
UNITED STATES
SECURITIES AND EXCHANGE COMMISSION
WASHINGTON, D.C. 20549
FORM 10-K
☒ | ANNUAL REPORT PURSUANT TO SECTION 13 OR 15(d) OF THE SECURITIES EXCHANGE ACT OF 1934 |
For the fiscal year ended December 31 2020, 2022
or
☐ | TRANSITION REPORT PURSUANT TO SECTION 13 OR 15(d) OF THE SECURITIES EXCHANGE ACT OF 1934 FOR THE TRANSITION PERIOD FROM TO |
Commission File Number: 001-33164
Domtar Corporation
(Exact name of registrant as specified in its charter)
Delaware | 20-5901152 |
(State or other jurisdiction of incorporation or organization) | (I.R.S. Employer |
234 Kingsley Park Drive Fort Mill, SC | 29715 |
(Address of principal executive offices) | (Zip Code) |
Registrant’s telephone number, including area code: (803) (803) 802-7500
Securities registered pursuant to Section 12(b) of the Act: Common Stock, Par Value $0.01 Per Share; Common stock traded on the New York Stock Exchange; trading symbol UFS.None
Securities registered pursuant to Section 12(g) of the Act: None
Indicate by check mark if the Registrant is a well-known seasoned issuer, as defined in Rule 405 of the Securities Act. Yes☐No☒No☐
Indicate by check mark if the Registrant is not required to file reports pursuant to Section 13 or 15(d) of the Act. Yes☒No☐No☒
Indicate by check mark whether the Registrant: (1) has filed all reports required to be filed by Section 13 or 15(d) of the Securities Exchange Act of 1934 during the preceding 12 months (or for such shorter period that the Registrant was required to file such reports), and (2) has been subject to such filing requirements for the past 90 days. Yes☒No☐ *
*The Registrant is a voluntary filer and not subject to the filing requirements of Section 13 or 15(d) of the Securities Exchange Act of 1934. Although not subject to these filing requirements, the Registrant has filed all reports that would have been required to be filed by Section 13 or 15(d) of the Securities Exchange Act of 1934 during the preceding 12 months had the Registrant been subject to such requirements.
Indicate by check mark whether the Registrant has submitted electronically every Interactive Data File required to be submitted pursuant to Rule 405 of Regulation S-T (§232.405 of this chapter) during the preceding 12 months (or for such shorter period that the Registrant was required to submit such files). Yes☒No☐
Indicate by check mark if disclosure of delinquent filers pursuant to Item 405 of Regulation S-K (§229.405) is not contained herein, and will not be contained, to the best of Registrant’s knowledge, in definitive proxy or information statements incorporated by reference in Part III of this Form 10-K or any amendment to this Form 10-K. ☐
Indicate by check mark whether the registrant is a large accelerated filer, an accelerated filer, a non-accelerated filer, smaller reporting company, or an emerging growth company. See the definitions of “large accelerated filer,” “accelerated filer,” “smaller reporting company,” and “emerging growth company” in Rule 12b-2 of the Exchange Act.
Large accelerated filer |
| Accelerated filer | ☐ | |||
Non-accelerated filer |
| Small reporting company | ☐ | |||
Emerging growth company | ☐ | |||||
If an emerging growth company, indicate by check mark if the registrant has elected not to use the extended transition period for complying with any new or revised financial accounting standards provided pursuant to Section 13(a) of the Exchange Act. ☐
Indicate by check mark whether the registrant has filed a report on and attestation to its management’s assessment of the effectiveness of its internal control over financial reporting under Section 404(b) of the Sarbanes-Oxley Act (15 U.S.C. 7262(b)) by the registered public accounting firm that prepared or issued its audit report. ☒☐
If securities are registered pursuant to Section 12(b) of the Act, indicate by check mark whether the financial statements of the registrant included in the filing reflect the correction of an error to previously issued financial statements. ☐
Indicate by check mark whether any of those error corrections are restatements that required a recovery analysis of incentive-based compensation received by any of the registrant’s executive officers during the relevant recovery period pursuant to §240.10D-1(b). ☐
Indicate by check mark whether the Registrant is a shell company (as defined in Rule 12b-2 of the Exchange Act). YES ☐ NO ☒
The aggregate market value of the voting and non-voting common equity held by non-affiliates of the Registrant, based on the closing price of the shares of common stock on The New York Stock Exchange on June 30, 2020,2022, was $1,165,096,948.
The number ofnil, there are no publicly traded common shares of Registrant’s Common Stock outstanding asDomtar Corporation.
As of February 19, 2021 was 55,066,504.December 31, 2022, there are no publicly traded common shares of Domtar Corporation.
Portions of the Registrant’s Proxy Statement relating to the Annual Meeting of Shareholders, scheduled to be held on May 5, 2021, are incorporated by reference into Part III of this Report.
DOMTAR CORPORATION
ANNUAL REPORT ON FORM 10-K
FOR THE YEAR ENDED DECEMBER 31, 20202022
TABLE OF CONTENTS
PAGE | |||||
PART I | |||||
ITEM 1 |
| ||||
| |||||
| |||||
| |||||
| |||||
| |||||
| |||||
| |||||
| |||||
| |||||
| |||||
| |||||
| |||||
| |||||
ITEM 1A |
| ||||
ITEM 1B |
| ||||
ITEM 2 |
| ||||
ITEM 3 |
| ||||
ITEM 4 |
| ||||
PART II | |||||
ITEM 5 |
| ||||
ITEM 6 |
| ||||
| |||||
| |||||
| |||||
|
| ||||
ITEM 7 | MANAGEMENT’S DISCUSSION AND ANALYSIS OF FINANCIAL CONDITION AND RESULTS OF OPERATIONS |
| |||
| |||||
| |||||
| |||||
| |||||
| |||||
| |||||
| |||||
| |||||
|
| ||||
ITEM 7A |
| ||||
ITEM 8 |
| ||||
| |||||
Report of PricewaterhouseCoopers LLP, Independent Registered Public Accounting Firm (PCAOB ID: 238) |
| ||||
Consolidated Statements of Earnings (Loss) and Comprehensive Income (Loss) |
| ||||
| |||||
| |||||
| |||||
| |||||
ITEM 9 | CHANGES IN AND DISAGREEMENTS WITH ACCOUNTANTS ON ACCOUNTING AND FINANCIAL DISCLOSURE |
| |
ITEM 9A |
| ||
ITEM 9B |
| ||
PART III | |||
ITEM 10 |
| ||
ITEM 11 |
| ||
ITEM 12 | SECURITY OWNERSHIP OF CERTAIN BENEFICIAL OWNERS AND MANAGEMENT AND RELATED STOCKHOLDER MATTERS |
| |
ITEM 13 | CERTAIN RELATIONSHIPS AND RELATED TRANSACTIONS, AND DIRECTOR INDEPENDENCE |
| |
ITEM 14 |
| ||
PART IV | |||
ITEM 15 |
| ||
| |||
ITEM 16 |
| ||
| |||
2
PART I
ITEM 1. BUSINESS
GENERALThroughout this Annual Report on Form 10-K, unless otherwise specified, “Domtar Corporation,” “the Company,” “Domtar,” “we,” “us” and “our” refer to Domtar Corporation, its subsidiaries, as well as its investments.
GENERAL
We design, manufacture, market and distribute a wide variety of fiber-based products, including communication papers, specialty and packaging papers. The foundation of our business is a network of wood fiber converting assets that produce paper and packaging grade as well as fluff and specialty pulp. Approximately 40%60% of our pulp production is consumed internally to manufacture paper, with the balance sold as market pulp. We are the largest integrated marketer of uncoated freesheet paper in North America serving a variety of customers, including merchants, retail outlets, stationers, printers, publishers, converters and end-users. To learn more, visit www.domtar.com.
Throughout this Annual Report on Form 10-K, unless otherwise specified, “Domtar Corporation,” “the Company,” “Domtar,” “we,” “us” and “our” refer toPaper Excellence acquired Resolute Forest Products through Domtar Corporation its subsidiaries,
On March 1, 2023, the Paper Excellence Group completed the acquisition of Resolute Forest Products Inc. ("Resolute") through Domtar (the “Acquisition”). Under the agreement, Domtar completed the acquisition of all the outstanding shares of Resolute common stock for $20.50 per share and one contingent value right tied to potential refunds on duty deposits made on or prior to June 30, 2022, of up to $500 million. Any proceeds attributable to the contingent value right will be distributed proportionally to contingent value right holders, and the value will ultimately be determined by the terms and timing of the resolution of the softwood lumber dispute between Canada and the United States.
Domtar is financing the transaction with (i) $500 million in equity from Domtar shareholder, and (ii) additional debt financing. Refer to Item 8, Financial Statements and Supplementary Data, under Note 24 “Subsequent Events” for additional information on this acquisition as well as its investments.financing.
2020 wasThe acquisition-date fair value of the consideration transferred is approximately $1.6 billion, excluding the contingent value right on softwood lumber duty deposit refunds.
As a yearcondition to obtain the approval of significant challenges for Domtar. During 2020,the Acquisition from the Canadian Competition Bureau, we undertook various strategic initiatives, including a cost reduction program, executed on our asset conversion roadmap, reviewed our strategic alternatives for our Personal Care business and faced unprecedented operating and market challenges duewere required to commit to the COVID-19 pandemic.
Whiledivestiture of our strategy will take someDryden, Ontario pulp mill, within a short period of time to execute,following the Acquisition. As of December 31, 2022, the sale of the pulp mill did not meet all the criteria for held for sale. On February 26, 2023, we made good progress in 2020 that provides us with a strong foundation on which to build. We are executing on a clear plan to create long-term shareholder value by refocusing our portfolio around Paper, Pulp and Packaging. We also have begun to execute our strategic plan to enter the containerboard market with highly competitive assets and a differentiated go-to-market strategy.
Sale of Personal Care business
On January 7, 2021, we agreedentered into an Asset Purchase Agreement to sell our Personal Care business to American Industrial Partners (AIP),the mill and related assets for a purchase price of $920$240 million in cash, (the “Transaction”).subject to customary adjustments and to customary closing conditions. The Transactiontransaction is expected to close in the first quarterhalf of 2021. Based2023.
Paper Excellence Acquired Domtar Corporation
On November 30, 2021, Paper Excellence completed the acquisition of all the outstanding common shares of Domtar Corporation by means of a merger of Pearl Merger Sub (a wholly-owned subsidiary) with and into the Company, with the Company continuing as the surviving corporation and as a subsidiary of Paper Excellence (the “Merger”). Refer to Item 8, Financial Statements and Supplementary Data, under Note 4 “Acquisition of Business” for additional information on its magnitudethe Merger.
As a condition to obtain the approval of the Merger from the Canadian Competition Bureau, we were required to commit to the divestiture of our Kamloops, British Columbia pulp mill, within a short period of time following the Merger. On June 1, 2022, the mill and because we are exitingrelated assets, were sold to an independent acquirer approved by the Personal Care business,Commissioner. The assets and liabilities related to the pulp mill for periods prior to the sales, were presented as held for sale in the Consolidated Balance Sheet. At the time of the Merger, the sale represents a significant strategic shift that has a material effect on ourof the pulp mill met the criteria for discontinued operations and financial results. Accordingly,as such, earnings were included within Earnings from discontinued operations, net of taxes in the Consolidated Statement of Earnings (Loss) and Comprehensive income (loss) for all periods presented reflect the Personal Care business as a discontinued operation. Our Personal Care business was previously disclosed as a separate reportable segment. For more information on our discontinued operations, referpresented. Refer to Item 8, Financial Statements and Supplementary Data, under Note 3 “Discontinued Operations”. for additional information on the Discontinued Operations.
Execution of our asset conversion roadmap
On August 7, 2020, we announced our decision to repurpose assets at our Kingsport, Tennessee and Ashdown, Arkansas, facilities,facility, following a review of our manufacturing footprint. This conversion program is consistent with the roadmap that we made public in 2018. The previously announced multi-mill conversion roadmap is designed to adjust our paper capacity to align with our customer demand. Through this process, we have identified up to four large scale paper machine/mill repurposing projects that can produce 2.5 million tons of containerboard and/or 570,000 ADMT of additional market softwood and fluff pulp. We plan to enterhave entered the linerboard market with the recent conversion of our Kingsport paper machine. Once in full operation, after the current ramp-up period and customers certification process, the mill will produce and market approximately 600,000 tons annually of high-quality recycled linerboard and medium, providing us with a strategic footprint in a growing adjacent market. The conversion is expected to be completed by the fourth quarter of 2022. We expect to complete the conversion of our Ashdown mill to 100% softwood and fluff pulp in early 2021. The Ashdown mill will produce additional market hardwood pulp until it converts the fiberline to softwood pulp. The conversion of the fiberline to 100% softwood is necessary for an eventual expansion into containerboard. Following the fiberline conversion, Ashdown will have annual production capacity of 775,000 tons of fluff and softwood pulp.
Cost reduction program
On August 7, 2020, we announced the implementation of a cost reduction program, targeting $200 million in annual run-rate cost savings to be realized by the end of 2021. The goal of the program is to build a stronger business operation, enhance our cost efficiency, improve operating margins and maximize productivity and cash flow. 3
For more information on our cost reduction program, refer to “Cost Reduction Program” section included in Item 7, Management’s Discussion and Analysis of Financial Condition and Results of Operations.
Purchase of Appvion Point of Sale business
On April 27, 2020, we completed the acquisition of the Point of Sale paper business from Appvion Operations, Inc. The business includes the coater and related equipment located at Appvion’s West Carrollton, Ohio, facility as well as a license for all corresponding intellectual property. The results of this business have been included in the consolidated financial statements as of April 27, 2020. For more information, refer to Item 8, Financial Statements and Supplementary Data, under Note 4 “Acquisition of Business”.
COVID-19
First identified in people in late 2019, COVID-19 spread rapidly throughout the world and, in March 2020, the World Health Organization characterized COVID-19 as a pandemic. With the unprecedented and rapid spread of COVID-19 and social distancing measures implemented throughout the world due to the pandemic, this virus has had a profound impact on human health, the global economy and society in general. We are actively monitoring the impact of COVID-19 on all aspects of our business, including our employees, operations, customers, suppliers, liquidity and capital resources. The health and safety of our employees and customers remains our top priority.
Prior to mid-March 2020, our results were largely in line with expectations. We began to experience a decline in shipment of paper in March 2020, when volume declined in response to shelter-in-place orders and other market restrictions. Overall, for 2020, our paper shipments were lower by approximately 19% when compared to 2019. COVID-19 is discussed in more detail under the COVID-19 section of the Item 7, Management’s Discussion and Analysis of Financial Condition and Results of Operations.
AVAILABILITY OF INFORMATION
In this Annual Report on Form 10-K, we incorporate by reference certain information contained in other documents filed with the Securities and Exchange Commission (“SEC”) and we refer you to such information. We file annual, quarterly and current reports and other information with the SEC. The SEC maintains aavailable on the SEC’s website at www.sec.gov that contains these filings. You also may access, free of charge our reports filed with the SEC through our website. Reports filed with the SEC will be available through our website as soon as reasonably practicable after they are filed. The information contained onwe have filed or connected to our website, www.domtar.com, is not incorporated by reference into this Form 10-K and should in no way be construed as a part of this or any other report that we filed withfurnished the SEC.above-referenced reports.
OUR CORPORATE STRUCTURE
At December 31, 2020, Domtar Corporation had a total of 55,194,538 shares of common stock issued and outstanding.
Our common stock is traded on the New York Stock Exchange and the Toronto Stock Exchange under the symbol “UFS”.
Information regarding our common stock is included in Item 8, Financial Statements and Supplementary Data under Note 21 “Shareholders’ Equity”.
OUR BUSINESS OVERVIEW
Following our agreement to sell our Personal Care business, we nowWe operate as a single reportable segment as described below, which also represents our only operating segment.
Pulp and Paper: Consists of the design, manufacturing, marketing and distribution of communication, specialty and packaging papers, as well as softwood hardwood and fluff pulps and high quality airlaid and ultrathin laminated absorbent cores.
Information regarding our reportable segment is included in Item 7, Management’s Discussion and Analysis of Financial Condition and Results of Operations, as well as Item 8, Financial Statements and Supplementary Data under Note 2422 “Segment Disclosures”. Geographic information is also included under Note 2422 of the Financial Statements and Supplementary Data.
4
PULP AND PAPER
Our Manufacturing Operations
We produce approximately 3.83.4 million metric tons of softwood fluff and hardwoodfluff pulp at 11 pulp and paper mills. Approximately 40%60% of our pulp is consumed internally to manufacture paper, with the balance being sold as market pulp. We also purchase limited amount of papergrade pulp from third parties for specific grades and to optimize the logistics of our pulp capacity while reducing transportation costs.
We are the largest integrated manufacturer and marketer of uncoated freesheet paper in North America. We have seveneight integrated pulp and paper mills (five(six in the United States and two in Canada), with an annual paper production capacity of approximately 2.22.4 million tons of uncoated freesheet paper. Our paper manufacturing operations are supported by 11eleven converting and forms manufacturing operations (including a network of 9eight plants located offsite from our paper making operations). Approximately 68%70% of our paper production capacity is in the United States and 32%30% is located in Canada.
We have started the operation at our newly converted packaging mill in Kingsport and once in full operation, the mill will manufacture packaging materials made from 100% recycled content. The mill will produce and market approximately 600,000 tons annually of high-quality recycled linerboard and corrugated medium, providing us with a strategic footprint in a growing market.
We produce papergrade, fluff and specialty pulps at our two stand-alone pulp mills in Dryden and Plymouth. We also produce market pulp in excess of our internal requirements at our pulp and paper mills in Espanola, Hawesville, Windsor, Marlboro and Nekoosa. We also produce papergrade, fluff and specialty pulps at our four stand-alone pulp millsmainly in Ashdown, Kamloops, DrydenEspanola and Plymouth.Marlboro. We can sell approximately 2.11.4 million metric tons of pulp per year depending on market conditions. Approximately 58%69% of our pulp production capacity is in the U.S. and 42%31% is in Canada.
The table below lists our operating pulp and paper mills and their annual production capacity:
|
|
|
|
|
|
|
| Saleable |
| |||||||
PRODUCTION FACILITY |
| Fiberline Pulp Capacity |
|
| Paper |
| ||||||||||
|
| # lines |
|
| ('000 ADMT) (1) |
|
| # machines |
|
| ('000 ST) (2) |
| ||||
Paper |
|
|
|
|
|
|
|
|
|
|
|
| ||||
Ashdown, Arkansas |
|
| 3 |
|
|
| 775 |
|
|
| 1 |
|
|
| 185 |
|
Windsor, Quebec |
|
| 1 |
|
|
| 447 |
|
|
| 2 |
|
|
| 642 |
|
Hawesville, Kentucky |
|
| 1 |
|
|
| 412 |
|
|
| 2 |
|
|
| 596 |
|
Marlboro, South Carolina |
|
| 1 |
|
|
| 320 |
|
|
| 1 |
|
|
| 274 |
|
Johnsonburg, Pennsylvania |
|
| 1 |
|
|
| 228 |
|
|
| 2 |
|
|
| 344 |
|
Nekoosa, Wisconsin |
|
| 1 |
|
|
| 155 |
|
|
| 3 |
|
|
| 168 |
|
Rothschild, Wisconsin |
|
| 1 |
|
|
| 65 |
|
|
| 1 |
|
|
| 131 |
|
Espanola, Ontario |
|
| 1 |
|
|
| 280 |
|
|
| 2 |
|
|
| 69 |
|
Kingsport, Tennessee |
|
| — |
|
|
| — |
|
|
| 1 |
|
|
| 600 |
|
Total |
|
| 10 |
|
|
| 2,682 |
|
|
| 15 |
|
|
| 3,009 |
|
Pulp |
|
|
|
|
|
|
|
|
|
|
|
| ||||
Dryden, Ontario(3) |
|
| 1 |
|
|
| 327 |
|
|
| — |
|
|
| — |
|
Plymouth, North Carolina |
|
| 1 |
|
|
| 390 |
|
|
| — |
|
|
| — |
|
Total |
|
| 2 |
|
|
| 717 |
|
|
| — |
|
|
| — |
|
TOTAL |
|
| 12 |
|
|
| 3,399 |
|
|
| 15 |
|
|
| 3,009 |
|
Total Trade Pulp (4) |
|
|
|
|
| 1,348 |
|
|
|
|
|
|
| |||
|
|
|
|
|
|
|
|
|
| Saleable |
| |||||||
PRODUCTION FACILITY (1) |
| Fiberline Pulp Capacity |
|
| Paper |
| ||||||||||||
|
| # lines |
|
| ('000 ADMT) (2) |
|
| # machines |
|
| Category (3) |
| ('000 ST) (4) |
| ||||
Uncoated freesheet |
|
|
|
|
|
|
|
|
|
|
|
|
|
|
|
|
|
|
Windsor, Quebec |
|
| 1 |
|
|
| 447 |
|
|
| 2 |
|
| Communication |
|
| 642 |
|
Hawesville, Kentucky |
|
| 1 |
|
|
| 412 |
|
|
| 2 |
|
| Communication |
|
| 596 |
|
Marlboro, South Carolina |
|
| 1 |
|
|
| 320 |
|
|
| 1 |
|
| Specialty & Packaging |
|
| 274 |
|
Johnsonburg, Pennsylvania |
|
| 1 |
|
|
| 228 |
|
|
| 2 |
|
| Communication |
|
| 344 |
|
Nekoosa, Wisconsin |
|
| 1 |
|
|
| 155 |
|
|
| 3 |
|
| Specialty & Packaging |
|
| 168 |
|
Rothschild, Wisconsin |
|
| 1 |
|
|
| 65 |
|
|
| 1 |
|
| Communication |
|
| 131 |
|
Espanola, Ontario |
|
| 1 |
|
|
| 280 |
|
|
| 2 |
|
| Specialty & Packaging |
|
| 69 |
|
Total Uncoated freesheet |
|
| 7 |
|
|
| 1,907 |
|
|
| 13 |
|
|
|
|
| 2,224 |
|
Pulp |
|
|
|
|
|
|
|
|
|
|
|
|
|
|
|
|
|
|
Ashdown, Arkansas (5) |
|
| 3 |
|
|
| 775 |
|
|
|
|
|
|
|
|
|
|
|
Kamloops, British Columbia |
|
| 1 |
|
|
| 408 |
|
|
| — |
|
|
|
|
| — |
|
Dryden, Ontario |
|
| 1 |
|
|
| 327 |
|
|
| — |
|
|
|
|
| — |
|
Plymouth, North Carolina |
|
| 1 |
|
|
| 390 |
|
|
| — |
|
|
|
|
| — |
|
Total Pulp |
|
| 6 |
|
|
| 1,900 |
|
|
| — |
|
|
|
|
| — |
|
Total |
|
| 13 |
|
|
| 3,807 |
|
|
| 13 |
|
|
|
|
| 2,224 |
|
Total Trade Pulp (6) |
|
|
|
|
|
| 2,149 |
|
|
|
|
|
|
|
|
|
|
|
|
|
|
|
(3) |
|
|
|
|
|
|
|
We planAs a condition to enterobtain the containerboard market withapproval of the conversionAcquisition of Resolute from the Canadian Competition Bureau, we were required to commit to the divestiture of our Kingsport paper machine. Once in full operation,Dryden, Ontario pulp mill, within a short period of time following the Acquisition. On February 26, 2023, we entered into an Asset Purchase Agreement to sell the mill will produce and market approximately 600,000 tons annuallyrelated assets for a purchase price of high-quality recycled linerboard$240 million in cash, subject to customary adjustments and medium, providing us with a strategic footprint in a growing market.to customary closing conditions. The conversiontransaction is expected to be completed byclose in the endfirst half of 2022.2023.
5
Our Raw Materials
The manufacturing of pulp and paper requires wood fiber, chemicals and energy. We discuss these three major raw materials used in our manufacturing operations below.
Wood Fiber
United States pulp and paper mills
The fiber used by our pulp and paper millsoperations in the U.S. is softwoodmainly wood fiber (softwood and hardwood, bothhardwood) as well as old corrugated containers (”OCC”), all readily available in the market from multiple third-party sources. The mills obtain fiber from a variety of sources, depending on their location. These sources include a combination of supply contracts, wood lot management arrangements, advance stumpage purchases and spot market purchases.
Canadian pulp and paper mills
The fiber used at our Windsor pulp and paper mill is hardwood originating from a variety of sources, including purchases on the open market in Canada and the U.S., contracts with Quebec wood producers’ marketing boards, public land where we have wood supply allocations and from Domtar’s private lands. The softwood and hardwood fiber for our Espanola pulp and paper mill and the softwood fiber for our Dryden pulp mill are obtained from third parties, directly or indirectly from public lands and through designated wood supply allocations. The fiber used at our Kamloops pulp mill is all softwood, originating mostly from third-party sawmill operations in the southern-interior part of British Columbia.
Cutting rights on public lands related to our pulp and paper mills in Canada represent about 1.7 million cubic meters of softwood and 0.8 million cubic meters of hardwood per year. Access to harvesting of fiber on public lands in Ontario and Quebec is subject to licenses and review by the respective governmental authorities.
Chemicals
We use various chemical compounds in our pulp and paper manufacturing operations that we purchase, primarily on a centralized basis, through contracts varying between one and ten years in length to ensure product availability. Most of the contracts have pricing that fluctuates based on prevailing market conditions. For pulp manufacturing, we use numerous chemicals including caustic soda, sodium chlorate, sulfuric acid, lime and peroxide. For paper manufacturing, we also use several chemical products including starch, precipitated calcium carbonate, optical brighteners, dyes and aluminum sulfate.
Energy
Our operations produce and consume substantial amounts of energy. Our primary energy sources include: biomass, natural gas and electricity. Approximately 73%70% of the total energy required to manufacture our products comes from renewable fuels such as bark and spent pulping liquor, generated as byproducts from our manufacturing processes. The remainder of the energy comes mainly from natural gas and from smaller amounts of other fossil fuels and purchased steam procured under supply contracts. Under most of these contracts, suppliers are committed to provide quantities within predetermined ranges that provide us with our needs for a particular type of fuel at a specific facility. Most of these contracts have pricing that fluctuate based on prevailing market conditions. Biomass and fossil fuels are consumed primarily to produce steam that is used in the manufacturing process and, to a lesser extent, to provide direct heat used in the chemical recovery process.
We have cogenerating assets at all of our integrated pulp and paper mills, as well as hydro assets at three locations: Espanola, Nekoosa and Rothschild. These generating assets produce approximately 71%65% of the electricity requirements of our manufacturing operations, with the balance supplied from local utilities. Electricity is primarily used to drive motors, pumps and other equipment, as well as provide lighting.
Our Transportation
Transportation of raw materials, wood fiber, chemicals and pulp into our mills is mostly done by rail and trucks, although barges are used in certain circumstances. We rely on third parties for the transportation of our pulp and paper products between our mills, converting operations, distribution centers and customers. Our paper products are shipped mostly by truck, with logistics operations and procurement being managed centrally in collaboration with each location. Our pulp is either shipped by vessel, rail or truck depending on destination and customer preference. We work with major railroads, ocean carriers, and approximately 300390 trucking and third- partythird-party transportation companies in the U.S. and Canada. Service agreements are typically negotiated on an annual basis. We pay diesel fuel surcharges, which vary depending on the cost of diesel fuel and mode of transportation used and the cost of diesel fuel.used.
and Go-to-Market Strategy
Paper
Our uncoated freesheet paperspaper products are categorized into both communication papers and specialty and packaging papers. Communication papers are further categorized into business papers and commercial printing and publishing papers.
6
Our business papers include copy and electronic imaging papers, which are used with inkjet and laser printers, photocopiers and plain-paper fax machines, as well as computer papers, preprinted forms and digital papers. These products are primarily for office and home use. Business papers accounted for approximately 41%47% of our shipments of paper products in 2020.2022.
Our commercial printing and publishing papers include uncoated freesheet papers, such as offset papers and opaques. These uncoated freesheet grades are used in sheet and roll fed offset presses across the spectrum of commercial printing end-uses, including digital printing. Our publishing papers include tradebook and lightweight uncoated papers used primarily in book publishing applications such as textbooks, dictionaries, catalogs, magazines, hard cover novels and financial documents. These products also include converting papers, such as envelopes, tablets, business forms and data processing/computer forms. Commercial printing and publishing papers accounted for approximately 41%36% of our shipments of paper products in 2020.2022.
Our specialty and packaging papers include papers used for thermal printing, flexible packaging, food packaging, medical packaging, medical gowns and drapes, sandpaper backing, carbonless printing, labels and other papers used for coating and laminating applications. We also manufacture papers for industrial and specialty applications including carrier papers, treated papers, security papers and specialized printing and converting applications. These specialty and packaging papers accounted for approximately 18%17% of our shipments of paper products in 2020.2022. These grades of papers require a certain amount of innovation and agility in the manufacturing system. Once our ramp-up period and client certification processes are completed in 2023 at our newly converted packaging mill, we will be able to offer our customers a full range of 100% recycled linerboard and medium, including: linerboard, corrugated medium, sack kraft and other packaging grades.
The chart below illustrates our main uncoated freesheet paper products and their applications:
|
| |||||||||
|
|
| ||||||||
|
|
|
|
|
| |||||
|
|
|
| |||||||
|
|
| ||||||||
|
|
| ||||||||
|
| |||||||||
| ||||||||||
| ||||||||||
|
|
|
|
|
| |||||
|
|
|
|
| ||||||
|
|
|
| |||||||
|
|
| ||||||||
|
| |||||||||
|
| |||||||||
Our paper sales channels are aligned to efficiently bring a competitive and complete product offering to our varied customers. Our customer service personnel work closely with sales, marketing and production staff to provide service and support to merchants, converters, end-users, stationers, printers and retailers. We sell our products directly to end-users and others who influence paper purchasing decisions in order to enhance brand recognition and increase product demand. In addition, our sales representatives work closely with mill-based product development personnel and undertake joint marketing initiatives with customers in order to better understand their business needs and to support their future requirements.
We sell business papers primarily to paper stationers, merchants, office equipment manufacturers and retail outlets. We distribute uncoated commercial printing and publishing papers to end-users and commercial printers, mainly through paper merchants, as well as selling directly to some end users.end-users. We sell our specialty and packaging papers mainly to converters, who apply a further production process such as coating, rewinding, folding or waxing to our papers before selling them to a variety of specialized end-users.
The chart below illustrates our channels of distribution for our paper products:
|
| ||||||||||||||||||||||||
|
|
| |||||||||||||||||||||||
|
|
|
|
|
|
|
| ||||||||||||||||||
|
|
|
|
|
|
| |||||||||||||||||||
|
|
|
|
| |||||||||||||||||||||
|
|
| |||||||||||||||||||||||
Pulp
Our pulp products are comprised of softwood fluff and hardwood kraftfluff as well as high quality airlaid and ultrathin laminated absorbent cores. Our pulp grades are sold to customers in overapproximately 50 countries worldwide and are used in a variety of end products,end-products, such as diapers and personal hygiene products, bathroom and facial tissue, specialty and packaging papers, customers who make printing and writing grades, building products and electrical insulating papers. Our laminated cores are used in the manufacturing of baby diapers, adult incontinence and feminine hygiene products.
We sell market pulp to customers in North America mainly through a North American sales force, while sales to most overseas customers are made directly or through commission agents. We maintain pulp supplies at strategically located warehouses, which allow us to respond to customer orders on short notice.
Our Customers
Our ten largest customers represented approximately 41%48% of our sales in 2020.2022. In 2020,2022, Staples represented approximately 12%13% of our sales. The majority of our customers purchase products through individual purchase orders. In 2020,2022, approximately 75%77% of our sales were in the United States, 9%10% were in Canada, and 16%13% were in other countries.
OUR STRATEGIC INITIATIVES AND FINANCIAL PRIORITIES
As a leading fiber-based technology company, Domtar is focused on driving innovation, enhancing our operating platforms, and delivering high quality products. To further bolster our position and drive enhanced value for our stockholders, Domtar is focused on four key business objectives: (1) driving value through strategic investment; (2) building on our core competencies in wood fiber to diversify and expand Domtar’s footprint in growth markets and industries; (3) maintaining a balanced and disciplined approach to capital allocation that allows for investments in growth opportunities and rewards stockholders with capital returns; and (4) operating with a focus on environmental responsibility and sustainability. We are confident that the continued focus on these objectives will bolster the competitive position of our business and drive value for our stakeholders, including stockholders, customers and employees.
Driving value. Fiber-based products remain the primary part of our growth plan, and we have strategies and operating priorities designed to maximize the value of the business. Our key priorities include: increasing productivity in our pulp business, pursuing new sources of paper consumption, pursuing asset repurposing opportunities and operating an optimal portfolio of strategic assets. We believe that execution on these priorities will enable Domtar to expand into complementary growth areas and protect its market position in Pulp and Paper.
Expanding into areas of growth and leveraging our fiber expertise. We are focused on optimizing and expanding our operations in markets with positive demand dynamics through investments for organic growth, the repurposing of assets and strategic acquisitions. Domtar has a history of proactively adapting to changing market conditions, and today, we are repositioning the Company towards areas of growth. We are well positioned to capitalize on new opportunities in the wood fiber market. The Company already has the financial resources, infrastructure, raw materials, technologies and expertise necessary to deliver new products. We believe that we have built a strong foundation for diversification and continue to make important, but disciplined, progress.OUR COMPETITION
Maintaining a balanced and disciplined approach to capital allocation that allows for investments in growth opportunities and rewards stockholders with capital returns. We believe in a balanced and disciplined approach to capital allocation, and we are committed to deploying capital only to the areas that will achieve the best possible return for our stockholders. Domtar’s free cash flow allows us to invest in growth opportunities and maintain a strong and flexible financial position for operating and strategic
initiatives, while still returning capital to our stockholders. To continue generating free cash flow, we are focused on allocating our capital expenditures effectively and minimizing working capital requirements by reducing discretionary spending, reviewing procurement costs and pursuing the balance of production and inventory control.
Operating responsibly on behalf of all of Domtar’s stakeholders. We try to make a positive difference every day by pursuing sustainable growth, valuing relationships, and responsibly managing our resources. We aim to care for our customers, end-users and stakeholders in the communities where we operate, all seeking assurances that resources are managed in a sustainable manner. We strive to provide these assurances by certifying our distribution and manufacturing operations and measuring our performance against internationally recognized benchmarks. Domtar is committed to the responsible use of forest resources across our operations, and we are enrolled in programs and initiatives to encourage landowners to pursue certification to improve their market access and increase their revenue opportunities. We believe that each of these initiatives also creates value for our stockholders and is part of our larger business strategy and commitment to environmental sustainability.
OUR COMPETITION
The markets in which our businesses operate are highly competitive with well-established domestic and foreign manufacturers.
In the paper business, our paper production does not rely on proprietary processes or formulas, except in highly specialized papers or customized products. In uncoated freesheet, we compete primarily on the basis of product quality, breadth of offering, service solutions and competitively priced paper products, which include an extensive offering of high qualityhigh-quality Forest Stewardship Council (“FSC”)-certified paper products. While we have a leading position in the North American uncoated freesheet market, we also compete with other paper grades, including coated freesheet, and with electronic transmission and document storage alternatives. As the use of these alternative products continues to grow, we continue to see a decrease in the overall demand for paper products. All of our pulp and paper manufacturing facilities are located in the U.S. or in Canada where we sell approximately 84%87% of our products. The five largest manufacturers of uncoated freesheet papers in North America (including Domtar) represent approximately 76%82% of total production capacity. On a global basis, there are hundreds of manufacturers that produce and sell uncoated freesheet paper. The level of competitive pressures from foreign producers in the North American market is highly dependent upon exchange rates, particularly the rate between the U.S. dollar and the Euro as well as the U.S. dollar and the Brazilian real.
The pulp we sell is mainly fluff softwood or hardwoodsoftwood pulp. The pulp market is highly fragmented with many manufacturers competing worldwide. Competition is primarily on the basis of access to low-cost wood fiber, product quality and competitively priced pulp products. TheWe sell softwood and fluff pulp we sellthat is used in absorbent products, incontinence products, diapers and feminine hygiene products. The softwoodWe sell both northern and hardwood pulp we sell is primarily slow growth northernsouthern bleached softwood and hardwood kraft, and wepulp. We also produce specialty engineered pulp grades with a predetermined mix of wood species. Our northern and southern softwood and hardwood pulps arepulp is sold to customers that make a variety of products for specialty paper, packaging, tissue and industrial applications, and
7
customers who make printing and writing grades. Airlaid and ultrathin laminated absorbent cores are highly customized and specialized for customer needs and have a relatively long and technical development, qualification and sales process. We also seek product differentiation through the certification of our pulp mills to the FSC chain-of-custody standard and the procurement of FSC-certified virgin fiber. All of our pulp production capacity is located in the U.S. or in Canada, and we sell approximately 54%46% of our pulp to other countries.
OUR HUMAN CAPITAL
We have approximately 6,6006,300 employees, 61%65% are employed in the United States and 39%35% in Canada. 57%56% of our employees are covered by collective bargaining agreements, generally on a facility-by-facility basis.
We are committed to fostering a workplace that attracts and retains talent. Through ongoing employee development, comprehensive compensation and benefits, and a focus on health, safety, employee well-being and community engagement, we aim to directly influence positive work behavior and on-the-job performance.performance.
Diversity and Inclusion
Although we have a strict non-discrimination and anti-harassment policy, we view diversity and inclusion as more than just policies and practices. It is part of who we are, how we operate, and essential to our long-term sustainability. We strive to create an inclusive workplace where people can bring their authentic selves to work and feel valued and included.
Our commitment to diversity and inclusion starts at the top with a highly skilled and diverse board.senior leadership. We are committed to increasing representation of women and underrepresented minorities at Domtar overall, but particularly in leadership roles. The Domtar Diversity and Inclusion Council provides guidance to leadership to help make Domtar more inclusive and diverse.
To ensure leadership maintains a commitment to diversity and inclusion, each leader is responsible for focusing on how they can develop and support diversity within the workplace and within their scope of responsibilities. The Human Resources Committee of the Board also has ongoing oversight of diversity and inclusion programs.
Compensation and Pay Equity
Our compensation program is designed to attract and reward talented individuals who possess the skills necessary to support our business objectives, assist in the achievement of our strategic goals and create long-term value for our stockholders.value. We believe people should be paid for what they do and how they do it, regardless of their gender, race, or other personal characteristics. To deliver on that commitment, we benchmark, and set pay ranges based on market data and consider factors such as an employee’s role, experience and their performance. We also regularly review our compensation practices, both in terms of our overall workforce and individual employees, to ensure our pay is fair and equitable.
Learning and Development
Hiring, developing and retaining employees is important to our operations and we are focused on creating experiences and programs that foster growth, performance and retention. We continually invest in our employees’ career growth and provide a wide range of development opportunities, including face-to-face, virtual, social and on-site learning, mentoring, coaching, and external development.
Health and Safety
The physical health, life balance and mental health of our employees is part of our core value of caring and thus is of vital importance to Domtar’s success.Domtar. That is why we work relentlessly to physically eliminate the potential for life-altering hazards and minimize risk of injury promoteas part of a proactive, preventive safety culture and investwhile investing in well-being programs to help our employees establish and maintain healthy lifestyles.
Throughout the COVID-19 pandemic, we have remained focused on protecting the health, safety, and well-being of our employees while meeting the needs of our customers. Shortly after the outset of COVID-19, we adopted enhanced safety measures and practices across our facilities to protect employee health and safety and ensured a reliable supply of essential products to our customers. We monitor the impact of the pandemic on our employees and within our operations, and proactively modify or adopt new practices to promote their health and safety.
Community Involvement
We make donations to charitable organizations in the communities where we live and work and believe that this commitment helps in our efforts to attract and retain employees. We also offer employees the opportunity to volunteer in their communities through our Domtar EarthChoice Ambassadors program. We focus our philanthropic efforts on three areas that align with our business: literacy, sustainability, and health and wellness.
8
OUR APPROACH TO SUSTAINABILITY
Domtar aims to deliver value to our customers, employees shareholders and communities by viewing our business decisions within the larger context of sustainability. We take a long-term view on managing natural resources for the future. We strive to minimize waste and encourage recycling. We aim to have the highest standards for ethical conduct, for caring about the health and safety of each other, and for maintaining the environmental quality in the communities where we live and work. We value the partnerships we have formed with non-governmental organizations and believe they make us a better company.Company. We focus on agility to respond to new opportunities, and we are committed to turning innovation into value creation. By embracing sustainability as our operating philosophy, we seek to internalize the fact that the choices we have and the impact of the decisions we make on our stakeholders are all interconnected. We believe that our business and the people and communities who depend on us are better served as we weave this focus on sustainability into the things we do.
Domtar executes this commitment to sustainability at every level and every location across the Company. With the support of the Board of Directors, ourOur Management Committee empowers senior managers from manufacturing, technology, finance, sales and marketing and corporate staff functions to regularly come together and establish key sustainability performance metrics, and to routinely assess and report on progress. Our sustainability goals, challenges and progress are reported annually on the Company’s website and other published reports.
OUR ENVIRONMENTAL COMPLIANCE
Our business is subject to a wide range of general and industry-specific laws and regulations in the U.S. and other countries where we have operations,Canada, relating to the protection of the environment, including those governing wood harvesting, air emissions, climate change, waste water discharges, storage, management and disposal of hazardous substances and wastes, contaminated sites, landfill operation and closure obligations and health and safety matters. Compliance with these laws and regulations is a significant factor in the operation of our business. We may encounter situations in which our operations fail to maintain full compliance with applicable environmental requirements, possibly leading to civil or criminal fines, penalties or enforcement actions, including those that could result in governmental or judicial orders that stop or interrupt our operations or require us to take corrective measures at substantial costs, such as the installation of additional pollution control equipment or other remedial actions.
Compliance with environmental laws and regulations involves capital expenditures as well as additional operating costs. Additional information regarding environmental matters is included in Item 8, Financial Statements and Supplementary Data, under Note 2220 “Commitments and Contingencies” and in Item 7, Management’s Discussion and Analysis of Financial Condition and Results of Operations, under the section of Critical accounting estimates and policies, under the caption “Environmental Matters and Asset Retirement Obligations.”
OUR INTELLECTUAL PROPERTY
Many of our brand name products are protected by registered trademarks. Our key trademarks include Cougar®, Lynx® Opaque Ultra, Husky® Opaque Offset, First Choice®, EarthChoice®, Ariva®,NovaThin® and NovaZorb®. These brand names and trademarks are important to our business. Our numerous trademarks have been registered in the U.S. and/or in other countries where our products are sold. The current registrations of these trademarks are effective for various periods of time. These trademarks may be renewed periodically, provided that we, as the registered owner, and/or licensee comply with all applicable renewal requirements, including the continued use of the trademarks in connection with similar goods.
We own U.S. and foreign patents and have several pending patent applications. Our management regards these patents and patent applications as important but does not consider any single patent or group of patents to be materially important to our business as a whole.
9
OUR EXECUTIVE OFFICERS (“MANAGEMENT COMMITTEE”)
Name | Age | Position and Business Experience |
John D. Williams |
68 | President and Chief Executive Officer of the Company since January 2009. He is also a member of the
Mr. Williams Mr. Williams is |
Daniel Buron |
59 | Executive Vice President and Chief Financial Officer of the Company since March 2007. He is also a member of the Management Committee. Mr. Buron was previously Senior Vice-President and Chief Financial Officer of Domtar Inc. since May 2004. He joined Domtar Inc. in 1999. Prior to May 2004, he was Vice President, Finance, Pulp and Paper sales division and, prior to September 2002, he was Vice President and Controller. He has over 30 years of experience in finance. Mr. Buron |
|
|
|
|
| Senior Vice President, Pulp and Paper |
|
|
|
|
|
|
|
|
|
|
|
|
|
|
|
|
| Senior Vice President, Pulp and Paper |
|
|
|
10
FORWARD-LOOKING STATEMENTS
This Annual Report on Form 10-K contains forward-looking statements relating to trends in, or representing management’s beliefs about, Domtar Corporation’s future growth, results of operations, performance, liquidity and business prospects and opportunities. These forward-looking statements are generally denoted by the use of words such as “anticipate,” “believe,” “expect,” “intend,” “aim,” “target,” “plan,” “continue,” “estimate,” “project,” “may,” “will,” “should” and similar expressions. These statements reflect management’s current beliefs and are based on information currently available to management. Forward-looking statements are necessarily based upon a number of estimates and assumptions that, while considered reasonable by management, are inherently subject to known and unknown risks and uncertainties and other factors that could cause actual results to differ materially from historical results or those anticipated. Accordingly, no assurances can be given that any of the events anticipated by the forward-looking statements will occur, or if any occur, what effect they will have on our results of operations or financial condition. These factors include, but are not limited to:
| • continued decline in usage of fine paper products in our core market; • our ability to implement our business diversification initiatives, including repurposing of assets and strategic acquisitions or divestitures, including facility closures; • failure to achieve our cost containment goals, conversion costs in excess of our expectations and demand for linerboard; • product selling prices; • raw material prices, including fiber, chemical and energy; • conditions in the global capital and credit markets, and the general economy, particularly in the U.S., and Canada; • performance of our manufacturing operations, including unexpected maintenance requirements; • the level of competition from domestic and foreign producers; • cyberattacks or other security breaches; • the effect of, or change in, forestry, land use, environmental and other governmental regulations and accounting regulations; • the effect of climate change and weather conditions and the risk of loss from fires, floods, windstorms, hurricanes and other natural disasters; • transportation costs; • the loss of current customers or the inability to obtain new customers; • legal proceedings; • changes in asset valuations, including impairment of long-lived assets, inventory, accounts receivable or other assets or other reasons; • changes in currency exchange rates, particularly the relative value of the U.S. dollar to the Canadian dollar; • performance of pension fund investments and related derivatives, if any; • a material disruption in our supply chain, manufacturing, distribution operations or customer demand such as public health crises that impact trade or the general economy, including COVID-19 and other viruses, diseases or illnesses; and • the other factors described under “Risk Factors,” Item 1A.
|
|
|
|
|
|
|
|
|
|
|
|
|
|
|
|
|
|
|
|
|
|
|
|
|
|
|
|
|
|
|
|
|
|
|
|
|
|
|
|
You are cautioned not to unduly rely on such forward-looking statements, which speak only as of the date made, when evaluating the information presented in this Annual Report on Form 10-K. Unless specifically required by law, Domtar Corporation disclaims any obligation to update or revise these forward-looking statements to reflect new events or circumstances.
ITEM 1A. RISK FACTORS
You should carefully consider the risks described below in addition to the other information presented in this Annual Report on Form 10-K.
Risks Related to our Business
Failure to successfully implement the Company’s business diversification initiatives could have a material adverse effect on its business, results of operations and financial position.
The Company is pursuing strategic initiatives that management considers important to our long-term success. The intent of these initiatives is to help grow and diversify the business and counteract the secular decline in our North American paper business. These initiatives may involve organic growth, conversion of assets, select joint ventures and strategic acquisitions. The success of these initiatives will depend on, among other things, our ability to identify potential strategic initiatives, understand the key trends and principal drivers affecting those businesses and to execute the initiatives in a cost-effective manner. There are significant risks involved with the execution of such initiatives, including significant business, economic and competitive uncertainties, many of which are outside the Company’s control.
For example, we are currently convertinghave completed the conversion of one of our mills to a containerboard production facility and in the past, we have converted paper mills to fluff pulp production facilities. If circumstances warrant, in the future we may again convert mills to produce pulp or other products. Conversions can be capital intensive and can involve the shutdown of a facility for an extended period of time, followed by an extended ramp-up and customer certification process. In addition, the success of a conversion depends upon demand over time for the new product relative to the previously produced paper products, as well as costs and other factors, and there can be no assurance that a conversion will be as successful as expected.
Strategic acquisitions may expose the Company to additional risks. The Company may have to compete for acquisition targets and any acquisition it makes may fail to accomplish our strategic objectives or may not perform as expected. In addition, the costs of integrating an acquired business may exceed our estimates and may require significant time and attention from senior management. Accordingly, the Company cannot predict whether it will succeed in implementing these strategic initiatives. If it fails to successfully diversify our business, it may have a material adverse effect on the Company’s competitive position, financial condition and operating results.
The Company’s paper products are vulnerable to long-term declines in demand due to competing technologies or materials.
The Company’s paper business competes with electronic transmission and document storage alternatives, as well as with paper grades it does not produce, such as uncoated groundwood. As a result of such competition, the Company is experiencing ongoing decreasing demand for most of its existing paper products. As the use of these alternatives grows, demand for paper products is likely to decline further. Declines in demand for our paper products may adversely affect the Company’s business, results of operations and financial position.
The pulp and paper industry in which we operate is highly cyclical. Fluctuations in the prices of and the demand for the Company’s pulp and paper products could result in lower sales and profit.
The pulp and paper industry is highly cyclical. Historically, economic and market shifts, fluctuations in capacity and changes in foreign currency exchange rates have created cyclical changes in prices, sales volume and margins for the Company’s pulp and paper products. The length and magnitude of industry cycles have varied over time and by product, but generally reflect changes in macroeconomic conditions and levels of industry capacity. Most of the Company’s paper products are commodities that are widely available from other producers. Because commodity products have few distinguishing qualities from producer to producer, competition for these products is based primarily on price, which is determined by supply relative to demand.
The overall levels of demand for the pulp and paper products that the Company manufactures and distributes, and consequently its sales and profitability, reflect fluctuations in levels of end-user demand, which depend in part on general macroeconomic conditions in North America and worldwide, the continuation of the current level of service and cost of postal services, competition from electronic substitution, as well as competition from electronic substitution.the occurrence of a contagious disease or illness, including COVID-19. See “Conditions in the global political and economic environment, including the global capital and credit markets, can adversely affect the Company’s business, results of operations and financial position” and, “The Company’s paper products are vulnerable to long-term declines in demand due to competing technologies or materials” and “A global pandemic (or any disease outbreak, including epidemics, pandemics, or similar widespread public health concerns such as the recent COVID-19 pandemic) could have a material adverse effect on the Company’s business operations, results of operations, cash flows and financial position”.
Industry supply of pulp and paper products is also subject to fluctuation, as changing industry conditions can influence producers to idle or permanently close individual machines or entire mills. Such closures can result in significant cash and/or non-cash charges. In addition, to avoid substantial cash costs in connection with idling or closing a mill, some producers will choose to continue to operate at a loss, sometimes even a cash loss, which can prolong weak pricing environments due to oversupply. Oversupply also can result from
12
producers introducing new capacity in response to favorable pricing trends or low-cost imports in response to exchange rates and other factors.
Industry supply of pulp andor paper products is also influenced by overseas production capacity, which has grown in recent years and is expected to continue to grow.
As a result, prices for all of the Company’s pulp and paper products are driven by many factors outside of its control, and the Company has little influence over the timing and extent of price changes, which are often volatile. Because market conditions beyond the Company’s control determine the prices for its commodity products, the price for any one or more of these products may fall below its cash production costs, requiring the Company to either incur cash losses on product sales or cease production at one or more of its pulp and paper manufacturing facilities. The Company continuously evaluates potential adjustments to its production capacity, which may include additional closures of machines or entire mills, and the Company could recognize significant cash and/or non-cash charges relating to any such closures in future periods. Refer to Item 8, Financial Statements and Supplementary Data, under Note 16 “Closure and Restructuring Costs and Impairment of Long-Lived Assets” for more details. Therefore, the Company’s profitability with respect to these products depends on managing its cost structure, particularly wood fiber, chemical, transportation and energy costs, which represent the largest components of its operating costs and can fluctuate based upon factors beyond its control. If the prices or demand for its pulp and paper products decline, or if its wood fiber, chemical, transportation or energy costs increase, or both, this could adversely affect the Company’s results of operations and financial position.
The Company relies heavily on a small number of significant customers, including one customer that represented approximately 12%13% of the Company’s sales in 2020.2022. A significant change in customer relationships or in customer demand for our products could materially adversely affect the Company’s business, financial condition or results of operations.
The Company heavily relies on a small number of significant customers. The Company’s largest customer, Staples, represented approximately 12%13% of the Company’s sales in 2020.2022. A significant reduction in sales to any of the Company’s key customers could materially adversely affect the Company’s business, financial condition or results of operations, which could result from such customers further diversifying their product sourcing, experiencing financial difficulty or consolidating with each other.operations.
The Company may have difficulty obtaining wood fiber at favorable prices, or at all.
Wood fiberFiber is the principal raw material used by the Company’s Pulp and Paper business, comprising approximately 24%22% of the cost of sales in 2020.2022. Wood fiber is a commodity, and prices historically have been impacted by a variety of factors. The primary source for wood fiber is timber. Environmental litigation and regulatory developments, alternative use for energy production and reduction in harvesting related to the housing market, have caused, and may cause in the future, significant reductions in the amount of timber available for commercial harvest in the U.S. and Canada. In addition, future domestic or foreign legislation and litigation concerning the use of timberlands, the protection of endangered species, the promotion of forest health and the response to and prevention of catastrophic wildfires could also affect timber supplies. Availability of harvested timber may be further limited by adverse weather, fire, insect infestation, disease, ice storms, windstorms, flooding and other natural and man-made causes, thereby reducing supply and increasing prices. Wood fiber pricing is subject to regional market influences, and the Company’s cost of wood fiber may increase in particular regions due to market shifts in those regions. Any sustained increase in wood fiber prices would increase the Company’s operating costs, and the Company may be unable to increase prices for its products in response to increased wood fiber costs due to additional factors affecting the demand or supply of these products.
The Company currently meets its wood fiber requirements by purchasing wood fiber from third parties and by harvesting timber pursuant to its forest licenses and forest management agreements. If the Company’s cutting rights, pursuant to its forest licenses or forest management agreements are reduced, or any third-party supplier of wood fiber stops selling or is unable to sell wood fiber to the Company, its financial condition or results of operations could be materially and adversely affected.
An increase in the cost of the Company’s purchased energy or other raw materials would lead to higher manufacturing costs, thereby reducing its margins.
The Company’s operations consume substantial amounts of energy such as biomass, natural gas and electricity. Energy prices, particularly for electricity, natural gas and fuel oil, have been volatile in recent years. As a result, fluctuations in energy prices will impact the Company’s manufacturing costs and contribute to earnings volatility. While the Company purchases substantial portions of its energy under supply contracts, most of these contracts are based on market pricing.
Other raw materials the Company uses include various chemical compounds, such as precipitated calcium carbonate, sodium chlorate, sulfuric acid, dyes, peroxide, methanol and aluminum sulfate, super absorbent polymers and nonwovens.methanol. The costs of these other raw materials have been volatile historically, and they are influenced by capacity utilization, energy prices and other factors beyond the Company’s control. Inflationary pressures have also increased and may continue to increase the cost of services and raw materials.
Due to the commodity nature of the Company’s products, the relationship between supply and demand for these products, rather than changes in the cost of raw materials or purchased energy, will determine the Company’s ability to increase prices. Consequently, the Company may be unable to pass on increases in its operating costs to its customers. Any sustained increase in raw material or energy
prices without any corresponding increase in product pricing would reduce the Company’s operating margins and may have a material adverse effect on its business and results of operations.
13
The Company depends on third parties for transportation services.
The Company relies on third parties for transportation of the products it manufactures and/or distributes, as well as delivery of its raw materials. In particular, a significant portion of the goods it manufactures and raw materials it uses are transported by railroad, trucks or ocean barges. If any of its third-party transportation providers were to fail to deliver the goods that the Company manufactures or distributes in a timely manner, the Company may be unable to sell those products at full value, or at all. Similarly, if any of these providers were to fail to deliver raw materials to the Company in a timely manner, it may be unable to manufacture its products in response to customer demand. In addition, if any of these third parties were to cease operations or cease doing business with the Company, it may be unable to replace them at reasonable cost. Any failure of a third-party transportation provider to deliver raw materials or finished products in a timely manner could harm the Company’s reputation, negatively impact its customer relationships and may have a material adverse effect on its financial condition and results of operations.
The Company could experience disruptions in operations and/or increased labor costs due to labor disputes.
Approximately 57%56% of the Company’s employees are represented by unions through collective bargaining agreements generally negotiated on a facility-by-facility basis. In the future, the Company may not be able to negotiate acceptable new collective bargaining agreements, which could result in strikes or work stoppages or other labor disputes by affected workers. Renewal of collective bargaining agreements could also result in higher wages or benefits paid to union members. In addition, labor organizing activities could occur at any of the Company’s facilities. Therefore, the Company could experience a disruption of its operations or higher ongoing labor costs, which could have a material adverse effect on its business and results of operations.
A material disruption in the Company supply chain, manufacturing or distribution operations could prevent it from meeting customer demand, reduce its sales and/or negatively impact its results of operations.
The Company’s ability to manufacture, distribute and sell products is critical to its operations. These activities are subject to inherent risks such as:
| • unscheduled maintenance outages; • prolonged power failures; • equipment failure; • chemical spill or release; • malfunction of a boiler; • the effect of a drought or reduced rainfall on its water supply; • labor disputes; • government regulations; • disruptions in the transportation infrastructure, including roads, bridges, railroad tracks and tunnels; • adverse weather, fires, floods, earthquakes, hurricanes or other catastrophes; • cyberattack or other security breaches; • failure of our IT systems, including any failure of our current systems and/or as a result of transitioning to additional or replacement IT system; • public health crises that impact trade or the general economy, including COVID-19 and other viruses, diseases or illnesses; • terrorism or threats of terrorism, acts of war; or • other operational problems, including those resulting from the risks described in this section.
|
|
|
|
|
|
|
|
|
|
|
|
|
|
|
|
|
|
|
|
|
|
|
|
|
|
|
|
|
|
Events such as those listed above could disrupt the Company’s supply chain and impair its ability to manufacture or sell its products and have resulted in operating losses in the past. Any interruption or facility damage could prevent the Company from meeting customer demand for its products as well as require additional resources and/or require unplanned expenditures. If one or more of these machines or facilities were to incur significant downtime, it may have a material adverse effect on the Company’s results of operations and financial position.
14
Climate change or legal, regulatory or market measures to address climate change may negatively affect our business and results of operations.
Climate change resulting from increased concentrations of carbon dioxide and other greenhouse gases in the atmosphere could present risks to our operations, including an adverse impact on global temperatures, weather patterns and the frequency and severity of extreme weather and natural disasters. Natural disasters and extreme weather conditions, such as a hurricane, tornado, wildfire, extreme winter condition or flooding, may pose physical risks to our facilities and disrupt the operation.
Concern over climate change may also result in new or additional legal or regulatory requirements designed to reduce greenhouse gas emissions and/or mitigate the effects of climate change on the environment. If such laws or regulations are more stringent than current legal or regulatory obligations, we may experience disruption in, or an increase in the costs associated with sourcing, manufacturing and distribution of our products, which may adversely affect our business, results of operations or financial condition. Further, the impacts of climate change have an influence on customer preferences, and failure to provide climate-friendly products could potentially result in loss of market share.
The Company could encounter difficulties restructuring operations or closing or disposing of facilities or business.
The Company is continuously seeking the most cost-effective means and structure to serve our customers and to respond to changes in our markets. Accordingly, from time to time, the Company has, and is likely to again close facilities, sell non-core assets and otherwise restructure operations in an effort to improve cost competitiveness and profitability. As a result, restructuring and divestiture costs have been, and are expected to be, a recurring component of our operating costs, and may vary significantly from year to year depending on the scope of such activities. Divestitures and restructuring may also result in significant financial charges for the impairment of assets, including intangible assets. Furthermore, such activities may divert the attention of management, disrupt our ordinary operations, or result in a reduction in the volume of products produced and sold. There is no guarantee that any such activities will achieve its goal,their goals, and if the Company cannot successfully manage the associated risks, its financial condition and results of operations could be adversely affected.
Legal and Regulatory Risks
The Company could incur substantial costs as a result of compliance with, violations of or liabilities under applicable environmental laws and regulations. It could also incur costs as a result of asbestos-related personal injury litigation.
The Company is subject to a wide range of general and industry-specific laws and regulations in the U.S. and other countries where we have operations,Canada, relating to the protection of the environment and natural resources, including those governing air emissions, greenhouse gases and climate change, wastewater discharges, harvesting, silvicultural activities, storage, management and disposal of hazardous substances and wastes, the cleanup of contaminated sites, landfill operation and closure obligations, forestry operations and endangered species habitat, and health and safety matters. In particular, the pulp and paper industry in the U.S. is subject to the United States Environmental Protection Agency’s (“EPA”) Cluster Rules.
The Company has incurred, and expects that it will continue to incur, significant capital, operating and other expenditures complying with applicable environmental laws and regulations as a result of remedial obligations. The Company incurred $62$71 million of operating expenses and $4$8 million of capital expenditures in connection with environmental compliance and remediation in 2020.2022. As of December 31, 2020,2022, the Company had a provision of $47$40 million for environmental expenditures, including certain asset retirement obligations (such as for landfill capping).
The Company could also incur substantial costs, such as civil or criminal fines, sanctions and enforcement actions (including orders limiting its operations or requiring corrective measures, installation of pollution control equipment or other remedial actions), cleanup and closure costs, and third-party claims for property damage and personal injury as a result of violations of, or liabilities under, environmental laws and regulations. The Company’s ongoing efforts to identify potential environmental concerns that may be associated with its past and present properties may lead to future environmental investigations. Those efforts may result in the determination of additional environmental costs and liabilities which cannot be reasonably estimated at this time.
As the owner and operator of real estate, the Company may be liable under environmental laws for cleanup, closure and other damages resulting from the presence and release of hazardous substances, including asbestos, on or from its properties or operations, including properties that it no longer owns. The amount and timing of environmental expenditures is difficult to predict, and, in some cases, the Company’s liability may be imposed without regard to contribution or to whether it knew of, or caused, the release of hazardous substances and may exceed forecasted amounts or the value of the property itself. The discovery of additional contamination or the imposition of additional cleanup obligations at the Company’s or third-party sites may result in significant additional costs. Any material liability the Company incurs could adversely impact its financial condition or preclude it from making capital expenditures that would otherwise benefit its business.
15
In addition, the Company may be subject to asbestos-related personal injury litigation arising out of exposure to asbestos on or from its properties or operations and may incur substantial costs as a result of any defense, settlement, or adverse judgment in such litigation. The Company may not have access to insurance proceeds to cover costs associated with asbestos-related personal injury litigation.
Enactment of new environmental laws or regulations or changes in existing laws or regulations (such as changes in climate change regulation), or interpretation thereof, might require significant expenditures. For additional information, refer to Item 8, Financial Statements and Supplementary Data, under Note 2220 “Commitments and Contingencies”. The Company may be unable to generate funds or other sources of liquidity and capital to fund environmental liabilities or expenditures.
Failure to comply with applicable laws and regulations could have a material adverse effect on our business, financial results or condition.
In addition to environmental laws, the Company’s business and operations are subject to a broad range of other laws and regulations in the U.S. and Canada as well as other jurisdictions in which the Company operates, including antitrust and competition laws, occupational health and safety laws, and employment laws. Many of these laws and regulations are complex and subject to evolving and differing interpretation. If the Company is determined to have violated any such laws or regulations, whether inadvertently or
willfully, it may be subject to civil and criminal penalties, including substantial fines, loss of authorizations to participate in or exclusion from government programs, claims for damages by third parties or fines or monetary penalties which may have a material adverse effect on the Company’s financial position, results of operations or cash flows. For additional information, refer to Item 8, Financial Statements and Supplementary Data, under Note 2220 “Commitments and Contingencies.”
Financial Risks
The Company may incur substantially more debt. This could increase risks associated with its leverage.
The Company may incur substantial additional indebtedness in the future. Although the Company’s debt agreements contain restrictions on the incurrence of additional secured and unsecured indebtedness, these restrictions are subject to a number of qualifications and exceptions, and additional indebtedness incurred in compliance with these restrictions could be substantial. Refer to Item 8, Note 17 “Long-term debt”, of this Annual Report on Form 10-K for more details.
The Company’s operations require substantial capital, and it may not have adequate capital resources to provide for all of its capital requirements.
The Company’s businesses are capital intensive and require ongoing capital expenditures in order to maintain its equipment, increase its operating efficiency and comply with environmental laws. In 2020,2022, the Company’s total capital expenditures were $175 million.$440 million, with a significant portion related to the conversions of the Kingsport mill.
If the Company’s available cash resources and cash generated from operations are not sufficient to fund its operating needs and capital expenditures, the Company would have to obtain additional funds from borrowings or other available sources or reduce or delay its capital expenditures. The Company may not be able to obtain additional funds on favorable terms, or at all. In addition, the Company’s debt service obligations will reduce its available cash flows. If the Company cannot maintain or upgrade its equipment as it requires or allocate funds to ensure environmental compliance, it could be required to curtail or cease some of its manufacturing operations, or it may become unable to manufacture products that compete effectively in one or more of its product lines.
The Company and its subsidiaries may incur substantially more debt. This could increase risks associated with its leverage.
The Company and its subsidiaries may incur substantial additional indebtedness in the future. Although the revolving credit facility contains restrictions on the incurrence of additional indebtedness, including secured indebtedness, these restrictions are subject to a number of qualifications and exceptions, and additional indebtedness incurred in compliance with these restrictions could be substantial. Refer to Item 8, Financial Statements and Supplementary Data, under Note 19 “Long-Term Debt” for more details.
The Company’s ability to generate the significant amount of cash needed to pay interest and principal on the Company’s secured and unsecured long-term notesindebtedness and service its other debt and financial obligations and its ability to refinance all or a portion of its indebtedness or obtain additional financing depends on many factors beyond the Company’s control.
In 2020,2022, the Company paid approximately $59$116 million in interest and principal payments. The Company’s ability to make payments on and refinance its debt, including the Company’s secured and unsecured long-term notes, its First Lien Term Loan Facility and amounts borrowed under its revolving credit facility and term loan,ABL Revolving Credit Facility, if any, and other financial obligations and to fund its operations will depend on its ability to generate substantial operating cash flow. The Company’s cash flow generation will depend on its future performance, which will be subject to prevailing economic conditions and to financial, business and other factors, many of which are beyond its control.
The Company’s business may not generate sufficient cash flow from operations and future borrowings may not be available to the Company under its revolving credit facilityABL Revolving Credit Facility or otherwise in amounts sufficient to enable the Company to service its indebtedness, including the Company’s secured and unsecured long-term notes, its First Lien Term Loan Facility and borrowings, if any, under its revolving credit facility and securitizationABL Revolving Credit Facility or to fund its other liquidity needs. If the Company cannot service its debt, the Company will have to take actions such as reducing or delaying capital investments, selling assets, restructuring or refinancing its debt or seek additional equity capital. Any of these remedies may not be executed on commercially reasonable terms, or at all, and may impede the implementation of its business strategy. Furthermore, the revolving credit facilitysecured and unsecured long-term notes, the First Lien Term Loan Facility and the ABL Revolving
16
Credit Facility may restrict the Company from adopting any of these alternatives. Because of these and other factors that may be beyond its control, the Company may be unable to service its indebtedness.
An increase in interest rates could have a material adverse effect on our business.
Borrowings under the Company ABL Revolving Credit Facility and under its First Lien Term loan bear interest at rates that are calculated based on LIBOR or SOFR or a base rate plus, in each case, an applicable margin. As a result, the Company is exposed to risks associated with an increase in interest rates, including if the U.S. Federal Reserve raises its benchmark interest rate. The Company may utilize derivative financial instruments, such as interest rate swaps, to manage its interest rate risk. There can be no assurance, however, that increases in interest rates will not adversely affect the Company business, financial position and results of operations by causing an increase in interest expense. Significantly higher interest rates may also, among other things, reduce the availability and increase the cost of obtaining new debt and refinancing existing indebtedness.
The Company has liabilities with respect to its pension plans and the actual cost of its pension plan obligations could exceed current provisions. As of December 31, 2020,2022, the Company’s defined benefit plans had a surplus of $152$219 million on certain plans and a deficit of $124$39 million on others.
Since pension fund obligations are primarily long-term in nature, losses in pension fund investments, if any, would result in increased contributions by the Company, to be paid over 5 year or 10 year periods, depending upon the applicable legislation for funding pension deficits. Losses, if any, would also impact the Company’s results over a longer period of time and immediately increase liabilities and reduce equity.
The Company’s future funding obligations for its defined benefit pension plans depend upon changes to the level of benefits provided by the plans, the future performance of assets set aside in trusts for these plans, the level of interest rates used to determine minimum funding levels, actuarial data and experience, and any changes in government laws and regulations. As of December 31, 2020,2022, the Company’s defined benefit pension plans held assets with a fair value of $1,594$962 million.
Market Risks
The Company faces intense competition in its markets, and the failure to compete effectively could have a material adverse effect on its business and results of operations.
The Company competes with U.S., Canadian, European and Asian producers and, for many of its product lines with global producers, some of which may have greater financial resources and lower production costs than the Company. The principal basis for competition is selling price. The Company’s ability to maintain satisfactory margins depends largely on its ability to control its costs. Our industries also are particularly sensitive to other factors including innovation, design, quality and service, with varying emphasis on these factors depending on the product line. The Company cannot provide assurance that it will compete effectively and maintain current levels of sales and profitability. If the Company cannot compete effectively, such failure could have a material adverse effect on its business and results of operations.
Conditions in the global political and economic environment, including the global capital and credit markets, can adversely affect the Company’s business, results of operations and financial position.
A significant or prolonged downturn in the general economic environment may affect the Company’s sales and profitability. The Company has exposure to counterparties with which it routinely executes transactions. Such counterparties include commercial banks, insurance companies and other financial institutions, some of which may be exposed to bankruptcy or liquidity risks. A bankruptcy or illiquidity event by one of its significant counterparties may materially and adversely affect the Company’s access to capital, future business and results of operations. In addition, the Company’s customers and suppliers may be adversely affected by severe economic conditions. This could result in reduced demand for its products or its inability to obtain necessary supplies at reasonable costs, or at all.
The Company may be negatively impacted by political issues or crisiscrises in individual countries or regions, including sovereign risk related to a default by or deterioration in the credit worthiness of local governments. Any of these effects, and others the Company cannot anticipate, may have a negative effect and may adversely affect the Company’s business.
The Company is affected by changes in currency exchange rates.
The Company has manufacturing operations in the U.S. and Canada. As a result, it is exposed to movements in foreign currency exchange rates in Canada. Moreover, certain assets and liabilities are denominated in currencies other than the U.S. dollar and are exposed to foreign currency movements. As a result, the Company’s earnings are affected by increases or decreases in the value of the Canadian dollar relative to the U.S. dollar. Additionally, there has been, and may continue to be, volatility in currency exchange rates. The Company’s risk management policy allows hedging a significant portion of its exposure to fluctuations in foreign currency exchange
17
rates for periods up to three years. The Company may use foreign exchange derivative instruments to mitigate its exposure to fluctuations in foreign currency exchange rates. There can be no assurance that the Company will be protected against substantial foreign currency fluctuations. Currency exchange rates could adversely affect the Company’s results of operations and financial position.
General Risks
A global pandemic (or any disease outbreak, including epidemics, pandemics, or similar widespread public health concerns such as the recent COVID-19 pandemic) could have a material adverse effect on the Company’s business operations, results of operations, cash flows and financial position.
The Company’s business may be negatively impacted by the fear of exposure to or actual effects of a disease outbreak, epidemic, pandemic, or similar widespread public health concern, resulting in travel restrictions or recommendations or mandates from governmental authorities to avoid large gatherings or to self-quarantine. These impacts include, but are not limited to:
• Significant reductions in demand or significant volatility in demand for one or more of the Company’s products, which may be caused by, among other things: the closing of offices and schools where paper is used extensively, the temporary inability of consumers to purchase the Company’s products due to illness, quarantine or other travel restrictions, financial hardship, shifts in demand away from one or more of our more discretionary or higher priced products to lower priced products or use of alternatives, stockpiling or similar activity; if prolonged, such impacts can further increase the difficulty of planning for operations and may adversely impact the Company’s results;
• Inability to meet the Company’s customers’ needs and achieve cost targets due to disruptions in the Company’s manufacturing and supply arrangements caused by constrained workforce capacity or the loss or disruption of other essential manufacturing and supply elements such as raw materials or other finished product components, transportation, or other manufacturing and distribution capability;
• Failure of third parties on which the Company relies, including the Company’s suppliers, distributors, contractors or commercial banks, to meet their obligations to the Company, or significant disruptions in their ability to do so, which may be caused by their own financial or operational difficulties and may adversely impact the Company’s operations; or
• Significant changes in the political conditions in the markets in which the Company manufactures, sells or distributes its products, including quarantines, import/export restrictions, price controls, or governmental or regulatory actions, closures or other restrictions that limit or close the Company’s operating and manufacturing facilities, restrict the Company’s employees’ ability to travel or perform necessary business functions, or otherwise prevent the Company’s suppliers or customers from sufficiently staffing operations, including operations necessary for the production, distribution and sale of the Company’s products, which could adversely impact the Company’s results.
Despite the Company’s efforts to manage and mitigate these impacts to the Company, their ultimate impact also depends on factors beyond our knowledge or control, including the duration and severity of any such outbreak as well as third-party actions taken to contain its spread and mitigate its public health effects.
18
The Company’s financial results could be affected by changes in U.S. and foreign tax laws or in the mix of our U.S. and foreign earnings, as well as adjustments to our estimates of uncertain tax issues or results from audits by U.S. or foreign tax authorities.
The Company is subject to U.S. and foreign tax laws and regulations. Tax laws, regulations, and administrative practices in various jurisdictions may be subject to significant change, with or without notice, due to economic, political and other conditions, and significant judgment is required in evaluating and estimating our provision and accruals for these taxes. International tax norms governing each country’s jurisdiction to tax cross-border international trade have evolved partly due to the Base Erosion and Profit Shifting project led by the Organization for Economic Cooperation and Development and supported by the G20. Changes in these laws and regulations, or any change in the position of tax authorities regarding their application, administration or interpretation could adversely affect the Company’s financial results. In addition, a number of countries are actively pursuing changes to their tax laws applicable to multinational corporations, such as the U.S. Tax Cuts and Jobs Acts (“U.S. Tax Reform”), enacted in 2017. Finally, foreign governments may enact tax laws in response to the U.S. Tax Reform that could result in further changes to global taxation and materially impact the Company’s financial results.
The U.S. Tax Reform significantly changes how the U.S. taxes corporations. The U.S. Tax Reform requires complex computations to be performed that were not previously required under U.S. tax law, significant judgments to be made in interpretation of the provisions of the U.S Tax Reform and significant estimates in calculations, and the preparation and analysis of information not previously relevant or regularly produced. The U.S. Treasury Department, the IRS, and other standard-setting bodies could interpret or issue guidance on how provisions of the U.S. Tax Reform will be applied or otherwise administered that is different from the Company’s interpretation.
The Company’s effective tax rates could be affected by changes in the mix of earnings in countries with differing statutory tax rates or changes in the valuation of deferred tax assets and liabilities. The Company is also subject to the examination of its tax returns and other matters by tax authorities and governmental bodies. The Company regularly assesses the likelihood of an adverse outcome resulting from these examinations to determine the adequacy of its provision for taxes and as of December 31, 2020,2022, has a reserve for liabilities relating to uncertain tax positions of $23$20 million. Taxing authorities may disagree with the positions the Company has taken regarding the tax treatment or characterization of its transactions. If any tax authorities were successful in challenging the tax treatment or characterization of any of the Company’s transactions, it could also adversely affect its financial results.
The Company’s intellectual property rights are valuable, and any inability to protect them could reduce the value of its products and its brands.
The Company relies on patent, trademark and other intellectual property laws of the U.S. and other countries to protect its intellectual property rights. However, the Company may be unable to prevent third parties from using its intellectual property without its authorization, which may reduce any competitive advantage it has developed. If the Company had to litigate to protect these rights, any proceedings could be costly, and it may not prevail. The Company cannot guarantee that any U.S. or foreign patents, issued or pending, will provide it with any competitive advantage or will not be challenged by third parties. Additionally, the Company has obtained and applied for U.S. and foreign trademark registrations and will continue to evaluate the registration of additional service marks and trademarks, as appropriate. The Company cannot guarantee that any of its pending patent or trademark applications will be approved by the applicable governmental authorities and, even if the applications are approved, third parties may seek to oppose or otherwise challenge these registrations. The failure to secure any pending patent or trademark applications may limit the Company’s ability to protect the intellectual property rights that these applications were intended to cover.
If the Company is unable to successfully retain and develop executive leadership and other key personnel, it may be unable to fully realize critical organizational strategies, goals and objectives.
The success of the Company is substantially dependent on the efforts and abilities of its key personnel, including its executive management team, to develop and implement its business strategies and manage its operations. The failure to retain key personnel or to develop successors with appropriate skills and experience for key positions in the Company could adversely affect the development and achievement of critical organizational strategies, goals and objectives. There can be no assurance that the Company will be able to retain or develop the key personnel it needs and the failure to do so may adversely affect its financial condition and results of operations.
Our operations could be adversely affected by disruptions to our Information Technology (IT) Services.
The Company’s IT systems, some of which are dependent on services provided by third parties, serve an important role in the efficient operation of its business. The protection of customers, employees and company data is critical to the Company’s business. This role includes ordering and managing materials from suppliers, managing its inventory, converting materials to finished products, facilitating order entry and fulfillment and processing of transactions, summarizing and reporting its financial results, facilitating internal and external communications, administering human resources functions, retaining certain personal information and providing other processes necessary to manage its business. The failure of the Company’s IT systems, including any failure of the Company’s current systems and/or as a result of transitioning to additional or replacement IT systems, as the case may be, to perform as the Company anticipates could disrupt the Company’s business and could result in, among other things, transactions errors, processing inefficiencies, disruption of production and/or deliveries, loss of data and the loss of sales and customers, which could have a material adverse effect on the Company’s business, financial position and results of operations and the effectiveness of our internal control over financial reporting could be negatively impact.impacted.
19
The Company is exposed to the risk of cyber incidents in the normal course of business. Cyber incidents may be deliberate attacks for the theft of intellectual property or other sensitive information or may be the result of unintentional events. Like most companies, the Company's information technology systems may be vulnerable to interruption due to a variety of events beyond the Company's control, including, but not limited to, natural disasters, terrorist attacks, power and/or telecommunications failures, computer viruses, hackers and other security issues. The Company has technology security initiatives and disaster recovery plans in place to mitigate the Company's risk to these vulnerabilities, including protection of confidential or personal information, but these measures may not be adequate or implemented properly to ensure that the Company's operations are not disrupted. The Company’s IT systems have been, and will likely continue to be, subject to computer viruses or other malicious codes, unauthorized access attempts, phishing and other cyber-incidents. The Company cannot guarantee that its security efforts will prevent breaches or breakdowns to its IT systems or those of its third-party providers. Potential consequences of a material cyber incident, which could result in confidential or personal information being accessed, obtained, damaged or used by unauthorized or improper persons, include damage to the Company’s reputation, litigation, inefficiencies or production downtimes and increased cyber security protection and remediation costs. Such consequences could have a negative impact on the Company’s ability to meet customers’ orders, resulting in a delay or decrease to its revenue and a reduction to its operating margins.
ITEM 1B. UNRESOLVED STAFF COMMENTS
None.
ITEM 2. PROPERTIES
As of December 31, 2022, we had eight integrated pulp and paper mills (six in the U.S. and two in Canada), one newly converted mill that produce packaging papers (in the U.S.) and two stand-alone pulp mills (one in the U.S. and one in Canada). As a condition of the regulatory approval for the Acquisition of Resolute, we were required to commit to the divestiture of our Dryden, Ontario mill. On February 26, 2023, we entered into an Asset Purchase Agreement to sell the mill and related assets for a purchase price of $240 million in cash, subject to customary adjustments and to customary closing conditions. The transaction is expected to close in the first half of 2023. A description of our mills and related properties is included in Item I, Business.
Production facilities
Our paper manufacturing operations are supported by eleven converting and forms manufacturing operations (including a network of eight plants located offsite from our paper making operations) as well as sales offices, regional replenishment centers and warehouse facilities located in the U.S. and Canada.
Production facilities
We own substantially all of our production facilities. We lease substantially all of our sales offices, regional replenishment centers and warehouse facilities. We believe our properties are in good operating condition and are suitable and adequate for the operations for which they are used. We own substantially all of the equipment used in our facilities.
ForestlandsApproximately 70% of our paper production capacity is in the United States and 30% is located in Canada and approximately 69% of our pulp production capacity is in the U.S. and 31% is in Canada.
Forestlands
We manage approximately 54 million acres of forestlands that are directly licensed or owned by Domtar in Canada, through efficient management and the application of certified sustainable forest management practices. We also have access to fiber from an additional 25 million acres of public forestlands in Canada that are licensed and managed by third parties. We believe that these forestlands will provide a continuous supply of wood for future needs.
Listing of facilities and locations (1)
|
|
|
|
|
|
|
|
|
|
|
ITEM 3. LEGAL PROCEEDINGS
In the normal course of operations, the Company becomes involved in various legal actions mostly related to contract disputes, patent infringements, environmental and product warranty claims, and labor issues. The Company periodically reviews the status of these proceedings and assesses the likelihood of any adverse judgments or outcomes of these legal proceedings, as well as analyzes probable losses. Although the final outcome of any legal proceeding is subject to a number of variables and cannot be predicted with any degree of certainty, management currently believes that the ultimate outcome of current legal proceedings will not have a material adverse effect on the Company’s long-term results of operations, cash flow or financial position. However, an adverse outcome in one or more of the significant legal proceedings could have a material adverse effect on the Company’s results, financial condition or cash flow in a given quarter or year.
For a discussion of commitments, legal proceedings and related contingencies, refer to Item 8, Financial Statements and Supplementary Data under, Note 2220 “Commitments and Contingencies”.
20
ITEM 4. MINE SAFETY DISCLOSURES
Not applicable.
21
PART II
ITEM 5. MARKET FOR REGISTRANT’S COMMON EQUITY, RELATED STOCKHOLDER MATTERS AND ISSUER PURCHASES OF EQUITY SECURITIES
MARKET INFORMATION
Domtar Corporation’sAs of December 31, 2022, there are no publicly traded common stock is traded on the New York Stock Exchange and the Toronto Stock Exchange under the symbol “UFS”.
HOLDERS
At February 5, 2021, the number of shareholders of record (registered and non-registered)shares of Domtar Corporation common stock was approximately 19,015.
DIVIDENDS AND STOCK REPURCHASE PROGRAM
During 2020, the Company declared one quarterly dividend of $0.455 per share, to holders of the Company’s common stock. Dividends aggregating $25 million were paid on April 15, 2020, to shareholders of record as of April 2, 2020.
On May 5, 2020, due to the unprecedented market conditions and uncertainty caused by COVID-19, the Company suspended the payment of its regular quarterly dividend and stock repurchase program in order to preserve cash and provide additional flexibility in the current environment. On February 11, 2021, the Company announced that it will resume its stock repurchase program. The Board of Directors will continue to evaluate the Company’s capital return program based upon customary considerations, including market conditions.
During 2019, the Company declared one quarterly dividend of $0.435 and three quarterly dividends of $0.455 per share, to holders of the Company’s common stock. Dividends aggregating $28 million, $28 million, $27 million and $26 million were paid on April 15, 2019, July 16, 2019, October 15, 2019 and January 15, 2020, respectively, to shareholders of record as of April 2, 2019, July 2, 2019, October 2, 2019 and January 2, 2020, respectively.
The Company’s Board of Directors has authorized a stock repurchase program (“the Program”) of up to $1.6 billion. At December 31, 2020, the Company had approximately $344 million of remaining availability under the Program. Under the Program, the Company is authorized to repurchase, from time to time, shares of its outstanding common stock on the open market or in privately negotiated transactions. The timing and amount of stock repurchases will depend on a variety of factors, including the market conditions, as well as corporate and regulatory considerations. The Program may be suspended, modified or discontinued at any time, and the Company has no obligation to repurchase any amount of its common stock under the Program. The Program has no set expiration date. The Company repurchases its common stock in part to reduce the dilutive effects of our stock options, awards, and to improve shareholders’ returns. All shares repurchased are recorded as Treasury stock on the Consolidated Balance Sheets under the par value method at $0.01 per share.
The Company makes open market purchases of its common stock using general corporate funds. Additionally, the Company may enter into structured stock repurchase agreements with large financial institutions using general corporate funds in order to lower the average cost to acquire shares. The agreements would require the Company to make up-front payments to the counterparty financial institutions which would result in either the receipt of stock at the beginning of the term of the agreements followed by a share adjustment at the maturity of the agreements, or the receipt of either stock or cash at the maturity of the agreements, depending upon the price of the stock.
During 2020, the Company repurchased 1,798,306 shares at an average price of $33.05 for a total cost of $59 million.
During 2019, the Company repurchased 6,220,658 shares at an average price of $35.29 for a total cost of $219 million.
Share repurchase activity under our stock repurchase program was as follows during the year ended December 31, 2020:Corporation.
|
|
|
|
|
|
|
|
|
|
|
|
|
| (d) Approximate |
| |
|
|
|
|
|
|
|
|
|
| (c) Total Number |
|
| Dollar Value of |
| ||
|
|
|
|
|
|
|
|
|
| of Shares |
|
| Shares that May |
| ||
|
|
|
|
|
|
|
|
|
| Purchased as |
|
| Yet be Purchased |
| ||
|
| (a) Total Number |
|
| (b) Average |
|
| Part of Publicly |
|
| under the Plans |
| ||||
|
| of Shares |
|
| Price Paid |
|
| Announced Plans |
|
| or Programs |
| ||||
Period |
| Purchased |
|
| per Share |
|
| or Programs |
|
| (in 000s) |
| ||||
January 1 through March 31, 2020 |
|
| 1,798,306 |
|
| $ | 33.05 |
|
|
| 1,798,306 |
|
| $ | 343,601 |
|
April 1 through June 30, 2020 |
|
| — |
|
| $ | — |
|
|
| — |
|
| $ | 343,601 |
|
July 1 through September 30, 2020 |
|
| — |
|
| $ | — |
|
|
| — |
|
| $ | 343,601 |
|
October 1 through October 31, 2020 |
|
| — |
|
| $ | — |
|
|
| — |
|
| $ | 343,601 |
|
November 1 through November 30, 2020 |
|
| — |
|
| $ | — |
|
|
| — |
|
| $ | 343,601 |
|
December 1 through December 31, 2020 |
|
| — |
|
| $ | — |
|
|
| — |
|
| $ | 343,601 |
|
|
|
| 1,798,306 |
|
| $ | 33.05 |
|
|
| 1,798,306 |
|
|
|
|
|
PERFORMANCE GRAPH
This graph compares the return on a $100 investment in the Company’s common stock on December 31, 2015 with a $100 investment in an equally-weighted portfolio of a peer group (1), and a $100 investment in the S&P 400 MidCap Index. This graph assumes that returns are in local currencies and assumes quarterly reinvestment of dividends. The measurement dates are the last trading day of the period as shown.
|
|
The peer group includes: WestRock Company, Ontex Group NV, Glatfelter Corporation, International Paper Co., Kimberly-Clark Corporation, Neenah Paper, Inc., Packaging Corp. of America, Resolute Forest Products Inc., SCA, Sonoco Products Company, Stora Enso Oyj and UPM-Kymmene Corp.
ITEM 6. SELECTED FINANCIAL DATARESERVED
The following sets forth selected historical financial data of the Company for the periods and as of the dates indicated. The selected financial data as of and for the fiscal years then ended have been derived from the audited financial statements of Domtar Corporation. All prior periods presented have been restated and prior period amounts have been adjusted to conform with current year presentation, if applicable.22
The following table should be read in conjunction with Item 7, Management’s Discussion and Analysis of Financial Condition and Results of Operations and Item 8, Financial Statements and Supplementary Data.
|
| Year ended |
| |||||||||||||||||
FIVE YEAR FINANCIAL SUMMARY |
| December 31, 2020 |
|
| December 31, 2019 |
|
| December 31, 2018 |
|
| December 31, 2017 |
|
| December 31, 2016 |
| |||||
(In millions of dollars, except per share figures) |
|
|
|
|
|
|
|
|
|
|
|
|
|
|
|
|
|
|
|
|
Statement of Income Data: |
|
|
|
|
|
|
|
|
|
|
|
|
|
|
|
|
|
|
|
|
Sales |
| $ | 3,652 |
|
| $ | 4,369 |
|
| $ | 4,565 |
|
| $ | 4,258 |
|
| $ | 4,291 |
|
Closure and restructuring costs and impairment of long-lived assets 1,2 |
|
| 235 |
|
|
| 54 |
|
|
| — |
|
|
| 31 |
|
|
| 60 |
|
Depreciation and amortization |
|
| 223 |
|
|
| 231 |
|
|
| 241 |
|
|
| 257 |
|
|
| 287 |
|
Operating (loss) income 1,2 |
|
| (177 | ) |
|
| 179 |
|
|
| 395 |
|
|
| 172 |
|
|
| 157 |
|
(Loss) earnings from continuing operations |
|
| (145 | ) |
|
| 85 |
|
|
| 281 |
|
|
| 239 |
|
|
| 77 |
|
Earnings (loss) from discontinued operations, net of taxes |
|
| 18 |
|
|
| (1 | ) |
|
| 2 |
|
|
| (497 | ) |
|
| 51 |
|
Net (loss) earnings 3 |
|
| (127 | ) |
|
| 84 |
|
|
| 283 |
|
|
| (258 | ) |
|
| 128 |
|
Per common share (in dollars) |
|
|
|
|
|
|
|
|
|
|
|
|
|
|
|
|
|
|
|
|
(Loss) earnings from continuing operations - Basic |
| $ | (2.62 | ) |
| $ | 1.39 |
|
| $ | 4.47 |
|
| $ | 3.81 |
|
| $ | 1.23 |
|
Earnings (loss) from discontinued operations - Basic |
| $ | 0.33 |
|
| $ | (0.02 | ) |
| $ | 0.03 |
|
| $ | (7.92 | ) |
| $ | 0.81 |
|
Basic net (loss) earnings |
| $ | (2.29 | ) |
| $ | 1.37 |
|
| $ | 4.50 |
|
| $ | (4.11 | ) |
| $ | 2.04 |
|
(Loss) earnings from continuing operations - Diluted |
| $ | (2.62 | ) |
| $ | 1.39 |
|
| $ | 4.45 |
|
| $ | 3.81 |
|
| $ | 1.23 |
|
Earnings (loss) from discontinued operations - Diluted |
| $ | 0.33 |
|
| $ | (0.02 | ) |
| $ | 0.03 |
|
| $ | (7.92 | ) |
| $ | 0.81 |
|
Diluted net (loss) earnings |
| $ | (2.29 | ) |
| $ | 1.37 |
|
| $ | 4.48 |
|
| $ | (4.11 | ) |
| $ | 2.04 |
|
Cash dividends paid per common share |
| $ | 0.91 |
|
| $ | 1.78 |
|
| $ | 1.72 |
|
| $ | 1.66 |
|
| $ | 1.63 |
|
Balance Sheet Data: |
|
|
|
|
|
|
|
|
|
|
|
|
|
|
|
|
|
|
|
|
Cash and cash equivalents |
| $ | 309 |
|
| $ | 61 |
|
| $ | 111 |
|
| $ | 139 |
|
| $ | 125 |
|
Property, plant and equipment, net |
|
| 2,023 |
|
|
| 2,223 |
|
|
| 2,229 |
|
|
| 2,354 |
|
|
| 2,434 |
|
Total assets |
|
| 4,856 |
|
|
| 4,903 |
|
|
| 4,925 |
|
|
| 5,212 |
|
|
| 5,680 |
|
Long-term debt due within one year |
|
| 13 |
|
|
| 1 |
|
|
| 1 |
|
|
| 1 |
|
|
| 63 |
|
Long-term debt |
|
| 1,084 |
|
|
| 937 |
|
|
| 852 |
|
|
| 1,126 |
|
|
| 1,216 |
|
Total shareholders' equity |
|
| 2,260 |
|
|
| 2,376 |
|
|
| 2,538 |
|
|
| 2,483 |
|
|
| 2,676 |
|
Discontinued operations: On January 7, 2021, we agreed to sell our Personal Care business. As a result, effective on December 31, 2020, we classified our Personal Care business as a discontinued operations and reclassified the Personal Care assets and liabilities to assets and liabilities held for sale on our balance sheets, for all periods presented.
|
|
|
|
|
|
ITEM 7. MANAGEMENT’S DISCUSSION AND ANALYSIS OF FINANCIAL CONDITION AND RESULTS OF OPERATIONS
This Management’s Discussion and Analysis of Financial Condition and Results of Operations (“MD&A”) should be read in conjunction with Domtar Corporation’s audited consolidated financial statements and notes thereto included in Item 8, Financial Statements and Supplementary Data. This discussion contains forward-looking statements that involve risks and uncertainties. Our actual results may differ materially from those discussed in forward-looking statements. Factors that might cause a difference include, but are not limited to, those discussed in Item 1, Business, under “Forward-looking statements”, as well as in Item 1A, Risk Factors, in this report. Except where otherwise indicated, all financial information reflected herein is determined on the basis of accounting principles generally accepted in the United States.
The information contained on our website, www.domtar.com, is not incorporated by reference into this Form 10-K and should in no way be construed as a part of this or any other report that we file with or furnish to the SEC.
In accordance with industry practice, in this report, the term “ton” or the symbol “ST” refers to a short ton, an imperial unit of measurement equal to 0.9072 metric tons. The term “metric ton” or the symbol “ADMT” refers to an air dry metric ton. In this report, unless otherwise indicated, all dollar amounts are expressed in U.S. dollars, and the term “dollars” and the symbol “$” refer to U.S. dollars. In the following discussion, unless otherwise noted, references to increases or decreases in income and expense items, prices, contribution to net earnings (loss), and shipment volumes are based on the twelve-month periods ended December 31, 2020, 2019 and 2018. The twelve month periods are also referred to as 2020, 2019 and 2018. References to notes refer to footnotes to the consolidated financial statements and notes thereto included in Item 8, Financial Statements and Supplementary Data.
This MD&A is intended to provide investors with an understanding of our recent performance, financial condition and outlook. Topics discussed and analyzed include:
|
|
|
|
|
|
|
|
|
|
|
|
|
|
|
|
For a discussion of the year ended December 31, 20192021 compared to the year ended December 31, 2018, other than “Results of Operations”,2020, please refer to Part II, Item 7, Management’s"Management's Discussion and Analysis of Financial Condition and Results of Operations,Operations" in our Annual Report on Form 10-K for the year ended December 31, 2019, filed2021 (filed with the SEC on March 10, 2022).
RECENT DEVELOPMENT
Paper Excellence acquired Resolute Forest Products through Domtar Corporation
On March 1, 2023, the Paper Excellence Group completed the acquisition of Resolute Forest Products Inc. ("Resolute") through Domtar (the “Acquisition”). Under the agreement, Domtar completed the acquisition of all the outstanding shares of Resolute common stock for $20.50 per share and one contingent value right tied to potential refunds on duty deposits made on or prior to June 30, 2022, of up to $500 million. Any proceeds attributable to the contingent value right will be distributed proportionally to contingent value right holders, and the value will ultimately be determined by the terms and timing of the resolution of the softwood lumber dispute between Canada and the United States.
We are financing the transaction with (i) $500 million in equity from Domtar shareholder, and (ii) additional debt financing. Refer to Item 8, “Financial Statements and Supplementary Data”, under Note 24 “ Subsequent Events”, for additional information on this acquisition as well as its financing.
The acquisition-date fair value of the considerations transferred is approximately $1.6 billion, excluding the contingent value right on softwood lumber duty deposits refunds.
As a condition to obtain the approval of the Acquisition from the Canadian Competition Bureau, we were required to commit to the divestiture of our Dryden, Ontario pulp mill, within a short period of time following the Acquisition. As of December 31, 2022, the sale of the pulp mill did not meet all the criteria for held for sale. On February 25, 2020.
Sale of Personal Care Business
On January 7, 2021,26, 2023, we agreedentered into and Asset Purchase Agreement to sell our Personal Care business to American Industrial Partners (“AIP”),the mill and related assets for a purchase price of $920$240 million in cash, (the “Transaction”).subject to customary adjustments and to customary closing conditions. The Transactiontransaction is expected to close in the first quarterhalf of 2021. Based on its magnitude and because we are exiting the Personal Care business, the sale represents a significant strategic shift that has a material effect on our operations and financial results. Accordingly, all periods presented reflect the Personal Care business as a discontinued operation. Our Personal Care business was previously disclosed as a separate reportable segment. For more information on our discontinued operations, refer to Item 8, Financial Statements and Supplemental Data, under Note 3, “Discontinued Operations”.
Purchase of Appvion Point of Sale Business
On April 27, 2020, we completed the acquisition of the Point of Sale paper business from Appvion Operations Inc. The business includes the coater and related equipment located at Appvion’s West Carrollton, Ohio, facility as well as a license for all corresponding intellectual property and assumed liabilities related to post-retirement benefits. The results of this business have been included in the consolidated financial statements as of April 27, 2020 and are presented in the Pulp and Paper business. For more information, refer to Item 8, Financial Statements and Supplemental Data, under Note 4 “Acquisition of Business”.
Change in Reporting for EAM Corporation2023.
Starting January 1, 2020, as a result of changes in our organizational structure, EAM Corporation, a manufacturer of high quality airlaid and ultrathin laminated cores, previously reported under our former Personal Care segment is now presented under our Pulp and Paper business. Prior period results have been restated to the new presentation with no significant impact on results. For more information, refer to Item 8, Financial Statements and Supplemental Data, under Note 24 “Segment Disclosures”.OVERVIEW
OVERVIEW
Following our agreement to sell our Personal Care business, we nowWe operate as a single reportable segment as described below, which also represents our only operating segment.
Pulp and Paper: Our Pulp and Paper business consists of the design, manufacturing, marketing and distribution of communication, specialty and packaging papers, as well as softwood hardwood and fluff pulps and high quality airlaid and ultrathin laminated absorbent cores.
Our segment measure of profit (operating income (loss) from continuing operations) is used by management to evaluate performance and make operational decisions. Management believes that this measure allows for a better understanding of cost trends, operating efficiencies, prices and volume. Business segment operating income (loss) is defined as earnings (loss) from continuing operations before income taxes and equity losses, excluding corporate items, interest expense, net, and non-service components of net periodic benefit cost. Corporate expenses are allocated to our segment with the exception of certain discretionary charges and credits, which we present under “Corporate” and do not allocate to the segment.
2020 HIGHLIGHTS
|
|
|
|
|
|
|
|
|
|
|
|
|
|
|
| Twelve months ended |
|
|
|
|
|
|
|
|
|
|
|
|
|
|
|
|
| |||||||||
|
| December 31, |
|
| December 31, |
|
| December 31, |
|
| Variance 2020 vs. 2019 |
|
| Variance 2019 vs. 2018 |
| |||||||||||||
FINANCIAL HIGHLIGHTS |
| 2020 |
|
| 2019 |
|
| 2018 |
|
| $ |
|
| % |
|
| $ |
|
| % |
| |||||||
(In millions of dollars, unless otherwise noted) |
|
|
|
|
|
|
|
|
|
|
|
|
|
|
|
|
|
|
|
|
|
|
|
|
|
|
|
|
Sales |
| $ | 3,652 |
|
| $ | 4,369 |
|
| $ | 4,565 |
|
| $ | (717 | ) |
|
| -16 | % |
| $ | (196 | ) |
|
| -4 | % |
Operating (loss) income (a) |
|
|
|
|
|
|
|
|
|
|
|
|
|
|
|
|
|
|
|
|
|
|
|
|
|
|
|
|
Pulp and Paper |
|
| (143 | ) |
|
| 226 |
|
|
| 442 |
|
|
| (369 | ) |
|
| -163 | % |
|
| (216 | ) |
|
| -49 | % |
Corporate |
|
| (34 | ) |
|
| (47 | ) |
|
| (47 | ) |
|
| 13 |
|
|
| 28 | % |
|
| — |
|
|
| - | % |
Operating (loss) income |
|
| (177 | ) |
|
| 179 |
|
|
| 395 |
|
|
| (356 | ) |
|
| -199 | % |
|
| (216 | ) |
|
| -55 | % |
(Loss) Earnings from continuing operations |
|
| (145 | ) |
|
| 85 |
|
|
| 281 |
|
|
| (230 | ) |
|
| -271 | % |
|
| (196 | ) |
|
| -70 | % |
Earnings (loss) from discontinued operations, net of taxes |
|
| 18 |
|
|
| (1 | ) |
|
| 2 |
|
|
| 19 |
|
|
| 1900 | % |
|
| (3 | ) |
|
| -150 | % |
Net (loss) earnings |
|
| (127 | ) |
|
| 84 |
|
|
| 283 |
|
|
| (211 | ) |
|
| -251 | % |
|
| (199 | ) |
|
| -70 | % |
Basic net (loss) earnings per common share (in dollars) (b): |
|
|
|
|
|
|
|
|
|
|
|
|
|
|
|
|
|
|
|
|
|
|
|
|
|
|
|
|
(Loss) earnings from continuing operations |
| $ | (2.62 | ) |
| $ | 1.39 |
|
| $ | 4.47 |
|
| $ | (4.01 | ) |
|
|
|
|
| $ | (3.08 | ) |
|
|
|
|
Earnings (loss) from discontinued operations |
| $ | 0.33 |
|
| $ | (0.02 | ) |
| $ | 0.03 |
|
| $ | 0.35 |
|
|
|
|
|
| $ | (0.05 | ) |
|
|
|
|
Basic net (loss) earnings |
| $ | (2.29 | ) |
| $ | 1.37 |
|
| $ | 4.50 |
|
| $ | (3.66 | ) |
|
|
|
|
| $ | (3.13 | ) |
|
|
|
|
Diluted net (loss) earnings per common share (in dollars) (b): |
|
|
|
|
|
|
|
|
|
|
|
|
|
|
|
|
|
|
|
|
|
|
|
|
|
|
|
|
(Loss) earnings from continuing operations |
| $ | (2.62 | ) |
| $ | 1.39 |
|
| $ | 4.45 |
|
| $ | (4.01 | ) |
|
|
|
|
| $ | (3.06 | ) |
|
|
|
|
Earnings (loss) from discontinued operations |
| $ | 0.33 |
|
| $ | (0.02 | ) |
| $ | 0.03 |
|
| $ | 0.35 |
|
|
|
|
|
| $ | (0.05 | ) |
|
|
|
|
Diluted net (loss) earnings |
| $ | (2.29 | ) |
| $ | 1.37 |
|
| $ | 4.48 |
|
| $ | (3.66 | ) |
|
|
|
|
| $ | (3.11 | ) |
|
|
|
|
|
| At December 31, |
|
| At December 31, |
| ||
|
| 2020 |
|
| 2019 |
| ||
Total assets |
| $ | 4,856 |
|
| $ | 4,903 |
|
Total long-term debt, including current portion |
| $ | 1,097 |
|
| $ | 938 |
|
|
|
|
|
IMPACT OF THE COVID-19 PANDEMIC
With23
On November 30, 2021, Paper Excellence completed the unprecedentedacquisition of all the outstanding common shares of Domtar Corporation by means of a merger of Pearl Merger Sub (a wholly-owned subsidiary) with and rapid spreadinto the Company with the Company continuing as the surviving corporation and as a subsidiary of COVID-19Paper Excellence (the “Merger”).
For purposes of the Company’s financial statement presentation, Pearl Merger Sub was determined to be the accounting acquirer in the Merger which was accounted for using the acquisition method of accounting. The application of the acquisition method of accounting resulted in a new basis of the Company’s assets and social distancing measures implemented throughoutliabilities which are measured at fair value as of the world duedate of the Merger.
The Company’s consolidated financial statements for the period following the closing of the Merger are labeled “Successor” and reflect the Company’s assets and liabilities at their fair values. All periods prior to the pandemic, this virus has hadclosing of the Merger reflect the historical accounting basis of the Company’s assets and liabilities and are labeled “Predecessor.”
As a profound impact on human health,condition to obtain the global economy and society in general. We are actively monitoringapproval of the impact of COVID-19 on all aspectsMerger from the Canadian Competition Bureau, we were required to commit to the divestiture of our Kamloops, British Columbia pulp mill, within a short period of time following the Merger. On June 1, 2022, the mill and related assets, were sold to an independent acquirer approved by the Commissioner. The assets and liabilities related to the pulp mill for periods prior to the sales, were presented as held for sale in the Consolidated Balance Sheet. At the time of the Merger, the sale of the pulp mill met the criteria for discontinued operations and as such, earnings were included within Earnings (loss) from discontinued operations, net of taxes in the Consolidated Statement of Earnings (Loss) and Comprehensive income (loss) for all periods presented. Refer to Item 1, Financial Statements and Supplementary Data, under Note 3 “Discontinued Operations” for additional information on the Discontinued Operations.
Combined Results
We have prepared our discussion of the results of operations by comparing the results of the Successor period from January 1, 2022 to December 31, 2022 and the combined Successor period from December 1, 2021 through December 31, 2021 and the Predecessor period from January 1, 2021 through November 30, 2021 (”S/P Combined”). We believe this approach provides the most meaningful basis of comparison and is more useful in identifying current business including how it is impactingtrends for the periods presented. The combined results of operations included in our employees, operations, customers, suppliers, liquidity and capital resources.
Our operationsdiscussion below are not considered to be essential servicesprepared in accordance with accounting principles generally accepted in the jurisdictions whereUnited States of America (“non-GAAP”) and have not been prepared as pro forma results under applicable regulations, may not reflect the actual results we operate. Certain of our paper products are used inwould have achieved had the testing for COVID-19 as well as for personal protection medical gowns. However, demand for our paper has declined significantly sinceMerger occurred at the beginning of April, largely due to work-from-home rulesfiscal 2021, and should not be viewed as a substitute for the overall economic slowdown. The length and severityresults of operations of the reductionPredecessor and Successor periods presented in paper demand is uncertain; ataccordance with accounting principles generally accepted in the current time, we expectUnited States of America.
In the adverse impactfollowing discussion, unless otherwise noted, references to continue through the first quarter of 2021. Beyond the first quarter of 2021, paper demand will depend largely on when,increases or decreases in income and the extentexpense items, prices, contribution to which, work-from-home subsidesnet earnings (loss), and shipment volumes are based on the timing oftwelve-month periods ended December 31, 2022 and 2021.
24
The twelve month periods are also referred to as 2022 and 2021. References to notes refer to footnotes to the return to normal global economic activities.
consolidated financial statements and notes thereto included in Item 8, Financial Statements and Supplementary Data.
Effects from COVID-19 began for us
| Successor |
|
|
| Predecessor |
|
| (non-GAAP) |
| |||||||
| Year ended |
|
| Period from |
|
|
| Period from |
|
| Year ended |
| ||||
|
|
|
|
|
|
|
|
|
|
|
|
| ||||
|
|
|
|
|
|
|
|
|
|
|
|
| ||||
Sales | $ | 4,577 |
|
| $ | 300 |
|
|
| $ | 3,368 |
|
| $ | 3,668 |
|
Operating Expenses |
|
|
|
|
|
|
|
|
|
|
|
| ||||
Cost of sales, excluding depreciation and amortization |
| 3,534 |
|
|
| 251 |
|
|
|
| 2,771 |
|
|
| 3,022 |
|
Depreciation and amortization |
| 209 |
|
|
| 23 |
|
|
|
| 182 |
|
|
| 205 |
|
Selling, general and administrative |
| 275 |
|
|
| 23 |
|
|
|
| 246 |
|
|
| 269 |
|
Impairment of long-lived assets |
| — |
|
|
| — |
|
|
|
| 9 |
|
|
| 9 |
|
Closure and restructuring costs |
| — |
|
|
| (1 | ) |
|
|
| 17 |
|
|
| 16 |
|
Asset conversion costs |
| 67 |
|
|
| 3 |
|
|
|
| 27 |
|
|
| 30 |
|
Transaction costs |
| 22 |
|
|
| — |
|
|
|
| 132 |
|
|
| 132 |
|
Other operating income, net |
| (2 | ) |
|
| — |
|
|
|
| (5 | ) |
|
| (5 | ) |
| $ | 4,105 |
|
| $ | 299 |
|
|
| $ | 3,379 |
|
| $ | 3,678 |
|
Operating income (loss) from continuing operations | $ | 472 |
|
| $ | 1 |
|
|
| $ | (11 | ) |
| $ | (10 | ) |
Interest expense, net |
| 90 |
|
|
| 10 |
|
|
|
| 54 |
|
|
| 64 |
|
Non-service components of net periodic benefit cost |
| (40 | ) |
|
| (2 | ) |
|
|
| (22 | ) |
|
| (24 | ) |
Earnings (loss) before income taxes and equity loss | $ | 422 |
|
| $ | (7 | ) |
|
| $ | (43 | ) |
| $ | (50 | ) |
Income tax expense (benefit) |
| 101 |
|
|
| (2 | ) |
|
|
| 6 |
|
|
| 4 |
|
Earnings (loss) from continuing operations | $ | 321 |
|
| $ | (5 | ) |
|
| $ | (49 | ) |
| $ | (54 | ) |
Earnings from discontinued operations, net of taxes |
| 18 |
|
|
| 1 |
|
|
|
| 26 |
|
|
| 27 |
|
Net earnings (loss) | $ | 339 |
|
| $ | (4 | ) |
|
| $ | (23 | ) |
| $ | (27 | ) |
|
|
|
|
|
|
|
|
|
|
|
|
| ||||
Operating income (loss) from continuing operations |
|
|
|
|
|
|
|
|
|
|
|
| ||||
Pulp and Paper |
| 527 |
|
|
| 4 |
|
|
|
| 157 |
|
|
| 161 |
|
Corporate |
| (55 | ) |
|
| (3 | ) |
|
|
| (168 | ) |
|
| (171 | ) |
Operating income (loss) from continuing operations | $ | 472 |
|
| $ | 1 |
|
|
| $ | (11 | ) |
| $ | (10 | ) |
COST REDUCTION PROGRAM
In 2020, we had implemented a cost savings program, which we had completed at the end of the firstsecond quarter of 2020 but were not material to the three-month’s results ended March 31, 2020. Shipments2021. As part of paper were lower by approximately 19% in 2020 when compared to 2019. As a result of the decrease in demand, on August 7, 2020,this program, we announced the permanent closure of the uncoated freesheet manufacturing at our Kingsport, Tennessee and Port Huron, Michigan mills, the remaining paper machine and converting operations at ourthe Ashdown, Arkansas mill and the converting center in Ridgefields, Tennessee. Additionally, we announced the closure of the converting center in Dallas, Texas. These actions reduced ourthe Company’s annual uncoated freesheet paper capacity by approximately 721,000 short tons and resulted in a workforce reduction of approximately 750 employees. The Kingsport and Ashdown paper machines, which havemachine has been idled since April 2020, did not recommence operations. Our2020. The Ridgefields converting center ceased operations at the end of the third quarter of 2020, while ourthe Port Huron mill is expected to shut down byat the end of February 2021 and the firstDallas converting center ceased operations at the beginning of July 2021.
Restart of the paper machine and converting operations at Ashdown, Arkansas mill
On July 15, 2021, we announced our intention to restart the paper machine and converting operations at the Ashdown, Arkansas mill, which has been idled since April 2020, to add an additional 185,000 tons per year of uncoated freesheet production capacity to our manufacturing network. The increase was necessary to meet growing customer demand as the economy recovers from the COVID-19 pandemic. The additional paper capacity resulted in a capacity reduction of 185,000 ADMT per year of baled SBSK pulp at the mill. The machine restarted in the fourth quarter of 2021.
Our pulp shipments were higher by approximately 7% in 2020 when compared to 2019. We expect near-term pulp markets to gradually improve driven by better demand, maintenance outages and restocking in China.
Below we further describe specific impacts and the measures we have taken since March 2020.
Health and Safety of our Employees
The safety of our employees continues to be our primary focus. As COVID-19 has evolved, we have taken numerous steps to protect the health and safety of our employees, including: social distancing, providing personnel protection and thermal scanning, health monitoring, contact tracing and enhanced cleaning measures. In addition, we implemented travel restrictions and work-from-home policies for employees who have the ability to work remotely.
Operations and Supply Chain
We continue to operate in compliance with the orders and restrictions imposed by government authorities in each of our locations, and we are working with our customers to meet their specific shipment needs. We continue to place a priority on business continuity and contingency planning, including potential planning for extended closures of any key facilities, whether because of government action or workforce disruption, or because of disruptions related to our key suppliers that might arise related to COVID-19. At this point, we have experienced only minor disruptions. We are actively monitoring our supply chain, and we may experience disruptions in our supply chain as the pandemic continues. We cannot reasonably estimate the potential impacts or timing of those events, nor can we reasonably estimate our ability to mitigate such impacts.
Cost Reduction Program
On August 7, 2020 we announced the implementation of a cost reduction program targeting $200 million in annual run-rate cost savings to be realized by the end of 2021. The goal of the program is to build a stronger business operation, enhance our cost efficiency, improve operating margins and maximize productivity and cash flow. The cost saving initiatives includes capacity reduction and asset closures(noted above), mill-level cost savings and rightsizing of support functions. See Cost Reduction Program below for more information on this program.
ONGOING IMPACT OF THE COVID-19 PANDEMIC
Liquidity and Capital Resources25
We have taken actions and may take other actions, intended to increase our cash position and preserve financial flexibility in light of the current uncertaintyAs reflected in the global markets. On May 5, 2020, we entered into a five-year $300 million term loan. We suspended our regular quarterly dividend and stock repurchase program in 2020 and on February 11, 2021, we announced that we would resume our stock repurchase program. In addition, we completed a reviewdiscussion below, ongoing impacts of all planned capital expenditures for 2020 and reduced or delayed spending without compromising on safety or regulatory compliance. Our capital expenditures for 2020 were $175 million, a decrease of approximately $75 million compared to our planned spending.
Government Assistance
The U.S. and Canadian governments have launched several support programs to provide assistance to companies during the COVID-19 pandemic. We continue to review the details of the various programs to determine whether we might qualify.
The Government of Canada created the CEWS to provide financial support for businesses during the COVID-19 pandemic and actions taken in response to prevent large layoffs. CEWS allows eligible entitiesthem had varying effects on our 2022 and 2021 results of operations, although some effects, including customer demand, are mitigating or becoming more difficult to receiveisolate or quantify. Moreover, it is difficult to determine the duration and scope of the pandemic, the scale and rate of economic recovery from the pandemic, any ongoing effects on consumer demand and spending patterns, supply chain disruptions, and labor availability and costs, or the impact of other indirect factors that may be attributable to the pandemic, and the extent to which these or other currently unanticipated consequences of the pandemic are reasonably likely to materially affect our results of operations. In addition, these factors can make it difficult to isolate and quantify the portion of our costs that are a subsidy retroactivedirect result of the pandemic and costs arising from factors that may have been influenced by the pandemic, including increased wage rates and incentives, increased carrier rates, and fulfillment network inefficiencies resulting from constrained labor markets and global supply chain constraints. We continue to March 15, 2020. assess the economic environment in which we operate and any developments relating to the COVID-19 pandemic, and take appropriate actions to address the economic and other challenges we face.
2022 HIGHLIGHTS
| Successor |
|
| (non-GAAP) |
|
|
|
| |||
| Year ended |
|
| Year ended |
|
| Variance 2022 vs. 2021 |
| |||
FINANCIAL HIGHLIGHTS |
|
|
|
|
|
|
|
| |||
|
|
|
|
|
|
|
|
| |||
Sales | $ | 4,577 |
|
| $ | 3,668 |
|
| $ | 909 |
|
Operating income (loss) from continuing operations (a) |
|
|
|
|
|
|
|
| |||
Pulp and Paper |
| 527 |
|
|
| 161 |
|
|
| 366 |
|
Corporate |
| (55 | ) |
|
| (171 | ) |
|
| 116 |
|
Operating income (loss) from continuing operations |
| 472 |
|
|
| (10 | ) |
|
| 482 |
|
Earnings (loss) from continuing operations |
| 321 |
|
|
| (54 | ) |
|
| 375 |
|
Earnings from discontinued operations, net of taxes |
| 18 |
|
|
| 27 |
|
|
| (9 | ) |
Net earnings (loss) |
| 339 |
|
|
| (27 | ) |
|
| 366 |
|
OUTLOOK
|
| Successor |
| ||||||
|
| At December 31, |
|
|
| At December 31, |
| ||
|
| 2022 |
|
|
| 2021 |
| ||
Total assets |
| $ | 4,724 |
|
|
| $ | 4,854 |
|
Total long-term debt, including current portion |
| $ | 1,536 |
|
|
| $ | 1,902 |
|
COST REDUCTION PROGRAM
On August 7, 2020, we announced the implementation of a cost reduction program, targeting $200 million in annual run-rate cost savings to be realized by the end of 2021. The goal of the program is to build a stronger business operation, enhance our cost efficiency, improve operating margins and maximize productivity and cash flow. The costs saving initiatives include capacity reduction and asset closures, mill-level cost savings and rightsizing support functions. The leaner organizational structure is also expected to improve cross-functional collaboration, leveraging more efficient business processes.
During 2020, we recorded $136 million of accelerated depreciation under Impairment of long-lived assets on the Consolidated Statementrelated to our cost reduction program of Earnings (Loss)$14 million and Comprehensive Income (Loss). Additionally,$9 million, respectively. In addition, in 2021, under Corporate, we recorded $34recognized $132 million of severancetransaction costs and termination costs, $31$2 million of inventory obsolescence, $12 million of environmental costs, $4 million of pension curtailment and settlement charges and $18 million of licenses fees, write-offs and other costs, under Closureclosure and restructuring costs on the Consolidated Statement of Earnings (Loss) and Comprehensive Income (Loss).
Kingsport, Tennessee mill
We plan to enter the linerboard market with the conversion of our Kingsport paper machine. Once in full operation, the mill will produce and market approximately 600,000 tons annually of high-quality recycled linerboard and medium, providing us with a strategic footprint in a growing adjacent market. The conversion is expected to be completed by the end of 2022.
We estimate the conversion cost to be between $300 and $350 million. Once fully operational, the mill is expected to be a low-cost, first quartile recycled linerboard mill in North America. The converted mill is expected to directly employ approximately 160 employees.
Ashdown, Arkansas mill
We will complete the conversion of our Ashdown mill to 100% softwood and fluff pulp, which will require $15 to $20 million of capital investments and is expected to be completed in early 2021. The mill will produce additional market hardwood pulp until it converts the fiberline to softwood pulp. The conversion of the fiberline to 100% softwood is also necessary for an eventual expansion into containerboard. Following the fiberline conversion, Ashdown will have annual production capacity of 775,000 tons of fluff and softwood pulp. Refer tocharges. See Item 8, Financial Statements and SupplementalSupplementary Data, under Note 1614 “Closure and Restructuring Costs and Impairment of Long-Lived Assets” for more information.
26
REVIEW OF OPERATIONS
This section presents a discussion and analysis of our 2020, 2019 and 2018twelve months ended December 31, 2022, with our S/P Combined twelve months ended December 31, 2021 sales, operating income (loss) income and other information relevant to the understanding of our results from continuing operations.
ANALYSIS OF SALES |
|
|
|
|
|
|
|
|
| |||
| Successor |
|
| (non-GAAP) S/P Combined |
|
|
|
|
| |||
| Twelve months ended |
|
| Twelve months ended December 31, 2021 |
|
|
| Variance 2022 vs. 2021 |
| |||
Sales | $ | 4,577 |
|
| $ | 3,668 |
|
|
| $ | 909 |
|
Shipments |
|
|
|
|
|
|
|
|
| |||
Paper - manufactured (in thousands of ST) |
| 2,297 |
|
|
| 2,144 |
|
|
|
| 153 |
|
Communication Papers |
| 1,912 |
|
|
| 1,769 |
|
|
|
| 143 |
|
Specialty and Packaging papers |
| 385 |
|
|
| 375 |
|
|
|
| 10 |
|
Pulp (in thousands of ADMT) |
| 1,291 |
|
|
| 1,433 |
|
|
|
| (142 | ) |
EAM’s results of operations, previously reported under our former Personal Care segment, are now presented under our Pulp and Paper business with no significant impact on our results. Prior period results have been restated to the new presentation.
ANALYSIS OF SALES |
|
|
|
|
|
|
|
|
|
|
|
|
|
|
|
|
|
|
|
|
|
|
|
|
|
|
|
|
|
| Twelve months ended |
|
|
|
|
|
|
|
|
|
|
|
|
|
|
|
|
| |||||||||
|
| December 31, |
|
| December 31, |
|
| December 31, |
|
| Variance 2020 vs. 2019 |
|
| Variance 2019 vs. 2018 |
| |||||||||||||
|
| 2020 |
|
| 2019 |
|
| 2018 |
|
| $ |
|
| % |
|
| $ |
|
| % |
| |||||||
Sales |
| $ | 3,652 |
|
| $ | 4,369 |
|
| $ | 4,565 |
|
|
| (717 | ) |
|
| -16 | % |
|
| (196 | ) |
|
| -4 | % |
Shipments |
|
|
|
|
|
|
|
|
|
|
|
|
|
|
|
|
|
|
|
|
|
|
|
|
|
|
|
|
Paper - manufactured (in thousands of ST) |
|
| 2,230 |
|
|
| 2,745 |
|
|
| 2,971 |
|
|
| (515 | ) |
|
| -19 | % |
|
| (226 | ) |
|
| -8 | % |
Communication Papers |
|
| 1,825 |
|
|
| 2,299 |
|
|
| 2,446 |
|
|
| (474 | ) |
|
| -21 | % |
|
| (147 | ) |
|
| -6 | % |
Specialty and Packaging papers |
|
| 405 |
|
|
| 446 |
|
|
| 525 |
|
|
| (41 | ) |
|
| -9 | % |
|
| (79 | ) |
|
| -15 | % |
Paper - sourced from third parties (in thousands of ST) |
|
| 69 |
|
|
| 93 |
|
|
| 109 |
|
|
| (24 | ) |
|
| -26 | % |
|
| (16 | ) |
|
| -15 | % |
Paper - total (in thousands of ST) |
|
| 2,299 |
|
|
| 2,838 |
|
|
| 3,080 |
|
|
| (539 | ) |
|
| -19 | % |
|
| (242 | ) |
|
| -8 | % |
Pulp (in thousands of ADMT) |
|
| 1,787 |
|
|
| 1,664 |
|
|
| 1,647 |
|
|
| 123 |
|
|
| 7 | % |
|
| 17 |
|
|
| 1 | % |
ANALYSIS OF CHANGES IN SALES |
|
|
|
|
|
|
|
|
|
|
|
|
|
|
|
|
|
|
|
|
|
|
|
|
| |||||||
|
| 2020 vs. 2019 |
|
| 2019 vs. 2018 |
| ||||||||||||||||||||||||||
|
| % Change in Sales due to |
|
| % Change in Sales due to |
| ||||||||||||||||||||||||||
|
|
|
|
|
| Volume / |
|
|
|
|
|
|
|
|
|
|
|
|
|
| Volume / |
|
|
|
|
|
|
|
|
| ||
|
| Net Price |
|
| Mix |
|
| Currency |
|
| Total |
|
| Net Price |
|
| Mix |
|
| Currency |
|
| Total |
| ||||||||
Sales |
|
| -5 | % |
|
| -11 | % |
|
| - | % |
|
| -16 | % |
|
| 1 | % |
|
| -5 | % |
|
| - | % |
|
| -4 | % |
Sales in 2020 decreased2022 increased by $717$909 million, or 16%25% when compared to sales in 2019.2021. This decreaseincrease in sales is mostly due to a decrease in our paper sales volumes and a decreasean increase in net average selling prices for paper and pulp and paper.an increase in our paper sales volumes. This decreaseincrease was partially offset by an increase in pulp sales volumes.
Sales in 2019 decreased by $196 million, or 4% when compared to sales in 2018. This decrease in sales is mostly due to a decrease in our paper sales volumes and a decrease in net average selling price for pulp. This decrease was partially offset by an increase in net average selling price for paper as well as an increase in our pulp sales volumes.
ANALYSIS of CHANGE IN OPERATING INCOME (LOSS) FROM CONTINUING OPERATIONS
2022 vs. 2021
2020 VS. 2019 |
|
|
|
|
|
|
|
|
|
|
|
|
|
|
|
|
|
|
|
|
|
|
|
|
|
|
|
|
|
|
|
|
|
|
|
|
|
| $ Change in Operating Income (Loss) due to |
| |||||||||||||||||||||||||||||||||
|
| Volume/ |
|
|
|
|
|
|
|
|
|
| Operating (b) |
|
|
|
|
|
| Depreciation/ |
|
|
|
|
|
| Other Income/ |
|
|
|
|
| ||||
|
| Mix |
|
| Net Price |
|
| Input Costs (a) |
|
| Expenses |
|
| Currency |
|
| Impairment (c) |
|
| Restructuring (d) |
|
| Expense (e) |
|
| Total |
| |||||||||
Pulp and Paper |
|
| (125 | ) |
|
| (208 | ) |
|
| 77 |
|
|
| 37 |
|
|
| 10 |
|
|
| (97 | ) |
|
| (74 | ) |
|
| 11 |
|
|
| (369 | ) |
Corporate |
|
| — |
|
|
| — |
|
|
| — |
|
|
| 16 |
|
|
| — |
|
|
| — |
|
|
| (3 | ) |
|
| — |
|
|
| 13 |
|
Operating income (loss) |
|
| (125 | ) |
|
| (208 | ) |
|
| 77 |
|
|
| 53 |
|
|
| 10 |
|
|
| (97 | ) |
|
| (77 | ) |
|
| 11 |
|
|
| (356 | ) |
|
|
|
|
|
|
|
|
|
|
|
|
|
|
Operating lossincome from continuing operations in our Pulp and Paper business amounted to ($143)$527 million in 2020, a decrease2022, an increase in income of $369$366 million, when compared to operating income from continuing operations of $226$161 million in 2019.2021. Our results were negativelypositively impacted by:
|
|
|
|
|
|
|
|
These decreasesincreases were partially offset by:
| • Higher input costs ($276 million) mostly related to higher cost of chemical, fiber and energy mostly related to inflation • Higher operating expenses ($126 million) mostly due to higher freight cost, higher salary and wages and higher maintenance expense, partially offset by higher production • Higher restructuring charges ($23 million) in 2022 as a result of higher asset conversion costs in 2022 ($37 million) related to our Kingsport mill conversion closure, partially offset by restructuring cost of nil in 2022 compared to $14 million in 2021 • The favorable impact of a lower Canadian dollar on our Canadian denominated expenses, was more than offset by the unfavorable impact of our hedging program ($16 million) • Higher depreciation/impairment charges ($1 million). We recorded $9 million of accelerated depreciation under Impairment of long-lived assets, related to our cost reduction program in 2021 compared to nil in 2022. Depreciation charges were higher by $10 million compared to 2021 • Lower other income ($1 million)
|
|
|
|
|
|
|
|
OTHER FACTORS
Corporate
We incurred $34$55 million of corporate charges in 2020,2022, a decrease of $13$116 million compared to corporate charges of $47$171 million in 2019.2021. This decrease was mostly due to lower SG&A expenses and partially offset by an increasetransaction costs of $22 million in restructuring expenses, both as a result of the cost reduction program.2022 compared to $132 million in 2021, mostly related to our Merger in 2021.
Interest Expense, net
We incurred $58$90 million of net interest expense in 2020,2022, an increase of $6$26 million compared to net interest expense of $52$64 million in 2019. The2021. This increase in net interest expense was impacted byin 2022 compared to 2021 is related to the $300$775 million Term LoanSenior Secured Notes due 2028 issued on October 18, 2021, the new ABL Revolving Credit Facility entered into on May 5, 2020November 30, 2021, the First Lien Term Loan facility entered on November 30, 2021 as well as a write-off of $6 million related to unamortized debt issuance cost in the first quarter of 2022. These increases were partially offset by lower interest paid on the 4.4% Notes due to early retirement in April 2021 as well as
27
a non-cash gain of $10 million on the fair value increment of the 6.25% Notes and 6.75% Notes upon partial repayment in January 2022. In 2022, we had capitalized interest of $24 million, compared to $9 million in 2021, mostly related to our Kingsport mill conversion. In April 2021, we paid $11 million in make-whole premium related to the early retirement of the 4.4% Notes originally due March 2022. See section “Capital Resources” below for more information on our debt structure.
Non-Service Components of net periodic benefit cost
For 2022, our non-service components of net periodic benefit cost was a benefit of $40 million, an increase in borrowingof $16 million when compared to 2021. In 2022, we recorded a non-cash pension settlement gain of $9 million. Refer to Item 8, Financial Statements and Supplementary Data, under the revolving credit facility.Note 6 “Pension Plans and Other Post-Retirement Benefit Plans” for additional information.
Income Taxes
We recorded an income tax benefitexpense of $76$101 million in 20202022 compared to an income tax expense of $17$4 million in 2019,2021, which yielded an effective tax rate of 35%24% and 16%-8% for 20202022 and 2019,2021, respectively.
In 2022, we have a U.S. tax liability from Global Intangible Low-Taxed Income (”GILTI”) related to our operations in Canada which is almost completely offset by a foreign tax credit. We also recorded $18 million of additional tax credits which mainly consisted of research and experimentation tax credits and state investment credits.
On January 7,November 30, 2021, we agreedwere acquired by Paper Excellence and incurred significant costs to sell our Personal Care business to American Industrial Partners (AIP) for $920 million. As such, forcomplete the December 31, 2020 reporting period, we are no longer indefinitely reinvested in that business and have classified our investment in that businesstransaction as held for sale. Accordingly, we have recordedwell as significant executive compensation as a deferred tax asset of $51 million for the difference between the net book valueresult of the businesschange in control. Certain of these transaction costs and theexecutive compensation expenses are not deductible for tax basis of that business which impactedpurposes and substantially impact the effective tax rate in 2020.
rate. We have assessed the valuerecorded $3 million of the deferred tax assetexpense related to the book/tax basis difference, which is expected to be a capital loss for tax purposes upon the completion of the saleGILTI and determined that we are not likely to realize a full benefit from the asset. As such, we have recorded a valuation allowance of $44 million associated with this deferred tax asset. During the year, we also analyzed our existing Arkansas research and development credits and determined an additional valuation allowance of $3 million should be recorded since it is expected these credits will expire un-utilized. These amounts unfavorably impacted the effective tax rate in 2020.
During 2020, we generated a U.S. tax net operating loss which, in accordance with the Coronavirus Aid, Relief, and Economic Security (CARES) Act will be carried back to 2015. In 2015, the US federal tax rate was 35%, versus the current rate of 21%. Therefore, we recorded an additional tax benefit of $5 million related to the tax rate benefit of the loss which favorably impacted the effective tax rate in 2020. We also recorded $17$9 million of tax credits, mainly research and experimentation credits,credits. Both of which favorably impacted the effective tax rate in 2020. Since we have a tax loss in 2020, the tax credits will be carried forward and are expected to be utilized in future years.
As a result of the deemed mandatory repatriation tax requirement of the U.S. Tax Reform, we have taxed our undistributed foreign earnings as of December 31, 2017, at reduced tax rates. After completing our evaluation of the U.S. Tax Reform’s impact on our business operations, we had determined that we are no longer indefinitely reinvested in these undistributed foreign earnings as well as foreign earnings after December 31, 2017. As such, as of December 31, 2020, we have recorded a deferred tax liability of $11 million ($12 million as of December 31, 2019) for foreign withholding tax and various state income taxes associated with future repatriation of these earnings. This additional $1 million tax benefit impacted the effective tax rate for 2020 ($2 million tax expense for 2019).
We recorded $18 million of tax credits in 2019, mainly research and experimentation credits, which significantly impacted the effective tax rate. Arkansas legislation changes were passed in 2019 which reduced the state tax rate and changed how the apportionment factor is calculated. This resulted in a deferred state tax benefit of $4 million. Additionally, a valuation allowance of $5 million was recorded in 2019 on state attributes we do not expect to utilize before they expire.
Economic conditions and uncertainties
The markets in which our pulp and paper business operateoperates are highly competitive with well-established domestic and foreign manufacturers. Most of our products are commodities that are widely available from other producers as well. Because commodity products have few distinguishing qualities from producer to producer, competition for these products is based primarily on price, which is determined by supply relative to demand. We also compete on the basis of product quality, breadth of offering and service solutions. Further, we compete against electronic transmission and document storage alternatives. As a result of such competition, we are experiencing ongoing decreasing demand for most of our existing paper products. In addition, current global economic conditions are highly volatile due to the COVID-19 pandemic, resulting in both market size contractions in certain countries due to economic slowdowns and government restrictions on movement.
The pulp market is highly fragmented with many manufacturers competing worldwide. Competition is primarily on the basis of access to low-cost wood fiber, product quality and competitively priced pulp products.
The high degree of uncertaintyIn 2023, we expect that paper volume and volatility day-to-dayprice will slightly increase when compared to 2022. Pulp volume is expected to remain relatively flat when compared to 2022. Global supply chain and the longer-term potential impacts of the economic slowdown remain unclear. In 2021, paper demand remains uncertain and dependent upon the COVID-19 recovery, in particular quarantine measures impacting the return to office and school. We expect near-term pulp markets to gradually improve driven by better demand, maintenance outages and restocking in China. Overall raw material costslogistics are expected to moderately increaseimprove and freight costs are alsowhile the rate of inflation is expected to be higher.
2019 VS. 2018 |
|
|
|
|
|
|
|
|
|
|
|
|
|
|
|
|
|
|
|
|
|
|
|
|
|
|
|
|
|
|
|
|
|
|
|
|
|
|
| $ Change in Operating Income (Loss) due to |
| ||||||||||||||||||||||||||||||||||
|
| Volume/ |
|
|
|
|
|
|
|
|
|
| Operating (b) |
|
|
|
|
|
|
| Depreciation/ |
|
|
|
|
|
| Other Income/ |
|
|
|
|
| ||||
|
| Mix |
|
| Net Price |
|
| Input Costs (a) |
|
| Expenses |
|
| Currency |
|
|
| Impairment (c) |
|
| Restructuring (d) |
|
| Expense (e) |
|
| Total |
| |||||||||
Pulp and Paper |
|
| (46 | ) |
|
| 52 |
|
|
| (46 | ) |
|
| (128 | ) |
|
| 8 |
|
|
|
| (23 | ) |
|
| (22 | ) |
|
| (11 | ) |
|
| (216 | ) |
Corporate |
|
| — |
|
|
| — |
|
|
| — |
|
|
| (6 | ) |
|
| — |
|
|
|
| — |
|
|
| — |
|
|
| 6 |
|
|
| — |
|
Operating income (loss) |
|
| (46 | ) |
|
| 52 |
|
|
| (46 | ) |
|
| (134 | ) |
|
| 8 |
|
|
|
| (23 | ) |
|
| (22 | ) |
|
| (5 | ) |
|
| (216 | ) |
|
|
|
|
|
|
|
|
|
|
|
|
|
|
Operating income inmoderate, overall input costs will remain elevated. In 2023, our PulpKingsport mill will ramp-up its production of containerboard and Paper business amountedwe expect to $226 million in 2019, a decrease of $216 million, when compared to operating income of $442 million in 2018. Our results were negatively impacted by:
|
|
|
|
|
|
|
|
|
|
|
|
These decreases were partially offset by:
|
|
|
|
Our Espanola pulp and specialty paper mill underwent an extensive audit and inspection of major components during its outage in June 2019. Followingsell the inspection and given the cyclically low pulp prices, we made the decision to fast-track some maintenance work that was originally planned for 2020 in order to address some reliability risks. This extended shutdown impacted mostly our second half of 2019 by adding approximately $36 million of maintenance costs and lowering our total production by approximately 60,000 tonnes.
OTHER FACTORS
Corporate
We incurred $47 million of corporate charges in both 2019 and 2018. Corporates charges decreased mostly due to a decrease in environmental provision and was offset by an increase in SG&A expenses.
Interest expense, net
We incurred $52 million of net interest expense in 2019, a decrease of $10 million compared to net interest expense of $62 million in 2018. The net interest expense was impacted by the repaymententire output of the $300 million Term Loan in the fourth quarter of 2018.mill.
Income Taxes
We recorded an income tax expense of $17 million in 2019 compared to an income tax expense of $68 million in 2018, which yielded an effective tax rate of 16% and 19% for 2019 and 2018, respectively.
We recorded $18 million of tax credits in 2019, mainly research and experimentation credits, which significantly impacted the effective tax rate. Arkansas legislation changes were passed in 2019 which reduced the state tax rate and changed how the apportionment factor is calculated. This resulted in a deferred state tax benefit of $4 million. Additionally, a valuation allowance of $5 million was recorded on state attributes we do not expect to utilize before they expire.
As a result of the deemed mandatory repatriation tax requirement of the U.S. Tax Reform, we have taxed our undistributed foreign earnings as of December 31, 2017, at reduced tax rates. After completing our evaluation of the U.S. Tax Reform’s impact on business operations, we have determined that we are no longer indefinitely reinvested in these undistributed foreign earnings as well as foreign earnings after December 31, 2017. Therefore, as of December 31, 2019, we have recorded a deferred tax liability of $12 million ($10 million as December 31, 2018) for foreign withholding tax and various state income taxes associated with future repatriation of these earnings. This $2 million tax expense impacted the effective tax rate for 2019 ($10 million expense for 2018).
We recorded $18 million of tax credits in 2018, mainly research and experimentation credits, which significantly impact the effective tax rate. We also recognized $3 million of tax benefits relating to 2018 law changes in Sweden and various U.S. states which favorably impacted our effective tax rate.
On December 22, 2017, the U.S. Tax Reform was signed into law. The U.S. Tax Reform significantly changed U.S. tax law for businesses by, among other things, lowering the maximum federal corporate income tax rate from 35% to 21% effective January 1, 2018, implementing a territorial tax system, and imposing a one-time deemed repatriation tax on accumulated foreign earnings. Additionally, Staff Accounting Bulletin No. 118 (“SAB 118”) was issued to address the application in situations when a registrant does not have the necessary information available, prepared, or analyzed in reasonable detail to complete the accounting for certain income tax effects of the U.S. Tax Reform. December 22, 2018 marked the end of the measurement period for purposes of SAB 118. As such, we completed our analysis, including currently available legislative updates, and recorded an additional tax benefit of $13 million for the year ended December 31, 2018. Of this benefit, $7 million related to adjustments to the deemed mandatory repatriation tax and $6 million related to the revaluation of our net deferred tax liabilities.
DISCONTINUED OPERATION
On January 7, 2021, we signed an agreement to sell our Personal Care business. Its results of operations are reported as discontinued operations for all periods presented. For the year ended December 31, 2020,2022, we reported earnings onfrom discontinued operations, net of taxes, of $18 million (2019 - loss from discontinued operations, net of taxes of $1 million; 2018 -(2021 – earnings from discontinued operations, net of taxes, of $2$27 million).
Mandated sale of Kamloops, British Columbia mill
As a condition to obtain the approval of the November 30, 2021 Merger from the Canadian Competition Bureau, we were required to commit to the divestiture of our Kamloops, British Columbia pulp mill, within a short period of time following the Merger. On June 1, 2022, the mill was sold to an independent acquirer approved by the Commissioner. The assets and liabilities related to the pulp mill for the period prior to the sales, were presented as held for sale in the Consolidated Balance Sheet. At the time of the Merger, the sale of the pulp mill met the criteria for discontinued operations and as such, earnings were included within Earnings (loss) from discontinued operations, net of taxes in the Consolidated Statement of Earnings (Loss) and Comprehensive income (loss) for all periods presented. Refer to Item 8, Financial Statements and Supplementary Data, under Note 3 “Discontinued Operations” for additional information on the Discontinued Operations.
Sale of our Personal Care business
On March 1, 2021, we completed the sale of our Personal Care business to American Industrial Partners (“AIP”), for a purchase price of $920 million in cash. Based on its magnitude and because we exited the Personal Care business, the sale represents a significant strategic shift that has a material effect on our operations and financial results. Accordingly, all periods presented reflect the Personal Care business as a discontinued operation. Our Personal Care business was previously disclosed as a separate reportable segment. For
28
more information on our discontinued operations, refer to Item 8, Financial Statements and Supplemental Data, under Note 3, “Discontinued Operations”.
STOCK-BASED COMPENSATION EXPENSE
UnderAs a result of the acquisition by Paper Excellence, on the Merger date, we recognized an accelerated vesting on all the outstanding stock-based awards under the Omnibus Plan. These awards were then cancelled and converted into the right to receive cash payment, which was made in December 2021. In turn, the Omnibus Plan we may award to key employeeswas terminated and non-employee directors, at the discretion of the Human Resources Committee of the Board of Directors, non-qualified stock options,replaced in 2022 by another long-term incentive stock options, stock appreciation rights, restricted stock units, performance-conditioned restricted stock units, performance share units, deferred share units (“DSUs”) and other stock-based awards. The non-employee directors only receive DSUs. We generally grant awards annually and use, when available, treasury stock to fulfill awards settled in common stock and options exercised.program.
For the year ended Decemberperiod from January 1 to November 31, 2020,2021, stock-based compensation expense recognized in ourthe predecessor results from continuing and discontinued operations was $7$46 million, (2019 – $22 million) for all of which $34 million, related to the outstanding awards. Compensation costs not yet recognized amounted to $15 million (2019 – $16 million) and will be recognized over the remaining service periodaccelerated vesting of approximately 14 months. The aggregate value of liability awards settled in 2020 was $6 million (2019 – $12 million). The total fair value of equity awards settled in 2020 was $6 million (2019 – $11 million), representing the fair value at the time of settlement. The fair value at the grant date for these settled equitystock-based awards, was $7 million (2019 – $6 million). Compensationrecorded under Transaction costs for performance awards are based on management’s best estimatein the Consolidated Statement of the final performance measurement.Earnings (Loss) and Comprehensive Income (Loss).
LIQUIDITY AND CAPITAL RESOURCES
Our principal cash requirements are for ongoing operating costs, pension contributions, working capital and capital expenditures, as well as principal and interest payments on our debt and income tax payments. We expect to fund our liquidity needs primarily with internally generated funds from our operations and, to the extent necessary, through borrowings under our $700$400 million credit facility,ABL Revolving Credit Facility, of which $646$336 million is currentlywas undrawn and available or through our $150 million receivables securitization facility, of which $111 million is currently undrawn and available.as at December 31, 2022. Under adverse market conditions, there can be no assurance that these agreements would be available or sufficient. See “Capital Resources” below.
Our ability to make payments on the requirements mentioned above will depend on our ability to generate cash in the future, which is subject to general economic, financial, competitive, legislative, regulatory and other factors that are beyond our control. Our credit and receivable securitization facilities and debt indenturesagreements impose various restrictions and covenants on us that could limit our ability to respond to market conditions, to provide for unanticipated capital investments or to take advantage of business opportunities.
A portion of our cash is held outside the U.S. by foreign subsidiaries. The earnings of the foreign subsidiaries reflect full provision for local income taxes. The U.S. Tax Reform includes a mandatory one-time tax on accumulated earnings of foreign subsidiaries for which we recorded a provisional repatriation tax amount of $46 million in 2017 and adjusted by $7 million in 2018. After completing our evaluation of the U.S. Tax Reform’s impact on the business operations, we have determined that we are no longer indefinitely reinvested in these undistributed foreign earnings as well as foreign earnings after December 31, 2017. We remain indefinitely reinvested in the outside basis differences of our foreign subsidiaries, except for our Personal Care business which we are selling. We do not anticipate any additional cash tax liability associated with repatriating the proceeds of the sale other than what is already provided.
Operating Activities
Our operating cash flow requirements are primarily for salaries and benefits, the purchase of raw materials, including fiber and energy, and other expenses such as income tax and property taxes.
Cash flows from operating activities, including discontinued operations, totaled $411in 2022, amounted to $604 million, in 2020, a $31$500 million decreaseincrease compared to cash flowsflow from operating activities, including discontinued operations, of $442$104 million in 2019.the combined twelve-month period ended December 31, 2021. This decreaseincrease in cash flows from operating activities is primarily due to an increase in profitability as well as a decrease in profitability partially offset by an improvement in cash flow from working capital requirements. We receivedmade income tax refunds,payments, net of payments,refunds, of $22$25 million in 2020during 2022 compared to income tax payments, net of refunds of $59$39 million in 2019.2021. We paid $4$37 million of employer pension and other post-retirement contribution in excess of pension and other post-retirement expense in 2022 compared to 2021 when we paid $19 million of employer pension and other post-retirement contributions in excess of pension and other post-retirement expense in 2020 compared to 2019 when we paid $1 million of employer pension and other post-retirement contributions in excess of pension and other post-retirement expense when excluding our non-cash pension settlement loss of $30 million.expense.
Investing Activities
Cash flows used for investing activities, including discontinued operations, in 20202022, amounted to $202$164 million, a $52$2,040 milliondecrease compared to cash flowsflow used for investing activities, including discontinued operations, of $254$2,204 million in 2019.the combine twelve month period ended December 31, 2021.
The use of cash in 20202022 was attributable to additions to property, plant and equipment of $175$440 million and was partially offset by the acquisitionproceeds from the sales of the Appvion Pointour Kamloops mills ($243 million) and proceeds from sale of Sale Business in the second quarterproperty, plant and equipment of 2020 ($30 million).$33 million.
The use of cash in 2019the combined twelve-month period ended December 31, 2021 was mostly related to the acquisition of business of $2,796 million attributable to the Merger with the Company being the surviving company as well as additions to property, plant and equipment of $255$309 million. This was partially offset by the proceeds from the sale of our Personal Care business ($897 million) and proceeds from sale of property of $4 million.
Our annual capital expenditures for 20212023 should increasedecrease due mostlyprimarily to ourthe completion of the Kingsport mill conversion and are expected to be between $310$225 million and $330$235 million.
29
Financing Activities
Cash flows used for financing activities, including discontinued operations, in 2022, amounted to $350 million, compared to cash flow provided from financing activities, including discontinued operations, totaled $35of $2,077 million in 2020 compared tothe combined twelve-month period ended December 31, 2021.
The use of cash flows used for financing activities in 2022 was attributable to the partial repurchase of $237the 6.25% Notes due 2042 and the 6.75% Notes due 2044 (“Existing Domtar Notes”) pursuant to the Domtar Notes Change of Control Offers that terminated on January 3, 2022. As a result of these offers, we repaid $134 million of the 6.25% Notes due 2042 and $100 million of the 6.75% Notes due 2044. To finance these repayments, we utilized $127 million under the Delayed Draw Term Loan facility as well as using restricted cash that had been set aside for this purpose. The remainder of this restricted cash was used to redeem $133 million of the Senior Secured due 2028. Borrowing under our ABL Revolving Credit Facility (which were $115 million as at December 31, 2021) were fully repaid in 2019.the second quarter of 2022 with the proceeds from the sales of our Kamloops mill ($150 million).
The primary source of cash flows provided from financing activities in 2021 was attributable to the proceeds from proceedsthe issuance of the term loanSenior Secured 6.75% Notes ($775 million), the First Lien Term Loan facility ($520 million), and borrowings under our ABL Revolving Credit Facility ($115 million) in 2020 ($300 million).2021. This was partially offset by the decrease in borrowings under our credit facilities (revolverearly repayment of the Term Loan and receivables securitization)4.4% Notes, including make-whole premium ($135606 million), as well as for the repurchase of our common stock ($59238 million), dividend payments ($51 million) and a decrease in bank indebtedness ($10 million).
The use of cash in 2019 was primarily the result of the repurchase of our common stock ($219 million) and dividend payments ($110 million). This was partially offset by the net increase of borrowings under our credit facilities (revolver and receivables securitization) ($85 million).
Capital Resources
Net indebtedness, consisting of bank indebtedness and long-term debt, net of cash and cash equivalents and restricted cash, was $788$1,182 million as of December 31, 20202022 compared to $886$1,616 million as of December 31, 2019.2021.
Term LoanABL Revolving Credit Facility
On May 5, 2020,November 30, 2021, we entered into a $300 million Term Loan Agreementour ABL Revolving Credit Facility that matures on May 5, 2025. We used borrowings under the Term Loan Agreement to repay other debt, to pay related fees and expenses. A mandatory repayment of $6 million was made in 2020. For more information, refer to Item 8, Financial Statements and Supplemental Data, under Note 19 “Long-Term Debt”.
November 30, 2026. Our ABL Revolving Credit Facility
We have an unsecured $700 million revolving credit facility (the “Credit Agreement”) with is available to Domtar Corporation and certain other domestic and foreign banks that maturesCanadian subsidiaries and provides for revolving loans and letters of credit in an aggregate amount of up to $400 million, subject to borrowing base capacity.
Borrowings under our ABL Revolving Credit Facility are limited by borrowing base calculations based on August 22, 2023.the sum of specified percentages of eligible accounts receivable, plus specified percentages of eligible inventory, plus specified percentages of qualified cash, minus the amount of any applicable reserves. Borrowings bear interest at a floating rate, which can be either an adjusted Eurodollar rate plus an applicable margin or, at our option, a base rate plus an applicable margin.
Borrowings by the CompanyOur obligations under theour ABL Revolving Credit AgreementFacility are guaranteed by our significant domestic subsidiaries. Borrowings by certain foreign subsidiaries under the Credit Agreement are guaranteed by the Company,immediate parent (a company which has no assets other than Domtar shares) and our significant domesticwholly-owned material U.S. subsidiaries and certainwholly-owned material Canadian subsidiaries. Our ABL Revolving Credit Facility has a first-priority lien on the current assets of such U.S. and Canadian subsidiaries, and a second-priority lien on the fixed assets of our significant foreign subsidiaries.wholly-owned material U.S. subsidiaries, excluding principal properties (second in priority to the liens securing our First Lien Term Loan Facility (“Term Loan Facility”) discussed below), in each case, subject to permitted liens.
Borrowings under the ABL Revolving Credit AgreementFacility bear interest at LIBOR, EURIBOR, Canadian bankers' acceptance or prime rate, as applicable, plus a margin linked to our credit rating.the Company’s utilization of the credit. In addition, we paythe Company pays facility fees quarterly at rates dependent on our credit ratings.linked to the Company’s utilization of the credit. The Financial Conduct Authority in the United Kingdom plans to phase out LIBOR by the end of 2021. We doCompany does not anticipate a significant impact to ourits financial position from the planned phase out of LIBOR.
TheOur ABL Revolving Credit AgreementFacility contains customary covenants, including, but not limited to, restrictions on our ability and eventsthat of defaultour subsidiaries to merge and consolidate with other companies, incur indebtedness, grant liens or security interests on assets, make acquisitions, loans, advances or investments, pay dividends, sell or otherwise transfer assets, optionally prepay or modify terms of any junior indebtedness, enter into transactions with affiliates or change our line of business.
Our ABL Revolving Credit Facility requires the maintenance of a fixed charge coverage of 1.00 to 1.00 at the end of each fiscal quarter for transactions of this type, including two financial covenants: (i) an interest coverage ratio, as defined in the Credit Agreement, that must be maintained at a level of nottrailing twelve month period, when specified excess availability is less than 3 to 1the greater of $35 million and (ii) a leverage ratio, as defined in10% of the Credit Agreement, that must be maintainedlesser of the borrowing base and maximum borrowing capacity. This covenant did not apply at a level of not greater than 3.75 to 1 (or 4.00 to 1 upon the occurrence of certain qualifying material acquisitions). December 31, 2022.
At December 31, 2020,2022, we were in compliance with these financial covenants, and had no borrowings under the Credit Agreement (December 31, 2019– $80 million). At December 31, 2020, our interest coverage ratio was 8.2 and our leverage ratio was 1.9. At December 31, 2020, we had $54$64 million of outstanding letters of credit (December 31, 2019 – nil), leaving $646 million unused and availableoutstanding under this facility.
Existing Domtar Notes Change of Control Offers
Following the change of control of Domtar, Domtar was obligated, pursuant to the indenture governing the 6.25% Notes due 2042 and the 6.75% Notes due 2044 (“Existing Domtar Notes”), to make the Existing Domtar Notes Change of Control Offers, pursuant to which Domtar offered to repurchase all of the Existing Domtar Notes from holders at a purchase price of 101%. Up to $250 million under the First Lien Term Loan was available on a delayed draw basis (“Delayed Draw Term Loan”) and up to $250 million aggregate principal amount of the 6.75% Senior Secured Notes was earmarked for the repurchase of the Existing Domtar Notes pursuant to the Existing Domtar Notes Change of Control Offers. Up to $250 million aggregate principal amount of the Senior Secured Notes was subject to
30
special mandatory redemption to the extent proceeds were not used to fund the redemptions of the Existing Domtar Notes pursuant to the Existing Domtar Notes Change of Control Offers.
On January 3, 2022, $134 million of the 6.25% Notes due 2042 and $100 million of the 6.75% Notes due 2044 were tendered pursuant to the offer. In addition, $3 million of premium and $6 million of accrued interest were paid. As a result, $116 million of the 6.25% Notes due 2042 and $150 million of the 6.75% Notes due 2044, remain outstanding as of December 31, 2022.
Term Loan Facility
On November 30, 2021, we entered into a Term Loan Facility maturing November 30, 2028, of which $525 million was immediately drawn and up to $250 million was available as a Delayed Draw Term Loan.
Borrowings under our Term Loan Facility amortize in equal quarterly installments in an amount equal to 1% per annum of the principal amount in 2022 and 5% per annum thereafter.
The interest rate margin applicable to borrowings under our Term Loan Facility is, at our option, either (1) the base rate plus an applicable margin or (2) LIBOR plus an applicable margin. Our Term Loan Facility is subject to a LIBOR floor of 0.75%.
We are required to prepay our Term Loan Facility and Senior Secured Notes with 100% of the net cash proceeds of certain asset sales subject to certain reinvestment rights. We are required to prepay our Term Loan Facility with 100% of the net cash proceeds of certain debt issuances and 50% of excess cash flow in each case, subject to certain exceptions.
Our obligations under our Term Loan Facility are guaranteed by our immediate parent (a company with no assets other than Domtar shares) and all of the Issuer’s direct and indirect wholly-owned material U.S. subsidiaries. Our Term Loan Facility as well as the Senior Secured Notes have a first priority lien on the fixed assets of our wholly-owned material U.S. subsidiaries, representing 66% of the Consolidated Fixed Assets, and a second-priority lien on the current asset collateral in the U.S. (second in priority to the liens securing our ABL Revolving Credit Facility discussed above), in each case, subject to other permitted liens.
Our Term Loan Facility contains customary negative covenants consistent with those applicable to the Notes, including, but not limited to, restrictions on our ability and that of our restricted subsidiaries to merge and consolidate with other companies, incur indebtedness, grant liens or security interests on assets, pay dividends or make other restricted payments, sell or otherwise transfer assets or enter into transactions with affiliates.
On January 7, 2022, we utilized $127 million under the Delayed Draw Term Loan facility (Decemberto fund a portion of the redemptions of the Existing Domtar Notes pursuant to the Domtar Notes Change of Control Offers that terminated on January 3, 2022. The remainder of the Delayed Draw Term Loan facility was cancelled. We repaid $7 million of the facility in 2022, leaving total drawings under the Term Loan Facility of $645 million.
Senior Secured Notes
Pearl Merger Sub Inc., a newly formed, wholly-owned subsidiary of Pearl Excellence Holdco L.P., a Delaware limited partnership, was the initial issuer of the $775 million aggregate principal amount of 6.75% Senior Secured Notes due 2028 (the “Notes”). This Note issue was part of financing related to the acquisition of Domtar by Pearl Excellence Holdco L.P. Upon the completion of the acquisition, the initial issuer was merged with and into Domtar with Domtar surviving the Merger and becoming the obligor of the Notes.
The Notes mature on October 1, 2028 and interest on the Notes is payable in cash semi-annually in arrears on April 1 and October 1 of each year, commencing on April 1, 2022.
Pending completion of the Domtar Existing Notes Change of Control Offers that terminated on January 3, 2022, $250 million of the proceeds of the Notes issue was set aside as restricted cash to fund approximately half of funds required to complete the Change of Control Offers. Such funds are reflected as restricted cash and included in Cash and cash equivalents on the Balance Sheet at December 31, 2019 – $620 million).2021. Funds not utilized were to be used to redeem a portion of the Senior Secured Notes at a 100% price. On January 7, 2022, $133 million of the Senior Secured Notes were redeemed as a result of the Domtar Existing Notes Change of Control Offers that terminated on January 3, 2022, leaving $642 million of Notes outstanding as of December 31, 2022.
Our Senior Secured Notes contain customary negative covenants consistent with those applicable to the Notes, including, but not limited to, restrictions on our ability and that of our restricted subsidiaries to merge and consolidate with other companies, incur indebtedness, grant liens or security interests on assets, pay dividends or make other restricted payments, sell or otherwise transfer assets or enter into transactions with affiliates.
31
Term Loan
On May 5, 2020, we entered into a $300 million Term Loan Agreement with a maturity date of May 5, 2025. On March 11, 2021, the Company fully repaid its Term Loan Agreement, in the amount of $294 million and wrote-off $2 million of unamortized debt issuance costs related to this repayment.
Revolving Credit Facility
We had an unsecured $700 million revolving credit facility that was terminated on November 30, 2021 and wrote-off $2 million of unamortized debt issuance cost related to this revolving credit facility.
Receivables Securitization
We havehad a $150 million receivables securitization facility that maturesterminated in NovemberOctober 2021.
At December 31, 2020,In 2021, we had no borrowings underincurred $1 million resulting from the receivables securitization facility, and had no outstanding letters of credit under the program (December 31, 2019 – $55 million and $53 million, respectively). The program contains certain termination events, which include, but are not limited to, matters related to receivable performance, certain defaults occurring under the Credit Agreement or our failure to repay or satisfy material obligations. At December 31, 2020, we had $111 million unused and available under this facility.
Common Stock
On May 5, 2020, we suspended the distribution of our regular quarterly dividend and stock repurchase program These charges were included in light of current uncertaintyInterest expense, net in the global markets. Our stock repurchase program resumed on February 11, 2021. Our BoardConsolidated Statements of Directors will continue to evaluate our capital return program based upon customary considerations, including market conditions.Earnings (Loss) and Comprehensive Income (Loss).
During 2020, we declared one quarterly dividend of $0.455 per share, to holders of our common stock. Total dividends aggregating $25 million were paid on April 15, 2020 to shareholders of record as of April 2, 2020.GUARANTEES
During 2019, we declared one quarterly dividend of $0.435 and three quarterly dividends of $0.455 per share, to holders of our common stock. Dividends aggregating $28 million, $28 million, $27 million and $26 million were paid on April 15, 2019, July 16, 2019, October 15, 2019 and January 15, 2020, respectively, to shareholders of record as of April 2, 2019, July 2, 2019, October 2, 2019 and January 2, 2020, respectively. Indemnifications
GUARANTEES
Indemnifications
In the normal course of business, we offer indemnifications relating to the sale of our businesses and real estate. In general, these indemnifications may relate to claims from past business operations, compliance with laws, the failure to abide by covenants and the breach of representations and warranties included in sales agreements. Typically, such representations and warranties relate to taxation, environmental, product and employee matters. The terms of these indemnification agreements are generally for an unlimited period of time. At December 31, 2020,2022, we were unable to estimate the potential maximum liabilities for these types of indemnification guarantees as the amounts are contingent upon the outcome of future events, the nature and likelihood of which cannot be reasonably estimated at this time. Accordingly, no provision has been recorded. These indemnifications have not yielded significant expenses in the past.
Pension Plans
We have indemnified and held harmless the trustees of our pension funds, and the respective officers, directors, employees and agents of such trustees, from any and all costs and expenses arising out of the performance of their obligations under the relevant trust agreements, including in respect of their reliance on authorized instructions from us or for failing to act in the absence of authorized instructions. These indemnifications survive the termination of such agreements. At December 31, 2020,2022, we have not recorded a liability associated with these indemnifications, as we do not expect to make any payments pertaining to these indemnifications.
CONTRACTUAL OBLIGATIONS AND COMMERCIAL COMMITMENTS
In the normal course of business, we enter into certain contractual obligations and commercial commitments. The following tables provideFor more information on our obligationscontractual obligation and commercial commitments, at December 31, 2020:refer to Item 8 Financial Statements and Supplementary Data under Note 11 “Leases”, Note 17 “Long-Term Debt” and Note 20 “Commitments and Contingencies”.
In connection with the U.S. Tax Reform, we have remaining liabilities of $24 million in repatriation tax to pay through 2025. See Note 8 “Income Taxes” for additional information on our income taxes.
CONTRACT TYPE |
| 2021 |
|
| 2022 |
|
| 2023 |
|
| 2024 |
|
| 2025 |
|
| THEREAFTER |
|
| TOTAL |
| |||||||
(in millions of dollars) |
|
|
|
|
|
|
|
|
|
|
|
|
|
|
|
|
|
|
|
|
|
|
|
|
|
|
|
|
Long-term debt (excluding interest) |
|
| 12 |
|
|
| 312 |
|
|
| 12 |
|
|
| 12 |
|
|
| 246 |
|
| $ | 500 |
|
| $ | 1,094 |
|
Finance leases and other (including interest) |
|
| 1 |
|
|
| 2 |
|
|
| 2 |
|
|
| 2 |
|
|
| 1 |
|
|
| 5 |
|
|
| 13 |
|
Operating leases |
|
| 20 |
|
|
| 18 |
|
|
| 15 |
|
|
| 10 |
|
|
| 6 |
|
|
| 9 |
|
|
| 78 |
|
Long-term income taxes payable (1) |
|
| 3 |
|
|
| 3 |
|
|
| 6 |
|
|
| 8 |
|
|
| 10 |
|
|
| — |
|
|
| 30 |
|
Total obligations |
| $ | 36 |
|
| $ | 335 |
|
| $ | 35 |
|
| $ | 32 |
|
| $ | 263 |
|
| $ | 514 |
|
|
| 1,215 |
|
COMMITMENT TYPE |
| 2021 |
|
| 2022 |
|
| 2023 |
|
| 2024 |
|
| 2025 |
|
| THEREAFTER |
|
| TOTAL |
| |||||||
(in millions of dollars) |
|
|
|
|
|
|
|
|
|
|
|
|
|
|
|
|
|
|
|
|
|
|
|
|
|
|
|
|
Other commercial commitments (2) |
| $ | 155 |
|
| $ | 10 |
|
| $ | 6 |
|
|
| 6 |
|
|
| — |
|
|
| 2 |
|
| $ | 179 |
|
|
|
|
|
In addition, we expect to contribute a minimum total amount of $13$4 million to the pension plans in 20212023 and a minimum total amount of $4 million in 20212023 to the other post-retirement benefits plans.
For 20212023 and the foreseeable future, we expect cash flows from operations and from our various sources of financing to be sufficient to meet our contractual obligations and commercial commitments.
RECENT ACCOUNTING PRONOUNCEMENTS
Refer to Item 8, Financial Statements and Supplementary Data under Note 2 “Recent Accounting Pronouncements”.
CRITICAL ACCOUNTING ESTIMATES AND POLICIES
Our principal accounting policies are described in Item 8, Financial Statements and Supplementary Data, under Note 1 “Summary of Significant Accounting Policies”. Notes referenced in this section are included in Item 8, Financial Statements and Supplementary Data.
32
The preparation of financial statements in conformity with accounting principles generally accepted in the United States of America requires management to make estimates, assumptions and choices amongst acceptable accounting methods that affect our reported results of operations and financial position. Critical accounting estimates pertain to matters that contain a significant level of management estimates about future events, encompass the most complex and subjective judgments and are subject to a fair degree of measurement uncertainty. On an ongoing basis, management reviews its estimates, including those related to environmental matters and asset retirement obligations, business combinations, impairment and useful lives of long-lived assets, closure and restructuring costs, intangible assets impairment, pension and other post-retirement benefit plans, income taxes and contingencies related to legal claims. These critical accounting estimates and policies have been reviewed with the Audit Committee of our Board of Directors. We believe these accounting policies, and others as set forth in Note 1 “Summary of Significant Accounting Policies”, should be reviewed as they are essential to understanding our results of operations, cash flows and financial condition. Actual results could differ from those estimates.
Environmental Matters and Asset Retirement Obligations
We maintain provisions for estimated environmental costs when remedial efforts are probable and can be reasonably estimated. Environmental provisions relate mainly to air emissions, effluent treatment, silvicultural activities and site remediation (together referred to as “environmental matters”). The environmental cost estimates reflect assumptions and judgments as to probable nature, magnitude and timing of required investigation, remediation and monitoring activities, as well as contribution by other responsible parties. Additional information regarding environmental matters is available in Note 2220 “Commitments and Contingencies”.
While we believe that we have determined the costs for environmental matters likely to be incurred, based on known information, our ongoing efforts to identify potential environmental concerns that may be associated with the properties may lead to future environmental investigations. These efforts may result in the determination of additional environmental costs and liabilities, which cannot be reasonably estimated at this time. In addition, environmental laws and regulations and interpretation by regulatory authorities could change which could result in significant changes to our estimates. For further details on “Climate change and air quality regulation” and other environmental matters refer to Note 2220 “Commitments and Contingencies”.
Asset retirement obligations are mainly associated with landfill operation and closure, dredging of settling ponds and bark pile management. We recognize asset retirement obligations, at fair value, in the period in which we incur a legal obligation associated with the retirement of an asset. The fair value is based on the expected cash flow approach, in which multiple cash flow scenarios that reflect a range of possible outcomes are considered. Probabilities are applied to each of the cash flow scenarios to arrive at an expected cash flow. The estimated cash flows are then discounted using a credit adjusted risk-free interest rate in combination with business-specific and other relevant risks to discount the cash flow. The rates used vary between 4.7% and 12.0%.
Cash flow estimates incorporate assumptions that marketplace participants would use in their estimates of fair value, whenever that information is available without undue cost and effort. If unavailable, assumptions are based on internal experts, third-party engineers’ studies and historical experience in remediation work.
As at December 31, 2020, we had an asset retirement obligation provision of $14 million for 12 locations (2019 – $13 million).
As at December 31, 2020,2022, we had a total provision of $47$40 million for environmental matters and asset retirement obligations (2019(2021 – $35$41 million). Certain of these amounts have been discounted due to more certainty of the timing of expenditures using the credit adjusted risk-free interest rate for the corresponding period until the settlement date. The rates used vary, based on the prevailing rate at the moment of recognition of the liability and on its settlement period. Additional costs, not known or identified, could be incurred for remediation efforts. Based on policies and procedures in place to monitor environmental exposure, management believes that such additional remediation costs would not have a material adverse effect on our financial position, result of operations or cash flows.
Business Combinations
We account for business combinations using the acquisition method of accounting, which requires us to recognized the assets acquired and the liabilities assumed at their acquisition date fair value and the recognition of acquisition-related costs in the Consolidated Statements of Earnings (Loss) and Comprehensive Income (Loss).
The estimated fair value assigned to identifiable intangible assets acquired are determined primarily by using an income approach using a discounted cash flow methodology, which is based on assumptions and estimates made by management.
The fair value of property, plant and equipment was primarily determined based on management’s estimate of depreciated replacement cost as further adjusted based on estimated cash flow forecasts. The significant assumptions underlying the fair value are based on company specific information and projections, which are not observable in the market and, therefore, are considered Level 2 and Level 3 measurements. These significant assumptions are forward-looking and could be affected by future changes in economic and market conditions.
The estimated fair value of finished goods was calculated as the estimated selling price, adjusted for costs of the selling effort and a reasonable profit allowance relating to the selling effort. The estimated fair value of work in process inventory was primarily calculated
33
as the estimated selling price, adjusted for estimated costs to complete the manufacturing, estimated costs of the selling effort, as well as a reasonable profit margin on the remaining manufacturing and selling effort. The estimated fair value of raw materials and operating and maintenance supplies was determined to approximate the historical carrying value. These significant assumptions are based on company specific information and projections, which are not observable in the market and, therefore, are considered Level 2 and Level 3 measurements. These significant assumptions are forward-looking and could be affected by future changes in economic and market conditions.
We generally use third-party qualified consultants to assist management in determining the fair value of assets acquired and liabilities assumed. This includes, when necessary, assistance with the determination of economic useful lives and valuation of property, plant and equipment and identifiable intangibles as well as assisting management in assessing off-market contracts.
The purchase price allocation process also entails us to refine these estimates over a measurement period not to exceed one year to reflect new information obtained surrounding facts and circumstances existing at acquisition date.
The excess of the purchase price over the fair value of the identified assets acquired and liabilities assumed is recorded as goodwill.
Impairment of Property Plant and Equipment, Operating lease right-of-use assets and Definite-Lived Intangible Assets
Property, plant and equipment, operating lease right-of-use assets and definite-lived intangible assets are reviewed for impairment upon the occurrence of events or changes in circumstances indicating that, at the lowest level of determinable cash flows, the carrying value of the assets may not be recoverable. Step I of the impairment test assesses if the carrying value of the assets exceeds their estimated undiscounted future cash flows in order to assess if the property, plant and equipment, operating lease right-of-use assets and definite-lived intangible assets are impaired. In the event the estimated undiscounted future cash flows are lower than the net book value of the assets, a Step II impairment test must be carried out to determine the impairment charge. In Step II, the assets are written down to their estimated fair values. Given that there is generally no readily available quoted value for our property, plant and equipment, operating lease right-of-use assets and definite-lived intangible assets, we determine fair value of our assets based on the present value of estimated future cash flows expected from their use and eventual disposition, and by using the liquidation or salvage value in the case of idled assets. The fair value estimate in Step II is based on the undiscounted cash flows used in Step I.
Estimates of undiscounted future cash flows used to test the recoverability of the property, plant and equipment, operating lease right-of use assets and definite-lived intangible assets includes key assumptions related to selling prices, inflation-adjusted cost projections, forecasted exchange rates (when applicable) and estimated useful life. Changes in our assumptions and estimates may affect our forecasts and may lead to an outcome where impairment charges would be required. In addition, actual results may vary from our forecasts, and such variations may be material and unfavorable, thereby triggering the need for future impairment tests where our conclusions may differ in reflection of prevailing market conditions.
Useful Lives
On a regular basis, we review the estimated useful lives of our property, plant and equipment and our definite-lived intangible assets. Assessing the reasonableness of the estimated useful lives of property, plant and equipment and definite-lived intangible assets requires judgment and is based on currently available information. Changes in circumstances such as technological advances, changes to our business strategy, changes to our capital strategy or changes in regulation can result in useful lives differing from our estimates. Revisions to the estimated useful lives of property, plant and equipment and definite-lived intangible assets constitute a change in accounting estimate and are dealt with prospectively by amending depreciation and amortization rates.
A change in the remaining estimated useful life of a group of assets, or their estimated net salvage value, will affect the depreciation or amortization rate used to depreciate or amortize the group of assets and thus affect depreciation or amortization expense as reported in our results of operations. In 2020, we recorded depreciation and amortization expense of $223 million compared to $231 million in 2019. At December 31, 2020, we had property, plant and equipment with a net book value of $2,023 million (2019 – $2,223 million) and definite-lived intangible assets, net of amortization, of $19 million (2019 – $20 million).
In 2020, we recognized $136 million of accelerated depreciation, mostly related to our announced permanent closure of our uncoated freesheet manufacturing at Kingsport, Tennessee and Port Huron, Michigan mills, the remaining paper machine at the Ashdown, Arkansas mill and the converting center in Ridgefield, Tennessee.
In the third quarter of 2019, we announced the permanent closure of two paper machines. These closures took place at our Ashdown, Arkansas pulp and paper mill and our Port Huron, Michigan paper mill. As a result, we recognized $32 million of accelerated depreciation in 2019.
Closure and Restructuring Costs
Closure and restructuring costs are recognized as liabilities in the period when they are incurred and are measured at their fair value. For such recognition to occur, management, with the appropriate level of authority, must have approved and committed to a firm plan
and appropriate communication to those affected must have occurred. These provisions may require an estimation of costs such as severance and termination benefits, pension and related curtailments, environmental remediation and may also include expenses related to demolition and outplacement. Actions taken may also require an evaluation of any remaining assets to determine required impairments, if any, and a review of estimated remaining useful lives which may lead to accelerated depreciation expense.
34
Estimates of cash flows and fair value relating to closures and restructuring require judgment. Closure and restructuring liabilities are based on management’s best estimates of future events. Although we do not anticipate significant changes, actual costs may differ from these estimates due to subsequent business developments. As such, additional costs and further impairment charges may be required in future periods.
During 2020, we recorded $136 million of accelerated depreciation under Impairment of long-lived assets on the Consolidated Statement of Earnings (Loss) and Comprehensive Income (Loss). Additionally, we recorded $34 million of severance and termination costs, $31 million of inventory obsolescence and $34 million of other costs, under Closure and restructuring costs.
During 2019, we recorded $32 million of accelerated depreciation under Impairment of long-lived assets and $1 million of accelerated depreciation under Depreciation and amortization, on the Consolidated Statement of Earnings (Loss) and Comprehensive Income (Loss). Additionally, we recorded $3 million of severance and termination costs, $4 million of inventory obsolescence and $2 million of other costs, under Closure and restructuring costs in relation to the paper machine closures. Concurrently, with the Ashdown paper machine closure and related workforce reduction, management negotiated a voluntary early retirement program to reduce costs and put the mill in a stronger cost position in the long-term. We additionally recorded $13 million of severance and termination costs under Closure and restructuring costs.
Additional information can be found under Note 1614 “Closure and Restructuring Costs and Impairment of Long-Lived Assets”.
Indefinite-lived intangible assets impairment assessment
Indefinite-lived intangible assets consist of license rights ($6 million) and water rights ($4 million). We test indefinite-lived intangible assets at the asset level. Indefinite-lived intangible assets are not amortized and are evaluated at the beginning of the fourth quarter of every year or more frequently whenever indicators of potential impairment exist. In connection with the Company's annual impairment testing in the fourth quarter of 2020, we performed a qualitative assessment for each indefinite-lived intangible asset (license rights and water rights). The qualitative assessments performed in the fourth quarter of 2020 indicated that the indefinite-lived intangible assets had fair values that exceeded their carrying amounts.
Pension Plans and Other Post-Retirement Benefit Plans
We have several defined contribution plans and multiemployer plans. The pension expense under these plans is equal to our contribution. Defined contribution pension expense was $39 million for the year ended December 31, 2020 (2019 – $39 million).
We sponsor both contributory and non-contributory U.S. and non-U.S. defined benefit pension plans. We also sponsor a number of other post-retirement benefit plans for eligible U.S. and non-U.S. employees; the plans are unfunded and include life insurance programs and medical and dental benefits. In addition, we provide supplemental unfunded defined benefit pension plans and supplemental unfunded defined contribution pension plans to certain senior management employees.
We account for pensions and other post-retirement benefits in accordance with Compensation-Retirement Benefits Topic of the Financial Accounting Standards Board-Accounting Standards CommitteeBoard, which requires employers to recognize the overfunded or underfunded status of defined benefit pension plans as an asset or liability in its Consolidated Balance Sheets. Pension and other post-retirement benefit charges require assumptions in order to estimate the projected and accumulated benefit obligations. These assumptions require considerable management judgment and include:
| - Expected long-term rate of return on plan assets – used to estimate the growth and expected return on assets - Discount rate – used to determine interest costs and the net present value of our obligations - Rate of compensation increase – used to calculate the impact of future increases on our obligations - Health care cost trends – used to calculate the impact of future health care costs on our obligations - Employee related factors, such as mortality rates, turnover, retirement age and disabilities – used to determine the extent of our obligations
|
|
|
|
|
|
|
|
|
|
Changes in these assumptions result in actuarial gains or losses, which are amortized over the expected average remaining service life of the active employee group covered by the plans, only to the extent that the unrecognized net actuarial gains and losses are in excess
of 10% of the greater of the projected benefit obligation and the market value of assets, over the average remaining service period of approximately ten years of the active employee group covered by the pension plans, and 12 years of the active employee group covered by the other post-retirement benefits plans.
An expected rate of return on plan assets of 4.6%4.8% was considered appropriate by management for the determination of pension expense for 2020.2022. Effective January 1, 2021,2023, we will use 4.4%5.9% as the expected return on plan assets, which reflects the current view of long-term investment returns. The overall expected long-term rate of return on plan assets is based on management’s best estimate of the long-term returns of the major asset classes (cash and cash equivalents, equities, bonds and bonds)various alternative investment asset classes) weighted by the target allocation of assets at the measurement date, net of expenses. This rate includes an equity risk premium over government bond returns for equity investments and a value-added premium for the contribution to returns from active management. The sources used to determine management's best estimate of long-term returns are numerous and include country specific bond yields, which may be derived from the market using local bond indices or by analysis of the local bond market, and country-specific inflation and investment market expectations derived from market data and analysts' or governments' expectations, as applicable.
We set our discount rate assumption annually to reflect the rates available on high-quality, fixed income debt instruments, with a duration that is expected to match the timing and amount of expected benefit payments. High-quality debt instruments are corporate bonds with a rating of AA or better. The discount rates at December 31, 20202022 for pension plans were estimated at 2.5%5.3% for the projected benefit obligation and 3.0%3.8% for the net periodic benefit cost for 20202022 and for post-retirement benefit plans were estimated at 2.5%5.3% for the projected benefit obligation and 3.0%3.5% for the net periodic benefit cost for 2020.2022.
We used a full yield curve approach to estimate the current service and interest cost components of net periodic benefit cost for Canadian pension plans and U.S. funded pension plans. The estimate of these components is made by applying the specific spot rates along the yield curve used in the determination of the benefit obligation to the relevant projected cash flows. We used this approach to provide a
35
more precise measurement of current service and interest cost components by improving the correlation between projected benefit cash flows to the corresponding spot yield curve rates.
The rate of compensation increase is another significant assumption in the actuarial model for pension (set at 2.7%3.1% for the projected benefit obligation and 2.8% for the net periodic benefit cost)cost and for post-retirement benefit plans (set at 2.8%3.2% for the projected benefit obligation and 2.7%2.9% for the net periodic benefit cost) and is determined based upon our long-term plans for such increases.
For employee related factors, mortality rate tables tailored to our industry were used and the other factors reflect our historical experience and management’s best estimate regarding future expectations.
For measurement purposes, a 3.9% weighted average annual rate of increase in the per capita cost of covered health care benefits was assumed for 2020.2022.
The following table provides a sensitivity analysis of the key weighted average economic assumptions used in measuring the projected pension benefit obligation, the accrued other post-retirement benefit obligation and related net periodic benefit cost for 2020.2022. The sensitivity analysis should be used with caution as it is hypothetical and changes in each key assumption may not be linear. The sensitivities in each key variable have been calculated independently of each other.
|
| Pension |
|
| Other Post-Retirement Benefit |
|
| Pension |
|
| Other Post-Retirement Benefit |
| ||||||||||||||||||||
PENSION AND OTHER POST-RETIREMENT BENEFIT PLANS |
| Projected Benefit Obligation |
|
| Net Periodic Benefit Cost |
|
| Projected Benefit Obligation |
|
| Net Periodic Benefit Cost |
|
| Projected Benefit Obligation |
|
| Net Periodic Benefit Cost |
|
| Projected Benefit Obligation |
|
| Net Periodic Benefit Cost |
| ||||||||
(In millions of dollars) |
|
|
|
|
|
|
|
|
|
|
|
|
|
|
|
|
|
|
|
|
|
|
|
|
|
| ||||||
Expected rate of return on assets |
|
|
|
|
|
|
|
|
|
|
|
|
|
|
|
|
|
|
|
|
|
|
|
|
| |||||||
Impact of: |
|
|
|
|
|
|
|
|
|
|
|
|
|
|
|
|
|
|
|
|
|
|
|
|
| |||||||
1% increase |
| N/A |
|
|
| (14 | ) |
| N/A |
|
| N/A |
|
| N/A |
|
| (14 | ) |
| N/A |
| N/A |
| ||||||||
1% decrease |
| N/A |
|
|
| 14 |
|
| N/A |
|
| N/A |
|
| N/A |
|
|
| 14 |
|
| N/A |
|
| N/A |
| ||||||
Discount rate |
|
|
|
|
|
|
|
|
|
|
|
|
|
|
|
|
|
|
|
|
|
|
|
|
| |||||||
Impact of: |
|
|
|
|
|
|
|
|
|
|
|
|
|
|
|
|
|
|
|
|
|
|
|
|
|
|
|
| ||||
1% increase |
|
| (189 | ) |
|
| (7 | ) |
|
| (8 | ) |
|
| - |
|
|
| (80 | ) |
|
| (1 | ) |
|
| (3 | ) |
|
| - |
|
1% decrease |
|
| 235 |
|
|
| 16 |
|
|
| 10 |
|
|
| - |
|
|
| 96 |
|
|
| (1 | ) |
|
| 4 |
|
|
| - |
|
Our pension plan funding policy is to contribute annually the amount required to provide for benefits earned in the year and to fund solvency deficiencies, funding shortfalls and past service obligations over periods not exceeding those permitted by the applicable regulatory authorities. Past service obligations primarily arise from improvements to plan benefits. The other post-retirement benefit plans are not funded, and contributions are made annually to cover benefit payments.
We expect to contribute a minimum total amount of $13$4 million in 20212023 compared to $15$7 million in 2020 (2019 – $17 million)2022 to the pension plans. We expect to contribute a minimum total amount of $4 million in 20212023 compared to $4 million in 20202022 to the other post-retirement benefit plans (2019 – $4 million).plans.
Benefit obligations and fair values of plan assets as of December 31, 20202022 for our pension and post-retirement plans were areas follows:
|
| Successor |
| |||||||||||||||||||||||||||||
|
| December 31, 2020 |
|
| December 31, 2019 |
|
| December 31, 2022 |
|
| December 31, 2021 |
| ||||||||||||||||||||
|
|
|
|
|
| Other |
|
|
|
|
|
| Other |
|
|
|
| Other |
|
|
| Other |
| |||||||||
|
| Pension |
|
| post-retirement |
|
| Pension |
|
| post-retirement |
|
| Pension |
| post-retirement |
| Pension |
| post-retirement |
| |||||||||||
|
| plans |
|
| benefit plans |
|
| plans |
|
| benefit plans |
|
| plans |
| benefit plans |
| plans |
| benefit plans |
| |||||||||||
|
| $ |
|
| $ |
|
| $ |
|
| $ |
|
| $ |
|
| $ |
|
| $ |
|
| $ |
| ||||||||
Projected benefit obligation at end of year |
|
| (1,566 | ) |
|
| (67 | ) |
|
| (1,425 | ) |
|
| (63 | ) |
|
| (782 | ) |
|
| (39 | ) |
|
| (1,433 | ) |
|
| (60 | ) |
Fair value of assets at end of year |
|
| 1,594 |
|
|
| — |
|
|
| 1,465 |
|
|
| — |
|
|
| 962 |
|
|
| — |
|
|
| 1,622 |
|
|
| — |
|
Funded status |
|
| 28 |
|
|
| (67 | ) |
|
| 40 |
|
|
| (63 | ) |
|
| 180 |
|
|
| (39 | ) |
|
| 189 |
|
|
| (60 | ) |
For additional details on our pension plans and other post-retirement benefit plans, refer to Note 76 “Pension Plans and Other Post-Retirement Benefit Plans”.
Income Taxes
We use the asset and liability method of accounting for income taxes. Under this method, deferred tax assets and liabilities are determined according to differences between the carrying amounts and tax bases of the assets and liabilities. The change in the net deferred tax asset or liability is included in earnings. Deferred tax assets and liabilities are measured using enacted tax rates and laws expected to apply in the years in which assets and liabilities are expected to be recovered or settled. Deferred tax assets and liabilities are classified as non-current items on the Consolidated Balance Sheets. For these years, a projection of taxable income and an assumption of the ultimate
36
recovery or settlement period for temporary differences are required. The projection of future taxable income is based on management’s best estimate and may vary from actual taxable income.
WeOn a quarterly basis, we assess the need to establish a valuation allowance for deferred tax assets and, if it is deemed more likely than not that our deferred tax assets will not be realized based on these taxable income projections, a valuation allowance is recorded. In general, “realization” refers to the incremental benefit achieved through the reduction in future taxes payable or an increase in future taxes refundable from the deferred tax assets. Evaluating the need for an amount of a valuation allowance for deferred tax assets often requires significant judgment. All available evidence, both positive and negative, should be considered to determine whether, based on the weight of that evidence, a valuation allowance is needed.
In our evaluation process, we give the most weight to historical income or losses. After evaluating all available positive and negative evidence, although realization is not assured, we determined that it is more likely than not that the results of future operations will generate sufficient taxable income to realize the deferred tax assets, with the exception of certain state credits and losses for which a valuation allowance of $13$15 million exists at December 31, 2020, the tax basis difference in our assets held of sale (U.S.2022, and foreign) for which a valuation allowance of $44 million exists at December 31, 2020, and certain foreigncapital loss carryforwards for which a valuation allowance of $7$43 million exists at December 31, 2020. Of this amount, $47 million unfavorably impacted tax expense and the effective tax rate for 2020 (2019 –$5 million).2022.
Our deferred tax assets are mainly composed of temporary differences related to various accruals, accounting provisions, pension and post-retirement benefit liabilities, net operating loss carryforwards, intangibles and available tax credits. Our deferred tax liabilities are mainly composed of temporary differences pertaining to property, plant and equipment, intangiblepension and post-retirement benefit assets, leasesdeferred taxes on foreign earnings and other items. Estimating the ultimate settlement period requires judgment. The reversal of timing differences is expected at enacted tax rates, which could change due to changes in income tax laws or the introduction of tax changes through the presentation of annual budgets by different governments. As a result, a change in the timing and the income tax rate at which the components will reverse could materially affect deferred tax expense in our future results of operations.
In addition, U.S. and foreign tax rules and regulations are subject to interpretation and require judgment that may be challenged by taxation authorities. To the best of our knowledge, we have adequately provided for our future tax consequences based upon current facts and circumstances and current tax law. In accordance with Income Taxes Topic of FASB ASC 740, we evaluate new tax positions that result in a tax benefit to us and determine the amount of tax benefits that can be recognized. The remaining unrecognized tax benefits are evaluated on a quarterly basis to determine if changes in recognition or classification are necessary. Significant changes in the amount of unrecognized tax benefits expected within the next 12 months are disclosed quarterly. Future
recognition of unrecognized tax benefits would impact the effective tax rate in the period the benefits are recognized. AtAs of December 31, 2020,2022, we had gross unrecognized tax benefits of approximately $23$20 million (2019(2021 – $28$22 million). These amounts represent the gross amount of exposure in individual jurisdictions and do not reflect any additional benefits expected to be realized if such positions were sustained, such as federal deduction that could be realized if an unrecognized state deduction was not sustained. As of December 31, 2020,2022, we believe it is reasonably possible that up to $4$3 million of our unrecognized tax benefits may be recognized in 2021,2023, which could significantly impact the effective tax rate. However, the amount and timing of the recognition of these benefits is subject to some uncertainty. In addition, a number of countries are actively pursuing changes to their tax laws applicable to corporation multinationals, such as the U.S. Tax Reform, enacted in 2017. Finally, foreign governments may enact tax laws in response to the U.S. Tax Reform that could result in further changes to global taxation and materially impact our financial results.
We operate in multiple jurisdictions with complex tax policy and regulatory environments. U.S. and foreign tax rules and regulations are subject to interpretation and require judgment that may be challenged by taxation authorities.
Tax audits by their nature are often complex and can require several years to resolve. We have a number of audits in process in various jurisdictions. Although the resolution of these tax positions is uncertain, based on currently available information, we believe that we have adequately provided for our future tax consequences based upon current facts and circumstances and current tax law, and we believe that the ultimate outcomes will not have a material adverse effect on our financial position, results of operations or cash flows. For further details refer to Note 108 “Income Taxes”.
Contingencies related to legal claims
As discussed in Item 1A Risk Factors, under the risk “Failure to comply with applicable laws and regulations could have a material adverse effect on our business, financial results or condition” and in Note 2220 “Commitments and Contingencies”, we are subject to various legal proceedings and claims that arise in the ordinary course of business. We record a liability when it is probable that a loss has been incurred, and the amount is reasonably estimable. The most likely cost to be incurred is accrued based on an evaluation of the then available facts with respect to each matter. When no amount within a range of estimates is more likely, the minimum is accrued. There is significant judgment required in both the probability determination and as to whether an exposure can be reasonably estimated. For further details on “Contingencies” and legal claims refer to Note 2220 “Commitments and Contingencies”.
37
ITEM 7A. QUANTITATIVE AND QUALITATIVE DISCLOSURE ABOUT MARKET RISK
Our operating income can be impacted by the following sensitivities:
SENSITIVITY ANALYSIS |
|
|
| |
(In millions of dollars, unless otherwise noted) |
|
|
| |
Each $10/unit change in the selling price of the following |
|
|
| |
Papers |
|
|
| |
Business Papers |
| $ | 11 |
|
Commercial Print & Publishing Papers |
|
| 9 |
|
Specialty & Packaging Papers |
|
| 8 |
|
Pulp - net position |
|
|
| |
Fluff |
| $ | 7 |
|
Softwood |
|
| 6 |
|
Foreign exchange |
|
|
| |
(US $0.01 change in relative value to the Canadian dollar before |
|
| 9 |
|
Energy 2 |
|
|
| |
Natural gas: $0.25/MMBtu change in price before hedging |
|
| 7 |
|
SENSITIVITY ANALYSIS |
|
|
|
|
(In millions of dollars, unless otherwise noted) |
|
|
|
|
Each $10/unit change in the selling price of the following products1: |
|
|
|
|
Papers |
|
|
|
|
Business Papers |
| $ | 10 |
|
Commercial Print & Publishing Papers |
|
| 8 |
|
Specialty & Packaging Papers |
|
| 4 |
|
Pulp - net position |
|
|
|
|
Softwood |
| $ | 13 |
|
Fluff |
|
| 8 |
|
Hardwood |
|
| - |
|
Foreign exchange |
|
|
|
|
(US $0.01 change in relative value to the Canadian dollar before hedging) |
|
| 11 |
|
Energy 2 |
|
|
|
|
Natural gas: $0.25/MMBtu change in price before hedging |
|
| 6 |
|
|
|
|
|
Note that we may, from time to time, hedge part of our foreign exchange, and energy positions, which may therefore impact the above sensitivities.
In the normal course of business, we are exposed to certain financial risks. We do not use derivative instruments for speculative purposes; although all derivative instruments purchased to minimize risk may not qualify for hedge accounting.
CREDIT RISK
We are exposed to credit risk on accounts receivables from our customers. In order to reduce this risk, we review new customers’ credit history before granting credit and conduct regular reviews of existing customers’ credit performance. As of December 31, 2020,2022, two of our customers located in the U.S. represented 15%28% or $58$144 million and 12% or $46 million, respectively, of our receivables (December 31, 2019–2021– two customers located in the U.S. represented 14%28% or $66 million and 13% or $65 million, respectively)$130 million).
We are exposed to credit risk in the event of non-performance by counterparties to our financial instruments. We attempt to minimize this exposure by entering into contracts with counterparties that are believed to be of high credit quality. Collateral or other security to support financial instruments subject to credit risk is usually not obtained. The credit standing of counterparties is regularly monitored.
INTEREST RATE RISK
We are exposed to interest rate risk arising from fluctuations in interest rates on our cash and cash equivalents, bank indebtedness, revolving credit facility, securitization, term loanABL Revolving Credit Facility, Term Loan Facility and long-term debt. Our objective in managing exposure to interest rate changes is to minimize the impact of interest rate changes on earnings and cash flows and to lower our overall borrowing costs. We may manage this interest rate exposure through the use of derivative instruments such as interest rate swap contracts, whereby we agree to exchange the difference between fixed and variable interest amounts calculated by reference to an agreed upon notional principal amount.
The Financial Conduct Authority in the United Kingdom plans to phase out LIBOR by the end of 2021. We do not anticipate a significant impact to our financial position from the planned phase out of LIBOR.38
COST RISK
Cash flow hedges
We are exposed to price volatility for raw materials and energy used in our manufacturing process. We manage our exposure to cost risk primarily through the use of supplier contracts. We purchase natural gas at the prevailing market price at the time of delivery. To reduce the impact on cash flow and earnings due to pricing volatility, we may utilize derivatives to fix the price of forecasted natural gas purchases. The changes in the fair value on qualifying instruments are included in Accumulated other comprehensive lossincome (loss) to the extent effective and reclassified into Cost of sales in the period during which the hedged transaction affects earnings. Current contracts are used to hedge a portion of forecasted purchases of natural gas over the next 3612 months.
As of December 31, 2022, we hedged 22% of our forecasted purchases of natural gas under derivative contracts for 2023. The natural gas derivative contracts were effective as of December 31, 2022.
FOREIGN CURRENCY RISK
Cash flow hedges
We have manufacturing operations in the U.S. and Canada. As a result, we are exposed to movements in foreign currency exchange rates in Canada. Moreover, certain assets and liabilities are denominated in Canadian dollars and are exposed to foreign currency movements. Accordingly, our earnings are affected by increases or decreases in the value of the Canadian dollar. Our risk management policy allows us to hedge a significant portion of the exposure to fluctuations in foreign currency exchange rates for periods up to three years. We may use derivative financial instruments (currency options and foreign exchange forward contracts) to mitigate our exposure to fluctuations in foreign currency exchange rates.
Derivatives are used to hedge forecasted purchases in Canadian dollars by our Canadian subsidiary over the next 24 months. Such derivatives are designated as cash flow hedges. The changes in the fair value on qualifying instruments are included in Accumulated other comprehensive lossincome (loss) to the extent effective and reclassified into Sales or Cost of sales in the period during which the hedged transaction affects earnings.
As of December 31, 2022, we hedged 79% and 30% of our forecasted net Canadian dollars cash exposures under contracts for 2023 and 2024, respectively. The foreign exchange derivative contracts were effective as of December 31, 2022.
39
PART II
ITEM 8. FINANCIAL STATEMENTS AND SUPPLEMENTARY DATA
Management’s Report on Financial Statements and Practices
The accompanying Consolidated Financial Statements of Domtar Corporation and its subsidiaries (the “Company”) were prepared by management. The statements were prepared in accordance with accounting principles generally accepted in the United States of America and include amounts that are based on management’s best judgments and estimates. Management is responsible for the completeness, accuracy and objectivity of the financial statements. The other financial information included in the annual report is consistent with that in the financial statements.
Management has established and maintains a system of internal accounting and other controls for the Company and its subsidiaries. This system and its established accounting procedures and related controls are designed to provide reasonable assurance that assets are safeguarded, that the books and records properly reflect all transactions, that policies and procedures are implemented by qualified personnel, and that published financial statements are properly prepared and fairly presented. The Company’s system of internal control is supported by written policies and procedures, contains self-monitoring mechanisms, and is audited by the internal audit function. Appropriate actions are taken by management to correct deficiencies as they are identified.
Management’s Report on Internal Control over Financial Reporting
Management is responsible for establishing and maintaining adequate internal control over financial reporting for the Company. Management has evaluated the effectiveness of internal control over financial reporting, using the criteria established in 2013 Internal Control – Integrated Framework, issued by the Committee of Sponsoring Organizations of the Treadway Commission (“COSO”). The Company’s internal control over financial reporting is designed to provide reasonable assurance regarding the reliability of financial reporting and the preparation of financial statements for external purposes in accordance with generally accepted accounting principles. The Company’s internal control over financial reporting includes those policies and procedures that (i) pertain to the maintenance of records that, in reasonable detail, accurately and fairly reflect the transactions and dispositions of the assets of the Company; (ii) provide reasonable assurance that transactions are recorded as necessary to permit preparation of financial statements in accordance with accounting principles generally accepted in the United States of America, and that receipts and expenditures of the Company are being made only in accordance with authorizations of management and directors of the Company; and (iii) provide reasonable assurance regarding prevention or timely detection of unauthorized acquisition, use, or disposition of the Company’s assets that could have a material effect on the financial statements.
Because of its inherent limitations, internal control over financial reporting may not prevent or detect misstatements. Also, projections of any evaluation of effectiveness to future periods are subject to the risk that controls may become inadequate because of changes in conditions, or that the degree of compliance with the policies or procedures may deteriorate.
Based on the assessment, management has concluded that the Company maintained effective internal control over financial reporting as of December 31, 2020,2022, based on criteria in Internal Control – Integrated Framework issued in 2013 by the COSO.
The effectiveness of the Company’s internal control over financial reporting as of December 31, 2020 has been audited by PricewaterhouseCoopers LLP, an independent registered public accounting firm, as stated in their report, which is included herein.
Report of Independent Registered Public Accounting Firm
To the Board of Directors and Shareholders of Domtar Corporation:
OpinionsOpinion on the Financial Statements and Internal Control over Financial Reporting
We have audited the accompanying consolidated balance sheets of Domtar Corporation and its subsidiaries (Successor) (the “Company”) as of December 31, 20202022 and 2019,2021, and the related consolidated statements of earnings (loss) and comprehensive income (loss), of shareholders' equity (deficit) and of cash flows for each of the three years in the periodyear ended December 31, 2020,2022 and for the period from December 1, 2021 through December 31, 2021, including the related notes and schedule of valuation and qualifying accounts for each of the three years in the periodyear ended December 31, 20202022 and for the period from December 1, 2021 through December 31, 2021 listed in the index appearing after the list of exhibits under Item 15(a)(3)(2) (collectively referred to as the “consolidated financial statements”). We also have audited the Company's internal control over financial reporting as of December 31, 2020, based on criteria established in Internal Control - Integrated Framework (2013) issued by the Committee of Sponsoring Organizations of the Treadway Commission (COSO).
In our opinion, the consolidated financial statements referred to above present fairly, in all material respects, the financial position of the Company as of December 31, 20202022 and 2019,2021 and the results of its operations and its cash flows for each of the three years in the periodyear ended December 31, 20202022 and for the period from December 1, 2021 through December 31, 2021 in conformity with accounting principles generally accepted in the United States of America. Also in our opinion, the Company maintained, in all material respects, effective internal control over financial reporting as of December 31, 2020, based on criteria established in Internal Control - Integrated Framework (2013) issued by the COSO.
Change in Accounting PrincipleBasis for Opinion
As discussed in Note 1 to theThese consolidated financial statements are the Company changed the manner in which it accounts for leases in 2019.
Basis for Opinions
The Company's management is responsible for these consolidated financial statements, for maintaining effective internal control over financial reporting, and for its assessmentresponsibility of the effectiveness of internal control over financial reporting, included in the accompanying Management’s Report on Internal Control over Financial Reporting.Company’s management. Our responsibility is to express opinionsan opinion on the Company’s consolidated financial statements and on the Company's internal control over financial reporting based on our audits. We are a public accounting firm registered with the Public Company Accounting Oversight Board (United States) (PCAOB) and are required to be independent with respect to the Company in accordance with the U.S. federal securities laws and the applicable rules and regulations of the Securities and Exchange Commission and the PCAOB.
We conducted our audits of these consolidated financial statements in accordance with the standards of the PCAOB.PCAOB and in accordance with auditing standards generally accepted in the United States of America. Those standards require that we plan and perform the auditsaudit to obtain reasonable assurance about whether the consolidated financial statements are free of material misstatement, whether due to error or fraud, and whether effectivefraud. The Company is not required to have, nor were we engaged to perform, an audit of its internal control over financial reporting. As part of our audit we are required to obtain an understanding of internal control over financial reporting was maintained in all material respects.
Our auditsbut not for the purpose of expressing an opinion on the effectiveness of the consolidatedCompany’s internal control over financial statementsreporting. Accordingly, we express no such opinion.
Our audits included performing procedures to assess the risks of material misstatement of the consolidated financial statements, whether due to error or fraud, and performing procedures that respond to those risks. Such procedures included examining, on a test basis, evidence regarding the amounts and disclosures in the consolidated financial statements. Our audits also included evaluating the accounting principles used and significant estimates made by management, as well as evaluating the overall presentation of the consolidated financial statements. Our audit of internal control over financial reporting included obtaining an understanding of internal control over financial reporting, assessing the risk that a material weakness exists, and testing and evaluating the design and operating effectiveness of internal control based on the assessed risk. Our audits also included performing such other procedures as we considered necessary in the circumstances. We believe that our audits provide a reasonable basis for our opinions.
Definition and Limitations of Internal Control over Financial Reporting
A company’s internal control over financial reporting is a process designed to provide reasonable assurance regarding the reliability of financial reporting and the preparation of financial statements for external purposes in accordance with generally accepted accounting principles. A company’s internal control over financial reporting includes those policies and procedures that (i) pertain to the maintenance of records that, in reasonable detail, accurately and fairly reflect the transactions and dispositions of the assets of the company; (ii) provide reasonable assurance that transactions are recorded as necessary to permit preparation of financial statements in accordance with generally accepted accounting principles, and that receipts and expenditures of the company are being made only in accordance with authorizations of management and directors of the company; and (iii) provide reasonable assurance regarding prevention or timely detection of unauthorized acquisition, use, or disposition of the company’s assets that could have a material effect on the financial statements.
Because of its inherent limitations, internal control over financial reporting may not prevent or detect misstatements. Also, projections of any evaluation of effectiveness to future periods are subject to the risk that controls may become inadequate because of changes in conditions, or that the degree of compliance with the policies or procedures may deteriorate.opinion.
Critical Audit Matters
The critical audit matter communicated below is a matter arising from the current period audit of the consolidated financial statements that was communicated or required to be communicated to the audit committee and that (i) relates to accounts or disclosures that are material to the consolidated financial statements and (ii) involved our especially challenging, subjective, or complex judgments. The communication of critical audit matters does not alter in any way our opinion on the consolidated financial statements, taken as a whole, and we are not, by communicating the critical audit matter below, providing a separate opinion on the critical audit matter or on the accounts or disclosures to which it relates.
Indefinite Lived Intangible Assets Impairment Assessment - Personal Care Segment
41
Revenue Recognition
As described in NotesNote 1 and 3 to the consolidated financial statements, the Company’s revenue is generated from the sale of finished goods to customers. Revenue is recognized at a single point in time when the performance obligation is satisfied which occurs when the control over the goods is transferred to customers. The point in time when the control of goods is transferred to customers is largely dependent on delivery terms. Revenue is recorded at the time of shipment for delivery terms designated Free On Board (F.O.B.) shipping point. For sales transactions designated F.O.B. destination, revenue is recorded when the product is delivered to the customer’s delivery site. Revenue is measured as the amount of consideration the Company classified the Personal Care business as a disposal group heldexpects to receive in exchange for salegoods transferred to customers. Revenue is recognized net of variable consideration in the fourth quarterform of 2020. Asrebates, discounts and other commercial incentives extended to customers. Variable consideration is recognized using the most likely amounts which are based on an analysis of historical experience and current period expectations. Management includes estimated amounts of variable consideration in revenue to the extent that it is probable that there will not be a significant reversal of recognized revenue when the uncertainty related to that variable consideration is resolved. The Company’s total sales were $4,577 million for the year ended December 31, 2020, net indefinite lived intangible assets in the disposal group held for sale totaled approximately $290 million. Management measured the indefinite lived intangible assets included in the disposal group held for sale at the lower of the carrying value or the fair value less any costs to sell. Management performed quantitative impairment tests for each Personal Care indefinite-lived intangible asset, which included comparing the fair value of the indefinite-lived intangible asset to its carrying amount. Fair value of the indefinite lived intangible assets is derived using an income approach that is a relief from royalty model. Key estimates supporting the cash flow projections used in the estimation of fair value include, but are not limited to, management's assessment of industry and market conditions, as well as its estimates of revenue growth rates, royalty rates, tax rates and discount rates.2022.
The principal considerations for our determination that performing procedures relating to the indefinite-lived intangible assets impairment assessment, specifically for the Personal Care segment,revenue recognition is a critical audit matter are (i) the significant judgment by management when developing the fair value measurement of the indefinite lived intangible assets included in the disposal group held for sale; (ii) a high degree of auditor judgment, subjectivity and effort in performing procedures and evaluating management’s significant assumptionsaudit evidence related to the Company’s revenue growth rates and royalty rates; and (iii) the audit effort involved the use of professionals with specialized skill and knowledge.recognition.
Addressing the matter involved performing procedures and evaluating audit evidence in connection with forming our overall opinion on the consolidated financial statements. These procedures included testing the effectiveness of controls relating to management’s impairment assessment of the Personal Care indefinite-lived intangible assets included in the disposal group held for sale,revenue recognition process, including controls over the developmentaccuracy and existence of assumptions relating to cash flow projections, revenue growth rates, royalty rates, tax rates, and discount rates utilized in the valuation of the intangible assets.recognized. These procedures also included among others, (i) testing management’s process for determining the fair value measurements of the Personal Care segment indefinite-lived intangible assets included in the disposal group; (ii) evaluating the appropriateness of the income approach based on a relief from royalty model; (iii)i) testing the completeness, accuracy and accuracyoccurrence of the underlying data used in the model;revenue recognized for a sample of revenue transactions by obtaining and (iv) evaluating the reasonablenessinspecting source documents, such as invoices, sales contracts, shipping and delivery documents and, cash receipts, where applicable, and ii) testing, on a sample basis, customer invoice balances outstanding as of significant assumptions usedDecember 31, 2022 by management related to revenue growth ratesobtaining and royalty rates. Evaluating management’s assumptions related to revenue growth ratesinspecting source documents, including invoices, shipping and royalty rates involved evaluating whether the assumptions used were reasonable considering (i) the currentdelivery documents, and past performance of the segment; and (ii) whether these assumptions were consistent with evidence obtained in other areas of the audit. Professionals with specialized skill and knowledge were used to assist in evaluating the appropriateness of the Company’s income approach based on the relief from royalty model, and evaluating the appropriateness of the royalty rates assumption.subsequent cash receipts, where applicable.
/s/ PricewaterhouseCoopers LLP
Charlotte, North Carolina
March 1, 20213, 2023
We have served as the Company’s auditor since 2007.
42
Report of Independent Registered Public Accounting Firm
To the Board of Directors and Shareholders of Domtar Corporation:
Opinion on the Financial Statements
We have audited the accompanying consolidated statements of earnings (loss) and comprehensive income (loss), of shareholders' equity (deficit) and of cash flows of Domtar Corporation and its subsidiaries (“Predecessor”) (the “Company”) for the period from January 1, 2021 through November 30, 2021, and for the year ended December 31, 2020, including the related notes and schedule of valuation and qualifying accounts for the period from January 1, 2021 through November 30, 2021, and for the year ended December 31, 2020 listed in the index appearing under Item 15(a)(2) (collectively referred to as the “consolidated financial statements”). In our opinion, the consolidated financial statements present fairly, in all material respects, the results of operations and cash flows of the Company for the period from January 1, 2021 through November 30, 2021, and for the year ended December 31, 2020 in conformity with accounting principles generally accepted in the United States of America.
Basis for Opinions
These consolidated financial statements are the responsibility of the Company’s management. Our responsibility is to express an opinion on the Company’s consolidated financial statements based on our audits. We are a public accounting firm registered with the Public Company Accounting Oversight Board (United States) (PCAOB) and are required to be independent with respect to the Company in accordance with the U.S. federal securities laws and the applicable rules and regulations of the Securities and Exchange Commission and the PCAOB.
We conducted our audits of these consolidated financial statements in accordance with the standards of the PCAOB and in accordance with auditing standards generally accepted in the United States of America. Those standards require that we plan and perform the audit to obtain reasonable assurance about whether the consolidated financial statements are free of material misstatement, whether due to error or fraud.
Our audits included performing procedures to assess the risks of material misstatement of the consolidated financial statements, whether due to error or fraud, and performing procedures that respond to those risks. Such procedures included examining, on a test basis, evidence regarding the amounts and disclosures in the consolidated financial statements. Our audits also included evaluating the accounting principles used and significant estimates made by management, as well as evaluating the overall presentation of the consolidated financial statements. We believe that our audits provide a reasonable basis for our opinion.
Critical Audit Matters
The critical audit matter communicated below is a matter arising from the current period audit of the consolidated financial statements that was communicated or required to be communicated to the audit committee and that (i) relates to accounts or disclosures that are material to the consolidated financial statements and (ii) involved our especially challenging, subjective, or complex judgments. The communication of critical audit matters does not alter in any way our opinion on the consolidated financial statements, taken as a whole, and we are not, by communicating the critical audit matter below, providing a separate opinion on the critical audit matter or on the accounts or disclosures to which it relates.
43
Revenue Recognition
As described in Note 1 to the consolidated financial statements, revenue is generated from the sale of finished goods to customers. Revenue is recognized at a single point in time when the performance obligation is satisfied which occurs when the control over the goods is transferred to customers. The point in time when the control of goods is transferred to customers is largely dependent on delivery terms. Revenue is recorded at the time of shipment for delivery terms designated Free On Board (“F.O.B.”) shipping point. For sales transactions designated f.o.b. destination, revenue is recorded when the product is delivered to the customer’s delivery site. Revenue is measured as the amount of consideration the Company expects to receive in exchange for goods transferred to customers. Revenue is recognized net of variable consideration in the form of rebates, discounts and other commercial incentives extended to customers. Variable consideration is recognized using the most likely amounts which are based on an analysis of historical experience and current period expectations. Management includes estimated amounts of variable consideration in revenue to the extent that it is probable that there will not be a significant reversal of recognized revenue when the uncertainty related to that variable consideration is resolved. The Company’s total sales was $3,368 million for the period from January 1, 2021 through November 30, 2021.
The principal considerations for our determination that performing procedures relating to revenue recognition is a critical audit matter are a high degree of auditor effort in performing procedures and evaluating audit evidence related to the Company’s revenue recognition.
Addressing the matter involved performing procedures and evaluating audit evidence in connection with forming our overall opinion on the consolidated financial statements. These procedures included, among others, evaluating, for a sample of revenue transactions, the recognition of revenue by obtaining and inspecting source documents, including invoices, sales contracts, shipping and delivery documents and, where applicable, cash receipts.
/s/ PricewaterhouseCoopers LLP
Charlotte, North Carolina
March 10, 2022
We have served as the Company’s auditor since 2007.
44
DOMTAR CORPORATION
CONSOLIDATED STATEMENTS OF EARNINGS (LOSS) AND COMPREHENSIVE INCOME (LOSS)
(IN MILLIONS OF DOLLARS, UNLESS OTHERWISE NOTED)
|
| Year ended December 31, |
|
| Year ended December 31, |
|
| Year ended December 31, |
| |||
|
| 2020 |
|
| 2019 |
|
| 2018 |
| |||
|
| $ |
|
| $ |
|
| $ |
| |||
Sales |
|
| 3,652 |
|
|
| 4,369 |
|
|
| 4,565 |
|
Operating expenses |
|
|
|
|
|
|
|
|
|
|
|
|
Cost of sales, excluding depreciation and amortization |
|
| 3,125 |
|
|
| 3,610 |
|
|
| 3,638 |
|
Depreciation and amortization |
|
| 223 |
|
|
| 231 |
|
|
| 241 |
|
Selling, general and administrative |
|
| 253 |
|
|
| 291 |
|
|
| 292 |
|
Impairment of long-lived assets (NOTE 16) |
|
| 136 |
|
|
| 32 |
|
|
| 0 |
|
Closure and restructuring costs (NOTE 16) |
|
| 99 |
|
|
| 22 |
|
|
| 0 |
|
Other operating (income) loss, net (NOTE 8) |
|
| (7 | ) |
|
| 4 |
|
|
| (1 | ) |
|
|
| 3,829 |
|
|
| 4,190 |
|
|
| 4,170 |
|
Operating (loss) income |
|
| (177 | ) |
|
| 179 |
|
|
| 395 |
|
Interest expense, net (NOTE 9) |
|
| 58 |
|
|
| 52 |
|
|
| 62 |
|
Non-service components of net periodic benefit cost (NOTE 7) |
|
| (17 | ) |
|
| 23 |
|
|
| (18 | ) |
(Loss) earnings before income taxes and equity loss |
|
| (218 | ) |
|
| 104 |
|
|
| 351 |
|
Income tax (benefit) expense (NOTE 10) |
|
| (76 | ) |
|
| 17 |
|
|
| 68 |
|
Equity loss, net of taxes |
|
| 3 |
|
|
| 2 |
|
|
| 2 |
|
(Loss) earnings from continuing operations |
|
| (145 | ) |
|
| 85 |
|
|
| 281 |
|
Earnings (loss) from discontinued operations, net of taxes (NOTE 3) |
|
| 18 |
|
|
| (1 | ) |
|
| 2 |
|
Net (loss) earnings |
|
| (127 | ) |
|
| 84 |
|
|
| 283 |
|
Per common share (in dollars) (NOTE 6) |
|
|
|
|
|
|
|
|
|
|
|
|
Basic net (loss) earnings |
|
|
|
|
|
|
|
|
|
|
|
|
(Loss) earnings from continuing operations |
|
| (2.62 | ) |
|
| 1.39 |
|
|
| 4.47 |
|
Earnings (loss) from discontinued operations |
|
| 0.33 |
|
|
| (0.02 | ) |
|
| 0.03 |
|
Basic net (loss) earnings |
|
| (2.29 | ) |
|
| 1.37 |
|
|
| 4.50 |
|
Diluted net (loss) earnings |
|
|
|
|
|
|
|
|
|
|
|
|
(Loss) earnings from continuing operations |
|
| (2.62 | ) |
|
| 1.39 |
|
|
| 4.45 |
|
Earnings (loss) from discontinued operations |
|
| 0.33 |
|
|
| (0.02 | ) |
|
| 0.03 |
|
Diluted net (loss) earnings |
|
| (2.29 | ) |
|
| 1.37 |
|
|
| 4.48 |
|
Weighted average number of common shares outstanding (millions) |
|
|
|
|
|
|
|
|
|
|
|
|
Basic |
|
| 55.4 |
|
|
| 61.2 |
|
|
| 62.9 |
|
Diluted |
|
| 55.4 |
|
|
| 61.4 |
|
|
| 63.1 |
|
Cash dividends per common share |
|
| 0.91 |
|
|
| 1.78 |
|
|
| 1.72 |
|
Net (loss) earnings |
|
| (127 | ) |
|
| 84 |
|
|
| 283 |
|
Other comprehensive income (loss): |
|
|
|
|
|
|
|
|
|
|
|
|
Net derivative gains (losses) on cash flow hedges: |
|
|
|
|
|
|
|
|
|
|
|
|
Net gains (losses) arising during the period, net of tax $(9) (2019 – $(3); 2018 – $10) |
|
| 27 |
|
|
| 11 |
|
|
| (30 | ) |
Less: Reclassification adjustment for losses (gains) included in net (loss) earnings, net of tax of $(4) (2019 – $(3); 2018 – $1) |
|
| 12 |
|
|
| 8 |
|
|
| (2 | ) |
Foreign currency translation adjustments |
|
| 63 |
|
|
| 21 |
|
|
| (91 | ) |
Change in unrecognized (losses) gains and prior service cost related to pension and post-retirement benefit plans, net of tax of $4 (2019 – $(13); 2018 – $3) |
|
| (13 | ) |
|
| 34 |
|
|
| (8 | ) |
Other comprehensive income (loss) |
|
| 89 |
|
|
| 74 |
|
|
| (131 | ) |
Comprehensive (loss) income |
|
| (38 | ) |
|
| 158 |
|
|
| 152 |
|
|
| Successor |
|
|
| Predecessor |
| ||||||||||
|
| Year ended |
|
| Period from |
|
|
| Period from |
|
| Year ended |
| ||||
|
| 2022 |
|
| 2021 |
|
|
| 2021 |
|
|
| 2020 |
| |||
|
| $ |
|
| $ |
|
|
| $ |
|
| $ |
| ||||
Sales |
|
| 4,577 |
|
|
| 300 |
|
|
|
| 3,368 |
|
|
| 3,415 |
|
Operating expenses |
|
|
|
|
|
|
|
|
|
|
|
|
| ||||
Cost of sales, excluding depreciation and amortization |
|
| 3,534 |
|
|
| 251 |
|
|
|
| 2,771 |
|
|
| 2,914 |
|
Depreciation and amortization |
|
| 209 |
|
|
| 23 |
|
|
|
| 182 |
|
|
| 208 |
|
Selling, general and administrative |
|
| 275 |
|
|
| 23 |
|
|
|
| 246 |
|
|
| 252 |
|
Impairment of long-lived assets (NOTE 14) |
|
| — |
|
|
| — |
|
|
|
| 9 |
|
|
| 136 |
|
Closure and restructuring costs (NOTE 14) |
|
| — |
|
|
| (1 | ) |
|
|
| 17 |
|
|
| 99 |
|
Asset conversion costs (NOTE 14) |
|
| 67 |
|
|
| 3 |
|
|
|
| 27 |
|
|
| — |
|
Transaction costs (NOTE 4) |
|
| 22 |
|
|
| — |
|
|
|
| 132 |
|
|
| — |
|
Other operating income, net |
|
| (2 | ) |
|
| — |
|
|
|
| (5 | ) |
|
| (7 | ) |
|
|
| 4,105 |
|
|
| 299 |
|
|
|
| 3,379 |
|
|
| 3,602 |
|
Operating income (loss) from continuing operations |
|
| 472 |
|
|
| 1 |
|
|
|
| (11 | ) |
|
| (187 | ) |
Interest expense, net (NOTE 7) |
|
| 90 |
|
|
| 10 |
|
|
|
| 54 |
|
|
| 58 |
|
Non-service components of net periodic benefit cost (NOTE 6) |
|
| (40 | ) |
|
| (2 | ) |
|
|
| (22 | ) |
|
| (17 | ) |
Earnings (loss) before income taxes and equity loss |
|
| 422 |
|
|
| (7 | ) |
|
|
| (43 | ) |
|
| (228 | ) |
Income tax expense (benefit) (NOTE 8) |
|
| 101 |
|
|
| (2 | ) |
|
|
| 6 |
|
|
| (80 | ) |
Equity method investment loss, net of taxes |
|
| — |
|
|
| — |
|
|
|
| — |
|
|
| 3 |
|
Earnings (loss) from continuing operations |
|
| 321 |
|
|
| (5 | ) |
|
|
| (49 | ) |
|
| (151 | ) |
Earnings from discontinued operations, net of taxes (NOTE 3) |
|
| 18 |
|
|
| 1 |
|
|
|
| 26 |
|
|
| 24 |
|
Net earnings (loss) |
|
| 339 |
|
|
| (4 | ) |
|
|
| (23 | ) |
|
| (127 | ) |
Other comprehensive (loss) income: |
|
|
|
|
|
|
|
|
|
|
|
|
| ||||
Net derivative (losses) gains on cash flow hedges: |
|
|
|
|
|
|
|
|
|
|
|
|
| ||||
Net (losses) gains arising during the period, net |
|
| (4 | ) |
|
| — |
|
|
|
| 24 |
|
|
| 27 |
|
Less: Reclassification adjustment for (gains) losses included in |
|
| (8 | ) |
|
| — |
|
|
|
| (31 | ) |
|
| 12 |
|
Foreign currency translation adjustments |
|
| (70 | ) |
|
| 8 |
|
|
|
| 57 |
|
|
| 63 |
|
Change in unrecognized (losses) gains and prior service cost |
|
| (10 | ) |
|
| 16 |
|
|
|
| 99 |
|
|
| (13 | ) |
Other comprehensive (loss) income |
|
| (92 | ) |
|
| 24 |
|
|
|
| 149 |
|
|
| 89 |
|
Comprehensive income (loss) |
|
| 247 |
|
|
| 20 |
|
|
|
| 126 |
|
|
| (38 | ) |
The accompanying notes are an integral part of the consolidated financial statements.
45
DOMTAR CORPORATION
CONSOLIDATED BALANCE SHEETS
(IN MILLIONS OF DOLLARS, UNLESS OTHERWISE NOTED)
|
| At |
| |||||
|
| December 31, |
|
| December 31, |
| ||
|
| 2020 |
|
| 2019 |
| ||
|
| $ |
|
| $ |
| ||
Assets |
|
|
|
|
|
|
|
|
Current assets |
|
|
|
|
|
|
|
|
Cash and cash equivalents |
|
| 309 |
|
|
| 61 |
|
Receivables, less allowances of $6 and $4 |
|
| 380 |
|
|
| 482 |
|
Inventories (NOTE 11) |
|
| 630 |
|
|
| 663 |
|
Prepaid expenses |
|
| 50 |
|
|
| 29 |
|
Income and other taxes receivable |
|
| 54 |
|
|
| 56 |
|
Assets held for sale (NOTE 3) |
|
| 1,133 |
|
|
| 227 |
|
Total current assets |
|
| 2,556 |
|
|
| 1,518 |
|
Property, plant and equipment, net (NOTE 12) |
|
| 2,023 |
|
|
| 2,223 |
|
Operating lease right-of-use assets (NOTE 13) |
|
| 59 |
|
|
| 58 |
|
Intangible assets, net (NOTE 14) |
|
| 29 |
|
|
| 30 |
|
Other assets (NOTE 15) |
|
| 189 |
|
|
| 163 |
|
Non-current assets held for sale (NOTE 3) |
|
| — |
|
|
| 911 |
|
Total assets |
|
| 4,856 |
|
|
| 4,903 |
|
|
|
|
|
|
|
|
|
|
Liabilities and shareholders' equity |
|
|
|
|
|
|
|
|
Current liabilities |
|
|
|
|
|
|
|
|
Bank indebtedness |
|
| — |
|
|
| 9 |
|
Trade and other payables (NOTE 17) |
|
| 484 |
|
|
| 580 |
|
Income and other taxes payable |
|
| 15 |
|
|
| 15 |
|
Operating lease liabilities due within one year (NOTE 13) |
|
| 20 |
|
|
| 18 |
|
Long-term debt due within one year (NOTE 19) |
|
| 13 |
|
|
| 1 |
|
Liabilities held for sale (NOTE 3) |
|
| 295 |
|
|
| 143 |
|
Total current liabilities |
|
| 827 |
|
|
| 766 |
|
Long-term debt (NOTE 19) |
|
| 1,084 |
|
|
| 937 |
|
Operating lease liabilities (NOTE 13) |
|
| 50 |
|
|
| 40 |
|
Deferred income taxes and other (NOTE 10) |
|
| 321 |
|
|
| 360 |
|
Other liabilities and deferred credits (NOTE 20) |
|
| 314 |
|
|
| 269 |
|
Long-term liabilities held for sale (NOTE 3) |
|
| — |
|
|
| 155 |
|
|
|
|
|
|
|
|
|
|
Commitments and contingencies (NOTE 22) |
|
|
|
|
|
|
|
|
|
|
|
|
|
|
|
|
|
Shareholders' equity (NOTE 21) |
|
|
|
|
|
|
|
|
Common stock $0.01 par value; authorized 2,000,000,000 shares; issued 65,001,104 and 65,001,104 shares |
|
| 1 |
|
|
| 1 |
|
Treasury stock $0.01 par value; 9,806,566 and 8,120,194 shares |
|
| — |
|
|
| — |
|
Additional paid-in capital |
|
| 1,717 |
|
|
| 1,770 |
|
Retained earnings |
|
| 846 |
|
|
| 998 |
|
Accumulated other comprehensive loss |
|
| (304 | ) |
|
| (393 | ) |
Total shareholders' equity |
|
| 2,260 |
|
|
| 2,376 |
|
Total liabilities and shareholders' equity |
|
| 4,856 |
|
|
| 4,903 |
|
|
| Successor |
| |||||
|
| At |
| |||||
|
| December 31, |
|
| December 31, |
| ||
|
| 2022 |
|
| 2021 |
| ||
|
| $ |
|
| $ |
| ||
Assets |
|
|
|
|
|
| ||
Current assets |
|
|
|
|
|
| ||
Cash and cash equivalents, including restricted cash of nil and $250 |
|
| 371 |
|
|
| 286 |
|
Receivables, less allowances of $4 and $4 |
|
| 521 |
|
|
| 463 |
|
Inventories (NOTE 9) |
|
| 685 |
|
|
| 663 |
|
Prepaid expenses |
|
| 24 |
|
|
| 44 |
|
Income and other taxes receivable |
|
| 45 |
|
|
| 59 |
|
Assets held for sale (NOTE 3) |
|
| — |
|
|
| 287 |
|
Total current assets |
|
| 1,646 |
|
|
| 1,802 |
|
Property, plant and equipment, net (NOTE 10) |
|
| 2,762 |
|
|
| 2,524 |
|
Operating lease right-of-use assets (NOTE 11) |
|
| 42 |
|
|
| 48 |
|
Intangible assets, net (NOTE 12) |
|
| 23 |
|
|
| 207 |
|
Other assets (NOTE 13) |
|
| 251 |
|
|
| 273 |
|
Total assets |
|
| 4,724 |
|
|
| 4,854 |
|
|
|
|
|
|
|
| ||
Liabilities and shareholders' equity |
|
|
|
|
|
| ||
Current liabilities |
|
|
|
|
|
| ||
Bank indebtedness |
|
| 17 |
|
|
| — |
|
Trade and other payables (NOTE 15) |
|
| 617 |
|
|
| 543 |
|
Income and other taxes payable |
|
| 51 |
|
|
| 11 |
|
Operating lease liabilities due within one year (NOTE 11) |
|
| 17 |
|
|
| 19 |
|
Long-term debt due within one year (NOTE 17) |
|
| 33 |
|
|
| 259 |
|
Liabilities held for sale (NOTE 3) |
|
| — |
|
|
| 63 |
|
Total current liabilities |
|
| 735 |
|
|
| 895 |
|
Long-term debt (NOTE 17) |
|
| 1,503 |
|
|
| 1,643 |
|
Operating lease liabilities (NOTE 11) |
|
| 27 |
|
|
| 36 |
|
Deferred income taxes and other (NOTE 8) |
|
| 501 |
|
|
| 525 |
|
Other liabilities and deferred credits (NOTE 18) |
|
| 172 |
|
|
| 216 |
|
|
|
|
|
|
|
| ||
Commitments and contingencies (NOTE 20) |
|
|
|
|
|
| ||
|
|
|
|
|
|
| ||
Shareholders' equity (NOTE 19) |
|
|
|
|
|
| ||
Common stock $0.01 par value; 100 shares issued and outstanding |
|
| — |
|
|
| — |
|
Additional paid-in capital |
|
| 1,555 |
|
|
| 1,555 |
|
Retained earnings (deficit) |
|
| 299 |
|
|
| (40 | ) |
Accumulated other comprehensive (loss) income |
|
| (68 | ) |
|
| 24 |
|
Total shareholders' equity |
|
| 1,786 |
|
|
| 1,539 |
|
Total liabilities and shareholders' equity |
|
| 4,724 |
|
|
| 4,854 |
|
The accompanying notes are an integral part of the consolidated financial statements.
46
DOMTAR CORPORATION
(IN MILLIONS OF DOLLARS, UNLESS OTHERWISE NOTED)NOTED)
Predecessor |
| Issued and |
|
| Common |
|
| Additional |
|
| Retained |
|
| Accumulated |
|
| Total |
| ||||||
|
|
|
|
| $ |
|
| $ |
|
| $ |
|
| $ |
|
| $ |
| ||||||
Balance at December 31, 2019 |
|
| 56.9 |
|
|
| 1 |
|
|
| 1,770 |
|
|
| 998 |
|
|
| (393 | ) |
|
| 2,376 |
|
Stock-based compensation, net of tax |
|
| 0.1 |
|
|
| — |
|
|
| 6 |
|
|
| — |
|
|
| — |
|
|
| 6 |
|
Net loss |
|
| — |
|
|
| — |
|
|
| — |
|
|
| (127 | ) |
|
| — |
|
|
| (127 | ) |
Net derivative gains on cash flow hedges: |
|
|
|
|
|
|
|
|
|
|
|
|
|
|
|
|
|
| ||||||
Net gains arising during the period, net of tax of $(9) |
|
| — |
|
|
| — |
|
|
| — |
|
|
| — |
|
|
| 27 |
|
|
| 27 |
|
Less: Reclassification adjustment for losses included |
|
| — |
|
|
| — |
|
|
| — |
|
|
| — |
|
|
| 12 |
|
|
| 12 |
|
Foreign currency translation adjustments |
|
| — |
|
|
| — |
|
|
| — |
|
|
| — |
|
|
| 63 |
|
|
| 63 |
|
Change in unrecognized losses and prior service cost related to |
|
| — |
|
|
| — |
|
|
| — |
|
|
| — |
|
|
| (13 | ) |
|
| (13 | ) |
Stock repurchase |
|
| (1.8 | ) |
|
| — |
|
|
| (59 | ) |
|
| — |
|
|
| — |
|
|
| (59 | ) |
Cash dividends declared |
|
| — |
|
|
| — |
|
|
| — |
|
|
| (25 | ) |
|
| — |
|
|
| (25 | ) |
Balance at December 31, 2020 |
|
| 55.2 |
|
|
| 1 |
|
|
| 1,717 |
|
|
| 846 |
|
|
| (304 | ) |
|
| 2,260 |
|
Stock-based compensation, net of tax |
|
| 0.3 |
|
|
| — |
|
|
| (5 | ) |
|
| — |
|
|
| — |
|
|
| (5 | ) |
Net loss |
|
| — |
|
|
| — |
|
|
| — |
|
|
| (23 | ) |
|
| — |
|
|
| (23 | ) |
Net derivative losses on cash flow hedges: |
|
|
|
|
|
|
|
|
|
|
|
|
|
|
|
|
|
| ||||||
Net gains arising during the period, net of tax of $(8) |
|
| — |
|
|
| — |
|
|
| — |
|
|
| — |
|
|
| 24 |
|
|
| 24 |
|
Less: Reclassification adjustment for gains included |
|
| — |
|
|
| — |
|
|
| — |
|
|
| — |
|
|
| (31 | ) |
|
| (31 | ) |
Foreign currency translation adjustments |
|
| — |
|
|
| — |
|
|
| — |
|
|
| — |
|
|
| 57 |
|
|
| 57 |
|
Change in unrecognized gains and prior service cost related to |
|
| — |
|
|
| — |
|
|
| — |
|
|
| — |
|
|
| 99 |
|
|
| 99 |
|
Stock repurchase |
|
| (5.1 | ) |
|
| — |
|
|
| (238 | ) |
|
| — |
|
|
| — |
|
|
| (238 | ) |
Successor |
|
|
|
|
|
|
|
|
|
|
|
|
|
|
|
|
|
| ||||||
Buy-out of predecessor equity |
|
| (50.4 | ) |
|
| (1 | ) |
|
| (1,474 | ) |
|
| (859 | ) |
|
| 155 |
|
|
| (2,179 | ) |
Capital contribution |
|
| — |
|
|
| — |
|
|
| 1,555 |
|
|
| — |
|
|
| — |
|
|
| 1,555 |
|
Net loss |
|
| — |
|
|
| — |
|
|
| — |
|
|
| (4 | ) |
|
| — |
|
|
| (4 | ) |
Foreign currency translation adjustments |
|
| — |
|
|
| — |
|
|
| — |
|
|
| — |
|
|
| 8 |
|
|
| 8 |
|
Change in unrecognized gains and prior service cost |
|
| — |
|
|
| — |
|
|
| — |
|
|
| — |
|
|
| 16 |
|
|
| 16 |
|
Balance at December 31, 2021 |
|
| — |
|
|
| — |
|
|
| 1,555 |
|
|
| (40 | ) |
|
| 24 |
|
|
| 1,539 |
|
Net earnings |
|
| — |
|
|
| — |
|
|
| — |
|
|
| 339 |
|
|
| — |
|
|
| 339 |
|
Net derivative losses on cash flow hedges: |
|
|
|
|
|
|
|
|
|
|
|
|
|
|
|
|
|
| ||||||
Net losses arising during the period, net of tax of $2 |
|
| — |
|
|
| — |
|
|
| — |
|
|
| — |
|
|
| (4 | ) |
|
| (4 | ) |
Less: Reclassification adjustment for gains included |
|
| — |
|
|
| — |
|
|
| — |
|
|
| — |
|
|
| (8 | ) |
|
| (8 | ) |
Foreign currency translation adjustments |
|
| — |
|
|
| — |
|
|
| — |
|
|
| — |
|
|
| (70 | ) |
|
| (70 | ) |
Change in unrecognized losses and prior service cost |
|
| — |
|
|
| — |
|
|
| — |
|
|
| — |
|
|
| (10 | ) |
|
| (10 | ) |
Balance at December 31, 2022 |
|
| — |
|
|
| — |
|
|
| 1,555 |
|
|
| 299 |
|
|
| (68 | ) |
|
| 1,786 |
|
|
| Issued and outstanding common shares (millions of shares) |
|
| Common stock, at par |
|
| Additional paid-in capital |
|
| Retained earnings |
|
| Accumulated other comprehensive loss |
|
| Total shareholders’ equity |
| ||||||
|
|
|
|
|
| $ |
|
| $ |
|
| $ |
|
| $ |
|
| $ |
| |||||
Balance at December 31, 2017 |
|
| 62.7 |
|
|
| 1 |
|
|
| 1,969 |
|
|
| 849 |
|
|
| (336 | ) |
|
| 2,483 |
|
Stock-based compensation, net of tax |
|
| 0.2 |
|
|
| — |
|
|
| 12 |
|
|
| — |
|
|
| — |
|
|
| 12 |
|
Net earnings |
|
| — |
|
|
| — |
|
|
| — |
|
|
| 283 |
|
|
| — |
|
|
| 283 |
|
Net derivative losses on cash flow hedges: |
|
|
|
|
|
|
|
|
|
|
|
|
|
|
|
|
|
|
|
|
|
|
|
|
Net losses arising during the period, net of tax of $10 |
|
| — |
|
|
| — |
|
|
| — |
|
|
| — |
|
|
| (30 | ) |
|
| (30 | ) |
Less: Reclassification adjustment for gains included in net earnings, net of tax of $1 |
|
| — |
|
|
| — |
|
|
| — |
|
|
| — |
|
|
| (2 | ) |
|
| (2 | ) |
Foreign currency translation adjustments |
|
| — |
|
|
| — |
|
|
| — |
|
|
| — |
|
|
| (91 | ) |
|
| (91 | ) |
Change in unrecognized losses and prior service cost related to pension and post-retirement benefit plans, net of tax of $3 |
|
| — |
|
|
| — |
|
|
| — |
|
|
| — |
|
|
| (8 | ) |
|
| (8 | ) |
Cash dividends declared |
|
| — |
|
|
| — |
|
|
| — |
|
|
| (109 | ) |
|
| — |
|
|
| (109 | ) |
Balance at December 31, 2018 |
|
| 62.9 |
|
|
| 1 |
|
|
| 1,981 |
|
|
| 1,023 |
|
|
| (467 | ) |
|
| 2,538 |
|
Stock-based compensation, net of tax |
|
| 0.2 |
|
|
| — |
|
|
| 8 |
|
|
| — |
|
|
| — |
|
|
| 8 |
|
Net earnings |
|
| — |
|
|
| — |
|
|
| — |
|
|
| 84 |
|
|
| — |
|
|
| 84 |
|
Net derivative gains on cash flow hedges: |
|
|
|
|
|
|
|
|
|
|
|
|
|
|
|
|
|
|
|
|
|
|
|
|
Net gains arising during the period, net of tax of $(3) |
|
| — |
|
|
| — |
|
|
| — |
|
|
| — |
|
|
| 11 |
|
|
| 11 |
|
Less: Reclassification adjustment for losses included in net earnings, net of tax of $(3) |
|
| — |
|
|
| — |
|
|
| — |
|
|
| — |
|
|
| 8 |
|
|
| 8 |
|
Foreign currency translation adjustments |
|
| — |
|
|
| — |
|
|
| — |
|
|
| — |
|
|
| 21 |
|
|
| 21 |
|
Change in unrecognized gains and prior service cost related to pension and post-retirement benefit plans, net of tax of $(13) |
|
| — |
|
|
| — |
|
|
| — |
|
|
| — |
|
|
| 34 |
|
|
| 34 |
|
Stock repurchase |
|
| (6.2 | ) |
|
| — |
|
|
| (219 | ) |
|
| — |
|
|
| — |
|
|
| (219 | ) |
Cash dividends declared |
|
| — |
|
|
| — |
|
|
| — |
|
|
| (109 | ) |
|
| — |
|
|
| (109 | ) |
Balance at December 31, 2019 |
|
| 56.9 |
|
|
| 1 |
|
|
| 1,770 |
|
|
| 998 |
|
|
| (393 | ) |
|
| 2,376 |
|
Stock-based compensation, net of tax |
|
| 0.1 |
|
|
| — |
|
|
| 6 |
|
|
| — |
|
|
| — |
|
|
| 6 |
|
Net loss |
|
| — |
|
|
| — |
|
|
| — |
|
|
| (127 | ) |
|
| — |
|
|
| (127 | ) |
Net derivative gains on cash flow hedges: |
|
|
|
|
|
|
|
|
|
|
|
|
|
|
|
|
|
|
|
|
|
|
|
|
Net gains arising during the period, net of tax of $(9) |
|
| — |
|
|
| — |
|
|
| — |
|
|
| — |
|
|
| 27 |
|
|
| 27 |
|
Less: Reclassification adjustment for losses included in net loss, net of tax of $(4) |
|
| — |
|
|
| — |
|
|
| — |
|
|
| — |
|
|
| 12 |
|
|
| 12 |
|
Foreign currency translation adjustments |
|
| — |
|
|
| — |
|
|
| — |
|
|
| — |
|
|
| 63 |
|
|
| 63 |
|
Change in unrecognized losses and prior service cost related to pension and post-retirement benefit plans, net of tax of $4 |
|
| — |
|
|
| — |
|
|
| — |
|
|
| — |
|
|
| (13 | ) |
|
| (13 | ) |
Stock repurchase |
|
| (1.8 | ) |
|
| — |
|
|
| (59 | ) |
|
| — |
|
|
| — |
|
|
| (59 | ) |
Cash dividends declared |
|
| — |
|
|
| — |
|
|
| — |
|
|
| (25 | ) |
|
| — |
|
|
| (25 | ) |
Balance at December 31, 2020 |
|
| 55.2 |
|
|
| 1 |
|
|
| 1,717 |
|
|
| 846 |
|
|
| (304 | ) |
|
| 2,260 |
|
The accompanying notes are an integral part of the consolidated financial statements
DOMTAR CORPORATION
CONSOLIDATED STATEMENTS OF CASH FLOWS
(IN MILLIONS OF DOLLARS)
|
| Year ended December 31, 2020 |
|
| Year ended December 31, 2019 |
|
| Year ended December 31, 2018 |
| |||
|
| $ |
|
| $ |
|
| $ |
| |||
Operating activities |
|
|
|
|
|
|
|
|
|
|
|
|
Net (loss) earnings |
|
| (127 | ) |
|
| 84 |
|
|
| 283 |
|
Adjustments to reconcile net (loss) earnings to cash flows from operating activities |
|
|
|
|
|
|
|
|
|
|
|
|
Depreciation and amortization |
|
| 283 |
|
|
| 293 |
|
|
| 308 |
|
Deferred income taxes and tax uncertainties (NOTE 10) |
|
| (45 | ) |
|
| (16 | ) |
|
| 13 |
|
Impairment of long-lived assets (NOTE 16) |
|
| 137 |
|
|
| 58 |
|
|
| 7 |
|
Impairment of inventory (NOTE 16) |
|
| 31 |
|
|
| 6 |
|
|
| 4 |
|
Net gains on disposals of property, plant and equipment |
|
| (1 | ) |
|
| — |
|
|
| (4 | ) |
Loss on classification as held for sale (NOTE 3) |
|
| 45 |
|
|
| — |
|
|
| — |
|
Stock-based compensation expense |
|
| 8 |
|
|
| 9 |
|
|
| 8 |
|
Equity loss, net |
|
| 3 |
|
|
| 2 |
|
|
| 2 |
|
Other |
|
| 4 |
|
|
| — |
|
|
| (1 | ) |
Changes in assets and liabilities, excluding the effect of acquisition of business |
|
|
|
|
|
|
|
|
|
|
|
|
Receivables |
|
| 99 |
|
|
| 96 |
|
|
| 18 |
|
Inventories |
|
| 7 |
|
|
| (22 | ) |
|
| (28 | ) |
Prepaid expenses |
|
| 11 |
|
|
| 2 |
|
|
| 2 |
|
Trade and other payables |
|
| (57 | ) |
|
| (67 | ) |
|
| 24 |
|
Income and other taxes |
|
| 13 |
|
|
| (43 | ) |
|
| (32 | ) |
Difference between employer pension and other post-retirement contributions and pension and other post-retirement expense |
|
| (4 | ) |
|
| 29 |
|
|
| (46 | ) |
Other assets and other liabilities |
|
| 4 |
|
|
| 11 |
|
|
| (4 | ) |
Cash flows from operating activities |
|
| 411 |
|
|
| 442 |
|
|
| 554 |
|
Investing activities |
|
|
|
|
|
|
|
|
|
|
|
|
Additions to property, plant and equipment |
|
| (175 | ) |
|
| (255 | ) |
|
| (195 | ) |
Proceeds from disposals of property, plant and equipment |
|
| 3 |
|
|
| 1 |
|
|
| 5 |
|
Acquisition of business, net of cash acquired (NOTE 4) |
|
| (30 | ) |
|
| — |
|
|
| — |
|
Other |
|
| — |
|
|
| — |
|
|
| (6 | ) |
Cash flows used for investing activities |
|
| (202 | ) |
|
| (254 | ) |
|
| (196 | ) |
Financing activities |
|
|
|
|
|
|
|
|
|
|
|
|
Dividend payments |
|
| (51 | ) |
|
| (110 | ) |
|
| (108 | ) |
Stock repurchase |
|
| (59 | ) |
|
| (219 | ) |
|
| — |
|
Net change in bank indebtedness |
|
| (10 | ) |
|
| 9 |
|
|
| — |
|
Change in revolving credit facility |
|
| (80 | ) |
|
| 80 |
|
|
| — |
|
Proceeds from receivables securitization facility |
|
| 25 |
|
|
| 205 |
|
|
| 85 |
|
Repayments of receivables securitization facility |
|
| (80 | ) |
|
| (200 | ) |
|
| (60 | ) |
Issuance of long-term debt |
|
| 300 |
|
|
| — |
|
|
| — |
|
Repayments of long-term debt |
|
| (7 | ) |
|
| (1 | ) |
|
| (301 | ) |
Other |
|
| (3 | ) |
|
| (1 | ) |
|
| 2 |
|
Cash flows provided from (used for) financing activities |
|
| 35 |
|
|
| (237 | ) |
|
| (382 | ) |
Net increase (decrease) in cash and cash equivalents |
|
| 244 |
|
|
| (49 | ) |
|
| (24 | ) |
Impact of foreign exchange on cash |
|
| 4 |
|
|
| (1 | ) |
|
| (4 | ) |
Cash and cash equivalents at beginning of year |
|
| 61 |
|
|
| 111 |
|
|
| 139 |
|
Cash and cash equivalents at end of year |
|
| 309 |
|
|
| 61 |
|
|
| 111 |
|
Supplemental cash flow information |
|
|
|
|
|
|
|
|
|
|
|
|
Net cash payments (refund) for: |
|
|
|
|
|
|
|
|
|
|
|
|
Interest |
|
| 52 |
|
|
| 46 |
|
|
| 57 |
|
Income taxes |
|
| (22 | ) |
|
| 59 |
|
|
| 71 |
|
The accompanying notes are an integral part of the consolidated financial statements.
47
DOMTAR CORPORATION
CONSOLIDATED STATEMENTS OF CASH FLOWS
(IN MILLIONS OF DOLLARS)
|
| Successor |
|
|
| Predecessor |
| ||||||||||
|
| Year ended |
|
| Period from |
|
|
| Period from |
|
| Year ended |
| ||||
|
| $ |
|
| $ |
|
|
| $ |
|
| $ |
| ||||
Operating activities |
|
|
|
|
|
|
|
|
|
|
|
|
| ||||
Net earnings (loss) |
|
| 339 |
|
|
| (4 | ) |
|
|
| (23 | ) |
|
| (127 | ) |
Adjustments to reconcile net earnings (loss) to cash flows |
|
|
|
|
|
|
|
|
|
|
|
|
| ||||
Depreciation and amortization |
|
| 209 |
|
|
| 23 |
|
|
|
| 205 |
|
|
| 283 |
|
Deferred income taxes and tax uncertainties (NOTE 8) |
|
| 32 |
|
|
| (10 | ) |
|
|
| (8 | ) |
|
| (45 | ) |
Impairment of long-lived assets (NOTE 14) |
|
| — |
|
|
| — |
|
|
|
| 9 |
|
|
| 137 |
|
Impairment of inventory (NOTE 14) |
|
| — |
|
|
| — |
|
|
|
| — |
|
|
| 31 |
|
Net gains on disposals of property, plant and equipment |
|
| — |
|
|
| — |
|
|
|
| (3 | ) |
|
| (1 | ) |
Net loss on disposition of discontinued operations (NOTE 3) |
|
| — |
|
|
| — |
|
|
|
| 33 |
|
|
| 45 |
|
Stock-based compensation expense |
|
| — |
|
|
| — |
|
|
|
| 28 |
|
|
| 8 |
|
Equity method investment loss, net of taxes |
|
| — |
|
|
| — |
|
|
|
| — |
|
|
| 3 |
|
Make-whole premium on repayment of long-term debt (NOTE 17) |
|
| — |
|
|
| — |
|
|
|
| 11 |
|
|
| — |
|
Other |
|
| 2 |
|
|
| 4 |
|
|
|
| 8 |
|
|
| 4 |
|
Changes in assets and liabilities, excluding the effect of acquisitions |
|
|
|
|
|
|
|
|
|
|
|
|
| ||||
Receivables |
|
| 8 |
|
|
| 45 |
|
|
|
| (163 | ) |
|
| 99 |
|
Inventories |
|
| (67 | ) |
|
| (19 | ) |
|
|
| (4 | ) |
|
| 7 |
|
Prepaid expenses |
|
| 38 |
|
|
| 4 |
|
|
|
| 7 |
|
|
| 11 |
|
Trade and other payables |
|
| 24 |
|
|
| (126 | ) |
|
|
| 118 |
|
|
| (57 | ) |
Income and other taxes |
|
| 60 |
|
|
| (17 | ) |
|
|
| 5 |
|
|
| 13 |
|
Difference between employer pension and other post-retirement |
|
| (37 | ) |
|
| (2 | ) |
|
|
| (17 | ) |
|
| (4 | ) |
Other assets and other liabilities |
|
| (4 | ) |
|
| — |
|
|
|
| — |
|
|
| 4 |
|
Cash flows provided from (used for) operating activities |
|
| 604 |
|
|
| (102 | ) |
|
|
| 206 |
|
|
| 411 |
|
Investing activities |
|
|
|
|
|
|
|
|
|
|
|
|
| ||||
Additions to property, plant and equipment |
|
| (440 | ) |
|
| (41 | ) |
|
|
| (268 | ) |
|
| (175 | ) |
Proceeds from disposals of property, plant and equipment |
|
| 33 |
|
|
| — |
|
|
|
| 4 |
|
|
| 3 |
|
Proceeds from sale of businesses, net of cash disposed (NOTE 3) |
|
| 243 |
|
|
| — |
|
|
|
| 897 |
|
|
| — |
|
Acquisition of businesses (NOTE 4) |
|
| — |
|
|
| (2,796 | ) |
|
|
| — |
|
|
| (30 | ) |
Cash flows (used for) provided from investing activities |
|
| (164 | ) |
|
| (2,837 | ) |
|
|
| 633 |
|
|
| (202 | ) |
Financing activities |
|
|
|
|
|
|
|
|
|
|
|
|
| ||||
Dividend payments |
|
| — |
|
|
| — |
|
|
|
| — |
|
|
| (51 | ) |
Stock repurchase |
|
| — |
|
|
| — |
|
|
|
| (238 | ) |
|
| (59 | ) |
Issuance of common shares |
|
| — |
|
|
| 1,555 |
|
|
|
| — |
|
|
| — |
|
Net change in bank indebtedness |
|
| 17 |
|
|
| — |
|
|
|
| — |
|
|
| (10 | ) |
Change in revolving credit facility |
|
| (115 | ) |
|
| 115 |
|
|
|
| — |
|
|
| (80 | ) |
Proceeds from receivables securitization facility |
|
| — |
|
|
| — |
|
|
|
| — |
|
|
| 25 |
|
Repayments of receivables securitization facility |
|
| — |
|
|
| — |
|
|
|
| — |
|
|
| (80 | ) |
Issuance of long-term debt, net of debt issue costs |
|
| 127 |
|
|
| 1,252 |
|
|
|
| — |
|
|
| 300 |
|
Repayments of long-term debt, including make-whole premium |
|
| (377 | ) |
|
| — |
|
|
|
| (606 | ) |
|
| (7 | ) |
Other |
|
| (2 | ) |
|
| — |
|
|
|
| (1 | ) |
|
| (3 | ) |
Cash flows (used for) provided from financing activities |
|
| (350 | ) |
|
| 2,922 |
|
|
|
| (845 | ) |
|
| 35 |
|
Net increase (decrease) in cash and cash equivalents |
|
| 90 |
|
|
| (17 | ) |
|
|
| (6 | ) |
|
| 244 |
|
Impact of foreign exchange on cash |
|
| (5 | ) |
|
| — |
|
|
|
| — |
|
|
| 4 |
|
Cash, cash equivalents and restricted cash at beginning of period |
|
| 286 |
|
|
| 303 |
|
|
|
| 309 |
|
|
| 61 |
|
Cash, cash equivalents and restricted cash at end of period |
|
| 371 |
|
|
| 286 |
|
|
|
| 303 |
|
|
| 309 |
|
Supplemental cash flow information |
|
|
|
|
|
|
|
|
|
|
|
|
| ||||
Net cash payments (refund) for: |
|
|
|
|
|
|
|
|
|
|
|
|
| ||||
Interest (including $11 million of make-whole premium in the |
|
| 116 |
|
|
| — |
|
|
|
| 53 |
|
|
| 52 |
|
Income taxes |
|
| 25 |
|
|
| 17 |
|
|
|
| 22 |
|
|
| (22 | ) |
The accompanying notes are an integral part of the consolidated financial statements.
48
DOMTAR CORPORATION
NOTES TO CONSOLIDATED FINANCIAL STATEMENTS
DECEMBER 31, 20202022
(IN MILLIONS OF DOLLARS, UNLESS OTHERWISE NOTEDNOTED))
INDEX FOR NOTES TO CONSOLIDATED FINANCIAL STATEMENTS
NOTE 1 |
| |
NOTE 2 |
| |
NOTE 3 |
| |
NOTE 4 |
| |
NOTE 5 |
| |
NOTE 6 |
| |
|
| |
NOTE |
| |
|
| |
NOTE |
| |
NOTE |
| |
NOTE |
| |
NOTE |
| |
NOTE |
| |
NOTE |
| |
NOTE | CLOSURE AND RESTRUCTURING COSTS AND IMPAIRMENT OF LONG-LIVED ASSETS |
|
NOTE |
| |
NOTE | CHANGES IN ACCUMULATED OTHER COMPREHENSIVE |
|
NOTE |
| |
NOTE |
| |
NOTE |
| |
NOTE |
| |
NOTE | DERIVATIVES AND HEDGING ACTIVITIES AND FAIR VALUE MEASUREMENT |
|
NOTE |
| |
NOTE |
| 108 |
NOTE 24 | 109 | |
5449
DOMTAR CORPORATION
NOTES TO CONSOLIDATED FINANCIAL STATEMENTS
DECEMBER 31, 20202022
(IN MILLIONS OF DOLLARS, UNLESS OTHERWISE NOTEDNOTED))
NOTE 1.
SUMMARY OF SIGNIFICANT ACCOUNTING POLICIES
NATURE OF OPERATIONS
Domtar designs, manufactures, markets and distributes a wide variety of fiber-based products including communication papers, specialty and packaging papers and components ofhigh quality airlaid and ultrathin laminated absorbent hygiene products.cores. The foundation of its business is a network of wood fiber converting assets that produce paper grade, fluff and specialty pulp. The majority of this pulp production is consumed internally to manufacture paper with the balance sold as market pulp. Domtar is the largest integrated marketer of uncoated freesheet paper in North America serving a variety of customers, including merchants, retail outlets, stationers, printers, publishers, converters and end-users.
BASIS OF PRESENTATION
The Company’s consolidated financial statements have been prepared in accordance with accounting principles generally accepted in the United States of America which requires management to make estimates and assumptions that affect the reported amounts of revenues and expenses during the year, the reported amounts of assets and liabilities, and the disclosure of contingent assets and liabilities at the date of the consolidated financial statements. On an ongoing basis, management reviews the estimates and assumptions, including but not limited to those related to environmental matters and asset retirement obligations, impairment and useful lives of long-lived assets, impairment of intangibles and goodwill, closure and restructuring costs, pension and other post-retirement benefit plans, income taxes, business combinations and contingencies, based on currently available information. Actual results could differ from those estimates.
On November 30, 2021, Paper Excellence completed the acquisition of all the outstanding common shares of Domtar Corporation (the “Company”) by means of a merger of Pearl Merger Sub (a wholly-owned subsidiary) with and into the Company with the Company continuing as the surviving corporation and as a subsidiary of Paper Excellence (the “Merger”). See Note 4 “Acquisition of business” for additional information on the Merger.
For purposes of the Company’s financial statement presentation, Pearl Merger Sub was determined to be the accounting acquirer in the Merger which was accounted for using the acquisition method of accounting. The application of the acquisition method of accounting resulted in a new basis of accounting basis of the Company’s assets and liabilities which are measured at fair value as of the date of the Merger.
The Company’s consolidated financial statements for the period following the closing of the Merger are labeled “Successor” and reflect the Company’s assets and liabilities at their fair values. All periods prior to the closing of the Merger reflect the historical accounting basis of the Company’s assets and liabilities and are labeled “Predecessor.” The consolidated financial statements and related notes include a black line division between the columns titled "Predecessor" and "Successor" to signify that the amounts shown for the periods prior to and following the Merger are not comparable.
As a condition to obtain the approval of the Merger from the Canadian Competition Bureau, the Company was required to commit to the divestiture of its Kamloops, British Columbia production facility within a short period of time following the Merger, which occurred on June 1, 2022.
Certain reclassifications have been made to the prior years’ presentation to conform to the current year presentation.
PRINCIPLES OF CONSOLIDATION
The consolidated financial statements include the accounts of Domtar and its controlled subsidiaries. Intercompany transactions have been eliminated on consolidation. The equity method of accounting is used for investments in affiliates over which the Company has significant influence but does not have effective control.
50
DOMTAR CORPORATION
NOTES TO CONSOLIDATED FINANCIAL STATEMENTS
DECEMBER 31, 2022
(IN MILLIONS OF DOLLARS, UNLESS OTHERWISE NOTED)
NOTE 1. SUMMARY OF SIGNIFICANT ACCOUNTING POLICIES (CONTINUED)
BUSINESS COMBINATIONS
The Company accounts for business combinations in accordance with ASC 805 “Business Combinations” which requires, among other things, the acquiring entity in a business combination to recognize the fair value of the assets acquired and liabilities assumed; the recognition of acquisition-related costs in the Consolidated Statements of Earnings (Loss) and Comprehensive Income (Loss); the recognition of restructuring costs in the Consolidated Statements of Earnings (Loss) and Comprehensive Income (Loss) for which the acquirer becomes obligated after the acquisition date; and contingent purchase consideration to be recognized at fair value on the acquisition date with subsequent adjustments recognized in the Consolidated Statements of Earnings (Loss) and Comprehensive Income (Loss).
Estimates of fair value require a complex series of judgments about future events and uncertainties. The estimates and assumptions used to determine the preliminary estimated fair value assigned to each class of assets and liabilities, as well as asset lives, have a material impact to the Company's consolidated financial statements, and are based upon assumptions believed to be reasonable but that are inherently uncertain. The Company generally uses third-party qualified consultants to assist management in determining the fair value of assets acquired and liabilities assumed. This includes, when necessary, assistance with the determination of lives and valuation of property and identifiable intangibles and assisting management in assessing off-market contracts and obligations associated with legal and environmental claims. The purchase price allocation process also entails the Company to refine these estimates over a measurement period not to exceed one year to reflect new information obtained surrounding facts and circumstances existing at acquisition date.
The excess of the purchase price over the fair value of the identified assets acquired and liabilities assumed is recorded as goodwill.
DISCONTINUED OPERATIONS
The results of operations forof the Personal Care business unit (disposal group)Kamloops, British Columbia production facility (the “Kamloops disposal group”) have been classified as discontinued operations for all periods presented in the Consolidated Statements of Earnings (Loss) and Comprehensive Income (Loss) as the Kamloops disposal group met the criteria to be classified as held for sale at the time of the Merger discussed above. The after-tax results of operations of the discontinued operations are reported as a separate component in the Consolidated Statements of Earnings (Loss) and Comprehensive Income (Loss) for all prior periods presented. The cash flows related to the divested Kamloops disposal group have not been segregated and are included in the Consolidated Statements of Cash Flows for all periods presented. In addition, the related assets and liabilities of the Kamloops disposal group have been classified as held for sale in the Consolidated Balance Sheets and are measured at their fair values at December 31, 2021.
The results of operations for the Personal Care business unit (the “Personal Care disposal group”) have been classified as discontinued operations for all periods presented in the Consolidated Statements of Earnings (Loss) and Comprehensive Income (Loss) as the Personal Care disposal group met the criteria to be classified as held for sale in the fourth quarter of 2020 and the disposal of the business unit represents a strategic shift that will havehas a major effect on the Company's operations and financial results. The after-tax results of operations of the discontinued operations (including the loss recognized on classification as held for sale are reported as a separate component in the Consolidated Statements of Earnings (Loss) and Comprehensive Income (Loss) for current and all prior periods presented. The cash flows related to the divested Personal Care business have not been segregated and are included in Consolidated Statements of Cash Flows for all periods presented. In addition, the related assets and liabilities of the disposal group have been classified as held for sale in the Consolidated Balance Sheets at December 31, 2020 and 2019.Sheets.
TRANSLATION OF FOREIGN CURRENCIES
The Company determines its international subsidiaries’ functional currency by reviewing the currencies in which their respective operating activities occur. The Company translates assets and liabilities of its non-U.S. dollar functional currency subsidiaries (primarily Canadian dollar) into U.S. dollars using the rate in effect at the balance sheet date and revenues and expenses are translated at the average exchange rates during the year. Foreign currency translation gains and losses are included in Shareholders’ equity as a component of Accumulated other comprehensive loss(loss) income in the accompanying Consolidated Balance Sheets.
Monetary assets and liabilities denominated in a currency that is different from a reporting entity’s functional currency must first be remeasured from the applicable currency to the legal entity’s functional currency. The effect of this remeasurement process is recognized in the Consolidated Statements of Earnings (Loss) and Comprehensive Income (Loss) and is partially offset by the Company’s hedging program (refer to Note 23 ���Derivatives21 “Derivatives and hedging activities and fair value measurement”).
5551
DOMTAR CORPORATION
NOTES TO CONSOLIDATED FINANCIAL STATEMENTS
DECEMBER 31, 20202022
(IN MILLIONS OF DOLLARS, UNLESS OTHERWISE NOTEDNOTED))
NOTE 1. SUMMARY OF SIGNIFICANT ACCOUNTING POLICIES (CONTINUED)
REVENUE RECOGNITION
The Company’s revenue is generated from the sale of finished goods to customers. Revenue is recognized at a single point in time when the performance obligation is satisfied which occurs when the control over the goods is transferred to customers. For shipping and handling activities performed after customers obtain control of the goods, the Company elected to account for these activities as fulfillment activities rather than assessing such activities as separate performance obligations. Accordingly, the sale of goods to customers represents a single performance obligation to which the entire transaction price is allocated.
The point in time when the control of goods is transferred to customers is largely dependent on delivery terms. Revenue is recorded at the time of shipment for delivery terms designated free on boardFree On Board (“f.o.b.F.O.B.”) shipping point. For sales transactions designated f.o.b.F.O.B. destination, revenue is recorded when the product is delivered to the customer’s delivery site.
Revenue is measured as the amount of consideration the Company expects to receive in exchange for goods transferred to customers. Revenue is recognized net of variable consideration in the form of rebates, discounts and other commercial incentives extended to customers. Variable consideration is recognized using the most likely amounts which are based on an analysis of historical experience and current period expectations. The Company includes estimated amounts of variable consideration in revenue to the extent that it is probable that there will not be a significant reversal of recognized revenue when the uncertainty related to that variable consideration is resolved.
For all the Company’s contracts, customer payments are due in less than one year. Accordingly, the Company does not adjust the amount of revenue recognized for the effects of a significant financing component.
Sales taxes, and other similar taxes, collected from customers are excluded from revenue.
SHIPPING AND HANDLING COSTS
The Company classifies shipping and handling costs as a component of Cost of sales in the Consolidated Statements of Earnings (Loss) and Comprehensive Income (Loss).
CLOSURE AND RESTRUCTURING COSTS
Closure and restructuring costs are recognized as liabilities in the period when they are incurred and are measured at their fair value. For such recognition to occur, management, with the appropriate level of authority, must have approved and committed to a firm plan and appropriate communication to those affected must have occurred. These provisions may require an estimation of costs such as severance and termination benefits, pension and related curtailments, environmental remediation and may also include expenses related to demolition and outplacement. Actions taken may also require an evaluation of any remaining assets to determine required impairments, if any, and a review of estimated remaining useful lives which may lead to accelerated depreciation expense.
Estimates of cash flows and fair value relating to closures and restructurings require judgment. Closure and restructuring liabilities are based on management’s best estimates of future events. Although the Company does not anticipate significant changes, the actual costs may differ from these estimates due to subsequent developments such as the results of environmental studies, the ability to find a buyer for assets set to be dismantled and demolished and other business developments. As such, additional costs and further working capital adjustments may be required in future periods.
5652
DOMTAR CORPORATION
NOTES TO CONSOLIDATED FINANCIAL STATEMENTS
DECEMBER 31, 20202022
(IN MILLIONS OF DOLLARS, UNLESS OTHERWISE NOTEDNOTED))
NOTE 1. SUMMARY OF SIGNIFICANT ACCOUNTING POLICIES (CONTINUED)
INCOME TAXES
Domtar uses the asset and liability method of accounting for income taxes. Under this method, deferred tax assets and liabilities are determined according to differences between the carrying amounts and tax bases of the assets and liabilities. The Company records its worldwide tax provision based on the respective tax rules and regulations for the jurisdictions in which it operates. The change in the net deferred tax asset or liability is included in Income tax expense (benefit) or in Other comprehensive (loss) income (loss) in the Consolidated Statements of Earnings (Loss) and Comprehensive Income (Loss). Deferred tax assets and liabilities are measured using enacted tax rates and laws expected to apply in the years in which the assets and liabilities are expected to be recovered or settled. Uncertain tax positions are recorded based upon the Company’s evaluation of whether it is “more likely than not” (a probability level of more than 50%) that, based upon its technical merits, the tax position will be sustained upon examination by the taxing authorities. The Company establishes a valuation allowance for deferred tax assets when it is more likely than not that they will not be realized. In general, “realization” refers to the incremental benefit achieved through the reduction in future taxes payable or an increase in future taxes refundable from the deferred tax assets. Deferred tax assets and liabilities are classified as non-current items on the Consolidated Balance Sheets.
The Company recognizes interest and penalties related to income tax matters as a component of Income tax expense (benefit) in the Consolidated Statements of Earnings (Loss) and Comprehensive Income (Loss).
If and when incurred, the Company accounts for any taxes associated with Global Intangible Low-Taxed Income (“GILTI”) as a period cost.
CASH AND CASH EQUIVALENTS
Cash and cash equivalents include cash and short-term investments with original maturities of less than three months from the date of purchase and are presented at cost which approximates fair value.
RECEIVABLES AND ALLOWANCES FOR EXPECTED CREDIT LOSSES
We establishReceivables are recorded at cost, net of an allowance for expected credit losses. The Company establishes allowances for expected credit losses on receivables. Thereceivables and the adequacy of these allowances is assessed quarterlyregularly through consideration of factors including, but not limited to, customer credit ratings, bankruptcy filings, published or estimated credit default rates, age of the receivable, expected loss rates and collateral exposures. We assignThe Company assigns internal credit ratings for all customers and determinedetermines the creditworthiness of each customer based upon publicly available information and information obtained directly from ourits customers. Our rating categories are comparable to those used by major credit rating agencies. The securitizationA receivable is written off when there is no reasonable expectation of receivables is accounted for as secured borrowings. Accordingly, financing expenses related torecovering the securitization of receivables are recognized in earnings as a component of Interest expense, net in the Consolidated Statements of Earnings (Loss) and Comprehensive Income (Loss).contractual cash flows.
INVENTORIES
INVENTORIES
Inventories are stated at the lower of cost or net realizable value. Cost includes labor, materials and production overhead. The last-in, first-out (“LIFO”) method is used to account for certain domestic raw materials, in process and finished goods inventories. LIFO inventories were $220 million and $242 million at December 31, 2020 and 2019, respectively. The balance of domestic raw material inventories, all materials and supplies inventories and all foreign inventories are recorded at either the first-in, first-out (“FIFO”) or average cost methods. Had the inventories for which the LIFO method is used been valued under the FIFO method, the amounts at which product inventories are stated would have been $52 million and $69 million greater at December 31, 2020 and 2019, respectively.
57
DOMTAR CORPORATION
NOTES TO CONSOLIDATED FINANCIAL STATEMENTS
DECEMBER 31, 2020
(IN MILLIONS OF DOLLARS, UNLESS OTHERWISE NOTED)
NOTE 1. SUMMARY OF SIGNIFICANT ACCOUNTING POLICIES (CONTINUED)
PROPERTY, PLANT AND EQUIPMENT
Property, plant and equipment are stated at acquisition cost less accumulated depreciation including asset impairments.and impairment. Costs for repair and maintenance activities are expensed as incurred under the direct expense method of accounting. Interest costs are capitalized for significant capital projects. For timberlands, the amortization is calculated using the unit of production method. For all other assets, depreciation is calculated using the straight-line method over the estimated useful lives of the assets. Buildings and improvements are depreciated over periods of 10 to 40 years and machinery and equipment over periods of 3 to 20 years. NaN years. No depreciation is recorded on assets under construction.
53
DOMTAR CORPORATION
NOTES TO CONSOLIDATED FINANCIAL STATEMENTS
DECEMBER 31, 2022
(IN MILLIONS OF DOLLARS, UNLESS OTHERWISE NOTED)
NOTE 1. SUMMARY OF SIGNIFICANT ACCOUNTING POLICIES (CONTINUED)
IMPAIRMENT OF PROPERTY, PLANT AND EQUIPMENT
Property, plant and equipment are reviewed for impairment upon the occurrence of events or changes in circumstances indicating that the carrying value of the assets may not be recoverable, by comparing the net book value of the asset group to their estimated undiscounted future cash flows expected from their use and eventual disposition. Impaired assets are recorded at estimated fair value, determined principally by using the present value of estimated future cash flows expected from their use and eventual disposition.
LEASES
LEASES
The Company engages in short and long-term leases for building, machinery, equipment and office equipment. At inception of an arrangement, the Company determines whether the arrangement contains a lease. A lease conveys the right to control the use of identified property, plant, or equipment (asset) for a period of time in exchange for consideration. Control over the use of the identified asset means that the Company has both the right to obtain substantially all of the economic benefits from the use of the asset and the right to direct the use of the asset.
For each lease arrangement that has an original lease term of more than 12 months, a right-of-use asset and a lease liability are recorded in the Consolidated Balance Sheets. The right-of-use asset represents the Company’s right to use an underlying asset for the lease term while the lease liability represents the obligation to make lease payments arising from the lease. The right-of-use asset and the lease liability are initially recorded at the same amount at the lease commencement date based on the present value of the remaining lease payments discounted using the Company’s incremental borrowing rate. The operating lease right-of-use asset also include previously recognized impairments and purchase price adjustments relating to favorable and unfavorable terms of leases acquired as part of business combinations. Lease terms may include options to extend or terminate the lease when it is reasonably certain that the Company will exercise that option. Any potential impairment forImpairment of right-of-use assets will beare determined and calculated in the same manner as disclosed under impairment of long-lived assets.property, plant and equipment.
The terms of a lease arrangement determine how a lease is classified (operating or finance), the resulting recognition pattern in the Consolidated Statements of Earnings (Loss) and Comprehensive Income (Loss) and the classification in the Consolidated Balance Sheets.
Finance lease expense is represented by the interest on the lease liability determined using the effective interest method and the amortization of the finance lease right-of-use asset calculated using the straight-line method over the estimated useful life of the identified asset. Finance lease related balances are included in the Consolidated Balance Sheets in Property, plant and equipment, net, Long-term debt due within one year and Long-term debt.
Operating lease expense is recorded on a straight-line basis over the lease term by adding interest expense determined using the effective interest method to the amortization of the right-of-use asset. Operating lease related balances are included in the Consolidated Balance Sheets in Operating lease right-of-use assets, Operating lease liabilities due within one year and Operating lease liabilities.
The Company elected to initially apply the new leases standard as of January 1, 2019 with certain available practical expedients. No cumulative-effect adjustments on retained earnings were necessary as of January 1, 2019. The most significant impact of adopting the new standard was the recognition of right-of-use assets and lease liabilities for operating leases. The accounting for finance leases remains substantially unchanged.
58
DOMTAR CORPORATION
NOTES TO CONSOLIDATED FINANCIAL STATEMENTSD
DECEMBER 31, 2020
(IN MILLIONS OF DOLLARS, UNLESS OTHERWISE NOTED)
NOTE 1. SUMMARY OF SIGNIFICANT ACCOUNTING POLICIES (CONTINUED)
EFINITE-LIVED INTANGIBLE ASSETS
Indefinite-lived intangible assets are not amortized and are evaluated for impairment individually at the beginning of the fourth quarter of every year, or more frequently whenever indicators of potential impairment exist. The Company has the option to first assess qualitative factors to determine whether it is more likely than not that the fair value of indefinite-lived intangible assets is less than their carrying amounts. To carry out the qualitative assessment, the Company considers elements such as the results of recent fair value assessments, macroeconomic conditions, industry and market considerations, cost factors, overall financial performance, specific events affecting the Company and the business. The identification and impact assessment of events and circumstances on the fair value involves significant judgment and assumptions. If a qualitative assessment is performed and after assessing the qualitative factors, the Company determines that it is more likely than not that the fair value of the indefinite-lived intangible assets is less than their carrying amounts, then a quantitative impairment test is required. The Company can also elect to proceed directly to the quantitative test. The quantitative impairment test consists of comparing the fair value of the indefinite-lived intangible assets determined using a variety of methodologies to their carrying amount. If the carrying amounts of the indefinite-lived intangible assets exceed their fair value, an impairment loss is recognized in an amount equal to that excess.
Indefinite-lived intangible assets include license rights and water rights. The Company reviews its indefinite-lived intangible assets each reporting period to determine whether events and circumstances continue to support indefinite useful lives.
Definite-lived intangible assets are stated at acquisition cost less accumulated amortization and are reviewed for impairment whenever events or changes in circumstances indicate that their carrying amount may not be recoverable. Definite-lived intangible assets include water rights customer relationships, technology as well as non-compete agreements,and trade names which are being amortized using the straight-line method over their respective estimated useful lives. Any potential impairment for definite-lived intangible assets will beis calculated in the same manner as disclosed under impairmentImpairment of long-lived assets.property, plant and equipment.
Amortization is based on the following useful lives:
| |||
Water rights |
| ||
|
| 30 years | |
| Trade names |
| 15 years |
|
| ||
54
DOMTAR CORPORATION
NOTES TO CONSOLIDATED FINANCIAL STATEMENTS
DECEMBER 31, 2022
(IN MILLIONS OF DOLLARS, UNLESS OTHERWISE NOTED)
NOTE 1. SUMMARY OF SIGNIFICANT ACCOUNTING POLICIES (CONTINUED)
DEBT ISSUANCE COSTS
Debt issuance costs associated with long-term debt are presented in the Consolidated Balance Sheets as a deduction from the carrying value of long-term debt. Debt issuance costs associated with revolving credit arrangements are presented in Other assets in the Consolidated Balance Sheets. Debt issuance costs are amortized using the effective rate method over the term of the related debt and included in Interest expense, net in the Consolidated Statements of Earnings (Loss) and Comprehensive Income (Loss).
59
DOMTAR CORPORATION
NOTES TO CONSOLIDATED FINANCIAL STATEMENTS
DECEMBER 31, 2020
(IN MILLIONS OF DOLLARS, UNLESS OTHERWISE NOTED)
NOTE 1. SUMMARY OF SIGNIFICANT ACCOUNTING POLICIES (CONTINUED)
ENVIRONMENTAL COSTS AND ASSET RETIREMENT OBLIGATIONS
Environmental expenditures for effluent treatment, air emission, silvicultural activities and site remediation (together referred to as environmental matters) are expensed or capitalized depending on their future economic benefit. In the normal course of business, Domtar incurs certain operating costs for environmental matters that are expensed as incurred. Expenditures for property, plant and equipment that prevent future environmental impacts are capitalized and amortized on a straight-line basis over 10 to 40 years. Provisions for environmental matters are recorded when remediation efforts are probable and can be reasonably estimated. Provisions for environmental matters are generally not discounted, due to uncertainty with respect to timing of expenditures.
Asset retirement obligations are mainly associated with landfill operation and closure, dredging of settling ponds and bark pile management and are recognized, at fair value, in the period in which Domtar incurs a legal obligation associated with the retirement of an asset. Conditional asset retirement obligations are recognized, at fair value, when the fair value of the liability can be reasonably estimated on a probability-weighted discounted cash flow estimate. The associated costs are capitalized as part of the carrying value of the related asset and depreciated over its remaining useful life. The liability is accreted using the credit adjusted risk-free interest rate used to discount the cash flow.
STOCK-BASED COMPENSATION AND OTHER STOCK-BASED PAYMENTS
Domtar recognizesAt the cost (net of estimated forfeitures) of employee services received in exchange for awards of equity instruments over the requisite service period, based on their grantMerger date, fair value for awards accounted for as equity and based on the quoted market value at the end of each reporting period for awards accounted for as liability. The Company awards are accounted for as compensation expense in the Consolidated Statements of Earnings (Loss) and Comprehensive Income (Loss) and presented in Additional paid-in capital on the Consolidated Balance Sheets for equity type awards and presented in Other liabilities and deferred credits on the Consolidated Balance Sheets for liability type awards.
The Company’s awards may be subject to market, performance and/or service conditions. Any consideration paid by plan participants on the exercise of stock options or the purchase of shares is credited to Additional paid-in capital in the Consolidated Balance Sheets. The par value included in the Additional paid-in capital component of stock-based compensation is transferred to Common stock upon the issuance of shares of common stock.
Stock options subject to service conditions vest pro rata on the first three anniversaries of the grant and have a seven-year term. Service and performance-based awards vest on the third anniversary of the grant. The performance-based awards have an additional feature where the ultimate number of units that vest will be determined byall the Company’s performance resultsoutstanding stock-based awards, whether vested or shareholder return in relationunvested, were cancelled and converted into the right to a predetermined target over the vesting period. Deferred Share Units vest immediately at the grant date and are remeasured at the end of each reporting period, until settlement, using the quoted market value.receive cash payment.
Under the amended and restated Domtar Corporation 2007 Omnibus Incentive Plan (“Omnibus Plan”), a maximum of 872,136 shares are reserved for issuance in connection with awards to be granted.
DERIVATIVE INSTRUMENTS
Derivative instruments may be utilized by Domtar as part of the overall strategy to manage exposure to fluctuations in foreign currency, interest rate and commodity price on certain purchases. As a matter of policy, derivatives are not used for trading or speculative purposes. All derivatives are recorded at fair value either as assets or liabilities. When derivative instruments have been designated within a hedge relationship and are highly effective in offsetting the identified risk characteristics of specific financial assets and liabilities or group of financial assets and liabilities, hedge accounting is applied. In a fair value hedge, changes in fair value of derivatives are recognized in the Consolidated Statements of Earnings (Loss) and Comprehensive Income (Loss). The change in fair value of the hedged item attributable to the hedged risk is also recorded in the Consolidated Statements of Earnings (Loss) and Comprehensive Income (Loss) by way of a corresponding adjustment of the carrying amount of the hedged item recognized in the Consolidated Balance Sheets. In a cash flow hedge, changes in fair value of derivative instruments are recorded in Other comprehensive income (loss). income. These amounts are reclassified in the Consolidated Statements of Earnings (Loss) and Comprehensive Income (Loss) in the periods in which results are affected by the cash flows of the hedged item within the same line item.
6055
DOMTAR CORPORATION
NOTES TO CONSOLIDATED FINANCIAL STATEMENTS
DECEMBER 31, 20202022
(IN MILLIONS OF DOLLARS, UNLESS OTHERWISE NOTEDNOTED))
NOTE 1. SUMMARY OF SIGNIFICANT ACCOUNTING POLICIES (CONTINUED)
PENSION PLANS
Domtar’s plans include funded and unfunded defined benefit and defined contribution pension plans. Domtar recognizes the overfunded or underfunded status of defined benefit and underfunded defined contribution pension plans as an asset or liability in the Consolidated Balance Sheets. The net periodic benefit cost includes the following:
- The cost of pension benefits provided in exchange for employees’ services rendered during the period, - The interest cost of pension obligations, - The expected long-term return on pension fund assets based on a market value of pension fund assets, - Gains or losses on settlements and curtailments, - The straight-line amortization of past service costs and plan amendments over the average remaining service period of approximately ten years of the active employee group covered by the plans, and - The amortization of cumulative net actuarial gains and losses in excess of 10% of the greater of the projected benefit obligation and the market value of assets over the average remaining service period of approximately ten years of the active employee group covered by the plans. |
|
|
|
|
|
|
|
|
|
|
|
|
The defined benefit plan obligations are determined in accordance with the projected unit credit actuarial cost method.
OTHER POST-RETIREMENT BENEFIT PLANS
The Company recognizes the unfunded status of other post-retirement benefit plans (other than multiemployer plans) as a liability in the Consolidated Balance Sheets. These benefits, which are funded by Domtar as they become due, include life insurance programs, medical and dental benefits and short-term and long-term disability programs. The Company amortizes the cumulative net actuarial gains and losses in excess of 10%10% of the greater of the projected benefit obligation and the market value of assets over the average remaining service period of approximately 12 years of the active employee group covered by the plans.
GUARANTEES
GUARANTEES
A guarantee is a contract or an indemnification agreement that contingently requires Domtar to make payments to the other party of the contract or agreement, based on changes in an underlying item that is related to an asset, a liability or an equity security of the other party or on a third party’s failure to perform under an obligating agreement. It could also be an indirect guarantee of the indebtedness of another party, even though the payment to the other party may not be based on changes in an underlying item that is related to an asset, a liability or an equity security of the other party. Guarantees, when applicable, are accounted for at fair value.
6156
DOMTAR CORPORATION
NOTES TO CONSOLIDATED FINANCIAL STATEMENTS
DECEMBER 31, 20202022
(IN MILLIONS OF DOLLARS, UNLESS OTHERWISE NOTEDNOTED))
NOTE 2.
RECENT ACCOUNTING PRONOUNCEMENTS
ACCOUNTING CHANGES IMPLEMENTED
IMPLEMENTATION COSTS FOR CLOUD COMPUTING ARRANGEMENTS
In August 2018, the FASB issued Accounting Standards Update (“ASU”) 2018-15, “Customer’s Accounting for Implementation Costs Incurred in a Cloud Computing Arrangement That Is a Service Contract”. Under the guidance, implementation costs for cloud computing arrangements should be evaluated for capitalization using the same approach as implementation costs associated with internal-use software and expensed over the term of the hosting arrangement. The ASU also provides guidance on presentation and disclosure.
The Company adopted the new guidance on January 1, 2020 with no significant impact on the consolidated financial statements.
RECEIVABLES
In June 2016, the FASB issued ASU 2016-13, “Financial Instruments - Credit Losses”. This ASU added a new impairment model (known as the current expected credit loss (“CECL”) model) that is based on expected losses rather than incurred losses. Under the new guidance, an entity recognizes an allowance for its estimate of expected credit losses and applies to most debt instruments, trade receivables, lease receivables, financial guarantee contracts, and other loan commitments. The CECL model does not have a minimum threshold for recognition of impairment losses and entities will need to measure expected credit losses on assets that have a low risk of loss.
The Company adopted the new guidance on January 1, 2020 with no significant impact on the consolidated financial statements.
INCOME TAXES
In December 2019, the FASB issued ASU 2019-12, “Income Taxes (Topic 740): Simplifying the Accounting for Income Taxes”. The ASU simplifies the accounting for income taxes by eliminating certain exceptions in ASC 740 related to the methodology for calculating income taxes in an interim period. It also clarifies and simplifies other aspects of the accounting for income taxes, improving the consistent application and simplification of U.S. GAAP. For public companies, the amendments in this ASU are effective for fiscal years beginning after December 15, 2020 and interim periods within those fiscal years, with early adoption permitted. The Company elected to early adopt this standard for its interim period ended September 30, 2020, using the methods directed by the standard. The most significant impact to the Company is the removal of a limit on the tax benefit recognized on pre-tax losses in interim periods, which allowed the Company to recognize a higher tax benefit in the quarter of adoption than previously allowable. The adoption of this ASU did not change the total income tax benefit the Company recognized for the full year ended December 31, 2020.
FUTURE ACCOUNTING CHANGES
TRANSITION AWAY FROM INTERBANK OFFERED RATES
On March 12, 2020, the FASB issued ASU 2020-04, “Reference Rate Reform (Topic 848):Facilitation of the Effects of Reference Rate Reform on Financial Reporting”. The ASU provides optional expedients and exceptions for applying generally accepted accounting principles to contract modifications and hedging relationships, subject to meeting certain criteria, that reference LIBOR or another reference rate expected to be discontinued.
The amendments in the ASU are elective and apply to entities that have contracts, hedging relationships, and other transactions that reference LIBOR or another reference rate expected to be discontinued due to reference rate reform. An entity may elect to apply the amendments prospectively through December 31, 2022.
On December 22, 2022, the FASB issued ASU 2022-06 “Reference Rate Reform (Topic 848): Deferral of the Sunset Date of Topic 848”. The amendments in this ASU defer the sunset date of Topic 848 from December 31, 2022, to December 31, 2024, after which entities will no longer be permitted to apply the relief in Topic 848.
As of December 31, 2022, the Company has not yet elected any optional expedients provided in the standard. The Company has begun its impact assessmentwill apply the accounting relief, if necessary, as relevant contract and while its evaluation of this guidance is inhedge accounting relationship modifications are made during the early stages, thereference rate reform transition period. The Company does not expect the adoption of this guidance to have a material impact on the consolidated financial statements.
6257
DOMTAR CORPORATION
NOTES TO CONSOLIDATED FINANCIAL STATEMENTS
DECEMBER 31, 20202022
(IN MILLIONS OF DOLLARS, UNLESS OTHERWISE NOTEDNOTED))
NOTE 3.
DISCONTINUED OPERATIONS
Mandated sale of Kamloops, British Columbia mill
On November 30, 2021, Paper Excellence completed the acquisition of all the outstanding shares of Domtar Corporation. The acquisition was subject to the review by the Canadian Competition Bureau, which outlined certain stipulations in a consent agreement before providing their final approval.
The consent agreement filed by the Canadian Commissioner of Competition (“Commissioner”) with the Competition Tribunal fulfilled the final condition to the closing of the business combination. According to the consent agreement, following the closing of the business combination, Domtar’s pulp mill in Kamloops, British Columbia was to be sold in order to resolve the Commissioner’s concerns about the business combination’s implications on the purchase of wood fiber from the Thompson/Okanagan region in British Columbia.
On June 1, 2022, Domtar completed the sale of the mill and related assets to an independent acquirer approved by the Commissioner for a purchase price of $243 million. In connection with the sale, the Company entered into Transition Services Agreements with the acquirer pursuant to which the Company agreed to provide various back-office and information technology support until the business is fully separated from Domtar.
The net assets of Domtar’s pulp mill in Kamloops, British Columbia were classified as held for sale and the results of operations were reclassified to discontinued operations. These results have been summarized in Earnings from discontinued operations, net of taxes on the Company’s Consolidated Statements of Earnings (Loss) and Comprehensive Income (Loss) for each period presented. The Consolidated Statements of Cash Flows were not reclassified to reflect discontinued operations.
Sale of Personal Care business
On January 7,March 1, 2021, Domtar Corporation entered into a definitive agreement with American Industrial Partners (AIP) to sellcompleted the sale of the Company’s Personal Care business to American Industrial Partners (“AIP”) for a purchase price of $920$920 million in cash, including elements of working capital estimated at $130of $130 million. Domtar received a net amount of $897 million, subject to customary adjustments. Subject towhich represented the satisfaction or waiver of conditionsselling price minus the settlements of the agreement,net indebtedness and other elements of working capital adjustments. In connection with the transactionsale, the Company entered into Transition Services Agreements with AIP pursuant to which the Company agreed to provide various back-office and information technology support. These agreements expired as the business is expected to close in the first quarter of 2021.fully separated from Domtar.
The resultresults of operations of the Company’s Personal Care business were reclassified to discontinued operations during 2020.operations. These results have been summarized in Earnings (loss) from discontinued operations, net of taxes on the Company’s Consolidated Statements of Earnings (Loss) and Comprehensive Income (Loss) for each period presented. The Consolidated Statements of Cash Flows were not reclassified to reflect discontinued operations. Personal Care was previously disclosed as a separate reportable business segment.
Major components of earnings (loss) from discontinued operations:
|
| Year ended December 31, |
|
| Year ended December 31, |
|
| Year ended December 31, |
| |||
|
| 2020 |
|
| 2019 |
|
| 2018 |
| |||
|
| $ |
|
| $ |
|
| $ |
| |||
Sales |
|
| 995 |
|
|
| 920 |
|
|
| 959 |
|
Operating expenses |
|
|
|
|
|
|
|
|
|
|
|
|
Cost of sales, excluding depreciation and amortization |
|
| 721 |
|
|
| 684 |
|
|
| 734 |
|
Depreciation and amortization |
|
| 60 |
|
|
| 62 |
|
|
| 67 |
|
Selling, general and administrative |
|
| 141 |
|
|
| 143 |
|
|
| 151 |
|
Impairment of long-lived assets |
|
| 1 |
|
|
| 26 |
|
|
| 7 |
|
Closure and restructuring costs |
|
| — |
|
|
| 20 |
|
|
| 8 |
|
Other operating loss, net |
|
| 2 |
|
|
| 1 |
|
|
| 1 |
|
|
|
| 925 |
|
|
| 936 |
|
|
| 968 |
|
Operating income (loss) |
|
| 70 |
|
|
| (16 | ) |
|
| (9 | ) |
Loss on classification as held for sale |
|
| 45 |
|
|
| — |
|
|
| — |
|
Earnings (loss) from discontinued operations before income taxes |
|
| 25 |
|
|
| (16 | ) |
|
| (9 | ) |
Income tax expense (benefit) |
|
| 7 |
|
|
| (15 | ) |
|
| (11 | ) |
Net earnings (loss) from discontinued operations |
|
| 18 |
|
|
| (1 | ) |
|
| 2 |
|
6358
DOMTAR CORPORATION
NOTES TO CONSOLIDATED FINANCIAL STATEMENTS
DECEMBER 31, 20202022
(IN MILLIONS OF DOLLARS, UNLESS OTHERWISE NOTEDNOTED))
NOTE 3. DISCONTINUED OPERATIONS (CONTINUED)
Major components of earnings from discontinued operations:
|
| Successor |
|
|
| Predecessor |
| ||||||||||
|
| Year ended December 31, |
|
| Period from |
|
|
| Period from |
|
| Year ended December 31, |
| ||||
|
| 2022 |
|
| 2021 |
|
|
|
| 2021 |
|
|
| 2020 |
| ||
|
| $ |
|
| $ |
|
|
| $ |
|
| $ |
| ||||
Sales |
|
| 154 |
|
|
| 18 |
|
|
|
| 446 |
|
|
| 1,232 |
|
Operating expenses |
|
|
|
|
|
|
|
|
|
|
|
|
| ||||
Cost of sales, excluding depreciation and amortization |
|
| 119 |
|
|
| 16 |
|
|
|
| 323 |
|
|
| 932 |
|
Depreciation and amortization |
|
| — |
|
|
| — |
|
|
|
| 23 |
|
|
| 75 |
|
Selling, general and administrative |
|
| — |
|
|
| — |
|
|
|
| 26 |
|
|
| 142 |
|
Impairment of long-lived assets |
|
| — |
|
|
| — |
|
|
|
| — |
|
|
| 1 |
|
Closure and restructuring costs |
|
| — |
|
|
| — |
|
|
|
| 1 |
|
|
| — |
|
Transaction costs |
|
| 9 |
|
|
| — |
|
|
|
| — |
|
|
| — |
|
Other operating loss, net |
|
| — |
|
|
| — |
|
|
|
| 1 |
|
|
| 2 |
|
|
|
| 128 |
|
|
| 16 |
|
|
|
| 374 |
|
|
| 1,152 |
|
Operating income |
|
| 26 |
|
|
| 2 |
|
|
|
| 72 |
|
|
| 80 |
|
Net loss on disposition of discontinued operations |
|
| — |
|
|
| — |
|
|
|
| 33 |
|
|
| 45 |
|
Earnings from discontinued operations |
|
| 26 |
|
|
| 2 |
|
|
|
| 39 |
|
|
| 35 |
|
Income tax expense |
|
| 8 |
|
|
| 1 |
|
|
|
| 13 |
|
|
| 11 |
|
Net earnings from discontinued operations |
|
| 18 |
|
|
| 1 |
|
|
|
| 26 |
|
|
| 24 |
|
Major classes of assets and liabilities classified as held for sale in the accompanying Balance Sheets were as follows:
|
| Successor |
| |||||
|
| At |
| |||||
|
| December 31, |
|
| December 31, |
| ||
|
| 2022 |
|
| 2021 |
| ||
|
| $ |
|
| $ |
| ||
Assets |
|
|
|
|
|
| ||
Receivables |
|
| — |
|
|
| 50 |
|
Inventories |
|
| — |
|
|
| 82 |
|
Long-term assets |
|
| — |
|
|
| 155 |
|
Total assets of the disposal group classified as held for sale on the |
|
| — |
|
|
| 287 |
|
|
|
|
|
|
|
| ||
Liabilities |
|
|
|
|
|
| ||
Trade and other payables |
|
| — |
|
|
| 26 |
|
Long-term debt due within one year |
|
| — |
|
|
| 1 |
|
Long-term debt |
|
| — |
|
|
| 4 |
|
Deferred income taxes and other |
|
| — |
|
|
| 27 |
|
Other liabilities and deferred credits |
|
| — |
|
|
| 5 |
|
Total liabilities of the disposal group classified as held for sale on the |
|
| — |
|
|
| 63 |
|
|
| At |
| |||||
|
| December 31, |
|
| December 31, |
| ||
|
| 2020 |
|
| 2019 |
| ||
|
| $ |
|
| $ |
| ||
Assets |
|
|
|
|
|
|
|
|
Receivables |
|
| 110 |
|
|
| 94 |
|
Inventories |
|
| 138 |
|
|
| 123 |
|
Prepaid expenses |
|
| 3 |
|
|
| 4 |
|
Income and other taxes receivable |
|
| 3 |
|
|
| 6 |
|
Property, plant and equipment, net |
|
| 351 |
|
|
| 344 |
|
Operating lease right-of-use assets |
|
| 15 |
|
|
| 22 |
|
Intangible assets, net (2)(3) |
|
| 554 |
|
|
| 543 |
|
Other assets |
|
| 2 |
|
|
| 2 |
|
Total assets |
|
| 1,176 |
|
|
| 1,138 |
|
Loss on classification as held for sale |
|
| (43 | ) |
|
| — |
|
Total assets of the disposal group classified as held for sale on the Consolidated Balance Sheets (1) |
|
| 1,133 |
|
|
| 1,138 |
|
|
|
|
|
|
|
|
|
|
Liabilities |
|
|
|
|
|
|
|
|
Trade and other payables |
|
| 128 |
|
|
| 125 |
|
Income and other taxes payable |
|
| 12 |
|
|
| 7 |
|
Operating lease liabilities due within one year |
|
| 8 |
|
|
| 10 |
|
Long-term debt |
|
| 1 |
|
|
| 1 |
|
Operating lease liabilities |
|
| 8 |
|
|
| 29 |
|
Deferred income taxes and other |
|
| 130 |
|
|
| 119 |
|
Other liabilities and deferred credits |
|
| 8 |
|
|
| 7 |
|
Total liabilities of the disposal group classified as held for sale on the Consolidated Balance Sheets (1) |
|
| 295 |
|
|
| 298 |
|
|
|
|
|
|
|
64
DOMTAR CORPORATION
NOTES TO CONSOLIDATED FINANCIAL STATEMENTS
DECEMBER 31, 20202022
(IN MILLIONS OF DOLLARS, UNLESS OTHERWISE NOTEDNOTED))
NOTE 3. DISCONTINUED OPERATIONS (CONTINUED)
|
Cash Flows from Discontinued Operations:
|
| Successor |
|
| Predecessor |
| |||||||||||||||||||||||
|
| Year ended December 31, |
|
| Year ended December 31, |
|
| Year ended December 31, |
|
| Year ended December 31, |
|
| Period from |
|
|
| Period from |
|
| Year ended December 31, |
| |||||||
|
| 2020 |
|
| 2019 |
|
| 2018 |
|
| 2022 |
|
| 2021 |
|
|
|
| 2021 |
|
|
| 2020 |
| |||||
|
| $ |
|
| $ |
|
| $ |
|
| $ |
| $ |
|
|
| $ |
| $ |
| |||||||||
Cash flows from operating activities |
|
| 111 |
|
|
| 90 |
|
|
| 58 |
|
|
| 39 |
|
|
| 3 |
|
|
|
| 57 |
|
|
| 130 |
|
Cash flows used for investing activities |
|
| (34 | ) |
|
| (40 | ) |
|
| (29 | ) |
|
| (3 | ) |
|
| (1 | ) |
|
|
| (14 | ) |
|
| (40 | ) |
|
|
|
|
|
|
|
|
|
|
|
|
|
|
|
|
|
|
|
|
|
| ||||||||
65
60
DOMTAR CORPORATION
NOTES TO CONSOLIDATED FINANCIAL STATEMENTS
DECEMBER 31, 20202022
(IN MILLIONS OF DOLLARS, UNLESS OTHERWISE NOTEDNOTED))
NOTE 4.
ACQUISITION OF BUSINESS
PurchaseAcquisition of Appvion Point of Sale businessDomtar Corporation by Paper Excellence
On April 27, 2020, Domtar CorporationNovember 30, 2021, Paper Excellence completed the acquisition of all the outstanding common shares of Domtar Corporation (the “Company”) by means of a merger of Pearl Merger Sub (a wholly-owned subsidiary) with and into the Company with the Company continuing as the surviving corporation and as a subsidiary of Paper Excellence (the “Merger”). On the terms and subject to the conditions set forth in the Merger Agreement, each share of outstanding common stock of the PointCompany was converted into the right to receive $55.50 in cash. The acquisition-date fair value of Sale paper business from Appvion Operation Inc. The business includes the coater and related equipment located at Appvion’s West Carrollton, Ohio, facility as well as a license for all corresponding intellectual property and assumed liabilities relatedconsideration transferred totaled $2.796 billion, less cash acquired of $332 million.
Pearl Merger Sub was determined to post-retirement benefits. The results of this business have been includedbe the accounting acquirer in the consolidated financial statements as of April 27, 2020. The purchase price was $20 million in cash plus the book value of raw materials and finished goods inventory, subject to post-closing adjustments. The acquisitionMerger which was accounted for as a business combination underusing the acquisition method of accounting. The application of the acquisition method of accounting resulted in a new basis of accounting basis of the Company’s assets and liabilities which was measured at fair value at the acquisition date. The total purchase price was allocated to tangible and intangible assets acquired and liabilities assumed based on the Company’s estimates of their fair value, which are based on information currently available.values, and was finalized during the fourth quarter of 2022, upon receipt of a third-party valuation report.
The table below illustratessummarizes the purchase price allocation:allocation, which was finalized in the fourth quarter of 2022:
Fair value of net assets acquired at the date of acquisition |
|
|
|
|
| |
Receivables |
|
|
| $ | 557 |
|
Inventories |
|
|
|
| 597 |
|
Prepaid expenses |
|
|
|
| 50 |
|
Income and other taxes receivable |
|
|
|
| 48 |
|
Property, plant and equipment |
|
|
|
| 2,625 |
|
Intangible assets |
|
|
|
| 24 |
|
Operating lease right-of-use assets |
|
|
|
| 51 |
|
Other assets |
|
|
|
| 264 |
|
Assets held for sale |
|
|
|
| 287 |
|
Total assets |
|
|
|
| 4,503 |
|
|
|
|
|
|
| |
Less: Assumed Liabilities |
|
|
|
|
| |
Trade and other payables |
|
|
|
| 674 |
|
Income and other taxes payable |
|
|
|
| 16 |
|
Operating lease liabilities (including short-term portion) |
|
|
|
| 58 |
|
Long-term debt (including short-term portion) |
|
|
|
| 529 |
|
Deferred income tax liabilities |
|
|
|
| 497 |
|
Other liabilities and deferred credits |
|
|
|
| 221 |
|
Liabilities held for sale |
|
|
|
| 44 |
|
Total liabilities |
|
|
|
| 2,039 |
|
|
|
|
|
|
| |
Fair value of net assets acquired at the date of acquisition |
|
|
|
| 2,464 |
|
| ||||||
|
| |||||
|
| |||||
|
| |||||
|
| |||||
|
| |||||
|
|
The fair value of property, plant and equipment was primarily determined based on management’s estimate of depreciated replacement cost as further adjusted based on estimated cash flow forecasts. The significant assumptions underlying the fair value are based on company specific information and projections, which are not observable in the market and, therefore, are considered Level 2 and Level 3 measurements. These significant assumptions are forward-looking and could be affected by future changes in economic and market conditions.
6661
DOMTAR CORPORATION
NOTES TO CONSOLIDATED FINANCIAL STATEMENTS
DECEMBER 31, 20202022
(IN MILLIONS OF DOLLARS, UNLESS OTHERWISE NOTEDNOTED))
NOTE 4. ACQUISITION OF BUSINESS (CONTINUED)
The fair value of finished goods was calculated as the estimated selling price, adjusted for costs of the selling effort and a reasonable profit allowance relating to the selling effort. The fair value of work in process inventory was primarily calculated as the estimated selling price, adjusted for estimated costs to complete the manufacturing, estimated costs of the selling effort, as well as a reasonable profit margin on the remaining manufacturing and selling effort. The fair value of raw materials and operating and maintenance supplies was determined to approximate the historical carrying value. These significant assumptions are based on company specific information and projections, which are not observable in the market and, therefore, are considered Level 2 and Level 3 measurements. These significant assumptions are forward-looking and could be affected by future changes in economic and market conditions.
For the year ended December 31, 2022, the Company recognized $3 million of acquisition related costs (2021 – $132 million that were expensed in the predecessor period). These costs are included in the Consolidated Statements of Earnings (Loss) and Comprehensive Income (Loss) in the line item entitled Transaction costs.
The Predecessor period includes the historical financial information of Pearl Merger Sub prior to the business combination, which is limited to immaterial amounts of interest and merger-related transactions costs. The businesses, and thus the financial results of the Successor and Predecessor entities, are virtually the same, excluding the impact on certain financial statement line items that were impacted by the Merger mainly:
62
DOMTAR CORPORATION
NOTES TO CONSOLIDATED FINANCIAL STATEMENTS
DECEMBER 31, 2022
(IN MILLIONS OF DOLLARS, UNLESS OTHERWISE NOTED)
NOTE 5.
STOCK-BASED COMPENSATION
OMNIBUS PLANAcquisition of Domtar Corporation by Paper Excellence
UnderPursuant to the terms of the Omnibus Plan, as a result of the acquisition by Paper Excellence, on the Merger date, the Company may award to key employees and non-employee directors, atrecognized an accelerated vesting on all the discretion ofoutstanding stock-based awards under the Human Resources Committee of the Board of Directors, non-qualified stock options, incentive stock options, stock appreciation rights, restricted stock units, performance-conditioned restricted stock units, performance share units, deferred share units (“DSUs”) and other stock-based awards. The non-employee directors only receive DSUs. The Company generally grants awards annually and uses, when available, treasury stock to fulfill awards settled in common stock and option exercises.
PERFORMANCE SHARE UNITS (“PSUs”)
PSUs are granted to Management Committee and non-Management Committee members.Omnibus Plan. These awards will be settledwere then cancelled and converted into the right to receive cash payment, which was made in shares for Management Committee membersDecember 2021. In turn, the Omnibus Plan was terminated and replaced by a new long-term incentive program in cash for non-Management Committee members, based on market conditions and/or performance2022.
For the year ended December 31, 2021, stock-based compensation expense recognized in the predecessor Company’s results from continuing and service conditions. Thesediscontinued operations was $46 million (2020 – $7 million), of which $34 million, related to the accelerated vesting of stock-based awards, have an additional feature wherewas recorded under Transaction costs in the ultimate numberConsolidated Statement of units that vest will be determined by the Company’s performance results or shareholder return in relation to a predetermined target over the vesting period. No awards vest when the minimum thresholds are not achieved. The performance measurement date will vary depending on the specific award. These awards will cliff vest at various dates up to February 18, 2023.Earnings (Loss) and Comprehensive Income (Loss).
|
|
|
|
|
| Weighted |
| |
|
|
|
|
|
| average grant |
| |
PSUs |
| Number of units |
|
| date fair value |
| ||
|
|
|
|
|
| $ |
| |
Vested and non-vested at December 31, 2017 |
|
| 622,468 |
|
|
| 37.78 |
|
Granted |
|
| 238,537 |
|
|
| 41.39 |
|
Forfeited |
|
| (36,932 | ) |
|
| 38.09 |
|
Issued |
|
| 52,563 |
|
|
| 41.05 |
|
Vested and settled |
|
| (154,178 | ) |
|
| 44.22 |
|
Vested and non-vested at December 31, 2018 |
|
| 722,458 |
|
|
| 37.82 |
|
Granted |
|
| 192,261 |
|
|
| 61.46 |
|
Forfeited |
|
| (24,980 | ) |
|
| 45.54 |
|
Cancelled |
|
| (41,399 | ) |
|
| 57.09 |
|
Vested and settled |
|
| (222,019 | ) |
|
| 32.39 |
|
Vested and non-vested at December 31, 2019 |
|
| 626,321 |
|
|
| 45.42 |
|
Granted |
|
| 304,604 |
|
|
| 36.70 |
|
Forfeited |
|
| (27,778 | ) |
|
| 45.25 |
|
Cancelled |
|
| (150,542 | ) |
|
| 45.41 |
|
Vested and settled |
|
| (216,701 | ) |
|
| 39.04 |
|
Vested and non-vested at December 31, 2020 |
|
| 535,904 |
|
|
| 43.06 |
|
6763
DOMTAR CORPORATION
NOTES TO CONSOLIDATED FINANCIAL STATEMENTS
DECEMBER 31, 20202022
(IN MILLIONS OF DOLLARS, UNLESS OTHERWISE NOTED)
NOTE 5. STOCK-BASED COMPENSATION (CONTINUED)
The fair value of PSUs granted in 2020, 2019 and 2018 was estimated at the grant date using the Monte Carlo simulation methodology. The Monte Carlo simulation creates artificial futures by generating numerous sample paths of potential outcomes. The following assumptions were used in calculating the fair value of the units granted:
|
| 2020 |
|
| 2019 |
|
| 2018 |
| |||
Dividend yield |
|
| 5.338 | % |
|
| 3.323 | % |
|
| 3.800 | % |
Expected volatility 1 year |
|
| 32 | % |
|
| 31 | % |
|
| 22 | % |
Expected volatility 3 years |
|
| 29 | % |
|
| 28 | % |
|
| 26 | % |
Risk-free interest rate December 31, 2018 |
|
| — |
|
|
| — |
|
|
| 2.23 | % |
Risk-free interest rate December 31, 2019 |
|
| — |
|
|
| 2.85 | % |
|
| 2.46 | % |
Risk-free interest rate December 31, 2020 |
|
| 1.42 | % |
|
| 2.65 | % |
|
| 2.61 | % |
Risk-free interest rate December 31, 2021 |
|
| 1.26 | % |
|
| 2.56 | % |
|
| — |
|
Risk-free interest rate December 31, 2022 |
|
| 1.21 | % |
|
| — |
|
|
| — |
|
At December 31, 2020, of the total vested and non-vested PSUs, 277,653 are expected to be settled in shares and 258,251 will be settled in cash.
RESTRICTED STOCK UNITS (“RSUs”)
RSUs are granted to Management Committee and non-Management Committee members. These awards will be settled in shares for Management Committee members and in cash for non-Management Committee members, upon completing service conditions. The awards cliff vest after a service period of approximately three years. Additionally, the RSUs are credited with dividend equivalents in the form of additional RSUs when cash dividends are paid on the Company’s stock. The grant date fair value of RSUs is equal to the market value of the Company’s stock on the date the awards are granted.
|
|
|
|
|
| Weighted |
| |
|
|
|
|
|
| average grant |
| |
RSUs |
| Number of units |
|
| date fair value |
| ||
|
|
|
|
|
| $ |
| |
Non-vested at December 31, 2017 |
|
| 460,663 |
|
|
| 38.56 |
|
Granted/issued |
|
| 157,502 |
|
|
| 44.04 |
|
Forfeited |
|
| (27,251 | ) |
|
| 39.91 |
|
Vested and settled |
|
| (135,323 | ) |
|
| 42.54 |
|
Non-vested at December 31, 2018 |
|
| 455,591 |
|
|
| 39.16 |
|
Granted/issued |
|
| 156,417 |
|
|
| 51.07 |
|
Forfeited |
|
| (21,203 | ) |
|
| 42.86 |
|
Vested and settled |
|
| (174,353 | ) |
|
| 34.96 |
|
Non-vested at December 31, 2019 |
|
| 416,452 |
|
|
| 45.20 |
|
Granted/issued |
|
| 231,012 |
|
|
| 33.26 |
|
Forfeited |
|
| (19,521 | ) |
|
| 41.05 |
|
Vested and settled |
|
| (147,753 | ) |
|
| 40.21 |
|
Non-vested at December 31, 2020 |
|
| 480,190 |
|
|
| 41.16 |
|
At December 31, 2020, of the total non-vested RSUs, 229,731 are expected to be settled in shares and 250,459 will be settled in cash.
68
DOMTAR CORPORATION
NOTES TO CONSOLIDATED FINANCIAL STATEMENTS
DECEMBER 31, 2020NOTED)
(IN MILLIONS OF DOLLARS, UNLESS OTHERWISE NOTED)
NOTE 5. STOCK-BASED COMPENSATION (CONTINUED)
DEFERRED SHARE UNITS
DSUs are granted to the Company’s Directors. The DSUs granted to the Directors vest immediately on the grant date. The DSUs are credited with dividend equivalents in the form of additional DSUs when cash dividends are paid on the Company’s stock. For Directors’ DSUs, the Company will deliver at the option of the holder either one share of common stock or the cash equivalent of the fair market value on settlement of each outstanding DSU (including dividend equivalents accumulated) upon termination of service. Directors who attained the share ownership requirements may elect to receive the equity component of their annual retainer in DSUs that may be settled in either cash or stock one year after the grant date. The grant date fair value of DSU awards is equal to the market value of the Company’s stock on the date the awards are granted.
Management Committee members may elect to defer awards earned under another program into DSUs. In 2020, 0 vested awards were deferred to DSUs (2019 – nil; 2018 – nil).
|
|
|
|
|
| Weighted |
| |
|
|
|
|
|
| average grant |
| |
DSUs |
| Number of units |
|
| date fair value |
| ||
|
|
|
|
|
| $ |
| |
Vested at December 31, 2017 |
|
| 272,234 |
|
|
| 29.55 |
|
Granted/issued |
|
| 31,691 |
|
|
| 44.64 |
|
Settled |
|
| (9,752 | ) |
|
| 40.95 |
|
Vested at December 31, 2018 |
|
| 294,173 |
|
|
| 30.79 |
|
Granted/issued |
|
| 35,596 |
|
|
| 41.32 |
|
Settled |
|
| (12,606 | ) |
|
| 43.90 |
|
Vested at December 31, 2019 |
|
| 317,163 |
|
|
| 31.45 |
|
Granted/issued |
|
| 48,943 |
|
|
| 25.11 |
|
Settled |
|
| (10,873 | ) |
|
| 40.96 |
|
Vested at December 31, 2020 |
|
| 355,233 |
|
|
| 30.29 |
|
NON-QUALIFIED STOCK OPTIONS
Stock options are granted to Management Committee and non-Management Committee members. The stock options vest at various dates up to February 20, 2021 subject to service conditions. The options expire at various dates no later than seven years from the date of grant. In 2020 and 2019, 0 stock options were granted.
The fair value of the stock options granted in 2018 was estimated at the grant date using a Black-Scholes based option pricing model or an option pricing model that incorporated the market conditions when applicable. The following assumptions were used in calculating the fair value of the options granted:
|
| 2018 |
|
| |
Dividend yield |
|
| 3.27 | % |
|
Expected volatility |
|
| 29 | % |
|
Risk-free interest rate |
|
| 2.62 | % |
|
Expected life |
| 4.5 years |
|
| |
Strike price |
| $ | 43.66 |
|
|
The grant date fair value of the non-qualified options granted in 2018 was $8.65.
69
DOMTAR CORPORATION
NOTES TO CONSOLIDATED FINANCIAL STATEMENTS
DECEMBER 31, 2020
(IN MILLIONS OF DOLLARS, UNLESS OTHERWISE NOTED)
NOTE 5. STOCK-BASED COMPENSATION (CONTINUED)
|
|
|
|
|
| Weighted average |
|
| Weighted average |
|
| Aggregate intrinsic |
| |||
|
| Number |
|
| exercise |
|
| remaining life |
|
| value |
| ||||
OPTIONS |
| of options |
|
| price |
|
| (in years) |
|
| (in millions) |
| ||||
|
|
|
|
|
| $ |
|
|
|
|
|
| $ |
| ||
Outstanding at December 31, 2017 |
|
| 563,065 |
|
|
| 44.46 |
|
|
| 4.1 |
|
|
| 3.6 |
|
Granted |
|
| 104,086 |
|
|
| 43.66 |
|
|
| 6.2 |
|
|
| — |
|
Exercised |
|
| (147,397 | ) |
|
| 39.42 |
|
|
| — |
|
|
| — |
|
Forfeited/expired |
|
| (6,102 | ) |
|
| 50.05 |
|
|
| — |
|
|
| — |
|
Outstanding at December 31, 2018 |
|
| 513,652 |
|
|
| 45.68 |
|
|
| 3.6 |
|
|
| 0.1 |
|
Exercisable at December 31, 2018 |
|
| 303,055 |
|
|
| 49.15 |
|
|
| 2.3 |
|
|
| — |
|
Outstanding at December 31, 2018 |
|
| 513,652 |
|
|
| 45.68 |
|
|
| 3.6 |
|
|
| 0.1 |
|
Exercised |
|
| (88,682 | ) |
|
| 39.46 |
|
|
| — |
|
|
| — |
|
Forfeited/expired |
|
| (3,616 | ) |
|
| 53.13 |
|
|
| — |
|
|
| — |
|
Outstanding at December 31, 2019 |
|
| 421,354 |
|
|
| 46.92 |
|
|
| 2.5 |
|
|
| 0.1 |
|
Exercisable at December 31, 2019 |
|
| 316,530 |
|
|
| 48.44 |
|
|
| 1.8 |
|
|
| 0.1 |
|
Outstanding at December 31, 2019 |
|
| 421,354 |
|
|
| 46.92 |
|
|
| 2.5 |
|
|
| 0.1 |
|
Forfeited/expired |
|
| (15,030 | ) |
|
| 43.09 |
|
|
| — |
|
|
| — |
|
Outstanding at December 31, 2020 |
|
| 406,324 |
|
|
| 47.07 |
|
|
| 1.6 |
|
|
| — |
|
Exercisable at December 31, 2020 |
|
| 371,622 |
|
|
| 47.38 |
|
|
| 1.4 |
|
|
| — |
|
The total intrinsic value of options exercised in 2019 and 2018 was $1 million and $1 million, respectively. Based on the Company’s closing year-end stock price of $31.65 (2019 – $38.24; 2018 – $35.13), the aggregate intrinsic value of options outstanding and options exercisable is nil.
For the year ended December 31, 2020, stock-based compensation expense recognized in the Company’s results from continuing and discontinued operations was $7 million (2019 – $22 million; 2018 – $10 million) for all outstanding awards. Compensation costs not yet recognized amounted to $15 million (2019 – $16 million; 2018 – $17 million) and will be recognized over the average remaining service period of approximately 14 months. The aggregate value of liability awards settled in 2020 was $6 million (2019 – $12 million; 2018 –$8 million). The total fair value of equity awards settled in 2020 was $6 million (2019 – $11 million; 2018 – $6 million), representing the fair value at the time of settlement. The fair value at the grant date for these settled equity awards was $7 million (2019 – $6 million; 2018 – $7 million). Compensation costs for performance awards are based on management’s best estimate of the final performance measurement.
CLAWBACK FOR FINANCIAL REPORTING MISCONDUCT
If a participant in the Omnibus Plan knowingly or grossly negligently engages in financial reporting misconduct, then all awards and gains from the exercise of options in the 12 months prior to the date the misleading financial statements were issued as well as any awards that vested based on the misleading financial statements will be disgorged to the Company. In addition, the Company may cancel or reduce, or require a participant to forfeit and disgorge to the Company or reimburse the Company for, any awards granted or vested, and bonus granted or paid, and any gains earned or accrued, due to the exercise, vesting or settlement of awards or sale of any common stock, to the extent permitted or required by, or pursuant to any Company policy implemented as required by applicable law, regulation or stock exchange rule as may from time to time be in effect.
70
DOMTAR CORPORATION
NOTES TO CONSOLIDATED FINANCIAL STATEMENTS
DECEMBER 31, 2020
(IN MILLIONS OF DOLLARS, UNLESS OTHERWISE NOTED)
NOTE 6.
EARNINGS (LOSS) PER COMMON SHARE
The calculation of basic (loss) earnings per common share is based on the weighted average number of Domtar common shares outstanding during the year. The calculation for diluted (loss) earnings per common share recognizes the effect of all potential dilutive common securities.
The following table provides the reconciliation between basic and diluted (loss) earnings per common share:
|
| Year ended |
|
| Year ended |
|
| Year ended |
| |||
|
| December 31, |
|
| December 31, |
|
| December 31, |
| |||
|
| 2020 |
|
| 2019 |
|
| 2018 |
| |||
(Loss) earnings from continuing operations |
| $ | (145 | ) |
| $ | 85 |
|
| $ | 281 |
|
Earnings (loss) from discontinued operations, net of taxes |
| $ | 18 |
|
| $ | (1 | ) |
| $ | 2 |
|
Net (loss) earnings |
| $ | (127 | ) |
| $ | 84 |
|
| $ | 283 |
|
|
|
|
|
|
|
|
|
|
|
|
|
|
Weighted average number of common shares outstanding (millions) |
|
| 55.4 |
|
|
| 61.2 |
|
|
| 62.9 |
|
Effect of dilutive securities (millions) |
|
| — |
|
|
| 0.2 |
|
|
| 0.2 |
|
Weighted average number of diluted common shares outstanding (millions) |
|
| 55.4 |
|
|
| 61.4 |
|
|
| 63.1 |
|
|
|
|
|
|
|
|
|
|
|
|
|
|
Basic net (loss) earnings per common share (in dollars) |
|
|
|
|
|
|
|
|
|
|
|
|
(Loss) earnings from continuing operations |
| $ | (2.62 | ) |
| $ | 1.39 |
|
| $ | 4.47 |
|
Earnings (loss) from discontinued operations |
| $ | 0.33 |
|
| $ | (0.02 | ) |
| $ | 0.03 |
|
Basic net (loss) earnings per common share |
| $ | (2.29 | ) |
| $ | 1.37 |
|
| $ | 4.50 |
|
|
|
|
|
|
|
|
|
|
|
|
|
|
Diluted net (loss) earnings per common share (in dollars) |
|
|
|
|
|
|
|
|
|
|
|
|
(Loss) earnings from continuing operations |
| $ | (2.62 | ) |
| $ | 1.39 |
|
| $ | 4.45 |
|
Earnings (loss) from discontinued operations |
| $ | 0.33 |
|
| $ | (0.02 | ) |
| $ | 0.03 |
|
Diluted net (loss) earnings per common share |
| $ | (2.29 | ) |
| $ | 1.37 |
|
| $ | 4.48 |
|
The following table provides the securities that could potentially dilute basic (loss) earnings per common share in the future, but were not included in the computation of diluted (loss) earnings per common share because to do so would have been anti-dilutive:
|
| December 31, |
|
| December 31, |
|
| December 31, |
| |||
|
| 2020 |
|
| 2019 |
|
| 2018 |
| |||
Options to purchase common shares |
|
| 406,324 |
|
|
| 324,413 |
|
|
| 227,221 |
|
71
DOMTAR CORPORATION
NOTES TO CONSOLIDATED FINANCIAL STATEMENTS
DECEMBER 31, 2020
(IN MILLIONS OF DOLLARS, UNLESS OTHERWISE NOTED)
NOTE 6.
NOTE 7.
PENSION PLANS AND OTHER POST-RETIREMENT BENEFIT PLANS
DEFINED CONTRIBUTION PLANS
The Company has several defined contribution plans and multiemployer plans. The pension expense under these plans is equal to the Company’s contribution. For the year ended December 31, 2020,2022, the related pension expense was $39$35 million (2019(2021 – $39 million; 2018$3 million and $30 million for the 1 month ended December 31 and the 11 months ended November 30, respectively; 2020 – $46$37 million).
DEFINED BENEFIT PLANS AND OTHER POST-RETIREMENT BENEFIT PLANS
The Company sponsors both contributory and non-contributory U.S. and non-U.S. defined benefit pension plans. Non-unionized employees in Canada joining the Company after January 1, 1998 participate in a defined contribution pension plan. Salaried employees in the U.S. joining the Company after January 1, 2008 participate in a defined contribution pension plan. Unionized and non-union hourly employees in the U.S. that are not grandfathered under the existing defined benefit pension plans, participate in a defined contribution pension plan for future service. The Company also sponsors a number of other post-retirement benefit plans for eligible U.S. and non-U.S. employees; the plans are unfunded and include life insurance programs and medical and dental benefits. The Company also provides supplemental unfunded defined benefit pension plans and supplemental unfunded defined contribution pension plans to certain senior management employees.
Related pension and other post-retirement plan expenses and the corresponding obligations are actuarially determined using management’s most probable assumptions.
The Company’s pension plan funding policy is to contribute annually the amount required to provide for benefits earned in the year and to fund solvency deficiencies, funding shortfalls and past service obligations over periods not exceeding those permitted by the applicable regulatory authorities. Past service obligations primarily arise from improvements to plan benefits. The other post-retirement benefit plans are not funded, and contributions are made annually to cover benefit payments.
The Company expects to contribute a minimum total amount of $13$4 million in 20212023 compared to $15$7 million in 2022 (2021 – $17 million; 2020 (2019 – $17 million; 2018 – $57$15 million) to the pension plans. The Company expects to contribute a minimum total amount of $4$4 million in 20212023 compared to $4$4 million in 2022 (2021 – $4 million; 2020 (2019 – $4 million; 2018 – $4$4 million) to the other post-retirement benefit plans.
7264
DOMTAR CORPORATION
NOTES TO CONSOLIDATED FINANCIAL STATEMENTS
DECEMBER 31, 20202022
(IN MILLIONS OF DOLLARS, UNLESS OTHERWISE NOTEDNOTED))
NOTE 7.6. PENSION PLANS AND OTHER POST-RETIREMENT BENEFIT PLANS (CONTINUED)
CHANGE IN PROJECTED BENEFIT OBLIGATION
The following table represents the change in the projected benefit obligation as of December 31, 20202022 and December 31, 2019,2021, the measurement date for each year:
|
| Successor |
| |||||||||||||||||||||||||||||
|
| December 31, 2020 |
|
| December 31, 2019 |
|
| December 31, 2022 |
|
| December 31, 2021 |
| ||||||||||||||||||||
|
|
|
|
|
|
|
|
|
|
|
|
|
|
|
|
|
|
|
|
|
|
|
|
|
|
|
|
| ||||
|
| Pension |
|
| Other post-retirement |
|
| Pension |
|
| Other post-retirement |
|
| Pension |
| Other post-retirement |
| Pension |
| Other post-retirement |
| |||||||||||
|
| plans |
|
| benefit plans |
|
| plans |
|
| benefit plans |
|
| plans |
| benefit plans |
| plans |
| benefit plans |
| |||||||||||
|
| $ |
|
| $ |
|
| $ |
|
| $ |
|
| $ |
|
| $ |
|
| $ |
|
| $ |
| ||||||||
Projected benefit obligation at beginning of year |
|
| 1,425 |
|
|
| 63 |
|
|
| 1,557 |
|
|
| 62 |
|
|
| 1,433 |
|
|
| 60 |
|
|
| 1,566 |
|
|
| 67 |
|
Service cost for the year |
|
| 29 |
|
|
| 1 |
|
|
| 29 |
|
|
| 1 |
|
|
| 21 |
|
|
| 1 |
|
|
| 28 |
|
|
| 1 |
|
Interest expense |
|
| 39 |
|
|
| 2 |
|
|
| 57 |
|
|
| 2 |
|
|
| 31 |
|
|
| 2 |
|
|
| 34 |
|
|
| 2 |
|
Plan participants' contributions |
|
| 6 |
|
|
| — |
|
|
| 6 |
|
|
| — |
|
|
| 6 |
|
|
| — |
|
|
| 6 |
|
|
| — |
|
Actuarial loss (gain) |
|
| 127 |
|
|
| 2 |
|
|
| 170 |
|
|
| (1 | ) | ||||||||||||||||
Actuarial gain |
|
| (251 | ) |
|
| (12 | ) |
|
| (104 | ) |
|
| (6 | ) | ||||||||||||||||
Plan amendments |
|
| 2 |
|
|
| — |
|
|
| — |
|
|
| — |
|
|
| — |
|
|
| — |
|
|
| 6 |
|
|
| — |
|
Benefits paid |
|
| (67 | ) |
|
| — |
|
|
| (96 | ) |
|
| — |
|
|
| (53 | ) |
|
| (1 | ) |
|
| (65 | ) |
|
| (1 | ) |
Direct benefit payments |
|
| (3 | ) |
|
| (4 | ) |
|
| (4 | ) |
|
| (4 | ) |
|
| (3 | ) |
|
| (3 | ) |
|
| (9 | ) |
|
| (3 | ) |
Acquisition of business |
|
| — |
|
|
| 1 |
|
|
| — |
|
|
| — |
| ||||||||||||||||
Curtailment (1) |
|
| (1 | ) |
|
| — |
|
|
| — |
|
|
| — |
| ||||||||||||||||
Settlement (2) |
|
| (15 | ) |
|
| — |
|
|
| (348 | ) |
|
| — |
| ||||||||||||||||
Curtailment |
|
| (1 | ) |
|
| — |
|
|
| — |
|
|
| — |
| ||||||||||||||||
Settlement (1) |
|
| (356 | ) |
|
| (5 | ) |
|
| (35 | ) |
|
| — |
| ||||||||||||||||
Effect of foreign currency exchange rate change |
|
| 24 |
|
|
| 2 |
|
|
| 54 |
|
|
| 3 |
|
|
| (45 | ) |
|
| (3 | ) |
|
| 6 |
|
|
| — |
|
Projected benefit obligation at end of year |
|
| 1,566 |
|
|
| 67 |
|
|
| 1,425 |
|
|
| 63 |
|
|
| 782 |
|
|
| 39 |
|
|
| 1,433 |
|
|
| 60 |
|
During 20202022 and 2019,2021, net actuarial losses increasedgains decreased the projected benefit obligation due to the decreaseincrease in discount rates.
The accumulated benefit obligation of the pension plans at December 31, 20202022 and 20192021 was $1,516$760 million and $1,379$1,386 million, respectively.
65
DOMTAR CORPORATION
NOTES TO CONSOLIDATED FINANCIAL STATEMENTS
DECEMBER 31, 2022
(IN MILLIONS OF DOLLARS, UNLESS OTHERWISE NOTED)
NOTE 6. PENSION PLANS AND OTHER POST-RETIREMENT BENEFIT PLANS (CONTINUED)
CHANGE IN FAIR VALUE OF ASSETS
The following table represents the change in the fair value of assets, as of December 31, 20202022 and December 31, 2019,2021, reflecting the actual return on plan assets, the contributions and the benefits paid for each year:
|
| December 31, 2020 |
|
| December 31, 2019 |
| ||
|
| Pension plans |
|
| Pension plans |
| ||
|
| $ |
|
| $ |
| ||
Fair value of assets at beginning of year |
|
| 1,465 |
|
|
| 1,579 |
|
Actual return on plan assets |
|
| 166 |
|
|
| 253 |
|
Employer contributions |
|
| 15 |
|
|
| 17 |
|
Plan participants' contributions |
|
| 6 |
|
|
| 6 |
|
Benefits paid |
|
| (70 | ) |
|
| (100 | ) |
Settlement (2) |
|
| (15 | ) |
|
| (348 | ) |
Effect of foreign currency exchange rate change |
|
| 27 |
|
|
| 58 |
|
Fair value of assets at end of year |
|
| 1,594 |
|
|
| 1,465 |
|
|
|
|
|
73
DOMTAR CORPORATION
NOTES TO CONSOLIDATED FINANCIAL STATEMENTS
DECEMBER 31, 2020
(IN MILLIONS OF DOLLARS, UNLESS OTHERWISE NOTED)
|
| Successor |
| |||||
|
| December 31, 2022 |
|
| December 31, 2021 |
| ||
|
| Pension plans |
|
| Pension plans |
| ||
|
| $ |
|
| $ |
| ||
Fair value of assets at beginning of year |
|
| 1,622 |
|
|
| 1,594 |
|
Actual return on plan assets |
|
| (207 | ) |
|
| 106 |
|
Employer contributions |
|
| 7 |
|
|
| 17 |
|
Plan participants' contributions |
|
| 6 |
|
|
| 6 |
|
Benefits paid |
|
| (56 | ) |
|
| (74 | ) |
Settlement (1) |
|
| (354 | ) |
|
| (35 | ) |
Effect of foreign currency exchange rate change |
|
| (56 | ) |
|
| 8 |
|
Fair value of assets at end of year |
|
| 962 |
|
|
| 1,622 |
|
NOTE 7. PENSION PLANS AND OTHER POST-RETIREMENT BENEFIT PLANS (CONTINUED)
|
|
INVESTMENT POLICIES AND STRATEGIES OF THE PLAN ASSETS
The assets of the pension plans are held by a number of independent trustees and are accounted for separately in the Company’s pension funds. The investment strategy for the assets in the pension plans is to maintain a diversified portfolio of assets, invested in a prudent manner to maintain the security of funds while maximizing returns within the guidelines provided in the investment policy. Diversification of the pension plans’ holdings is maintained in order to reduce the pension plans’ annual return variability, reduce market and credit exposure to any single asset and to any single component of the capital markets, reduce exposure to unexpected inflation, enhance the long-term risk-adjusted return potential of the pension plans and reduce funding risk.
Over the long-term, the performance of the pension plans is primarily determined by the long-term asset mix decisions. To manage the long-term risk of not having sufficient funds to match the obligations of the pension plans, the Company conducts asset/liability studies. These studies lead to the recommendation and adoption of a long-term asset mix target that sets the expected rate of return and reduces the risk of adverse consequences to the plans from increases in liabilities and decreases in assets. In identifying the asset mix target that would best meet the investment objectives, consideration is given to various factors, including (a) each plan’s characteristics, (b) the duration of each plan’s liabilities, (c) the solvency and going concern financial position of each plan and their sensitivity to changes in interest rates and inflation, and (d) the long-term return and risk expectations for key asset classes.
The investments of each plan can be done directly through cash investments in equities, bonds or bondsalternative investment asset classes or indirectly through derivatives, pooled funds or pooled funds.private placements. The use of derivatives must be in accordance with an approved mandate and cannot be used for speculative purposes.
The Company’s pension funds are not permitted to directly own any of the Company’s shares or debt instruments.
66
DOMTAR CORPORATION
NOTES TO CONSOLIDATED FINANCIAL STATEMENTS
DECEMBER 31, 2022
(IN MILLIONS OF DOLLARS, UNLESS OTHERWISE NOTED)
NOTE 6. PENSION PLANS AND OTHER POST-RETIREMENT BENEFIT PLANS (CONTINUED)
The following table shows the allocation of the plan assets, based on the fair value of the assets held and the target allocation for 2020:
|
|
|
|
|
| Percentage of |
|
| Percentage of |
| ||
|
|
|
|
|
| plan assets at |
|
| plan assets at |
| ||
|
|
|
|
|
| December 31, |
|
| December 31, |
| ||
|
| Target allocation |
|
| 2020 |
|
| 2019 |
| |||
Fixed income |
|
|
|
|
|
|
|
|
|
|
|
|
Cash and cash equivalents |
| 0% – 10% |
|
|
| 2 | % |
|
| 2 | % | |
Bonds |
| 40% – 50% |
|
|
| 42 | % |
|
| 53 | % | |
Insurance contracts |
| 11% |
|
|
| 11 | % |
|
| — |
| |
Equity |
|
|
|
|
|
|
|
|
|
|
|
|
Canadian Equity |
| 3% – 10% |
|
|
| 6 | % |
|
| 6 | % | |
U.S. Equity |
| 9% – 19% |
|
|
| 15 | % |
|
| 15 | % | |
International Equity |
| 18% – 28% |
|
|
| 24 | % |
|
| 24 | % | |
Total (1) |
|
|
|
|
|
| 100 | % |
|
| 100 | % |
|
|
74
DOMTAR CORPORATION
NOTES TO CONSOLIDATED FINANCIAL STATEMENTS
DECEMBER 31, 20202022:
(IN MILLIONS OF DOLLARS, UNLESS OTHERWISE NOTED)
|
|
|
| Successor |
| |||||
|
|
|
| Percentage of |
|
| Percentage of |
| ||
|
|
|
| plan assets at |
|
| plan assets at |
| ||
|
|
|
| December 31, |
|
| December 31, |
| ||
|
| Target allocation |
| 2022 |
|
| 2021 |
| ||
Fixed income |
|
|
|
|
|
|
|
| ||
Cash and cash equivalents |
| 0% – 10% |
|
| 2 | % |
|
| 8 | % |
Bonds |
| 35% – 64% |
|
| 43 | % |
|
| 40 | % |
Insurance contracts |
| 0% |
|
| 0 | % |
|
| 10 | % |
Equity |
|
|
|
|
|
|
|
| ||
Canadian Equity |
| 0% – 11% |
|
| 4 | % |
|
| 6 | % |
U.S. Equity |
| 5% – 16% |
|
| 9 | % |
|
| 12 | % |
International Equity |
| 13% – 24% |
|
| 17 | % |
|
| 19 | % |
Alternate Investments |
|
|
|
|
|
|
|
| ||
Real Estate |
| 0% – 18% |
|
| 13 | % |
|
| 5 | % |
Multi-Asset Credit |
| 0% – 10% |
|
| 6 | % |
|
| 0 | % |
Infrastructure |
| 0% – 9% |
|
| 6 | % |
|
| 0 | % |
Total (1) |
|
|
|
| 100 | % |
|
| 100 | % |
NOTE 7. PENSION PLANS AND OTHER POST-RETIREMENT BENEFIT PLANS (CONTINUED)
RECONCILIATION OF FUNDED STATUS TO AMOUNTS RECOGNIZED IN THE CONSOLIDATED BALANCE SHEETS
The following table presents the difference between the fair value of assets and the actuarially determined projected benefit obligation. This difference is also referred to as either the deficit or surplus, as the case may be, or the funded status of the plans. The table further reconciles the amount of the surplus or deficit (funded status) to the net amount recognized in the Consolidated Balance Sheets.
|
| Successor |
| |||||||||||||
|
| December 31, 2022 |
|
| December 31, 2021 |
| ||||||||||
|
|
|
|
|
|
|
|
|
|
|
|
| ||||
|
| Pension |
|
| Other post-retirement |
|
| Pension |
|
| Other post-retirement |
| ||||
|
| plans |
|
| benefit plans |
|
| plans |
|
| benefit plans |
| ||||
|
| $ |
|
| $ |
|
| $ |
|
| $ |
| ||||
Projected benefit obligation at end of year |
|
| (782 | ) |
|
| (39 | ) |
|
| (1,433 | ) |
|
| (60 | ) |
Fair value of assets at end of year |
|
| 962 |
|
|
| — |
|
|
| 1,622 |
|
|
| — |
|
Funded status |
|
| 180 |
|
|
| (39 | ) |
|
| 189 |
|
|
| (60 | ) |
|
| December 31, 2020 |
|
| December 31, 2019 |
| ||||||||||
|
|
|
|
|
|
|
|
|
|
|
|
|
|
|
|
|
|
| Pension |
|
| Other post-retirement |
|
| Pension |
|
| Other post-retirement |
| ||||
|
| plans |
|
| benefit plans |
|
| plans |
|
| benefit plans |
| ||||
|
| $ |
|
| $ |
|
| $ |
|
| $ |
| ||||
Projected benefit obligation at end of year |
|
| (1,566 | ) |
|
| (67 | ) |
|
| (1,425 | ) |
|
| (63 | ) |
Fair value of assets at end of year |
|
| 1,594 |
|
|
| — |
|
|
| 1,465 |
|
|
| — |
|
Funded status |
|
| 28 |
|
|
| (67 | ) |
|
| 40 |
|
|
| (63 | ) |
|
| Successor |
| |||||||||||||
|
| December 31, 2022 |
|
| December 31, 2021 |
| ||||||||||
|
|
|
|
|
|
|
|
|
|
|
|
| ||||
|
| Pension |
|
| Other post-retirement |
|
| Pension |
|
| Other post-retirement |
| ||||
|
| plans |
|
| benefit plans |
|
| plans |
|
| benefit plans |
| ||||
|
| $ |
|
| $ |
|
| $ |
|
| $ |
| ||||
Trade and other payables |
|
| — |
|
|
| (5 | ) |
|
| — |
|
|
| (5 | ) |
Other liabilities and deferred credits |
|
| (39 | ) |
|
| (34 | ) |
|
| (59 | ) |
|
| (55 | ) |
Other assets |
|
| 219 |
|
|
| — |
|
|
| 248 |
|
|
| — |
|
Net amount recognized in the Consolidated |
|
| 180 |
|
|
| (39 | ) |
|
| 189 |
|
|
| (60 | ) |
67
DOMTAR CORPORATION
NOTES TO CONSOLIDATED FINANCIAL STATEMENTS
DECEMBER 31, 2022
(IN MILLIONS OF DOLLARS, UNLESS OTHERWISE NOTED)
NOTE 6. PENSION PLANS AND OTHER POST-RETIREMENT BENEFIT PLANS (CONTINUED)
The funded status includes $61 million of projected benefit obligation ($55 million at December 31, 2019) related to supplemental unfunded defined benefit and defined contribution plans.
|
| December 31, 2020 |
|
| December 31, 2019 |
| ||||||||||
|
|
|
|
|
|
|
|
|
|
|
|
|
|
|
|
|
|
| Pension |
|
| Other post-retirement |
|
| Pension |
|
| Other post-retirement |
| ||||
|
| plans |
|
| benefit plans |
|
| plans |
|
| benefit plans |
| ||||
|
| $ |
|
| $ |
|
| $ |
|
| $ |
| ||||
Trade and other payables (Note 17) |
|
| — |
|
|
| (5 | ) |
|
| — |
|
|
| (5 | ) |
Other liabilities and deferred credits (Note 20) |
|
| (124 | ) |
|
| (62 | ) |
|
| (101 | ) |
|
| (58 | ) |
Other assets (Note 15) |
|
| 152 |
|
|
| — |
|
|
| 141 |
|
|
| — |
|
Net amount recognized in the Consolidated Balance Sheets |
|
| 28 |
|
|
| (67 | ) |
|
| 40 |
|
|
| (63 | ) |
The following table presents the pre-tax amounts included in Other comprehensive income (loss):
|
| Year ended |
|
| Year ended |
|
| Year ended |
| |||||||||||||||
|
| December 31, 2020 |
|
| December 31, 2019 |
|
| December 31, 2018 |
| |||||||||||||||
|
|
|
|
|
| Other post- |
|
|
|
|
|
| Other post- |
|
|
|
|
|
| Other post- |
| |||
|
| Pension |
|
| retirement |
|
| Pension |
|
| retirement |
|
| Pension |
|
| retirement |
| ||||||
|
| plans |
|
| benefit plans |
|
| plans |
|
| benefit plans |
|
| plans |
|
| benefit plans |
| ||||||
|
| $ |
|
| $ |
|
| $ |
|
| $ |
|
| $ |
|
| $ |
| ||||||
Prior service cost |
|
| (2 | ) |
|
| — |
|
|
| — |
|
|
| — |
|
|
| — |
|
|
| — |
|
Amortization of prior year service cost (credit) |
|
| 2 |
|
|
| (1 | ) |
|
| 5 |
|
|
| (1 | ) |
|
| 5 |
|
|
| — |
|
Net (loss) gain |
|
| (26 | ) |
|
| (1 | ) |
|
| 3 |
|
|
| 1 |
|
|
| (31 | ) |
|
| 8 |
|
Amortization of net actuarial loss (gain) (1) |
|
| 12 |
|
|
| (1 | ) |
|
| 40 |
|
|
| (1 | ) |
|
| 8 |
|
|
| (1 | ) |
Net amount recognized in other comprehensive income (loss) (pre-tax) |
|
| (14 | ) |
|
| (3 | ) |
|
| 48 |
|
|
| (1 | ) |
|
| (18 | ) |
|
| 7 |
|
|
|
75
DOMTAR CORPORATION
NOTES TO CONSOLIDATED FINANCIAL STATEMENTS
DECEMBER 31, 2020 income:
(IN MILLIONS OF DOLLARS, UNLESS OTHERWISE NOTED)
|
| Successor |
|
|
| Predecessor |
| ||||||||||||||||||||||||||
|
| Year ended |
|
| Period from |
|
|
| Period from |
|
| Year ended |
| ||||||||||||||||||||
|
| 2022 |
|
| 2021 |
|
|
| 2021 |
|
| 2020 |
| ||||||||||||||||||||
|
|
|
|
| Other post- |
|
|
|
|
| Other post- |
|
|
|
|
|
| Other post- |
|
|
|
|
| Other post- |
| ||||||||
|
| Pension |
|
| retirement |
|
| Pension |
|
| retirement |
|
|
| Pension |
|
| retirement |
|
| Pension |
|
| retirement |
| ||||||||
|
| plans |
|
| benefit plans |
|
| plans |
|
| benefit plans |
|
|
| plans |
|
| benefit plans |
|
| plans |
|
| benefit plans |
| ||||||||
|
| $ |
|
| $ |
|
| $ |
|
| $ |
|
|
| $ |
|
| $ |
|
| $ |
|
| $ |
| ||||||||
Prior service (cost) credit |
|
| — |
|
|
| — |
|
|
| — |
|
|
| — |
|
|
|
| (6 | ) |
|
| 1 |
|
|
| (2 | ) |
|
| — |
|
Effect of settlement |
|
| 2 |
|
|
| — |
|
|
| — |
|
|
| — |
|
|
|
| — |
|
|
| — |
|
|
| — |
|
|
| — |
|
Amortization of prior year service |
|
| — |
|
|
| — |
|
|
| — |
|
|
| — |
|
|
|
| 1 |
|
|
| (1 | ) |
|
| 2 |
|
|
| (1 | ) |
Net (loss) gain |
|
| (19 | ) |
|
| 12 |
|
|
| 22 |
|
|
| (1 | ) |
|
|
| 121 |
|
|
| 7 |
|
|
| (26 | ) |
|
| (1 | ) |
Amortization of net actuarial (gain) |
|
| (9 | ) |
|
| — |
|
|
| — |
|
|
| — |
|
|
|
| 7 |
|
|
| (1 | ) |
|
| 12 |
|
|
| (1 | ) |
Net amount recognized in other |
|
| (26 | ) |
|
| 12 |
|
|
| 22 |
|
|
| (1 | ) |
|
|
| 123 |
|
|
| 6 |
|
|
| (14 | ) |
|
| (3 | ) |
NOTE 7. PENSION PLANS AND OTHER POST-RETIREMENT BENEFIT PLANS (CONTINUED)
At December 31, 2020,2022, the projected benefit obligation and the fair value of plan assets with a projected benefit obligation in excess of fair value of plan assets were $917$44 million and $793$5 million, respectively (2019(2021 – $833$318 million and $732$259 million, respectively).
|
| Year ended |
|
| Year ended |
|
| Year ended |
|
| Successor |
|
| Predecessor |
| ||||||||||||||
|
| December 31, |
|
| December 31, |
|
| December 31, |
|
| Year ended |
|
| Period from |
|
|
| Period from |
| Year ended |
| ||||||||
Components of net periodic benefit cost for pension plans |
| 2020 |
|
| 2019 |
|
| 2018 |
|
| 2022 |
|
| 2021 |
|
|
| 2021 |
|
| 2020 |
| |||||||
|
| $ |
|
| $ |
|
| $ |
|
| $ |
| $ |
|
|
| $ |
| $ |
| |||||||||
Service cost for the year |
|
| 29 |
|
|
| 29 |
|
|
| 34 |
|
|
| 21 |
|
|
| 2 |
|
|
|
| 25 |
|
|
| 28 |
|
Interest expense |
|
| 39 |
|
|
| 57 |
|
|
| 53 |
|
|
| 31 |
|
|
| 3 |
|
|
|
| 31 |
|
|
| 39 |
|
Expected return on plan assets |
|
| (68 | ) |
|
| (79 | ) |
|
| (85 | ) |
|
| (64 | ) |
|
| (5 | ) |
|
|
| (61 | ) |
|
| (68 | ) |
Amortization of net actuarial loss |
|
| 10 |
|
|
| 10 |
|
|
| 8 |
|
|
| — |
|
|
| — |
|
|
|
| 7 |
|
|
| 10 |
|
Curtailment loss |
|
| 2 |
|
|
| — |
|
|
| — |
|
|
| — |
|
|
| — |
|
|
|
| — |
|
|
| 2 |
|
Settlement loss |
|
| 2 |
|
|
| 30 |
|
|
| — |
| |||||||||||||||||
Settlement (gain) loss |
|
| (9 | ) |
|
| — |
|
|
|
| — |
|
|
| 2 |
| ||||||||||||
Amortization of prior year service cost |
|
| 2 |
|
|
| 5 |
|
|
| 5 |
|
|
| — |
|
|
| — |
|
|
|
| 1 |
|
|
| 2 |
|
Net periodic benefit cost |
|
| 16 |
|
|
| 52 |
|
|
| 15 |
|
|
| (21 | ) |
|
| — |
|
|
|
| 3 |
|
|
| 15 |
|
68
DOMTAR CORPORATION
NOTES TO CONSOLIDATED FINANCIAL STATEMENTS
DECEMBER 31, 2022
(IN MILLIONS OF DOLLARS, UNLESS OTHERWISE NOTED)
NOTE 6. PENSION PLANS AND OTHER POST-RETIREMENT BENEFIT PLANS (CONTINUED)
|
| Successor |
|
|
| Predecessor |
| ||||||||||
Components of net periodic benefit cost for other post-retirement |
| Year ended |
|
| Period from |
|
|
| Period from |
|
| Year ended |
| ||||
benefit plans |
| 2022 |
|
| 2021 |
|
|
| 2021 |
|
| 2020 |
| ||||
|
| $ |
|
| $ |
|
|
| $ |
|
| $ |
| ||||
Service cost for the year |
|
| 1 |
|
|
| — |
|
|
|
| 1 |
|
|
| 1 |
|
Interest expense |
|
| 2 |
|
|
| — |
|
|
|
| 2 |
|
|
| 2 |
|
Amortization of net actuarial gain |
|
| — |
|
|
| — |
|
|
|
| (1 | ) |
|
| (1 | ) |
Amortization of prior year service credit |
|
| — |
|
|
| — |
|
|
|
| (1 | ) |
|
| (1 | ) |
Net periodic benefit cost |
|
| 3 |
|
|
| — |
|
|
|
| 1 |
|
|
| 1 |
|
|
|
|
|
|
|
|
|
|
|
|
|
|
Components of net periodic benefit cost for other post-retirement |
| Year ended December 31, |
|
| Year ended December 31, |
|
| Year ended December 31, |
| |||
benefit plans |
| 2020 |
|
| 2019 |
|
| 2018 |
| |||
|
| $ |
|
| $ |
|
| $ |
| |||
Service cost for the year |
|
| 1 |
|
|
| 1 |
|
|
| 1 |
|
Interest expense |
|
| 2 |
|
|
| 2 |
|
|
| 2 |
|
Amortization of net actuarial gain |
|
| (1 | ) |
|
| (1 | ) |
|
| (1 | ) |
Amortization of prior year service credit |
|
| (1 | ) |
|
| (1 | ) |
|
| — |
|
Net periodic benefit cost |
|
| 1 |
|
|
| 1 |
|
|
| 2 |
|
WEIGHTED-AVERAGE ASSUMPTIONS
The Company used the following key assumptions to measure the projected benefit obligation and the net periodic benefit cost. These assumptions are long-term, which is consistent with the nature of employee future benefits.
|
| Successor |
|
| Predecessor |
| |||||||||||||||||||||||
|
| December 31, |
|
| December 31, |
|
| December 31, |
|
| December 31, |
| December 31, |
|
|
| November 30, |
| December 31, |
| |||||||||
Pension plans |
| 2020 |
|
| 2019 |
|
| 2018 |
|
| 2022 |
|
| 2021 |
|
|
| 2021 |
|
| 2020 |
| |||||||
Projected benefit obligation |
|
|
|
|
|
|
|
|
|
|
|
|
|
|
|
|
|
|
|
|
|
|
| ||||||
Discount rate |
|
| 2.5 | % |
|
| 3.1 | % |
|
| 3.8 | % |
|
| 5.3 | % |
|
| 3.0 | % |
|
| N/A |
|
| 2.5 | % | ||
Rate of compensation increase |
|
| 2.7 | % |
|
| 2.7 | % |
|
| 2.7 | % |
|
| 3.1 | % |
|
| 2.7 | % |
|
| N/A |
|
| 2.7 | % | ||
Net periodic benefit cost |
|
|
|
|
|
|
|
|
|
|
|
|
|
|
|
|
|
|
|
|
|
|
| ||||||
Discount rate |
|
| 3.0 | % |
|
| 3.8 | % |
|
| 3.5 | % |
|
| 3.8 | % |
|
| 3.0 | % |
|
|
| 2.5 | % |
|
| 3.0 | % |
Rate of compensation increase |
|
| 2.8 | % |
|
| 2.6 | % |
|
| 2.8 | % |
|
| 2.8 | % |
|
| 2.8 | % |
|
|
| 2.7 | % |
|
| 2.8 | % |
Expected long-term rate of return on plan assets |
|
| 4.6 | % |
|
| 5.2 | % |
|
| 5.0 | % |
|
| 5.0 | % |
|
| 4.3 | % |
|
|
| 4.3 | % |
|
| 4.6 | % |
A weighted-average interest-crediting rate of 3.3%3.8% was assumed for 2020,2022, for the Company’s cash balance pension plan.
The Company used a full yield curve approach to estimate the current service and interest cost components of net periodic benefit cost for Canadian pension plans and U.S. funded pension plans. The estimate of these components is made by applying the specific spot rates along the yield curve used in the determination of the benefit obligation to the relevant projected cash flows.
76
DOMTAR CORPORATION
NOTES TO CONSOLIDATED FINANCIAL STATEMENTS
DECEMBER 31, 2020
(IN MILLIONS OF DOLLARS, UNLESS OTHERWISE NOTED)
NOTE 7. PENSION PLANS AND OTHER POST-RETIREMENT BENEFIT PLANS (CONTINUED)
For the U.S. unfunded pension plan and other post-retirement benefits, given materiality, the current service and interest cost components were estimated using a single weighted-average discount rate derived from the yield curve for each unfunded pension plan or based on each post-retirement plans’ projected cash flows. The discount rate of 3.2%5.2% for U.S. unfunded plans is obtained by incorporating the plans’ expected cash flows in the Mercer Yield Curve.
For Canadian plans, short-term yields to maturity are derived from actual AA rated corporate bond yield data. For longer terms, extrapolated data is used. The extrapolated data are created by adding a term-based spread over long provincial bond yields. For U.S. funded plans, the rates are taken from the Mercer Yield Curve which is based on bonds rated AA by Moody’s or Standard & Poor’s, excluding callable bonds, bonds of less than a minimum issue size, and certain other bonds. The universe of bonds also includes private placement (traded in reliance on Rule 144A and which are at least two years from issuance), make whole, and foreign corporation (denominated in U.S. dollars) bonds.
69
DOMTAR CORPORATION
NOTES TO CONSOLIDATED FINANCIAL STATEMENTS
DECEMBER 31, 2022
(IN MILLIONS OF DOLLARS, UNLESS OTHERWISE NOTED)
NOTE 6. PENSION PLANS AND OTHER POST-RETIREMENT BENEFIT PLANS (CONTINUED)
Effective January 1, 2021,2023, the Company will use 4.4% (20205.9% (2022 – 4.8%4.8%; 20192021 – 5.2%4.4%) as the expected return on plan assets, which reflects the current view of long-term investment returns. The overall expected long-term rate of return on plan assets is based on management's best estimate of the long-term returns of the major asset classes (cash and cash equivalents, equities, bonds and bonds)various alternative investment asset classes) weighted by the target allocation of assets at the measurement date, net of expenses. This rate includes an equity risk premium over government bond returns for equity investments and a value-added premium for the contribution to returns from active management. The sources used to determine management's best estimate of long-term returns are numerous and include country specific bond yields, which may be derived from the market using local bond indices or by analysis of the local bond market, and country-specific inflation and investment market expectations derived from market data and analysts' or governments' expectations, as applicable.
|
| December 31, |
|
| December 31, |
|
| December 31, |
| |||
Other post-retirement benefit plans |
| 2020 |
|
| 2019 |
|
| 2018 |
| |||
Projected benefit obligation |
|
|
|
|
|
|
|
|
|
|
|
|
Discount rate |
|
| 2.5 | % |
|
| 3.1 | % |
|
| 3.8 | % |
Rate of compensation increase |
|
| 2.8 | % |
|
| 2.8 | % |
|
| 2.8 | % |
Net periodic benefit cost |
|
|
|
|
|
|
|
|
|
|
|
|
Discount rate |
|
| 3.0 | % |
|
| 3.7 | % |
|
| 3.5 | % |
Rate of compensation increase |
|
| 2.7 | % |
|
| 2.7 | % |
|
| 2.7 | % |
|
| Successor |
|
|
| Predecessor |
| ||||||||||
|
| December 31, |
|
| December 31, |
|
|
| November 30, |
|
| December 31, |
| ||||
Other post-retirement benefit plans |
| 2022 |
|
| 2021 |
|
|
| 2021 |
|
| 2020 |
| ||||
Projected benefit obligation |
|
|
|
|
|
|
|
|
|
|
|
|
| ||||
Discount rate |
|
| 5.3 | % |
|
| 3.1 | % |
|
| N/A |
|
|
| 2.5 | % | |
Rate of compensation increase |
|
| 3.2 | % |
|
| 2.9 | % |
|
| N/A |
|
|
| 2.8 | % | |
Net periodic benefit cost |
|
|
|
|
|
|
|
|
|
|
|
|
| ||||
Discount rate |
|
| 3.5 | % |
|
| 3.2 | % |
|
|
| 2.3 | % |
|
| 3.0 | % |
Rate of compensation increase |
|
| 2.9 | % |
|
| 2.8 | % |
|
|
| 2.6 | % |
|
| 2.7 | % |
For measurement purposes, a 3.9%3.9% weighted average annual rate of increase in the per capita cost of covered health care benefits was assumed for 2020.2022.
FAIR VALUE MEASUREMENT
Fair Value Measurements and Disclosures Topic of FASB ASC 820 establishes a fair value hierarchy, which prioritizes the inputs to valuation techniques used to measure fair value into three levels. A financial instrument’s categorization within the fair value hierarchy is based upon the lowest level of input that is available and significant to the fair value measurement.
Level 1 | Quoted prices in active markets for identical assets or liabilities. |
Level 2 | Observable inputs other than quoted prices in active markets for identical assets and liabilities, quoted prices for identical or similar assets or liabilities in inactive markets, or other inputs that are observable or can be corroborated by observable market data for substantially the full term of the assets or liabilities. |
Level 3 | Inputs that are generally unobservable and typically reflect management’s estimates of assumptions that market participants would use in pricing the assets or liabilities. |
77
70
DOMTAR CORPORATION
NOTES TO CONSOLIDATED FINANCIAL STATEMENTS
DECEMBER 31, 20202022
(IN MILLIONS OF DOLLARS, UNLESS OTHERWISE NOTEDNOTED))
NOTE 7.6. PENSION PLANS AND OTHER POST-RETIREMENT BENEFIT PLANS (CONTINUED)
The following table presents the fair value of the plan assets at December 31, 2020,2022, by asset category:
|
| Successor |
| |||||||||||||
|
| Fair Value Measurements at |
| |||||||||||||
|
| December 31, 2022 |
| |||||||||||||
|
|
|
|
| Quoted Prices |
|
|
|
|
|
|
| ||||
|
|
|
|
| in Active |
|
| Significant |
|
| Significant |
| ||||
|
|
|
|
| Markets for |
|
| Observable |
|
| Unobservable |
| ||||
|
|
|
|
| Identical Assets |
|
| Inputs |
|
| Inputs |
| ||||
Asset Category |
| Total |
|
| (Level 1) |
|
| (Level 2) |
|
| (Level 3) |
| ||||
|
| $ |
|
| $ |
|
| $ |
|
| $ |
| ||||
Cash and short-term investments |
|
| 33 |
|
|
| 18 |
|
|
| 15 |
|
|
| — |
|
Canadian provincial government bonds |
|
| 228 |
|
|
| 226 |
|
|
| 2 |
|
|
| — |
|
Canadian corporate debt securities |
|
| 58 |
|
|
| 43 |
|
|
| 15 |
|
|
| — |
|
U.S. corporate debt securities |
|
| 25 |
|
|
| 25 |
|
|
| — |
|
|
| — |
|
International corporate debt securities |
|
| 6 |
|
|
| 6 |
|
|
| — |
|
|
| — |
|
Bond fund (1 & 2) |
|
| 92 |
|
|
| — |
|
|
| 92 |
|
|
| — |
|
Canadian equities (3) |
|
| 43 |
|
|
| 43 |
|
|
| — |
|
|
| — |
|
U.S. equities (4) |
|
| 43 |
|
|
| 43 |
|
|
| — |
|
|
| — |
|
International equities (5) |
|
| 108 |
|
|
| 108 |
|
|
| — |
|
|
| — |
|
U.S. stock index funds (2 & 6) |
|
| 87 |
|
|
| — |
|
|
| 87 |
|
|
| — |
|
U.S. private real estate funds (7) |
|
| 122 |
|
|
| — |
|
|
| — |
|
|
| 122 |
|
U.S private multi-asset credit funds (8) |
|
| 57 |
|
|
| — |
|
|
| — |
|
|
| 57 |
|
Global private infrastructure fund (9) |
|
| 61 |
|
|
| — |
|
|
| — |
|
|
| 61 |
|
Derivative contracts (10) |
|
| (1 | ) |
|
| — |
|
|
| (1 | ) |
|
| — |
|
Total |
|
| 962 |
|
|
| 512 |
|
|
| 210 |
|
|
| 240 |
|
|
| Fair Value Measurements at |
| |||||||||||||
|
| December 31, 2020 |
| |||||||||||||
|
|
|
|
|
| Quoted Prices |
|
|
|
|
|
|
|
|
| |
|
|
|
|
|
| in Active |
|
| Significant |
|
| Significant |
| |||
|
|
|
|
|
| Markets for |
|
| Observable |
|
| Unobservable |
| |||
|
|
|
|
|
| Identical Assets |
|
| Inputs |
|
| Inputs |
| |||
Asset Category |
| Total |
|
| (Level 1) |
|
| (Level 2) |
|
| (Level 3) |
| ||||
|
| $ |
|
| $ |
|
| $ |
|
| $ |
| ||||
Cash and short-term investments |
|
| 60 |
|
|
| 16 |
|
|
| 44 |
|
|
| — |
|
Canadian provincial government bonds |
|
| 391 |
|
|
| 388 |
|
|
| 3 |
|
|
| — |
|
Canadian corporate debt securities |
|
| 63 |
|
|
| 46 |
|
|
| 17 |
|
|
| — |
|
U.S. corporate debt securities |
|
| 23 |
|
|
| 22 |
|
|
| 1 |
|
|
| — |
|
International corporate debt securities |
|
| 10 |
|
|
| 10 |
|
|
| — |
|
|
| — |
|
Bond fund (1 & 2) |
|
| 173 |
|
|
| — |
|
|
| 173 |
|
|
| — |
|
Canadian equities (3) |
|
| 97 |
|
|
| 97 |
|
|
| — |
|
|
| — |
|
U.S. equities (4) |
|
| 99 |
|
|
| 99 |
|
|
| — |
|
|
| — |
|
International equities (5) |
|
| 268 |
|
|
| 268 |
|
|
| — |
|
|
| — |
|
U.S. stock index funds (2 & 6) |
|
| 233 |
|
|
| — |
|
|
| 233 |
|
|
| — |
|
Insurance contracts (7) |
|
| 176 |
|
|
| — |
|
|
| — |
|
|
| 176 |
|
Derivative contracts (8) |
|
| 1 |
|
|
| — |
|
|
| 1 |
|
|
| — |
|
Total |
|
| 1,594 |
|
|
| 946 |
|
|
| 472 |
|
|
| 176 |
|
|
|
|
|
|
|
|
|
|
|
|
|
|
|
|
|
78
DOMTAR CORPORATION
NOTES TO CONSOLIDATED FINANCIAL STATEMENTS
DECEMBER 31, 20202022
(IN MILLIONS OF DOLLARS, UNLESS OTHERWISE NOTEDNOTED))
NOTE 7.6. PENSION PLANS AND OTHER POST-RETIREMENT BENEFIT PLANS (CONTINUED)
The following table presents the fair value of the plan assets at December 31, 2019,2021, by asset category:
|
| Successor |
| |||||||||||||
|
| Fair Value Measurements at |
| |||||||||||||
|
| December 31, 2021 |
| |||||||||||||
|
|
|
|
| Quoted Prices |
|
| Significant |
|
| Significant |
| ||||
Asset Category |
| Total |
|
| (Level 1) |
|
| (Level 2) |
|
| (Level 3) |
| ||||
|
| $ |
|
| $ |
|
| $ |
|
| $ |
| ||||
Cash and short-term investments |
|
| 145 |
|
|
| 19 |
|
|
| 126 |
|
|
| — |
|
Canadian provincial government bonds |
|
| 380 |
|
|
| 377 |
|
|
| 3 |
|
|
| — |
|
Canadian corporate debt securities |
|
| 70 |
|
|
| 52 |
|
|
| 18 |
|
|
| — |
|
U.S. corporate debt securities |
|
| 28 |
|
|
| 28 |
|
|
| — |
|
|
| — |
|
International corporate debt securities |
|
| 8 |
|
|
| 8 |
|
|
| — |
|
|
| — |
|
Bond fund (1 & 2) |
|
| 157 |
|
|
| — |
|
|
| 157 |
|
|
| — |
|
Canadian equities (3) |
|
| 90 |
|
|
| 90 |
|
|
| — |
|
|
| — |
|
U.S. equities (4) |
|
| 94 |
|
|
| 94 |
|
|
| — |
|
|
| — |
|
International equities (5) |
|
| 211 |
|
|
| 211 |
|
|
| — |
|
|
| — |
|
U.S. stock index funds (2 & 6) |
|
| 196 |
|
|
| — |
|
|
| 196 |
|
|
| — |
|
U.S. private real estate funds (7) |
|
| 77 |
|
|
| — |
|
|
| — |
|
|
| 77 |
|
Insurance contracts (8) |
|
| 165 |
|
|
| — |
|
|
| — |
|
|
| 165 |
|
Derivative contracts (9) |
|
| 1 |
|
|
| — |
|
|
| 1 |
|
|
| — |
|
Total |
|
| 1,622 |
|
|
| 879 |
|
|
| 501 |
|
|
| 242 |
|
|
| Fair Value Measurements at December 31, 2019 |
| |||||||||||||
|
|
|
|
|
| Quoted Prices in Active Markets for Identical Assets |
|
| Significant Observable Inputs |
|
| Significant Unobservable Inputs |
| |||
Asset Category |
| Total |
|
| (Level 1) |
|
| (Level 2) |
|
| (Level 3) |
| ||||
|
| $ |
|
| $ |
|
| $ |
|
| $ |
| ||||
Cash and short-term investments |
|
| 66 |
|
|
| 24 |
|
|
| 42 |
|
|
| — |
|
Canadian provincial government bonds |
|
| 454 |
|
|
| 453 |
|
|
| 1 |
|
|
| — |
|
Canadian corporate debt securities |
|
| 119 |
|
|
| 91 |
|
|
| 28 |
|
|
| — |
|
U.S. corporate debt securities |
|
| 21 |
|
|
| 21 |
|
|
| — |
|
|
| — |
|
International corporate debt securities |
|
| 13 |
|
|
| 13 |
|
|
| — |
|
|
| — |
|
Bond fund (1 & 2) |
|
| 166 |
|
|
| — |
|
|
| 166 |
|
|
| — |
|
Canadian equities (3) |
|
| 93 |
|
|
| 93 |
|
|
| — |
|
|
| — |
|
U.S. equities (4) |
|
| 86 |
|
|
| 86 |
|
|
| — |
|
|
| — |
|
International equities (5) |
|
| 231 |
|
|
| 231 |
|
|
| — |
|
|
| — |
|
U.S. stock index funds (2 & 6) |
|
| 215 |
|
|
| — |
|
|
| 215 |
|
|
| — |
|
Insurance contracts |
|
| 1 |
|
|
| — |
|
|
| — |
|
|
| 1 |
|
Total |
|
| 1,465 |
|
|
| 1,012 |
|
|
| 452 |
|
|
| 1 |
|
|
|
|
|
|
|
|
|
|
|
|
|
79
DOMTAR CORPORATION
NOTES TO CONSOLIDATED FINANCIAL STATEMENTS
DECEMBER 31, 20202022
(IN MILLIONS OF DOLLARS, UNLESS OTHERWISE NOTEDNOTED))
NOTE 7.6. PENSION PLANS AND OTHER POST-RETIREMENT BENEFIT PLANS (CONTINUED)
The following table presents changes during the period for Level 3 fair value measurements of plan assets:
Fair Value Measurements Using Significant | |||||
Unobservable Inputs (Level 3) | |||||
| |||||
| |||||
Balance at December 31, |
| ||||
|
|
| |||
Settlements | (14 | ) | |||
Return on plan assets |
| ||||
Effect of foreign currency exchange rate change |
| ||||
Balance at December 31, |
| ||||
Purchases |
| ||||
Settlements | (255 | ) | |||
Return on plan assets |
| ) | |||
Effect of foreign currency exchange rate change |
| ) | |||
Balance at December 31, |
| ||||
ESTIMATED FUTURE BENEFIT PAYMENTS FROM THE PLANS
Estimated future benefit payments from the plans for the next 10 years at December 31, 20202022 are as follows:
. |
| Pension plans |
|
| Other post-retirement benefit plans |
|
| Pension plans |
|
| Other post-retirement |
| ||||
|
| $ |
|
| $ |
|
| $ |
| $ |
| |||||
2021 |
|
| 89 |
|
|
| 4 |
| ||||||||
2022 |
|
| 88 |
|
|
| 4 |
| ||||||||
2023 |
|
| 88 |
|
|
| 4 |
|
|
| 50 |
|
|
| 4 |
|
2024 |
|
| 90 |
|
|
| 4 |
|
|
| 59 |
|
|
| 4 |
|
2025 |
|
| 89 |
|
|
| 4 |
|
|
| 54 |
|
|
| 4 |
|
2026 – 2030 |
|
| 434 |
|
|
| 20 |
| ||||||||
2026 |
|
| 56 |
|
|
| 4 |
| ||||||||
2027 |
|
| 57 |
|
|
| 3 |
| ||||||||
2028 – 2032 |
|
| 281 |
|
|
| 16 |
| ||||||||
8073
DOMTAR CORPORATION
NOTES TO CONSOLIDATED FINANCIAL STATEMENTS
DECEMBER 31, 20202022
(IN MILLIONS OF DOLLARS, UNLESS OTHERWISE NOTED)
NOTE 8.
OTHER OPERATING (INCOME) LOSS, NET
Other operating (income) loss, net is an aggregate of both recurring and non-recurring loss or income items and, as a result, can fluctuate from year to year. The Company’s other operating (income) loss, net includes the following:
|
| Year ended December 31, 2020 |
|
| Year ended December 31, 2019 |
|
| Year ended December 31, 2018 |
| |||
|
| $ |
|
| $ |
|
| $ |
| |||
Environmental provision |
|
| 2 |
|
|
| 4 |
|
|
| 5 |
|
Foreign exchange loss (gain) |
|
| — |
|
|
| 3 |
|
|
| (3 | ) |
Bad debt expense |
|
| 4 |
|
|
| 1 |
|
|
| 2 |
|
Net gain on sale of property, plant and equipment |
|
| (1 | ) |
|
| — |
|
|
| (4 | ) |
Income for waiving a non-compete clause |
|
| (7 | ) |
|
| — |
|
|
| — |
|
Other |
|
| (5 | ) |
|
| (4 | ) |
|
| (1 | ) |
Other operating (income) loss, net |
|
| (7 | ) |
|
| 4 |
|
|
| (1 | ) |
81
DOMTAR CORPORATION
NOTES TO CONSOLIDATED FINANCIAL STATEMENTS
DECEMBER 31, 2020NOTED)
(IN MILLIONS OF DOLLARS, UNLESS OTHERWISE NOTED)
NOTE 7.
NOTE 9.
INTEREST EXPENSE, NET
The following table presents the components of interest expense, net:
| Successor |
|
|
| Predecessor |
| ||||||||||
| Year ended |
|
| Period from |
|
|
| Period from |
|
| Year ended |
| ||||
| 2022 |
|
| 2021 |
|
|
| 2021 |
|
| 2020 |
| ||||
| $ |
|
| $ |
|
|
| $ |
|
| $ |
| ||||
Interest on long-term debt (1) |
| 90 |
|
|
| 9 |
|
|
|
| 36 |
|
|
| 52 |
|
Gain on fair value increment upon partial repayment |
| (10 | ) |
|
| — |
|
|
|
| — |
|
|
| — |
|
Make-whole premium on repayment of long-term debt |
| — |
|
|
| — |
|
|
|
| 11 |
|
|
| — |
|
Interest on receivables securitization |
| — |
|
|
| — |
|
|
|
| 1 |
|
|
| 1 |
|
Interest on withdrawal liabilities for multiemployer plans |
| 2 |
|
|
| — |
|
|
|
| 2 |
|
|
| 3 |
|
Amortization of debt issuance costs and other |
| 8 |
|
|
| 1 |
|
|
|
| 4 |
|
|
| 2 |
|
|
| 90 |
|
|
| 10 |
|
|
|
| 54 |
|
|
| 58 |
|
|
| Year ended |
|
| Year ended |
|
| Year ended |
| |||
|
| December 31, |
|
| December 31, |
|
| December 31, |
| |||
|
| 2020 |
|
| 2019 |
|
| 2018 |
| |||
|
| $ |
|
| $ |
|
| $ |
| |||
Interest on long-term debt (1) |
|
| 52 |
|
|
| 45 |
|
|
| 56 |
|
Interest on receivables securitization |
|
| 1 |
|
|
| 2 |
|
|
| 1 |
|
Interest on withdrawal liabilities for multiemployer plans |
|
| 3 |
|
|
| 3 |
|
|
| 2 |
|
Amortization of debt issuance costs and other |
|
| 2 |
|
|
| 2 |
|
|
| 3 |
|
|
|
| 58 |
|
|
| 52 |
|
|
| 62 |
|
|
|
8274
DOMTAR CORPORATION
NOTES TO CONSOLIDATED FINANCIAL STATEMENTS
DECEMBER 31, 20202022
(IN MILLIONS OF DOLLARS, UNLESS OTHERWISE NOTEDNOTED))
NOTE 8.
NOTE 10.
INCOME TAXES
The Company’s earnings (loss) earnings before income taxes by taxing jurisdiction were:
|
| Successor |
|
|
| Predecessor |
| ||||||||||
|
| Year ended |
|
| Period from |
|
|
| Period from |
|
| Year ended |
| ||||
|
| 2022 |
|
| 2021 |
|
|
| 2021 |
|
| 2020 |
| ||||
|
| $ |
|
| $ |
|
|
| $ |
|
| $ |
| ||||
U.S. earnings (loss) |
|
| 308 |
|
|
| (4 | ) |
|
|
| (7 | ) |
|
| (199 | ) |
Foreign earnings (loss) |
|
| 114 |
|
|
| (3 | ) |
|
|
| (36 | ) |
|
| (29 | ) |
Earnings (loss) before income taxes |
|
| 422 |
|
|
| (7 | ) |
|
|
| (43 | ) |
|
| (228 | ) |
|
| Year ended |
|
| Year ended |
|
| Year ended |
| |||
|
| December 31, |
|
| December 31, |
|
| December 31, |
| |||
|
| 2020 |
|
| 2019 |
|
| 2018 |
| |||
|
| $ |
|
| $ |
|
| $ |
| |||
U.S. (loss) earnings |
|
| (199 | ) |
|
| 80 |
|
|
| 241 |
|
Foreign (loss) earnings |
|
| (19 | ) |
|
| 24 |
|
|
| 110 |
|
(Loss) earnings before income taxes |
|
| (218 | ) |
|
| 104 |
|
|
| 351 |
|
Provisions for income taxes include the following:
|
| Year ended |
|
| Year ended |
|
| Year ended |
|
| Successor |
|
| Predecessor |
| ||||||||||||||
|
| December 31, |
|
| December 31, |
|
| December 31, |
|
| Year ended |
|
| Period from |
|
|
| Period from |
| Year ended |
| ||||||||
|
| 2020 |
|
| 2019 |
|
| 2018 |
|
| 2022 |
|
| 2021 |
|
|
| 2021 |
|
| 2020 |
| |||||||
|
| $ |
|
| $ |
|
| $ |
|
| $ |
|
| $ |
|
|
| $ |
|
| $ |
| |||||||
U.S. Federal and State: |
|
|
|
|
|
|
|
|
|
|
|
|
|
|
|
|
|
|
|
|
|
|
|
|
| ||||
Current |
|
| (21 | ) |
|
| 19 |
|
|
| 38 |
|
|
| 29 |
|
|
| 5 |
|
|
|
| 29 |
|
|
| (21 | ) |
Deferred |
|
| (45 | ) |
|
| (6 | ) |
|
| (1 | ) |
|
| 36 |
|
|
| (6 | ) |
|
|
| (13 | ) |
|
| (45 | ) |
Foreign: |
|
|
|
|
|
|
|
|
|
|
|
|
|
|
|
|
|
|
|
|
|
|
|
|
| ||||
Current |
|
| (7 | ) |
|
| 4 |
|
|
| 5 |
|
|
| 40 |
|
|
| 4 |
|
|
|
| (23 | ) |
|
| (11 | ) |
Deferred |
|
| (3 | ) |
|
| — |
|
|
| 26 |
|
|
| (4 | ) |
|
| (5 | ) |
|
|
| 13 |
|
|
| (3 | ) |
Income tax (benefit) expense |
|
| (76 | ) |
|
| 17 |
|
|
| 68 |
| |||||||||||||||||
Income tax expense (benefit) |
|
| 101 |
|
|
| (2 | ) |
|
|
| 6 |
|
|
| (80 | ) | ||||||||||||
8375
DOMTAR CORPORATION
NOTES TO CONSOLIDATED FINANCIAL STATEMENTS
DECEMBER 31, 20202022
(IN MILLIONS OF DOLLARS, UNLESS OTHERWISE NOTEDNOTED))
NOTE 10.8. INCOME TAXES (CONTINUED)
The Company’s provision for income taxes differs from the amounts computed by applying the statutory income tax rate of 21%21% to earnings (loss) earnings before income taxes due to the following:
|
| Year ended |
|
| Year ended |
|
| Year ended |
|
| Successor |
|
| Predecessor |
| ||||||||||||||
|
| December 31, |
|
| December 31, |
|
| December 31, |
|
| Year ended |
|
| Period from |
|
|
| Period from |
| Year ended |
| ||||||||
|
| 2020 |
|
| 2019 |
|
| 2018 |
|
| 2022 |
|
| 2021 |
|
|
| 2021 |
|
| 2020 |
| |||||||
|
| $ |
|
| $ |
|
| $ |
|
| $ |
|
| $ |
|
|
| $ |
| $ |
| ||||||||
U.S. federal statutory income tax |
|
| (46 | ) |
|
| 22 |
|
|
| 74 |
|
|
| 89 |
|
|
| (1 | ) |
|
|
| (9 | ) |
|
| (48 | ) |
Reconciling Items: |
|
|
|
|
|
|
|
|
|
|
|
|
|
|
|
|
|
|
|
|
|
|
|
|
| ||||
State and local income taxes, net of federal income tax benefit |
|
| (6 | ) |
|
| 4 |
|
|
| 9 |
|
|
| 12 |
|
|
| — |
|
|
|
| 4 |
|
|
| (6 | ) |
Foreign income tax rate differential |
|
| (1 | ) |
|
| 2 |
|
|
| 6 |
|
|
| 10 |
|
|
| — |
|
|
|
| (3 | ) |
|
| (2 | ) |
Tax credits and special deductions |
|
| (17 | ) |
|
| (18 | ) |
|
| (18 | ) |
|
| (18 | ) |
|
| (1 | ) |
|
|
| (9 | ) |
|
| (17 | ) |
U.S. tax rate benefit from loss carryback |
|
| (5 | ) |
|
| — |
|
|
| — |
|
|
| — |
|
|
| — |
|
|
|
| 1 |
|
|
| (5 | ) |
Tax rate changes |
|
| — |
|
|
| (4 | ) |
|
| (9 | ) |
|
| (1 | ) |
|
| — |
|
|
|
| (1 | ) |
|
| — |
|
Deemed mandatory repatriation tax |
|
| — |
|
|
| — |
|
|
| (7 | ) | |||||||||||||||||
Uncertain tax positions |
|
| (4 | ) |
|
| (3 | ) |
|
| (5 | ) |
|
| (2 | ) |
|
| — |
|
|
|
| (1 | ) |
|
| (4 | ) |
Deferred taxes on Personal Care Group Investment |
|
| (51 | ) |
|
| — |
|
|
| — |
|
|
| — |
|
|
| — |
|
|
|
| 1 |
|
|
| (51 | ) |
Deferred taxes on foreign earnings |
|
| (1 | ) |
|
| 2 |
|
|
| 10 |
|
|
| 4 |
|
|
| — |
|
|
|
| 2 |
|
|
| (1 | ) |
Intercompany income with assets held for sale |
|
| 3 |
|
|
| 3 |
|
|
| 4 |
|
|
| — |
|
|
| — |
|
|
|
| — |
|
|
| 3 |
|
Net book value adjustment of assets held for sale |
|
| 5 |
|
|
| — |
|
|
| — |
|
|
| — |
|
|
| — |
|
|
|
| — |
|
|
| 5 |
|
Valuation allowance on deferred tax assets |
|
| 47 |
|
|
| 5 |
|
|
| — |
|
|
| (1 | ) |
|
| — |
|
|
|
| 1 |
|
|
| 47 |
|
Nondeductible expenses |
|
| 1 |
|
|
| 3 |
|
|
| — |
|
|
| 5 |
|
|
| — |
|
|
|
| 17 |
|
|
| 1 |
|
Global intangible low-taxed income (GILTI) |
|
| 1 |
|
|
| — |
|
|
|
| 3 |
|
|
| — |
| ||||||||||||
Foreign-derived intangible income (FDII) |
|
| — |
|
|
| — |
|
|
|
| (1 | ) |
|
| — |
| ||||||||||||
Other |
|
| (1 | ) |
|
| 1 |
|
|
| 4 |
|
|
| 2 |
|
|
| — |
|
|
|
| 1 |
|
|
| (2 | ) |
Income tax (benefit) expense |
|
| (76 | ) |
|
| 17 |
|
|
| 68 |
| |||||||||||||||||
Income tax expense (benefit) |
|
| 101 |
|
|
| (2 | ) |
|
|
| 6 |
|
|
| (80 | ) | ||||||||||||
In 2022, the Company has a U.S. tax liability from Global Intangible Low-Taxed Income ("GILTI") related to its operations in Canada which is almost completely offset by a foreign tax credit. The Company also recorded $18 million of additional tax credits which mainly consisted of research and experimentation tax credits and state investment credits.
On November 30, 2021, Domtar Corporation was acquired by Paper Excellence and incurred significant costs to complete the transaction as well as significant executive compensation as a result of the change in control. Certain of these transaction costs and executive compensation expenses are not deductible for tax purposes and substantially impact the effective tax rate. The tax impact of these amounts in the Predecessor period is included in the Nondeductible Expenses in the above table. During the Predecessor Period ending November 30, 2021, the Company recorded $3 million of tax expense related to GILTI. Additionally, the Company recorded $9 million of tax credits during the 2021 Predecessor Period, mainly research and experimentation credits, which also impacts the effective tax rate.
During the Successor Period ending December 31, 2021, the Company recorded $1 million of tax credits, mainly research and experimentation credits.
76
DOMTAR CORPORATION
NOTES TO CONSOLIDATED FINANCIAL STATEMENTS
DECEMBER 31, 2022
(IN MILLIONS OF DOLLARS, UNLESS OTHERWISE NOTED)
NOTE 8. INCOME TAXES (CONTINUED)
On January 7, 2021, the Company reached an agreement with AIP to sell the Personal Care business for $920 million.business. As such, for the December 31, 2020 reporting period, we arethe Company was no longer indefinitely reinvested in that business and have classified ourits investment in that business as held for sale. Accordingly, we have recorded a deferred tax asset of $51$51 million was recorded for the difference between the net book value of the business and the tax basis of that business. The Company is accountingaccounted for the tax impacts related to the sale of the Personal Care business as a stock investment and therefore recognizingrecognized the tax benefit for recording the book/tax basis difference and the net book value adjustment as part of continuing operations. Both of these items impacted the effective tax rate in 2020.
The Company has assessed the value of the deferred tax asset related to the basis difference described above, which is expected to beshown as a capital loss for tax purposes upon the completion of the sale, and determined that the Company iswill not likely to realize athe full benefit from the asset. As such, the Company has recorded a valuation allowance of $44$44 million associated with this deferred tax asset. During the year,2020, the Company also analyzed its existing Arkansas research and development credits and determinedrecorded an additional valuation allowance of $3$3 million should be recorded since it is expected some of the credits will expire un-utilized. These amounts unfavorably impacted the effective tax rate in 2020.
During 2020, the Company generated a U.S. tax net operating loss which, in accordance with the Coronavirus Aid, Relief, and Economic Security (CARES)(“CARES”) Act will bewas carried back to 2015. In 2015, the US federal tax rate was 35%35%, versus the current rate of 21%21%. Therefore, the Company recorded an additional tax benefit of $5$5 million related to the tax rate benefit of the loss which favorably impacted the effective tax rate in 2020.
The Company recorded $17$17 million of tax credits, mainly research and experimentation credits, which favorably impacted the effective tax rate in 2020. Since the Company hashad a tax loss in 2020, the tax credits will bewere carried forward and are expected to bewere utilized in future years.
84
DOMTAR CORPORATION
NOTES TO CONSOLIDATED FINANCIAL STATEMENTS
DECEMBER 31, 2020the predecessor period.
(IN MILLIONS OF DOLLARS, UNLESS OTHERWISE NOTED)
NOTE 10. INCOME TAXES (CONTINUED)
As a result of the deemed mandatory repatriation tax requirement of the U.S. Tax Reform, the Company has taxed its undistributed foreign earnings as of December 31, 2017, at reduced tax rates. After completing its evaluation of the U.S. Tax Reform’s impact on its business operations, the Company has determined that it is no longer indefinitely reinvested in these undistributed foreign earnings as well as foreign earnings after December 31, 2017. As such, as of December 31, 2020, the Company has recorded a deferred tax liability of $11 million ($12 million as of December 31, 2019) for foreign withholding tax and various state income taxes associated with future repatriation of these earnings. This additional $1 million tax benefit impacted the effective tax rate for 2020 ($2 million tax expense for 2019 and $10 million tax expense for 2018).
The Company recorded $18 million of tax credits in 2019 ($18 million in 2018), mainly research and experimentation credits, which favorably impacted the effective tax rate. Arkansas legislation changes were passed in 2019 which reduced the state tax rate and changed how the apportionment factor is calculated. This resulted in a deferred state tax benefit of $4 million for the Company. Additionally, a valuation allowance of $5 million was recorded on state attributes the Company does not expect to utilize before they expire.
On December 22, 2017, the U.S. Tax Reform was signed into law. The U.S. Tax Reform significantly changed U.S. tax law for businesses by, among other things, lowering the maximum federal corporate income tax rate from 35% to 21% effective January 1, 2018, implementing a territorial tax system, and imposing a one-time deemed repatriation tax on accumulated foreign earnings. Additionally, Staff Accounting Bulletin No. 118 (“SAB 118”) was issued to address the application in situations when a registrant does not have the necessary information available, prepared, or analyzed in reasonable detail to complete the accounting for certain income tax effects of the U.S. Tax Reform. December 22, 2018 marked the end of the measurement period for purposes of SAB 118. As such, the Company completed its analysis, including currently available legislative updates, and recorded an additional tax benefit of $13 million for the year ended December 31, 2018. Of this benefit, $7 million related to adjustments to the deemed mandatory repatriation tax and $6 million related to the revaluation of the Company’s net deferred tax liabilities. The $6 million benefit for the revaluation of the net deferred tax liabilities is included in the “Tax rate changes” above, along with $3 million of additional tax benefits relating to 2018 law changes in Sweden and various U.S. states.
Deferred tax assets and liabilities are based on tax rates that are expected to be in effect in future periods when deferred items are expected to reverse. Changes in tax rates or tax laws affect the expected future benefit or expense. The effect of such changes that occurred during each of the last three fiscal years is included in “Tax rate changes” disclosed under the effective income tax rate reconciliation shown above.
85
77
DOMTAR CORPORATION
NOTES TO CONSOLIDATED FINANCIAL STATEMENTS
DECEMBER 31, 20202022
(IN MILLIONS OF DOLLARS, UNLESS OTHERWISE NOTEDNOTED))
NOTE 10.8. INCOME TAXES (CONTINUED)
DEFERRED TAX ASSETS AND LIABILITIES
The tax effects of significant temporary differences representing deferred tax assets and liabilities at December 31, 20202022 and December 31, 20192021 are comprised of the following:
|
| December 31, |
|
| December 31, |
| ||
|
| 2020 |
|
| 2019 |
| ||
|
| $ |
|
| $ |
| ||
Accounting provisions |
|
| 31 |
|
|
| 27 |
|
Net operating loss carryforwards and other deductions |
|
| 56 |
|
|
| 9 |
|
Pension and other employee future benefit plans |
|
| 19 |
|
|
| 16 |
|
Inventory |
|
| 11 |
|
|
| 12 |
|
Tax credits |
|
| 41 |
|
|
| 23 |
|
Other |
|
| 12 |
|
|
| 7 |
|
Gross deferred tax assets |
|
| 170 |
|
|
| 94 |
|
Valuation allowance |
|
| (64 | ) |
|
| (17 | ) |
Net deferred tax assets |
|
| 106 |
|
|
| 77 |
|
Property, plant and equipment |
|
| (367 | ) |
|
| (386 | ) |
Intangible assets |
|
| (6 | ) |
|
| (6 | ) |
Other |
|
| (31 | ) |
|
| (17 | ) |
Total deferred tax liabilities |
|
| (404 | ) |
|
| (409 | ) |
Net deferred tax liabilities |
|
| (298 | ) |
|
| (332 | ) |
Included in: |
|
|
|
|
|
|
|
|
Deferred income taxes and other |
|
| (298 | ) |
|
| (332 | ) |
Total |
|
| (298 | ) |
|
| (332 | ) |
|
| Successor |
| |||||
|
| December 31, |
|
| December 31, |
| ||
|
| 2022 |
|
| 2021 |
| ||
|
| $ |
|
| $ |
| ||
Accounting provisions |
|
| 34 |
|
|
| 36 |
|
Net operating loss carryforwards and other deductions |
|
| 53 |
|
|
| 48 |
|
Inventory |
|
| 4 |
|
|
| — |
|
Intangible assets |
|
| 8 |
|
|
| — |
|
Tax credits |
|
| 22 |
|
|
| 30 |
|
Debt |
|
| 6 |
|
|
| — |
|
Other |
|
| 13 |
|
|
| 19 |
|
Gross deferred tax assets |
|
| 140 |
|
|
| 133 |
|
Valuation allowance |
|
| (58 | ) |
|
| (58 | ) |
Net deferred tax assets |
|
| 82 |
|
|
| 75 |
|
Property, plant and equipment |
|
| (508 | ) |
|
| (458 | ) |
Intangible assets |
|
| — |
|
|
| (51 | ) |
Pension and other employee future benefit plans |
|
| (26 | ) |
|
| (23 | ) |
Inventory |
|
| — |
|
|
| (10 | ) |
Outside basis difference |
|
| — |
|
|
| (12 | ) |
Deferred tax on foreign earnings |
|
| (17 | ) |
|
| (13 | ) |
Other |
|
| (12 | ) |
|
| (11 | ) |
Total deferred tax liabilities |
|
| (563 | ) |
|
| (578 | ) |
Net deferred tax liabilities |
|
| (481 | ) |
|
| (503 | ) |
Included in: |
|
|
|
|
|
| ||
Deferred income taxes and other |
|
| (481 | ) |
|
| (503 | ) |
Total |
|
| (481 | ) |
|
| (503 | ) |
As required by the 2017 Tax Cuts and Jobs Act, effective January 1, 2022, the Company’s research and development expenditures were capitalized and amortized which increased the current tax expense with an equal amount of deferred tax benefit.
On November 30, 2021, the Company was acquired by Paper Excellence and under the acquisition method of accounting the Company’s assets and liabilities were adjusted to fair value as of the date of the Merger. The Company has provided for deferred taxes for these adjustments as necessary. Additionally, as a condition to obtain the approval of the Merger from the Canadian Competition Bureau, the Company was required to commit to the divestiture of its Kamloops, British Columbia production facility and at December 31, 2021, was accounting for these operations as Assets Held for Sale. Accordingly, the Company had provided for deferred taxes on the outside basis difference that was expected to be realized when these operations are sold. This was also recorded through acquisition accounting.
At December 31, 2020,2022, the Company had 0no federal net operating loss carryforwards however, the Company has recorded a tax asset related to the book/tax basis difference of the Assets Held for Sale which is expected to beand a capital loss once the saleof $185 million (representing a deferred tax asset of $43 million, which is completed.fully reserved). The Company also hashad other foreign net operating losses of $4$4 million at December 31, 2020,2022, which maycan be carried forward indefinitely.
In assessing the realizability of deferred tax assets, management considers whether it is more likely than not that some portion or all of the deferred tax assets will not be realized. The ultimate realization of deferred tax assets is dependent upon the generation of future taxable income during periods in which temporary differences become deductible.
78
DOMTAR CORPORATION
NOTES TO CONSOLIDATED FINANCIAL STATEMENTS
DECEMBER 31, 2022
(IN MILLIONS OF DOLLARS, UNLESS OTHERWISE NOTED)
NOTE 8. INCOME TAXES (CONTINUED)
The Company evaluates the realization of deferred tax assets on a quarterly basis. Evaluating the need for an amount of a valuation allowance for deferred tax assets often requires significant judgment. All available evidence, both positive and negative, is considered when determining whether, based on the weight of that evidence, a valuation allowance is needed. Specifically, the Company evaluated the following items:
| • Historical income / (losses) – particularly the most recent three-year period • Reversals of future taxable temporary differences • Projected future income / (losses) • Tax planning strategies • Divestitures
|
|
|
|
|
|
|
|
|
|
86
DOMTAR CORPORATION
NOTES TO CONSOLIDATED FINANCIAL STATEMENTS
DECEMBER 31, 2020
(IN MILLIONS OF DOLLARS, UNLESS OTHERWISE NOTED)
NOTE 10. INCOME TAXES (CONTINUED)
Management believes that it is more likely than not that the results of future operations will generate sufficient taxable income to realize the deferred tax assets, with the following exceptions:
|
|
• Capital loss ($43 |
|
|
|
In 2020,2022, the valuation allowance unfavorablyfavorably impacted tax expense and the effective tax rate by $47$1 million (2019(1 month ended December 31, 2021 – $5nil; 11 months ended November 30, 2021 – $1 million and 2020 – $47 million).
As of December 31, 2020,2022, the Company has recorded a cumulative deferred tax liability of $11$17 million ($12 million for 2019)(2021 – $13 million) for foreign withholding tax and various state income taxes associated with the repatriation of earnings subject to the repatriation tax as well as future repatriation of its unremitted foreign earnings. With the exception of the Personal Care businessKamloops, British Columbia production facility, which is beingwas shown as held for sale in 2021, the Company hasdid not providedprovide for deferred taxes on the outside basis differences in its investments in its foreign subsidiaries that are unrelated to unremitted earnings as it estimates that this deferred tax liability in combination with the repatriation tax amount, covers all tax liabilities with foreign investments to date. The Company is indefinitely reinvested in the outside basis differences of its remaining foreign subsidiaries.
ACCOUNTING FOR UNCERTAINTY IN INCOME TAXES
At December 31, 2020,2022, the Company had gross unrecognized tax benefits of approximately $23$20 million ($2822 million and $28$23 million for 20192021 and 2018,2020, respectively). If recognized in 2020,2022, these tax benefits would impact the effective tax rate. These amounts represent the gross amount of exposure in individual jurisdictions and do not reflect any additional benefits expected to be realized if such positions were sustained, such as federal deduction that could be realized if an unrecognized state deduction was not sustained. These amounts are included in Deferred income taxes and other on the Consolidated Balance Sheets.
|
| Successor |
|
|
| Predecessor |
| ||||||
|
| December 31, |
|
| December 31, |
|
|
| December 31, |
| |||
|
| 2022 |
|
| 2021 |
|
|
| 2020 |
| |||
|
| $ |
|
| $ |
|
|
| $ |
| |||
Balance at beginning of year |
|
| 22 |
|
|
| 23 |
|
|
|
| 28 |
|
Additions based on tax positions related to current year |
|
| 2 |
|
|
| 2 |
|
|
|
| 1 |
|
Additions for tax positions of prior years |
|
| 2 |
|
|
| — |
|
|
|
| 1 |
|
Expirations of statutes of limitations |
|
| (6 | ) |
|
| (4 | ) |
|
|
| (7 | ) |
Interest |
|
| — |
|
|
| 1 |
|
|
|
| — |
|
Balance at end of year |
|
| 20 |
|
|
| 22 |
|
|
|
| 23 |
|
|
| December 31, |
|
| December 31, |
|
| December 31, |
| |||
|
| 2020 |
|
| 2019 |
|
| 2018 |
| |||
|
| $ |
|
| $ |
|
| $ |
| |||
Balance at beginning of year |
|
| 28 |
|
|
| 28 |
|
|
| 27 |
|
Additions based on tax positions related to current year |
|
| 1 |
|
|
| 3 |
|
|
| 3 |
|
Additions for tax positions of prior years |
|
| 1 |
|
|
| 2 |
|
|
| 3 |
|
Expirations of statutes of limitations |
|
| (7 | ) |
|
| (6 | ) |
|
| (6 | ) |
Interest |
|
| — |
|
|
| 1 |
|
|
| 1 |
|
Balance at end of year |
|
| 23 |
|
|
| 28 |
|
|
| 28 |
|
79
DOMTAR CORPORATION
NOTES TO CONSOLIDATED FINANCIAL STATEMENTS
DECEMBER 31, 2022
(IN MILLIONS OF DOLLARS, UNLESS OTHERWISE NOTED)
NOTE 8. INCOME TAXES (CONTINUED)
The Company recorded less than $1$1 million of accrued interest associated with unrecognized tax benefits for the period ending December 31, 20202022 ($1 million for 20192021 and $1less than $1 million for 2018)2020). The Company recognizes accrued interest and penalties, if any, related to unrecognized tax benefits as a component of tax expense. The Company believes it is reasonably possible that up to $4$3 million of its unrecognized benefits may be recognized by December 31, 2021.2023. However, the amount and timing of the recognition of these benefits is subject to some uncertainty.
The major jurisdictions where the Company and its subsidiaries will file tax returns for 20202022 are Canada and the U.S. The Company will file one consolidated U.S. federal income tax return. The Company and its subsidiaries will also file returns in various other countries in Europe and Asia as well as various U.S. states and Canadian provinces. At December 31, 2020,2022, the Company’s subsidiaries are subject to foreign federal income tax examinations for the tax years 20132014 through 2019,2021, with federal years prior to 20172019 being closed from a cash tax liability standpoint in the U.S. The Company does not anticipate that adjustments stemming from these audits would result in a significant change to the results of its operations and financial condition.
8780
DOMTAR CORPORATION
NOTES TO CONSOLIDATED FINANCIAL STATEMENTS
DECEMBER 31, 20202022
(IN MILLIONS OF DOLLARS, UNLESS OTHERWISE NOTEDNOTED))
NOTE 9.
NOTE 11.
INVENTORIES
INVENTORIES
The following table presents the components of inventories:
|
| Successor |
| |||||||||||||
|
| December 31, |
|
| December 31, |
|
| December 31, |
|
| December 31, |
| ||||
|
| 2020 |
|
| 2019 |
|
| 2022 |
|
| 2021 |
| ||||
|
| $ |
|
| $ |
|
| $ |
| $ |
| |||||
Work in process and finished goods |
|
| 321 |
|
|
| 325 |
|
|
| 389 |
|
|
| 359 |
|
Raw materials |
|
| 107 |
|
|
| 119 |
|
|
| 136 |
|
|
| 110 |
|
Operating and maintenance supplies |
|
| 202 |
|
|
| 219 |
|
|
| 160 |
|
|
| 194 |
|
|
|
| 630 |
|
|
| 663 |
|
|
| 685 |
|
|
| 663 |
|
Certain domestic raw materials, in process and finished goods inventories are valued based on the LIFO method. LIFO inventories were $314 million and $213 million at December 31, 2022 and 2021, respectively. If inventories valued under the LIFO basis had been valued using the FIFO method, inventories would have been $4 million lower than reported as of December 31, 2022 and $1 million lower at December 31, 2021.
88
81
DOMTAR CORPORATION
NOTES TO CONSOLIDATED FINANCIAL STATEMENTS
DECEMBER 31, 20202022
(IN MILLIONS OF DOLLARS, UNLESS OTHERWISE NOTEDNOTED))
NOTE 10.
NOTE 12.
PROPERTY, PLANT AND EQUIPMENT
The following table presents the components of property, plant and equipment:
|
|
|
| Successor |
| |||||||||||||||||||
|
| Range of useful lives |
|
| December 31, |
|
| December 31, |
|
| Range of useful lives |
|
| December 31, |
| December 31, |
| |||||||
|
| (in years) |
|
| 2020 |
|
| 2019 |
|
| (in years) |
|
| 2022 |
|
| 2021 |
| ||||||
|
|
|
|
|
| $ |
|
| $ |
|
|
|
| $ |
| $ |
| |||||||
Machinery and equipment |
| 3 – 20 |
|
|
| 7,617 |
|
|
| 7,436 |
|
| 3 – 20 |
|
| 2,056 |
|
|
| 1,894 |
| |||
Buildings and improvements |
| 10 – 40 |
|
|
| 962 |
|
|
| 944 |
|
| 10 – 40 |
|
| 340 |
|
|
| 199 |
| |||
Timberlands |
| (1) |
|
|
| 195 |
|
|
| 191 |
|
| (1) |
|
| 281 |
|
|
| 142 |
| |||
Assets under construction |
|
| — |
|
|
| 87 |
|
|
| 135 |
|
|
| — |
|
|
| 314 |
|
|
| 311 |
|
|
|
|
|
|
|
| 8,861 |
|
|
| 8,706 |
|
|
|
|
| 2,991 |
|
|
| 2,546 |
| ||
Less: Accumulated depreciation |
|
|
|
|
|
| (6,838 | ) |
|
| (6,483 | ) |
|
|
|
| (229 | ) |
|
| (22 | ) | ||
|
|
|
|
|
|
| 2,023 |
|
|
| 2,223 |
|
|
|
|
| 2,762 |
|
|
| 2,524 |
| ||
(1)Amortization is calculated using the unit of production method.
|
|
Depreciation expense related to property, plant and equipment for the year ended December 31, 2022 was $209 million (2021 – $22 million and $181 million for the 1 month ended December 31 and the 11 months ended November 30, respectively; 2020 was $222 million (2019 – $230 million; 2018 – $240$207 million).
8982
DOMTAR CORPORATION
NOTES TO CONSOLIDATED FINANCIAL STATEMENTS
DECEMBER 31, 20202022
(IN MILLIONS OF DOLLARS, UNLESS OTHERWISE NOTEDNOTED))
NOTE 11.
NOTE 13.
LEASES
LEASES
In the normal course of business, the Company enters into operating and finance leases mainly for manufacturing and warehousing facilities, corporate offices, motor vehicles, mobile equipment, office equipment and manufacturing equipment.
While the Company’s lease payments are generally fixed over the lease term, some leases may include price escalation terms that are fixed at the lease commencement date.
The Company has remaining lease terms ranging from 1 year to 1210 years, some of which may include options to extend the leases for up to 10 years, and some of which may include options to terminate the leases within 1 year.
The components of lease expense were as follows:
|
|
|
| Successor |
|
|
| Predecessor |
| ||||||||||
|
|
|
| Year ended |
|
| Period from |
|
|
| Period from |
|
| Year ended |
| ||||
|
|
|
| 2022 |
|
| 2021 |
|
|
| 2021 |
|
| 2020 |
| ||||
|
|
|
| $ |
|
| $ |
|
|
| $ |
|
| $ |
| ||||
Operating lease expense |
| 21 |
|
|
| 4 |
|
|
|
| 17 |
|
|
| 22 |
| |||
|
|
|
|
|
|
|
|
|
|
|
|
| |||||||
|
|
|
| Year ended |
|
| Year ended |
| ||
|
|
|
| December 31, |
|
| December 31, |
| ||
|
|
|
| 2020 |
|
| 2019 |
| ||
|
|
|
| $ |
|
| $ |
| ||
Operating lease expense |
| 22 |
|
|
| 21 |
| |||
|
|
|
|
|
|
|
| |||
Finance lease expense: |
|
|
|
|
|
|
| |||
Amortization of right-of-use assets |
| 1 |
|
|
| — |
| |||
Interest on lease liabilities |
| — |
|
|
| — |
| |||
Total finance lease expense |
| 1 |
|
|
| — |
| |||
For the year ended December 31, 2018, total operating lease expense amounted to $19 million.
Supplemental cash flow information related to leases was as follows:
|
|
|
| Year ended |
|
| Year ended |
|
| Successor |
|
| Predecessor |
| |||||||||||||||
|
|
|
| December 31, |
|
| December 31, |
|
| Year ended |
|
| Period from |
|
|
| Period from |
| Year ended |
| |||||||||
|
|
|
| 2020 |
|
| 2019 |
|
| 2022 |
|
| 2021 |
|
|
| 2021 |
|
| 2020 |
| ||||||||
|
|
|
| $ |
|
| $ |
|
| $ |
| $ |
|
|
| $ |
| $ |
| ||||||||||
Cash paid for amounts included in the measurement of lease liabilities: | Cash paid for amounts included in the measurement of lease liabilities: |
|
|
|
|
|
|
| Cash paid for amounts included in the measurement of lease |
|
|
|
|
|
|
|
|
|
| ||||||||||
| Operating cash flows from operating leases |
| 23 |
|
|
| 21 |
| Operating cash flows from operating leases |
| 23 |
|
|
| 4 |
|
|
|
| 20 |
|
|
| 23 |
| ||||
| Operating cash flows from finance leases |
| 1 |
|
|
| 1 |
| Operating cash flows from finance leases |
| — |
|
|
| — |
|
|
|
| — |
|
|
| 1 |
| ||||
| Financing cash flows from finance leases |
| 1 |
|
|
| 1 |
| Financing cash flows from finance leases |
| 1 |
|
|
| — |
|
|
|
| 1 |
|
|
| 1 |
| ||||
|
|
|
|
|
|
|
|
|
|
|
|
|
|
|
|
|
|
|
| ||||||||||
Right-of-use assets obtained in exchange for lease liabilities: | Right-of-use assets obtained in exchange for lease liabilities: |
|
|
|
|
|
|
| Right-of-use assets obtained in exchange for lease liabilities: |
|
|
|
|
|
|
|
|
|
| ||||||||||
| Operating leases |
| 12 |
|
|
| 24 |
| Operating leases |
| 6 |
|
|
| — |
|
|
|
| 3 |
|
|
| 12 |
| ||||
| Finance leases |
| — |
|
|
| — |
| |||||||||||||||||||||
9083
DOMTAR CORPORATION
NOTES TO CONSOLIDATED FINANCIAL STATEMENTS
DECEMBER 31, 20202022
(IN MILLIONS OF DOLLARS, UNLESS OTHERWISE NOTEDNOTED))
NOTE 13.11. LEASES (CONTINUED)
Supplemental balance sheet information related to leases was as follows:
|
|
|
|
|
|
|
|
| Successor |
| |||||
|
|
|
|
|
|
|
|
| December 31, |
|
| December 31, |
| ||
|
|
|
|
|
|
|
|
| 2022 |
|
| 2021 |
| ||
|
|
|
|
|
|
|
|
| $ |
|
| $ |
| ||
Operating leases |
|
|
|
|
|
|
|
|
|
| |||||
| Operating lease right-of-use assets |
|
|
|
|
|
| 42 |
|
|
| 48 |
| ||
|
|
|
|
|
|
|
|
|
|
|
| ||||
| Lease liabilities due within one year |
|
|
|
|
|
| 17 |
|
|
| 19 |
| ||
| Long-term operating lease liabilities |
|
|
|
|
|
| 27 |
|
|
| 36 |
| ||
|
|
|
|
|
|
|
| 44 |
|
|
| 55 |
| ||
|
|
|
|
|
|
|
|
|
|
|
| ||||
Finance leases |
|
|
|
|
|
|
|
|
|
| |||||
| Property, plant and equipment |
|
|
|
|
|
| 6 |
|
|
| 5 |
| ||
| Accumulated depreciation |
|
|
|
|
|
| — |
|
|
| (2 | ) | ||
|
|
|
|
|
|
|
| 6 |
|
|
| 3 |
| ||
|
|
|
|
|
|
|
|
|
|
|
| ||||
| Long-term debt due within one year |
|
|
|
|
|
| 1 |
|
|
| 1 |
| ||
| Long-term debt |
|
|
|
|
|
| 3 |
|
|
| 3 |
| ||
|
|
|
|
|
|
|
| 4 |
|
|
| 4 |
| ||
|
|
|
|
|
|
|
|
|
|
|
| ||||
| Weighted-average remaining lease term |
|
|
|
|
|
|
|
|
|
| ||||
|
| Operating leases |
|
|
|
|
| 3.9 years |
|
| 4.3 years |
| |||
|
| Finance leases |
|
|
|
|
| 5.8 years |
|
| 6.8 years |
| |||
|
|
|
|
|
|
|
|
|
|
|
|
| |||
| Weighted-average discount rate |
|
|
|
|
|
|
|
|
|
| ||||
|
| Operating leases |
|
|
|
|
|
| 3.4 | % |
|
| 3.2 | % | |
|
| Finance leases |
|
|
|
|
|
| 8.2 | % |
|
| 8.2 | % | |
|
|
|
| December 31, |
|
| December 31, |
| ||
|
|
|
| 2020 |
|
| 2019 |
| ||
|
|
|
| $ |
|
| $ |
| ||
Operating leases |
|
|
|
|
|
|
| |||
| Operating leases right-of-use assets |
| 59 |
|
|
| 58 |
| ||
|
|
|
|
|
|
|
|
| ||
| Lease liabilities due within one year |
| 20 |
|
|
| 18 |
| ||
| Operating lease liabilities |
| 50 |
|
|
| 40 |
| ||
|
|
| 70 |
|
|
| 58 |
| ||
|
|
|
|
|
|
|
|
| ||
Finance leases |
|
|
|
|
|
|
| |||
| Property, plant and equipment |
| 11 |
|
|
| 9 |
| ||
| Accumulated depreciation |
| (3 | ) |
|
| (2 | ) | ||
|
|
| 8 |
|
|
| 7 |
| ||
|
|
|
|
|
|
|
|
| ||
| Long-term debt due within one year |
| 1 |
|
|
| 1 |
| ||
| Long-term debt |
| 9 |
|
|
| 8 |
| ||
|
|
| 10 |
|
|
| 9 |
| ||
|
|
|
|
|
|
|
|
| ||
| Weighted-average remaining lease term |
|
|
|
|
|
|
| ||
|
| Operating leases | 4.7 years |
|
| 3.8 years |
| |||
|
| Finance leases | 8.8 years |
|
| 10.4 years |
| |||
|
|
|
|
|
|
|
|
|
| |
| Weighted-average discount rate |
|
|
|
|
|
|
| ||
|
| Operating leases |
| 4.4 | % |
|
| 4.4 | % | |
|
| Finance leases |
| 6.1 | % |
|
| 7.0 | % | |
Maturities of lease liabilities at December 31, 20202022 were as follows:
|
|
|
| Operating leases |
| |
|
|
|
| $ |
| |
| 2021 |
|
|
| 20 |
|
| 2022 |
|
|
| 18 |
|
| 2023 |
|
|
| 15 |
|
| 2024 |
|
|
| 10 |
|
| 2025 |
|
|
| 6 |
|
| Thereafter |
|
| 9 |
| |
| Total lease payments |
|
| 78 |
| |
|
|
|
|
|
| |
| Less: Imputed interest |
|
| 8 |
| |
|
|
|
|
|
| |
| Total lease liabilities |
|
| 70 |
| |
|
|
|
|
|
| Operating leases |
| |
|
|
|
|
|
| $ |
| |
| 2023 |
|
|
|
|
| 17 |
|
| 2024 |
|
|
|
|
| 13 |
|
| 2025 |
|
|
|
|
| 7 |
|
| 2026 |
|
|
|
|
| 3 |
|
| 2027 |
|
|
|
|
| 3 |
|
| Thereafter |
|
|
|
| 4 |
| |
| Total lease payments |
|
|
|
| 47 |
| |
|
|
|
|
|
|
| ||
| Less: Imputed interest |
|
|
|
| 3 |
| |
|
|
|
|
|
|
| ||
| Total lease liabilities |
|
|
|
| 44 |
| |
9184
DOMTAR CORPORATION
NOTES TO CONSOLIDATED FINANCIAL STATEMENTS
DECEMBER 31, 20202022
(IN MILLIONS OF DOLLARS, UNLESS OTHERWISE NOTEDNOTED))
NOTE 12.
NOTE 14.
INTANGIBLE ASSETS
The following table presents the components of intangible assets:
|
|
|
|
| Successor |
| ||||||||||||||||||||||||||||||||||||||||||||||||||
|
| Estimated useful lives |
|
| December 31, |
|
| December 31, |
|
| Estimated useful lives |
|
| December 31, |
|
| December 31, |
| ||||||||||||||||||||||||||||||||||||||
|
| (in years) |
|
| 2020 |
|
| 2019 |
|
| (in years) |
|
| 2022 |
|
| 2021 |
| ||||||||||||||||||||||||||||||||||||||
|
|
|
|
|
| Gross carrying |
|
| Accumulated |
|
|
|
|
|
| Gross carrying |
|
| Accumulated |
|
|
|
|
|
|
|
|
| Gross carrying |
| Accumulated |
|
|
| Gross carrying |
| Accumulated |
|
|
| ||||||||||||||||
|
|
|
|
|
| amount |
|
| amortization |
|
| Net |
|
| amount |
|
| amortization |
|
| Net |
|
|
|
|
| amount |
|
| amortization |
|
| Net |
|
| amount |
|
| amortization |
|
| Net |
| |||||||||||||
Definite-lived intangible assets subject to amortization |
|
|
|
|
| $ |
|
| $ |
|
| $ |
|
| $ |
|
| $ |
|
| $ |
|
|
|
|
| $ |
|
| $ |
|
| $ |
|
| $ |
|
| $ |
|
| $ |
| |||||||||||||
Water rights |
|
| 40 |
|
|
| 3 |
|
|
| (1 | ) |
|
| 2 |
|
|
| 3 |
|
|
| (1 | ) |
|
| 2 |
|
|
| 30 |
|
|
| 9 |
|
|
| — |
|
|
| 9 |
|
|
| 7 |
|
|
| — |
|
|
| 7 |
|
Customer relationships |
| 20 – 30 |
|
|
| 24 |
|
|
| (10 | ) |
|
| 14 |
|
|
| 24 |
|
|
| (9 | ) |
|
| 15 |
|
| Up to 15 |
|
|
| — |
|
|
| — |
|
|
| — |
|
|
| 171 |
|
|
| (1 | ) |
|
| 170 |
| ||
Technology |
| 7 – 20 |
|
|
| 8 |
|
|
| (5 | ) |
|
| 3 |
|
|
| 8 |
|
|
| (5 | ) |
|
| 3 |
| |||||||||||||||||||||||||||||
Non-Compete |
|
| 9 |
|
|
| 1 |
|
|
| (1 | ) |
|
| — |
|
|
| 1 |
|
|
| (1 | ) |
|
| — |
| ||||||||||||||||||||||||||||
|
|
|
|
|
|
| 36 |
|
|
| (17 | ) |
|
| 19 |
|
|
| 36 |
|
|
| (16 | ) |
|
| 20 |
| ||||||||||||||||||||||||||||
Indefinite-lived intangible assets not subject to amortization |
|
|
|
|
|
|
|
|
|
|
|
|
|
|
|
|
|
|
|
|
|
|
|
|
|
|
|
| ||||||||||||||||||||||||||||
Water rights |
|
|
|
|
|
| 4 |
|
|
| — |
|
|
| 4 |
|
|
| 4 |
|
|
| — |
|
|
| 4 |
| ||||||||||||||||||||||||||||
License rights |
|
|
|
|
|
| 6 |
|
|
| — |
|
|
| 6 |
|
|
| 6 |
|
|
| — |
|
|
| 6 |
| ||||||||||||||||||||||||||||
Trade Names |
|
| 15 |
|
|
| 15 |
|
|
| (1 | ) |
|
| 14 |
|
|
| 30 |
|
|
| — |
|
|
| 30 |
| ||||||||||||||||||||||||||||
Total |
|
|
|
|
|
| 46 |
|
|
| (17 | ) |
|
| 29 |
|
|
| 46 |
|
|
| (16 | ) |
|
| 30 |
|
|
|
|
|
| 24 |
|
|
| (1 | ) |
|
| 23 |
|
|
| 208 |
|
|
| (1 | ) |
|
| 207 |
| |
As part of finalization of the purchase price allocation, the Company revised its provisional amounts recorded for tangible (property, plant and equipment) and intangible assets based on final valuation reports obtained from a third party. The finalization of provisional amounts recorded did not result in a material change in current or long-term assets and liabilities recorded as the result of the Merger (see Note 4 "Acquisition of Businesses" for more details).
Amortization expense related to intangible assets for the year ended December 31, 20202022 was $1nil ($1 million ($and $1 million for the 1 month ended December 31, 2021 and 11 months ended November 30, 2021, respectively, and $1 million in 2019 and 2018, respectively)2020).
Amortization expense for the next five years related to intangible assets is expected to be as follows:
|
| 2021 |
|
| 2022 |
|
| 2023 |
|
| 2024 |
|
| 2025 |
| |||||
|
| $ |
|
| $ |
|
| $ |
|
| $ |
|
| $ |
| |||||
Amortization expense related to intangible assets |
|
| 1 |
|
|
| 1 |
|
|
| 1 |
|
|
| 1 |
|
|
| 1 |
|
|
| 2023 |
|
| 2024 |
|
| 2025 |
|
| 2026 |
|
| 2027 |
| |||||
|
| $ |
|
| $ |
|
| $ |
|
| $ |
|
| $ |
| |||||
Amortization expense related to intangible assets |
|
| 1 |
|
|
| 1 |
|
|
| 1 |
|
|
| 1 |
|
|
| 1 |
|
The Company performed its annual impairment test on its indefinite-lived intangible assets at October 1, 2020, 2019 and 2018, using a quantitative approach, except for the license rights and water rights, where the Company used a qualitative approach, and determined that the estimated fair values of its indefinite-lived intangible assets exceeded their carrying amounts. NaN impairment charge was recorded for indefinite-lived intangible assets during 2020, 2019 or 2018.
9285
DOMTAR CORPORATION
NOTES TO CONSOLIDATED FINANCIAL STATEMENTS
DECEMBER 31, 20202022
(IN MILLIONS OF DOLLARS, UNLESS OTHERWISE NOTEDNOTED))
NOTE 13.
NOTE 15.
OTHER ASSETS
The following table presents the components of other assets:
|
| December 31, |
|
| December 31, |
| ||
|
| 2020 |
|
| 2019 |
| ||
|
| $ |
|
| $ |
| ||
Pension asset - defined benefit pension plans (Note 7) |
|
| 152 |
|
|
| 141 |
|
Investment tax credits receivable |
|
| 4 |
|
|
| 5 |
|
Unamortized debt issuance costs |
|
| 3 |
|
|
| 3 |
|
Derivative financial instruments (Note 23) |
|
| 17 |
|
|
| 4 |
|
Equity swap contracts (Note 23) |
|
| 2 |
|
|
| — |
|
Investments and advances |
|
| 6 |
|
|
| 5 |
|
Other |
|
| 5 |
|
|
| 5 |
|
|
|
| 189 |
|
|
| 163 |
|
|
| Successor |
| |||||
|
| December 31, |
|
| December 31, |
| ||
|
| 2022 |
|
| 2021 |
| ||
|
| $ |
|
| $ |
| ||
Pension asset - defined benefit pension plans |
|
| 219 |
|
|
| 248 |
|
Other |
|
| 32 |
|
|
| 25 |
|
|
|
| 251 |
|
|
| 273 |
|
9386
DOMTAR CORPORATION
NOTES TO CONSOLIDATED FINANCIAL STATEMENTS
DECEMBER 31, 20202022
(IN MILLIONS OF DOLLARS, UNLESS OTHERWISE NOTEDNOTED))
NOTE 14.
NOTE 16.
CLOSURE AND RESTRUCTURING COSTS AND IMPAIRMENT OF LONG-LIVED ASSETS
At December 31,Cost reduction program
In 2020, the Company’s total provision for the withdrawal liabilities of its U.S. multiemployer plans was $42 million.
Cost reduction program
The Company is implementingimplemented a cost savings program. As part of this program, onin August 7, 2020, the Company announced the permanent closure of the uncoated freesheet manufacturing at the Kingsport, Tennessee and Port Huron, Michigan mills, the remaining paper machine at the Ashdown, Arkansas mill and the converting center in Ridgefields, Tennessee. Additionally, in May 2021, the Company announced the closure of the converting center in Dallas, Texas. These actions will reducereduced the Company’s annual uncoated freesheet paper capacity by approximately 721,000 short tons and will resultresulted in a workforce reduction of approximately 750 employees. The KingsportFor the year ended December 31, 2022, the Company recorded nil of accelerated depreciation under Impairment of long-lived assets and Ashdown paper machines, which have been idled since April 2020, did not recommence operations. The Ridgefields converting center ceased operations atnil of closure costs under Closure and restructuring costs on the endConsolidated Statement of Earnings (Loss) and Comprehensive Income (Loss).
For the third quarter1 month ended December 31, 2021 and the 11 months ended November 30, 2021, the Company recorded nil and $9 million, respectively, of 2020, whileaccelerated depreciation under Impairment of long-lived assets and a reversal of $1 million and $17 million, respectively, of closure costs, under Closure and restructuring costs on the Port Huron mill is expected to shut down by the endConsolidated Statement of the first quarter of 2021.Earnings (Loss) and Comprehensive Income (Loss).
The Company plans to enter the linerboard market with the conversion of the Kingsport paper machine. Domtar estimates the conversion cost to be between $300 and $350 million. As a result of the decision to change the nature and use of the Kingsport, Tenessee mill, the carrying amount of the remaining assets of the Kingsport mill has been tested for impairment in the third quarter and resulted in no additional impairment charge. The carrying amount of these assets was approximately $80 million at September 30, 2020. The Company is also completing the conversion of the Ashdown mill to 100% softwood and fluff pulp, which is requiring $15 to $20 million of capital investments and is expected to be completed within six to nine months. For the year ended December 31, 2020, the Company recorded $136$136 million of accelerated depreciation under Impairment of long-lived assets on the Consolidated Statement of Earnings (Loss) and Comprehensive Income (Loss). Additionally, the Company recorded $33$99 million of closure costs, largely related to severance costs, inventory write downs and termination costs, $31 million of inventory obsolescence, $12 million of environmental costs, $2 million of pension curtailment loss, $2 million of pension settlement loss and $18 million of licenses fees, write-offs and other costs,liabilities, under Closure and restructuring costs on the Consolidated Statement of Earnings (Loss) and Comprehensive Income (Loss).
Ashdown, ArkansasConversion of Kingsport, Tennessee mill and Port Huron, Michigan mill
On September 27, 2019, the Company’s Board of Directors approved the decision to permanently shut down 2 paper machines, which was announced on October 3, 2019. The closures took place atCompany plans to enter the Ashdown, Arkansas pulplinerboard market with the conversion of the Kingsport paper machine. Once in full operation, the mill will produce and paper millmarket approximately 600,000 tons annually of high-quality recycled linerboard and medium, providing the Port Huron, Michigan paper mill.
Company with a strategic footprint in a growing adjacent market. The conversion was completed in January 2023. For the year ended December 31, 2019,2022, the Company recorded $32$67 million of accelerated depreciation under Impairment of long-lived assets and $1 million of accelerated depreciation under Depreciation and amortization,Asset conversion costs on the Consolidated Statement of Earnings (Loss) and Comprehensive Income (Loss). Additionally,
For the 1 month ended December 31, 2021 and the 11 months ended November 30, 2021, the Company recorded $3$3 million and $27 million, respectively, under Asset conversion costs on the Consolidated Statement of severanceEarnings (Loss) and termination costs, $4 million of inventory obsolescence, and $2 million of other costs, under Closure and restructuring costs.Comprehensive Income (Loss).
Concurrently, with the Ashdown paper machine closure and related workforce reduction, management negotiated a voluntary early retirement program to reduce costs and put the mill in a stronger cost position in the long-term. The Company additionally recorded $13 million of severance and termination costs under Closure and restructuring costs.
Other costs
During 2020 other costs related to previous and ongoing closures and restructuring included $1 million of severance and termination costs (2019 and 2018 – nil).
94
DOMTAR CORPORATION
NOTES TO CONSOLIDATED FINANCIAL STATEMENTS
DECEMBER 31, 2020
(IN MILLIONS OF DOLLARS, UNLESS OTHERWISE NOTED)
NOTE 16. CLOSURE AND RESTRUCTURING COSTS AND IMPAIRMENT OF LONG-LIVED ASSETS (CONTINUED)
The following tables provide the components of closure and restructuring costs:
|
| Year ended |
| |||||||||
|
| December 31, 2020 |
| |||||||||
|
| Pulp and Paper |
|
| Corporate |
|
| Total |
| |||
|
| $ |
|
| $ |
|
| $ |
| |||
Severance and termination costs |
|
| 33 |
|
|
| 1 |
|
|
| 34 |
|
Inventory write-down (storeroom, spare parts and other) |
|
| 31 |
|
|
| — |
|
|
| 31 |
|
Environmental costs |
|
| 12 |
|
|
| — |
|
|
| 12 |
|
Pension curtailment and settlement charges |
|
| 4 |
|
|
| — |
|
|
| 4 |
|
Licenses fees, write-offs and other costs |
|
| 16 |
|
|
| 2 |
|
|
| 18 |
|
Closure and restructuring costs |
|
| 96 |
|
|
| 3 |
|
|
| 99 |
|
|
| Year ended |
| |||||
|
| December 31, 2019 |
| |||||
|
| Pulp and Paper |
|
| Total |
| ||
|
| $ |
|
| $ |
| ||
Severance and termination costs |
|
| 16 |
|
|
| 16 |
|
Inventory write-down |
|
| 4 |
|
|
| 4 |
|
Other costs |
|
| 2 |
|
|
| 2 |
|
Closure and restructuring costs |
|
| 22 |
|
|
| 22 |
|
The following table provides the activity in the closure and restructuring and transaction costs liability:
|
| December 31, |
|
| December 31, |
| ||
|
| 2022 |
|
| 2021 |
| ||
|
| $ |
|
| $ |
| ||
Balance at beginning of year |
|
| 24 |
|
|
| 28 |
|
Additions (1) |
|
| 31 |
|
|
| 21 |
|
Payments |
|
| (41 | ) |
|
| (25 | ) |
Balance at end of year (2) |
|
| 14 |
|
|
| 24 |
|
|
| December 31, |
|
| December 31, |
| ||
|
| 2020 |
|
| 2019 |
| ||
|
| $ |
|
| $ |
| ||
Balance at beginning of year |
|
| 12 |
|
|
| 2 |
|
Additions |
|
| 48 |
|
|
| 12 |
|
Payments |
|
| (32 | ) |
|
| (1 | ) |
Reversal |
|
| — |
|
|
| (1 | ) |
Balance at end of year (1) |
|
| 28 |
|
|
| 12 |
|
|
|
The $28$14 million provision is comprised of severance and termination costs of which $9$1 million and $6 million relaterelated to the Pulp and Paper business, as well as transaction costs of $5 million and Corporate, respectively and licenseslicense fees and other costs of $13$8 million relaterelated to Corporate.
87
DOMTAR CORPORATION
NOTES TO CONSOLIDATED FINANCIAL STATEMENTS
DECEMBER 31, 2022
(IN MILLIONS OF DOLLARS, UNLESS OTHERWISE NOTED)
NOTE 14. CLOSURE AND RESTRUCTURING COSTS AND IMPAIRMENT OF LONG-LIVED ASSETS
(CONTINUED)
Closure and restructuring costs are based on management’s best estimates at December 31, 2020.2022. Actual costs may differ from these estimates due to subsequent developments such as the results of environmental studies, the ability to find a buyer for assets set to be dismantled and demolished and other business developments. As such, additional costs and further impairment charges may be required in future periods.
9588
DOMTAR CORPORATION
NOTES TO CONSOLIDATED FINANCIAL STATEMENTS
DECEMBER 31, 20202022
(IN MILLIONS OF DOLLARS, UNLESS OTHERWISE NOTEDNOTED))
NOTE 15.
NOTE 17.
TRADE AND OTHER PAYABLES
The following table presents the components of trade and other payables:
|
| December 31, |
|
| December 31, |
| ||
|
| 2020 |
|
| 2019 |
| ||
|
| $ |
|
| $ |
| ||
Trade payables |
|
| 260 |
|
|
| 310 |
|
Payroll-related accruals |
|
| 104 |
|
|
| 99 |
|
Accrued interest |
|
| 16 |
|
|
| 16 |
|
Payables on capital projects |
|
| 13 |
|
|
| 27 |
|
Rebate accruals |
|
| 44 |
|
|
| 58 |
|
Liability - pension and other post-retirement benefit plans (Note 7) |
|
| 5 |
|
|
| 5 |
|
Liability - multiemployer plan withdrawal |
|
| 2 |
|
|
| 2 |
|
Provision for environment and other asset retirement obligations (Note 22) |
|
| 10 |
|
|
| 8 |
|
Closure and restructuring costs liability (Note 16) |
|
| 22 |
|
|
| 12 |
|
Derivative financial instruments (Note 23) |
|
| 3 |
|
|
| 11 |
|
Dividends payable (Note 21) |
|
| — |
|
|
| 26 |
|
Stock-based compensation - liability awards (Note 23) |
|
| 5 |
|
|
| 6 |
|
|
|
| 484 |
|
|
| 580 |
|
|
| Successor |
| |||||
|
| December 31, |
|
| December 31, |
| ||
|
| 2022 |
|
| 2021 |
| ||
|
| $ |
|
| $ |
| ||
Trade payables |
|
| 367 |
|
|
| 297 |
|
Payroll-related accruals |
|
| 128 |
|
|
| 131 |
|
Other accruals |
|
| 122 |
|
|
| 115 |
|
|
|
| 617 |
|
|
| 543 |
|
9689
DOMTAR CORPORATION
NOTES TO CONSOLIDATED FINANCIAL STATEMENTS
DECEMBER 31, 20202022
(IN MILLIONS OF DOLLARS, UNLESS OTHERWISE NOTEDNOTED))
NOTE 16.
NOTE 18.
CHANGES IN ACCUMULATED OTHER COMPREHENSIVE LOSSINCOME (LOSS) BY COMPONENT
The following table presents the changes in Accumulated other comprehensive lossincome (loss) by component(1) for the periods ended November 30, 2021, December 31, 20202021 and 2019.December 31, 2022.
|
| Net derivative |
|
| Pension items(2) |
|
| Post-retirement |
|
| Foreign currency |
|
| Total |
| |||||
Predecessor |
| $ |
|
| $ |
|
| $ |
|
| $ |
|
| $ |
| |||||
Balance at December 31, 2020 |
|
| 34 |
|
|
| (207 | ) |
|
| 8 |
|
|
| (139 | ) |
|
| (304 | ) |
Natural gas swap contracts |
|
| 22 |
|
| N/A |
|
| N/A |
|
| N/A |
|
|
| 22 |
| |||
Foreign exchange forward contracts |
|
| 2 |
|
| N/A |
|
| N/A |
|
| N/A |
|
|
| 2 |
| |||
Net gain |
| N/A |
|
|
| 85 |
|
|
| 5 |
|
| N/A |
|
|
| 90 |
| ||
Foreign currency items |
| N/A |
|
| N/A |
|
| N/A |
|
|
| 57 |
|
|
| 57 |
| |||
Other comprehensive income before |
|
| 24 |
|
|
| 85 |
|
|
| 5 |
|
|
| 57 |
|
|
| 171 |
|
Amounts reclassified from Accumulated other |
|
| (31 | ) |
|
| 10 |
|
|
| (1 | ) |
|
| — |
|
|
| (22 | ) |
Net current period other comprehensive |
|
| (7 | ) |
|
| 95 |
|
|
| 4 |
|
|
| 57 |
|
|
| 149 |
|
Balance at November 30, 2021 |
|
| 27 |
|
|
| (112 | ) |
|
| 12 |
|
|
| (82 | ) |
|
| (155 | ) |
Elimination of Predecessor's Accumulated |
|
| (27 | ) |
|
| 112 |
|
|
| (12 | ) |
|
| 82 |
|
|
| 155 |
|
Balance at November 30, 2021 |
|
| — |
|
|
| — |
|
|
| — |
|
|
| — |
|
|
| — |
|
|
| Net derivative |
|
|
|
|
|
|
|
|
|
|
|
|
|
|
|
|
| |
|
| gains (losses) on |
|
|
|
|
|
| Post-retirement |
|
| Foreign currency |
|
|
|
|
| |||
|
| cash flow hedges |
|
| Pension items(2) |
|
| benefit items(2) |
|
| items |
|
| Total |
| |||||
|
| $ |
|
| $ |
|
| $ |
|
| $ |
|
| $ |
| |||||
Balance at December 31, 2018 |
|
| (24 | ) |
|
| (231 | ) |
|
| 11 |
|
|
| (223 | ) |
|
| (467 | ) |
Natural gas swap contracts |
|
| (10 | ) |
| N/A |
|
| N/A |
|
| N/A |
|
|
| (10 | ) | |||
Currency options |
|
| 5 |
|
| N/A |
|
| N/A |
|
| N/A |
|
|
| 5 |
| |||
Foreign exchange forward contracts |
|
| 16 |
|
| N/A |
|
| N/A |
|
| N/A |
|
|
| 16 |
| |||
Net gain |
| N/A |
|
|
| 1 |
|
|
| 1 |
|
| N/A |
|
|
| 2 |
| ||
Foreign currency items |
| N/A |
|
| N/A |
|
| N/A |
|
|
| 21 |
|
|
| 21 |
| |||
Other comprehensive income before reclassifications |
|
| 11 |
|
|
| 1 |
|
|
| 1 |
|
|
| 21 |
|
|
| 34 |
|
Amounts reclassified from Accumulated other comprehensive loss |
|
| 8 |
|
|
| 33 |
|
|
| (1 | ) |
|
| — |
|
|
| 40 |
|
Net current period other comprehensive income |
|
| 19 |
|
|
| 34 |
|
|
| — |
|
|
| 21 |
|
|
| 74 |
|
Balance at December 31, 2019 |
|
| (5 | ) |
|
| (197 | ) |
|
| 11 |
|
|
| (202 | ) |
|
| (393 | ) |
Natural gas swap contracts |
|
| 1 |
|
| N/A |
|
| N/A |
|
| N/A |
|
|
| 1 |
| |||
Currency options |
|
| 3 |
|
| N/A |
|
| N/A |
|
| N/A |
|
|
| 3 |
| |||
Foreign exchange forward contracts |
|
| 23 |
|
| N/A |
|
| N/A |
|
| N/A |
|
|
| 23 |
| |||
Net loss |
| N/A |
|
|
| (21 | ) |
|
| (1 | ) |
| N/A |
|
|
| (22 | ) | ||
Foreign currency items |
| N/A |
|
| N/A |
|
| N/A |
|
|
| 63 |
|
|
| 63 |
| |||
Other comprehensive income (loss) before reclassifications |
|
| 27 |
|
|
| (21 | ) |
|
| (1 | ) |
|
| 63 |
|
|
| 68 |
|
Amounts reclassified from Accumulated other comprehensive loss |
|
| 12 |
|
|
| 11 |
|
|
| (2 | ) |
|
| — |
|
|
| 21 |
|
Net current period other comprehensive income (loss) |
|
| 39 |
|
|
| (10 | ) |
|
| (3 | ) |
|
| 63 |
|
|
| 89 |
|
Balance at December 31, 2020 |
|
| 34 |
|
|
| (207 | ) |
|
| 8 |
|
|
| (139 | ) |
|
| (304 | ) |
|
|
|
|
9790
DOMTAR CORPORATION
NOTES TO CONSOLIDATED FINANCIAL STATEMENTS
DECEMBER 31, 20202022
(IN MILLIONS OF DOLLARS, UNLESS OTHERWISE NOTEDNOTED))
NOTE 18.16. CHANGES IN ACCUMULATED OTHER COMPREHENSIVE LOSSINCOME (LOSS) BY COMPONENT (CONTINUED)
|
| Net derivative |
|
| Pension items(2) |
|
| Post-retirement |
|
| Foreign currency |
|
| Total |
| |||||
Successor |
| $ |
|
| $ |
|
| $ |
|
| $ |
|
| $ |
| |||||
Balance at November 30, 2021 |
|
| — |
|
|
| — |
|
|
| — |
|
|
| — |
|
|
| — |
|
Natural gas swap contracts |
|
| (3 | ) |
| N/A |
|
| N/A |
|
| N/A |
|
|
| (3 | ) | |||
Foreign exchange forward contracts |
|
| 3 |
|
| N/A |
|
| N/A |
|
| N/A |
|
|
| 3 |
| |||
Net gain (loss) |
| N/A |
|
|
| 17 |
|
|
| (1 | ) |
| N/A |
|
|
| 16 |
| ||
Foreign currency items |
| N/A |
|
| N/A |
|
| N/A |
|
|
| 8 |
|
|
| 8 |
| |||
Other comprehensive income (loss) before |
|
| — |
|
|
| 17 |
|
|
| (1 | ) |
|
| 8 |
|
|
| 24 |
|
Amounts reclassified from Accumulated other |
|
| — |
|
|
| — |
|
|
| — |
|
|
| — |
|
|
| — |
|
Net current period other comprehensive |
|
| — |
|
|
| 17 |
|
|
| (1 | ) |
|
| 8 |
|
|
| 24 |
|
Balance at December 31, 2021 |
|
| — |
|
|
| 17 |
|
|
| (1 | ) |
|
| 8 |
|
|
| 24 |
|
Natural gas swap contracts |
|
| 14 |
|
| N/A |
|
| N/A |
|
| N/A |
|
|
| 14 |
| |||
Currency options |
|
| (2 | ) |
| N/A |
|
| N/A |
|
| N/A |
|
|
| (2 | ) | |||
Foreign exchange forward contracts |
|
| (16 | ) |
| N/A |
|
| N/A |
|
| N/A |
|
|
| (16 | ) | |||
Net (loss) gain |
| N/A |
|
|
| (11 | ) |
|
| 9 |
|
| N/A |
|
|
| (2 | ) | ||
Foreign currency items |
| N/A |
|
| N/A |
|
| N/A |
|
|
| (70 | ) |
|
| (70 | ) | |||
Other comprehensive (loss) income before |
|
| (4 | ) |
|
| (11 | ) |
|
| 9 |
|
|
| (70 | ) |
|
| (76 | ) |
Amounts reclassified from Accumulated other |
|
| (8 | ) |
|
| (7 | ) |
|
| (1 | ) |
|
| — |
|
|
| (16 | ) |
Net current period other comprehensive |
|
| (12 | ) |
|
| (18 | ) |
|
| 8 |
|
|
| (70 | ) |
|
| (92 | ) |
Balance at December 31, 2022 |
|
| (12 | ) |
|
| (1 | ) |
|
| 7 |
|
|
| (62 | ) |
|
| (68 | ) |
91
DOMTAR CORPORATION
NOTES TO CONSOLIDATED FINANCIAL STATEMENTS
DECEMBER 31, 2022
(IN MILLIONS OF DOLLARS, UNLESS OTHERWISE NOTED)
NOTE 16. CHANGES IN ACCUMULATED OTHER COMPREHENSIVE INCOME (LOSS) BY COMPONENT (CONTINUED)
The following table presents reclassifications out of Accumulated other comprehensive loss:income (loss):
|
|
|
|
|
|
| |||||||||||
|
|
|
|
|
|
| |||||||||||
Details about Accumulated other comprehensive |
| Amounts reclassified from |
| ||||||||||||||
|
| Successor | Predecessor |
| |||||||||||||
|
| Year ended |
|
| Period from |
|
|
| Period from |
|
| Year ended |
| ||||
|
| $ |
|
| $ |
|
|
| $ |
|
| $ |
| ||||
Net derivative gains (losses) on cash flow hedge |
|
|
|
|
|
|
|
|
|
|
|
|
| ||||
Natural gas swap contracts (1) |
|
| 16 |
|
|
| — |
|
|
|
| 10 |
|
|
| (10 | ) |
Currency options and forwards (1) |
|
| (6 | ) |
|
| — |
|
|
|
| 38 |
|
|
| (6 | ) |
Net investment hedge (2) |
|
| — |
|
|
| — |
|
|
|
| (9 | ) |
|
| — |
|
Total before tax |
|
| 10 |
|
|
| — |
|
|
|
| 39 |
|
|
| (16 | ) |
Tax (expense) benefit |
|
| (2 | ) |
|
| — |
|
|
|
| (8 | ) |
|
| 4 |
|
Net of tax |
|
| 8 |
|
|
| — |
|
|
|
| 31 |
|
|
| (12 | ) |
|
|
|
|
|
|
|
|
|
|
|
|
|
| ||||
Amortization of defined benefit pension items |
|
|
|
|
|
|
|
|
|
|
|
|
| ||||
Amortization of net actuarial gain (loss) (3)(4) |
|
| 9 |
|
|
| — |
|
|
|
| (7 | ) |
|
| (12 | ) |
Amortization of prior year service cost (3) |
|
| — |
|
|
| — |
|
|
|
| (1 | ) |
|
| (2 | ) |
Discontinued operations |
|
| — |
|
|
| — |
|
|
|
| (4 | ) |
|
| — |
|
Total before tax |
|
| 9 |
|
|
| — |
|
|
|
| (12 | ) |
|
| (14 | ) |
Tax (expense) benefit |
|
| (2 | ) |
|
| — |
|
|
|
| 2 |
|
|
| 3 |
|
Net of tax |
|
| 7 |
|
|
| — |
|
|
|
| (10 | ) |
|
| (11 | ) |
|
|
|
|
|
|
|
|
|
|
|
|
|
| ||||
Amortization of other post-retirement benefit items |
|
|
|
|
|
|
|
|
|
|
|
|
| ||||
Amortization of net actuarial gain (3) |
|
| — |
|
|
| — |
|
|
|
| 1 |
|
|
| 1 |
|
Amortization of prior year service credit (3) |
|
| — |
|
|
| — |
|
|
|
| 1 |
|
|
| 1 |
|
Discontinued operations |
|
| 1 |
|
|
| — |
|
|
|
| — |
|
|
| — |
|
Total before tax |
|
| 1 |
|
|
| — |
|
|
|
| 2 |
|
|
| 2 |
|
Tax expense |
|
| — |
|
|
| — |
|
|
|
| (1 | ) |
|
| — |
|
Net of tax |
|
| 1 |
|
|
| — |
|
|
|
| 1 |
|
|
| 2 |
|
|
|
|
| |||||||||
|
|
|
| |||||||||
Details about Accumulated other comprehensive loss components |
| Amount reclassified from Accumulated other comprehensive loss |
| |||||||||
|
| Year ended |
|
| Year ended |
|
| Year ended |
| |||
|
| December 31, |
|
| December 31, |
|
| December 31, |
| |||
|
| 2020 |
|
| 2019 |
|
| 2018 |
| |||
|
| $ |
|
| $ |
|
| $ |
| |||
Net derivative (losses) gains on cash flow hedge |
|
|
|
|
|
|
|
|
|
|
|
|
Natural gas swap contracts (1) |
|
| (10 | ) |
|
| (4 | ) |
|
| 2 |
|
Currency options and forwards (1) |
|
| (6 | ) |
|
| (7 | ) |
|
| 1 |
|
Total before tax |
|
| (16 | ) |
|
| (11 | ) |
|
| 3 |
|
Tax benefit (expense) |
|
| 4 |
|
|
| 3 |
|
|
| (1 | ) |
Net of tax |
|
| (12 | ) |
|
| (8 | ) |
|
| 2 |
|
|
|
|
|
|
|
|
|
|
|
|
|
|
Amortization of defined benefit pension items |
|
|
|
|
|
|
|
|
|
|
|
|
Amortization of net actuarial loss (2)(3) |
|
| (12 | ) |
|
| (40 | ) |
|
| (8 | ) |
Amortization of prior year service cost (2) |
|
| (2 | ) |
|
| (5 | ) |
|
| (5 | ) |
Total before tax |
|
| (14 | ) |
|
| (45 | ) |
|
| (13 | ) |
Tax benefit |
|
| 3 |
|
|
| 12 |
|
|
| 3 |
|
Net of tax |
|
| (11 | ) |
|
| (33 | ) |
|
| (10 | ) |
|
|
|
|
|
|
|
|
|
|
|
|
|
Amortization of other post-retirement benefit items |
|
|
|
|
|
|
|
|
|
|
|
|
Amortization of net actuarial gain (2) |
|
| 1 |
|
|
| 1 |
|
|
| 1 |
|
Amortization of prior year service credit (2) |
|
| 1 |
|
|
| 1 |
|
|
| — |
|
Total before tax |
|
| 2 |
|
|
| 2 |
|
|
| 1 |
|
Tax expense |
|
| — |
|
|
| (1 | ) |
|
| — |
|
Net of tax |
|
| 2 |
|
|
| 1 |
|
|
| 1 |
|
|
|
|
|
|
|
98
DOMTAR CORPORATION
NOTES TO CONSOLIDATED FINANCIAL STATEMENTS
DECEMBER 31, 20202022
(IN MILLIONS OF DOLLARS, UNLESS OTHERWISE NOTEDNOTED))
NOTE 17.
NOTE 19.
LONG-TERM DEBT
|
|
|
| Par |
|
|
|
| December 31, |
|
| December 31, |
| |||
|
| Maturity |
| Amount |
|
| Currency |
| 2020 |
|
| 2019 |
| |||
|
|
|
| $ |
|
|
|
| $ |
|
| $ |
| |||
Unsecured notes |
|
|
|
|
|
|
|
|
|
|
|
|
|
|
|
|
4.4% Notes |
| 2022 |
|
| 300 |
|
| US |
|
| 300 |
|
|
| 300 |
|
6.25% Notes |
| 2042 |
|
| 250 |
|
| US |
|
| 249 |
|
|
| 249 |
|
6.75% Notes |
| 2044 |
|
| 250 |
|
| US |
|
| 250 |
|
|
| 250 |
|
Term Loan |
| 2025 |
|
| — |
|
| US |
|
| 294 |
|
|
| — |
|
Revolving Credit Facility |
| 2023 |
|
| — |
|
| US |
|
| — |
|
|
| 80 |
|
Securitization |
| 2021 |
|
| — |
|
| US |
|
| — |
|
|
| 55 |
|
Finance lease obligations and other |
| 2021 - 2032 |
|
|
|
|
|
|
|
| 10 |
|
|
| 9 |
|
|
|
|
|
|
|
|
|
|
|
| 1,103 |
|
|
| 943 |
|
|
|
|
|
|
|
|
|
|
|
|
|
|
|
|
|
|
Less: Unamortized debt issuance costs |
|
|
|
|
|
|
|
|
|
| 6 |
|
|
| 5 |
|
|
|
|
|
|
|
|
|
|
|
|
|
|
|
|
|
|
Less: Due within one year |
|
|
|
|
|
|
|
|
|
| 13 |
|
|
| 1 |
|
|
|
|
|
|
|
|
|
|
|
| 1,084 |
|
|
| 937 |
|
|
|
|
|
|
|
|
|
| Successor |
| ||||||
|
|
|
| Par |
|
|
|
| December 31, |
|
| December 31, |
| |||
|
| Maturity |
| Amount |
|
| Currency |
| 2022 |
|
| 2021 |
| |||
|
|
|
| $ |
|
|
|
| $ |
|
| $ |
| |||
Unsecured notes |
|
|
|
|
|
|
|
|
|
|
|
|
| |||
6.25% Notes |
| 2042 |
|
| 116 |
|
| US |
|
| 121 |
|
|
| 264 |
|
6.75% Notes |
| 2044 |
|
| 150 |
|
| US |
|
| 157 |
|
|
| 262 |
|
Senior secured notes |
|
|
|
|
|
|
|
|
|
|
|
|
| |||
6.75% Notes |
| 2028 |
|
| 642 |
|
| US |
|
| 642 |
|
|
| 775 |
|
ABL Revolving Credit Facility |
| 2026 |
|
| — |
|
| US |
|
| — |
|
|
| 115 |
|
First Lien Term Loan |
| 2028 |
|
| 645 |
|
| US |
|
| 639 |
|
|
| 520 |
|
Finance lease obligations |
| 2022 - 2028 |
|
|
|
|
|
|
| 4 |
|
|
| 4 |
| |
|
|
|
|
|
|
|
|
|
| 1,563 |
|
|
| 1,940 |
| |
|
|
|
|
|
|
|
|
|
|
|
|
|
| |||
Less: Unamortized debt issuance costs |
|
|
|
|
|
|
|
|
| 27 |
|
|
| 38 |
| |
|
|
|
|
|
|
|
|
|
|
|
|
|
| |||
Less: Due within one year |
|
|
|
|
|
|
|
|
| 33 |
|
|
| 259 |
| |
|
|
|
|
|
|
|
|
|
| 1,503 |
|
|
| 1,643 |
| |
Principal long-term debt repayments, including finance lease obligations, in each of the next five years will amount to:
|
| Long-term debt |
|
| Finance leases and other |
| ||||||||||
|
| $ |
|
| $ |
|
| Long-term |
|
| Finance |
| ||||
2021 |
|
| 12 |
|
|
| 1 |
| ||||||||
2022 |
|
| 312 |
|
|
| 2 |
| ||||||||
|
| $ |
|
| $ |
| ||||||||||
2023 |
|
| 12 |
|
|
| 2 |
|
|
| 33 |
|
|
| 1 |
|
2024 |
|
| 12 |
|
|
| 2 |
|
|
| 33 |
|
|
| 1 |
|
2025 |
|
| 246 |
|
|
| 1 |
|
|
| 33 |
|
|
| 1 |
|
2026 |
|
| 33 |
|
|
| 1 |
| ||||||||
2027 |
|
| 33 |
|
|
| 1 |
| ||||||||
Thereafter |
|
| 500 |
|
|
| 5 |
|
|
| 1,388 |
|
|
| — |
|
|
|
| 1,094 |
|
|
| 13 |
|
|
| 1,553 |
|
|
| 5 |
|
Less: Amounts representing interest |
|
| — |
|
|
| 3 |
|
|
| — |
|
|
| 1 |
|
Total payments |
|
| 1,094 |
|
|
| 10 |
|
|
| 1,553 |
|
|
| 4 |
|
ABL REVOLVING CREDIT FACILITY
On November 30, 2021, the Company entered into an ABL Revolving Credit Facility that matures on November 30, 2026. The ABL Revolving Credit Facility is available to Domtar Corporation and certain other domestic and Canadian subsidiaries and provides for revolving loans and letters of credit in an aggregate amount of up to $400 million, subject to borrowing base capacity. At December 31, 2022, the Company had no borrowings and $64 million of letters of credit outstanding.
99Borrowings under the ABL Revolving Credit Facility is limited by borrowing base calculations based on the sum of specified percentages of eligible accounts receivable, plus specified percentages of eligible inventory, plus specified percentages of qualified cash, minus the amount of any applicable reserves. Borrowings bear interest at a floating rate, which can be either an adjusted Eurodollar rate plus an applicable margin or, at the Company’s option, a base rate plus an applicable margin.
93
DOMTAR CORPORATION
NOTES TO CONSOLIDATED FINANCIAL STATEMENTS
DECEMBER 31, 20202022
(IN MILLIONS OF DOLLARS, UNLESS OTHERWISE NOTEDNOTED))
NOTE 19.17. LONG-TERM DEBT (CONTINUED)
TERM LOAN
On May 5, 2020, the Company entered into a $300 million Term Loan Agreement (the “Term Loan Agreement”) that matures on May 5, 2025. The Company used borrowingsCompany’s obligations under the Term Loan Agreement to repay other debt and to pay related fees and expenses. Borrowings under the Term Loan Agreement bear interest at LIBOR plus a margin of 2.5% and require principal repayments of $3 million each quarter. All borrowings under the Term Loan are unsecured. Certain domestic subsidiaries of the Company guarantee the obligations arising under the Term Loan Agreement. The Term Loan Agreement contains customary covenants, including two financial covenants: (i) an interest coverage ratio, as defined in the Term Loan Agreement, that must be maintained at a level of not less than 3 to 1 and (ii) a leverage ratio, as defined in the Term Loan Agreement that must be maintained at a level of not greater than 3.75 to 1.
At December 31, 2020, the Company was in compliance with these financial covenants and had $294 million of borrowings outstanding under the Term Loan Agreement (December 31, 2019 – nil).
REVOLVING CREDIT FACILITY
The Company has an unsecured $700 million revolving credit facility (the “Credit Agreement”) with certain domestic and foreign banks that matures on August 22, 2023. The maturity date of the facility may be extended by one year and the lender commitments may be increased by up to $400 million, subject to lender approval and customary requirements. Borrowings by the Company under theABL Revolving Credit AgreementFacility are guaranteed by its significant domestic subsidiaries. Borrowings by certain foreign subsidiaries under the Credit Agreement are guaranteed by the Company, the Company’s significant domesticimmediate parent (a company with no assets other than Domtar shares) and its wholly-owned material U.S. subsidiaries and certainwholly-owned material Canadian subsidiaries. The ABL Revolving Credit Facility has a first-priority lien on the current assets of such U.S. and Canadian subsidiaries and second-priority lien on the Company’s significant foreign subsidiaries.fixed assets of its wholly-owned material U.S. subsidiaries, excluding principal properties (second in priority to the liens securing on First Lien Term Loan Facility (the “Term Loan Facility”) discussed below), in each case, subject to permitted liens.
Borrowings under the ABL Revolving Credit AgreementFacility bear interest at LIBOR, EURIBOR, Canadian bankers' acceptance or prime rate, as applicable, plus a margin linked to the Company’s credit rating.utilization of the credit. In addition, the Company pays facility fees quarterly at rates dependent onlinked to its utilization of the Company's credit ratings. The Financial Conduct Authority in the United Kingdom plans to phase out LIBOR by the end of 2021.credit. The Company does not anticipate a significant impact to its financial position from the planned phase out of LIBOR.
The ABL Revolving Credit AgreementFacility contains customary covenants, including, but not limited to, restrictions on the Company’s ability and eventsthat of defaultits subsidiaries to merge and consolidate with other companies, incur indebtedness, grant liens or security interests on assets, make acquisitions, loans, advances or investments, pay dividends, sell or otherwise transfer assets, optionally prepay or modify terms of any junior indebtedness, enter into transactions with affiliates or change its line of business.
The ABL Revolving Credit Facility requires the maintenance of a fixed charge coverage of 1.00 to 1.00 at the end of each fiscal quarter for the prior twelve month period when specified excess availability is less than the greater of $35 million and 10% of the lesser of the borrowing base and maximum borrowing capacity. This covenant did not apply at December 31, 2022.
FIRST LIEN TERM LOAN FACILITY
On November 30, 2021, the Company entered into a Term Loan Facility maturing November 30, 2028, of which $525 million was immediately drawn and up to $250 million was available on a delayed draw basis (the “Delayed Draw Term Loan”) to fund redemptions of the Existing Domtar Notes pursuant to the Domtar Notes Change of Control Offers that terminated on January 3, 2022.
Borrowings under the Term Loan Facility amortize in equal quarterly installments in an amount equal to 1% per annum of the principal amount in 2022 and 5% per annum thereafter.
The interest rate margin applicable to borrowings under the Term Loan Facility is, at the Company’s option, either (1) the base rate plus an applicable margin or (2) LIBOR plus an applicable margin. The Term Loan Facility is subject to a LIBOR floor of 0.75%.
The Company is required to prepay the Term Loan Facility and Senior Secured Notes with 100% of the net cash proceeds of certain asset sales subject to certain reinvestment rights. The Company is required to prepay the Term Loan Facility with 100% of the net cash proceeds of certain debt issuances and 50% of excess cash flow in each case, subject to certain exceptions.
The Company’s obligations under the Term Loan Facility are guaranteed by its immediate parent (a company with no assets other than Domtar shares) and all of the Issuer’s direct and indirect wholly-owned material U.S. subsidiaries. The Term Loan Facility has a first-priority lien on the fixed assets of its wholly-owned material U.S. subsidiaries’ fixed assets and a second-priority lien on the current asset collateral (second in priority to the liens securing the ABL Credit Facility discussed above), in each case, subject to other permitted liens.
The Term Loan Facility contains customary negative covenants consistent with those applicable to the Notes, including, but not limited to, restrictions on the Company’s ability and that of its restricted subsidiaries to merge and consolidate with other companies, incur indebtedness, grant liens or security interests on assets, pay dividends or make other restricted payments, sell or otherwise transfer assets or enter into transactions with affiliates.
On January 7, 2022, the Company utilized $127 million under the delayed draw term facility to fund a portion of this type, including two financial covenants: (i) anthe redemptions of the Existing Domtar Notes pursuant to the Domtar Notes Change of Control Offers that terminated on January 3, 2022. The remainder of the Delayed Draw Term Loan facility was cancelled, and $7 million repayments were made during the year, leaving total drawings under the Term Loan Facility of $645 million as of December 31, 2022.
94
DOMTAR CORPORATION
NOTES TO CONSOLIDATED FINANCIAL STATEMENTS
DECEMBER 31, 2022
(IN MILLIONS OF DOLLARS, UNLESS OTHERWISE NOTED)
NOTE 17. LONG-TERM DEBT (CONTINUED)
SENIOR SECURED NOTES
Pearl Merger Sub Inc., a newly formed, wholly-owned subsidiary of Pearl Excellence Holdco L. P., a Delaware limited partnership, was the initial issuer of the $775 million aggregate principal amount of 6.75% Senior Secured Notes due 2028 (the ‘‘Notes’’). This note issue was part of financing related to the acquisition of Domtar by Pearl Excellence Holdco L.P. Upon the completion of the acquisition, the initial issuer was merged with and into Domtar with Domtar surviving the Merger and becoming the obligor of the Notes.
The Notes will mature on October 1, 2028 and interest coverage ratio,on the Notes will be payable in cash semi-annually in arrears on April 1 and October 1 of each year, commencing on April 1, 2022.
Pending completion of the Domtar Existing Notes Change of Control Offers that terminated on January 3, 2022, $250 million of the proceeds of the Note issue was set aside as definedrestricted cash to fund approximately half of funds required to complete the Change of Control Offers. Such funds are reflected as restricted cash and included in Cash and cash equivalents on the Credit Agreement, that mustBalance Sheet at December 31, 2021. Funds not utilized were to be maintainedused to redeem a portion of the Senior Secured Notes at a level100% price.
The Company’s obligations under the Senior Secured Notes are guaranteed by its immediate parent and all of the Issuer’s direct and indirect wholly-owned material U.S. subsidiaries. The Senior Secured Notes will be secured by a lien on substantially all of the Issuer’s direct and indirect wholly-owned material U.S. subsidiaries’ fixed assets and a second-priority lien on the Current Asset Collateral (second in priority to the liens securing the ABL Credit Facility discussed above), in each case, subject to other permitted liens. The notes rank pari passu with the First Lien Term Loan Facility, subject to intercreditor agreements.
The Senior Secured Notes contain customary negative covenants consistent with those applicable to the Notes, including, but not less thanlimited to, restrictions on the Company’s ability and that of its restricted subsidiaries to merge and consolidate with other companies, incur indebtedness, grant liens or security interests on assets, pay dividends or make other restricted payments, sell or otherwise transfer assets or enter into transactions with affiliates.
On January 7, 2022, $133 million of the Senior Secured Notes were redeemed, and accrued interest of $2 million were paid, as a result of the Domtar Existing Notes Change of Control Offers that terminated on January 3, to 1 and (ii) a leverage ratio,2022, leaving $642 million of Notes outstanding as defined in the Credit Agreement, that must be maintained at a level of not greater than 3.75 to 1 (or 4.00 to 1 upon the occurrence of certain qualifying material acquisitions). At December 31, 2020, the Company was in compliance with these financial covenants, and had 0 borrowings and $54 million of letters of credit outstanding under this facility (December 31, 2019 – $80 million and nil).2022.
RECEIVABLES SECURITIZATION
The Company hashad a $150$150 million receivables securitization facility that maturesterminated in October 2021. For the 11 months ended November 2021. This facility provides additional liquidity to the Company to fund its operations or issue letters of credit. The costs under the program vary based on changes in interest rates and amounts utilized.
Sales of receivables under this program are accounted for as secured borrowings. The program consists of the ongoing sale of most of the receivables of its domestic subsidiaries to a bankruptcy remote consolidated subsidiary which, in turn, transfers a senior beneficial interest in them to a special purpose entity managed by a financial institution for multiple sellers of receivables to support borrowings or the issue of letters of credit by the Company.
The program contains certain termination events, which include, but are not limited to, matters related to receivable performance, certain defaults occurring under the Credit Agreement, or the failure by Domtar to satisfy material obligations.
At December 31, 2020, there were 0 borrowings and 0 letters of credit outstanding under this facility (2019 – $55 million and $53 million, respectively). At December 31, 2020, the Company had $111 million unused and available under this facility.
In 2020,30, 2021, a net charge of $1$1 million (2019(2020 – $2 million; 2018 – $1$1 million) resulted from the program described above and was included in Interest expense, net in the Consolidated Statements of Earnings (Loss) and Comprehensive Income (Loss).
DOMTAR UNSECURED NOTES CHANGE OF CONTROL OFFERS
Following the change of control of Domtar, Domtar was obligated, pursuant to the indenture governing the 6.25% Notes due 2042 and the 6.75% Notes due 2044 (“Existing Domtar Notes”), to make the Existing Domtar Notes Change of Control Offers, pursuant to which Domtar offered to repurchase all of the Existing Domtar Notes from holders at a purchase price of 101%.
On January 3, 2022, $134 million of the 6.25% Notes due 2042 and $100 million of the 6.75% Notes due 2044 were tendered pursuant to the offer. In addition, $3 million of premium and $6 million of accrued interest were paid. As a result, $116 million par amount ($121 million carrying value) of the 6.25% Notes due 2042 and $150 million par amount ($157 million carrying value) of the 6.75% Notes due 2044, remain outstanding as of December 31, 2022.
95
DOMTAR CORPORATION
NOTES TO CONSOLIDATED FINANCIAL STATEMENTS
DECEMBER 31, 20202022
(IN MILLIONS OF DOLLARS, UNLESS OTHERWISE NOTEDNOTED))
NOTE 18.
NOTE 20.
OTHER LIABILITIES AND DEFERRED CREDITS
The following table presents the components of other liabilities and deferred credits:
. |
| December 31, |
|
| December 31, |
| ||
|
| 2020 |
|
| 2019 |
| ||
|
| $ |
|
| $ |
| ||
Liability - other post-retirement benefit plans (Note 7) |
|
| 62 |
|
|
| 58 |
|
Pension liability - defined benefit pension plans (Note 7) |
|
| 124 |
|
|
| 101 |
|
Pension liability - multiemployer plan withdrawal |
|
| 40 |
|
|
| 42 |
|
Long-term income taxes payable |
|
| 9 |
|
|
| 9 |
|
Closure and restructuring costs liability (Note 16) |
|
| 6 |
|
|
| — |
|
Provision for environmental and asset retirement obligations (Note 22) |
|
| 37 |
|
|
| 27 |
|
Stock-based compensation - liability awards (Note 23) |
|
| 11 |
|
|
| 16 |
|
Derivative financial instruments (Note 23) |
|
| 3 |
|
|
| 8 |
|
Worker's compensation and other related accruals |
|
| 14 |
|
|
| 5 |
|
Other |
|
| 8 |
|
|
| 3 |
|
|
|
| 314 |
|
|
| 269 |
|
. |
| Successor |
| |||||
|
| December 31, |
|
| December 31, |
| ||
|
| 2022 |
|
| 2021 |
| ||
|
| $ |
|
| $ |
| ||
Liability - other post-retirement benefit plans |
|
| 34 |
|
|
| 55 |
|
Pension liability - defined benefit pension plans |
|
| 39 |
|
|
| 59 |
|
Pension liability - multiemployer plan withdrawal |
|
| 36 |
|
|
| 38 |
|
Other |
|
| 63 |
|
|
| 64 |
|
|
|
| 172 |
|
|
| 216 |
|
ASSET RETIREMENT OBLIGATIONS
The asset retirement obligations are principally linked to landfill capping obligations and demolition of certain abandoned buildings. At December 31, 2020, Domtar estimated the net present value of its asset retirement obligations to be $14 million (2019 – $13 million); the present value is based on probability weighted undiscounted cash outflows of $59 million (2019 – $58 million). The majority of the asset retirement obligations are estimated to be settled prior to December 31, 2060. Domtar’s credit adjusted risk-free rates were used to calculate the net present value of the asset retirement obligations. The rates used vary between 4.7% and 12.0%, based on the prevailing rate at the moment of recognition of the liability and on its settlement period.
The following table reconciles Domtar’s asset retirement obligations:
|
| December 31, |
|
| December 31, |
| ||
|
| 2020 |
|
| 2019 |
| ||
|
| $ |
|
| $ |
| ||
Asset retirement obligations, beginning of year |
|
| 13 |
|
|
| 12 |
|
Accretion expense |
|
| 1 |
|
|
| 1 |
|
Asset retirement obligations, end of year |
|
| 14 |
|
|
| 13 |
|
10196
DOMTAR CORPORATION
NOTES TO CONSOLIDATED FINANCIAL STATEMENTS
DECEMBER 31, 20202022
(IN MILLIONS OF DOLLARS, UNLESS OTHERWISE NOTEDNOTED))
NOTE 19.
NOTE 21.
SHAREHOLDERS’ EQUITY
DIVIDENDSAcquisition of Domtar Corporation by Paper Excellence
During 2020,On November 30, 2021, Paper Excellence completed the acquisition of all the outstanding common shares of Domtar Corporation (the “Company”) by means of a merger of Pearl Merger Sub (a wholly-owned subsidiary) with and into the Company declared one quarterly dividendwith the Company continuing as the surviving corporation and as a subsidiary of $0.455 perPaper Excellence (the “Merger”). On the terms and subject to the conditions set forth in the Merger Agreement, each share to holders of the Company’s outstanding common stock. Total dividends of approximately $25 millionstock was converted into the right to receive $55.50 in cash, upon which the shares were paid on April 15, 2020 to shareholders of record as of April 2, 2020.cancelled.
During 2019, the Company declared one quarterly dividend of $0.435 and three quarterly dividends of $0.455 per share, to holders of the Company’s common stock. Dividends aggregating $28 million, $28 million, $27 million and $26 million were paid on April 15, 2019, July 16, 2019, October 15, 2019 and January 15, 2020, respectively, to shareholders of record as of April 2, 2019, July 2, 2019, October 2, 2019 and January 2, 2020, respectively.COMMON STOCK
STOCK REPURCHASE PROGRAM
The Company’s Board of Directors has authorized a stock repurchase program (“the Program”) of up to $1.6 billion. At December 31, 2020,2022 and 2021, the Company had approximately $344 million100 common shares with a par value of remaining availability under$0.01 per share.
Prior to the Program. The Company is authorized to repurchase, from time to time, shares of its outstanding common stock on the open market or in privately negotiated transactions. The timing and amount of stock repurchases will depend on a variety of factors, including the market conditions as well as corporate and regulatory considerations. The Program may be suspended, modified or discontinued at any time, andacquisition, the Company has no obligation to repurchase any amount of its common stock under the Program. The Program has no set expiration date. The Company repurchases its common stock in part to reduce the dilutive effects of stock options and awards, and to improve shareholders’ returns.
The Company makes open market purchases of its common stock using general corporate funds. Additionally, the Company may enter into structured stock repurchase agreements with large financial institutions using general corporate funds in order to lower the average cost to acquire shares. The agreements would require the Company to make up-front payments to the counterparty financial institutions, which would result in either the receipt of stock at the beginning of the term of the agreements followed by a share adjustment at the maturity of the agreements, or the receipt of either stock or cash at the maturity of the agreements, depending upon the price of the stock.
During 2020, the Company repurchased 1,798,306 shares at an average price of $33.05 for a total cost of $59 million.
During 2019, the Company repurchased 6,220,658 shares at an average price of $35.29 for a total cost of $219 million.
CAPITAL RETURN PROGRAM
On May 5, 2020, due to the unprecedented market conditions and uncertainty caused by COVID-19, the Company suspended the payment of its regular quarterly dividend and stock repurchase program in order to preserve cash and provide additional flexibility in the current environment.
On February 11, 2021, the Company announced that it will resume its stock repurchase program. The Board of Directors will continue to evaluate the Company’s capital return program based upon customary considerations, including market conditions.
102
DOMTAR CORPORATION
NOTES TO CONSOLIDATED FINANCIAL STATEMENTS
DECEMBER 31, 2020
(IN MILLIONS OF DOLLARS, UNLESS OTHERWISE NOTED)
NOTE 21. SHAREHOLDERS’ EQUITY (CONTINUED)
The authorized stated capital consists of the following:
PREFERRED SHARES
The Company iswas authorized to issue 20 million preferred shares, par value $0.01 per share. The Board of Directors of the Company will determine the voting powers (if any) of the shares, and the preferences and relative, participating, optional or other special rights, if any, and any qualifications, limitations or restrictions thereof, of the shares at the time of issuance. NaN preferred shares were outstanding at December 31, 2020 or December 31, 2019.
COMMON STOCK
The Company is authorized to issue 2two billion shares of common stock, par value $0.01$0.01 per share. Holders of the Company’s common stock arewere entitled to one vote per share.
The changes in the number of outstanding common stock and their aggregate stated value during the years ended December 31, 20202022 and December 31, 2019,2021, were as follows:
|
| Successor |
|
|
| Predecessor |
| ||||||||||||||||||
|
| December 31, |
|
| December 31, |
|
|
| November 30, |
| |||||||||||||||
|
| 2022 |
|
| 2021 |
|
|
| 2021 |
| |||||||||||||||
|
| Number |
|
|
|
|
| Number |
|
|
|
|
|
| Number |
|
|
|
| ||||||
Common stock |
| of shares |
|
| $ |
|
| of shares |
|
| $ |
|
|
| of shares |
|
| $ |
| ||||||
Balance at beginning |
|
| 100 |
|
|
| — |
|
|
| 50,379,090 |
|
|
| 1 |
|
|
|
| 55,194,538 |
|
|
| 1 |
|
Shares cancelled |
|
| — |
|
|
| — |
|
|
| (50,379,090 | ) |
|
| (1 | ) |
|
|
| — |
|
|
| — |
|
Shares issued |
|
|
|
|
|
|
|
|
|
|
|
|
|
|
|
|
|
|
| ||||||
Treasury stock (1) |
|
| — |
|
|
| — |
|
|
| — |
|
|
| — |
|
|
|
| (4,815,448 | ) |
|
| — |
|
Common shares |
|
| — |
|
|
| — |
|
|
| 100 |
|
|
| — |
|
|
|
| — |
|
|
| — |
|
Balance at end of period |
|
| 100 |
|
|
| — |
|
|
| 100 |
|
|
| — |
|
|
|
| 50,379,090 |
|
|
| 1 |
|
|
| December 31, |
|
| December 31, |
| ||||||||||
|
| 2020 |
|
| 2019 |
| ||||||||||
|
| Number |
|
|
|
|
|
| Number |
|
|
|
|
| ||
Common stock |
| of shares |
|
| $ |
|
| of shares |
|
| $ |
| ||||
Balance at beginning of year |
|
| 56,880,910 |
|
|
| 1 |
|
|
| 62,914,569 |
|
|
| 1 |
|
Shares issued |
|
|
|
|
|
|
|
|
|
|
|
|
|
|
|
|
Treasury stock (1) |
|
| (1,686,372 | ) |
|
| 0 |
|
|
| (6,033,659 | ) |
|
| 0 |
|
Balance at end of year |
|
| 55,194,538 |
|
|
| 1 |
|
|
| 56,880,910 |
|
|
| 1 |
|
DIVIDENDS
During 2020, the Company declared one quarterly dividend of $0.455 per share, to holders of the Company’s common stock. Total dividends of approximately $25 million were paid on April 15, 2020, to shareholders of record as of April 2, 2020. STOCK REPURCHASE PROGRAM During 2021, the Company repurchased a total of 5,060,865 shares at an average price of $46.96 for a total cost of $238 million. During 2020, the Company repurchased 1,798,306 shares at an average price of $33.05 for a total cost of $59 million. |
|
10397
DOMTAR CORPORATION
NOTES TO CONSOLIDATED FINANCIAL STATEMENTS
DECEMBER 31, 20202022
(IN MILLIONS OF DOLLARS, UNLESS OTHERWISE NOTEDNOTED))
NOTE 20.
NOTE 22.
COMMITMENTS AND CONTINGENCIES
ENVIRONMENTAL MATTERS
The Company is subject to environmental laws and regulations enacted by federal, provincial, state and local authorities. The Company may also incur substantial costs in relation to enforcement actions (including orders requiring corrective measures, installation of pollution control equipment or other remedial actions) as a result of violations of, or liabilities under, environmental laws and regulations applicable to its past and present properties. The Company’s ongoing efforts to identify potential environmental concerns that may be associated with such properties may result in additional environmental costs and liabilities which cannot be reasonably estimated at this time.
In 2020,For the year ended December 31, 2022, the Company’s operating expenses for environmental matters amounted to $62$71 million (2019(2021 – $71 million; 2018$4 million and $56 million for the 1 month ended December 31, and the 11 months ended November 30, respectively; 2020 – $68$60 million).
The Company made capital expenditures for environmental matters of $4$8 million induring the year ended December 31, 2022 (2021 – $1 million and $4 million for the 1 month ended December 31, and the 11 months ended November 30, respectively; 2020 (2019 – $19 million; 2018 – $8$2 million).
A former owner of the Company’s Dryden, Ontario manufacturing site (the "Dryden Property") operated a chlor-alkali plant during the 1960s and 1970s, during which time, mercury and other pollutants were used and discharged into the natural environment. In conjunction with the sale and redevelopment of the Dryden Property, the Province of Ontario (the “Province”) provided a broad indemnity (the "Indemnity") in 1985 to the then purchaser of the Dryden Property and its successors and assigns with respect to the discharge of any pollutant, including mercury, by the historical operators of the Dryden Property. This Indemnity subsequently was assigned to the Company in connection with its 2007 purchase of the Dryden Property.
As the current owner of the Dryden Property, the Company is actively engaged with the Province with respect to the management of the historical contamination.
The Province issued a Director's order under environmental laws to certain prior owners of the Dryden Property in connection with a nearby waste disposal site that has never been owned by the Company. The Director's order required certain work to be conducted by those prior owners. The prior owners asserted that the Indemnity covered the work required by the Director’s order. Following extensive litigation, the Supreme Court of Canada found, among other things, that the Indemnity covered third-party claims, but not first-party claims, such as the Director's order.
In the future, the Province may challenge whether the Company has the benefit of the Indemnity. In addition to the Indemnity, the CompanyDomtar has other recourses relating to the historical contamination.
The situation involving the historical contamination is continuing to develop, and the Company cannot predict its outcome. While the Company currently does not believe that it will be required to incur costs that would have a material impact on its results of operations or financial condition, there is no certainty that this is in fact the case.
10498
DOMTAR CORPORATION
NOTES TO CONSOLIDATED FINANCIAL STATEMENTS
DECEMBER 31, 20202022
(IN MILLIONS OF DOLLARS, UNLESS OTHERWISE NOTEDNOTED))
NOTE 22.20. COMMITMENTS AND CONTINGENCIES (CONTINUED)
The following table reflects changes in the reserve for environmental remediation and asset retirement obligations:obligations:
|
| December 31, |
|
| December 31, |
| ||
|
| 2022 |
|
| 2021 |
| ||
|
| $ |
|
| $ |
| ||
Balance at beginning of year |
|
| 41 |
|
|
| 42 |
|
Additions and other changes |
|
| 3 |
|
|
| 3 |
|
Environmental spending |
|
| (3 | ) |
|
| (4 | ) |
Effect of foreign currency exchange rate change |
|
| (1 | ) |
|
| — |
|
Balance at end of year (1) |
|
| 40 |
|
|
| 41 |
|
|
| December 31, |
|
| December 31, |
| ||
|
| 2020 |
|
| 2019 |
| ||
|
| $ |
|
| $ |
| ||
Balance at beginning of year |
|
| 35 |
|
|
| 37 |
|
Additions and other changes |
|
| 15 |
|
|
| 4 |
|
Environmental spending |
|
| (3 | ) |
|
| (7 | ) |
Effect of foreign currency exchange rate change |
|
| — |
|
|
| 1 |
|
Balance at end of year (1) |
|
| 47 |
|
|
| 35 |
|
|
|
At December 31, 2020,2022, $8 million is shown in Trade and other payables and $32 million is shown in Other liabilities and deferred credits.
At December 31, 2022, anticipated undiscounted payments in each of the next five years are as follows:
|
| 2021 |
|
| 2022 |
|
| 2023 |
|
| 2024 |
|
| 2025 |
|
| Thereafter |
|
| Total |
| |||||||
|
| $ |
|
| $ |
|
| $ |
|
| $ |
|
| $ |
|
| $ |
|
| $ |
| |||||||
Environmental provision and asset retirement obligations |
|
| 10 |
|
|
| 2 |
|
|
| 2 |
|
|
| 6 |
|
|
| 2 |
|
|
| 70 |
|
|
| 92 |
|
|
| 2023 |
|
| 2024 |
|
| 2025 |
|
| 2026 |
|
| 2027 |
|
| Thereafter |
|
| Total |
| |||||||
|
| $ |
|
| $ |
|
| $ |
|
| $ |
|
| $ |
|
| $ |
|
| $ |
| |||||||
Environmental provision and asset |
|
| 8 |
|
|
| 6 |
|
|
| 2 |
|
|
| 1 |
|
|
| 2 |
|
|
| 55 |
|
|
| 74 |
|
The U.S. Environmental Protection Agency (the “EPA”) and/or various state agencies have notified the Company that it may be a potentially responsible party under the Comprehensive Environmental Response Compensation and Liability Act, commonly known as “Superfund”, and similar state laws with respect to other hazardous waste sites as to which no proceedings have been instituted against the Company. The Company continues to take remedial action under its Care and Control Program at its former wood preserving sites, and at a number of operating sites, due to possible soil, sediment or groundwater contamination.
CONTINGENCIES
In the normal course of operations, the Company becomes involved in various legal actions mostly related to contract disputes, patent infringements, environmental and product warranty claims, and labor issues. While the final outcome with respect to actions outstanding or pending at December 31, 2020,2022, cannot be predicted with certainty, it is management’s opinion that their resolution will not have a material adverse effect on the Company’s financial position, results of operations or cash flows.
OTHER COMMERCIAL COMMITMENTS
The Company has commitments to purchase property, plant and equipment, roundwood, wood chips, gas and certain chemicals. Purchase orders in the normal course of business are excluded from the table below. Any amounts for which the Company is liable under purchase orders are reflected in the Consolidated Balance Sheets as Trade and other payables. Minimum future payments under these other commercial commitments, determined at December 31, 2020,2022, were as follows:
|
| 2021 |
|
| 2022 |
|
| 2023 |
|
| 2024 |
|
| 2025 |
|
| Thereafter |
|
| Total |
| |||||||
|
| $ |
|
| $ |
|
| $ |
|
| $ |
|
| $ |
|
| $ |
|
| $ |
| |||||||
Other commercial commitments |
|
| 155 |
|
|
| 10 |
|
|
| 6 |
|
|
| 6 |
|
|
| — |
|
|
| 2 |
|
|
| 179 |
|
|
| 2023 |
|
| 2024 |
|
| 2025 |
|
| 2026 |
|
| 2027 |
|
| Thereafter |
|
| Total |
| |||||||
|
| $ |
|
| $ |
|
| $ |
|
| $ |
|
| $ |
|
| $ |
|
| $ |
| |||||||
Other commercial commitments |
|
| 137 |
|
|
| 34 |
|
|
| 2 |
|
|
| — |
|
|
| — |
|
|
| — |
|
|
| 173 |
|
10599
DOMTAR CORPORATION
NOTES TO CONSOLIDATED FINANCIAL STATEMENTS
DECEMBER 31, 20202022
(IN MILLIONS OF DOLLARS, UNLESS OTHERWISE NOTEDNOTED))
NOTE 22.20. COMMITMENTS AND CONTINGENCIES (CONTINUED)
INDEMNIFICATIONS
InIn the normal course of business, the Company offers indemnifications relating to the sale of its businesses and real estate. In general, these indemnifications may relate to claims from past business operations, compliance with laws, the failure to abide by covenants and the breach of representations and warranties included in the sales agreements. Typically, such representations and warranties relate to taxation, environmental, product and employee matters. The terms of these indemnification agreements are generally for an unlimited period of time. At December 31, 2020,2022, the Company is unable to estimate the potential maximum liabilities for these types of indemnification guarantees as the amounts are contingent upon the outcome of future events, the nature and likelihood of which cannot be reasonably estimated at this time. Accordingly, 0no provision has been recorded. These indemnifications have not yielded a significant expense in the past.
Pension Plans
The Company has indemnified and held harmless the trustees of its pension funds, and the respective officers, directors, employees and agents of such trustees, from any and all costs and expenses arising out of the performance of their obligations under the relevant trust agreements, including in respect of their reliance on authorized instructions from the Company or for failing to act in the absence of authorized instructions. These indemnifications survive the termination of such agreements. At December 31, 20202022 the Company has 0tnot recorded a liability associated with these indemnifications, as it does not expect to make any payments pertaining to these indemnifications.
GENERAL RISK FACTORSCLIMATE CHANGE AND AIR QUALITY REGULATIONS
Climate change and air quality regulation
Various national and local laws and regulations relating to climate change have been established or are emerging in jurisdictions where the Company currently has, or may have in the future, manufacturing facilities or investments.
TheIn 2019, the EPA repealed the Clean Power Plan and replaced it with the “Affordable Clean Energy” (“ACE”) rule. The ACE rule was legally challenged in the U.S. Court of Appeals for the D.C. Circuit. The Court ruled the EPA wrongly understood the Clean Air Act andvacated the ACE rule and, its embeddedthe repeal of the Clean Power Plan, was vacated and sent backbut the court stayed its mandate as to the Clean Power Plan repeal to avoid reinstating that now outdated rule. However, on June 30, 2022, the Supreme Court reversed the D.C. Circuit’s decision, holding that the Clean Power Plan was an “extraordinary” case of an agency claiming transformative power over a “major question” of policy without a clear statement from Congress. The decision does not completely bar EPA from regulating greenhouse gas emissions from the power sector but prohibits the EPA from imposing standards based on “generation shifting” away from coal-fired power plants to natural gas plants and renewable resources. The EPA plans to propose a new climate change rule for further consideration. Regardless of the outcome of the EPA’s further consideration, theexisting power plants in March 2023. The Company does not expect to be disproportionately affected compared with other pulp and paper producers located in the states where the Company operates.
The province of Quebec has a greenhouse gasesgas (“GHG”) cap-and-trade system with reduction targets. British Columbia has a carbon tax that applies to the purchase of fossil fuels within the province. The Company does not expect its facilities to be disproportionately affected by these measures compared to the other pulp and paper producers located in these provinces.
The Government of Canada has established a federal carbon pricing system in provinces that do not already impose a cost on carbon emissions. The Government of Canada has imposed its carbon pricing program for regulating GHG emissions in Ontario, which took effect on January 1, 2019. To reduce GHG emissions and recognize the unique circumstances of the province’s diverse economy, Ontario finalized its own GHG Emission Performance Standards regulation. The Ontario Government has been in discussions with the Canadian Government to replace the federal program in Ontario with its provincial program. The Canadian Government has accepted Ontario’s program as an alternative to the federal program and workthe transition for Ontario facilities from the federal program to transition has begun.the Ontario program occurred on January 1, 2022. The Company does not expect to be disproportionately affected compared with other pulp and paper producers located in Ontario.
The EPA proposed to revisefinalized amendments revising certain aspects of its Industrial Boiler Maximum Achievable Control Technology Standard (“MACT”), or Boiler MACT, in a notice published on August 24, 2020.MACT. The proposedrevised rule is a responseresponded to two court decisions that remanded certain issues for further review by the EPA, and it includes revisions to 34 different emission limitations that could apply to some of the Company’s facilities. Although the EPA has indicated that a small number of facilities may need to reduce emissions further compared to the current limits, the EPA does not expect additional costs to be significant and the Company does not expect its facilities to be disproportionately affected compared to other U.S. pulp and paper producers.
106100
DOMTAR CORPORATION
NOTES TO CONSOLIDATED FINANCIAL STATEMENTS
DECEMBER 31, 20202022
(IN MILLIONS OF DOLLARS, UNLESS OTHERWISE NOTEDNOTED))
NOTE 21.
NOTE 23.
DERIVATIVES AND HEDGING ACTIVITIES AND FAIR VALUE MEASUREMENT
HEDGING PROGRAMS
The Company is exposed to market risk, such as changes in currency exchange rates, commodity prices and interest rates and prices of the Company’s common stock with regard to the Company’s stock-based compensation program.rates. To the extent the Company decides to manage the volatility related to these exposures, the Company may enter into various financial derivatives that are accounted for under the derivatives and hedging guidance. These transactions are governed by the Company's hedging policies which provide direction on acceptable hedging activities, including instrument type and acceptable counterparty exposure.
Upon inception, the Company formally documents the relationship between hedging instruments and hedged items. At inception and quarterly thereafter, the Company formally assesses whether the financial instruments used in hedging transactions are effective at offsetting changes in either the cash flow or the fair value of the underlying exposures. The Company does not hold derivative financial instruments for trading purposes.
CREDIT RISK
The Company is exposed to credit risk on accounts receivables from its customers. In order to reduce this risk, the Company reviews new customers’ credit history before granting credit and conducts regular reviews of existing customers’ credit performance. As of December 31, 2020, 22022, two customers located in the U.S. represented 15%28% or $58$144 million and 12% or $46 million, respectively, of the Company’s receivables (December 31, 20192021 – 2two customers located in the U.S. represented 14%28% or $66 million, and 13% or $65 million, respectively)$130 million).
The Company is exposed to credit risk in the event of non-performance by counterparties to its financial instruments. The Company attempts to minimize this exposure by entering into contracts with counterparties that are believed to be of high credit quality. Collateral or other security to support financial instruments subject to credit risk is usually not obtained. The credit standing of counterparties is regularly monitored.
INTEREST RATE RISK
The Company is exposed to interest rate risk arising from fluctuations in interest rates on its cash and cash equivalents, bank indebtedness, revolving credit facility, and securitization, term loan and long-term debt. The Company’s objective in managing exposure to interest rate changes is to minimize the impact of interest rate changes on earnings and cash flows and to lower its overall borrowing costs. The Company may manage this interest rate exposure through the use of derivative instruments such as interest rate swap contracts, whereby it agrees to exchange the difference between fixed and variable interest amounts calculated by reference to an agreed upon notional principal amount.
EQUITY RISK
The Company is exposed to changes in share prices with regard to its stock-based compensation program. The Company manages its exposure through the use of derivative instruments such as equity swap contracts. In March 2020, the Company entered into a total return swap agreement covering 500,000 common shares maturing on March 4, 2022.
107
DOMTAR CORPORATION
NOTES TO CONSOLIDATED FINANCIAL STATEMENTS
DECEMBER 31, 2020
(IN MILLIONS OF DOLLARS, UNLESS OTHERWISE NOTED)
NOTE 23. DERIVATIVES AND HEDGING ACTIVITIES AND FAIR VALUE MEASUREMENT (CONTINUED)
COST RISK
Cash flow hedges:
The Company is exposed to price volatility for raw materials and energy used in its manufacturing process. The Company manages its exposure to cost risk primarily through the use of supplier contracts. The Company purchases natural gas at the prevailing market price at the time of delivery. To reduce the impact on cash flow and earnings due to pricing volatility, the Company may utilize derivatives to fix the price of forecasted natural gas purchases. The changes in the fair value on qualifying instruments are included in Accumulated other comprehensive lossincome (loss) to the extent effective, and reclassified into Cost of sales in the period during which the hedged transaction affects earnings. Current contracts are used to hedge a portion of forecasted purchases of natural gas over the next 3612 months.
The following table presents the volumes under derivative financial instruments for natural gas contracts outstanding as101
DOMTAR CORPORATION
NOTES TO CONSOLIDATED FINANCIAL STATEMENTS
DECEMBER 31, 2022
(IN MILLIONS OF DOLLARS, UNLESS OTHERWISE NOTED)
NOTE 21. DERIVATIVES AND HEDGING ACTIVITIES AND FAIR VALUE MEASUREMENT (CONTINUED)
As of December 31, 2020 to hedge2022, the Company hedged 22% of its forecasted purchases:
|
|
|
|
|
|
|
|
|
|
|
|
|
|
|
|
|
|
|
|
|
|
|
|
|
|
|
|
|
|
Commodity |
| Notional contractual quantity under derivative contracts MMBtu(1) |
|
| Notional contractual value under derivative contracts (in millions of dollars) |
| Percentage of forecasted purchases under derivative contracts |
| ||||||
Natural gas |
|
|
|
|
|
|
|
|
|
|
|
|
|
|
2021 |
|
| 9,270,000 |
|
|
| $ | 27 |
|
|
| 37% |
| |
2022 |
|
| 9,270,000 |
|
|
| $ | 25 |
|
|
| 35% |
| |
2023 |
|
| 4,210,000 |
|
|
| $ | 12 |
|
|
| 15% |
| |
|
|
purchases of natural gas under derivative contracts for 2023. The natural gas derivative contracts were effective as of December 31, 2020.2022.
FOREIGN CURRENCY RISK
Cash flow hedges:
The Company has manufacturing operations in the United States and Canada. As a result, it is exposed to movements in the foreign currency exchange raterates in Canada. Moreover, certain assets and liabilities are denominated in Canadian dollars and are exposed to foreign currency movements. Accordingly, the Company’s earnings are affected by increases or decreases in the value of the Canadian dollar. The Company’s risk management policy allows it to hedge a significant portion of its exposure to fluctuations in foreign currency exchange rates for periods up to three years.years. The Company may use derivative financial instruments (currency options and foreign exchange forward contracts) to mitigate its exposure to fluctuations in foreign currency exchange rates.
Derivatives are used to hedge forecasted purchases in Canadian dollars by the Company’s Canadian subsidiary over the next 24 months. Such derivatives are designated as cash flow hedges. The changes in the fair value on qualifying instruments are included in Accumulated other comprehensive lossincome (loss) to the extent effective, and reclassified into Sales or Cost of sales in the period during which the hedged transaction affects earnings.
108
DOMTAR CORPORATION
NOTES TO CONSOLIDATED FINANCIAL STATEMENTS
DECEMBER 31, 2020
(IN MILLIONS OF DOLLARS, UNLESS OTHERWISE NOTED)
NOTE 23. DERIVATIVES AND HEDGING ACTIVITIES AND FAIR VALUE MEASUREMENT (CONTINUED)
The following table presents the currency values under significant currency positions pursuant to currency derivatives outstanding asAs of December 31, 2020 to hedge2022, the Company hedged 79% and 30% of its forecasted purchasesnet Canadian dollars cash exposures under contracts for 2023 and sales:
|
|
|
|
|
| Percentage of |
|
|
|
|
| |
|
|
|
| Notional |
| forecasted net |
|
|
|
|
| |
|
| Year of |
| contractual |
| exposures under |
|
| Average |
| Average | |
Currency exposure hedged |
| maturity |
| value |
| contracts |
|
| Protection rate |
| Obligation rate | |
|
|
|
|
|
|
|
|
|
|
|
|
|
CAD/USD |
| 2021 |
| 781 CAD |
| 82% |
|
| 1 USD = 1.3359 |
| 1 USD = 1.3536 | |
|
|
|
|
|
|
|
|
|
|
|
|
|
CAD/USD |
| 2022 |
| 382 CAD |
| 40% |
|
| 1 USD = 1.3486 |
| 1 USD = 1.3486 | |
2024, respectively. The foreign exchange derivative contracts were effective as of December 31, 2020.2022.
FAIR VALUE MEASUREMENT
The accounting standards for fair value measurements and disclosures establish a fair value hierarchy, which prioritizes the inputs to valuation techniques used to measure fair value into three levels. A financial instrument’s categorization within the fair value hierarchy is based upon the lowest level of input that is available and significant to the fair value measurement.
Level 1 | Quoted prices in active markets for identical assets or liabilities. |
Level 2 | Observable inputs other than quoted prices in active markets for identical assets and liabilities, quoted prices for identical or similar assets or liabilities in inactive markets, or other inputs that are observable or can be corroborated by observable market data for substantially the full term of the assets or liabilities. |
Level 3 | Inputs that are generally unobservable and typically reflect management’s estimates of assumptions that market participants would use in pricing the asset or liability. |
109
102
DOMTAR CORPORATION
NOTES TO CONSOLIDATED FINANCIAL STATEMENTS
DECEMBER 31, 20202022
(IN MILLIONS OF DOLLARS, UNLESS OTHERWISE NOTEDNOTED))
NOTE 23.21. DERIVATIVES AND HEDGING ACTIVITIES AND FAIR VALUE MEASUREMENT (CONTINUED)
The following tables present information about the Company’s financial assets and financial liabilities measured at fair value on a recurring basis (except Long-term debt, see (b) and (c) below) at December 31, 20202022 and December 31, 2019,2021, in accordance with the accounting standards for fair value measurements and disclosures and indicates the fair value hierarchy of the valuation techniques utilized by the Company to determine such fair value.
|
| Successor |
|
|
|
| ||||||||||||||||||||||||||||||||
|
|
|
|
|
| Quoted prices in |
|
| Significant |
|
| Significant |
|
|
|
|
|
|
| Quoted prices in |
| Significant |
| Significant |
|
|
|
| ||||||||||
|
|
|
|
|
| active markets for |
|
| observable |
|
| unobservable |
|
|
|
|
|
|
| active markets for |
| observable |
| unobservable |
|
|
|
| ||||||||||
|
| December 31, |
|
| identical assets |
|
| inputs |
|
| inputs |
|
|
|
|
| December 31, |
| identical assets |
| inputs |
| inputs |
|
|
|
| |||||||||||
Fair Value of financial instruments at: |
| 2020 |
|
| (Level 1) |
|
| (Level 2) |
|
| (Level 3) |
|
|
| Balance sheet classification |
| 2022 |
|
| (Level 1) |
|
| (Level 2) |
|
| (Level 3) |
|
|
| Balance sheet classification | ||||||||
|
| $ |
|
| $ |
|
| $ |
|
| $ |
|
|
|
|
| $ |
|
| $ |
|
| $ |
|
| $ |
|
|
|
| ||||||||
Derivatives designated as hedging instruments: |
|
|
|
|
|
|
|
|
|
|
|
|
|
|
|
|
|
|
|
|
|
|
|
|
|
|
|
|
|
|
|
|
| |||||
Asset derivatives |
|
|
|
|
|
|
|
|
|
|
|
|
|
|
|
|
|
|
|
|
|
|
|
|
|
|
|
|
|
|
|
|
| |||||
Currency derivatives |
|
| 31 |
|
|
| — |
|
|
| 31 |
|
|
| — |
|
| (a) | Prepaid expenses |
|
| 2 |
|
|
| — |
|
|
| 2 |
|
|
| — |
|
| (a) | Prepaid expenses |
Natural gas swap contracts |
|
| 4 |
| �� |
| — |
|
|
| 4 |
|
|
| — |
|
| (a) | Prepaid expenses | |||||||||||||||||||
Currency derivatives |
|
| 16 |
|
|
| — |
|
|
| 16 |
|
|
| — |
|
| (a) | Other assets |
|
| 1 |
|
|
| — |
|
|
| 1 |
|
|
| — |
|
| (a) | Other assets |
Natural gas swap contracts |
|
| 1 |
|
|
| — |
|
|
| 1 |
|
|
| — |
|
| (a) | Other assets | |||||||||||||||||||
Total Assets |
|
| 48 |
|
|
| — |
|
|
| 48 |
|
|
| — |
|
|
|
|
|
| 7 |
|
|
| — |
|
|
| 7 |
|
|
| — |
|
|
|
|
|
|
|
|
|
|
|
|
|
|
|
|
|
|
|
|
|
|
|
|
|
|
|
|
|
|
|
|
|
|
|
|
|
|
| ||||
Liabilities derivatives |
|
|
|
|
|
|
|
|
|
|
|
|
|
|
|
|
|
|
|
|
|
|
|
|
|
|
|
|
|
|
|
|
|
| ||||
Currency derivatives |
|
| 1 |
|
|
| — |
|
|
| 1 |
|
|
| — |
|
| (a) | Trade and other payables |
|
| 16 |
|
|
| — |
|
|
| 16 |
|
|
| — |
|
| (a) | Trade and other payables |
Natural gas swap contracts |
|
| 2 |
|
|
| — |
|
|
| 2 |
|
|
| — |
|
| (a) | Trade and other payables |
|
| 3 |
|
|
| — |
|
|
| 3 |
|
|
| — |
|
| (a) | Trade and other payables |
Natural gas swap contracts |
|
| 3 |
|
|
| — |
|
|
| 3 |
|
|
| — |
|
| (a) | Other liabilities and deferred credits | |||||||||||||||||||
Currency derivatives |
|
| 3 |
|
|
| — |
|
|
| 3 |
|
|
| — |
|
| (a) | Other liabilities and deferred | |||||||||||||||||||
Total Liabilities |
|
| 6 |
|
|
| — |
|
|
| 6 |
|
|
| — |
|
|
|
|
|
| 22 |
|
|
| — |
|
|
| 22 |
|
|
| — |
|
|
|
|
|
|
|
|
|
|
|
|
|
|
|
|
|
|
|
|
|
|
|
|
|
|
|
|
|
|
|
|
|
|
|
|
|
|
| ||||
Other Instruments: |
|
|
|
|
|
|
|
|
|
|
|
|
|
|
|
|
|
|
|
|
|
|
|
|
|
|
|
|
|
|
|
|
|
| ||||
Stock-based compensation - liability awards |
|
| 5 |
|
|
| 5 |
|
|
| — |
|
|
| — |
|
|
| Trade and other payables | |||||||||||||||||||
Stock-based compensation - liability awards |
|
| 11 |
|
|
| 11 |
|
|
| — |
|
|
| — |
|
|
| Other liabilities and deferred credits | |||||||||||||||||||
Equity swap contracts |
|
| 2 |
|
|
| 2 |
|
|
| — |
|
|
| — |
|
|
| Other assets | |||||||||||||||||||
Long-term debt due within |
|
| 33 |
|
|
| — |
|
|
| 33 |
|
|
| — |
|
| (b) | Long-term debt due within | |||||||||||||||||||
Long-term debt |
|
| 1,234 |
|
|
| — |
|
|
| 1,234 |
|
|
| — |
|
| (b) | Long-term debt |
|
| 1,321 |
|
|
| — |
|
|
| 1,321 |
|
|
| — |
|
| (c) | Long-term debt |
The net cumulative loss recorded in Accumulated other comprehensive loss relating to natural gas contracts is $4 million at December 31, 2020, of which a loss of $2 million will be recognized in Cost of sales upon maturity of the derivatives over the next 12 months at the then prevailing values, which may be different from those at December 31, 2020.
110103
DOMTAR CORPORATION
NOTES TO CONSOLIDATED FINANCIAL STATEMENTS
DECEMBER 31, 20202022
(IN MILLIONS OF DOLLARS, UNLESS OTHERWISE NOTEDNOTED))
NOTE 23.21. DERIVATIVES AND HEDGING ACTIVITIES AND FAIR VALUE MEASUREMENT (CONTINUED)
|
| Successor |
|
|
|
| |||||||||||||
|
|
|
|
| Quoted prices in |
|
| Significant |
|
| Significant |
|
|
|
| ||||
|
|
|
|
| active markets for |
|
| observable |
|
| unobservable |
|
|
|
| ||||
|
| December 31, |
|
| identical assets |
|
| inputs |
|
| inputs |
|
|
|
| ||||
Fair Value of financial instruments at: |
| 2021 |
|
| (Level 1) |
|
| (Level 2) |
|
| (Level 3) |
|
|
| Balance sheet classification | ||||
|
| $ |
|
| $ |
|
| $ |
|
| $ |
|
|
|
| ||||
Derivatives designated as |
|
|
|
|
|
|
|
|
|
|
|
|
|
|
| ||||
Asset derivatives |
|
|
|
|
|
|
|
|
|
|
|
|
|
|
| ||||
Currency derivatives |
|
| 18 |
|
|
| — |
|
|
| 18 |
|
|
| — |
|
| (a) | Prepaid expenses |
Natural gas swap contracts |
|
| 6 |
|
|
| — |
|
|
| 6 |
|
|
| — |
|
| (a) | Prepaid expenses |
Natural gas swap contracts |
|
| 2 |
|
|
| — |
|
|
| 2 |
|
|
| — |
|
| (a) | Other assets |
Total Assets |
|
| 26 |
|
|
| — |
|
|
| 26 |
|
|
| — |
|
|
|
|
|
|
|
|
|
|
|
|
|
|
|
|
|
|
|
| ||||
Liabilities derivatives |
|
|
|
|
|
|
|
|
|
|
|
|
|
|
| ||||
Currency derivatives |
|
| 1 |
|
|
| — |
|
|
| 1 |
|
|
| — |
|
| (a) | Trade and other payables |
Currency derivatives |
|
| 1 |
|
|
| — |
|
|
| 1 |
|
|
| — |
|
| (a) | Other liabilities and deferred |
Total Liabilities |
|
| 2 |
|
|
| — |
|
|
| 2 |
|
|
| — |
|
|
|
|
|
|
|
|
|
|
|
|
|
|
|
|
|
|
|
| ||||
Other Instruments: |
|
|
|
|
|
|
|
|
|
|
|
|
|
|
| ||||
Long-term debt due within |
|
| 259 |
|
|
| — |
|
|
| 259 |
|
|
| — |
|
| (b) | Long-term debt due within |
Long-term debt |
|
| 1,682 |
|
|
| — |
|
|
| 1,682 |
|
|
| — |
|
| (c) | Long-term debt |
- For currency derivatives: Foreign currency forward and option contracts are valued using standard valuation models. Interest rates, forward market rates and volatility are used as inputs for such valuation techniques.
- For natural gas contracts: Fair value is measured using the discounted difference between contractual rates and quoted market future rates.
|
|
|
|
|
| Quoted prices in |
|
| Significant |
|
| Significant |
|
|
|
| |||
|
|
|
|
|
| active markets for |
|
| observable |
|
| unobservable |
|
|
|
| |||
|
| December 31, |
|
| identical assets |
|
| inputs |
|
| inputs |
|
|
|
| ||||
Fair Value of financial instruments at: |
| 2019 |
|
| (Level 1) |
|
| (Level 2) |
|
| (Level 3) |
|
|
| Balance sheet classification | ||||
|
| $ |
|
| $ |
|
| $ |
|
| $ |
|
|
|
| ||||
Derivatives designated as hedging instruments: |
|
|
|
|
|
|
|
|
|
|
|
|
|
|
|
|
|
|
|
Asset derivatives |
|
|
|
|
|
|
|
|
|
|
|
|
|
|
|
|
|
|
|
Currency derivatives |
|
| 4 |
|
|
| — |
|
|
| 4 |
|
|
| — |
|
| (a) | Prepaid expenses |
Currency derivatives |
|
| 4 |
|
|
| — |
|
|
| 4 |
|
|
| — |
|
| (a) | Other assets |
Total Assets |
|
| 8 |
|
|
| — |
|
|
| 8 |
|
|
| — |
|
|
|
|
|
|
|
|
|
|
|
|
|
|
|
|
|
|
|
|
|
|
|
|
Liabilities derivatives |
|
|
|
|
|
|
|
|
|
|
|
|
|
|
|
|
|
|
|
Currency derivatives |
|
| 2 |
|
|
| — |
|
|
| 2 |
|
|
| — |
|
| (a) | Trade and other payables |
Natural gas swap contracts |
|
| 9 |
|
|
| — |
|
|
| 9 |
|
|
| — |
|
| (a) | Trade and other payables |
Natural gas swap contracts |
|
| 8 |
|
|
| — |
|
|
| 8 |
|
|
| — |
|
| (a) | Other liabilities and deferred credits |
Total Liabilities |
|
| 19 |
|
|
| — |
|
|
| 19 |
|
|
| — |
|
|
|
|
|
|
|
|
|
|
|
|
|
|
|
|
|
|
|
|
|
|
|
|
Other Instruments: |
|
|
|
|
|
|
|
|
|
|
|
|
|
|
|
|
|
|
|
Stock-based compensation - liability awards |
|
| 6 |
|
|
| 6 |
|
|
| — |
|
|
| — |
|
|
| Trade and other payables |
Stock-based compensation - liability awards |
|
| 16 |
|
|
| 16 |
|
|
| — |
|
|
| — |
|
|
| Other liabilities and deferred credits |
Long-term debt |
|
| 1,029 |
|
|
| — |
|
|
| 1,029 |
|
|
| — |
|
| (b) | Long-term debt |
|
|
|
|
|
|
|
|
Due to their short-term maturity, the carrying amounts of cash and cash equivalents, receivables, bank indebtedness, trade and other payables and income and other taxes approximate their fair values.
111104
DOMTAR CORPORATION
NOTES TO CONSOLIDATED FINANCIAL STATEMENTS
DECEMBER 31, 20202022
(IN MILLIONS OF DOLLARS, UNLESS OTHERWISE NOTEDNOTED))
NOTE 22.
NOTE 24.
SEGMENT DISCLOSURES
Following the agreement on January 7, 2021 to sellsale of the Company’s Personal Care business on March 1, 2021, the Company now operates as a single reportable segment as described below, which also represents its only operating segment:
| • Pulp and Paper – consists of the design, manufacturing, marketing and distribution of communication, specialty and packaging papers, as well as softwood and fluff pulp, and high quality airlaid and ultrathin laminated absorbent cores.
|
|
The accounting policies of the reportable segments are the same as those described in Note 1. The Company evaluates segment performance based on operating income. Certain Corporate general and administrative costs are allocated to the segment. Corporate costs that are not related to segment activities, as well as the mark-to-market impact on stock-based compensation awards, are presented on the Corporate line. The Company does not allocate interest expense and income taxes to the segment. Segment assets are those directly used in segment operations.
The Company attributes sales to customers in different geographical areas on the basis of the location of the customer.
Long-lived assets consist of property, plant and equipment, operating lease right-of-use assets and intangible assets used in the generation of sales in the different geographical areas.
Starting January 1, 2020, EAM Corporation, a manufacturer of high quality airlaid and ultrathin laminated cores, previously reported under the Company’s former Personal Care segment is now presented under its Pulp and Paper segment. Prior period segment results have been restated to the new segment presentation with no significant impact on segment results. There were no changes to the Company’s consolidated sales or operating income.
112105
DOMTAR CORPORATION
NOTES TO CONSOLIDATED FINANCIAL STATEMENTS
DECEMBER 31, 20202022
(IN MILLIONS OF DOLLARS, UNLESS OTHERWISE NOTEDNOTED))
NOTE 24.22. SEGMENT DISCLOSURES (CONTINUED)
An analysis and reconciliation of the Company’s business segment information to the respective information in the financial statements is as follows:
|
| Successor |
|
|
| Predecessor |
| ||||||||||
|
| Year ended |
|
| Period from |
|
|
| Period from |
|
| Year ended |
| ||||
SEGMENT DATA |
| 2022 |
|
| 2021 |
|
|
| 2021 |
|
| 2020 |
| ||||
|
| $ |
|
| $ |
|
|
| $ |
|
| $ |
| ||||
Sales by product group |
|
|
|
|
|
|
|
|
|
|
|
|
| ||||
Communication papers |
|
| 2,602 |
|
|
| 155 |
|
|
|
| 1,834 |
|
|
| 1,968 |
|
Specialty and packaging papers |
|
| 726 |
|
|
| 49 |
|
|
|
| 538 |
|
|
| 575 |
|
Market pulp |
|
| 1,249 |
|
|
| 96 |
|
|
|
| 996 |
|
|
| 872 |
|
Consolidated sales (1) |
|
| 4,577 |
|
|
| 300 |
|
|
|
| 3,368 |
|
|
| 3,415 |
|
Operating income (loss) from continuing operations (2) |
|
|
|
|
|
|
|
|
|
|
|
|
| ||||
Pulp and Paper |
|
| 527 |
|
|
| 4 |
|
|
|
| 157 |
|
|
| (153 | ) |
Corporate |
|
| (55 | ) |
|
| (3 | ) |
|
|
| (168 | ) |
|
| (34 | ) |
Consolidated operating income (loss) from continuing operations |
|
| 472 |
|
|
| 1 |
|
|
|
| (11 | ) |
|
| (187 | ) |
Interest expense, net |
|
| 90 |
|
|
| 10 |
|
|
|
| 54 |
|
|
| 58 |
|
Non-service components of net periodic benefit cost |
|
| (40 | ) |
|
| (2 | ) |
|
|
| (22 | ) |
|
| (17 | ) |
Earnings (loss) before income taxes and equity loss |
|
| 422 |
|
|
| (7 | ) |
|
|
| (43 | ) |
|
| (228 | ) |
Income tax expense (benefit) |
|
| 101 |
|
|
| (2 | ) |
|
|
| 6 |
|
|
| (80 | ) |
Equity method investment loss, net of taxes |
|
| — |
|
|
| — |
|
|
|
| — |
|
|
| 3 |
|
Earnings (loss) from continuing operations |
|
| 321 |
|
|
| (5 | ) |
|
|
| (49 | ) |
|
| (151 | ) |
Earnings from discontinued operations, net of taxes |
|
| 18 |
|
|
| 1 |
|
|
|
| 26 |
|
|
| 24 |
|
Net earnings (loss) |
|
| 339 |
|
|
| (4 | ) |
|
|
| (23 | ) |
|
| (127 | ) |
|
| Year ended |
|
| Year ended |
|
| Year ended |
| |||
|
| December 31, |
|
| December 31, |
|
| December 31, |
| |||
SEGMENT DATA |
| 2020 |
|
| 2019 |
|
| 2018 |
| |||
|
| $ |
|
| $ |
|
| $ |
| |||
Sales by product group |
|
|
|
|
|
|
|
|
|
|
|
|
Communication papers |
|
| 1,968 |
|
|
| 2,571 |
|
|
| 2,548 |
|
Specialty and packaging papers |
|
| 575 |
|
|
| 637 |
|
|
| 710 |
|
Market pulp |
|
| 1,064 |
|
|
| 1,119 |
|
|
| 1,260 |
|
Absorbent hygiene products |
|
| 45 |
|
|
| 42 |
|
|
| 47 |
|
Consolidated sales (1) |
|
| 3,652 |
|
|
| 4,369 |
|
|
| 4,565 |
|
Operating (loss) income from continuing operations (2) |
|
|
|
|
|
|
|
|
|
|
|
|
Pulp and Paper |
|
| (143 | ) |
|
| 226 |
|
|
| 442 |
|
Corporate |
|
| (34 | ) |
|
| (47 | ) |
|
| (47 | ) |
Consolidated operating (loss) income from continuing operations |
|
| (177 | ) |
|
| 179 |
|
|
| 395 |
|
Interest expense, net |
|
| 58 |
|
|
| 52 |
|
|
| 62 |
|
Non-service components of net periodic benefit cost |
|
| (17 | ) |
|
| 23 |
|
|
| (18 | ) |
(Loss) earnings before income taxes and equity loss |
|
| (218 | ) |
|
| 104 |
|
|
| 351 |
|
Income tax (benefit) expense |
|
| (76 | ) |
|
| 17 |
|
|
| 68 |
|
Equity loss, net of taxes |
|
| 3 |
|
|
| 2 |
|
|
| 2 |
|
(Loss) earnings from continuing operations |
|
| (145 | ) |
|
| 85 |
|
|
| 281 |
|
Earnings (loss) from discontinued operations, net of taxes |
|
| 18 |
|
|
| (1 | ) |
|
| 2 |
|
Net (loss) earnings |
|
| (127 | ) |
|
| 84 |
|
|
| 283 |
|
Successor December 31, December 31, 2022 2021 $ $ Segment assets Pulp and Paper 4,182 4,051 Corporate 542 516 Total for reportable segments 4,724 4,567 Assets held for sale — 287 Consolidated assets 4,724 4,854 106 |
| ||||||||||||||||||||||||||||||||||||||||||||||||||||||||||||||||||||||||||||||||||||||||||||||||||||
|
|
|
| December 31, |
|
| December 31, |
| ||
|
| 2020 |
|
| 2019 |
| ||
|
| $ |
|
| $ |
| ||
Segment assets |
|
|
|
|
|
|
|
|
Pulp and Paper |
|
| 3,209 |
|
|
| 3,562 |
|
Corporate |
|
| 514 |
|
|
| 203 |
|
Total for reportable segments |
|
| 3,723 |
|
|
| 3,765 |
|
Assets held for sale |
|
| 1,133 |
|
|
| 1,138 |
|
Consolidated assets |
|
| 4,856 |
|
|
| 4,903 |
|
113
DOMTAR CORPORATION
NOTES TO CONSOLIDATED FINANCIAL STATEMENTS
DECEMBER 31, 20202022
(IN MILLIONS OF DOLLARS, UNLESS OTHERWISE NOTEDNOTED))
NOTE 24.22. SEGMENT DISCLOSURES (CONTINUED)
|
| Successor |
|
|
| Predecessor |
| ||||||||||
|
| Year ended |
|
| Period from |
|
|
| Period from |
|
| Year ended |
| ||||
|
| 2022 |
|
| 2021 |
|
|
| 2021 |
|
| 2020 |
| ||||
|
| $ |
|
| $ |
|
|
| $ |
|
| $ |
| ||||
Additions to property, plant and equipment |
|
|
|
|
|
|
|
|
|
|
|
|
| ||||
Pulp and Paper |
|
| 443 |
|
|
| 42 |
|
|
|
| 251 |
|
|
| 120 |
|
Corporate |
|
| 2 |
|
|
| — |
|
|
|
| 4 |
|
|
| 3 |
|
Discontinued Operations |
|
| 3 |
|
|
| 1 |
|
|
|
| 15 |
|
|
| 37 |
|
Consolidated additions to property, plant |
|
| 448 |
|
|
| 43 |
|
|
|
| 270 |
|
|
| 160 |
|
Add: Change in payables on capital projects |
|
| (8 | ) |
|
| (2 | ) |
|
|
| (2 | ) |
|
| 15 |
|
Consolidated additions to property, plant and |
|
| 440 |
|
|
| 41 |
|
|
|
| 268 |
|
|
| 175 |
|
|
| Year ended |
|
| Year ended |
|
| Year ended |
| |||
|
| December 31, |
|
| December 31, |
|
| December 31, |
| |||
|
| 2020 |
|
| 2019 |
|
| 2018 |
| |||
|
| $ |
|
| $ |
|
| $ |
| |||
Additions to property, plant and equipment |
|
|
|
|
|
|
|
|
|
|
|
|
Pulp and Paper |
|
| 124 |
|
|
| 225 |
|
|
| 167 |
|
Corporate |
|
| 3 |
|
|
| 3 |
|
|
| 2 |
|
Discontinued Operations |
|
| 33 |
|
|
| 36 |
|
|
| 34 |
|
Consolidated additions to property, plant and equipment |
|
| 160 |
|
|
| 264 |
|
|
| 203 |
|
Add: Change in payables on capital projects |
|
| 15 |
|
|
| (9 | ) |
|
| (8 | ) |
Consolidated additions to property, plant and equipment per Consolidated Statements of Cash Flows |
|
| 175 |
|
|
| 255 |
|
|
| 195 |
|
|
| Successor |
|
|
| Predecessor |
| ||||||||||
|
| Year ended |
|
| Period from |
|
|
| Period from |
|
| Year ended |
| ||||
|
| 2022 |
|
| 2021 |
|
|
| 2021 |
|
| 2020 |
| ||||
|
| $ |
|
| $ |
|
|
| $ |
|
| $ |
| ||||
Geographic information |
|
|
|
|
|
|
|
|
|
|
|
|
| ||||
Sales |
|
|
|
|
|
|
|
|
|
|
|
|
| ||||
United States |
|
| 3,520 |
|
|
| 232 |
|
|
|
| 2,560 |
|
|
| 2,691 |
|
Canada |
|
| 441 |
|
|
| 27 |
|
|
|
| 327 |
|
|
| 324 |
|
Asia |
|
| 402 |
|
|
| 26 |
|
|
|
| 315 |
|
|
| 203 |
|
Europe |
|
| 211 |
|
|
| 13 |
|
|
|
| 157 |
|
|
| 116 |
|
Other foreign countries |
|
| 3 |
|
|
| 2 |
|
|
|
| 9 |
|
|
| 81 |
|
|
|
| 4,577 |
|
|
| 300 |
|
|
|
| 3,368 |
|
|
| 3,415 |
|
|
| Year ended |
|
| Year ended |
|
| Year ended |
| |||
|
| December 31, |
|
| December 31, |
|
| December 31, |
| |||
|
| 2020 |
|
| 2019 |
|
| 2018 |
| |||
|
| $ |
|
| $ |
|
| $ |
| |||
Geographic information |
|
|
|
|
|
|
|
|
|
|
|
|
Sales |
|
|
|
|
|
|
|
|
|
|
|
|
United States |
|
| 2,755 |
|
|
| 3,306 |
|
|
| 3,257 |
|
Canada |
|
| 324 |
|
|
| 419 |
|
|
| 470 |
|
Europe |
|
| 117 |
|
|
| 150 |
|
|
| 221 |
|
Asia |
|
| 374 |
|
|
| 369 |
|
|
| 488 |
|
Other foreign countries |
|
| 82 |
|
|
| 125 |
|
|
| 129 |
|
|
|
| 3,652 |
|
|
| 4,369 |
|
|
| 4,565 |
|
|
| Successor |
| |||||
|
| December 31, |
|
| December 31, |
| ||
|
| 2022 |
|
| 2021 |
| ||
|
| $ |
|
| $ |
| ||
Long-lived assets |
|
|
|
|
|
| ||
United States |
|
| 1,870 |
|
|
| 2,069 |
|
Canada |
|
| 957 |
|
|
| 710 |
|
|
|
| 2,827 |
|
|
| 2,779 |
|
|
| December 31, |
|
| December 31, |
| ||
|
| 2020 |
|
| 2019 |
| ||
|
| $ |
|
| $ |
| ||
Long-lived assets |
|
|
|
|
|
|
|
|
United States |
|
| 1,423 |
|
|
| 1,620 |
|
Canada |
|
| 688 |
|
|
| 691 |
|
|
|
| 2,111 |
|
|
| 2,311 |
|
114107
DOMTAR CORPORATION
NOTES TO CONSOLIDATED FINANCIAL STATEMENTS
DECEMBER 31, 20202022
(IN MILLIONS OF DOLLARS, UNLESS OTHERWISE NOTEDNOTED))
NOTE 25.
RELATED PARTY TRANSACTIONS
SUPPLEMENTAL GUARANTOR FINANCIAL INFORMATION
In 2022, the Company sold land parcels for an amount of $4 million, which represented the fair value of these assets, to a Paper Excellence affiliate. The following information is presented as required under Rule 3-10Company also purchased for $3 million of Regulation S-X,wood fiber from Paper Excellence affiliates. Other related party transactions in connection2022 were not material.
Related party transactions with Paper Excellence and their affiliates were not material for the Company’s issuance of debt securities that are fully and unconditionally guaranteed by Domtar’s significant 100% owned domestic subsidiaries, including Domtar Paper Company, LLC, Domtar Industries LLC (and subsidiaries, excluding Domtar Funding LLC), Domtar A.W. LLC, Attends Healthcare Products Inc., EAM Corporation, Associated Hygienic Products LLC and Home Delivery Incontinent Supplies Co., (“Guarantor Subsidiaries”), on a joint and several basis. The Guaranteed Debt is not guaranteed by certain of Domtar’s foreign and non-significant domestic subsidiaries, all 100% owned, (collectively the “Non-Guarantor Subsidiaries”). A subsidiary’s guarantee may be released in certain customary circumstances, such as if the subsidiary is sold or sells all of its assets, if the subsidiary’s guarantee of the Credit Agreement is terminated or released and if the requirements for legal defeasance to discharge the indenture have been satisfied.
Upon the sale of the Personal Care business, anticipated to take place during the first quarter of 2021, Attends Healthcare Products Inc., Associated Hygienic Products LLC and Home Delivery Incontinent Supplies Co. will cease to be guarantors.
The following supplemental condensed consolidating financial information sets forth, on an unconsolidated basis, the Balance Sheets atperiod from December 1 through December 31, 2020 and 2019 and the Statements of Earnings (Loss) and Comprehensive Income (Loss) and Cash Flows for the years ended December 31, 2020, 2019 and 2018 for Domtar Corporation (the “Parent”), and on a combined basis for the Guarantor Subsidiaries and, on a combined basis, the Non-Guarantor Subsidiaries. The supplemental condensed consolidating financial information reflects the investments of the Parent in the Guarantor Subsidiaries, as well as the investments of the Guarantor Subsidiaries in the Non-Guarantor Subsidiaries, using the equity method.2021.
115108
DOMTAR CORPORATION
NOTES TO CONSOLIDATED FINANCIAL STATEMENTS
DECEMBER 31, 20202022
(IN MILLIONS OF DOLLARS, UNLESS OTHERWISE NOTED)
NOTE. 25 SUPPLEMENTAL GUARANTOR FINANCIAL INFORMATION (CONTINUED)
CONDENSED CONSOLIDATING STATEMENT OF EARNINGS |
| Year ended |
| |||||||||||||||||
(LOSS) AND COMPREHENSIVE INCOME (LOSS) |
| December 31, 2020 |
| |||||||||||||||||
|
|
|
|
|
|
|
|
|
| Non- |
|
|
|
|
|
|
|
|
| |
|
|
|
|
|
| Guarantor |
|
| Guarantor |
|
| Consolidating |
|
|
|
|
| |||
|
| Parent |
|
| Subsidiaries |
|
| Subsidiaries |
|
| Adjustments |
|
| Consolidated |
| |||||
|
| $ |
|
| $ |
|
| $ |
|
| $ |
|
| $ |
| |||||
Sales |
|
| — |
|
|
| 3,232 |
|
|
| 1,352 |
|
|
| (932 | ) |
|
| 3,652 |
|
Operating expenses |
|
|
|
|
|
|
|
|
|
|
|
|
|
|
|
|
|
|
|
|
Cost of sales, excluding depreciation and amortization |
|
| — |
|
|
| 2,952 |
|
|
| 1,105 |
|
|
| (932 | ) |
|
| 3,125 |
|
Depreciation and amortization |
|
| — |
|
|
| 164 |
|
|
| 59 |
|
|
| — |
|
|
| 223 |
|
Selling, general and administrative |
|
| 8 |
|
|
| 38 |
|
|
| 207 |
|
|
| — |
|
|
| 253 |
|
Impairment of long-lived assets |
|
| — |
|
|
| 136 |
|
|
| — |
|
|
| — |
|
|
| 136 |
|
Closure and restructuring costs |
|
| — |
|
|
| 84 |
|
|
| 15 |
|
|
| — |
|
|
| 99 |
|
Other operating loss (income), net |
|
| 2 |
|
|
| (5 | ) |
|
| (4 | ) |
|
| — |
|
|
| (7 | ) |
|
|
| 10 |
|
|
| 3,369 |
|
|
| 1,382 |
|
|
| (932 | ) |
|
| 3,829 |
|
Operating loss |
|
| (10 | ) |
|
| (137 | ) |
|
| (30 | ) |
|
| — |
|
|
| (177 | ) |
Interest expense (income), net |
|
| 65 |
|
|
| 72 |
|
|
| (79 | ) |
|
| — |
|
|
| 58 |
|
Non-service components of net periodic benefit cost |
|
| — |
|
|
| (6 | ) |
|
| (11 | ) |
|
| — |
|
|
| (17 | ) |
(Loss) earnings before income taxes and equity loss |
|
| (75 | ) |
|
| (203 | ) |
|
| 60 |
|
|
| — |
|
|
| (218 | ) |
Income tax (benefit) expense |
|
| (24 | ) |
|
| (73 | ) |
|
| 21 |
|
|
| — |
|
|
| (76 | ) |
Equity loss, net of taxes |
|
| — |
|
|
| 1 |
|
|
| 2 |
|
|
| — |
|
|
| 3 |
|
Share in earnings of equity accounted investees |
|
| (72 | ) |
|
| 52 |
|
|
| — |
|
|
| 20 |
|
|
| — |
|
(Loss) earnings from continuing operations |
|
| (123 | ) |
|
| (79 | ) |
|
| 37 |
|
|
| 20 |
|
|
| (145 | ) |
(Loss) earnings from discontinued operations, net of taxes |
|
| (4 | ) |
|
| 7 |
|
|
| 15 |
|
|
| — |
|
|
| 18 |
|
Net (loss) earnings |
|
| (127 | ) |
|
| (72 | ) |
|
| 52 |
|
|
| 20 |
|
|
| (127 | ) |
Other comprehensive income |
|
| 89 |
|
|
| 80 |
|
|
| 54 |
|
|
| (134 | ) |
|
| 89 |
|
Comprehensive (loss) income |
|
| (38 | ) |
|
| 8 |
|
|
| 106 |
|
|
| (114 | ) |
|
| (38 | ) |
116
DOMTAR CORPORATION
NOTES TO CONSOLIDATED FINANCIAL STATEMENTS
DECEMBER 31, 2020NOTED)
(IN MILLIONS OF DOLLARS, UNLESS OTHERWISE NOTED)
NOTE. 25 SUPPLEMENTAL GUARANTOR FINANCIAL INFORMATION (CONTINUED)
CONDENSED CONSOLIDATING STATEMENT OF EARNINGS |
| Year ended |
| |||||||||||||||||
AND COMPREHENSIVE INCOME |
| December 31, 2019 |
| |||||||||||||||||
|
|
|
|
|
|
|
|
|
| Non- |
|
|
|
|
|
|
|
|
| |
|
|
|
|
|
| Guarantor |
|
| Guarantor |
|
| Consolidating |
|
|
|
|
| |||
|
| Parent |
|
| Subsidiaries |
|
| Subsidiaries |
|
| Adjustments |
|
| Consolidated |
| |||||
|
| $ |
|
| $ |
|
| $ |
|
| $ |
|
| $ |
| |||||
Sales |
|
| — |
|
|
| 3,878 |
|
|
| 1,491 |
|
|
| (1,000 | ) |
|
| 4,369 |
|
Operating expenses |
|
|
|
|
|
|
|
|
|
|
|
|
|
|
|
|
|
|
|
|
Cost of sales, excluding depreciation and amortization |
|
| 1 |
|
|
| 3,349 |
|
|
| 1,260 |
|
|
| (1,000 | ) |
|
| 3,610 |
|
Depreciation and amortization |
|
| — |
|
|
| 172 |
|
|
| 59 |
|
|
| — |
|
|
| 231 |
|
Selling, general and administrative |
|
| 9 |
|
|
| 162 |
|
|
| 120 |
|
|
| — |
|
|
| 291 |
|
Impairment of long-lived assets |
|
| — |
|
|
| 32 |
|
|
| — |
|
|
| — |
|
|
| 32 |
|
Closure and restructuring costs |
|
| — |
|
|
| 22 |
|
|
| — |
|
|
| — |
|
|
| 22 |
|
Other operating (income) loss, net |
|
| — |
|
|
| (3 | ) |
|
| 7 |
|
|
| — |
|
|
| 4 |
|
|
|
| 10 |
|
|
| 3,734 |
|
|
| 1,446 |
|
|
| (1,000 | ) |
|
| 4,190 |
|
Operating (loss) income |
|
| (10 | ) |
|
| 144 |
|
|
| 45 |
|
|
| — |
|
|
| 179 |
|
Interest expense (income), net |
|
| 69 |
|
|
| 80 |
|
|
| (97 | ) |
|
| — |
|
|
| 52 |
|
Non-service components of net periodic benefit cost |
|
| — |
|
|
| 2 |
|
|
| 21 |
|
|
| — |
|
|
| 23 |
|
(Loss) earnings before income taxes and equity loss |
|
| (79 | ) |
|
| 62 |
|
|
| 121 |
|
|
| — |
|
|
| 104 |
|
Income tax (benefit) expense |
|
| (17 | ) |
|
| 2 |
|
|
| 32 |
|
|
| — |
|
|
| 17 |
|
Equity loss, net of taxes |
|
| — |
|
|
| 1 |
|
|
| 1 |
|
|
| — |
|
|
| 2 |
|
Share in earnings of equity accounted investees |
|
| 146 |
|
|
| 121 |
|
|
| — |
|
|
| (267 | ) |
|
| — |
|
Earnings from continuing operations |
|
| 84 |
|
|
| 180 |
|
|
| 88 |
|
|
| (267 | ) |
|
| 85 |
|
(Loss) earnings from discontinued operations, net of taxes |
|
| — |
|
|
| (34 | ) |
|
| 33 |
|
|
| — |
|
|
| (1 | ) |
Net earnings |
|
| 84 |
|
|
| 146 |
|
|
| 121 |
|
|
| (267 | ) |
|
| 84 |
|
Other comprehensive income |
|
| 74 |
|
|
| 81 |
|
|
| 49 |
|
|
| (130 | ) |
|
| 74 |
|
Comprehensive income |
|
| 158 |
|
|
| 227 |
|
|
| 170 |
|
|
| (397 | ) |
|
| 158 |
|
117
DOMTAR CORPORATION
NOTES TO CONSOLIDATED FINANCIAL STATEMENTSNOTE 24.
DECEMBER 31, 2020
(IN MILLIONS OF DOLLARS, UNLESS OTHERWISE NOTED)
NOTE. 25 SUPPLEMENTAL GUARANTOR FINANCIAL INFORMATION (CONTINUED)
CONDENSED CONSOLIDATING STATEMENT OF EARNINGS |
| Year ended |
| |||||||||||||||||
AND COMPREHENSIVE INCOME |
| December 31, 2018 |
| |||||||||||||||||
|
|
|
|
|
|
|
|
|
| Non- |
|
|
|
|
|
|
|
|
| |
|
|
|
|
|
| Guarantor |
|
| Guarantor |
|
| Consolidating |
|
|
|
|
| |||
|
| Parent |
|
| Subsidiaries |
|
| Subsidiaries |
|
| Adjustments |
|
| Consolidated |
| |||||
|
| $ |
|
| $ |
|
| $ |
|
| $ |
|
| $ |
| |||||
Sales |
|
| — |
|
|
| 3,961 |
|
|
| 1,732 |
|
|
| (1,128 | ) |
|
| 4,565 |
|
Operating expenses |
|
|
|
|
|
|
|
|
|
|
|
|
|
|
|
|
|
|
|
|
Cost of sales, excluding depreciation and amortization |
|
| — |
|
|
| 3,437 |
|
|
| 1,329 |
|
|
| (1,128 | ) |
|
| 3,638 |
|
Depreciation and amortization |
|
| — |
|
|
| 181 |
|
|
| 60 |
|
|
| — |
|
|
| 241 |
|
Selling, general and administrative |
|
| 11 |
|
|
| 25 |
|
|
| 256 |
|
|
| — |
|
|
| 292 |
|
Other operating (income) loss, net |
|
| — |
|
|
| (3 | ) |
|
| 2 |
|
|
| — |
|
|
| (1 | ) |
|
|
| 11 |
|
|
| 3,640 |
|
|
| 1,647 |
|
|
| (1,128 | ) |
|
| 4,170 |
|
Operating (loss) income |
|
| (11 | ) |
|
| 321 |
|
|
| 85 |
|
|
| — |
|
|
| 395 |
|
Interest expense (income), net |
|
| 62 |
|
|
| 91 |
|
|
| (91 | ) |
|
| — |
|
|
| 62 |
|
Non-service components of net periodic benefit cost |
|
| — |
|
|
| 1 |
|
|
| (19 | ) |
|
| — |
|
|
| (18 | ) |
(Loss) earnings before income taxes and equity loss |
|
| (73 | ) |
|
| 229 |
|
|
| 195 |
|
|
| — |
|
|
| 351 |
|
Income tax (benefit) expense |
|
| (20 | ) |
|
| 38 |
|
|
| 50 |
|
|
| — |
|
|
| 68 |
|
Equity loss, net of taxes |
|
| — |
|
|
| 1 |
|
|
| 1 |
|
|
| — |
|
|
| 2 |
|
Share in earnings of equity accounted investees |
|
| 336 |
|
|
| 166 |
|
|
| — |
|
|
| (502 | ) |
|
| — |
|
Earnings from continuing operations |
|
| 283 |
|
|
| 356 |
|
|
| 144 |
|
|
| (502 | ) |
|
| 281 |
|
(Loss) earnings from discontinued operations, net of taxes |
|
| — |
|
|
| (20 | ) |
|
| 22 |
|
|
| — |
|
|
| 2 |
|
Net earnings |
|
| 283 |
|
|
| 336 |
|
|
| 166 |
|
|
| (502 | ) |
|
| 283 |
|
Other comprehensive loss |
|
| (131 | ) |
|
| (133 | ) |
|
| (110 | ) |
|
| 243 |
|
|
| (131 | ) |
Comprehensive income |
|
| 152 |
|
|
| 203 |
|
|
| 56 |
|
|
| (259 | ) |
|
| 152 |
|
118
DOMTAR CORPORATION
NOTES TO CONSOLIDATED FINANCIAL STATEMENTSSUBSEQUENT EVENTS
DECEMBER 31, 2020
(IN MILLIONS OF DOLLARS, UNLESS OTHERWISE NOTED)
NOTE. 25 SUPPLEMENTAL GUARANTOR FINANCIAL INFORMATION (CONTINUED)
CONDENSED CONSOLIDATING BALANCE SHEET |
| December 31, 2020 |
| |||||||||||||||||
|
|
|
|
|
|
|
|
|
| Non- |
|
|
|
|
|
|
|
|
| |
|
|
|
|
|
| Guarantor |
|
| Guarantor |
|
| Consolidating |
|
|
|
|
| |||
|
| Parent |
|
| Subsidiaries |
|
| Subsidiaries |
|
| Adjustments |
|
| Consolidated |
| |||||
|
| $ |
|
| $ |
|
| $ |
|
| $ |
|
| $ |
| |||||
Assets |
|
|
|
|
|
|
|
|
|
|
|
|
|
|
|
|
|
|
|
|
Current assets |
|
|
|
|
|
|
|
|
|
|
|
|
|
|
|
|
|
|
|
|
Cash and cash equivalents |
|
| 208 |
|
|
| 5 |
|
|
| 96 |
|
|
| — |
|
|
| 309 |
|
Receivables |
|
| — |
|
|
| 65 |
|
|
| 315 |
|
|
| — |
|
|
| 380 |
|
Inventories |
|
| — |
|
|
| 425 |
|
|
| 205 |
|
|
| — |
|
|
| 630 |
|
Prepaid expenses |
|
| 8 |
|
|
| 37 |
|
|
| 5 |
|
|
| — |
|
|
| 50 |
|
Income and other taxes receivable |
|
| 36 |
|
|
| — |
|
|
| 18 |
|
|
| — |
|
|
| 54 |
|
Intercompany accounts |
|
| 759 |
|
|
| 902 |
|
|
| 433 |
|
|
| (2,094 | ) |
|
| — |
|
Assets held for sale |
|
| — |
|
|
| 488 |
|
|
| 648 |
|
|
| (3 | ) |
|
| 1,133 |
|
Total current assets |
|
| 1,011 |
|
|
| 1,922 |
|
|
| 1,720 |
|
|
| (2,097 | ) |
|
| 2,556 |
|
Property, plant and equipment, net |
|
| — |
|
|
| 1,348 |
|
|
| 675 |
|
|
| — |
|
|
| 2,023 |
|
Operating lease right-of-use assets |
|
| — |
|
|
| 48 |
|
|
| 11 |
|
|
| — |
|
|
| 59 |
|
Intangible assets, net |
|
| — |
|
|
| 24 |
|
|
| 5 |
|
|
| — |
|
|
| 29 |
|
Investments in affiliates |
|
| 3,558 |
|
|
| 2,169 |
|
|
| — |
|
|
| (5,727 | ) |
|
| — |
|
Intercompany long-term advances |
|
| 5 |
|
|
| — |
|
|
| 1,157 |
|
|
| (1,162 | ) |
|
| — |
|
Other assets |
|
| 11 |
|
|
| 41 |
|
|
| 143 |
|
|
| (6 | ) |
|
| 189 |
|
Total assets |
|
| 4,585 |
|
|
| 5,552 |
|
|
| 3,711 |
|
|
| (8,992 | ) |
|
| 4,856 |
|
|
|
|
|
|
|
|
|
|
|
|
|
|
|
|
|
|
|
|
|
|
Liabilities and shareholders' equity |
|
|
|
|
|
|
|
|
|
|
|
|
|
|
|
|
|
|
|
|
Current liabilities |
|
|
|
|
|
|
|
|
|
|
|
|
|
|
|
|
|
|
|
|
Trade and other payables |
|
| 26 |
|
|
| 294 |
|
|
| 167 |
|
|
| (3 | ) |
|
| 484 |
|
Intercompany accounts |
|
| 677 |
|
|
| 491 |
|
|
| 926 |
|
|
| (2,094 | ) |
|
| — |
|
Income and other taxes payable |
|
| 3 |
|
|
| 11 |
|
|
| 1 |
|
|
| — |
|
|
| 15 |
|
Operating lease liabilities due within one year |
|
| — |
|
|
| 15 |
|
|
| 5 |
|
|
| — |
|
|
| 20 |
|
Long-term debt due within one year |
|
| 12 |
|
|
| — |
|
|
| 1 |
|
|
| — |
|
|
| 13 |
|
Liabilities held for sale |
|
| — |
|
|
| 121 |
|
|
| 174 |
|
|
| — |
|
|
| 295 |
|
Total current liabilities |
|
| 718 |
|
|
| 932 |
|
|
| 1,274 |
|
|
| (2,097 | ) |
|
| 827 |
|
Long-term debt |
|
| 1,075 |
|
|
| — |
|
|
| 9 |
|
|
| — |
|
|
| 1,084 |
|
Operating lease liabilities |
|
| — |
|
|
| 44 |
|
|
| 6 |
|
|
| — |
|
|
| 50 |
|
Intercompany long-term loans |
|
| 509 |
|
|
| 653 |
|
|
| — |
|
|
| (1,162 | ) |
|
| — |
|
Deferred income taxes and other |
|
| — |
|
|
| 237 |
|
|
| 90 |
|
|
| (6 | ) |
|
| 321 |
|
Other liabilities and deferred credits |
|
| 23 |
|
|
| 128 |
|
|
| 163 |
|
|
| — |
|
|
| 314 |
|
Shareholders' equity |
|
| 2,260 |
|
|
| 3,558 |
|
|
| 2,169 |
|
|
| (5,727 | ) |
|
| 2,260 |
|
Total liabilities and shareholders' equity |
|
| 4,585 |
|
|
| 5,552 |
|
|
| 3,711 |
|
|
| (8,992 | ) |
|
| 4,856 |
|
119
DOMTAR CORPORATION
NOTES TO CONSOLIDATED FINANCIAL STATEMENTS
DECEMBER 31, 2020
(IN MILLIONS OF DOLLARS, UNLESS OTHERWISE NOTED)
NOTE. 25 SUPPLEMENTAL GUARANTOR FINANCIAL INFORMATION (CONTINUED)
CONDENSED CONSOLIDATING BALANCE SHEET |
| December 31, 2019 |
| |||||||||||||||||
|
|
|
|
|
|
|
|
|
| Non- |
|
|
|
|
|
|
|
|
| |
|
|
|
|
|
| Guarantor |
|
| Guarantor |
|
| Consolidating |
|
|
|
|
| |||
|
| Parent |
|
| Subsidiaries |
|
| Subsidiaries |
|
| Adjustments |
|
| Consolidated |
| |||||
|
| $ |
|
| $ |
|
| $ |
|
| $ |
|
| $ |
| |||||
Assets |
|
|
|
|
|
|
|
|
|
|
|
|
|
|
|
|
|
|
|
|
Current assets |
|
|
|
|
|
|
|
|
|
|
|
|
|
|
|
|
|
|
|
|
Cash and cash equivalents |
|
| 1 |
|
|
| 11 |
|
|
| 49 |
|
|
| — |
|
|
| 61 |
|
Receivables |
|
| — |
|
|
| 114 |
|
|
| 368 |
|
|
| — |
|
|
| 482 |
|
Inventories |
|
| — |
|
|
| 468 |
|
|
| 195 |
|
|
| — |
|
|
| 663 |
|
Prepaid expenses |
|
| 5 |
|
|
| 14 |
|
|
| 10 |
|
|
| — |
|
|
| 29 |
|
Income and other taxes receivable |
|
| 34 |
|
|
| — |
|
|
| 22 |
|
|
| — |
|
|
| 56 |
|
Intercompany accounts |
|
| 538 |
|
|
| 547 |
|
|
| 237 |
|
|
| (1,322 | ) |
|
| — |
|
Assets held for sale |
|
| — |
|
|
| 110 |
|
|
| 117 |
|
|
| — |
|
|
| 227 |
|
Total current assets |
|
| 578 |
|
|
| 1,264 |
|
|
| 998 |
|
|
| (1,322 | ) |
|
| 1,518 |
|
Property, plant and equipment, net |
|
| — |
|
|
| 1,545 |
|
|
| 678 |
|
|
| — |
|
|
| 2,223 |
|
Operating lease right-of-use assets |
|
| — |
|
|
| 44 |
|
|
| 14 |
|
|
| — |
|
|
| 58 |
|
Intangible assets, net |
|
| — |
|
|
| 25 |
|
|
| 5 |
|
|
| — |
|
|
| 30 |
|
Investments in affiliates |
|
| 3,627 |
|
|
| 2,493 |
|
|
| — |
|
|
| (6,120 | ) |
|
| — |
|
Intercompany long-term advances |
|
| 5 |
|
|
| 1 |
|
|
| 1,482 |
|
|
| (1,488 | ) |
|
| — |
|
Other assets |
|
| 14 |
|
|
| 30 |
|
|
| 130 |
|
|
| (11 | ) |
|
| 163 |
|
Non-current assets held for sale |
|
| — |
|
|
| 383 |
|
|
| 528 |
|
|
| — |
|
|
| 911 |
|
Total assets |
|
| 4,224 |
|
|
| 5,785 |
|
|
| 3,835 |
|
|
| (8,941 | ) |
|
| 4,903 |
|
|
|
|
|
|
|
|
|
|
|
|
|
|
|
|
|
|
|
|
|
|
Liabilities and shareholders' equity |
|
|
|
|
|
|
|
|
|
|
|
|
|
|
|
|
|
|
|
|
Current liabilities |
|
|
|
|
|
|
|
|
|
|
|
|
|
|
|
|
|
|
|
|
Bank indebtedness |
|
| — |
|
|
| 9 |
|
|
| — |
|
|
| — |
|
|
| 9 |
|
Trade and other payables |
|
| 57 |
|
|
| 338 |
|
|
| 185 |
|
|
| — |
|
|
| 580 |
|
Intercompany accounts |
|
| 344 |
|
|
| 299 |
|
|
| 679 |
|
|
| (1,322 | ) |
|
| — |
|
Income and other taxes payable |
|
| 1 |
|
|
| 12 |
|
|
| 2 |
|
|
| — |
|
|
| 15 |
|
Operating lease liabilities due within one year |
|
| — |
|
|
| 13 |
|
|
| 5 |
|
|
| — |
|
|
| 18 |
|
Long-term debt due within one year |
|
| — |
|
|
| — |
|
|
| 1 |
|
|
| — |
|
|
| 1 |
|
Liabilities held for sale |
|
| — |
|
|
| 60 |
|
|
| 83 |
|
|
| — |
|
|
| 143 |
|
Total current liabilities |
|
| 402 |
|
|
| 731 |
|
|
| 955 |
|
|
| (1,322 | ) |
|
| 766 |
|
Long-term debt |
|
| 873 |
|
|
| 1 |
|
|
| 63 |
|
|
| — |
|
|
| 937 |
|
Operating lease liabilities |
|
| — |
|
|
| 31 |
|
|
| 9 |
|
|
| — |
|
|
| 40 |
|
Intercompany long-term loans |
|
| 541 |
|
|
| 946 |
|
|
| 1 |
|
|
| (1,488 | ) |
|
| — |
|
Deferred income taxes and other |
|
| — |
|
|
| 277 |
|
|
| 94 |
|
|
| (11 | ) |
|
| 360 |
|
Other liabilities and deferred credits |
|
| 32 |
|
|
| 96 |
|
|
| 141 |
|
|
| — |
|
|
| 269 |
|
Long-term liabilities held for sale |
|
| — |
|
|
| 76 |
|
|
| 79 |
|
|
| — |
|
|
| 155 |
|
Shareholders' equity |
|
| 2,376 |
|
|
| 3,627 |
|
|
| 2,493 |
|
|
| (6,120 | ) |
|
| 2,376 |
|
Total liabilities and shareholders' equity |
|
| 4,224 |
|
|
| 5,785 |
|
|
| 3,835 |
|
|
| (8,941 | ) |
|
| 4,903 |
|
120
DOMTAR CORPORATION
NOTES TO CONSOLIDATED FINANCIAL STATEMENTS
DECEMBER 31, 2020
(IN MILLIONS OF DOLLARS, UNLESS OTHERWISE NOTED)
NOTE. 25 SUPPLEMENTAL GUARANTOR FINANCIAL INFORMATION (CONTINUED)
CONDENSED CONSOLIDATING STATEMENT OF CASH FLOWS |
| Year ended December 31, 2020 |
| |||||||||||||||||
|
|
|
|
|
|
|
|
|
| Non- |
|
|
|
|
|
|
|
|
| |
|
|
|
|
|
| Guarantor |
|
| Guarantor |
|
| Consolidating |
|
|
|
|
| |||
|
| Parent |
|
| Subsidiaries |
|
| Subsidiaries |
|
| Adjustments |
|
| Consolidated |
| |||||
|
| $ |
|
| $ |
|
| $ |
|
| $ |
|
| $ |
| |||||
Operating activities |
|
|
|
|
|
|
|
|
|
|
|
|
|
|
|
|
|
|
|
|
Net (loss) earnings |
|
| (127 | ) |
|
| (72 | ) |
|
| 52 |
|
|
| 20 |
|
|
| (127 | ) |
Changes in operating and intercompany assets and liabilities and non-cash items, included in net (loss) earnings |
|
| 167 |
|
|
| 107 |
|
|
| 284 |
|
|
| (20 | ) |
|
| 538 |
|
Cash flows provided from operating activities |
|
| 40 |
|
|
| 35 |
|
|
| 336 |
|
|
| — |
|
|
| 411 |
|
Investing activities |
|
|
|
|
|
|
|
|
|
|
|
|
|
|
|
|
|
|
|
|
Additions to property, plant and equipment |
|
| — |
|
|
| (104 | ) |
|
| (71 | ) |
|
| — |
|
|
| (175 | ) |
Proceeds from disposals of property, plant and equipment |
|
| — |
|
|
| 3 |
|
|
| — |
|
|
| — |
|
|
| 3 |
|
Acquisition of business, net of cash acquired |
|
| — |
|
|
| — |
|
|
| (30 | ) |
|
| — |
|
|
| (30 | ) |
Cash flows provided from (used for) investing activities |
|
| — |
|
|
| (101 | ) |
|
| (101 | ) |
|
| — |
|
|
| (202 | ) |
Financing activities |
|
|
|
|
|
|
|
|
|
|
|
|
|
|
|
|
|
|
|
|
Dividend payments |
|
| (51 | ) |
|
| — |
|
|
| — |
|
|
| — |
|
|
| (51 | ) |
Stock repurchase |
|
| (59 | ) |
|
| — |
|
|
| — |
|
|
| — |
|
|
| (59 | ) |
Net change in bank indebtedness |
|
| — |
|
|
| (10 | ) |
|
| — |
|
|
| — |
|
|
| (10 | ) |
Change in revolving credit facility |
|
| (80 | ) |
|
| — |
|
|
| — |
|
|
| — |
|
|
| (80 | ) |
Proceeds from receivables securitization facility |
|
| — |
|
|
| — |
|
|
| 25 |
|
|
| — |
|
|
| 25 |
|
Repayments of receivables securitization facility |
|
| — |
|
|
| — |
|
|
| (80 | ) |
|
| — |
|
|
| (80 | ) |
Issuance of long-term debt |
|
| 300 |
|
|
| — |
|
|
| — |
|
|
| — |
|
|
| 300 |
|
Repayments of long-term debt |
|
| (6 | ) |
|
| — |
|
|
| (1 | ) |
|
| — |
|
|
| (7 | ) |
Increase in long-term advances to related parties |
|
| — |
|
|
| — |
|
|
| (137 | ) |
|
| 137 |
|
|
| — |
|
Decrease in long-term advances to related parties |
|
| 67 |
|
|
| 70 |
|
|
| — |
|
|
| (137 | ) |
|
| — |
|
Other |
|
| (4 | ) |
|
| — |
|
|
| 1 |
|
|
| — |
|
|
| (3 | ) |
Cash flows provided from (used for) financing activities |
|
| 167 |
|
|
| 60 |
|
|
| (192 | ) |
|
| — |
|
|
| 35 |
|
Net increase (decrease) in cash and cash equivalents |
|
| 207 |
|
|
| (6 | ) |
|
| 43 |
|
|
| — |
|
|
| 244 |
|
Impact of foreign exchange on cash |
|
| — |
|
|
| — |
|
|
| 4 |
|
|
| — |
|
|
| 4 |
|
Cash and cash equivalents at beginning of year |
|
| 1 |
|
|
| 11 |
|
|
| 49 |
|
|
| — |
|
|
| 61 |
|
Cash and cash equivalents at end of year |
|
| 208 |
|
|
| 5 |
|
|
| 96 |
|
|
| — |
|
|
| 309 |
|
121
DOMTAR CORPORATION
NOTES TO CONSOLIDATED FINANCIAL STATEMENTS
DECEMBER 31, 2020
(IN MILLIONS OF DOLLARS, UNLESS OTHERWISE NOTED)
NOTE. 25 SUPPLEMENTAL GUARANTOR FINANCIAL INFORMATION (CONTINUED)
CONDENSED CONSOLIDATING STATEMENT OF CASH FLOWS |
| Year ended December 31, 2019 |
| |||||||||||||||||
|
|
|
|
|
|
|
|
|
| Non- |
|
|
|
|
|
|
|
|
| |
|
|
|
|
|
| Guarantor |
|
| Guarantor |
|
| Consolidating |
|
|
|
|
| |||
|
| Parent |
|
| Subsidiaries |
|
| Subsidiaries |
|
| Adjustments |
|
| Consolidated |
| |||||
|
| $ |
|
| $ |
|
| $ |
|
| $ |
|
| $ |
| |||||
Operating activities |
|
|
|
|
|
|
|
|
|
|
|
|
|
|
|
|
|
|
|
|
Net earnings |
|
| 84 |
|
|
| 146 |
|
|
| 121 |
|
|
| (267 | ) |
|
| 84 |
|
Changes in operating and intercompany assets and liabilities and non-cash items, included in net earnings |
|
| 32 |
|
|
| (93 | ) |
|
| 152 |
|
|
| 267 |
|
|
| 358 |
|
Cash flows provided from operating activities |
|
| 116 |
|
|
| 53 |
|
|
| 273 |
|
|
| — |
|
|
| 442 |
|
Investing activities |
|
|
|
|
|
|
|
|
|
|
|
|
|
|
|
|
|
|
|
|
Additions to property, plant and equipment |
|
| — |
|
|
| (137 | ) |
|
| (118 | ) |
|
| — |
|
|
| (255 | ) |
Proceeds from disposals of property, plant and equipment |
|
| — |
|
|
| 1 |
|
|
| — |
|
|
| — |
|
|
| 1 |
|
Cash flows used for investing activities |
|
| — |
|
|
| (136 | ) |
|
| (118 | ) |
|
| — |
|
|
| (254 | ) |
Financing activities |
|
|
|
|
|
|
|
|
|
|
|
|
|
|
|
|
|
|
|
|
Dividend payments |
|
| (110 | ) |
|
| — |
|
|
| — |
|
|
| — |
|
|
| (110 | ) |
Stock repurchase |
|
| (219 | ) |
|
| — |
|
|
| — |
|
|
| — |
|
|
| (219 | ) |
Net change in bank indebtedness |
|
| — |
|
|
| 9 |
|
|
| — |
|
|
| — |
|
|
| 9 |
|
Change in revolving credit facility |
|
| 80 |
|
|
| — |
|
|
| — |
|
|
| — |
|
|
| 80 |
|
Proceeds from receivables securitization facility |
|
| — |
|
|
| — |
|
|
| 205 |
|
|
| — |
|
|
| 205 |
|
Repayments of receivables securitization facility |
|
| — |
|
|
| — |
|
|
| (200 | ) |
|
| — |
|
|
| (200 | ) |
Repayments of long-term debt |
|
| — |
|
|
| — |
|
|
| (1 | ) |
|
| — |
|
|
| (1 | ) |
Increase in long-term advances to related parties |
|
| — |
|
|
| — |
|
|
| (220 | ) |
|
| 220 |
|
|
| — |
|
Decrease in long-term advances to related parties |
|
| 135 |
|
|
| 85 |
|
|
| — |
|
|
| (220 | ) |
|
| — |
|
Other |
|
| (1 | ) |
|
| — |
|
|
| — |
|
|
| — |
|
|
| (1 | ) |
Cash flows (used for) provided from financing activities |
|
| (115 | ) |
|
| 94 |
|
|
| (216 | ) |
|
| — |
|
|
| (237 | ) |
Net increase (decrease) in cash and cash equivalents |
|
| 1 |
|
|
| 11 |
|
|
| (61 | ) |
|
| — |
|
|
| (49 | ) |
Impact of foreign exchange on cash |
|
| — |
|
|
| — |
|
|
| (1 | ) |
|
| — |
|
|
| (1 | ) |
Cash and cash equivalents at beginning of year |
|
| — |
|
|
| — |
|
|
| 111 |
|
|
| — |
|
|
| 111 |
|
Cash and cash equivalents at end of year |
|
| 1 |
|
|
| 11 |
|
|
| 49 |
|
|
| — |
|
|
| 61 |
|
122
DOMTAR CORPORATION
NOTES TO CONSOLIDATED FINANCIAL STATEMENTS
DECEMBER 31, 2020Sale of Dryden, Ontario mill
(IN MILLIONS OF DOLLARS, UNLESS OTHERWISE NOTEDOn February 26, 2023, the Company entered into an Asset Purchase Agreement to sell the Company’s Dryden, Ontario mill and related assets for a purchase price of $)240 million in cash, subject to customary adjustments and to customary closing conditions. The transaction is expected to close in the first half of 2023.
Acquisition of Resolute Forest Products Inc. by Paper Excellence through Domtar Corporation
NOTE. 25 SUPPLEMENTAL GUARANTOR FINANCIAL INFORMATION (CONTINUED)On March 1, 2023, Paper Excellence completed the acquisition of all the outstanding common shares of Resolute Forest Products Inc. (“Resolute”) through Domtar by means of a merger of Terra Acquisition Sub Inc. (a Domtar wholly-owned subsidiary) with and into Resolute, with Resolute continuing as the surviving corporation and as a subsidiary of Domtar (the “Acquisition”). Under the Acquisition agreement, Domtar acquired all outstanding shares of Resolute common stock for $20.50 per share and one contingent value right tied to potential refunds on duty deposits made on or prior to June 30, 2022, of up to $500 million. Any proceeds attributable to the contingent value right will be distributed proportionally to contingent value right holders, and the value will ultimately be determined by the terms and timing of the resolution of the softwood lumber dispute between Canada and the United States.
The acquisition-date fair value of the consideration transferred is approximately $1.6 billion, excluding the contingent value right on softwood lumber duty deposit refunds.
As a condition to obtain the approval of the Acquisition from the Canadian Competition Bureau, Domtar committed to the divestiture of its Dryden, Ontario pulp mill, as disclosed above. As of December 31, 2022, the sale of the pulp mill did not meet all the criteria for discontinued operations and as such, earnings are included within Earnings (loss) from continuing operations, in the Consolidated Statement of Earnings (Loss) and Comprehensive Income (Loss) for all periods presented.
Domtar is financing the transaction with (i) $500 million in equity from Domtar’s shareholder, and (ii) additional debt financing.
Debt financing arrangements included an increase in the Company’s ABL Revolving Credit Facility to provide for aggregate borrowings and letters of credit of up to $1.0 billion (up from $400 million) and extended the maturity date to March 1, 2028 (from November 30, 2026). On the closing date, the ABL Revolving Credit Facility was drawn by $210 million to partially fund the Acquisition and provide liquidity. Also, $179 million of letters of credit were outstanding on the closing date, leaving unused commitments under the ABL Revolving Credit Facility available to the Company of up to $611 million (subject to borrowing base capacity).
Debt financing also included new Farm Credit Term Loan Facilities. The new Farm Credit Term Loan Facilities provide for an aggregate of $949 million of senior secured first lien term loans, consisting of two tranches: (i) the 2023-A First Lien Term Facility, providing for borrowings of $666 with a maturity date of March 1, 2030 and (ii) the 2023-B First Lien Term Facility, providing for borrowings of $283 million with a maturity date of November 30, 2028. Borrowings under the 2023-A First Lien Term Facility were used to partially fund the Acquisition. Borrowings under the 2023-B First Lien Term Facility were used to repay $283 million of borrowings under the existing Term Loan Facility. Borrowings will rank pari passu with the Senior Secured Notes and the existing First Lien Term Loan Facility. Borrowings under the new Farm Credit Term Loan Facilities amortize in equal quarterly installments in an amount equivalent to 5% per annum.
Given that the transaction recently closed, the preliminary purchase price allocation is in process and only high-level estimates are available at this time. The preliminary purchase price allocation could significantly change when the detail exercise is completed. The preliminary fair value of net assets acquired is as follow: Short-term assets $1.5 billion, Long-term assets $2.0 billion, Short-term liabilities $0.4 billion and Long-term liabilities $1.5 billion.
CONDENSED CONSOLIDATING STATEMENT OF CASH FLOWS |
| Year ended December 31, 2018 |
| |||||||||||||||||
|
|
|
|
|
|
|
|
|
| Non- |
|
|
|
|
|
|
|
|
| |
|
|
|
|
|
| Guarantor |
|
| Guarantor |
|
| Consolidating |
|
|
|
|
| |||
|
| Parent |
|
| Subsidiaries |
|
| Subsidiaries |
|
| Adjustments |
|
| Consolidated |
| |||||
|
| $ |
|
| $ |
|
| $ |
|
| $ |
|
| $ |
| |||||
Operating activities |
|
|
|
|
|
|
|
|
|
|
|
|
|
|
|
|
|
|
|
|
Net earnings |
|
| 283 |
|
|
| 336 |
|
|
| 166 |
|
|
| (502 | ) |
|
| 283 |
|
Changes in operating and intercompany assets and liabilities and non-cash items, included in net earnings |
|
| (557 | ) |
|
| 434 |
|
|
| (108 | ) |
|
| 502 |
|
|
| 271 |
|
Cash flows (used for) provided from operating activities |
|
| (274 | ) |
|
| 770 |
|
|
| 58 |
|
|
| — |
|
|
| 554 |
|
Investing activities |
|
|
|
|
|
|
|
|
|
|
|
|
|
|
|
|
|
|
|
|
Additions to property, plant and equipment |
|
| — |
|
|
| (142 | ) |
|
| (53 | ) |
|
| — |
|
|
| (195 | ) |
Proceeds from disposals of property, plant and equipment |
|
| — |
|
|
| 1 |
|
|
| 4 |
|
|
| — |
|
|
| 5 |
|
Other |
|
| — |
|
|
| (2 | ) |
|
| (4 | ) |
|
| — |
|
|
| (6 | ) |
Cash flows used for investing activities |
|
| — |
|
|
| (143 | ) |
|
| (53 | ) |
|
| — |
|
|
| (196 | ) |
Financing activities |
|
|
|
|
|
|
|
|
|
|
|
|
|
|
|
|
|
|
|
|
Dividend payments |
|
| (108 | ) |
|
| — |
|
|
| — |
|
|
| — |
|
|
| (108 | ) |
Proceeds from receivables securitization facility |
|
| — |
|
|
| — |
|
|
| 85 |
|
|
| — |
|
|
| 85 |
|
Repayments of receivables securitization facility |
|
| — |
|
|
| — |
|
|
| (60 | ) |
|
| — |
|
|
| (60 | ) |
Repayments of long-term debt |
|
| — |
|
|
| (300 | ) |
|
| (1 | ) |
|
| — |
|
|
| (301 | ) |
Increase in long-term advances to related parties |
|
| — |
|
|
| (341 | ) |
|
| (36 | ) |
|
| 377 |
|
|
| — |
|
Decrease in long-term advances to related parties |
|
| 377 |
|
|
| — |
|
|
| — |
|
|
| (377 | ) |
|
| — |
|
Other |
|
| 2 |
|
|
| — |
|
|
| — |
|
|
| — |
|
|
| 2 |
|
Cash flows provided from (used for) financing activities |
|
| 271 |
|
|
| (641 | ) |
|
| (12 | ) |
|
| — |
|
|
| (382 | ) |
Net decrease in cash and cash equivalents |
|
| (3 | ) |
|
| (14 | ) |
|
| (7 | ) |
|
| — |
|
|
| (24 | ) |
Impact of foreign exchange on cash |
|
| — |
|
|
| — |
|
|
| (4 | ) |
|
| — |
|
|
| (4 | ) |
Cash and cash equivalents at beginning of year |
|
| 3 |
|
|
| 14 |
|
|
| 122 |
|
|
| — |
|
|
| 139 |
|
Cash and cash equivalents at end of year |
|
| — |
|
|
| — |
|
|
| 111 |
|
|
| — |
|
|
| 111 |
|
109
Domtar Corporation
Interim Financial Results (Unaudited)
(In millions of dollars, unless otherwise noted)
2020 |
| 1st Quarter |
|
| 2nd Quarter |
|
| 3rd Quarter |
|
| 4th Quarter |
|
| Year |
| |||||
Sales |
| $ | 1,031 |
|
| $ | 802 |
|
| $ | 899 |
|
| $ | 920 |
|
| $ | 3,652 |
|
Operating loss |
|
| (1 | ) |
|
| (4 | ) | (a) |
| (152 | ) | (b) |
| (20 | ) | (c) |
| (177 | ) |
Loss before income taxes and equity loss |
|
| (11 | ) |
|
| (14 | ) |
|
| (162 | ) |
|
| (31 | ) |
|
| (218 | ) |
Loss from continuing operations |
|
| (15 | ) |
|
| (3 | ) |
|
| (111 | ) |
|
| (16 | ) |
|
| (145 | ) |
Earnings (loss) from discontinued operations, net of taxes |
|
| 20 |
|
|
| 22 |
|
|
| 19 |
|
|
| (43 | ) |
|
| 18 |
|
Net earnings (loss) |
|
| 5 |
|
|
| 19 |
|
|
| (92 | ) |
|
| (59 | ) |
|
| (127 | ) |
Basic net earnings (loss) per common share |
|
|
|
|
|
|
|
|
|
|
|
|
|
|
|
|
|
|
|
|
Loss from continuing operations |
|
| (0.27 | ) |
|
| (0.05 | ) |
|
| (2.01 | ) |
|
| (0.29 | ) |
|
| (2.62 | ) |
Earnings (loss) from discontinued operations |
|
| 0.36 |
|
|
| 0.39 |
|
|
| 0.34 |
|
|
| (0.78 | ) |
|
| 0.33 |
|
Basic net earnings (loss) per common share |
|
| 0.09 |
|
|
| 0.34 |
|
|
| (1.67 | ) |
|
| (1.07 | ) |
|
| (2.29 | ) |
Diluted net earnings (loss) per common share |
|
|
|
|
|
|
|
|
|
|
|
|
|
|
|
|
|
|
|
|
Loss from continuing operations |
|
| (0.27 | ) |
|
| (0.05 | ) |
|
| (2.01 | ) |
|
| (0.29 | ) |
|
| (2.62 | ) |
Earnings (loss) from discontinued operations |
|
| 0.36 |
|
|
| 0.39 |
|
|
| 0.34 |
|
|
| (0.78 | ) |
|
| 0.33 |
|
Diluted net earnings (loss) per common share |
|
| 0.09 |
|
|
| 0.34 |
|
|
| (1.67 | ) |
|
| (1.07 | ) |
|
| (2.29 | ) |
2019 |
| 1st Quarter |
|
| 2nd Quarter |
|
| 3rd Quarter |
|
| 4th Quarter |
|
| Year |
| |||||
Sales |
| $ | 1,157 |
|
| $ | 1,106 |
|
| $ | 1,079 |
|
| $ | 1,027 |
|
| $ | 4,369 |
|
Operating income (loss) |
|
| 123 |
|
|
| 52 |
|
|
| 27 |
| (d) |
| (23 | ) | (e) |
| 179 |
|
Earnings (loss) before income taxes and equity loss |
|
| 113 |
|
|
| 41 |
|
|
| 17 |
|
|
| (67 | ) | (f) |
| 104 |
|
Earnings (loss) from continuing operations |
|
| 83 |
|
|
| 31 |
|
|
| 15 |
|
|
| (44 | ) |
|
| 85 |
|
(Loss) earnings from discontinued operations, net of taxes |
|
| (3 | ) |
|
| (13 | ) |
|
| 5 |
|
|
| 10 |
|
|
| (1 | ) |
Net earnings (loss) |
|
| 80 |
|
|
| 18 |
|
|
| 20 |
|
|
| (34 | ) |
|
| 84 |
|
Basic net earnings (loss) per common share |
|
|
|
|
|
|
|
|
|
|
|
|
|
|
|
|
|
|
|
|
Earnings (loss) from continuing operations |
|
| 1.32 |
|
|
| 0.50 |
|
|
| 0.25 |
|
|
| (0.76 | ) |
|
| 1.39 |
|
(Loss) earnings from discontinued operations |
|
| (0.05 | ) |
|
| (0.21 | ) |
|
| 0.08 |
|
|
| 0.17 |
|
|
| (0.02 | ) |
Basic net earnings (loss) per common share |
|
| 1.27 |
|
|
| 0.29 |
|
|
| 0.33 |
|
|
| (0.59 | ) |
|
| 1.37 |
|
Diluted net earnings (loss) per common share |
|
|
|
|
|
|
|
|
|
|
|
|
|
|
|
|
|
|
|
|
Earnings (loss) from continuing operations |
|
| 1.32 |
|
|
| 0.49 |
|
|
| 0.24 |
|
|
| (0.76 | ) |
|
| 1.39 |
|
(Loss) earnings from discontinued operations |
|
| (0.05 | ) |
|
| (0.21 | ) |
|
| 0.08 |
|
|
| 0.17 |
|
|
| (0.02 | ) |
Diluted net earnings (loss) per common share |
|
| 1.27 |
|
|
| 0.28 |
|
|
| 0.32 |
|
|
| (0.59 | ) |
|
| 1.37 |
|
|
|
|
|
|
|
|
|
|
|
|
|
ITEM 9. CHANGES IN AND DISAGREEMENTS WITH ACCOUNTANTS ON ACCOUNTING AND FINANCIAL DISCLOSURE
The Company has nothing to report under this item.
ITEM 9A. CONTROLS AND PROCEDURES
Evaluation of Disclosure Controls and Procedures
We maintain disclosure controls and procedures that are designed to provide reasonable assurance that information required to be disclosed in our reports under the Securities and Exchange Act of 1934, as amended (“Exchange Act”), is recorded, processed, summarized and reported within the time periods specified in the SEC’s rules and forms, and that such information is accumulated and communicated to management, including our Chief Executive Officer and Chief Financial Officer, as appropriate, to allow timely decisions regarding required disclosure. As of December 31, 2020,2022, an evaluation was performed by members of management, at the direction and with the participation of our Chief Executive Officer and Chief Financial Officer, of the effectiveness of the design and operation of our disclosure controls and procedures (as defined in Rule 13a-15(e) or 15d-15(e) under the Exchange Act). Based upon this evaluation, our Chief Executive Officer and Chief Financial Officer concluded that, as at December 31, 2020,2022, our disclosure controls and procedures were effective.
Management’s Report on Internal Control over Financial Reporting
The information called for by this item is incorporated herein by reference to “Management’s Report on Internal Control Over Financial Reporting”, and the attestation regarding internal controls over financial reporting included in the “Report of Independent Registered Public Accounting Firm” included in Item 8 of this Report..
Change in Internal Control over Financial Reporting
There were no changes in our internal control over financial reporting that have materially affected or are reasonably likely to materially affect our internal control over financial reporting during the fourth quarter ended December 31, 2020.2022.
ITEM 9B. OTHER INFORMATION
The Company has nothing to report under this item.
110
PART III
ITEM 10. DIRECTORS, EXECUTIVE OFFICERS AND CORPORATE GOVERNANCE
The information included under the captions “Governance of the Corporation” and “Election of Directors” in our Proxy Statement for the 2021 Annual Meeting of Stockholders, to be filed on or about March 25, 2021, is incorporated herein by reference.
Information regarding our executive officers is presented in Item 1, Business, under the caption “Our Executive Officers”.
Set forth in the table below is the list of our directors, together with certain biographical information, including their ages as of February 28, 2023.
Name | Age | Principal Occupation |
Patrick Loulou | 54 | Vice-Chairman, Paper Excellence |
Tom Shih | 52 | Chief, Legal Affairs, Paper Excellence Canada Holdings Corporation |
Hardi Wardhana | 51 | Director, Global Head of M&A, Paper Excellence |
Patrick Loulou became a director of the Company on November 30, 2021, as part of the Merger. Mr. Loulou was the Company’s Senior Vice-President, Business Development from 2007 until the Merger, at which date he became Paper Excellence Vice-Chairman. He previously held a number of positions in the telecommunications sector as well as in management consulting. His over 20 year career has spanned a number of areas and functions such as corporate strategy, M&A, operations, business transformation and business development. Mr. Loulou has a PhD and Masters degree in Aeronautics and Astronautics from Stanford University, and a Bachelor of Science in Mechanical Engineering from Polytechnique in Montréal, Canada. He is also a trustee of the Montreal Fine Arts Museum Foundation and sits on the Board of the Montreal Symphony Orchestra.
Tom Shih became a director of the Company on November 30, 2021, as part of the Merger. Mr. Shih previously served as General Counsel for the Paper Excellence Group and headed the legal department of the organization since 2011. In this capacity, he provided guidance to shareholder, executives and managers at all levels on all legal, corporate/commercial, regulatory, government affairs, compliance and strategic management matters relating to the Group and its various subsidiaries and affiliates. Currently he serves as Chief, Legal Affairs for Paper Excellence Canada Holdings Corporation. Mr. Shih holds several advanced degrees from the University of California, Los Angeles, including Juris Doctor (J.D.), Doctor of Environmental Science & Engineering (D.Env.), Master of Public Health (M.P.H.), and a Bachelor of Science in Biology. He is a licensed attorney with expertise in international, corporate, contracts, regulatory and environmental laws and regulations. Prior to his legal practice, Mr. Shih worked for over 5 years as an environmental Scientist at the California Environmental Protection Agency, Water Resources Control Board.
Hardi Wardhana became a director of the Company on November 30, 2021, as part of the Merger. Mr. Wardhana has been with the Paper Excellence Group since inception in 2006. He is currently a Director of Paper Excellence B.V., and the Global Head of M&A. Mr. Wardhana has been involved in all the M&A transactions within the Paper Excellence Group, overseeing a total of about US$8 billion in transaction value across Canada, France, Germany, Brazil and USA. Mr. Wardhana previously worked at McKinsey & Co as a management consultant. He earned a Bachelor of Science in Mechanical Engineering from Columbia University, a Master of Science in Engineering-Economic Systems from Stanford University and a Master in Finance from the London Business School.
Code of Conduct and Ethics
The Company has adopted a Code of Business Conduct and Ethics that is applicable to its directors and all employees, including the principal executive officer, the principal financial officer and the principal accounting officer, and which is available on the Corporation’s website at www.domtar.com. Directors and employees are required to complete annually a mandatory online training program that includes a certification attesting to their adherence to the Code.
111
ITEM 11. EXECUTIVE COMPENSATION
Key Compensation Decisions for 2022
The metrics for participants in the 2022 Company AIP were weighted 70% on company EBITDA performance, 10% on Lost Time TFR (“LTFR”, a Company Health & Safety metric) and 20% on Pulp Productivity.
The 2022 Long-Term Incentive Plan (LTIP) was comprised of non-equity awards with a three-year cliff vest. The breakout consisted of 50% Restricted Units, that are service-based, and 50% Performance Units, with 70% weighting on Adjusted Cash Flow from Operating Activities and 30% on Production of Prime Containerboard.
With the closing of the transaction with Paper Excellence completed, a retention bonus opportunity in the value of 50% of their respective base salary for each of the next two years was presented to certain members of the Management Committee to recognize their individual importance to the success of the business and to reinforce their significant impact to the future growth of the Company. The first year retention bonus vested on the first anniversary of the Closing or November 30, 2022, and the second year retention bonus will vest on the second anniversary of the Closing or November 30, 2023, as long as they were still employed with the Company.
In November 2022, the Company announced that President and Chief Executive Officer John Williams will retire on June 30, 2023 and that he will be succeeded by Steve Henry, formerly Senior Vice President, Packaging, who has been named Executive Vice President and Chief Operating Officer. As EVP and COO, Mr. Henry will lead the pulp, paper and packaging operations and commercial functions at Domtar, while Mr. Williams will continue to lead all corporate functions until his retirement.
2022 Compensation Results
For 2022, our Named Executive Officers (“NEOs”) are:
John D. Williams | President and Chief Executive Officer (President and CEO) |
Daniel Buron | Executive Vice President and Chief Financial Officer (CFO) |
Steve Henry | Executive Vice President and Chief Operating Officer (COO)1 |
James (Bill) Edwards | Senior Vice President, Pulp and Paper Operations (SVP, Pulp and Paper Operations) |
Robert Melton | Senior Vice President, Commercial Pulp and Paper (SVP, Commercial Pulp and Paper) |
1 Promoted from SVP, Packaging to the new position of COO effective November 28, 2022.
Annual incentive awards as a percentage of target earned by our NEOs based on our business results for 2022 was 140.00%
The status of the 2022 LTIP Performance Units (“PUs”) based on performance results are summarized below. All previous outstanding equity awards were paid out in their entirety in 2021 upon the acquisition of the Corporation by Paper Excellence:
As the Corporation no longer has a Human Resource Committee of the Board, equivalent decisions are fulfilled by the whole Board of Directors.
112
Additional Information on Executive Compensation Program
Compensation Decisions for 2022 – CEO Details
The table below shows target total direct compensation for the CEO and reflects the terms of his second Amended and Restated Employment Agreement in affect as of November 2021.
John D. Williams: CEO – Target Total Direct Compensation:
|
|
| Change | |
John D. Williams | 2021 | 2022 | Dollars | Percent |
Base Salary | $1,213,800 | $1,213,800 | $0 | 0% |
Annual Incentive Plan |
|
|
|
|
Target % of Base Salary | 117% | 117% |
|
|
Target Dollars | $1,420,146 | $1,420,146 | $0 | 0% |
Target Total Cash | $2,633,946 | $2,633,946 | $0 | 0% |
Actual Payout % of Target | 166.77% | 140.00% |
|
|
Actual Payout Dollars | $2,368,377 | $1,988,204 | ($380,173) | -16.05% |
Actual Total Cash | $3,582,177 | $3,202,004 | ($380,173) | -10.61% |
Long-Term Incentive (LTI) Bonus1 |
|
|
|
|
Target % of Base Salary | N/A | N/A |
|
|
Target Dollars / Maximum Dollars | $7,119,850 | $0 | ($7,119,850) | -100% |
Target Total Direct Compensation | $9,753,796 | $2,633,946 | ($7,119,850) | -73% |
1 In 2021, Mr. Williams received his 2021 LTIP grant at a 325% target and a second LTI Bonus with a maximum value of $3,175,000, consisting of serviced-based ($1,500,000) and
performance-based ($1,675,000) per his second Amended and Restated Employment Agreement. He does not have an LTIP target % or grant for 2022 and 2023 per the terms of his
Agreement.
Direct Compensation Mix – at Target
The 2022 target pay mix for our CEO and other NEOs is shown below and reflects the pay changes made for 2022.
Per Mr. Williams employment agreement with Paper Excellence, he was not eligible to receive a long-term incentive award in 2022.
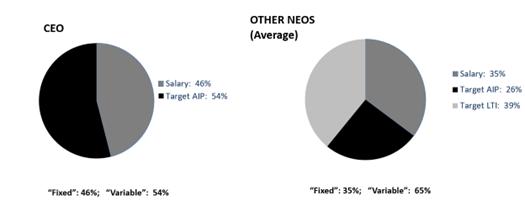
113
Executive Compensation Decision-Making Process
Process and Participants
The table below lists the primary roles of the key participants in our executive compensation decision-making process:
Process and Participants | Description of Role |
Board of Directors | • The Board recognizes the importance of executive compensation decisions to our management team. The efforts on these matters are structured to ensure that sound processes are followed, that sufficient time is provided for deliberation, and that decisions are made in support of our longer-term business strategy and objectives. |
Management | • The CEO provides input on several aspects of executive and Corporation performance, including overall goals and results achieved, as well as performance and pay for members of the Management Committee. Management retains Meridian Compensation Partners, LLC as its consultant, to provide general advice and counsel on various executive compensation matters. |
Benchmarking
Use of Market Data
We use compensation market data as a reference for understanding the competitive pay positioning of each pay element and total compensation. Judgment is exercised about compensation decisions and are reviewed for each executive officer in relation to a range of market data (e.g., median, 25th percentile, 75th percentile, etc.) and considers this, along with internal and other external factors, in making executive pay decisions.
Our approach to executive pay benchmarking for most of our Management Committee members uses manufacturing industry data from Aon Hewitt for companies that are similar in size to Domtar, regressed to the relevant scope of each position.
Details of Executive Compensation Program
Components of Executive Compensation
The principal components of our ongoing compensation program for our NEOs, and their primary purposes, are detailed below:
Component | Purpose |
Base salaries | Deliver a competitive level of fixed cash pay intended to reflect the primary duties of the role |
Annual cash bonuses | Offer an opportunity to earn additional pay based on achieving predetermined performance goals pursuant to our Annual Incentive Plan (“AIP”) |
Long-term Non-Equity incentives | Align executives’ interests with those of the Shareholder through non-equity grant-based incentive vehicles |
Retirement and other health/welfare | Provide assistance with executive retirement needs, and security in case of possible illness, disability, or loss of life |
Perquisites | Limited business-related benefits are provided |
Severance and Change- | Provide protection against termination of employment for reasons beyond the executives’ control |
The following paragraphs describe our approach to each component in greater detail.
114
Base Salaries
The Board of Directors considers whether to grant merit increases and/or market-based adjustments to our executives. Such increases are not always made annually, but rather are made periodically after considering several factors:
• Competitive market pay levels derived from our benchmarking analyses;
• The executive’s performance throughout the year, and whether his or her duties changed during the year; and
• The overall economic climate, and the Corporation’s performance.
Base salaries in 2022 for our NEOs were therefore as follows:
Name | Position | 20211 | 20221 | % Change |
John D. Williams | President and CEO | $ 1,213,800 | $ 1,213,800 | 0.0% |
Daniel Buron | CFO | $ 661,670 | $ 681,520 | 3.0% |
Steve Henry | COO | N/D2 | $ 500,000 | N/D |
James (Bill) Edwards | SVP, Pulp and Paper Operations | $ 400,000 | $ 450,000 | 12.5% |
Robert Melton | SVP, Commercial Pulp and Paper | $ 365,000 | $ 410,000 | 12.3% |
1 Amounts shown are annualized and are reflected as of December 31, 2022 for each NEO. The actual salary received by each NEO during 2022 is set forth in the
Summary Compensation Table.
2 Mr. Henry’s base salary is not disclosed as he was not a Named Executive Officer in 2021.
Performance-Based Annual Bonuses
Annual cash incentives focus our executive officers on achieving specific annual financial and operating results. Our AIP plays a key role in ensuring that our total cash compensation opportunity remains competitive.
Target awards. Each NEO has a target bonus award for the plan year, expressed as a percentage of the actual base salary paid to the NEO during that year. For 2022, short-term incentive targets were as follows:
Name | Position | Target as Percent of Salary |
John D. Williams | President and CEO | 117% |
Daniel Buron | CFO | 89% |
Steve Henry | COO | 65% |
James (Bill) Edwards | SVP, Pulp and Paper Operations | 65% |
Robert Melton | SVP, Commercial Pulp and Paper | 65% |
Based on performance, actual awards earned can vary as a percent of target from below threshold of 0% (if performance is below threshold for all measures) to a maximum of 200%. Achieving results at the threshold performance for any measure will result in a payout equal to 30% of the target award allocated to that measure. Between performance levels, award payouts will be interpolated on a straight-line basis.
Performance measures. The AIP measures results for Key Performance Indicators (“KPIs”) that we view as critical to positioning our business for the future. AIP performance measures are categorized as Fixed or Floating and are measured at the Company level.
The Fixed measure categories of EBITDA and Health and Safety remain constant from year to year. The Floating or variable measures change periodically based on the more immediate business challenges we expect for a particular year. The measures applicable for our FY2022 program are described below.
Fixed Measures – measured at the Company level
EBITDA. We view EBITDA as a leading indicator of our ability to successfully manage our business. This measure is defined as earnings before interest, taxes, depreciation and amortization, and excluding certain one-time or nonrecurring items as further described in our AIP.
Health and Safety. Providing a safe working environment for our employees is critical to our business and directly correlated with efficient operations and manufacturing excellence. This measure focuses on the degree to which we reduce the number of occurrences that must be reported to Occupational Safety and Health Agency (“OSHA”).
Floating Measures –
Company incentive plan structure. The measures and weightings for the Company AIPs are indicated below.
115
Performance goals and results achieved. The following charts present each KPI, its weighting, the performance goals established at the beginning of 2022, results achieved for each measure, and the related payout earned as a percent of the target award. The Board of Directors, in exercising its judgment regarding the appropriate level of threshold, target and maximum goals for the 2022 performance measures, considered a number of factors that included the following (without any specific weighting):
• Historical results for the performance measure;
• Internally forecasted results for the performance measure as determined through our annual budgeting process; and
• Expected degree of difficulty and likelihood of achieving the minimum, target and maximum goals.
AIP goals are reviewed on an annual basis. Financial metrics, such as EBITDA, are established in accordance with our annual budget, based on the business expectations for the coming year.
NEO performance is reviewed while taking into account Mr. Williams’ assessment for each of his direct reports. Each NEOs performance is considered against key strategic initiatives, operational efficiency, and leadership goals established at the beginning of 2022.
2022 Corporate KPIs | Weight | 2022 Domtar Results | Threshold | Target | Maximum | Payout as % of Target |
Company EBITDA | 70.0% | $810.0M | $595.0M | $700.0M | $805.0M | 140.00% |
Health and Safety |
|
|
|
|
|
|
Company LTFR | 10.0% | 0.45 | 0.30 | 0.26 | 0.23 | 0.00% |
Slush Pulp Productivity |
|
|
|
|
|
|
Paper Mills | 10.0% | 4,605 | 4,638 | 4,781 | 4,829 | 0.00% |
Pulp Mills | 10.0% | 4,186 | 4,409 | 4,545 | 4,590 | 0.00% |
2022 Percentage of Target Award Payable è | 140.00% | |||||
Long-Term Non-Equity Incentives
Due to the acquisition of the Corporation by Paper Excellence, the Corporation no longer grants long-term equity awards. Instead, we are granting long-term incentive awards to align with maximizing long term cash generation, long term stability and deliver new growth opportunities, while operating the company in a sustainable and responsible manner.
Starting in 2022, the purpose of the Long-Term Incentive Plan is to promote the interests of the Corporation and its Subsidiaries by:
116
Award Mix. Domtar’s LTIP for senior executives for 2022 continued to use a portfolio approach, as shown below.
Restricted Units: 50% Restricted Units, or RUs, provide a retention incentive and help retain our key contributors through our sometimes volatile business cycles. RU awards vest on the third anniversary of the grant and are settled in cash. | Performance Units: 50% Performance Units, or PUs, link a significant portion of executive pay to long-term company performance over a three-year period. Awards earned vary above or below target based on annual performance results achieved relative to pre-established goals. Awards earned are settled in cash. |
Approximately 160 of our managers participated in our equity compensation program in 2022. The grants awarded to our managers were generally comprised of RUs and PUs weighted 50% and 50%, respectively.
Overall Target Awards. Target long-term values for 2022 awards of PUs and RUs to our NEOs are shown in the following chart.
Name
|
| Target Award as a % of Base Salary
|
| |
Position
| 2021
| 2022
| % Change
| |
John D. Williams1 | President and CEO | N/A | N/A | N/A |
Daniel Buron | CFO | 165% | 165% | 0% |
Steve Henry | COO | N/D2 | 85% | N/D |
James (Bill) Edwards | SVP, Pulp and Paper Operations | 50% | 85% | 70% |
Robert Melton | SVP, Commercial Pulp and Paper | 50% | 85% | 70% |
1 In 2021,Mr. Williams received his 2021 LTIP grant at a 325% target and a second LTI Bonus with a maximum value of $3,175,000, consisting of serviced-based
($1,500,000) and performance-based ($1,675,000) per his second Amended and Restated Employment Agreement. He does not have an LTIP target % or grant for
2022 and 2023 per the terms of his Agreement.
2 Mr. Henry was not a Named Executive Officer in 2021.
Additional information appearingregarding the terms of our PU and RU awards is provided in the narrative accompanying the Grants of Plan-Based Awards Table.
Performance Measure Determinations. Performance measures for the Year 1 2022 PUs included Adjusted Cash Flow from Operating Activities and Production of Prime Containerboard. The two metrics were weighted at 70% and 30%, respectively.
At the beginning of the three-year cycle, goals for Year 1 of the three-year measurement period were set. The following years performance goals will be set in the first quarter of each respective year. Each measurement period is weighted equally at 33.33%.
PU Performance Periods. No PU awards could be earned when performance is below what is deemed to be performance threshold. Awards earned could range from 50% to 200% of target based on performance levels achieved. PUs earned for the performance periods vest in full at the end of the entire three-year period.
The following tables show the Adjusted Cash Flow from Operating Activities and Production of Prime Containerboard goals, and the results for the first performance period, or Year 1, of the 2022 PU awards. Due to the acquisition by Paper Excellence as of November 30, 2021, all previous outstanding equity awards were settled and paid on December 13, 2021, according to the terms of the Long-Term Incentive Plan.
2022 PU Performance Measures
2022 LTIP Grant – Year 1 | Weight | 2022 Domtar Results | Threshold | Target | Maximum | Payout as % of Target |
-100% | 50% | 100% | 200% | |||
Adjusted Cash Flow from Operating activities | 70% | $571M | $339M | $399M | $459M | 140.00% |
Kingsport Production of Prime Containerboard (Tons) | 30% | 0 | 1,000 | 5,000 | 10,000 | 0.00% |
2022 Percentage of Target Award Payable è | 140.00% | |||||
This results in a banked percentage of 46.67% (140% x 33.33%) of the overall 2022 LTIP PU Awards. Year 1 results is one-third of the measurement period or 33.33%.
Linear interpolation applied to determine awards earned for results between performance levels of Threshold and Target, and between Target and Maximum.
Employee Benefits and Perquisites
As part of a competitive total compensation program, we also offer our executives the ability to participate in customary employee benefit programs as outlined in the table below.
117
Types of benefits | Underlying rationale for offering these | Description of benefits provided |
Retirement Benefits | Attract and retain the highest caliber executive talent by: • ensuring our overall compensation is competitive, and • providing our executives with a baseline level of financial security. | Tax-qualified plans: • Defined contribution option under the Domtar Pension Plan for Non-Negotiated Employees (Canadian tax-qualified pension plan that covers all Canadian salaried Domtar employees) – Mr. Buron participates in this plan. • Domtar U.S. Salaried 401(k) plan (tax-qualified defined contribution plan available to all U.S. Pulp and Paper salaried employees of Domtar) – Messrs. Williams, Henry, Edwards and Melton participate in this plan. • Domtar U.S. Salaried Pension plan (tax-qualified defined benefit cash balance plan that covers all U.S. Domtar employees hired on or before December 31, 2007) – Messrs. Edwards and Melton participate in this plan. |
Supplemental Executive Retirement Plans (“SERPs”) for U.S. and Canadian Executives: • Supplemental retirement benefits are provided to certain officers and key employees, under three supplemental retirement plans (DC SERP and DB SERP). • The SERP plans were designed to provide a competitive cost-effective retirement benefit over an executive’s career, and to provide consistency in employer-paid retirement plans for executives in Canada and the U.S. (to the degree possible, given differences in tax rules). • Mr. Buron is also eligible to receive benefits under the legacy Supplementary Pension Plan for Designated Managers of Domtar Inc. (“DM SERP”) with respect to his service prior to becoming a member of the Management Committee of Domtar Inc. in 2004. This plan was amended in 2013 to better align benefits with market practice. These amendments, as well as benefits under SERP plans and other arrangements, are more fully described in the narrative accompanying the Pension Benefits Table that appears later in this proxy statement. | ||
Health and Welfare Benefits | • Offer a competitive package • Provide benefits that will enable our executives to more fully focus on the demands of running our business. | • Medical & dental benefits • Life, accidental death and dismemberment coverage • Long-term disability insurance coverage |
118
Types of benefits | Underlying rationale for offering these | Description of benefits provided |
Provisions applicable to our NEOs vary based on whether they are based in the U.S. or in Canada. | ||
Executive Perquisites | • Provide flexibility to our executives • Increase travel efficiencies (for the CEO), which in turn ensures more productive use of his time and a greater focus on Domtar-related activities. | For a description of the perquisites provided, refer to the footnote disclosure to the All Other Compensation column in the Summary Compensation Table that appears later in this statement. We do not provide tax gross-ups on any perquisites other than for relocation expenses that are taxable. |
Employment Agreements and Other Post-Termination Protections
In mid-2013, Domtar entered into an amended and restated employment agreement with Mr. Williams. Effective November 30, 2021, a second amended and restated agreement was entered in place of the 2013 agreement. Under the terms of Mr. Williams’ new employment agreement, Mr. Williams is entitled to a Change in Control bonus equal to the amount of $5,270,000 to be paid in three equal installments on each of the following dates: November 30, 2021, November 30, 2022 and Term End Date (June 30, 2023). Upon a termination of the Executive’s employment for any reason prior to the Term Date, any unpaid installment will be paid no later than 30 days after the date of such termination. Additional material terms of the agreement with Mr. Williams are described in the section entitled “Employment Agreements and Potential Payments upon Termination or a Change in Control”.
On January 16, 2022, Mr. Buron’s entered into a fixed term employment contract, from January 17, 2021 to March 1, 2024. Mr. Buron’s duties and responsibilities will be consistent with that of the senior-most financial executive of the Company. Under the contract, Domtar agreed to pay Mr. Buron a final gross sum of US$2,501,112, less statutory tax withholdings, to be paid in two equal installments as of January 16, 2022 and November 30, 2022, respectively. The material terms of the new employment contract with Mr. Buron are described in the section entitled “Employment Agreements and Potential Payments upon Termination or a Change in Control.”
Members of our Management Committee (other than Messrs. Williams and Buron, whose severance is governed by their respective employment agreements) are eligible to participate in Domtar’s Severance Program for Management Committee Members, which is a severance program intended to assure that members are treated fairly in the event their employment is terminated.
This program is intended to:
The benefits provided under the caption “Compensationarrangements and plans described above are detailed and quantified under the heading “Employment Agreements and Potential Payments upon Termination or a Change in Control” later in this statement.
119
Related Policies and Considerations
Forfeiture of Awards for Misconduct (“Clawback”)
If a participant in the Long-Term Incentive Plan knowingly or grossly negligently engages in financial reporting misconduct, then all awards in the 12 months prior to the date the misleading financial statements were issued, as well as any awards that vested based on the misleading financial statements, will be disgorged to the Corporation. In addition, the Corporation may cancel or reduce, or require a participant to forfeit and disgorge to the Corporation or reimburse the Corporation for, any awards granted or vested, and bonus granted or paid, and any gains earned or accrued, due to the exercise, vesting or settlement of awards or sale of any common stock, to the extent permitted or required by, or pursuant to any Corporation policy implemented as required by, applicable law, regulation or stock exchange rule as may from time to time be in effect.
Timing of Long-Term Incentive Grants
The Corporation’s practice is to make all annual long-term award grants (other than new hire grants) once per year.
Risk Assessment of Compensation Programs, Policies and Practices
The Corporation has conducted an assessment of its compensation programs, policies and practices for all employees, including the Named Executive Officers, relative to risk to determine whether they create a reasonable likelihood of a material adverse effect on the Corporation. Based on this assessment, which also considered the control environment and approval processes in place, the Corporation concluded that its compensation programs, policies and practices do not encourage excessive or unnecessary risk-taking and are not reasonably likely to have a material adverse effect on the Corporation. The Corporation’s findings were reported to, and discussed by, the Advisory Human Resources Committee.
Board of Directors Report
We have reviewed and discussed the foregoing Compensation Discussion and Analysis”, “Executive Compensation”Analysis with management as required by Item 402(b) of Regulation S-K. We approve of the inclusion of the Compensation Discussion and “Director Compensation”Analysis in our Proxy Statementthe Corporation’s Annual Report on Form 10-K for the year ended December 31, 2022.
Report submitted as of March 3, 2023 by:
THE BOARD OF DIRECTORS OF DOMTAR CORPORATION:
Patrick Loulou
Tom Shih
Hardi Wardhana
120
EXECUTIVE COMPENSATION
Summary Compensation Table and Narrative Disclosure
The table and footnotes below describe the total compensation paid or awarded to or earned by the Corporation’s Named Executive Officers (“NEOs”).
Summary Compensation Table
Name and Principal Position | Year | Salary(1) | Bonus(2) | Stock | Non-Equity Plan | Change in Non-qualified | All | Total |
|
| ($) | ($) | ($) | ($) | ($) | ($) | ($) |
John D. Williams President and Chief Executive Officer | 2022 | 1,213,800 | 1,756,667 | N/A | 2,813,204 | – | 593,295 | 6,376,966 |
2021 | 1,213,800 | 1,756,667 | 4,136,690 | 4,018,377 | – | 406,575 | 11,532,109 | |
2020 | 1,213,800 | – | 4,154,011 | 893,272 | – | 459,104 | 6,720,187 | |
Daniel Buron Executive Vice President and Chief Financial Officer | 2022 | 681,520 | 2,841,872 | N/A | 1,673,813 | – | 201,562 | 5,398,767 |
2021 | 661,670 | – | 1,144,853 | 982,086 | – | 133,928 | 2,922,537 | |
2020 | 661,670 | – | 1,149,642 | 370,409 | 681,328 | 121,831 | 2,984,880 | |
Steve Henry Executive Vice President and COO | 2022 | 384,135 | 250,000 | N/A | 585,596 | N/A | 112,942 | 1,332,673 |
James (Bill) Edwards Senior Vice President, Pulp and Paper Operations | 2022 | 449,038 | 225,000 | N/A | 690,000 | – | 106,443 | 1,470,481 |
2021 | 387,668 | 520,000 | 209,722 | 433,602 | 6,819 | 60,545 | 1,618,356 | |
Robert Melton Senior Vice President, Commercial Pulp and Paper | 2022 | 409,135 | 205,000 | N/A | 628,667 | – | 85,764 | 1,328,566 |
2021 | 362,398 | 474,500 | 191,377 | 395,662 | – | 61,149 | 1,485,086 |
(1) Mr. Henry includes salary amounts from his respective role prior to his promotion to COO on November 28, 2022.
(2) This column reflects the 2022 payout of Mr. Williams Change in Control bonus; for Mr. Buron, a fixed term employment payment per his contract with Paper Excellence ($2,501,112)
and retention bonus ($340,760); and retention bonuses for Messrs. Henry, Edwards and Melton.
(3)This column is no longer relevant since Domtar is a Private company and no longer has common stock associated with it.The following amounts were reported in the
Corporation’s Option Exercises and Stock Vested Table for the prior year and settled in cash on December 13, 2021: Mr. Williams, $25,920,222 in stock awards,
$652,062 for options exercised and $5,123,721 for DSUs; Mr. Buron, $5,723,321 in stock awards and $561,984 for options exercised; Mr. Henry was not reported in prior
disclosures; Mr. Edwards, $754,600 in stock awards; and Mr. Melton, $735,958 in stock awards.
(4)This column represents:
(5) This column represents the actuarial increase in the applicable year in the pension value of the defined benefit retirement plans in which each NEO participates. Domtar does not pay
above market rates or preferential rates under its nonqualified deferred compensation plans. The actuarial present value of Mr. Williams’ accumulated benefits under the defined
benefit retirement plans decreased in 2020 by $29,153. The actuarial present value of Messrs. Williams, Buron and Melton’s accumulated benefits under the defined benefit retirement
plans decreased in 2021 by $1,264,047, $223,047 and $5,056., respectively. The actuarial present value of Messrs. Williams, Buron, Edwards and Melton decreased in 2022 by
$578,866, $986,120, $121,072 and $152,171, respectively. As a result, consistent with SEC rules, a zero is reflected in this column for 2020, 2021 and 2022. Mr. Henry does not
participate in a defined benefit retirement plan. As a result, N/A is reflected for him.
(6) Amounts shown in the “All Other Compensation” column include the following (for 2022 only):
Name | Corporation | Corporation | Personal Use of | Corporation | Financial | Professional | Club | Total |
| ($) | ($) | ($) | ($) | ($) | ($) | ($) | ($) |
John D. Williams | 411,950 | 528 | 107,158 | 58,734 | 3,000 | - | 11,925 | 593,295 |
Daniel Buron | 181,322 | 1,183 | 1,064 | 11,402 | 3,500 | 3,091 | - | 201,562 |
Steve Henry | 80,986 | 3,500 | - | 28,274 | 182 | - | - | 112,942 |
James (Bill) Edwards | 69,414 | 3,500 | - | 30,029 | 3,500 | - | - | 106,443 |
Robert Melton | 61,849 | 3,500 | - | 19,390 | 1,025 | - | - | 85,764 |
For purposes of this table, amounts paid in Canadian dollars were converted to U.S. dollars at the average prevailing spot exchange rate during 2022 (0.7682).
(a) Company contributions were made to the Domtar U.S. Salaried 401(k) plan for Messrs. Williams ($35,075), Henry ($33,550), Edwards ($16,775) and Melton ($16,775), to the
Domtar Pension Plan for Non-Negotiated Employees for Mr. Buron ($11,823), and to the DC SERP for Designated Executives of Domtar for Messrs. Williams ($376,875), Buron
121
($169,499), Henry ($47,436), Edwards ($52,639) and Melton ($45,074).
(b) Pursuant to his employment agreement, as amended, Mr. Williams is entitled to 36 hours per year of personal use of corporate aircraft. The amount for Mr. Williams includes personal
use of corporate aircraft ($83,403) and automobile ($23,755). Corporate aircraft charges are based on the incremental cost to Domtar. For Mr. Buron, the amount represents the cost
of company-paid parking.
(c) Represents the cost of company-paid health, welfare, disability, life, and accidental death and dismemberment insurance for the NEOs.
(d) This represents the amount paid for club membership dues pursuant to Mr. Williams’ employment agreement.
Grants of Plan-Based Awards Table
During 2022, the NEOs received the following types of plan-based awards:
Annual Incentive Plan – Domtar’s AIP is an incentive plan based on achieving pre-established annual targets. For 2022, the award under the AIP was payable in cash.
For each plan year, a specified percentage of each bonus award is based upon the performance objectives for that plan year. Each performance objective has an associated threshold level that must be achieved for any of the bonus award associated with such objective to be paid. The maximum bonus award that could be paid under the plan framework to a NEO for any plan year is $5 million. The Board of Directors may, in its sole discretion, reduce or eliminate the amount otherwise payable to a participant under the AIP. There is no payment under the plan for performance that does not meet the threshold level. The actual amount paid under the AIP for 2022 is set forth in the “Non-Equity Incentive Plan Compensation” column of the Summary Compensation Table.
Long-Term Incentive Plan – The following non-equity awards were granted to current NEOs in 2022 as units under the Long-Term Incentive Plan:
RUs – RUs or serviced-based awards were granted on January 1, 2022 under our Long-Term Incentive Plan to the NEOs.
PUs – PUs or performance-based awards were granted on January 1, 2022 under our Long-Term Incentive Plan to the NEOs.
Name |
Grant Type |
|
Grant Date |
Estimated Possible Payouts | Estimated Future Payouts | All Other Stock Awards: Number of Shares of Stock or Units(5) |
Grant Date Fair Value of | ||||
# of Units Awarded(2) |
Threshold |
Target |
Max |
Threshold |
Target |
Max | |||||
|
|
|
| $ | $ | $ | # | # | # |
| $ |
John D. Williams(1) | AIP | - | - | 426,044 | 1,420,146 | 2,840,292 | - | - | - | - | - |
| RUs | - | - | - | - | - | - | - | - | - | - |
| PUs | - | - | - | - | - | - | - | - | - | - |
Daniel Buron | AIP | - | - | 181,966 | 606,553 | 1,213,106 | - | - | - | - | - |
| RUs | 562,254 | 1/1/22 | - | 562,254 | - | - | - | - | - | - |
| PUs | 562,254 | 1/1/22 | 281,127 | 562,254 | 1,124,508 | - | - | - | - | - |
Steve Henry | AIP | - | - | 75,396 | 251,318 | 502,637 | - | - | - | - | - |
| RUs | 159,375 | 1/1/22 | - | 159,375 | - | - | - | - | - | - |
| PUs | 159,375 | 1/1/22 | 79,688 | 159,375 | 318,750 | - | - | - | - | - |
James (Bill) Edwards | AIP | - | - | 87,750 | 292,500 | 585,000 | - | - | - | - | - |
| RUs | 191,250 | 1/1/22 | - | 191,250 | - | - | - | - | - | - |
| PUs | 191,250 | 1/1/22 | 95,625 | 191,250 | 382,500 | - | - | - | - | - |
Rob Melton | AIP | - | - | 79,950 | 266,500 | 533,000 | - | - | - | - | - |
| RUs | 174,250 | 1/1/22 | - | 174,250 | - | - | - | - | - | - |
| PUs | 174,250 | 1/1/22 | 87,125 | 174,250 | 348,500 | - | - | - | - | - |
(4) These columns are no longer relevant since Domtar is a Private company and no longer has common stock associated with it.
(5) This column is no longer relevant since Domtar is a Private company and no longer has common stock associated with it.
(6) This column is no longer relevant since Domtar is a Private company and no longer has common stock associated with it.
Outstanding Equity Awards at Fiscal Year-End Table
122
Due to the acquisition by Paper Excellence as of November 30, 2021, all outstanding equity awards were settled and paid in cash on December 13, 2021.
Option Exercises and Stock Vested Table
Due to the acquisition by Paper Excellence as of November 30, 2021 and the payout of all outstanding equity awards and options at that time, there will no longer be any options or stock awarded due to the Corporations private company status.
Pension Benefits
The following table and narrative provide information on the defined benefit retirement plans in which the NEOs participate. The table illustrates the actuarial present value as of December 31, 2022 of benefits accumulated by the NEOs under Domtar’s defined benefit pension plans and arrangements using the methodology required by the SEC pursuant to the U.S. Accounting Standards at the earliest unreduced retirement age under the plan.
Name | Plan Name | Number of Years | Present Value of | Payments During |
John D. Williams(3) | DB SERP for Management | 15.00(2) | 282,219 | – |
Daniel Buron(3) | Supplementary Pension Plan for | 3.92 | 822,979 | – |
DB SERP for Management Committee Members of Domtar | 18.67(4) | 1,978,458 | – | |
Steve Henry(5), (6) | Domtar US Salaried Pension Plan | N/A | N/A | N/A |
James (Bill) Edwards(5)
| Domtar US Salaried Pension Plan | 27.24 | 382,545 | – |
Robert Melton(5)
| Domtar US Salaried Pension Plan | 31.71 | 327,588 | – |
(1) The Present Value of Accumulated Benefits has been calculated on the following basis:
(a) Best average earnings and credited service as of December 31, 2022.
(b) Retirement is assumed to occur at age 62 (age 60 for Mr. Buron) or actual age if above, the earliest age that qualifies for an unreduced pension under the DB SERP.
(c) Assumptions used correspond to those used for the purposes of determining the accrued benefit obligations of the defined benefit plans as of December 31, 2022 for the
financial statements of the Corporation (namely, a discount rate of 5.26% for Canadian executives, 5.15% for U.S. executives and 5.23% specifically for the Domtar US
Salaried Pension Plan, except that no mortality or termination of employment assumption before retirement was used.
(2) Mr. Williams has an agreement whereby two additional months per year of credited service are recognized in the DB SERP (up to a maximum of 12 months). As of December 31,
2022, Mr. Williams has received 12 months of additional service. This was implemented to compensate Mr. Williams for pension arrangements Mr. Williams had with his previous
employer.
(3) For purposes of this table, converted to U.S. dollars at the average prevailing spot exchange rate during 2022 (0.7682).
(4) Years of credited service are retroactive to the date in 2004 when Mr. Buron became a member of the Management Committee of Domtar. Mr. Buron is eligible for benefits under the
DB SERP for service since his appointment to the Management Committee in 2004, in replacement of the benefits accrued by him under the Supplementary Pension Plan for Senior
Management Employees (“SPP”) which he had joined in 2000. Because benefits under the DB SERP replaced the benefits accrued by Mr. Buron under the SPP, Mr. Buron’s accrued
pension under the DB SERP in respect of credited service prior to the time Mr. Buron began participating in the DB SERP will not be less than what he otherwise would have accrued
under the SPP, based on earnings and Management Committee service up to that date.
(5) Effective December 9, 2020, the DB SERP is closed to new membership.
(6) Mr. Henry does not participate in a defined benefit retirement plan. As a result, N/A is reflected for him.
DB SERP for Management Committee Members of Domtar (“DB SERP”). The CEO and CFO participate in the DB SERP, a defined benefit plan. The annual pension payable is equal to 2% of the best average earnings during any consecutive 60 months in the last 120 months for each year of credited service as a member of the Management Committee, less an offset based on entitlements from other pension plans of the Corporation (generally based on the assumption that maximum contributions have been made to tax-qualified plans in which the executive is eligible to participate). Earnings include base salary and annual cash bonuses (up to the lesser of 50% of previous year’s salary or 100% of target bonus). Effective December 9, 2020, the DB SERP is closed to new membership; however, NEOs participating in the DB SERP on or about March 25, 2021, is incorporated herein by reference.prior to that date will continue to accumulate benefits in accordance with its provisions.
For a Canadian executive, the DB SERP pension is payable for life and guaranteed for a minimum of five years. Other forms of payment are available on an actuarially equivalent basis. A Canadian executive will continue to accrue credited service in the DB SERP if he is considered “disabled” under the Canadian Pension Plan. Benefits under the DB SERP will only be paid upon a disabled participant’s actual termination of employment. Benefits for Canadian members of the Management Committee under the DB SERP who are not U.S. tax payers are generally gradually funded when such member reaches age 60, up to the normal retirement age (currently age 65). Such funding is maintained through retirement only if the member actually retires at age 65 or above while being a member of the Management Committee; otherwise, amounts set aside for the member revert to the Corporation. In the event of termination within 12 months of a change of control, the member’s interest in the assets set aside vest. Otherwise, members will receive their benefits out of
123
the general funds of the Corporation. For a U.S. executive, the present value of the DB SERP benefits will be paid in a lump sum upon retirement instead of a pension. Benefits under the DB SERP will only be paid upon a disabled participant’s actual termination of employment. U.S. executives will receive their benefits out of the general funds of the Corporation.
Supplementary Pension Plan for Designated Managers of Domtar Inc. (“Canadian Supplementary Plan”). The annual pension payable under the Canadian Supplementary Plan is equal to 1.5% of the average of the Yearly Maximum Pensionable Earnings during the five years preceding the employee’s termination of employment, plus 2% of the employee’s best average earnings during any consecutive 60 months in the last 120 months prior to his termination of employment, in excess of the average Yearly Maximum Pensionable Earnings, multiplied by his years of credited service. This annual pension is reduced by the benefits payable under the Domtar Pension Plan for Non-Negotiated Employees (same benefits as the Canadian Supplementary Plan, but subject to the Canadian Income Tax Act limits). The Yearly Maximum Pensionable Earnings correspond to the maximum earnings on which an employee may contribute under the Quebec Pension Plan. Effective January 1, 2015, bonuses are limited to the lesser of 50% of previous year’s salary or 100% of target bonus; however, the best average earnings since January 1, 2015 cannot be less than such average determined as at December 31, 2014. These benefits are fully vested from age 55 and also vest upon earlier of death or involuntary termination. Mr. Buron is eligible to receive benefits under the Canadian Supplementary Plan with respect to his service prior to becoming a member of the Management Committee of Domtar Inc. in 2004.
The Corporation has a securing arrangement through a letter of credit for benefits payable from the DB SERP and the Canadian Supplementary Plan for eligible Canadian executives who are not U.S. taxpayers. Mr. Buron is eligible for this coverage. The letter of credit will be used to pay eligible benefits in the event of failure of the employer to make payments.
The Corporation cautions that the values reported in the Present Value of Accumulated Benefit column are theoretical and are calculated pursuant to SEC requirements. The change in pension value from year to year is subject to market volatility and does not represent the value that a named executive officer actually accrues under the Corporation’s retirement plans during any given year nor what he will receive at retirement, termination or death.
Domtar U.S. Salaried Pension Plan (“U.S. Pension Plan”). The U.S. Pension Plan is a cash balance plan entirely funded by the Corporation. The plan was closed to new entrants on December 31, 2007. Under the U.S. Pension Plan, a percentage of the employee’s earnings is credited to his account each year, based on his age. In addition, the employee’s account is credited with an annual rate of interest based on the 30-year Treasury Constant Maturities rate published by the Federal Reserve Board. Benefits are fully vested in the employee after three years of service. Upon termination of employment or retirement, the account of the employee is converted into a pension using factors specified in the plan. The employee may instead elect a lump sum payment corresponding to the present value of the pension.
Nonqualified Deferred Compensation
The following table and narrative provide information on the nonqualified deferred compensation plans in which our NEOs participate. The table shows the 2022 account activity for each NEO and includes each executive’s contributions, company contributions, earnings, distributions and the aggregate balance of his total deferral account as of December 31, 2022. The aggregate balance includes the total personal contributions made (and not withdrawn) by each executive and the contributions made by the Corporation and predecessor companies over the career of each executive.
Name | Plan Name | Executive Last FY(1) | Registrant | Aggregate | Aggregate Distributions | Aggregate |
|
| ($) | ($) | ($) | ($) | ($) |
John D. Williams | DC SERP | – | $376,875 | ($808,720) | – | $5,370,244 |
Daniel Buron(2) | DC SERP | – | $169,499 | ($248,467) | – | $2,403,719 |
Steve Henry | DC SERP | – | $47,436 | ($36,492) | – | $226,812 |
James (Bill) Edwards | DC SERP | – | $52,639 | ($39,821) | – | $223,089 |
Robert Melton | DC SERP | – | $45,074 | ($29,557) | – | $190,893 |
(1) The amounts with respect to the DC SERP are included in the “All Other Compensation” column of the “Summary Compensation Table”.
(2) DC SERP amounts are converted in U.S. dollars at the average prevailing spot exchange rate during 2022 (0.7682).
(3) The following amounts were reported in the Corporation’s Summary Compensation Table for the prior years:
- Mr. Williams, $208,963 of the amounts with respect to the DC SERP
- Mr. Buron, $102,254 of the amounts with respect to the DC SERP
- Mr. Henry was not reported in prior disclosures
- Mr. Edwards, $12,382 of the amounts with respect to the DC SERP
- Mr. Melton, $12,596 of the amounts with respect to the DC SERP
124
Canadian executives’ accounts are credited with an amount equal to 11% of earnings, less the value of the benefit provided by the employer contributions under the Domtar Pension Plan for Non-Negotiated Employees (the “Canadian Pension Plan”), calculated based on the assumption that the executive has elected to contribute to the defined contribution option at the maximum allowable rate. A Canadian executive will continue to accrue benefits if he is considered “disabled” under the Canadian Pension Plan. Benefits under the DC SERP will only be paid upon a disabled participant’s actual termination of employment. A Canadian executive who retires after age 55 also has the option to receive his benefits over a 10-year period.
The Corporation has a securing arrangement through a letter of credit for benefits payable from the DC SERP for eligible Canadian executives who are not U.S. taxpayers. Mr. Buron is eligible for this coverage. The letter of credit will be used to pay eligible benefits in the event of failure of the employer to make payments.
For U.S. executives, the contribution formula under the DC SERP is the same as under the Domtar U.S. Salaried 401(k) Plan for a participant of the same age, without taking into account the tax limit applicable to tax qualified plans, less the employer contribution to the Domtar U.S. Salaried 401(k) Plan, calculated based on the assumption that the executive has elected to contribute to the Domtar U.S. Salaried 401(k) Plan at the maximum allowable rate.
For purposes of the DC SERP, “earnings” includes base salary and annual cash bonuses.
Employment Agreements and Potential Payments upon Termination or a Change in Control
Severance Benefits
Mr. Williams. Under the terms of Mr. Williams’ second amended and restated employment agreement, effective as of November 30, 2021, upon termination of Mr. Williams’ employment for Good Reason or due to death or disability, in each case, before the Term End Date, severance is to include: accelerated vesting of any unvested portion of the Service-Based LTI; a pro-rated portion of any unearned Performance-Based LTI in respect of the CEO KPIs for the year in which the termination date occurs (based on actual performance); continued eligibility to earn the amounts related to the Successor KPIs, subject to achievement of such Successor KPIs in the relevant years (2024, 2025 and 2026); a prorated bonus for the year in which the Executive’s termination occurs (based on actual achievement); and if the termination date occurs after the end of a calendar year, any unpaid bonus that the Executive would have received for such calendar year; and reimbursement of health coverage premiums for 24 months following the termination date.
Upon a termination of Mr. Williams’ employment as a result of the Term End Date, he shall be entitled to: reimbursement of health coverage premiums for 24 months following the Term End Date (or, if earlier, the date on which the Executive obtains coverage from another employer); and earn any unearned Performance-Based LTIP, subject to achievement of the CEO KPI in respect of fiscal year 2023 and applicable Successor KPIs.
Upon a termination of Mr. Williams’ employment by the Corporation for reasons other than death, disability, the Term End Date or cause (as defined in the agreement) or his breach of certain obligations in his employment agreement and other term of his employment agreement, Mr. Williams will be entitled to receive: any unpaid base salary and other compensation; any unreimbursed expenses; and any other benefits to which he is legally entitled, such as the unpaid portion of the Change in Control Bonus and, if the termination is due to early retirement, all post-retirement payments and benefits provided under the applicable plans.
Mr. Williams must give the Company six months’ notice of a termination without Good Reason and will continue to receive his base salary and earn other compensation during this period. The Company may elect to terminate Mr. Williams prior to the end of the notice period and pay him, in a cash lump sum: his base salary for the balance of the notice period; and any amounts that would have been paid or become vested during the notice period under the Annual Incentive Plan, the Service-Based LTI and, subject to achievement of the applicable key performance indicators, the Performance-Based LTI.
Mr. Buron. On January 14, 2022, Domtar entered into a fixed term employment contract with Mr. Buron. In consideration of the agreement, Domtar undertakes to pay Mr. Buron a Retention Bonus equal to 50% of base salary, less statutory tax withholdings, for each of the next two years, November 30, 2022 (first anniversary of the Paper Excellence acquisition) and November 30, 2023 (second anniversary of the Paper Excellence acquisition) respectively. Mr. Buron will not be eligible for the retention bonuses as set forth above if he is terminated for cause or resigns prior to such applicable anniversary. If the Company terminates employment without cause before the second installment is due, then he will be eligible to receive each of the retention bonuses set forth above minus any such retention bonus that has already been paid. If Mr. Buron becomes disabled or dies (i) during the first twelve-month period following the Paper Excellence acquisition, he will be eligible for a pro rata portion of the First Year Retention Bonus, or (ii) during the second twelve month period following the Closing, Executive will be eligible for a pro rata portion of the Second Year Retention Bonus (calculations defined in his agreement).
Upon a termination of employment on the Term End Date, March 1, 2024, which shall be deemed a retirement under the Company’s plans, policies and programs, Mr. Buron (or his estate) will receive the following payments and benefits: any unpaid base salary and any other earned but unpaid compensation with respect to the period prior to the effective date of termination; a prorated bonus under the Annual Incentive Plan for the year in which the Term End Date occurs if Mr. Buron had continued in employment based on achievement of the applicable performance criteria for such year; any unvested Restricted Units prorated based on the number of days
125
elapsed from the respective grant date through the Term End Date; any unvested Performance Units prorated based on the number of days elapsed from the commencement of the respective performance period through the Term End Date, subject to the achievement of the performance goals; and coverage under the Company’s medical and dental insurance policies for 24 months after the Term End Date at no cost to Mr. Buron.
Mr. Buron’s employment shall terminate automatically upon his death or for cause (as defined in his agreement) without the Company being bound to pay any compensation whatsoever except as otherwise required herein or under the text of the Company’s plans, policies and programs.
Other NEOs. Under our Severance Program applicable to members of its Management Committee, our NEOs would be entitled to up to 24 months’ salary payable in a lump sum upon a termination of employment by the Corporation for reasons other than cause, with benefit levels that vary based on service. Severance is equal to one year’s base salary regardless of service as a member of the Management Committee, with three additional months’ salary paid for each full year of service on the Management Committee, up to a maximum of 24 months base salary. Messrs. Henry, Edwards and Melton would be entitled to 15 months’ salary. The executives would also be entitled to continued health benefits for the severance period, except if the executive’s benefits are subject to taxation in the United States, in which case the health insurance policies maintained by the Corporation will remain in effect until the earlier to occur of the last day of the severance period and the 18-month anniversary of the date the executive’s separation from service. The executives will also be entitled to outplacement services.
In the event one of the covered executives’ employment is involuntarily terminated without cause or the executive voluntarily terminates his employment for good reason within three months prior to or 24 months following a change in control of the Corporation, each of NEOs would be entitled to cash severance equal to 24 months’ salary plus two times his target bonus as of the date of termination or, if greater, the date of the change in control.
Under our severance program, a covered executive who has been involuntarily terminated by the Corporation for business reasons, whether or not in connection with a Change in Control, or who in the three months prior to or 24 months following a Change in Control has terminated his or her employment for Good Reason or has been terminated by the Corporation without Cause will be eligible for a prorated bonus under the AIP for the year in which the termination of employment occurred. Payment will be based on the pre-established goals under the AIP for the applicable plan year accrued on the books and records of the Corporation as at the end of the fiscal quarter ended immediately prior to such termination (or such greater amount as is payable under the AIP) and the covered executive’s performance.
Other Post-Employment Benefits. In the event of death, an amount equal to 2.5 times base salary (up to a maximum of CAN$1,500,000) in the year of the death is payable to the beneficiaries of Canadian executives pursuant to the life insurance program offered under the Corporation’s flexible benefit program option available to senior Canadian executives. In the event of the death of a U.S. executive (other than Mr. Williams, whose beneficiary would receive a payment of $2,757,000), the beneficiary will receive a payment equal to the calculated amount of the life insurance (up to maximum of $1,600,000 including the basic life insurance of up to $50,000) based on the basic annual salary of the executive in the year of his or her death pursuant to the U.S. Executive Life plan and using the following table:
Age | Multiplier |
Under 45 | 5 times |
45 to 49 | 4 times |
50 to 54 | 3 times |
55 or over | 2 times |
The supplemental pension benefits under the DB SERP for Management Committee Members of Domtar for Messrs. Williams and Buron and under the DC SERP for Designated Executives of Domtar for Messrs. Williams, Buron, Henry, Edwards and Melton, are fully vested. They will receive benefits under these plans in the event of their death or if their employment were terminated involuntarily. However, before such date, all benefits in the event of death under these plans were considered vested.
Change in Control Protections. The Corporation does not have change in control agreements with its employees (although as described above, enhanced benefits may be available under our severance plan). Under the Long-Term Incentive Plan, upon a change in control, unless otherwise determined by the Board or as otherwise provided in an Award Agreement, all outstanding Awards shall be considered vested.
All outstanding Service Awards held by a Participant shall become vested and the Restricted Period on all such outstanding Service Awards shall lapse and for each outstanding Performance Award held by a Participant shall be deemed to be earned and become vested based on the plan terms regarding performance cycles completed, in progress or not yet commenced. All other Performance Awards that do not vest in accordance with the performance rules shall lapse and be forfeited and canceled upon consummation of the Change in Control without any payment therefor.
If there is a change in control and a participant’s employment is terminated for business reasons within 3 months prior to the occurrence of a Change in Control shall be considered an active employee and continuing in the Company’s employment until the occurrence of
126
such Change in Control, and to have been terminated immediately thereafter. Any amounts payable in respect of vested Awards shall be settled in cash.
Under our annual incentive plan, bonuses payable for the year in which the change in control occurs will not be less than the bonus amounts accrued on the books and records of the Corporation as of the date of the change in control.
The following table presents potential payments to each NEO as if the officer’s employment had been terminated and/or if a change in control had occurred as of December 31, 2022, the last business day of 2022. As all outstanding equity has been settled prior to the end of fiscal year 2021, there is no equity that would be paid out under these scenarios. The actual amounts that would be paid to any NEO can only be determined at the time of an actual termination of employment or change in control and would vary from those listed below. The estimated amounts listed below are in addition to any retirement, welfare and other benefits that are available to our salaried employees generally.
|
|
|
|
|
|
|
Name | Severance Pay | Non-Equity With Accelerated Vesting | Retirement Plan Benefits: SERP | Death/ Disability Benefits | Continued Perquisites and Benefits(1) | Total |
|
|
|
|
|
|
|
| ($) | ($)(7) | ($) | ($) | ($) | ($) |
John D. Williams(5) |
|
|
|
|
|
|
Death | 4,088,204 | – | 5,652,629 (2) | 2,757,000(4) | – | 12,497,833 |
Disability | 4,088,204 | – | 5,652,629 (2) | 483,3813) | – | 10,224,214 |
Involuntary Termination without Cause | 4,088,204 | – | 5,652,629 (2) | – | 30,806 | 9,771,639 |
Voluntary Termination for Good Reason | 4,088,204 | – | 5,652,629 (2) | – | 30,806 | 9,771,639 |
Voluntary Termination without Good Reason or Termination for Cause | 2,963,204 | – | 5,652,629 (2) | – | – | 8,615,833 |
Change-In-Control | – | – | – | – | – | – |
Daniel Buron(6) |
|
|
|
|
|
|
Death | 879,049 | 749,501 | 5,232,112 (2) | 444,457(2)(4) | – | 7,305,119 |
Disability | 879,049 | 774,465 | – | 395,726(2)(3) | – | 2,049,240 |
Retirement | 879,049 | 399,458 | 5,232,112 (2) | – | – | 6,510,619 |
Involuntary Termination without Cause | 1,189,934 | 1,199,468 | 5,232,112 (2) | – | 11,252(2) | 7,632,766 |
Voluntary Termination for Good Reason | 879,049 | 399,458 | 5,232,112 (2) | – | – | 6,510,619 |
Voluntary Termination without Good Reason or Termination for Cause | 849,174 | 399,458 | 5,232,112 (2) | – | – | 6,480,744 |
Change-In-Control | – | – | – | – | – | – |
Steve Henry |
|
|
|
|
|
|
Death | – | 212,452 | 226,812 | 1,550,000(4) | – | 1,989,264 |
Disability | – | 219,528 | 226,812 | – | – | 446,340 |
Retirement | – | – | – | – | – | – |
Involuntary Termination | 1,080,000 | – | 226,812 | – | 29,800 | 1,336,612 |
Change-In-Control | – | – | – | – | – | – |
Involuntary Termination or Termination for good Reason within Two Years after a Change-In-Control | 1,650,000 | 339,997 | 226,812 | – | 29,800 | 2,246,609 |
James (Bill) Edwards |
|
|
|
|
|
|
Death | – | 254,942 | 223,089 | 950,000(4) | – | 1,428,031 |
Disability | – | 263,433 | 223,089 | – | – | 486,522 |
Retirement | – | 135,875 | 223,089 | – | – | 358,964 |
Involuntary Termination | 972,000 | – | 223,089 | – | 29,800 | 1,224,889 |
Change-In-Control | – | – | – | – | – | – |
Involuntary Termination or Termination for Good Reason within Two Years after a Change-In-Control | 1,485,000 | 407,997 | 223,089 | – | 29,800 | 2,145,886 |
Robert Melton |
|
|
|
|
|
|
Death | – | 232,280 | 190,893 | 1,300,000(4) | – | 1,723,173 |
Disability | – | 240,017 | 190,893 | – | – | 430,910 |
Retirement | – | – | - | – | – | – |
Involuntary Termination | 885,600 | – | 190,893 | – | 17,484 | 1,093,977 |
Change-In-Control | – | – | – | – | – | – |
Involuntary Termination or Termination for Good Reason within Two Years after a Change-In-Control | 1,353,000 | 371,731 | 190,893 | – | 17,484 | 1,933,108 |
(1) Amount shown under “Continued Perquisites and Benefits” represents the cost of company-paid medical and dental for all NEOs, and also includes life and accidental death and
dismemberment for Mr. Buron.
(2) For the purposes of this table, converted to U.S. dollars at spot exchange rate of December 31, 2022 (0.7383).
(3) Represents the estimated present value of the disability benefit that is in excess of what is currently offered to salaried employees. These benefits are uninsured.
(4) Represents the death benefit, which is fully insured.
(5) As described in the “Employment Agreements and Other Post-Termination Protections” and the “Employment Agreements and Potential Payments upon Termination or a Change in
Control“ section the stated two conditions are not reflected in the above table: Mr. Williams is due any owed payments of his Change in Control bonus as it is considered fully vested
with future payments, regardless of termination reason and is also eligible to receive up to $175,000 based on achievement of the Successor KPIs in future years. His accelerated
vesting of service and performance-based LTI is included in the ‘Severance Pay’ calculation per the terms of his second amended and restated employment agreement.
(6) As described in the “Employment Agreements and Other Post-Termination Protections“ section, Mr. Buron is due any owed payments from his employment release agreement and
is not reflected in the table above.
(7) Amount included for the PU grant has been calculated at “Target” for Death benefits and, for all other instances, based on achievement of the performance goals through 2022 for the
2022 metrics, and at “Target” for awards with performance periods that commence after 2022. Mr. Williams did not receive a 2022 LTIP grant per his second amended and restated
employment agreement.
127
DISCLOSURE OF THE CEO PAY RATIO
As required by the Dodd-Frank Wall Street Reform and Consumer Protection Act, and Regulation S-K (the “Regulation”), we are providing the following information about the relationship between the annual total compensation of our Chief Executive Officer and that of our median employee:
To determine its median employee for purposes of the CEO pay ratio, Domtar analyzed its employee population (excluding the CEO) of approximately 6,350 full-, part-time and temporary employees across the U.S. and Canada as of December 1, 2022. The median employee was identified using base compensation, which we determined reasonably reflects the annual compensation and is consistently applied to all our employees. The calculation of total compensation of the CEO and the median employee was determined in the same manner as the “Total Compensation” shown for our CEO in the “Summary Compensation Table”.
In 2022, Domtar CEO’s total compensation was $6,376,966 and the total compensation of Domtar’s median employee was $102,137. The resulting ratio of total compensation of the CEO to our median employee is 62:1. This ratio is a reasonable estimate calculated in a manner consistent with the Regulation.
The applicable rules provide issuers with a great degree of flexibility in determining the methodology and related assumptions in identifying their median employee and calculating the ratio. As a result, the pay ratio we have disclosed in this statement may not be comparable to pay ratios disclosed by other companies.
Director Compensation
Members of our Board of Directors do not receive compensation for their service.
ITEM 12. SECURITY OWNERSHIP OF CERTAIN BENEFICIAL OWNERS AND MANAGEMENT AND RELATED STOCKHOLDER MATTERS
The information appearing under
As of February 28, 2023, there were 100 shares of common stock of the caption “Security OwnershipCompany issued and outstanding. All of Certain Beneficial Owners,our issued and outstanding common stock is owned by Pearl Excellence Holdco L.P., the general partner of which is Karta Halten General Partner B.V.,which is indirectly 100% owned by Mr. Jackson Wijaya. Directors and Officers” in our Proxy Statement for the 2021 Annual Meeting of Stockholders, to be filed on or about March 25, 2021, is incorporated herein by reference.
The following table sets forth the number ofExecutive Officers do not own shares of our stock reserved for issuance under our equity compensation plans asthe Company or any of December 31, 2020:
|
|
|
|
|
|
|
|
|
|
|
|
|
| Number of securities remaining |
| |
|
| Number of securities to |
|
|
|
|
|
|
|
|
|
| available for future issuance under |
| ||
|
| be issued upon exercise |
|
|
|
| Weighted average exercise price |
|
|
|
| equity compensation |
| |||
|
| of outstanding options, |
|
|
|
| of outstanding |
|
|
|
| plans (excluding securities reflected |
| |||
Plan Category |
| warrants and rights (#) |
|
|
|
| options, warrants and rights ($) |
|
|
|
| in column (a) (#) |
| |||
|
| (a) |
|
|
|
| (b) |
|
|
|
| (c) |
| |||
Equity compensation plans approved by security holders |
|
| 1,622,535 |
|
| (1 | ) | $ | 47.07 |
|
| (2 | ) |
| 872,136 |
|
Equity compensation plans not approved by security holders |
| N/A |
|
|
|
| N/A |
|
|
|
| N/A |
| |||
Total |
|
| 1,622,535 |
|
|
|
| $ | 47.07 |
|
|
|
|
| 872,136 |
|
its parent or subsidiaries. |
|
|
|
|
|
The information appearing under the captions “GovernanceCompany has written Procedures for Review of Related Person Transactions. Under such procedures, each director, director nominee, executive officer and shareholder beneficially owning more than five percent of voting securities of the Company must notify the Senior Vice-President, General Counsel and Corporate Secretary in writing of any related person transaction in which the Company was or is to be a participant, where the amount exceeds $120,000. In 2021, the Company assumed debt incurred by upstream owners in connection with their payment of the Merger consideration.
Director Independence
Domtar Corporation – Board Independenceis a privately-held corporation, held by Paper Excellence. Messrs. Loulou, Shih and Other Determinations” in our Proxy Statement for the 2021 Annual MeetingWardhana are not independent because of Stockholders is incorporated herein by reference.their affiliations with Paper Excellence.
128
ITEM 14. PRINCIPAL ACCOUNTANT FEES AND SERVICES
The information appearing underCompany’s fees for services performed by its independent auditor, PricewaterhouseCoopers LLP, (“PwC”) during fiscal years 2022 and 2021 were:
| 2022 | 2021 |
Audit fees(1) | $ 2,079,826 | $ 2,728,863 |
Audit- related fees | $ 240,623 | $ 205,000 |
Tax fees(2) | $ 77,900 | $ 341,526 |
All other fees(3) | $ 7,026 | $ 7,284 |
Total | $ 2,405,375 | $ 3,282,673 |
(1) Audit fees were primarily for services rendered in connection with the caption “Ratificationaudit of Appointmentthe financial statements included in the Annual Report of Independent Registered Public Accounting Firm”the Corporation on Form 10-K, and “Independent Registered Public Accounting Firm Fees”reviews of the financial statements included in our Proxy Statementthe Corporation’s Quarterly Reports on Form 10-Q. 2021 audit fees also include fees for professional services rendered for the audit of the effectiveness of internal control over financial reporting. This caption also includes audit fees for separate audit opinions for stand-alone audits of 100% owned subsidiaries of the Corporation.
(2) Tax fees related to tax compliance, tax planning and tax advice.
(3) The 2021 Annual Meetingand 2022 fees included amounts for license fees for an accounting and reporting research tool.
The Company has established policies requiring its pre-approval of Stockholders is incorporated hereinaudit and non-audit services provided by reference.the independent registered public accounting firm. The policies require that the Board annually pre-approve specifically described audit and audit-related services. For the annual pre-approval, the Board approves categories of audit services and audit-related services, and related fee budgets. For all pre-approvals, the Board considers whether such services impair the independence of the Corporation’s independent registered public accounting firm. All audit and non-audit fees were approved pursuant to the policy in 2021 and 2022.
129
PART IV
ITEM 15. EXHIBITS AND FINANCIAL STATEMENT SCHEDULES
| (a) 1. Financial Statements – See Item 8, Financial Statements and Supplementary Data.
|
|
2. Schedule II – Valuation and Qualifying Accounts
All other schedules are omitted as the information required is either included elsewhere in the consolidated financial statements in Item 8, Financial Statements and Supplementary Data – or is not applicable.
3. Exhibits:
|
|
|
| Incorporated by reference to: | ||
Exhibit Number |
| Exhibit Description |
| Form | Exhibit | Filing Date |
|
|
|
|
|
|
|
2.1 |
|
| 8-K | 2.1 | 01/08/2021 | |
|
|
|
|
|
|
|
3.1 |
|
| 10-Q | 3.1 | 08/08/2008 | |
|
|
|
|
|
|
|
3.2 |
| Certificate of Amendment of the Amended and Restated Certificate of Incorporation |
| 8-K | 3.1 | 06/08/2009 |
|
|
|
|
|
|
|
3.3 |
|
| 8-K | 3.1 | 02/24/2016 | |
|
|
|
|
|
|
|
4.1 |
|
| 8-K | 4.1 | 02/21/2008 | |
|
|
|
|
|
|
|
4.2 |
|
| 8-K | 4.1 | 03/16/2012 | |
|
|
|
|
|
|
|
4.3 |
|
| S-3 | 4.8 | 08/20/2012 | |
|
|
|
|
|
|
|
4.4 |
|
| 8-K | 4.1 | 08/23/2012 | |
|
|
|
|
|
|
|
4.5 |
|
| 8-K | 4.1 | 11/26/2013 | |
|
|
|
|
|
|
|
4.6 |
|
| 10-Q | 10.1 | 05/08/2020 | |
|
|
|
|
|
|
|
4.7 |
| Third Amended and Restated Credit Agreement dated as of August 22, 2018 |
| 10-Q | 10.1 | 11/08/2018 |
|
|
|
|
|
|
|
10.1* |
|
| 10-K | 10.30 | 02/27/2009 | |
|
|
|
|
|
|
|
10.2* |
|
| 8-K | 10.1 | 05/24/2007 | |
|
|
|
|
|
|
|
|
|
|
| Incorporated by reference to: | ||
Exhibit Number |
| Exhibit Description |
| Form | Exhibit | Filing Date |
|
|
|
|
|
|
|
2.1 |
|
| 10-Q | 2.1 | 08/05/2021 | |
|
|
|
|
|
|
|
2.2 |
|
| 8-K | 2.1 | 05/12/2021 | |
|
|
|
|
|
|
|
2.3 |
|
| 8-K | 2.1 | 01/08/2021 | |
|
|
|
|
|
|
|
2.4 |
|
| 8-K | 2.1 | 11/07/2022 | |
|
|
|
|
|
|
|
2.5 |
|
| 8-K | 2.1 | 28/02/2023 | |
|
|
|
|
|
|
|
3.1 |
|
| 8-K | 3.1 | 11/30/2021 | |
|
|
|
|
|
|
|
3.2 |
|
| 8-K | 3.2 | 11/30/2021 | |
|
|
|
|
|
|
|
4.1 |
|
| 10-K | 4.1 | 03/10/2022 | |
|
|
|
|
|
|
|
4.2 |
|
| 10-K | 4.2 | 03/10/2022 | |
|
|
|
|
|
|
|
4.3 |
|
| 10-K | 4.3 | 03/10/2022 | |
|
|
|
|
|
|
|
4.4 |
|
| 10-K | 4.4 | 03/10/2022 | |
|
|
|
|
|
|
|
4.5 |
|
| 10-K | 4.5 | 03/10/2022 | |
|
|
|
|
|
|
|
130
131
Incorporated by reference to: | |||||||
|
|
|
|
| |||
Number | Exhibit Description |
|
|
| Filing Date | ||
| |||||||
| |||||||
|
| ||||||
|
| ||||||
|
|
|
|
| |||
|
|
|
| ||||
|
| ||||||
|
| ||||||
|
|
|
| ||||
|
|
|
|
| |||
|
|
|
|
| |||
| |||||||
|
| ||||||
| |||||||
| |||||||
| |||||||
| |||||||
| |||||||
101.INS | XBRL Instance Document – the instance document does not appear in the Interactive Data File because its XBRL tags are embedded within the Inline XBRL document. | ||||||
|
| ||||||
|
| ||||||
|
| ||||||
|
| ||||||
| ||||||
|
|
|
|
| ||
| ||||||
| Inline XBRL Taxonomy Extension Schema | |||||
101.CAL | Inline XBRL Taxonomy Extension Calculation Linkbase | |||||
101.DEF | Inline XBRL Taxonomy Extension Definition Linkbase | |||||
101.LAB | Inline XBRL Taxonomy Extension Label Linkbase | |||||
101.PRE | Inline XBRL Extension Presentation Linkbase | |||||
104 | Cover Page Interactive Data File (formatted as inline XBRL and contained in Exhibit 101) | |||||
|
|
* Indicates management contract or compensatory arrangement
132
FINANCIAL STATEMENT SCHEDULE
(IN MILLIONS OF DOLLARS, UNLESS OTHERWISE NOTED)
SCHEDULE II – VALUATION AND QUALIFYING ACCOUNTS
For the three yearsperiods ended:
|
| Balance at |
|
| Charged to |
|
| Deductions from |
|
| Balance at end |
| ||||
|
| beginning of year |
|
| income |
|
| reserve |
|
| of year |
| ||||
|
| $ |
|
| $ |
|
| $ |
|
| $ |
| ||||
Allowances deducted from related asset accounts: |
|
|
|
|
|
|
|
|
|
|
|
|
|
|
|
|
Doubtful accounts - Accounts receivable |
|
|
|
|
|
|
|
|
|
|
|
|
|
|
|
|
2020 |
|
| 4 |
|
|
| 4 |
|
|
| (2 | ) |
|
| 6 |
|
2019 |
|
| 3 |
|
|
| 1 |
|
|
| — |
|
|
| 4 |
|
2018 |
|
| 4 |
|
|
| 2 |
|
|
| (3 | ) |
|
| 3 |
|
|
| Balance at |
|
| Charged to |
|
| Deductions from |
|
| Balance at end |
| ||||
|
| beginning of year |
|
| income |
|
| reserve |
|
| of year |
| ||||
|
| $ |
|
| $ |
|
| $ |
|
| $ |
| ||||
Valuation Allowance on Deferred Tax Assets |
|
|
|
|
|
|
|
|
|
|
|
|
|
|
|
|
2020 |
|
| 17 |
|
|
| 47 |
|
|
| — |
|
|
| 64 |
|
2019 |
|
| 12 |
|
|
| 5 |
|
|
| — |
|
|
| 17 |
|
2018 |
|
| 12 |
|
|
| — |
|
|
| — |
|
|
| 12 |
|
|
| Successor |
|
|
| Predecessor |
| ||||||||||
|
| Year ended |
|
| Period from |
|
|
| Period from |
|
| Year ended |
| ||||
|
| 2022 |
|
| 2021 |
|
|
| 2021 |
|
| 2020 |
| ||||
|
| $ |
|
| $ |
|
|
| $ |
|
| $ |
| ||||
|
|
|
|
|
|
|
|
|
|
|
|
|
| ||||
Allowances deducted from related asset accounts: |
|
|
|
|
|
|
|
|
|
|
|
|
| ||||
Doubtful accounts - Accounts receivable |
|
|
|
|
|
|
|
|
|
|
|
|
| ||||
Balance at beginning of period |
|
| 4 |
|
|
| 4 |
|
|
|
| 6 |
|
|
| 4 |
|
Charged to income |
|
| — |
|
|
| — |
|
|
|
| (2 | ) |
|
| 4 |
|
Deductions from reserve |
|
| — |
|
|
| — |
|
|
|
| — |
|
|
| (2 | ) |
Balance at end of period |
|
| 4 |
|
|
| 4 |
|
|
|
| 4 |
|
|
| 6 |
|
Valuation Allowance on Deferred Tax Assets |
|
|
|
|
|
|
|
|
|
|
|
|
| ||||
Balance at beginning of period |
|
| 58 |
|
|
| 58 |
|
|
|
| 64 |
|
|
| 17 |
|
Charged to income |
|
| (1 | ) |
|
| — |
|
|
|
| 1 |
|
|
| 47 |
|
Deductions from reserve |
|
| 1 |
|
|
| — |
|
|
|
| (7 | ) |
|
| — |
|
Balance at end of period |
|
| 58 |
|
|
| 58 |
|
|
|
| 58 |
|
|
| 64 |
|
133
ITEM 16. FORM 10-K SUMMARY
None.
SIGNATURES
134
SIGNATURES
Pursuant to the requirements of Section 13 or 15(d) of the Securities Exchange Act of 1934, the registrant has duly caused this report to be signed on its behalf by the undersigned, thereunto duly authorized in the City of Fort Mill, South Carolina, United States, on March 1, 20213, 2023
DOMTAR CORPORATION | ||
by | /s/ John D. Williams | |
Name: | John D. Williams | |
Title: | President and Chief Executive Officer | |
We, the undersigned directors and officers of Domtar Corporation, hereby severally constitute Zygmunt JablonskiNancy Klembus and Razvan L. Theodoru,Josée Mireault, and each of them singly, our true and lawful attorneys with full power to them and each of them to sign for us, in our names in the capacities indicated below, any and all amendments to this Annual Report on Form 10-K filed with the Securities and Exchange Commission.
Pursuant to the requirements of the Securities Exchange Act of 1934, this report has been signed below by the following persons on behalf of the registrant and in the capacities and on the dates indicated.
Signature | Title | Date | |||
/s/ John D. Williams | President and Chief Executive Officer (Principal Executive Officer) and Director | March | |||
| 3, 2023 | ||||
John D. Williams | |||||
/s/ Daniel Buron | Executive Vice President and Chief Financial | March | |||
Daniel Buron | Officer (Principal Financial Officer and | ||||
Principal Accounting Officer) | |||||
/s/ | Director | March | |||
| 3, 2023 | ||||
Patrick Loulou | |||||
|
|
| |||
| |||||
/s/ Tom Shih | Director | March 3, 2023 | |||
|
|
| |||
| |||||
/s/ | Director | March | |||
| 3, 2023 | ||||
Hardi Wardhana | |||||
|
|
| |||
| |||||
|
|
| |||
| |||||
|
|
| |||
| |||||
|
|
| |||
|
135
132