Table of Contents

UNITED STATES

SECURITIES AND EXCHANGE COMMISSION

WASHINGTON, D.C. 20549

FORM10-K

ANNUAL REPORT PURSUANT TO SECTION 13 OR 15(d) OF THE SECURITIES EXCHANGE ACT OF 1934

ANNUAL REPORT PURSUANT TO SECTION 13 OR 15(d) OF THE SECURITIES EXCHANGE ACT OF 1934

For the fiscal year ended December 31 2020, 2023

or

TRANSITION REPORT PURSUANT TO SECTION 13 OR 15(d) OF THE SECURITIES EXCHANGE ACT OF 1934

TRANSITION REPORT PURSUANT TO SECTION 13 OR 15(d) OF THE SECURITIES EXCHANGE ACT OF 1934

For the transition period from to

Commission File Number: file number:001-39315

VROOM, INC.

(Exact nameName of registrantRegistrant as specifiedSpecified in its charter)Its Charter)

Delaware

901112566

(State or other jurisdictionOther Jurisdiction of

incorporationIncorporation or organization)Organization)

(I.R.S. Employer

Identification Number)No.)

1375 Broadway, 3600 W Sam Houston Pkwy S, Floor 114

New York, New York 10018Houston, Texas77042

(Address of principal executive offices) (Zip code)

(855) 524-1300(518)535-9125

(Registrant's telephone number, including area code)

Securities registered pursuant to Section 12(b) of the Act:

Title of each class

Trading Symbol(s)

Name of each exchange on which registered

Common Stock, $0.001 par value

VRM

Nasdaq Global Select

Securities registered pursuant to Section 12(g) of the Act: None.

Indicate by check mark if the Registrantregistrant is a well-known seasoned issuer, as defined in Rule 405 of the Securities Act. YES Yes NO No

Indicate by check mark if the Registrantregistrant is not required to file reports pursuant to Section 13 or Section 15(d) of the Act. YES Yes NO No

Indicate by check mark whether the Registrant:registrant: (1) has filed all reports required to be filed by Section 13 or 15(d) of the Securities Exchange Act of 1934 during the preceding 12 months (or for such shorter period that the Registrant was required to file such reports), and (2) has been subject to such filing requirements for the past 90 days. YES Yes NO No

Indicate by check mark whether the Registrantregistrant has submitted electronically every Interactive Data File required to be submitted pursuant to Rule 405 of Regulation S-T (§232.405 of this chapter) during the preceding 12 months (or for such shorter period that the Registrantregistrant was required to submit such files). YES Yes NO No

Indicate by check mark whether the registrant is a large accelerated filer, an accelerated filer, a non-accelerated filer, a smaller reporting company, or an emerging growth company. See the definitions of "large accelerated filer," "accelerated filer," "smaller reporting company," and "emerging growth company" in Rule 12b-2 of the Exchange Act.

Large accelerated filer

Accelerated filer

Non-accelerated filer

Smaller reporting company

Emerging growth company

If an emerging growth company, indicate by check mark if the registrant has elected not to use the extended transition period for complying with any new or revised financial accounting standards provided pursuant to Section 13(a) of the Exchange Act.

Indicate by check mark whether the registrant has filed a report on and attestation to its management’s assessment of the effectiveness of its internal control over financial reporting under Section 404(b) of the Sarbanes-Oxley Act (15 U.S.C. 7262(b)) by the registered public accounting firm that prepared or issued its audit report.

If securities are registered pursuant to Section 12(b) of the Act, indicate by check mark whether the financial statements of the registrant included in the filing reflect the correction of an error to previously issued financial statements.

Indicate by check mark whether any of those error corrections are restatements that required a recovery analysis of incentive-based compensation received by any of the registrant’s executive officers during the relevant recovery period pursuant to §240.10D-1(b). ☐

Indicate by check mark whether the registrant is a shell company (as defined in Rule 12b-2 of the Exchange Act). YesNo

As of June 30, 2020,2023, the aggregate market value of the common stock of the registrant held by non-affiliates was $4.8 billion$184.0 million based on the closing price of the common stock on theThe Nasdaq Global Select Market of the Nasdaq Stock Market LLC on such date.


Table of Contents

As of March 1, 2021, 135,599,6847, 2024, 1,794,797 shares of the registrants’ common stock were outstanding.

DOCUMENTS INCORPORATED BY REFERENCE

TheCertain portions of the information required to be furnished pursuant to Part III of this Annual Report on Form 10-K will be set forth in, and incorporated by reference from, the registrant’s definitive proxy statement for the annual meeting of stockholders which will be filed with the Securities and Exchange Commission no later than 120 days after the end of the fiscal year ended December 31, 2020.2023.


Table of Contents

TABLE OF CONTENTS

Page

Part I

56

Item 1.

Business

56

Item 1A.

Risk Factors

2012

Item 1B.

Unresolved Staff Comments

4941

Item 2.1C.

PropertiesCybersecurity

4942

Item 3.2.

Legal ProceedingsProperties

4943

Item 4.3.

Mine Safety DisclosuresLegal Proceedings

4943

Item 4.

Mine Safety Disclosures

45

Part II

5349

Item 5.

Market for Registrant’s Common Equity, Related Stockholder Matters, and Issuer Purchases of Equity Securities

5349

Item 6.

Selected Financial DataReserved

5550

Item 7.

Management’s Discussion and Analysis of Financial Condition and Results of Operations

5651

Item 7A.

Quantitative and Qualitative Disclosure About Market Risk

7972

Item 8.

Financial Statements and Supplementary Data

8073

Item 9.

Changes in and Disagreements with Accountants on Accounting and Financial Disclosure

110123

Item 9A.

Controls and Procedures

110123

Item 9B.

Other Information

111123

Item 9C.

Disclosure Regarding Foreign Jurisdictions that Prevent Inspections

124

Part III

112125

Item 10.

Directors, Executive Officers, and Corporate Governance

112125

Item 11.

Executive Compensation

112125

Item 12.

Security Ownership of Certain Beneficial Owners and Management and Related Stockholder Matters

112125

Item 13.

Certain Relationships and Related Transactions, and Director Independence

112125

Item 14.

Principal Accounting Fees and Services

112125

Part IV

113126

Item 1515.

Exhibits and Financial Statement Schedules

113126

Item 16.

ExhibitsForm 10-K Summary

113130

Item 16.

Form 10-K SummarySignatures

116

Signatures

117131

2

2


Table of Contents

SPECIAL NOTE REGARDING FORWARD-LOOKING STATEMENTS

This Annual Report on Form 10-K contains forward-looking statements within the meaning of Section 27A of the Securities Act of 1933, as amended, (the "Securities Act"), and Section 21E of the Securities Exchange Act of 1934, as amended, (the "Exchange Act"), about us and our industry that involve substantial risks and uncertainties. All statements other than statements of historical facts contained in this Annual Report on Form 10-K, including statements regarding general economic and market conditions, our future results of operations and financial condition, business strategy, and plans and objectives of management for future operations, including our Value Maximization Plan and the ongoing activities of and potential growth of our UACC and CarStory businesses, are forward-looking statements. In some cases, forward-looking statements may be identified by words such as "anticipate," "believe," “contemplate,”"contemplate," "continue," "could," "design," "estimate," "expect," "intend," "may," "plan," "potentially," "predict," "project," "should," “target,” "target," "will," “would,” "would," or the negative of these terms or other similar terms or expressions, although not all forward-looking statements contain these identifying words.

The forward-looking statements in this Annual Report on Form 10-K are only predictions. Forward-looking statements are based on our management’s beliefs and assumptions and on information currently available. These forward-looking statements are subject to a number of known and unknown risks, uncertainties, assumptions, and other important factors that may cause our actual results, performance or achievements to be materially different from any future results, performance or achievements expressed or implied by the forward-looking statements, including risks described in the sectionssection titled "Risk Factors," “Summary Risk Factors”Factors" and elsewhere in this Annual Report on Form 10-K.

Other sections of this Annual Report on Form 10-K include additional factors that could harm our business and financial performance. Moreover, we operate in a very competitive and rapidly changing environment. New risk factors emerge from time to time, and it is not possible for our management to predict all risk factors nor can we assess the impact of all factors on our business or the extent to which any factor, or combination of factors, may cause actual results to differ from those contained in, or implied by, any forward-looking statements.

You should not rely upon forward-looking statements as predictions of future events. We cannot assure you that the events and circumstances reflected in the forward-looking statements will be achieved or occur. Although we believe that the expectations reflected in the forward-looking statements are reasonable, we cannot guarantee future results, levels of activity, performance or achievements. These forward-looking statements speak only as of the date of this Annual Report on Form 10-K. Except as required by law, we undertake no obligation to update publicly any forward-looking statements for any reason after the date of this report or to conform these statements to actual results or to changes in our expectations. You should read this Annual Report on Form 10-K and the documents that we reference or incorporate by reference in this Annual Report on Form 10-K and have filed as exhibits to this report with the understanding that our actual future results, levels of activity, performance, and achievements may be materially different from what we expect. We qualify all of our forward-looking statements by these cautionary statements.

3


Table of Contents

SUMMARY RISK FACTORS

Our business is subject to numerous risks and uncertainties, including those described in Part I, Item 1A. “Risk Factors” in this Annual Report on Form 10-K. You should carefully consider these risks and uncertainties when investing in our common stock. The principal risks and uncertainties affecting our business include, but are not limited to, the following:

there are risks associated with the impactdiscontinuance of our ecommerce operations and wind-down of our used vehicle dealership business;

our Value Maximization Plan may not be successful, and may not lead to growth and enhanced profitability for our UACC or CarStory businesses;
we may not generate sufficient liquidity to operate our business;
general business and economic conditions and risks related to the COVID-19 pandemic;

larger automotive ecosystem, including consumer demand;

we have a history of losses and we may not achieve or maintain profitability in the future;

we may not be ableour level of indebtedness could have a material adverse effect on our ability to generate sufficient revenuecash to generate positivefulfill our obligations under such indebtedness, to react to changes in our business and to incur additional indebtedness to fund future needs;

our indebtedness and liabilities could limit the cash flow on a sustained basis, andavailable for our revenue growth rate may decline;

we have a limited operating history and are still building out our foundational systems;

our recent, rapid growth may not be indicative of our future growth;

if we continue to grow rapidly, we may not be able to manage our growth effectively;

our business is subject to certain risks related to the operation of Texas Direct Auto;

we rely on third-party vendors for key components of our business, which exposesoperations, expose us to increased risks;

we have entered into outsourcing arrangements with third parties related to our customer experience team, and any difficulties experienced in these arrangementsrisks that could result in an interruption of our ability to sell our vehicles and value-added products;

if the quality of our customer experience, our reputation or our brand were negatively affected, our business, sales and results of operations could be materially and adversely affected;

we face a variety of risks associated with the operation of our vehicle reconditioning centers by us and our third-party service providers, any of which could materially and adversely affect our business, financial condition and results of operations;

operations and impair our ability to satisfy our debt obligations;

we rely primarily on third-party carriers to transport our vehicle inventory throughout the United States. Thus, we are subject to business risks and costs associated with such carriers and with the transportation industry, many of which are out of our control;

we are expanding our proprietary logistics operations, including vehicle pick-ups and delivery from our last mile hubsand line haul transportation of vehicles between our last mile hubs, which will further expose us to increased risks related to ownership of infrastructure and the transportation of vehicles;

the current geographic concentration where we provide reconditioning services and store inventoryof UACC's borrowers or dealerships creates an exposure to local and regional downturns or severe weather or catastrophic occurrences that may materially and adversely affect our business, financial condition and results of operations;

our recent reverse stock split may not result in the market price per share of our common stock to either exceed or remain in excess of the $1.00 minimum bid price as required by Nasdaq (as defined herein), or have any of its other anticipated impacts, and we may be unable to satisfy other Nasdaq continued listing rules;
UACC may be unable to sell automotive finance receivables and generate gains on sales of those finance receivables, which could harm our business, results of operations, and financial condition;
UACC's securitizations may expose it to financing and other risks, and there can be no assurance that it will be able to access the securitization market in the future, which may require it to seek more costly financing;
UACC is currently experiencing increasing credit losses in interests it holds in automotive finance receivables and its credit scoring systems may not effectively forecast its automotive receivables loss rates. Higher than anticipated credit losses or prepayments or the inability to effectively forecast loss rates may negatively impact our operating results;
if UACC loses servicing rights on its automobile contracts, our results of operations would be negatively impacted;

4


Table of Contents

if we or our third-party providers sustain cyber-attacks or other privacy or data security incidents that result in security breaches, we could suffer a loss of sales and increased costs, exposure to significant liability, reputational harm and other negative consequences;
we operate in a highly regulated industry and

are subject to a wide range of federal, state and local laws and regulations and failure to comply with these laws and regulations could have a material adverse effect on our business, financial condition and results of operations;

we are, and may in the future be, subject to legal proceedings in the ordinary course of our business. If the outcomes of these proceedings are adverse to us, it could have a material adverse effect on our business, financial condition and results of operations; and
our actual operating results may differ significantly from our guidance.

45


Table of Contents

PART I

Item 1. Business

Overview

Vroom, Inc., which was incorporated under the laws of the State of Delaware in 2012, is a holding company that conducts its operations through its subsidiaries. Vroom, Inc. completed its initial public offering (“IPO”) in June 2020 and its common stock trades on The Nasdaq Global Select Market (“Nasdaq”) under the symbol VRM. Unless the context otherwise requires, references herein to “Vroom”, the "Company”, “we”, “us” or “our” refer to Vroom and its consolidated subsidiaries.

Our VisionCompany

Build

During the world’s premierfiscal year ended December 31, 2023, the period covered by this Annual Report on Form 10-K, Vroom operated an end-to-end ecommerce platform to research, discover, buy and sell used vehicles.

Our Company

On January 22, 2024, we announced that the Board of Directors (the “Board”) of Vroom had approved a value maximization plan, pursuant to which the Company has discontinued its ecommerce operations and is an innovative, end-to-end ecommerce platform that is transformingin the process of winding down its used vehicle industrydealership business in order to preserve liquidity and enable the Company to maximize stakeholder value through its remaining businesses (the “Value Maximization Plan”). Vroom owns United Auto Credit Corporation (“UACC”), a leading automotive finance company that offers vehicle financing to its customers through third party dealers under the UACC brand, and CarStory (“CarStory”), a leader in AI-powered analytics and digital services for automotive retail. The UACC and CarStory businesses will continue to serve their third-party customers, with their operations substantially unaffected by offering a better wayVroom’s ecommerce wind-down. The Company will seek to buygrow and a better wayenhance the profitability of the UACC and CarStory businesses going forward.

Prior to sell used vehicles. We are deeply committedthe adoption of the Value Maximization Plan, the Company’s platform combined automotive ecommerce, vehicle operations and data science and experimentation to creating an exceptional experience for our customers.

We are driving enduring change in the industry on a national scale. We take a vertically integrated, asset-light approach that is reinventingbring all phases of the vehiclecar buying and selling process from discovery to deliveryconsumers wherever they are, offering an extensive selection of used vehicles, transparent pricing, competitive financing, and everything in between. Ourat-home pick-up and delivery. Pursuant to the Value Maximization Plan, we are conducting an orderly wind-down of our ecommerce business.

Former Ecommerce Operations

Vroom’s ecommerce platform encompasses:

Ecommerce:    We offer an exceptional ecommerce experience for our customers. In contrast to legacy dealershipsoffered thousands of vehicles that had undergone detailed inspections, met proprietary reconditioning standards and were backed by a Vroom 90-day limited warranty. The platform provided comprehensive and transparent information on each of the peer-to-peer market,vehicles we provide consumerssold and provided buyers with a personalized, intuitive interface with specific sorting, searching and intuitive ecommerce interface to research and select from thousands of fully reconditioned vehicles. Ourfiltering functionality. The platform is accessible at any time on any device and provides transparent pricing,offered integrated, real-time financing solutions through strategic partnerships with automotive finance lenders and nationwide contact-free delivery right to a buyer’s driveway.through our subsidiary, UACC. For consumers looking to sell or trade in their vehicles, we provide attractive market-based pricing, real-time price quotes and convenient, at-homethe platform offered the ease of online submission of basic vehicle pick-up.

Vehicle Operations:    Our scalable andinformation to receive an on-demand appraisal. Vroom’s vehicle operations encompassed a vertically integrated operations underpin our business model. We strategically source inventory from auctions, consumers, rental car companies, original equipment manufacturers (“OEMs”)approach to sourcing, transporting, reconditioning, delivering, and dealers. We improve our ability to acquire high-demand vehicles through enhanced supply science across all our sourcing channels and we have expanded our national marketing efforts to drive consumer sourcing. In our reconditioning and logistics operations, we deploy an asset-light strategy that optimizes a combination of ownership and operation of assets by us with strategic third-party partnerships. This hybrid approach provides flexibility, agility and speed without taking on unnecessary risk and capital investment, and drives improved unit economics and operating leverage.

Data Science and Experimentation:    picking up vehicles. Data science and experimentation arewas at the core of everythingVrooms operations, and we do. We relyrelied on data science, machine learning and A/B and multivariate testing to continually drive optimization and operating leverage across our ecommerce and vehicle operations. We leverage data

Pursuant to increase the effectivenessValue Maximization Plan, we are conducting an orderly wind-down of our national brandecommerce business. We have suspended transactions through vroom.com, completed transactions for customers who had previously contracted with us to purchase or sell a vehicle, halted purchases of additional vehicles, sold substantially all of our used vehicle inventory through wholesale channels and performance marketing,paid off our vehicle floorplan financing facility dated November 4, 2022 ("2022 Vehicle Floorplan Facility") with Ally Bank and Ally Financial Inc. ("Ally"). We continue to take other actions to maximize the value of our remaining ecommerce assets, reduce our outstanding commitments and preserve our liquidity, and have been executing a reduction-in-force commensurate with our reduced operations. Although we expect the ecommerce wind down to be substantially complete by the end of the first quarter of 2024, we may incur additional wind-down costs through the end of 2024.

The UACC and CarStory businesses will continue to serve their third-party customers, with their operations substantially unaffected by Vroom’s ecommerce wind-down. The Company will seek to grow and enhance the customer experience, analyze market dynamics at scale, calibrateprofitability of the UACC and CarStory businesses going forward.

6


For more information about our former ecommerce operations, please refer to “Part I, Item 1. Business” in our Annual Report on Form 10-K for the year ended December 31, 2022, filed with the SEC on March 2, 2023.

UACC

UACC, which Vroom acquired in February 2022, is an indirect lender that offers vehicle pricingfinancing to consumers through third-party dealers under the UACC brand, focusing primarily on the non-prime market. Prior to Vroom’s wind-down of its ecommerce operations, UACC also offered vehicle financing to Vroom’s customers through its ecommerce platform. Effective March 1, 2024, Tom Shortt, the Company’s Chief Executive Officer, serves as UACC’s President and optimize our overall inventory sales velocity. OnChief Executive Officer and Jon Sandison, the operations side, data scienceCompany’s VP, Investor Relations and experimentation enable usFP&A, serves as UACC’s Chief Financial Officer.

UACC, which has been engaged in automotive finance since 1996, currently offers financing services to fine tune our supply, sourcinga nationwide network of thousands of manufacturer-franchised and logistics modelsindependent motor vehicle dealers in 49 states, and we seek to streamline our reconditioning processes.

expand that network over time. UACC enables these dealers to finance their customers' purchases of new and used automobiles, medium and light duty trucks and vans with competitive financing terms. The U.S. used automotive market iscredit programs offered by UACC are primarily designed to serve consumers who have limited access to traditional motor vehicle financing.

In addition to its financing expertise, the largestUACC platform brings with it extensive application processing, underwriting, and servicing capabilities. UACC’s underwriting process begins when UACC accepts a consumer product category and is highly fragmented with over 42,000 dealers and millions of peer-to-peer transactions. It also is ripe for disruption as an industry that is notorious for consumer dissatisfaction and hascredit application from one of its approved dealerships. Upon receipt, required information is entered into UACC's underwriting system for review and disposition by UACC's automated underwriting decisioning engine in accordance with UACC’s established underwriting guidelines. Because UACC serves consumers who are typically unable to meet the lowest levelscredit standards imposed by most traditional motor vehicle financing sources, it may charge higher interest rates than most traditional motor vehicle financing sources.

UACC verifies the accuracy of ecommerce penetration. Our platform, coupled with our national presenceinformation submitted through credit applications and brand, providesretail installment sales contracts. Verifications are assigned based on risk modeling and completed via a significant competitive advantage versus local dealershipscombination of first-party verifications and regional players that lack nationwide reachthird-party data sources. Verifications may include customer identity, customer interviews, proof of residence, verification of employment, proof of income, collateral/vehicle valuation, verification of insurance, and scalable technology, operationsother stipulated requirements resulting from risk factors inherent within each credit application.

UACC services the retail installment sales contracts it originates or purchases and logistics. The traditional auto dealers and peer-to-peer market do not and cannot offer consumers what we offer.

In December 2015, we acquired Houston-based Texas Direct Auto® (“TDA”), which included our proprietary vehicle reconditioning center (“Vroom VRC”), the TDA dealership and our Sell Us Your Car® centers. From the launch of our combined operations in January 2016, our business has grown significantly as we have scaled our operations, developed our ecommerce platform and leveraged the network effects inherent in our model. We intend towill continue to investservice the contracts it originated or purchased for customers of Vroom’s former ecommerce business. Servicing activities consist primarily of collecting and processing customer payments, responding to customer inquiries, initiating contact with customers who are delinquent in growthpayment of an installment, maintaining the security interests in the financed vehicles and, when necessary, arranging for the repossession and liquidation of the financed vehicles and pursuit of deficiencies. Because UACC focuses primarily on the non-prime market, it generally sustains a higher level of delinquencies and credit losses than that experienced by traditional motor vehicle financing sources. As of December 31, 2023, UACC serviced a portfolio of approximately 79,000 retail installment sales contracts with an aggregate principal outstanding balance of $1.1 billion.

To fund UACC’s automotive finance operations, eligible retail installment sales contracts that UACC originates or purchases are pledged to scale our company responsiblylenders under warehouse credit facilities and drive towards profitability.

On June 11, 2020, we completed our initial public offering (the “IPO”),typically sold to third-party investors via securitization transactions, with UACC continuing to service the finance receivables underlying those contracts. In such securitization transactions, UACC conveys a pool of automotive finance receivables to a special purpose vehicle, typically a trust that, in which we sold 24,437,500 sharesturn, issues certain securities. The securities issued by the special purpose vehicle are collateralized by the pool of common stock, which included 3,187,500 shares sold pursuantautomotive finance receivables. In exchange for the transfer of finance receivables to the exercise byspecial purpose vehicle, UACC receives the underwriters of an option to purchase additional shares, at a public offering price of $22.00 per share. We receivedcash proceeds of approximately $504.0 million, net of underwriting discounts and before deducting offering expenses of $7.5 million, from sales of our shares in the IPO.

On January 7, 2021, we completed the acquisitionsale of the securities.

CarStory

CarStory business,is a leader in AI-powered analytics and digital services for automotive retail, through the acquisition of 100% of Vast Holdings, Inc. Leveraging its machine learning, informed by more than 7 million listings per day and more than 18 million consumer sessions per month,retail. CarStory

5


Table of Contents

brings the industry’s most complete and accurate view of predictive market data to our national ecommerce and vehicle operations platform. As part of Vroom, we expect CarStory to continue to drive automotive retail innovation by aggregating, optimizing, and distributing current market data from thousands of automotive sources and offering offers its digital retailing services to dealers, top automotive financial services companies and household namesothers in the automotive industry, research and retailing.Pursuantwhich use CarStory’s solutions to the acquisition agreement, the aggregate purchase price was approximately $120.0 million, comprised of cash and shares of our common stock. The purchase price is subject to adjustment for certain working capital adjustments and post-closing indemnities.

Our Industry and Market Opportunity

The U.S. used automotive industry is a massive market that is ripe for disruption due to its fragmentation, high level of consumer dissatisfaction, changing consumer buying patterns and lack of ecommerce and technology penetration.

The U.S. Used Automotive Market is Massive and Highly Fragmented

In 2019, the U.S. used automotive market was the largest consumer product category, generating approximately $841 billion from sales. Based on data from Cox Automotive, there were an estimated 37.2 million used vehicle transactions in 2020, compared to approximately 40 million transactions in 2019. The U.S. used automotive market is also highly fragmented with approximately 42,000 automotive dealers and millions of peer-to-peer transactions across the country. Across all used vehicle sales in 2018, the largest U.S. used vehicle dealer had a market-share of only 1.9%, with the top 100 used vehicle dealers collectively representing only 9.3%.

Our Competitors Rely on an Outdated Business Model

The traditional dealership model involves limited selection, lack of transparency, high pressure sales tactics and inconvenient hours. These shortcomings have caused many consumers to transact onenhance their own, creating a large peer-to-peer market for used vehicles with its own set of challenges for both buyers and sellers, which can entail home visits by strangers, lack of secure payment methods or identity checks, difficulty researching available vehicles and lack of verified vehicle condition. Presented with these alternatives, the overwhelming majority of consumers are dissatisfied with the current automotive buying and selling experience. According to a Dealersocket Independent Dealership Action Report, 81% of respondents reported dissatisfaction in the car buying process.

Consumer Buying Patterns are Changing

The U.S. retail used automotive market is experiencing shifting consumer buying patterns from in-store towards online purchases. In particular, mobile commerce is poised for even faster growth than broader ecommerce. Consumers are increasingly focused on customized products and personalized services, while also expecting delivery of those products and services on-demand. Our model enables consumers to select not only the make and model of a vehicle, but also the model year, color, trim and options in many combinations, offering a customized shopping experience that is not possible at a traditional dealership or in the peer-to-peer market.  

In addition, used is the new “New” as consumers have become increasingly willing to buy used goods. In 2019, 64% of vehicle shoppers considered buying a used vehicle before making a purchase decision, up from 61% in 2018. At the same time, the average price differential between new and three-year-old used vehicles has grown in recent years and as a result, owning or leasing a new vehicle has become increasingly unaffordable. The purchase of a used vehicle enables a consumer to obtain a fully reconditioned vehicle at a higher standard of luxury or with highly sought-after features for the same dollar amount as a new, lesser-model vehicle.

The U.S. Used Automotive Market is Growing and Resilient and Ecommerce Penetration is Just Beginning

American consumers continue to exhibit entrenched vehicle ownership trends with approximately 284 million registered vehicles on the road in 2019, as compared to 279 million in 2018. Further, approximately 91.5% of families in the United States had at least one vehicle in 2018. Additionally, the retail used vehicle market generally has shown resilience through recessionary markets and other challenging economic cycles.

At the same time, the used automotive market has one of the lowest ecommerce penetration levels among consumer product categories. Industry reports estimate that ecommerce penetration will grow to as much as half of all used vehicle sales by 2030. In a 2019 Cox Automotive Data survey, 49% of consumers reported that they are willing to make a vehicle purchase online. Furthermore, while it is too soon to measure the long-term impact of the COVID-19 pandemic on consumer behavior, recent surveys indicate a growing willingness to buy a vehicle online and reduced use of

6


Table of Contents

public transportation and ride-sharing services, with respondents attributing recent vehicle purchases to the COVID-19 pandemic.

What We Do: Offer a Better Way

We are driving a better way to buy and a better way to sell used vehicles and bringing about enduring change in the industry. Our platform brings together all phases of the vehicle buying and selling process in a seamless, intuitive and convenient way. We create a climate of trust and provide an exceptional experience with complete transparency by eliminating friction and sales pressure. The traditional auto dealers and peer-to-peer market do not and cannot offer consumers what we offer. We offer a better way.

A Better Way to Buy

For consumers looking to buy a used vehicle, we offer a value proposition that differs markedly from traditional auto dealers and the peer-to-peer market. We are dedicated to helping customers evolve from wary shoppers to confident owners by streamlining the entire buying process, from discovery through financing to delivery, by offering the following:

Enormous Selection of Inventory.    We currently offer a growing inventory of thousands of low-mileage, high-demand vehicles. By making purchasing decisions based on data rather than intuition, we are able to offer a wide selection of vehicles that excite our customers. Consumers no longer have to settle for traditional dealerships with a limited number of vehicles on hand or scour local peer-to-peer listings and travel to a seller’s location.

Consistent High Quality.    All of our vehicles pass our detailed inspections and meet our proprietary Vroom Reconditioning Standards, which result in high-quality used vehicles backed by our free Vroom 90-Day Limited Warranty. We never lose sight of the fact that the used vehicles we sell are “new” to our customers.

Comprehensive and Transparent Vehicle Information.    We remove the asymmetry of information between dealers and consumers by providing comprehensive and transparent information on the vehicles we sell. We mitigate bait-and-switch risk through high-resolution photography and detailed product descriptions on our platform, which show our customers our vehicles from all angles, and provide third-party vehicle history reports on all of our vehicles.

Customized Vehicle Search and Discovery.    In addition to the size and diversity of our inventory selection, we provide buyers with a personalized, intuitive interface with detailed sorting, searching and filtering functionality. This enables our customers to research and discover the right car for their unique needs.

Competitive, Market-based Pricing.    We price our vehicles using data science and proprietary algorithms, ensuring that buyers receive attractive, market-based, no-haggle pricing. Our pricing strategy takes into account hundreds of variables when determining the accurate market price of a vehicle, including items beyond make, model and color that are unavailable to traditional dealerships, such as proprietary historical purchase and sales data.

Exceptional Customer Support.    Our professional customer experience team accompanies the buyer through every step of the process to make sure all questions are answered and any concerns are addressed. In all of our customer interactions, our goal is to ensure that every customer is a delighted customer.

On-Demand Shopping and Contact-Free, Convenient Delivery Experience.    We offer customers the ability to shop for their desired vehicle at any time, on any device and from any location. We also deliver our vehicles nationwide to a location of our customer’s choosing. Our on-demand shopping and contact-free, convenient delivery not only saves our customers a trip to the dealership, it provides the ultimate driveway experience.

Value-Added Products.    We provide seamlessly integrated, real-time, individualized financing solutions through our strategic partnerships with trusted lenders in automotive finance and give our customers access to competitive market rates. We also offer third-party protection products, including vehicle service contracts, GAP protection and tire and wheel coverage, all with transparent pricing.

Assurance.    Our Vroom 7-Day Return Program offers customers seven days or 250 miles to test drive their purchase with their family, versus a seven-minute test drive around the block at a dealership. This fundamentally transforms the customers’ test drive experience by providing the opportunity to see how their vehicle performs in day-to-day life.

7


Table of Contents

A Better Way to Sell

We are revolutionizing the process for consumers to sell or trade-in their vehicles. Consumers typically encounter either low-ball prices from their local dealer or face the prospect of advertising and selling the vehicle themselves in a time-consuming process through the peer-to-peer market. In contrast, we offer consumers the following:

Ease of Use.    We offer the ease of online submission of basic vehicle information in order to receive an appraisal. There is no trip to the dealership and no cost to submit a vehicle for sale, but rather a simple, hassle-free process enabling customers to sell us their vehicles.

On-Demand Appraisals.    Our Sell Us Your Car® proposition gives customers on-demand appraisals. We utilize our extensive data insights and experience across thousands of transactions to generate a quote that reflects a competitive market-based price, providing customers a fast and easy customer experience.

A Real-Time Price on Every Vehicle.    For every vehicle that customers submit for appraisal, we provide a real-time price.

No High-Pressure Tactics.    All price quotes are good for seven days or 250 miles. This process allows customers to shop, compare and analyze the sale of their vehicle from the convenience of their home to ensure they are getting the best value, eliminating pressure to take a deal on the spot.

Convenient, Contact-Free Vehicle Pick-ups.    Our customers enjoy the convenience of national, at-home contact-free vehicle pick-up free of charge within days of accepting our price.

No Hassle Pay-offs.    As an added convenience, we offer hassle-free customer payment and/or pay-off of any loans on the vehicle being sold, saving the customer time and paperwork.

Our Competitive Strengths

A Leading Ecommerce Platform for Used Vehicles

We offer an end-to-end, ecommerce platform for buying, selling, transporting, reconditioning, pricing, financing, registering and delivering vehicles nationwide. Our platform encompasses every element of the customer experience and ensures quality and consistency. Our customer-centric business model addresses the shortcomings of the traditional dealership model and peer-to-peer market. We combine high-quality and high-demand vehicles, asset-light, scalable reconditioning operations, a national logistics network and an exceptional ecommerce experience. In addition, our ability to control the entire customer value chain from demand generation to pick-up or delivery to the customer’s driveway creates operating leverage as we scale, further driving the network effects inherent in our business and contributing to our path to profitability.drive increased vehicle purchases.

Asset-Light, Scalable Operations

An asset-light strategy is fundamental to our business model. We seek to optimize the combination of ownership and operation of assets by us with strategic third-party partnerships. Our strategy provides flexibility, agility and speed as we scale our business, without taking on the unnecessary risk and capital investment inherent in direct investment.7

We employ this hybrid approach across our business and utilize strategic relationships with experienced and trusted providers to optimize reconditioning services, logistics, consumer financing and customer experience:


Reconditioning Facilities.    We combine the use of our Vroom VRC and third-party vehicle reconditioning centers (“third-party VRCs”) to best meet our reconditioning needs as we continue to expand our business. We leverage our partnerships with third parties within the reconditioning industry to recondition approximately two-thirds of the vehicles in our inventory to our Vroom Reconditioning Standards, which creates capacity to scale quickly and efficiently, while simultaneously reducing our capital commitments and expanding our geographic footprint.

Logistics.We primarily have used third-party carriers for our inbound and outbound logistics operations while also developing our proprietary logistics capabilities. This has allowed us to efficiently deliver vehicles to customers throughout the United States while focusing on expanding other critical components of our business, such as the volume and selection of vehicles in our inventory. We are optimizing this hybrid approach by expanding our proprietary logistics operations, including our owned vehicle fleet. We initially are focused on expanding our last-mile delivery operations, which we expect to both improve our operating leverage and enhance our customer experience, and also have begun to invest in long-haul vehicles for hub-to-hub shipments.

8


Table of Contents

VRC and Last Mile Hub Locations as of February 15, 2021

Customer Financing.    By partnering with many of the largest and most trusted banks in the world, we arrange reliable vehicle financing for our customers while avoiding the increased risk associated with underwriting consumer debt and carrying financing receivables on our books. This low-risk, high-margin financing structure enables us to provide customers with an essential aspect of the vehicle-buying process without adding additional debt commitments to our balance sheet and operational cost and complexities to our business.

Customer Experience Team.    In addition to our in-house customer support personnel, we have partnered with a leading customer experience management provider to operate our primary call center providing sales support to our customers. This strategy enables us to centralize our contact center services, ensure consistency in customer interactions, increase conversion and maximize operating efficiencies. We also recently engaged two additional customer service providers to expand our customer service operations as we scale our business.

Relentless Focus on Data Science

Data science is at the core of everything we do, and all aspects of our business are enhanced by data analytics. In an industry that historically used intuition and basic industry-wide data to drive purchasing and pricing decisions, we are moving from intuition to algorithm. We are expanding and continuously improving our access to data, using data science and machine learning across our business to maximize efficiency. Our proprietary technology, machine learning and data analytics models continuously optimize our marketing investments and conversion funnel, fine-tune our supply, sourcing and logistics models, calibrate our vehicle pricing, streamline our reconditioning processes and optimize our overall inventory sales velocity. Our recent acquisition of CarStory reinforces and enhances our data analytics, as CarStory continues to drive automotive retail innovation as a leader in artificial intelligence powered analytics and digital services in the automotive space.

Continuous Experimentation and Innovation at Scale

We strive to make key decisions based on data and testing. We continuously experiment using A/B and multivariate testing methodologies to drive conversion, innovation and improved unit economics. We test variables involved in sourcing, buying, reconditioning, and managing our inventory, and make decisions based on the data insights gained from such continuous experimentation. We integrate a full-stack statistics engine that is connected to our front-and back-end operations, enabling us to A/B test across all aspects of our business, including our marketing and conversion funnel, inventory procurement, management, refurbishment and sales processes.

9


Table of Contents

National Market Penetration and Brand

Our national presence provides a significant competitive advantage versus local dealerships and regional players that lack scalable technology, operations and logistics, and are unable to take advantage of the efficiencies and lower costs of national brand advertising. We are able to deliver a superior customer experience through the breadth and diversity of our national inventory of thousands of vehicles on our platform. Consumers no longer have to settle for whatever the local dealer has on the lot or scour local peer-to-peer listings and travel to a seller’s location for an unknown, time-consuming experience. Additionally, our customers enjoy the convenience of national, at-home delivery and pick-up of vehicles. We also leverage our national marketing campaigns to efficiently increase brand awareness and attract and convert new customers at lower cost. Our brand’s national reach provides a significant advantage over local dealers who typically rely on costly local or regional advertising campaigns.

Difficult to Replicate Business Model

Our platform overcomes the unique operational and technological challenges associated with buying and selling used vehicles in an ecommerce channel. Each vehicle that we offer through our platform has a unique vehicle identification number (“VIN”) and requires multiple touch points, including appraisal, inspection, reconditioning, photography, pricing and delivery. It requires significant funding sources to finance the acquisition of inventory, the ability to source and manage complex inventory, pricing and appraisal optimization skills, reconditioning expertise and sophisticated logistics capabilities. Given the significance of the purchase to a consumer, it also requires professional customer service and a brand that consumers can trust. These elements make our platform difficult to replicate. Our operational experience and the improvements we have made over time serve as important competitive moats. To succeed, any new entrant to ecommerce used auto sales would require data-driven automotive expertise, ecommerce capabilities and scalable operations integrated in a single platform.

Seasoned Leadership Team and an Exceptional Culture

Our success to date has been built on a culture that reflects our values: s.p.e.e.d – obsessive customer service, unwavering commitment to forward progress, appreciation for the diversity and skills of our employees,  engagement and celebration of all we do, and passionate development of our people, products, brand, and communities. We maintain a deep commitment to prudent corporate governance, transparency, accountability and collaboration. Our leadership team is comprised of seasoned executives who possess cross-vertical experience in the ecommerce, technology, supply chain, logistics, retail and automotive sectors, and have a demonstrated track record of scaling businesses and achieving profitable growth. Building on lessons learned and experience leading digital disruption in other fields, we believe we can bring the same level of innovation to the automotive retail industry. Our Growth Strategies and Path to Profitability

The core elements of our platform—ecommerce, vehicle operations and data science and experimentation—serve as the foundation of our growth strategies and path to profitability.

Drive Growth

Our business has grown significantly as we have scaled our operations. Our growth is not attributable to a single innovation or breakthrough, but to coalescence around multiple strategies that serve as points on our flywheel. The diversity and number of vehicles in our inventory drive demand and support expanded national marketing to enable us to acquire new customers more cost effectively, allowing us to invest back into our platform to continue to improve the customer experience, all of which drives increased conversion. This flywheel revolves, builds momentum and ultimately propels our business forward as we seek to drive disciplined growth and operating leverage.

Grow and Optimize Vehicle Inventory

As a data-driven business, we measure demand at the unique VIN level and use data analytics to inform our pricing and inventory selection. This enables us to curate an optimal inventory that matches market demand signals, driving higher conversion and sales. As we grow, we will continuously refine our inventory mix and expand our offerings across vehicle price points to serve a greater range of customers and increase our demand and conversion opportunities.

10


Table of Contents

Expand Marketing and Maximize ROI

The strength of our brand and effectiveness of our advertising programs is critical to our ability to attract new customers cost effectively. Leveraging our advanced data analytics, we will continue to invest in national marketing campaigns and targeted performance marketing to identify, attract and convert new customers at lower cost. This strategy provides a significant advantage over local dealers who typically rely on costly local or regional campaigns and enables us to maximize return on our marketing spend. We also run sophisticated digital marketing across various vehicle listing sites, constantly monitoring performance and maximizing ROI with limited reliance on any one platform.

Deliver Exceptional Customer Experience

We believe that customer experience is fundamental to our ability to convert consumers into customers, attract new customers and ensure repeat customers. We seek to provide customers with an intuitive, trustworthy and convenient buying and selling experience. We will continue to invest in our platform to further streamline the transaction process for our customers, as well as invest in expanded customer service operations to support our customers and enhance the customer experience. We will also continue to invest in the development of our mobile experiences to strengthen customer engagement. We believe these investments will lead to greater consumer traffic to our platform, higher levels of customer satisfaction and increased conversion and sales.

Increase Conversion

Sales conversion drives revenue growth and is an output of the acceleration of every point on the growth flywheel. We will continue to invest in our technology framework to optimize all aspects of our conversion funnel by constantly A/B testing our web and mobile applications to ensure we are displaying the features and formats that are most likely to resonate with our customers and lead to increased sales.

Drive Profitability

Our business model benefits from network effects and significant operating leverage as it scales. We believe that improvements in our unit economics are the foundation to driving profitability and will be achieved by scaling and optimizing the following elements of our platform:

Optimize Vehicle Acquisition and Pricing

We strategically source inventory from auctions, consumers, rental car companies, OEMs and dealers. We improve our ability to acquire the right vehicle at the right price through enhanced supply science across all our sourcing channels. We are expanding our national marketing efforts featuring our Sell Us Your Car® proposition to drive consumer sourcing. As a result, we expect to increase the number of vehicles we purchase from consumers, which typically generate higher gross profit per unit when sold compared to other inventory sources. In parallel, we continue to invest in data analytics and machine learning to optimize vehicle acquisition and pricing, increase sales velocity and drive profitability. We also are exploring third-party inventory strategies, which offers the possibility of expanding our sourcing channels while offering attractive revenue models in an asset light, debt free structure.

Increase Reconditioning Capacity

As we scale our business, we intend to continue to invest in increased reconditioning capacity. In addition to achieving cost savings and operational efficiencies, we will be focused on lowering our days to sale to improve working capital efficiency. We will continue to employ a hybrid approach that combines the use of our Vroom VRC with geographically dispersed third-party VRCs to best meet our reconditioning needs. To do so, we have expanded and are continuing to expand our third-party VRC locations to provide added scale with reduced lead-time and greater flexibility. As we search for additional VRC locations, leveraging our data analytics and deep industry experience, we take into account a combination of factors, including proximity to customers, transportation costs, access to inbound inventory and the ability to expand capacity at our third-party partners’ specific locations. All of these initiatives are designed to lower reconditioning costs and inbound shipping costs per unit, and thereby improve per unit economics while enhancing the customer experience.

11


Table of Contents

Expand Value-Added Products

Every vehicle sale creates potential for multiple additional revenue streams, including fees earned on third-party vehicle financing and fees from the sale of other value-added products. As we expand our business, we believe there are substantial opportunities to increase attachment rates on our existing value-added products through training, merchandising and technology enhancements. Strategic partnerships with lenders such as Chase and Santander provide enhanced revenue streams for us, as well as offering convenience, assurance and efficiency for our customers. Introducing new types of vehicle related finance and protection products can provide additional revenues going forward. Because we are paid fees on the value-added products we sell, our gross profit on such products is equal to the revenue we generate on such sales. In addition to expanding our offering of value-added products, in the longer term, we see a significant opportunity to provide our customers with complementary services such as entertainment and location-based services. The addition of new value-added products and services will not only increase our product offerings and profitability but will also strengthen and extend our interactions with customers.

Strategically Develop Logistics Network

For our logistics operations, we primarily have used national third-party carriers, which has allowed us to efficiently deliver vehicles to customers throughout the United States while focusing on expanding other critical components of our business, such as the volume and selection of vehicles in our inventory. We optimized our third-party logistics network nationally through the development of strategic carrier arrangements with national haulers and consolidated our carrier base into dedicated operating regions. This strategy enhanced the flexibility, agility and speed of our growth while reducing the need for additional capital commitments as we scaled our business. In part as a result of a reduced supply of carriers, increased shipping prices and deteriorating service levels at the outset of the COVID-19 pandemic, and to further enhance the quality of our logistics operations and our customer experience, we have been accelerating our strategy to optimize our hybrid approach by expanding our proprietary logistics network and improving our operating leverage. Initially, we have been prioritizing investment in our last-mile delivery operations, where we can have the greatest impact on the customer experience, and also have begun to invest in long-haul vehicles for hub-to-hub shipments. Consistent with our hybrid approach, as we continue to scale our business, we will strategically combine the operation of our expanded proprietary fleet with the use of third-party carriers, which will enable us to both accommodate our rapid growth and provide the highest level of customer service.

Capitalize on New Product and Market Opportunities

Expand our Platform to Additional Products and Markets

We have designed and built an innovative platform with countless potential applications. We have the potential to leverage our platform for expansion into adjacent areas of technology-enabled commerce and fully deploy our technology, data analytics and business experience to take advantage of the opportunities this creates. We will have the flexibility to strategically pursue opportunities across markets, potentially including additional transportation and vehicle markets, global geographic markets and B-to-B business models.

Continue to Innovate on New Capabilities

Technological developments have had a significant impact on the automobile industry and are expected to continue to have an impact for the foreseeable future. Electrification and shared mobility in particular are expected to have a transformative impact on road transportation. We continuously monitor developments in autonomy, ride-hailing and ride-sharing as it relates to the overall automotive market, and we are well-positioned to expand our capabilities to participate actively as the industry evolves. As the automotive landscape develops, we will seek to capitalize on new opportunities.

Our Marketing

We operate a multi-channel marketing strategy that includes both national brand and digital performance marketing. We leverage various digital performance channels, including automotive aggregator sites, to generate demand for Vroom inventory by VIN. In these channels, we manage the national distribution footprint of each VIN by continually optimizing its forward distribution to maximize consumer demand and achieve planned conversion, sales velocity and profitability.

Our national brand campaign through TV and online media, which commenced in the first quarter of 2019, has shown strong momentum in its first two years. Because brand leads convert at a higher rate than all other marketing channels, we believe that continued growth of our national brand marketing campaign and an increasing mix of brand leads will improve our marketing efficiency. We also have expanded our national marketing efforts to feature our Sell Us Your Car® proposition to drive consumer sourcing of vehicles, which typically generate higher gross profit per unit when sold compared to other inventory sources.

12


Table of Contents

We analyze visitor traffic and customer interaction with our platform to identify and correlate visitor behavior with sales conversion. Our analytics enable us to measure and monitor the ROI generated by our marketing placements, which we then use to optimize placement and spend across marketing channels to balance sales velocity and profitability.

Our Technology

Technology and data science are the foundation of all of our operations and strategic decision making.

Our team of data scientists and engineers continuously extract and analyze additional information, processing millions of data points daily to create models that inform purchasing, pricing and market decisions, allowing us to understand price elasticity, and also allowing us to price a significant majority of the vehicles we acquire from consumers in just a few seconds. We adjust price as a function of overall market value trend, taking into account competitor inventory, market price fluctuations, and relative inventory advantages.

Core to our underlying technology is the real-time collection of customer and inventory data. We analyze and act on the data in real time. As our systems collect new or updated incoming data signals, those signals are immediately available to downstream systems to trigger parallel event processes. Our technology supports multi-channel engagement with our customers, delivering consistent messaging via the web, in native apps and via email. In cases where customers need attention outside of our ecommerce experience, we provide customer assistance via phone.

In addition, CarStory drives automotive retail innovation by aggregating, optimizing and distributing current market data from thousands of automotive sources. CarStory tracks over fivethree and a half million unique VINsvehicle identification numbers (“VINs”) listed for sale every day. This data is aggregated with nationwide demand insights from dealersmillions of consumer sessions and enterprise brandsVIN data from CarStory's proprietary VIN database to generate accurate price and sales predictions. These predictions. CarStory helps dealers optimize their pricing by leveraging data science models for retail pricing that provide predictive pricing for marketing, buying, selling and VIN-level features.

In addition to its data analytics and digital services,CarStory powers white labeled storefronts for automotive marketplaces and finance companies. In developing its white label capabilities, CarStory also has developed a variety of consumer-focused functions designed to enhance the customer experience and drive conversion. CarStory's data and data science assets create significant opportunity for automotive AI product development, with over 200 million VINs, over three billion photos and price and price elasticity models.

Marketing

As an indirect lender, UACC's marketing efforts are further enhancedfocused on selling to dealerships, rather than consumers. UACC utilizes a combination of internal and field sales managers to both solicit the enrollment of new dealerships and to market its financing programs and products to existing dealerships. UACC's sales managers serve as the primary liaison with its dealerships. Sales managers focus their efforts on educating dealership personnel on UACC's lending programs and how to combine specific consumer characteristics, collateral and deal structures to increase the probability of approval under UACC's underwriting guidelines. Prior to establishing a business relationship with an automobile dealership, UACC completes a review of the dealership's operations, inventory, facilities, and owner’s credit history.

CarStory has not actively engaged in marketing activities since being acquired by CarStory's proprietary enhanced VIN database, ensuring a comprehensiveVroom in 2021. As part of the wind-down of its ecommerce business, Vroom has ended all sales and accurate view of a vehicle.

Competition

The U.S.marketing activities for its used vehicle marketoperations.

Competition

The automotive financing industry is large and highly fragmented,competitive. UACC competes with over 42,000 traditional franchiseda number of national, regional and independent dealerships nationwide as well aslocal finance companies, banks, credit unions, fintech companies, and captive finance companies. Many of these companies are larger and have greater financial resources than UACC, including greater access to capital markets for debt instruments or access to lower cost deposit bases. These funding sources may be unavailable to UACC. Many of these companies also have long-standing relationships with automobile dealers and may provide other financing to dealers, including floor plan financing for the peer-to-peer market. dealers' purchases of automobiles from manufacturers and auctions, which we do not offer.

Credit applications may be sent simultaneously to multiple lenders for consideration. As a result, UACC competes with other financing sources on the basis of the approved structure, minimum customer requirements and stipulations, types of vehicles financed, dealer fees, dealer incentives, levels of service, and distribution (accessibility to UACC’s program via credit application technology platforms). We believe that we can obtain from our dealership network sufficient automobile contracts for purchase at attractive prices by consistently applying reasonable underwriting criteria and making timely purchases of qualifying automobile contracts, however, there can be no assurance that we will be able to do so.

The playersautomotive data and service business is large and very competitive. CarStory competes with a number of companies in the used vehicle market can be classified into the following segments:

traditional newautomotive industry, including valuation services, VIN data providers, website marketplaces, inventory aggregators, and used car dealerships;

large, national car dealers, such as CarMaxretail e-commerce platforms. Some of these companies are significantly larger with well-established sales and AutoNation, which are expanding into online sales, including “omni-channel” offerings;

used car dealers or marketplaces that currently have existing ecommerce businesses or online platforms, such as Carvana;

the peer-to-peer market, utilizing sites such as Facebook, Craigslist.com, eBay Motors and Nextdoor.com; and

sales by rental car companies directly to consumers of used vehicles which were previously utilized in rental fleets, such as Enterprise Car Sales.

Internet and online automotive sites could change their models to sell used vehicles andmarketing teams. We compete with us, such as Google, Amazon, AutoTrader.com, Edmunds.com, KBB.com, Autobytel.com, TrueCar.com, CarGurusother companies to attract customers to our marketplace and Cars.com. In addition, automobile manufacturers such as General Motors, Ford and Volkswagen could change their sales modelsdealers to better compete with our model through technology and infrastructure investments. While such enterprises may change their business models and endeavor to compete with us, the sale of used vehicles through ecommerce presents unique operational and technical challenges. See “Business—Our Competitive Strengths—Difficult to Replicate Business Model.”digital solutions.

We view our main competitors to be the traditional auto dealers, who make up the significant portion of U.S. used vehicle sales and are still operating under an outdated business model that is ripe for disruption.

Description of Human Capital Management

Vroom believes in and adheres to a core set of values and Rules of the Road that guide our actions at work. Those values are summed up as s.p.e.e.d: obsessive customer service, unwavering commitment to forward progress, an appreciation for the diversity and skills of our employees, engagement and celebration of all we do, and passionate development of our people, products, brand, and communities. Our core values are embedded in our culture through our onboarding, training, operations and communication. All of our employees receive Driver’s Manuals that outline and define

13


Table of Contents

these values and all new hires are invited to listen to our Chief Executive Officer and Chief People and Culture Officer discuss the Company’s Mission, Vision, and Values, and those values inform everything we do.  

At the center of Vroom’s values are its employees, without whom we could not achieve our vision of building the world’s premier platform to research, discover, buy and sell vehicles.  

As of December 31, 
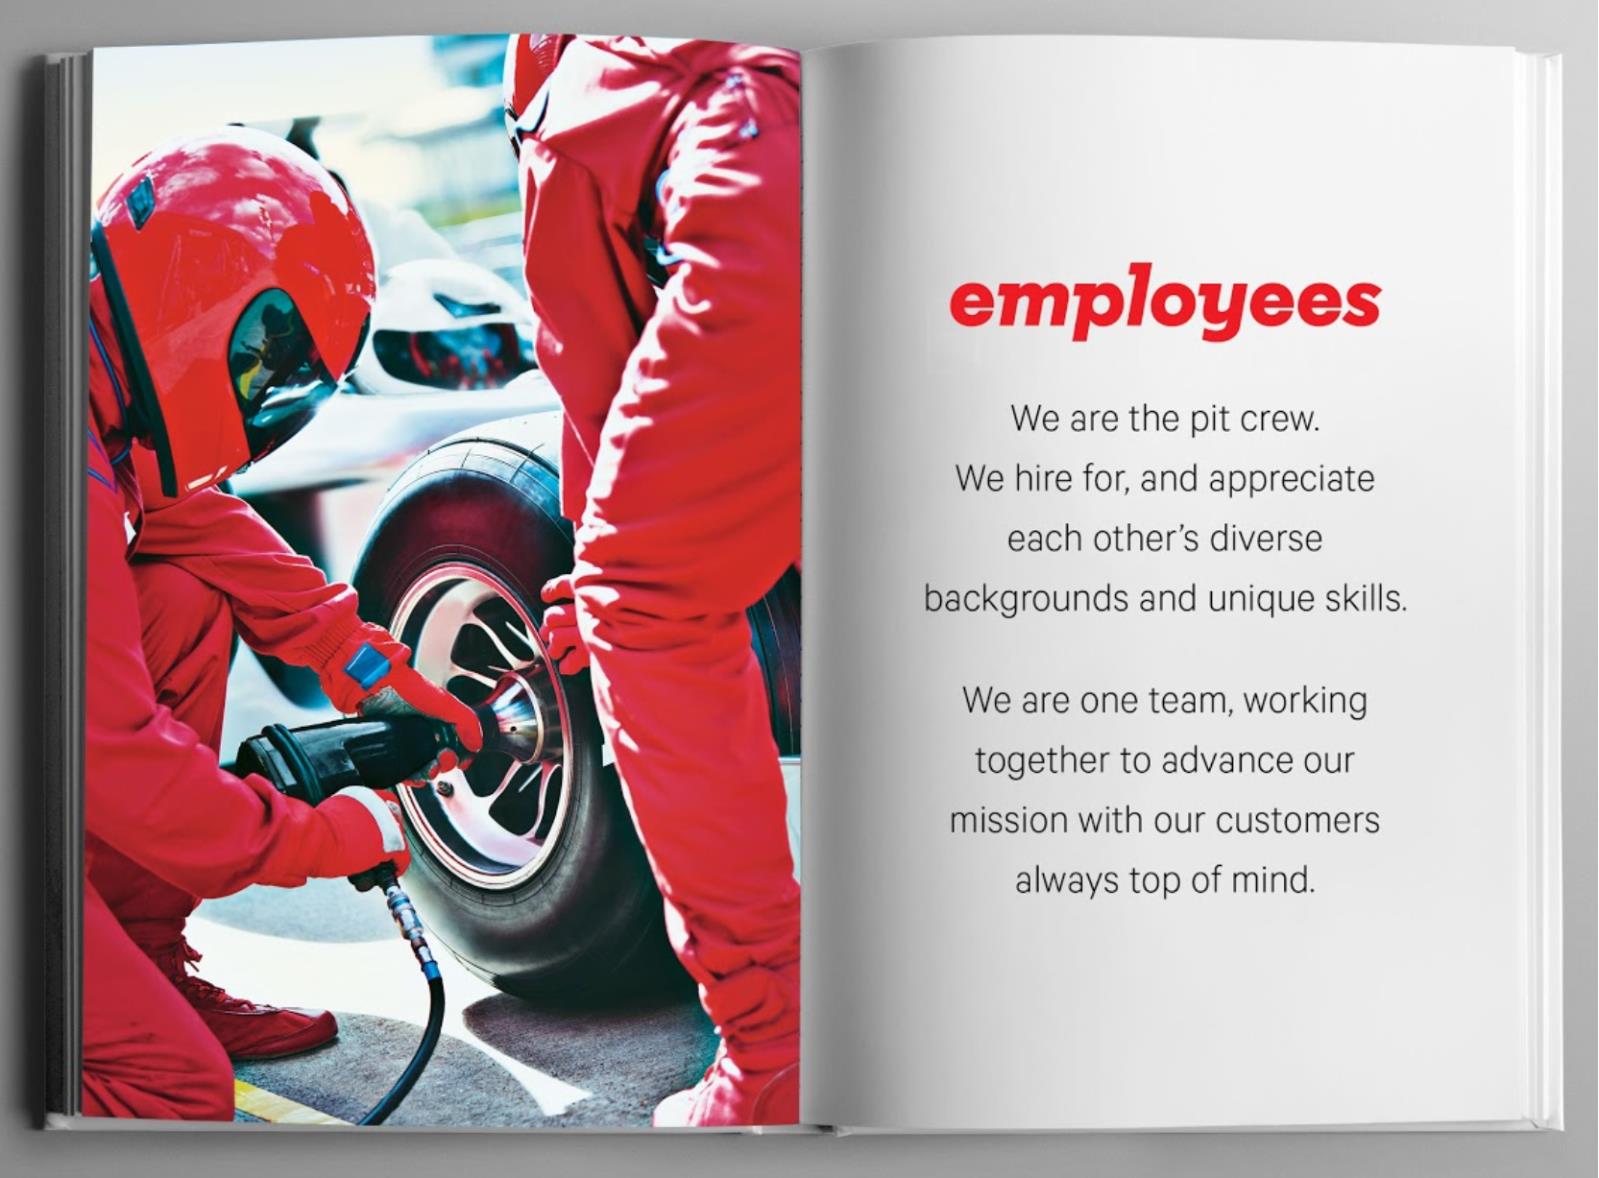
2020, Vroom2023, the Company employed a total of 9441,682 employees, of which 1,675 were full-time employees. The total consisted of 25.5% reconditioning1,468 employees across 34 states in the United States and logistics staff, 48.6% corporate and transactional staff, 13% technical and engineering staff, and 12.8% retail staff.214 employees based in Belgrade, Serbia. UACC employed 683 workers, of which 677 were full-time. CarStory employed 219 workers, 213 of which are based in Serbia, with the balance in the US. The balance were employed as part of the Vroom ecommerce

8


Table of Contents

business. None of our employees is represented by a labor union. We consider our relationships with our employees to be good and have not experienced any interruptions of operations due to labor disagreements.

Engaging Talent

EachIn January and April 2023, as part of our continued focus on reducing variable and fixed costs, we conducted reductions in force across the Vroom business. During the year, we conduct an annual engagement surveyalso undertook several smaller reductions to further streamline the business. In January 2024, in connection with the wind-down of our ecommerce operations, we began a significant reduction in force across the entire Vroom business. We anticipate that approximately 800 employees both to measure our employees’ collective sentiment, and also to focus our efforts on maintaining a workplace where employees can bring their whole selves to work and do their best work every day. We used our 2019 annual engagement survey to identify four key areas for improvement and, through a series of targeted initiatives, we saw improvement across each topic in our 2020 annual engagement survey results:

Focus Area

Year over Year change

2019 to 2020

Improving employee’s perception that the organization was listening to and acting upon employee feedback

+6%

Improving individual employee recognition

+25%

More effectively managing change in the organization

+5%

Increasing perceptions of fair compensation

+4%

14


Table of Contents

Measuring Talent

We use a variety of human capital measures in managing our business, including diversity, attrition, hiring, promotions, and leadership. We also use certain talent management metrics, including retention rates of top talent and hiring metrics.

Diversity, Equity, and Inclusion

Diversity, equity and inclusion (“DEI”) are cornerstoneswill be impacted upon substantial completion of the Vroom values, emphasized most stronglywind-down, resulting in the s.p.e.e.d. valuesa reduction of Employees and Engagement. During 2020, we made progress on a number of our diversity initiatives:

Representation

We added two female members to our board of directors, bringing representation of our non-employee directors to 33% female as of December 31, 2020.  

The percentage of women in our workforce increased from 33.0% as of December 31, 2019 to 40.6% as of December 31, 2020.

Efforts to improve race and ethnicity-related voluntary reporting by our employees greatly improved our confidence in the data reported in 2020 relative to 2019. In 2019, 32.6% of our employees did not report a race or ethnicity. That number dropped to 8.2% by the end of 2020.  

Based on the reported race and ethnicity-related data, non-white representation among our employees stayed nearly flat at 68.5% as of December 31, 2019 and 67.9% as of December 31, 2020.  


Employee Race and Ethnicity


2019

2020

Change

Asian

7.88%

8.07%

0.20%

Black / African American

20.33%

25.26%

4.93%

Hispanic / Latino

35.71%

29.53%

(6.19)%

Native Hawaiian / Pacific Islander

0.55%

0.35%

(0.20)%

Two or More Races

2.20%

2.54%

0.34%

White

31.50%

32.06%

0.56%

I do not wish to answer

1.83%

2.19%

0.36%

Total

100.00%

100.00%


Inclusion

During the summer of 2020, in the midst of social unrest, we held a number of listening sessions to discuss the experiences of our employees — with particular emphasis on our African American colleagues. These sessions were well attended and well received by our employees.  

We also established a cross functional Diversity, Equity and Inclusion Committee tasked with working with our Senior Leadership Team on efforts aimed at improving DEI experiences and outcomes for our employees. The Diversity, Equity and Inclusion Committee has begun making recommendations for Company-wide training, communication, and other efforts.

In addition to our required anti-harassment training, we have introduced mandatory implicit bias training to heighten awareness across the organization.  

Workplace Health & Safety

Vroom takes a comprehensive approach to workplace health and safety. During 2020, efforts were largely focused on addressing the spread of COVID-19, especially given the in-person natureapproximately 93% of the work of many of Vroom’s employees including our reconditioning, titling, and document support staff.not engaged in UACC’s or CarStory’s ongoing operations.

In response to the COVID-19 disruptions, we implemented a number of measures to protect the health and safety of our workforce. These measures include restrictions on non-essential business travel, the institution of work-from-home policies wherever feasible and the implementation of strategies for workplace safety at our facilities. We are following and require all of our on-site vendors to follow the guidance from public health officials and government agencies, including implementation of enhanced cleaning measures, social distancing guidelines, wearing of masks, eliminating non-essential

15


Table of Contents

vendor / guest visitation, and requiring temperature checks and health attestations prior to entering buildings. Seating, signage, and cleaning materials have been added to ensure adherence to best practices for employee health and safety during this pandemic. In addition, we have leased additional office space to ensure sufficient in-office capacity while providing adequate spacing of our employees. Where feasible, we operate on a rotating team schedule to reduce exposure and also require any diagnosed or exposed employees to self-isolate for up to two weeks. In response to the COVID-19 pandemic, a cross functional working group was formed to focus on COVID-related matters of space and remote work and continues to meet bi-weekly to ensure up-to-date safety protocols and efficient responses to new information.

Compensation & Rewards

COVID-19 Related Actions

Reduced unit volume in the early weeks of the COVID-19 pandemic led to a furlough of approximately one-third of our staff as well as salary reductions for our remaining staff. Employees were given two weeks’ notice prior to any furlough action and remained on Company-provided benefits for the duration of the furlough. Approximately 77% of those employees furloughed were returned to work within 60 days and only 13% were ultimately terminated. Each of these terminated employees received standard separation benefits, including outplacement and separation pay.

In May 2020, salary reductions were instituted relative to level and overall compensation in the organization. The option to work overtime was eliminated for hourly employees and salaried employees experienced reductions at the most junior level of 5%, up to 25% for our Chief Executive Officer. Salaries were returned to pre-COVID levels by July of 2020, with our Chief Executive Officer being the last employee to have his full salary restored.  

General Compensation

Our compensation philosophy is driven by the desire to attract and retain top talent, while ensuring that compensation aligns with our corporate and financial objectives and the long-term interests of our stockholders. We have developed a pay structure that offers a competitive total compensation package including base salary, bonus, equity, and other position-specific incentives.  Annual bonus plans are tied to both company and individual performance factors.  

Our comprehensive benefit plans offer medical, dental and vision insurance and long and short-term disability, as well as flexible spending accounts and other voluntary coverage to all of our employees. We routinely benchmark our salaries and benefits against market peers to ensure our total rewards package remains competitive.  

Communication & Talent Development

A key part of Vroom’s operating philosophy is ensuring that employees are learning and developing as well as providing input into Vroom’s daily operations. In addition to a standard engagement survey and formal feedback tool, Vroom has implemented a number of systems designed to improve feedback to and from employees. They are described below:

System / Tool

Description / Purpose

Pit Crew Meetings

Frequent small group meetings between employees and a senior leader in the organization to share business updates and surface ideas for improvements in the business and employee experience.

Town Hall Style Meetings with Chief Executive Officer

Quarterly town-hall style meetings where business results are shared and employees submit questions to the Chief Executive Officer and Senior Leadership Team regarding a wide range of topics.

Check Engine System

An anonymous forum for uncovering problems or challenges in the business that are then addressed by appropriate parties.  

Pit Crew Feedback

An always-on, multi-rater feedback tool that allows managers to collect feedback from their employee’s key stakeholders at the times when it’s most pertinent.

16


Table of Contents

PaceSetter Awards

Quarterly awards that highlight employees in the business who exemplify Vroom’s values. These awards show appreciation while also setting an example for employee interactions.  

Mission, Vision, Values

The Chief Executive Officer and Chief People and Culture Officer meet with all new hires in interactive sessions to discuss Vroom’s Mission, Vision, and Values in detail.

The Company offers a number of developmental programs in addition to standard training on compliance-oriented topics. Offerings include content on managing bias, providing effective feedback, utilizing compensation tools, and thoughtful self-evaluation. Vroom invested in development resources during 2020, adding both a Senior Director of Learning and Development focused on broad initiatives, as well as a Director of Training & Quality Assurance focused on operational skills and measurement. We look forward to providing even more growth opportunities for the team in 2021.

Intellectual Property

The protection of our technology and intellectual property is an important aspect of our business. We seek to protect our intellectual property rights, including our intellectual property rights in our technology, through trademark, trade secret and copyright law, as well as confidentiality agreements, procedures and other contractual commitments and other legal rights. We generally enter into confidentiality agreements and invention assignment agreements with our employees and consultants to control access to, and clarify ownership of, our proprietary rights and information.

As of the date of this Annual Report on Form 10-K, we do not own any U.S.CarStory has 30 issued or foreign patents and do not have any U.S. or foreign patent applications pending, except for certainallowed U.S. patents with expirations through 2039 and seven pending U.S. patent applications, we acquired as part of the CarStory acquisition.and Vroom has one pending nonprovisional patent. We own 1225 registrations for our trademarks in the United States owned by Vroom, Vast (CarStory's parent entity) and UACC, collectively, with renewal deadlines through 2033, including Vroom®Vroom®, VroomV & Design®, Get In®In®, TDA®, DealerLane®, Texas Direct®, Flag and Highway Logo and Sell Us Your Car®Car®, VroomProtect®, Texas Direct®, CarStory®, Vast® and United Auto Credit®; and we hold 54 registered trademarks in Australia, Brazil, China, Colombia, Chile, Argentina, the European Union, the United Kingdom, Japan, Singapore, Mexico, Canada, South Korea and Peru, including for the Vroom®Vroom® trademark with renewal deadlines through 2033 and we also have a number of pending trademark applications to registerin the Vroom® trademark in otherU.S. and certain foreign jurisdictions. We continually review our branding strategies and technology development efforts to assess the existence, registrability, and patentability of new intellectual property. We will work to preserve the value of our Vroom® intellectual property rights where appropriate following the wind-down of our ecommerce operations.

As part of the CarStory acquisition, we acquired 19 U.S. patents and ten pending U.S. patent applications. In addition, we acquired ten trademark registrations and two applications for trademark registration in the United States, Canada, and Europe, including for VAST® and CARSTORY®.

Intellectual property laws, procedures and restrictions provide only limited protection and any of our intellectual property rights may be challenged, invalidated, circumvented, infringed or misappropriated. Further, the laws of certain countries do not protect proprietary rights to the same extent as the laws of the United States, and, therefore, in certain jurisdictions, we may be unable to protect our proprietary technology, brands, or other intellectual property.

Government Regulation

Our business isbusinesses are and will continue to be subject to extensive U.S. federal, state and local laws and regulations.

As an entity operating in the financial services sector, UACC is required to comply with a wide variety of laws and regulations. Compliance with these laws and regulations requires that UACC maintain forms, processes, procedures, controls and the infrastructure to support these requirements, and these laws and regulations often create operational constraints both on UACC's ability to implement servicing procedures and on pricing. UACC is subject to laws designed for the protection of consumers, including the Truth in Lending Act, the Equal Credit Opportunity Act, the Fair Credit Reporting Act, prohibitions against unfair, deceptive, and abusive acts and practices, and various other state and federal laws and regulations. These laws mandate certain disclosures with respect to finance charges on automobile contracts and impose certain other restrictions. Most states regulate retail installment sales, including setting a maximum interest rate, caps on certain fees, or maximum amounts financed. Certain states require UACC to have a sales finance license, consumer credit license, or similar applicable license. UACC has obtained licenses in all states where licensing is required.

UACC's financing operations are also subject to U.S. federal, state, and local laws and regulations regarding contract origination, acquiring motor vehicle installment sales contracts from retail sellers, furnishing data to credit reporting agencies, servicing, debt collection practices, and securitization transactions. In addition, UACC is subject to supervision and examination by the Consumer Financial Protection Bureau (“CFPB”), a federal agency created by the Dodd-Frank Wall Street Reform and Consumer Protection Act (the “Dodd-Frank Act”). The CFPB has rulemaking, supervisory and enforcement authority over UACC and is specifically authorized, among other things, to take actions to prevent companies from engaging in “unfair, deceptive or abusive” acts or practices in connection with consumer financial

9


Table of Contents

products and services, and to issue rules requiring enhanced disclosures for consumer financial products or services. The CFPB also has authority to interpret, enforce and issue regulations implementing enumerated consumer laws, including certain laws that apply to UACC. The Dodd-Frank Act and regulations promulgated thereunder may affect UACC's cost of doing business, may limit or expand its permissible activities, may affect the competitive balance within UACC's industry and market areas, and could have a material adverse effect on UACC.

In addition to the CFPB, other state and federal agencies have the ability to regulate aspects of our business. For example, the Dodd-Frank Act provides a mechanism for state Attorneys General to investigate UACC. In addition, the Federal Trade Commission has jurisdiction to investigate aspects of our business. From time to time, we are subject to routine investigations by state and federal regulators. We expect that regulatory investigations by both state and federal agencies will continue, and there can be no assurance that the results of such investigations will not have a material adverse effect on UACC.

The advertising, sale, purchase, financing and transportation of used vehicles are regulated by every state in which we operatepreviously operated our ecommerce business, and by the U.S. federal government. The titling and registration of vehicles and the sale of value-added products also are regulated by state laws, and such laws can vary significantly from state to state. In addition, we areour ecommerce business was subject to regulations and laws specifically governing the internet and ecommerce and the collection, storage, use and useother processing of personal information and other customer data. We are alsoFurther, our ecommerce business was subject to federalcurrent and state consumer protectionfuture laws regarding the use of, training, testing, oversight and accuracy of AI. Additionally, we are subject to industry-specific regulations and intellectual property laws regarding proprietary data, including the Equal Credit Opportunities Act and prohibitions again unfair or deceptive acts or practices.motor vehicle records. The federal governmental agencies that regulatehave regulated our ecommerce business and have the authority to enforce such regulations and laws against us include agencies such as the U.S. Federal Trade Commission, the U.S. Department of Transportation, the U.S. Occupational Health and Safety Administration, the U.S. Department of Justice and the U.S. Federal Communications Commission. Additionally, we areour ecommerce business was subject to regulation by individual state dealer licensing authorities, state consumer protection agencies and state financial regulatory agencies. We also are subjectFrom time to audit by such state regulatory authorities.

17


Table of Contents

State dealer licensing authorities regulate the purchase and sale of used vehicles by dealers within their respective states. The applicability of these regulatory and legal compliance obligations totime, our ecommerce business is dependent on evolving interpretations of these laws and regulations and how our operations are, or are not,was subject to them. We are licensed as a dealeraudits, requests for information, investigations and other inquiries from our regulators related to customer complaints. As we encountered operational challenges in keeping up with our rapid growth from 2020 through the Statesfirst quarter of Texas and Florida and all of our vehicle transactions are conducted under our Texas and Florida licenses. We believe that our activities2022, we experienced an increase in other states are not subjectcustomer complaints, leading to such states’ vehicle dealer licensing laws; however, regulatorsan increase in such states could seek to require us to maintain a used vehicle dealer license in order to engage in activities in that state. In addition, we intend to obtain a used vehicle dealer license in certain additional states to maximize operational flexibility and efficiency, enhance our customer experience and invest in relationships with state regulators.

Most states regulate retail installment sales, including setting a maximum interest rate, caps on certain fees or maximum amounts financed. In addition, certain states require that retail installment sellers file a notice or registration document or have a sales finance license or an installment sellers license in order to solicit or originate installment sales in that state.regulatory inquiries. We have obtained aendeavored to promptly respond to any such inquiries and cooperate with our regulators. We previously held automotive dealer licenses and motor vehicle sales finance license in Texas in connection with our Texas dealer license, and we have obtained alicenses or retail installment seller license in Florida in connection with our Florida dealer license. The financial regulatory agency in Pennsylvania determined that we need to obtain an installment seller license in order to enter into retail installment sales with residents of Pennsylvania. As a result, we are not currently offering third-party financing to our customers in Pennsylvania, who must obtain independent financing to the extent needed to fund any vehicle purchases on our platform. We recently obtained a Pennsylvania installment seller license and expect to resume offering financing to Pennsylvania customers in the future. In addition, we may elect to obtain sales finance or installment seller licenses in certain other states in which our customers reside in order to maximize operational flexibilitymultiple states. As a result of the wind-down of the ecommerce business and efficiency, enhance our customer experience and invest in relationships with state regulators.

In addition, the ongoing expansioncessation of our proprietary logisticsused automotive dealer operations, exposes us to greater regulation from the U.S. Department of Transportation and state transportation regulators.

We previously had not been operatingwe are in the Commonwealthprocess of Massachusetts due to its prohibition on the use of temporary tags, which we typically provide to our customers upon delivery. We recently implemented a solution that enables us to sell vehicles in Massachusetts and provide customers with vehicle registration and permanent tags upon delivery.terminating such licenses.

In addition to thesethe laws and regulations that apply specifically to the sale and financing of used vehicles,described above, our facilities and business operations are subject to laws and regulations relating to environmental protection, occupational health and safety, and other broadly applicable business regulations. We also are subject to laws and regulations involving taxes, tariffs, privacy and data security, anti-spam, pricing, content protection, electronic contracts and communications, mobile communications, consumer protection, information-reporting requirements, unencumbered internet access to our platform, the design and operation of websites and internet neutrality. We also are subject to laws and regulations affecting public companies, including securities laws and Nasdaq listing rules.

Additionally, we are subject to Federal, State and local laws and regulations, and other government actions, related to the COVID-19 pandemic.

For a discussion of the various risks we face from regulation and compliance matters, see “Risk Factors—Risks Related to LawsCybersecurity and Regulations—Privacy—Failure to comply with federal, state and local laws and regulations relating to privacy, data protection and consumer protection, or the expansion of current or the enactment of new laws or regulations relating to privacy, data protection and consumer protection, as well as our actual or perceived failure to protect such information could harm our reputation and could adversely affect our business, financial condition and results of operations”; “—“Risk Factors—Risks Related to Cybersecurity and Privacy—Our CarStory business relies on artificial intelligence to facilitate the automotive retail experience. If our use of artificial intelligence results in inaccurate data, regulatory scrutiny, privacy concerns or is otherwise unsuccessful, it could adversely affect our business, results of operations, and financial condition”; “Risk Factors—Risks Related to Cybersecurity and Privacy—Any actual or perceived failure to comply with the evolving regulatory frameworks around the development and use of AI could adversely affect our business, results of operations, and financial condition”; “Risk Factors—Risks Related to Laws and Regulations——We operate in a highly regulated industry and are subject to a wide range of federal, state and local laws and regulations. Failure to comply with these laws and regulations could have a material adverse effect on our business, financial condition and results of operations”; “—If we fail to comply with the Telephone Consumer Protection Act, we may face significant damages, which could harm our business, financial condition and results of operationsoperations”; and “—Government regulation of

10


Table of Contents

the internet and ecommerce is evolving, and unfavorable changes or failure by us to comply with these regulations could substantially harm our business, financial condition and results of operations”; “Risk Factors—Risks Related to Our Use of Data and Technology—We are subject to risks related to online payment methods”; “Risk Factors—Risks Related to Our Growth and Strategy—We are expanding our proprietary logistics operations, including vehicle pick-ups and delivery from our last mile hubsand line haul transportation of vehicles between our last mile hubs, which will further expose us to increased risks related to ownership of infrastructure and the transportation of vehicles” and “Risk Factors—Risks Related to the COVID-19 Pandemic—The COVID-19 pandemic has had and is expected to continue to have an adverse effect on our business, financial condition and results of operations.”.

18


Table of Contents

Seasonality

Seasonality

Used vehicle sales are seasonal. The used vehicle industry typically experiences an increase in sales early in the calendar year and reaches its highest point late in the first quarter and early in the second quarter. Vehicle sales then level off through the rest of the year, with the lowest level of sales in the fourth quarter. This seasonality has historically corresponded with the timing of income tax refunds, which are an important source of funding for vehicle purchases. Additionally, used vehicles depreciate at a faster rate in the last two quarters of each year and a slower rate in the first two quarters of each year. In lineHowever, the past few years have not followed typical depreciation trends and there remains continued uncertainty surrounding market trends. Consistent with these macromarket trends, our gross profit per unit has historically been higher inUACC generally experiences increased funding activity during the first half ofquarter through tax season. Delinquencies also tend to be lower during the year when compared tofirst quarter through tax season and higher during the secondlatter half of the year. See “Risk Factors—Risks Related to Our Financial Condition and Results of Operations—We may experience seasonal and other fluctuations in our quarterly results of operations, which may not fully reflect the underlying performance of our business.”

Available Information

Our website address is www.vroom.com.www.vroom.com. The information contained on, or that can be accessed through, our website is deemed not to be incorporated in this Annual Report on Form 10-K or to be part of this Annual Report on Form 10-K or any other report filed with the SEC. Our Annual Report on Form 10-K, Quarterly Reports on Form 10-Q and Current Reports on Form 8-K, as well as any amendments to those reports, are available free of charge through our website as soon as reasonably practicable after we file them with, or furnish them to, the SEC. The SEC maintains a website at www.sec.gov that contains reports, proxy statements, and other information regarding SEC registrants, including Vroom, Inc.

11

19


Table of Contents

Item 1A. Risk Factors

An investment in our common stock involves a high degree of risk. You should consider carefully the risks and uncertainties described below, together with the financial and other information contained in this Annual Report on Form 10-K, before you decide to purchase shares of our common stock. The risks and uncertainties described below are not the only ones we face. Additional risks and uncertainties that we are unaware of, or that we currently believe are not material or important, may also become material or important factors that adversely affect our business. If any of the following risks or others not specified below materialize, our business, financial condition and results of operations could be materially and adversely affected. In that case, the trading price of our common stock could decline and you could lose all or part of your investment in our common stock.

Risks Related to Our Financial Condition, Results of Operations, Liquidity and Indebtedness

There are risks associated with the COVID-19 Pandemicdiscontinuance of our ecommerce operations and wind-down of our used vehicle dealership business.

The COVID-19 pandemic has hadOn January 22, 2024, we announced the Value Maximization Plan, pursuant to which we are discontinuing our ecommerce operations and iswinding down our used vehicle dealership business in order to preserve cash and maximize stakeholder value through our remaining businesses. As a result, we will incur costs including severance costs, inventory liquidation costs, contract and lease termination costs and non-cash asset impairments, and such costs are expected to continueexceed any cash we generate on the liquidation of assets. The Company estimates it will incur approximately $31.5 million in one-time expenses in connection with the Plan. Included in this amount are approximately $15.0 million in costs attributable to have an adverse effectcontract and lease terminations and approximately $16.5 million of expenses the Company expects to incur relating to employee severance and benefits costs. The actual amount of wind down, transition and impairment charges may materially exceed our estimates, due to various factors, many of which are outside of our control, including the outcomes of discussions and negotiations (a number of which are currently ongoing) with the counterparties to the contracts and leases we intend to terminate or modify. In addition, because of uncertainties with respect to our wind-down plan (including those described above), we may not be able to realize the anticipated benefits of or complete the wind-down in the expected timeframe, on the terms or in the manner we expect, and the costs incurred in connection with such wind-down activities may exceed our estimates. If the time to complete the wind-down takes longer than expected, or the actual costs or impairment charges exceed our estimates, the Company’s business, operational results, financial position and cash flows could be adversely affected.

The purpose of the Value Maximization Plan is to wind-down our ecommerce operations, which were not profitable and had significant cash burn, in order to preserve cash and enable us to maximize stakeholder value through our remaining businesses, UACC and CarStory. As of February 29, 2024, we had cash and cash equivalents of approximately $94.0 million. Given our wind-down expenses, including employee severance costs, our ongoing operating expenses and recent losses at UACC, there can be no assurance that we will succeed in growing and enhancing the profitability of UACC and CarStory and create meaningful stakeholder value.

Additionally, the announced wind-down involves further risks, including:

the inability to retain qualified personnel necessary for the wind-down during the wind-down period;
potential disruption of the operations of the rest of our businesses and diversion of management’s attention from such businesses and operations;
exposure to unknown, contingent or other liabilities, including litigation arising in connection with the wind-down;
negative impact on our business financial conditionrelationships, including but not limited to potential relationships with our customers, suppliers, vendors, licensees and resultsemployees; and
unintended negative consequences from changes to our business.

If any of operations.

Governmental authorities around the world have implemented measures to reduce the spread of COVID-19. These measures have adversely affected workforces, customers, supply chains, consumer sentiment, economies, and financial markets, and, along with decreased consumer spending, have led to an economic downturn across many global economies.

The COVID-19 pandemic rapidly escalated in the United States, creating significant uncertainty and economic disruption, and leading to record levels of unemployment nationally. Numerous state and local jurisdictions imposed, and others in the future may impose, shelter-in-place orders, quarantines, shut-downsthese or restrictions on operations of non-essential businesses, and similar government orders and restrictions on their residents to control the spread of COVID-19. While some such orders or restrictions have been lifted in certain jurisdictions, certain of those orders have been re-instated, new orders have been imposed and future orders may be imposed as the COVID-19 pandemic continues to spread in waves nationwide and various new strains of the virus surface. Such orders or restrictions have resulted in temporary facility closures (including certain of our third-party VRCs), work stoppages, slowdowns and travel restrictions, among other effects, thereby adversely impacting our operations. Due to the evolving nature of the COVID-19 crisis and the uncertainties surrounding the availability and efficacy of vaccines and other treatments for COVID-19, including with respect to their development and distribution, we continue to monitor the situation closely and assess the impact on our business. As of the filing of this Annual Report on Form 10-K, we expect our operations will continue to be adversely impacted in 2021, however, the magnitude and duration of the ultimate impact is impossible to predict with certainty due to:

uncertainties regarding the duration of the COVID-19 pandemic and the length of time over which the disruptions caused by COVID-19 will continue;

the impact of governmental orders and regulations that have been, and may in the future be, imposed in response to the pandemic;

the impact of COVID-19 on VRCs, wholesale auctions, state DMV titling and registration services, third-party vehicle carriers and other third parties on which we rely;

uncertainty as to the impact future increases in COVID-19 transmission rates could have onfactors impair our ability to fully staff portionssuccessfully implement the wind-down, we may not be able to realize other business opportunities as we may be required to spend additional time and incur additional expense relating to the wind-down that otherwise would be used on the development, expansion and profitability of our business;

the deterioration of economic conditions in the United States, as well as high unemployment levels,other businesses, which could adversely impact our business, operational results, financial position and cash flows.

12


We may not generate sufficient liquidity to operate our business.

As of February 29, 2024, we had cash and cash equivalents of approximately $94.0 million. We expect to use our cash and cash equivalents to finance our future capital requirements and UACC’s four senior secured warehouse facility agreements (the “Warehouse Credit Facilities”) to fund our finance receivables. Certain advance rates available to UACC on borrowings from the Warehouse Credit Facilities have decreased as a result of the increasing credit losses in UACC's portfolio and overall higher interest rates. Any future decreases on available advance rates may have an adverse impact on discretionary consumer spending;our liquidity.

uncertainty regardingWe cannot assure you that we will generate sufficient revenue to offset the potential for, timingcost of maintaining our remaining operations, including significant accounting, legal, administrative and duration of, and severity of future waves of the COVID-19 crisis and the effect of new strains of the virus;

uncertainty as to whetherother costs associated with being a public company, and to what degree governmentalservice the interest and repay the outstanding Convertible Senior Notes due 2026 (the "Notes") when due. Our revenue growth may be adversely affected by our inability to grow and develop the UACC and CarStory businesses; weakness in the automotive retail industry generally; general economic relief will be provided to soften the negative economic effects of the COVID-19 crisisconditions, including high interest rates and the resulting governmental orders and restrictions; and

the availability and efficacy of vaccinesinflation; global pandemics and other treatments for COVID-19, including with respect to their developmentpublic health emergencies; and distribution.

In response to the COVID-19 disruptions, we implemented a number of measures designed to protect the health and safetyincreasing competition. Our historical revenue growth is not indicative of our workforce. These measures include restrictions on non-essential business travel,future performance, particularly given the institutionwind-down of work-from-home policies wherever feasible and the implementation of strategies for workplace safety at our facilities that remain open. We are following the guidance from public health officials and government agencies, including limiting the number of employees in our office facilities, implementation of enhanced cleaning measures, social distancing guidelines, wearing of masks, eliminating non-essential vendor / guest visitation, and requiring health attestations and temperature checks prior to entering facilities, in each case subject to local requirements. Seating, signage, and cleaning materials have

20


Table of Contents

been added to ensure adherence to best practices for employee health and safety during this pandemic. Where feasible, we operate on a rotating team schedule to reduce exposure and also require any diagnosed or exposed employees to self-isolate for up to two weeks before returning to work. Nevertheless, these actions may not be sufficient to prevent a material disruption in our workforce.

Both TDA and our back-office facility in Houston continued to remain open during the year ended December 31, 2020 and through the date of this Annual Report on Form 10-K. However, lower foot traffic in the initial phase of the COVID-19 pandemic as well as reduced inventory at the TDA location as the ecommerce business scales, continues to negatively affect our TDA business. We also have experienced disruptions in our logistics network and productivity challenges in our back-office operations, including backlogs in the titling and registration of vehicles due to shutdowns of or limited operations at state departments of motor vehicles. As COVID-19 disruptions continue,If we are unsure whenunable to grow and develop the negative effects on our business will subside. As a result of these developments, our business, results of operations, cash flowsUACC and financial condition for fiscal year 2020 have been significantly affected by the COVID-19 disruptionsCarStory businesses and could continue to be adversely impacted in the future. There is no assurance the measures we have taken or may take in the future will be successful in managing the uncertainties caused by COVID-19.

The extent to which COVID-19 ultimately impactsgenerate sufficient revenue, our business, financial condition and results of operations will dependbe materially and adversely affected. Additionally, our cash needs may increase in the future as we focus on future developments, which are highly uncertaingrowing and unpredictable, including new information which may emerge concerningdeveloping the severityUACC and durationCarStory businesses.

In addition to our ongoing cash requirements, our liquidity will also be used to fund costs related to the wind-down of the COVID-19 outbreakour ecommerce operations, primarily severance and the effectiveness of actions taken to contain the COVID-19 outbreak or treat its impact, including the availabilityearly contract and efficacy of vaccineslease termination payments. Such payments could be significant and other treatments for COVID-19, including with respect to their development and distribution, and the resistance of new strains of the virus to vaccines, among others. The ultimate consequences of the COVID-19 pandemic cannot be predicted with certainty, but it could have a material effect on our business, operating results, financial condition and prospects.

In addition tocash flows from operations. Our future capital requirements will depend on many factors, including our available advance rates on the COVID-19 disruptions adversely impacting our business and financial results, they may also have the effect of heightening many of the other risks described herein, including risks relating to changes in consumer demand; our limited operating history;Warehouse Credit Facilities, our ability to generate sufficient revenuecomplete additional securitization transactions on terms favorable to generate positive cash flow; the operation of TDA; our relationships with third party customer experience teams; the availability of third-party providers to deliver our vehicles to customers nationwide; the operation of our VRCs by us, and our third party service providers; the current geographic concentration of reconditioning services and store inventory; our level of indebtedness; our agreement with a single lender to finance our vehicle inventory purchasesfuture credit losses. We have no significant debt maturities due until July 2026 and the expirationpayments on our securitization debt are funded by cashflows on the finance receivables within the securitization trusts. However, there can be no assurance that our liquidity will be sufficient to achieve the objectives of such agreement; our access to desirable vehicle inventory; regulatory restrictions; and the shift by traditional dealers to online sales and deliveries.Value Maximization Plan.

Risks Related to Our Financial Condition and Results of Operations

We have a history of losses and we may not achieve or maintain profitability in the future.

We have not been profitable since our inception in 2012 and had an accumulated deficit of approximately $777.9$1,966.2 million as of December 31, 2020.2023. We incurred net losses of $202.8$365.5 million and $143.0$451.9 million for the years ended December 31, 20202023 and 2019,2022, respectively. While the majority of our historic losses related to our ecommerce business, UACC had a loss before provision for income taxes of approximately $41.2 million for the year ended December 31, 2023. We may continue to incur significant losses in the future for a number of reasons, including increased losses on UACC's portfolio, our inability to reduce costs, acquiregrow and appropriately price vehicle inventory, providemaximize the exceptional customer experience needed to attract customers or identifyvalue of the UACC and respond to emerging trends in the used car industry; a slowdown in demand for used vehicles and our related value-added products;CarStory businesses; weakness in the automotive retail industry generally; general economic conditions;conditions, including high interest rates, inflation and unemployment; global pandemics;pandemics and other public health emergencies; and increasing competition, as well as other risks described in this Annual Report on Form 10-K, and we may encounter unforeseen expenses, difficulties, complications and delays in achieving profitability.the goals of our Value Maximization Plan.

Additionally,

While we have significantly reduced our operating expenses as part of our Value Maximization Plan, we expect to continue to incur lossesincurring operating expenses as we invest in the UACC and strive to grow our business. We expect our operating expenses to increase in the future as we increase our investment in our proprietary logistics operations, increase our advertising and marketing efforts to build our brand, continue to investCarStory businesses, including investments in technology development increase hiring and expand our operating infrastructure.for those businesses. In addition, as a public company, we now have significantanticipate continued legal, accounting, administrative and other expenses that we did not incur as a privatepublic company. As a result of these increased expenditures, we will have to generate and sustain increased revenue sufficient to offset our operating expenses andin order to achieve and maintain profitability. In addition, if we reduce variable costs to respond to losses, this may limit

Our level of indebtedness could have a material adverse effect on our ability to acquire customersgenerate sufficient cash to fulfill our obligations under such indebtedness, to react to changes in our business and growto incur additional indebtedness to fund future needs.

As of December 31, 2023, we had outstanding $151.2 million aggregate principal amount of borrowings under our revenues. Our ecommerce gross profit per unit increased by $69, or 4.1%, from2022 Vehicle Floorplan Facility and $290.5 million aggregate principal amount of our Notes. For the year ended December 31, 20192023, our interest expense was $19.5 million related to the 2022 Vehicle Floorplan Facility, and $4.3 million related to the Notes. In addition, as of December 31, 2020. To2023, UACC had $314.1 million of securitization indebtedness as well as its Warehouse Credit Facilities with banking institutions, with an aggregate borrowing limit of $825.0 million. As of December 31, 2023, there was $421.3 million in outstanding borrowings related to the Warehouse Credit Facilities. In

13


Table of Contents

2023, we repurchased $74.2 million in aggregate principal amount of our Notes, net of deferred issuance costs of $3.7 million, in open market transactions for $36.5 million. Subject to market conditions and availability, we may continue to opportunistically repurchase Notes from time to time to reduce our losses,outstanding indebtedness at a discount. However, as we will need to increase our gross profit per unit by lowering our costs per unit by, among other things, increasing efficiencies in reconditioning and logistics, whichapproach the July 2026 maturity date, we may be unable to do. Accordingly,repay, restructure or refinance the remaining Notes on commercially reasonable terms or at all.

If our cash flows and capital resources are insufficient to fund our debt service obligations going forward, we may not achievebe forced to reduce or maintain profitabilitydelay investments and capital expenditures, or to sell assets, seek additional capital or restructure or refinance our indebtedness. If new debt is added to our current indebtedness level, the related risks that we may continueface could intensify. Our remaining Notes will mature on July 1, 2026, and our ability to incur significant losses inservice the future.

21


Table of Contents

We may not be ableinterest and repay the Notes when due will depend on our ability to generate sufficient revenuecash. Our ability to generate positiverestructure or refinance our current or future debt, including the Notes, or obtain additional debt financing will depend on the condition of the capital markets and our financial condition at such time, including the execution of our Value Maximization Plan and our ability to grow and enhance the profitability of the UACC and CarStory businesses. Any refinancing of our debt could be at higher interest rates and may require us to comply with more onerous covenants, which could further restrict our business operations. Any failure to make payments of interest and principal on our outstanding indebtedness on a timely basis or failure to comply with certain restrictions in our debt instruments would result in a default under our debt instruments. In the event of a default under any of our current or future debt instruments, the lenders could elect to declare all amounts outstanding under such debt instruments to be due and payable.

Our indebtedness and liabilities could limit the cash flow on a sustained basis, andavailable for our revenue growth rate may decline.

We cannot assure youoperations, expose us to risks that we will generate sufficient revenue to offset the cost of maintaining our platform and maintaining and growing our business. Although our revenue grew from $1.2 billion for the year ended December 31, 2019 to $1.4 billion for the year ended December 31, 2020, our revenue growth rate may decline in the future because of a variety of factors, including our inability to acquire and appropriately price vehicle inventory, provide the exceptional customer experience needed to attract customers or execute effective marketing campaigns to increase traffic to our platform; a slowdown in demand for used vehicles and our related value-added products; weakness in the automotive retail industry generally; general economic conditions; and increasing competition. We cannot assure you that our revenue will continue to grow or will not decline. You should not consider our historical revenue growth as indicative of our future performance. If our revenue growth rate declines,could adversely affect our business, financial condition and results of operations will be materially and adversely affected.impair our ability to satisfy our debt obligations.

Further, going forward

As of December 31, 2023, we, expect to makeincluding our subsidiaries, had approximately $1,199.0 million principal amount of consolidated indebtedness. Of that amount, $151.2 million aggregate principal amount of borrowings under our 2022 Vehicle Floorplan Facility has been paid in full, and $314.1 million of securitization debt is funded by cashflows on receivables within the securitization trusts. Our indebtedness could have significant investments to further developnegative consequences for our security holders and expand our business, results of operations and these investmentsfinancial condition by, among other things:

increasing our vulnerability to adverse economic and industry conditions;
limiting our ability to obtain additional financing;
requiring the dedication of a substantial portion of our cash flow from operations to service our indebtedness, which will reduce the amount of cash available for other purposes, including the successful execution of our Value Maximization Plan;
limiting our flexibility to plan for, or react to, changes in our business;
placing us at a possible competitive disadvantage with competitors that are less leveraged than us or have better access to capital.

Our business may not resultgenerate sufficient funds, and we may otherwise be unable to maintain sufficient cash reserves, or to pay amounts due under our indebtedness, and our cash needs may increase in increased revenue or growth on a timely basis or at all. For example,the future. In addition, our existing indebtedness contains, and any future indebtedness that we expect to continue to expend substantialmay incur may contain, financial and other resourcesrestrictive covenants that may limit our ability to operate our business, raise capital or make payments under our other indebtedness.

For example, on increased marketingDecember 21, 2023, we received written notice from Nasdaq notifying us that, for the prior 30 consecutive business days, the bid price for our common stock had closed below the $1.00 minimum bid price requirement for continued inclusion on the Nasdaq Global Select Market. On February 13, 2024, after obtaining stockholder approval, we effected a 1-for-80 reverse stock split (the “Reverse Stock Split”), and other efforts to acquire and retain customers, expanding our customer experience team, developing our technology and data analytics capabilities, adding new features and functionality to our website, mobile application development and expansionstock began trading on a post-split adjusted basis on February 14, 2024. On February 29, 2024, we were notified by Nasdaq Listing Qualifications that the closing bid price of our reconditioningcommon stock had been at $1.00 per share or greater for 11 consecutive business days, from February 14, 2024 to February 28, 2024. Accordingly, the Company has regained compliance with Nasdaq Listing Rule 5450(a)(1) and proprietary logistics operations. These investments may not result in increased revenuethis matter is now closed. However, if our common stock again closes below the $1.00 per share minimum bid price required by Nasdaq for 30 consecutive business days, we again would receive another notice of non-compliance with Nasdaq’s listing standards and would face the risk of delisting. There can be no assurance that our common stock will continue to close at or growth in our business. If we cannot successfully earn revenue at a rateabove the $1.00 per share minimum bid price as required by

14


Table of Contents

Nasdaq, or that exceeds the costs associated with our business, we will not be able to generate positive cash flowotherwise meet the requirements of Nasdaq for continued listing on Nasdaq Global Select Market. The delisting of our common stock from the Nasdaq Global Select Market would constitute a sustained basisfundamental change under the terms of our Indenture and make our revenue growth rate may decline. Additionally, we base our expenses and investment plans on our estimates of revenue and gross profit. If our assumptions prove to be wrong, we may spend more than we anticipate or may generate less revenue than anticipated.Notes redeemable at par upon delisting. If we fail to continuecomply with these covenants or to growmake payments under our revenue,indebtedness when due, then we would be in default under that indebtedness, which could, in turn, result in that and our business, financial condition and results of operations could be materially and adversely affected.other indebtedness becoming immediately payable in full.

Our business is subject to certain risks

We recognized an impairment charge related to goodwill and long-lived assets. If our amortizable intangible assets or remaining long-lived assets become impaired in the operationfuture, we would incur additional impairment charges, which would negatively affect our operating results.

Our goodwill was fully impaired as of TDA.

InDecember 31, 2022. We also recognized impairment charges of $48.7 million related to long-lived assets during the yearsyear ended December 31, 2020 and 2019, $196.7 million and $390.2 million, respectively, of2023. If our revenues were related to sales at TDA, representing approximately 14.5% and 32.8% of our total revenues for those years. For the years ended December 31, 2020 and 2019, TDA gross profit was $12.1 million and $25.4 million, respectively. Lower foot trafficamortizable intangible assets or remaining long-lived assets become impaired in the initial phase of the COVID-19 pandemic, as well as reduced inventory at the TDA location as the ecommerce business scales, continues tofuture, we would incur additional impairment charges, which would negatively affect our TDA business. Vehicle sales at TDA also could be adversely affected for a variety of other reasons, including severe weather conditions or other catastrophic events in the Houston area that could damage our facilities and/or our inventory and keep customers from coming onsite, or economic downturns or other factors affecting the Houston area that could lead to reduced demand. Although revenues and gross profit from TDA are expected to decline as a percentage of total revenues over time as we scale our ecommerce business, a material decline in vehicle sales at TDA in the near term would adversely affect our results of operations. In addition, we acquired TDAThere is significant judgment required in 2015,the analysis of a potential impairment of identified intangible assets and other long-lived assets. Impairment may result from, among other things, significant changes in connection with this acquisition, we could continue to be subject to risks and liabilities from the operationmanner of TDA under its prior ownership, and the indemnities that we negotiated as partuse of the transaction may not adequately protect us.acquired assets, negative industry or economic trends and/or significant underperformance relative to historic or projected operating results. See Notes 7 and 12 to the Company’s Consolidated Financial Statements.

We may experience seasonal and other fluctuations in our quarterly results of operations, which may not fully reflect the underlying performance of our business.

We expect our quarterly results of operations, including our revenue, gross profityield, net spreads, risk-adjusted margins, credit losses and cash flow to vary significantly in the future based in part on among other things, vehicle-buying patterns. Vehicle sales generally exhibithistorically have exhibited seasonality, with an increase in sales early in the year that reaches its highest point late in the first quarter and early in the second quarter, which then levels off through the rest of the year with the lowest level of sales in the fourth quarter. This seasonality historically corresponds with the timing of income tax refunds, which can provide a primary source of funds for customers’ payments on used vehicle purchases. Used vehicle prices also exhibit seasonality, with used vehicles depreciating at a faster rate in the last two quarters of each year and a slower rate in the first two quarters of each year. Consistent with market trends, UACC generally experiences increased funding activity during the first quarter through tax season. Delinquencies also tend to be lower during the first quarter through tax season and higher during the latter half of the year.

Other factors that may cause our quarterly results to fluctuate include, without limitation:

the progress of our Value Maximization Plan;

our liquidity and ability to raise capital through equity or debt financings;
our ability to attract new customers;

complete securitization transactions on favorable terms;

our ability to generate sales of value-added products;

future credit losses;

increases in vehicle prices;

changes in the competitive dynamics of our industry;

the regulatory environment;

expenses associated with unforeseen quality issues;

22


Table of Contents

macroeconomic conditions, including the impact of the COVID-19 pandemic;

interest rates, inflation, unemployment and underemployment rates, vehicle supply and demand and labor costs;

the scope, impact and timing of any federal economic stimulus checks;

our ability to maintain sufficient inventory of desirable vehicles;

seasonality of the automotive industry and third-party aggregation websites on which we rely;

changes that impact disposable income, including changes that impact the timing or amount of income tax refunds; and

litigation or other claims against us.

us and increased legal and regulatory expenses.

In addition, a significant portion of our expenses are fixed and do not vary proportionately with fluctuations in revenues. As a result of these seasonal fluctuations, our results in any quarter may not be indicative of the results we may achieve in any subsequent quarter or for the full year, and period-to-period comparisons of our results of operations may not be meaningful.

15

Our level of indebtedness could have a material adverse effect on our ability to generate sufficient cash to fulfill our obligations under such indebtedness, to react to changes in our business and to incur additional indebtedness to fund future needs.

As of December 31, 2020, we had outstanding $329.2 million aggregate principal amount of borrowings under our 2020 Vehicle Floorplan Facility (as defined in “Management’s Discussion and Analysis of Financial Condition and Results of Operations—Liquidity and Capital Resources—Vehicle Financing”). Our interest expense was $9.7 million for the year ended December 31, 2020.

If our cash flows and capital resources are insufficient to fund our debt service obligations, we may be forced to reduce or delay investments and capital expenditures, or to sell assets, seek additional capital or restructure or refinance our indebtedness. Our ability to restructure or refinance our current or future debt will depend on the condition of the capital markets and our financial condition at such time. Any refinancing of our debt could be at higher interest rates and may require us to comply with more onerous covenants, which could further restrict our business operations. The terms of existing or future debt instruments may restrict us from adopting some of these alternatives. Any failure to make payments of interest and principal on our outstanding indebtedness on a timely basis or failure to comply with certain restrictions in our debt instruments would result in a default under our debt instruments. In the event of a default under any of our current or future debt instruments, the lenders could elect to declare all amounts outstanding under such debt instruments to be due and payable. Furthermore, our 2020 Vehicle Floorplan Facility restricts our ability to dispose of assets and/or use the proceeds from the disposition. We may not be able to consummate any such dispositions or to obtain the proceeds that we could realize from them and these proceeds may not be adequate to meet any debt service obligations then due.

In addition, our indebtedness under our 2020 Vehicle Floorplan Facility bears interest at variable rates. Because we have variable rate debt, fluctuations in interest rates may affect our cash flows or business, financial condition and results of operations. We may attempt to minimize interest rate risk and lower our overall borrowing costs through the utilization of derivative financial instruments, primarily interest rate swaps.

We may require additional debt and equity capital to pursue our business objectives and respond to business opportunities, challenges or unforeseen circumstances. If such capital is not available to us, our business, financial condition and results of operations may be materially and adversely affected.

We may require additional capital to pursue our business objectives and respond to business opportunities, challenges or unforeseen circumstances, including to increase our marketing expenditures to improve our brand awareness, build and maintain our inventory of used vehicles, develop new products or services or further improve existing products and services, expand and enhance our operating and proprietary logistics infrastructure and acquire complementary businesses and technologies. Accordingly, we may need to engage in equity or debt financings to secure additional funds. However, additional funds may not be available when we need them, on terms that are acceptable to us, or at all. Moreover, any debt financing that we secure in the future could involve restrictive covenants which may make it more difficult for us to obtain additional capital and to pursue business opportunities. Volatility in the credit markets may also have an adverse effect on our ability to obtain debt financing. If we raise additional funds through further issuances of equity or convertible debt securities, our existing stockholders could suffer significant dilution, and any new equity securities we issue could have rights, preferences and privileges superior to those of holders of our common stock. If we are unable to obtain adequate financing or financing on terms satisfactory to us when we require it, we may be forced to obtain financing on undesirable terms or our ability to continue to pursue our business objectives and to respond to business opportunities, challenges or unforeseen circumstances could be significantly limited, and our business, financial condition and results of operations could be materially and adversely affected.

23


Table of Contents

We currently rely on an agreement with a single lender to finance our vehicle inventory purchases under our 2020 Vehicle Floorplan Facility. If our relationship with this lender were to terminate, and we fail to acquire alternative sources of funding to finance our vehicle inventory purchases, we may be unable to maintain sufficient inventory, which would adversely affect our business, financial condition and results of operations.

We rely on a revolving credit agreement with a single lender to finance our vehicle inventory purchases under our 2020 Vehicle Floorplan Facility. Outstanding borrowings are due as financed vehicles are sold, and the 2020 Vehicle Floorplan Facility is secured by our vehicle inventory and certain other assets. If we are unable to maintain our 2020 Vehicle Floorplan Facility, which expires in September 2022, absent renewal, on favorable terms or at all, or if the agreement is terminated or expires and is not renewed with our existing third-party lender or we are unable to find a satisfactory replacement, our inventory supply may decline, resulting in fewer vehicles available for sale on our website. Moreover, new funding arrangements may be at higher interest rates or subject to other less favorable terms. These financing risks, in addition to potential rising interest rates and changes in market conditions, if realized, could negatively impact our business, financial condition and results of operations. See “Management’s Discussion and Analysis of Financial Condition and Results of Operations—Liquidity and Capital Resources—Vehicle Financing.”

Risks Related to Our Growth and Strategy

Our recent, rapid growth may not be indicative of our future growth and, if we continue to grow rapidly, we may not be able to manage our growth effectively.

Our revenue grew from $1.2 billion for the year ended December 31, 2019 to $1.4 billion for the year ended December 31, 2020. We expect that, in the future, even if our revenue continues to increase, our rate of growth may decline. In any event, we will not be able to grow as fast or at all if we do not:

increase the number of unique visitors to our website, the number of qualified visitors to our website (i.e. those who have the intent and ability to transact), and the number of customers transacting on or through our platform;

further enhance the quality of our vehicle offerings and value-added products, and introduce high quality new offerings and features on our platform;

acquire sufficient high-quality inventory at an attractive cost to meet the increasing demand for our vehicles;  

further invest in and enhance the quality of our logistics operations, including our customer delivery experience; and

•  further develop the functionality of our website and mobile applications to facilitate fully digital transactions and reduce the need for continued investments in staffing for sales and sales support functions.

Our business has grown rapidly as new customers have purchased vehicles and value-added products from us. However, our business is relatively new and has operated at substantial scale for only a limited period of time. Given this limited history, it is difficult to predict whether we will be able to maintain or grow our business. Our historical revenue growth should not be considered indicative of our future performance. We have encountered, and will continue to encounter, risks and difficulties frequently experienced by growing companies in rapidly changing industries, including difficulties in our ability to achieve market acceptance of our platform and attract customers, as well as increasing competition and increasing expenses as we continue to grow our business. We also expect that our business will evolve in ways that may be difficult to predict. For example, over time our investments that are intended to drive new customer traffic to our website may be less productive than expected. In the event of this or any other adverse developments, our continued success will depend on our ability to successfully adjust our strategy to meet changing market dynamics. If we are unable to do so, our business, financial condition and results of operations could be materially and adversely affected.

Our recent, rapid growth has placed and may continue to place significant demands on our management and our operational and financial resources. In addition to our significant growth in sales and revenues, we have experienced significant growth in the number of customers on our platform as well as the amount of data that we analyze. Although we have hired additional personnel, our operations have not kept pace with our top-line growth, which has resulted in backlog in our operations that have adversely affected our customer experience. We expect to continue hiring additional personnel to support our continued rapid growth. In addition, our organizational structure is becoming more complex as we add staff, and we will need to continue to improve our operational, financial and management controls as well as our reporting systems and procedures. This will require significant capital expenditures and the allocation of valuable management resources to grow and adapt in these areas without undermining our corporate culture of teamwork. If we cannot manage our growth effectively to maintain the quality and efficiency of our customers’ experience and/or the quality of the vehicles we sell, our business, financial condition and results of operations could be materially and adversely affected.

24


Table of Contents

We have a limited operating history and are still building out our foundational systems.

We commenced operations in 2012 and acquired TDA in 2015 and, as a result, have a limited operating history. Moreover, over the past four years, we brought in a new senior leadership team that has refocused our strategy, accelerated our growth and committed us to pursue a path to profitability. To execute this strategy, we have invested, and continue to invest, in enhancing our foundational systems as we scale our business, including design and expansion of website functionality and features, mobile application development, advancement and deployment of sophisticated data analytics, lean manufacturing technology and logistics network management, and work on all such foundational systems is ongoing. Fundamental to our continued growth and path to profitability is the further development of the functionality of our website and mobile applications to facilitate fully digital transactions and reduce the need for continued investments in staffing for the sales and sales support functions.

These types of activities and investments subject us to various costs and risks, including increased capital expenditures, additional administration and operating expenses, potential disruption of our internal control structure, acquisition and retention of sufficiently skilled personnel, demands on management time, the introduction of errors or vulnerabilities and other risks and costs of delays or difficulties in transitioning to or integrating new systems into our foundational systems. There can be no assurance that we will succeed in successfully developing our capabilities in each of these areas, or that a desirable return on investment will be achieved on the investments made in these areas. A failure to successfully execute on the development of our foundational systems would adversely affect our business, financial condition and results of operations. 

We are expanding our proprietary logistics operations, including vehicle pick-ups and delivery from our last mile hubs and line haul transportation of vehicles between our last mile hubs, which will further expose us to increased risks related to ownership of infrastructure and the transportation of vehicles.

We experienced disruptions across our logistics network at the outset of the COVID-19 pandemic, with a reduced number of third-party providers available to deliver our vehicles, which resulted in a slowdown of inventory being picked up and delivered to our VRCs and in sold units being delivered to customers. In addition, our transportation costs increased as the remaining carriers have increased prices.

In response to these disruptions, and to further enhance the quality of our logistics operations and our customer experience, we have been accelerating our investment in our proprietary logistics operations, including expanding our owned vehicle fleet. Additionally, as of February 15, 2021, we have opened twelve last mile hubs around the country at third-party facilities, through which we will coordinate directly with our customers to schedule deliveries in an effort to further strengthen our customer experience. We also have invested in short-haul trucks to make regional deliveries from our last mile hubs, and have begun to invest in long-haul vehicles for hub-to-hub shipments. These investments will require additional capital expenditures and operating expenses, increase our current risks and expose us to new risks. These risks include local and federal regulations, vehicular crashes, injury, insufficient internal capacity, taxes, license and registration fees, insurance premiums, self-insurance levels, difficulty in recruiting and retaining qualified drivers, maintaining the truck fleet, disruption of our technology systems, equipment supply, equipment quality, and increasing equipment and operational and overhead costs. Our failure to successfully manage the expansion of our logistics operations could cause delays and increase costs in our inbound and outbound shipping, which may adversely affect our operating results and financial condition.

Our ability to expand value-added product offerings and introduce additional products and services may be limited, which could have a material adverse effect on our business, financial condition and results of operations.

Currently, our third-party value-added products consist of finance and protection products, which includes third-party financing of customers’ vehicle purchases, as well as other value-added products, such as vehicle service contracts, GAP protection and tire and wheel coverage. If we introduce new value-added products or expand existing offerings on our platform, such as insurance referral services, music services and vehicle diagnostic and tracking services, we may incur losses or otherwise fail to enter these markets successfully. Our expansion into these markets may place us in competitive and regulatory environments with which we are unfamiliar and involve various risks, including the need to invest significant resources to familiarize ourselves with such frameworks and the possibility that returns on such investments may not be achieved for several years, if at all. In attempting to establish new offerings, we expect to incur significant expenses and face various other challenges, such as expanding our customer experience team and management personnel to cover these markets and complying with complicated regulations that apply to these markets. In addition, we may not successfully demonstrate the value of these value-added products to customers, and failure to do so would compromise our ability to successfully expand into these additional revenue streams. Any of these risks, if realized, could materially and adversely affect our business, financial condition and results of operations.

25


Table of Contents

We rely on third-party vendors for key components of our business, which exposes us to increased risks.

In line with our asset-light business strategy, many components of our business, including our reconditioning facilities, our logistics operations, our customer financing and our customer experience teams are primarily provided by third parties. We carefully select our third-party vendors, but we cannot control their actions. If our vendors fail to perform as we expect, our operations and reputation could suffer if the failure harms the vendors’ ability to serve us and our customers. One or more of these third-party vendors may experience financial distress, staffing shortages or liquidity challenges, file for bankruptcy protection, go out of business, or suffer disruptions in their business due to the COVID-19 pandemic. The use of third-party vendors represents an inherent risk to our Company that could have a material adverse effect on our business, financial condition and results of operations.

Our future growth and profitability relies heavily on the effectiveness and efficiency of our marketing and branding efforts, and these efforts may not be successful.

Because we are a consumer brand, we rely heavily on marketing and advertising to increase brand visibility and attract potential customers. Advertising expenditures are and will continue to be a significant component of our operating expenses, and there can be no assurance that we will achieve a meaningful return on investment on such expenditures. We continue to evolve our marketing strategies, adjusting our messages, the amount we spend on advertising and where we spend it, and no assurance can be given that we will be successful in developing effective messages and in achieving efficiency in our marketing and advertising expenditures. As a result, our future growth and profitability will depend in part on:

the effectiveness of our national television advertising campaigns;

the effectiveness of our performance-based digital marketing efforts;

the effectiveness and efficiency of our online advertising and search marketing programs in generating consumer awareness of, and sales on, our platform;

our ability to prevent confusion among customers that can result from search engines that allow competitors to use or bid on our trademarks to direct customers to competitors’ websites;

our ability to prevent internet publication of false or misleading information regarding our platform or our competitors’ offerings; and

the effectiveness of our direct-to-consumer advertising to reduce our dependency on third-party aggregation websites.

We currently advertise through a blend of brand and direct advertising channels with the goal of increasing the strength, recognition and trust in the Vroom brand and driving more unique visitors to our platform. Our marketing strategy includes national television campaigns, and performance marketing through digital platforms, including both auto-centric lead generation platforms and broader consumer-facing platforms. We also strategically use targeted radio campaigns and billboards and other local advertising in key markets, and we are expanding our national marketing efforts featuring Sell Us Your Car®. As such, a significant component of our marketing spend involves the use of various marketing techniques, including programmatic ad-buying, interest targeting, retargeting and email nurturing. Future growth and profitability will depend in part on the cost and efficiency of our promotional advertising and marketing programs and related expenditures, including our ability to create greater awareness of our platform and brand name, to appropriately plan for future expenditures and to drive the promotion of our platform.

Additionally, our business model relies on our ability to grow rapidly and to decrease incremental customer acquisition costs as we grow. If we are unable to recover our marketing costs through increases in customer traffic and incremental sales, if our advertising partners refuse to work with us at competitive rates or at all, or if our broad marketing campaigns are not successful or are terminated, our growth may suffer and our business, financial condition and results of operations could be materially and adversely affected.

26


Table of Contents

We may acquire other companies or technologies, which could divert our management’s attention, result in additional dilution to our stockholders and otherwise disrupt our operations and harm our results of operations.

Our success will depend, in part, on our ability to grow our business in response to the demands of consumers and other constituents within the automotive industry, as well as competitive pressures. Although we have no plans to do so currently, in some circumstances, we may determine to grow our business through the acquisition of complementary businesses and technologies rather than through internal development, such as our recent acquisition of the CarStory business. The identification of suitable acquisition candidates can be difficult, time-consuming and costly, and we may not be able to successfully complete identified acquisitions. The risks we face in connection with acquisitions include:

diversion of management time and focus from operating our business to addressing acquisition integration challenges;

coordination of technology, research and development and sales and marketing functions;

transition of the acquired company’s users to our platform;

retention of employees from the acquired company;

potential adverse reactions to the acquisition by an acquired company’s customers;

cultural challenges associated with integrating employees from the acquired company into our organization;

integration of the acquired company’s accounting, management information, human resources and other administrative systems;

the need to implement or improve controls, policies and procedures at a business that, prior to the acquisition, may have lacked effective controls, policies and procedures;

potential write-offs of intangibles or other assets acquired in such transactions that may have an adverse effect our results of operations;

liability for activities of the acquired company before the acquisition, including patent and trademark infringement claims, violations of laws, commercial disputes, tax liabilities and other known and unknown liabilities; and

litigation or other claims in connection with the acquired company, including claims from terminated employees, customers, former stockholders or other third parties.

Our failure to address these risks or other problems encountered in connection with our past or future acquisitions and investments could cause us to fail to realize the anticipated benefits of these acquisitions or investments, cause us to incur unanticipated liabilities and otherwise harm our business. Future acquisitions also could result in dilutive issuances of our equity securities, the incurrence of debt, contingent liabilities or amortization expenses, any of which could harm our financial condition. Also, the anticipated benefits of any acquisitions may not materialize. Any of these risks, if realized, could materially and adversely affect our business, financial condition and results of operations.

Risks Related to Our Operations

We face a variety of risks associated with the operation of our VRCs by us and our third-party service providers, any of which could materially and adversely affect our business, financial condition and results of operations.

We and third-party service providers operate our VRCs. If we are unable to maintain our relationship with our third-party service providers, such service providers cease to provide the services we need, or such service providers are unable to effectively deliver our services to our standards on timelines and at the prices we have negotiated, and we are unable to contract with alternative vendors or replace such service providers with a Vroom VRC (which may require significant time and investment), we could experience a decrease in the finished goods output sufficient to scale the business and quality of our reconditioning services, delays in listing our inventory, additional expenses, delivery delays and loss of potential and existing customers and related revenues, which may materially and adversely affect our business, financial condition and results of operations. These risks are exacerbated by the fact that slightly more than half of our current third-party VRCs are primarily operated by one third-party provider.

Moreover, our future growth and profitability depends in part on scaling our reconditioning operations and expanding the geographic reach of those operations in order to reduce shipping costs. We are expanding our reconditioning capacity through third-party VRC locations If for any reason we are unable to expand our reconditioning operations as planned, we could experience operational delays and a decrease in planned inventory. Any operational delays or delays in our planned expansion could have a material adverse effect on our business, financial condition and results of operations.

27


Table of Contents

Additionally, we and our third-party vendors are required to obtain approvals, permits and licenses from state regulators and local municipalities to operate our VRCs. There could be delays in obtaining the requisite approvals, permits, financing and licenses to operate our VRCs or we may not be able to obtain them at all. If we or our vendors encounter delays in obtaining or cannot obtain the requisite approvals, permits, financing and licenses to operate our VRCs in desirable locations, our business, financial condition and results of operations may be materially and adversely affected.

We rely primarily on third-party carriers to transport our vehicle inventory throughout the United States. Thus, we are subject to business risks and costs associated with such carriers and with the transportation industry, many of which are out of our control.

Although we are expanding our proprietary logistics network, we still primarily rely on third-party carriers to transport vehicles from auctions or individual sellers to VRCs, and then from our VRCs to our customers. As a result, we are exposed to risks associated with the transportation industry such as weather, traffic patterns, local and federal regulations, vehicular crashes, gasoline prices and lack of reliability of many independent carriers. Our third-party carriers’ failure to successfully manage our logistics and fulfilment process could cause a disruption in our inventory supply chain and decrease our inventory sales velocity, which may materially and adversely affect our business, financial condition and results of operations. In addition, third-party carriers who deliver vehicles to our customers could adversely affect the customer experience if they do not perform to our standards of professionalism and courtesy, which could adversely impact our business, financial condition and results of operations.

We rely on third-party service providers to provide financing, as well as value-added products to our customers, and we cannot control the quality or fulfillment of these products.

We rely on third-party lenders to finance our customers’ vehicle purchases. We also offer value-added products to our customers through a third-party service provider, including vehicle service contracts, GAP protection and tire and wheel coverage. Because we utilize third-party service providers, we cannot control all of the factors that might affect the quality and fulfillment of these services and products, including (i) lack of day-to-day control over the activities of third-party service providers, (ii) that such service providers may not fulfill their obligations to us or our customers or may otherwise fail to meet expectations and (iii) that such service providers may terminate their arrangements with us on limited or no notice or may change the terms of these arrangements in a manner unfavorable to us for reasons outside of our control. Such providers also are subject to state and federal regulations and any failure by such third-party service providers to comply with applicable legal requirements could cause us financial or reputational harm.

Our revenues and results of operations are partially dependent on the actions of these third parties. If one or more of these third-party service providers cease to provide these services or products to our customers, tighten their credit standards or otherwise provide services to fewer customers or are no longer able to provide them on competitive terms, it could have a material adverse effect on our business, revenues and results of operations. If we were unable to replace the current third-party providers upon the occurrence of one or more of the foregoing events, it could also have a material adverse effect on our business, revenues and results of operations. In addition, disagreements with such third-party service providers could require or result in costly and time-consuming litigation or arbitration.

Moreover, we receive fees from these third-party service providers in connection with finance, service and protection products purchased by our customers. A portion of the fees we receive on such products is subject to chargebacks in the event of early termination, default or prepayment of the contracts by end-customers, which could adversely affect our business, revenues and results of operations.

28


Table of Contents

The current geographic concentration where we provide reconditioning services and store inventoryof UACC’s borrowers or dealerships creates an exposure to local and regional downturns or severe weather or catastrophic occurrences that may materially and adversely affect our business, financial condition and results of operations.

We currently conduct our business through multiple VRCs, including our Vroom VRC located outside Houston, Texas, where we hold 22% of our inventory. In addition, more than half of our third-party reconditioning services are conducted through a single provider, with facilities located

Changes in California, Florida, Arizonademographics and other states. Any unforeseen eventspopulation, local and regional downturns or circumstances that negatively affect these areas, particularly our facilities near Houston, which have experienced flooding and other damage in recent years as a result of severe weather conditions including hurricanes,and other catastrophic occurrences in any of the states where UACC has a high concentration of borrowers or dealership partners could result in payment delays and increased risk of losses and could materially and adversely affect our revenues and results of operations. ChangesDuring the year ended December 31, 2023, 36.9% of UACC's originations were located in demographics and population or severe weather conditionsUACC's three largest states (measured by aggregate financed amount). While we believe that we have a diverse geographic presence, we expect that these three states will continue to generate significant amounts of our loans due to economic, demographic, regulatory, competitive and other catastrophic occurrencesconditions in areasthese states. Adverse developments in which we operate or from which we obtain inventory maythese states could lead to reduced demand for automotive financing, and could materially and adversely affect our financial condition and results of operations. Such conditions may result in physical damage to our properties, loss of inventory and delays in the delivery of vehicles to our customers.

We depend on key personnel to operate our business, and if we are unable to retain, attractintegrate and integrateattract qualified personnel, our ability to develop and successfully grow our business could be harmed.

We believe our success has depended, and continues to depend, on the efforts and talents of our executives and employees. Our future success depends on our continuing ability to attract,retain, develop, motivate and retainattract highly qualified and skilled employees. Qualified individuals are in high demand, and we may incur significant costs to attractretain and retainattract them. In addition,particular, we are highly dependent on the loss of anyservices of our key employees or senior management,leadership team to the development of our business, future vision, and strategic direction, including as we realign our business in accordance with the Value Maximization Plan. On February 29, 2024, James G. Vagim, III, UACC's Co-President and Chief Executive Officer, Paul J. Hennessy, could materially and adversely affectRavi Gandhi, UACC's Co-President and Chief Financial Officer stepped down. The Company's Chief Executive Officer, Tom Shortt succeeded Mr. Vagim as President and Chief Executive Officer, and the Company's Vice President of Investor Relations and Financial Planning & Analysis, Jon Sandison, succeeded Mr. Gandhi as UACC's Chief Financial Officer. Our future performance will depend, in part, on the successful transition of these positions. We heavily rely on the continued service and performance of our abilitysenior management team, which provides leadership, contributes to the core areas of our business and helps us to efficiently execute our business, plan and strategy, andincluding with respect to strategic initiatives such as our Value Maximization Plan. If members of our senior management team, including our executive leadership, become ill, or if we are otherwise unable to retain them, we may not be able to find adequate replacementsmanage our business effectively and, as a result, our business and operating results could be harmed. If the senior management team, including any new hires that we make, fails to work together effectively and to execute our plans and strategies on a timely basis then our business and future growth prospects could be harmed.

In addition, we issue equity awards to certain of our employees as part of our hiring and retention efforts, and job candidates and existing employees often consider the value of the equity awards they receive in connection with their employment. Our employees’ ability to sell their shares in the public market at times and/or at all.prices desired may lead to a larger than normal turnover rate. The market value of our common stock has declined significantly. If the actual or perceived value of our common stock does not recover, or if our common stock is delisted from the Nasdaq Global Select Market, it may adversely affect our ability to hire or retain employees. See “We may be unable to satisfy a continued listing rule from the Nasdaq”. In addition, we may periodically change our equity compensation practices, which may include reducing the number of employees eligible for equity awards or reducing the size or value of equity awards granted per employee or undertaking other efforts that may prove to be an unsuccessful retention mechanism. If we are unable to attract, integrate, or retain the qualified and highly skilled personnel required to fulfill our current or future needs, our business and future growth prospects could be harmed.

Furthermore, in light of the reduction in headcount as part of our Value Maximization Plan, we may find it difficult to maintain valuable aspects of our culture, to prevent a negative effect on employee morale or attrition beyond our planned reduction in headcount, and to attract competent personnel who are willing to embrace our culture in the future. Our executive officers and other employees are at-will employees, which means they may terminate their employment relationship with us at any time, and their knowledge of our business and industry would be extremely difficult to replace. We may not be able to retain the services of any members of our senior management or other key employees.employees, particularly in light of the discontinuance of our ecommerce business and wind-down of our used vehicle dealership business. If we do not succeed in attracting well-qualified employees or retaining and motivating existing employees or attracting well-qualified employees in the future, our business, financial condition and results of operations could be materially and adversely affected.

16


We are, and may in the future be, subject to legal proceedings in the ordinary course of our business. If the outcomes of these proceedings are adverse to us, it could have a material adverse effect on our business, financial condition and results of operations.

We are subject to various litigation matters from time to time, the outcome of which could have a material adverse effect on our business, financial condition and results of operations. Claims arising out of actual or alleged violations of law could be asserted against us by individuals, either individually or through class actions, by governmental entities in civil or criminal investigations and proceedings or by other entities. These claims could be asserted under a variety of laws, including but not limited to consumer finance laws, consumer protection laws, intellectual property laws, privacy laws, labor and employment laws, securities laws and employee benefit laws. These actions could expose us to adverse publicity and to substantial monetary damages and legal defense costs, injunctive relief and criminal and civil fines and penalties, including but not limited to suspension or revocation of licenses to conduct business. For example, a consolidated class action is pending in the U.S. District Court for the Southern District of New York asserting claims on behalf of a putative class of Company stockholders against us, certain of our officers, and certain of our directors, among others, alleging violations of the federal securities laws. We also are a party to certain stockholder derivative suits in which the Company is named as a nominal defendant in suits that various individual stockholders seek to bring on behalf of the Company against certain of our current and former directors and officers. These suits are pending in the U.S. District Court for the Southern District of New York and the U.S. District Court for the District of Delaware and are based on the same general course of conduct alleged in the consolidated securities class action. We believe these lawsuits are without merit and intend to vigorously contest these claims.

In January 2022, the Company received a non-public civil investigative demand from the Federal Trade Commission (“FTC”), seeking the production of information related to certain of the Company's business practices and the Company responded to those information requests. On February 23, 2024, the FTC notified the Company that it has reason to believe that the Company violated Section 5(a) of the Federal Trade Commission Act, 15 U.S.C. § 45(a); the FTC's Mail, Internet, or Telephone Order Merchandise Rule, 16 C.F.R. Part 435; the FTC’s Used Motor Vehicle Trade Regulation Rule,16 C.F.R. Part 455; and the FTC’s Pre-Sale Availability Rule, 16 C.F.R. Part 702. The FTC advised the Company that it is authorized to negotiate a stipulated order and the Company intends to work cooperatively with the FTC towards a resolution. Because the matter is at an early stage and the outcome of any complex legal proceeding is inherently unpredictable and subject to significant uncertainties, the Company cannot determine at present whether any potential liability would have a material adverse effect on the Company’s financial condition, cash flows, or results of operations.

In addition, in April 2022, the Attorney General of Texas filed a lawsuit on behalf of the State of Texas in the District Court of Travis County, Texas against the Company, alleging violation of the Texas Deceptive Trade Practices − Consumer Protection Act and Texas Business and Commerce Code § 17.41 et seq. In December 2023, Vroom, Inc., Vroom Automotive, LLC and the Attorney General of the State of Texas reached a final agreement to resolve all claims in the petition, without any admission of wrongdoing by either Vroom entity. Under the agreement, the Company will pay a total of $2 million in civil penalties and $1 million in attorneys' fees, with the first half due in September 2024 and the remaining half due in September 2025, and abide permanently by an injunction of certain operational practices that were previously implemented. The agreement was approved by the District Court of Travis County on December 13, 2023. See Part I, Item 3. “Legal Proceedings” for more information about these matters and the other legal proceedings to which we are subject.

Risks Related to Our Customer Experiencethe UACC Business

We

UACC may be unable to sell automotive finance receivables and generate gains on sales of those finance receivables, which could harm our business, results of operations, and financial condition.

UACC provides indirect financing by drawing on its Warehouse Credit Facilities to purchase retail installment sales contracts and pledging eligible finance receivables as collateral, then typically selling the receivables related to the retail installment sales contracts. Certain advance rates available to UACC on borrowings from the Warehouse Credit Facilities have decreased as a result of the increasing credit losses in UACC's portfolio and overall rising interest rates. Any future decreases on available advance rates may have an adverse impact on our liquidity. In addition, UACC has entered into outsourcing arrangements with third parties related to our customer experience team, and any difficulties experienced in these arrangements could result in an interruption of our ability to sell our vehiclesautomotive finance receivables that it purchases, through securitizations, and value-added products.

We have enteredwe expect UACC to enter into several outsourcing arrangements with third parties relatedadditional securitizations in the future, subject to our customer experience teams, including with respect to our customer inquiries, sales, purchases, financing, document support, customer service and other customer experience operations.

Currently, the substantial majority of inquiries, sales, purchases and financings of our vehicles in our ecommerce business are conducted by phone through a third-party customer experience center located in Detroit, Michigan. Thus, the customer experience centermarket conditions. If UACC is fundamental to the success of our business. As a result, the success of our business and our customer experience is partially dependent on a third party over which we have limited control. If the third party’s systems and operations fail or if the third party is otherwise unable to perform its sales function, we would be limited in our ability to complete customer transactions, which would make it more difficultnot able to sell vehiclesreceivables under these current or future arrangements for a variety of reasons, including increased credit losses or

17


because it has reached its capacity under the arrangements, its financing partners exercise termination rights before it reaches capacity, general economic or credit market conditions, market disruption or it reaches the scheduled expiration date of the commitment, and value-added products through our platform.

We also relyit is not able to enter into new arrangements on other third parties to provide customer service, document supportsimilar terms, it may not have adequate liquidity and other important customer experience operations. If the customer experience center or any of these third parties are unable to perform to our standards or to provide the level of service required or expected by our customers, or we are unable to renegotiate our agreements with them on attractive terms or at all, or if we are unable to contract with alternative third-party providers, our business, financial condition and results of operations may be harmedadversely affected. For example, as a result of market conditions at the time, which led to unfavorable pricing, we retained the non-investment grade securities and residual interests in UACC's 2023-1 securitization, requiring that the transaction remain on balance sheet pending the sale of the additional retained interests. Although we maysubsequently sold the non-investment grade securities, we continue to hold the residual interests. There can be no assurance that these residual interests will be sold and off-balance sheet treatment will be achieved in the future for this transaction. Furthermore, if we are unable to sell the residual interests, we could be subject to credit risk and be forced to pursue alternativesincur unexpected asset write-offs and bad-debt expense. In addition, as a result of high interest rates, the current inflationary environment and vehicle depreciation in the used automotive industry, UACC has been experiencing higher loss severity. Due to provide these services, whichthe increased loss severity, UACC elected to waive monthly servicing fees related to the 2022-2 securitization transaction in the first quarter of 2023. The waiver of monthly servicing fees related to the 2022-2 securitization transaction resulted in consolidation of the related finance receivables and securitization debt on our financial statements. Waiver of monthly servicing fees also results in reduced servicing income. Any future waivers of monthly servicing fees on other prior off-balance sheet securitization transactions could result in delays, interruptions,consolidation of such transactions. Such future consolidations could increase our indebtedness and may have a material adverse effect on our results of operations, financial condition and liquidity.

UACC's securitizations may expose it to financing and other risks, and there can be no assurance that it will be able to access the securitization market in the future, which may require it to seek more costly financing.

UACC has securitized, and we expect will in the future securitize, certain of its automotive finance receivables to generate cash. In such transactions, it conveys a pool of automotive finance receivables to a special purpose vehicle, typically a trust that, in turn, issues certain securities. The securities issued by the special purpose vehicle are collateralized by the pool of automotive finance receivables. In exchange for the transfer of finance receivables to the special purpose vehicle, UACC receives the cash proceeds from the sale of the securities.

There can be no assurance that UACC will be able to complete additional expensessecuritizations in the future, particularly if the securitization markets become constrained. In addition, the value of any securities that UACC may retain in its securitizations, including securities retained to comply with applicable risk retention rules, might be reduced or, in some cases, eliminated as a result of an adverse change in economic conditions, the financial markets or credit performance. For example, on March 1, 2024, 2023, UACC's BB-rated securities from the 2022-2 securitization transaction were downgraded by one ratings agency to a CCC rating. UACC's other rated securities may also be downgraded or put on negative credit watch. Furthermore, although our intent is to sell receivables originated by UACC using off-balance sheet securitization transactions, even if UACC is able to complete its securitizations, those securitizations may not qualify for sales accounting if market conditions do not allow for the sale of lower-rated securities or residual certificates. In addition, as a result of higher interest rates, the current inflationary environment and vehicle depreciation in the used automotive industry, UACC is experiencing higher portfolio losses. The increased losses could lead to reduced servicing income if UACC elects to waive monthly servicing fees going forward as it did in the first quarter of 2023 on the 2022-2 securitization transaction. The waiver of monthly servicing fees on the 2022-2 securitization transaction resulted in consolidation of the related finance receivables and securitization debt on Vroom’s financial statements. If it is not possible or economical for UACC to securitize its automotive finance receivables in the future, it would need to seek alternative financing to support its operations and to meet its existing debt obligations, which may be less efficient and more expensive than raising capital via securitizations and may have a material adverse effect on our results of operations, financial condition, and liquidity.

UACC is currently experiencing increasing credit losses in interests it holds in automotive finance receivables and its credit scoring systems may not effectively forecast its automotive receivables loss rates. Higher than anticipated credit losses or prepayments or the inability to effectively forecast loss rates may negatively impact our operating results.

UACC specializes in the purchase and servicing of potentialcontracts to finance vehicle purchases primarily by non-prime customers, including those who have limited credit history, past credit problems, or low income. Such contracts generally have a higher risk of non-performance, and existingmay result in higher delinquencies and higher losses than contracts with customers who have higher credit ratings. UACC is currently experiencing increasing credit losses on its finance receivables, which has negatively impacted the fair value of our financial receivables and related revenues.increased the losses recognized during 2022 and 2023. Increasing credit losses negatively impacted our business during 2023 and we expect these credit

2918


losses to continue to negatively impact our business during 2024. Due to the wind-down of our ecommerce business, UACC has become our largest business and our results of operations and financial condition are increasingly vulnerable to adverse developments in UACC's business.

Until UACC sells automotive finance receivables, and to the extent it retains interests in those receivables after it sells them, whether pursuant to securitization transactions or otherwise, UACC is exposed to the risk that certain customers will be unable or unwilling to repay their retail installment sales contracts according to their terms and that the vehicle collateral securing the payment of those retail installment sales contracts may not be sufficient to ensure full repayment. Additionally, higher energy prices (including the price of gasoline) and other consumer prices, unstable real estate values, reset of adjustable-rate mortgages to higher interest rates, geopolitical tensions (including outbreaks of military hostilities such as the ongoing geopolitical conflicts and war in Europe and the Middle East), interest rate increases, regional bank failures, inflation and other factors can affect consumer confidence and disposable income. While credit losses are inherent in the automotive finance receivables market, these conditions can increase loss frequency and severity, decrease consumer demand for motor vehicles and weaken collateral values on certain types of motor vehicles in any period of extended economic slowdown or recession and could have a material adverse effect on our results of operations and financial condition. Because UACC focuses predominately on non-prime borrowers, the actual rates of delinquencies, defaults, repossessions and losses on its receivables are higher and more volatile than those experienced in the general motor vehicle finance industry and may be adversely affected to a greater extent during an economic downturn. In addition, caps on interest rates by individual states may limit UACC's ability to offset rising interest rates against automotive financing rates it offers to dealers.

UACC makes various assumptions and judgments about the automotive finance receivables it originates or purchases and may establish a valuation allowance and value beneficial ownership interests based on a number of factors. Although management may establish a valuation allowance and value beneficial ownership interests based on analysis it believes is appropriate, this may not be adequate, particularly in periods of increased industry-wide vehicle depreciation rates, which we are currently experiencing. For example, if economic conditions were to deteriorate unexpectedly, additional credit losses not incorporated in the existing valuation may occur. Several variables have affected UACC’s recent loss and delinquency rates, including general economic conditions and market interest rates, and such variables are likely to differ in the future. In particular, given the impact the COVID-19 pandemic had on the economy and individuals, including the associated stimulus programs, historical loss and delinquency expectations may not accurately predict the performance of UACC's receivables and impact its ability to effectively forecast loss rates. Losses in excess of expectations could have a material adverse effect on our results of operations and financial condition. Further, the rate of prepayments cannot be predicted and may be influenced by a variety of factors, including changes in the economic and social conditions of our borrowers.

UACC relies on its internally developed credit scoring systems to forecast loss rates of the automotive finance receivables it originates or purchases. If it relies on systems that fail to effectively forecast loss rates on receivables it originates or purchases, those receivables may suffer higher losses than expected. UACC’s credit scoring systems were developed prior to the onset of the COVID-19 pandemic and, accordingly, were not designed to take into account the effect of the economic, financial and social disruptions resulting from the pandemic, including the associated stimulus programs. Additionally, as noted above, we believe that the impact of the pandemic on the economy and individuals led to loss and delinquency expectations that may not accurately predict the performance of UACC's receivables.

UACC generally seeks to sell these receivables through securitization transactions. If the qualityreceivables it sells experience higher loss rates than forecasted, it may be unable to sell those receivables or may obtain less favorable pricing on the receivables it sells in the future and suffer reputational harm in the marketplace for the receivables it sells and its results of operations and financial condition may be adversely affected. If UACC holds receivables that it originates on its balance sheet until it sells them in securitization transactions or, in the future, through loan sales to its financing partners or other arrangements, then to the extent those receivables fail to perform during its holding period, they may become ineligible for sale.

If UACC’s dealers do not submit a sufficient number of suitable automobile contracts to UACC for purchase, its results of operations may be impaired.

UACC is dependent upon establishing and maintaining relationships with a large number of manufacturer-franchised and independent motor vehicle dealers to supply it with automobile contracts. During the years ended December 31, 2020 through 2023, no single dealer accounted for 1% or more of the automobile contracts UACC purchased, other than Vroom, through our customer experience,former ecommerce business, which accounted for approximately 22% of

19


UACC's automobile contracts in 2023. The agreements UACC has with dealers to purchase automobile contracts do not require dealers to submit a minimum number of automobile contracts for purchase. The failure of dealers to submit automobile contracts that meet UACC’s underwriting criteria could result in reductions in its revenues or the cash flows available to it, and, therefore, could have an adverse effect on UACC's and our reputationresults of operations.

As of December 31, 2023, automobile contracts originated from Vroom customers or our brand were negatively affected,purchased from Vroom represented approximately 30% of UACC's total serviced loan portfolio. If UACC is unable to replace the volume of automobile contracts it previously received from Vroom's ecommerce business, our business, salesfinancial condition, and results of operations could be materially and adversely affected.

Our business model is primarily based

If UACC loses servicing rights on its automobile contracts, our ability to enable consumers to buy and sell used vehicles through our ecommerce platform in a seamless, transparent and hassle-free transaction. If consumers fail to perceive us as a trusted brand with a strong reputation and high standards, or if an event occurs that damages our reputation, it could adversely affect customer demand and have a material adverse effect on our business, revenues and results of operations. Evenoperations would be impaired.

UACC is entitled to receive servicing fees only when it acts as servicer under the perceptionapplicable sale and servicing agreements governing its Warehouse Credit Facilities and securitizations. Under such agreements, UACC may be terminated as servicer upon the occurrence of a decrease in certain events, including:

its failure to observe and perform its duties and responsibilities and comply with other covenants;
certain bankruptcy events; and
the qualityoccurrence of our customer experience or brand could impact results. Our high ratecertain events of growth makes maintainingdefault under the qualitydocuments governing the facilities.

The loss of our customer experience more difficult, and we have encountered operational challenges in keeping up with our rapid growth over the past year. Backlogs in our business developed as there was more sales volume than we had the capacity to process, resulting in delays that degraded the customer experience.

Complaints or negative publicity about our business practices, marketing and advertising campaigns, vehicle quality, customer service, delivery experience, compliance with applicable laws and regulations, data privacy and security or other aspects of our business, including on consumer platforms such as the Better Business Bureau, consumer facing blogs and social media websites, could diminish consumer confidence in our platform and adversely affect our brand. The growing use of social media increases the speed with which information and opinions can be shared and thus the speed with which our reputation can be damaged. If we fail to deliver the desired customer experience, or fail to correct or mitigate misinformation or negative information about us, our platform, our vehicle inventory, our customer experience, our brand or any aspect of our business, including information spread through social media or traditional media channels, itservicing rights could materially and adversely affect our business,results of operations, financial condition and cash flows.

Risk retention rules may limit UACC’s liquidity and increase UACC’s capital requirements.

Securitizations of automobile receivables are subject to risk retention rules under Federal law, which generally require that sponsors of asset-backed securities (ABS), such as UACC, retain no less than five percent of the credit risk of the assets collateralizing the ABS issuance. The rules also set forth prohibitions on transferring or hedging the credit risk that the sponsor is required to retain. Because the rules place an upper limit on the degree to which UACC may use financial leverage, its securitization structures may require more capital, or may release less cash, than might be the case in the absence of such rules.

UACC may be unable to continue to access or renew funding sources and obtain capital needed to maintain and grow its business.

UACC uses debt financing to maintain and grow its business. It currently utilizes its Warehouse Credit Facilities and securitizations to fund its liquidity needs. We cannot guarantee that the Warehouse Credit Facilities will continue to be available beyond their current maturity dates, on acceptable terms, or at all, or that UACC will be able to obtain additional financing on acceptable terms or at all. The availability of additional financing will depend on a variety of factors such as market conditions, the general availability of credit, the losses incurred in UACC's loan portfolio, UACC’s financial position, its results of operations, and the capacity for additional borrowing under its existing financing arrangements. If UACC’s various financing alternatives were to become limited or unavailable, it may be unable to maintain or grow loan volume at the level that we anticipate and our financial condition and results of operations.operations could be materially adversely affected.

Risks Related to Cybersecurity and Privacy

An actual or perceived failure to maintain the security of personal information and other customer data that we collect, store, process, and use could harm our business, financial condition and results of operations.

We and certain of our third-party providers collect, store,maintain and process data about current and use personalprospective customers, employees, business partners and others, including personally identifiable information, as well as proprietary information belonging to our business such as trade secrets (collectively, "Confidential Information"). We rely on computer systems, hardware, software, technology infrastructure and other customer data,online sites and networks for both internal and external operations that are critical to our business (collectively, "IT Systems"). We own and manage some of these IT Systems but also rely in part on third parties that are not directly under our control including our third-party customer experience teams, to manage certain areas of these operations. For example, we rely on encryption, storage, and processing technology developed by third parties to securely transmit, operate on and store such information. Successful cyberattacks that disrupt or result in unauthorized access to third party

20


IT Systems can materially impact our operation and financial results. Due to the volume and sensitivity of the personal information and data we and these third parties manage and expect to manage in the future, as well as the nature of our customer base, the security features of our information systems are critical. Any failure or perceived failure by us or by third parties who access our IT Systems and/or Confidential Information to maintain the security of personal and other data that is provided to us by customers, employees and vendors could harm our reputation and brand and expose us to a risk of loss or litigation and possible liability, any of which could adversely affect our business, financial condition, and results of operations. While we employ a number of security measures designed to protect the security of our IT Systems and Confidential Information, there can be no assurance that our cybersecurity risk management program and processes, including our policies, controls or procedures, and of third parties we rely on will be fully implemented, complied with our effective in protecting our IT Systems and Confidential Information.

Additionally, concerns about our practices with regard to the collection, use or disclosure of personal information or other privacy-related matters, even if unfounded, could harm our business, financial condition and results of operations. We are subject to numerous federal, state and local laws, regulations and regulationsindustry standards regarding privacy, cybersecurity and the collection, use, disclosure and disclosure orother processing of personal information and other data. The scope and interpretation of these laws continue to evolve and may be inconsistent across jurisdictions. New laws also may be enacted. See "Failure to comply with federal, state and local laws and regulations relating to privacy, data protection and consumer protection, or the expansion of current or the enactment of new laws or regulations relating to privacy, data protection and consumer protection, as well as our actual or perceived failure to protect such information could harm our reputation and could adversely affect our business, financial condition and results of operations." Further, we are subject to contractual requirements and others’ privacy policies that govern how we use and protect personal information and other data. These obligations may be interpreted and applied inconsistently and may conflict with other rules or our practices. Any failure or perceived failure by us to comply with our privacy policies or obligations may result in governmental enforcement actions, litigation or negative publicity that could have an adverse effect on our business. If our third-party service providers violate applicable laws, contractual obligations or our policies, then such violations also may put consumer, employee and vendor information at risk and could, in turn, harm our reputation, business and operating results. We carry out ongoing efforts to implement a number of security controls to mitigate these risks.  

If we or our third-party providers sustain cyber-attacks or other privacy or data security incidents that result in security breaches, we could suffer a loss of sales and increased costs, exposure to significant liability, reputational harm and other negative consequences.

Threat actors are increasingly sophisticated and can operate large-scale complex automated attacks. Similar to most IT systems and companies, there iswe face a consistent threat from cyber-attacks, viruses, malicious software, physical break-ins, theft, ransomware, phishing, social engineering, unintentional employee error or malfeasance, system availability, and other security breaches. Further, third-party hosts or service providers are also a source of security concerns as it relates to failures of their own security systems and infrastructure. Our technology infrastructure may be

30


Table of Contents

subject to increased risk of slowdown or interruption as a result of integration with third-party services, including cloud services, and/or failures by such third parties, which are beyond our control. The costs to eliminate or address evolving security threats and vulnerabilities before or after a cyber-incident could be significant. Our remediation efforts may not be successful and could result in interruptions, delays or cessation of service and loss of existing or potential suppliers or players.players, any of which could lead to negative reputational impacts.

Although we have insurance coverage for losses associated with cyber-attacks, as with all insurance policies, there are coverage exclusions and limitations, and our coverage may not be sufficient to cover all possible claims, and we may still suffer losses that could have a material adverse effect on our business, including reputational damage. We also could be negatively impacted by existing and proposed U.S. laws and regulations, and government policies and practices related to cybersecurity, data privacy, and data localization. In the event that we or our service providers are unable to prevent, detect, and remediate the foregoing security threats and risks, our operations could be disrupted or we could incur financial, legal or reputational losses arising from misappropriation, misuse, leakage, falsification or intentional or accidental release or loss of information maintained in our information systems and networks, including personal information of our employees and our customers.

Risks Related to Our Industry and General Economic Conditions

Our business is sensitive to changes in the prices of new and used vehicles.

Any significant changes in retail prices for new or used vehicles could have a material adverse effect on our business, financial condition and results of operations. For example, if retail prices for used vehicles rise relative to retail prices for new vehicles, it could make buying a new vehicle more attractive to our customers than buying a used vehicle, which could have a material adverse effect on our business, financial condition and results of operations and could result in reduced vehicle sales and lower revenue. Additionally, manufacturer incentives, including financing, could contribute to narrowing the price gap between new and used vehicles.21

Used vehicle prices also may decline due to an increased number of new vehicle lease returns over the next several years. In addition, rental car company bankruptcies may cause a broader disruption in the used vehicle market and adversely impact used vehicle prices. While lower used vehicle prices reduce our cost of acquiring new inventory, lower prices could also lead to reductions in the value of inventory we currently hold, which could have a negative impact on gross profit. Moreover, any significant changes in retail prices due to scarcity or competition for used vehicles could impact our ability to source desirable inventory for our customers, which could have a material adverse effect on our results of operations and could result in fewer used-car sales and lower revenue. Furthermore, any significant changes in wholesale prices for used vehicles could have a negative impact on our results of operations by reducing wholesale margins.

Our business is dependent upon access to desirable vehicle inventory. Obstacles to acquiring attractive inventory, whether because of supply, competition or other factors, may have a material adverse effect on our business, financial condition and results of operations.

We acquire vehicles for sale from auctions, consumers, rental car companies, OEMs and dealers. There can be no assurance that the supply of desirable used vehicles will be sufficient to meet our needs. In addition, we purchase a significant amount of our inventory from one third-party auction source, which accounted for approximately 26% of our inventory sourcing for the year ended December 31, 2020. If this third party is unable to fulfill our inventory needs or if we are unable to source desirable used vehicles from alternative third-party providers, we may lack sufficient inventory and, as a result, may lose potential and existing customers and related revenues. Moreover, we sell consumer-sourced vehicles that do not meet our retail standards to auctions, which may result in lower revenues and also could lead to reductions in our available inventory.

Additionally, we appraise thousands of consumer vehicles daily and evaluate potential purchases based on mechanical soundness, consumer desirability and relative value in relation to retail inventory or wholesale disposition. If we fail to adjust appraisal offers to stay in line with broader market trade-in offer trends or fail to recognize those trends, it could adversely affect our ability to acquire inventory. Our ability to source vehicles through our appraisal process also could be affected by competition, both from new and used vehicle dealers directly and through third-party websites driving appraisal traffic to those dealers. In addition, we remain dependent on third parties to sell us used vehicles, and there can be no assurance of an adequate supply of desirable vehicles on terms that are attractive to us. A reduction in the availability of or access to sources of inventory for any reason could have a material adverse effect on our business, financial condition and results of operations.

31


Table of Contents

Our business is dependent upon our ability to expeditiously sell inventory. Failure to expeditiously sell our inventory could have a material adverse effect on our business, financial condition and results of operations.

Sourcing of our used vehicle inventory is based in large part on projected demand. If actual sales are materially less than our forecasts, we would experience an over-supply of used vehicle inventory. An over-supply of used vehicle inventory will generally cause downward pressure on our vehicle sales prices and margins and decrease inventory sales velocity. Vehicles depreciate rapidly, so a failure to expeditiously sell our inventory or to efficiently recondition and deliver vehicles to customers could hurt our gross profit per unit and materially and adversely affect our business, financial condition and results of operations. The rate at which customers return vehicles increased in recent periods. In the years ended December 31, 2020 and December 31, 2019, we had approximately 5.1% and 4.8%, respectively, in total vehicle returns and approximately 4.0% and 3.7%, respectively, in vehicle returns net of vehicle swaps. There is no assurance these rates will remain similar to our historical levels. Vehicles returned continue to depreciate in value and if return rates continue to increase, our revenue, business, financial condition and results of operations could be materially and adversely affected.

Used vehicle inventory has typically represented a significant portion of our total assets. Having such a large portion of our total assets in the form of used vehicle inventory for an extended period of time subjects us to write-downs and other risks that affect our results of operations. Accordingly, if we have excess inventory, if we are unable to ship and deliver vehicles efficiently or if our inventory sales velocity decreases, we may be unable to liquidate such inventory at prices that would allow us to meet unit economics targets or to recover our costs, which could have a material adverse effect on our business, financial condition and results of operations.

We participate in a highly competitive industry, and pressure from existing and new companies may adversely affect our business and results of operations.

Our current and future competitors may include:

traditional new and used car dealerships;

large, national car dealers, such as CarMax and AutoNation, which are expanding into online sales, including “omni-channel” offerings;

used car dealers or marketplaces that currently have existing ecommerce businesses or online platforms, such as Carvana;

the peer-to-peer market, utilizing sites such as Facebook, Craigslist.com, eBay Motors and Nextdoor.com; and

sales by rental car companies directly to consumers of used vehicles which were previously utilized in rental fleets, such as Enterprise Car Sales.

Internet and online automotive sites could change their models to directly compete with us, such as Google, Amazon, AutoTrader.com, Edmunds.com, KBB.com, Autobytel.com, TrueCar.com, CarGurus and Cars.com. In addition, automobile manufacturers such as General Motors, Ford and Volkswagen could change their sales models to better compete with our model through technology and infrastructure investments. While such enterprises may change their business models and endeavor to compete with us, the purchase and sale of used vehicles through ecommerce presents unique challenges.

Our competitors also compete in the online market through companies that provide listings, information, lead generation and car buying services designed to reach customers and enable dealers to reach these customers and providers of offline, membership-based car buying services such as the Costco Auto Program.

We also expect that new competitors will continue to enter the traditional and ecommerce automotive retail industry with competing brands, business models and products and services, which could have an adverse effect on our revenue, business and financial results. For example, traditional car dealers could transition their selling efforts to the internet, allowing them to sell vehicles across state lines and compete directly with our online offering and no-negotiating pricing model.

Our current and potential competitors may have significantly greater financial, technical, marketing and other resources than we have, and the ability to devote greater resources to the development, promotion and support of their businesses, platforms, and related products and services. Additionally, they may have more extensive automotive industry relationships, longer operating histories and greater name recognition than we have. As a result, these competitors may be able to respond more quickly to consumer needs with new technologies and to undertake more extensive marketing or promotional campaigns. If we are unable to compete with these companies, the demand for our used vehicles and value-added products could substantially decline.

32


Table of Contents

In addition, if one or more of our competitors were to merge or partner with another of our competitors, the change in the competitive landscape could adversely affect our ability to compete effectively. We may not be able to compete successfully against current or future competitors, and competitive pressures may harm our business, financial condition and results of operations. Furthermore, if our competitors develop business models, products or services with similar or superior functionality to our platform, it may adversely affect our business. Additionally, our competitors could use their political influence and increase lobbying efforts to encourage new regulations or interpretations of existing regulations that would prevent us from operating in certain markets.

Changes in the auto industry may threaten our business model if we are unable to adapt.

The market for used vehicles may be impacted by the significant, and likely accelerating, changes to the broader automotive industry, which may render our existing or future business model or our ability to sell vehicles, products and services less competitive, unmarketable or obsolete. For example, technology is currently being developed to produce automated, driverless vehicles that could reduce the demand for, or replace, traditional vehicles, including the used vehicles that we acquire and sell. Additionally, ride-hailing and ride-sharing services are becoming increasingly popular as a means of transportation and may decrease consumer demand for the used vehicles we sell, particularly as urbanization increases. Furthermore, new technologies such as autonomous driving software have the potential to change the dynamics of car ownership in the future. If we are unable to or otherwise fail to successfully adapt to such industry changes, our business, financial condition and results of operations could be materially and adversely affected.

Prospective purchasers of vehicles may choose not to shop online, which would prevent us from growing our business.

Our success will depend, in part, on our ability to attract additional customers who have historically purchased vehicles through traditional dealers. The online market for vehicles is significantly less developed than the online market for other goods and services such as books, music, travel and other consumer products. If this market does not gain widespread acceptance, our business may suffer. Furthermore, we may have to incur significantly higher and more sustained advertising and promotional expenditures or offer more incentives than we currently anticipate in order to attract additional consumers to our platform and convert them into purchasing customers. Specific factors that could prevent consumers from purchasing vehicles through our ecommerce platform include:

concerns about buying vehicles without face-to-face interaction with sales personnel and the ability to physically test-drive and examine vehicles;

preference for a more personal experience when purchasing vehicles;

insufficient level of desirable inventory;

pricing that does not meet consumer expectations;

delayed deliveries;

inconvenience with returning or exchanging vehicles purchased online;

concerns about the security of online transactions and the privacy of personal information; and

usability, functionality and features of our platform.

If the online market for vehicles does not continue to develop and grow, our business will not grow and our business, financial condition and results of operations could be materially and adversely affected.

General business and economic conditions, and risks related to the larger automotive ecosystem, including consumer demand, could reduce our sales and profitability, which could have a material adverse effect on our business, financial condition and results of operations.

Our business is affected by general business and economic conditions. The global economy often experiences periods of instability, and this volatility may result in reduced demand for our vehicles and value-added products, reduced spending on vehicles, inability of customers to obtain credit to finance purchases of vehicles and decreased consumer confidence to make discretionary purchases. Consumer purchases of new and used vehicles generally decline during recessionary periods and other periods in which disposable income is adversely affected.

Purchases of new and used vehicles are typically discretionary for consumers and have been, and may continue to be, affected by negative trends in the economy and other factors, including rising interest rates, the cost of energy and gasoline, the availability and cost of consumer credit, reductions in consumer confidence and fears of recession, stock

33


Table of Contents

market volatility, increased regulation and increased unemployment. Increased environmental regulation has made, and may in the future make, used vehicles more expensive and less desirable for consumers.

In addition, changing trends in consumer tastes, negative business and economic conditions and market volatility may make it difficult for us to accurately forecast vehicle demand trends, which could cause us to increase our inventory carrying costs and could materially and adversely affect our business, financial condition and results of operations.

Our business is sensitive to conditions affecting automotive manufacturers, including manufacturer recalls.

Adverse conditions affecting one or more automotive manufacturers could have a material adverse effect on our business, financial condition and results of operations and could impact our supply of used vehicles. In addition, manufacturer recalls are a common occurrence that have accelerated in frequency and scope in recent years. In the instance of an open recall, we may have to temporarily remove vehicles from inventory and may be unable to liquidate such inventory in a timely manner or at all. Because we do not have manufacturer authorization to complete recall-related repairs, some vehicles we sell may have unrepaired safety recalls. Such recalls, and our lack of authorization to make recall-related repairs or potential unavailability of parts needed to make such repairs, could (i) adversely affect used vehicle sales or valuations, (ii) cause us to temporarily remove vehicles from inventory, (iii) cause us to sell any affected vehicles at a loss, (iv) force us to incur increased costs and (v) expose us to litigation and adverse publicity related to the sale of recalled vehicles, which could have a material adverse effect on our business, financial condition and results of operations.

Risks Related to Laws and Regulations

We operate in a highly regulated industry and are subject to a wide range of federal, state and local laws and regulations. Failure to comply with these laws and regulations could have a material adverse effect on our business, financial condition and results of operations.

Our business is and will continue to be subject to extensive U.S. federal, state and local laws and regulations. The advertising, sale, purchase, financing and transportation of used vehicles are regulated by every state in which we operate and by the U.S. federal government. The titling and registration of vehicles and the sale of value-added products also are regulated by state laws, and such laws can vary significantly from state to state. Regulations governing the used vehicle industry generally do not contemplate our ecommerce business model. In addition, we are subject to regulations and laws specifically governing the internet and ecommerce and the collection, storage and use of personal information and other customer data. We are also subject to federal and state consumer protection laws, including the Equal Credit Opportunity Act and prohibitions against unfair or deceptive acts or practices. The federal governmental agencies that regulate our business and have the authority to enforce such regulations and laws against us include the U.S. Federal Trade Commission, the U.S. Department of Transportation (“DOT”), the U.S. Occupational Health and Safety Administration, the U.S. Department of Justice and the U.S. Federal Communications Commission. Additionally, we are subject to regulation by individual state dealer licensing authorities, state consumer protection agencies and state financial regulatory agencies. We also are subject to audit by such state regulatory authorities.

State dealer licensing authorities regulate the purchase and sale of used vehicles by dealers within their respective states. The applicability of these regulatory and legal compliance obligations to our ecommerce business is dependent on evolving interpretations of these laws and regulations and how our operations are, or are not, subject to them. We are licensed as a dealer in the States of Texas and Florida and all of our vehicle transactions are conducted under our Texas and Florida licenses. We believe that our activities in other states are not subject to their vehicle dealer licensing laws; however, regulators in such states could seek to require us to maintain a used vehicle dealer license in order to engage in activities in that state.

Most states regulate retail installment sales, including setting a maximum interest rate, caps on certain fees or maximum amounts financed. In addition, certain states require that retail installment sellers file a notice or registration document or have a sales finance license or an installment sellers license in order to solicit or originate installment sales in that state. We have obtained a motor vehicle sales finance license in Texas in connection with our Texas dealer license, and we have obtained a retail installment seller license in Florida in connection with our Florida dealer license. The financial regulatory agency in Pennsylvania determined that we need to obtain an installment seller license in order to enter into retail installment sales with residents of Pennsylvania. As a result, we are not currently offering third-party financing to our customers in Pennsylvania, who must obtain independent financing to the extent needed to fund any vehicle purchases on our platform. We recently obtained a Pennsylvania installment seller license and expect to resume offering financing to Pennsylvania customers in the future.

Any failure to renew or maintain any of the foregoing licenses would materially and adversely affect our business, financial condition and results of operations. Many aspects of our business are subject to regulatory regimes at the state and local level, and we may not have all licenses required to conduct business in every jurisdiction in which we operate.

34


Table of Contents

Despite our belief that we are not subject to certain licensing requirements of those state and local jurisdictions, regulators may seek to impose punitive fines for operating without a license or demand we seek a license in those state and local jurisdictions, any of which may inhibit our ability to do business in those state and local jurisdictions, increase our operating expenses and adversely affect our business, financial condition and results of operations.

Our proprietary logistics operations are subject to regulation by the DOT and by the states through which our vehicles travel. Transport vehicle dimensions, transport vehicle conditions, driver motor vehicle record history, driver alcohol and drug testing, and driver hours of service are also subject to both federal and state regulation. More restrictive limitations on vehicle weight and size, condition, trailer length and configuration, methods of measurement, driver qualifications, or driver hours of service would increase our operating expenses and may adversely affect our financial condition, operating results, and cash flows. If we fail to comply with the DOT regulations or if those regulations become more stringent, we could be subject to increased inspections, audits, or compliance burdens. Regulatory authorities could take remedial action including imposing fines, suspending, or shutting down our transportation operations. If any of these events occur, our business, financial condition and results of operations would be adversely affected.

In addition to these laws and regulations that apply specifically to the sale and financing of used vehicles and logistics, our facilities and business operations are subject to laws and regulations relating to environmental protection, occupational health and safety, and other broadly applicable business regulations. We also are subject to laws and regulations involving taxes, tariffs, privacy and data security, anti-spam, pricing, content protection, electronic contracts and communications, mobile communications, consumer protection, information reporting requirements, unencumbered internet access to our platform, the design and operation of websites and internet neutrality.

We are also subject to laws and regulations affecting public companies, including securities laws and Nasdaq listing rules. The violation of any of these laws or regulations could result in administrative, civil or criminal penalties or in a cease-and-desist order against our business operations, any of which could damage our reputation and have a material adverse effect on our business, financial condition and results of operations. We have incurred and will continue to incur capital and operating expenses and other costs to comply with these laws and regulations.

Additionally, we are subject to Federal, State and local laws and regulations and other government actions related to the COVID-19 pandemic.

The foregoing description of laws and regulations to which we are or may be subject is not exhaustive, and the regulatory framework governing our operations is subject to evolving interpretations and continuous change. The enactment of new laws and regulations or the interpretation of existing laws and regulations in an unfavorable way may affect the operation of our business, directly or indirectly, which could result in substantial regulatory compliance costs, civil or criminal penalties, including fines, adverse publicity, decreased revenues, and increased expenses.

Failure to comply with federal, state and local laws and regulations relating to privacy, data protection and consumer protection, or the expansion of current or the enactment of new laws or regulations relating to privacy, data protection and consumer protection, as well as our actual or perceived failure to protect such information could harm our reputation and could adversely affect our business, financial condition and results of operations.

There are numerous federal, state and local laws regarding privacy and the collection, processing, storing, sharing, disclosing, using and protecting of personal information and other data, the scope of which are changing, subject to differing interpretations, and which may be costly to comply with, inconsistent between jurisdictions or conflicting with other rules. We are also subject to specific contractual requirements contained in third-party agreements governing our use and protection of personal information and other data. We generally comply with industry standards and are subject to the terms of our privacy policies and the privacy- and security-related obligations to third parties. We strive to comply with applicable laws, policies, legal obligations and industry codes of conduct relating to privacy and data protection, to the extent possible. However, it is possible that these obligations may be interpreted and applied in new ways or in a manner that is inconsistent from one jurisdiction to another and may conflict with other rules or our practices. Additionally, new regulations could be enacted with which we are not familiar. Any failure or perceived failure by us to comply with our privacy policies, our privacy-related obligations to customers or other third parties, or our privacy-related legal obligations or any compromise of security that results in the unauthorized release or transfer of sensitive information, which may include personally identifiable information or other customer data, may result in governmental enforcement actions, litigation or public statements against us by consumer advocacy groups or others and could cause customers, vendors and third-party business partners to lose trust in us, which could have a material adverse effect on our business, financial condition and results of operations. Additionally, if vendors, developers or other third parties that we work with violate applicable laws or our policies, such violations may also put customers’, vendors’ or receivables-purchasers’ information at risk and could in turn harm our business, financial condition and results of operations.

35


Table of Contents

We expect that new industry standards, laws and regulations will continue to be proposeddevelop regarding privacy, data protection, and information security and artificial intelligence in many jurisdictions, including the California Consumer Privacy Act (the “CCPA”), which went into effect on January 1, 2020. We cannot yet determine the impact of the CCPA or such future laws, regulations and standards may have on our business.jurisdictions. Complying with these evolving obligations is costly. For instance, expanding definitions and interpretations of what constitutes “personal data” (or the equivalent) within the United States may increase our compliance costs and legal liability. Additionally, the California Privacy Rights Act (“CPRA”), recently passed in California. The CPRA significantly amends the CCPA, and imposes additionalhas created a new data protection obligations on covered companies doing business in California, including additional consumer rights processesagency, and opt outs for certain uses of sensitive data. It also creates a new California data protection agencyother states may do the same, specifically tasked to enforce the law,California privacy laws, which would likely result in increased regulatory scrutiny of California businesses in the areas of data protection and security. The substantive requirements for businesses subject to the CPRA will go into effect on January 1, 2023, and become enforceable on July 1, 2023.

A significant data breach or any failure, or perceived failure, by us to comply with any federal, state or local privacy or consumer protection-related laws, regulations or other principles or orders to which we may be subject or other legal obligations relating to privacy or consumer protection could adversely affect our reputation, brand and business, and may result in claims, investigations, proceedings or actions against us by governmental entities or others or other penalties or liabilities or require us to change our operations and/or cease using certain data sets. Depending on the nature of the information compromised, we may also have obligations to notify users, law enforcement or payment companies about the incident and may need to provide some form of remedy, such as refunds, for the individuals affected by the incident.

Risks Related to Our Industry and General Economic Conditions

Our businesses participate in highly competitive industries, and pressure from existing and new companies may adversely affect our business and results of operations.

The automobile financing business is large and highly competitive. UACC competes with a number of national, regional and local finance companies, banks, credit unions, fintech companies, and captive finance companies. Many of these companies are much larger and have greater financial resources than UACC, including greater access to capital markets for debt instruments or access to lower cost deposit bases. These funding sources may be unavailable to UACC. Many of these companies also have long-standing relationships with automobile dealers and may provide other financing to dealers, including floor plan financing for the dealers' purchases of automobiles from manufacturers and auctions, which we do not offer. There can be no assurance that we will be able to continue to compete successfully and, as a result, we may not be able to purchase automobile contracts from dealers at a price acceptable to us, which could result in reductions in our revenues or the cash flows available to us. Additionally, if UACC is unsuccessful in maintaining and growing its dealer network, our results of operations, cash flows, and financial condition may be adversely affected.

The automotive data and service business is large and very competitive. CarStory competes with a number of companies in the automotive industry, including valuation services, VIN data providers, website marketplaces, inventory

22


aggregators, and retail e-commerce platforms. Some of these companies are significantly larger with well-established sales and marketing teams. We compete with other companies to attract customers to our marketplace and dealers to our digital solutions. If we are unable to grow CarStory's marketplace and customer base, our results of operations, cash flows, and financial condition may be adversely affected.

General business and economic conditions, and risks related to the larger automotive ecosystem, including consumer demand, could reduce our sales and profitability, which could have a material adverse effect on our business, financial condition and results of operations.

Our business is affected by general business and economic conditions. The global economy often experiences periods of instability, and this volatility may lead to high unemployment and a lack of available credit, which may in turn lead to increased delinquencies, defaults, repossessions and losses on motor vehicle contracts financed through UACC and could materially and adversely affect our business, financial condition and results of operations.

Purchases of new and used vehicles are typically discretionary for consumers and have been, and may continue to be, affected by negative trends in the economy and other factors, including inflation and rising interest rates, the cost of energy and gasoline, the availability and cost of consumer credit, reductions in consumer confidence and fears of recession, stock market volatility, increased regulation and increased unemployment. The current inflationary environment has led to both overall price increases and pronounced price increases in certain sectors, including gasoline prices. Moreover, the Federal Reserve’s efforts to tame inflation have led to, and may continue to lead to, increased interest rates, which affects automotive finance rates, making vehicle financing more costly and less accessible to many consumers. Additionally, increased environmental regulation has made, and may in the future make, used vehicles more expensive and less desirable for consumers.

Risks Related to Laws and Regulations

We operate in a highly regulated industry and are subject to a wide range of federal, state and local laws and regulations. Failure to comply with these laws and regulations could have a material adverse effect on our business, financial condition and results of operations.

Our businesses are and will continue to be subject to extensive U.S. federal, state and local laws and regulations. The financing of motor vehicles is regulated by every state in which we operate and by the U.S. federal government. Our prior ecommerce business, including the advertising and sale of used vehicles, titling and registration of vehicles, and the sale of value-added products, also was regulated by state laws, and such state laws can vary significantly from state to state. In addition, we are subject to regulations and laws specifically governing the internet and ecommerce and the collection, storage and use of personal information and other customer data. We are also subject to federal and state consumer protection laws, including prohibitions against unfair or deceptive acts or practices. The federal governmental agencies that regulate our business and have the authority to enforce such regulations and laws against us include agencies such as the U.S. Federal Trade Commission ("FTC"), the U.S. Consumer Financial Protection Bureau ("CFPB"), the U.S. Occupational Health and Safety Administration, the U.S. Department of Justice and the U.S. Federal Communications Commission ("FCC"). Additionally, we are subject to regulation by state consumer protection agencies and state financial regulatory agencies.

In our prior ecommerce business, we have been subject to audits, requests for information, investigations and other inquiries from our regulators related to customer complaints. As we encountered operational challenges in keeping up with our rapid growth from 2020 through the first quarter of 2022, we experienced an increase in customer complaints, leading to an increase in such regulatory inquiries. We endeavored to promptly respond to any such inquiries and cooperate with our regulators. However, we have incurred fines in certain states and in April 2022, the Attorney General of Texas filed a lawsuit on behalf of the State of Texas in the District Court of Travis County, Texas against the Company, alleging violation of the Texas Deceptive Trade Practices − Consumer Protection Act and Texas Business and Commerce Code § 17.41 et seq. In December 2023, Vroom, Inc., Vroom Automotive, LLC and the Attorney General of the State of Texas reached a final agreement to resolve all claims in the petition, without any admission of wrongdoing by either Vroom entity. Under the agreement, the Company will pay a total of $2 million in civil penalties and $1 million in attorneys' fees, with the first half due in September 2024 and the remaining half due in September 2025, and abide permanently by an injunction of certain operational practices that were previously implemented. The agreement was approved by the District Court of Travis County on December 13, 2023. See Part II, Item 1 – “Legal Proceedings.”

23


In addition, In January 2022, the Company received a non-public civil investigative demand from the Federal Trade Commission (“FTC”), seeking the production of information related to certain of the Company's business practices and the Company responded to those information requests. On February 23, 2024, the FTC notified the Company that it has reason to believe that the Company violated Section 5(a) of the Federal Trade Commission Act, 15 U.S.C. § 45(a); the FTC's Mail, Internet, or Telephone Order Merchandise Rule, 16 C.F.R. Part 435; the FTC’s Used Motor Vehicle Trade Regulation Rule,16 C.F.R. Part 455; and the FTC’s Pre-Sale Availability Rule, 16 C.F.R. Part 702. The FTC advised the Company that it is authorized to negotiate a stipulated order and the Company intends to work cooperatively with the FTC towards a resolution. Because the matter is at an early stage and the outcome of any complex legal proceeding is inherently unpredictable and subject to significant uncertainties, the Company cannot determine at present whether any potential liability would have a material adverse effect on the Company’s financial condition, cash flows, or results of operations.

In relation to our prior ecommerce business, we have been licensed as a dealer in the states of Texas, Florida, Arizona, California, Ohio and Wisconsin. We also have a motor vehicle sales finance license in Texas in connection with our Texas dealer license, a retail installment seller license in Florida in connection with our Florida dealer license, a retail installment seller license in Pennsylvania, and filed the required notice in Arizona in connection with our Arizona dealer license. As a result of the wind-down of the ecommerce business and discontinuance of our used automotive dealer operations, we are terminating the foregoing licenses once all transactions, including title and registration transactions on behalf of our customers, are completed in the relevant jurisdiction.

UACC's financing operations are subject to U.S. federal, state, and local laws and regulations regarding contract origination, acquiring motor vehicle installment sales contracts from retail sellers, furnishing data to credit reporting agencies, servicing, debt collection practices, and securitization transactions. Certain states require UACC to have a sales finance license, consumer credit license, or similar applicable license. UACC has obtained licenses in all states where licensing is required. In addition, UACC is subject to enforcement by the CFPB and state consumer protection agencies, including state attorney general offices and state financial regulatory agencies. Any failure to renew or maintain or any revocation of any of UACC's licenses would materially and adversely affect our business, financial condition and results of operations.

In addition to these laws and regulations that apply specifically to the sale and financing of used vehicles, our facilities and business operations are subject to laws and regulations relating to environmental protection, occupational health and safety, and other broadly applicable business regulations. We also are subject to laws and regulations involving taxes, tariffs, privacy and data security, anti-spam, pricing, content protection, electronic contracts and communications, mobile communications, consumer protection, information reporting requirements, unencumbered internet access to our platform, the design and operation of websites and internet neutrality.

We are also subject to laws and regulations affecting public companies, including securities laws and Nasdaq listing rules. The violation of any of these laws or regulations could result in administrative, civil or criminal penalties or in a cease-and-desist order against our business operations, any of which could damage our reputation and have a material adverse effect on our business, financial condition and results of operations. We have incurred and will continue to incur capital and operating expenses and other costs to comply with these laws and regulations.

The foregoing description of laws and regulations to which we are or may be subject is not exhaustive, and the regulatory framework governing our operations is subject to evolving interpretations and continuous change. The enactment of new laws and regulations or the interpretation of existing laws and regulations in an unfavorable way may affect the operation of our business, directly or indirectly, which could result in substantial regulatory compliance costs, civil or criminal penalties, including fines, adverse publicity, decreased revenues, and increased expenses.

If we fail to comply with the Telephone Consumer Protection Act, we may face significant damages, which could harm our business, financial condition and results of operations.

We utilizeutilized telephone calls as a means of responding to and marketing tocommunicating with our Vroom ecommerce customers interested in purchasing, trading in and/or selling vehicles and value-added products, and intend to implement the use of texting as a means of communication with our customers. We generate leads fromproducts. Potential customers could submit their contact information, including phone number, via our website and online advertising by prompting potential customersor third-party listing sites to provide their phone numbers so that we can contact them in response toexpress their interest in selling a vehicle, purchasing a vehicle, trading inselling a vehicle, or obtaining financing terms. We currently engage aengaged third-party customer experience centercenters to facilitate substantially all telephonerespond to certain of these inquiries and further communicate with potential customers concerning sales, purchases and financings of our vehicles through our platform. We also sent text messages to customers concerning the status of their order. As we wind-down our ecommerce operations, we will continue to communicate with

24


customers through telephone calls and text messages as needed. Our UACC business utilizes telephone calls and text messages as a means of responding to and communicating with customers who finance their vehicle purchase from automobile dealers through UACC, including communications relating to collections. Our CarStory business collects consent to contact consumers by telephone calls or text messages via its vehicles listing sites and shares such consent with CarStory’s business partners.

The Telephone Consumer Protection Act (the “TCPA”), as interpreted and implemented by the Federal Communication Commission (the “FCC”)FCC and U.S. courts, imposes significant restrictions on the use of autodialed telephone calls, pre-recorded messages, and text messages to residential and mobile telephone numbers as a means of communication when prior consent of the person being contacted has not been obtained. Currently, our third-party customer experience center utilizes automated telephone dialing systems to dial phone numbers of potential customers who have requested that we contact them by providing their phone number to us through our website and through third-party aggregation websites. Our telephone marketing activities, such as these, must comply with the TCPA and the Telephone Sales Rule (the “TSR”). The TCPA prohibits the use of automatic telephone dialing systems for communications with wireless phone numbers without express consent of the consumer, and the TSR established the Do Not Call Registry. Although it is possible that decisions of other appellate courts could further change the standards of conduct applicable to the use of automated telephone dialing systems, at present obtaining appropriate consent for auto-dialed calls and properly managing revocations of consent must comply with the standard of conduct announced in the ACA Ruling. Violations of the TCPA may be enforced by the FCC or by individuals through litigation, including class actions. Statutory penalties for TCPA violations range from $500 to $1,500 per violation, which has been interpreted to mean per phone call.call or text message. In addition, several states have enacted their own versions of the TCPA.

In September 2016, an individual brought a putative class action against us under the TCPA alleging we violated the TCPA by sending him a single text message expressing interest in purchasing a vehicle he listed for sale online. The court granted summary judgment in our favor and, following the plaintiff’s appeal, the parties resolved the lawsuit.

While we have implemented processes and procedures to comply with the TCPA and state equivalents, if we or the third parties on which we rely fail to adhere to such processes and procedures or fail or successfully implement appropriate processes and procedures in response to existing or future regulations, it could result in legal and monetary liability, fines, penalties or damage to our reputation in the marketplace, any of which could have a material adverse effect on our business, financial condition and results of operations. Additionally, any changes to the TCPA, its interpretation, or enforcement of it by the government or private parties that further restrict the way we contact and communicate with our potential customers or generate leads could adversely affect our ability to attract customers and could harm our business, financial condition and results of operations.

36


Table of Contents

Government regulation of the internet and ecommerce is evolving, and unfavorable changes or failure by us to comply with these regulations could substantially harm our business, financial condition and results of operations.

We are subject to general business regulations and laws, as well as regulations and laws specifically governing the internet and ecommerce. Existing and future regulations and laws could impede the growth of the internet, ecommerce or mobile commerce. These regulations and laws may involve taxes, tariffs, privacy and data security, artificial intelligence, anti-spam, pricing, content protection, electronic contracts and communications, mobile communications, consumer protection, information reporting requirements, unencumbered internet access to our platform, the design and operation of websites and internet neutrality. It is not clear how existing laws governing issues such as property ownership, sales and other taxes and consumer privacy apply to the internet as the vast majority of these laws were adopted prior to the advent of the internet and do not contemplate or address the unique issues raised by the internet or ecommerce. It is possible that general business regulations and laws, or those specifically governing the internet or ecommerce, may be interpreted and applied in a manner that is inconsistent from one market segment to another and may conflict with other rules or our practices. For example, federal, state and local regulation regarding privacy, data protection and information security has become more significant, and proposedthese evolving regulations such as the CCPA may increase our costs of compliance.compliance. We cannot be sure that our practices have complied, comply or will comply fully with all such laws and regulations. The enactment of new laws and regulations or the interpretation of existing laws and regulations in an unfavorable way may affect the operation of our business, directly or indirectly, which could result in substantial regulatory compliance costs, civil or criminal penalties, including fines, adverse publicity, decreased revenues and increased expenses.

We actively use anonymous online data for targeting ads online and if ad networks are compelled by regulatory bodies to limit use of this data, it could materially affect our ability to do effective performance marketing. Any failure, or perceived failure, by us to comply with any of these laws or regulations could result in damage to our reputation, a loss in business and proceedings or actions against us by governmental entities or others. Any such proceeding or action could hurt our reputation, force us to spend significant amounts in defense of these proceedings, distract our management, increase our costs of doing business, decrease the use of our sites by customers and suppliers and result in the imposition of monetary liability. We also may be contractually liable to indemnify and hold harmless third parties from the costs or consequences of non-compliance with any such laws or regulations. Adverse legal or regulatory developments could substantially harm our business, our ability to attract new customers may be adversely affected, and we may not be able to maintain or grow our revenue and expand our business as anticipated.

Risks Related to Our Use of Data and Technology

Our CarStory business and inventory is dependent on our ability to correctly appraiseoffer accurate and price vehicles we buy and sell.competitive pricing for vehicles.

When purchasing a vehicle from us,

We provide suggested offer pricing to our customers sometimes trade in their current vehicle and applydealer partners as part of the trade-in value towards their purchase. We also acquire vehicles from consumers independent of any purchase of a vehicle from us and purchase vehicles from auctions, rental car companies, OEMs and dealers. We appraise and price vehicles we buy and sellCarStory platform using data science and proprietary algorithms based on a number of factors, including mechanical soundness, consumer desirability, vehicle history, market prices and relative value as prospective inventory. If we are unable to correctly appraiseprovide accurate and price both the vehicles we buy and the vehicles we sell, we may be unablecompetitive pricing to acquire or sell inventory at attractive prices or to manage inventory effectively, and accordinglyour dealer partners, our revenue, gross margins and results of operations would be affected, which could have a materialan adverse effect on our business, financial condition and results of operations.

We are subject to risks related to online payment methods.

We accept payments for deposits on our vehicles through a variety of methods, including credit card and debit card. As we offer new payment options to customers, we may be subject to additional regulations, compliance requirements and fraud. For certain payment methods, including credit and debit cards, we pay interchange and other fees, which may increase over time and raise our operating costs. We are also subject to payment card association operating rules and certification requirements, including the Payment Card Industry Data Security Standard and rules governing electronic funds transfers, which could change or be reinterpreted to make it difficult or impossible for us to comply. As our business changes, we also may be subject to different rules under existing standards, which may require new assessments that involve costs above what we currently pay for compliance. If we fail to comply with the rules or requirements of any provider of a payment method we accept, if the volume of fraud in our transactions limits or terminates our rights to use payment methods we currently accept, or if a data breach occurs relating to our payment systems, we may, among other things, be subject to fines or higher transaction fees and may lose, or face restrictions placed upon, our ability to accept credit card and debit card payments from customers or facilitate other types of online payments. If any of these events were to occur, our business, financial condition and results of operations could be materially adversely affected.

37


Table of Contents

We occasionally receive orders placed with fraudulent credit card data, including stolen credit card numbers, or from clients who have closed bank accounts or have insufficient funds in open bank accounts to satisfy payment obligations. We may suffer losses as a result of orders placed with fraudulent credit card data even if the associated financial institution approved payment of the orders. Under current credit card practices, we may be liable for fraudulent credit card transactions. If we are unable to detect or control credit card or other fraud, our liability for these transactions could harm our business, financial condition and results of operations.

If we do not adequately address our customers’ reliance on mobile device technology, our results of operations could be harmed and our growth could be negatively affected.

Vroom.com is a mobile website that consumers can access and utilize from their mobile devices. In addition, we have designed and launched mobile apps (iOS and android) to enhance customers’ mobile experience. In light of consumers’ shift to mobile technology, our future success depends in part on our ability to provide enhanced functionality for customers who use mobile devices to shop for used vehicles and increase the number of transactions with us that are completed by those users. The shift to mobile technology by our users may harm our business in the following ways:

customers visiting our website from a mobile device may not accept mobile technology as a viable long-term platform to buy or sell a vehicle. This may occur for a number of reasons, including our ability to provide the same level of website functionality to a mobile device that we provide on a desktop computer, the actual or perceived lack of security of information on a mobile device and possible disruptions of service or connectivity;

we may be unable to provide sufficient website functionality to mobile device users, which may cause customers using mobile devices to believe that our competitors offer superior products and features;

problems may arise in developing applications for alternative devices and platforms and the need to devote significant resources to the creation, support and maintenance of such applications; or

regulations related to consumer protection, such as the Federal Trade Commission Act and similar state regulations, and related to consumer finance disclosures, including the Truth in Lending Act and the Fair Credit Reporting Act, may be interpreted, in the context of mobile devices, in a manner which could expose us to legal liability in the event we are found to have violated applicable laws.

If we do not develop suitable functionality for users who visit our website using a mobile device, our business, financial condition and results of operations could be harmed.

We rely on internet search engines, vehicle listing sites and social networking sites to help drive traffic to our website, and if we fail to appear prominently in the search results or fail to drive traffic through paid advertising, our traffic would decline and our business, financial condition and results of operations could be materially and adversely affected.

We depend in part on internet search engines, such as Google, Bing and Yahoo!, vehicle listing sites and social networking sites such as Facebook and Instagram to drive traffic to our platform. Our ability to maintain and increase the number of visitors directed to our platform is not entirely within our control. Our competitors may increase their search engine marketing efforts and outbid us for placement on various vehicle listing sites or for search terms on various search engines, resulting in their websites receiving a higher search result page ranking than ours. Additionally, internet search engines could revise their methodologies in a way that would adversely affect our search result rankings. If internet search engines modify their search algorithms in ways that are detrimental to us, if vehicle listing sites refuse to display any or all of our inventory in certain geographic locations, or if our competitors’ efforts are more successful than ours, overall growth in our customer base could slow or our customer base could decline. Internet search engine providers could provide automotive dealer and pricing information directly in search results, align with our competitors or choose to develop competing services. Our platform has experienced fluctuations in search result rankings in the past, and we anticipate similar fluctuations in the future. We could reach a point of inventory saturation at third-party aggregation websites whereby we will exceed the maximum allowable inventory that will require us to spend greater than market rates to list our inventory. Any reduction in the number of users directed to our platform through internet search engines, vehicle listings sites or social networking sites could harm our business, financial condition and results of operations.

Our business relies on email and other messaging services, and any restrictions on the sending of emails or messages or an inability to timely deliver such communications could materially and adversely affect our business, financial condition and results of operations.

Our business is dependent upon email and other messaging services for promoting our platform and vehicles available for purchase. Promotions offered through email and other messages sent by us are an important part of our marketing strategy. We provide emails to customers and other visitors informing them of the convenience and value of

38


Table of Contents

using our platform, as well as updates on new inventory and price updates on listed inventory, and we believe these emails, coupled with our general marketing efforts, are an important part of our customer experience and help generate revenue. If we are unable to successfully deliver emails or other messages to our subscribers, or if subscribers decline to open our emails or other messages, our revenues could be materially and adversely affected. Any changes in how webmail applications organize and prioritize email may reduce the number of subscribers opening our emails. For example, Google’s Gmail service has a feature that organizes incoming emails into categories (such as primary, social and promotions). Such categorization or similar inbox organizational features may result in our emails being delivered in a less prominent location in a subscriber’s inbox or viewed as “spam” by our subscribers and may reduce the likelihood of that subscriber opening our emails.

In addition, actions by third parties to block, impose restrictions on or charge for the delivery of emails or other messages could also adversely impact our business. From time to time, internet service providers or other third parties may block bulk email transmissions or otherwise experience technical difficulties that result in our inability to successfully deliver email or other messages to third parties. Changes in the laws or regulations that limit our ability to send such communications or impose additional requirements upon us in connection with sending such communications could also materially and adversely affect our business, financial condition and results of operations. Our use of email and other messaging services to send communications about our sites or other matters may also result in legal claims against us, which may cause us to incur increased expenses, and if successful might result in fines and orders with costly reporting and compliance obligations or might limit or prohibit our ability to send emails or other messages. We also rely on social networking messaging services to send communications and to encourage customers to send communications. Changes to the terms of these social networking services to limit promotional communications, any restrictions that would limit our ability or our customers’ ability to send communications through their services, disruptions or downtime experienced by these social networking services or decline in the use of or engagement with social networking services by customers and potential customers could materially and adversely affect our business, financial condition and results of operations.

We rely on third-party technology and information systems to complete critical business functions. If that technology fails to adequately serve our needs, and we cannot find alternatives, it may negatively impact our business, financial condition and results of operations.

We rely on third-party technology for certain of our critical business functions, including customer identity verification for financing, transportation fleet telemetry, network infrastructure for hosting our website and inventory data, software libraries, development environments and tools, services to calculate state taxes and fees associated with our vehicle sales and acquisitions, services to allow customers to digitally sign contracts and customer experience center management. Our business is dependent on the integrity, security and efficient operation of these systems and technologies. Our systems and operations or those of our third-party vendors and partners could be exposed to damage or interruption from, among other things, fire, natural disaster, power loss, telecommunications failure, unauthorized entry, computer viruses, denial-of-service attacks, acts of terrorism, human error, vandalism or sabotage, financial insolvency, bankruptcy and similar events. The failure of these systems to perform as designed, the failure to maintain or update these systems as necessary, the vulnerability of these systems to security breaches or attacks or the inability to enhance our information technology capabilities, and our inability to find suitable alternatives could disrupt our operations and have a material adverse effect on our business, financial condition and results of operations.

Our platform utilizes open-source software, and any defects or security vulnerabilities in the open-source software could negatively affect our business.

Our platform employs open-source software, and we expect to use open-source software in the future. To the extent that our platform depends upon the successful operation of open-source software, any undetected errors or defects

25


in this open-source software could prevent the deployment or impair the functionality of our platform, delay the introduction of new solutions, result in a failure of our platform and injure our reputation. For example, undetected errors or defects in open-source software could render it vulnerable to breaches or security attacks, and, in conjunction, make our systems more vulnerable to data breaches.

In addition, the terms of various open-source licenses have not been interpreted by United States courts, and there is a risk that such licenses could be construed in a manner that imposes unanticipated conditions or restrictions on our ability to market our platform. Some open-source licenses might require us to make our source code available at no cost or require us to make our source code publicly available for modifications or derivative works if our source code is based upon, incorporates, or was created using the open-source software to license such source code under the terms of the particular open-source license. While we try to insulate our proprietary code from the effects of such open-source license provisions, we cannot guarantee we will be successful. In addition to risks related to open-source license requirements, usage of open-source software can lead to greater risks than use of third-party commercial software, as open-source licensors generally do not provide warranties or controls on the origin of the software. Many of the risks associated with

39


Table of Contents

usage of open-source software cannot be eliminated and could materially and adversely affect our business, financial condition and results of operations.

A significant disruption in service on our platform could damage our reputation and result in a loss of customers, which could harm our brand or our business, financial condition and results of operations.

Our brand, reputation and ability to attract customers depend on the reliable performance of our platform and the supporting systems, technology and infrastructure. We may experience significant interruptions to our systems in the future. Interruptions in these systems, whether due to system failures or lack of upgrades, programming or configuration errors, computer viruses or physical or electronic break-ins, could affect the availability of our inventory on our platform and prevent or inhibit the ability of customers to access our platform. In addition, we expect that we will need to invest in and upgrade the UACC systems over time. Problems with the reliability or security of our systems could harm our reputation, result in a loss of customers and result in additional costs.

Our

UACC operates a data center is located at a colocation facility in Houston, Texas, which connects all of our offices and our Vroom VRC. OurCalifornia to support its operations. This data center is vulnerable to damage or interruption from fire, flood, power loss, telecommunications failure,failures, terrorist attacks, acts of war, electronic and physical break-ins, computer viruses, ransomware, earthquakes and similar events. The occurrence of any of these events could render communications between Vroomour offices inoperable and impact our ability to list and sell vehicles through our platform.

results of operations could be harmed. Problems faced by our third-party web-hosting providers, including AWS and Google Cloud, could inhibit the functionality of our platform. For example, our third-party web-hosting providers could close their facilities without adequate notice or suffer interruptions in service caused by cyber-attacks, natural disasters or other phenomena. Disruption of their services could cause our website to be inoperable and could have a material adverse effect on our business, financial condition and results of operations. Any financial difficulties, up to and including bankruptcy, faced by our third-party web-hosting providers or any of the service providers with whom they contract may have negative effects on our business, the nature and extent of which are difficult to predict. In addition, if our third-party web-hosting providers are unable to keep up with our growing capacity needs, our business, financial condition and results of operations could be harmed.

Any errors, defects, disruptions, or other performance or reliability problems with our platform could interrupt our customers’ access to our inventory and our access to data that drives our inventory purchase operations, which could harm our reputation or our business, financial condition and results of operations.

Our CarStory business relies on artificial intelligence to facilitate the automotive retail experience. If our use of artificial intelligence results in inaccurate data, regulatory scrutiny, privacy concerns or is otherwise unsuccessful, it could adversely affect our business, results of operations, and financial condition.

We have made significant investments in artificial intelligence (“AI”) initiatives, including through our CarStory business and offerings. CarStory provides AI-powered analytics and digital services, including predictive market data, for automotive retail. CarStory relies on AI, machine learning, automated decision making, data analytics and similar tools to analyze market trends, improve our services, provide insights to our customers and tailor our interactions with our customers (“AI Tools”). Certain of these AI Tools are proprietary to CarStory, and certain are third party AI Tools that CarStory has obtained a right to use from the applicable provider. Pursuant to our Value Maximization Plan, we are shifting focus in part to our CarStory business and expect to expand our use and offerings of our AI Tools. We intend to leverage our CarStory data and technology, including our AI Tools, to enhance operations at UACC.As with many technological innovations, there

26


are significant risks involved in developing, maintaining and utilizing AI Tools and no assurance can be provided that CarStory’s use of AI Tools will enhance our products or services or continue to be successful. If the models underlying our AI Tools are inadequately or incorrectly designed, improperly trained or used, or the data used to train them is incomplete, inadequate or biased in some way, our use of AI Tools may inadvertently reduce our efficiency or cause unintentional or unexpected outputs that are incorrect, insufficient, do not match our business goals, do not comply with our policies or standards, adversely affect our financial condition, business and reputation. Further if we are deemed to not have sufficient rights to use such data to train our AI Tools, then we may be subject to litigation by the owners of the content or other materials that comprise such data, similar to the litigation that is currently pending in various U.S. courts against other developers of AI Tools, and which has an uncertain outcome.

The market for AI Tools is complex and rapidly evolving, and we face significant competition from other companies as well as an evolving regulatory landscape. To the extent AI development and utilization from our industry competitors prove to be successful, or more successful, than our approach, the demand for our CarStory platform, and thus our business, could be adversely affected. Our efforts to continuously improve our AI Tools, including the introduction of new products or capabilities or changes to existing products or capabilities, may result in new or enhanced governmental or regulatory scrutiny, litigation, privacy or ethical concerns, or other complications that could adversely affect our business, reputation, or financial results. For example, the use of datasets to develop AI models, the content generated by AI systems, or the application of AI systems may be found to be insufficient, biased, or harmful, or violate current or future laws and regulations or deviate from consumers’ expectations of privacy. In addition, market acceptance of AI technologies is uncertain, especially in the automotive retail industry.

The rapid evolution of AI will require the application of resources to develop, test, maintain and improve our products and services to help ensure that the AI is accurate and efficient. The continuous development, testing, maintenance and deployment of our AI Tools may also increase the cost profile of our offerings due to the nature of the computing costs involved in such systems, and may involve unforeseen difficulties including material performance problems, undetected defects or errors. We may encounter technical obstacles, and it is possible that we may discover additional problems that may prevent our proprietary AI Tools from operating properly, which could adversely affect our business, customer relationships and reputation. See “Any actual or perceived failure to comply with evolving regulatory frameworks around the development and use of AI could adversely affect our business, results of operations, and financial condition.”

Any actual or perceived failure to comply with the evolving regulatory frameworks around the development and use of AI could adversely affect our business, results of operations, and financial condition.

The regulatory framework around the development and use of these emerging technologies is rapidly evolving, and many federal, state and foreign government bodies and agencies have introduced and/or are currently considering additional laws and regulations. Both in the United States and internationally, the development and use of AI Tools are the subject of evolving regulation by various governmental and regulatory agencies, and changes in laws, rules, directives and regulations governing the use of AI Tools may adversely affect the ability of our business to use or rely on AI Tools. As a result, implementation standards and enforcement practices are likely to remain uncertain for the foreseeable future, and we cannot yet determine the impact future laws, regulations, standards, or perception of their requirements may have on our business.

Already, there are some existing legal regimes that regulate certain aspects of AI, and new laws regulating AI Tools are expected to enter into force in the United States and the EU in 2024. In October 2023, the President of the United States issued a broad Executive Order on the Safe, Secure and Trustworthy Development and Use of AI (the “Order”), emphasizing the need for transparency, accountability and fairness in the development and use of AI Tools.

The Order established certain new requirements for the training, testing and cybersecurity of sophisticated AI models

and large-scale compute centers used to train AI models. The Order also instructed several other federal agencies to promulgate certain additional regulations within specific timeframes from the date of the Order regarding the development, use and marketing of AI Tools.

Any of the foregoing, together with developing guidance and/or decisions in this area, may affect our ability to use AI Tools, require additional compliance measures and changes to our operations and processes regarding AI Tools, and result in increased compliance costs, and potential increases in the risk of civil claims against us. Any actual or perceived failure to comply with evolving regulatory frameworks around the development and use of AI Tools, could adversely affect our brand, reputation, business, results of operations, and financial condition.

27


Risks Related to Intellectual Property

Failure to adequately protect our intellectual property, technology and confidential information could harm our business, financial condition and results of operations.

The protection of intellectual property, technology and confidential information is crucial to the success of our business.businesses. Moreover, we will work to preserve the value of our Vroom® intellectual property rights where appropriate following the wind-down of our ecommerce operations. We rely on a combination of trademark, trade secret, patent and copyright law, as well as contractual restrictions, to protect our intellectual property (including our brand, technology and confidential information). While it is our policy to protect and defend our rights to our intellectual property, we cannot predict whether steps taken by us to protect our intellectual property will be adequate to prevent infringement, misappropriation, dilution or other violations of our intellectual property rights. We also cannot guarantee that others will not independently develop technology that has the same or similar functionality as our technology. Unauthorized parties may also attempt to copy or obtain and use our technology to develop competing solutions, and policing unauthorized use of our technology and intellectual property rights may be difficult and ineffective. Changes in the law or adverse court rulings may notalso negatively affect our ability to prevent others from using our technology. If our intellectual property rights are used or misappropriated by third parties, the value of our brand and intellectual property may be effective.diminished and competitors may be able to more effectively mimic our products and methods of operations. Any of these events could materially adversely affect our business, financial condition or results of operations. Furthermore, we may face claims of infringement of third-party intellectual property that could interfere with our ability to market, promote and sell our brands, products and services. Any litigation to enforce our intellectual property rights or defend ourselves against claims of infringement of third-party intellectual property rights, regardless of merit, could be costly, divert attention of management and may not ultimately be resolved in our favor. Moreover, if we are unable to successfully defend against claims that we have infringed the intellectual property rights of others, we may be prevented from using certain intellectual property and may be liable for damages, which in turn could materially adversely affect our business, financial condition or results of operations. Even if we were to prevail, the time and resources necessary to resolve such disputes could be costly, time-consuming and divert the attention of management from our business operations.

As part

A number of aspects of intellectual property protection in the field of AI and machine learning are currently under development, and there is uncertainty and ongoing litigation in different jurisdictions as to the degree and extent of protection warranted for AI and machine learning systems and relevant system input and outputs. If we fail to obtain protection for the intellectual property rights concerning our efforts to protectAI Tools, or later have our intellectual property technology and confidential information, we require certainrights invalidated or otherwise diminished, our competitors may be able to take advantage of our employeesresearch and consultantsdevelopment efforts to enter into confidentiality and assignmentdevelop competing products. Given the long history of inventions agreements, and we also require certain thirddevelopment of AI Tools, other parties to enter into nondisclosure agreements. These agreements may not effectively grant all necessary rights to any inventions that may have been developed by our employees and consultants. In addition, these agreements may not effectively prevent unauthorized use or disclosure of our confidential information, intellectual property or technology and may not provide an adequate remedy(or in the event of unauthorized usefuture may obtain) patents or disclosure of our confidential information, intellectual property or technology. Despite our efforts to protect ourother proprietary rights unauthorized parties may attempt to copy aspects of our website features, software and functionalitythat would prevent, limit or obtain and use information that we

40


Table of Contents

consider proprietary. Changes in the law or adverse court rulings may also negatively affectinterfere with our ability to prevent others from usingmake, use or sell our technology.own AI Tools.

We are currently the registrant of the vroom.com, texasdirectauto.com, carstory.com, vast.com and texasdirectauto.comunitedautocredit.net internet domain names and various other related domain names. The regulation of domain names in the United States is subject to change. Regulatory bodies could establish additional top-level domains, appoint additional domain name registrars or modify the requirements for holding domain names. As a result, we may not be able to acquire or maintain domain names that are important for our business.

In addition, we have registered certain trademarks that are important to our business, such as the Vroom®“Vroom®”, Sell“Sell Us Your Car®Car®”, CarStory®“CarStory®”, “Vast®” and Vast® “United Auto Credit®” trademarks. While we are seeking, and have secured registration of several of our trademarks in the U.S. and other foreign jurisdictions (including Canada and Europe), it is possible that others may assert senior rights to similar trademarks and seek to prevent our use and further registration of our trademarks in certain jurisdictions. Additionally, our pending trademark or service mark applications may not result in such marks being registered in a timely manner or at all. If we fail to adequately protect or enforce our rights under these trademarks, we may lose the ability to use those trademarks or to prevent others from using them, which could adversely harm our reputation and our business, financial condition and results of operations. While we are actively seeking, and have secured registration of several of our trademarks in the U.S. and other jurisdictions (including Canada and Europe), it is possible that others may assert senior rights to similar trademarks, in the U.S. and internationally, and seek to prevent our use and registration of our trademarks in certain jurisdictions. Our pending trademark or service mark applications may not result in such marks being registered.

While software can be protected under copyright law, we have chosen not to register any copyrights in these works,our proprietary software, and instead, primarily rely on trade secret law to protect our proprietary software. In order to bring a copyright infringement lawsuit in the United States, the copyright must be registered. Accordingly, the remedies and damages available to us for unauthorized use of our software may be limited. Our trade secrets, know-how and other proprietary materials may be revealed to the public or our competitors or independently developed by our competitors and no longer provide protection for the related intellectual property. Furthermore, our trade secrets, know-how and other proprietary materials may be revealed to the public or our competitors or independently developed by our competitors and, as a result, may no longer provide protection for the related intellectual property.

As part

28


Our CarStory business has a number of patents and we may obtain additional patents in the future. We may fail to apply for patents on important products, methods and technologies in a timely fashion or at all, or we may fail to apply for patents in potentially relevant jurisdictions. Moreover, we may fail to obtain issuance of any of the CarStory acquisition,patent applications we acquired 19 U.S. patents and ten pending U.S. patent applications.do file. Effective protection of patents is complex, expensive and difficult to maintain, both in terms of application and registrationfiling costs as well as the costs of defending and enforcing those rights.our rights in our patents. For example, the U.S. Patent and Trademark Office and various foreign governmental patent agencies require compliance with a number of procedural requirements to complete the patent application process and to maintain issued patents, and noncompliance or non-payment could result in abandonment or lapse of a patent or patent application, resulting in partial or complete loss of patent rights in a relevant jurisdiction.

Our agreements with employees and consultants may not effectively prevent unauthorized use of our intellectual property, and we may be subject to claims asserting that our employees or, consultants have wrongfully used or disclosed alleged trade secrets of their current or former employers or claims asserting ownership of what we regard as our own intellectual property.

As part of our efforts to protect our intellectual property, technology and confidential information, we require employees and contractors who may be involved in the creation or development of intellectual property to enter into confidentiality and assignment of inventions agreements, and we also require certain third parties to enter into nondisclosure agreements. However, we may not be successful in having all such employees, contractors or third parties enter into such agreements. These agreements may not effectively grant all necessary rights to any inventions that may have been developed by our employees and consultants. In addition, while these agreements will give us contractual remedies upon unauthorized use or disclosure of our intellectual property or confidential information, these agreements may not effectively prevent unauthorized use or disclosure of our confidential information, intellectual property or technology and we may not be able to detect such unauthorized activity.

Although we try to ensure that our employees, consultants and advisors do not use the proprietary information or know-how of others in their work for us, we may be subject to claims that we or these individuals have used or disclosed intellectual property, including trade secrets or other proprietary information, of any such individual’s current or former employer. Litigation may be necessary to defend against these claims, which could be costly and time-consuming. If we fail in defending any such claims, in addition to paying monetary damages, we may lose valuable intellectual property rights or personnel. Even if we are successful in defending against such claims, litigation could result in substantial costs and divert the attention of management.

We rely on licenses to use the intellectual property rights of third parties which are incorporated into our products and services. Failure to renew or expand existing licenses may require us to modify, limit or discontinue certain offerings, which could materially affect our business, financial condition and results of operations.

We rely on products, technologies and intellectual property that we license from third parties for use in our products and services. We cannot assure that these third-party licenses, or support for such licensed products and technologies, will continue to be available to us on commercially reasonable terms, if at all. In the event that we cannot renew or expand existing licenses, we may be required to discontinue or limit our use of the products or services that include or incorporate the licensed intellectual property.

We cannot be certain that our licensors are not infringing the intellectual property rights of others or that our suppliers and licensors have sufficient rights to the technology in all jurisdictions in which we may operate. If we are unable to obtain or maintain rights to any of this technology because of intellectual property infringement claims brought by third parties against our suppliers and licensors or against us, or if we are unable to continue to obtain the technology or enter into new agreements on commercially reasonable terms, our ability to develop our products and services containing that technology could be severely limited and our business could be harmed. Additionally, if we are unable to obtain necessary technology from third parties, we may be forced to acquire or develop alternate technology, which may require significant time and effort and may be of lower quality or performance standards. This would limit and delay our ability to provide new or competitive offerings and increase our costs. If alternate technology cannot be obtained or developed, we may not be able to offer certain functionality as part of our products and services, which could adversely affect our business, financial condition and results of operations.

29


We utilize third party open-source software components in some of the solutions we license to our clients deliverables we develop and create for our clients, and failure to comply with the terms of the underlying open-source software licenses could subject us or our clients to possible litigation.

We use open-source software in some of our proprietary software, and we expect to continue to use open-source software in the future. The use and distribution of open-source software is accompanied by the risk that open-source licensors generally do not provide warranties, indemnification or other contractual provisions regarding the quality of the code or intellectual property infringement claims protections. To the extent that our proprietary software depends upon the successful operation of open-source software, any undetected errors or defects in this open-source software could prevent the deployment or impair the functionality of such technologies and injure our reputation. In addition, some open source licenses contain terms requiring us to make available source code for modifications or derivative works we create based upon the type of open-source software we use or grant other licenses to our intellectual property. Although we monitor our use of open-source software to avoid subjecting our software to conditions we do not intend, we cannot assure you that our processes for controlling our use of open-source software in our software will be effective. Additionally, we could be subject to third-party claims asserting ownership of, or demanding release of, the open-source software or derivative works that we developed using such software, or otherwise seeking to enforce the terms of the applicable open-source license. Such claims could result in litigation and/or substantial costs to defend and resolve.

We may be subject to claims asserting that our employees, consultants or advisors have wrongfully used or disclosed alleged trade secrets of their current or former employers or claims asserting ownership of what we regard as our own intellectual property.

Although we try to ensure that our employees, consultants and advisors do not use the proprietary information or know-how of others in their work for us, we may be subject to claims that we or these individuals have used or disclosed intellectual property, including trade secrets or other proprietary information, of any such individual’s current or former employer. Litigation may be necessary to defend against these claims. If we fail in defending any such claims, in addition to paying monetary damages, we may lose valuable intellectual property rights or personnel. Even if we are successful in defending against such claims, litigation could result in substantial costs and be a distraction to management.

In addition, while it is our policy to require our employees and contractors who may be involved in the creation or development of intellectual property on our behalf to execute agreements assigning such intellectual property to us, we may be unsuccessful in having all such employees and contractors execute such an agreement. The assignment of intellectual property may not be self-executing or the assignment agreement may be breached, and we may be forced to bring claims against third parties or defend claims that they may bring against us to determine the ownership of what we regard as our intellectual property.

41


Table of Contents

Risks Related to Ownership of Our Common Stock

Our common stock price may be volatile and the value of our common stock has declined since our initial public offering and may continue to decline regardless of our operating performance, and you may not be able to resell your shares at or above the price which you paid for them.

It is possible that an active trading market for shares of our common stock will not be sustained, which could make it difficult for you to sell your shares of common stock at an attractive price or at all.

Many factors, some of which are outside our control, may cause the market price of our common stock to fluctuate significantly, including those described in this “Risk Factors” section and elsewherethe "Risk Factors" section in thisour Annual Report, on Form 10-K, as well as the following:

our operating and financial performance and prospects;

prospects, including as a result of operational changes and initiatives we are taking as part of our Value Maximization Plan;
the discontinuation of our ecommerce operations and wind-down of our used vehicle dealership business and our ability to reduce the related costs;
potential delisting of our common stock, as described below;
our ability to grow and develop the UACC and CarStory businesses;

30


our liquidity and ability to raise capital;
our quarterly or annual earnings or those of other companies in our industry compared to market expectations;

our guidance regarding future quarterly or annual earnings;

earnings, and our financial results in relation to previously issued guidance;

conditions that impact demand for our offerings and platform, including demand inability to achieve the automotive industry generally and the performancebenefits of the third parties through whom we conduct significant parts of our business;

any cost saving measures;

future announcements concerning our businessbusinesses or our competitors’ businesses;

the public’s reaction to our press releases, other public announcements and filings with the SEC;

coverage by or changes in financial estimates by securities analysts or failure to meet their expectations;

market and industry perception of our success, or lack thereof, in pursuing our growthbusiness strategy;

changes in market sentiment regarding growth companies that are not yet profitable;

strategic actions by us or our competitors, such as acquisitions or restructurings;

changes in laws or regulations which adversely affect our industry or us;

changes in accounting standards, policies, guidance, interpretations or principles;

changes in senior management or key personnel;

personnel and the impact of reductions in our workforce;

issuances, exchanges or sales, or expected issuances, exchanges or sales of our capital stock;

changes in our dividend policy;

new, or adverse resolution of new or pending, litigation or other claims against us; and

global political unrest and wars, including geopolitical conflicts and war in Europe and the Middle East, which could delay and disrupt our business, and if such political unrest further escalates or leads to disruptions in the financial markets or puts further pressure on global supply chains, it could heighten many of the other risk factors included in this Item 1A;

the current inflationary environment in the United States and in other global economies, the impact of high interest rates and the impact of any recession or general economic downturn;
potential volatility in the banking industry; and
other changes in general market, economic and political conditions in the United States and global economies or financial markets, including those resulting from the federal government's ongoing negotiations regarding the federal debt limit, natural disasters, terrorist attacks, global pandemics, acts of war and responses to such events.

events

As a result, volatility in the market price of our common stock may prevent investors from being able to sell their common stock at or above the price which they paid for them. These broad market and industry factors may materially reduce the market price of our common stock, regardless of our operating performance. In addition, price volatility may be greater if the public float and trading volume of our common stock is low. As a result, you may suffer a loss on your investment. Broad market and industry fluctuations, as well as general economic, political, regulatory, and market conditions, may negatively impact the market price of our common stock.

We have experienced significant declines in the market price of our common stock, and it could continue to decline in the future, including as a result of the execution and implementation of our Value Maximization Plan. Further declines in our stock price could, among other things, make it more difficult to raise capital on terms acceptable to us, or at all, and make it difficult for our investors to sell their shares of common stock. If our stock price again closes below $1.00 per share minimum bid price for 30 consecutive business days, we would be out of compliance with the $1.00 per share minimum bid price requirement for continued inclusion on the Nasdaq Global Select Market and our stock would be at risk of delisting. See "Risk Factors—We may be unable to satisfy a continued listing rule from the Nasdaq" and "Risk Factors—Our indebtedness and liabilities could limit the cash flow available for our operations, expose us to risks that could adversely affect our business, financial condition and results of operations and impair our ability to satisfy our debt obligations" for more information on the risk of delisting from the Nasdaq Global Select Market. In the past,addition, companies that have experiencedexperience volatility in the market price of their securities have beenoften are the subject toof securities class action litigation. We may be the target of this type of litigationFor example, a consolidated class action is pending in the future, which could result in substantial costsU.S. District Court for the Southern District of New York against us,

31


certain of our officers, and divertcertain of our management’s attention.directors, among others, alleging violations of the federal securities laws. See Part I, Item 3. “Legal Proceedings.”

We do not intend to pay dividends on our common stock for the foreseeable future.

We currently intend to retain all available funds and any future earnings to fund the development and growth of our business.businesses. As a result, we do not anticipate declaring or paying any cash dividends on our common stock in the foreseeable future. Any decision to declare and pay dividends in the future will be made at the discretion of our board of directors and will depend on, among other things, our business prospects, results of operations, financial condition, cash requirements and availability, industry trends and other factors that our board of directors may deem relevant. Any such decision also will be subject to compliance with contractual restrictions and covenants in the agreements governing our current indebtedness. In addition, we may incur additional indebtedness, the terms of which may further restrict or prevent us from paying dividends on our common stock. As a result, you may have to sell some or all of your common stock after price appreciation in order to generate cash flow from your investment, which you may not be able to do. Our inability or decision not to pay dividends could also adversely affect the market price of our common stock.

42


Table of Contents

We may issue shares of preferred stock in the future, which could make it difficult for another company to acquire us or could otherwise adversely affect holders of our common stock, which could depress the price of our common stock.

Our amended and restated certificate of incorporation authorizes us to issue one or more series of preferred stock. Our board of directors has the authority to determine the preferences, limitations and relative rights of the shares of preferred stock and to fix the number of shares constituting any series and the designation of such series, without any further vote or action by our stockholders. Our preferred stock could be issued with voting, liquidation, dividend and other rights superior to the rights of our common stock. The potential issuance of preferred stock may delay or prevent a change in control of us, discouraging bids for our common stock at a premium to the market price, and materially and adversely affect the market price and the voting and other rights of the holders of our common stock.

The issuance by us of additional shares of common stock or convertible securities maywould significantly dilute your ownership of us and could adversely affect our stock price.

We may issueseek additional equity or debt financing. The issuance of any additional capital stock in the future that willwould result in significant dilution to all otherour stockholders. We also expect to continue to grant equity awards to employees, directors and consultants under our equity incentive plans. From time to time in the future, we may also issue additional shares of our common stock or securities convertible into common stock pursuant to a variety of transactions, including acquisitions. The issuance by us of additional shares of our common stock or securities convertible into our common stock would dilute your ownership of us and the sale of a significant amount of such shares in the public market could adversely affect prevailing market prices of our common stock.

The issuance or sale of shares of our common stock, or rights to acquire shares of our common stock, could depress the trading price of our common stock and our notes, and would significantly dilute existing stockholders.

We may conduct future offerings of our common stock, preferred stock or other securities that are convertible into or exercisable for our common stock to finance our operations or fund acquisitions, or for other purposes. On December 1, 2023, we filed a prospectus supplement with the SEC under which we may offer and sell from time to time and at our discretion shares of our common stock having an aggregate offering price of up to $50.0 million pursuant to an “at the market” offering program (the “ATM Program”). As of December 31, 2023, we had issued 43,483 shares of common stock under the ATM program for net proceeds of $2.4 million. In addition, as of December 31, 2023, we had reserved 53,537 shares of our common stock for issuance under our equity incentive plans. The Indenture for our Notes does not restrict our ability to issue additional equity securities. If we issue or sell additional shares of our common stock or rights to acquire shares of our common stock, if any of our existing stockholders sells a substantial amount of our common stock, or if the market perceives that such issuances or sales may occur, then the trading price of our common stock, and, accordingly, our Notes may significantly decline. In addition, our issuance or sale of additional shares of common stock would significantly dilute the ownership interests of our existing common stockholders, including noteholders who receive shares of our common stock upon conversion of their Notes.

32


Future sales, or the perception of future sales, by us or our existing stockholders in the public market could cause the market price for our common stock to decline.

The sale of substantial amounts of shares of our common stock in the public market, or the perception that such sales could occur, could harm the prevailing market price of shares of our common stock. These sales, or the possibility that these sales may occur, also might make it more difficult for us to sell equity securities in the future at a time and at a price that we deem appropriate. Many ofOther than shares held by our affiliates, stockholders who held our capital stock prior to the completion of our IPO have substantial unrecognized gains onnow hold freely tradable shares of our common stock without restriction or further registration requirements under the value of the equity they hold based upon the price at which shares were sold in our IPO,Securities Act, and therefore they may take steps to sell their shares or otherwise secure theany unrecognized gains on those shares. WeAdditionally, any shares of common stock held by our affiliates are unableeligible for resale pursuant to predictRule 144 under the timingSecurities Act, subject to the volume, manner of orsale, holding period and other limitations of Rule 144.

On December 1, 2023, we filed a prospectus supplement with the effect that such sales may haveSEC for our ATM Program. As of December 31, 2023, we had issued 43,483 shares of common stock under our ATM program for net proceeds of $2.4 million. In addition, we filed a registration statement on the prevailing market price of our common stock.

In connection with our IPO, we registeredForm S-8 to register shares of our common stock issued or reserved for issuance under our 2020 Incentive Award Plan and Second Amended and Restated 2014 Equity Incentive Plan, as well as a registration statement on Form S-8 to register shares of our common stock issued or reserved for issuance under our 2022 Inducement Award Plan. Subject to the satisfaction of vesting conditions, and the expiration of lockup agreements, shares registered under thethese registration statementstatements on Form S-8 will bebecame available for resale immediately in the public market without restriction.

Further, certain holders of our common stock have rights, subject to some conditions, to require us to file registration statements covering the sale of their shares or to include their shares in registration statements that we may file on our behalf or for other stockholders.

We are unable to predict the timing of or the effect that such sales may have on the prevailing market price of our common stock, which in turn may impact our continued listing on Nasdaq. See “We may be unable to satisfy a continued listing rule from the Nasdaq”.

We may be unable to satisfy a continued listing rule from Nasdaq.

The Nasdaq Stock Market LLC ("Nasdaq") maintains several requirements for continued listing of our common stock, one of which is the maintenance of a minimum closing bid price of $1.00. On December 21, 2023, we received written notice from Nasdaq notifying us that, for the prior 30 consecutive business days, the bid price for our common stock had closed below the $1.00 minimum bid price requirement for continued inclusion on the Nasdaq Global Select Market. On February 13, 2024, after obtaining stockholder approval, we effected a 1-for-80 reverse stock split (the “Reverse Stock Split”), and our stock began trading on a post-split adjusted basis on February 14, 2024. On February 29, 2024, we were notified by Nasdaq Listing Qualifications that the closing bid price of our common stock had been at $1.00 per share or greater for 11 consecutive business days, from February 14, 2024 to February 28, 2024. Accordingly, the Company has regained compliance with Nasdaq Listing Rule 5450(a)(1) and this matter is now closed. However, if our common stock again closes below the $1.00 per share minimum bid price required by Nasdaq for 30 consecutive business days, we would receive another notice of non-compliance with Nasdaq's listing standards and may be provided a period of 180 calendar days from the date of such notice to regain compliance with the minimum bid closing price requirement of at least $1.00 per share for a minimum of 10 consecutive business days. However, there can be no assurance that our common stock will continue to close at or above the $1.00 per share minimum bid price as required by Nasdaq, or that we will otherwise meet the requirements of Nasdaq for continued inclusion for trading on Nasdaq Global Select Market.

We intend to continue to actively monitor the closing bid price of our common stock and, if we lose compliance with Nasdaq’s minimum bid price closing requirements, will consider all available options to regain compliance.

If our common stock is delisted in the future, it is unlikely that we will be able to list our common stock on another national securities exchange and, as a result, we expect our securities would be quoted on an over-the-counter market. If this were to occur, we and our stockholders could face significant material adverse consequences, including limited availability of market quotations and analyst coverage for our common stock, and reduced liquidity for the trading of our securities. In addition, a delisting would constitute a fundamental change under the terms of our Indenture and make our Notes redeemable at par upon delisting (as described further below), and we could also experience a decreased ability to issue additional securities and obtain additional financing in the future. Delisting also could result in, among other things, a

33


loss of investor confidence or interest in strategic transactions or opportunities, us being subject to regulation in each state in which we offer our securities, and difficulty in recruiting and retaining personnel through equity incentive awards.

The obligations associated with being a public company require significant resources and management attention, and we have and will continue to incur increased costs as a result of becoming a public company.attention.

As a public company, we face increasedsignificant legal, accounting, administrative and other costs and expenses that we did not incur as a private company. We expect to continue to incur significant costs related to operating as a public company.expenses. We are subject to the Exchange Act, the rules and regulations implemented by the SEC, the Sarbanes-Oxley Act of 2022, as amended (the "Sarbanes Oxley-Act"), the Wall Street Reform and Consumer Protection Act of 2020 (the “Dodd-Frank Act”), the Public Company Accounting Oversight Board (“PCAOB”) and Nasdaq rules and standards, each of which imposes additional reporting and other obligations on public companies. As a public company, we are required to, among other things:

prepare, file and distribute annual, quarterly and current reports with respect to our business and financial condition;

prepare, file and distribute proxy statements and other stockholder communications;

hire additionalretain financial and accounting personnel and other experienced accounting and finance staff with the expertise to address complex accounting matters applicable to public companies;

institute more comprehensive financial reporting and disclosure compliance procedures;

43


Table of Contents

involve and retain to a greater degree outside counsel and accountants to assist us with the activities listed above;

enhance our investor relations function;

establishenforce new internal policies, including those relating to trading in our securities and disclosure controls and procedures;

comply with Nasdaq’s listing standards; and

comply with the Sarbanes-Oxley Act.

These rules and regulations and changes in laws, regulations and standards relating to corporate governance and public disclosure, which have created uncertainty for public companies, have and will continue to increase our legal and financial compliance costs and make some activities more time consuming and costly. These laws, regulations and standards are subject to varying interpretations, in many cases due to their lack of specificity, and, as a result, their application in practice may evolve over time as new guidance is provided by regulatory and governing bodies. This could result in continuing uncertainty regarding compliance matters and higher costs necessitated by ongoing revisions to disclosure and governance practices. Our investment in compliance with existing and evolving regulatory requirements has and will continue to result in increased administrative expenses and a diversion of management’s time and attention from revenue-generating activities to compliance activities, which could have a material adverse effect on our business,businesses, financial condition and results of operations.

In addition, the need to continue to develop the corporate infrastructure demanded of a public company may also divert management’s attention from implementing our business strategy, including our Value Maximization Plan, which could prevent us from improving our business,businesses, financial condition and results of operations. If we do not continue to develop and implement the right processes and tools to manage our changing enterprise and maintain our culture, our ability to compete successfully and achieve our business objectives could be impaired, which could negatively impact our business, financial condition and results of operations. In addition, we cannot predict or estimate the amount of additional costs we may incur to comply with these requirements. We anticipate that these costs will materially increase our general and administrative expenses.

Being a public company and complying with applicable rules and regulations could also make it more difficult and more expensive for us to obtain director and officer liability insurance, and we may be required to accept reduced policy limits and coverage or incur substantially higher costs to obtain the same or similar coverage. As a result, it may be more difficult for us to attract and retain qualified people to serve on our board of directors, our board committees or as executive officers.

34


We are a “smaller reporting company” and the reduced disclosure requirements applicable to smaller reporting companies may make our common stock less attractive to investors.

As of December 31, 2023, we are a “smaller reporting company” as defined under the rules promulgated under the Exchange Act. We will remain a smaller reporting company until the fiscal year following the determination that either (i) the value of our voting and non-voting common shares held by non-affiliates is $250 million or more measured on the last business day of our second fiscal quarter or (ii) our annual revenues are $100 million or more during the most recently completed fiscal year and the value of our voting and non-voting common shares held by non-affiliates is $700 million or more measured on the last business day of our second fiscal quarter. Smaller reporting companies are able to provide simplified executive compensation disclosure and have certain other reduced disclosure obligations, including, among other things, being required to provide only two years of audited financial statements and not being required to provide selected financial data, or supplemental financial information.

We cannot predict whether investors will find our common stock less attractive because we have chosen to rely on any these exemptions. If some investors find our common stock less attractive as a result, there may be a less active trading market for our common stock and our stock price may be reduced or more volatile.

As a public reporting company, we are subject to rules and regulations established from time to time by the SEC and Nasdaq regarding our internal control over financial reporting. We have identified material weaknesses in our internal control over financial reporting. If our remediation of such material weaknesses is not effective, or if we experience additional material weaknesses or otherwise fail to establish and maintain effective internal control over financial reporting and disclosure controls and procedures, we may not be able to accurately report our financial results or report them in a timely manner, which may adversely affect investor confidence in us and, as a result, the value of our common stock.

We are a public reporting company subject to the rules and regulations established from time to time by the SEC and Nasdaq. These rules and regulations require, among other things, that we establish and periodically evaluate procedures with respect to our disclosure controls and procedures and our internal control over financial reporting. Reporting obligations as a public company place a considerable strain on our financial and management systems, processes and controls, as well as on our personnel.

In addition, as a public company, we will beare required to document and test our internal control over financial reporting pursuant to Section 404 of the Sarbanes-Oxley Act so that our management can certify as to the effectiveness of our internal control over financial reporting. Section 404(a) of the Sarbanes-Oxley Act (“Section 404(a)”) requires that management assess and report annually on the effectiveness of our internal control over financial reporting and identify any material weaknesses in our internal control over financial reporting. Additionally, Section 404(b) requires our independent registered public accounting firm to issue an annual report that addresses the effectiveness of our internal control over financial reporting. Our first Section 404(a) assessment will take place for our annual report for the year ending December 31, 2021. We also expect to comply with Section 404(b) at that time. Although we started the costly and challenging process of compiling the system and process documentation necessary to perform the evaluation needed to comply with Section 404(a), we may not be able to complete our evaluation, testing and any required remediation in a timely fashion. Our compliance with Section 404(a) will require that we incur substantial expenses and expend significant management efforts.

44


Table of Contents

As of December 31, 2020, we did not design or maintain effective internal control over financial reporting due to certain identified material weaknesses. We describe these material weaknesses in Part II, Item 9A. “Controls and Procedures” in this Annual Report. The material weaknesses did not result in a misstatement to our annual or interim consolidated financial statements. However, each of these control deficiencies, if not remediated, could result in a misstatement of one or more account balances or disclosures that would result in a material misstatement to the annual or interim consolidated financial statements that would not be prevented or detected, and, accordingly, we determined that these control deficiencies constitute material weaknesses. We intend to continue to take steps to remediate the material weaknesses through hiring additional qualified accounting personnel and further evolving our business processes and related internal controls. However, we will not be able to fully remediate these material weaknesses until these steps have been completed and the related internal controls have been operating effectively for a sufficient period of time.

If we identify additional material weaknesses in our internal control over financial reporting, or determine that existing material weaknesses have not been remediated, our management will be unable to assert that our disclosure controls and procedures and our internal control over financial reporting is effective. If we are unable to assert that our internal control over financial reporting is effective, or if our independent registered public accounting firm is unable to express an unqualified opinion as to the effectiveness of our internal control over financial reporting, investors may lose confidence in the accuracy and completeness of our financial reports, the market price of our common stock could be adversely affected and we could become subject to litigation or investigations by Nasdaq, the SEC, or other regulatory authorities, which could require additional financial and management resources.

If our estimates or judgments relating to our critical accounting policies prove to be incorrect, our operating results could be adversely affected.

The preparation of financial statements in conformity with GAAP requires management to make estimates and assumptions that affect the amounts reported in the consolidated financial statements and accompanying notes. We base our estimates on historical experience and on various other assumptions that we believe to be reasonable under the circumstances, as provided in the section titled “Management’s Discussion and Analysis of Financial Condition and Results of Operations-Critical Accounting Policies and Estimates” in Part II, Item 7 of this Annual Report on Form 10-K. The results of these estimates form the basis for making judgments about the carrying values of assets, liabilities, expenses and related disclosures. On an ongoing basis, we evaluate our estimates, including, among others, those related to income taxes, the realizability of inventory, stock-based compensation, revenue-related reserves, as well as impairment of goodwill and long-lived assets. Our operating results may be adversely affected if our assumptions change

35


or if actual circumstances differ from those in our assumptions, which could cause our operating results to fall below the expectations of securities analysts and investors, resulting in a decline in the price of our common stock.

The implementation of new accounting requirements or other changes to GAAP could have a material adverse effect on our reported results of operations and financial condition.

Increased scrutiny and changing expectations from investors, consumers, employees, regulators, and others regarding our environmental, social and governance practices and reporting could cause us to incur additional costs, devote additional resources and expose us to additional risks, which could adversely impact our reputation, customer attraction and retention, access to capital and employee recruitment and retention.

Companies across all industries are facing increasing scrutiny related to their environmental, social and governance (“ESG”) practices and reporting. Investors, consumers, employees and other stakeholders have focused increasingly on ESG practices and placed increasing importance on the implications and social cost of their investments, purchases and other interactions with companies. With this increased focus, public reporting regarding ESG practices is becoming more broadly expected. If our ESG practices and reporting do not meet investor, consumer or employee expectations, which continue to evolve, our brand, reputation and customer retention may be negatively impacted.

Our ability to achieve any ESG objective is subject to numerous risks, many of which are outside of our control. Examples of such risks include:

the availability and cost of low- or non-carbon-based energy sources;
the evolving regulatory requirements affecting ESG standards or disclosures;
the availability of suppliers that can meet sustainability, diversity and other ESG standards that we may set;
our ability to recruit, develop and retain diverse talent in our labor markets; and
the success of our organic growth and acquisitions or dispositions of businesses or operations.

If we fail, or are perceived to be failing, to meet the standards included in any sustainability disclosure or the expectations of our various stakeholders, it could negatively impact our reputation, customer attraction and retention, access to capital and employee retention. In addition, new sustainability rules and regulations have been adopted and may continue to be introduced in various states and other jurisdictions. Our failure to comply with any applicable rules or regulations could lead to penalties and adversely impact our reputation, customer attraction and retention, access to capital and employee retention.

Provisions in the Indenture governing our outstanding convertible notes could delay or prevent an otherwise beneficial takeover of us.

On June 18, 2021, we issued $625.0 million aggregate principal amount of Notes, of which $290.5 million aggregate principal amount are still outstanding. Certain provisions in our Notes and our indenture governing our Notes could make a third party attempt to acquire us more difficult or expensive. For example, if a takeover constitutes a fundamental change, then noteholders will have the right to require us to repurchase their Notes for cash. In addition, if a takeover constitutes a make-whole fundamental change, then we may be required to temporarily increase the conversion rate. In either case, and in other cases, our obligations under our Notes and our indenture could increase the cost of acquiring us or otherwise discourage a third party from acquiring us or removing incumbent management, including in a transaction that our security holders may view as favorable.

We may need to seek or raise additional debt or equity capital to pursue our business objectives and respond to business opportunities, challenges or unforeseen circumstances. If such capital is not available to us, our business, financial condition and results of operations would be materially and adversely affected.

We may need to seek or raise additional debt or equity capital to in pursuit of various goals, including without limitation to fund our operations, pursue our business objectives, respond to business opportunities, challenges or unforeseen circumstances, successfully execute on our Value Maximization Plan, develop new products or services or further improve existing products and services, and acquire complementary businesses and technologies. To the extent we decide to seek or raise additional capital, there can be no assurance that additional funds, including any additional equity or debt financings, will be available in amounts or on terms acceptable to us, if at all.

36


Moreover, any debt financing that we secure would result in additional debt service obligations and the instruments governing such debt could provide for restrictive operating and financial covenants, security interests on our assets, and other terms that could be adverse to our current stakeholders, which may make it more difficult for us to obtain additional capital and to pursue business opportunities. Volatility in the credit markets may also have an adverse effect on our ability to obtain debt financing.

If we raise additional funds through further issuances of equity or convertible debt securities, our existing stockholders would suffer significant dilution, and any new equity securities we issue could have rights, preferences and privileges superior to those of holders of our commons stock.

If we require but are unable to obtain adequate financing or financing on terms or conditions satisfactory to us, we may be forced to obtain financing on undesirable terms or our ability to continue to pursue our business objectives, successfully respond to business opportunities, challenges or unforeseen circumstances, would be significantly limited, and our business, financial condition and results of operations would be materially and adversely affected.

Anti-takeover provisions in our governing documents and under Delaware law could make an acquisition of our company more difficult, limit attempts by our stockholders to replace or remove our current management, and depress the market price of our common stock.

Our amended and restated certificate of incorporation, amended and restated bylaws and Delaware law contain provisions that could have the effect of rendering more difficult, delaying or preventing an acquisition deemed undesirable by our board of directors. Among others, our amended and restated certificate of incorporation and amended and restated bylaws include the following provisions:

limitations on convening special stockholder meetings, which could make it difficult for our stockholders to adopt desired governance changes;

advance notice procedures, which apply for stockholders to nominate candidates for election as directors or to bring matters before an annual meeting of stockholders;

a prohibition on stockholder action by written consent, which means that our stockholders will only be able to take action at a meeting of stockholders;

a forum selection clause, which means certain litigation against us can only be brought in Delaware;

no authorization of cumulative voting, which limits the ability of minority stockholders to elect director candidates;

certain amendments to our certificate of incorporation require the approval of two-thirds of the then outstanding voting power of our capital stock;

our bylaws provide that the affirmative vote of two-thirds of the then-outstanding voting power of our capital stock, voting as a single class, is required for stockholders to amend or adopt any provision of our bylaws; and

the authorization of undesignated or “blank check” preferred stock, the terms of which may be established and shares of which may be issued without further action by our stockholders.

These provisions, alone or together, could delay or prevent hostile takeovers and changes in control or changes in our management. As a Delaware corporation, we are also subject to provisions of Delaware law, including Section 203 of the Delaware General Corporation Law (the “DGCL”), which prevents interested stockholders, such as certain stockholders holding more than 15% of our outstanding common stock from engaging in certain business combinations unless (i) prior to the time such stockholder became an interested stockholder, the board approved the transaction that resulted in such stockholder becoming an interested stockholder, (ii) upon consummation of the transaction that resulted in such stockholder becoming an interested stockholder, the interested stockholder owned 85% of the common stock or (iii) following board approval, the business combination receives the approval of the holders of at least two-thirds of our outstanding common stock not held by such interested stockholder.

Any provision of our amended and restated certificate of incorporation, amended and restated bylaws or Delaware law that has the effect of delaying, preventing or deterring a change in control could limit the opportunity for our

37


stockholders to receive a premium for their shares of our common stock and could also affect the price that some investors are willing to pay for our common stock.

45


Table of Contents

Our amended and restated certificate of incorporation provides that the Court of Chancery of the State of Delaware will be the sole and exclusive forum for substantially all disputes between us and our stockholders, and federal district courts will be the sole and exclusive forum for Securities Act claims, which could limit our stockholders’ ability to obtain a favorable judicial forum for disputes with us or our directors, officers or employees.

Our amended and restated certificate of incorporation provides that, unless we consent to the selection of an alternative forum, the Court of Chancery of the State of Delaware is the sole and exclusive forum for: (a) any derivative action or proceeding brought on our behalf; (b) any action asserting a claim of breach of fiduciary duty owed by any of our directors, officers or other employees to us or to our stockholders; (c) any action asserting a claim arising pursuant to the DGCL, our amended and restated certificate of incorporation or amended bylaws, or as to which the DGCL confers exclusive jurisdiction on the Court of Chancery of the State of Delaware; or (d) any action asserting a claim governed by the internal affairs doctrine; provided that the exclusive forum provisions will not apply to suits brought to enforce any liability or duty created by Exchange Act or to any claim for which the federal courts have exclusive jurisdiction. Our amended and restated certificate of incorporation further provides that, unless we consent in writing to the selection of an alternative forum, the federal district courts are the sole and exclusive forum for the resolution of any complaint asserting a cause of action arising under the Securities Act. The choice of forum provisions may limit a stockholder’s ability to bring a claim in a judicial forum that it finds favorable for disputes with us or our directors, officers or other employees, which may discourage such lawsuits against us and our directors, officers and other employees. Alternatively, if a court were to find the choice of forum provisions contained in our amended and restated certificate of incorporation to be inapplicable or unenforceable in an action, we may incur additional costs associated with resolving such action in other jurisdictions, which could harm our business, financial condition and results of operations.

If securities analysts docontinue not to publish research or reports about our company, or if they issue unfavorable commentary about us or our industry or downgrade our common stock, the price of our common stock could decline.

Our stock price and trading volume are heavilymay be influenced by the way analysts and investors interpret our financial information and other disclosures. If securities or industry analysts docontinue not to publish research or reports about our business, delay publishing reports about our business, or publish negative reports about our business,businesses, regardless of accuracy, our common stock price and trading volume could decline.

The trading market for our common stock depends, in part, on the research and reports that securities or industry analysts publish about us or our business. We do not have any control over these analysts.business, if any. Currently, [fifteen]no analysts cover our company. If the numberThe lack of analysts that cover us declines,analyst coverage could decrease demand for our common stock could decrease and our common stock price and trading volume may decline.decline even further.

Even if our common stock is actively covered by analysts in the future, we do not have any control over the analysts or the measures that analysts or investors may rely upon to forecast our future results. Over-reliance by analysts or investors on any particular metric to forecast our future results may result in forecasts that differ significantly from our own.

Regardless of accuracy, unfavorable interpretations of our financial information and other public disclosures could have a negative impact on our stock price. If our financial performance fails to meet analyst estimates, for any of the reasons discussed above or otherwise, or one or more of the analysts who cover us downgrade our common stock or change their opinion of our common stock, our stock price would likely decline.

Risks Related to Tax Matters

We may be limited in our ability to utilize, or may not be able to utilize, net operating loss carryforwards to reduce our future tax liability.

As of December 31, 20202023, we had substantial U.S. federal net operating loss (“NOL”) carryforwards, of $462.1 million, the utilization of which may be limited annually due to certain change in ownership provisions of Section 382 of the Internal Revenue Code of 1986, as amended (the “Code”). Some of our U.S. federal NOL carryforwards will begin to expire in 2034,2028, with the remaining losses having no expiration. Please refer to Note 15 to20 of our consolidated financial statements appearing

38


elsewhere in this Annual Report on Form 10-K for a further discussion of the carryforward of our NOLs. As of December 31, 2020,2023, we maintain a full valuation allowance of $121.9 million for our net deferred tax assets.

An “ownership change” (generally defined as greater than 50-percentage-point cumulative changes in the equity ownership of certain stockholders over a rolling three-year period) under Section 382 of the Code may limit our ability to utilize fully our pre-change NOL carryforwards to reduce our taxable income in periods following the ownership change. In general, an ownership change would limit our ability to utilize U.S. federal NOL carryforwards to an amount equal to the aggregate value of our equity at the time of the ownership change multiplied by a specified tax-exempt interest rate, subject to increase by certain built-in gains. Similar provisions of state tax law may also apply to our state NOL carryforwards. We

46


Table of Contents

believe we have undergone an ownership change for purposes of Section 382 of the Code in each of 2013, 2014, 2015 and 2015,2021, which substantially limits our ability to use U.S. federal NOL carryforwards generated prior to each such ownership change. In addition, future changes in our stock ownership, some of which may be beyond our control, could result in additional ownership changes under Section 382 of the Code.

Tax matters could impact our results of operations and financial condition.

We are subject to U.S. federal income tax, as well as income tax in certain states. Our provision for income taxes and cash tax liability in the future could be adversely affected by numerous factors including, changes in tax laws, regulations, accounting principles or interpretations thereof, which could materially and adversely impact our cash flows and our business, financial condition and results of operations in future periods. Increases in our effective tax rate could also materially affect our net results. The Tax Cuts and Jobs Act (the “TCJA”), which was enacted in 2017, significantly reformedIn addition, the Code. The TCJA, among other things, containedU.S. government may enact significant changes to corporatethe taxation of business entities including, a reduction ofamong others, an increase in the corporate income tax rate from a top marginal rate of 35% to a flat rate of 21%, limitations on the deduction for NOL carryforwards and the eliminationimposition of NOL carrybacks, in each case, for losses generated after December 31, 2017 (though anyminimum taxes. The likelihood of these changes being enacted or implemented is unclear. We are currently unable to predict whether such NOLs may be carried forward indefinitely),changes will occur and, limitationsif so, the ultimate impact on deductions for interest expense. The consolidated financial statements contained herein reflect the effects of the TCJA based on current guidance. However, there remain uncertainties and ambiguities in the application of certain provisions of the TCJA, and, as a result, we made certain judgments and assumptions in the interpretation thereof. The U.S. Treasury Department and the Internal Revenue Service (the “IRS”) may issue further guidance on how the provisions of the TCJA will be applied or otherwise administered that differs from our current interpretation. In addition, the TCJA could be subject to potential amendments and technical corrections, any of which could materially lessen or increase certain adverse impacts of the legislation on us.business. Further, we are subject to the examination of our income and other tax returns by the IRS and state and local tax authorities, which could have an impact on our business, financial condition and results of operations.

General Risk Factors

We may need to recognize impairment charges related to goodwill, identified intangible assets and fixed assets.

We are required to test goodwill and any other intangible asset with an indefinite life for possible impairment on the same date each year and on an interim basis if there are indicators of a possible impairment. There is significant judgment required in the analysis of a potential impairment of goodwill, identified intangible assets and other long-lived assets. If, as a result of a general economic slowdown or deterioration in one or more of the markets in which we operate or in our financial performance or future outlook, or if the estimated fair value of our long-lived assets decreases, we may determine that one or more of our long-lived assets is impaired. An impairment charge would be determined based on the estimated fair value of the assets and any such impairment charge could have a material adverse effect on our business, financial condition and results of operations.

Our business is subject to the risk of natural disasters, adverse weather events and other catastrophic events, and to interruption by manmade problems such as war and terrorism.

Our business is vulnerable to damage or interruption from earthquakes, fires, floods, hurricanes, power losses, telecommunications failures, terrorist attacks, acts of war, global pandemics, human errors and similar events. The third-party systems and operations on which we rely are subject to similar risks. For example, a significant natural disaster, such as an earthquake, fire, flood or hurricane could have an adverse effect on our business,businesses, financial condition and operating results, and our insurance coverage may be insufficient to compensate us for losses that may occur. ActsGlobal climate change is resulting in certain types of terrorism could also cause disruptions in our businesses, consumer demandnatural disasters occurring more frequently or the economy as a whole.with more intense effects. We may not have sufficient protection or recovery plans in some circumstances, such as if a natural disaster affects locations that store a significant amount of our inventory vehicles.circumstances. As we rely heavily on our computer and communications systems and the internet to conduct our businessbusinesses and provide high-quality customer service, any disruptions could negatively affect our ability to run our business,businesses, which could have an adverse effect on our business,businesses, financial condition, and operating results.

We are,

War and mayacts of terrorism in the future be, subject to legal proceedingsUnited States and abroad could also cause disruptions in our businesses, consumer demand or the economy as a whole. For example, the ongoing geopolitical conflicts and war in Europe and the Middle East could result in a slowdown in global economic growth, rising inflation, market disruptions and increased volatility in commodity prices in the ordinary courseUnited States. The extent and duration of the military actions, sanctions and resulting market disruptions could be significant and could potentially have substantial impact on the global economy and our business for an unknown period of time. The broader consequences of geopolitical tensions, such as embargoes, regional instability and geopolitical shifts; airspace bans relating to certain routes, or strategic decisions to alter certain routes; and potential retaliatory action by governments against companies, cannot be predicted. We may incur expenses or delays relating to such events outside of our business. If the outcomes of these proceedings are adverse to us, itcontrol, which could have a material adverse impact on our business, operating results and financial condition. Any such disruptions may also magnify the impact of other risks described in this Risk Factors section.

39


We may acquire other companies or technologies, which could divert our management’s attention, result in additional dilution to our stockholders and otherwise disrupt our operations and harm our results of operations.

Our success will depend, in part, on our ability to successfully wind-down our ecommerce business and develop and evolve UACC and CarStory. Although we have no plans to do so as of the filing of this Annual Report on Form 10-K, we may in the future determine to grow our businesses through the acquisition of complementary businesses and technologies rather than through internal development, as we did with our prior acquisitions of UACC and CarStory. The identification of suitable acquisition candidates can be difficult, time-consuming and costly, and we may not be able to successfully complete identified acquisitions or realize their intended benefits. The risks we face in connection with acquisitions include:

use of capital that could be used to improve our operations instead, and additional strain on our liquidity;
diversion of management time and focus from operating our business to addressing acquisition integration challenges;
coordination of technology, research and development and sales and marketing functions;
retention of employees from the acquired company;
potential adverse reactions to the acquisition by an acquired company’s customers;
cultural challenges associated with integrating employees from the acquired company into our organization;
integration of the acquired company’s accounting, management information, human resources and other administrative systems;
the need to implement or improve controls, policies and procedures at a business that, prior to the acquisition, may have lacked effective controls, policies and procedures;
potential write-offs of intangibles or other assets acquired in such transactions that may have an adverse effect onour results of operations;
liability for activities of the acquired company before the acquisition, including patent and trademark infringement claims, violations of laws, commercial disputes, tax liabilities and other known and unknown liabilities; and
litigation or other claims in connection with the acquired company, including claims from terminated employees, customers, former stockholders or other third parties.

Our failure to address these risks or other problems encountered in connection with our past or future acquisitions and investments could cause us to fail to realize the anticipated benefits of these acquisitions or investments, cause us to incur unanticipated liabilities and otherwise harm our business. Future acquisitions also could result in dilutive issuances of our equity securities, the incurrence of debt, contingent liabilities or amortization expenses, any of which could harm our financial condition. Also, the anticipated benefits of any acquisitions may not materialize. Any of these risks, if realized, could materially and adversely affect our business, financial condition and results of operations.

We are subject to various litigation matters from time to time, the outcome of which could have a material adverse effect on our business, financial condition and results of operations. Claims arising out of actual or alleged violations of law could be asserted against us by individuals, either individually or through class actions, by governmental entities in civil or criminal investigations and proceedings or by other entities. These claims could be asserted under a variety of laws, including but not limited to consumer finance laws, consumer protection laws, intellectual property laws, privacy laws, labor

47


Table of Contents

and employment laws, securities laws and employee benefit laws. These actions could expose us to adverse publicity and to substantial monetary damages and legal defense costs, injunctive relief and criminal and civil fines and penalties, including but not limited to suspension or revocation of licenses to conduct business. See Part I, Item 3. “Legal Proceedings.”

Our insurance may not provide adequate levels of coverage against claims.

We believe that we maintain insurance customary for businesses of our size and type. However, there are types of losses we may incur that cannot be insured against or that we believe are not economically reasonable to insure. Moreover, any loss incurred could exceed policy limits and policy payments made to us may not be made on a timely basis. For example, insurance we maintain against liability claims may not continue to be available on terms acceptable to us and such coverage may not be adequate to cover the types of liabilities actually incurred. A successful claim brought against us, if not fully covered by available insurance coverage, could materially and adversely affect our business, financial condition and results of operations.

If our operating and financial performance in any given period does not meet the guidance that we provide to the public, the market price of our common stock may decline.

From time to time, we provide public guidance on our expected operating and financial results for future periods. Any such guidance will be comprised of forward-looking statements subject to the risks and uncertainties described in this Annual Report on Form 10-K and in our other public filings and public statements. Any such guidance is prepared by our

40


management and is qualified by, and subject to, the assumptions and the other information contained or referred to in the relevant release and the factors described under “Special Note Regarding Forward-Looking Statements” in this Annual Report on Form 10-K and our current and periodic reports filed with the SEC.

Guidance is based upon a number of assumptions and estimates that, although presented with numerical specificity, are inherently subject to business, economic and competitive uncertainties and contingencies, many of which are beyond our control and are based upon specific assumptions with respect to future business decisions, some of which will change. We generally state possible outcomes as high and low ranges which are intended to provide a sensitivity analysis as variables are changed but are not intended to represent that actual results could not fall outside of the estimated ranges. The principal reason that we release this guidance is to provide a basis for our management to discuss our business outlook with analysts and investors. We do not accept any responsibility for any projections or reports published by any third parties. Moreover, even if we do issue public guidance, there can be no assurance that we will continue to do so in the future.

Guidance is necessarily speculative in nature, and it can be expected that some or all of the assumptions underlying the guidance furnished by us will not materialize or will vary significantly from actual results. Our actual results may not always be in line with or exceed any guidance we have provided, especially in times of economic uncertainty. If, in the future, our operating or financial results for a particular period do not meet any guidance we provide or the expectations of investment analysts, or if we reduce our guidance for future periods, the market price of our common stock may decline.

Short sellers of our stock may be manipulative and may drive down the market price of our common stock.

Short selling is the practice of selling securities that the seller does not own, but rather has borrowed or intends to borrow from a third party with the intention of buying identical securities at a later date to return to the lender. A short seller hopes to profit from a decline in the value of the securities between the sale of the borrowed securities and the purchase of the replacement shares, as the short seller expects to pay less in that purchase than it received in the sale. It is therefore in the short seller’s interest for the price of the stock to decline, and some short sellers publish, or arrange for the publication of, opinions or characterizations regarding the relevant issuer, often involving misrepresentations of the issuer’s business prospects and similar matters calculated to create negative market momentum, which may permit them to obtain profits for themselves as a result of selling the stock short.

As a public entity, we may be the subject of concerted efforts by short sellers to spread negative information in order to gain a market advantage. In addition, the publication of misinformation may also result in lawsuits, the uncertainty and expense of which could adversely impact our business,businesses, financial condition, and reputation. There are no assurances that we will not face short sellers' efforts or similar tactics in the future, and the market price of our common stock may decline as a result of their actions.

48


TableStockholder activism could disrupt our business, cause us to incur significant expenses, hinder execution of Contentsour business strategy, and impact our stock price.

We may in the future be subject to stockholder activism, which can arise in a variety of predictable or unpredictable situations, and can result in substantial costs and divert management’s and our Board of Director’s attention and resources from our businesses. Additionally, stockholder activism could give rise to perceived uncertainties as to our long-term businesses, financial forecasts, future operations and strategic planning, harm our reputation, adversely affect our relationships with our business partners, and make it more difficult to attract and retain qualified personnel. We may also be required to incur significant fees and other expenses related to activist matters, including for third-party advisors that would be retained by us to assist in navigating activist situations. Our stock price could fluctuate due to trading activity associated with various announcements, developments, and share purchases over the course of an activist campaign or otherwise be adversely affected by the events, risks and uncertainties related to any such stockholder activism.

Item 1B. Unresolved Staff Comments

Not Applicable.

41


Item 1C. Cybersecurity

Cybersecurity Risk Management and Strategy

We have developed and implemented a cybersecurity risk management program intended to protect the confidentiality, integrity, and availability of our critical systems and information.

We design and assess our program guided by a number of well-known industry standards, such as the National Institute of Standards and Technology (NIST) Risk Management Framework (RMF), International Organization for Standardization/International Electrotechnical Commission (ISO/IEC) 27001, and Center for Internet Security (CIS) Controls V8. This does not imply that we meet all of these standards, specifications, and requirements, only that we use these standards as a guide to help us identify, assess, and manage cybersecurity risks relevant to our business.

Our cybersecurity risk management program is integrated into our overall enterprise risk management program, and shares common methodologies, reporting channels and governance processes that apply across the enterprise risk management program to other legal, compliance, strategic, operational, and financial risk areas.

Key features of our cybersecurity risk management program include, but are not limited to, the following:

risk assessments designed to help identify material cybersecurity risks to our critical systems and, information;
an information security program, led by our Senior Director, Information Security, principally responsible for managing (1) our cybersecurity risk assessment processes, (2) our security controls, and (3) our response to cybersecurity incidents;
the use of external service providers, where appropriate, to assess, test or otherwise assist with aspects of our security processes;
cybersecurity awareness training of our employees;
a cybersecurity incident response plan that includes procedures for responding to cybersecurity incidents; and
a third-party risk management process for service providers, suppliers, and vendors based on their criticality and risk profile.

We have not identified risks from known cybersecurity threats, including as a result of any prior cybersecurity incidents, that have materially affected or are reasonably likely to materially affect us, including our operations, business strategy, results of operations, or financial condition. We face certain ongoing risks from cybersecurity threats that, if realized, are reasonably likely to materially affect us, including our operations, business strategy, results of operations, or financial condition. See “Risk Factors—Risks Related to Cybersecurity and Privacy—If we or our third-party providers sustain cyber-attacks or other privacy or data security incidents that result in security breaches, we could suffer a loss of sales and increased costs, exposure to significant liability, reputational harm and other negative consequences."

Cybersecurity Governance

Our Board considers cybersecurity risk as part of its risk oversight function and has delegated to the Audit Committee (the "Committee") oversight of cybersecurity and other information technology risks. The Committee oversees management’s implementation of our cybersecurity risk management program. Our cybersecurity risk management program is integrated into our overall enterprise risk management program, and shares common methodologies, reporting channels and governance processes that apply across the enterprise risk management program to other legal, compliance, strategic, operational, and financial risk areas.

Vroom’s Senior Director, Information Security reports to the Committee on a quarterly basis on our cybersecurity risks. In addition, the Senior Director, Information Security updates the Committee, as necessary, regarding any material cybersecurity incidents, as well as any incidents with lesser impact potential.

42


The Committee periodically reports to the full Board regarding its activities, including those related to cybersecurity. Committee members receive presentations on cybersecurity topics from our Senior Director, Information Security, internal security staff or external experts as part of the Committee’s continuing education on topics that impact public companies. Our management team, including Vroom’s Chief Executive Officer, Chief Financial Officer, Chief Legal Officer, Chief People and Culture Officer, and Head of Technology, is responsible for assessing and managing our material risks from cybersecurity threats. The team has primary responsibility for our overall cybersecurity risk management program and supervises both our internal information security program and personnel and certain of our retained external cybersecurity consultants. Our Senior Director of Information Security, reports to the VP of Engineering and is the head of the Company’s cybersecurity team. The Senior Director of Information Security is responsible for overseeing the Company’s security team and related initiatives. He has twenty-five years of experience in the technology industry with over ten years of experience in cybersecurity.

Our management team stays informed and monitors efforts to prevent, detect, mitigate, and remediate cybersecurity risks and incidents through various means, which may include briefings from internal information security personnel; threat intelligence and other information obtained from governmental, public or private sources, including external consultants engaged by us; and alerts and reports produced by security tools deployed in the IT environment.

Item 2. Properties

Our

We lease office space in Houston, Texas, consisting of approximately 102,492 square feet of space under a lease that expires in November 2024. We have used this space as our corporate headquarters is located in New York, New York, and consiststo support our administrative functions, including finance, human resources, information technology, engineering, sales and marketing and other administrative functions, all of which supported our Ecommerce and Wholesale segments.

In addition, we operated the TDA dealership outside Houston, Texas, consisting of approximately 22,54958,000 square feet under a lease that expires in September 2024. This space included our Vroom VRC, and supported reconditioning and sales operations for our Ecommerce segment. In connection with the Value Maximization Plan and the wind-down of the ecommerce business, we intend to cease using both facilities.

UACC leases office space in Newport Beach, California, consisting of approximately 20,058 square feet of space under a lease that expires on March 31, 2029. UACC uses this space as its corporate headquarters and to support UACC's retail indirect financing, including risk management, dealer compliance, finance and accounting, human resources, information technology, sales and marketing, credit underwriting and funding, all of which support our Retail Financing segment.

In addition, UACC leases office space in Fort Worth, Texas, consisting of approximately 106,500 square feet of space under a lease that expires in September 2024. We use these facilities for finance, legal, human resources, information technology, engineering, sales2031. UACC uses this space as its servicing center and marketingto support UACC's retail indirect financing, including servicing, collections, remarketing and other administrative functions. Werecovery operations. UACC also leaseleases office space outside Houston, Texas, which we use to support our administrative functions, under leases that expire in March 2024 and December 2022.

Additionally, we operate our Vroom VRC located outside Houston, Texas, under leases that expire in December 2023. We use our Vroom VRC to recondition vehicles.

We also operate the TDA dealership outside Houston, Texasof Buffalo, New York, consisting of approximately 12,000 square feet of space under a lease that expires in September 2024.June 2031. UACC uses this space as its buyer center and to conduct credit underwriting operations in support of its indirect retail financing. The Fort Worth and Buffalo spaces support our Retail Financing segment.

We have been negotiating early terminations of leases that are no longer needed for our ecommerce business. We believe our existing and planned facilities are sufficient for our current needs and that, should it be needed, suitable additional or alternative space will be available to accommodate our operations.

From time to time, we are subject to routine legal proceedings in the normal course of operating our business. AlthoughThe outcome of litigation, regardless of the merits, is inherently uncertain. Beginning in March 2021, multiple putative class actions were filed in the U.S. District Court for the Southern District of New York by certain of the Company’s stockholders against the Company and certain of the Company’s officers alleging violations of federal securities laws. The lawsuits

43


were captioned Zawatsky et al. v. Vroom, Inc. et al., Case No. 21-cv-2477; Holbrook v. Vroom, Inc. et al., Case No. 21-cv-2551; and Hudda v. Vroom, Inc. et al., Case No. 21-cv-3296. All three of the lawsuits asserted similar claims under Sections 10(b) and 20(a) of the Exchange Act, and SEC Rule 10b-5. In each case, the named plaintiff(s) sought to represent a proposed class of all persons who purchased or otherwise acquired the Company’s securities during a period from June 9, 2020 to March 3, 2021 (in the case of Holbrook and Hudda), or November 11, 2020 to March 3, 2021 (in the case of Zawatsky). In August 2021, the Court consolidated the cases under the new name In re: Vroom, Inc. Securities Litigation, Case No. 21-cv-2477, appointed a lead plaintiff and lead counsel and ordered a consolidated amended complaint to be filed. The court-appointed lead plaintiff subsequently filed a consolidated amended complaint that reasserts claims under Sections 10(b) and 20(a) of the Exchange Act, and SEC Rule 10b-5 against the Company and certain of the Company’s officers, and added new claims under Sections 11, 12 and 15 of the Securities Act against the Company, certain of its officers, certain of its directors, and the underwriters of the Company’s September 2020 secondary offering. The Company filed a motion to dismiss all claims, and briefing of this motion is complete. The Company believes this lawsuit is without merit and intends to vigorously contest these claims. While the outcome of litigationany complex legal proceeding is inherently difficultunpredictable and subject to predict, we aresignificant uncertainties, based upon information presently known to management, the Company believes that the potential liability, if any, will not involved in any legal proceedings that we believe could reasonably be expected to have a material adverse effect on our business,the Company’s financial condition, cash flows, or results of operations.

In August 2021, November 2021, January 2022, and February 2022, various Company stockholders filed purported shareholder derivative lawsuits on behalf of the Company in the U.S. District Court for the Southern District of New York against certain of the Company’s officers and directors, and nominally against the Company, alleging violations of the federal securities laws and breaches of fiduciary duty to the Company and/or related violations of Delaware law based on the same general course of conduct alleged in In re: Vroom, Inc. Securities Litigation. All four lawsuits have been consolidated under the case caption In re Vroom, Inc. Shareholder Derivative Litigation, Case No. 21-cv-6933, and the court has approved the parties’ stipulation that the cases would remain stayed pending final resolution of In re: Vroom, Inc. Securities Litigation. All four derivative suits remain in preliminary stages and there have been no substantive developments in any matter.

In April 2022, one of the Company’s stockholders filed a purported shareholder derivative lawsuit on behalf of the Company in the U.S. District Court for the District of Delaware against certain of the Company’s officers and directors, and nominally against the Company, alleging violations of the federal securities law and breaches of fiduciary duty to the Company and/or related violations of Delaware law based on the same general course of conduct alleged in In re: Vroom, Inc. Securities Litigation. The case is captioned Godlu v. Hennessy et al., Case No. 22-cv-569, and the court has approved the parties’ stipulation that the case would remain stayed pending final resolution of In re: Vroom, Inc. Securities Litigation. This lawsuit remains in preliminary stages and there have been no substantive developments.

In January 2022, the Company received a non-public civil investigative demand from the Federal Trade Commission (“FTC”), seeking the production of information related to certain of the Company's business practices and the Company responded to those information requests. On February 23, 2024, the FTC notified the Company that it has reason to believe that the Company violated Section 5(a) of the Federal Trade Commission Act, 15 U.S.C. § 45(a); the FTC's Mail, Internet, or Telephone Order Merchandise Rule, 16 C.F.R. Part 435; the FTC’s Used Motor Vehicle Trade Regulation Rule,16 C.F.R. Part 455; and the FTC’s Pre-Sale Availability Rule, 16 C.F.R. Part 702. The FTC advised the Company that it is authorized to negotiate a stipulated order and the Company intends to work cooperatively with the FTC towards a resolution. Because the matter is at an early stage and the outcome of any complex legal proceeding is inherently unpredictable and subject to significant uncertainties, the Company cannot determine at present whether any potential liability would have a material adverse effect on the Company’s financial condition, cash flows, or results of operations.

In April 2022, the Attorney General of Texas filed a petition on behalf of the State of Texas in the District Court of Travis County, Texas against the Company, alleging violation of the Texas Deceptive Trade Practices − Consumer Protection Act, Texas Business and Commerce Code § 17.41 et seq., based on alleged deficiencies and other issues in the Company’s marketing of used vehicles and fulfilment of customer orders, including the titling and registration of sold vehicles. According to the petition, 80% of the customer complaints referenced in the petition were received in the 12 months prior to April 2022. The petition is captioned State of Texas v. Vroom Automotive LLC, and Vroom Inc., Case No. D-1-GN-001809. In May 2022, Vroom Automotive, LLC the Attorney General of the State of Texas agreed to a temporary injunction in which Vroom Automotive, LLC agreed to adhere to its existing practice of possessing title for all vehicles it sells or advertises as available for sale on its ecommerce platform. In December 2023, Vroom, Inc., Vroom Automotive,

44


LLC and the Attorney General of the State of Texas reached a final agreement to resolve all claims in the petition, without any admission of wrongdoing by either Vroom entity. Under the agreement, the Company will pay a total of $2 million in civil penalties and $1 million in attorneys' fees, with the first half due in September 2024 and the remaining half due in September 2025, and abide permanently by an injunction of certain operational practices that were previously implemented. The agreement was approved by the District Court of Travis County on December 13, 2023.

In July 2022 and August 2022, respectively, certain plaintiffs filed two putative class action lawsuits in the District Court of Cleveland County, Oklahoma and the New York State Supreme Court, respectively, against Vroom, Inc., and Vroom Automotive LLC as defendants, alleging, among other things, deficiencies in Vroom’s titling and registration of sold vehicles: Blake Sonne, individually and on behalf of all others similar situated, v. Vroom Automotive, LLC and Vroom, Inc., No. CJ-2022-822 and Emely Reyes Martinez, on behalf of all others similarly situated, v. Vroom Automotive, LLC and Vroom Inc., No. 652684/2022. The Company removed the cases to the U.S. District Court for the Western District of Oklahoma (Case No. 22-cv-761) and the U.S. District Court for the Southern District of New York (Case No. 22-cv-7631), respectively, and filed motions to compel arbitration of all claims in both cases. In September 2023, Vroom’s motions to compel arbitration were granted in both cases, and the court actions stayed pending the outcome of any arbitration proceeding over the respective plaintiffs’ individual claims. On February 9, 2024, the parties filed a joint stipulation to dismiss the Sonne matter with prejudice.

As previously disclosed, we have been subject to audits, requests for information, investigations and other inquiries from our regulators relating to increased customer complaints concerning the same or similar matters alleged in the State of Texas petition. These regulatory matters could continue to progress into legal proceedings as well as enforcement actions. We have incurred fines in certain states and could continue to incur fines, penalties, restitution, or alterations in our business practices, which in turn, could lead to increased business expenses, additional limitations on our business activities and further reputational damage, although to date such expenses have not had a material adverse effect on the Company’s financial condition, cash flows, or results of operations.

Item 4. Mine Safety Disclosures

Not applicable.


4945


INFORMATION ABOUT OUR EXECUTIVE OFFICERS AND DIRECTORS

The following table sets forth information regarding our executive officers and directors as of the date of this Annual Report on Form 10-K.

Name

Age

Position(s)

Name

Age

Position(s)

Robert J. Mylod, Jr.

57

54

Chairperson of the Board

Scott A. DahnkeTimothy M. Crow

68

55

Director

Michael J. Farello

59

56

Director

Laura W. Lang

68

65

Director

Laura G. O’Shaughnessy

46

43

Director

Adam ValkinPaula B. Pretlow

68

46

Director

Paul J. HennessyThomas H. Shortt

55

56

Chief Executive Officer, Director, and President and Chief Executive Officer of UACC

David K. JonesRobert R. Krakowiak

53

51

Chief Financial Officer

Mark E. RoszkowskiPatricia Moran

64

50

Chief Revenue Officer

Patricia Moran

61

Chief Legal Officer and Secretary

C. Denise Stott

56

53

Chief People and Culture Officer

Robert J. Mylod, Jr. has served as a member of our boardBoard of directorsDirectors since September 2015.2015 and Independent Executive Chair of the Board since May 2022. Mr. Mylod is the Managing Partner of Annox Capital Management, a private investment firm that he founded in 2013. Previously, Mr. Mylod served as Head of Worldwide Strategy & Planning and Vice ChairmanChair for Bookings Holdings, Inc., an online travel services provider, from January 2009 to March 2011 and as its Chief Financial Officer and Vice Chairman from November 2000 to January 2009. He currently serves as the ChairmanChair of the board of directors and a member of the compensation committee of Booking Holdings, Inc. Mr. Mylod also currently serves as a member of the board of directors and of the audit committee of Redfin Corporation, an online real estate company. He is also a member of the board of directors and of the audit and compensation committees of Dropbox, Inc., a cloud-based collaboration and data storage company, and a number ofseveral private companies. Mr. Mylod holds a Bachelor of Arts in English from the University of Michigan and a Master of Business Administration from the University of Chicago Booth School of Business and a Bachelor of Arts in English from the University of Michigan.School. We believe that Mr. Mylod’s experience as a venture capital investor and a senior finance executive, including having served as the chief financial officer and vice chairman of a large publicly traded online services provider, qualifies him to serve on our boardBoard of directors.Directors.

Scott A. Dahnke

Timothy M. Crow has served on our boardBoard of directorsDirectors since July 2015. Since 2016,October 2022. Mr. Dahnke has served as co-ChiefCrow is the Chief Executive Officer of L Catterton, a consumer-focused private equity firm, after previously serving as Managing Partner from 2003 to 2015. Prior to that, he was Managing Director of Deutsche Bank Capital Partners, the former private equity division of Deutsche Bank AG, from 2002 to 2003, and Managing Director of AEA InvestorsFernwood Holdings, a venture capital investment firm focused on hyper-growth innovators. Mr. Crow has led an accomplished career spanning more than 20 years in human capital management for leading consumer retail companies. From May 2002, Mr. Crow served in roles of increasing responsibility at The Home Depot, Inc., the world's largest home improvement specialty retailer, culminating in his role as Executive Vice President, Chief Human Resources Officer from 1998February 2007 to 2002. Previously, Mr. Dahnke was Chief Executive Officer of infoGROUP (formerly known as InfoUSA), a provider of data and data-driven marketing services, from 1997 to 1998.July 2017. Prior to joining infoUSA,that, Mr. DahnkeCrow served clients on an arrayas Senior Vice President, Human Resources of strategic and operational issues asKmart Corporation, a Partner at McKinsey & Company. His early career also includes experience in the Merger Department of Goldman, Sachs & Co. and with General Motors.leading general merchandise retailer, from May 1999 through May 2002. Mr. Dahnke currently serves as Chairperson of the board of directors and of the compensation committee and the nominations, corporate governance and social responsibility committee of Williams Sonoma Inc. and as a member of the board of directors and of the technology, environmental safety and security committee of Norwegian Cruise Lines Holdings, as well as servingCrow previously served as a director of severalMilacron Holdings, Corp., a global leader in the plastic technology and processing industry, where he chaired its Leadership Development and Compensation Committee, and currently serves as a director of a number of private companies. Mr. Dahnke holdsCrow earned a Bachelor of ScienceArts degree from theCalifornia State University of Notre Dame and a Master of Business Administration from Harvard Business School.at Northridge. We believe that Mr. Dahnke’sCrow’s extensive leadership experience, in private equityhuman capital management expertise, and investment and expertise in the ecommerce, retail and consumer industry along with his service as a director at numerous companiesexperience qualifies him to serve on our board of directors.

50


Table of Contents

Michael Farello has served on our boardBoard of directorsDirectors since July 2015. Since 2006, Mr. Farello has served as Managing Partner at L Catterton, a consumer-focused private equity firm. Prior to this, he served as an executive at Dell Technologies, Inc., a global end-to-end technology provider, from 2002 to 2005, and spent twelve years at McKinsey & Company, a management consulting firm. Mr. Farello currently serves as a member of the board of directors of several private companies including FlashParking, Inc. and ClassPassHydrow Inc. Mr. Farello holds a Bachelor of Science from Stanford University and a Master of Business Administration from Harvard Business School. We believe Mr. Farello’s experience in

46


private equity investments and expertise in the consumer sector, along with his service as a director at numerous companies, qualifies him to serve on our boardBoard of directors.Directors.

Laura W. Lang has served on our boardBoard of directorsDirectors since May 2020. Ms. Lang has served as the Managing Director of Narragansett Ventures, LLC, a strategic advisory firm focused on digital business transformation and growth investing, since January 2014. Since November 2018, Ms. Lang has also served as an adviser to L Catterton. Ms. Lang was the Chief Executive Officer of Time Inc., one of the largest branded media companies in the world, until 2013. From 2008 until she joined Time Inc. in 2012, Ms. Lang was Chief Executive Officer of Digitas Inc., a marketing and technology agency and unit of Publicis Groupe S.A. In addition, she headed the company’s pure-play digital agencies, including Razorfish, Big Fuel, Denuo and Phonevalley. Ms. Lang currently serves as a member of the board of directors and the talent and compensation and finance committees of V. F. Corporation, an international apparel and footwear company.company, and a member of the board of directors and chair of the compensation committee of Oscar Health Inc., a health insurance company built on a technology platform. She previously served as a member of the board of directors of Care.com Inc. from August 2014 to June 2016, Nutrisystem, Inc. from 2010 to 2012 and Benchmark Electronics, Inc. from 2005 to 2011. Ms. Lang holds a Bachelor of Arts from Tufts University and a Master of Business Administration from the Wharton School of the University of Pennsylvania. We believe Ms. Lang’s extensive leadership experience, digital and media expertise and service on the board of directors of other public companies qualifies her to serve on our boardBoard of directors.Directors.

Laura G. O’Shaughnessy has served on our boardBoard of directorsDirectors since May 2020. Until recently,Since December 2022, Ms. O'Shaughnessy has served as the Chief Marketing Officer and Co-Founder of Picnic Group, a data-driven consumer packaged goods company where she oversees the scaling of founder-created consumer packaged food brands. Prior to The Picnic Group, Ms. O’Shaughnessy was a strategic growth and operations consultant for a number of direct to consumer brands. Previously she was the Chief Executive Officer of SocialCode, LLC (now named Code3), a technology company that manages digital and social advertising for leading consumer brands, which she co-founded in 2009. Previously, Ms. O’Shaughnessy oversaw business development2009 and product strategy for the Slate Group, an online publisher, where she specialized in advertising product development and strategic partnerships.led until August 2020. Ms. O’Shaughnessy currently serves as a member of the board of directors and of the audit committee and governance committee of Acuity Brands, and on the boards of several nonprofits.directors of two nonprofits in Washington, D.C. Ms. O’Shaughnessy holds a Bachelor of Arts in Economics from the University of Chicago and a Master of Business Administration from the MIT Sloan School of Management and a Bachelor of Arts in Economics from the University of Chicago.Management. We believe Ms. O’Shaughnessy’s extensive leadership experience, including serving in a chief executive officer role, and digital and technology expertise, qualifies her to serve on our boardBoard of directors.Directors.

Adam Valkin

Paula B. Pretlow has served on our Board of Directors since April 2021. Ms. Pretlow is a former Senior Vice President of The Capital Group, an investment management firm, where she led the public fund business development and client relationship group and was also responsible for large client relationships from 1999 until 2011. Prior to joining The Capital Group, she worked for Montgomery Asset Management and Blackrock (formerly Barclays Global Investors). She is a member of the board of directors since December 2015. Since 2013, Mr. Valkin has served as Managing Director of General Catalyst, a venture capital firm. Mr. Valkin currentlyand serves on the boardsaudit and finance committee of Williams-Sonoma, Inc. She is also a member of the board of directors of several private companies. Mr. ValkinGreenlight Financial Technology, Inc., where she serves on the audit committee. In addition, she currently serves as chair of the board of The Harry and Jeanette Weinberg Foundation, is a member of the board of trustees of The Kresge Foundation, and she is a charter board trustee of Northwestern University. Ms. Pretlow holds a Bachelor of Arts in EconomicsPolitical Science and a Master of Business Administration, both from Harvard University.Northwestern University, and is a 2017 Fellow of Stanford’s Distinguished Careers Institute. We believe Mr. Valkin’sMs. Pretlow’s extensive leadership experience, including roles in private equity investmentsfinance and expertise in consumer businesses,business development, along with his serviceher experience as a director, qualify her to serve on our Board of Directors.

Thomas H. Shortt has served as the Company's Chief Executive Officer since May 2022 and previously served as the Company's Chief Operating Officer from January 2022. Since March 1, 2024, Mr. Shortt has also served as President and Chief Executive Officer of UACC. Prior to joining Vroom, Mr. Shortt served as Senior Vice President at numerous companiesWalmart Inc. ("Walmart") starting in 2018, where he developed a comprehensive ecommerce supply chain strategy and led improvements through advanced analytics, processes, and systems. Prior to his time at Walmart, Mr. Shortt served as Senior Vice President of Supply Chain at The Home Depot, Inc. starting in 2013, and previously held senior leadership roles overseeing supply chain, fulfillment and logistics, with an emphasis on change management and business transformation, at ACCO Brands Corporation, Unisource Worldwide, Inc., Fisher Scientific International, Inc. and Office Depot, Inc. Mr. Shortt holds a Bachelor’s degree in Accounting from the University of Akron and is a graduate of the Harvard Business School Advanced Management Program. We believe that Mr. Shortt’s service as our chief executive officer and his expertise in supply chain, logistics, data analytics and change management qualifies him to serve on our boardBoard of directors.Directors.

Paul J. Hennessy

47


Robert R. Krakowiak has served as our Chief ExecutiveFinancial Officer and as a memberTreasurer of our board of directorsVroom since June 2016. Mr. Hennessy has over 20 years of global ecommerce leadership experience, previously serving in several leadership roles for Booking Holdings, Inc. (“Booking Holdings”), a world leader in online travel. At Booking Holdings,September, 2021. Prior to that he most recently served as Chief ExecutiveFinancial Officer and Treasurer of Priceline.com, a leading online travel agency for finding discount rates for travel-related purchases, from April 2015 to JuneStoneridge Corporation since August 2016 and was appointed as Chief Marketing Officer of Booking.com, a leading online service for booking accommodation reservations, from November 2011 to March 2015. Mr. Hennessy also currently serves on the board of directors of Shutterstock Inc. Mr. Hennessy holds a Bachelor of ScienceExecutive Vice President in Marketing Management from Dominican College and a Master of Business Administration from Long Island University. Mr. Hennessy was selected to serve on our board of directors based on his deep experience and the perspective he brings as our Chief Executive Officer, as well as his extensive prior ecommerce leadership experience, driving growth strategies and optimizing operations and marketing for profitability.

David K. Jones has served as our Chief Financial Officer since NovemberOctober 2018. Prior to joining Vroom, heStoneridge, Mr. Krakowiak served as Executive Vice President, Treasurer and Chief Financial Officer of Iconix Brand Group, Inc., a global brand management company,Investor Relations at Visteon Corporation from July 20152012 until August 2016. Prior to November 2018. From May 2011that, Mr. Krakowiak held various financial positions at Owens Corning from 2005 to July 2015,2012. Mr. Jones served as Executive Vice President and Chief Financial Officer of Penske Automotive Group, an international transportation services company operating automotive and commercial truck dealerships. Mr. Jones joined Penske Automotive Group in 2003 and served in various senior

51


Table of Contents

management roles through May 2011. He began his career in public accounting at Andersen LLP and remained there for over a decade. Mr. JonesKrakowiak holds a Bachelor of Business Administration in Accounting from Seton Hall University.

Mark E. Roszkowski has served as our Chief Revenue Officer since February 2019. Prior to joining Vroom, Mr. Roszkowski served as Executive Vice President, Global Head of Corporate Development, StrategyScience and Strategic Partnerships of Verizon Media, the media and online businesses division of Verizon Communications Inc., from June 2017 to January 2019. He previously served as Senior Vice President, Global Head of Corporate Development, Strategy and Strategic Partnerships of AOL Inc., a web portal and online service provider, from June 2014 through its sale to Verizon in June 2015 and subsequently until June 2017. Mr. Roszkowski holds a B.S. in Mechanical Engineering from Worcester Polytechnic Institute, a Master of Science degrees in MechanicalElectrical Engineering from the University of RochesterMichigan and a Masteran M.B.A. from the University of Business Administration from Massachusetts InstituteChicago Booth School of Technology.Business.

Patricia Moran has served as our Chief Legal Officer and Secretary since January 2019. Previously, Ms. Moran was a Managing Director, Chief Legal Officer and Secretary of Greenhill & Co. Inc., a publicly traded, global independent investment bank, from April 2014 to October 2016, and a Senior Advisor from November 2016 to April 2017. Prior to joining Greenhill, Ms. Moran was a Partner at Skadden, Arps, Slate, Meagher & Flom LLP, a leading global law firm where she had a 30-year career and chaired the New York office Diversity Committee. Ms. Moran has broad experience in corporate governance and corporate transactions, including mergers and acquisitions, private equity, joint ventures, restructurings and corporation finance. Ms. Moran holds a Bachelor of Science from the University of Scranton and a Juris Doctor from the Villanova University School of Law.

C. Denise Stott has served as our Chief People and Culture Officer since November 2016. Previously, Ms. Stott was Senior Vice President of Human Resources at Undertone, a digital advertising company, from May 2013 to October 2016. Ms. Stott’s tenure at Undertone included leading the human resources function through multiple transformations including acquisitions and the eventual sale to a public company. From February 2010 until she joined Undertone, Ms. Stott was Vice President of Human Resources at Yodle, a leader in local online marketing, where she led people development through a focus on talent acquisition, employee engagement, employee training and compensation and benefits. Ms. Stott also served as Senior Vice President of Human Resources for ZenithOptimedia, a media and advertising services provider, from August 2007 to July 2009. Ms. Stott holds a Bachelor of Science in Mathematical Economics from Tulane University and a Master of Business Administration from Vanderbilt University.

52

48


PART II

Item 5. Market for Registrant’s Common Equity, Related Stockholder Matters, and Issuer Purchases of Equity Securities.

Market Information

On June 9, 2020, our common stock began trading on the Nasdaq Global Select Market under the ticker symbol "VRM." Prior to that date, there was no public trading market for our common stock.

Holders of Record

We are authorized to issue up to 500,000,000 shares of common stock and up to 10,000,000 shares of preferred stock. As of March 1, 2021,7, 2024, there were 4020 stockholders of record of our common stock. The actual number of stockholders is greater than this number of record holders, and includes stockholders who are beneficial owners, but whose shares are held in street name by brokers and other nominees. This number of holders of record also does not include stockholders whose shares may be held in trust by other entities.

Dividend Policy

We have not declared or paid any cash dividends on our common stock during the fiscal year and do not currently anticipate paying cash dividends in the foreseeable future.

Stock Performance Graph

The information contained in this Stock Performance Graph section shall not be deemed to be “soliciting material” or “filed” or incorporated by reference in future filings with the SEC, or subject to the liabilities of Section 18 of the Exchange Act, except to the extent that we specifically incorporate it by reference into a document filed under the Securities Act or the Exchange Act.

The following graph compares the total stockholder return from June 9, 2020, the date on which our common shares commenced trading on the Nasdaq Global Select Market, through December 31, 2020 of (i) our common stock, (ii) the Standard and Poor's 500 Stock Index ("S&P 500") and (iii) the Standard and Poor's 500 Retailing Index ("S&P 500 Retailing Index"), assuming an initial investment of $100 on June 9, 2020 including reinvestment of dividends where applicable. The results presented below are not necessarily indicative of future performance.
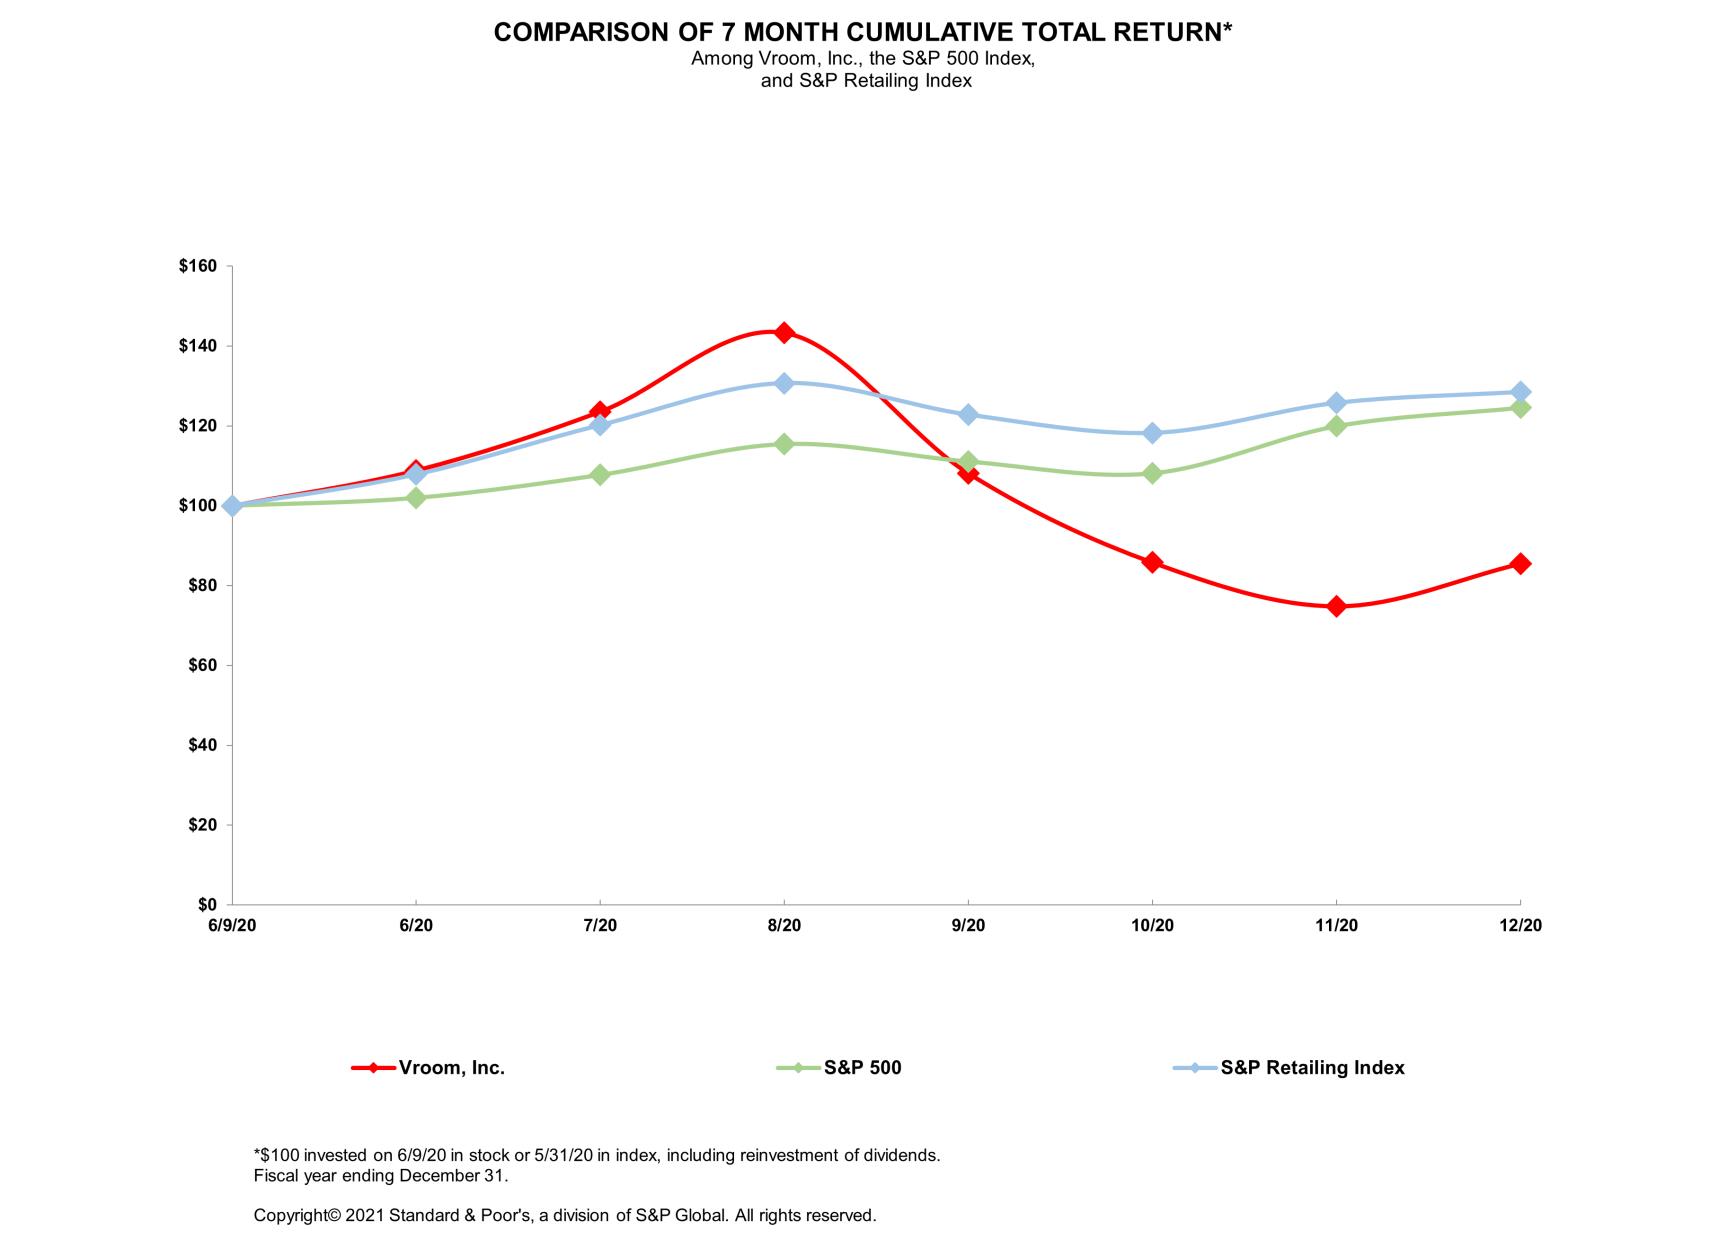
53


Table of Contents

Purchases of equity securities by the Issuer or affiliated purchasers

None.

None.

Recent sales of unregistered securities

There were no unregistered equity securities sold from January 1, 2020 to December 31, 2020, other than as previously disclosed in our Quarterly Reports on Form 10-Q.

None.

Use of Proceeds from Public Offering of Common Stock

On June 11, 2020, we completed our IPO. The offer and sale of all of the shares in the IPO were registered under the Securities Act pursuant to a registration statement on Form S-1 (File No. 333-238482), as amended, which was declared effective by the SEC on June 8, 2020. There has been no material change in the planned use of proceeds from our IPO as described in our final prospectus filed with the SEC on June 9, 2020 pursuant to Rule 424(b)(4).

54


Table of Contents

Item 6. Selected Financial Data

The following tables present our selected consolidated financial and other data. We have derived the selected consolidated statements of operations data for the years ended December 31, 2020, 2019, and 2018 and the consolidated balance sheet data asAs of December 31, 2020 and 20192023, we had fully utilized the net proceeds from our consolidated financial statements included elsewhere in this Annual Report on Form 10-K. You should read the following selected consolidated financial and other data together with the information under the section titled “Management’s Discussion and Analysis of Financial Condition and Results of Operations,” and our consolidated financial statements and related notes included elsewhere in this Annual Report on Form 10-K.IPO.


Year Ended

December 31,


2020


2019


2018


(in thousands, except share and per share data)


Total revenue


$

1,357,700


$

1,191,821


$

855,429


Cost of sales


1,286,155


1,133,962


794,622


Total gross profit


71,545


57,859


60,807


Selling, general and administrative expenses


245,546


184,988


133,842


Depreciation and amortization


4,598


6,019


6,857


Loss from operations


(178,599

)


(133,148

)


(79,892

)

Interest expense


9,656


14,596


8,513


Interest income


(5,896

)


(5,607

)


(3,135

)

Revaluation of preferred stock warrant


20,470


769


174


Other income, net


(114

)


(96

)


(495

)

Loss before provision for income taxes


(202,715

)


(142,810

)


(84,949

)

Provision for income taxes


84


168


229


Net loss


$

(202,799

)


$

(142,978

)


$

(85,178

)

Accretion of redeemable convertible preferred stock


(132,750

)


(13,036

)

Net loss attributable to common stockholders


$

(202,799

)


$

(275,728

)


$

(98,214

)

Net loss per share attributable to common stockholders,

   basic and diluted(1)


$

(2.76

)


$

(32.04

)


$

(11.50

)

Weighted-average number of shares outstanding used to

   compute net loss per share attributable to common

   stockholders, basic and diluted(1)


73,345,569


8,605,962


8,540,778


As of

December 31,


2020


2019


Cash and cash equivalents


$

1,056,213


$

217,734


Total assets


1,724,056


563,387


Total liabilities


496,954


262,907


Total redeemable convertible preferred stock


874,332


Total stockholders’ equity (deficit)


1,227,102


(573,852

)

(1)

See Note 16 to our consolidated financial statements included elsewhere in this Annual Report on Form 10-K for an explanation of the calculations of our net loss per share attributable to common stockholders, basic and diluted, for the years ended December 31, 2020, 2019, and 2018.


Year Ended

December 31,


2020


2019


2018


Ecommerce units sold


34,488


18,945


10,006


Vehicle Gross Profit per ecommerce unit


$

869


$

1,109


$

1,666


Product Gross Profit per ecommerce unit


896


587


576


Total Gross Profit per ecommerce unit


$

1,765


$

1,696


$

2,242


Average monthly unique visitors


969,890


653,216


291,772


Listed Vehicles


15,963


4,956


3,421


Ecommerce average days to sale


66


68


59


(a)

See “Management’s Discussion and Analysis of Financial Condition and Results of Operations—Key Operating and Financial Metrics” for information on how we define these key operating and financial metrics.

5549


Item 6. [Reserved].

50


Item 7. Management’s Discussion and Analysis of Financial Condition and Results of Operations

The following discussion and analysis of our financial condition and results of operations should be read in conjunction with our consolidated financial statements and related notes appearing elsewhere in this Annual Report on Form 10-K. As discussed in the section titled "Special Note Regarding Forward-Looking Statements," the following discussion and analysis contains forward-looking statements that involve risks and uncertainties, as well as assumptions that, if they never materialize or prove incorrect, could cause our results to differ materially from those expressed or implied by such forward-looking statements. Factors that could cause or contribute to these differences include, but are not limited to, those identified below and those incorporated by reference into the section titled "Risk Factors" in Part I Item 1A of this Annual Report on Form 10-K. Additionally, our historical results are not necessarily indicative of the results that may be expected for any period in the future.

A discussion regarding

Recent Events

Value Maximization Plan

On January 22, 2024, we announced that our Board had approved the Value Maximization Plan, pursuant to which we discontinued our ecommerce operations and are in the process of winding down our used vehicle dealership business in order to preserve liquidity and enable us to maximize stakeholder value through our remaining businesses. We have suspended transactions through vroom.com, completed transactions for customers who had previously contracted with us to purchase or sell a vehicle, halted purchases of additional vehicles, sold substantially all of our used vehicle inventory through wholesale channels and paid off our 2022 Vehicle Floorplan Facility. We continue to take other actions to maximize the value of our remaining ecommerce assets, reduce our outstanding commitments and preserve our liquidity, and have been executing a reduction-in-force commensurate with our reduced operations. Although we expect the ecommerce wind down to be substantially complete by the end of the first quarter of 2024, we may incur additional wind-down costs through the end of 2024.

We also own and operate UACC, a leading automotive finance company that offers vehicle financing to its customers through third-party dealers under the UACC brand, and CarStory, an artificial intelligence-powered analytics and digital services platform for automotive retail. The UACC and CarStory businesses will continue to serve their third-party customers, with their operations substantially unaffected by Vroom’s ecommerce wind-down. We will seek to grow and enhance the profitability of the UACC and CarStory businesses going forward.

As a result of the Value Maximization Plan, we estimate that we will incur total cash charges of approximately $16.5 million for severance and other personnel-related costs and approximately $15.0 million in contract and lease termination costs. As part of a planned reduction-in-force under the Value Maximization Plan, we anticipate that approximately 800 employees will be impacted upon substantial completion of the wind-down, resulting in a reduction of approximately 93% of the employees not engaged in UACC’s or CarStory’s ongoing operations.

We determined a triggering event existed as of December 31, 2023, resulting in long–lived asset impairment charges of $47.4 million. The impairment charges consist of $23.9 million related to "Property and equipment, net", $22.2 million related to "Operating lease right-of-use assets", and $1.3 million related to "Other assets" on our consolidated balance sheet. Refer to Note 7 — Property and Equipment, Net and Note 12 — Leases in our consolidated financial conditionstatements included elsewhere in this Annual Report on Form 10-K for further discussion.

Repayment of 2022 Vehicle Floorplan Facility

On January 19, 2024, we amended our 2022 Vehicle Floorplan Facility. As a result of the amendment, borrowings under the 2022 Vehicle Floorplan Facility were suspended for future vehicle purchases and resultswe were required to maintain 40% of operationour outstanding borrowings in cash. In addition, all other financial covenants were eliminated. As a result of the liquidation of our vehicle inventory, we repaid the remaining outstanding balance related to the 2022 Vehicle Floorplan Facility in full and the agreement has been terminated.

Nasdaq Notice and Reverse Stock Split

On December 21, 2023, we received written notice from The Nasdaq Stock Market LLC (“Nasdaq”) notifying us that, for the last 30 consecutive business days, the bid price for our common stock had closed below the $1.00 per share

51


minimum bid price requirement for continued inclusion on the Nasdaq Global Select Market pursuant to Nasdaq Listing Rule 5450(a)(1) (the "Minimum Bid Price Requirement").

On February 13, 2024, after obtaining stockholder approval, we effected a 1-for-80 reverse stock split (the "Reverse Stock Split"), and our stock began trading on a post-split adjusted basis on February 14, 2024. On February 29, 2024, we were notified by the Nasdaq Listing Qualifications staff that the closing bid price of our common stock had been at $1.00 per share or greater for 11 consecutive business days, from February 14, 2024 to February 28, 2024. Accordingly, the Company has regained compliance with Nasdaq Listing Rule 5450(a)(1) and this matter is now closed. If our common stock again closes below the $1.00 per share minimum bid price required by Nasdaq for 30 consecutive business days, we would again receive another notice of non-compliance with Nasdaq's listing standards and face the risk of delisting.

All shares of the Company’s common stock, stock-based instruments, and per-share data included in this Annual Report on Form 10-K have been retroactively adjusted as though the Reverse Stock Split has been effected prior to all periods presented.

Overview

During the fiscal year ended December 31, 2020 compared to2023, the year ended December 31, 2019 is presented below. A discussion regarding our financial condition and results of operations for the year ended December 31, 2019 compared to the year ended December 31, 2018 is included under “Management’s Discussion and Analysis of Financial Condition and Results of Operations” in our prospectus for our Follow-on Public Offering, which was filed with the SEC pursuant to Rule 424(b)period covered by this Annual Report on September 11, 2020.

Overview

Form 10-K, Vroom isoperated an innovative, end-to-end ecommerce platform that is transforming the used vehicle industry by offering a better way to buy and a better way to sell used vehicles. We are deeply committedVroom also owns United Auto Credit Corporation, a leading automotive finance company that offers vehicle financing to creating an exceptional experienceits customers through third-party dealers under the UACC brand, and the CarStory business, a leader in AI-powered analytics and digital services for our customers.automotive retail.

We are driving enduring change in the industry on a national scale. We take a vertically integrated, asset-light approach that is reinventing

Former Ecommerce Operations

Vroom's ecommerce platform combined automotive ecommerce, vehicle operations and data science and experimentation to bring all phases of the vehiclecar buying and selling process from discovery to deliveryconsumers wherever they are, offering an extensive selection of used vehicles, transparent pricing, competitive financing, and everything in between. Ourat-home pick-up and delivery. Vroom’s ecommerce platform encompasses:

Ecommerce:    We offer an exceptional ecommerce experience for our customers. In contrast to legacy dealershipsoffered thousands of vehicles that had undergone detailed inspections, met proprietary reconditioning standards and were backed by a Vroom 90-day limited warranty. The platform provided comprehensive and transparent information on each of the peer-to-peer market,vehicles we provide consumerssold and provided buyers with a personalized, intuitive interface with specific sorting, searching and intuitive ecommerce interface to research and select from thousands of fully reconditioned vehicles. Ourfiltering functionality. The platform is accessible at any time on any device and provides transparent pricing,offered integrated, real-time financing solutions through strategic partnerships with automotive finance lenders and nationwide contact-free delivery right to a buyer’s driveway.through our subsidiary, UACC. For consumers looking to sell or trade in their vehicles, we provide attractive market-based pricing, real-time price quotes and convenient, contact-free at-homethe platform offered the ease of online submission of basic vehicle pick-up.

Vehicle Operations:    Our scalable andinformation to receive an on-demand appraisal. Vroom’s vehicle operations encompassed a vertically integrated operations underpin our business model. We strategically source inventory from auctions, consumers, rental car companies, OEMsapproach to sourcing, transporting, reconditioning, delivering, and dealers. We improve our ability to acquire high-demand vehicles through enhanced supply science across all our sourcing channels and we have expanded our national marketing efforts to drive consumer sourcing. In our reconditioning and logistics operations, we deploy an asset-light strategy that optimizes a combination of ownership and operation of assets by us with strategic third-party partnerships. This hybrid approach provides flexibility, agility and speed without taking on unnecessary risk and capital investment, and drives improved unit economics and operating leverage.

Data Science and Experimentation:    picking up vehicles. Data science and experimentation arewas at the core of everythingVrooms operations, and we do. We relyrelied on data science, machine learning and A/B and multivariate testing to continually drive optimization and operating leverage across our ecommerce and vehicle operations. We leverage dataPursuant to increase the effectivenessValue Maximization Plan described above, we are conducting an orderly wind-down of our nationalecommerce business starting in 2024. Although we expect the ecommerce wind down to be substantially complete by the end of the first quarter of 2024, we may incur additional wind-down costs through the end of 2024.

UACC

UACC, which Vroom acquired in February 2022, is an indirect lender that offers vehicle financing to consumers through third-party dealers under the UACC brand, focusing primarily on the non-prime market. Prior to Vroom’s wind-down of its ecommerce operations, UACC also offered vehicle financing to Vroom’s customers through its ecommerce platform.

UACC, which has been engaged in automotive finance since 1996, currently offers financing services to a nationwide network of thousands of manufacturer-franchised and performanceindependent motor vehicle dealers in 49 states, and we seek to expand that network over time. UACC enables these dealers to finance their customers' purchases of new and used automobiles, medium and light duty trucks and vans with competitive financing terms. The credit programs offered by UACC are primarily designed to serve consumers who have limited access to traditional motor vehicle financing.

In addition to its financing expertise, the UACC platform brings with it extensive application processing, underwriting, and servicing capabilities. UACC services the retail installment sales contracts it originates or purchases and

52


will continue to service the contracts it originated or purchased for customers of Vroom’s former ecommerce business. Because UACC focuses primarily on the non-prime market, it generally sustains a higher level of delinquencies and credit losses than that experienced by traditional motor vehicle financing sources. As of December 31, 2023, UACC serviced a portfolio of approximately 79,000 retail installment sales contracts with an aggregate principal outstanding balance of $1.1 billion.

Loss before provision for income taxes for UACC on a standalone basis was $41.2 million and $16.2 million for the years ended December 31, 2023 and 2022, respectively, including intercompany eliminations of $17.7 million and $6.2 million, respectively.

CarStory

CarStory is a leader in AI-powered analytics and digital services for automotive retail. CarStory offers its digital retailing services to dealers, automotive financial services companies and others in the automotive industry, which use CarStory’s solutions to enhance their customer experience and drive increased vehicle purchases.

CarStory drives automotive retail innovation by aggregating, optimizing and distributing data from thousands of automotive sources. CarStory tracks over three and a half million unique vehicle identification numbers ("VINs") listed for sale every day. This data is aggregated with demand insights from millions of consumer sessions and VIN data from CarStory's proprietary VIN database to generate accurate price and sales predictions. CarStory helps dealers optimize their pricing by leveraging data science models for retail pricing that provide predictive pricing for marketing, buying, selling and VIN-level features.

In addition to its data analytics and digital services, CarStory powers white labeled storefronts for automotive marketplaces and finance companies. In developing its white label capabilities, CarStory also has developed a variety of consumer-focused functions designed to enhance the customer experience analyze market dynamics at scale, calibrate our vehicle pricing and optimize our overall inventory sales velocity. On the operations side,drive conversion. CarStory's data and data science and experimentation enables us to fine tune our supply, sourcing and logistics models and to streamline our reconditioning processes.

In 2019, the U.S. usedassets create significant opportunity for automotive market is the largest consumerAI product category, generating approximately $841 billion from sales. Based on data from Cox Automotive, there were an estimated 37.2 million used vehicle transactions in 2020, compared to approximately 40 million transactions in 2019. The U.S. used automotive market is also highly fragmented,development, with over 42,000 dealers200 million VINs, over three billion photos and millions of peer-to-peer transactions across the country. It also is ripe for disruption as an industry that is notorious for consumer dissatisfactionprice and has one of the lowest levels of ecommerce penetration. Industry reports estimate that ecommerce penetration will grow to as much as half of all used vehicle sales by 2030. price elasticity models.

Our platform, coupled with our national presence and brand, provides a significant competitive advantage versus local dealerships and regional players that lack nationwide reach and scalable technology, operations and logistics. The traditional auto dealers and peer-to-peer market do not and cannot offer consumers what we offer.   Segments

56


Table of Contents

Our Model

We generate revenue through the sale of used vehicles and value-added products. We sell vehicles directly to consumers primarily through our Ecommerce segment. As the largest segment in our business, Ecommerce revenue grew 55.7% from 2019 to 2020, and we expect Ecommerce to continue to outgrow our other segments as it is the core focus of our growth strategy.

We also sell vehicles through wholesale channels, which provide a revenue source for vehicles that do not meet our Vroom retail sales criteria. Additionally, we generate revenue through the retail sale of used vehicles and value-added products at Houston-based Texas Direct Auto, or TDA.

ForIn the year ended December 31, 2020, our Ecommerce, Wholesale2023 and TDA segments represented 67.4%, 18.1%prior periods, we managed and 14.5% of our total revenue, respectively.

Our retail gross profit consists of two components: Vehicle Gross Profit and Product Gross Profit. Vehicle Gross Profit is calculated as the aggregate retail sales price for all vehicles sold to customers along with delivery fee revenue and document fees received from customers, less the aggregate cost to acquire such vehicles, the aggregate cost of inbound transportation for such vehicles to our vehicle reconditioning centers, which we refer to as VRCs, and the aggregate cost of reconditioning such vehicles for sale. Product Gross Profit consists of fees earned on any finance and protection products sold as part of a vehicle sale. Because we are paid fees on the value-added products we sell, our gross profit on such products is equal to the revenue we generate. See “—Key Operating and Financial Metrics.”

Below is an explanation of how we calculate vehicle gross profit per unit and product gross profit per unit:

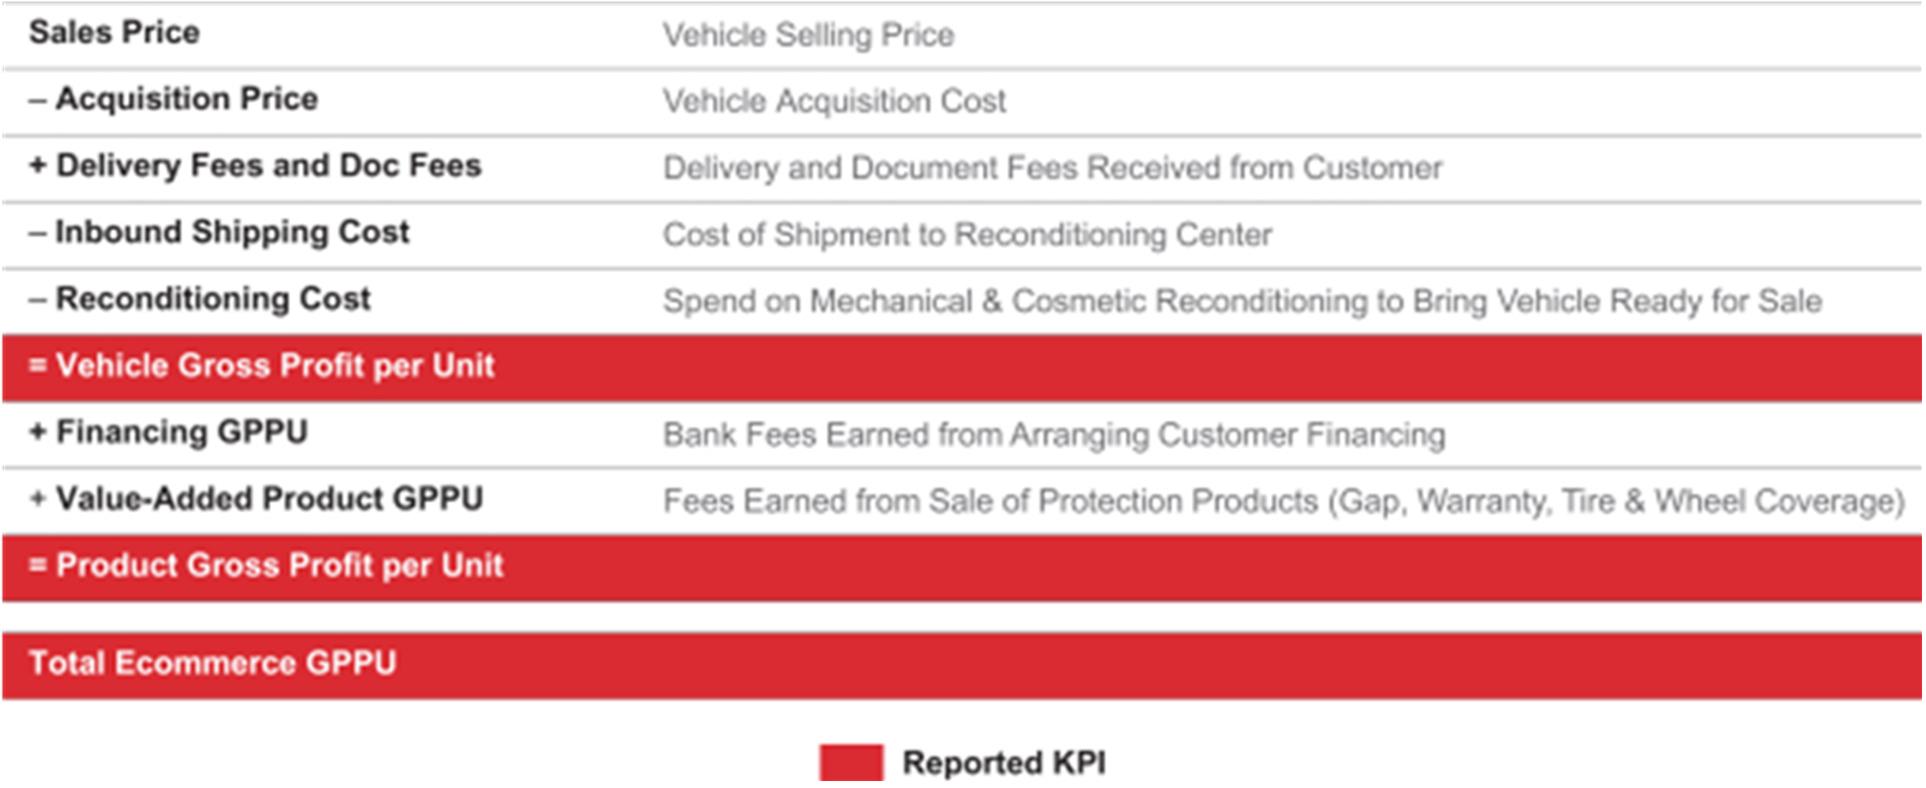
Our profitability depends primarily on increasing unit sales and operating leverage, as well as improving unit economics. We deploy an asset-light strategy that optimizes a combination of ownership and operation of assets by us with strategic third-party partnerships. Our hybrid approach also applies to the third-party value-added products we sell to customers, which enables us to generate additional revenue streams without taking on the risk associated with underwriting vehicle financing or protection products. As we scale, we expect to benefit from efficiencies and operating leverage across our business, including our marketing and technology investments, and our inventory procurement, logistics, reconditioning and sales processes.

Inventory Sourcing

We source our vehicle inventory from a variety of channels, including auctions, consumers, rental car companies, OEMs and dealers. Because the quality of vehicles and associated gross margin profile vary across each channel, the mix of inventory sources has an impact on our profitability. We continually evaluate the optimal mix of sourcing channels to generate the highest sales margins and shortest inventory turns, both of which contribute to increased gross profit per unit. We generate a vast set of data derived from market demand, pricing dynamics, vehicle acquisitions and subsequent sales, and we leverage that data to optimize future vehicle acquisitions. As we scale, we expect to continue to leverage the data at our disposal to optimize and enhance the volume and selection of vehicles in our inventory and, in turn, drive revenue growth and profitability. We are also exploring third party inventory strategies, which offers the possibility of expanding our sourcing channels through third party sellers while offering us attractive revenue models in an asset light, debt free structure. See “—Key Factors and Trends Affecting our Operating Results—Ability to drive growth by cost effectively increasing the volume and selection of vehicles in our inventory.”

57


Table of Contents

Vehicle Reconditioning

Before a vehicle is listed for retail sale on our platform, it undergoes a thorough reconditioning process in order to meet our Vroom retail sales criteria. The efficiency of this reconditioning process is a key element in our ability to profitably grow. To recondition vehicles, we rely on a combination of our Vroom VRC along with a network of VRCs owned and operated by third parties, and we intend to continue to expand our network of third-party VRCs. Utilizing this hybrid approach, we have increased our total reconditioning capacity to approximately 2,000 units per week as of December 31, 2020, with approximately two-thirds from our eighteen third-party VRCs. As we increase the number of vehicles in our inventory and expand our reconditioning capacity, we expect that reconditioning costs and inbound shipping costs per unit will decrease as we benefit from economies of scale and operating leverage in reconditioning costs. See “—Key Factors and Trends Affecting our Operating Results—Ability to expand and optimize our reconditioning capacity to satisfy increasing demand.”

Logistics Network

For our logistics operations, we primarily have used national third-party carriers, which has allowed us to efficiently deliver vehicles to customers throughout the United States while focusing on expanding other critical components of our business, such as the volume and selection of vehicles in our inventory. We optimized our third-party logistics network nationally through the development of strategic carrier arrangements with national haulers and consolidated our carrier base into dedicated operating regions. This strategy enhanced the flexibility, agility and speed of our growth while reducing the need for additional capital commitments as we scaled our business. Since the start of the COVID-19 pandemic, we have experienced a reduced supply of carriers, increased shipping prices and deteriorating service levels. Thus, in response to these disruptions, and to further enhance the quality of our logistics operations and our customer experience, we have been accelerating our strategy to optimize our hybrid approach by expanding our proprietary logistics network. Initially we have been prioritizing investment in our last-mile delivery operations where we can have the greatest impact on the customer experience. We also have invested in short-haul trucks to make regional deliveries from our last mile hubs, and have begun to invest in long-haul vehicles for hub-to-hub shipments. Consistent with our hybrid approach, as we scale our business, we continue to strategically combine the operation of our expanded proprietary fleet with the use of third-party carriers, which we expect will enable us to both accommodate our growth and provide the highest level of customer service.  See “—Key Factors and Trends Affecting our Operating Results—Ability to expand and develop our logistics network.”

Value-Added Products

We generate revenue by earning fees for selling value-added products to customers in connection with vehicle sales. Currently, our third-party value-added product offering consists of finance and protection products, including financing from third-party lenders for our customers’ vehicle purchases, as well as sales of vehicle service contracts, GAP protection and tire and wheel coverage. As we scale our business, we intend to introduce additional value-added products that will be attractive to our customers and drive revenue and profitable growth. We expect that both expanded product offerings and increased attachment rates in value-added product sales will have a positive impact on our profitability. See “—Key Factors and Trends Affecting our Operating Results—Ability to increase and better monetize value-added products.”

Our Segments

We manage and reportreported operating results through three reportable segments:

Ecommerce (67.4%64.5% of 20202023 revenue; 49.3%70.0% of 20192022 revenue): The Ecommerce segment represents retail sales of used vehicles through our ecommerce platform, and feesrevenue earned on vehicle financing originated by UACC or our third-party financing sources and sales of value-added products associated with those vehiclevehicles sales.

Wholesale (18.1%11.7% of 20202023 revenue; 17.9%15.1% of 20192022 revenue): The Wholesale segment represents sales of used vehicles through wholesale channels.

TDA Retail Financing (14.5%17.6% of 20202023 revenue; 32.8%7.8% of 20192022 revenue): The TDARetail Financing segment represents retail salesUACC’s operations with its network of used vehicles from TDAthird-party dealership customers.

As a result of the Value Maximization Plan and fees earned on salesthe wind-down of value-added products associated with those vehicle sales.

58


Tableour ecommerce operations, we will discontinue reporting our results through our Ecommerce and Wholesale segments starting in the first quarter of Contents2024.

Gross profit is defined as revenue less cost of sales for each segment. Reflected below is a summary of reportable segment revenue and reportable segment gross profit for the years ended December 31, 2020, 2019,2023 and 2018:2022:

53


Year Ended

December 31,


2020


2019


2018


(in thousands)


Revenue:


Ecommerce


$

915,451


$

588,114


$

301,172


Wholesale


245,580


213,464


174,514


TDA


196,669


390,243


379,743


Total revenue


$

1,357,700


$

1,191,821


$

855,429


Gross profit (loss):


Ecommerce


$

60,861


$

32,127


$

22,425


Wholesale


(1,432

)


340


3,257


TDA


12,116


25,392


35,125


Total gross profit


$

71,545


$

57,859


$

60,807


Table of Contents


Year Ended
December 31,


2023


2022


(in thousands)


Revenue:


Ecommerce


$

576,170


$

1,364,195


Wholesale


104,119


293,528


Retail Financing


156,938


152,542


All Other


55,976


138,636


Total revenue


$

893,203


$

1,948,901


Gross profit (loss):


Ecommerce


$

59,231


$

99,973


Wholesale


(34,353

)


(10,620

)

Retail Financing


125,610


138,381


All Other


11,459


17,053


Total gross profit


$

161,947


$

244,787


Key Operating and Financial Metrics

We

Prior to the wind-down of our ecommerce operations, including the periods presented in this Annual Report on Form 10-K, we regularly reviewreviewed a number of metrics, including the following key operating and financial metrics, to evaluate our business, measure our performance, identify trends in our business, prepare financial forecasts and make strategic decisions. We believe these operational measures arewere useful in evaluating our performance, in addition to our financial results prepared in accordance with U.S. Generally Accepted Accounting Principles, or U.S. GAAP. You should read the key operating and financial metrics in conjunction with the following discussion of our results of operations and together with our consolidated financial statements and related notes included elsewhere in this Annual Report on Form 10-K. We focusfocused heavily on metrics related to unit economics as improved gross profit per unit iswas a key element of our growth and profitability strategies. As a result of the Value Maximization Plan and the wind-down of our ecommerce operations, we have discontinued evaluating our business using these key operating and financial metrics in the first quarter of 2024.

The calculation of our key operating and financial metrics is straightforward and does not rely on significant projections, estimates or assumptions. Nevertheless, each of our key operating and financial metrics has limitations because each focuses specifically on only one standard by which to evaluate our business, without taking into account other applicable standards, performance measures or operating trends by which our business could be evaluated. Accordingly, no single metric should be viewed as the bellwether by which our business should be measured. Rather, each key operating and financial metric should be considered in conjunction with other metrics and components of our results of operations, such as each of the other key operating and financial metrics and our revenues, inventory, loss from operations and segment results.


Year Ended
December 31,


2023


2022


Ecommerce units sold


17,401


39,278


Vehicle gross profit per ecommerce unit


$

594


$

1,033


Product gross profit per ecommerce unit


2,809


1,512


Total gross profit per ecommerce unit


$

3,403


$

2,545


Average monthly unique visitors


2,060,804


1,866,197


Ecommerce average days to sale


217


131


Inventory turnover


3.02


3.05


Inventory days to supply


121


120


Year Ended

December 31,


2020


2019


2018


Ecommerce units sold


34,488


18,945


10,006


Vehicle Gross Profit per ecommerce unit


$

869


$

1,109


$

1,666


Product Gross Profit per ecommerce unit


896


587


576


Total Gross Profit per ecommerce unit


$

1,765


$

1,696


$

2,242


Average monthly unique visitors


969,890


653,216


291,772


Listed Vehicles


15,963


4,956


3,421


Ecommerce average days to sale


66


68


59


5954


Table of Contents

Ecommerce Units Sold

Ecommerce units sold is defined as the number of vehicles sold and shipped to customers through our ecommerce platform, net of returns under our Vroom 7-Day Return Program. Ecommerce units sold excludesexclude on-site sales of vehicles at Texas Direct Auto ("TDA") and through the TDA and Wholesale segments. As we continue to expand our ecommerce business, we expect that ecommerce units sold will be the primary driver of our revenue growth. Additionally, eachsegment. Each vehicle sale through our ecommerce platform also createscreated the opportunity to leverage such sale to provide vehicle financing, sell value-added products. Continued ecommerce growth will also increase the number ofproducts and acquire trade-in vehicles acquired from our customers, which we cancould either recondition and add to our inventory or sell through wholesale channels.

Vehicle Gross Profit per Ecommerce Unit

Vehicle Gross Profit per ecommerce unit, which we refer to as Vehicle GPPU, for a given period is defined as the aggregate retail sales price and delivery charges for all vehicles sold through our Ecommerce segment less the aggregate costs to acquire those vehicles, the aggregate costs of inbound transportation to the VRCsvehicle reconditioning centers ("VRCs") and the aggregate costs of reconditioning those vehicles in that period, divided by the number of ecommerce units sold in that period. As we continue to expand our ecommerce business, we believe Vehicle GPPU will be a key driver of our long-term profitability.

Product Gross Profit per Ecommerce Unit

Product Gross Profit per ecommerce unit, which we refer to as Product GPPU, for a given period is defined as the aggregate fees earned on sales of third-party vehicle financing and value-added products in that period, net of the reserves for chargebacks on such products in that period, divided by the number of ecommerce units sold in that period. Because we arewere paid fees on the vehicle financing and value-added products we sell,sold, our gross profit iswas equal to the revenue we generategenerated from the sale of value-addedsuch products. We planStarting in 2022, Product Gross Profit also included (i) interest income earned on finance receivables from Vroom customers to continue to introduce initiatives to increasefinance vehicle sales that we originated through UACC before the attachment ratescontracts are sold, (ii) interest income on finance receivables held in consolidated VIEs less the interest expense incurred on securitization debt, and when applicable (iii) gain on sales of value-added products and expand our offeringssecuritized finance receivables, divided by the number of value-added products which will grow our Product GPPU.ecommerce units sold in that period.

Total Gross Profit per Ecommerce Unit

Total Gross Profit per ecommerce unit, which we refer to as Total GPPU, for a given period is calculated as the sum of Vehicle GPPU and Product GPPU. We view Total GPPU as a key metric of the profitability of our Ecommerce segment.

Average Monthly Unique Visitors

Average monthly unique visitors is defined as the average number of individuals who access our ecommerce platform within a calendar month. We calculate the average monthly unique visitors over any period by dividing the aggregate monthly unique visitors during such period by the number of months in that period. We use average monthly unique visitors to measure the quality of our customer experience, the effectiveness of our marketing campaigns and customer acquisition as well as the strength of our brand and market penetration.

Average monthly unique visitors is calculated using data provided by Google Analytics. The computation of average monthly unique visitors excludes individuals who access our platform multiple times within a calendar month, counting such individuals only one time for purposes of the calculation. If an individual accesses our ecommerce platform using different devices or different browsers on the same device within a given month, the first access through each such device or browser is counted as a separate monthly unique visitor.

Listed Vehicles

We define listed vehicles as the aggregate number of vehicles listed on our platform at any given point in time. Listed vehicles includes vehicles that are available for sale, pending sale and “coming soon”. Listed vehicles is a key indicator of our performance because we believe that the number of vehicles listed on our platform is a key driver of vehicle sales and revenue growth. Increasing the number of vehicles listed on our platform results in a greater selection of vehicles for our customers, creating demand and increasing conversion.

Ecommerce Average Days to Sale

We define ecommerce average days to sale as the average number of days between our acquisition of vehicles and the final delivery of such vehicles to customers through our ecommerce platform. We calculate average days to sale for a given period by dividing the aggregate number of days between the acquisition of all vehicles sold through our ecommerce platform during such period and final delivery of such vehicles to customers by the number of ecommerce units sold in that period. Ecommerce average days to sale excludes vehicles sold on-site at TDA and through the TDA and Wholesale segments.segment.

6055


Table of Contents

EcommerceInventory turnover

We calculate inventory turnover for a given period as total retail and wholesale cost of sales for the respective period annualized and divided by average inventory (computed using the current and immediately preceding quarter-end balances).

Inventory days to sale is an important metric becausesupply

We calculate inventory days to supply for a reduction ingiven period by dividing average inventory by total retail and wholesale cost of sales per day for the number of days between the acquisition of a vehicle and the delivery of such vehicle typically results in a higher gross profit per unit.respective period.

Non-GAAP Financial Measures

In addition to our results determined in accordance with U.S. GAAP, we believe the following non-GAAP financial measures are useful in evaluating our operating performance: EBITDA, Adjusted EBITDA, and Adjusted loss from operations, Non-GAAP net loss, Non-GAAP net loss per share and Non-GAAP net loss per share, as adjusted.EBITDA excluding securitization gain. These non-GAAP financial measures have limitations as analytical tools in that they do not reflect all of the amounts associated with our results of operations as determined in accordance with U.S. GAAP. Because of these limitations, these non-GAAP financial measures should be considered along with other operating and financial performance measures presented in accordance with U.S. GAAP. The presentation of these non-GAAP financial measures is not intended to be considered in isolation or as a substitute for, or superior to, financial information prepared and presented in accordance with U.S. GAAP. We have reconciled all non-GAAP financial measures with the most directly comparable U.S. GAAP financial measures.

EBITDA, Adjusted EBITDA, and Adjusted loss from operations, Non-GAAP net loss, Non-GAAP net loss per share and Non-GAAP net loss per share, as adjustedEBITDA excluding securitization gain are supplemental performance measures that our management uses to assess our operating performance and the operating leverage in our business. Because EBITDA, Adjusted EBITDA, and Adjusted loss from operations, Non-GAAP net loss, Non-GAAP net loss per share and Non-GAAP net loss per share, as adjustedEBITDA excluding securitization gain facilitate internal comparisons of our historical operating performance on a more consistent basis, we use these measures for business planning purposes.

EBITDA, Adjusted EBITDA, and Adjusted EBITDA excluding securitization gain

We calculate EBITDA as net loss before interest expense, interest income, income tax expense and depreciation and amortization expense and weexpense.

We calculate Adjusted EBITDA as EBITDA adjusted to exclude severance costs, gain on debt extinguishment, severe weather-related costs, long-lived asset impairment charges, goodwill impairment charge, realignment costs, acquisition related costs, and the one-time, IPO related acceleration of non-cash stock-based compensation expense,compensation. Changes in fair value of financial instruments can fluctuate significantly from period to period and were previously related primarily to historical finance receivables and debt that have been securitized, and were acquired on February 1, 2022 from UACC. As a result of market conditions at the one-time, IPOtime, the financial instruments related non-cash revaluationto the 2022-2 and 2023-1 securitization transactions are recognized on balance-sheet and accounted for under the fair value option. See Note 17 — Financial Instruments and Fair Value Measurements to our consolidated financial statements included elsewhere in this Annual Report on Form 10-K. As a result, the majority of our finance receivables are now carried at fair value and a preferred stock warrant,significant portion of the risk of loss associated with these finance receivables have been retained by UACC. We therefore have determined we will no longer make any adjustments for such fluctuations in fair value to our Adjusted EBITDA results. We have recast the prior periods presented to conform to current period presentation. We may account for future securitizations as on balance sheet transactions depending on market conditions.

We calculate Adjusted EBITDA excluding securitization gain as Adjusted EBITDA adjusted to exclude the securitization gain from the sale of UACC's finance receivables as it provides a useful perspective on the underlying operating results and acquisition related costs. trends as well as a means to compare our period-over-period results.

56


Table of Contents

The following table presents a reconciliation of EBITDA, Adjusted EBITDA, and Adjusted EBITDA excluding securitization gain to net loss, which is the most directly comparable U.S. GAAP measure:


Year Ended

December 31,


2020


2019


2018


(in thousands)


Net loss


$

(202,799

)


$

(142,978

)


$

(85,178

)

Adjusted to exclude the following:


Interest expense


9,656


14,596


8,513


Interest income


(5,896

)


(5,607

)


(3,135

)

Provision for income taxes


84


168


229


Depreciation and amortization expense


4,654


6,157


6,932


EBITDA


$

(194,301

)


$

(127,664

)


$

(72,639

)

One-time IPO related acceleration of non-cash stock-based compensation


1,262


One-time IPO related non-cash revaluation of preferred stock warrant


20,470


Acquisition related costs


2,080


Adjusted EBITDA


$

(170,489

)


$

(127,664

)


$

(72,639

)

Adjusted loss from operations


Year Ended
December 31,


2023


2022


(in thousands)


Net loss


$

(365,540

)


$

(451,910

)

Adjusted to exclude the following:


Interest expense


45,445


40,693


Interest income


(21,158

)


(19,363

)

Provision (benefit) for income taxes


615


(19,680

)

Depreciation and amortization


43,476


38,707


EBITDA


$

(297,162

)


$

(411,553

)

Severance costs


$

6,703


$


Gain on debt extinguishment


(37,878

)


(164,684

)

Hail storm costs


2,353


Long-lived asset impairment charges


48,748


5,806


Goodwill impairment charge


201,703


Realignment costs


15,025


Acquisition related costs


5,653


Acceleration of non-cash stock-based compensation


2,439


Adjusted EBITDA


$

(277,236

)


$

(345,611

)

Securitization gain


(45,589

)

Adjusted EBITDA excluding securitization gain


$

(277,236

)


$

(391,200

)

We calculate Adjusted loss from operations as loss from operations adjusted to exclude the one-time, IPO related acceleration of non-cash stock-based compensation expense and acquisition related costs. The following table presents a reconciliation of Adjusted loss from operations to loss from operations, which is the most directly comparable U.S. GAAP measure:


Year Ended

December 31,


2020


2019


2018


(in thousands)


Loss from operations


$

(178,599

)


$

(133,148

)


$

(79,892

)

Add: One-time IPO related acceleration of non-cash stock based compensation


1,262


Add: Acquisition related costs


2,080


Adjusted loss from operations


$

(175,257

)


$

(133,148

)


$

(79,892

)

61


Table of Contents

Non-GAAP net loss, Non-GAAP net loss per share and Non-GAAP net loss per share, as adjusted

We calculate Non-GAAP net loss as net loss adjusted to exclude the one-time, IPO related acceleration of non-cash stock-based compensation expense, the one-time, IPO related non-cash revaluation of a preferred stock warrant, and acquisition related costs. We calculate Non-GAAP net loss per share as Non-GAAP net loss divided by weighted average number of shares outstanding. The following table presents a reconciliation of Non-GAAP net loss and Non-GAAP net loss per share to net loss and net loss per share, which are the most directly comparable U.S. GAAP measures:


Year Ended

December 31,


2020


2019


2018


Net loss


$

(202,799

)


$

(142,978

)


$

(85,178

)

Accretion of redeemable convertible preferred stock


(132,750

)


(13,036

)

Net loss attributable to common stockholders


$

(202,799

)


$

(275,728

)


$

(98,214

)

Add: One-time IPO related acceleration of non-cash stock based compensation


1,262


Add: One-time IPO related non-cash revaluation of preferred stock warrant


20,470


Add: Acquisition related costs


2,080


Non-GAAP net loss


$

(178,987

)


$

(275,728

)


$

(98,214

)


Weighted-average number of shares outstanding used to compute net loss per share, basic and diluted


73,345,569


8,605,962


8,540,778


Net loss per share, basic and diluted


$

(2.76

)


$

(32.04

)


$

(11.50

)

Impact of one-time IPO related acceleration of non-cash stock based compensation


0.02


Impact of one-time IPO related non-cash revaluation of preferred stock warrant


0.28


Impact of acquisition related costs


0.03


Non-GAAP net loss per share, basic and diluted


$

(2.43

)


$

(32.04

)


$

(11.50

)

Non-GAAP net loss per share, as adjusted, basic and diluted(a)


$

(1.37

)


$

(1.11

)


$

(0.66

)

(a)Non-GAAP net loss per share, as adjusted has been computed to give effect to, as of the beginning of each period presented, (i) the shares of common stock issued in connection with our IPO (ii) the automatic conversion of all outstanding shares of redeemable convertible preferred stock into shares of common stock that occurred upon the consummation of our IPO and (iii) the shares of common stock issued in connection with our follow-on public offering. The computation of Non-GAAP net loss per share, as adjusted is as follows:


Year Ended

December 31,


2020


2019


2018


Non-GAAP net loss


$

(178,987

)


$

(275,728

)


$

(98,214

)

Add: Accretion of redeemable convertible preferred stock


132,750


13,036


Non-GAAP net loss, as adjusted


$

(178,987

)


$

(142,978

)


$

(85,178

)


Weighted-average number of shares outstanding used to compute net loss per share,

basic and diluted


73,345,569


8,605,962


8,540,778


Add: unweighted adjustment for common stock issued in connection with IPO


24,437,500


24,437,500


24,437,500


Add: unweighted adjustment for conversion of redeemable convertible preferred stock in connection with IPO


85,533,394


85,533,394


85,533,394


Add: unweighted adjustment for common stock issued in connection with follow-on public offering


10,800,000


10,800,000


10,800,000


Less: Adjustment for the impact of the above items already included in weighted-average number of shares outstanding for the periods presented


(63,865,903

)


Weighted-average number of shares outstanding used to compute net loss per share, as adjusted, basic and diluted


130,250,560


129,376,856


129,311,672


Non-GAAP net loss per share, as adjusted, basic and diluted


$

(1.37

)


$

(1.11

)


$

(0.66

)

62


Table of Contents

Recent Events

Initial Public Offering

On June 11, 2020, we completed an initial public offering, or IPO, in which we sold 24,437,500 shares of common stock, which included 3,187,500 shares sold pursuant to the exercise by the underwriters of an over-allotment option to purchase additional shares, at a public offering price of $22.00 per share. We received proceeds of approximately $504.0 million, net of underwriting discount and before deducting offering expenses of $7.5 million, from sales of our shares in the IPO. Prior to the completion of the IPO, we effected a 2-for-1 forward stock split of all the issued and outstanding shares of our common stock the (“Stock Split”). As a result of the Stock Split and the completion of the IPO, all of our redeemable convertible preferred stock outstanding automatically converted into an aggregate of 85,533,394 shares of our common stock.

Follow-on Public Offering

On September 15, 2020, we closed on our follow-on public offering in which we sold 10,800,000 shares of common stock at the public offering price of $54.50 per share. We received proceeds of approximately $569.5 million from the offering, net of the underwriting discount and before deducting offering expenses of $1.5 million.

Rocket Agreement

On May 15, 2020, we entered into an agreement with Rocket Auto LLC and certain of its affiliates (collectively, “Rocket”) providing for the launch of an ecommerce platform under the “Rocket Auto” brand for the marketing and sale of vehicles directly to consumers (the “RA Agreement”). We will list our used vehicle inventory for sale on the Rocket Auto platform, but all sales of the inventory will be conducted through our platform. Rocket Auto is expected to launch publicly during 2021. During the term of the RA Agreement, Rocket has agreed to ensure that a minimum percentage of all used vehicles sold or leased through the platform on a monthly basis will be Vroom inventory. We issued Rocket 183,870 shares of our common stock upon execution of the RA Agreement. We will pay Rocket a combination of cash and stock for vehicle sales made through the platform. Rocket may earn up to 8,641,914 shares of common stock over a four-year period based upon sales volume of Vroom inventory through the Rocket Auto platform.

CarStory Acquisition

On January 7, 2021, we completed the acquisition of the CarStory business, a leader in AI-powered analytics and digital services for automotive retail, through the acquisition of 100% of Vast Holdings, Inc.

Leveraging its machine learning, informed by more than 7 million listings per day and more than 18 million consumer sessions per month, CarStory brings the industry’s most complete and accurate view of predictive market data to our national ecommerce and vehicle operations platform. As part of Vroom, we expect CarStory to continue to drive automotive retail innovation by aggregating, optimizing and distributing current market data from thousands of automotive sources and offering its digital retailing services to dealers, top automotive financial services companies and household names in automotive industry research and retailing.

Pursuant to the acquisition agreement, the aggregate purchase price was approximately $120.0 million, comprised of cash and shares of our common stock. On the closing date, we paid $77.5 million in cash and issued 1,072,117 shares of our common stock. The purchase price is subject to adjustment for certain working capital adjustments and post-closing indemnities.

Update on the Impact of the COVID-19 Pandemic

The results of our operations and overall financial performance were impacted due to the COVID-19 pandemic during the year ended December 31, 2020. After the initial disruption in our ecommerce operations, consumer demand for used vehicles now exceeds pre-COVID-19 levels. Lower foot traffic in the initial phase of the COVID-19 pandemic as well as reduced inventory at the TDA location as the ecommerce business scales, continues to negatively affect our TDA business. Additionally, we experienced disruption across our logistics network, with a reduced number of third-party providers available to deliver our vehicles, which has resulted in a slowdown of inventory being picked up and delivered to our VRCs and in sold units being delivered to customers. Our transportation costs have also increased as the remaining carriers have increased prices.

63


Table of Contents

We expect our operations will continue to be adversely impacted continuing into in 2021, however, the magnitude and duration of the ultimate impact is impossible to predict with certainty due to:

uncertainties regarding the duration of the COVID-19 pandemic and the length of time over which the disruptions caused by COVID-19 will continue, including any potential future waves, the spread of new variants and the success of vaccination programs;

the impact of governmental orders and regulations that have been, and may in the future be, imposed in response to the pandemic;

the impact of COVID-19 on VRCs, wholesale auctions, state DMV titling and registration services, third party vehicle carriers and other third parties on which we rely;

uncertainty as to the impact future increases in transmission could have on our ability to fully staff portions of our business;

the deterioration of economic conditions in the United States, as well as high unemployment levels, which could have an adverse impact on discretionary consumer spending; and

uncertainty as to whether and to what degree governmental stimulus packages or other economic relief will be provided to soften the negative economic effects of the COVID-19 crisis and the impact of any such relief.

See “Risk Factors—Risk Related to the COVID-19 pandemic—The COVID-19 pandemic has had and is expected to continue to have an adverse effect on our business, financial condition and results of operations.”

Severe Weather Conditions

In February 2021, the state of Texas was hit with record breaking winter weather which resulted in dangerous road conditions, widespread power outages, water outages and contamination of the water supply, which caused significant disruptions to our Houston area operations, including the closure of our offices and Vroom VRC for several days. We immediately focused on the health and wellbeing of our employees, while also working to minimize the impact on our customers. We have resumed full operations and are currently working to address the backlog in certain areas of our business, including our VRC, sales support, and administrative functions. “Risk Factors—General Risk Factors—Our business is subject to the risk of natural disasters, adverse weather events and other catastrophic events, and to interruption by manmade problems such as terrorism.

Other Key Factors and Trends Affecting our Operating Results

Our financial condition and results of operations have been, and will continue to be, affected by a number of factors and trends, including the following:

Ability to utilize data scienceexpand our dealer network to drive revenue growth by cost effectively increasingincrease vehicle finance offerings

We intend to grow our automotive financing business. UACC will continue to provide financing services to its existing dealer network and will seek to expand its network over time. UACC provides funding that allows manufacturer-franchised and independent motor vehicle dealers to finance new and used vehicles. Currently, UACC serves a nationwide network of thousands of dealers in 49 states. UACC's credit programs are primarily designed to serve consumers who have limited access to traditional vehicle financing, although UACC intends to expand its offerings across a broader range of the volume and selectioncredit spectrum going forward.

As of vehicles in our inventory

Our growthDecember 31, 2023, automobile contracts originated from Vroom customers or purchased from Vroom represented approximately 30% of UACC's total serviced loan portfolio. If UACC is primarily driven by vehicle sales. Vehicle sales growth, in turn, is largely driven byunable to replace the volume of inventoryautomobile contracts it previously received from the Vroom ecommerce business, our business, financial condition, and results of operations could be materially adversely affected.

57


Table of Contents

Ability to manage credit losses and enhance profitability at UACC

While credit losses are inherent in the automotive finance receivables business, several variables have affected UACC’s recent loss and delinquency rates, including rising interest rates, the current inflationary environment and vehicle depreciation. UACC is currently experiencing higher loss severity and higher losses on its finance receivables, which has negatively impacted the fair value of our finance receivables and the selection of vehicles listed on our platform. Accordingly, we believe that having the appropriate volume and mix of vehicle inventory is critical to our ability to drive growth.

The continued growth of our vehicle inventory requires a number of important capabilities, including the ability to finance the acquisition of inventory at competitive rates, source high quality vehicles across various acquisition channels nationwide, secure adequate reconditioning capacity and execute effective marketing strategies to increase consumer sourcing. In addition, our ability to accurately forecast pricing and consumer demand for specific types of vehicles is critical to sourcing high quality, high-demand vehicles. This ability is enabled by our data science capabilities that leverage the growing amount of data at our disposal and fine-tune our supply and sourcing models. Our investment in CarStory further enhances our predictive market data capabilities. As we continue to invest in our operational efficiency and data analytics, we expect that we will continue to cost effectively increase the volume and optimize the selection of our ecommerce inventory.

Ability to capitalize on the continued migration of vehicle purchasers to ecommerce platforms through data-driven marketing efforts

While the overall ecommerce penetration rate in used vehicle sales remains low, over the last several years, ecommerce used vehicle sales have experienced significant growth. There has been a shift in consumer buying patterns

64


Table of Contents

towards more convenient, personalized, and on-demand purchases, as well as a demand for ecommerce across more diverse categories, including the used vehicle market. We expect that the ecommerce model for buying and selling used vehicles will continue to grow and such growth may be accelerated by the COVID-19 pandemic. Our ability to continue to benefit from this trend will be an important driver of our future performance.

We seek to improve our brand awareness among consumers through national marketing campaigns in order to strengthen our customer acquisition funnel. We also use digital performance marketing such as search engine marketing, automotive aggregator sites and social media to acquire customers more cost effectively. Our aggregate marketing spend has increased over time, with our first national brand marketing campaign commencing in the first quarter of 2019, and we expect to continue to invest in both national brand marketing and performance marketing efforts. As we leverage our national brand, we believe this investment in marketing spend will drive additional demand and sales. We also believe that we have the ability to drive down the cost of acquisition per unit sold by increasing the efficiency of our marketing spend.

Ability to convert visitors to our platform into customers

The quality of the customer experience on our ecommerce platform is critical to our ability to attract new visitors to our platform, convert such visitors into customers and increase repeat customers. Our ability to drive higher customer conversion depends on our ability to make our platform a compelling choice for consumers based on our functionalities and consumer offerings.

Data analytics and experimentation drive decision making across all of our conversion efforts. By analyzing the data generated by the millions of visitors and tens of thousands of transactions on our platform, and continually testing strategies to maximize conversion rates, we form a better understanding of consumer preferences and try to create a more tailored ecommerce experience. 

Increased conversion also depends on our ability to provide the necessary customer service and sales support to respond to increased demand. During the fourth quarter, we further expanded our customer experience team as we ramp up our sales support in anticipation of continued sales growth in 2021. We also recently engaged two additional customer service providers to expand our customer service operations as we scale our business. As we continue to invest in our brand and improve the customer experience, we expect that we will attract more visitors, improve conversion and drive greater sales.

Ability to optimize the mix of inventory sources to drive increased gross profit and improvements to our unit economics

We strategically source inventory from auctions, consumers, rental car companies, OEMs and dealers. Auctions, consumers, and rental car companies represent the vast majority of our inventory sources, accounting for approximately 48%, 40%, and 10% of our retail inventory soldlosses recognized for the year ended December 31, 2020, respectively. Because2023. Higher than anticipated credit losses contributed to a pre-tax net loss at UACC of approximately $41.2 million for the quality of vehiclesyear ended December 31, 2023, and associated gross margin profile vary across each channel, the mix of inventory sources has an impact on our profitability. We continually evaluate the optimal mix of sourcing channels and strive to source vehicles in a way that maximizes our average gross profit per unit and improves our unit economics. For example, purchasing vehicles at third-party auctions is competitive and, consequently, vehicle prices at third-party auctions tend to be higher than vehicle prices for vehicles sourced directly from consumers. Accordingly, as part of our sourcing strategy, we seek to increase the percentage of vehicle sales that we source from consumers.

Our ability to increase the percentage of inventory sourced directly from consumers will depend on the popularity and success of our ecommerce platform. In orderare expected to continue to increase the percentage of vehicles that we source directly from consumers, we also have expanded our national marketing efforts that are focused on our Sell Us Your Car® proposition, which we believe will result in more customers gaining familiarity with our platform. We expect that, as consumers experience the convenience of our platform to sell or trade in their used vehicles, the percentage of inventory we source directly from consumers will continue to grow.

We are also exploring third-party inventory strategies, which offers the possibility of expanding our sourcing channels through third party sellers while offering us attractive revenue models in an asset light, debt free structure.

Ability to expand and optimize our reconditioning capacity to satisfy increasing demand

Our ability to recondition purchased vehicles to our quality standards is a critical component of our business. Historically, we have successfully increased our reconditioning capacity asnegatively impact our business has grown, and our future success will depend on our ability to expand and optimize our reconditioning capacity to satisfy increasing customer demand. We employ a hybrid approach that combinesin 2024, especially because UACC primarily operates in the use of our Vroom VRC and third-party VRCs to best meet our reconditioning needs.

65


Table of Contents

In 2019, we significantly increased our reconditioning capacity within our Vroom VRC by overhauling our operations and applying lean manufacturing techniques and other software-enabled technological advances. As we continue to grow our business, we intend to continue to invest in increased reconditioning capacity and operational efficiency through third-party VRC locations. Additionally, our use of third-party VRCs to recondition vehicles allows us to avoid additional capital expenditures, quickly increase capacity, maintain greater operational flexibility and broaden our geographic footprint to drive lower logistics costs. We have continued to expand our third-party VRC operations and, asnon-prime sector of the date of this Annual Reportmarket which is expected to have more volatility. Certain advance rates available to UACC on Form 10-K,borrowings from the Warehouse Credit Facilities have a total of nineteen VRCs throughout the U.S. See “—Liquidity and Capital Resources.”

We leverage our data analytics and deep industry experience to strategically select VRC locations where we believe there is the highest supply and demand for our vehicles. We expect that our continued investment in reconditioning capacity and technology will lower our reconditioning costs per unit and drive greater operational efficiency, higher gross profit per unit and improved unit economics.

Ability to expand and develop our logistics network

We primarily use third-party carriers and have optimized our third-party logistics network nationwide through the development of strategic carrier arrangements with national haulers and the consolidation of our carrier base into dedicated operating regions. We expect that these enhanced logistics operations, combined with the expansion of strategically located VRCs, will drive efficiency in our logistics operations. Our VRCs also serve as pooling points to aggregate acquired vehicles and we are using certain VRCs as hubs for staging vehicles for last-mile delivery to customers, which we expect to provide an improved experience for customers. Recently,decreased as a result of the continued prevalence of the COVID-19 pandemic, weincreasing credit losses in UACC's portfolio and overall rising interest rates. Any future decreases on available advance rates may have experienced a reduced supply of carriers, increased shipping prices and deteriorating service levels. Thus, in response to these disruptions, and to further enhance the quality of our logistics operations and our customer experience, we are accelerating our strategy to optimize our hybrid approach by expanding our proprietary logistics network. Currently, we are prioritizing investment in our last-mile delivery operations where we can have the greatestan adverse impact on the customer experience. We also have invested in short-haul trucks to make regional deliveries from our last mile hubs, and have begun to invest in long-haul vehicles for hub-to-hub shipments. As we invest in our expanded logistics operations, we expect to incur increased operating expenses and capital expenditures associated with purchasing or leasing fleet vehicles, leasing space for delivery hubs, hiring qualified drivers, and operating and maintaining fleet vehicles, offset in part by reduced third-party logistics expense. Consistent with our hybrid approach, we continue to strategically combine the operation of our expanded proprietary fleet with the use of third-party carriers, which we expect will enable us to both accommodate our growth and provide the highest level of customer service. Over time, as our business scales, we expect that optimizing our logistics network through this hybrid approach will result in improved unit economics, increased profitability and an enhanced customer experience.liquidity.

Ability to increasesecuritize UACC's loan portfolio

The success of UACC's business is highly dependent on the ability to securitize and better monetize value-added products

Our offering of value-added products is an integral part of providing a seamless vehicle-buying experience to our customers. These products provide added revenue streams for us as well as offering convenience, assurance and efficiency for our customers. We sell our third-party value-added products through our strategic relationships with multiple lenders and other third parties who bear the incremental risks associated with the underwriting ofautomotive finance and protection products. We have entered into strategic partnerships with lenders such as Chase and Santander which have contributed to improvements in Product GPPU. Additionally, through our on-going data analytics, experimentation and further development of our ecommerce technology, we expect to increase attachment rates of our existing value-added products while finding new opportunities to include additional finance and protection products, as well as other value-added products. Because we are paid fees on value-added products we sell, our gross profit is equal to the revenue we generate on such sales.receivables that it underwrites or acquires. As a result such sales help drive total gross profit per unit. We expect that,of high interest rates, the current inflationary environment and vehicle depreciation in the used automotive industry, UACC is experiencing higher loss severity. As a result, UACC may not be able to securitize its loan portfolio on favorable terms, or may not be able to sell the subordinate notes or residual certificates issued in its securitizations at a favorable price or at all.

If UACC fails to sell the subordinate notes or the residual interests, it will preclude us from recognizing the sale and result in the securitization trust being consolidated and therefore remaining on balance sheet. In January 2023, UACC completed the 2023-1 securitization transaction, selling the investment grade rated asset-backed securities, and in April 2023, UACC sold the non-investment grade rated securities. As a result of market conditions at the time, which led to unfavorable pricing, UACC retained the residual interests and we accounted for the 2023-1 securitization transaction as secured borrowings. The related finance receivables and securitization debt remain on balance sheet. In the future, we scalemay account for UACC securitizations as on balance sheet transactions depending on the market conditions.

In addition, due to the increased loss severity, UACC elected to waive monthly servicing fees related to the 2022-2 securitization transaction in the first quarter of 2023. The waiver of monthly servicing fees related to the 2022-2 securitization transaction resulted in consolidation of the related finance receivables and securitization debt on our business, we will increase the breadth and varietyfinancial statements. Waiver of value-added products offered to customers and improve attachment rates to our vehicle sales, whichmonthly servicing fees also resulted in turn will grow revenue and drive profitability.reduced servicing income.

Seasonality

Seasonality

Used vehicle sales arehave historically been seasonal. The used vehicle industry typically experiences an increase in sales early in the calendar year and reaches its highest point late in the first quarter and early in the second quarter. Vehicle sales then level off through the rest of the year, with the lowest level of sales in the fourth quarter. This seasonality has historically corresponded with the timing of income tax refunds, which are an important source of funding for vehicle purchases. Additionally, used vehicles typically depreciate at a faster rate in the last two quarters of each year and a slower rate in the first two quarters of each year. In lineHowever, the past few years have not followed typical depreciation trends and there remains continued uncertainty surrounding market trends. Consistent with these macromarket trends, our gross profit per unit has historically been higher inUACC generally experiences increased funding activity during the first half ofquarter through tax season. Delinquencies also tend to be lower during the year when compared tofirst quarter through tax season and higher during the secondlatter half of the year. See “Risk Factors—Risks Related to Our Financial Condition and

66


Table of Contents

Results of Operations—We may experience seasonal and other fluctuations in our quarterly results of operations, which may not fully reflect the underlying performance of our business.”business” in our Annual Report.

Macroeconomic Factors

Both the United States and global economies are experiencing a sustained inflationary environment and the Federal Reserve’s efforts to tame inflation have led to increased interest rates, which affects automotive finance rates, reducing discretionary spending and making vehicle financing more costly and less accessible to many consumers. In December 2023, the Federal Reserve announced that it expects to cut interest rates in 2024; however it is too soon to know the degree to which rates may be cut and the impact it may have on the economy. Moreover, geopolitical conflicts and war, including those in Europe and the Middle East, have increased global economic and political uncertainty, which has caused dramatic fluctuations in global financial markets. A significant escalation or expansion of economic disruption

58


Table of Contents

could continue to impact consumer spending, broaden inflationary costs, and could have a material adverse effect on our results of operations. We will continue to actively monitor and develop responses to these disruptions, but depending on duration and severity, these trends could continue to negatively impact our business in 2024.

Components of Results of Operations

Revenue

Revenue

In connection with the Value Maximization Plan, in January 2024 we started to wind-down our ecommerce operations, including both retail and wholesale vehicle sales which also reduced associated product revenue. Therefore, each of the retail vehicle revenue, wholesale vehicle revenue, and the associated product revenue described below will not be applicable to our results of operations going forward.

Retail vehicle revenue

We sell

Historically, we sold retail vehicles through both our ecommerce platform and TDA. Revenue from vehicle sales, including any delivery charges, arewas recognized when vehicles arewere delivered to the customers or picked up at our TDA retail location, net of a reserve for estimated returns. The number of units sold and the average selling price (“ASP”) per unit arewere the primary factors impacting our retail revenue stream.

The number of units sold depends on the volume of inventory and the selection of vehicles listed on our ecommerce platform, our ability to attract new customers, our brand awareness and our ability to expand our reconditioning operations and logistics network.

ASP depends primarily on our acquisition and pricing strategies, retail used car market prices, our average days to sale and our reconditioning and logistics costs.

We have begun to strategically take advantage of a broader portion of the used vehicle market by adding more lower priced vehicles to our inventory. As a data-driven company, we acquire inventory based upon demand predicted by our data analytics. Since the COVID-19 pandemic, that data has been moving towards lower-priced inventory, which we expect to continue to result in a lower ASP per unit than historical levels.

Wholesale vehicle revenue

We sell

Historically, we sold vehicles that do not meet our Vroom retail sales criteria through wholesale channels. Vehicles sold through wholesale channels arewere acquired from customers who trade-intraded-in their vehicles when making a purchase from us, from customers who sellsold their vehicle to us in direct-buy transactions, and from liquidation of vehicles previously listed for retail sale.sale. The number of wholesale vehicles sold and the ASP per unit arewere the primary drivers of wholesale revenue. The ASP per unit is affected by the mix of the vehicles

Product revenue

Historically, we acquire and general supply and demand conditions in the wholesale market.

Product revenue

We generategenerated revenue by financing vehicle sales through UACC, earning fees on sales of third-party financing, and sales of value-added products to our customers in connection with vehicle sales, including fees earned on customer vehicle financing from third-party lenders and fees earned on sales of other value-added products, such as vehicle service contracts, GAP protection and tire and wheel coverage.

We generate ecommerce product revenue from receivables generated by financing provided to Vroom customers through UACC. We earn interest income on such finance receivables before the contracts are sold, interest income on finance receivables held in consolidated VIEs, and, when applicable, gain on the sales of securitized finance receivables. We account for sales of finance receivables in accordance with ASC Topic 860, Transfers and Servicing of Financial Assets ("ASC 860"). Refer to "Finance revenue" below for further details.

We also earned fees on thesethird-party financing and value-added products pursuant to arrangements with the third parties that sellsold and administeradministered these products. For accounting purposes, we arewere an agent for these transactions and, as a result, we recognizerecognized fees on a net basis when the customer entersentered into an arrangement to purchase these products or obtain third-party financing, which iswas typically at the time of a vehicle sale. Our gross profit on product revenue is equal to the revenue we generate.

Product revenue iswas affected by the number of vehicles sold, the attachment rate of value-added products and the amount of fees we receive on each product. Product revenue also consistsconsisted of estimated profit-sharing amounts to which we arewere entitled based on the performance of third-party protection products once a required claims period has passed.

A portion of the fees we receive isreceived was subject to chargeback in the event of early termination, default, or prepayment of the contracts by our customers. We recognizerecognized product revenue net of reserves for estimated chargebacks.

Other

Finance revenue

Other

Our finance revenue is related to finance receivables originated or acquired by UACC through its network of third-party dealership customers and consists of laborinterest income earned on finance receivables before the contracts are sold,

59


Table of Contents

interest income earned on finance receivables held in consolidated VIEs, and, partswhen applicable, gains on the sale of securitized finance receivables.

UACC acquires and services finance receivables from its network of third-party dealership customers and generates revenue through the sales of these financing receivables. We account for sales of finance receivables in accordance with ASC Topic 860, Transfers and Servicing of Financial Assets ("ASC 860"). In order for transfers of the finance receivables to qualify as sales, the finance receivables being transferred must be legally isolated, may not be constrained by restrictions from further transfer, and must be deemed to be beyond our control.

For any securitization transactions that are accounted for as secured borrowings, we recognize interest income, which includes finance charges and servicing fees in accordance with the terms of the related customer agreements.

In February 2022, UACC completed the 2022-1 securitization transaction, which qualified as a sale, therefore we recorded a gain on the sale of the finance receivables. The amount of the gain is equal to the fair value of the net proceeds received less the carrying amount of the finance receivables. In July 2022, UACC sold a pool of finance receivables in the 2022-2 securitization transaction. Originally, we concluded that we were not the primary beneficiary of the 2022-2 securitization trust, and therefore we did not consolidate the 2022-2 trust. From January to March 2023, although not contractually required, UACC elected to waive its servicing fee on the 2022-2 securitization, due to higher-than-expected losses. Since UACC has the power to direct the significant activities of the VIE, as it is the servicer, and additionally it absorbs the risk of loss, we concluded that we are the primary beneficiary of the VIE. In March 2023, we accounted for the transaction as secured borrowings and consolidated the 2022-2 securitization trust. The beneficial interest was then eliminated. In January 2023, UACC completed the 2023-1 securitization transaction, selling the investment grade rated asset-backed securities, and in April 2023, UACC sold the non-investment grade rated securities. As a result of market conditions at the time, which led to unfavorable pricing, UACC retained the residual interests and we accounted for the 2023-1 securitization transaction as secured borrowings. The related finance receivables and securitization debt remain on the balance sheet. We may account for future securitizations as on balance sheet transactions depending on the market conditions.

Servicing income represents the annual fees earned by uson the outstanding principal balance of the finance receivables serviced. Fees are earned monthly at an annual rate of approximately 4% for the 2022-1 securitization transaction and 3.25% for the 2022-2 and 2023-1 securitization transactions of the outstanding principal balance of the finance receivables serviced.

As a result of high interest rates, the current inflationary environment and vehicle repair services at TDA.depreciation in the used automotive industry, UACC is experiencing higher loss severity. The increased loss severity could lead to reduced servicing income if UACC elects to waive monthly servicing fees going forward as it did in the first quarter of 2023.

See “Note 3—Revenue Recognition” and "Note 4 – Variable Interest Entities and Securitizations" to our consolidated financial statements included elsewhere in this Annual Report on Form 10-K.

67

60


Table of Contents

Cost of sales

Cost

In connection with the Value Maximization Plan, we started to wind-down our ecommerce operations in January 2024. Therefore, each of the retail cost of sales, wholesale cost of sales, and the associated product cost of sales described below will not be applicable to our results of operations going forward.

Retail cost of sales

Retail cost of sales primarily includesincluded the costs to acquire vehicles, inbound transportation costs and direct and indirect reconditioning costs associated with preparing vehicles for sale. Costs to acquire vehicles arewere primarily driven by the inventory source, vehicle mix and general supply and demand conditions of the used vehicle market. Inbound transportation costs includeincluded costs to transport the vehicle to our VRCs. Reconditioning costs includeincluded parts, labor and third-party reconditioning costs directly attributable to the vehicle and allocated overhead costs. Cost of sales also includesincluded any accounting adjustments to reflect vehicle inventory at the lower of cost or net realizable value.

Wholesale cost of sales

Wholesale cost of sales primarily included costs to acquire vehicles sold through wholesale channels as well as any accounting adjustments to reflect vehicle inventory at the lower of cost or net realizable value.

Product cost of sales

Product cost of sales consists of interest expense incurred on securitization debt related to finance receivables originated by UACC for Vroom customers.

Finance cost of sales

Finance cost of sales consists of interest expense incurred on securitization debt originated by UACC for its network of third-party dealership customers and collection expenses related to servicing finance receivables.

Total gross profit

Total gross profit is defined as total revenue less costs associated with such revenue.

Selling, general and administrative expenses

Our selling, general, and administrative expenses, which we refer to as SG&A expenses, consisthistorically consisted primarily of advertising and marketing expenses, outbound transportation costs, employee compensation, occupancy costs of our facilities, and professional fees for accounting, auditing, tax, legal and consulting services.

Weservices and software and IT costs. Going forward, we expect that our SG&A expenses will increase into decrease significantly as a result of the future as we expandwind-down of our operations, including our proprietary logistics operations, hire additional employees and continue to increase our marketing spend. In 2020, we further expanded our customer experience team as we ramp up our sales support in anticipation of continued sales growth. We also recently engaged two additional customer service providers to expand our customer service operations as we scale our business. We also will continue to incur increased expenses associated with being a public company, including costs of accounting, audit, legal, regulatory and tax-related services associated with maintaining compliance with SEC and Nasdaq requirements, director and officer insurance costs, and investor and public relations costs.ecommerce operations.

Depreciation and amortization

Our depreciation and amortization expense primarily includes: depreciation related to our leasehold improvements and company vehicles;logistics fleet; amortization related to intangible assets in acquired businesses; and capitalized internal use software costs incurred in the development of our platform and website applications. Depreciation expense related to our Vroom VRC and the portion of depreciation expense for our proprietary logistics fleet related to inbound transportation is included in cost of sales in the consolidated statements of operations.

Impairment Charges

Impairment charges represent charges to write down the carrying amount of goodwill and other long-lived assets to fair value as well as lease impairment charges related to closing physical office locations and Sell Us Your Car® centers.

61


Table of Contents

Gain on debt extinguishment

Gain on debt extinguishment represents the gain recognized from the repurchase of a portion of our outstanding Convertible Senior Notes due 2026 (the "Notes") in open-market transactions.

Interest expense

Our interest expense primarily includes (i) interest expense related to our 20202022 Vehicle Floorplan Facility, as discussed below, which iswas used to finance our inventory, as well as(ii) interest expense on our term loan facility,Notes, (iii) interest expense on UACC's Warehouse Credit Facilities, which was repaidare used to fund our finance receivables, and (iv) interest expense on UACC's financing of beneficial interests in full in December 2019.securitizations.

Interest Income

Interest income primarily represents interest credits earned on cash deposits maintained in relation to our 20202022 Vehicle Floorplan Facility as well as interest earned on cash and cash equivalents.

68


Table of Contents

Other Loss, net

Other loss, net primarily represents realized and unrealized losses on finance receivables, securitization debt and beneficial interests in securitizations as well as recoveries from losses previously recognized on finance receivables.

Results of Operations

The following table presents our consolidated results of operations for the periods indicated:


Year Ended
December 31,


2023


2022


% Change


(in thousands)


Revenue:


Retail vehicle, net


$


565,972


$


1,425,842


(60.3

)%

Wholesale vehicle


104,119


293,528


(64.5

)%

Product, net


52,253


62,747


(16.7

)%

Finance


156,938


152,542


2.9

%

Other


13,921


14,242


(2.3

)%

Total revenue


893,203


1,948,901


(54.2

)%

Cost of sales:


Retail vehicle


553,565


1,382,005


(59.9

)%

Wholesale vehicle


138,472


304,148


(54.5

)%

Product


3,337


100.0

%

Finance


31,328


14,161


121.2

%

Other


4,554


3,800


19.8

%

Total cost of sales


731,256


1,704,114


(57.1

)%

Total gross profit


161,947


244,787


(33.8

)%

Selling, general and administrative expenses


340,657


566,387


(39.9

)%

Depreciation and amortization


42,769


38,290


11.7

%

Impairment charges


48,748


211,873


(77.0

)%

Loss from operations


(270,227

)


(571,763

)


52.7

%

Gain on debt extinguishment


(37,878

)


(164,684

)


77.0

%

Interest expense


45,445


40,693


11.7

%

Interest income


(21,158

)


(19,363

)


9.3

%

Other loss (income), net


108,289


43,181


150.8

%

Loss before provision (benefit) for income taxes


(364,925

)


(471,590

)


22.6

%

Provision (benefit) for income taxes


615


(19,680

)


103.1

%

Net loss


$


(365,540

)


$


(451,910

)


19.1

%


Year Ended

December 31,


Year Ended

December 31,


2020


2019


% Change


2019


2018


% Change


(in thousands)


(in thousands)


Revenue:


Retail vehicle, net

$


1,072,551


$


952,910


12.6

%


$


952,910


$


656,928


45.1

%

Wholesale vehicle


245,580


213,464


15.0

%


213,464


174,514


22.3

%

Product, net


38,195


23,708


61.1

%


23,708


19,653


20.6

%

Other


1,374


1,739


(21.0

)%


1,739


4,334


(59.9

)%

Total revenue


1,357,700


1,191,821


13.9

%


1,191,821


855,429


39.3

%

Cost of sales


1,286,155


1,133,962


13.4

%


1,133,962


794,622


42.7

%

Total gross profit


71,545


57,859


23.7

%


57,859


60,807


(4.8

)%

Selling, general and administrative expenses


245,546


184,988


32.7

%


184,988


133,842


38.2

%

Depreciation and amortization


4,598


6,019


(23.6

)%


6,019


6,857


(12.2

)%

Loss from operations


(178,599

)


(133,148

)


34.1

%


(133,148

)


(79,892

)


66.7

%

Interest expense


9,656


14,596


(33.8

)%


14,596


8,513


71.5

%

Interest income


(5,896

)


(5,607

)


5.2

%


(5,607

)


(3,135

)


78.9

%

Revaluation of stock warrant


20,470


769


2,561.9

%


769


174


342.0

%

Other income, net


(114

)


(96

)


18.8

%


(96

)


(495

)


(80.6

)%

Loss before provision for income taxes


(202,715

)


(142,810

)


41.9

%


(142,810

)


(84,949

)


68.1

%

Provision for income taxes


84


168


(50.0

)%


168


229


(26.6

)%

Net loss

$


(202,799

)


$


(142,978

)


41.8

%


$


(142,978

)


$


(85,178

)


67.9

%

62


Table of Contents

Segments

Segments

We managehave historically managed and reportreported operating results through three reportable segments:

Ecommerce (67.4%64.5% of 20202023 revenue; 49.3%70.0% of 20192022 revenue): The Ecommerce segment represents retail sales of used vehicles through our ecommerce platform, and feesrevenue earned on vehicle financing originated by UACC or our third-party financing sources and sales of value-added products associated with those vehiclevehicles sales.

Wholesale (18.1%11.7% of 20202023 revenue; 17.9%15.1% of 20192022 revenue): The Wholesale segment represents sales of used vehicles through wholesale channels.

TDA Retail Financing (14.5%17.6% of 20202023 revenue; 32.8%7.8% of 20192022 revenue): The TDARetail Financing segment represents retail salesUACC’s operations with its network of used vehicles from TDAthird-party dealership customers.

As a result of the Value Maximization Plan and fees earned on salesthe wind-down of value-added products associated with those vehicle sales.

our ecommerce operations, we will discontinue reporting our results through our Ecommerce and Wholesale segments starting in the first quarter of 2024.

69


Table of Contents

YearYears Ended December 31, 20202023 and 20192022

Ecommerce

Ecommerce

The following table presents our Ecommerce segment results of operations for the periods indicated:


Year Ended

December 31,


Year Ended
December 31,


2020


2019


Change


% Change


2023


2022


Change


% Change


(in thousands, except unit

data and average days to sale)


(in thousands, except unit
data and average days to sale)


Ecommerce units sold


34,488


18,945


15,543


82.0

%


17,401


39,278


(21,877

)


(55.7

)%

Ecommerce revenue:


Vehicle revenue


$


884,560


$


576,998


$


307,562


53.3

%


$


523,945


$


1,304,797


$


(780,852

)


(59.8

)%

Product revenue


30,891


11,116


19,775


177.9

%


52,225


59,398


(7,173

)


(12.1

)%

Total ecommerce revenue


$


915,451


$


588,114


$


327,337


55.7

%


$


576,170


$


1,364,195


$


(788,025

)


(57.8

)%

Ecommerce gross profit:


Vehicle gross profit


$


29,970


$


21,011


$


8,959


42.6

%


$


10,343


$


40,575


$


(30,232

)


(74.5

)%

Product gross profit


30,891


11,116


19,775


177.9

%


48,888


59,398


(10,510

)


(17.7

)%

Total ecommerce gross profit


$


60,861


$


32,127


$


28,734


89.4

%


$


59,231


$


99,973


$


(40,742

)


(40.8

)%

Average vehicle selling price per ecommerce unit


$


25,648


$


30,456


$


(4,808

)


(15.8

)%


$


30,110


$


33,220


$


(3,110

)


(9.4

)%

Product revenue per ecommerce unit


3,001


1,512


1,489


98.5

%

Gross profit per ecommerce unit:


Vehicle gross profit per ecommerce unit


$


869


$


1,109


$


(240

)


(21.6

)%


$


594


$


1,033


$


(439

)


(42.5

)%

Product gross profit per ecommerce unit


896


587


309


52.6

%


2,809


1,512


1,297


85.8

%

Total gross profit per ecommerce unit


$


1,765


$


1,696


$


69


4.1

%


$


3,403


$


2,545


$


858


33.7

%

Ecommerce average days to sale


66


68


(2

)


(2.9

)%


217


131


86


65.6

%

Ecommerce units

After the initial disruption in our ecommerce operations due to the COVID-19 pandemic, consumer demand for used vehicles has returned to pre-COVID-19 levels and in 2020, we experienced strong consumer demand for our ecommerce solutions and contact-free delivery.

Ecommerce units sold increased 15,543,decreased 21,877, or 82.0%55.7%, from 18,945 in 201939,278 for the year ended December 31, 2022 to 34,488 in 2020.17,401 for the year ended December 31, 2023. This increasedecrease was driven by higher inventory levels, our national advertising campaign which continuesstrategic decision to strengthenprioritize unit economics over unit sales volume starting in the second quarter of 2022, our national brand awareness as well as greater consumer acceptancedecision to reduce vehicle acquisitions during the fourth quarter of 2023, pressure on servicing our business modeldemand as a result of disruptions caused by the COVID-19 pandemic,reducing third-party sales support staff and process improvements inscaling our ecommerce platform. Average monthly unique visitors to our website grew from 653,216 in 2019 to 969,890 in 2020, representing year over year growth of 48.5%. We expect ecommerce units sold to continue to grow in the future as we increase our inventory selection and marketing effortsinternal sales team, as well as macroeconomic factors.

Ecommerce average days to sale increased from 131 days for the year ended December 31, 2022 to 217 days for the year ended December 31, 2023. We undertook various initiatives to address the operational challenges created by our prior rapid growth from 2020 through the first quarter of 2022, in particular with titling and registration processes. While these initiatives were designed to improve conversion.our transaction processing, enhance our customer experience, and

63


Table of Contents

reduce our regulatory risk, they resulted in delays in listing vehicles for sale and caused a higher portion of our unit sales throughout 2023 to be from aged inventory, which increased the number of days between our acquisition of vehicles and the final delivery of such vehicles to customers.

Vehicle Revenue

Ecommerce vehicle revenue increased $307.6decreased $780.9 million, or 53.3%59.8%, from $577.0$1,304.8 million in 2019for the year ended December 31, 2022 to $884.6$523.9 million in 2020.for the year ended December 31, 2023. The increasedecrease in ecommerce vehicle revenue was primarily attributable to the 15,543 increase21,877 decrease in ecommerce units sold, which increaseddecreased vehicle revenue by $473.4$726.8 million, partially offset byand a lowerdecrease in ASP per unit, which decreased from $30,456 in 2019$33,220 for the year ended December 31, 2022 to $25,648 in 2020$30,110 for the year ended December 31, 2023 and decreased vehicle revenue by $165.8$54.1 million. The decrease in ASP per unit was driven by demand predicted by our data analytics and by our abilityprimarily due to source and recondition lower priced vehicles while maintaining target gross profit per units as a resultsignificant market appreciation in the first half of our expanding VRC network. We expect to continue to sell vehicles with a lower ASP per unit than historical levels and that ecommerce vehicle revenue will continue to grow driven by increases in ecommerce units sold.2022.

Product Revenue

Ecommerce product revenue increased $19.8decreased $7.2 million, or 177.9%12.1%, from $11.1$59.4 million in 2019for the year ended December 31, 2022 to $30.9$52.2 million in 2020.for the year ended December 31, 2023. The increasedecrease in ecommerce product revenue was primarily attributable to a $309the 21,877 decrease in ecommerce units sold, which decreased product revenue by $33.1 million, partially offset by an increase in product revenue per unit, which increased product revenue by $10.7 millionfrom $1,512 for the year ended December 31, 2022 to $3,001 for the year ended December 31, 2023 and the 15,543 increase in ecommerce units sold, which increased product revenue by $9.1$25.9 million. The increase in product revenue per unit was primarily due to higher attachment rates, improved financing featuresan increase in our ecommerce platforminterest income earned on finance receivables from Vroom customers originated or serviced by UACC as well as our strategic lender partnerships. We expect ecommerce product revenue will continuecompared to grow in the future driven by increases in ecommerce units sold, new product offerings, initiatives to improve product attachment rates and increases in per unit profit.year ended December 31, 2022.

70


Table of Contents

Vehicle Gross Profit

Ecommerce vehicle gross profit increased $9.0decreased $30.3 million, or 42.6%74.5%, from $21.0$40.6 million in 2019for the year ended December 31, 2022 to $30.0$10.3 million in 2020.for the year ended December 31, 2023. The increasedecrease in vehicle gross profit was primarily attributable to the 15,543 increase21,877 decrease in ecommerce units sold, which increased vehicle gross profit by $17.2 million, partially offset by a $240 decrease in vehicle gross profit per unit, which decreased vehicle gross profit by $8.2$22.7 million. VehicleAdditionally, vehicle gross profit per unit decreased $439 from $1,109 in 2019$1,033 for the year ended December 31, 2022 to $869 in 2020,$594 for year ended December 31, 2023, which decreased vehicle gross profit by $7.6 million. The decrease was primarily attributable todriven by lower sales margins (sales price less purchase pricemargin on aged inventory and higher reconditioning costs per unit related to an increased mix of higher mileage and aged vehicles sold),along with significant parts inflation. The decreases were partially offset by improvementsa lower inventory reserve as a result of a decrease in inbound logistics and reconditioning costs.inventory levels as we continued to sell through our aged inventory.

As we continuemade progress on our initiatives to matureaddress the operational challenges created by our infrastructure, increaseprior rapid growth from 2020 through the first quarter of 2022, a higher portion of our unit sales in 2023 was from aged inventory, which negatively impacted our sales margin and optimize our network of VRCs, we expect ecommerce vehicle gross profit per unit to increase in the future driven by reduced costs across acquisitions, logistics and reconditioning.GPPU.

Product Gross Profit

Ecommerce product gross profit increased $19.8decreased $10.5 million, or 177.9%17.7%, from $11.1$59.4 million in 2019for the year ended December 31, 2022 to $30.9$48.9 million in 2020.for the year ended December 31, 2023. The increasedecrease in ecommerce product gross profit was primarily attributable to the 21,877 decrease in ecommerce units sold, which decreased product gross profit by $33.1 million, partially offset by a $309$1,297 increase in product gross profit per unit, which increased product gross profit by $10.7 million and the 15,543 increase in ecommerce units sold which increased product gross profit by $9.1$22.6 million. The increase in productProduct gross profit per unit wasincreased from $1,512 for the year ended December 31, 2022 to $2,809 for the year ended December 31, 2023, primarily attributabledue to higher attachment rates, improved financing featuresan increase in our ecommerce platform as well as our strategic lender partnerships. We expect ecommerce product gross profit will continueinterest income earned, partially offset by interest expense on securitization debt related to grow in the future drivenVroom customers' finance receivables originated or serviced by increases in ecommerce units sold, new product offerings, initiatives to improve product attachment rates and increases in per unit profit.UACC.

Wholesale

64


Table of Contents

Wholesale

The following table presents our Wholesale segment results of operations for the periods indicated:


Year Ended

December 31,


Year Ended
December 31,


2020


2019


Change


% Change


2023


2022


Change


% Change


(in thousands, except unit data)


(in thousands, except unit data)


Wholesale units sold


21,108


20,197


911


4.5

%


7,094


20,876


(13,782

)


(66.0

)%

Wholesale revenue


$


245,580


$


213,464


$


32,116


15.0

%


$


104,119


$


293,528


$


(189,409

)


(64.5

)%

Wholesale gross (loss) profit


$


(1,432

)


$


340


$


(1,772

)


(521.2

)%

Wholesale gross loss


$


(34,353

)


$


(10,620

)


$


(23,733

)


223.5

%

Average selling price per unit


$


11,634


$


10,569


$


1,065


10.1

%


$


14,677


$


14,061


$


616


4.4

%

Wholesale gross (loss) profit per unit


$


(68

)


$


17


$


(85

)


(500.0

)%

Wholesale gross loss per unit


$


(4,843

)


$


(509

)


$


(4,334

)


851.5

%

Wholesale Units

Wholesale units sold increased 911,decreased 13,782, or 4.5%66.0%, from 20,197 in 201920,876 for the year ended December 31, 2022 to 21,108 in 2020,7,094 for the year ended December 31, 2023, primarily driven by the sale of retail quality vehicles through wholesale channels in order to reduce inventory risk during the early days of the COVID-19 pandemic as well as in the fourth quarter of 2020, partially offset by a decrease in wholesale units purchased from consumers and a lower number of trade-in vehicles due to a lower volumeassociated with the decrease in the number of ecommerce units sold during the early days of the pandemic.sold.

Wholesale Revenue

Wholesale revenue increased $32.1decreased $189.4 million, or 15.0%64.5%, from $213.5$293.5 million in 2019for the year ended December 31, 2022 to $245.6$104.1 million in 2020.for the year ended December 31, 2023. The increasedecrease was primarily attributable to a 13,782 decrease in wholesale units sold, which decreased wholesale revenue by $193.8 million, partially offset by a higher ASP per wholesale unit, which increased from $10,569 in 2019 to $11,634 in 2020 and increased wholesale revenue by $22.5$4.4 million.

Wholesale Gross Loss

Wholesale gross loss increased $23.8 million, as well asor 223.5%, from $10.6 million for the 911year ended December 31, 2022 to $34.4 million for the year ended December 31, 2023. The change was primarily attributable to a $4,334 increase in wholesale gross loss per unit from $509 for the year ended December 31, 2022 to $4,843 for the year ended December 31, 2023, which increased wholesale gross loss by $30.8 million, partially offset by a 13,782 decrease in wholesale units sold, which increaseddecreased wholesale revenue by $9.6 million.

Wholesale Gross (Loss) Profit

Wholesale gross profit decreased $1.8 million from gross profit of $0.4 million in 2019 to gross loss of $(1.4) million in 2020. by $7.0 million.

The decrease was primarily attributable to a $85 decreaseincrease in wholesale gross profitloss per unit which decreasedwas primarily as the result ofdriven by lower sales marginmargins as a result of liquidatingwholesale liquidations for aged inventory during the initial phase of the COVID-19 pandemic as well asand vehicles damaged by hail storms in the fourthsecond and third quarter of 2020.2023 and a higher inventory reserve.

71


Table of Contents

Retail Financing

TDA

The following table presents our TDARetail Financing segment results of operations for the periods indicated:


Year Ended

December 31,


2020


2019


Change


% Change


(in thousands, except unit

data and average days to sale)


TDA units sold


7,385


13,018


(5,633

)


(43.3

)%

TDA revenue:


Vehicle revenue


$


187,991


$


375,912


$


(187,921

)


(50.0

)%

Product revenue


7,304


12,592


(5,288

)


(42.0

)%

Other


1,374


1,739


(365

)


(21.0

)%

Total TDA revenue


$


196,669


$


390,243


$


(193,574

)


(49.6

)%

TDA gross profit:


Vehicle gross profit


$


4,373


$


12,069


$


(7,696

)


(63.8

)%

Product gross profit


7,304


12,592


(5,288

)


(42.0

)%

Other gross profit


439


731


(292

)


(39.9

)%

Total TDA gross profit


$


12,116


$


25,392


$


(13,276

)


(52.3

)%

Average vehicle selling price per TDA unit


$


25,456


$


28,876


$


(3,420

)


(11.8

)%

Gross profit per TDA unit:


Vehicle gross profit per TDA unit


$


592


$


927


$


(335

)


(36.1

)%

Product gross profit per TDA unit


989


967


22


2.3

%

Total gross profit per TDA unit


$


1,581


$


1,894


$


(313

)


(16.5

)%

TDA average days to sale


46


50


(4

)


(8.0

)%


Year Ended
December 31,


2023


2022


Change


% Change


(in thousands)


Retail Financing revenue


$


156,938


$


152,542


$


4,396


2.9

%

Retail Financing gross profit


$


125,610


$


138,381


$


(12,771

)


(9.2

)%

TDA unitsRetail Financing Revenue

TDA units sold decreased 5,633,

Retail Financing revenue increased $4.4 million, or 43.3%2.9%, from 13,018$152.5 million for the year ended December 31, 2022 to $156.9 million for the year ended December 31, 2023. The increase was primarily driven by an increase in 2019interest and discount income from $78.6 million for the year ended December 31, 2022 to 7,385 in 2020.$140.6 million for the year ended December 31, 2023 related to income earned on finance receivables with third-party dealership customers as a result of new originations and the consolidation of the 2022-2 and 2023-1 securitization transactions. The increase was

65


Table of Contents

partially offset by the gain on sale of finance receivables of $45.6 million for the year ended December 31, 2022 related to the 2022-1 and 2022-2 securitization transactions.

Retail Financing Gross Profit

Retail Financing gross profit decreased $12.8 million, or 9.2%, from $138.4 million for the year ended December 31, 2022 to $125.6 million for the year ended December 31, 2023. The decrease was primarily driven by the gain on sale of finance receivables of $45.6 million for the year ended December 31, 2022 related to the 2022-1 and 2022-2 securitization transactions. Additionally, the decrease was a result of a significant reductionan increase in foot traffic duecollection expenses related to servicing finance receivables originated or acquired by UACC and an increase in interest expense on securitization debt from $3.4 million for the COVID-19 pandemic. Additionally, TDA units sold was impacted by reduced inventory atyear ended December 31, 2022 to $18.6 million for the TDA location as the ecommerce business continues to scale.

Vehicle Revenue

TDA vehicle revenue decreased $187.9 million, or 50.0%, from $375.9 million in 2019 to $188.0 million in 2020.year ended December 31, 2023. The decrease in TDA vehicle revenue was primarily due to the 5,633 decrease in TDA units sold, which decreased TDA vehicle revenue by $162.7 million and a lower ASP per unit, which decreased from $28,876 in 2019 to $25,456 in 2020 and decreased revenue by $25.2 million.

Product Revenue

TDA product revenue decreased $5.3 million, or 42.0%, from $12.6 million in 2019 to $7.3 million in 2020. The decrease in TDA product revenue was primarily attributable to the 5,633 decrease in TDA units sold, which decreased TDA product revenue by $5.4 million, partially offset by thean increase in product revenue per unit which increased revenue by $0.1 million.interest and discount income earned on finance receivables with third-party dealership customers as a result of new originations and the consolidation of the 2022-2 and 2023-1 securitization transactions, as described above.

Other Revenue

TDA other revenue decreased $0.3 million, or 21.0%,Selling, general and administrative expenses


Year Ended
December 31,


2023


2022


Change


% Change


(in thousands)


Compensation & benefits


$


166,056


$


251,153


$

(85,097

)


(33.9

)%

Marketing expense


48,440


79,670


(31,230

)


(39.2

)%

Outbound logistics (1)


8,466


39,023


(30,557

)


(78.3

)%

Occupancy and related costs


18,010


23,363


(5,353

)


(22.9

)%

Professional fees


20,129


33,455


(13,326

)


(39.8

)%

Software and IT costs


36,466


44,570


(8,104

)


(18.2

)%

Other


43,090


95,153


(52,063

)


(54.7

)%

Total selling, general & administrative expenses


$


340,657


$


566,387


$

(225,730

)


(39.9

)%

(1)
Outbound logistics primarily includes third-party transportation fees as well as cost related to operating our proprietary logistics network, including fuel, tolls, and maintenance expenses associated with vehicle deliveries. Inbound transportation costs, from $1.7 million in 2019 to $1.4 million in 2020.

Vehicle Gross Profit

TDA vehicle gross profit decreased $7.7 million, or 63.8%, from $12.1 million in 2019 to $4.4 million in 2020. The decrease in vehicle gross profit was primarily attributablethe point of acquisition to the 5,633 decreaserelevant reconditioning facility, are included in TDA units sold, whichcost of sales.

SG&A expenses decreased TDA vehicle gross profit by $5.2 million and a $335 decrease in TDA vehicle gross profit per unit, which decreased vehicle gross profit by $2.5 million. Vehicle gross profit per unit decreased from $927 in 2019 to $592 in 2020, primarily due to lower sales margin.

72


Table of Contents

Product Gross Profit

TDA product gross profit decreased $5.3 million, or 42.0% from $12.6 million in 2019 to $7.3 million in 2020. The decrease in TDA product gross profit was primarily attributable to the 5,633 decrease in TDA units sold, which decreased TDA product gross profit by $5.4 million, partially offset by the increase in product gross profit per unit which increased gross profit by $0.1 million.

Other gross profit

TDA other gross profit decreased $0.3$225.7 million, or 39.9%, from $0.7$566.4 million for the year ended December 31, 2022 to $340.7 million for the year ended December 31, 2023. The total decrease was primarily caused by:

a $85.1 million decrease in 2019compensation and benefits primarily as a result of workforce reductions;

a $31.2 million decrease in marketing expense contemplated by our long-term roadmap, our previous business strategy for our ecommerce business;

a $30.6 million decrease in outbound logistics costs attributable to $0.4the decrease in ecommerce units sold as well as a decrease in outbound logistics cost per ecommerce unit;

a $13.3 million decrease in 2020.professional fees primarily related to costs incurred in connection with the UACC Acquisition during the first quarter of 2022 as well as a decrease in legal and other consulting fees;

a $8.1 million decrease in software and IT costs primarily related to volume-based fees as a result of reduced headcount and more efficient targeted software use;

a $5.4 million decrease in occupancy expense primarily as a result of physical office location closures from the second quarter of 2022 through the second quarter of 2023; and

a $52.1 million decrease in other SG&A expenses primarily due to a decrease in our non-recurring costs, including legal settlements and rental car expenses, as we worked to address our operational challenges created by our rapid growth from 2020 through the first quarter of 2022 as well as reduced fixed and variable costs contemplated by our long-term roadmap.

66


Table of Contents

Selling, general

We expect SG&A expenses to decrease in the future driven by further reductions in both fixed and administrative expensesvariable cost components as we wind-down our ecommerce business and complete our announced workforce reduction.


Year Ended

December 31,


2020


2019


Change


% Change


(in thousands)


Compensation & benefits


$


92,205


$


72,473


$

19,732


27.2

%

Marketing expense


62,393


49,866


12,527


25.1

%

Outbound logistics


30,262


13,950


16,312


116.9

%

Occupancy and related costs


10,784


11,335


(551

)


(4.9

)%

Professional fees


10,560


11,560


(1,000

)


(8.7

)%

Other


39,342


25,804


13,538


52.5

%

Total selling, general & administrative expenses


$


245,546


$


184,988


$

60,558


32.7

%

Selling, generalDepreciation and administrativeamortization

Depreciation and amortization expenses increased $60.5$4.5 million, or 32.7%11.7%, from $185.0$38.3 million in 2019for the year ended December 31, 2022 to $245.5$42.8 million in 2020.for the year ended December 31, 2023. The increase was primarily due to:to an additional month of amortization expense of intangible assets acquired as part of the UACC Acquisition for the year ended December 31, 2023 and amortization related to our capitalized internal use software costs incurred in the development of our platform and website applications.

Impairment Charges

Impairment charges of $48.7 million for the year ended December 31, 2023 primarily consist of $47.4 million long–lived asset impairment charges as a $19.7result of a triggering event as of December 31, 2023. Impairment charges of $211.9 million increasefor the year ended December 31, 2022 represent an impairment charge to write down the carrying amount of the goodwill to fair value, lease impairment charges related to closing physical office locations, Stafford reconditioning facility and Sell Us Your Car® centers, and impairment of long-lived assets no longer in compensationuse.

Gain on debt extinguishment

Gain on debt extinguishment represents a gain of $37.9 million and benefits$164.7 million for the years ended December 31, 2023 and 2022, respectively, related to the repurchase of $74.2 million and $254.3 million in aggregate principal balance of the Notes, net of deferred issuance costs, for $36.5 million and $90.2 million, respectively.

Interest expense

Interest expense increased $4.7 million, or 11.7%, from $40.7 million for the year ended December 31, 2022 to $45.4 million for the year ended December 31, 2023. Interest expense incurred on UACC's Warehouse Credit Facilities increased as a result of an increase in headcountthe outstanding balance. The increase was offset by a decrease in interest expense related to a lower outstanding balance on the 2022 Vehicle Floorplan Facility, as well as a $10.5 million increasedecrease in stock-based compensation from $2.8 million in 2019 to $13.3 million in 2020;

a $16.3 million increase in outbound logistics costs attributableinterest expense on the Notes due to the growth in ecommerce units sold, which increased outbound logistics costs by $11.4 million,repurchase of a portion of the Notes during the second half of 2022 and increases in market rates of logistics providers, which increased outbound logistics costs by $4.9 million;

a $13.5 million increase in other selling, general, and administrative expenses primarily related to $3.9 million of additional insurance costs associated with being a publicly traded company and volume-based subscription fees as our business continues to scale; and

a $12.5 million increase in marketing expense as we expanded our national broad-reach advertising.

during 2023.

These increases were partially offset by a $1.0 million decrease in professional fees due to a reduction in consulting expenses, primarily in the finance and reconditioning departments, as a result of completion of certain process improvement projects and hiring more employees. The decrease in professional fees was partially offset by $2.1 million in costs related to the CarStory acquisition.  

We expect selling, general and administrative expenses to increase in the future as we scale our business and sell more ecommerce units. We will also continue to invest in and improve our customer experience and invest in expanding our proprietary logistics network including our last-mile delivery operations.

Depreciation and amortization

Depreciation and amortization expenses decreased $1.4 million, or 23.6%, from $6.0 million in 2019 to $4.6 million in 2020. The decrease was primarily due to reduced amortization expense as certain intangible assets were fully amortized.

Interest expense

Interest expense decreased $4.9 million, or 33.8%, from $14.6 million in 2019 to $9.7 million in 2020. The decrease was primarily attributable to lower interest rates for the 2020 Vehicle Floorplan Facility as a result of decreases in the1-Month LIBOR rate as well as the repayment of our term loan facility in December 2019.

73


Table of Contents

Interest income

Interest income increased $0.3$1.8 million, or 5.2%9.3%, from $5.6$19.4 million in 2019for the year ended December 31, 2022 to $5.9$21.2 million in 2020.for the year ended December 31, 2023. The increase in interest income was primarily driven by higher interest rates earned on cash and cash equivalent balancesequivalents.

Other loss, net

Other loss, net increased $65.1 million, or 150.8%, from $43.2 million for the year ended December 31, 2022 to $108.3 million for the year ended December 31, 2023. The increase in other loss was primarily driven by an increase in realized and unrealized losses on finance receivables as a result of the IPO and follow-on public offering, partially offset by lower interest rates.a larger loan portfolio as well as higher loss rates on our overall portfolio as of December 31, 2023 as compared to December 31, 2022.

Liquidity and Capital Resources

Our operations historically have been financed primarily from the sale of redeemable convertible preferred stock and borrowings under our Vehicle Floorplan Facility. On June 11, 2020, we completed our IPO in which we sold 24,437,500 shares of our common stock, which included 3,187,500 shares sold pursuant to the exercise by the underwriters of an over-allotment option to purchase additional shares, for proceeds of $504.0 million, net of the underwriting discount and before deducting offering expenses of $7.5 million. On September 15, 2020, we completed our follow-on public offering in which we sold 10,800,000 shares of common stock for proceeds of $569.5 million, net of the underwriting discount and before deducting offering expenses of $1.5 million.

As of December 31, 2020,2023, we had cash and cash equivalents of $1,056.2$135.6 million and restricted cash of $73.2 million. Restricted cash primarily includes restricted cash required under UACC's securitization transactions and Warehouse Credit Facilities of $49.1 million and cash deposits required under our 2022 Vehicle Floorplan Facility of $22.7 million. Prior to the wind-down of our ecommerce operations, our primary source of liquidity was cash generated through financing activities. Additionally, we had excess borrowing capacity of $56.9 million under UACC's Warehouse Credit Facilities as of December 31, 2023.

On January 19, 2024, we amended our 2022 Vehicle Floorplan Facility. As a result of the amendment, borrowings under the 2022 Vehicle Floorplan Facility were suspended for future vehicle purchases and we were required to maintain 40% of our outstanding borrowings in cash. In addition, all other financial covenants were eliminated. As a result of the

67


Table of Contents

liquidation of our vehicle inventory, we repaid all amounts outstanding under the 2022 Vehicle Floorplan Facility in full and the agreement has been terminated.

We expect to use our cash and cash equivalents to finance our future capital requirements and UACC’s Warehouse Credit Facilities to fund our finance receivables. Certain advance rates available to UACC on borrowings from the Warehouse Credit Facilities have decreased as a result of the increasing credit losses in UACC's portfolio and overall rising interest rates. Any future decreases on available advance rates may have an adverse impact on our liquidity.

As of February 29, 2024, we had cash and cash equivalents of approximately $94.0 million. We anticipate that our existing cash and cash equivalents and the 2020 Vehicle Floorplan FacilityUACC's Warehouse Credit Facilities will be sufficient to support our working capital and capital expenditure requirementsthe Company for at least the next twelve months from the date of this Annual Report on Form 10-K. For

In addition to our ongoing cash requirements, our liquidity will also be used to fund costs related to the year ended December 31, 2020, we had negative cash flow fromannounced wind-down of our ecommerce operations, primarily in relation to severance and generatedearly contract and lease termination payments. Such payments could be significant and have a net loss. We have not been profitable since our inception in 2012. We expect to incur additional losses in the future.

We historically have funded vehicle inventory purchases primarily through our floorplan financing arrangements. Our cash flows from operations may differ substantially from our net loss due to non-cash charges or due to changes in balance sheet accounts. The timing ofmaterial effect on our cash flows from operating activities can also vary among periods due to the timing of payments made or received.operations. Our future capital requirements will depend on many factors, including our ability to successfully implement the Value Maximization Plan and realize its benefits, available advance rates on our Warehouse Credit Facilities, our ability to complete additional securitization transactions at terms favorable to us, and our future credit losses. We have no significant debt maturities due until July 2026 and the payments on our securitization debt are funded by cashflows on the finance receivables within the securitization trusts.

Convertible Senior Notes

On June 18, 2021, we issued $625.0 million aggregate principal amount of the Notes pursuant to an indenture between us and U.S. Bank National Association, as trustee (the “Indenture”).

The Notes bear interest at a rate of revenue growth, our efforts0.75% per annum, payable semiannually in arrears on January 1 and July 1 of each year, beginning on January 1, 2022. The Notes will mature on July 1, 2026, subject to earlier repurchase, redemption or conversion. The total net proceeds from the offering, after deducting commissions paid to the initial purchasers and debt issuance costs, were approximately $608.9 million. During the year ended December 31, 2023, the conditions allowing holders of the Notes to convert were not met.

During the year ended December 31, 2023, we repurchased $74.2 million in aggregate principal amount of the Notes, net of deferred issuance costs, for $36.5 million, respectively, in open-market transactions. We recognized a gain on extinguishment of debt of $37.9 million for the year ended December 31, 2023. As a result of these repurchases and repurchases made in 2022, as of December 31, 2023, $286.8 million aggregate principal amount of the Notes remain outstanding, net of deferred issuance costs of $3.7 million. Subject to market conditions and availability, we may continue to opportunistically repurchase Notes from time to time to reduce costs per unit, the expansionour outstanding indebtedness at a discount. Refer to Note 13 — Long Term Debt of our inventoryconsolidated financial statements included elsewhere in this Annual Report on Form 10-K, for further discussion.

Finance Receivables

Subject to market conditions, we plan to sell finance receivables originated by UACC through asset-backed securitization transactions. In January 2023, UACC sold approximately $238.7 million of investment grade rated asset-backed securities in the 2023-1 auto loan securitization transaction for proceeds of $237.8 million. On April 19, 2023, UACC sold the non-investment grade rated securities related to the 2023-1 securitization transaction for $23.1 million. The securitization trust is collateralized by finance receivables with an aggregate principal balance of $326.4 million. As a result of market conditions at the time, which led to unfavorable pricing, UACC retained the residual interests, and saleswe accounted for the 2023-1 securitization transaction as secured borrowings.

In the year ended December 31, 2022, UACC sold $523.7 million of rated asset-backed securities and marketing activities, investment$49.6 million of residual certificates in 2022-1 and 2022-2 auto loan securitization transactions for proceeds of $582.9 million. The securitization trusts are collateralized by finance receivables with an aggregate principal balance of $603.5 million and have a carrying value of $534.6 million at the time of sale.

68


Table of Contents

Finance receivables are serviced by UACC. UACC retains at least 5% of the notes and residual certificates sold as required by applicable risk retention rules and generally uses the proceeds of the securitization transactions to pay down outstanding debt under its Warehouse Credit Facilities.

Depending on market conditions, future securitization transactions may be accounted for as secured borrowings and remain on balance sheet.

As a result of high interest rates, the current inflationary environment and vehicle depreciation in the used automotive industry, UACC is experiencing higher loss severity. The increased loss severity could lead to reduced servicing income if UACC elects to waive monthly servicing fees going forward as it did in the first quarter of 2023. The waiver of monthly servicing fees related to the 2022-2 securitization transaction resulted in consolidation of the related finance receivables and securitization debt on our reconditioning, logisticsfinancial statements.

Refer to Note 4 — Variable Interest Entities and customer experience operations, enhancementsSecuritizations to our ecommerce platform,consolidated financial statements included elsewhere in this Annual Report on Form 10-K, for further discussion.

UACC Risk Retention Financing Facility

On May 3, 2023, UACC entered into a Risk Retention Financing Facility enabling it to finance asset-backed securities issued in its securitization transactions and increased hiring efforts. We may be requiredheld by UACC pursuant to seek additional equityapplicable risk retention rules. Under this facility, UACC sells such retained interests and agrees to repurchase them at fair value on a future date. In its initial transaction under this facility, UACC pledged $24.5 million of its retained beneficial interests as collateral, and received proceeds of $24.1 million, with expected repurchase dates ranging from March 2025 to September 2029. The securitization trusts will distribute payments related to UACC's pledged beneficial interests in securitizations directly to the lenders, which will reduce the beneficial interests in securitizations and the related debt balance.

Warehouse Credit Facilities

UACC has four senior secured warehouse facility agreements the (“Warehouse Credit Facilities”) with banking institutions. The Warehouse Credit Facilities are collateralized by eligible finance receivables and available borrowings are computed based on a percentage of eligible finance receivables. The aggregate borrowing limit is $825.0 million with maturities between June 2025 and September 2025. As of December 31, 2023, outstanding borrowings related to the Warehouse Credit Facilities were $421.3 million and we were in compliance with all covenants related to the Warehouse Credit Facilities. Failure to satisfy these and or debt financing inany other requirements contained within the futureagreements would restrict access to fundthe Warehouse Credit Facilities and could have a material adverse effect on our operations or to fund our needs for capital expenditures. In the event that additional financing is required, we may not be able to raise it on terms acceptable to us, or at all. If we are unable to raise additional capital or generate cash flows necessary to expand our operations, our business,financial condition, results of operations and liquidity. Certain breaches of covenants may also result in acceleration of the repayment of borrowings prior to the scheduled maturity. Refer to Note 11 — Warehouse Credit Facilities of Consolidated VIEs to our consolidated financial condition could be adversely affected.statements included elsewhere in this Annual Report on Form 10-K, for further discussion.

Vehicle Financing

Operating Leases

Prior to the wind-down of our ecommerce operations, we entered into various noncancelable operating lease agreements for office space, the Company’s reconditioning facility, the TDA retail location, the Company’s Sell Us Your Car centers, regional logistics hubs, parking lots, other facilities, and equipment used in the normal course of business, and, as of December 31, 2023 operating lease obligations were $33.9 million, with $10.7 million payable within 12 months. As of December 31, 2020,2023, UACC had an additional operating lease that has not yet commenced with future lease payments of approximately $1.2 million. The lease is expected to commence over the next 12 months with initial lease terms of approximately 7 years. As a result of the Value Maximization Plan, we financehave been negotiating early terminations of our inventory with a vehicle floorplan facility (the “2020 Vehicle Floorplan Facility”) with Ally Bank, which provides a committed credit linelease obligations. As of up to $450.0March 8, 2024, we have reduced our aggregate future operating lease obligations by $4.9 million.

The amount of credit available to us under the 2020 Vehicle Floorplan Facility is determined on a monthly basis based on a calculation that considers average outstanding borrowings and vehicle units paid off by us within the three immediately preceding months. Approximately $27.7 million was available under this facility as of December 31, 2020. In October 2020, we amended our 2020 Vehicle Floorplan Facility to extend the maturity date to September 30, 2022. The amendment requires us to pay an availability fee Our ongoing lease obligations will depend on the average unused capacity from the prior quarter if it was greater than 50%outcomes of the calculated floorplan allowance, as defined. Wediscussions and negotiations (a number of which are subject to financial covenants that require us to maintain a certain level of equity in the vehicles that are financed, to maintain at least 7.5% of the credit line in cash and cash equivalents and to maintain 10% of the monthly daily floorplan principal balance outstanding on depositcurrently ongoing) with Ally Bank. We were required to pay an upfront commitment fee upon execution of the amendment.

Outstanding borrowings are due as the vehicles financed are sold, or in any event, on the maturity date. The 2020 Vehicle Floorplan Facility bears interest at a rate equalcounterparties to the 1-Month LIBOR rate applicableleases we still intend to terminate or modify. See "Note 12—Leases,” to our consolidated financial statements included elsewhere in this Annual Report on Form 10-K for further detail of our obligations and the immediately preceding month plus a spreadtiming of 425 basis points.expected future payments.

74

69


Table of Contents

Cash Flows from Operating, Investing, and Financing Activities

The following table summarizes our cash flows for the years ended December 31, 2020, 2019,2023 and 2018:2022:


Year Ended

December 31,


Year Ended
December 31,


2020


2019


2018


2023


2022


(in thousands)


(in thousands)


Net cash used in operating activities


$


(355,254

)


$


(215,636

)


$


(64,911

)


$


(533,684

)


$


(109,065

)

Net cash (used in) provided by investing activities


(11,329

)


(3,528

)


12,788


Net cash provided by financing activities


1,237,035


275,242


132,375


Net increase in cash and cash equivalents and restricted cash


870,452


56,078


80,252


Net cash provided by (used in) investing activities


173,153


(164,212

)

Net cash provided by (used in) financing activities


97,340


(469,488

)

Net (decrease) increase in cash, cash equivalents and restricted cash


(263,191

)


(742,765

)

Cash and cash equivalents and restricted cash at beginning of period


219,587


163,509


83,257


472,010


1,214,775


Cash and cash equivalents and restricted cash at end of period


$


1,090,039


$


219,587


$


163,509


$


208,819


$


472,010


Operating Activities

Net cash flows used in operating activities increased $139.7by $424.6 million, or 64.8%, from $215.6$109.1 million for the year ended December 31, 2022 to $533.7 million for the year ended December 31, 2023. For the year ended December 31, 2022, the cash used in 2019operating activities was partially offset by the proceeds from the sale of finance receivables held for sale related to $355.3 millionthe 2021-2 and 2022-2 securitization transactions of $509.6 million. The remaining increase in 2020. The increasenet cash used in operating activities is primarily attributabledue to an increasea change in working capital of $155.1 million, primarily related to higherthe change in inventory levels as we continue to scale our business, resultinglevels. The increases were partially offset by a $149.3 million decrease in an increase in the use of cash of $131.6 million, as well as $27.0 million in incremental net loss after reconciling adjustments in 2020for the year ended December 31, 2023, as compared to 2019.the year ended December 31, 2022, a decrease of originations of finance receivables held for sale of $43.4 million, and an increase in principal payments received on finance receivables held for sale of $41.3 million

As the 2023-1 securitization transaction was accounted for as secured borrowings, the proceeds are included as a financing activity in our consolidated statement of cash flows.

We finance substantially allfinanced a majority of our inventoriesinventory with the 2022 Vehicle Floorplan Facility. In accordance with U.S. GAAP, relating to the statement of cash flows, we report all cash flows arising in connection with the 2022 Vehicle Floorplan Facility as a financing activity in our consolidated statement of cash flows.

Investing Activities

Net cash flows from investing activities changed $337.4 million, from net cash used in investing activities increased $7.8of $164.2 million from $3.5for the year ended December 31, 2022 to net cash provided by investing activities of $173.2 million in 2019 to $11.3 million in 2020,for the year ended December 31, 2023. The change was primarily as a result of the UACC Acquisition in February 2022 which resulted in cash outflow of $267.5 million during the year ended December 31, 2022, a decrease in purchases of finance receivables at fair value of $53.1 million, an increase in capitalizationprincipal payments received on finance receivables at fair value of software development costs$42.4 million, and the acquisition of trucks for our proprietary logistics network.

Financing Activities

Net cash flows provided by financing activities increased $961.8 million from $275.2 million in 2019 to $1,237.0 million in 2020. The increase was primarily related to $497.2 million of net proceeds received upon completionconsolidation of the IPO net2022-2 securitization transaction which resulted in a cash inflow of cash paid for offering expenses, $568.0$11.4 million of net proceeds received upon completion ofduring the follow-on public offering net of cash paid for offering expenses, a net increase in cash of $74.9 million related to our Vehicle Floorplan Facility, and a net increase in cash related to the $25.7 million repayment of our long-term debt in 2019. These increasesyear ended December 31, 2023. The changes were partially offset by a decrease in proceeds from the sale of finance receivables at fair value for the 2022-1 and 2022-2 securitization transactions of $43.3 million, which resulted in a cash inflow during the year ended December 31, 2022.

Financing Activities

Net cash flows from financing activities changed $566.8 million, from net cash used in financing activities of $469.5 million for the year ended December 31, 2022 to net cash provided by financing activities of $97.3 million for the year ended December 31, 2023. The change was primarily related to proceeds from borrowings under secured financing arrangements of $262.0 million, an increase in net cash inflow of $136.0 million related to our Warehouse Credit Facilities, a decrease in net repayments of $110.0 million related to our 2022 Vehicle Floorplan Facility, a decrease in the issuancerepurchase of Series H preferred stock, netconvertible senior notes of issuance costs paid. Net cash flows provided by$53.7 million, and proceeds from financing activitiesbeneficial interests in 2020 includedsecuritizations of $24.5 million for the issuance of $21.7 million of Series H preferred stock, as compared to the issuance of $227.5 million in 2019.

Contractual Obligations and Commitments

The following table summarizes our contractual obligations and commitments as ofyear ended December 31, 2020:2023. The changes were partially offset by an increase in principal repayments under secured financing agreements and financing beneficial interests in securitizations of $15.6 million and $8.7 million, respectively.


Payments Due by Year


Total


Less than

1 year


1-3 years


3-5 years


More than

5 years


(in thousands)


Vehicle Floorplan Facility (excluding interest)


$


329,231


$


329,231


$


$


$


Operating leases


18,145


6,052


8,171


3,922


Total


$


347,376


$


335,283


$


8,171


$


3,922


$


7570


Table of Contents

Off Balance Sheet Arrangements

We do not have any off balance sheet arrangements, as defined by applicable regulations of the SEC, that are reasonably likely to have a current or future material effect on our financial condition, results of operations, liquidity, capital expenditures or capital resources.

Critical Accounting Policies and Estimates

Our consolidated financial statements are prepared in accordance with GAAP. The preparation of consolidated financial statements requires us to make estimates, assumptions and judgments that affect the reported amounts of assets, liabilities, revenue, and expenses and related disclosures. On an ongoing basis, we evaluate our estimates, including, among others, those related to income taxes, the realizability of inventory, stock-based compensation, revenue-related reserves, as well as impairment of goodwill and long-lived assets. We base our estimates on historical experience, market conditions and on various other assumptions that are believed to be reasonable. Actual results may differ from these estimates.

Beginning

The critical accounting policies that reflect our more significant judgments and estimates used in the first quarterpreparation of 2020, the COVID-19 pandemic negatively impacted, and may continue to negatively impact, the macroeconomic environmentour consolidated financial statements include those described in the United States and globally, as well as our business, financial condition and results of operations. Due to the evolving and uncertain nature of COVID-19, it is reasonably possible that it could materially impact our estimates, particularly those noted above that require consideration of forecasted financial information, in the near to medium term. The ultimate impact will depend on numerous evolving factors that we may not be able to accurately predict, including the duration and extent of the pandemic, the impact of federal, state, local and foreign governmental actions, consumer behavior in response to the pandemic and other economic and operational conditions that we may face.

We believe that the accounting policies described below involve a significant degree of judgment and complexity. Accordingly, we believe these are the most critical to aid in fully understanding and evaluating our financial condition and results of operations. For further information, see “NoteNote 2—Summary of Significant Accounting Policies”Policies and “NoteNote 3—Revenue Recognition” in the NotesRecognition to Consolidated Financial Statementsour consolidated financial statements included elsewhere in this Annual Report on Form 10-K.

Revenue Recognition

We adopted ASU 2014-09, Revenue from Contracts with Customers (“Topic 606”), as of January 1, 2018 utilizing the modified retrospective approach applied only to contracts not completed as of the date of adoption.

We recognized a net decrease to accumulated deficit of approximately $1.7 million as of January 1, 2018 due to the cumulative effect of adopting Topic 606.

Revenue consists of retail vehicle sales through our ecommerce platform and TDA retail location, wholesale vehicle sales and other revenues. Revenue also includes delivery charges. Our product revenue consists of fees earned on customer vehicle financing from third-party lenders and fees earned on sales of other value-added products, such as vehicle service contracts, GAP protection and tire and wheel coverage.

We recognize revenue upon transfer of control of goods or services to customers, in an amount that reflects the consideration to which we expect to be entitled in exchange for those goods or services. We may collect sales taxes and other taxes from customers on behalf of governmental authorities at the time of sale as required. These taxes are accounted for on a net basis and are not included in revenues or cost of sales.

Our revenue is disaggregated within the consolidated statement of operations and is generated from customers throughout the United States.

Retail Vehicle Revenue

We sell vehicles to our retail customers through our Ecommerce segment and our TDA segment. The transaction price for vehicles is a fixed amount as set forth within the customer contract at the time of sale. Customers frequently trade-in their existing vehicle to apply the amount received for such vehicle towards the transaction price of a purchased vehicle. Trade-in vehicles represent noncash consideration, which we measure at an agreed upon price based on fair value, which is based on external and internal market data for each specific vehicle. We generally satisfy our performance obligation and recognize revenue for vehicle sales at a point in time when the vehicles are delivered to the customers for ecommerce sales or picked up by the customer for TDA sales. The revenue recognized by us includes the agreed upon

76


Table of Contents

transaction price, including any delivery charges stated within the customer contract. Revenue excludes any sales taxes, title and registration fees, and other government fees that are collected from customers.

We receive payment for vehicle sales directly from the customer at the time of sale or from third-party financial institutions within a short period of time following the sale if the customer obtains financing. Payments received prior to delivery or pick-up of used vehicles are recorded as “Deferred revenue” within the consolidated balance sheet.

We offer a return program for used vehicle sales and establish a provision for estimated returns based on historical information and current trends. The reserve for estimated returns is presented gross on the consolidated balance sheet, with an asset recorded in “Prepaid expenses and other current assets” and a refund liability recorded in “Other current liabilities.”

Wholesale Vehicle Revenue

We sell vehicles that do not meet our Vroom retail sales criteria primarily through wholesale channels. Vehicles sold through wholesale channels are acquired from customers who trade-in their vehicles when making a purchase from us and also from customers who sell their vehicles to us in direct-buy transactions. The transaction price for a wholesale vehicle is a fixed amount. We satisfy our performance obligation and recognize revenue for wholesale vehicle sales when the vehicle is sold. The transaction price is typically due and collected within a short period of time following the vehicle sales.

Product Revenue

Our product revenue consists of fees earned on customer vehicle financing from third-party lenders and fees earned on sales of other value-added products such as vehicle service contracts, GAP protection and tire and wheel coverage. We sell these products pursuant to arrangements with the third parties that provide these products and are responsible for their fulfilment. We concluded that we are an agent for these transactions because we do not control the products before they are transferred to the customer. As an agent, our performance obligation is to arrange for the third party to provide the products. We recognize product revenues on a net basis when the customer enters into an arrangement for the products, which is typically at the time of a used vehicle sale.

Customers may enter into retail installment sales contracts to finance the purchase of used vehicles. We sell these contracts on a non-recourse basis to various financial institutions. We receive fees from the financial institution based on the difference between the interest rate charged to the customer that purchased the vehicle and the interest rate set by the financial institution. These fees are recognized upon sale and assignment of the installment sales contract to the financial institution.

A portion of the fees earned on these products is subject to chargebacks in the event of early termination, default, or prepayment of the contracts by end-customers. Our exposure for these events is limited to fees that we receive. An estimated refund liability for chargebacks against the revenue recognized from sales of these products is recorded in the period in which the related revenue is recognized and is based primarily on our historical chargeback experience. We update our estimates at each reporting date. As of December 31, 2020 and 2019, our reserve for chargebacks was approximately $3.8 million and $3.3 million, respectively.

We also are contractually entitled to receive profit-sharing revenues based on the performance of the protection policies once a required claims period has passed. We recognize profit-sharing revenue to the extent it is probable that it will not result in a significant revenue reversal. We estimate the revenue based on historical claims and cancellation data from our customers, as well as other qualitative assumptions. We reassess the estimate at each reporting period with any changes reflected as an adjustment to revenues in the period identified. As of December 31, 2020 and 2019, we had recognized approximately $11.5 million and $6.9 million, respectively, related to cumulative profit-sharing payments to which we expect to be entitled.

Other Revenue

Other revenue primarily consists of labor and parts revenue earned by us for vehicle repair services at TDA.

Inventory

Inventory consists of vehicles and parts and accessories and is stated at the lower of cost or net realizable value. Inventory cost is determined by specific identification and includes acquisition cost, direct and indirect reconditioning costs, and in-bound transportation costs. Net realizable value is the estimated selling price less costs to complete, dispose and

77


Table of Contents

transport the vehicles. We recognize any necessary adjustments to reflect inventory at the lower of cost or net realizable value in cost of sales in the consolidated statements of operations.

Shipping and Handling

Our logistics costs relate to transporting vehicle inventory and are primarily third-party transportation fees. The portion of these costs related to inbound transportation from the point of acquisition to the relevant reconditioning facility is included within inventory and reclassified into cost of sales when the related vehicle is sold. Logistics costs related to delivering vehicles sold to customers are accounted for as costs to fulfil contracts with customers and are included in “Selling, general and administrative expenses” in the consolidated statement of operations and were approximately $30.3 million, $14.0 million, and $6.4 million for the years ended December 31, 2020, 2019, and 2018, respectively.

Leases

We adopted Topic 842 as of January 1, 2020 using the modified retrospective approach with any cumulative-effect adjustment to opening retained earnings (accumulated deficit) with no restatement of comparative periods. Upon adoption, we recognized $18.4 million of operating lease liabilities and $17.4 million of operating lease right-of-use assets.

The adoption of Topic 842 did not result in a cumulative effect adjustment to accumulated deficit. We elected to utilize the package of practical expedients for transition which permitted us to not reassess our prior conclusions regarding whether a contract is or contains a lease, lease classification and initial direct costs.

We did not elect the hindsight practical expedient to determine lease terms. We elected the short-term lease recognition exemption for all leases that qualify and the practical expedient to not separate lease and non-lease components of leases.

Goodwill

Goodwill represents the excess of the consideration transferred over the fair value of the identifiable assets acquired and liabilities assumed in business combinations. Goodwill is tested for impairment annually as of October 1, or whenever events or changes in circumstances indicate that an impairment may exist.

We have three reporting units: Ecommerce, Wholesale and TDA. In performing our annual goodwill impairment test, we first review qualitative factors to determine whether it is more likely than not that the fair value of a reporting unit is less than its carrying amount. If, after assessing qualitative factors, we determine that it is not more likely than not that the fair value of a reporting unit is less than its carrying amount, then performing the quantitative test is unnecessary and our goodwill is not considered to be impaired. However, if based on the qualitative assessment we conclude that it is more likely than not that the fair value of the reporting unit is less than its carrying amount, or if we elect to bypass the optional qualitative assessment as provided for under GAAP, we proceed with performing the quantitative impairment test.

No goodwill impairment was determined to exist for the years ended December 31, 2020, 2019, and 2018.

In connection with its annual goodwill impairment test as of October 1, 2020, the Company performed impairment assessments for each of its reporting units. The results of the assessments indicated that it was not more likely than not that the fair value of the reporting units were less than the carrying values.

The quantitative goodwill impairment test requires a determination of whether the estimated fair value of a reporting unit is less than its carrying value. We estimate the fair value of our reporting units using an income valuation approach. The income valuation approach is applied using the discounted cash flow method which requires (1) estimating future cash flows for a discrete projection period (2) estimating the terminal value, which reflects the remaining value that the reporting unit is expected to generate beyond the projection period and (3) discounting those amounts to present value at a discount rate which is based on a weighted average cost of capital that considers the relative risk of the cash flows. The income valuation approach requires the use of significant estimates and assumptions, which include revenue growth rates, future gross profit margins and operating expenses used to calculate projected future cash flows, determination of the weighted average cost of capital, and future economic and market conditions. The terminal value is based on an exit multiple which requires significant assumptions regarding the selection of appropriate multiples that consider relevant market trading data. We base our estimates and assumptions on our knowledge of the automotive and ecommerce industries, our recent performance, our expectations of future performance and other assumptions we believe to be reasonable. Actual future results may differ from those estimates. We also make certain judgments and assumptions in allocating shared assets and liabilities to determine the carrying values for each of our reporting units.

78


Table of Contents

Income Taxes

We account for income taxes under the asset and liability method. We recognize deferred tax assets and liabilities for the future tax consequences attributable to differences between the financial statement carrying amounts of existing assets and liabilities and their respective tax basis, as well as for operating loss and tax credit carry forwards. We measure deferred tax assets and liabilities using enacted tax rates expected to apply to taxable income in the years in which we expect to recover or settle those temporary differences. We recognize the effect of a change in tax rates on deferred tax assets and liabilities in the results of operations in the period that includes the enactment date. We reduce the measurement of a deferred tax asset, if necessary, by a valuation allowance if it is “more-likely-than-not” that we will not realize some or all of the deferred tax asset. We maintained a full valuation allowance against net deferred tax assets because we determined that is it more likely than not that these assets will not be fully realized based on a current evaluation of expected future taxable income and we are in a cumulative loss position.

We account for uncertain tax positions by recognizing the financial statement effects of a tax position only when, based upon technical merits, it is “more likely than not” that the position will be sustained upon examination. Potential interest and penalties associated with unrecognized tax positions are recognized in income tax expense.

Stock-Based Compensation

We recognize the cost of employee services received in exchange for stock awards based on the fair value of those awards at the date of grant over the requisite service period. We use the Black-Scholes-Merton option-pricing model, which we refer to as Black Scholes option-pricing model, to determine the fair value of our stock-based awards. Estimating the fair value of stock-based awards requires the input of subjective assumptions, including the estimated fair value of our common stock, the expected life of the options, stock price volatility, the risk-free interest rate and expected dividends. The assumptions used in the Black-Scholes option-pricing model represent our best estimates and involve a number of variables, uncertainties and assumptions and the application of management’s judgment, as they are inherently subjective.

Recently Issued and Adopted Accounting Pronouncements

See

Refer to “Note 2—Summary of Significant Accounting Policies” to our consolidated financial statements included elsewhere in Part II, Item 8 of this Annual Report on Form 10-K for a discussion about new accounting pronouncements adopted and not yet adopted as of the date of this report.

71


Table of Contents

Item 7A. Quantitative and Qualitative Disclosure About Market Risk

Market risk is

We are a smaller reporting company as defined in Rule 12b-2 of the risk of economic losses dueExchange Act and are not required to adverse changes in financial market prices and rates. Our primary market risk has been interest rate risk. We do not have material exposure to commodity risk.provide the information otherwise required under this Item 7A.

Interest Rate Risk72

As of December 31, 2020, we had an outstanding balance under the 2020 Vehicle Floorplan Facility of $329.2 million. The 2020 Vehicle Floorplan Facility bears interest at a rate equal to the 1-Month LIBOR rate applicable in the immediately preceding month, plus a spread of 425 basis points. A hypothetical 10% change in interest rates during the year ended December 31, 2020 would result in a change to interest expense of $0.9 million.

Inflation Risk

Inflationary factors such as increases in overhead costs may adversely affect our operating results. Although we do not believe that inflation has had a material impact on our financial position or results of operations to date, a high rate of inflation in the future may have an adverse effect on our ability to maintain current levels of operating expenses as a percentage of revenue, if the selling prices of our products do not increase with these increased costs.

79


Table of Contents

Item 8.

Financial Statements and Supplementary Data

Item 8. Financial Statements and Supplementary Data

INDEX TO CONSOLIDATED FINANCIAL STATEMENTS

Page

Report of Independent Registered Public Accounting Firm PCAOB ID 238

8174

Consolidated Balance Sheets as of December 31, 20202023 and 20192022

8376

Consolidated Statements of Operations for the Years Ended December 31, 2020, 20192023 and 20182022

8477

Consolidated Statements of Changes in Redeemable Convertible Preferred Stock and Stockholders' Equity (Deficit) for the Years Ended December 31, 2020, 20192023 and 20182022

8578

Consolidated Statements of Cash Flows for the Years Ended December 31, 2020, 20192023 and 20182022

8679

Notes to Consolidated Financial Statements

8881

8073


Table of Contents

Report of Independent Registered Public Accounting Firm

To the Board of Directors and Stockholders of Vroom, Inc.

OpinionOpinions on the Financial Statements and Internal Control over Financial Reporting

We have audited the accompanying consolidated balance sheets of Vroom, Inc. and its subsidiaries (the “Company”) as of December 31, 20202023 and 2019,2022, and the related consolidated statements of operations, of changes in redeemable convertible preferred stock and stockholders'stockholders’ equity (deficit) and of cash flows for each of the three years in the periodthen ended, December 31, 2020, including the related notes (collectively referred to as the “consolidated financial statements”). We also have audited the Company's internal control over financial reporting as of December 31, 2023, based on criteria established in Internal Control - Integrated Framework (2013) issued by the Committee of Sponsoring Organizations of the Treadway Commission (COSO).

In our opinion, the consolidated financial statements referred to above present fairly, in all material respects, the financial position of the Company as of December 31, 20202023 and 2019,2022, and the results of its operations and its cash flows for each of the three years in the periodthen ended December 31, 2020 in conformity with accounting principles generally accepted in the United States of America. Also in our opinion, the Company maintained, in all material respects, effective internal control over financial reporting as of December 31, 2023, based on criteria established in Internal Control - Integrated Framework(2013)issued by the COSO.

Basis for OpinionOpinions

TheseThe Company's management is responsible for these consolidated financial statements, are the responsibilityfor maintaining effective internal control over financial reporting, and for its assessment of the Company’s management.effectiveness of internal control over financial reporting, included in Management's Annual Report on Internal Control over Financial Reporting appearing under Item 9A. Our responsibility is to express an opinionopinions on the Company’s consolidated financial statements and on the Company's internal control over financial reporting based on our audits. We are a public accounting firm registered with the Public Company Accounting Oversight Board (United States) (PCAOB) and are required to be independent with respect to the Company in accordance with the U.S. federal securities laws and the applicable rules and regulations of the Securities and Exchange Commission and the PCAOB.

We conducted our audits of these consolidated financial statements in accordance with the standards of the PCAOB. Those standards require that we plan and perform the audits to obtain reasonable assurance about whether the consolidated financial statements are free of material misstatement, whether due to error or fraud.fraud, and whether effective internal control over financial reporting was maintained in all material respects.

Our audits of the consolidated financial statements included performing procedures to assess the risks of material misstatement of the consolidated financial statements, whether due to error or fraud, and performing procedures that respond to those risks. Such procedures included examining, on a test basis, evidence regarding the amounts and disclosures in the consolidated financial statements. Our audits also included evaluating the accounting principles used and significant estimates made by management, as well as evaluating the overall presentation of the consolidated financial statements. Our audit of internal control over financial reporting included obtaining an understanding of internal control over financial reporting, assessing the risk that a material weakness exists, and testing and evaluating the design and operating effectiveness of internal control based on the assessed risk. Our audits also included performing such other procedures as we considered necessary in the circumstances. We believe that our audits provide a reasonable basis for our opinion.opinions.

Emphasis of Matter

As discussed in Note 1 – Value Maximization Plan to the consolidated financial statements, in 2024, the Board of Directors approved a value maximization plan, pursuant to which the Company discontinued its ecommerce operations and is winding down its used vehicle dealership business.

Definition and Limitations of Internal Control over Financial Reporting

A company’s internal control over financial reporting is a process designed to provide reasonable assurance regarding the reliability of financial reporting and the preparation of financial statements for external purposes in accordance with generally accepted accounting principles. A company’s internal control over financial reporting includes those policies and procedures that (i) pertain to the maintenance of records that, in reasonable detail, accurately and fairly reflect the

74


Table of Contents

transactions and dispositions of the assets of the company; (ii) provide reasonable assurance that transactions are recorded as necessary to permit preparation of financial statements in accordance with generally accepted accounting principles, and that receipts and expenditures of the company are being made only in accordance with authorizations of management and directors of the company; and (iii) provide reasonable assurance regarding prevention or timely detection of unauthorized acquisition, use, or disposition of the company’s assets that could have a material effect on the financial statements.

Because of its inherent limitations, internal control over financial reporting may not prevent or detect misstatements. Also, projections of any evaluation of effectiveness to future periods are subject to the risk that controls may become inadequate because of changes in conditions, or that the degree of compliance with the policies or procedures may deteriorate.

Critical Audit Matters

The critical audit matter communicated below is a matter arising from the current period audit of the consolidated financial statements that was communicated or required to be communicated to the audit committee and that (i) relates to accounts or disclosures that are material to the consolidated financial statements and (ii) involved our especially challenging, subjective, or complex judgments. The communication of critical audit matters does not alter in any way our opinion on the consolidated financial statements, taken as a whole, and we are not, by communicating the critical audit matter below, providing a separate opinion on the critical audit matter or on the accounts or disclosures to which it relates.

Revenue Recognition – Retail Vehicle, Net Revenues

As described in Notes 2 andNote 3 to the consolidated financial statements, revenue consists of retail used vehicle sales, wholesale used vehicle sales, fees earned on sales of value-added products to customers in connection with vehicle sales, and other revenues. The Company recognizes revenue upon the transfer of control of goods or services to customers, in an amount that reflects the consideration to which the Company expects to be entitled in exchange for those goods or services. The Company’s revenue was $1,357.7 million for the year ended December 31, 2020.  2023 included retail vehicle, net revenues of $566.0 million. The Company recognizes revenue for used vehicle sales generally at a point in time when the vehicles are delivered to the customer or picked up by the customer. The revenue recognized by the Company includes the agreed upon transaction price, including any delivery charges and document fees stated within the customer contract.

The principal considerationsconsideration for our determination that performing procedures relating to revenuethe recognition of retail vehicle, net revenues is a critical audit matter areis a high degree of auditor effort in performing procedures and evaluating audit evidence related to revenue recognition after consideration of the material weaknesses identified by the Company in its internal control environment.  Company’s retail vehicle, net revenues.

81


Table of Contents

Addressing the matter involved performing procedures and evaluating audit evidence in connection with forming our overall opinion on the consolidated financial statements. These procedures included testing the effectiveness of controls relating to the revenue recognition process, including controls over the recording of revenue at the transaction price when the used vehicle has been delivered to the customer or picked up by the customer. These procedures also included, among others (i) evaluating the recognition of revenue fortesting a sample of retail vehicle, net revenue transactions by obtaining and inspecting source documents, including invoices, salessuch as customer contracts, shipping and delivery documents, and cash receipts and (ii) testing the cutofftiming of revenue transactions. These procedures also included evaluating the naturerecognition for a sample of retail vehicle, net revenue transactions before December 31, 2023 by obtaining and extent of audit procedures performedinspecting source documents, such as customer contracts and evidence obtained.delivery documents.

 /s/ /s/ PricewaterhouseCoopers LLP

New York, New York

March 3, 202113, 2024

We have served as the Company’s auditor since 2016.

75

82


Table of Contents

VROOM, INC.

CONSOLIDATED BALANCE SHEETS

(in thousands, except share and per share amounts)


As of


December 31,


2020


2019


ASSETS


Current Assets:


Cash and cash equivalents


$

1,056,213


$

217,734


Restricted cash


33,826


1,853


Accounts receivable, net of allowance of $2,803 and $789, respectively


60,576


30,848


Inventory


423,647


205,746


Prepaid expenses and other current assets


23,617


9,149


Total current assets


1,597,879


465,330


Property and equipment, net


15,092


7,828


Goodwill


78,172


78,172


Operating lease right-of-use assets


17,137


Other assets


15,776


12,057


Total assets


$

1,724,056


$

563,387


LIABILITIES, REDEEMABLE CONVERTIBLE PREFERRED STOCK AND STOCKHOLDERS’ EQUITY (DEFICIT)


Current Liabilities:


Accounts payable


$

32,925


$

18,987


Accrued expenses


59,405


38,491


Vehicle floorplan


329,231


173,461


Deferred revenue


24,822


17,323


Operating lease liabilities, current


6,052


Other current liabilities


30,275


11,572


Total current liabilities


482,710


259,834


Operating lease liabilities, excluding current portion


12,093


Other long-term liabilities


2,151


3,073


Total liabilities


496,954


262,907


Commitments and contingencies (Note 9)


Redeemable convertible preferred stock, $0.001 par value; 10,000,000 and 86,123,364 shares authorized as of December 31, 2020 and 2019, respectively; zero and 83,568,628 shares issued and outstanding as of December 31, 2020 and 2019, respectively


874,332


Stockholders’ equity (deficit):


Common stock, $0.001 par value; 500,000,000 and 113,443,854 shares authorized as of December 31, 2020 and 2019, respectively; 134,043,969 and 8,650,922 shares issued and outstanding as of December 31, 2020 and 2019, respectively


132


8


Additional paid-in-capital


2,004,841


Accumulated deficit


(777,871

)


(573,860

)

Total stockholders’ equity (deficit)


1,227,102


(573,852

)

Total liabilities, redeemable convertible preferred stock and stockholders’ equity (deficit)


$

1,724,056


$

563,387


As of
December 31,


2023


2022


ASSETS


Current Assets:


Cash and cash equivalents


$

135,585


$

398,915


Restricted cash (including restricted cash of consolidated VIEs of $49.1 million and $24.7 million, respectively)


73,234


73,095


Accounts receivable, net of allowance of $11.2 million and $21.5 million, respectively


9,139


13,967


Finance receivables at fair value (including finance receivables of consolidated VIEs of $11.8 million and $11.5 million, respectively)


12,501


12,939


Finance receivables held for sale, net (including finance receivables of consolidated VIEs of $457.2 million and $305.9 million, respectively)


503,546


321,626


Inventory


163,250


320,648


Beneficial interests in securitizations


4,485


20,592


Prepaid expenses and other current assets (including other current assets of consolidated VIEs of $25.2 million and $11.7 million, respectively)


50,899


58,327


Total current assets


952,639


1,220,109


Finance receivables at fair value (including finance receivables of consolidated VIEs of $329.6 million and $119.6 million, respectively)


336,169


140,235


Property and equipment, net


24,132


50,201


Intangible assets, net


131,892


158,910


Operating lease right-of-use assets


7,063


23,568


Other assets (including other assets of consolidated VIEs of $1.8 million and $0 million, respectively)


23,527


26,004


Total assets


$

1,475,422


$

1,619,027


LIABILITIES AND STOCKHOLDERS’ EQUITY


Current Liabilities:


Accounts payable


$

26,762


$

34,702


Accrued expenses (including accrued expenses of consolidated VIEs of $4.0 million and $1.5 million, respectively)


52,452


76,795


Vehicle floorplan


151,178


276,988


Warehouse credit facilities of consolidated VIEs


421,268


229,518


Current portion of long-term debt (including current portion of securitization debt of consolidated VIEs at fair value of $163.5 million and $47.2 million, respectively)


172,410


47,239


Deferred revenue


14,025


10,655


Operating lease liabilities, current


8,737


9,730


Other current liabilities


9,974


17,693


Total current liabilities


856,806


703,320


Long-term debt, net of current portion (including securitization debt of consolidated VIEs of $150.6 million and $32.6 million at fair value, respectively)


454,173


402,154


Operating lease liabilities, excluding current portion


25,183


20,129


Other long-term liabilities (including other long-term liabilities of consolidated VIEs of $10.4 million and $7.4 million, respectively)


17,109


18,183


Total liabilities


1,353,271


1,143,786


Commitments and contingencies (Note 14)


Stockholders’ equity:


Common stock, $0.001 par value; 500,000,000 shares authorized as of December 31, 2023 and 2022; 1,791,286 and 1,727,525 shares issued and outstanding as of December 31, 2023 and 2022, respectively


2


2


Additional paid-in-capital


2,088,381


2,075,931


Accumulated deficit


(1,966,232

)


(1,600,692

)

Total stockholders’ equity


122,151


475,241


Total liabilities and stockholders’ equity


$

1,475,422


$

1,619,027


See accompanyingnotes to these consolidated financial statements.

83

76


Table of Contents

VROOM, INC.

CONSOLIDATED STATEMENTS OF OPERATIONS

(in thousands, except share and per share amounts)


Year Ended
December 31,


2023


2022


Revenue:


Retail vehicle, net


$

565,972


$

1,425,842


Wholesale vehicle


104,119


293,528


Product, net


52,253


62,747


Finance


156,938


152,542


Other


13,921


14,242


Total revenue


893,203


1,948,901


Cost of sales:


Retail vehicle


553,565


1,382,005


Wholesale vehicle


138,472


304,148


Product


3,337


Finance


31,328


14,161


Other


4,554


3,800


Total cost of sales


731,256


1,704,114


Total gross profit


161,947


244,787


Selling, general and administrative expenses


340,657


566,387


Depreciation and amortization


42,769


38,290


Impairment charges


48,748


211,873


Loss from operations


(270,227

)


(571,763

)

Gain on debt extinguishment


(37,878

)


(164,684

)

Interest expense


45,445


40,693


Interest income


(21,158

)


(19,363

)

Other loss (income), net


108,289


43,181


Loss before provision (benefit) for income taxes


(364,925

)


(471,590

)

Provision (benefit) for income taxes


615


(19,680

)

Net loss


$

(365,540

)


$

(451,910

)

Net loss per share attributable to common stockholders, basic and diluted


$

(209.70

)


$

(262.15

)

Weighted-average number of shares outstanding used to compute net loss per share attributable to common stockholders, basic and diluted


1,743,128


1,723,843


Year Ended

December 31,


2020


2019


2018


Revenue:


Retail vehicle, net


$

1,072,551


$

952,910


$

656,928


Wholesale vehicle


245,580


213,464


174,514


Product, net


38,195


23,708


19,653


Other


1,374


1,739


4,334


Total revenue


1,357,700


1,191,821


855,429


Cost of sales


1,286,155


1,133,962


794,622


Total gross profit


71,545


57,859


60,807


Selling, general and administrative expenses


245,546


184,988


133,842


Depreciation and amortization


4,598


6,019


6,857


Loss from operations


(178,599

)


(133,148

)


(79,892

)

Interest expense


9,656


14,596


8,513


Interest income


(5,896

)


(5,607

)


(3,135

)

Revaluation of preferred stock warrant


20,470


769


174


Other income, net


(114

)


(96

)


(495

)

Loss before provision for income taxes


(202,715

)


(142,810

)


(84,949

)

Provision for income taxes


84


168


229


Net loss


$

(202,799

)


$

(142,978

)


$

(85,178

)

Accretion of redeemable convertible preferred stock


(132,750

)


(13,036

)

Net loss attributable to common stockholders


$

(202,799

)


$

(275,728

)


$

(98,214

)

Net loss per share attributable to common stockholders, basic and diluted


$

(2.76

)


$

(32.04

)


$

(11.50

)

Weighted-average number of shares outstanding used to compute net loss per share attributable to common stockholders, basic and diluted


73,345,569


8,605,962


8,540,778


See accompanying notes to these consolidated financial statements.

84

77


Table of Contents

VROOM, INC.

CONSOLIDATED STATEMENTS OF CHANGES IN REDEEMABLE CONVERTIBLE

PREFERRED STOCK AND STOCKHOLDERS’ EQUITY (DEFICIT)

(in thousands, except share amounts)


Redeemable Convertible

Preferred Stock


Common Stock


Additional

Paid-in


Accumulated


Total

Stockholders’


Shares


Amount


Shares


Amount


Capital


Deficit


Equity

(Deficit)


Balance at January 1, 2018


50,545,260


$

360,165


8,522,110


$

8


$


$

(201,507

)


$

(201,499

)

Cumulative effect of accounting change - revenue recognition


$


$


$


$

1,658


$

1,658


Stock-based compensation


1,158


1,158


Exercise of stock options


12,502


31


31


Vesting of restricted stock awards


36,774


Issuance of Series G redeemable convertible preferred stock, net of issuance costs


16,280,040


145,899


Accretion of redeemable convertible preferred stock


13,036


(1,189

)


(11,847

)


(13,036

)

Net loss


(85,178

)


(85,178

)

Balance at December 31, 2018


66,825,300


$

519,100


8,571,386


$

8


$


$

(296,874

)


$

(296,866

)

Stock-based compensation


$


$


$

2,756


$


$

2,756


Exercise of stock options


135,950


466


466


Vesting of restricted stock awards


623,832


1,344


1,344


Repurchase of common stock


(680,246

)


(4,566

)


(1,258

)


(5,824

)

Issuance of Series H redeemable convertible preferred stock, net of issuance costs


16,743,328


222,482


Accretion of redeemable convertible preferred stock


132,750


(132,750

)


(132,750

)

Net loss


(142,978

)


(142,978

)

Balance at December 31, 2019


83,568,628


$

874,332


8,650,922


$

8


$


$

(573,860

)


$

(573,852

)

Issuance of common stock


$


183,870


$


$

2,127


$


$

2,127


Issuance of Series H redeemable convertible preferred stock, net of issuance costs


1,964,766


26,714


Conversion of redeemable convertible preferred stock to common stock


(85,533,394

)


(901,046

)


85,533,394


86


900,960


901,046


Conversion of redeemable convertible preferred stock warrant to common stock warrant


21,873


21,873


Issuance of common stock in IPO, net of offering costs


24,437,500


24


496,486


496,510


Issuance of common stock in follow-on public offering,

net of offering costs


10,800,000


11


567,941


567,952


Repurchase of common stock


(200,000

)


(606

)


(1,212

)


(1,818

)

Vesting of restricted stock awards


3,249,346


2


3,381


3,383


Stock-based compensation


13,254


13,254


Exercise of stock options


598,406


1


2,340


2,341


Exercise of common stock warrants


636,112


Vesting of restricted stock units


237,334


Common stock shares withheld to satisfy employee tax withholding obligations


(82,915

)


(2,915

)


(2,915

)

Net loss


(202,799

)


(202,799

)

Balance at December 31, 2020


$


134,043,969


$

132


$

2,004,841


$

(777,871

)


$

1,227,102


Common Stock


Additional
Paid-in


Accumulated


Total
Stockholders’


Shares


Amount


Capital


Deficit


Equity


Balance at December 31, 2021


1,713,662


$

2


$

2,063,974


$

(1,148,782

)


$

915,194


Stock-based compensation


$


$

11,957


$


$

11,957


Vesting of restricted stock units


9,404


Restricted stock units in accordance with purchase agreement


4,459


Net loss


(451,910

)


(451,910

)

Balance at December 31, 2022


1,727,525


$

2


$

2,075,931


$

(1,600,692

)


$

475,241


Stock-based compensation


$


$

10,051


$


$

10,051


Vesting of restricted stock units


20,278


Issuance of common stock related to at-the-market offering, net of offering costs


43,483


2,399


2,399


Net loss


(365,540

)


(365,540

)

Balance at December 31, 2023


1,791,286


$

2


$

2,088,381


$

(1,966,232

)


$

122,151


See accompanyingnotes to these consolidated financial statements.

85

78


Table of Contents

VROOM, INC.

CONSOLIDATED STATEMENTS OF CASH FLOWS

(in thousands)


Year Ended
December 31,


2023


2022


Operating activities


Net loss


$

(365,540

)


$

(451,910

)

Adjustments to reconcile net loss to net cash used in operating activities:


Impairment charges


48,748


211,873


Gain on debt extinguishment


(37,878

)


(164,684

)

Depreciation and amortization


43,476


38,707


Amortization of debt issuance costs


4,598


4,809


Realized gains on securitization transactions


(45,589

)

Deferred taxes


(23,855

)

Losses on finance receivables and securitization debt, net


114,702


66,839


Stock-based compensation expense


10,051


11,957


Provision to record inventory at lower of cost or net realizable value


(2,360

)


1,812


Provision for bad debt


4,074


13,406


Provision to record finance receivables held for sale at lower of cost or fair value


20,566


6,541


Amortization of unearned discounts on finance receivables at fair value


(25,954

)


(14,593

)

Other, net


(17,393

)


(7,512

)

Changes in operating assets and liabilities:


Finance receivables, held for sale


Originations of finance receivables held for sale


(582,170

)


(625,575

)

Principal payments received on finance receivables held for sale


105,858


64,521


Proceeds from sale of finance receivables held for sale, net


509,612


Other


(1,606

)


(7,701

)

Accounts receivable


754


78,060


Inventory


159,758


403,924


Prepaid expenses and other current assets


22,711


4,146


Other assets


3,266


(2,546

)

Accounts payable


(7,940

)


(24,281

)

Accrued expenses


(24,766

)


(53,553

)

Deferred revenue


3,370


(65,148

)

Other liabilities


(10,009

)


(38,325

)

Net cash used in operating activities


(533,684

)


(109,065

)

Investing activities


Finance receivables at fair value


Purchases of finance receivables at fair value


(3,392

)


(56,484

)

Principal payments received on finance receivables at fair value


174,748


132,391


Proceeds from sale of finance receivables at fair value, net


43,262


Consolidation of VIEs


11,409


Principal payments received on beneficial interests


5,193


8,341


Purchase of property and equipment


(14,805

)


(24,234

)

Acquisition of business, net of cash acquired of $47.9 million


(267,488

)

Net cash provided by (used in) investing activities


173,153


(164,212

)

Financing activities


Proceeds from the issuance of common stock in at-the-market offering, net of offering costs


2,399


Proceeds from borrowings under secured financing agreements


261,991


Principal repayment under secured financing agreements


(208,476

)


(192,839

)

Proceeds from financing of beneficial interests in securitizations


24,506


Principal repayments of financing of beneficial interests in securitizations


(8,698

)


Proceeds from vehicle floorplan


559,331


1,403,042


Repayments of vehicle floorplan


(685,141

)


(1,638,855

)

Proceeds from warehouse credit facilities


480,100


520,800


Repayments of warehouse credit facilities


(290,483

)


(467,216

)

Repurchases of convertible senior notes


(36,536

)


(90,208

)

Other financing activities


(1,653

)


(4,212

)

Net cash provided by (used in) financing activities


97,340


(469,488

)

Net (decrease) increase in cash, cash equivalents and restricted cash


(263,191

)


(742,765

)

Cash, cash equivalents and restricted cash at the beginning of period


472,010


1,214,775


Cash, cash equivalents and restricted cash at the end of period


$

208,819


$

472,010


(Continued on following page)


Year Ended

December 31,


2020


2019


2018


Operating activities


Net loss


$

(202,799

)


$

(142,978

)


$

(85,178

)

Adjustments to reconcile net loss to net cash used in operating activities:


Depreciation and amortization


4,654


6,157


6,932


Amortization of debt issuance costs


938


357


279


Loss on extinguishment of debt


1,031


Stock-based compensation expense


13,254


2,756


1,158


Loss on disposal of property and equipment


46


789


3,198


Provision for inventory obsolescence


6,588


2,682


(1,069

)

Revaluation of preferred stock warrant


20,470


769


174


Other


2,329


789


Changes in operating assets and liabilities:


Accounts receivable


(32,068

)


(18,430

)


9,049


Inventory


(224,489

)


(92,877

)


11,902


Prepaid expenses and other current assets


(9,117

)


(3,935

)


(2,916

)

Other assets


(4,556

)


(3,487

)


(3,105

)

Accounts payable


14,066


4,035


(6,527

)

Accrued expenses


28,431


10,131


6,291


Deferred revenue


7,499


10,902


860


Other liabilities


19,500


5,673


(5,959

)

Net cash used in operating activities


(355,254

)


(215,636

)


(64,911

)

Investing activities


Purchase of property and equipment


(11,329

)


(3,528

)


(2,062

)

Proceeds from the sale of property and equipment


14,850


Net cash (used in) provided by investing activities


(11,329

)


(3,528

)


12,788


Financing activities


Repayments of long-term debt


(25,000

)


(5,506

)

Payments of debt extinguishment costs


(685

)


Proceeds from vehicle floorplan


1,242,736


992,179


648,309


Repayments of vehicle floorplan


(1,086,966

)


(914,200

)


(656,194

)

Payment of vehicle floorplan upfront commitment fees


(2,906

)


Proceeds from the issuance of redeemable convertible preferred stock, net


21,694


227,502


145,899


Repurchase of common stock


(1,818

)


(5,824

)


Common stock shares withheld to satisfy employee tax withholding obligations


(2,915

)


Proceeds from the issuance of common stock in connection with IPO, net of underwriting discount


504,024


Payments of costs related to IPO


(6,791

)


(723

)


Proceeds from the issuance of common stock in connection with follow-on public offering, net of underwriting discount


569,471


Payments of costs related to follow-on public offering


(1,519

)


Proceeds from exercise of stock options


2,341


1,810


31


Other financing activities


(316

)


183


(164

)

Net cash provided by financing activities


1,237,035


275,242


132,375


Net increase in cash, cash equivalents and restricted cash


870,452


56,078


80,252


Cash, cash equivalents and restricted cash at the beginning of period


219,587


163,509


83,257


Cash, cash equivalents and restricted cash at the end of period


$

1,090,039


$

219,587


$

163,509


8679


Table of Contents

Supplemental disclosure of cash flow information:


Cash paid for interest


$

8,540


$

12,607


$

7,743


Cash paid for income taxes


$

163


$

157


$

212


Supplemental disclosure of non-cash investing and financing activities:


Accretion of redeemable convertible preferred stock


$


$

132,750


$

13,036


Series H preferred stock issuance costs included in accrued expenses


$


$

5,020


$


Costs related to IPO included in accrued expenses and accounts payable


$


$

1,703


$


Conversion of redeemable convertible preferred stock warrant to common stock warrant


$

21,873


$


$


Issuance of common stock as upfront payment to nonemployee


$

2,127


$


$


Accrued property and equipment expenditures


$

97


$

200


$


VROOM, INC.

CONSOLIDATED STATEMENTS OF CASH FLOWS (continued)

(in thousands)

Supplemental disclosure of cash flow information:


Cash paid for interest


$

59,351


$

34,907


Cash paid for income taxes


$

5,363


$

2,409


Supplemental disclosure of non-cash investing and financing activities:


Finance receivables from consolidation of 2022-2 securitization transaction


$

180,706


$


Elimination of beneficial interest from the consolidation of 2022-2 securitization transaction


$

9,811


$


Securitization debt from consolidation of 2022-2 securitization transaction


$

186,386


$


Reclassification of finance receivables held for sale to finance receivables at fair value, net


$

248,081


$


Fair value of beneficial interests received in securitization transactions


$


$

30,082


See accompanyingnotes to these consolidated financial statements.

80

87


Table of Contents

VROOM, INC.

NOTES TO CONSOLIDATED FINANCIAL STATEMENTS

1. Description of Business and Basis of Presentation

Description of Business and Organization

Vroom, Inc., and its wholly owned subsidiaries (collectively, “the Company”the "Company”) is, was an innovative, end-to-end ecommerce platform that is transforming the used vehicle industry by offering a better way to buy and a better way to sell used vehicles.

In December 2015, the Company acquired Houston-based Left Gate Property Holding, LLC (d/b/a Texas Direct Auto and Vroom). The acquisition included the Company's proprietary vehicle reconditioning center, the Texas Direct Auto ("TDA") dealership, and Sell Us Your Car® centers. Left Gate Property Holding, LLC was renamed Vroom Automotive, LLC in March 2021, and iswas the primary operating entity for the Company's purchases and sales of used vehicles. In January 2021, the Company acquired Vast Holdings, Inc. (d/b/a CarStory). On February 1, 2022 (the "Acquisition Date"), the Company completed the acquisition of Unitas Holdings Corp. (now known as Vroom Finance Corporation), including its wholly owned subsidiaries United PanAm Financial Corp. (now known as Vroom Automotive Financial Corporation) and United Auto Credit Corporation ("UACC").

The

Starting in 2022, the Company currently iswas organized into three reportable segments: Ecommerce, Wholesale and TDA.Retail Financing. The Ecommerce reportable segment representsrepresented retail sales of used vehicles through the Company’s ecommerce platform, and feesrevenue earned on vehicle financing originated by UACC or the Company's third-party financing sources and sales of value-added products associated with those vehicles sales. The Wholesale reportable segment representsrepresented sales of used vehicles through wholesale channels. The TDARetail Financing reportable segment represents retailrepresented UACC’s operations with its network of third-party dealership customers, which primarily consists of the purchases and servicing of vehicle installment contracts, but excludes financing of vehicle sales to Vroom customers. As a result of used vehicles from TDAthe Value Maximization Plan and fees earned on salesthe wind-down of value-added products associated with those vehicles sales.the ecommerce operations, as described below, the Company will discontinue reporting its results through the Ecommerce and Wholesale segments starting in the first quarter of 2024.

The Company was incorporated in Delaware on January 31, 2012 under the name BCM Partners III, Corp. On June 25, 2013, the Company changed its name to Auto America, Inc. and on July 9, 2015, the Company changed its name to Vroom, Inc.

Stock Split

In connectionValue Maximization Plan

On January 19, 2024, the Board of Directors of Vroom approved a value maximization plan, pursuant to which the Company discontinued its ecommerce operations and is winding down its used vehicle dealership business in order to preserve liquidity and enable the Company to maximize stakeholder value through its remaining businesses (the “Value Maximization Plan”). The Company has suspended transactions through vroom.com, completed transactions for customers who had previously contracted to purchase or sell a vehicle, halted purchases of additional vehicles, sold all of its used vehicle inventory through wholesale channels and paid off its floorplan financing facility. The Company continues to take other actions to maximize the value of its remaining ecommerce assets, reduce its outstanding commitments and preserve its liquidity, and has been executing a reduction-in-force commensurate with its reduced operations. The Company expects the closingecommerce wind down to be substantially complete by the end of the Company’s initial public offering (“IPO”)first quarter of 2024, but may incur additional wind-down costs through the end of 2024.

The Company also owns and operates UACC, an automotive finance company, and CarStory, an artificial intelligence-powered analytics and digital services platform for automotive retail. The UACC and CarStory businesses will continue to serve their third-party customers, with their operations unaffected by Vroom’s ecommerce wind-down.

As a result of the Value Maximization Plan, the Company estimates that it will incur total cash charges of approximately $16.5 million for severance and other personnel-related costs and approximately $15.0 million in other contract and lease termination costs. As part of a planned reduction-in-force under the Value Maximization Plan, the Company anticipates that approximately 800 employees will be impacted upon substantial completion of the wind-down, resulting in a reduction of approximately 93% of the employees not engaged in UACC’s or CarStory’s ongoing operations.

The Company determined a triggering event existed as of December 31, 2023, resulting in long–lived asset impairment charges of $47.4 million. The impairment charges consist of $23.9 related to "Property and equipment, net",

81


Table of Contents

VROOM, INC.

NOTES TO CONSOLIDATED FINANCIAL STATEMENTS

$22.2 million related to "Operating lease right-of-use assets", and $1.3 million related to "Other assets" on June 11, 2020,the Company's consolidated balance sheets. Refer to Note 7 — Property and Equipment, Net and Note 12 — Leases for further details.

Reverse Stock Split

On February 13, 2024, the Company effected a 2-for-1 forward1-for-80 reverse stock split of the Company’s common stock, which became effective immediately prior to the consummation of the IPO.stock. All shares of the Company’s common stock, stock-based instruments and per-share data included in these consolidated financial statements have been retroactively adjusted as though the stock split has been effected prior to all periods presented.

Initial Public Offering

The Company closed its IPO on June 11, 2020 in which it sold 24,437,500 shares of common stock at the public offering price of $22.00 per share, including 3,187,500 shares sold pursuant to exercise by the underwriters of their option to purchase additional shares. The Company received proceeds of $504.0 million from the IPO, net of the underwriting discount and before deducting offering expenses of $7.5 million. In addition, in accordance with their terms and consistent with the conversion rates discussed in Note 11 - Redeemable Convertible Preferred Stock and Stockholders’ Equity (Deficit), all shares of the Company’s outstanding redeemable convertible preferred stock were automatically converted into common stock upon the closing of the IPO.

Follow-on Public Offering

The Company closed its follow-on public offering on September 15, 2020 in which it sold 10,800,000 shares of common stock at the public offering price of $54.50 per share. The Company received proceeds of $569.5 million from the offering, net of the underwriting discount and before deducting offering expenses of $1.5 million.

Basis of Presentation

The consolidated financial statements of the Company have been prepared in accordance with U.S. generally accepted accounting principles (“U.S. GAAP”). Certain prior year amounts have been reclassified to conform to the current year presentation.

88


Table of Contents

VROOM, INC.

NOTES TO CONSOLIDATED FINANCIAL STATEMENTS

Principles of Consolidation

The accompanying consolidated financial statements include the accounts of the Company and its wholly owned subsidiaries. All intercompany accounts and transactions have been eliminated in consolidation.

2. Summary of Significant Accounting Policies

Use of Estimates

The preparation of consolidated financial statements in accordance with U.S. GAAP requires management to make estimates, assumptions and judgments that affect the reported amounts of assets, liabilities, revenue, and expenses and related disclosures. On an ongoing basis, the Company evaluates its estimates, including, among others, those related to income taxes, the realizability of inventory, stock-based compensation, contingencies, revenue-related reserves, fair value measurements goodwill, and useful lives of property and equipment and intangible assets. The Company bases its estimates on historical experience, market conditions, and on various other assumptions that are believed to be reasonable. Actual results may differ from these estimates.

Beginning in the first quarter of 2020, the COVID-19 pandemic negatively impacted, and may continue to negatively impact, the macroeconomic environment in the United States and globally, as well as the Company’s business, financial condition and results of operations. Due to the evolving and uncertain nature of COVID-19, it is reasonably possible that it could materially impact the Company’s estimates, particularly those noted above that require consideration of forecasted financial information, in the near to medium term. The ultimate impact will depend on numerous evolving factors that the Company may not be able to accurately predict, including the duration and extent of the pandemic, the impact of federal, state, local and foreign governmental actions, consumer behavior in response to the pandemic and other economic and operational conditions the Company may face.

Comprehensive Loss

The Company did notnot have any other comprehensive income or loss for the years ended December 31, 2020, 2019,2023, and 2018.2022. Accordingly, net loss and comprehensive loss are the same for the periods presented.

Revenue Recognition

Revenue consists of retail used vehicle sales, wholesale used vehicle sales, financing vehicle sales through UACC, fees earned on sales of third-party financing and value-added products to customers in connection with vehicles sales, and other revenues. Refer to Note 3 – Revenue Recognition for a discussion of the Company’s significant accounting policies related to revenue recognition.

Cost of sales

Cost of sales primarily includes the cost to acquire used vehicles, inbound transportation costs and direct and indirect reconditioning costs associated with preparing vehicles for resale. Reconditioning costs include parts, labor and third-party reconditioning costs directly attributable to the vehicle and allocated overhead costs. Cost of sales also includes any necessary adjustments to reflect vehicle inventory at the lower of cost or net realizable value. As a result of the UACC acquisition, cost of sales also includes interest expense incurred on securitization debt related to finance receivables originated by UACC for Vroom customers as well as interest expense incurred on securitization debt originated by UACC for its network of third-party dealership customers and collection expenses related to servicing finance receivables.

82


Table of Contents

VROOM, INC.

NOTES TO CONSOLIDATED FINANCIAL STATEMENTS

Cash and Cash Equivalents

Cash and cash equivalents include cash deposits at financial institutions and highly liquid investments with original maturities of three months or less. Outstanding checks that are in excess of the cash balances at certain financial institutions are included in “Accounts payable” in the consolidated balance sheets and changes in these amounts are reflected in operating cash flows in the consolidated statements of cash flows.

Restricted Cash

Restricted cash primarily includes cash deposits required under letter of credit agreements as explained in Note 9 – Commitments and Contingencies. As of December 31, 2020, restricted cash also includes a $31.6 million cash deposit required under the Company’s 20202022 Vehicle Floorplan Facility as explained in Note 810 – Vehicle Floorplan Facilities.

89


TableFacility and UACC restricted cash. UACC collects and services receivables under the securitization transactions and warehouse credit facilities. These collections are restricted for use until properly remitted each month under the terms of Contentsthe servicing agreement. Refer to Note 11 — Warehouse Credit Facilities of Consolidated VIEs and Note 13 — Long Term Debt for further detail.

VROOM, INC.

NOTES TO CONSOLIDATED FINANCIAL STATEMENTS

Accounts Receivable, Net

Accounts receivable, net of an allowance for doubtful accounts, includes amounts due from customers and from third-party financial institutions related to vehicle purchases. The allowance for doubtful accounts is estimated based upon historical experience, age of the balances, current economic conditions and other factors and is evaluated as of each reporting date. Increases and decreases in the allowance for doubtful accounts are recorded in “Selling, general and administrative expenses” in the consolidated statements of operations. The allowance for doubtful accounts was $11.2 million, $21.5 million and $8.5 million as of December 31, 2023, 2022, and 2021, respectively. For the year ended December 31, 2023, the provision for bad debt was $4.1 million and write-offs were $14.4 million. For the year ended December 31, 2022, the provision for bad debt was $13.4 million and write-offs were immaterial.

Finance Receivables

Inventory

Finance receivables consist of installment contracts the Company originates through UACC to finance the vehicles it sells, as well as installment contracts acquired by UACC from its existing network of third-party dealership customers.

The Company's finance receivables are generally secured by the vehicles being financed.

Finance receivables over 90 days delinquent are considered nonaccrual finance receivables. Interest income is subsequently recognized only to the extent cash payments are received. Finance receivables may be restored to accrual status when a customer settles all delinquency balances and future interest and principal payments are reasonably assured.

Finance Receivables Held for Sale, Net

Finance receivables that the Company intends to sell and not hold to maturity are classified as held for sale. The Company intends to sell finance receivables through securitization transactions. Finance receivables classified as held for sale are recorded at the lower of cost or fair value. Deferred acquisition costs and any discounts or premiums are deferred until the finance receivables are sold and are then recognized as part of the total gain or loss on sale and recorded in “Finance Revenue” and "Product, net" in the consolidated statements of operations. Refer to Note 3 – Revenue Recognition.

The Company records a valuation allowance to report finance receivables at the lower of amortized cost basis or fair value. To determine the valuation allowance, finance receivables are evaluated collectively as they represent a large group of smaller-balance homogeneous loans. To the extent that actual experience differs from estimates, significant adjustments to the Company's valuation allowance may be needed. Fair value adjustments are recorded in "Other loss (income), net" in the consolidated statements of operations. Principal balances of finance receivables are charged-off when the Company is unable to sell the finance receivable and the related vehicle has been repossessed and liquidated or the receivable has otherwise been deemed uncollectible. As of December 31, 2023 and 2022, the valuation allowance

83


Table of Contents

VROOM, INC.

NOTES TO CONSOLIDATED FINANCIAL STATEMENTS

for finance receivables classified as held for sale was $33.8 million and $10.5 million, respectively. Refer to Note 17 – Financial Instruments and Fair Value Measurements.


Finance Receivables at Fair Value

Finance receivables at fair value represent finance receivables that the Company does not intend to sell in the immediate future and for which the fair value option was elected. Fair value adjustments are recorded in "Other loss (income), net" in the consolidated statements of operations. Refer to Note 17 – Financial Instruments and Fair Value Measurements.

Consolidated CFEs

The Company elected the fair value option upon consolidation of the assets and liabilities of its variable interest entities ("VIEs") related to the 2021-1, 2022-2 and 2023-1 securitization transactions. Refer to Note 4 – Variable Interest Entities and Securitizations. These VIEs are consolidated collateralized financing entities (CFEs) and are accounted for using the measurement alternative in accordance with ASU 2014-13, Measuring the Financial Assets and Liabilities of a Consolidated Collateralized Financing Entity (“ASU 2014-13"). During the years ended December 31, 2023 and 2022, the Company recognized the following revenue and expenses associated with these CFEs in the consolidated statements of operations:


Year Ended
December 31,


2023


2022


Finance revenue


$

82,442


$

40,869


Product revenue


$

11,966


$


Finance cost of sales


$

(18,840

)


$

(3,377

)

Product cost of sales


$

(3,338

)


$


Other loss, net


$

(66,968

)


$

(20,987

)

The assets and liabilities of the CFEs are presented as part of the current and noncurrent “Finance receivables at fair value”, “Current portion of long term debt”, and "Long term debt, net of current portion", respectively, on the consolidated balance sheets. Refer to Note 4 – Variable Interest Entities and Securitizations and Note 17 – Financial Instruments and Fair Value Measurements for further details.

Inventory

Inventory consists primarily of used vehicles and parts and accessories and is stated at the lower of cost or net realizable value. Inventory cost is determined by specific identification and includes acquisition cost, direct and indirect reconditioning costs and inbound transportation expenses. Net realizable value represents the estimated selling price less costs to complete, dispose and transport the vehicles. The Company recognizes any necessary adjustments to reflect inventory at the lower of cost or net realizable value through adjustments to “Cost“Retail vehicle cost of sales” in the consolidated statements of operations.

Property and Equipment, Net

Property and equipment are recorded at cost less accumulated depreciation and amortization. Charges for repairs and maintenance that do not improve or extend the life of the respective assets are expensed as incurred. When assets are retired or otherwise disposed of, their costs and related accumulated depreciation are written off and any resulting gains or losses are recorded during the period.

84


Table of Contents

VROOM, INC.

NOTES TO CONSOLIDATED FINANCIAL STATEMENTS

Depreciation and amortization are calculated using the straight-line method over the following estimated useful lives of the assets:

Equipment

3 to 15 years

Furniture and fixtures

3 to 15 years

Company VehiclesLogistics fleet

5 to 7 years

Leasehold improvements

Lesser of useful life or lease term

Internal-use software

31 to 510 years

The Company capitalizes direct costs of materials and services utilized in developing or obtaining internal-use software. The Company also capitalizes payroll and payroll-related costs for employees who are directly associated with and who devote time to the development of software products for internal use, to the extent of the time spent directly on the project. Capitalization of costs begins during the application development stage and ends when the software is available for general use. Costs incurred during the preliminary project and post-implementation stages are charged to expense as incurred.

Goodwill

Additionally, the Company capitalizes implementation costs incurred in a cloud computing arrangement that is a service contract. The capitalized implementation costs related to a cloud computing arrangement are amortized over the term of the arrangement. Capitalized implementation costs are included in “Other assets” in the consolidated balance sheet and are amortized over the terms of the arrangements, which range between 1 and 10 years.

The Company regularly reviews long-lived assets for impairment when events or changes in circumstances indicate the carrying amount of an asset group may not be recoverable. The Company compares the sum of estimated undiscounted future cash flows expected to result from the use of the asset group to the carrying value of the asset group. When the carrying value of the asset group exceeds its estimated undiscounted future cash flows, the Company recognizes an impairment charge for the amount by which the carrying value of the asset group exceeds the fair value of the asset group. Refer to Note 7 — Property and Equipment, Net for further details on impairment tests performed.

Goodwill and Intangible Assets

Goodwill represents the excess of the consideration transferred over the fair value of the identifiable assets acquired and liabilities assumed in business combinations. Goodwill is tested for impairment annually as of October 1 or whenever events or changes in circumstances indicate that an impairment may exist.

The Company has three reporting units: Ecommerce, Wholesale and TDA.Retail Financing. In performing its annual goodwill impairment test, the Company first reviews qualitative factors to determine whether it is more likely than not that the fair value of a reporting unit is less than its carrying amount. If, after assessing qualitative factors, the Company determines that it is not more likely than not that the fair value of a reporting unit is lessmore than its carrying amount, then performing the quantitative test is unnecessary and the Company’s goodwill is not considered to be impaired. However, if based on the qualitative assessment the Company concludes that it is more likely than not that the fair value of the reporting unit is less than its carrying amount, or if the Company elects to bypass the optional qualitative assessment as provided for under U.S. GAAP, the Company proceeds with performing the quantitative impairment test. Refer to Note 8 — Goodwill and Intangible Assets for further details on the impairment tests performed.

No goodwill impairment was determined to exist for

The Company's intangible assets are amortized on a straight-line basis over the years ended December 31, 2020, 2019, and 2018.following estimated weighted average useful lives:

90

Developed technology

7 years

Trademarks

9 years

Customer relationships

8 years

The Company periodically reassesses the useful lives of its definite-lived intangible assets when events or circumstances indicate that useful lives have significantly changed from the previous estimate.

85


Table of Contents

VROOM, INC.

NOTES TO CONSOLIDATED FINANCIAL STATEMENTS

Leases

In connection with its annual goodwill impairment test as of October 1, 2020,

The Company determines if an arrangement is a lease at inception by evaluating if the asset is explicitly or implicitly identified or distinct, if the Company performed qualitative impairment assessments for each of its reporting units. The resultswill receive substantially all of the qualitative assessments indicated that it waseconomic benefit or if the lessor has an economic benefit and the ability to substitute the asset. Right-of-use ("ROU") assets represent the Company's right to use an underlying asset for the lease term and lease liabilities represent the Company's obligation to make lease payments arising from the lease. The Company assesses whether the lease is an operating or finance lease at its inception. Operating lease liabilities are recognized at commencement date based on the present value of the lease payments over the lease term. As the rate implicit in the lease is generally not more likely thanreadily determinable for the Company’s operating leases, the discount rates used to determine the present value of the Company’s lease liabilities are based on the Company’s incremental borrowing rate at the lease commencement date and commensurate with the remaining lease term. The incremental borrowing rate for a lease is the rate of interest the Company would have to pay to borrow on a collateralized basis over a similar term for an amount equal to the lease payments in a similar economic environment. The Company uses its incremental borrowing rate based on the information available at commencement date in determining the present value of lease payments. The operating lease ROU asset is the initial lease liability adjusted for any prepayments, initial indirect costs incurred by the Company, and lease incentives. The Company's operating leases are included in "Operating lease right-of-use assets," "Operating lease liabilities, current," and "Operating lease liabilities, excluding current portion" on the consolidated balance sheets. The Company does not thathave any material leases, individually or in the aggregate, classified as a finance leasing arrangement. Additionally, leases with an initial term of 12 months or less are not recorded on the Company’s consolidated balance sheet and expenses for these leases are recognized on a straight-line basis over the lease term.

The Company regularly reviews long-lived assets for impairment when events or changes in circumstances indicate the carrying amount of an asset group may not be recoverable. The Company compares the sum of estimated undiscounted future cash flows expected to result from the use of the asset group to the carrying value of the asset group. When the carrying value of the asset group exceeds its estimated undiscounted future cash flows, the Company recognizes an impairment charge for the amount by which the carrying value of the asset group exceeds the fair value of the reporting units were less than the carrying values.

Deferred Offering Costs

Deferred offering costs, including legal, accounting and other fees and costs relatingasset group. Refer to the Company’s IPO and Follow-on Public Offering, are capitalized and included within “Other assets” in the consolidated balance sheets. The deferred offering costs were offset against the IPO proceeds within equity upon the closing of the IPO and Follow-on Public Offering. As of December 31, 2020 and 2019, there were $0.0 million and $2.4 million, respectively, of capitalized deferred offering costs included within “Other assets.”Note 12 — Leases for further details on impairment tests performed.

Vehicle Floorplan

The vehicle floorplan payable (the “Vehicle Floorplan Facility”) reflects amounts borrowed to finance the purchase of specific vehicle inventories. Portions of the Vehicle Floorplan Facility are settled on a daily basis depending on the Company’s sales and purchasing activity. The Vehicle Floorplan Facility is collateralized by vehicle inventories and certain other assets of the Company. Borrowings and repayments are presented separately and classified as financing activities within the consolidated statements of cash flows.

Income Taxes

The Company accounts for income taxes under the asset and liability method. The Company recognizes deferred tax assets and liabilities for the future tax consequences attributable to differences between the financial statement carrying amounts of existing assets and liabilities and their respective tax basis, as well as for operating loss and tax credit carry forwards. The Company measures deferred tax assets and liabilities using enacted tax rates expected to apply to taxable income in the years in which the Company expects to recover or settle those temporary differences. The Company recognizes the effect of a change in tax rates on deferred tax assets and liabilities in the results of operations in the period that includes the enactment date. The Company reduces the measurement of a deferred tax asset, if necessary, by a valuation allowance if it is “more-likely-than-not”more likely than not that the Company will not realize some or all of the deferred tax asset. The Company accounts for uncertain tax positions by recognizing the financial statement effects of a tax position only when, based upon technical merits, it is “moremore likely than not”not that the position will be sustained upon examination. Potential interest and penalties associated with unrecognized tax positions are recognized in income tax expense.

Stock-Based Compensation

The Company recognizes the cost of employee services received in exchange for stock awards based on the fair value of those awards at the date of grant over the requisite service period. The Company accounts for forfeitures as they

86


Table of Contents

VROOM, INC.

NOTES TO CONSOLIDATED FINANCIAL STATEMENTS

occur. For awards earned based on performance or upon occurrence of a contingent event, if the award is deemed probable of being earned, related compensation expense is recorded over the estimated service period. If an award is not considered probable of being earned, no amount of stock-based compensation is recognized. To the extent the estimate of awards considered probable of being earned changes, the amount of stock-based compensation recognized will also change.

The Company uses the Black-Scholes-Merton (“Black-Scholes”) option pricing model to determine the fair value of its stock-based awards.stock options. Estimating the fair value of stock-based awardsstock options requires the input of subjective assumptions, including the estimated fair value of the Company’s common stock, the expected life of the options, stock price volatility, which is determined based on the historical volatilities of several publicly listed peer companies as the Company has only a short trading history for its common stock, the risk-free interest rate and expected dividends. The assumptions used in the Company’s Black-Scholes option-pricing model represent management’s best estimates and involve a number of variables, uncertainties and assumptions and the application of management’s judgment, as they are inherently subjective.

Business Combinations

Advertising

The Company uses its best estimates and assumptions to assign fair value to the tangible and intangible assets acquired and liabilities assumed at the acquisition date. The Company’s estimates are inherently uncertain and subject to refinement. During the measurement period, which may be up to one year from the acquisition date, the Company may record adjustments to the fair value of these tangible and intangible assets acquired and liabilities assumed, with the corresponding offset to goodwill. The Company will continue to collect information and reevaluate these estimates and assumptions quarterly and record any adjustments to the Company’s preliminary estimates to goodwill provided that the Company is within the measurement period. Upon the conclusion of the measurement period or final determination of the fair value of assets acquired or liabilities assumed, whichever comes first, any subsequent adjustments will be recorded to the Company’s consolidated statement of operations.

Advertising

Advertising costs are expensed as incurred and are included within “Selling, general and administrative expenses” in the consolidated statements of operations. Advertising expenses were $62.4 million, $49.9$48.4 million and $25.6$79.7 million for the years ended December 31, 2020, 2019,2023 and 2018,2022, respectively.

Shipping and Handling

The Company’s logistics costs related to transporting its used vehicle inventory primarily include third-party transportation fees. The portion of these

Logistics costs related to inbound transportation from the point of acquisition to the relevant reconditioning facility isare included in cost of sales when the related used vehicle is sold. Logistics costs not included in cost of sales are accounted for as costs to fulfilfulfill contracts with customers and are included in “Selling, general

91


Table of Contents

VROOM, INC.

NOTES TO CONSOLIDATED FINANCIAL STATEMENTS

and administrative expenses” in the consolidated statements of operations and were $30.3 million, $14.0$8.5 million and $6.4$39.0 million for the years ended December 31, 2020, 2019,2023 and 2018,2022, respectively.

Concentration of Credit Risk and Significant Customers

The Company’s principal financial instruments subject to potential concentration of credit risk are cash and cash equivalents and accounts receivable, which are unsecured. The Company’s cash balances are maintained at various large, reputable financial institutions. Deposits held with financial institutions may at times exceed the amount of insurance provided on such deposits. Generally, these deposits may be redeemed upon demand and, therefore, management believes they bear minimal risk. The Company’s cash equivalents primarily consist of money market funds that hold investments in highly liquid US treasuryU.S. government securities. Concentration of credit risk with respect to accounts receivable is generally mitigated by a large customer base.

For the years ended December 31, 2020, 2019,2023 and 2018,2022, no customer represented 10% or more of the Company’s revenues and no customer represented more than 10% of the Company’s accounts receivable as of December 31, 20202023 and 2019.2022.

Liquidity

87


Table of Contents

VROOM, INC.

NOTES TO CONSOLIDATED FINANCIAL STATEMENTS

Liquidity

As of December 31, 2023, the Company had cash and cash equivalents of $135.6 million and restricted cash of $73.2 million. Restricted cash primarily includes restricted cash required under UACC's securitization transactions and Warehouse Credit Facilities of $49.1 million and cash deposits required under our 2022 Vehicle Floorplan Facility of $22.7 million. The Company has historically had negative cash flows and generated losses from operations since inception which itand the Company’s primary source of liquidity has funded primarilybeen cash generated through issuancesfinancing activities. As of commonFebruary 29, 2024 the Company had cash and preferred stock. Thecash equivalents of approximately $94.0 million.

In January 2024, the Company has historically fundedannounced its Value Maximization Plan to discontinue its ecommerce operations and wind-down its used vehicle dealership business, refer to Note 1 — Description of Business and Basis of Presentation — Value Maximization Plan. On January 19, 2024, the Company amended its agreement with Ally Bank and Ally Financial Inc. (together, “Ally”) dated November 4, 2022. As a result of the amendment, the floorplan was suspended for future vehicle purchases and the Company was required to maintain 40% of our outstanding borrowings in cash. In addition, all other financial covenants were eliminated. As a result of the liquidation of the Company's vehicle inventory, purchases through a vehicle floorplan facility. As further discussed in Note 8 – Vehicle Floorplan Facilities, the Company entered into a new facility in March 2020 which increasedrepaid all amounts outstanding under the borrowing capacity up to $450.0 million. In October 2020, the2022 Vehicle Floorplan Facility in the first quarter of 2024 and the agreement was amendedterminated.

In addition to extend the maturityCompany's ongoing cash requirements, the Company's liquidity will also be used to fund the announced wind-down of its ecommerce operations which is expected to result in the payment of $16.5 million in severance related benefits and $15.0 million in early contract and lease termination costs.

UACC has four warehouse credit facilities with an aggregate borrowing limit of $825.0 million as of December 31, 2023. As of December 31, 2023, outstanding borrowings related to the Warehouse Credit Facilities were $421.3 million and excess borrowing capacity was $56.9 million. As of December 31, 2023, the Company was in compliance with all covenants related to the Warehouse Credit Facilities.

Failure to satisfy these and or any other requirements contained within the agreements would restrict access to the Warehouse Credit Facilities and could have a material adverse effect on the financial condition of the Company, results of operations and liquidity. Certain breaches of covenants may also result in acceleration of the repayment of borrowings prior to the scheduled maturity. Refer to Note 11 – Warehouse Credit Facilities of Consolidated VIEs for further discussion.

The Company expects to use cash and cash equivalents to finance future capital requirements and UACC’s Warehouse Credit Facilities to fund finance receivables. Certain advance rates available to UACC on borrowings from the Warehouse Credit Facilities have decreased as a result of the increasing credit losses in UACC’s portfolio and overall rising interest rates. Any future decreases on available advance rates may have an adverse impact on our liquidity.

The Company’s future capital requirements will depend on many factors, including the ability to successfully implement the Value Maximization Plan and realize its benefits, available advance rates on the Warehouse Credit Facilities, our ability to complete additional securitization transactions at terms favorable to us, and our future credit losses.

The Company anticipates that existing cash and cash equivalents and UACC's Warehouse Credit Facilities will be sufficient to support the Company’s ongoing operations and obligations, inclusive of the wind-down of the ecommerce operations, for at least the next twelve months from the date to September 2022.of issuance of the consolidated financial statements.

Net Loss Per Share Attributable to Common Stockholders

Basic and diluted net loss per share attributable to common stockholders is presented in conformity with the two-class method required for participating securities. Under the two-class method, net loss is attributed to common stockholders and participating securities based on their participation rights. The Company considers all series of its redeemable convertible preferred stock to be participating securities. Under the two-class method, the net loss attributable to common stockholders is not allocated to the redeemable convertible preferred stock as the holders of the Company’s redeemable convertible preferred stock do not have a contractual obligation to share in the Company’s losses. Under the two-class method, basic net loss per share attributable to common stockholders is computed by dividing the net loss attributable to common stockholders by the weighted-average number of shares of common stock outstanding during the period. For periods in which the

88


Table of Contents

VROOM, INC.

NOTES TO CONSOLIDATED FINANCIAL STATEMENTS

Company reports net losses, diluted net loss per common share attributable to common stockholders is the same as basic net loss per common share attributable to common stockholders because potentially dilutive common shares are not assumed to have been issued if their effect is anti-dilutive.

The accretion of the Company’s redeemable convertible preferred stock (refer to Note 11) for the years ended December 31, 2019 and 2018 has been presented as an increase to net loss to determine net loss attributable to common stockholders.

Nonemployee Share-Based Payments

On May 15, 2020, the Company entered into an agreement with Rocket Auto LLC and certain of its affiliates (collectively, “Rocket”) providing for the launch of an ecommerce platform under the “Rocket Auto” brand for the marketing and sale of vehicles directly to consumers (the “RA Agreement”). The Company will list its used vehicle inventory for sale on the Rocket Auto platform, but all sales of the Company’s inventory will be conducted through the Company’s platform. Rocket Auto is expected to launch publicly during 2021 and, during the term of the RA Agreement, Rocket has agreed to ensure that not less than a minimum percentage of all used vehicles sold or leased through the platform on a monthly basis will be Vroom inventory. The Company issued Rocket 183,870 shares of the Company’s common stock upon execution of the RA Agreement. The Company will pay Rocket a combination of cash and stock for vehicle sales made through the platform. Rocket may earn up to 8,641,914 shares of common stock over a four-year period based upon sales volume of Vroom inventory through the Rocket Auto platform.

The Company accounts for the issuance of its common stock under the RA agreement in accordance with ASC 718, Compensation – Stock Compensation, including the provisions that apply to share-based payments issued to nonemployees for goods or services. The Company determined that the grant date was May 15, 2020 for both the upfront

92


Table of Contents

VROOM, INC.

NOTES TO CONSOLIDATED FINANCIAL STATEMENTS

shares issued and the additional shares that potentially are to be issued based on sales volume through the Rocket Auto platform. The fair value of the Company’s common stock on the grant date was determined to be $11.57 per share. The grant date fair value of the upfront shares issued was initially recognized as an asset within “Other assets” in the consolidated balance sheet, which will subsequently be amortized within “Selling, general and administrative expenses” over the term of the RA agreement commencing on the launch date. The grant date fair value of the potential shares to be issued will be recognized within “Selling, general and administrative expenses” as sales of Vroom’s inventory associated with the Rocket Auto platform occur and such shares are earned.

Accounting Standards Adopted

In May 2014, the Financial Accounting Standards Board (“FASB”) issued ASU 2014-09, Revenue from Contracts with Customers (“Topic 606”), which amends the guidance on revenue recognition. Under the new standard, revenue is recognized upon transfer of control of promised goods or services to customers in an amount that reflects the consideration the entity expects to receive in exchange for those goods and services. The principles in the standard are applied using a five-step model that includes 1) identifying the contract(s) with a customer, 2) identifying the performance obligations in the contract, 3) determining the transaction price, 4) allocating the transaction price to the performance obligations in the contract, and 5) recognizing revenue when (or as) the performance obligations are satisfied. The standard also requires disclosure of the nature, amount, timing, and uncertainty of revenue and cash flows arising from contracts with customers. The FASB also subsequently issued several amendments to the standard to clarify the guidance.

The Company adopted Topic 606 as of January 1, 2018 utilizing the modified retrospective approach applied only to contracts not completed as of the date of adoption. The Company recognized a net decrease to accumulated deficit of $1.7 million as January 1, 2018 due to the cumulative effect of adopting Topic 606.

The cumulative effect adjustment primarily resulted from a change in revenue recognition for sales of vehicle service contracts which are provided by a third-party and are sold by the Company on a commission basis. For these products, the Company is contractually entitled to receive profit-sharing revenues based on the performance of the vehicle service contracts once a required claims period has passed. The Company previously recognized this revenue at each reporting date based on the performance of the vehicle service contracts at such date. Under Topic 606, profit sharing revenues are recognized earlier because they represent variable consideration which the Company estimates and recognizes at the time the vehicle services are sold to the end-customer.

Topic 606 also requires the Company to make additional disclosures about the amount, timing, and uncertainty of revenue and cash flows arising from contracts with customers. Refer to Note 3—Revenue Recognition for further information on the Company’s revenue recognition accounting policies.

In August 2018, the FASB issued ASU 2018-15, Intangibles—Goodwill and Other—Internal-Use Software (Subtopic 350-40): Customer’s Accounting for Implementation Costs Incurred in a Cloud Computing Arrangement That Is a Service Contract (“ASU 2018-15”). The intent of this new guidance is to align the requirements for capitalizing implementation costs incurred in a cloud computing arrangement that is a service contract with the requirements for capitalizing implementation costs incurred to develop or obtain internal-use software as defined in ASC 350-40. Under ASU 2018-15, the capitalized implementation costs related to a cloud computing arrangement will be amortized over the term of the arrangement and all capitalized implementation amounts will be required to be presented in the same line items of the financial statements as the related hosting fees. The Company adopted ASU 2018-15 as of January 1, 2019. The new guidance was applied prospectively to all implementation costs incurred after the date of adoption and resulted in the capitalization of $2.7 million of implementation costs, which primarily relate to the Company’s hosted general ledger system. Capitalized implementation costs are included in “Other assets” in the consolidated balance sheet as of December 31, 2019 and are amortized over the terms of the arrangements, which range between 2 and 5 years. Total amortization expense for the year ended December 31, 2019 was $0.3 million.

93


Table of Contents

VROOM, INC.

NOTES TO CONSOLIDATED FINANCIAL STATEMENTS

In February 2016, the FASB issued, ASU 2016-02, Leases (Topic 842), which amends the accounting guidance on leases. The new standard requires a lessee to recognize right-of-use assets and lease obligations on the balance sheet for most lease agreements. Leases are classified as either operating or finance, with classification affecting the pattern of expense recognition in the statement of operations. The FASB also subsequently issued amendments to the standard to provide additional practical expedients and an additional transition method option.

The Company adopted Topic 842 as of January 1, 2020 using the modified retrospective approach with a cumulative-effect adjustment to opening retained earnings (accumulated deficit) with no restatement of comparative periods. Upon adoption, the Company recognized $18.4 million of operating lease liabilities and $17.4 million of operating lease right-of-use assets. The adoption of Topic 842 did not result in a cumulative effect adjustment to accumulated deficit.

Topic 842 provides various optional practical expedients for transition. The Company elected to utilize the package of practical expedients for transition which permitted the Company to not reassess its prior conclusions regarding whether a contract is or contains a lease, lease classification and initial direct costs. The Company did not elect the hindsight practical expedient to determine lease terms.

Topic 842 also provides optional practical expedients for an entity’s ongoing lease accounting. The Company elected the short-term lease recognition exemption for all leases that qualify and the practical expedient to not separate lease and non-lease components of leases.

In August 2018, the FASB issued ASU 2018-13, Fair Value Measurement (Topic 820): Disclosure Framework — Changes to the Disclosure Requirements for Fair Value Measurement, related to updated requirements over the disclosures of fair value measurements. Under ASU 2018-13, certain disclosure requirements for fair value measurements were eliminated, modified or added to facilitate better disclosure regarding recurring and non-recurring fair value measurements. The Company adopted the guidance on January 1, 2020 which did not have a material impact on the Company’s consolidated financial statements and related disclosures.

In June 2016, the FASB issued ASU 2016-13, Financial instruments, Credit Losses (Topic 326): Measurement of Credit Losses on Financial Instruments, which amends the guidance on the impairment of financial instruments by requiring measurement and recognition of expected credit losses for most financial assets, including trade receivables, and other instruments that are not measured at fair value through net income. The Company adopted the guidance on January 1, 2020 which did not have a material impact on the Company’s consolidated financial statements and related disclosures.

Accounting Standards Issued But Not Yet Adopted

In December 2019, the FASB issued ASU 2019-12, Income Taxes (Topic 740): Simplifying the Accounting for Income Taxes, which enhances and simplifies various aspects of the income tax accounting guidance including the elimination of certain exceptions related to the approach for intraperiod tax allocation, the methodology for calculating income taxes in an interim period and the recognition of deferred tax liabilities for outside basis differences. The Company adopted the guidance on January 1, 2021 which did not have a material impact on the Company’s consolidated financial statements and related disclosures.

In August 2020, the FASB issued ASU 2020-06, Debt Debt with Conversion and Other Options (Subtopic 470-20) and Derivatives and Hedging Contracts in Entity’s Own Equity (Subtopic 815-40): Accounting for Convertible Instruments and Contracts in an Entity’s Own Equity, which simplifies the issuer’s accounting for convertible debt instruments and amended certain guidance related to the computation of earnings per share for convertible instruments and contracts in an entity’s own equity. The Company earlyadopted the new guidance effective January 1, 2021. There was no impact on the date of adoption. During the year ended December 31, 2021, the Company issued convertible notes. Refer to Note 13 – Long Term Debt for further discussion.

In October 2021, the FASB issued ASU 2021-08, Business Combinations (Topic 805): Accounting for Contract Assets and Contract Liabilities from Contracts with Customers, which requires contract assets and contract liabilities acquired in a business combination to be recognized in accordance with Topic 606 as if the acquirer had originated the contracts. The Company adopted the guidance on January 1, 2023, which did not have a material impact on the Company's consolidated financial statements and related disclosures.

Accounting Standards Issued But Not Yet Adopted

In November 2023, the FASB issued ASU 2023-07, Segment Reporting (Topic 280): Improvements to Reportable Segment Disclosures, which requires disclosure of incremental segment information on an annual and interim basis, primarily through enhanced disclosures of significant segment expenses. The guidance will be effective for fiscal years beginning after December 15, 2020,2023, and interim periods within fiscal years beginning after December 15, 2024 and requires retrospective application to all periods presented upon adoption, with early adoption permitted. The Company is currently evaluating the impact that the adoption of ASU 2019-12this guidance will not result in a material change to the Company’shave on its consolidated financial statements and related disclosures.

In December 2023, the FASB issued ASU 2023-09, Income Taxes (Topic 740): Improvements to Income Tax Disclosures, which requires disclosure of incremental income tax information within the rate reconciliation and expanded disclosures of income taxes paid, among other disclosure requirements. The guidance will be effective for fiscal years beginning after December 15, 2024, with early adoption permitted. The Company is currently evaluating the impact that the adoption of this guidance will have on its consolidated financial statements and related disclosures.

3. Revenue Recognition

The Company recognizes revenue upon transfer of control of goods or services to customers, in an amount that reflects the consideration to which the Company expects to be entitled in exchange for those goods or services. The Company may collect sales taxes and other taxes and government fees from customers on behalf of governmental authorities at the time of sale as required. These taxes are accounted for on a net basis and are not included in revenues or cost of sales.

The Company’s revenue is disaggregated within the consolidated statements of operations and is generated from customers throughout the United States. The Company recognizes revenue at a point in time as described below.

89


Table of Contents

VROOM, INC.

NOTES TO CONSOLIDATED FINANCIAL STATEMENTS

Retail Vehicle Revenue

The Company sellssold used vehicles to its retail customers through its ecommerce platform and TDA retail location. The transaction price for used vehicles is a fixed amount as set forth within the customer contract at the time of sale. Customers frequently trade-in their existing vehicle to apply toward the transaction price of a used vehicle. Trade-in vehicles represent non-cash consideration which the Company measures at fair value based on external and internal

94


Table of Contents

VROOM, INC.

NOTES TO CONSOLIDATED FINANCIAL STATEMENTS

market data for each specific vehicle. The Company satisfies its performance obligation and recognizes revenue for used vehicle sales generally at a point in time when the vehicles are delivered to the customer for ecommerce sales or picked up by the customer for TDA sales. The revenue recognized by the Company includes the agreed upon transaction price, including any delivery charges and document fees stated within the customer contract. Revenue excludes any sales taxes, title and registration fees, and other government fees that are collected from customers.

The Company receives payment for used vehicle sales directly from the customer at the time of sale or from third-party financial institutionsarranges financing within a short period of time following the sale if the customer obtains financing.sale. Payments received prior to delivery or pick-up of used vehicles are recorded as “Deferred revenue” within the consolidated balance sheets.

The Company offers a return program for used vehicle sales and establishes a provision for estimated returns based on historical information and current trends. The reserve for estimated returns is presented gross on the consolidated balance sheets, with an asset recorded in “Prepaid expenses and other current assets” and a refund liability recorded in “Other current liabilities.”

Wholesale Vehicle Revenue

The Company sellssold vehicles that do not meet its retail sales criteria through wholesale channels. Vehicles sold through wholesale channels are acquired from customers who trade-in their vehicles when making a purchase from the Company, from customers who sell their vehicles to the Company in direct-buy transactions, and from liquidation of vehicles previously listed for retail sale. The transaction price for wholesale vehicles is a fixed amount. The Company satisfies its performance obligation and recognizes revenue for wholesale vehicle sales at a point in time when the vehicle is sold. The transaction price is typically due and collected within a short period of time following the vehicle sales.

Product Revenue

The Company’s product revenue consists of income from financing vehicle sales for Vroom customers through UACC and fees earned on selling third-party financing and value-added products, such as vehicle service contracts, guaranteed asset protection (“GAP”) and tire and wheel coverage.

As a result of the UACC Acquisition (as defined below), the Company generates ecommerce product revenue by providing Vroom customers with automotive financing solutions through its captive financing operation. The Company earns interest income on finance receivables before they are sold, interest income on finance receivables held in consolidated VIEs and gains on the sale of finance receivables. Refer to Note 4 – Variable Interest Entities and Securitizations.

The Company also sells thesethird-party financing and value-added products pursuant to arrangements with the third parties that provide these products and are responsible for their fulfillment. The Company concluded that it is an agent for these transactions because it does not control the products before they are transferred to the customer. The Company recognizes product revenues on a net basis when the customer enters into an arrangement for the products, which is typically at the time of a used vehicle sale.

Customers may enter into a retail installment sales contract to finance the purchase of used vehicles. The Company sells these contracts on a non-recourse basis to various financial institutions. The Company receives a fee from the financial institution based on the difference between the interest rate charged to the customer that purchased the used vehicle and the interest rate set by the financial institution. These fees are recognized upon sale and assignment of the installment sales contract to the financial institution, which occurs concurrently at the time of a used vehicle sale.

A portion of the fees earned on thesethird-party financing and value-added products is subject to chargebacks in the event of early termination, default, or prepayment of the contracts by end-customers. The Company’s exposure for these

90


Table of Contents

VROOM, INC.

NOTES TO CONSOLIDATED FINANCIAL STATEMENTS

events is limited to the fees that it receives. An estimated refund liability for chargebacks against the revenue recognized from sales of these products is recorded in the period in which the related revenue is recognized and is based primarily on the Company’s historical chargeback experience. The Company updates its estimates at each reporting date. As of December 31, 20202023 and 2019,2022, the Company’s reserve for chargebacks was $3.8$6.2 million and $3.3$8.2 million, respectively, of which $1.7$3.3 million and $1.8$4.4 million, respectively, are included within “Accrued expenses” and $2.1$2.9 million and $1.5$3.8 million, respectively, are included in “Other long-term liabilities.”

The Company also is contractually entitled to receive profit-sharing revenues based on the performance of the vehicle service policies once a required claims period has passed. The Company recognizes profit-sharing revenues to the extent it is probable that it will not result in a significant revenue reversal. The Company estimates the revenue based on historical claims and cancellation data from its customers, as well as other qualitative assumptions. The Company reassesses the estimate at each reporting period with any changes reflected as an adjustment to revenues in the period identified. As of December 31, 20202023 and 2019,2022, the Company recognized $11.5$20.6 million and $6.9$22.5 million, respectively, related to cumulative profit-sharing payments to which it expects to be entitled, of which $0.8$2.3 million and $0.3$1.6 million, respectively, are included within “Prepaid expenses and other current assets” and $10.7$18.3 million and $6.6$20.9 million, respectively, are included within “Other assets.”

95


TableFinance Revenue

The Company’s finance revenue is related to finance receivables originated by UACC for its network of Contents

VROOM, INC.

NOTES TO CONSOLIDATED FINANCIAL STATEMENTS

Other Revenue

Other revenue primarilythird-party dealership customers and consists of laborinterest income earned on finance receivables before they are sold, interest income earned on finance receivables held in consolidated VIEs, and parts revenue earnedgains on the sale of finance receivables. Refer to Note 4 – Variable Interest Entities and Securitizations.

Interest income deemed uncollectible is reversed at the time the finance receivable is charged off. An account is considered delinquent if a scheduled payment has not been received by the Companydate such payment was contractually due. Finance receivables over 90 days delinquent are considered nonaccrual finance receivables. Income is subsequently recognized only to the extent cash payments are received until the borrower is able to make periodic interest and principal payments in accordance with the finance receivable terms. Late charges and other fees are calculated at predetermined amounts or percentages of overdue finance receivable balances and are recorded on a cash basis.

Servicing income represents the annual fees earned on the outstanding principal balance of the finance receivables serviced. Fees are earned monthly at an annual rate of approximately 4% for vehicle repair services at TDA.the 2022-1 securitization transaction and 3.25% for the 2022-2 and 2023-1 securitization transactions of the outstanding principal balance of the finance receivables serviced. From January to March 2023, UACC waived the monthly servicing fees related to the 2022-2 securitization transaction, which resulted in consolidation of the 2022-2 VIE. Refer to Note 4 – Variable Interest Entities and Securitizations.

Contract Costs

The Company has elected, as a practical expedient, to expense sales commissions when incurred because the amortization period would have been less than one year. These costs are recorded within “Selling, general and administrative expenses” in the consolidated statements of operations.

4. Variable Interest Entities and Securitizations

4.

A VIE is an entity that either (i) has insufficient equity to finance its activities without additional subordinated financial support, or (ii) has equity investors who lack the characteristics of a controlling financial interest. The Company consolidates VIEs for which it is the primary beneficiary. The Company is the primary beneficiary of a VIE when it has both the power to direct the activities that most significantly impact the entity’s economic performance and the obligation to absorb losses or the right to receive benefits from the entity that could potentially be significant to the VIE. Assets recognized as a result of consolidating VIEs do not represent additional assets that could be used to satisfy claims against the Company's general assets. Liabilities recognized as a result of consolidating VIEs do not represent additional claims on the Company's general assets, rather they represent claims against the specific assets of the consolidated VIEs.

91


Table of Contents

VROOM, INC.

NOTES TO CONSOLIDATED FINANCIAL STATEMENTS

UACC has the power to direct significant activities of its VIEs when it has the ability to exercise discretion in the servicing of financial assets or control investment decisions. UACC generally retains a portion of the economic interests in UACC-sponsored asset-backed securitization transactions, which could be retained in the form of a portion of the senior interests, the subordinated interests, residual interests, or servicing rights.

UACC has developed a securitization program that involves selling finance receivables to securitization trusts through the private issuance of asset-backed securities which are collateralized by the finance receivables. UACC establishes and sponsors these transactions which create and pass along risks to the variable interest holders, specifically, consumer credit risk and pre-payment risk. In February and July 2022, UACC completed the 2022-1 and 2022-2 securitization transactions, respectively, and in January 2023, UACC completed the 2023-1 securitization transaction.

The securitization trusts established in connection with asset-backed securitization transactions are VIEs. For each VIE that UACC establishes in its role as sponsor of securitization transactions, the Company performs an analysis to determine if it is the primary beneficiary of the VIE. For all securitization transactions consummated prior to the Acquisition Date, the Company consolidated VIEs and accounted for these transactions as secured borrowings.

UACC has no obligation to repurchase or replace any securitized asset that subsequently becomes delinquent in payment or otherwise is in default, except when representations and warranties about the eligibility of the securitized assets are breached, or when certain changes are made to the underlying asset contracts. Securitization investors have no recourse to UACC or its other assets and have no right to require UACC to repurchase the investments. UACC has no obligation to provide liquidity or contribute cash or additional assets to the VIEs and does not guarantee any asset-backed securities.

In January 2023, UACC completed the 2023-1 securitization transaction, in which it sold approximately $238.7 million of rated asset-backed securities, for proceeds of $237.8 million. In April 2023, UACC sold the non-investment grade securities related to the 2023-1 securitization transaction for $23.1 million. UACC still retains the residual interests related to the 2023-1 securitization transaction. The trust is collateralized by finance receivables with an aggregate principal balance of $326.4 million. These finance receivables are serviced by UACC. The Company consolidated the 2023-1 VIE and accounted for this transaction as a secured borrowing.

UACC is the primary beneficiary of the 2021-1 and 2023-1 securitization trusts, as it has both the power to direct the activities that most significantly impact the entity’s economic performance and the obligation to absorb losses or the right to receive benefits from the entity that could potentially be significant to the VIE. UACC also retained a portion of the economic interests in the 2021-1 and 2023-1 asset-backed securitization transactions, in the form of residual interests in accordance with Regulation RR of the Dodd-Frank Wall Street Reform and Consumer Protection Act of 2010 (the "Risk Retention Rules"). The Risk Retention Rules require the Company to retain at least 5% of the beneficial interests issued by the securitization trusts. Refer to Note 13 – Long Term Debt for further details.

In July 2022, UACC sold a pool of finance receivables in the 2022-2 securitization transaction. UACC retained the servicing rights to these finance receivables and receives an "at market" servicing fee. UACC retained an insignificant amount of the asset-backed securities issued in the securitization in order to comply with risk retention rules. Originally, the Company concluded that it is not the primary beneficiary of the 2022-2 securitization trust because UACC retained interests in the VIE are insignificant. Therefore, the Company did not originally consolidate the 2022-2 trust. From January to March 2023, although not contractually required, UACC elected to waive its servicing fee on the 2022-2 securitization, due to higher-than-expected losses, which transferred more than an insignificant portion of the corresponding risk of loss from the VIE to the Company. Since UACC has the power to direct the significant activities of the VIE, as it is the servicer, and additionally it absorbs the risk of loss, the Company concluded that it is the primary beneficiary of the VIE. In March 2023, the Company accounted for the transaction as secured borrowings and consolidated the 2022-2 securitization trust. The beneficial interest was then eliminated.

92


Table of Contents

VROOM, INC.

NOTES TO CONSOLIDATED FINANCIAL STATEMENTS

The VIE model allows for a measurement alternative when a reporting entity elects the fair value option and consolidates a collateralized financing entity (“CFE”). This measurement alternative eliminates the accounting mismatch that may arise from measurement differences between the CFE’s financial assets and third-party financial liabilities in earnings and attributes those earnings to the controlling equity interest in the consolidated income statement. The 2021-1, 2022-2, and 2023-1 securitization trusts consolidated by UACC meet the definition of a CFE, therefore, the Company has elected to apply the measurement alternative when consolidating these VIEs. Refer to Note 17 – Financial Instruments and Fair Value Measurements for further detail.

UACC has four senior secured warehouse credit facilities. Through trusts, UACC entered into warehouse facility agreements with certain banking institutions, primarily to finance the purchase and origination of finance receivables as well as to provide funding for general operating activities. These trusts are secured by eligible finance receivables which are pledged as collateral for the warehouse facilities. These trusts are consolidated VIEs. Refer to Note 11 – Warehouse Credit Facilities of Consolidated VIEs for further details on the warehouse facilities.

93


Table of Contents

VROOM, INC.

NOTES TO CONSOLIDATED FINANCIAL STATEMENTS

Creditors or beneficial interest holders of VIEs for which the Company is the primary beneficiary generally have recourse only to the assets and cash flows of the VIEs and do not have recourse to the Company. The following table presents the total assets and total liabilities associated with the Company's variable interests in consolidated VIEs, as classified in the consolidated balance sheets (in thousands):


As of December 31, 2023


Securitization Vehicles


Warehouse
Facilities
1


Total


Current Assets:


Restricted cash


$

28,458


$

20,688


$

49,146


Finance receivables at fair value


10,878


947


11,825


Finance receivables held for sale


457,185


457,185


Other current assets


12,390


12,814


25,204


Total Current Assets


51,726


491,634


543,360


Finance receivables at fair value


306,120


23,499


329,619


Other assets


1,759


1,759


Total Assets


$

357,846


$

516,892


$

874,738


Current Liabilities:


Current portion of securitization debt


$

163,516


$


$

163,516


Warehouse credit facilities


421,268


421,268


Accrued expenses


1,286


2,674


3,960


Total Current Liabilities


164,802


423,942


588,744


Securitization debt, net of current portion


150,579


150,579


Other liabilities


3,248


7,127


10,375


Total Liabilities


$

318,629


$

431,069


$

749,698


As of December 31, 2022


Securitization Vehicles


Warehouse
Facilities
1


Total


Current Assets:


Restricted cash


$

9,023


$

15,654


$

24,677


Finance receivables at fair value


5,336


6,156


11,492


Finance receivables held for sale


305,917


305,917


Other current assets


2,730


9,004


11,734


Total Current Assets


17,089


336,731


353,820


Finance receivables at fair value


72,568


47,024


119,592


Total Assets


$

89,657


$

383,755


$

473,412


Current Liabilities:


Current portion of securitization debt


$

47,239


$


$

47,239


Warehouse credit facilities


229,518


229,518


Accrued expenses


90


1,439


1,529


Total Current Liabilities


47,329


230,957


278,286


Securitization debt, net of current portion


32,590


32,590


Other liabilities


686


6,724


7,410


Total Liabilities


$

80,605


$

237,681


$

318,286


1 Refer to Note 11 – Warehouse Credit Facilities of Consolidated VIEs for further details of the warehouse facilities.

UACC establishes securitization trusts to purchase finance receivables. The securitization trusts issue asset-backed securities, which are collateralized by the finance receivables that UACC sells to the securitization trusts. Upon sale of the finance receivables to the securitization trusts, the Company recognizes a gain or loss on sales of finance receivables if it determines it qualifies for sale accounting treatment and it is not the primary beneficiary of the VIE.

In February 2022, UACC sold a pool of finance receivables in the 2022-1 securitization transaction. UACC retained the servicing rights to these finance receivables and receives an "at market" servicing fee. UACC retained an

94


Table of Contents

VROOM, INC.

NOTES TO CONSOLIDATED FINANCIAL STATEMENTS

insignificant amount of the asset-backed securities issued in the securitization in order to comply with Risk Retention Rules. The 2022-1 securitization trust is a VIE that the Company does not consolidate. As the servicer, UACC retained the power to direct the activities that are most significant to the entities, however, the Company concluded that it is not the primary beneficiary of the 2022-1 securitization trust because UACC retained interests in the VIE are insignificant. The beneficial interest retained by UACC included rated notes and unrated residual certificates issued by the 2022-1 securitization trust.

In July 2022, UACC completed the 2022-2 securitization transaction, as discussed above, and recognized a gain on sale for the year ended December 31, 2022.

During the year ended December 31, 2022, the Company sold $523.7 million of rated asset-backed securities and $49.6 million of residual certificates through securitization transactions. The total gain related to finance receivables sold pursuant to securitization transactions was $45.6 million for the year ended December 31, 2022.

As of December 31, 2023 and 2022, the assets UACC retains in the unconsolidated VIEs were approximately $4.5 million and $20.6 million, respectively, and are included in "Beneficial interests in securitizations" in the Company's consolidated balance sheet. The beneficial interests in securitizations are subject to restrictions on transfer pursuant to UACC’s obligations as a sponsor under Risk Retention Rules. These securities are interests in securitization trusts, thus there are no contractual maturities. In the year ended December 31, 2023, the Company entered into a Risk Retention Financing Facility to finance the majority of its retained beneficial interests in securitizations. Refer to Note 13 – Long Term Debt for further detail.

The following table summarizes the amortized cost, the carrying amount, which is the fair value, and the maximum exposure to losses of UACC's assets related to unconsolidated VIEs (in thousands):


As of December 31, 2023


As of December 31, 2022


Aggregate Principal Balance


Carrying Value


Total Exposure


Aggregate Principal Balance


Carrying Value


Total Exposure


Rated notes


$

4,538


$

4,345


$

4,345


$

19,233


$

18,664


$

18,664


Certificates


140


140


1,928


1,928


Other assets


310


310


310


310


310


310


Total unconsolidated VIEs


$

4,848


$

4,795


$

4,795


$

19,543


$

20,902


$

20,902


Total exposure represents the estimated loss UACC would incur under severe, hypothetical circumstances, such as if the value of the interests in the securitization trusts and any associated collateral declined to zero. The Company believes the possibility of this is remote. As such, the total exposure presented above is not an indication of the Company's expected losses.

5. Acquisition

UACC Acquisition

On February 1, 2022, the Company completed the acquisition (the "UACC Acquisition") of 100% of Unitas Holdings Corp., a Delaware corporation, including its wholly owned subsidiaries United PanAm Financial Corp. and UACC. Unitas Holdings Corp. (now known as Vroom Finance Corporation), United PanAm Financial Corp. (now known as Vroom Automotive Financial Corporation) and UACC, as well as their other subsidiaries, are now wholly owned subsidiaries of the Company. This acquisition accelerated the Company's strategy of establishing a captive financing arm and underwriting vehicle financing for its customers, the results of which are included within the Ecommerce reporting segment. UACC will also continue its current operations with its network of third-party dealership customers, including the purchases and servicing of vehicle installment contracts, which constitutes the separate Retail Financing reporting segment. The cash consideration transferred was approximately $315.4 million at the Acquisition Date, inclusive of immaterial measurement period adjustments.

95


Table of Contents

VROOM, INC.

NOTES TO CONSOLIDATED FINANCIAL STATEMENTS

The following table summarizes the fair value of the identified assets acquired and liabilities assumed as of the Acquisition Date, inclusive of immaterial measurement period adjustments (in thousands):


Fair Value


Cash and cash equivalents


$

5,294


Restricted cash


42,631


Finance receivables at fair value


296,927


Finance receivables, held for sale


263,393


Intangible assets


156,000


Goodwill


42,886


Other assets


25,934


Total assets acquired


$

833,065


Warehouse credit facilities


(178,067

)

Long term debt


(285,704

)

Deferred tax liability


(23,855

)

Other liabilities


(30,026

)

Total liabilities assumed


$

(517,652

)

Net assets acquired


$

315,413


The estimated fair value of the finance receivables that were designated as held for sale were determined using the discounted cash flow method under the income approach. The Company determined the fair value of these finance receivables utilizing sales prices based on an estimated securitization transaction, adjusted for transaction costs, risk and a normal profit margin associated with securitization transactions. The significant assumptions used in the valuation were discount rate, prepayment rate, cumulative net losses, weighted average interest rate and recovery rate. Such fair value measurement of finance receivables held for sale is considered Level 3 of the fair value hierarchy.

The Company acquired two types of finance receivables that are accounted for under the fair value option: (i) those that were sold in one of the securitization transactions that UACC completed in 2019, 2020 or 2021, and (ii) those that were not eligible to be sold in future securitization transactions. The estimated fair value of the finance receivables that were previously sold were valued using the measurement alternative by reference to the fair value of the securitization debt. See Note 17 – Financial Instruments and Fair Value Measurements for more information regarding the measurement alternative and the fair value of these finance receivables. The fair value of the ineligible finance receivables was determined using a discounted cash flow method under the income approach. The significant assumptions used in the valuation were discount rate and recovery rate. Such fair value measurement of finance receivables accounted for under the fair value option is considered Level 3 of the fair value hierarchy.

The estimated fair value of the securitization debt of consolidated VIEs was determined using the discounted cash flow method under the income approach. The significant assumption used in the valuation was the yield. Such fair value measurement of securitization debt is considered Level 3 of the fair value hierarchy.

The estimated fair value of the warehouse credit facilities of consolidated VIEs approximated its carrying value due to the proximity of the Acquisition Date to the payoff date. These notes were acquired on February 1, 2022, as part of the UACC Acquisition and were paid off with the proceeds from the 2022-1 securitization transaction that UACC completed on February 16, 2022.

The excess of purchase consideration over the fair value of net tangible and identifiable intangible assets acquired was recorded as goodwill which is not deductible for tax purposes. Goodwill is primarily attributable to the workforce of the acquired business as well as benefits related to integrating UACC’s financing operations to establish a captive financing arm and underwrite vehicle financing for the Company's customers. All of the goodwill was assigned to the Ecommerce reporting unit.

96


Table of Contents

VROOM, INC.

NOTES TO CONSOLIDATED FINANCIAL STATEMENTS

The following table summarizes the identifiable intangible assets acquired and their estimated weighted average useful life at the date of acquisition (in thousands):


Fair Value


Weighted Average Useful Life

Purchased technology


$

83,000


7

Customer relationships


66,000


8

Trade name


7,000


10


$

156,000


Purchased technology represents the fair value of UACC’s proprietary technology used to support all aspects of their business including underwriting, servicing, and risk management. The estimated fair value of the purchased technology was determined using a relief-from-royalty method under the income approach. The significant assumptions used in the relief-from-royalty method include estimates about future expected cash flows from the purchased technology, including the revenue growth rates, the royalty rate, the obsolescence factor and the discount rate.

Customer relationships represents UACC's relationship with its network of dealer customers. UACC has expertise in the non-prime credit dealer market serving as the key link between independent dealerships and consumers. UACC has developed expertise and robust relationships in the independent dealer market as demonstrated by its active dealership network. The estimated fair value of the customer relationships was determined using a multi-period excess earnings method under the income approach. The significant assumptions used in the multi-period excess earnings method include estimates about future expected cash flows from the customer relationships, including pre-tax income margins and the discount rate.

Trade name represents the value of the UACC trade name. The UACC brand is an important factor in the marketing of UACC’s services to prospective dealership customers. The fair value of the trade name acquired was determined using a relief-from-royalty method under the income approach. The significant assumptions used in the relief-from-royalty method include future expected cash flows from the trade name, the royalty rate, and the discount rate.

The fair values assigned to assets acquired and liabilities assumed are based on management’s estimates and assumptions. The allocation of the total consideration transferred to the assets acquired, including intangible assets and goodwill, as well as the liabilities assumed was final as of December 31, 2022.

The transaction costs associated with the UACC Acquisition were $5.7 million for the year ended December 31, 2022, and are included within "Selling, general and administrative expenses" in the consolidated statement of operations.

The aggregate revenue and net income of UACC consolidated into the Company’s financial statements from the date of the acquisition was $167.8 million and $26.7 million for the year ended December 31, 2022, respectively.

Unaudited Pro Forma Information

The unaudited pro forma financial information in the table below summarizes the combined results of the Company and UACC, as though the companies had been combined on January 1, 2021. The pro forma adjustments include incremental amortization of intangible assets, adjustments to reflect non-recurring acquisition-related costs of $5.7 million as of the beginning of the 2021 annual reporting period, a non-recurring tax adjustment of $24.1 million for the year ended December 31, 2022. The pro forma information is presented for informational purposes only and may not be indicative of the results of operations that would have been achieved if the acquisition had taken place on January 1, 2021 or that may occur in the future, and does not reflect future synergies, integration costs, or other such costs or savings. The pro forma information for the years ended December 31, 2022 is as follows (in thousands):


Year Ended December 31,


2022


Total revenue


$

1,964,372


Net loss


$

(464,101

)

97


Table of Contents

VROOM, INC.

NOTES TO CONSOLIDATED FINANCIAL STATEMENTS

6. Inventory

Inventory consisted of the following (in thousands):


December 31,


December 31,


2020


2019


2023


2022


Vehicles


$

421,458


$

203,290


$

162,659


$

317,994


Parts and accessories


2,189


2,456


591


2,654


Total inventory


$

423,647


$

205,746


$

163,250


$

320,648


As of December 31, 20202023 and 2019,2022, “Inventory” includes an adjustment of $12.9$21.8 million and $6.3$24.2 million, respectively, to record the balances at the lower of cost or net realizable value.

5.

7. Property and Equipment, Net

Property and equipment, net consisted of the following (in thousands):


December 31,


December 31,


2020


2019


2023


2022


Equipment


$

1,061


$

930


$

2,653


$

3,357


Furniture and fixtures


1,746


1,725


503


1,896


Company vehicles


5,002


1,151


Logistics fleet


32,562


32,468


Leasehold improvements


7,068


6,556


434


6,577


Internal-use software


10,552


4,406


4,807


30,725


Other


2,997


2,580


1,369


8,081


28,426


17,348


42,328


83,104


Accumulated depreciation and amortization


(13,334

)


(9,520

)


(18,196

)


(32,903

)

Property and equipment, net


$

15,092


$

7,828


$

24,132


$

50,201


Depreciation and amortization expense was $4.1 million, $2.8$16.5 million and $3.5$13.4 million for the years ended December 31, 2020, 2019,2023 and 2018,2022, respectively. Depreciation and amortization expense included within “Cost of $0.1sales” in the consolidated statements of operations was $0.7 million and $0.4 million for the years ended December 31, 2023 and 2022 respectively.

Implementation costs capitalized and accumulated amortization related to the Company’s cloud computing arrangements were $0.6 million and $0.2 million as of December 31, 2023, respectively, and $7.7 million and $4.6 million as of December 31, 2022, respectively, and were included within “Other assets” in the consolidated balance sheets. Amortization expense of $1.8 million and $2.3 million was included within “Cost of sales”“Selling, general and administrative expenses” in the consolidated statements of operations for the years ended December 31, 2020, 20192023 and 2018.2022, respectively.

6. Goodwill

The carrying amount of the Company’s goodwill was $78.2 millionCompany determined a triggering event existed as of December 31, 20202023, resulting in impairment charges for "Property and 2019,equipment, net" and "Other assets" of which $72.2 million, $4.2$23.9 million and $1.8$1.3 million, is allocatedrespectively, related to the Ecommerce, TDA,Company's internal-use software, implementation costs for cloud computing arrangements, and Wholesale reportable segments, respectively. There wereother miscellaneous furniture and equipment that no changeslonger have a planned future use.

Additionally, the Company incurred impairment charges for "Property and equipment, net" and "Other assets" of $0.3 million and $3.4 million, respectively, for the year ended December 31, 2022, related to the Company's internal-use software and implementation costs for cloud computing arrangements that are no longer in use.

98


Table of Contents

VROOM, INC.

NOTES TO CONSOLIDATED FINANCIAL STATEMENTS

8. Goodwill and Intangible Assets

Goodwill

The following table summarizes the activity in the carrying amountvalue of goodwill by reporting unit for the year ended December 31, 2022 (in thousands):


Ecommerce


Wholesale


TDA


Total


Balance as of December 31, 2021


$

152,876


$

1,720


$

4,221


$

158,817


Acquisition


42,886


42,886


Goodwill impairment charge


(195,762

)


(1,720

)


(4,221

)


(201,703

)

Balance as of December 31, 2022


$


$


$


$


There was no goodwill as of December 31, 2023 and 2022.

As of March 31, 2022, a quantitative interim goodwill impairment assessment was performed over the Company's reporting units due to further sustained declines in the Company's and comparable companies' stock prices during the three months ended March 31, 2022.

The Company estimated the fair value of the Company’sEcommerce, Wholesale, and TDA reporting units using the discounted cash flow method under the income approach. The significant assumptions used in the valuation include revenue growth rates, future gross profit margins and operating expenses used to calculate projected future cash flows, determination of the weighted average cost of capital, and future economic and market conditions. The terminal value is based on an exit revenue multiple which requires significant assumptions regarding the selection of appropriate multiples that consider relevant market trading data. The Company bases its estimates and assumptions on its knowledge of the automotive and ecommerce industries, recent performance, expectations of future performance and other assumptions the Company believe to be reasonable.

The Company determined that the estimated fair value of the Ecommerce, Wholesale, and TDA reporting units was less than their carrying amounts. The Company recorded a goodwill impairment charge of $201.7 million in the consolidated statements of operations for the year ended December 31, 2022.

Refer to Note 5 – Acquisition for more information related to the acquisition that occurred in the year ended December 31, 2022.

Intangible Assets

Intangible assets, net consisted of the following (in thousands):


December 31, 2023


December 31, 2022


Gross Carrying Value


Accumulated Amortization


Carrying Value


Gross Carrying Value


Accumulated Amortization


Carrying Value


Developed and purchased technology


$

108,700


$

(38,050

)


$

70,650


$

108,700


$

(21,053

)


$

87,647


Customer relationships


69,400


(17,336

)


52,064


69,400


(8,661

)


60,739


Trademarks and trade names


12,200


(3,022

)


9,178


12,200


(1,676

)


10,524


      Total intangible assets


$

190,300


$

(58,408

)


$

131,892


$

190,300


$

(31,390

)


$

158,910


Refer to Note 5 – Acquisition for more information related to the acquisition that occurred in the year ended December 31, 2022.

Amortization expense for intangible assets was $27.0 million and $25.3 million for the years ended December 31, 20202023 and 2019 and there have been no accumulated impairment charges.  2022, respectively.

9699


Table of Contents

VROOM, INC.

NOTES TO CONSOLIDATED FINANCIAL STATEMENTS

The estimated amortization expense for intangible assets subsequent to December 31, 2023, consists of the following (in thousands):

7.

Year Ending December 31:


2024


$

27,022


2025


27,022


2026


21,979


2027


21,882


2028


21,882


Thereafter


12,105


$

131,892


9. Accrued Expenses and Other Current Liabilities

The Company’s accrued expenses consisted of the following (in thousands):


December 31,


2023


2022


Accrued marketing expenses


$

3,694


$

2,093


Vehicle related expenses


9,655


14,789


Sales taxes


4,398


5,983


Accrued compensation and benefits


13,223


28,276


Accrued professional services


2,935


3,488


Accrued legal settlements(1)


6,050


7,383


Interest payable


5,708


3,990


Other


6,789


10,793


Total accrued expenses


$

52,452


$

76,795


(1) Accrued legal settlements are primarily related to legal challenges stemming from operational challenges created by the Company's prior rapid growth, which resulted in additional costs incurred, including legal settlements.


December 31,


2020


2019


Accrued marketing expenses


$

9,106


$

3,158


Vehicle related expenses


13,062


8,923


Sales taxes


15,443


7,455


Accrued compensation and benefits


5,749


3,386


Accrued professional services


4,890


2,964


Accrued Series H preferred stock issuance costs


5,020


Other


11,155


7,585


Total accrued expenses


$

59,405


$

38,491


The Company’s other current liabilities consisted of the following (in thousands):


December 31,


2023


2022


Vehicle payable


$

3,522


$

3,617


Reserve for estimated returns


1,594


3,919


Insurance payable


4,158


4,551


Other


700


5,606


Total other current liabilities


$

9,974


$

17,693


December 31,


2020


2019


Vehicle payable


$

25,086


$

8,904


Other


5,189


2,668


Total other current liabilities


$

30,275


$

11,572


8.10. Vehicle Floorplan FacilitiesFacility

In March 2020,November 2022, the Company entered into a new vehicleamended its floorplan facility with Ally Bank and Ally Financial (the “2020“2022 Vehicle Floorplan Facility”), which replaced the Company’s previous vehicle floorplan facility.. The 20202022 Vehicle Floorplan Facility provides a committed credit line of up to $450.0$500.0 million which originally wasis scheduled to expire in mature on March 2021.The31, 2024.

The amount of credit available is determinedto the Company on a monthly basis based on a calculation that considersequals the product of (1) the greater of five times the aggregate number of retail units sold during the most recent month for which information is available or the aggregate number of retail units sold during the five most recent months for which information is available and (2) the greater of the average outstanding borrowings and vehicle units paid off byfloorplan balance of all vehicles on the Company withinfloorplan as of the immediately preceding three-month period.month-end or the average monthly outstanding floorplan balance of all vehicles on the floorplan as of month-end for the immediately preceding five months. As of December 31, 2020,2023, the borrowing capacity of the 2022 Vehicle Floorplan Facility was $253.6 million, of which $102.4 million was unutilized. As of December 31, 2022, the borrowing capacity of the 2022 Vehicle Floorplan Facility was $343.9 million, of which $66.9 million was unutilized.

100


Table of Contents

VROOM, INC.

NOTES TO CONSOLIDATED FINANCIAL STATEMENTS

Additionally, the Company may elect to increase its monthly credit line availability by an additional $25.0 million during any four months in the period from November 1, 2022 through March 31, 2024, subject to the maximum $500.0 million credit limit. The 2022 Vehicle Floorplan Facility allows for more flexibility in the Company's borrowing capacity. Consistent with the terms of the 2020 Vehicle Floorplan Facility, was $356.9 million,the Company and Vroom Automotive, LLC have provided Ally with a guaranty of which $27.7 million was unutilized.

Outstanding borrowings related topayment of all amounts owed under the 20202022 Vehicle Floorplan Facility are due as well as a security interest in all or substantially all tangible, intangible, and other personal property of Vroom, Inc., to secure obligations under the vehicles financed are sold, or in any event, on the maturity date. 2022 Vehicle Floorplan Facility.

The 20202022 Vehicle Floorplan Facility bears interest at a rate equal to the 1-Month LIBOR rate applicable in the immediately preceding monthPrime Rate, announced per annum by Ally Bank, plus a spread of 425175 basis points. The 2020 Vehicle Floorplan Facility is collateralized by the Company’s vehicle inventory and certain other assets andAdditionally, the Company is subject to amended covenants that require itand events of default. The Company is required to maintain a certain level of equity in the vehicles that are financed, to maintain at least 10%20.0% of the outstanding borrowingscredit line in cash and cash equivalents, to maintain 10% of the monthly credit line availability on deposit with Ally Bank and to maintain a minimum tangible adjusted net worth of $167.0 million, which is defined as shareholder equity (deficit) plus redeemable convertible preferred stock as determined under U.S. GAAP. The Company was required to pay an upfront commitment fee upon execution of the 2020 Vehicle Floorplan Facility.

In October 2020, the Company amended its 2020 Vehicle Floorplan Facility to extend the maturity date to September 30, 2022. The amendment requires the Company to pay an availability fee each quarter on the average unused capacity from the prior quarter if it was greater than 50% of the calculated floorplan allowance, as defined. The amendment reduces the minimum liquidity requirement to maintain in cash and cash equivalents as a percentage of the credit line from 10.0% to 7.5% and changes the requirement to maintain 10% of the monthly credit line availability on depositbalance with Ally Bank to 10%of at least 15.0% of the daily floorplan principal balance outstanding. The amendment eliminated the minimum tangible adjusted net worth covenant. The Company was required to pay an upfronta commitment fee upon execution of the amendment.

The Company previously entered into a vehicle floorplan (the “20162022 Vehicle Floorplan Facility”) with Ally Bank and Ally Financial in April 2016, as subsequently amended. The 2016 Vehicle Floorplan Facility consisted of a revolving line of credit with a borrowing capacity of $220.0 million as of December 31, 2019, which could be used to finance the Company’s vehicle inventory.Facility.

97


Table of Contents

VROOM, INC.

NOTES TO CONSOLIDATED FINANCIAL STATEMENTS

The interest rate on the 2016 Vehicle Floorplan Facility was equal to the 1-Month LIBOR rate applicable in the immediately preceding month plus a spread of 425 basis points and was payable on a monthly basis.

As of December 31, 20202023 and 2019,2022, outstanding borrowings on the vehicle floorplan facilities were $329.2$151.2 million and $173.5$277.0 million, respectively. Cash deposits required under the vehicle floorplan facilities of $22.7 million and $34.6 million are classified as "Restricted cash" within the consolidated balance sheets as of December 31, 2023 and 2022, respectively.

Interest expense incurred by the Company for the vehicle floorplan facilities was $9.7 million, $10.4$19.5 million and $4.7$26.8 million for the years ended December 31, 2020, 2019,2023 and 2018,2022, respectively, which are recorded within “Interest expense” in the consolidated statements of operations. The weighted average interest rate on the vehicle floorplan borrowings was 4.39%10.25% and 6.00%9.25% as of December 31, 20202023 and 2019,2022, respectively.

As of December 31, 20202023 and 2019,2022, the Company was in compliance with all covenants related to the vehicle floorplan facilities.

In connection with the vehicle floorplan facilities, the Company entered into credit balance agreements with Ally Bank and Ally Financial that permit the Company to deposit cash with the bank for the purpose of reducing the amount of interest payable for borrowings. Interest credits earned by the Company were $5.4 million, $5.1$13.2 million and $2.9$15.9 million for the years ended December 31, 2020, 2019,2023 and 2018,2022, respectively, which are recorded within “Interest income” in the consolidated statements of operations.

9. Commitments and Contingencies

Litigation

From time to time,On January 19, 2024, the Company is involved in various claims and legal actions that arise in the ordinary course of business. The Company accruesamended its 2022 Vehicle Floorplan Facility. As a liability when a loss is considered probable and the amount can be reasonably estimated. When a material loss contingency is reasonably possible but not probable, the Company does not record a liability, but instead discloses the nature and the amountresult of the claim,amendment, borrowings under the 2022 Vehicle Floorplan Facility were suspended for future vehicle purchases and an estimate of the loss or range of loss, if such an estimate can be made. Legal fees are expensed as incurred. As of December 31, 2020 and 2019, the Company was not a party to any legal proceedings that, individually or in the aggregate, are reasonably expected to have a material adverse effect on the Company’s consolidated results of operations, financial condition or cash flows. However, the results of these matters cannot be predicted with certainty, and an unfavorable resolution of one or more matters could have a material adverse effect on the Company’s consolidated results of operations, financial condition or cash flows.

Letters of Credit

The Company obtained stand-by letters of credit totaling $2.2 million in 2020 to satisfy conditions under three lease agreements. The Company was required to maintain 40% of its outstanding borrowings in cash. In addition, all other financial covenants were eliminated. As a cash depositresult of $2.2 millionthe liquidation of the Company's vehicle inventory, the Company repaid the remaining outstanding balance related to the 2022 Vehicle Floorplan Facility in full and $1.9 millionthe agreement has been terminated.

101


Table of Contents

VROOM, INC.

NOTES TO CONSOLIDATED FINANCIAL STATEMENTS

11. Warehouse Credit Facilities of Consolidated VIEs

UACC has four senior secured warehouse facility agreements (the “Warehouse Credit Facilities”) with the financial institution that issued the stand-by letters of credit, which is classified as “Restricted cash” within the consolidated balance sheetsbanking institutions as of December 31, 20202023. The Warehouse Credit Facilities are collateralized by eligible finance receivables and 2019,available borrowings are computed based on a percentage of eligible finance receivables. As of December 31, 2023 and 2022, the Company had excess borrowing capacity of $56.9 million and $105.8 million on UACC's Warehouse Credit Facilities, respectively.

Other Matters

The Company enters into agreements with third parties in the ordinary course of business that may contain indemnification provisions. In the event that an indemnification claim is asserted, the Company’s liability, if any, would be limited by the terms of the applicable agreement. Historically,Warehouse Credit Facilities include the following (in thousands):


Facility One


Facility Two


Facility Three


Facility Four


Execution date


May 30, 2012


November 19, 2013


July 11, 2019


November 18, 2022


Maturity date


July 21, 2025


June 2, 2025


August 29, 2025


September 12, 2025


Aggregate borrowings limit


$

200,000


$

200,000


$

200,000


$

225,000


As of December 31, 2023


Aggregate principal balance of finance receivables pledged as collateral


$

223,207


$

64,970


$

165,927


$

92,978


Outstanding balance


$

177,375


$

51,012


$

117,264


$

75,617


Restricted cash


$

8,961


$

2,550


$

6,485


$

2,692


As of December 31, 2022


Aggregate principal balance of finance receivables pledged as collateral


$

143,919


$

142,503


$

126,636


$


Outstanding balance


$

110,602


$

19,615


$

101,435


$


Restricted cash


$

8,110


$

2,007


$

5,537


$


As of December 31, 2023 and 2022, the Company's weighted average interest rate on the Warehouse Credit Facilities borrowings was approximately 6.98% and 6.19%, respectively.

The Company's ability to utilize its Warehouse Credit Facilities is primarily conditioned on the satisfaction of certain legal, operating, administrative and financial covenants contained within the agreements. These include covenants that require UACC to maintain a minimum tangible net worth, minimum liquidity levels, specified leverage ratios and certain indebtedness levels. Failure to satisfy these and or any other requirements contained within the agreements would restrict access to the Warehouse Credit Facilities. Certain breaches of covenants may also result in acceleration of the repayment of borrowings prior to the scheduled maturity. As of December 31, 2023 and 2022, the Company has not incurred material costs to defend lawsuits or settle claimswas in compliance with all covenants related to indemnification provisions.the Warehouse Credit Facilities.

12. Leases

10. Leases

The Company’s leasing activities primarily consist of real estate leases for its operations, including office space, the Company’s reconditioning facility, the TDA retail location, the Company’s Sell Us Your Car centers, parking lots, other facilities and other facilities.equipment used in the normal course of business. The real estate leases have terms ranging from sixthree months to eight years. The Company also has leases for various types of equipment, which are not material, individually or in the aggregate.nine years. The Company assesses whether each lease is an operating or finance lease at the lease commencement date. The Company does not have any material leases, individually or in the aggregate, classified as a finance leasing arrangement.

The Company’s lease agreements do not contain any material residual value guarantees or material restrictive covenants. TheAs of December 31, 2023, the Company does not have any significant leaseshad an additional operating lease that havehas not yet commenced but that create significant rights and obligations forwith future lease payments of approximately $1.2 million. The lease is expected to commence over the Company.next 12 months with an initial lease term of approximately 7 years.

98


Table of Contents

VROOM, INC.

NOTES TO CONSOLIDATED FINANCIAL STATEMENTS

The Company’s real estate leases often require it to make payments for maintenance in addition to rent as well as payments for real estate taxes and insurance. Maintenance, real estate taxes, and insurance payments are generally variable costs which are based on actual expenses incurred by the lessor. Therefore, these amounts are not included in the consideration of the contract when determining the right-of-use asset and lease liability but are reflected as variable lease expenses.

102


Table of Contents

VROOM, INC.

NOTES TO CONSOLIDATED FINANCIAL STATEMENTS

Leases with an initial term of 12 months or less are not recorded on the Company’s consolidated balance sheet and expense for these leases are recognized on a straight-line basis over the lease term.

Options to extend or terminate leases

Certain of the Company’s real estate leases include one or more options to renew, with renewal terms that can extend the lease term from one to five years.years. The exercise of lease renewal options is at the Company’s sole discretion. If it is reasonably certain that the Company will exercise such options, the periods covered by such options are included in the lease term and are recognized as part of the Company’s right-of-use assets and lease liabilities. The depreciable life of assets and leasehold improvements are limited by the expected lease term, unless there is a transfer of title or purchase option reasonably certain of exercise.

Lease term and discount rate

As of December 31, 2020, the

The weighted-average remaining lease term and discount rate for the Company’s operating leases, were 3.5 years and 3.4%, excluding short-term operating leases.leases, were 5.1 years and 7.1% as of December 31, 2023, respectively, and 4.2 years and 5.8% as of December 31, 2022, respectively.

As the rate implicit in the lease is generally not readily determinable for the Company’s operating leases, the discount rates used to determine the present value of the Company’s lease liabilities are based on the Company’s incremental borrowing rate at the lease commencement date and commensurate with the remaining lease term. The incremental borrowing rate for a lease is the rate of interest the Company would have to pay to borrow on a collateralized basis over a similar term for an amount equal to the lease payments in a similar economic environment. The Company determinesuses its incremental borrowing rate based on a synthetic credit rating that was developed with the assistanceinformation available at commencement date in determining the present value of a third-party specialist.lease payments.

Lease costs and activity

The Company’s lease costs and activity for the yearyears ended December 31, 20202023 and 2022 were as follows (in thousands):


Year Ended
December 31,


2023


2022


Lease Cost


Operating lease cost


$

8,951


$

8,402


Short-term lease cost


312


690


Variable lease cost


4,125


3,810


Sublease income


(379

)


(72

)

Net lease cost


$

13,009


$

12,830


Year Ended
December 31,


2023


2022


Other information


Cash paid for amounts included in the measurement of lease liabilities:


Operating cash flows from operating leases


$

11,892


$

9,322


Right-of-use assets obtained in exchange for operating lease liabilities


$

13,260


$

19,896


The Company incurred impairment charges related to operating lease right-of-use assets of $23.5 million for the year ended December 31, 2023, with $22.2 million related to the wind-down of the Company's ecommerce operations that resulted in a triggering event as of December 31, 2023 and $1.3 million related the closing of a physical office location.

The Company incurred impairment charges related to operating lease right-of-use assets of $6.5 million for the year ended December 31, 2022, related to costs associated with planned facility closures that will continue to be incurred under the contract for its remaining term without economic benefit to the Company. Refer to Note 18 — Restructuring Activities for further detail.


Year Ended

December 31,


2020


Lease Cost


Operating lease cost


$

5,503


Short-term lease cost


350


Variable lease cost


1,915


Sublease income


(445

)

Net lease cost


$

7,323


Year Ended

December 31,


2020


Other information


Cash paid for amounts included in the measurement of lease liabilities:


Operating cash flows from operating leases


$

5,524


Right-of-use assets obtained in exchange for operating lease liabilities


$

4,600


99103


Table of Contents

VROOM, INC.

NOTES TO CONSOLIDATED FINANCIAL STATEMENTS

Maturity of Lease Liabilities

The maturity of the Company’s lease liabilities on an undiscounted cash flow basis and a reconciliation to the operating lease liabilities recognized on the Company’s consolidated balance sheet as of December 31, 20202023 were as follows (in thousands):

2024


10,744


2025


6,960


2026


6,233


2027


5,877


2028


4,873


Thereafter


6,329


Total lease payments


41,016


Less: interest


(7,096

)

Present value of lease liabilities


$

33,920


Operating lease liabilities, current


$

8,737


Operating lease liabilities, noncurrent


25,183


Total operating lease liabilities


$

33,920


2021


6,577


2022


5,318


2023


3,398


2024


3,111


2025


907


Thereafter


-


Total lease payments


19,311


Less: interest


(1,166

)

Present value of lease liabilities


$

18,145


Operating lease liabilities, current


$

6,052


Operating lease liabilities, noncurrent


12,093


Total operating lease liabilities


$

18,145


13. Long Term Debt

Future minimum payments under non-cancelable operating leases with initial terms

Debt instruments, excluding the 2022 Vehicle Floorplan Facility, which is discussed in Note 10 — Vehicle Floorplan Facility, and warehouse credit facilities of one year or moreconsolidated VIEs, which are discussed in Note 11 — Warehouse Credit Facilities of Consolidated VIEs, consisted of the following (in thousands):


December 31,


2023


2022


Current portion of securitization debt of consolidated VIEs


$

163,516


$

47,239


Current portion of financing of beneficial interest in securitizations


8,894


Total current portion of long term debt


$

172,410


$

47,239


Convertible senior notes


$

286,800


$

359,254


Securitization debt of consolidated VIEs, net of current portion


150,579


32,590


Financing of beneficial interest in securitizations


6,484


Junior subordinated debentures


10,310


10,310


Long term debt, net of current portion


$

454,173


$

402,154


Total debt


$

626,583


$

449,393


Convertible Senior Notes

On June 18, 2021, the Company issued $625.0 million aggregate principal amount of 0.75% unsecured Convertible Senior Notes due 2026 (the “Notes”), including $75.0 million aggregate principal amount of such notes pursuant to the exercise in full of the overallotment option granted to the initial purchasers. The Notes were issued pursuant to an indenture (the “Indenture”), between the Company and U.S. Bank National Association, as trustee.

The Notes bear interest at a rate of 0.75% per annum, payable semiannually in arrears on January 1 and July 1 of each year, beginning on January 1, 2022. The Notes will mature on July 1, 2026, subject to earlier repurchase, redemption or conversion. The total net proceeds from the offering, after deducting commissions paid to the initial purchasers and debt issuance costs paid to third-parties, were approximately $608.9 million.

104


Table of Contents

VROOM, INC.

NOTES TO CONSOLIDATED FINANCIAL STATEMENTS

Each $1,000 principal amount of the Notes will initially be convertible into 0.2232 shares of the Company’s common stock, which is equivalent to an initial conversion price of approximately $4,480.29 per share, subject to adjustment upon the occurrence of specified events. The Notes are convertible, at the option of the noteholders, on or after April 1, 2026. Prior to April 1, 2026, the Notes are convertible only under the following circumstances:

During any fiscal quarter commencing after the fiscal quarter ending on September 30, 2021 (and only during such fiscal quarter), if the last reported sale price of the Company’s common stock for at least 20 trading days (whether or not consecutive) during a period of 30 consecutive trading days ending on the last trading day of the immediately preceding fiscal quarter is greater than or equal to 130% of the conversion price of the Notes on each applicable trading day;

During the five consecutive business day period after any ten consecutive trading day period in which the trading price per $1,000 principal amount of the Notes for each day of that ten consecutive trading day period was less than 98% of the product of the last reported sale price of the Company’s common stock and the conversion rate of the Notes on such trading day;

If the Company calls any or all of the Notes for redemption; or

Upon the occurrence of specific corporate events such as a change in control or certain beneficial distributions to common stockholders (as set forth in the Indenture).

The Company may settle conversions by paying or delivering, as applicable, cash, shares of its common stock or a combination of cash and shares of its common stock, at the Company’s election.

The Company may not redeem the Notes prior to July 6, 2024. On or after July 6, 2024, the Company may redeem all or any portion of the Notes for cash equal to 100% of the principal amount of the Notes being redeemed plus any accrued and unpaid interest if the last reported sale price of the Company’s common stock has been at least 130% of the conversion price then in effect for at least 20 trading days (whether or not consecutive) during any 30 consecutive trading day period.

If the Company undergoes a fundamental change (as defined in the Indenture), subject to certain conditions, holders of the Notes may require the Company to repurchase for cash all or any portion of their Notes at a repurchase price equal to 100% of the principal amount of the Notes plus any accrued and unpaid interest. In addition, if specific corporate events occur prior to the maturity date or if the Company issues a notice of redemption, the Company will increase the conversion rate by pre-defined amounts for a holder who elects to convert their Notes in connection with such a corporate event. During the years ended December 31, 2023 and 2022, the conditions allowing holders of the Notes to convert were not met.

In 2023, the Company repurchased $74.2 million in aggregate principal amount of the Notes, net of deferred issuance costs, for $36.5 million in open-market transactions. The Company recognized a gain on extinguishment of debt of $37.9 million for the year ended December 31, 2023.

In 2022, the Company repurchased $254.3 million in aggregate principal amount of the Notes, net of deferred issuance costs, for $90.2 million in open-market transactions. The Company recognized a gain on extinguishment of debt of $164.7 million for the year ended December 31, 2022.

The Company accounts for the Notes as a single liability-classified instrument measured at amortized cost. As of December 31, 2019 in accordance with ASC Topic 840 (in thousands):

Year Ending December 31,


2020


$

5,509


2021


4,909


2022


3,204


2023


3,026


2024


2,746


Thereafter


699


Total future minimum lease payments


$

20,093


In accordance with ASC Topic 840, rent expense2023, the unamortized debt discount and debt issuance costs was $7.2$3.7 million and $5.7the net carrying value was $286.8 million. As of December 31, 2022, the unamortized debt discount and debt issuance costs was $6.5 million and the net carrying value was $359.3 million.

The Notes were issued at par value and fees associated with the issuance of these Notes are amortized to interest expense using the effective interest method over the contractual term of the Notes. The interest expense for the years ended December 31, 20192023 and 2018. Certain2022 were $4.3 million and $7.2 million, respectively. The effective interest rate of the Notes is 1.3%.

105


Table of Contents

VROOM, INC.

NOTES TO CONSOLIDATED FINANCIAL STATEMENTS

Securitization Debt of Consolidated VIEs

The securitization debt was issued under UACC's securitization program. The Company elected to account for the securitization debt under the fair value option using the measurement alternative. Fair value adjustments are recorded in "Other loss, net" in the consolidated statements of operations. Refer to Note 17 – Financial Instruments and Fair Value Measurements. For the 2021-1, 2022-2, and 2023-1 securitization transactions, the Company consolidated the VIEs and accounted for these transactions as secured borrowings. Refer to Note 4 – Variable Interest Entities and Securitizations for further discussion.

Upon the issuance of the securitization debt for the 2021-1 and 2023-1 securitization transactions, UACC retained the residual interests. UACC also retains the servicing rights for all finance receivables that were securitized; therefore, it is responsible for the administration and collection of the amounts owed under the contracts. In the first quarter of 2023, UACC waived its servicing fees related to the 2022-2 securitization and subsequently consolidated the 2022-2 trust. The securitization agreements also require certain funds to be held in restricted cash accounts to provide additional collateral for the borrowings or to be applied to make payments on the securitization debt. Restricted cash under the various agreements totaled approximately $28.5 million and $9.0 million as of December 31, 2023 and 2022, respectively.

Wholly owned bankruptcy remote subsidiaries of UACC were formed to facilitate the above asset-backed financing transactions. Bankruptcy remote refers to a legal structure in which it is expected that the applicable entity would not be included in any bankruptcy filing by its parent or affiliates. All of the assets of these subsidiaries have been pledged as collateral for the related debt. None of the assets of these subsidiaries are available to pay other creditors of the Company or its affiliates.

The securitization debt issued is included in “Current portion of long term debt” and "Long term debt, net of current portion" on the consolidated balance sheet. The securitization debt of consolidated VIEs consisted of the following (in thousands):

As of December 31, 2023


Series


Final Scheduled Payment Date


Initial Principal


Contractual Interest Rate


Outstanding Principal


Fair Value


United Auto Credit 2021-1-D


June 10, 2026


$

29,380


1.14

%

$

3,246


$

3,235


United Auto Credit 2021-1-E


June 10, 2026


20,800


2.58

%


20,800


20,540


United Auto Credit 2021-1-F


September 10, 2027


13,910


4.30

%


13,910


13,644


United Auto Credit 2022-2-B


December 10, 2025


30,324


5.41

%


28,786


28,745


United Auto Credit 2022-2-C


May 10, 2027


26,533


5.81

%


26,533


26,331


United Auto Credit 2022-2-D


January 10, 2028


32,889


6.84

%


32,889


32,642


United Auto Credit 2022-2-E


April 10, 2029


33,440


10.00

%


33,440


29,691


United Auto Credit 2023-1-A


July 10, 2025


118,598


5.57

%


15,089


15,083


United Auto Credit 2023-1-B


July 10, 2028


51,157


5.91

%


51,157


51,019


United Auto Credit 2023-1-C


July 10, 2028


33,326


6.28

%


33,326


33,199


United Auto Credit 2023-1-D


July 10, 2028


35,653


8.00

%


35,653


36,152


United Auto Credit 2023-1-E


September 10, 2029


23,256


10.98

%


23,256


23,814


Total rated notes


$

449,266


$

318,085


$

314,095


106


Table of Contents

VROOM, INC.

NOTES TO CONSOLIDATED FINANCIAL STATEMENTS


As of December 31, 2022


Series


Final Scheduled Payment Date


Initial Principal


Contractual Interest Rate


Outstanding Principal


Fair Value


United Auto Credit 2021-1-C


June 10, 2026


$

29,640


0.84

%

$

18,466


$

18,322


United Auto Credit 2021-1-D


June 10, 2026


29,380


1.14

%


29,380


28,481


United Auto Credit 2021-1-E


June 10, 2026


20,800


2.58

%


20,800


19,685


United Auto Credit 2021-1-F


September 10, 2027


13,910


4.30

%


13,910


13,341


$

93,730


$

82,556


$

79,829


The final scheduled payment date represents legal maturity of the remaining balance sheet securitization debt. Securitization debt is expected to become due and to be paid prior to those dates, based on amortization of the finance receivables pledged to the Trusts. Expected payments, which will depend on the performance of such receivables, as to which there can be no assurance, are $147.6 million in 2024, $91.8 million in 2025, $47.8 million in 2026, $26.8 million in 2027 and $4.1 million in 2028.

In February 2024, UACC exercised its option to repurchase the 2021-1 securitization debt for a total redemption price of $35.6 million.

The aggregate principal balance and the fair value of finance receivables pledged to the securitization debt consists of the following (in thousands):


As of December 31,


2023


2022


Aggregate Principal Balance


Fair Value


Aggregate Principal Balance


Fair Value


United Auto Credit 2021-1


$

38,951


$

35,790


$

84,477


$

77,904


United Auto Credit 2022-2


125,072


111,379


United Auto Credit 2023-1


197,586


169,829


Total finance receivables of CFEs


$

361,609


$

316,998


$

84,477


$

77,904


Financing of Beneficial Interests in Securitizations

On May 3, 2023, UACC entered into a Risk Retention Financing Facility enabling it to finance asset-backed securities issued in its securitization transactions and held by UACC pursuant to applicable Risk Retention Rules. Under this facility, UACC sells such retained interests and agrees to repurchase them on a future date. In its initial transaction under this facility, UACC pledged $24.5 million of its retained beneficial interests as collateral, and received proceeds of $24.1 million, with expected repurchase dates ranging from March 2025 to September 2029. The securitization trusts will distribute payments related to UACC's pledged beneficial interests in securitizations directly to the lender, which will reduce the beneficial interests in securitizations and the related debt balance. Pledged collateral levels are monitored and are generally maintained at an agreed-upon percentage of the fair value of the amounts borrowed during the life of the transactions. In the event of a decline in the fair value of the pledged collateral, UACC may be required to transfer cash or additional securities as pledged under this facility. At the termination of this agreement, UACC is obligated to return the amounts borrowed.

The outstanding balance of this facility, net of unamortized debt issuance costs, was $15.4 million as of December 31, 2023, with $8.9 million included in "Current portion of long term debt" and $6.5 million included in "Long-term debt, net of current portion" on the consolidated balance sheet. As of December 31, 2023, the fair value of the collateral pledged under this facility was $15.8 million.

107


Table of Contents

VROOM, INC.

NOTES TO CONSOLIDATED FINANCIAL STATEMENTS

Junior Subordinated Debentures

On July 31, 2003, UACC issued junior subordinated debentures (trust preferred securities) of $10.0 million through a subsidiary, UPFC Trust I. The trust issuer is a 100 percent owned finance subsidiary and the securities are fully and unconditionally guaranteed by Vroom Automotive Finance Corporation. The interest is paid quarterly at a variable rate, equal to SOFR + 3.05%. The final maturity of these securities is on October 7, 2033; however, they can be called at par any time at the Company’s discretion.

14. Commitments and Contingencies

Litigation

From time to time, the Company is involved in various claims and legal actions that arise in the ordinary course of business and an unfavorable resolution of any of these matters could materially affect the Company’s future results of operations, cash flows or financial position. The Company is also party to various disputes that the Company considers routine and incidental to its business. The Company does not expect the results of any of these routine actions to have a material effect on the Company’s business, results of operations, financial condition, or cash flows. The Company accrues a liability when a loss is considered probable and the amount can be reasonably estimated. When a material loss contingency is reasonably possible but not probable, the Company does not record a liability, but instead discloses the nature and the amount of the claim, and an estimate of the loss or range of loss, if such an estimate can be made. Legal fees are expensed as incurred.

Beginning in March 2021, multiple putative class actions were filed in the U.S. District Court for the Southern District of New York by certain of the Company’s lease agreements contain escalation clauses, and accordingly,stockholders against the Company recordsand certain of the rent expenseCompany’s officers alleging violations of federal securities laws. The lawsuits were captioned Zawatsky et al. v. Vroom, Inc. et al., Case No. 21-cv-2477; Holbrook v. Vroom, Inc. et al., Case No. 21-cv-2551; and Hudda v. Vroom, Inc. et al., Case No. 21-cv-3296. All three of the lawsuits asserted similar claims under Sections 10(b) and 20(a) of the Exchange Act, and SEC Rule 10b-5. In each case, the named plaintiff(s) sought to represent a proposed class of all persons who purchased or otherwise acquired the Company’s securities during a period from June 9, 2020 to March 3, 2021 (in the case of Holbrook and Hudda), or November 11, 2020 to March 3, 2021 (in the case of Zawatsky). In August 2021, the Court consolidated the cases under the new name In re: Vroom, Inc. Securities Litigation, Case No. 21-cv-2477, appointed a lead plaintiff and lead counsel and ordered a consolidated amended complaint to be filed. The court-appointed lead plaintiff subsequently filed a consolidated amended complaint that reasserts claims under Sections 10(b) and 20(a) of the Exchange Act, and SEC Rule 10b-5 against the Company and certain of the Company’s officers, and added new claims under Sections 11, 12 and 15 of the Securities Act against the Company, certain of its officers, certain of its directors, and the underwriters of the Company’s September 2020 secondary offering. The Company filed a motion to dismiss all claims, and briefing of this motion is complete. The Company believes this lawsuit is without merit and intends to vigorously contest these claims. While the outcome of any complex legal proceeding is inherently unpredictable and subject to significant uncertainties, based upon information presently known to management, the Company believes that the potential liability, if any, will not have a material adverse effect on the Company’s financial condition, cash flows, or results of operations.

In August 2021, November 2021, January 2022, and February 2022, various Company stockholders filed purported shareholder derivative lawsuits on behalf of the Company in the U.S. District Court for the Southern District of New York against certain of the Company’s officers and directors, and nominally against the Company, alleging violations of the federal securities laws and breaches of fiduciary duty to the Company and/or related violations of Delaware law based on the same general course of conduct alleged in In re: Vroom, Inc. Securities Litigation. All four lawsuits have been consolidated under the case caption In re Vroom, Inc. Shareholder Derivative Litigation, Case No. 21-cv-6933, and the court has approved the parties’ stipulation that the cases would remain stayed pending final resolution of In re: Vroom, Inc. Securities Litigation. All four derivative suits remain in preliminary stages and there have been no substantive developments in any matter.

In April 2022, one of the Company’s stockholders filed a purported shareholder derivative lawsuit on behalf of the Company in the U.S. District Court for the District of Delaware against certain of the Company’s officers and directors, and nominally against the Company, alleging violations of the federal securities law and breaches of fiduciary duty to the Company and/or related violations of Delaware law based on the same general course of conduct alleged in In re: Vroom, Inc. Securities Litigation. The case is captioned Godlu v. Hennessy et al., Case No. 22-cv-569, and the court has

108


Table of Contents

VROOM, INC.

NOTES TO CONSOLIDATED FINANCIAL STATEMENTS

approved the parties’ stipulation that the case would remain stayed pending final resolution of In re: Vroom, Inc. Securities Litigation. This lawsuit remains in preliminary stages and there have been no substantive developments.

In January 2022, the Company received a non-public civil investigative demand from the Federal Trade Commission (“FTC”), seeking the production of information related to certain of the Company's business practices and the Company responded to those information requests. On February 23, 2024, the FTC notified the Company that it has reason to believe that the Company violated Section 5(a) of the Federal Trade Commission Act, 15 U.S.C. § 45(a); the FTC's Mail, Internet, or Telephone Order Merchandise Rule, 16 C.F.R. Part 435; the FTC’s Used Motor Vehicle Trade Regulation Rule,16 C.F.R. Part 455; and the FTC’s Pre-Sale Availability Rule, 16 C.F.R. Part 702. The FTC advised the Company that it is authorized to negotiate a stipulated order and the Company intends to work cooperatively with the FTC towards a resolution. Because the matter is at an early stage and the outcome of any complex legal proceeding is inherently unpredictable and subject to significant uncertainties, the Company cannot determine at present whether any potential liability would have a material adverse effect on the Company’s financial condition, cash flows, or results of operations.

In April 2022, the Attorney General of Texas filed a petition on behalf of the State of Texas in the District Court of Travis County, Texas against the Company, alleging violation of the Texas Deceptive Trade Practices − Consumer Protection Act, Texas Business and Commerce Code § 17.41 et seq., based on alleged deficiencies and other issues in the Company’s marketing of used vehicles and fulfilment of customer orders, including the titling and registration of sold vehicles. According to the petition, 80% of the customer complaints referenced in the petition were received in the 12 months prior to April 2022. The petition is captioned State of Texas v. Vroom Automotive LLC, and Vroom Inc., Case No. D-1-GN-001809. In May 2022, Vroom Automotive, LLC the Attorney General of the State of Texas agreed to a temporary injunction in which Vroom Automotive, LLC agreed to adhere to its existing practice of possessing title for all vehicles it sells or advertises as available for sale on its ecommerce platform. In December 2023, Vroom, Inc., Vroom Automotive, LLC and the Attorney General of the State of Texas reached a final agreement to resolve all claims in the petition, without any admission of wrongdoing by either Vroom entity. Under the agreement, the Company will pay a total of $2 million in civil penalties and $1 million in attorneys' fees, with the first half due in September 2024 and the remaining half due in September 2025, and abide permanently by an injunction of certain operational practices that were previously implemented. The agreement was approved by the District Court of Travis County on December 13, 2023.

In July 2022 and August 2022, respectively, certain plaintiffs filed two putative class action lawsuits in the District Court of Cleveland County, Oklahoma and the New York State Supreme Court, respectively, against Vroom, Inc., and Vroom Automotive LLC as defendants, alleging, among other things, deficiencies in Vroom’s titling and registration of sold vehicles: BlakeSonne, individually and on behalf of all others similar situated, v. Vroom Automotive, LLC and Vroom, Inc., No. CJ-2022-822 and Emely Reyes Martinez, on behalf of all others similarly situated, v. Vroom Automotive, LLC and Vroom Inc., No. 652684/2022. The Company removed the cases to the U.S. District Court for the Western District of Oklahoma (Case No. 22-cv-761) and the U.S. District Court for the Southern District of New York (Case No. 22-cv-7631), respectively, and filed motions to compel arbitration of all claims in both cases. In September 2023, Vroom's motions to compel arbitration were granted in both cases, and the court actions stayed pending the outcome of any arbitration proceeding over the respective plaintiffs' individual claims. On February 9, 2024, the parties filed a joint stipulation to dismiss the Sonne matter with prejudice.

As previously disclosed, the Company has been subject to audits, requests for information, investigations and other inquiries from its regulators relating to increased customer complaints concerning the same or similar matters alleged in the State of Texas petition. These regulatory matters could continue to progress into legal proceedings as well as enforcement actions. The Company has incurred fines in certain states and could continue to incur fines, penalties, restitution, or alterations in the Company's business practices, which in turn, could lead to increased business expenses, additional limitations on the Company's business activities and further reputational damage, although to date such expenses have not had a material adverse effect on the Company’s financial condition, cash flows, or results of operations.

Nasdaq Notice

On December 21, 2023, the Company received written notice from The Nasdaq Stock Market LLC (“Nasdaq”) notifying it that, for the last 30 consecutive business days, the bid price for the Company's common stock had closed

109


Table of Contents

VROOM, INC.

NOTES TO CONSOLIDATED FINANCIAL STATEMENTS

below the $1.00 per share minimum bid price requirement for continued inclusion on the Nasdaq Global Select Market pursuant to Nasdaq Listing Rule 5450(a)(1) (the "Minimum Bid Price Requirement").

On February 13, 2024 after obtaining stockholder approval, the Company effected a 1-for-80 reverse stock split (the "Reverse Stock Split"), and the Company's stock began trading on a straight-linepost-split adjusted basis overon February 14, 2024. On February 29, 2024, the lease term. Deferred rent under ASC Topic ASC 840Company was notified by the Nasdaq Listing Qualifications staff that the closing bid price of its common stock had been at $1.00 per share or greater for 11 consecutive business days, from February 14, 2024 to February 28, 2024. Accordingly, the Company has regained compliance with Nasdaq Listing Rule 5450(a)(1) and this matter is recorded within “Accrued expenses”now closed. If the Company's common stock again closes below the $1.00 per share minimum bid price required by Nasdaq for 30 consecutive business days, the Company would again receive another notice of non-compliance with Nasdaq's listing standards and face the risk of delisting.

All shares of the Company’s common stock, stock-based instruments, and per-share data included in these consolidated financial statements have been retroactively adjusted as though the Reverse Stock Split has been effected prior to all periods presented.

Other Matters

The Company enters into agreements with third parties in the consolidated balance sheet.ordinary course of business that may contain indemnification provisions. In the event that an indemnification claim is asserted, the Company’s liability, if any, would be limited by the terms of the applicable agreement. Historically, the Company has not incurred material costs to defend lawsuits or settle claims related to indemnification provisions.

11. Redeemable Convertible

15. Preferred Stock and Stockholders’ Equity (Deficit)

Redeemable Convertible

Preferred Stock

As of December 31, 2019, the Company had eight outstanding series of redeemable convertible preferred stock (collectively the “Series Preferred”). The Company classified its Series B through H Preferred Stock (collectively the “Senior Preferred Stock”) as temporary equity within the Company’s consolidated balance sheet as of December 31, 2019 because the instruments contained redemption rights. The Company concluded that the Senior Preferred Stock were considered probable of becoming redeemable through November 2019 and therefore recorded accretion to their redemption values of $132.8 million during the year ended December 31, 2019. During December 2019, the Company ceased accretion of the Senior Preferred Stock to their redemption values due to a sufficiently high likelihood of an IPO requiring a conversion of the instruments into common stock.

As of December 31, 2019, the Company classified its Series A Preferred Stock as temporary equity within the Company’s consolidated balance sheets because the instrument contained liquidation features, including a liquidation preference in the event of a deemed liquidation event, that were not solely within the Company’s control. The Company did not adjust the carrying value of the Series A Preferred Stock to its redemption value because it was not probable that the Series A Preferred Stock would become redeemable.

100


Table of Contents

VROOM, INC.

NOTES TO CONSOLIDATED FINANCIAL STATEMENTS

On January 8, 2020, the Company completed an additional closing of its Series H Preferred Stock whereby it sold and issued an aggregate of 1,964,766 shares of Series H Preferred Stock in exchange for gross proceeds of $26.7 million. The proceeds were used for general corporate purposes and business development.

Immediately upon closing of the IPO, the Company’s outstanding preferred stock was automatically converted into an aggregate of 85,533,394 shares of the Company’s common stock. On June 11, 2020, the Company amended its certificate of incorporation to authorize the issuance of up to 10,000,000 shares of Preferred Stock. As of December 31, 2020,2023, there was no preferred stock issued or outstanding.

The authorized, issued and outstanding shares, issue price, conversion price, liquidation preference, and carrying value of the Series Preferred as of December 31, 2019 were as follows:


As of December 31, 2019


(in thousands, except share and per share amounts)


Shares

authorized


Shares

issued and

outstanding


Issue

price


Per share

conversion

price


Liquidation

preference


Carrying

value


Series A


3,983,996


3,983,996


$

1.61


$

1.61


$

6,419


$

6,167


Series B


4,716,484


4,716,484


2.48


2.48


11,709


42,425


Series C


9,134,242


9,134,242


5.93


5.93


54,209


88,739


Series D


14,431,136


14,431,136


6.58


6.58


95,000


142,724


Series E


6,163,792


6,163,792


8.11


8.11


50,000


64,042


Series F


12,705,580


12,115,610


8.53


8.53


103,346


127,820


Series G


16,280,040


16,280,040


8.98


8.98


146,113


174,764


Series H


18,708,094


16,743,328


13.60


13.60


227,651


227,651


86,123,364


83,568,628


$

694,447


$

874,332


Common Stock

On June 11, 2020,February 13, 2024, the Company amended its certificate of incorporation to effect a 2-for-1 forward1-for-80 reverse stock split of shares of the Company’s outstanding common stock, such that each share of common stock, $0.001 par value became twoevery 80 shares of common stock $0.001 par value per share.became one of common stock. The shares of common stock authorized for issuance was increased to 500,000,000.remained unchanged at 500,000,000 and the par value per share of common stock remained unchanged at $0.001. Each share of common stock entitles the holder to one vote on all matters submitted to a vote of the Company’s stockholders.

Warrants

In connection with the offering of shares of Series B Preferred Stock,At-the-market Offering

On December 1, 2023, the Company issued warrantsentered into an equity distribution agreement with Virtu Americas LLC to an investor in return for providing ongoing advisory services (“Series B Warrants”). The Series B Warrants allowed the investor to purchase up to 161,136 shares of common stock with an exercise price of $0.72 per share. The Series B Warrants vested in equal monthly installments through October 1, 2017. Upon the closing of the IPO, all of the Series B Warrants were exercised cashless by the holder which resulted in the net issuance of 155,862sell shares of the Company’s common stock.

In August 2017,stock, par value $0.001 per share, with aggregate gross sales proceeds of up to $50.0 million, from time to time, through an “at-the-market” equity offering program (the "ATM offering"). As of December 31, 2023, the Company issued a warrant (the “Series F Preferred Stock Warrant”) which allowed the holders to purchasehas up to 589,970 shares of$47.5 million remaining in aggregate gross proceeds that can be issued through the Company’s Series F Preferred Stock, or common stock upon conversion of the Company’s preferred stock into common stock, with an exercise price of $8.53 per share. The holders exercised the warrant on June 23, 2020 on a cashless basis, which resulted in the net issuance of 480,250 shares of the Company’s common stock. Prior to the conversion of the Company’s preferred stock into common stock, the Series F Preferred Stock Warrant was classified as a liability due to the contingent redemption features of the Series F Preferred Stock and was measured at fair value at each reporting date. Refer to Note 13 – Financial Instruments and Fair Value Measurements.  ATM offering.

12.

16. Stock-based Compensation

On May 28, 2020, the Company adopted the 2020 Incentive Award Plan (“the 2020 Plan”), which authorized the issuance of (i) up to 3,019,10837,379 shares of the Company’s common stock, (ii) up to 4% of an annual increase on the first day of each year beginning on January 1, 2022 and ending on January 1, 2030 of up to 4% of the shares of common stock outstanding on an as-converted basis on the last day of the immediately preceding fiscal year, and (iii) any shares of the Company’s common stock subject to awards under the 2014 Plan which are forfeited or lapse unexercised and which following the effective date are not issued under the 2014 Plan. Awards may be issuedin the form of restricted stock units, restricted stock, stock

101


Table of Contents

VROOM, INC.

NOTES TO CONSOLIDATED FINANCIAL STATEMENTS

appreciation rights, and stock options. As of December 31, 2023, the Company has registered an additional

110


Table of Contents

VROOM, INC.

NOTES TO CONSOLIDATED FINANCIAL STATEMENTS

137,647 shares of the Company's common stock to be issued pursuant to the 2020 Plan. As of December 31, 2023, there were 3,185,96422,869 shares available for future issuance under the 2020 Plan.

On May 20, 2022, the Company adopted the 2022 Inducement Award Plan (the “Inducement Award Plan”). Awards under the Inducement Award Plan may only be granted to a newly hired employee who has not previously been an employee or a member of the Board or an employee who is being rehired following a bona fide period of non-employment by the Company, in each case as a material inducement to the employee’s entering into employment. An aggregate of 37,500 shares of the Company’s common stock are reserved for issuance under the Inducement Award Plan. As of December 31, 2023, there were 30,668 shares available for future issuance under the Inducement Award Plan.

Stock Options

The following table summarizes stock option activity for the year ended December 31, 2020:2023:


Shares


Weighted

Average

Exercise Price


Weighted

Average

Remaining

Contractual Life


Outstanding as of December 31, 2019


6,340,000


$

3.92


8.22


Granted


420,500


10.46


Exercised


(598,406

)


3.91


Forfeited / cancelled


(544,526

)


4.48


Outstanding as of December 31, 2020


5,617,568


$

4.35


7.33


Vested and exercisable as of December 31, 2019


2,684,160


$

3.58


7.41


Vested and exercisable as of December 31, 2020


3,449,606


$

3.83


6.74


Shares


Weighted
Average
Exercise Price


Weighted
Average
Remaining
Contractual Life


Outstanding as of December 31, 2022


35,715


$

475.74


7.32


Granted


Exercised


Expired


(3,281

)


336.80


Forfeited / cancelled


(6,346

)


387.49


Outstanding as of December 31, 2023


26,088


$

514.72


6.64


Vested and exercisable as of December 31, 2022


16,494


$

378.40


5.71


Vested and exercisable as of December 31, 2023


16,861


$

468.68


5.70


The Company recognized $2.2 million, $2.6$0.8 million and $1.0$1.5 million of stock-based compensation expense related to stock options for the years ended December 31, 2020, 2019,2023 and 2018,2022, respectively. As of December 31, 20202023 and 2019,2022, the Company had $3.5$0.6 million and $5.2$1.6 million, respectively, of unrecognized stock-based compensation expense that is expected to be recognized over a weighted-average period of 2.21.2 years and 2.61.9 years, respectively.

There were no options exercised during the year ended December 31, 2023, and the aggregate intrinsic value of options outstanding and options exercisable as of December 31, 2023 was not material.

On May 9, 2022 and May 20, 2022, 7,500 stock options having a fair value of $66.40 per share were granted to the CEO and an aggregate of 8,125 stock options having a grant date fair value of $91.20 per share were granted to certain members of key management, respectively. The exercise price of the stock options is $600.00 per share. The stock options vest ratably over a three-year period subject to continued employment through each applicable vesting date.

The grant date fair value of stock options granted during the year ended December 31, 20202022 was estimated at the time of grant using the Black-Scholes option-pricing model and utilized the following weighted average assumptions:


May 20, 2022


May 9, 2022


Fair value of common stock (per share)


$

91.20


$

66.40


Expected term (in years)


10


10


Risk-free interest rate


2.78

%


3.05

%

Expected volatility


100.00

%


100.00

%

Dividend yield


—%


—%


Year Ended

December 31, 2020


Fair value of common stock (per share)


$

10.46


Expected term (in years)


5.9 — 6.3


Risk-free interest rate


1.7%


Expected volatility


36.3% — 36.6%


Dividend yield


—%


111


Table of Contents

VROOM, INC.

NOTES TO CONSOLIDATED FINANCIAL STATEMENTS

RSUs

The weighted average fair value of stock options granted during the year ended December 31, 2020 was estimated to be $3.97 per share. The aggregate intrinsic value of options exercised during the year ended December 31, 2020 was $22.4 million, and the aggregate intrinsic value of options outstanding and options exercisable as of December 31, 2020 was $205.7 million and $128.1 million, respectively.

RSUs

The following table summarizes activity for restricted stock units (“RSUs”unit ("RSUs") activity for the year ended December 31, 2020:   2023:


Shares


Weighted Average

Grant Date Fair

Value per Share


Unvested and outstanding as of December 31, 2019


408,000


$

4.01


Granted


2,073,006


12.06


Vested


(237,334

)


3.86


Forfeited / cancelled


(8,230

)


11.86


Unvested and outstanding as of December 31, 2020


2,235,442


$

11.46


Shares


Weighted Average
Grant Date Fair
Value per Share


Unvested and outstanding as of December 31, 2022


108,268


$

259.37


Granted


110,365


73.10


Vested and released


(20,278

)


468.31


Forfeited / cancelled


(23,089

)


213.51


Outstanding as of December 31, 2023


175,266


$

124.33


Vested and exercisable


(1,152

)


84.80


Unvested and outstanding as of December 31, 2023


174,114


$

124.59


The Company recognized $10.9$9.2 million, $0.1$10.5 million, and $0.1$11.2 million of stock-based compensation expense related to RSUs for the years ended December 31, 2020, 2019,2023 and 2018,2022, respectively. As of December 31, 20202023 and 2019,2022, the Company had $15.4$12.1 million and $1.3$18.2 million, respectively, of unrecognized stock-based compensation expense that is expected to be recognized over a weighted-average period of 1.81.6 and 1.9 years, respectively.

On May 9, 2022, 15,000 RSUs having a grant date fair value of $86.40 per share were granted to the CEO and 2.4on May, 20, 2022, an aggregate of 39,875 RSUs having a grant date fair value of $116.00 per share were granted to certain members of the management team. On July 25, 2022, 1,750 RSUs having a grant date fair value of $131.20 per share were granted to a member of the management team. The RSUs were issued under the 2020 Plan and will vest on the third anniversary of the grant date, subject to continued employment through that date. The vesting of the RSUs will accelerate in one-third increments if the Company's common stock achieves a closing price at or above $600.00 per share for twenty consecutive trading days during the three-year vesting period; a closing price at or above $1,200.00 per share for twenty consecutive trading days in the second or third years respectively.  of the vesting period; and a closing price at or above $1,680.00 per share for twenty consecutive trading days during the third year of the vesting period. As of December 31, 2023, the accelerated vesting conditions were not met.

102


Table of Contents

VROOM, INC.

NOTES TO CONSOLIDATED FINANCIAL STATEMENTS

As a result of completing its IPO in June 2020, the Company commenced the recognition of compensation expense for 510,278 RSUs that vest upon the occurrence of a liquidity event, which includes an IPO, and continuous service that generally ranges from 12 to 48 months.

In February 2020, the Company granted 367,782 RSUs to its chief executive officer that vest upon the achievement of performance-based conditions, which includes Revenue and EBITDA targets for fiscal year 2022, and the achievement of a liquidity event, which includes a change of control or an IPO. As a result of completing its IPO in June 2020, and the probability of achieving the performance-based conditions, the Company commenced recognition of compensation expense.

Certain of the Company’s RSU grants are subject to acceleration upon a change of control and termination within 12 months, and upon death, disability, retirement and certain “good leaver” circumstances.

RSAs

During the years ended December 31, 2014 and 2015, the Company granted awards of 4,751,874 shares of restricted common stock (the “RSAs”).

The following table summarizes the activity related to the Company’s RSAs for the year ended December 31, 2020:

Shares

Unvested at December 31, 2019

272,868

Vested

(272,868

)

Unvested at December 31, 2020

For the years ended December 31, 2020, 2019, and 2018, the expense related to the RSAs was $0.2 million, $0.0 million and $0.1 million, respectively. As of December 31, 2020, there was no remaining unrecognized stock-based compensation expense related to the RSAs.

13.17. Financial Instruments and Fair Value Measurements

U.S. GAAP defines fair value as the price that would be received from selling an asset or paid to transfer a liability in the principal or most advantageous market for the asset or liability in an orderly transaction between market participants at the measurement date. These estimates are subjective in nature and involve uncertainties and matters of judgment, and therefore cannot be determined with precision. U.S. GAAP establishes a fair value hierarchy which requires an entity to maximize the use of observable inputs and minimize the use of unobservable inputs when measuring fair value and establishes the following three levels of inputs that may be used to measure fair value:

Level 1—Quoted prices in active markets for identical assets or liabilities

Level 2—Observable inputs other than Level 1 prices such as quoted prices for similar assets or liabilities; quoted market prices in markets that are not active; or model-derived valuations or other inputs that are observable or can be corroborated by observable market data for substantially the full term of the assets or liabilities

Level 3—Unobservable inputs that are supported by little or no market activity and that are significant to the fair value of the assets or liabilities

103


Table of Contents

VROOM, INC.

NOTES TO CONSOLIDATED FINANCIAL STATEMENTS

Items Measured at Fair Value on a Recurring Basis

The Company holds certain financial assets that are required to be measured at fair value on a recurring basis. Additionally, the Company elected the fair value option for the financial assets and liabilities of UACC’s consolidated CFEs, beneficial interests in the 2022-1 securitization transaction, certain of UACC’s finance receivables that are ineligible

112


Table of Contents

VROOM, INC.

NOTES TO CONSOLIDATED FINANCIAL STATEMENTS

to be sold as of the Acquisition Date, and certain other finance receivables. Under the fair value option allowable under ASC 825, “Financial Instruments” (“ASC 825”), the Company may elect to measure at fair value financial assets and liabilities that are not otherwise required to be carried at fair value. Subsequent changes in fair value for designated items are reported in earnings.

The following tables present the Company’s financial assets and liabilities measured at fair value on a recurring basis (in thousands):


As of December 31, 2023


Level 1


Level 2


Level 3


Total


Financial Assets


Cash and cash equivalents:


Money market funds


$

80


$


$


$

80


CFE assets:


     Finance receivables


316,998


316,998


Finance receivables at fair value


31,672


31,672


Beneficial interests in securitizations


4,485


4,485


Total financial assets


$

80


$

4,485


$

348,670


$

353,235


Financial Liabilities


CFE liabilities:


     Securitization debt of consolidated VIEs


314,095


314,095


Total financial liabilities


$


$

314,095


$


$

314,095


As of December 31, 2022


Level 1


Level 2


Level 3


Total


Financial Assets


Cash and cash equivalents:


Money market funds


$

182,687


$


$


$

182,687


CFE assets:


     Finance receivables


77,904


77,904


Finance receivables at fair value


75,270


75,270


Beneficial interests in securitizations


20,592


20,592


Total financial assets


$

182,687


$

20,592


$

153,174


$

356,453


Financial Liabilities


CFE liabilities:


     Securitization debt of consolidated VIEs


79,829


79,829


Total financial liabilities


$


$

79,829


$


$

79,829


Valuation Methodologies of Financial Instruments Measured at Fair Value on a Recurring Basis

The following is a description of the valuation methodologies used for financial instruments carried at fair value. These methodologies are applied to financial assets and liabilities across the fair value levels discussed above, and it is the observability of the inputs used that determines the appropriate level in the fair value hierarchy for the respective asset or liability.

Money Market Funds: Money market funds primarily consist of investments in highly liquid U.S. treasury securities, with original maturities of three months or less and are classified as Level 1. The Company determines the fair value of cash equivalents based on quoted prices in active markets.

Financial assets and liabilities of CFEs: The Company elected the fair value option for the assets and liabilities of its consolidated VIEs related to securitization transactions that were deemed to be CFEs.

In accordance with ASC 825, the Company has elected the fair value option, for the eligible financial assets and liabilities of the 2021-1, 2022-2, and 2023-1 consolidated CFEs in order to mitigate potential accounting mismatches between the carrying value of the financial assets and liabilities. To eliminate potential measurement differences, the

`


As of December 31, 2020


Level 1


Level 2


Level 3


Total


Financial Assets


Cash and cash equivalents:


Money market funds


$

814,681


$


$


$


Total financial assets


$

814,681


$


$


$


`


As of December 31, 2019


Level 1


Level 2


Level 3


Total


Financial Assets


Cash and cash equivalents:


Money market funds


$

70,059


$


$


$


Total financial assets


$

70,059


$


$


$


Financial Liabilities


Other long-term liabilities:


Series F Preferred Stock Warrant


1,403


1,403


Total financial liabilities


$


$


$

1,403


$

1,403


113


Table of Contents

VROOM, INC.

NOTES TO CONSOLIDATED FINANCIAL STATEMENTS

Company elected the measurement alternative included in ASU 2014-13, allowing the Company to measure both the financial assets and liabilities of a qualifying CFE using the fair value of either the CFE’s financial assets or liabilities, whichever is more observable. Under the measurement alternative prescribed by ASU 2014-13, the Company recognizes changes in the CFE’s net assets, including changes in fair value adjustments and net interest earned, in its consolidated statements of operations.

The Company is required to determine whether the fair value of the financial assets or the fair value of the financial liabilities of the eligible CFEs are more observable, but in either case, the methodology results in the fair value of the financial assets of the securitization trust being equal to the fair value of their liabilities. The Company determined that the fair value of the liabilities of the securitization CFEs are more observable, since market prices of their liabilities are based on non-binding quoted prices provided by broker dealers who make markets in similar financial instruments. The assets of the securitization CFEs are not readily marketable, and their fair value measurement requires information that may be limited in availability.

In determining the fair value of the securitization debt of consolidated CFEs, the broker dealers consider contractual cash payments and yields expected by market participants. Broker dealers also incorporate common market pricing methods, including a spread measurement to the treasury curve or interest rate swap curve as well as underlying characteristics of the particular security including ratings, coupon, collateral type and seasoning or age of the security. When the Company obtains prices from multiple broker dealers for the same security and has a consensus among them, it deems these fair values to be based on observable valuation inputs and classified as Level 2 of the fair value hierarchy. Where a third-party broker dealer quote is not available, an internal model is utilized using unobservable inputs or if the Company has multiple quotes that are not within determined range, it classified the securitization debt as Level 3 of the fair value hierarchy.

The financial assets of the consolidated CFEs are an aggregate value derived from the fair value of the CFEs liabilities. The Company determined that CFEs finance receivables in their entirety should be classified as Level 3 of the fair value hierarchy.

Finance receivables at fair value: Finance receivables at fair value represent finance receivables for which the Company elected the fair value option in accordance with ASC 825. These receivables primarily relate to finance receivables that the Company does not intend to sell in the immediate future due to various factors such as: delinquencies, bankruptcy, etc. The Company estimates the fair value of these receivables using a discounted cash flow model and incorporates key inputs that include performance rate, default rate, recovery rate, and weighted average coupon rates, as well as certain macroeconomics events the Company believes market participants would consider relevant.

Beneficial interests in securitization: Beneficial interests in securitization relate to the 2022-1 securitization completed in February 2022 and include rated notes as well as certificates. The beneficial interests in the 2022-2 securitization completed in July 2022 were eliminated upon consolidation of the VIE in March 2023. Refer to Note 4 – Variable Interest Entities and Securitizations. The Company elected the fair value option on its beneficial interests in securitization.

Beneficial interests may initially be classified as Level 2 if the transactions occur within close proximity to the end of each respective reporting period. Subsequently, similar to the securitization debt described above, fair value is determined by requesting a non-binding quote from broker dealers, or by utilizing market acceptable valuation models, such as discounted cash flows. Broker dealer quotes may be based on an income approach, which converts expected future cash flows to a single present value amount, with specific consideration of inputs relevant to particular security types. Such inputs may include ratings, collateral types, geographic concentrations, underlying loan vintages, delinquencies and defaults, loss severity assumptions, prepayments, and weighted average coupons and maturities. When the volume or level of market activity for a security is limited, certain inputs used to determine fair value may not be observable in the market. Broker dealer quotes may also be based on a market approach that considers recent transactions involving identical or similar securities. When the Company obtains prices from multiple broker dealers for the same security and has a consensus among them, it deems these fair values to be based on observable valuation inputs and classified as Level 2 of the fair value hierarchy. Where a third-party broker dealer quote is not available, the Company utilizes an internally developed model using unobservable inputs. If internally developed models are utilized or if the

114


Table of Contents

VROOM, INC.

NOTES TO CONSOLIDATED FINANCIAL STATEMENTS

Company has multiple quotes that are not within a consensus range of each other, the Company deems these securities to be classified as Level 3 of the fair value hierarchy.

Changes in Level 3 Recurring Fair Value Measurements

The following table presents a reconciliation of the Series F Preferred Stock Warrant,financial assets, which waswere measured at fair value on a recurring basis using Level 3 inputs (in thousands):


Series F Preferred

Stock Warrant


Balance as of December 31, 2019


$

1,403


Change in fair value


20,470


Conversion to common stock warrant


(21,873

)

Balance as of December 31, 2020


$


Finance Receivables of Consolidated CFEs


Finance Receivables at Fair Value


Fair value as of January 1, 2023


$

77,904


$

75,270


Reclassification of finance receivables held for sale to finance receivables at fair value


248,081


Transfer within Level 3 categories


23,338


(23,338

)

Consolidation of VIEs


180,706


Losses included in other income


(86,331

)


(1,683

)

Issuances, net of discount


3,392


Paydowns


(151,032

)


(23,716

)

Other


24,332


1,747


Fair value as of December 31, 2023


$

316,998


$

31,672


Finance Receivables of Consolidated CFEs


Finance Receivables at Fair Value


Securitization Debt of Consolidated CFEs


Fair value as of January 1, 2022


$


$


$


Acquired in business combination


262,644


34,283


275,394


Transfer out of Level 3


(275,394

)

Transfer within Level 3 categories


(51,330

)


51,330


Losses included in other income


(29,825

)


(14,388

)


Issuances, net of discount


56,484


Sales


(24,312

)


(14,114

)


Paydowns


(90,410

)


(41,980

)


Other


11,137


3,655


Fair value as of December 31, 2022


$

77,904


$

75,270


$


PriorDuring the year ended December 31, 2023, $180.7 million of finance receivables related to the closing2022-2 securitization transaction were consolidated and classified as Level 3 and $248.1 million of finance receivables held for sale related to the IPO on June 11, 2020 and the related conversion2023-1 securitization transaction were reclassified to Level 3 finance receivables of the Company’s preferred stock into common stock, the Company estimatedconsolidated CFEs.

The Company's transfers between levels of the fair value hierarchy are assumed to have occurred at the beginning of the Series F Preferred Stock Warrant basedreporting period on a quarterly basis, except for assets and liabilities acquired during the Black-Scholes option-pricingprior period as described below.

During the year ended December 31, 2022, transfers out of Level 3 liabilities related to securitization debt of consolidated CFEs. The transfer out of Level 3 was the result of achieving consensus pricing from third-party broker dealers who utilize market observable inputs to price the liabilities. Upon acquisition, the Company utilized unobservable pricing information and an internal discounted cash flows model to value the CFEs liabilities. The Company obtained consensus broker dealers quotes as of December 31, 2022. For the CFEs liabilities acquired during the period, the transfer was presumed to occur immediately after the Acquisition Date.

115


Table of Contents

VROOM, INC.

NOTES TO CONSOLIDATED FINANCIAL STATEMENTS

Other Relevant Data for Financial Assets and Liabilities for which utilizedFVO Was Elected

The following table presents the value of shares soldgains or losses recorded in "Other loss (income), net" in the Company’s latest preferred stock financing and allocatedconsolidated statements of operations related to the estimated equityeligible financial instruments for which the fair value ofoption was elected (in thousands):


Year Ended December 31,


2023


2022


Financial Assets


     Finance receivables of CFEs


$

75,064


$

24,231


     Finance receivables at fair value


(2,103

)


11,624


     Beneficial interests in securitizations


1,103


1,149


Financial Liabilities


Debt of securitized VIEs


(5,635

)


(2,727

)

Total net loss included in "Other loss (income), net"


$

68,429


$

34,277


The following table presents other relevant data related to the Company to each class of the Company’s outstanding securities using an option-pricing back-solve model. Upon the closing of the IPO, the Series F Preferred Stock Warrant converted into a common stock warrant and the warrant liability was remeasuredfinance receivables carried at fair value for(in thousands):

As of December 31, 2023


Finance Receivables of CFEs at Fair Value


Finance Receivables at Fair Value


Aggregate unpaid principal balance included within finance receivables that are reported at fair value


$

361,609


$

36,207


Aggregate fair value of finance receivables that are reported at fair value


$

316,998


$

31,672


Unpaid principal balance of receivables within finance receivables that are reported at fair value and are on nonaccrual status (90 days or more past due)


$

6,700


$

717


Aggregate fair value of receivables carried at fair value that are on nonaccrual status (90 days or more past due)


$

5,921


$

544


As of December 31, 2022


Finance Receivables of CFEs at Fair Value


Finance Receivables at Fair Value


Aggregate unpaid principal balance included within finance receivables that are reported at fair value


$

84,477


$

89,068


Aggregate fair value of finance receivables that are reported at fair value


$

77,904


$

75,270


Unpaid principal balance of receivables within finance receivables that are reported at fair value and are on nonaccrual status (90 days or more past due)


$

1,097


$

1,499


Aggregate fair value of receivables carried at fair value that are on nonaccrual status (90 days or more past due)


$

985


$

1,311


All finance receivables of CFEs are pledged to the last time based on the quoted priceCFEs trusts.

The following table presents other relevant data related to securitization debt of the Company’s publicly traded common stock. On June 23, 2020, the holders exercised the Series F Preferred Stock Warrant.consolidated VIEs carried at fair value (in thousands):

As of December 31, 2023


Securitization debt of consolidated VIEs at Fair Value


Aggregate unpaid principal balance of rated notes of securitized VIEs


$

318,085


Aggregate fair value of rated notes of securitized VIEs


$

314,095


As of December 31, 2022


Securitization debt of consolidated VIEs at Fair Value


Aggregate unpaid principal balance of rated notes of securitized VIEs


$

82,556


Aggregate fair value of rated notes of securitized VIEs


$

79,829


116


Table of Contents

VROOM, INC.

NOTES TO CONSOLIDATED FINANCIAL STATEMENTS

Fair Value of Financial Instruments Not Carried at Fair Value

The carrying amounts of restricted cash, accounts receivable, accounts payable and accrued liabilities approximate fair value due to their short-term nature. The carrying value of the 20202022 Vehicle Floorplan Facility and the Warehouse Credit Facilities was determined to approximate fair value due to its short-term duration and variable interest rate that approximates prevailing interest rates as of each reporting period.

14.

Finance receivables held for sale, net: For finance receivables eligible to be sold in a securitization, the Company determines the fair value of these finance receivables utilizing sales prices based on estimated securitization transactions, adjusted for transformation costs, risk and a normal profit margin associated with securitization transactions. Such fair value measurement of finance receivables held for sale, net is considered Level 3 of the fair value hierarchy. As of December 31, 2023, the Company determined that all of these finance receivables should be marked to their fair value of $468.8 million based on the results of the Company's lower of amortized cost basis or fair value analysis. As of December 31, 2022, the carrying value and fair value of the finance receivables held for sale, net were $299.2 million and $299.9 million, respectively.

In addition, from time to time the Company may mark certain receivables, that are no longer eligible to be sold in a securitization, classified as held for sale to fair value on a non-recurring basis. As of December 31, 2023 and 2022, there were $34.8 million and $22.4 million of these finance receivables that were marked to fair value on a non-recurring basis, respectively. These are finance receivables that became delinquent and no longer meet the expected securitization sales criteria. The Company uses a discounted cash flow model to estimate the present value of future recoveries for finance receivables. Such fair value measurement of finance receivables held for sale, net is considered Level 3 of the fair value hierarchy.

Convertible Senior Notes:The fair value of the Notes, which are not carried at fair value on the accompanying consolidated balance sheets, was determined utilizing actual bids and offer prices of the Notes in markets that are not active and are classified within Level 2 of the fair value hierarchy.


December 31,


2023


2022


Carrying value


$

286,800


$

359,254


Fair value


$

152,506


$

128,026


Financing of beneficial interests in securitizations: The fair value of the financing of beneficial interests in securitizations, which are not carried at fair value on the accompanying consolidated balance sheets, approximated their carrying value as of December 31, 2023 and are classified within Level 3 of the fair value hierarchy.

Junior Subordinated Debentures: The fair value of the junior subordinated debentures, which are not carried at fair value on the accompanying consolidated balance sheets, approximated their carrying value as of December 31, 2023 and 2022 and are classified within Level 3 of the fair value hierarchy.

Fair Value of Financial Instruments on a Nonrecurring Basis

Assets and liabilities acquired as part of a business combination and goodwill attributable to each of the Company's reporting units are recorded at fair value on a nonrecurring basis. Refer to Note 5 – Acquisition and Note 8 – Goodwill and Intangible Assets for additional information.

18. Restructuring Activities

On May 5, 2022, the Company approved the Realignment Plan, which was designed to position the Company for long-term profitable growth by prioritizing unit economics, reducing operating expenses and maximizing liquidity.

In connection with the Realignment Plan, the Company reduced headcount across the organization and closed its New York City, Detroit, and one of its Houston office locations as well as several Sell Us Your Car® center facilities. Additionally, the Company streamlined TDA's operations and closed its service center. The service center was

117


Table of Contents

VROOM, INC.

NOTES TO CONSOLIDATED FINANCIAL STATEMENTS

repurposed to replace the reconditioning facility in Stafford, Texas, which was also closed. The Company also restructured its network of logistics hubs in order to align with reduced unit volume and its regional operating model.

The restructuring activities associated with the Realignment Plan were substantially completed during 2022.

On January 18, 2023, the Company executed a reduction-in-force as part of the continued focus on reducing variable and fixed costs. The Company reduced Vroom’s headcount by approximately 275 employees based on the assessment of the Company's business needs, key initiatives, and long-term success and profitable growth. For the year ended December 31, 2023, the Company incurred expenses of approximately $4.1 million, primarily consisting of severance.

On April 26, 2023, as part of the Company’s ongoing reexamination of all facets of the business, the Company implemented an organizational restructuring that included a reduction-in-force. The Company reduced Vroom’s headcount by approximately 120 employees and incurred total expenses of approximately $2.3 million for the year ended December 31, 2023, primarily consisting of severance costs, as a result of this reduction-in-force.

The following table summarizes the components of the restructuring and related charges:


Year Ended December 31,


Total Charges Incurred to Date


2023


2022


Charges by activity:


   Severance and termination benefits (1)


$

6,703


$

7,358


$

14,061


   Impairment of operating lease right-of-use assets (2)


6,491


6,491


   Other costs (3)


1,176


1,176


Total restructuring and related charges


$

6,703


$

15,025


$

21,728


(1) Severance and termination costs consist of severance costs provided to employees who have been terminated as well outplacement costs and COBRA benefits.

(2) Impairment of operating lease right-of-use assets consist of costs associated with planned facility closures that will continue to be incurred under the contract for its remaining term without economic benefit to the Company.

(3) Other costs incurred to date consist of legal expenses incurred in connection with the Realignment Plan and acceleration of depreciation of property and equipment related to the planned facility closures.

Severance and termination benefits and other costs are included in "Selling, general, and administrative expenses" and impairment of operating lease right-of-use assets are included in "Impairment charges" in the consolidated statements of operations for the years ended December 31, 2023 and 2022.

The following table is a reconciliation of the beginning and ending restructuring liability for the years ended December 31, 2023 and 2022:

Balance as of December 31, 2021


$


   Accrual and accrual adjustments


7,941


   Cash payments


(7,131

)

Balance as of December 31, 2022


$

810


   Accrual and accrual adjustments


6,703


   Cash payments


(7,440

)

Balance as of December 31, 2023


$

73


The restructuring liability for severance and termination benefits is reflected in "Accrued Expenses" in the consolidated balance sheet as of December 31, 2023 and 2022.

19. Segment Information

The Company has three reportable segments: Ecommerce, Wholesale, and TDA.Retail Financing. No operating segments have been aggregated to form the reportable segments.

118


Table of Contents

VROOM, INC.

NOTES TO CONSOLIDATED FINANCIAL STATEMENTS

As a result of the Value Maximization Plan and the wind-down of the ecommerce operations, the Company will discontinue reporting its results through the Ecommerce and Wholesale segments starting in the first quarter of 2024.

The Company determined its operating segments based on how the chief operating decision maker (“CODM”) reviews the Company’s operating results in assessing performance and allocating resources. The CODM reviews revenue and gross profit for each of the reportable segments. Gross profit is defined as revenue less cost of sales incurred by the segment. The CODM does not evaluate operating segments using asset information as these are managed on an enterprise wideenterprise-wide group basis. Accordingly, the Company does notnot report

104


Table of Contents

VROOM, INC.

NOTES TO CONSOLIDATED FINANCIAL STATEMENTS

segment asset information. As of December 31, 2020, 2019,2023 and 2018, the Company did not have any2022, long-lived assets were predominantly located outside ofin the United States.

The Ecommerce reportable segment represents retail sales of used vehicles through the Company’s ecommerce platform, and feesrevenue earned on vehicle financing originated by UACC or the Company's third-party financing sources and sales of value-added products associated with those vehiclevehicles sales. The Wholesale reportable segment represents sales of used vehicles through wholesale channels. The TDARetail Financing reportable segment represents UACC’s operations with its network of third-party dealership customers, including the purchases and servicing of vehicle installment contracts. Revenues within the "All Other" category consist of retail sales of used vehicles from TDA and fees earned on sales of value-added products associated with those vehicle sales.vehicles sales and the CarStory business.

Information about the Company’s reportable segments are as follows (in thousands):


Year Ended December 31, 2023


Ecommerce


Wholesale


Retail Financing


All Other


Total


Revenues from external customers


$

576,170


$

104,119


$

156,938


$

55,976


$

893,203


Gross profit


$

59,231


$

(34,353

)


$

125,610


$

11,459


$

161,947


Year Ended December 31, 2022


Ecommerce


Wholesale


Retail Financing


All Other


Total


Revenues from external customers


$

1,364,195


$

293,528


$

152,542


$

138,636


$

1,948,901


Gross profit


$

99,973


$

(10,620

)


$

138,381


$

17,053


$

244,787


Year Ended December 31, 2020


Ecommerce


Wholesale


TDA


Consolidated


Revenues from external customers


$

915,451


$

245,580


$

196,669


$

1,357,700


Gross profit (loss)


$

60,861


$

(1,432

)


$

12,116


$

71,545


Year Ended December 31, 2019


Ecommerce


Wholesale


TDA


Consolidated


Revenues from external customers


$

588,114


$

213,464


$

390,243


$

1,191,821


Gross profit


$

32,127


$

340


$

25,392


$

57,859


Year Ended December 31, 2018


Ecommerce


Wholesale


TDA


Consolidated


Revenues from external customers


$

301,172


$

174,514


$

379,743


$

855,429


Gross profit


$

22,425


$

3,257


$

35,125


$

60,807


The reconciliation between reportable segment gross profit to consolidated loss before provision for income taxes is as follows (in thousands):


Year Ended
December 31,


2023


2022


Reconciliation to consolidated total revenue


Total reportable segment revenue


$

837,227


$

1,810,265


All Other revenues


55,976


138,636


Consolidated total revenue


$

893,203


$

1,948,901


Reconciliation to consolidated loss before (benefit) provision for income taxes


Total reportable segment gross profit


$

150,488


$

227,734


All Other gross profit


11,459


17,053


Selling, general and administrative expenses


340,657


566,387


Depreciation and amortization


42,769


38,290


Impairment charges


48,748


211,873


Gain on debt extinguishment


(37,878

)


(164,684

)

Interest expense


45,445


40,693


Interest Income


(21,158

)


(19,363

)

Other loss, net


108,289


43,181


Consolidated loss before provision (benefit) for income taxes


$

(364,925

)


$

(471,590

)


Year Ended

December 31,


2020


2019


2018


Segment gross profit


$

71,545


$

57,859


$

60,807


Selling, general and administrative expenses


245,546


184,988


133,842


Depreciation and amortization


4,598


6,019


6,857


Interest expense


9,656


14,596


8,513


Interest Income


(5,896

)


(5,607

)


(3,135

)

Revaluation of preferred stock warrant


20,470


769


174


Other income, net


(114

)


(96

)


(495

)

Loss before provision for income taxes


$

(202,715

)


$

(142,810

)


$

(84,949

)

105119


Table of Contents

VROOM, INC.

NOTES TO CONSOLIDATED FINANCIAL STATEMENTS

15.

20. Income Taxes

Income Tax Provision

Domestic and foreign pretax income (loss) are as follows for the years ended December 31, 2023 and 2022 (in thousands):


Year Ended
December 31,


2023


2022


Domestic


$

(365,520

)


$

(472,203

)

Foreign


595


613


Total


$

(364,925

)


$

(471,590

)

The components of the provision for income taxes are as follows for the years ended December 31, 2020, 2019, and 2018 (in thousands):


Year Ended

December 31,


Year Ended
December 31,


2020


2019


2018


2023


2022


Current:


Federal


$


$


$


$


$


State and local


84


168


229


526


4,083


Foreign


89


92


Total current tax expense


84


168


229


615


4,175


Deferred tax (benefit):


Federal


(20,472

)

State and local


(3,383

)

Foreign


Total deferred tax (benefit)


(23,855

)

Provision for income taxes


$

84


$

168


$

229


Provision (benefit) for income taxes


$

615


$

(19,680

)

Pretax lossOn August 16, 2022, the Inflation Reduction Act of 2022 ("IRA") was signed into law. The IRA includes implementation of a new alternative minimum tax, an excise tax on stock buybacks, and significant tax incentives for all periods presented were classified as Domestic.energy and climate initiatives, among other provisions. The Company evaluated the provisions included under the IRA and the provisions do not have a material impact to the Company's consolidated financial statements.

Tax Rate Reconciliation

The Company’s effective tax rate for the years ended December 31, 2020, 2019,2023 and 20182022 was (0.04)(0.17)%, (0.12)%, and (0.27)4.17%, respectively. The increase in effective tax rate for the year ended December 31, 2022 was primarily driven by a deferred tax benefit recorded for the decrease of Valuation Allowance resulting from the acquisition of Unitas Holdings Corp. (now known as Vroom Finance Corporation) that occurred during the December 31, 2022 period, of $23.9 million.

120


Table of Contents

VROOM, INC.

NOTES TO CONSOLIDATED FINANCIAL STATEMENTS

A reconciliation of the provision for income taxes at the statutory rate to the amount reflected in the consolidated statements of operations is as follows (in thousands):


Year Ended

December 31,


Year Ended
December 31,


2020


2019


2018


2023


2022


Income taxes at statutory rate


$

(42,570

)


$

(29,990

)


$

(17,839

)


$

(76,657

)


$

(99,034

)

State income taxes, net of federal benefit


(5,417

)


(1,096

)


180


(23,718

)


(3,529

)

Foreign Rate Differential


(36

)


(129

)

Permanent differences


1,264


772


229


1,550


1,510


Goodwill impairment


41,241


Deferred tax adjustment for acquisition of business


(23,855

)

Change in valuation allowance


46,901


30,051


17,756


99,926


66,634


Other


(94

)


431


(97

)


(450

)


(2,518

)

Provision for income taxes


$

84


$

168


$

229


Provision (benefit) for income taxes


$

615


$

(19,680

)

Deferred Tax Assets (Liabilities)

The Company computes income taxes using the liability method. This method requires recognition of deferred tax assets and liabilities, measured by enacted rates, attributable to temporary differences between the financial statements and the income tax basis of assets and liabilities. In assessing the realizability of deferred tax assets, the Company considers whether it is more likely than not that certain deferred tax assets will be realized. The ultimate realization of deferred tax assets is dependent upon the generation of future taxable income in those specific jurisdictions prior to the dates on which such net operating losses expire. The Company maintained a full valuation allowance against its net deferred tax assets for December 31, 2020 and 2019 because the Company has determined that it is it more likely than not that these assets will not be fully realized based on a current evaluation of expected future taxable income and the Company isbeing in a cumulative 3-year loss position. As of December 31, 20202023, 2022, and 20192021, the Valuation Allowancevaluation allowance balance was $121.9$358.7 million, $258.8 million and $75.0$216.0 million, respectively. The Valuation Allowance was $44.9 million and $27.5 million as of December 31, 2018 and January 1, 2018, respectively.

106


Table of Contents

VROOM, INC.

NOTES TO CONSOLIDATED FINANCIAL STATEMENTS

Significant components of the Company’s deferred tax assets and liabilities are as follows (in thousands):


As of December 31,


2023


2022


Deferred tax assets:


   Net operating loss carryforwards


$

365,841


$

265,927


   Inventory reserves


9,758


9,395


   Stock-based compensation


2,169


3,067


   Depreciation


3,729


   Lease Liability


8,829


7,086


   Unrealized Gains/Losses


3,636


10,549


   Allowance for Doubtful Accounts


1,765


8,342


   Other


2,441


2,612


Total deferred tax assets


398,168


306,978


Less: valuation allowance


(358,722

)


(258,796

)

   Net deferred tax assets


39,446


48,182


Deferred tax liabilities:


   Intangible amortization


(32,687

)


(37,377

)

   Depreciation


(3,017

)

   Repo Expenses


(4,966

)


(2,194

)

   Right of Use Asset


(1,793

)


(5,594

)

Net deferred tax liabilities


(39,446

)


(48,182

)

   Net deferred income taxes


$


$


As of December 31,


2020


2019


Deferred tax assets:


Net operating loss carryforwards


$

102,252


$

66,879


Inventory reserves


12,409


5,911


Stock-based compensation


3,119


840


Accrued Expense


1,456


867


Depreciation


114


Right of Use Asset


4,175


Allowance for Doubtful Accounts


1,809


173


Other


836


423


Total deferred tax assets


126,056


75,207


Less: valuation allowance


(121,859

)


(74,959

)

Net deferred tax assets


4,197


248


Deferred tax liabilities:


Intangible amortization


(225

)


(248

)

Depreciation


(29

)


Lease Liability


(3,943

)


Net deferred tax liabilities


(4,197

)


(248

)

Net deferred income taxes


$


$


121


Table of Contents

VROOM, INC.

NOTES TO CONSOLIDATED FINANCIAL STATEMENTS

Net Operating Losses

As of December 31, 2020,2023, the Company had total net operating loss carryforwards for U.S. federal income tax purposes of $462.1$1,504.9 million, of which $126.2$168.5 million expire from 20342028 through 20372042 and $335.9$1,336.4 million do not expire. The Company has net operating loss carryforwards for state income tax purposes of $78.7$767.8 million, which expire from 2034 through 2040.2042.

The Company is subject to tax in the United States and many state and local jurisdictions. The Company, with certain exceptions, is no longer subject to income tax examinations by U.S. federal, state and local for tax years 20152017 and prior. The company is not currently under audit for any US federal or state income tax audits.

The Internal Revenue Code (IRC) Section 382 provides for a limitation of the annual use of net operating loss and tax credit carryforwards following certain ownership changes (as defined by the IRC Section 382) that limits the Company’s ability to utilize these carryforwards. The Company completed a Section 382 study to determine the applicable limitation, if any. It was determined that the Company has undergone three ownership changes. There werefour ownership changes in July 2013, November 2014 and July 2015the most recent of which was April 2021. These changes will substantially limit the use of the net operating losses generated before the change in control.

The Company is still evaluating to see if the shareholder lock-up period expiration in December 2020 associated with the IPO, resultedacquired Unitas Holdings Corp. (now known as Vroom Finance Corporation) on February 1, 2022 in a change in control.stock acquisition, refer to Note 5 – Acquisition for additional information. The NOLs and other tax attributes acquired are subject to Section 382 limitations.

Uncertain Tax Positions

The Company has notnot identified any uncertain tax positions as of December 31, 20202023 or 2019.2022. Any interest and penalties related to uncertain tax positions shall be recorded as a component of income tax expense. To date, no interest or penalties have been accrued in relation to uncertain tax positions.

107


Table of Contents

VROOM, INC.

NOTES TO CONSOLIDATED FINANCIAL STATEMENTS

16.21. Net Loss Per Share

The following table sets forth the computation of basic and diluted net loss per share attributable to common stockholders:


Year Ended
December 31,


(in thousands, except share and per share amounts)


2023


2022


Net loss


$

(365,540

)


$

(451,910

)

Weighted-average number of shares outstanding used to compute net loss per share attributable to common stockholders, basic and diluted


1,743,128


1,723,843


Net loss per share attributable to common stockholders, basic and diluted


$

(209.70

)


$

(262.15

)


Year Ended

December 31,


(in thousands, except share and per share amounts)


2020


2019


2018


Net loss


$

(202,799

)


$

(142,978

)


$

(85,178

)

Accretion of redeemable convertible preferred stock


(132,750

)


(13,036

)

Net loss attributable to common stockholders


$

(202,799

)


$

(275,728

)


$

(98,214

)

Weighted-average number of shares outstanding used to compute net loss per share attributable to common stockholders, basic and diluted


73,345,569


8,605,962


8,540,778


Net loss per share attributable to common stockholders, basic and diluted


$

(2.76

)


$

(32.04

)


$

(11.50

)

The following potentially dilutive shares were not included in the calculation of diluted shares outstanding for the periods presented as the effect would have been anti-dilutive:


As of December 31,


2023


2022


Convertible senior notes


64,830


81,635


Stock options


26,088


35,715


Restricted stock units


175,266


108,268


Total


266,184


225,618


Year Ended

December 31,


2020


2019


2018


Redeemable convertible preferred stock


83,568,628


66,825,300


Warrants


161,136


161,136


Stock options


5,617,568


6,110,000


2,961,008


Restricted stock awards


3,249,382


3,873,214


Restricted stock units


2,235,442


408,000


100,000


Total


7,853,010


93,497,146


73,920,658


17. Related Party Transactions122

Management Services Agreement

In July 2015, the Company entered into a management services agreement (“MSA”) with Catterton Management Company, L.L.C. (“Catterton Management”), an affiliate of L Catterton (“Catterton”), a holder of more than 5% of the Company’s outstanding capital stock, pursuant to which Catterton Management agreed to provide consulting services on certain business and financial matters. Under the MSA, the Company agreed to pay Catterton Management an annual fee of $0.3 million until the expiration of the MSA upon the earlier of (i) termination by mutual consent of the parties and (ii) such time that Catterton and/or its affiliates cease to be one of the Company’s stockholders. For the years ended December 31, 2020, 2019, and 2018, payments of the annual fees were waived. In May 2020, the MSA was terminated.

AutoNation Reconditioning Agreement

In January 2019, the Company entered into a vendor agreement (“Vendor Agreement”) with AutoNation, Inc. (“AutoNation”), an affiliate of Auto Holdings, Inc., a holder of more than 5% of the Company’s outstanding capital stock, pursuant to which AutoNation agreed to provide certain reconditioning and repair services for vehicles owned by the Company. Amounts due under the Vendor Agreement for parts supplied and services performed by AutoNation become due and payable as they accrued.  For the year ended December 31, 2019, the Company incurred $1.1 million of costs under the Vendor Agreement. The Vendor Agreement was terminated in February 2020.

108


Table of Contents

VROOM, INC.

NOTES TO CONSOLIDATED FINANCIAL STATEMENTS

18. Subsequent Event

On January 7, 2021, the Company completed the acquisition of the CarStory business, a leader in AI-powered analytics and digital services for automotive retail, through the acquisition of 100% of Vast Holdings, Inc. Leveraging its machine learning, CarStory brings predictive market data to Vroom’s national ecommerce and vehicle operations platform. As part of Vroom, we expect CarStory to continue to offer its digital retailing services to dealers, automotive financial services companies and others in the automotive industry.

Pursuant to the acquisition agreement, the aggregate purchase price was approximately $120.0 million, comprised of cash and shares of the Company’s common stock. On the closing date, the Company paid $77.5 million in cash and issued 1,072,117 shares of common stock. The purchase price is subject to adjustment for certain working capital adjustments and post-closing indemnities.

Due to the proximity of the acquisition date to the Company’s filing of its annual report on Form 10-K for the year ended December 31, 2020, the initial accounting for the CarStory business combination is incomplete, and therefore the Company is unable to disclose certain information required by ASC 805, Business Combinations, including the provisional amounts recognized as of the acquisition date for each major class of assets acquired and liabilities assumed and goodwill.

109


Table of Contents

Item 9. Changes in and Disagreements with Accountants on Accounting and Financial Disclosure

Not applicable.

Item 9A. Controls and Procedures

Limitations on effectiveness of controls and procedures

In designing and evaluating our disclosure controls and procedures, management recognizes that any controls and procedures, no matter how well designed and operated, can provide only reasonable assurance of achieving the desired control objectives. In addition, the design of disclosure controls and procedures must reflect the fact that there are resource constraints and that management is required to apply judgment in evaluating the benefits of possible controls and procedures relative to their costs.

Evaluation of Disclosure Controls and Procedures

Our management, with the participation of our principal executive officerPrincipal Executive Officer and principal financial officer,Principal Financial Officer, evaluated as of the end of the period covered by this Annual Report on Form 10-K, the effectiveness of our disclosure controls and procedures (as defined in Rules 13a-15(e) and 15d-15(e) under the Exchange Act). as of December 31, 2023.

Based on that evaluation, our Principal Executive Officer and as a result of the material weaknesses described below, our principal executive officer and principal financial officerPrincipal Financial Officer have concluded that, as of December 31, 2020,2023, our disclosure controls and procedures were not effective. In light of this fact, our management has performed additional analyses, reconciliations, and other post-closing procedures and has concluded that, notwithstandingeffective at the material weaknesses in our internal control over financial reporting, the consolidated financial statements for the periods covered by and included in this Annual Report on Form 10-K fairly state, in all material respects, our financial position, results of operations and cash flows for the periods presented in conformity with U.S. GAAP.reasonable assurance level.

Management's Annual Report on Internal Control Over Financial Reporting

This Annual Report on Form 10-K does not include a report of management's assessment regarding

Our management is responsible for establishing and maintaining adequate internal control over financial reporting, oras such term is defined in Exchange Act Rules 13a-15(f) and 15d-15(f). Management has assessed the effectiveness of the Company’s internal control over financial reporting as of December 31, 2023, using the criteria described in Internal Control—Integrated Framework (2013 framework) issued by the Committee of Sponsoring Organizations of the Treadway Commission (COSO). Based on this evaluation, our management concluded that the Company’s internal control over financial reporting was effective as of December 31, 2023.

The effectiveness of the Company’s internal control over financial reporting as of December 31, 2023 has been audited by PricewaterhouseCoopers LLP, an attestation report of our independent registered public accounting firm, due to a transition period established by the rulesas stated in their report which appears in Item 8 of the SEC for newly public companies.this Annual Report on Form 10-K.

Material Weaknesses

A material weakness is a deficiency, or combination of deficiencies, in internal control over financial reporting such that there is a reasonable possibility that a material misstatement of annual or interim financial statements will not be prevented or detected on a timely basis. Internal control over financial reporting is a process designed to provide reasonable assurance regarding the reliability of financial reporting and the preparation of financial statements in accordance with GAAP.  In connection with our audit of consolidated financial statements for the year ended December 31, 2018, we identified material weaknesses in our internal control over financial reporting. We did not design or maintain an effective control environment commensurate with our financial reporting requirements. Specifically, we lacked a sufficient complement of personnel with (i) an appropriate level of accounting knowledge, training and experience to appropriately analyze, record and disclose accounting matters timely and accurately, and (ii) an appropriate level of knowledge and experience to establish effective information technology processes and controls. This material weakness contributed to the following material weaknesses:

we did not design and maintain adequate controls over the preparation and review of certain account reconciliations and journal entries. Specifically, we did not design and maintain controls to ensure (i) the appropriate segregation of duties in the preparation and review of account reconciliations and journal entries and (ii) account reconciliations and journal entries were reviewed at the appropriate level of precision.

we did not design and maintain effective controls over certain information technology general controls for information systems and applications that are relevant to the preparation of the consolidated financial statements. Specifically, we did not design and maintain sufficient user and privileged access controls to ensure appropriate segregation of duties and adequate restricted user access to financial applications; program change management controls to ensure that IT program and data changes affecting financial IT applications and underlying accounting records are identified, tested, authorized and implemented appropriately; or computer operations controls as well as testing and approval controls for program development.

110


Table of Contents

The control deficiencies described above did not result in a misstatement to our annual or interim consolidated financial statements. However, each of the control deficiencies described above, if not remediated, could result in a misstatement of one or more account balances or disclosures that would result in a material misstatement to the annual or interim consolidated financial statements that would not be prevented or detected, and, accordingly, we determined that these control deficiencies constitute material weaknesses.

We have concluded that these material weaknesses arose because, as a private company, we did not have the necessary business processes, systems, personnel and related internal controls.

Remediation of Material Weakness

In the year ended December 31, 2019, we undertook measures to address material weaknesses in our internal controls. In particular, we (i) hired additional finance and accounting personnel with expertise in preparation of financial statements and account reconciliations; (ii) further developed and documented our accounting policies; and (iii) hired a director responsible for implementation of information technology general controls. In addition, in the year ended December 31, 2020, we continued to take steps to remediate these material weaknesses, including:

hiring additional qualified accounting, financial reporting and information technology personnel with public company experience;

providing additional training for our personnel on internal control over financial reporting;

implementing new financial systems and processes;

implementing additional review controls and processes and requiring timely account reconciliation and analyses;

implementing processes and controls to better identify and manage segregation of duties; and

engaging an external advisor to assist with evaluating and documenting the design and operating effectiveness of internal controls and assisting with the remediation of deficiencies, as necessary.

Changes in Internal Control over Financial Reporting

We are taking steps, as described above, to remediate

During the material weaknesses relating toyear ended December 31, 2023, we completed the process of incorporating the internal controls of Unitas Holdings Corp., including its wholly owned subsidiaries United PanAm Financial Corp. and United Auto Credit Corporation, into our internal control over financial reporting. However, we will not be able to fully remediate these material weaknesses until these steps have been completedreporting and extending our Section 404 compliance program under the Sarbanes-Oxley Act and the related internal controls have been operating effectivelyapplicable rules and regulations under such law to include such entities. Except for a sufficient period of time. Except as otherwise described herein,the foregoing, there was no change in our internal control over financial reporting (as defined in Rules 13a-15(f) and 15d-15(f) under the Exchange Act) that occurred during the quarterquarterly period ended December 31, 20202023, that has materially affected, or is reasonably likely to materially affect, our internal control over financial reporting.

Item 9B. Other Information

As we approach

a)
Disclosure in lieu of reporting on a Current Report on Form 8-K.

On March 8, 2024 (the “Effective Date”), the completionCompensation Committee (the “Committee”) of our firstthe Board of Directors of Vroom, Inc. (the “Company”) approved retention letter agreements (each, a “Retention Agreement”) with each of Thomas Shortt, Robert Krakowiak and Patricia Moran providing for: (i) an amendment to each executive’s outstanding restricted stock units which are scheduled to vest in 2024, 2025 and 2026 to vest in full yearbetween March 17, 2025 and March 20, 2025, subject to the executive’s continued employment through such date (the “RSU Vesting Amendment”) or earlier acceleration on a termination without Cause or for Good Reason (each as defined in the Retention Agreement), (ii) in consideration of the executives’ agreement to the RSU Vesting Amendment, a public company,grant of additional restricted stock units with respect to 2,250, 1,085, and 531 shares of common stock, respectively, with the same vesting terms, and (iii) an

123


Table of Contents

extension of the post-termination exercise period of any outstanding vested stock options held by such executive in the event of the executive’s termination without Cause or for Good Reason through the original expiration date of such options. In addition, Mr. Adam Valkin indicated to us on March 2, 2021Shortt’s Retention Agreement provides that he planswill be eligible to step down asearn a directorretention bonus of $1,000,000, which will be payable in five equal installments on or shortly following each date of filing of the Company’s annual report on Form 10-K for fiscal year 2023, the quarterly reports on Form 10-Q for each of the first three fiscal quarters of fiscal year 2024, and the Company’s annual report on Form 10-K for fiscal year 2024, subject to his continued service with the Company on the applicable payment date or on an earlier termination without Cause or for Good Reason.

The Committee also determined to increase the base salaries of Mr. Krakowiak and Ms. Moran to $650,000 and $600,000, respectively, effective as of our 2021 Annual MeetingFebruary 1, 2024. In addition, the Committee approved an amendment and restatement of Stockholders,the Company's Amended and therefore heRestated Executive Severance Plan (the "Executive Severance Plan") which: (i) clarifies that a Competing Business (as defined in the Executive Severance Plan) includes a business engaged in financing motor vehicles in order to reflect changes to the Company’s business activities since the effective date of the Executive Severance Plan, (ii) makes certain other clarifying changes, including to reflect the severance terms previously agreed to with the Company’s Chief Executive Officer Mr. Shortt in his employment letter with the Company dated May 9, 2022; and (iii) provides that the severance payments payable on a qualifying termination (outside of the Change in Control Period (as defined in the Executive Severance Plan)) will be paid in substantially equal installments over a period of four months (rather than the original eighteen- or twelve- month periods, as applicable).

The foregoing summary of the amendment and restatement to the Executive Severance Plan and Retention Agreements is not stand for re-election atcomplete and is qualified in its entirety by reference to the full text of the amended and restated Executive Severance Plan, a copy of which is attached as Exhibit 10.15 and the Retention Agreements, a copy of which are attached as Exhibits 10.25, 10.26 and 10.27.

b)
Insider Trading Arrangements and Policies.

During the three months ended December 31, 2023, no director or officer of the Company adopted or terminated a “Rule 10b5-1 trading arrangement” or “non-Rule 10b5-1 trading arrangement,” as each term is defined in Item 408(a) of Regulation S-K.

Item 9C. Disclosure Regarding Foreign Jurisdictions that meeting.Prevent Inspections.

111

Not applicable.

124


Table of Contents

PART III

PART III

Item 10. Directors, Executive Officers, and Corporate Governance

We have adopted a written code of ethics, entitled “Code of Business Conduct and Ethics,” that applies to all of our directors, executive officers and employees, including our principal executive officer, principal financial officer, principal accounting officer and controller, or persons performing similar functions. We make available our code of ethics free of charge through our investor relations website which is located at ir.vroom.com. We intend to post on our website all disclosures that are required by law or Nasdaq listing standards concerning any amendments to, or waivers from, any provision of our code of ethics.ethics.

The information concerning our executive offers and directors required by this Item 10 is contained under the caption “Information about our Executive Officers and Directors” at the end of Part I of this Annual Report on Form 10-K.10-K. The remaining information required by this item is incorporated by reference to Vroom’s Proxy Statement for its 20212024 Annual Meeting of Stockholders to be filed with the SEC within 120 days after the end of the fiscal year ended December 31, 2020.2023, under the headings "Our Board of Directors," "Our Executive Officers," "Corporate Governance," and, if applicable, "Delinquent Section 16(a) Reports".

Item 11. Executive Compensation

The information required by this item is incorporated by reference to Vroom’s Proxy Statement for its 20212024 Annual Meeting of Stockholders to be filed with the SEC within 120 days after the end of the fiscal year ended December 31, 2020.2023, under the headings "Executive Compensation" and "Compensation Committee Interlocks and Insider Participation".

Item 12. Security Ownership of Certain Beneficial Owners and Management and Related Stockholder Matters

The information required by this item is incorporated by reference to Vroom’s Proxy Statement for its 20212024 Annual Meeting of Stockholders to be filed with the SEC within 120 days after the end of the fiscal year ended December 31, 2020.2023, under the headings "Security Ownership of Certain Beneficial Owners and Management" and "Securities Authorized for Issuance under Equity Compensation Plans".

The information required by this item is incorporated by reference to Vroom’s Proxy Statement for its 20212024 Annual Meeting of Stockholders to be filed with the SEC within 120 days after the end of the fiscal year ended December 31, 2020.2023, under the headings "Certain Relationships and Related Person Transactions" and "Corporate Governance".

Item 14. Principal Accounting Fees and Services

The information required by this item is incorporated by reference to Vroom’s Proxy Statement for its 20212024 Annual Meeting of Stockholders to be filed with the SEC within 120 days after the end of the fiscal year ended December 31, 2020.2023, under the subheading "Principal Accountant Fees and Services".

125

112


Table of Contents

PART IV

Item 15. Exhibits and Financial Statement Schedules

1.

Financial Statements: The Consolidated Financial Statements of Vroom are set forth in Part II, Item 8 of this Annual Report on Form 10-K.

1.
Financial Statements: The Consolidated Financial Statements of Vroom are set forth in Part II, Item 8 of this Annual Report on Form 10-K.

2.

Financial Statement Schedules: All financial statement schedules have been omitted because they are not applicable, not material or the required information is shown in Part II, Item 8 of this Annual Report on Form 10-K.

2.
Financial Statement Schedules: All financial statement schedules have been omitted because they are not applicable, not material or the required information is shown in Part II, Item 8 of this Annual Report on Form 10-K.

3.

Exhibits: The exhibits listed in the accompanying Exhibit Index are filed, furnished or incorporated by reference as part of this Annual Report on Form 10-K.

3.
Exhibits: The exhibits listed in the accompanying Exhibit Index are filed, furnished or incorporated by reference as part of this Annual Report on Form 10-K.

INDEX TO EXHIBITS

Exhibit

Number

Exhibit Description

Form

File No.

Exhibit

Filing

Date

Filed Herewith

Furnished

Herewith

2.1

Agreement and Plan of Merger, dated as of October 11, 2021, by and among Vroom, Inc., Vroom Finance Corporation, Unitas Holdings Corp. and Fortis Advisors LLC, solely in its capacity as the equityholders' representative

8-K

001-39315

2.1

October 12, 2021

3.1

Amended and Restated Certificate of Incorporation of Vroom, Inc.

10-Q

001-39315

3.1

  August 13, 2020

3.2


Certificate of Amendment of Amended and Restated Certificate of Incorporation of Vroom, Inc., dated February 13, 2024.


8-K


001-39315


3.1


February 14, 2024


3.3

Amended and Restated Bylaws of Vroom, Inc.

10-Q

001-39315

3.2

  August 13, 2020

4.1

Specimen Stock Certificate evidencing the shares of common stock

S-1/A

333-238482

4.1

June 1, 2020

4.2

Indenture, dated as of June 18, 2021, between Vroom, Inc. and U.S. Bank National Association, as trustee

8-K

001-39315

4.1

June 21, 2021

4.3

Form of Global Note representing the 0.750% Convertible Senior Notes due 2026 (included in Exhibit 4.2)

8-K

001-39315

4.2

June 21, 2021

 4.4

Eighth Amended and Restated Investors’ Rights Agreement, dated as of November 21, 2019, by and among Vroom, Inc. and certain holders of its capital stock

S-1/A

333-238482

4.2

May 18, 2020

Exhibit 

Number


Exhibit Description


Form


File No.


Exhibit


Filing

Date


Filed Herewith

Furnished

Herewith


 3.1


Amended and Restated Certificate of Incorporation of Vroom, Inc.


10-Q


001-39315


3.1


  August 13, 2020


 3.2


Amended and Restated Bylaws of Vroom, Inc.


10-Q


001-39315


3.2


  August 13, 2020


 4.1


Specimen Stock Certificate evidencing the shares of common stock


S-1/A


333-238482


4.1


June 1, 2020


4.2


Eighth Amended and Restated Investors’ Rights Agreement, dated as of November 21, 2019, by and among Vroom, Inc. and certain holders of its capital stock


S-1/A


333-238482


4.2


May 18, 2020


4.3


Description of the Registrant’s Securities


X


10.1†


Second Amended & Restated 2014 Equity Incentive Plan, as amended


S-1/A


333-238482


10.1


May 18, 2020


10.2†


First Amendment to the Second Amended and Restated Vroom, Inc. 2014 Equity Incentive Award Plan


10-Q


001-39315


10.3


August 13, 2020


10.3†


Second Amendment to the Second Amended and Restated Vroom, Inc. 2014 Equity Incentive Award Plan


10-Q


001-39315


10.4


August 13, 2020


10.4†


Form of Stock Option Agreement pursuant to the Second Amended and Restated 2014 Equity Incentive Award Plan


X


10.5†


Form of Restricted Stock Unit Agreement pursuant to the Second Amended and Restated 2014 Equity Incentive Award Plan


X


10.6†


2019 Short Term Incentive Plan


S-1/A


333-238482


10.2


May 18, 2020


10.7†


2020 Incentive Award Plan


S-1/A


333-238482


10.3


June 1, 2020


10.8†


Form of Restricted Stock Unit Agreement pursuant to the 2020 Incentive Award Plan


10-Q


001-39315


10.2


August 13, 2020


113

126


Table of Contents

 4.5

Description of Registrant’s Securities

10-K

001-39315

4.3

March 3, 2021

10.1†

Second Amended & Restated 2014 Equity Incentive Plan, as amended

S-1/A

333-238482

10.1

May 18, 2020

10.2†

First Amendment to the Second Amended and Restated Vroom, Inc. 2014 Equity Incentive Award Plan

10-Q

001-39315

10.3

August 13, 2020

10.3†

Second Amendment to the Second Amended and Restated Vroom, Inc. 2014 Equity Incentive Award Plan

10-Q

001-39315

10.4

August 13, 2020

10.4†

Form of Stock Option Agreement pursuant to the Second Amended and Restated 2014 Equity Incentive Award Plan

10-K

001-39315

10.4

March 3, 2021

10.5†

Form of Restricted Stock Unit Agreement pursuant to the Second Amended and Restated 2014 Equity Incentive Award Plan

10-K

001-39315

10.5

March 3, 2021

10.6†

2019 Short Term Incentive Plan

S-1/A

333-238482

10.2

May 18, 2020

10.7†

2020 Incentive Award Plan

S-1/A

333-238482

10.3

June 1, 2020

10.8†

Form of Restricted Stock Unit Agreement pursuant to the 2020 Incentive Award Plan

10-Q

001-39315

10.2

August 13, 2020


10.9†


Form of Stock Option Grant Notice and Stock Option Agreement pursuant to the 2020 Incentive Award Plan


10-Q


001-39315


10.4


August 8, 2022


10.10†


2022 Inducement Award Plan


S-8


333-265233


99.1


May 26, 2022


10.11†


Form of Restricted Stock Unit Agreement pursuant to the 2022 Inducement Award Plan


S-8


333-265233


99.2


May 26, 2022


10.12†


Form of Stock Option Agreement pursuant to the 2022 Inducement Award Plan


S-8


333-265233


99.3


May 26, 2022


10.13†

Amended and Restated Non-Employee Director Compensation Policy

10-Q

001-39315

10.9

August 8, 2022

10.14†

Form of Indemnification Agreement

S-1/A

333-238482

10.5

June 1, 2020

Exhibit 

Number


Exhibit Description


Form


File No.


Exhibit


Filing

Date


Filed Herewith

Furnished

Herewith


10.9†


Non-Employee Director Compensation Policy


S-1/A


333-238482


10.4


June 1, 2020


10.10†


Form of Indemnification Agreement


S-1/A


333-238482


10.5


June 1, 2020


10.11†


Executive Severance Plan


X


10.12


Commercial Lease Agreement, dated August 10, 2009, as amended, by and between Texas Direct Auto and Robert P. Archer, ETAL


S-1/A


333-238482


10.6


June 1, 2020


10.13


Lease Agreement, dated May 21, 2011, as amended, by and between Beechnut FEC LLC and Left Gate Property Holding, Inc. d/b/a as Texas Direct Auto


S-1/A


333-248655


10.7


June 1, 2020


10.14


Second Amendment to Lease Agreement, dated January 3, 2019, by and between Beechnut FEC LLC and Vroom, Inc.


X


10.15


Third Amendment to Lease Agreement, dated February 2, 2021, by and between Beechnut FEC LLC and Left Gate Property Holding, LLC d/b/a Texas Direct Auto


X


10.16


Lease Agreement, dated May 21, 2011, by and between Sohani Heritage Trust and Left Gate Property Holding, Inc. d/b/a Texas Direct Auto


S-1/A


333-248655


10.8


June 1, 2020


10.17


First Amendment to Lease Agreement, dated December 28, 2018, by and between Sohani Heritage Trust and Left Gate Property, Inc. d/b/a Texas Direct Auto


X


10.18


Second Amendment to Lease Agreement, dated April 28, 2020, by and between Sohani Heritage Trust and Vroom, Inc., as successor to Left Gate Property Holding, Inc. d/b/a Texas Direct Auto


X


10.19


Third Amendment to Lease Agreement, dated January 28, 2021, by and between Sohani Heritage Trust and Left Gate Property Holding, LLC d/b/a Texas Direct Auto


X


10.20


Development Agreement, dated June 28, 2011, as amended, by and between The City of Meadows Place, Texas and Left Gate Property Holding, Inc. d/b/a Texas Direct Auto and Vroom


S-1/A


333-248655


10.9


June 1, 2020


127

114


Table of Contents

10.15†

Amended and Restated Executive Severance Plan, as amended and restated


 X

10.16#


Amended and Restated Inventory Financing and Security Agreement, dated November 4, 2022 by and among Ally Bank, Ally Financial Inc., Vroom Automotive, LLC and Vroom, Inc.


10-Q


001-39315


10.1


November 7, 2022


10.17


First Amendment to Amended and Restated Inventory Financing and Security Agreement, dated August 1, 2023, by and among Ally Bank, Ally Financial Inc., Vroom Automotive, LLC and Vroom, Inc.


10-Q


001-39315


10.1


August 8, 2023


10.18


Second Amendment to Amended and Restated Inventory Financing and Security Agreement, dated January 19, 2024, by and among Ally Bank, Ally Financial Inc., Vroom Automotive, LLC and Vroom, Inc.


X


10.19†


Agreement of Termination of Amended and Restated Inventory Financing and Security Agreement and Credit Balance Agreement, dated March 12, 2024 by and among Ally Bank, Ally Financial Inc., Vroom Automotive, LLC and Vroom, Inc.


X


10.20

Employment Offer Letter, dated December 29, 2018, by and between Vroom, Inc. and Patricia Moran

S-1/A

333-248655

10.18

September 8, 2020

10.21

Employment Offer Letter, dated November 3, 2016, by and between Vroom, Inc. and Carol Denise Stott

S-1/A

333-248655

10.19

September 8, 2020

10.22

Letter Agreement, dated as of September 13, 2021, by and between Robert Krakowiak and Vroom, Inc.

8-K

001-39315

10.1

September 13, 2021

10.23


Amended Offer Letter, dated as of May 20, 2022, by and between Robert R. Krakowiak and Vroom, Inc.


8-K


001-39315


10.2


May 26, 2022


10.24†

Letter Agreement, dated as of December 15, 2021, by and between Thomas Shortt and Vroom, Inc.

8-K

001-39315

10.1

December 17, 2021


128


Table of Contents

Exhibit 

Number10.25

Exhibit DescriptionLetter Agreement dated as of March 11, 2024, by and between Thomas Shortt and Vroom, Inc.

Form

File No.

Exhibit

Filing

Date

Filed HerewithX

Furnished

Herewith

10.21#10.26

Inventory Financing and SecurityLetter Agreement dated as of March 6, 2020,11, 2024, by and among Ally Bank, Ally Financial Inc., Left Gate Property Holding, LLCbetween Robert Ronald Krakowiak and Vroom, Inc.

S-1/A

333-248655

10.10

May 18, 2020

X

10.22#10.27

First Amendment to Inventory Financing and SecurityLetter Agreement dated June 19, 2020,as of March 11, 2024, by and among Ally Bank, Ally Financial Inc., Left Gate Property Holding, LLCbetween Patricia Moran and Vroom, Inc.

10-Q

001-39315

10.9

August 13, 2020

X

10.23#

Second Amendment to Inventory Financing and Security Agreement, dated October 1, 2020 by and among Ally Bank, Ally Financial, Inc., Left Gate Property Holding, LLC and Vroom, Inc.

10-Q

001-39315

10.1

November 12, 2020

10.24#10.28

Customer Experience Management Agreement,Employment Letter, dated April 17, 2020,as of May 9, 2022, by and between Rock Connections LLCThomas Shortt and Left Gate Property Holding, LLCVroom, Inc.

S-1/A8-K

333-248655001-39315

10.1110.1

June 1, 2020May 9, 2022

10.25#10.29

Assignment and Assumption Agreement, dated August 17, 2020, by and between Left Gate Property Holding, LLC, Rock Connections LLC and Rocket Auto LLC

X

10.26#

Retail Reconditioning Services Agreement, dated May 20, 2020, by and between Manheim Remarketing, Inc d/b/a Manheim Retail Solutions and Left Gate Property Holding, LLC d/b/a Vroom

S-1/A

333-248655

10.12

June 1, 2020

10.27

Employment Agreement, dated June 8, 2016, by and between Vroom, Inc. and Paul J. Hennessy

S-1/A

333-248655

10.13

June 1, 2020

10.28

Employment Offer Letter, dated October 15, 2018, by and between Vroom, Inc. and David K. Jones

S-1/A

333-248655

10.14

June 1, 2020

10.29

Employment Offer Letter, dated January 6, 2019, by and between Vroom, Inc. and Mark Roszkowski

S-1/A

333-248655

10.15

June 1, 2020

10.30

Employment Offer Letter, dated December 29, 2018, by and between Vroom, Inc. and Patricia Moran

S-1/A

333-248655

10.18

September 8, 2020

10.31

Employment Offer Letter, dated November 3, 2016, by and between Vroom, Inc. and Carol Denise Stott

S-1/A

333-248655

10.19

September 8, 2020

10.32

Nominee and Indemnity Agreement, dated September 1, 2020, by and among Catterton Management Company, L.L.C. as investment manager of CGP2 Lone Star, L.P., Scott Dahnke and Vroom, Inc.

S-1/A

333-248655

10.20

September 8, 2020

115


Table of Contents

Exhibit 

Number

Exhibit Description

Form

File No.

Exhibit

Filing

Date

Filed Herewith

Furnished

Herewith

10.33

Nominee and Indemnity Agreement, dated September 1, 2020, by and among Catterton Management Company, L.L.C. as investment manager of CGP2 Lone Star, L.P., Michael Farello and Vroom, Inc.

S-1/A

333-248655

10.21

September 8, 2020

21.1

10.30

Assignment of Contracts, dated July 29, 2021, by and between CGP2 Lone Star, LP as assignor and Catterton Growth Partners II, L.P., Catterton Growth Partners II Offshore, L.P., L Catterton Growth Partners III, L.P. and L Catterton Growth Partners Offshore III, L.P. as assignees, of the Nominee and Indemnity Agreements, dated September 1, 2020, of Scott Dahnke and Michael Farello

10-Q

001-39315

10.1

August 11, 2021

21.1

Subsidiaries of the Registrant

X

23.1

Consent of PricewaterhouseCoopers LLP

X

31.1

Certification of Principal Executive Officer Pursuant to Rules 13a-14(a) and 15d-14(a) under the Securities Exchange Act of 1934, as Adopted Pursuant to Section 302 of the Sarbanes-Oxley Act of 2002

X

31.2

Certification of Principal Financial Officer Pursuant to Rules 13a-14(a) and 15d-14(a) under the Securities Exchange Act of 1934, as Adopted Pursuant to Section 302 of the Sarbanes-Oxley Act of 2002

X

129


Table of Contents

32.1

32.1

Certification of Principal Executive Officer Pursuant to 18 U.S.C. Section 1350, as Adopted Pursuant to Section 906 of the Sarbanes-Oxley Act of 2002

XXX

32.2

Certification of Principal Financial Officer Pursuant to 18 U.S.C. Section 1350, as Adopted Pursuant to Section 906 of the Sarbanes-Oxley Act of 2002

XXX

101.INS97.1

XBRL Instance DocumentPolicy for Recovery of Erroneously Awarded Compensation

X

X

101.SCH101.INS

Inline XBRL Instance Document

X

101.SCH

Inline XBRL Taxonomy Extension Schema Document

X

X

101.CAL

Inline XBRL Taxonomy Extension Calculation Linkbase Document

X

X

101.DEF

Inline XBRL Taxonomy Extension Definition Linkbase Document

X

X

101.LAB

Inline XBRL Taxonomy Extension Label Linkbase Document

 X

X

101.PRE

Inline XBRL Taxonomy Extension Presentation Linkbase Document

X

104

Cover Page Interactive Data File (embedded within the Inline XBRL document)

X

Indicates a management contract or compensatory plan or arrangement.

#Certain portions of this exhibit (indicated by “["[***]") have been omitted pursuant to Regulation S-K, Item (601)(601)(b)(10).

Item 16. Form 10-K Summary

None.

116

130


Table of Contents

SIGNATURES

SIGNATURES

Pursuant to the requirements of the Securities Exchange Act of 1934, the registrant has duly caused this report to be signed on its behalf by the undersigned thereunto duly authorized.

Vroom, Inc.

Date: March 3, 202113, 2024

By:

/s/ Paul J. HennessyThomas H. Shortt

Paul J. HennessyThomas H. Shortt

Chief Executive Officer

(principal executive officer)

Date: March 3, 202113, 2024

By:

/s/ David K JonesRobert R. Krakowiak

David K. JonesRobert R. Krakowiak

Chief Financial Officer

(principal financial and accounting officer)

Pursuant to the requirements of the Securities Exchange Act of 1934, this report has been signed below by the following persons on behalf of the registrant and in the capacities and on the dates indicated.indicated.

Signature

Title

Date

/s/ Paul J. HennessyThomas H. Shortt

Paul J. HennessyThomas H. Shortt

Chief Executive Officer (Principal Executive Officer) and Director

March 3, 202113, 2024

/s/ David K. JonesRobert R. Krakowiak

David K. JonesRobert R. Krakowiak

Chief Financial Officer (Principal Financial OfficerOfficer)

March 13, 2024

/s/ Agnieszka Zakowicz

Agnieszka Zakowicz

Senior Vice President and Principal Accounting Officer)Officer

March 3, 202113, 2024

/s/ Robert J. Mylod, Jr.

Robert J. Mylod, Jr.

Director

March 3, 202113, 2024

/s/ Scott A. DahnkeTimothy M. Crow

Scott A. DahnkeTimothy M. Crow

Director

March 3, 202113, 2024

/s/ Michael J. Farello

Michael J. Farello

Director

March 3, 202113, 2024

/s/ Laura W. Lang

Laura W. Lang

Director

March 3, 202113, 2024

/s/ Laura G. O’Shaughnessy

Laura G. O’Shaughnessy

Director

March 3, 202113, 2024

/s/ Adam ValkinPaula B. Pretlow

Adam ValkinPaula B. Pretlow

Director

March 3, 202113, 2024

117131