UNITED STATES

SECURITIES AND EXCHANGE COMMISSION

WASHINGTON, D.C. 20549

FORM 10-K

(Mark One)

ANNUAL REPORT PURSUANT TO SECTION 13 OR 15(d) OF THE SECURITIES EXCHANGE ACT OF 1934

ANNUAL REPORT PURSUANT TO SECTION 13 OR 15(d) OF THE SECURITIES EXCHANGE ACT OF 1934

For the Fiscal Year EndedDecember 31 2020, 2023

OR

TRANSITION REPORT PURSUANT TO SECTION 13 OR 15(d) OF THE SECURITIES EXCHANGE ACT OF 1934

TRANSITION REPORT PURSUANT TO SECTION 13 OR 15(d) OF THE SECURITIES EXCHANGE ACT OF 1934

For the transition period from to

Commission file number 001-37747

MEDALLION FINANCIAL CORP.CORP.

(Exact name of registrant as specified in its charter)

delaware

04-3291176

(State of

Incorporation)

(IRS Employer

Identification No.)

437 MADISON AVENUE, 38th Floor

New York, New York 10022

(Address of principal executive offices) (Zip Code)

(212) (212) 328-2100

(Registrant’s telephone number, including area code)

Securities registered pursuant to Section 12(b) of the Act:

Title of each class

Trading symbols

Name of each exchange

on which registered

Common Stock, par value $0.01 per share

MFIN

MFIN

NASDAQ Global Select Market

9.000% Senior Notes due 2021

MFINL

NASDAQ Global Select Market

Securities registered pursuant to Section 12(g) of the Act: None

Indicate by check mark if the registrant is a well-known seasoned issuer, as defined in Rule 405 of the Securities Act. YesNo

Indicated by check mark if the registrant is not required to file reports pursuant to Section 13 or Section 15(d) of the Act. YesNo

Indicate by check mark whether the registrant (1) has filed all reports required to be filed by Section 13 or 15(d) of the Securities Exchange Act of 1934 during the preceding 12 months (or for such shorter period that the registrant was required to file such reports), and (2) has been subject to such filing requirements for the past 90 days. YesNo

Indicate by check mark whether the registrant has submitted electronically every Interactive Data File required to be submitted pursuant to Rule 405 of Regulation S-T (§232.405 of this chapter) during the preceding 12 months (or for such shorter period that the registrant was required to submit such files). YesNo

Indicate by check mark whether the registrant is a large accelerated filer, an accelerated filer, a non-accelerated filer, a smaller reporting company, or an emerging growth company. See the definitions of “large accelerated filer,” “accelerated filer,” “smaller reporting company,” and “emerging growth company” in Rule 12b-2 of the Exchange Act.

Large accelerated filer

Accelerated filer

Non-accelerated filer

Smaller reporting company

Emerging growth company

If an emerging growth company, indicate by checkmark if the registrant has elected not to use the extended transition period for complying with any new or revised financial accounting standards provided pursuant to Section 13(a) of the Exchange Act.

Indicate by check mark whether the registrant has filed a report on and attestation to its management’s assessment of the effectiveness of its internal control over financial reporting under Section 404(b) of the Sarbanes-Oxley Act (15 U.S.C. 7262(b)) by the registered public accounting firm that prepared or issued its audit report.

If securities are registered pursuant to Section 12(b) of the Act, indicate by check mark whether the financial statements of the registrant included in the filing reflect the correction of an error to previously issued financial statements.

Indicate by check mark whether any of those error corrections are restatements that required a recovery analysis of incentive-based compensation received by any of the registrant’s executive officers during the relevant recovery period pursuant to §240.10D-1(b). ☐

Indicate by check mark whether the registrant is a shell company (as defined in Rule 12b-2 of the Act). YesNo

The aggregate market value of the voting common equity held by non-affiliates of the registrant, computed by reference to the last reported price at which the stock was sold on June 30, 2020,2023, as reported on NASDAQ, was $54,470,199.$146,115,624.

The number of outstanding shares of registrant’s common stock, par value $0.01, as of March 12, 20216, 2024 was 25,039,969.23,483,564.

DOCUMENTS INCORPORATED BY REFERENCE

Portions of the registrant’s Definitive Proxy Statement for its 20212024 Annual Meeting of Shareholders, for which a Definitive Proxy Statement will be filed with the Securities and Exchange Commission not later than 120 days after the registrant’s fiscal year-end of December 31, 2020,2023, are incorporated by reference into Part III of this Form 10-K.


MEDALLION FINANCIAL CORP.

20202023 FORM 10-K ANNUAL REPORT

TABLE OF CONTENTS

Page

PART I

34

ITEM 1.

OUR BUSINESS

34

ITEM 1A.

RISK FACTORS

2019

ITEM 1B.

UNRESOLVED STAFF COMMENTS

34

ITEM 1C.

CYBERSECURITY

34

ITEM 2.

PROPERTIES

3435

ITEM 3.

LEGAL PROCEEDINGS

3435

ITEM 4.

MINE SAFETY DISCLOSURES

3435

PART II

3536

ITEM 5.

MARKET FOR REGISTRANT’S COMMON EQUITY, RELATED STOCKHOLDER MATTERS AND ISSUER PURCHASES OF EQUITY SECURITIES

3536

ITEM 6.

SELECTED FINANCIAL DATA[RESERVED]

3637

ITEM 7.

MANAGEMENT’S DISCUSSION AND ANALYSIS OF FINANCIAL CONDITION AND RESULTS OF OPERATIONS

3637

ITEM 7A.

QUANTITATIVE AND QUALITATIVE DISCLOSURES ABOUT MARKET RISK

6258

ITEM 8.

FINANCIAL STATEMENTS AND SUPPLEMENTARY DATA

6258

ITEM 9.

CHANGES IN AND DISAGREEMENTS WITH ACCOUNTANTS ON ACCOUNTING AND FINANCIAL DISCLOSURE

6258

ITEM 9A.

CONTROLS AND PROCEDURES

6258

ITEM 9B.

OTHER INFORMATION

61

ITEM 9C.

65DISCLOSURE REGARDING FOREIGN JURISDICTIONS THAT PREVENT INSPECTIONS

61

PART III

6561

ITEM 10.

DIRECTORS, EXECUTIVE OFFICERS AND CORPORATE GOVERNANCE

6561

ITEM 11.

EXECUTIVE COMPENSATION

6561

ITEM 12.

SECURITY OWNERSHIP OF CERTAIN BENEFICIAL OWNERS AND MANAGEMENT AND RELATED STOCKHOLDER MATTERS

6561

ITEM 13.

CERTAIN RELATIONSHIPS AND RELATED TRANSACTIONS, AND DIRECTOR INDEPENDENCE

6561

ITEM 14.

PRINCIPAL ACCOUNTANT FEES AND SERVICES

6561

PART IV

6562

ITEM 15.

EXHIBITS AND FINANCIAL STATEMENT SCHEDULES

6562

ITEM 16.

FORM 10-K SUMMARY

6665

SIGNATURES

6766

2


The following discussion should be read in conjunction with our financial statements and the notes to those statements and other financial information appearing elsewhere in this report.

This report contains forward-looking statements relating to future events and future performance applicable to us within the meaning of Section 27A of the Securities Act of 1933 and Section 21E of the Securities Exchange Act of 1934, or the Exchange Act, including, without limitation, statements regarding our expectations, beliefs, intentions, or future strategies that are signified by the words expects, anticipates, intends, believes, or similar language. In connection with certain forward-looking statements contained in this Form 10-K and those that may be made in the future by or on behalf of the Company, the Company notes that there are various factors that could cause actual results to differ materially from those set forth in any such forward-looking statements. The forward-looking statements contained in this Form 10-K were prepared by management and are qualified by, and subject to, significant business, economic, competitive, regulatory, and other uncertainties and contingencies, all of which are difficult or impossible to predict, and many of which are beyond control of the Company. In particular, any forward-looking statements are subject to the risks and great uncertainties associated with the ongoing COVID-19 pandemicpending litigation with the Securities and Exchange Commission as well as the current inflationary environment and the related impact on the US and global economies.risk of recession.


All forward-looking statements included in this document are based on information available to us on the date hereof, and we assume no obligation to update any forward-looking statements. The statements have not been audited by, examined by, compiled by, or subjected to agreed-upon procedures by independent accountants, and no third-party has independently verified or reviewed such statements. Readers of this Form 10-K should consider these facts in evaluating the information contained herein. In addition, the business and operations of the Company are subject to substantial risks which increase the uncertainty inherent in the forward-looking statements contained in this Form 10-K. The inclusion of the forward-looking statements contained in this Form 10-K should not be regarded as a representation by the Company or any other person that the forward-looking statements contained in this Form 10-K will be achieved.

In light of the foregoing, readers of this Form 10-K are cautioned not to place undue reliance on the forward-looking statements contained herein. You should consider these risks and those described under Risk Factors below in this Form 10-K and others that are detailed in the other reports that the Company files from time to time with the Securities and Exchange Commission.

3


PART I

ITEM 1. OUR BUSINESS

ITEM 1.

OUR BUSINESS

We, Medallion Financial Corp., or the Company, are a specialty finance company organized as a Delaware corporation that includes Medallion Bank, our primary operating subsidiary. In recent years, our strategic growth has been through Medallion Bank, which originates consumer loans for the purchase of recreational vehicles, boats, and trailers and to finance home improvements. We historically have had a leading position in originating, acquiring, and servicing loans that finance taxi medallions and various types of commercial businesses.

Since Medallion Bank acquired a consumer loan portfolio and began originating consumer loans in 2004, it has increased its consumer loan portfolio at a compound annual growth rate of 16% (19% if there had been no loan sales during 2016, 2017, and 2018). In January 2017, we announced our plans to transform our overall strategy. We have transitioned away from medallion lending and have placed ourcorporation. Our strategic focus onis growing our growing consumer finance portfolio. Totaland commercial lending businesses. Our total assets under management, which includes assets serviced for third party investors, were $1.8$2.6 billion as of December 31, 20202023 and $1.7$2.3 billion as of December 31, 2019, and have grown at a compound annual growth rate of 9% from $215,000,000 at the end of 1996.2022.

We conduct our business through various wholly-owned subsidiaries, including:

Medallion Bank, or the Bank, a Federal Deposit Insurance Corporation, or FDIC, insured industrial bank that originates consumer loans, raises deposits and conducts other banking activities and has a separate board of directors with a majority of independent directors;

Medallion Bank, or the Bank, a Federal Deposit Insurance Corporation, or FDIC, insured industrial bank that originates consumer loans, raises deposits and conducts other banking activities;

Medallion Funding LLC, or Medallion Funding, a Small Business Investment Company, or SBIC, our primary taxi medallion lending company;

Medallion Capital, Inc., or Medallion Capital, an SBIC which conducts a mezzanine financing business;

Freshstart Venture Capital Corp., or Freshstart, an SBIC which originates and services taxi medallion and commercial loans; and

Medallion Servicing Corp., or MSC, which provides loan services to the Bank.

Our other consolidated subsidiaries are comprised of Medallion Fine Art, Inc., CDI-LP Holding, Inc.,or Medallion Motorsports, LLC, and RPAC Racing,Capital, a Small Business Investment Company, or SBIC, which conducts a mezzanine financing business;

Medallion Funding LLC, or RPAC. In addition, we make both marketableMedallion Funding, an SBIC, historically our primary taxi medallion lending company; and nonmarketable equity investments, primarily as a function of our mezzanine lending business.

In recent years, we have focused on growing our consumer lending segments

Freshstart Venture Capital Corp., or Freshstart, which historically originated and maintaining the profitability of ourserviced taxi medallion and commercial lending segment. During the year ended December 31, 2020, we have taken various steps to pursue this strategyloans and improve our corporate governance, including:

was an SBIC through 2023.

carrying-out cost-cutting measures, such as reducing our employee headcount by 21% at our parent company Medallion Financial Corp. and closing satellite offices in Long Island City, New York, Chicago, Illinois, and Boston, Massachusetts;

exiting non-core investments, such as selling the assets of LAX Group, LLC on December 16, 2020, and expecting to sell, when practicable to maximize our proceeds, other non-core investments like our remaining art investments of less than $1,000,000 in Medallion Fine Art, Inc.;


strengthening our initiative to grow the Bank by partnering with two fintech companies in our strategic partnership program; and  

electing Cynthia A. Hallenbeck as our independent director, resulting in a more independent and diverse board of directors.

Effective April 2, 2018, following authorization by our shareholders, we withdrew our previous election to be regulated as a business development company, or BDC, under the Investment Company Act of 1940, as amended, or the 1940 Act. Prior to such time, we were a closed-end, non-diversified management investment company that had elected to be treated as a BDC under the 1940 Act.

As a result of this change in status, commencing with the three months ended June 30, 2018:

we consolidated the results of the Bank and our other subsidiaries in our financial statements, which, as an investment company, we were previously precluded from doing; and

with the consolidation of the Bank, given its significance to our overall financial results, we report as a bank holding company for accounting purposes under Article 9 and Guide 3 of Regulation S-X, but we are not a bank holding company for regulatory purposes.

In accordance with the Financial Accounting Standards Board, or FASB, Accounting Standards Codification, or ASC Topic 946 – Financial Services – Investment Company, we made this change to our financial reporting prospectively, and have not restated or revised periods prior to our change in status to a non-investment company effective April 2, 2018. Accordingly, in this report we refer to both accounting in accordance with US generally accepted accounting principles, or GAAP, applicable to bank holding companies, or Bank Holding Company Accounting, which applies commencing April 2, 2018, and to that applicable to investment companies under the 1940 Act, or Investment Company Accounting, which applies to prior periods.

Our Market

We provide loans to individuals and small to mid-size businesses, through our subsidiaries, inunder four operating segments:

loans that finance consumer purchases of recreational vehicles, boats, and other consumer recreational equipment;
loans that finance consumer home improvements;
loans that finance commercial businesses; and
historically, loans that finance taxi medallions.

loans that finance consumer purchases of recreational vehicles, boats, and trailers;

loans that finance consumer home improvements;

loans that finance commercial businesses; and

loans that finance taxi medallions.

The following charttable shows the detailsour loans receivable as of December 31, 2023.

(Dollars in thousands)


Loans


Allowance for
Credit Losses


Net Loans
Receivable


Recreation


$

1,336,226


$

57,532


$

1,278,694


Home improvement


760,617


21,019


739,598


Commercial


114,827


4,148


110,679


Taxi medallion


3,663


1,536


2,127


Strategic partnership (1)


553


553


Total


$

2,215,886


$

84,235


$

2,131,651


(1)
Strategic partnership loans are held in our non-operating segment.

4


Recreation Lending

Recreation lending is a growth-oriented business focused on originating prime and non-prime recreation loans, comprising 60% of our loans receivable as of December 31, 2020.

(Dollars in thousands)


Loans


Allowance for

Loan Loss


Net Loans

Receivable


Recreation


$

792,686


$

27,348


$

765,338


Home improvement


334,033


5,157


328,876


Commercial


65,327


65,327


Medallion


37,768


25,043


12,725


Strategic partnership


24


24


Total


$

1,229,838


$

57,548


$

1,172,290


Consumer Loans

Consumer loans are originated by the Bank, and consist of loans for the purchase of recreational vehicles, boats, and trailers, or recreation lending; and to finance home improvements such as replacement windows and roofs, or home improvement lending. Combined consumer loans outstanding were $1,094,214,000 at December 31, 2020 and comprised 93% of our net loans receivable, compared to $939,973,000, comprising 84% of our net loans receivable, as of December 31, 2019. We believe that the consumer loan portfolio is of acceptable credit quality given the high interest rates earned on the loans, which compensate for the higher degree of credit risk in the loan portfolio.

Recreation Lending. Recreation lending is a high-growth business focused on originating prime and non-prime recreation loans.2023. The segment is a significant source of income, accounting for 76%67% of our interest income for the twelve monthsyear ended December 31, 2020.2023. All of our recreation loans are serviced by a third-party loan servicer andthat we have used the same loan servicer since the business’s inception.


Through the Bank, weWe maintain non-exclusive relationships with approximately 3,3003,200 dealers and financial service providers, or FSPs, not all of which are active at any one time. FSPs are entities that provide finance and insurance, or F&I, services to small dealers that do not have the desire or ability to provide F&I services themselves. The ability of FSPs to aggregate the financing and relationship management for many small dealers makes them valuable to the Bank.us. We receive approximately half of our loan volume from dealers and the other half from FSPs. Approximately 47%Our top ten dealer and FSP relationships were responsible for 43% of recreation lending’s new loan originations for the twelve monthsyear ended December 31, 2020 were from our top ten dealer and FSP relationships.2023. The percentage of new loan originations by the top ten dealer and FSP relationships is a measure of concentration, within the segment's loan originations, which management uses to determine whether to undertake diversification efforts, and which provides investors with information about origination concentration.

The recreation lendingloan portfolio consists of thousands of geographically distributed loans with an average loan size of approximately $14,700$20,000 as of December 31, 2020.2023.The loans are fixed rate loans with an average term at origination of approximately 1112.9 years. The weighted average remaining termmaturity of our loans outstanding at December 31, 2020 is 8.9 years, and the average payoff time is 3.310.0 years. The size, geographic dispersion, source and collateral variety of the loans reduces risk to the Company. As of December 31, 2020,2023, recreation loans were primarily secured by recreational vehicle,vehicles, or RV, loans,RVs, which make up 60%54% of the portfolio, and boat loans, which make up 19% of the portfolio. Recreation loans are made in all fifty states,to borrowers residing nationwide, with the highest concentrations in Texas California, and Florida, at 17%,15% and 10%, and 9% of loans outstanding atas of December 31, 2020 and2023 with no other states over 9%at or above 10%. As of December 31, 2023, 2022, and 2021, the weighted average FICO scores, measured at origination, of our recreation loans outstanding were 683, 671, and 668. The weighted average FICO scores at the time of origination for the loans funded in the years ended December 31, 2023, 2022, and 2021 were 686, 676, and 684.

Home Improvement Lending

. Through the Bank, we workWorking directly with contractors and FSPs, towe offer flexible customer financing for window, siding, and roof replacement;replacement, swimming pool and solar system installation;installations, and other home improvement projects. Our core product is a standard installment loan, which features affordable monthly payments and competitive interest rates for prime credit customers at no cost to the contractor. We also offer a variety of promotional loan options to help contractors close a challenging sale. Promotional loan options include same-as-cash, no interest, and deferred payment features, which allow borrowers to reduce the total cost of financing or start repayments when it is most convenient. Home improvement loans comprised 34% of our loans receivable as of December 31, 2023.

Home improvement lending operates in a manner similar to recreation lending, with a few key differences. Through the Bank, weWe currently maintain a smaller number of non-exclusive relationships, currently with approximately 800 contractors and FSPs. Management monitors the number of contractors and FSPs and their relative contributions as a means of assessing market share and segment growth. Most of our home improvement-financed sales take place in the borrower’s home instead of a store, with the contractor presenting the borrower with a bid that includes a financing option.

A large proportion of our home improvement-financed sales are facilitated by contractor salespeople with limited financing backgrounds rather than by contractor employees who provide F&I services. The result is contractor demand for financing services that facilitate an in-home transaction (e.g., information technologydigital tools, including mobile applications for phone or tablet, support for E-SIGN compliant electronic signatures, and extended operating hours), and additional supportresources for the salesperson throughout the financing process. Approximately 50%Our top ten contractors and FSP relationships were responsible for 57% of home improvement lending’s new loan originations for the twelve monthsyear ended December 31, 2020 were from our top ten contractors and FSP relationships.2023. The percentage of new loan originations by the top ten contractor and FSP relationships is a measure of concentration, within the segment's loan originations, which management uses to determine whether to undertake diversification efforts, and which provides investors with information about origination concentration.

We offer home improvement loans with only fixed rates, with an average term at origination of approximately 1413.6 years. The weighted average remaining termmaturity of our loans outstanding is 11.512.3 years as of December 31, 2020, and the average payoff term is 2.9 years.2023. The average size of the loans in our home improvement portfolio isat December 31, 2023 was approximately $16,000, and$20,000. The geographic dispersion and source and collateral variety of the home improvement loans reducesloan portfolio supplements credit quality in reducing risk to the Company. As of December 31, 2020,2023, home improvement loans were concentrated in roofs, swimming pools, roofs,and windows and solar panels at 27%41%, 24%, 13%20%, and 8%13%. Home improvement loans are made to borrowers residing in all fifty states,nationwide, with the highest concentrations in Florida, Texas and OhioFlorida both at 11%, 11%, and 9%10% of loans outstanding atas of December 31, 20202023, and with no other states over 9%at or above 10%. As of December 31, 2023, 2022, and 2021, the weighted average FICO scores, measured at origination, of our home improvement loans outstanding were 764, 753, and 754. The weighted average FICO scores at the time of origination for the loans funded in the years ended December 31, 2023, 2022, and 2021 were 771, 758, and 759.

5


Commercial LoansLending

Mainly through our subsidiary Medallion Capital, weWe originate both senior and subordinated loans nationwide to businesses to finance either the purchase of the equipment and related assets necessary to open a new business or the purchase or improvement of an existing business. From the inception of the commercial loan business, in 1987 through December 31, 2020, we have originated more than $996,725,000 of$1.0 billion in commercial loans. Commercial loans of $65,327,000$114.8 million comprised 6%5% of our net loans receivable as of December 31, 2020, compared to $69,767,000, or 6% of our net loans receivable, as of December 31, 2019.2023.


We have worked to increase our commercial loan activity, in recent years, primarily because of the attractive higher yielding nature of most of this business. We focus our marketing efforts on the manufacturing, professional, scientific, and technical services, morewith California, and Minnesota each representing 27% and 12% of the segment portfolio, and no other states having a concentration greater than 53% of which are located in the Midwest region, with the rest scattered across the country.10%. These commercial loans are primarily secured by a second position on all assets of the businesses and generally range in amount from $2,000,000$2.5 million to $5,000,000$6.0 million at origination. As a component of most of the transactions, a portion of the investment is an equity or partnership stake, and occasionally, we also receive warrants to purchase an equity interest in the borrowers or some other form of success fee or profit participation. We planseek to continue expandingexpand our commercial loan activities by developing a more diverse borrower base with a wider geographic area of coverage, and by expanding the targeted industries.

Commercial loans are generally secured by equipment, accounts receivable, real estate, or other assets, and have interest rates averaging 981437 basis points over the prevailing prime rate at the end of 2020, up from 8552023, compared to 473 basis points over the prime rate at the end of 2019.2022.

Taxi Medallion LoansLending

MedallionTaxi medallion loans of $12,725,000$3.7 million comprised less than 1% of our net loans receivable as of December 31, 2020, down from $105,022,000, or 10% of our net loans receivable, as of December 31, 2019. Including loans to unaffiliated investors and unconsolidated subsidiaries, the total amount of2023. Taxi medallion loans under our management was $119,856,000 as of December 31, 2020, compared to $218,603,000 as of December 31, 2019. Since 1979, we have originated approximately $3.6 billioncollateralized by taxi medallions in medallion loans inthe New York City Chicago, Boston, Newark, Cambridge, and other cities within the United States. In addition, our management has a long history of owning, managing, and financing taxi fleets, taxi medallions, and corporate car services, dating back to 1956.

Medallion loans collateralized by New York City taxi medallionsmetropolitan area and related assets comprised 89% and 88%100% of the taxi medallion loan portfolio as of December 31, 2020 and 2019.2023.

While medallion loans become delinquent or default, ourOur taxi medallion loans are secured by the taxi medallion and enhanced with personal guarantees of the owners, shareholders or equity members. When a borrower defaults on a loan, we have the ability to restructure the underlying loan or repossess the taxi medallion collateralizing that loan and sell it in the market or through a foreclosure auction and pursue the personal guarantees, all of which we have done. We have recorded an allowance for loancredit losses against the loans to mitigate potential future losses, and have placedsince 2020, the entire portfolio has remained on nonaccrual. Consistent with our established policy, once loans become 120 days past due, they are charged off down to collateral value and transferred to loan collateral in process of foreclosure. Taxi medallion loan collateral in process of foreclosure which was $53,128,000$10.0 million as of December 31, 2020 compared to $51,235,000 as of December 31, 2019.2023, with 100% located in the New York City metropolitan area.

New York City Market. A New York City taxi medallion is the only permitted license to operate a taxi and accept street hails in New York City, except as discussed below.City. As reported by the Taxi and Limousine Commission, or TLC, taxi medallions sold for a wide variety of prices during 2020. Our analysis of transaction activity supported2023 supporting our estimated value of $79,500, net of liquidation costs, as of December 31, 2020. We also assessed the cash flow analysis of owners and operators. The number of taxi medallions is limited by law to 13,630 medallions outstanding, of which 5,142 were active as of December 31, 2020. A New York State law permits cars for hire to pick up street hails in the boroughs outside Manhattan. Pursuant to such law, the TLC began issuing street hail livery licenses in June 2013.2023.

A prospective taxi medallion owner must qualify under the taxi medallion ownership standards set and enforced by the TLC. These standards prohibit individuals with criminal records from owning taxi medallions, require that the funds used to purchase taxi medallions be derived from legitimate sources, and mandate that taxi vehicles and meters meet TLC specifications. In addition, before the TLC will approve a taxi medallion transfer, the TLC requires a letter from the seller’s insurer stating that there are no outstanding claims for personal injuries in excess of insurance coverage. After the transfer is approved, the owner’s taxi is subject to quarterly TLC inspections.

Most New York City taxi medallion transfers are handled through approximately 19 taxi medallion brokers licensed by the TLC. In addition to brokering taxi medallions, these brokers also arrange for TLC documentation insurance, vehicles, meters, and financing. We have excellent relations with many of the most active brokers, and previously had received referrals from them regularly.

Newark Market. We estimate that Newark taxi medallions sold for approximately $108,700, net of liquidation costs, as of December 31, 2020. The number of Newark taxi medallions has been limited to 600 since 1950 by local law.

Chicago Market. We estimate that Chicago taxi medallions sold for approximately $18,500, net of liquidation costs, as of December 31, 2020. Pursuant to a municipal ordinance,Strategic Partnerships

In 2019, the number of outstanding taxi medallions is capped at 6,995 as of December 31, 2020.


Other Markets. We estimated that Boston and Cambridge taxi medallions sold for approximately $18,500 and $3,250, net of liquidation costs, as of December 31, 2020. These other markets make upBank launched a de minimis percentage of our total medallion loans receivable.

Strategic Partnership

The Bank’s strategic partnership program began in 2019, in which it partnered withto provide lending and other services to financial technology, or fintech, companies to offer loans and other financial services to customers. DuringThe Bank entered into an initial partnership in 2020 and began issuing its first loans. The associated activities are currently limited to originating loans or other receivables facilitated by our strategic partners and selling those loans or receivables to our strategic partners or other third parties without recourse within a specified time after origination, such as three business days. Revenues are currently derived primarily from contracted program fees paid to us by our strategic partners and interest income earned while the first loans were issuedor receivables remain on our books, offset by any transaction fees paid by us to our strategic partners for their role in processing loan applications. We originated $118.3 million and there were $24,000$49.5 million of strategic partnership loans for the years ended December 31, 2023 and 2022. We held $0.6 million of strategic partnership loans as of both December 31, 2020.2023 and 2022.

6


Our Strategy

Our core philosophy has been “In niches there are riches.” We try to identify markets that are profitable and where we can be an industry leader.obtain defensible market positions. The key elements of our strategy to grow our consumer lending (recreation and home improvement) and commercial lending businesses and increase their profitability include:

Capitalize on our relationships with brokers and dealers. We are committed to establishing, building, and maintaining our relationships with our brokers and dealers. Our marketing efforts are focused on building relationships with dealers in the consumer markets as we work directly with dealerships, contractors and FSPs to offer quality financing for their customers, including those with past credit challenges. We believe that our relationships with dealers and brokers provide us with, in addition to potential investmentloan origination opportunities, significant benefits, including an additional layer of due diligence and additional monitoring capabilities. We have assembled a management team that has developed an extensive network of dealer and broker relationships in our target markets over the last 50 years. We believe that our management team’s relationships with these dealers and brokers have provided and will continue to provide us with significant investmentloan origination opportunities. In 2020,2023, all of our consumer loans were generated by brokers, dealers, contractors, and dealers.FSPs.

Focus on niche industries and our expertise in these niche fields. We specialize in providing consumer loans for the purchase of RVs, boats, and trailers,other consumer recreational equipment, and to finance home improvements through contractors and suppliers in the home improvement sector. We believe our focus on these niche areas provides us with an opportunity to realize favorable returns, with less competition.returns.

Employ disciplined underwriting policies and maintain rigorous portfolio monitoring. We have an extensive loan underwriting and monitoring process. We conduct a thorough analysis of each potential loan and its prospects, competitive position, financial performance, and industry dynamics. We stress the importance of credit and risk analysis in our underwriting process. We believe that our continued adherence to this disciplined process will permit us to continue to generate a stable, diversified and increasing revenue stream of current income from our earning assets to enable us to make distributions to our stockholders.

Leverage the skills of our experienced management team. Our management team is led by our Chief Executive Officer, Mr. Alvin Murstein, and our President, Mr. Andrew M. Murstein. Alvin Murstein has over 60 years of experience in the ownership, management, and financing of taxi medallions and other commercial businesses, and Andrew M. Murstein is the third generation in his family to participate in the business and has over 30 years of experience in the ownership, management, and financing of taxi medallions and other commercial businesses. The other members of our management team including the Bank have broad investment backgrounds, with prior experience in banking and non-bank consumer and commercial lending, at specialty finance companies, middle market commercial banks, and other financial services companies. We believe that the experience and contacts of our management team will continue to allow us to effectively implement the key aspects of our business strategy.

Seek strategic acquisitions. In addition to increasing market share in existing lending markets and identifying new niches, we seek to acquire other financing businesses and related portfolios, and specialty finance companies that make secured loans to small businesses and consumers which have experienced historically low loancredit losses similar to our own. Since our initial public offering in May 1996, we have acquired eight specialty finance companies, five loan portfolios, and three taxi rooftop advertising companies.

Implement aExpand our strategic partnership program. We launched an initial fintech partnership during 2020. These activities include originating loans or other receivables marketed by our partners and selling those loans or receivables to our partners without recourseor others, within two to foura specified time after origination, such as three business days as contractually agreed.days. Revenues are to be derived primarily from contracted program fees paid to us by our partners, and interest income earned while the loans or receivables are on our books, offset by transaction fees paid to our partners for processing loan applications. Our partners are non-banks offering loans and other financial services to their customers. In the 2021 first quarter, we entered into a second strategic partnershipWe continue to provide loan origination services to our partner.evaluate and launch additional partnerships.

Carry out cost-cutting measures where appropriate. We are seeking to reduce our expenses in certain areas to better align our structure with its profitability. For example, in 2020 we reduced our employee headcount by 21% at the parent company Medallion Financial Corp. and closed satellite offices in Long Island City, New York, Chicago, Illinois, and Boston, Massachusetts.


Exit non-core investments at a profit.Loan Characteristics We aim to exit our non-core investments when possible. In the 2020 fourth quarter, we sold the assets of LAX Group, LLC. We plan to sell, when practicable to maximize our proceeds, other non-core investments like our remaining art investments of less than $1,000,000 in Medallion Fine Art, Inc.

Loan/Investment Activity

The following table sets forth the components of loan/investment activity in the consolidated/managed investment portfolio for the years indicated.


December 31,


(Dollars in thousands)


2020


2019


2018


Net loans receivable


$

1,114,762


$

981,487


$

1,380,054


Loans originated (1)


506,106


471,069


428,510


Repayments of loans (1)


(321,831

)


(251,653

)


(261,383

)

Consumer loans sold to third parties


(100,920

)

Net realized losses on loans


(42,305

)

Provision for loan losses


(69,817

)


(47,386

)


(59,008

)

Net increase in unrealized appreciation (2)


29,864


Transfers to loans in process of foreclosure


(47,254

)


(31,398

)


(53,756

)

Investment transfers excluded from loans in process of

   foreclosure (3)


(262,064

)

Deconsolidation of Trust III (4)


(71,409

)

Amortization of origination costs


(6,022

)


(4,952

)


(3,950

)

Paid-in-kind interest


1,188


834


Amortization of loan premium


(3,042

)


(3,289

)


Other, net


(1,800

)


50


(2,146

)

Net increase (decrease) in loans


57,528


133,275


(398,567

)

Net loans receivable


$

1,172,290


$

1,114,762


$

981,487


(1)

Includes refinancings.  

(2)

Excludes net unrealized depreciation of $1,915 for the three months ended March 31, 2018 related to investments other than securities and other assets.

(3)

Represents portfolio investments transferred to other asset categories and excluded from net loans receivable.

(4)

Represents the Taxi Medallion Loan Trust III, or Trust III, gross loans of $53,546 and loans in process of foreclosure that had been transferred to other assets of $17,863 as a result of the Company no longer considered the primary beneficiary of, and thus not consolidating, Trust III.

Loan Characteristics

Consumer Loans. Consumer loans generally require equal monthly payments covering accrued interest and amortization of principal over a negotiated term, generally around eleven to fourteen years. Interest rates offered are fixed. Borrowers may prepay consumer loans without any prepayment penalty. In general, the Bank has established relationships with dealers, FSPs, and contractors, in the industry, whowhich are the sources for consumer loan volumes. The loans are made up of recreation loans and home improvement loans which were 70%64% and 30%36% of total consumer loans at December 31, 2020.2023.

Our recreation loans are secured primarily by RVs, boats and trailersother consumer recreational equipment with a small proportion of loans secured by other collateral such as autos, motorcycles and boat motors. These loans, which together make up our largest and most profitable loan portfolio, have a weighted average yield of 15.62%13.07% at December 31, 2020.2023. Our home improvement loans are secured by the personal property installed on real property, and the security interest for a majoritysome of these loans is perfected with a UCC fixture filing. As of December 31, 2020,2023, these loans had a weighted average yield of 9.14%8.86%.

Commercial Loans. We have typically originated commercial loans in principal amounts generally ranging from $2,000,000$2.5 million to $5,000,000,$6.0 million, and occasionally have originated loans under or in excess of those amounts. These loans are generally retained and typically have maturities ranging from three to ten years and require monthly payments ranging from full amortization over the loan term to fully deferred interest and principal at maturity, with multiple payment options in between. Substantially allAll loans may be prepaid, and in the first five years, a prepayment fee may be owed to us. The term of, and interest rate charged on, certain of our outstanding loans are subject to the regulations of the Small Business Administration, or the SBA. Under SBA regulations, the


maximum rate of interest permitted on loans originated by us is 19%; however, terms and interest rates are subject to market competition for all loans. Unlike medallion loans, for which competition and market conditions preclude us from charging the maximum rate of interest permitted under SBA regulations, we are able to charge the maximum rate on certain commercial loans.

7


Taxi Medallion Loans. Our taxi medallion loan portfolio consists of mostly fixed-rate loans, collateralized by first security interests in taxi medallions and related assets (vehicles, meters, and the like).assets. We estimate that the weighted average loan-to-value ratio of all of the taxi medallion loans was 327%183% as of December 31, 2020,2023, compared to 190%339% as of December 31, 2019.2022. These ratios do not factor in the reserve on these loans of $25,043,000$1.5 million and $25,410,000$9.5 million as of December 31, 20202023 and 20192022 and also do not include loan collateral in process of foreclosure, held at the lower of amortized cost or collateral value. In addition, we have recourse against the vast majority of the owners of the taxi medallions and related assets through personal guarantees.

Other than in connection with dispositions of existing taxi medallion assets, Medallion loans generally require equal monthly payments covering accrued interest and amortization of principal over a five to twenty-five year schedule, subject to a balloon payment of all outstanding principal at maturity. Historically, we haveFinancial Corp. has not originated loans with one to five year maturities where interest rates are adjusted and a new maturity period set.taxi medallion loan since 2015, and the Bank has not originated a new taxi medallion loan since 2014.

Generally, we retained the medallion loans we originated. However, from time to time, we participated or sold shares of some loans or portfolios to interested third-party financial institutions. In these cases, we retained the borrower relationships and serviced the sold loans.

Marketing, Origination, and Loan Approval Process

We employ 98 personnel (including 10 furloughed employees at our parent company, Medallion Financial Corp.) as of December 31, 2020, to originate, manage, service, and collect on the consumer, commercial, and medallion loans. Each loan application is individually reviewed through analysis of a number ofseveral factors, including loan-to-value ratios, the borrower’s credit history, public records, personal interviews, trade references, personal inspection of the premises, and approval from the TLC, SBA, or other regulatory body, if applicable. Each medallioncommercial and commercialtaxi medallion loan applicant is required to provide personal or corporate tax returns, premises leases, and/or property deeds.

The Company’s senior management establishes loan origination criteria. Loans that conform to such criteria may be processed by a loan officer with the proper credit authority, and non-conforming loans (other than those by the Bank) must be approved by the Company’s Chief Executive Officer, President, and/or the Chief Credit Officer and the Investment Oversight Committee of the Company’s board of directors. Loan criteria for loans originated with the Bank is established by the Bank’s board of directors and senior management. The Bank’s policies identify specific approval authorities for its recreation and home improvement medallion, and real estate loans. Policy exceptions are reported to the Bank’s board of directors. Both medallion and commercial loans are sourced from brokers with extensive networks of applicants, and commercial loans are also referred by contacts with banks, attorneys, and accounting firms. Consumer loans are primarily sourced through relationships which have been established with RV and boat dealers, and home improvement contractors throughout our market area. Commercial loans are generally sourced through a network of private equity sponsors who we have long-standing relationships with, and are also referred by contacts with banks.

Sources of Funds

We have historically fundedManagement determines our lending operations primarily through credit facilities with banks and, to a lesser degree, through equity or debt offerings or private placements, and fixed-rate, senior secured notes and long-term subordinated debentures issued to the SBA. Since the inception of the Bank, substantially all of the Bank’s funding has been provided by FDIC insured brokered certificates of deposit. The determination of funding sources, is established by our management, based upon an analysis of the respective financial and other costs and burdens associated with funding sources. We also fund our lending operations through debt offerings and private placements, fixed-rate, senior secured notes, long-term subordinated debentures issued to the SBA, as well as preferred equity securities at our subsidiaries. In the past, we have utilized credit facilities with banks, as well as equity and debt offerings, to fund our lending operations. Our funding strategy and interest rate risk management strategy is to have the proper structuring of debt to minimize both rate and maturity risk, while maximizing returns with the lowest cost of funding over an intermediate period of time. Since the inception of the Bank, substantially all of the Bank’s borrowings have been provided by FDIC insured brokered certificates of deposit.


The table below summarizes our sources of available funds and amounts outstanding under credit facilities, exclusive of deferred financing costs of $5,805,000,$8.5 million, and their respective end of period weighted average interest rates at December 31, 2020.2023. See Note 65 to the consolidated financial statements for additional information.

(Dollars in thousands)


Total


Cash, cash equivalents, and federal funds sold


$

149,845


Brokered certificates of deposit & other funds borrowed


1,870,939


Average interest rate


3.07

%

Retail notes and privately placed borrowings


139,500


Average interest rate


8.08

%

Maturity


3/24 - 12/33


SBA debentures and borrowings


Amounts undisbursed


10,250


Amounts outstanding


75,250


Average interest rate


3.69

%

Maturity


3/24 - 3/34


Trust preferred securities


33,000


Average interest rate


7.75

%

Maturity


9/37


Total cash (1)


$

149,845


Total debt outstanding


$

2,118,689


(1)
Includes $110.0 million at the Bank and $8.9 million at SBIC subsidiaries.

(Dollars in thousands)


Total


Cash, cash equivalents, and federal funds sold


$

112,040


Brokered CDs & other funds borrowed


1,068,072


Average interest rate


1.71

%

Retail and privately placed notes


103,225


Average interest rate


8.25

%

Maturity


4/21-12/27


SBA debentures and borrowings


93,008


Amounts undisbursed


25,000


Amounts outstanding


68,008


Average interest rate


3.36

%

Maturity


3/21-9/30


Preferred securities


33,000


Average interest rate


2.35

%

Maturity


9/37


Bank loans


31,261


Average interest rate


3.67

%

Maturity


2/21-12/23


Other borrowings


8,689


Average interest rate


1.91

%

Maturity


12/21 -  6/25


Total cash


$

112,040


Total debt outstanding


$

1,312,255


8


We fund our fixed-rate loans with variable-rate credit lines and bank debt, and withfixed rate brokered or listing service certificates of deposit, fixed rate private notes, fixed-rate SBA debentures and borrowings, and to a lesser extent variable rate borrowings. The mismatch between maturities and interest-rate sensitivities of these balance sheet items results in interest rate risk. We seek to manage our exposure to increases in market rates of interest to an acceptable level by:by incurring fixed-rate debt.

Originating adjustable rate loans; and

Incurring fixed-rate debt.

Nevertheless, we accept varying degrees of interest rate risk depending on market conditions. For additional discussion of our funding sources and asset liability management strategy, see Asset/Liability Management on page 57.53.

Competition

Banks, credit unions, and finance companies, some of which are SBICs, compete with us in originating consumer commercial and medallioncommercial loans. Many of these competitors have greater resources than we have, and certain competitors are subject to less restrictive regulations than we are. As a result, we cannot assure you that we will be able to identify and complete the financing transactions that will permit us to compete successfully.


Human Capital Resources

As of December 31, 20202023, we employed 187 persons, including 87169 persons: 128 at our Medallion Bank, subsidiary. We believe that relations with our employees are good. The total number of employees includes 11 furloughed employees33 at our parent company, and 8 at Medallion Financial Corp.,Capital. This compares to 158 persons at the end of 2022: 119 at Medallion Bank, 33 at our parent company, and effective March 2, 2021 were terminated as a result of expense-cutting measures due6 at Medallion Capital.

We are committed to the ongoing effects of the COVID-19 pandemic. We have a single human resources departmenthiring inclusively, fostering an inclusive culture, and ensuring equitable pay for all of our subsidiaries, except for RPAC, which employs its own human resources personnel.

employees. We value diversity among all of our employees. Equal employment opportunity is a fundamental principle at the Company, where employment is based upon personal capabilities and qualifications. We prohibit and do not tolerate any discrimination against employees, applicants, interns or any other covered persons, and we ensure equal employment opportunity without discrimination on the basis of race, color, creed, religion, national origin, ancestry, ethnicity, citizenship status, physical or mental disability, age, sex (including pregnancy), gender, gender identity or gender expression (including transgender status), marital status, familial status, veteran status, genetic information or any other protected characteristic as established by applicable federal, state or local law.

We incentivize our employees through a combination of competitive salary, equity compensation and other benefits. We provide most employees with incentive bonuses in the form of restricted stockcash and stock options.equity. Employee equity ownership helps us attract, retain, motivate and reward employees, while aligning employee compensation with our stockholders’ interests by linking realizable pay with stock performance.

Our Compensation Committee reviews management’s recommendations and advises management and the Board of Directors on broad compensation policies such as salary ranges, annual incentive bonuses, long-term incentive plans, including equity-based compensation programs, and other benefit and perquisite programs.

We have a 401(k) Investment Plan and other generally available benefit programs like health insurance, paid and unpaid leaves, life insurance, disability coverage, accident insurance and critical illness insurance; we believe that the availability of these benefit programs generally enhance employee productivity and loyalty to the Company. We believe it is important for our employees at the Bank to provide service to the communities in which they live and encourage them to take time, including prearranged work time, to participate in activities of local civic organizations, charitable or nonprofit organizations or educational institutions. We value employee development and training and are committed to identifying and developing the talents of our next-generation leaders. Our employee benefits also help protect the health, well-being and financial security of our employees.

The health and safety of our employees is one of our highest priorities. As we continue to monitor the spread of COVID-19 and its ongoing effects, we have and will continue to implement measures to help ensure the health and safety of our employees.  In March 2020, as a result of the COVID-19 pandemic, our employees were directed to work remotely on a temporary basis. To the extent necessary, employees were provided with equipment, including laptops. As the severity of the pandemic subsided and states and cities began reopening, in late June 2020, our employees returned to work in our New York City offices on a part-time basis in accordance with local guidelines, while our employees outside of New York City largely continue to work remotely. The Bank’s current plan is to return most employees to office work, in alternating shifts, sometime in the second quarter of 2021, but such plans are dependent on the case counts, mortality rates, vaccination availability, use and effectiveness and other factors in Utah and Washington State. We have implemented and continue to monitor changes in health and safety legal and regulatory requirements to help protect the health and safety of our employees. Additionally, while there are certain risks with our workforce working remotely, we have implemented additional mitigating controls to help reduce such risks.


9


MATERIAL US FEDERAL INCOME TAX CONSIDERATIONSSUPERVISION AND REGULATION

For our tax years ended December 31, 2020 and 2019, we have been taxed as a corporation and must pay corporate-level federal and state income taxes on our taxable income. Because we were taxed as a corporation under Subchapter C of the Internal Revenue Code, or the Code, for the tax years ended December 31, 2020 and December 31, 2019, we are able to carry forward any net operating losses incurred to succeeding years. In addition, distributions will generally be taxable to our stockholders to the extent of our current and accumulated earnings and profits for US federal tax purposes. Distributions in excess of our current and accumulated earnings and profits would be treated first as a return of capital to the extent of a stockholder’s tax basis, and any remaining distributions would be treated as a capital gain. Subject to certain limitations under the Code, corporate distributees would be eligible for the dividends received deduction.

REGULATION

Exemption from the 1940 Act

In order to maintain our status as a non-investment company, we operate so as to fall outside the definition of an “investment company” or within an applicable exception. We expect to continue to fall within the exception from the definition of an “investment company” provided under Section 3(c)(6) of the 1940 Act as a company primarily engaged, directly or through majority-owned subsidiaries, in the business of, among other things, (i) banking, (ii) purchasing and otherwise acquiring notes, drafts, acceptances, open accounts receivable, and other obligations representing part or all of the sales price of merchandise, insurance and services, and (iii) making loans to manufacturers, wholesalers, and retailers of, and to prospective purchasers of, specified merchandise, insurance, and services. We monitor our continued compliance with this exception and were compliant with as of December 31, 2020.2023.

Regulation of Medallion Bank as an Industrial Bank

In May 2002, we formed the Bank, which received approval from the FDIC for federal deposit insurance in October 2003. The Bank is subject to extensive federal and state banking laws, regulations, and policies that are intended primarily for the protection of depositors, the Deposit Insurance Fund, and the banking system as a whole;whole, not for the protection of our other creditors and stockholders.

Under the banking charter, the Bank is authorized to make consumer and commercial loans and may accept all FDIC-insured deposits other than demand deposits (checking accounts). As a state-charted non-member bank with FDIC-insured deposits, the Bank is examined, supervised and regulated by the FDIC and the Utah Department of Financial Institutions, or the Utah DFI. The statutes enforced by, and regulations and policies of, these agencies affect almost all aspects of its business, including by prescribing permissible types of loans and investments, the amount of required capital, the permissible scope of its activities and various other requirements. If the Bank’s regulators were to determine that we have violated banking laws and regulations, including by engaging in unsafe and unsound practices, the Bank could be subject to enforcement and other regulatory actions, which could have an adverse effect on its business, results of operations and financial condition.

Capital Standards

The Bank is subject to risk-based and leverage-based capital ratio requirements under the USU.S. Basel III capital rules adopted by the federal banking regulators.

Under the risk-based capital standards, the Bank’s assets, exposures and certain off-balance sheet items are assigned to broad risk categories, each with designated weights, and the resulting capital ratios represent capital as a percentage of total risk-weighted assets. The minimum capital ratios applicable to us are as follows:

CET1 Risk-Based Capital Ratio, equal to the ratio of Common Equity Tier 1, or CET1, capital to risk-weighted assets. CET1 capital primarily includes common shareholders’ equity subject to certain regulatory adjustments and deductions, including with respect to goodwill, intangible assets, certain deferred tax assets and accumulated other comprehensive income. The minimum CET1 risk-based capital ratio requirement is 4.5%.

CET1 Risk-Based Capital Ratio, equal to the ratio of Common Equity Tier 1 (CET1), capital to risk-weighted assets. CET1 capital primarily includes common shareholders’ equity subject to certain regulatory adjustments and deductions, including with respect to goodwill, intangible assets, certain deferred tax assets and accumulated other comprehensive income. The minimum CET1 risk-based capital ratio requirement is 4.5%.

Tier 1 Risk-Based Capital Ratio, equal to the ratio of Tier 1 capital to risk-weighted assets. Tier 1 capital primarily consists of CET1 capital and perpetual preferred stock. The minimum Tier 1 risk-based capital ratio requirement is 6%.

Tier 1 Risk-Based Capital Ratio, equal to the ratio of Tier 1 capital to risk-weighted assets. Tier 1 capital primarily consists of CET1 capital and perpetual preferred stock. The minimum Tier 1 risk-based capital ratio requirement is 6%.

Total Risk-Based Capital Ratio, equal to the ratio of total capital, including CET1 capital, additional Tier 1 capital and Tier 2 capital, to risk-weighted assets. The Bank’s Tier 2 capital primarily includes allowance for loan and lease losses up to 1.25% of the Bank’s risk-weighted assets.The minimum total risk-based capital ratio requirement is 8%.

Total Risk-Based Capital Ratio, equal to the ratio of total capital, including CET1 capital, additional Tier 1 capital and Tier 2 capital, to risk-weighted assets. The Bank’s Tier 2 capital primarily includes allowance for credit losses up to 1.25% of the Bank’s risk-weighted assets. The minimum total risk-based capital ratio requirement is 8%.

Tier 1 Leverage Ratio, equal to the ratio of Tier 1 capital to quarterly average assets (net of goodwill, certain other intangible assets and certain other deductions). The minimum Tier 1 leverage ratio requirement is 4%.


The prompt corrective action framework, which generally applies to FDIC-insured depository institutions, including the Bank, also includes capital requirements the Bank must satisfy in order to, among other things, be able to accept brokered deposits without limitations. See “Prompt Corrective Action” and “Brokered Deposits” below.

In addition to meeting the minimum capital requirements, under the USU.S. Basel III capital rules, the Bank must also maintain the required capital conservation buffer of 2.5% to avoid becoming subject to restrictions on capital distributions (including dividends on the Bank’s preferred stock) and certain discretionary bonus payments to management. The capital conservation buffer is calculated as a ratio of CET1 capital to risk-weighted assets, and it effectively increases the required minimum risk-based capital ratios.

10


The table below shows the capital requirements the Bank is required to maintain:

Minimum USU.S. Basel III Regulatory Capital
Ratio Plus Capital Conservation Buffer

CET1 risk-based capital ratio

7.0%

Tier 1 risk-based capital ratio

8.5%

Total risk-based capital ratio

10.5%

For purposes of calculating the denominator of the three risk-based capital ratios, the assets of covered banking organizations are given risk weights that, under the USU.S. Basel III capital rules, range from 0% to 1,250%, depending on the nature of the asset. Most of the Bank’s loans are assigned a 100% risk weight, with loans that are 90 days or more past due or on nonaccrual assigned a 150% risk weight. In addition, direct obligations of the USU.S. Department of the Treasury or the US Treasury,(U.S. Treasury), or obligations unconditionally guaranteed by the USU.S. government have a 0% risk weight, while general obligation claims on states or other political subdivisions of the United States are assigned a 20% risk weight, except for municipal or state revenue bonds, which have a 50% risk weight.

The USU.S. Basel III capital rules provide for limited recognition in CET1 capital, and deduction from CET1 capital above certain thresholds, of three categories of assets: (i) deferred tax assets arising from temporary differences that cannot be realized through net operating loss carrybacks (net of related valuation allowances and of deferred tax liabilities), (ii) mortgage servicing assets (net of associated deferred tax liabilities) and (iii) investments in more than 10% of the issued and outstanding common stock of unconsolidated financial institutions (net of associated deferred tax liabilities). In July 2019, theThe federal banking regulators issuedhave adopted a final rule that is designed to simplify the capital treatment of those categories of assets for banking organizations, such as the Bank, thatwhich are not subject to the advanced approaches in the USU.S. Basel III capital rules. The provisions final rule became fully effective for the Bank on April 1, 2020.

In December 2017, the Basel Committee published standards that it described as the finalization of the Basel III post-crisis regulatory reforms. Among other things, these standards revise the Basel Committee’s standardized approach for credit risk and provide a new standardized approach for operational risk capital. The Basel Committee’s standards will generally be effective on January 1, 2023. As with all standardsIn July 2023, the U.S. federal bank regulatory agencies proposed bya rule implementing the Basel Committee,Committee's finalization of the December 2017 standards are not effective in any jurisdiction until rules implementing such standards have been implemented by the relevant regulators in such jurisdiction. Following the release of these standards, the federal banking regulators stated that the standards are intendedpost-crisis regulatory capital reforms. The proposed rule would apply to achieve various objectives with regard to internationally activelarge banks and thatbanks with significant trading activity. Capital requirements would not change for community banks, which includes the regulators will consider how to apply the standards in the United States.Bank.

Federal banking regulators published a final rule, effective in April 1, 2019, permitting banking organizations to phase in any adverse day-one regulatory capital effects of the adoption of ASU 2016-13 (referred to as the current expected credit loss model, or CECL), over a period of three years. The Bank formally adopted CECL on January 1, 2023. For additional information on ASU 2016-13, see “Note 1. Organization and Summary of Significant Accounting Policies” in the annual audited financial statements included elsewhere in this Form 10-K.

The Economic Growth, Regulatory Relief, and Consumer Protection Act of 2018, or EGRRCPA, required the federal banking regulators to adopt regulations to implement an exemption from the USU.S. Basel III capital rules for smaller banking organizations, including the Bank, thatwhich maintain a “Community Bank Leverage Ratio” of at least 8% to 10%. Specifically, the EGRRCPA provides that if any depository institution or depository institution holding company with less than $10 billion in total consolidated assets maintains tangible equity in excess of this leverage ratio, as implemented by the federal banking regulators, it would be deemed to be in compliance with (i) the leverage and risk-based capital requirements promulgated by the federal banking agencies; (ii) in the case of a depository institution, the capital ratio requirements to be considered “well-capitalized” under the federal banking agencies’ “prompt corrective action” regime; and (iii) “any other capital or leverage requirements” to which the depository institution or holding company is subject, unless the appropriate federal banking agency determines otherwise based on the particular institution’s risk profile.profile.


The FDIC has adopted a final rule, which took effect in January 2020, implementing the Community Bank Leverage Ratio. Under the rule, the Community Bank Leverage Ratio is the same as the Tier 1 Leverage Ratio under the Basel III capital rules and a qualifying small banking organization, such as the Bank, that has less than $10 billion in total consolidated assets and meets certain risk-based criteria can choose to apply the Community Bank Leverage Ratio framework if its Community Bank Leverage Ratio is greater than 9%. The Coronavirus Aid, Relief, and Economic Security Act, enacted on March 27, 2020, directed by the FDIC and other federal banking regulators to decrease temporarily the Community Bank Leverage Ratio to 8%, which the federal banking regulators implemented did by adopting a temporary rule. The Bank has not elected and currently does not expect to elect to apply the Community Bank Leverage Ratio framework but will continue to assess the framework and may choose to apply it in the future.

As a condition to receipt of FDIC insurance, the Bank entered into the 2003a capital maintenance agreement with the FDIC, or the 2003 Capital Maintenance Agreement, requiring it to maintain a 15% leverage ratio (Tier 1 capital to average assets) and an adequate allowance for loan and leasecredit losses and restricting the amount of taxi medallion loans that the Bank may finance to three times the Bank’s Tier 1 capital.

11


Prompt Corrective Action

The Bank is subject to FDIC regulations which apply to every FDIC-insured depository institution, setting out a system of mandatory and discretionary supervisory actions that generally become more severe as the capital levels of an individual institution decline. Pursuant to provisions of the Federal Deposit Insurance Act, or FDIA, and related regulations with respect to prompt corrective action, the federal banking regulators must take “prompt corrective action” with respect to FDIC-insured depository institutions that do not meet minimum capital requirements. The FDIA sets forth the following five capital categories: “well-capitalized,” “adequately capitalized,” “undercapitalized,” “significantly undercapitalized” and “critically undercapitalized.” An insured depository institution’s capital category depends upon how its capital levels compare with various relevant capital measures and certain other factors that are established by regulation.


“Well-capitalized”


“Adequately capitalized”

CET1 risk-based capital ratio


6.5%


4.5%

Tier 1 risk-based capital ratio


8.0%


6.0%

Total risk-based capital ratio


10.0%


8.0%

Tier 1 leverage ratio


5.0%


4.0%


“Well-capitalized”

“Adequately capitalized”

CET1 risk-based capital ratio

6.5%

4.5%

Tier 1 risk-based capital ratio

8.0%

6.0%

Total risk-based capital ratio

10.0%

8.0%

Tier 1 leverage ratio

5.0%

4.0%

If a bank meets the quantitative thresholds for well-capitalized status provided above and is not subject to any written agreement, order or directive from the appropriate regulatory agency to meet and maintain a specific capital level, it will qualify as well-capitalized. Failure to be well-capitalized or to meet minimum capital requirements could result in certain mandatory and possible additional discretionary actions by regulators that, if undertaken, could have a material adverse effect on the Bank’s operations or financial condition. See “Brokered Deposits” below for additional information. Failure to be well-capitalized or to meet minimum capital requirements could also result in restrictions on the Bank’s ability to pay dividends or otherwise distribute capital or to receive regulatory approval of applications. Pursuant to the 2003 capital maintenance agreement,Capital Maintenance Agreement, the Bank has agreed that the Bank’s capital levels will at all times meet or exceed the levels required for the Bank to be considered well-capitalized under FDIC rules.

Brokered Deposits

The Bank uses “brokered deposits” to fund a substantial portion of the Bank’s activities. Under the FDIA and related regulations, FDIC-insured institutions such as the Bank may only accept brokered deposits without FDIC permission if they meet specified capital standards and are not subject to any written agreement, order or directive to meet and maintain a specific capital level, and are subject to restrictions with respect to the interest they may pay on deposits unless they are well-capitalized. In particular, the FDIA and the FDIC’s regulations prohibit an insured depository institution from accepting brokered deposits or offering interest rates on any deposits significantly higher than the prevailing rate in the bank’s normal market area or nationally (depending upon where the deposits are solicited), unless it is well-capitalized or is adequately capitalized and receives a waiver from the FDIC. A depository institution that is adequately capitalized and accepts

Under FDIC regulations governing brokered deposits under a waiver from the FDIC may not pay an interest rate on any deposit in excess of 75 basis points over certain prevailing market rates.

In December 2020, the FDIC issued a final rule intended to modernize its regulations on brokered deposit and interest rate restrictions. Under the rule, effective April 1, 2021, aA bank that is “adequately capitalized” and accepts brokered deposits under a waiver from the FDIC may not pay an interest rate, onat the time any such deposit is accepted, in excess of (i) 75 basis points over certain national rates described in the FDIC’s regulations or (ii) 90% of the highest interest rate paid on a particular deposit product in the bank’s local market area, if the bank provides notice to the FDIC and evidence of such local rate. There are no such restrictions under the FDIC on a bank that is well-capitalized.


Pursuant to the 2003 capital maintenance agreement,Capital Maintenance Agreement, the Bank has agreed that our capital levels will at all times meet or exceed the level required for the Bank to be considered well-capitalized under FDIC rules. If the Bank was no longer able to accept or renew brokered deposits as a result of failing to meet the requisite capital standards or as a result of being subject to a written agreement, order or directive to meet and maintain a specific capital level, there would be a material adverse effect on the Bank’s business, financial condition, liquidity and results of operations.

Deposit Insurance

The Bank’s deposits have the benefit of FDIC insurance up to the applicable limits. The FDIC’s Deposit Insurance Fund, or DIF, is funded by assessments on insured depository institutions, such as us. The Bank’s assessment (subject to adjustment by the FDIC) is currently based on the Bank’s average total consolidated assets less the Bank’s average tangible equity during the assessment period, the Bank’s supervisory ratings, and specified forward-looking financial measures used to calculate the assessment rate.

In October 2022, the FDIC adopted a rule applicable to all FDIC-insured banks that increased initial base deposit insurance assessment rates by 2 basis points, beginning with the first quarterly assessment period of 2023. The FDIC, as required under the FDIA, established a plan in September 2020 to restore the DIF reserve ratio to meet or exceed the statutory minimum of 1.35 percent within eight years. The increased assessment is intended to improve the likelihood that the DIF reserve ratio would reach the required minimum by the statutory deadline of September 30, 2028.

12


In November 2023, the FDIC adopted a final rule providing for the recovery, by special assessment, of losses to the FDIC deposit insurance fund as a result of the FDIC’s use of the systemic risk exception following the closures of Silicon Valley Bank and Signature Bank. In addition, the FDIC must recover, by special assessment, losses to the FDIC deposit insurance fund as a result of the FDIC’s use of the systemic risk exception to the least cost resolution test under the FDIA. The special assessment will be collected on the basis of insured depository institution’s uninsured deposits, adjusted to exclude the first $5 billion of uninsured deposits, and will therefore not be applicable to us.

Payment of Dividends

The power of the board of directors of an insured depository institution to declare a cash dividend or other distribution with respect to capital is subject to statutory and regulatory restrictions that limit the amount available for such distribution, depending upon earnings, financial condition and cash needs of the institution, as well as general business conditions. Insured depository institutions are also prohibited from paying management fees to any controlling persons or, with certain limited exceptions, making capital distributions, including dividends, if after such transaction the institution would be less than adequately capitalized.

Under Utah law, the Bank may only declare dividends to the Bank’s shareholders out of the Bank’s net profits, after providing for all expenses, losses, interest and taxes accrued or due. Further, the Bank is required to transfer to a surplus fund at least 10% of the Bank’s net profits before dividends for the period covered by the dividend until the surplus fund reaches 100% of the Bank’s capital stock. Any amount paid from the Bank’s net earnings into a fund for the retirement of outstanding debt capital instruments or preferred stock for the period covered by the dividend will be considered an addition to the Bank’s surplus fund if, upon the retirement of such instruments, the amount paid into the retirement fund for the period may be properly carried to the Bank’s surplus fund.

The federal banking agencies also have authority to prohibit depository institutions from engaging in business practices that are considered unsafe or unsound, possibly including payment of dividends or other payments under certain circumstances even if such payments are not expressly prohibited by statute.

In addition, as discussed under “Capital Standards,” if the Bank’s risk-based capital ratios do not satisfy the minimum risk-based requirements plus the capital conservation buffer, the Bank will face graduated constraints on, among other things, capital distributions (including dividends on the Bank’s preferred stock) based on the amount of the shortfall and the amount of the Bank’s eligible retained income. For these purposes, eligible retained income is defined as the greater of (i) net income for the four preceding quarters, net of distributions and associated tax effects not reflected in net income; and (ii) the average net income over the preceding four quarters.

Safety and Soundness

The FDIA also implemented certain specific restrictions on transactions and required federal banking regulators to adopt overall safety and soundness standards for depository institutions related to internal controls, information systems and internal audit systems, loan documentation, credit underwriting, interest rate risk exposure, asset growth, asset quality, earnings, stock valuation and compensation, fees and benefits, and such other operational and managerial standards as the agencies deem appropriate. Guidelines adopted by the federal banking regulators establish general standards relating to internal controls and information systems, internal audit systems, loan documentation, credit underwriting, interest rate exposure, asset growth and compensation, fees and benefits. In general, these guidelines require, among other things, appropriate systems and practices to identify and manage the risk and exposures specified in the guidelines. These guidelines also prohibit excessive compensation as an unsafe and unsound practice and describe compensation as excessive when the amounts paid are unreasonable or disproportionate to the services performed by an executive officer, employee, director or principal shareholder. The federal banking agencies may require an institution to submit to an acceptable compliance plan as well as have the flexibility to pursue other more appropriate or effective courses of action given the specific circumstances and severity of an institution’s noncompliance with one or more standards. The FDIC may also terminate deposit insurance upon a finding that the institution has engaged in unsafe and unsound practices, is in an unsafe or unsound condition to continue operations, or has violated any applicable law, regulation, rule, order or condition imposed by the FDIC.

Among other things, in addition to the restrictions on brokered deposits discussed above, the FDIA limits the interest rates paid on deposits by undercapitalized institutions and limits the aggregate extensions of credit by a depository institution to an executive officer, director, principal shareholder or related interest.

13


Consumer Financial Protection

The Bank is subject to a number of federal and state consumer protection laws that extensively govern the Bank’s consumer lending businesses. These laws include, but are not limited to, the Equal Credit Opportunity Act, the Fair Credit Reporting Act, the Truth in Lending Act, the Electronic Fund Transfer Act and these laws’ respective state-law counterparts, as well as laws regarding unfair and deceptive acts and practices. These federal and state laws, among other things, require disclosures of the cost of credit and terms of deposit accounts, provide substantive consumer rights, prohibit discrimination in credit transactions, regulate the use of credit


report information, provide financial privacy protections, prohibit unfair, deceptive and abusive practices and subject the Bank to substantial regulatory oversight. Violations of applicable consumer protection laws can result in significant potential liability from litigation brought by customers, including actual damages, restitution and attorneys’ fees. Federal banking regulators, state attorneys general and state and local consumer protection agencies may also seek to enforce consumer protection requirements and obtain these and other remedies, including regulatory sanctions, customer rescission rights, and civil money penalties. Failure to comply with consumer protection requirements may also result in substantial reputational harm that could adversely affect our business.

Community Reinvestment Act of 1977

The Bank is subject to certain requirements and reporting obligations under the Community Reinvestment Act, or CRA. Under the CRA, the Bank has an obligation, consistent with safe and sound operations, to help meet the credit needs of ourthe Bank's entire assessment area, including low- and moderate-income individuals and communities in that assessment area. Currently, the Bank's assessment area is Salt Lake County, Utah. In connection with its examination of the Bank, the FDIC is required to assess ourthe Bank's CRA performance in the areas of lending, investments and services. The FDIC may take compliance with the CRA into account when regulating and supervising ourthe Bank's other activities. The CRA also requires the agencies to take into account banks’ records of meeting community credit needs when evaluating applications for, among other things, new branches or mergers. We have elected to be evaluated for ourthe Bank's compliance with CRA requirements based on a strategic plan we adopted with public involvement and regulatory approval. That strategic plan includes measurable goals for helping to meet the credit needs of ourthe Bank's assessment area and is available on ourthe Bank's website. The CRA provides that CRA examination ratings be made public. The Bank received a rating of “Outstanding” in its most recently completed CRA examination.

In December 2019,October 2023, the Federal Reserve, the FDIC, and the Office of the Comptroller of the Currency, or the OCC, and the FDIC issued a notice of proposed rulemaking intended to (i) clarify which activities qualify for CRA credit; (ii) update where activities count for CRA credit; (iii) create a more transparent and objective method for measuring CRA performance; and (iv) provide for more transparent, consistent, and timely CRA-related data collection, recordkeeping, and reporting. In May 2020, the OCCjointly issued a final rule that implementedsignificantly amended the agencies’ regulatory framework implementing the CRA. The revised federal CRA regulations tailor CRA evaluations to bank size and type, with many of the changes applying only to banks with more than $2 billion in assets, such as the Bank. The final rule introduced major changes in four key areas: (1) the delineation of assessment areas, (2) the overall evaluation framework and performance standards and metrics, (3) the definition of community development activities and (4) data collection and reporting. The final rule will be effective on April 1, 2024, but most provisions of the noticerule, including the new tests, the need to define retail lending assessment areas and the data collection requirements, will become applicable on January 1, 2026. Reporting of proposed rulemaking and added certain clarifications and transitional relief. The FDIC didthe collected data will not join in the final rule and indicated that it was not prepared to finalize the proposal at that time. The Bank will continue to evaluate any changes to the CRA regulations and their impact to the Bank’s financial condition, results of operations or liquidity.be required until April 1, 2027.

Transactions with Affiliates and Insiders

The Bank is subject to certain federal laws that restrict and control our ability to extend credit and provide to or receive services from its affiliates under Sections 23A and 23B of the Federal Reserve Act and Regulation W promulgated thereunder. An affiliate of a bank is any company or entity that controls, is controlled by or is under common control with the bank. These restrictions include quantitative and qualitative limits on the amounts and types of transactions that may take place, including the transfer of funds by the Bank to certain of its affiliates in the form of loans, extensions of credit, investments, or purchases of assets. These restrictions also require that credit transactions with affiliates be collateralized and that its transactions with affiliates be on terms no less favorable to the Bank than comparable transactions with unrelated third parties. Generally, the Bank’s covered transactions with any affiliate are limited to 10% of our capital stock and surplus, and covered transactions with all affiliates are limited to 20% of our capital stock and surplus.

The Bank is also subject to limits under federal law on its ability to extend credit to its directors, executive officers and principal shareholders (persons that beneficially own or control more than 10% of any class of our voting stock), as well as to entities owned or controlled by such persons. Among other things, extensions of credit to such insiders are required to be made on terms that are substantially the same as, and follow credit underwriting procedures that are not less stringent than those prevailing for comparable transactions with non-insiders. Also, the terms of such extensions of credit may not involve more than the normal risk of non-repayment or present other unfavorable features and may not exceed certain limitations on the amount of credit extended to such persons individually and in the aggregate. Certain extensions of credit also require the approval of the Bank’s board of directors.


14


Financial Privacy and Cybersecurity

Federal and state law contains extensive consumer privacy protection provisions. The Gramm-Leach-Bliley Act requires financial institutions to periodically disclose their privacy policies and practices relating to their collection, sharing suchand protection of nonpublic personal information and enables retail customers to opt out of institutions’ ability to sharetheir information being shared by financial institutions with unaffiliated third parties under certain circumstances. Other federal and state laws and regulations impact our ability to share certain information with affiliates and non-affiliates for marketing and/or non-marketing purposes, or to contact customers with marketing offers. The Gramm-Leach-Bliley Act also requires financial institutions to implement a comprehensive information security program that includes administrative, technical and physical safeguards to ensure the security and confidentiality of customer records and information. Federal law also makes it a criminal offense, except in limited circumstances, to obtain or attempt to obtain customer information of a financial nature by fraudulent or deceptive means.

State regulators have been increasingly active in implementingenacting or promulgating privacy and cybersecurity standards and regulations. In recent years, several states have adopted regulations requiring certain financial institutions to implement and maintain cybersecurity programs and providing detailed requirements with respect to these programs, including data encryption requirements. Many states have also implemented or modified their data breach notification and data privacy requirements. For example, the California Consumer Privacy Act, which became effective in January 2020, applies

In addition, pursuant to for-profit businesses that conduct business in California and meet certain revenue or data collection thresholds and imposes privacy compliance obligations with regardrequirements applicable to the personal information of California residents.

In December 2020, federal banking regulators issued a proposed rule that would implement notification requirements forFDIC-supervised banking organizations, in connection with significant computer-security incidents. Under the proposed rule, a banking organization would besuch as us, we are required to notify its primary federal regulatorthe FDIC within 36 hours after the discovery of an incidentincidents that couldhave materially disrupted, degraded, or are reasonably likely to materially disrupt or impairdegrade the banking organization’s ability to carry out banking operations, activities or processes or deliver services to a material portion of its customer base, affectjeopardize the viability of key business linesoperations of the banking organization, or impactpose a threat to the financial stability of the United States. No such incidents occurred during 2023.

Anti-Money Laundering and the USA PATRIOT Act

The Bank is subject to the anti-money laundering or AML,(AML) provisions of the Bank Secrecy Act, or the BSA, as amended by the USA PATRIOT Act, or the PATRIOT Act, and implementing regulations issued by the FDIC and the USU.S. Treasury. The PATRIOT Act, which includes the International Money Laundering Abatement and Anti-Terrorist Financing Act of 2001, is intended to facilitate the detection and prosecution of terrorism and international money laundering. The PATRIOT Act establishes standards for verifying customer identification incidental to the opening of new accounts. Other provisions of the PATRIOT Act provide for special information sharing procedures governing communications with the government and other financial institutions with respect to suspected terrorists and money laundering activity, and enhancements to suspicious activity reporting, including electronic filing of suspicious activity reports over a secure filing network. The BSA requires all financial institutions, including banks, to, among other things, establish a risk-based system of internal controls reasonably designed to prevent money laundering and the financing of terrorism. The BSA includes a variety of record-keeping and reporting requirements (such as cash and suspicious activity reporting), as well as due diligence/know-your-customer documentation requirements. In January 2021, the Anti-Money Laundering Act of 2020, or AMLA, which amends the BSA, was enacted.

The AMLA is intended to comprehensively reform and modernize US anti-money laundering laws. Many of the statutory provisions in the AMLA will require additional rulemakings, reports and other measures, and the impact of the AMLA, including on our compliance costs and compliance risk relating to the BSA, will depend on, among other things, rulemaking and implementation guidance. The USU.S. Treasury’s Office of the Financial Crimes Enforcement Network, or FinCEN, issued a final rule, applicable as of May 2018, to clarify and enhance customer due diligence requirements for financial institutions. The rule (among other things) imposes certain obligations on covered financial institutions with respect to their “legal entity customers,” including corporations, limited liability companies and other similar entities. For each such customer that opens an account (including an existing customer opening a new account), the covered financial institution must identify and verify the customer’s “beneficial owners,” who are specifically defined in the rule. Bank regulators routinely examine institutions for compliance with customer due diligence obligations. The Anti-Money Laundering Act of 2020, or AMLA, which amends the BSA, is intended to comprehensively reform and modernize U.S. anti-money laundering laws. Among other things, the AMLA codifies a risk-based approach to AML compliance for financial institutions; requires the U.S. Department of the Treasury to periodically promulgate priorities for anti-money laundering and countering the financing of terrorism policy; requires the development of standards by the Treasury Department for testing technology and internal processes for BSA compliance; expands enforcement- and investigations-related authority, including a significant expansion in the available sanctions for certain BSA violations and expands BSA whistleblower incentives and protections. Many of the statutory provisions in the AMLA will require additional rulemakings, reports and other measures, and the impact of the AMLA, including on our compliance costs and compliance risk relating to the BSA, will depend on, among other things, rulemaking and implementation guidance.

In June 2021, FinCEN issued the priorities for anti-money laundering and countering the financing of terrorism policy required under the AMLA. The priorities include corruption, cybercrime, terrorist financing, fraud, transnational crime, drug trafficking, human trafficking and proliferation financing.

15


Regulation by the SBA

Medallion Funding and Medallion Capital and Freshstart are each licensed by the SBA to operate as SBICs, under the Small Business Investment Act of 1958, as amended, or the SBIA. Freshstart, through 2023, was licensed by the SBA to operate as an SBIC. The SBIA authorizes the licensing of privately-heldprivately held investment vehicles as SBICs in order to provide long term financing to small business concerns. Under the SBIA and the regulations promulgated by the SBA thereunder, a “small business concern” is a business that is independently owned and operated, which is not dominant in its field of operation, and which (i) has a tangible net worth, together with any affiliates, of $19.5$24.0 million or less and average annual net


income after USU.S. federal income taxes for the preceding two fiscal years of $6.5$8.0 million or less (average annual net income is computed without the benefit of any carryover loss), or (ii) satisfies alternative criteria under the Federal government’s North American Industry Classification System, or the NAICS, that assigns codes to the industry in which a small business is engaged and provides a small business size standard based either on the number of persons employed by the business or its gross revenues. In addition, at the end of each fiscal year, at least 25% of the total amount of investments must be made in “smaller enterprises” that have a net worth of $6.0 million or less, and average net income after federal income taxes for the preceding two years of $2.0 million or less. A business that meets the NAICS size standards also qualifies as a “smaller enterprise” for purposes of meeting SBA’s size standard regulations.

Investments by SBICs must generally be in active, primarily domestic businesses. SBIC regulations preclude investment in the following types of businesses: (1) business whose primary business activity is as a relender or reinvestor (that is, directly or indirectly, providing funds to others, purchasing debt obligations, factoring, or long term leasing of equipment with no provision for maintenance or repair); (2) many kinds of real estate projects; (3) single purpose projects that are not continuing businesses; (4) companies located outside the USU.S. intending to use the proceeds of the investment outside of the USU.S. or companies that are located in the USU.S. that have more than 49% of their employees or tangible assets located outside of the US; (5) businesses that are passive and do not carry on an active trade or business; (6) businesses that use 50% or more of the funds to buy goods or services from an associated supplier; and (7) certain “sin businesses” such as gambling and the like.

Under current SBA regulations, the maximum rate of interest that Medallion Funding and Medallion Capital and Freshstart may charge may not exceed the higher of (i) 19% or (ii) the sum of (a) the higher of (i) that company’s weighted average cost of qualified borrowings, as determined under SBA regulations, or (ii) the current SBA debenture rate, plus (b) 11%, rounded to the next lower eighth of one percent. As of December 31, 2020,2023, the maximum rate of interest permitted on loans originated by Medallion Funding, Medallion Capital, and Freshstartour SBICs was 19%. As of December 31, 2020,2023, our outstanding taxi medallion loans had a weighted average rate of interest of 3.00%4.89%, and our outstanding commercial loans had a weighted average rate of interest of 13.06%12.87%. Current SBA regulations also require that each loan originated by an SBIC has a term between one and 20 years.

In addition, SBICs are subject to periodic examination by the SBA, for which the SBA charges examination fees. SBICs must maintain certain records and make them available for SBA examination. SBICs also are required to prepare valuations of their portfolio investments in accordance with prescribed valuation guidelines, maintain certain minimum levels of capital, file annual reports containing financial, management and other information and file notices of certain material changes in their ownership and operations. We are typically examined by the SBA for compliance with applicable SBA regulations.

SBICs are precluded from making investments in a small business if it would give rise to a conflictcertain conflicts of interest. Generally, a conflict of interest may arise if an associate of the SBIC has or makes an investment in the small business that the SBIC is financing or serves as one of its officers or would otherwise benefit from the financing. A conflict of interest would also occur if an SBIC were to lend money to any of its officers, directors, and employees, or invest in any affiliates thereof. Joint investing with an associate (such as another fund controlled by affiliates of the general partner of the fund) may be made on identical terms or on terms that are fair to the SBIC. The SBA also prohibits, without prior SBA approval, a “change of control” or transfers which would result in any person (or group of persons acting in concert) owning 10% or more of any class of capital stock of an SBIC. A “change of control” is any event which would result in the transfer of the power, direct or indirect, to direct the management and policies of an SBIC, whether through ownership, contractual arrangements, or otherwise.

Under SBA regulations, without prior SBA approval, loans and other investments by licensees with outstanding SBA leverage to any single small business concern may not exceed 30% of an SBIC’s “regulatory capital.”

16


SBICs may invest idle funds that are not being used to make loans or other long-term investments in certain short-term investments permitted under SBA regulations. These permitted investments include direct obligations of, or obligations guaranteed as to principal and interest by, the government of the USU.S. with a term of 15 months or less and deposits maturing in one year or less issued by an institution insured by the FDIC. These permitted investments must be maintained in (i) direct obligations of, or obligations guaranteed as to principal and interest by, the US, which mature within 15 months from the date of the investment; (ii) repurchase agreements with federally insured institutions with a maturity of seven days or less if the securities underlying the repurchase agreements are direct obligations of, or obligations guaranteed as to principal and interest by the US, and such securities must be maintained in a custodial account in a federally insured institution; (iii) mutual funds, securities, or other instruments that exclusively consist of, or represent pooled assets of, investments described in (i) or (ii) above; (iv) certificates of deposit with a maturity of one year or less, issued by a federally insured institution; (v) a deposit account in a federally insured institution, subject to withdrawal restriction of one year or less; (vi) a checking account in a federally insured institution; or (vii) a reasonable petty cash fund.

SBICs may purchase voting securities of small business concerns in accordance with SBA regulations. Although prior regulations prohibited an SBIC from controlling a small business concern except in limited circumstances, SBA regulations allow an


SBIC to exercise control over a small business for a period of seven years from the date on which the SBIC initially acquires its control position. This control period may be extended for an additional period of time with the SBA’s prior written approval.

If an SBIC defaults in its payment obligations to SBA under its outstanding debentures, fails to comply with any terms of its securities, or violates any law or certain regulations applicable to it, the SBA has the right to accelerate the maturity of all amounts due under its debentures. Additionally, the SBA may appoint a receiver for the SBIC and for its liquidation in the event of a default on payment of a SBIC’s debentures or for serious regulatory violations.

Other

Change in Control

Because the Bank is an “insured depository institution” within the meaning of the Federal Deposit Insurance ActFDIA and the Change in Bank Control Act and we areas well as Medallion Financial Corp. being a “financial institution holding company” within the meaning of the Utah Financial Institutions Act, federal and Utah law and regulations prohibit any person or company from acquiring control of us and, indirectly, the Bank or Medallion Financial Corp., without, in most cases, prior written approval of the FDIC or the Commissioner of the Utah Department of Financial Institutions,DFI, as applicable. Under the Change in Bank Control Act, control is conclusively presumed if, among other things, a person or company acquires 25% or more of any class of ourthe Bank’s voting stock. A rebuttable presumption of control arises if a person or company acquires 10% or more of any class of voting stock and is subject to a number ofseveral specified “control factors” as set forth in the applicable regulations. Although the Bank is an “insured depository institution” within the meaning of the Federal Deposit Insurance Act and the Change in Bank Control Act, your investment in the Company is not insured or guaranteed by the FDIC, or any other agency, and is subject to lossloss..

Under the Utah Financial Institutions Act, control is defined as the power, directly or indirectly, or through or in concert with one or more persons to (1)to: (a) direct or exercise a controlling influence over (i) the management or policies of usa financial institution or (ii) the election of a majority of the directors or trustees of us,an institution; or (2)(b) to vote 20%25% or more of any class of our voting securities by an individualof a financial institution. In addition, under Utah law, there is a rebuttable presumption that a person has control of a Utah financial institution if the person has the power, directly or indirectly, or through or in concert with one or more persons, to vote more than 10% but not less than 25% of any class of our voting securities byof a person other than an individual.financial institution. If any holder of any series of the Bank’s preferred stock is or becomes entitled to vote for the election of the Bank’s directors, such series will be deemed a class of voting stock, and any other person will be required to obtain the non-objection of the FDIC under the Change in Bank Control Act to acquire or maintain 10% or more of that series. Investors are responsible for ensuring that they do not, directly or indirectly, acquire shares of our common stock in excess of the amount which can be acquired without regulatory approval.

Examination and Supervision

Federal and state banking agencies require the Bank to prepare annual reports on financial condition and to conduct an annual audit of financial affairs in compliance with minimum standards and procedures. We must undergo regular on-site examinations by the FDIC and the Utah DFI, which examine for adherence to a range of legal and regulatory compliance responsibilities. A bank regulator conducting an examination has complete access to the books and records of the examined institution. The results of the examination are confidential, with the exception of the CRA examination discussed above. The cost of examinations may be assessed against the examined institution as the agency deems necessary or appropriate.

17


Incentive Compensation

The FDIC has issued comprehensive guidance on incentive compensation policies intended to ensure that the incentive compensation policies of banking organizations do not undermine the safety and soundness of such organizations by encouraging excessive risk taking. The guidance, which covers all employees that have the ability to materially affect the risk profile of an organization, either individually or as part of a group, is based upon the key principles that a banking organization’s incentive compensation arrangements should (i) provide incentives that appropriately balance risk and financial results in a manner that does not encourage employees to expose their organizations to imprudent risk, (ii) be compatible with effective internal controls and risk management and (iii) be supported by strong corporate governance, including active and effective oversight by the organization’s board of directors.

The Dodd-Frank Act requires the federal banking regulators and the Securities and Exchange Commission, or the SEC, to establish joint regulations or guidelines at specified regulated entities having at least $1 billion in total assets, such as us, prohibiting incentive-based payment arrangements that encourage inappropriate risk-taking by providing an executive officer, employee, director or principal shareholder with excessive compensation, fees, or benefits or that could lead to material financial loss to the entity. The federal banking regulators and the SEC proposed revised rules in 2016, which have not been finalized.


Valid When Made and True Lender

In June 2020, theThe FDIC publishedhas adopted a final rule clarifying that a loan made by a state-chartered bank is considered “valid when made” pursuant to the preemptive authority in Section 27 of the FDIA, and therefore the loan’s original terms, including, among others, its interest rate, are valid and enforceable by any subsequent assignee, transferee, or buyer, regardless of the usury laws of other states.states, or the “Valid-When-Made Rule”. Under the Valid-When-Made Rule, the interest rate on a bank-made loan remains valid and enforceable even after the bank sells or transfers it to a party that could not have originated the loan on the same terms as the bank. The FDIC ruleValid-When-Made Rule does not address when a state-chartered bank is the "true lender"“true lender” of a loan, and the ultimate effect of the FDIC rule remains uncertain in light of the overturning of the OCC's analogous rule pursuant to a Congressional Review Act resolution signed by President Biden, and other pending legal challenges to bank-fintech partnerships on the FDIC’s rule and an analogous rule issued byground that the OCC. On August 20,bank is not the “true lender.” In 2020, the state attorneys general of seven states and the District of Columbia filed suit against the FDIC, alleging that the final ruleValid-When-Made Rule conflicts with the FDIA, exceeds the FDIC’s statutory authority, and violates the Administrative Procedure Act. The suitIn February 2022, the United States District Court for the Northern District of California granted the FDIC's motion for summary judgement, holding that the FDIC had the power to issue the Valid-When-Made Rule and that its interpretation of the federal banking laws is ongoing, however, weentitled to judicial deference. We believe the impact to the Bank regardless of outcome, wouldthe Valid-When-Made Rule will be minimalminimal.

Future Legislation

Congress may enact legislation from time to time that affects the regulation of the financial services industry, and state legislatures may enact legislation from time to time affecting the regulation of financial institutions chartered by or operating in those states. Federal and state regulatory agencies also periodically propose and adopt changes to their regulations or change the manner in which existing regulations are applied. The substance or impact of pending or future legislation or regulation, or the application thereof, cannot be predicted, although enactment of the proposed legislation could impact the regulatory structure under which we operate and may significantly increase our costs, impede the efficiency of our internal business processes, require us to increase our regulatory capital and modify our business strategy, and limit our ability to pursue business opportunities in an efficient manner.

AVAILABLE INFORMATION

Our corporate website is located at www.medallion.com. We make copies of our Annual Reports on Form 10-K, Quarterly Reports on Form 10-Q, Current Reports on Form 8-K, and any amendments to those reports filed with or furnished to the SEC pursuant to Section 13(a) or 15(d) of the Exchange Act available on or through our website free of charge as soon as reasonably practicable after we electronically file them with or furnish them to the SEC. Our SEC filings can be found in the Investors Relations section of our website, the address of which is www.medallion.com/investors.html, or on the SEC website at www.sec.gov. Our Code of Ethical Conduct and Insider Trading Policy can be located in the Corporate Governance section of our website at www.medallion.com/investors_corporate_governance.html. These documents, as well as our SEC filings, are available in print free of charge to any stockholder who requests a copy from our Secretary.

18


ITEM 1A. RISK FACTORS

ITEM 1A.

RISK FACTORS

Risks Related to Our Loan Portfolios and Business

The ongoing COVID-19 pandemic, and the related significant negative impact on the global economy and financial markets, have had and could further have a material adverse impact on our business, operating results, and financial condition, particularly given our concentration in the consumer lending business.

The spread of COVID-19 has created a global public-health crisis that has resulted in widespread volatility and deteriorations in employment levels, as well as business, economic, and market conditions that have materially and adversely affected our business, operating results and financial condition. The full extent of the adverse impact of the COVID-19 pandemic on our business, results of operations, financial position (including capital and liquidity) and prospects depends on a number of evolving factors, including:

The duration, extent, and severity of the pandemic. COVID-19 does not yet appear to be contained as it continues to spread throughout the United States and could affect significantly more households and businesses. Delays in the widespread distribution and use of effective vaccines, or a lack of public acceptance of vaccines, could lead people to continue to self-isolate and not participate in the economy at pre-pandemic levels for a prolonged period of time, which could, in turn, perpetuate or exacerbate the adverse effects of COVID-19 on economic conditions. Further, even if vaccines are widely distributed and used, there can be no assurance that vaccines will ultimately be successful in limiting or stopping the spread of COVID-19 or mitigating the impact of COVID-19 on economic conditions.

The response of governmental and non-governmental authorities. Many of the actions taken by governmental and non-governmental authorities have been directed toward curtailing household and business activities to contain the spread of COVID-19 while simultaneously deploying fiscal- and monetary-policy measures to partially mitigate the adverse effects on individual households and businesses. These actions are not always coordinated or consistent across


jurisdictions. The scope, duration and ultimate effects of these responses continue to be uncertain, and we cannot predict the full impact these responses may have on our business and operations.

The effect on our borrowers, counterparties, employees, and third-party service providers. COVID-19 and its associated consequences and uncertainties may continue to affect individuals, households and businesses differently and unevenly. Our credit, operational, including cybersecurity, and other risks could continue to increase as a result of the impacts of COVID-19, including, for example, as a result of the work-from-home arrangements implemented by us and our service providers. Although, to date, the operational measures we have taken, such as having employees work remotely on a part-time basis, have allowed us to continue to operate during the pandemic, we may continue to experience disruptions or other adverse effects to our operations as a result of the COVID-19 pandemic’s continued impacts on our employees and service providers.

The effect on economies and markets. The COVID-19 pandemic, perceptions regarding its broad impact and preventive measures taken to contain or mitigate the pandemic have had, and are likely to continue to have, significant negative effects on the US and global economy, employment levels, employee productivity and financial market conditions, which, in turn, may continue to have negative effects on the ability of our borrowers to repay outstanding loans, the value of collateral securing loans, demand for loans and other financial services products, and consumer discretionary spending. National, regional and local economies and markets could continue to suffer disruptions that are lasting. Even after the pandemic recedes and measures taken by governmental authorities in response, such as stay-at-home orders and other social-distancing measures, cease to apply, the pandemic may continue to have long-term effects on economic and commercial activity, as well as consumer behaviors. A prolonged economic slowdown could adversely affect our originations of recreation and home improvement loans (which comprises the significant majority of our loan portfolio) and the performance of our existing loans. In addition, governmental actions are meaningfully influencing the interest-rate environment, which have had and could continue to have an adverse effect on our results of operations and financial condition.

In March 2020, we adjusted our payment policies and procedures and created a program to support our borrowers during the pandemic. We have been negotiating payment terms with our borrowers, and allowed them to defer payments up to 180 days, which as of December 31, 2020, there were minimal consumer loans on deferral. Although we believe that our deferral programs have been effective to date in mitigating the effect of COVID-19 on our consumer loan portfolio and consumer businesses are uncertain, and we could suffer potential losses on our consumer portfolios as a result of the effects of the pandemic on the ability of our borrowers to repay their loans. The effects of the pandemic on us could be exacerbated given that our business model is largely consumer-directed and the pandemic, and preventative measures taken to contain or mitigate the pandemic, have had and may increasingly have significant negative effects on consumer discretionary spending and unemployment levels.

The impact of COVID-19 is being especially felt in the taxi industry. In March 2020, the Governor of New York State declared states of emergency for both the State and City of New York, and, since then, economic activity generally and taxi ridership in particular have decreased dramatically in New York City. Despite New York City’s phased reopening, the extent to which the COVID-19 pandemic will continue to adversely affect New York City taxi medallion owners and, by extension, our medallion loans and other related assets will depend on future developments, which are highly uncertain and cannot be predicted, including the scope and duration of the pandemic, actions taken by governmental authorities, and the direct and indirect impact of the pandemic on taxi medallion owners and the behaviors of people who have historically taken taxis. With our medallion business, we also adjusted our payment policies and procedures and allowed borrowers to defer payments up to 180 days in March 2020. Since March 31, 2020, payments on medallion loans have decreased significantly compared to payments during the 2020 first quarter and prior periods. For the medallion business, no loans remained on deferral and it was determined it was impossible to quantify anticipated payment activity. As a result, all loans were placed on nonaccrual and written down to net collateral value in the 2020 third quarter. In addition, medallion loans in the New York City market were written down to $79,500 net as of December 31, 2020. We are actively engaged with many borrowers about modifying their loan agreements, and as a result, we placed all medallion loans on TDR as we work with borrowers. We are also continuing to evaluate options for our medallion loan portfolio and related assets, which may result in additional write-downs, charge-offs or impairments, the impact of which could be material to our results of operations and financial condition.

As a result of the cash flow shortages due to the slowdown in the taxi industry resulting from the COVID-19 pandemic, we received from our lending banks 180-day payment deferrals that terminated in August and modifications to provide interest only payments from September through the end of 2020 for the notes payable to banks. We have also worked to extend our maturity dates with lenders throughout 2021. To the extent we continue to experience cash flow shortages, whether as a result of the pandemic or otherwise, we would need to negotiate additional relief from our lenders or seek alternative funding, neither of which can be assured.

As a result of these foregoing factors or other risks and consequences, the pandemic could continue to materially and adversely affect our business, results of operations and financial condition and heighten the other risk described in this Item 1A- Risk


Factors. The full extent to which the pandemic will impact our operations will depend on future developments, which are highly uncertain and cannot be predicted at this time, and include the duration, severity and scope of the continued outbreak and the actions taken to contain or mitigate the pandemic.

Our business is heavily concentrated in consumer lending, which carries a high risk of loss that is different from and typically higher than the risk of loss associated with commercial lending, and which could be adversely affected by an economic downturn.

Our business is heavily concentrated in consumer lending. As a result, we are more susceptible to fluctuations and risks particular to consumer credit than a more diversified company including as a result of the COVID-19 pandemic, as described above. For example, ourwould be. Our business is particularly sensitive to macroeconomic conditions that affect the USU.S. economy, consumer spending and consumer credit.credit, including for example, the impacts of inflation, which has had and could continue to have an adverse effect on consumer spending, a rising interest rate environment, as well as the impact that geopolitical responses to international and regional wars have had on gasoline prices and the economic environment generally in the United States. We are also more susceptible to the risks of increased regulations and legal and other regulatory actions that are targeted at consumer credit or the specific consumer credit products that we offer (including promotional financing). Our business concentration could have a material adverse effect on our results of operations.

By its nature, lending to consumers carries with it different risks and typically a higher risk of loss than commercial lending. Although the net interest margins are intended to be higher to compensate us for this increased risk, an economic downturn could result in higher loss rates and lower returns than expected and could affect the profitability of our consumer loan portfolios. For example, in 2023 our net interest margin on gross loans decreased to 8.38% from 8.73%. During periods of economic slowdown, delinquencies, defaults, repossessions, and losses generally increase, and consumers may reduce their discretionary spending in areas such as recreation and home improvement, which constitute athe significant majority of our business. These periods have been, and may continue to be, accompanied by increasing unemployment rates and declining values of consumer products securing outstanding accounts, which weaken collateral coverage and increase the amount of a loss in the event of default.

Additionally, higher gasoline prices, volatile real estate values and market conditions, resetresets of adjustable rate mortgages to higher interest rates, increases in inflation, general availability of consumer credit, or other factors that impact consumer confidence or disposable income, could increase loss frequency and decrease consumer demand for RVs, boats, trailers and other consumer products (including in connection with home improvement projects), as well as weaken collateral values on certain types of consumer products. Any decrease in consumer demand for those products could have a material adverse effect on our ability to originate new loans and, accordingly, on our business, financial condition, and results of operations.

Although declines in commodity prices, and more particularly gasoline prices, generally are financially beneficial to the individual consumer, these declines may also have a negative impact on unemployment rates in geographic areas that are highly dependent upon the oil and natural gas industry, which could adversely affect the credit quality of consumers in those areas.

Our balance sheet consists of a significant percentage of non-prime consumer loans, which are associated with higher than averagehigher-than-average delinquency rates. The actual rates of delinquencies, defaults, repossessions, and losses on these loans could be more dramatically affected by a general economic downturn. In addition, during an economic slowdownslow-down or recession, our servicing costs may increase without a corresponding increase in our net interest income.

Furthermore, our business is significantly affected by monetary and regulatory policies of the USU.S. Federal Government and its agencies. Changes in any of these policies are influenced by macroeconomic conditions and other factors that are beyond our control and could have a material adverse effect on us, through interest rate changes, costs of compliance with increased regulation, and other factors. For example, the Federal Reserve raised the Federal Funds Rate several times in 2022 and 2023. If inflationary pressures persist, our interest expense could increase faster than our interest income, reducing our net interest income and net interest margin, and continuing adverse impacts on consumer spending could reduce demand for our consumer loan products. These developments, along with United States government credit, debt ceiling and deficit concerns, global economic uncertainties and market volatility, have caused and could continue to cause interest rates to be volatile.

The process we use to estimate losses inherent in our credit exposure requires complex judgments, including forecasts of economic conditions and how those economic conditions might impair the ability of our borrowers to repay their loans. The degree of uncertainty concerning economic conditions may adversely affect the accuracy of our estimates, which may, in turn, impact the reliability of the process and the quality of our assets.

19


Our financial condition, liquidity and results of operations depend on the credit performance of our loans.

As of December 31, 2020, approximately 55%2023, 38% of our recreation loans were non-prime receivables with obligors who do not qualify for conventional consumer finance products as a result of, among other things, adverse credit history. While our underwriting guidelines are designed to confirm that, notwithstanding such factors, the obligor would be a reasonable credit risk, the receivables nonetheless are expected to experience higher default rates than a portfolio of obligations of prime obligors. The weakening of our underwriting guidelines for any reason, such as in response to the competitive environment, in an effort to originate higher yielding loans, a lack of discipline or diligence by our employees in underwriting and monitoring loans or our inability to adequately adapt policies and procedures to changes in economic or other conditions, may result in loan defaults and charge-offs that may necessitate increases to our allowance for loancredit losses, each of which could adversely affect our net income and financial condition. In the event of a default on a recreation loan, generally the most practical recovery method is repossession of the financed vehicle, although the collateral value of the vehicle usually does not fully cover the outstanding account balance and costs of recovery. Repossession sales that do not yield sufficient proceeds to repay the receivables in full typically result in losses on those receivables.

In addition, our prime portfolio has grown in proportion to our overall portfolio over the past several years. While prime portfolios typically have lower default rates than non-prime portfolios, we have less ability to make risk adjustments to the pricing of


prime loans compared to non-prime loans. As a result, to the extent our prime portfolio continues to grow, a larger proportion of our business will consist of loans with respect to which we will have less flexibility to adjust pricing to absorb losses. As a result of these factors, we may sustain higher losses than anticipated in our prime portfolio. Additionally, if our prime loancredit losses are higher than expected then we may also be at risk with regardsregard to our forecasted losses, which could impact our loss reserves and results of operations.

Changes in the taxi and for-hire vehicle industries have resulted in significantly increased competition and have had a material adverse effect on our business, financial condition, and operations and have resulted in losses in our medallion loan portfolio.

The continued expansion of ride-sharing applications, or ride-sharing apps and the issuance of additional livery licenses and other for-hire classifications has changed the taxi and for-hire vehicle industries resulting in significantly increased competition in all of our taxi medallion markets. Many of these for-hire vehicle operators operate outside of the regulatory regime under which we and our borrowers operate, which poses an increased risk of competition because they are able to pass the cost savings of not having to comply with certain regulations to its passengers.

In New York City, Chicago, Boston, and other markets where we originated medallion loans, taxi fares are generally set by government agencies, but expenses associated with operating taxis are largely unregulated. Escalating expenses, such as rising gas prices and an increase in interest rates, coupled with stagnant or declining taxi fares can render taxi operations less profitable and cause borrowers to default on loans from us, which would adversely affect the value of our collateral. There were reductions in fare totals and taxi trips in the 2020 fiscal year, which were likely the result of the ongoing COVID-19 pandemic, together with continued increases in competition, impacts from the congestion pricing surcharge, and use of public transportation.

Decreases in the value of our medallion loan collateral, including the impact on loans in process of foreclosure, and our Chicago taxi medallions purchased out of foreclosure have had, and may continue to have, a material adverse effect on our business.

We stopped originating new medallion loans in July 2015.  Our medallion loans and related assets represent 4% of our total assets at December 31, 2020. There have also been recent decreases in the values of our medallion loan collateral. Increased competition reduced the overall market for taxi services, income from operating medallions, and the value of taxi medallions. If these trends continue and intensify, there would be a further material increase to our loan-to-value ratios, loan delinquencies, and loan defaults , which could have a material adverse effect on our business, financial condition, and results of operations.

According to TLC data, New York City taxi medallions appreciated in value to a high of $1,320,000 for corporate taxi medallions and $1,050,000 for individual taxi medallions in 2014. In 2017, the New York City Council eliminated the distinction between individual and corporate taxi medallions. We estimate that the market value of New York City taxi medallions declined to $85,000, $79,500 net of liquidation costs, as of December 31, 2020.

We own 159 Chicago taxi medallions that were purchased out of foreclosure in 2003. Additionally, a portion of our loan revenue is derived from loans collateralized by Chicago taxi medallions. The Chicago taxi medallions had appreciated in value from $50,000 in 2003 to approximately $370,000 in 2013. Since that time, however, there has been a decline in the value of Chicago taxi medallions to approximately $24,000, $18,500 net of liquidation costs, as of December 31, 2020.

Government entities may take other actions in the future, which could have adverse effects on the market for taxi medallions and which could affect, potentially materially, our financial condition and results of operations. Every city in which we originated medallion loans, and most other major cities in the United States, limits the supply of taxi medallions, which results in supply restrictions that support the value of taxi medallions. Loosening these restrictions that result in the issuance of additional taxi medallions could decrease the value of taxi medallions in that market and in turn, adversely affect the value of the collateral securing our then outstanding medallion loans in that market.

We estimate that the weighted average loan-to-value ratio of our medallion loans was approximately 327% as of December 31, 2020. If taxi medallion values continue to decline, there is likely to be an increase in medallion loan delinquencies, foreclosures and borrower bankruptcies. Our ability to recover on defaulted medallion loans by foreclosing on and selling the taxi medallion collateral would be diminished, which would result in material losses on defaulted medallion loans which could have a material adverse effect on our business. If we are required to liquidate all or a portion of our medallion loans quickly, we would realize less than the value at which we had previously recorded such medallions.

Uncertainty relating to the reporting of collateral values for our loans may adversely affect the value of our portfolio.

Medallion loans are primarily collateral-based lending, whereby the collateral value generally exceeds the amount of the loan at the time of origination, providing sufficient excess collateral to protect us against losses. Collateral values for medallion loans reflect recent sales prices and are typically obtained from the regulatory agency in a particular local market. We rely on the integrity of the


collateral value benchmarks obtained by the applicable regulatory agencies and other third parties. Any changes or volatility in these benchmarks could cause us to suffer losses. We have experienced a significant downward movement in medallion collateral values which has caused and may continue to cause a negative impact on our valuation analysis and could further significantly lower the fair market value measurements of our portfolio.

We require an objective benchmark in determining the value of our portfolio. If the benchmarks that we currently use are deemed to be unreliable, we will need to use other intrinsic factors in determining the collateral values for our loans.

Our allowance for loancredit losses may prove to be insufficient to cover losses on our loans.

We maintain an allowance for loancredit losses (a reserve established through a provision for losses that decreases our earnings and that, accordingly, affects our financial condition) that we believe is appropriate to provide for incurredcurrent expected losses in our loan portfolio.

The process for establishing an allowance for loancredit losses is critical to our results of operations and financial condition, and requires complex models and judgments, including forecasts of economic conditions.conditions and other assumptions. Changes in economic conditions affecting borrowers, growth in our loan portfolio, changes in the credit characteristics of our loan portfolio, new information regarding our loans and other factors, both within and outside of our control, may require an increase in the allowance for loancredit losses. In cases where we modify a loan,loans, if the modified loans do not perform as anticipated, we may be required to establish additional allowances on these loans. As of December 31, 2023, the overall allowance for credit losses increased from December 31, 2022, due in part to the adoption of ASU 2016-13 (referred to as the current expected credit loss model, or CECL) methodology on January 1, 2023.

We periodically review and update our methodology, models and the underlying assumptions, estimates and assessments we use to establish our allowance for loancredit losses to reflect our view of current conditions. Moreover, our regulators, as part of their supervisory function, periodically review the methodology, models and the underlying assumptions, estimates and assessments we use for calculating, and the adequacy of, our allowance for loancredit losses. Our regulators, based on their judgment, may conclude that we should modify our methodology, models or the underlying assumptions, estimates and assessments, increase our allowance for loancredit losses, and/or recognize further losses. We continue to review and evaluate our methodology, models and the underlying assumptions, estimates and assessments we use and we will implement further enhancements or changes to them, as needed. We cannot assure youprovide assurance that our loancredit loss reserves will be sufficient to cover actual losses. Future increases in the allowance for loancredit losses or recognized losses (as a result of any review, update, regulatory guidance, changes in accounting standards or otherwise) will result in a decrease in net earnings and capital and could have a material adverse effect on our business, results of operations, and financial condition.

Our business, financial condition and results of operations could be negatively impacted if we are unsuccessful in developing and maintaining our relationships with dealerships, contractors, and FSPs.

We originate loans by working with third-party sellers of consumer products and not by working directly with consumers. As a result, our ability to originate consumer loans depends on our relationships with a limited number of dealerships, contractors, and FSPs. Although we have relationships with various dealerships, contractors, and FSPs, none of our relationships are exclusive and each may be terminated at any time. In particular, thereaddition, a large proportion of our new loan originations are concentrated in our top ten relationships (57% in our home improvement portfolio and 43% in our recreation portfolio), and the loss of a significant relationship could have a negative effect on demand for our products and our new loan originations. There is also significant competition for the contractor and FSP relationships we depend on in connection with our home improvement lending segment. The loss of any of these relationships, our failure to develop additional relationships, and circumstances in which our existing dealer,dealership, contractor, and FSP relationships generate decreased sales and loan volume all may have a material adverse effect on a substantial part of our business, financial condition and results of operations.

A reduction in demand for our products and failure by us to adapt to such reduction could adversely affect our business, financial condition and results of operations.

The demand for the products we offer may be reduced due to a variety of factors, such as demographic patterns, changes in

20


customer preferences or financial conditions, regulatory restrictions that decrease customer access to particular products or the availability of competing products. If we fail to adapt to significant changes in our customers’ demand for, or access to, our products, our revenues could decrease, and our operations could be adversely affected. Even if we do make changes to our product offerings to fulfill customer demand, customers may resist such changes or may reject such products. Moreover, the effect of any product change on the results of our business may not be fully ascertainable until the change has been in effect for some time, and, by that time, it may be too late to make further modifications to such product without causing further adverse effects to our business, results of operations, and financial condition.

Decreases or increases in prevailing interest rates could adversely affect our business, our cost of capital and our net interest income.

Our commercial borrowers generally have the right to prepay their loans upon paymentin full or in part at any time. Commercial borrowers are subject to a prepayment penalty of a fee ranging from 1%up to 2% for standard loans, and for higher amounts, as negotiated, for larger more custom loan arrangements.5% during the first year, declining by one percentage point through the fifth year. A borrower is likely to exercise prepayment rights at a time when the interest rate payable on the borrower’s loan is high relative to prevailing interest rates. In a lower interest rate environment, we will have difficulty re-lending prepaid funds at comparable rates, which may reduce the net interest income that we receive. When this occurs, we will generally reinvest these proceeds in temporary investments, pending their future investment in new portfolio companies. These temporary investments will typically have substantially lower yields than the debt being prepaid, and we could experience significant delays in reinvesting these amounts. Any future investment in a new portfolio company


may also be at lower yields than the debt that was repaid. As a result, our results of operations could be materially adversely affected if a substantial number of our portfolio companies elect to prepay amounts owed to us and we are not able to reinvest the proceeds for comparable yields in a timely fashion. Additionally, prepayments could negatively impact our return on equity, which could result in a decline in the market price of our common stock.

Our profitability has and may further be directly affected by interest rate levels and fluctuations in interest rates. As interest rates change, our gross interest rate spread on originations either increases or decreases because the rates charged on the loans originated are limited by market and competitive conditions, restricting our ability to pass on increased interest costs to the consumer. For example, in 2023, as interest rates increased, our net interest margin decreased by 64 basis points. Additionally, although a significant percentage of our borrowers are non-prime and are not highly sensitive to interest rate movement, increases in interest rates may reduce the volume of loans we originate. While we monitor the interest rate environment and seek to mitigate the impact of increased interest rates, we cannot provide assurance that the impact of changes in interest rates can be successfully mitigated.

In addition, the majority of our loan portfolio is comprised of fixed-rate loans. AnTo the extent our funding costs increase in response to an increase in market rates of interest, an abrupt increase in market rates of interest may have an adverse impact on our earnings until we are able to originate new loans at higher prevailing interest rates. During 2023, we saw an increase in the cost of certificates of deposit, our largest funding source, and we expect this increase to continue in 2024.

Additionally, because we borrow to fund our loans and investments, a portion of our income is dependent upon the difference between the interest rate at which we borrow funds and the interest rate at which we invest these funds. For example, in 2023 our net interest margin on gross loans decreased to 8.38% from 8.73%. A portion of our investments, such as taxi medallion loans, will have fixed interest rates, while a portion of our borrowings will likelymay have floating interest rates. As a result, a significant change in market interest rates could have a material adverse effect on our net investment income. In periods of rising interest rates, our cost of funds could increase, which would reduce our net investment income. We may hedge against interest rate fluctuations by using standard hedging instruments, subject to applicable legal requirements. These activities may limit our ability to participate in the benefits of lower interest rates with respect to the hedged portfolio. Adverse developments resulting from changes in interest rates or hedging transactions could have a material adverse effect on our business, financial condition, and results of operations. Also, we will have to rely on our counterparties to perform their obligations under such hedges.

Decreases in the value of our taxi medallion loan collateral, including the impact on loans in process of foreclosure, had and may continue to have, a material adverse effect on our business.

Other than in connection with dispositions of existing taxi medallion assets, or refinancings of maturing loans, we stopped originating new taxi medallion loans in July 2015, and the Bank has not originated new taxi medallion loans since 2014. Our net taxi medallion loans and related assets represent less than 1% of our total assets at December 31, 2023. In recent years, increased competition has reduced the overall market for taxi services, income generated from operating taxi medallions, and the value of taxi medallions. If these trends continue, there will be further negative impacts to our taxi medallion loans and related assets. We continue to utilize a market value for a New York City taxi medallion of $85,000, $79,500 net of liquidation costs, as of December 31, 2023. As of December 31, 2023, our entire net exposure to taxi medallion assets was concentrated in the New York City metropolitan area and had a net value of $12.1 million on our consolidated balance sheet.

21


Government entities may take other actions in the future, which could have adverse effects on the market for taxi medallions and which could affect our financial condition and results of operations. Every city in which we have originated taxi medallion loans, and most other major cities in the United States, limits the supply of taxi medallions, which results in supply restrictions that support the value of taxi medallions. Loosening restrictions that result in the issuance of additional taxi medallions could decrease the value of taxi medallions in that market and in turn, adversely affect the value of the collateral securing our then outstanding taxi medallion loans in that market.

We estimate that the weighted average loan-to-value ratio of our taxi medallion loans was approximately 183% as of December 31, 2023. If taxi medallion values continue to decline, there is likely to be an increase in taxi medallion loan delinquencies, foreclosures and borrower bankruptcies. Our ability to recover on defaulted taxi medallion loans by foreclosing on and selling the taxi medallion collateral would be diminished, which would result in future losses on defaulted taxi medallion loans that could have an effect on our business. If we are required to liquidate all or a portion of our taxi medallion loans quickly, we would realize less than the value at which we had previously recorded such taxi medallions.

Uncertainty relating to the reporting of collateral values for our taxi medallion loans may adversely affect the value of our portfolio.

We stopped originating taxi medallion loans in July 2015, though we have continued to refinance loans as they mature, and our taxi medallion loan portfolio represented less than 1% of our total assets at December 31, 2023. Although our taxi medallion loan portfolio now represents a small percentage of our operations, further material losses in the portfolio could have a material and adverse impact on our net income for one or more future periods.

During the third quarter of 2020, we placed all taxi medallion loans on nonaccrual and adjusted them down to collateral value, net of liquidation costs. Collateral values for taxi medallion loans reflect recent sales prices and are typically obtained from the regulatory agency in a particular local market. We rely on the integrity of the collateral value benchmarks obtained by the applicable regulatory agencies and other third parties in determining the fair value of our portfolio. Any changes or volatility in these benchmarks could cause us to suffer losses, and if the benchmarks that we currently use are deemed to be unreliable, we will need to use other intrinsic factors in determining the collateral values for our loans. We have experienced a significant downward movement in taxi medallion collateral values, which caused and may again cause a negative impact on our valuation analysis and could further significantly lower the fair market value measurements of our portfolio.

Decreases in the value of our taxi medallion loan collateral have resulted in an increase in the loan-to-value ratios of our taxi medallion loans. If taxi medallion values decline further, there is likely to be an increase in taxi medallion loan delinquencies, foreclosures and borrower bankruptcies. Our ability to recover on defaulted taxi medallion loans by foreclosing on and selling the taxi medallion collateral would be diminished, which would result in material losses on defaulted taxi medallion loans which would have a material adverse effect on our taxi medallion loan portfolio and other taxi medallion-related assets. If we are required to liquidate all or a portion of our taxi medallion loans and repossessed collateral quickly, we would realize less than the value at which we had previously recorded such taxi medallions.

Financing and Related Risks

We are subject to certain financial covenants and other restrictions under our loan and creditdebt arrangements, which could affect our ability to finance future operations or capital needs or to engage in other business activities.

Our loan and credit agreementsCertain privately placed notes contain financial covenants and other restrictions relating to borrowing base eligibility,financial ratios and minimum tangible net worth, net income, leverage ratios, stockholders’ equity, and collateral values.worth. Our ability to meet these financial covenants and restrictions could be affected by events beyond our control, such as a substantial decline in collateral values or a rise in borrower delinquencies.control. A breach of these covenants could result in an event of default under the applicable debt instrument. Such a default, if not cured or waived, may allow the creditorsholders to accelerate the related debt and may result in the acceleration of any other debt that is subject to an applicable cross-acceleration or cross-default provision. Most of our credit facilityOur privately placed debt is subject to cross default provisions. Certain other events can constitute an event of default. Furthermore, if we were unable to repay the amounts due and payable under our credit facilities, those lenders could proceed against the collateral granted to them to secure that indebtedness. In the event our lenders or holders of the related notes accelerate the repayment of our borrowings, we and our subsidiaries may not have sufficient assets to repay that indebtedness. We have regularly needed waivers and extensions, and there can be no guarantee that we will be able to continue to get them if requested. Based on the foregoing factors, the operating and financial restrictions and covenants in our current creditdebt agreements and any future financing agreements could adversely affect our ability to finance future operations or capital needs or to engage in other business activities.

Failure to obtain an extension of our existing credit facilities, failure to obtain additional revolving credit facilities or raise additional capital in the future could have a material adverse effect on our results of operations and financial position.

We utilize secured revolving credit facilities and other facilitiesOur privately placed notes contain certain provisions that require us to fund our investments.meet certain tests in order to raise additional debt. We cannot guarantee that our credit facilitieswe will continue to be available beyond their current maturity dates on reasonable terms or at all, or that we will be ablemeet such tests in the future. Additionally, our ability to otherwise obtain additional sources of funds by selling assets or raising equity to make required payments on maturing indebtedness. Our revolving credit facilities have converted to term loans. Obtaining additional revolvingincluding through credit facilities or other alternative sources of financing may be difficult, and we cannot guarantee that we will be able to do so on terms favorable to us or at all. The availability of revolving credit facilities depends, in part, on factors outside of our control, including regulatory capital treatment for unfunded bank lines of credit, the financial strength and strategic objectives of the banks that participate in our credit facilities and the availability of bank liquidity in general. If the credit facilities are not renewed or extended by our lenders by their maturity dates, we will not be able to make further borrowings under the facilities after they mature and the outstanding principal balances under such facilities will be due and payable at maturity. If we are unable to refinance our indebtedness at maturity or meet our payment obligations, our financial condition would be adversely affected and our lenders may foreclose on the property securing such indebtedness. If we are unable to extend or replace these facilities or arrange new credit facilities or other types of interim financing, we may need to curtail or suspend loan origination and funding activities which could have a material adverse effect on our results of operations and financial position.

22


In addition, we may need to raise additional capital in the future to have sufficient capital resources and liquidity to meet our commitments, including the terms of the 2003 capital maintenance agreement,Capital Maintenance Agreement, and fund our business needs and future growth,


particularly if the quality of our assets or earnings were to deteriorate significantly. Our ability to raise additional capital, if needed, will depend on, among other things, conditions in the capital markets at that time, which are outside of our control, and our financial condition. We may not be able to obtain capital on acceptable terms or at all. Any occurrence that may limit our access to the capital markets, such as a decline in the confidence of capital markets investors or other disruptions in capital markets, may adversely affect our capital costs and our ability to raise capital and, in turn, our liquidity. Further, if we need to raise capital in the future, we may have to do so when other financial institutions are seeking to raise capital and would then have to compete with those institutions for investors. An inability to raise additional capital on acceptable terms when needed could have a material adverse effect on our business, financial condition, or results of operations.

Medallion Bank’s use of brokered deposits for its deposit-gathering activities may not be available when needed. The inability to accept and renew brokered deposits would have a material adverse effect on our business, financial condition, liquidity, and results of operations.

Medallion Bank relies on the established brokered deposit market to originate deposits to fund its operations. Additionally, Medallion Bank’s business, strategy and prospects are dependent on its ability to accept and renew brokered deposits without limitation and, therefore, dependent on its ability to be “well-capitalized” under the FDIC’s regulatory framework.

Medallion Bank’s brokered deposits consist of deposits raised through the brokered deposit market rather than through retail branches. WhileAlthough Medallion Bank has developed contractual relationships with a diversified group of investment brokers, and the brokered deposit market is well developed and utilized by many banking institutions, conditions could change that might affect the availability of brokered deposits. In addition, Medallion Bank’s ability to rely on brokered deposits as a source of funding is subject to capitalization requirements set forth in the FDIC’s prompt corrective action framework. Medallion Bank may not accept or renew brokered deposits unless they areit is “well-capitalized”, or they areit is “adequately capitalized” and they receiveit receives a waiver from the FDIC. A bank that is “adequately capitalized” and that accepts or renews brokered deposits under a waiver from the FDIC is subject to additional restrictions on the interest rates it may offer. See "Our Business - Supervision and Regulation" for additional information.

If the capital levels at Medallion Bank fall below the “well-capitalized” level as defined by the FDIC, or we otherwise fail to maintain “well capitalized” status, Medallion Bank’s ability to raise brokered deposits would be materially impaired. If Medallion Bank’s capital levels fall below the “adequately-capitalized” level as defined by the FDIC, it would be unable to raise brokered deposits. Any impairment or inability to raise brokered deposits would have a material adverse effect on our business, financial condition, liquidity and results of operations. Brokered deposits may also not be as stable as other types of deposits, and if Medallion Bank experiences a period of sustained operating losses, the cost of attracting deposits from the brokered deposit market could increase significantly. Medallion Bank’s ability to manage its growth to stay within the “well-capitalized” level is critical to our ability to retain open access to this funding source.

Investors in our securities, may be adversely affected and may face significant losses (including the possibility of losing their entire investment) if Medallion Bank is unable to accept or renew brokered deposits or if its access to the brokered deposit market were impaired.

We depend on cash flow from our subsidiaries to make payments on our indebtedness and fund operations.

We are primarily a holding company, and we derive most of our operating income and cash flow from our subsidiaries. As a result, we rely heavily upon distributions from our subsidiaries to generate the funds necessary to make payments on our indebtedness and fund operations. Funds are provided to us by our subsidiaries through dividends and payments on intercompany indebtedness, but we cannot assure you that our subsidiaries will be in a position to continue to make these dividend or debt payments. The Utah Department of Financial Institutions and FDIC have the authority to prohibit or to limit the payment of dividends by Medallion Bank. In addition, as a condition to receipt of FDIC insurance, Medallion Bank entered into a capital maintenance agreement with the FDIC requiring it to maintain a 15% Tier 1 leverage ratio (Tier 1 capital to average assets). As of December 31, 2020,2023, Medallion Bank’s Tier 1 leverage ratio was 16.9%16.2%. We received dividends from Medallion Bank of $1,500,000$20.0 million for each of the years ended December 31, 2023 and 2022 and received dividends from Medallion Capital of $4.8 million and $5.1 million for the years ended December 31, 2023 and 2022, all of which was reinvested in December 2019 and $6,000,000 during 2020.Medallion Capital.

23


Legal and Regulatory Risks

We are subject to pending litigation with the SEC for certain violations of the federal securities laws, which could result in material fines and/or other sanctions and accordingly have a material adverse effect on our business, reputation, financial condition, results of operations and/or stock price, as well as a bar against our President and Chief Operating Officer.

As described in Note 10 “Commitments and Contingencies” to the consolidated financial statements included in this Annual Report on Form 10-K, on December 29, 2021, the SEC filed a civil complaint in the U.S. District Court for the Southern District of New York against the Company and its President and Chief Operating Officer alleging certain violations of the antifraud, books and records, internal controls and anti-touting provisions of the federal securities laws. The litigation relates to certain issues that occurred during the period 2015 to 2017, including (i) the Company’s retention of third parties in 2015 and 2016 concerning posting information about the Company on certain financial websites and (ii) the Company’s financial reporting and disclosures concerning certain assets, including Medallion Bank, in 2016 and 2017, a period when the Company had previously reported as a business development company (BDC) under the Investment Company Act of 1940. Since April 2018, the Company does not report as a BDC, and has not worked with such third parties since 2016. The Company does not expect to change previously reported financial results. The Company filed a motion to dismiss the complaint on March 22, 2022, the SEC filed an amended complaint on April 26, 2022 and the Company filed a motion to dismiss the amended complaint on August 5, 2022.

The SEC is seeking injunctive relief, disgorgement plus pre-judgment interest and civil penalties in amounts unspecified, as well as an officer and director bar against the Company’s President and Chief Operating Officer. The Company and its President and Chief Operating Officer intend to defend themselves vigorously and believe that the SEC will not prevail on its claims. Nevertheless, depending on the outcome of the litigation, the Company could incur a loss and other penalties that could be material to the Company, its results of operations and/or financial condition, as well as a bar against its President and Chief Operating Officer. In addition, the Company has and expects to further incur significant legal fees and expenses in defending against such charges by the SEC and the Company may be subject to shareholder litigation relating to these SEC matters.

We operate in a highly regulated environment, and if we are found to be in violation of any of the federal, state, or local laws or regulations applicable to us, our business could suffer.

The Dodd-Frank Wall Street Reform and Consumer Protection Act, or the Dodd-Frank Act, was enacted in 2010. The Dodd-Frank Act significantly changed federal financial services regulation and affects, among other things, the lending, deposit, investment, trading, and operating activities of financial institutions and their holding companies. In addition to the statutory requirements under the Dodd-Frank Act, the legislation also delegated authority to USU.S. banking, securities, and derivatives regulators to impose additional restrictions through required rulemaking. The Dodd-Frank Act requires a company that owns an industrial bank to serve as a “source of strength” to the institution and is also subject to the “Volcker Rule.” Although these requirements have not materially impacted us, we cannot assure you that they will not in the future.


Other changes in the laws or regulations applicable to us more generally, may negatively impact the profitability of our business activities, require us to change certain of our business practices, materially affect our business model, limit the activities in which we may engage, affect retention of key personnel, require us to raise additional regulatory capital, increase the amount of liquid assets that we hold, or otherwise affect our funding profile or expose us to additional costs (including increased compliance costs). Any such changes may also require us to invest significant management attention and resources to make any necessary changes and may adversely affect our ability to conduct our business as previously conducted or our results of operations or financial condition.

We are also subject to a wide range of federal, state, and local laws and regulations, such as local licensing requirements, and retail financing, debt collection, consumer protection, environmental, health and safety, creditor, wage-hour, anti-discrimination, whistleblower and other employment practices laws and regulations and we expect these costs to increase going forward. The violation of these or future requirements or laws and regulations could result in administrative, civil, or criminal sanctions against us, which may include fines, a cease and desist order against the subject operations or even revocation or suspension of our license to operate the subject business. As a result, we have incurred and will continue to incur capital and operating expenditures and other costs to comply with these requirements and laws and regulations.

The recent change in Presidential Administration increases the likelihood of further changes to laws, regulations and supervisory practices affecting financial institutions, which could include more stringent requirements and greater scrutiny from regulatory authorities.

24


The banking industry is highly regulated, and the regulatory framework, together with any future legislative or regulatory changes, may have a significant adverse effect on our operations.

The banking industry is extensively regulated and supervised under both federal and state laws and regulations that are intended primarily for the protection of depositors, customers, federal deposit insurance funds, and the banking system as a whole, and not for the protection of security holders. We are subject to regulation and supervision by the FDIC and the Utah DFI. The laws and regulations applicable to us govern a variety of matters, including permissible types, amounts, and terms of loans and investments we may make, the maximum interest rate that may be charged, the amount of reserves we must hold against deposits we take, the types of deposits we may accept, maintenance of adequate capital and liquidity, changes in the control of Medallion Bank and us, restrictions on dividends, and establishment of new offices. We must obtain approval from our regulators before engaging in certain activities or acquisitions, and there is the risk that such approvals may not be obtained, either in a timely manner or at all. Our regulators also have the ability to compel us to take, or restrict us from taking, certain actions entirely, such as actions that our regulators deem to constitute an unsafe or unsound banking practice. Our failure to comply with any applicable laws or regulations, or regulatory policies and interpretations of such laws and regulations, could result in sanctions by regulatory agencies, civil money penalties, or damage to our reputation, all of which could have a material adverse effect on our business, financial condition or results of operations.

Federal and state banking laws and regulations, as well as interpretations and implementations of these laws and regulations, are continually undergoing substantial review and change. Financial institutions generally have also been subjected to increased scrutiny from regulatory authorities. Changes in the Presidential Administration or control of Congress also increase the likelihood of further changes to laws, regulations and supervisory practices affecting financial institutions, which could include more stringent requirements and greater scrutiny from regulatory authorities. These changes and increased scrutiny have resulted and may continue to result in increased costs of doing business and may in the future result in decreased revenues and net income, reduce our ability to effectively compete to attract and retain customers, or make it less attractive for us to continue providing certain products and services. Any future changes in federal and state law and regulations, as well as the interpretations and implementations, or modifications or repeals, of such laws and regulations, could affect us in substantial and unpredictable ways, including those listed above or other ways that could have a material adverse effect on our business, financial condition or results of operations.

Our inability to remain in compliance with regulatory requirements in a particular jurisdiction could have a material adverse effect on our operations in thata given market and on our reputation generally. No assurance can be given that applicable laws or regulations will not be amended or construed differently or that new laws and regulations will not be adopted, either of which could materially adversely affect our business, financial condition, or results of operations.

The USA PATRIOTPatriot Act of 2001 and the Bank Secrecy Act, or the BSA require financial institutions to design and implement programs to prevent financial institutions from being used for money laundering and terrorist activities. If such activities are detected, financial institutions are obligated to file suspicious activity reports with FinCEN. These rules require financial institutions to establish procedures for identifying and verifying the identity of customers and beneficial owners of certain legal entity customers seeking to open new financial accounts. Federal and state bank regulators also have focused on compliance with Bank Secrecy ActBSA and anti-money laundering regulations. In January 2021, the Anti-Money Laundering Act of 2020, or the AMLA, which amends the BSA, was enacted. The AMLA is intended to comprehensively reform and modernize US anti-money laundering laws. Many of the statutory provisions in the AMLA will require additional rulemakings, reports and other measures, and the impact of the AMLA, including on our compliance costs and compliance risk relating to the BSA, will depend on, among other things, rulemaking and implementation guidance. Failure to comply with these regulations could result in fines or sanctions, including restrictions on conducting acquisitions or expanding activities. During the last several years, a number of banking institutions have received large fines for non-compliance with these laws and regulations. Although we have policies and procedures designed to assist in compliance with the BSA and other anti-money laundering laws and regulations, there can be no assurance that such policies or procedures will work effectively all of the time or protect us against liability for actions taken by our employees, agents, and intermediaries with respect to our business or any businesses that we may acquire. Failure to maintain and implement adequate programs to combat money laundering and terrorist


financing could also have serious reputational consequences for us, which could have a material adverse effect on our business, financial condition or results of operations.

Increases in FDIC insurance premiums may adversely affect our earnings.

Our deposits are insured by the FDIC up to legal limits and, accordingly, we are subject to FDIC deposit insurance assessments. We generally cannot control the amount of premiums we will be required to pay for FDIC insurance. In connection with financial institution failures or losses that the deposit insurance fund suffers, we may be required to pay higher FDIC premiums, or the FDIC may charge special assessments or require future prepayments. For example, in October 2022 the FDIC increased the initial base deposit insurance assessment rates by 2 basis points beginning with the first quarterly assessment period of 2023 and in November 2023 the FDIC adopted a rule to recover, by special assessment, losses to the deposit insurance fund in connection with the closures of Silicon Valley Bank and Signature Bank. See “Supervision and Regulation—Deposit Insurance.” Future increases of FDIC insurance premiums or special assessments could have a material adverse effect on our business, financial condition or results of operations.

25


Regulations relating to privacy, information security and data protection could increase our costs, affect or limit how we collect and use personal information and adversely affect our business opportunities.

We are subject to various privacy, information security, and data protection laws, including requirements concerning cybersecurity and security breach notification, and we could be negatively affected by these laws. For example, our business is subject to the Gramm-Leach-Bliley Act which, among other things: (i) imposes certain limitations on our ability to share nonpublic personal information about our customers with nonaffiliated third parties; (ii) requires that we provide certain disclosures to customers about our information collection, sharing and security practices and afford customers the right to “opt out” of any information sharing by us with nonaffiliated third parties (with certain exceptions); and (iii) requires that we develop, implement and maintain a written comprehensive information security program containing physical, technical, and administrative safeguards appropriate based on our size and complexity, the nature and scope of our activities, and the sensitivity of the customer information we process, as well as plans for responding to data security breaches. Various state and federal banking regulators and statesstate legislatures have also enacted data security breach notification requirements with varying levels of individual, consumer, regulatory and/or law enforcement notification requirements in certain circumstances in the event of a security breach. Moreover, legislators and regulators are increasingly adopting, revising or revisingenforcing privacy, information security, and data protection laws or requirements – including privacy-related regulatory activity at the federal level (e.g., by the Federal Trade Commission) and the state level – that potentially could have a significant impact on our current and planned privacy, data protection, and information security-related practices, our collection, use, sharing, retention and safeguarding of consumer or employee information, and some of our current or planned business activities. This could also increase our costs of compliance and business operations and could reduce income from certain business initiatives. This includes increased privacy-related enforcement activity at the federal level, by the Federal Trade Commission, as well as at the state level.

Compliance with current or future privacy, data protection, and information security laws (including those regarding security breach notification) could result in higher compliance technology, and technologyother operational costs and could restrict our ability to provide certain products and services, which could have a material adverse effect on our business, financial conditions or results of operations. Our failure to comply with privacy, data protection, and information security laws could result in potentially significant regulatory or governmental investigations or actions, litigation, fines, sanctions, and damage to our reputation, which could have a material adverse effect on our business, financial condition, or results of operations.

Our use of third-party vendors and our other ongoing third-party business relationships are subject to regulatory requirements and scrutiny.

We regularly use third-party vendors as part of our business. We also have substantial ongoing business relationships with other third parties. These types of third-party relationships are subject to demanding regulatory requirements and attention by our federal and state bank regulators. Regulation requires us to enhance ouradopt enhanced due diligence, ongoing monitoring and control over our third-party vendors and other ongoing third-party business relationships. In certain cases, we may in the future be required to renegotiate our agreements with these vendors to meet these enhanced requirements, which could increase our costs and potentially limit our competitiveness. We expect that our regulators will hold us responsible for deficiencies in our oversight and control of our third-party relationships and in the performance of the parties with which we have these relationships. As a result, if our regulators conclude that we have not exercised adequate oversight and control over our third-party vendors or other ongoing third-party business relationships or that such third parties have not performed appropriately, we could be subject to enforcement actions, including civil money penalties or other administrative or judicial penalties or fines as well as requirements for customer remediation, any of which could have a material adverse effect our business, financial condition or results of operations.

If any of the various dealerships, contractors or FSPs through which we originate loans fails to fulfill their obligations to consumers or comply with applicable law, we may incur remediation costs. Although the dealerships, contractors and FSPs that we contract with are required to fulfill their contractual commitments to consumers and to comply with applicable law, from time to time they might not, or a consumer might allege that they did not. This, in turn, can result in claims against us or in loans being uncollectible. In those cases, we may decide that it is beneficial to remediate the situation, either by assisting the consumers to get a refund, working with the dealerships, contractors or FSPs to modify the terms of the loans or reducing the amount due by making a concession to the consumer or otherwise. Historically, the cost of remediation has not been material to our business, but it could be in the future.

Our SBIC subsidiaries are licensed by the SBA and are therefore subject to SBA regulations.

Our SBIC subsidiaries are licensed to operate as SBICs and are regulated by the SBA. The SBA also places certain limitations on the financing terms of investments by SBICs in portfolio companies and prohibits SBICs from providing funds for certain purposes or to businesses in a few prohibited industries. Compliance with SBA requirements may cause the SBIC subsidiaries to forego attractive investment opportunities that are not permitted under SBA regulations.

26


Further, SBA regulations require that a licensed SBIC be periodically examined and audited by the SBA to determine its compliance with the relevant SBA regulations. The SBA prohibits, without prior SBA approval, a “change of control” of an SBIC or transfers that would result in any person (or a group of persons acting in concert) owning 10% or more of a class of capital stock of an SBIC. If the SBIC subsidiaries fail to comply with applicable SBIC regulations, the SBA could, depending on the severity of the violation, limit or prohibit their use of debentures, declare outstanding debentures immediately due and payable, and/or limit them from making new investments. In addition, the SBA could revoke or suspend an SBIC license or may appoint a receiver for the SBIC and for its liquidation for willful or repeated violation of, or willful or repeated failure to observe, any provision of the SBIA or any rule or regulation promulgated thereunder. Such actions by the SBA would, in turn, negatively affect us.

Our ability to enter into transactions with our affiliates is restricted.

The SBA restricts the ability of SBICs to lend money to any of their officers, directors, and employees, or invest in any affiliates thereof.


Medallion Bank is subject to certain federal laws that restrict and control its ability to engage in transactions with its affiliates. Sections 23A and 23B of the Federal Reserve Act and applicable regulations restrict the transfer of funds by Medallion Bank to certain of its affiliates, including us, in the form of loans, extensions of credit, investments, or purchases of assets and restrict its ability to provide services to, or receive services from, its affiliates. Sections 23A and 23B also require generally that Medallion Bank’s transactions with its affiliates be on terms no less favorable to Medallion Bank than comparable transactions with unrelated third parties.

Federal and state law may discourage certain acquisitions of our common stock which could have a material adverse effect on our stockholders.

Because Medallion Bank is an “insured depository institution” within the meaning of the Federal Deposit Insurance Act and the Change in Bank Control Act and we areMedallion Financial Corp. is a “financial institution holding company” within the meaning of the Utah Financial Institutions Act, federal and Utah law and regulations prohibit any person or company from acquiring control of us and, indirectly Medallion Bank or Medallion Financial Corp., without, in most cases, prior written approval of the FDIC or the Commissioner of the Utah Department of Financial Institutions, as applicable. Under the Change in Bank Control Act, control is conclusively presumed if, among other things, a person or company acquires 25% or more of any class of ourthe Bank’s voting stock. A rebuttable presumption of control arises if a person or company acquires 10% or more of any class of voting stock and is subject to a number ofseveral specified “control factors” as set forth in the applicable regulations. Although Medallion Bank is an “insured depository institution” within the meaning of the Federal Deposit Insurance Act and the Change in Bank Control Act, your investment in the Company is not insured or guaranteed by the FDIC, or any other agency, and is subject to loss. Under the Utah Financial Institutions Act, control is defined as the power, todirectly or indirectly, or through or in concert with one or more persons to: (a) direct or exercise a controlling influence over (i) management or policies of a financial institution or (ii) the election of a majority of the directors or trustees of an institution or (b) vote 20%25% or more of any class of our voting securities by an individualof a financial institution. In addition, under Utah law, there is a rebuttable presumption that a person has control of a Utah financial institution if the person has the power, directly or indirectly, or through concern with one or more persons, to vote more than 10% but not less than 25% of any class of our voting securities byof a person other than an individual.financial institution. Investors are responsible for ensuring that they do not, directly or indirectly, acquire shares of our common stock in excess of the amount which can be acquired without regulatory approval. These provisions could delay or prevent a third party from acquiring us, despite the possible benefit to our stockholders, or otherwise adversely affect the market price of our common stock.


 Although Medallion Bank is an “insured depository institution” within the meaning of the Federal Deposit Insurance Act and the Change in Bank Control Act, your investment in the Company is not insured or guaranteed by the FDIC, or any other agency, and is subject to loss.

Risk Relating to Our Growth and Operations

We operate in a highly competitive market for investment opportunities.Competition with other lenders could adversely affect us.

The consumer lending market is very competitive and is served by a variety of entities, including banks, savings and loan associations, credit unions, independent finance companies, and financial technology companies. The recreation lending and home improvement lending markets are also highly fragmented, with a small number of lenders capturing large shares of each market and many smaller lenders competing for the remaining market share. Our competitors often seek to provide financing on terms more favorable to consumers or dealers, contractors, and FSPs than we offer. Many of these competitors also have long-standing relationships with dealers, contractors, and FSPs and may offer other forms of financing that we do not offer, e.g., credit card lending. We anticipate that we will encounter greater competition as we expand our operations, and competition may also increase in more stable or favorable economic conditions. Certain of our competitors are not subject to the same regulatory requirements that we are and, as a result, these competitors may have advantages in conducting certain business and providing certain services and may be more aggressive in their loan origination activities. Increasing competition could also require us to lower the rates we charge on loans in order to maintain our desired loan origination volume, which could also have a material adverse effect on our business, financial condition and results of operations.

27


We have in the past and may in the future pursue new strategies and lines of business, and we may face enhanced risks as a result of these changes in strategy, including from transacting with a broader array of customers and exposure to new assets, activities and markets.

In July 2019, we commenced the build-out of a newlaunched our Strategic Partnership Program, through which the Bank partnerswe partner with third parties to offer consumer loans and other financial services. Potential legal and regulatory risks associated with this line of business remain uncertain and may develop in ways that could affect us adversely, including as a result of legal proceedings brought against us on the basis that we are the “true lender” of the loans facilitated, held and serviced by our partners,Strategic Partners, or on the basis of a determination by the FDIC or other financial regulators that our Strategic Partnership Program represents an unsafe and unsound practice.

We may continue to change our strategy and enter new lines of business, including through the acquisition of another company, acquisitions of new types of loan portfolios or other asset classes, or otherwise, in the future. Any new business initiatives, including our Strategic Partnership Program, have in the past and may in the future expose us to new and enhanced risks, including new credit-related, compliance, fraud, market and operational risks, increased compliance and operating costs, different and potentially greater regulatory scrutiny of such new activities and assets, and may expose us to new types of consumerscustomers as well as asset classes, activities and markets.

Any new business initiatives and strategies we may pursue in the future may be less successful than anticipated and may not advance our intended business strategy. We may not realize a satisfactory return on investments or acquisitions, we may experience


difficulty in managing new portfolios or integrating operations, and management’s attention from our other businesses could be diverted. Any of these results could ultimately have an adverse effect on our business, financial condition or results of operations.

Our financial condition and results of operations will depend on our ability to manage growth effectively.

Our ability to achieve our loan and investment objective will depend on our ability to grow, which will depend, in turn, on our management team’s ability to identify, evaluate, and monitor, and our ability to finance and invest in, companies that meet our investment criteria.

Accomplishing this result on a cost-effective basis will be largely a function of our management team’s handling of the investment process, its ability to provide competent, attentive, and efficient services, and our access to financing on acceptable terms. In addition to monitoring the performance of our existing investments, members of our management team and our investment professionals may also be called upon to provide managerial assistance to our portfolio companies. These demands on their time may distract them or slow the rate of investment. In order to grow, we will need to hire, train, supervise, and manage new employees. However, we cannot assure you that any such employees will contribute to the success of our business. Any failure to manage our future growth effectively could have a material adverse effect on our business, financial condition, and results of operations.

Our business depends on our ability to adapt to rapid technological change.

The financial services industry is continually undergoing rapid technological change with frequent introductions of new, technology-driven products and services. The effective use of technology increases efficiency and enables financial institutions to serve customers better and to reduce costs.better. Our future success depends, in part, upon our ability to address the needs of customers by using technology to provide products and services that will satisfy customer demands, as well as to create additional efficiencies in our operations. Many of our competitors have substantially greater resources to invest in technological improvements than we do. We may not be able to effectively implement new, technology-driven products and services or be successful in marketing these products and services to our customers. In addition, the implementation of technological changes and upgrades to maintain current systems and integrate new ones may also cause service interruptions, transaction processing errors and system conversion delays and may cause us to fail to comply with applicable laws. Failure to successfully keep pace with technological change affecting the financial services industry and failure to avoid interruptions, errors and delays could have a material adverse effect on our business, financial condition or results of operations.

We expect that new technologies and business processes applicable to the banking industry will continue to emerge, and these new technologies and business processes may be better than those we currently use. Because the pace of technological change is high and our industry is intensely competitive, we may not be able to sustain our investment in new technology as critical systems and applications become obsolete or as better ones become available. A failure to maintain current technology and business processes could cause disruptions in our operations or cause our products and services to be less competitive, all of which could have a material adverse effect on our business, financial condition or results of operations.

28


Security breaches and other disruptions could compromise our information and expose us to liability, which would cause our business and reputation to suffer.

In the ordinary course of our business, we collect and store sensitive data, including our proprietary business information and that of our customers and personally identifiablethe personal information of our customers and employees, on our systems, in third-party data centers, andor on our networks.the systems of service providers or other third parties on which we rely. The secure processing, maintenance, and transmission of this information is critical to our operations. Despite our security and business continuity measures, our information technology and infrastructure may be vulnerable to attacks by hackers or breached due to employee error, or malfeasance, or other disruptions or vulnerable to other disruptions as a result of systems failures, operational events, employee error, or incidents affecting our third-party service providers (or providers to those third-party service providers). Any such breach or disruption could compromise our networks and the information stored there could be accessed, publicly disclosed, destroyed, lost, or stolen. Any such access, disclosure, destruction or other lossimpact to the confidentiality, integrity or availability of such information could result in legal claims or proceedings, liability under laws that protect the privacy of personal information and regulatory penalties, disrupt our operations and damage our reputation, which could adversely affect our business. In addition, we may also be required to incur significant costs in connection with any regulatory investigation or civil litigation resulting from a security breach or other information technology disruption that affects us.

We have been, and likely will continue to be, the target of attempted cyber-attacks, computer viruses, malicious code, phishing attacks, denial of service attacks and other information security threats. To date, cyber-attacks have not had a material impact on our financial condition, results or business; however, we could suffer material financial or other losses in the future and we are not able to predict the severity of these attacks. Our risk and exposure to these matters remains heightened because of, among other things, the evolving nature of these threats, the current global economic and political environment, our work-from home arrangements, the outsourcing of some of our business operations, the ongoing shortage of qualified cybersecurity professionals, and the interdependence of third parties to our systems. In addition, our increasing interconnectivity with service providers, dealerships, contractors and FSPs, including through application programming interfaces, increases the risk that a security breach or other disruption affecting a third party materially affects our ability to conduct business. Regulatory agencies have also become increasingly focused on cybersecurity, including as a result of the increasing number of cybersecurity incidents; given this regulatory and cyber threat environment, we may incur additional expenses in order to comply with new obligations.

We are dependent upon our key investment personnelsenior management team for our future success.

We depend on the diligence, skill, and network of business contacts of the investment professionals we employ for sourcing, evaluating, negotiating, structuring, and monitoring our investments. Our future success will also depend, to a significant extent,depends on the continued service and coordination of our senior management team particularly,and its coordination with the senior management team at Medallion Bank. These members of senior management include Alvin Murstein, our Chairman and Chief Executive Officer, Andrew M. Murstein, our President Larry D. Hall,and Chief Operating Officer, Anthony N. Cutrone, our Executive Vice President and Chief Financial Officer, Donald S. Poulton, President and his management team forChief Executive Officer, Medallion Bank, D. Justin Haley, Executive Vice President and Chief Financial Officer, Medallion Bank, and Alex TravisSteven M. Hannay, Executive Vice President and his management team atChief Lending Officer, Medallion Capital.Bank. The departure of Messrs. Murstein or Mr. Hall, or any other member of our senior management or the senior management team at Medallion Bank could have a material adverse effect on our ability to manage or grow our business and effectively mitigate risk.

The development and use of Artificial Intelligence, or AI, present risks and challenges that may adversely impact our business.

We or our third-party vendors, service providers, dealerships, contractors or FSPs with which we have relationships may develop or incorporate AI technology in certain business processes, services or products. The development and use of AI present a number of risks and challenges to our business. The legal and regulatory environment relating to AI is uncertain and rapidly evolving, both in the U.S. and internationally, and includes regulatory schemes targeted specifically at AI as well as provisions in intellectual property, privacy, consumer protection, employment and other laws applicable to the use of AI. These evolving laws and regulations could increase our compliance costs and the risk of non-compliance. AI models, particularly generative AI models, may produce output or take action that is incorrect, that result in the release of private, confidential or proprietary information, that reflect biases included in the data on which they are trained, infringe on the intellectual property rights of others, or that is otherwise harmful or which produce outcomes contrary to the expectations of consumers. In addition, the complexity of many AI models makes it challenging to understand why they are generating particular outputs. This limited transparency increases the challenges associated with assessing the proper operation of AI models, understanding and monitoring the capabilities of the AI models, reducing erroneous output, eliminating bias and complying with regulations that require documentation or explanation of the basis on which decisions are made. Further, we may rely on AI models developed by third parties, and, to that extent, would be dependent in part on the manner in which those third parties develop and train their models, including risks arising from the inclusion of any unauthorized material in the training data for their models, and the effectiveness of the steps these third parties have taken to limit the risks associated with the output of their models, matters over which we may have limited visibility. Any of these risks could expose us to liability or adverse legal or regulatory consequences and harm our reputation and the public perception of our business or the effectiveness of our security measures or other controls.

29


In addition to our use of AI technologies, we are exposed to risks arising from the use of AI technologies by bad actors to commit fraud and misappropriate funds and to facilitate cyberattacks. Generative AI, if used to perpetrate fraud or launch cyberattacks, could create panic at a particular financial results.institution or exchange, which could pose a threat to financial stability.


Terrorist attacks, other acts of violence or war, and natural disasters may affect any market for our securities, impact the businesses in which we invest, and harm our operations and profitability.

Terrorist attacks and natural disasters may harm our results of operations and your investment. We cannot assure you that there will not be further terrorist attacks against the USU.S. or USU.S. businesses or major natural disasters hitting the United States. Such attacks or natural disasters in the USU.S. or elsewhere may impact the businesses in which we directly or indirectly invest by undermining economic conditions in the United States. In addition, a portion of our business is focused inon the New York City metropolitan area, which suffered a terrorist attack in 2001 and has faced continued threats. Another terrorist attack in New York City or elsewhere could severely impact our results of operations. Losses resulting from terrorist attacks are generally uninsurable.

Our operations could be interrupted if certain external vendors on which we rely experience difficulty, terminate their services or fail to comply with banking laws and regulations.

We depend to a significant extent on relationships with third parties that provide services, primarily information technology services critical to our operations. Currently, we obtain services from third parties that include information technology infrastructure and support, plus loan origination, loan servicing, and accounting systems and support. If any of our third-party service providers experience difficulties or terminate their services and we are unable to replace our service providers with other service providers, our operations could be interrupted. It may be difficult for us to replace some of our third-party vendors, particularly vendors providing our loan origination, loan servicing and accounting services, in a timely manner if they are unwilling or unable to provide us with these services in the future for any reason. If an interruption were to continue for a significant period of time, it could have a material adverse effect on our business, financial condition or results of operations. Even if we are able to replace these third parties, it may be at higher cost to us, which could have a material adverse effect on our business, financial condition, or results of operations. In addition, if a third-party provider fails to provide the services we require, fails to meet contractual requirements, such as compliance with applicable laws and regulations, or suffers a cyber-attack or other security breach, our business could suffer economic and reputational harm that could have a material adverse effect on our business, financial condition or results of operations.

Misconduct by current or former employees could expose us to significant legal liability and reputational harm.

We are vulnerable to reputational harm because we operate in an industry in which integrity and the confidence of the dealerships, contractors, and FSPs that sell our consumer products are of critical importance. Our current and former directors, and employees could engage or could have engaged in misconduct that adversely affects our business. For example, if such a person were to engage, or previously engaged, in fraudulent, illegal or suspicious activities, we could be subject to regulatory sanctions and suffer serious harm to our reputation (as a consequence of the negative perception resulting from such activities), financial position, third-party relationships and ability to forge new relationships with third-party dealers, contractors or contractors.FSPs. Our business often requires that we deal with confidential information. If our current and former directors, and employees were to improperly use or disclose this information or previously improperly used or disclosed this information, even if inadvertently, we could suffer serious harm to our reputation, financial position and current and future business relationships. It is not always possible to deter employee misconduct, and the precautions we take to detect and prevent this activity may not always be effective. Misconduct by our current and former employees or former directors, and employees, or even unsubstantiated allegations of misconduct, could result in a material adverse effect on our business, financial condition or results of operations.

We borrow money, which magnifies the potential for gain or loss on amounts invested, and increases the risk of investing in us.

Borrowings, also known as leverage, magnify the potential for gain or loss on amounts invested, and therefore increase the risk associated with investing in us. We borrow from the brokered CD market, private and public note placements and issue senior debt securities to banks and other lenders, and through long-term subordinated SBA debentures. These creditors have fixed dollar claims on our assets that are superior to the claims of our stockholders. If the value of our assets increases, then leveraging would cause stockholders’ equity to increase more sharply than it would have had we not leveraged. Conversely, if the value of our assets decreases, leveraging would cause stockholders’ equity to decline more sharply than it otherwise would have had we not leveraged. Similarly, any increase in our income in excess of interest payable on the borrowed funds would cause our net income to increase more than it would without the leverage, while any decrease in our income would cause net income to decline more sharply than it would have had we not borrowed. Such a decline could reduce the amount available for distribution payments.

As of December 31, 2020,2023, we had $1.3$2.1 billion of outstanding indebtedness with a weighted average borrowing cost of 2.37%3.50%.

30


Approximately $730 million$0.7 billion of our borrowing relationships have maturity dates during 2021 through 2022, including almost $6352024, a vast majority of which are brokered certificates of deposit. We currently have $33.0 million of brokered CDs. We have been in active and ongoing discussions with eachindebtedness of these lenders and have extended each ofwhich the facilities as they matured. Certain lenders have worked with us to extend and change the terms of the borrowing agreements, but we cannot assure you that they will continue to do so. Additionally, with the cessation of LIBOR by the end of 2021, there could beinterest rate adjustments that may have material impacts to our cost of borrowings.is SOFR-based. See Note 65 of our consolidated financial statements for a discussion of the current and new lending arrangements to date.


Additional Risks Relating to Our Loan Portfolios and Investments

Lending to small businesses involves a high degree of risk and is highly speculative.

Lending to small businesses involves a high degree of business and financial risk, which can result in substantial losses and should be considered speculative. Historically, our borrower base consists primarily of small business owners that may have limited resources and that are generally unable to obtain financing from traditional sources. There is generally no publicly available information about these small business owners, and we must rely on the diligence of our employees and agents to obtain information in connection with our credit decisions. In addition, these small businesses often do not have audited financial statements. Some smaller businesses have narrower product lines and market shares than their competition. Therefore, they may be more vulnerable to customer preferences, market conditions, or economic downturns, which may adversely affect the return on, or the recovery of, our investment in these businesses.

Our portfolio is and may continue to be concentrated in a limited number of portfolio companies, industries and sectors, which will subject us to a risk of significant loss if any of these companies default on its obligations to us or by a downturn in the particular industry or sector.

Our portfolio is and may continue to be concentrated in a limited number of portfolio companies, industries and sectors. In addition, taxi companies that constitute separate issuers may have related management or guarantors and constitute larger business relationships to us. We do not have fixed guidelines for diversification, and while we are not targeting any specific industries, our investments are, and could continue to be, concentrated in relatively few industries. As a result, the aggregate returns we realize may be adversely affected if a small number of loans perform poorly or if we need to write down the value of any one loan. If our larger borrowers were to significantly reduce their relationships with us and seek financing elsewhere, the size of our loan portfolio and operating results could decrease. In addition, larger business relationships may also impede our ability to immediately foreclose on a particular defaulted portfolio company as we may not want to impair an overall business relationship with either the portfolio company management or any related funding source. Additionally, a downturn in any particular industry or sector in which we are invested could also negatively impact the aggregate returns we realize.

The lack of liquidity in our investments may adversely affect our business.

We generally make investments in private companies. Substantially all of these securities are subject to legal and other restrictions on resale or are otherwise less liquid than publicly traded securities. The illiquidity of our investments may make it difficult for us to sell such investments if the need arises. In addition, if we are required to liquidate all or a portion of our portfolio quickly, we may realize significantly less than the value at which we had previously recorded our investments. We may also face other restrictions on our ability to liquidate an investment in a portfolio company to the extent that we have material non-public information regarding such portfolio company.

In addition, the illiquidity of our loan portfolio and investments may adversely affect our ability to dispose of loans at times when it may be advantageous for us to liquidate such portfolio or investments. In addition, if we were required to liquidate some or all of the investments in the portfolio, the proceeds of such liquidation may be significantly less than the current value of such investments. Because we borrow money to make loans and investments, our net operating income is dependent upon the difference between the rate at which we borrow funds and the rate at which we invest these funds. As a result, there can be no assurance that a significant change in market interest rates will not have a material adverse effect on our interest income. In periods of rising interest rates, our cost of funds would increase, which would reduce our net operating income before net realized and unrealized gains. We use a combination of long-term and short-term borrowings and equity capital to finance our investing activities. Our long-term fixed-rate investments are financed primarily with short-term floating-rate debt, and to a lesser extent by term fixed-rate debt. We may use interest rate risk management techniques in an effort to limit our exposure to interest rate fluctuations. Such techniques may include various interest rate hedging activities.

We have analyzed the potential impact of changes in interest rates on net interest income. Assuming that the balance sheet were to remain constant and no actions were taken to alter the existing interest rate sensitivity a hypothetical immediate 1% increase in interest rates would result in an increase to the line item “net income”net income as of December 31, 20202023 by approximately $1,183,000$1.6 million on an annualized basis, and the impact of such an immediate increase of 1% over a one year period would have been approximately ($1,763,000)a reduction in net income by $1.9 million at December 31, 2020.2023. Although management believes that this measure is indicative of our sensitivity to interest rate changes, it does not adjust for potential changes in credit quality, size, and composition of the assets on the balance sheet, and other business developments that could affect net increase in net assets resulting from operations in a particular quarter or for the year taken as a whole. Accordingly, no assurances can be given that actual results would not differ materially from the potential outcome simulated by these estimates.

31


Sales of loans could have an adverse effect on the credit or other characteristics of the loans and portfolios we retain.

From time to time, we have sold portfolios of loans, and those transactions have generally included loans with stronger credit characteristics than the overall composition of our loan portfolio. Accordingly, following those transactions, the overall credit characteristics of our loan portfolio declined due to the transfer of the loans with stronger credit characteristics. In the future, the credit


characteristics of our loan portfolio could change as a result of loan sales, and other characteristics could change as well. For example, if we sell loans with less favorable credit characteristics, the net interest income and net interest margin for our loan portfolio could be adversely affected because loans with less favorable credit characteristics typically generate more net interest income and higher net interest margin.

We depend on the accuracy and completeness of information about customers.

In deciding whether to extend credit or enter into other transactions, and in evaluating and monitoring our loan portfolio on an ongoing basis, we may rely on information furnished by or on behalf of customers, including financial statements, credit reports and other financial information. We may also rely on representations of those customers or of other third parties, such as independent auditors, as to the accuracy and completeness of that information. The failure to receive financial statements, credit reports or other financial or business information related to our customers on a timely basis, or the inadvertent reliance by us on inaccurate, incomplete, fraudulent or misleading forms of any of the foregoing information, could result in loancredit losses, reputational damage or other effects that could have a material adverse effect on our business, financial condition or results of operations.

Laws and regulations implemented in response to climate change could result in increased operating costs for our portfolio companies.

CongressClimate change may cause extreme weather events that may disrupt our operations, the operations of the FSPs, dealerships or contractors with which we have relationships, or the businesses and other governmental authorities have either considered or implemented various laws and regulations in response to climate change and the reduction of greenhouse gases. Existing environmental regulations could be revised or reinterpreted, new laws and regulations could be adopted, and future changes in environmental laws and regulations could occur, which could impose additional costs on the operationemployers of our portfolio companies. For example, regulations to cut gasoline use and control greenhouse gas emissions from new carsborrowers. Any such disruptions could adversely affect our medallion portfolio companies. Our portfolio companies may have to make significant capital and other expenditures to comply with these laws and regulations. Changes in, or new, environmental restrictions may force our portfolio companies to incur significant expenses or expenses that may exceed their estimates. There can be no assurance that such companies would be able to recover all or any increased environmental costs from their customers or that their business, financial condition or results of operations would not be materially and adverselyability to originate new loans. Climate change and the transition to a less carbon-dependent economy could also have a negative impact on origination volumes in our Recreation Lending segment if demand for recreational vehicles decreases due to climate-related concerns. In addition, our credit risks could increase and demand for our products could decrease if and to the extent our borrowers work in industries that are negatively affected by such expendituresclimate change and climate transition efforts.

New regulations or any changesguidance relating to climate change, as well as the perspectives of regulators, employees and other stakeholders regarding climate change, may affect whether and on what terms and conditions we engage in environmental lawscertain activities or offer certain products. Federal and regulations,state banking regulators and supervisory authorities and other stakeholders have increasingly viewed financial institutions as playing an important role in helping to address risks related to climate change, both directly and with respect to their customers, which casemay result in financial institutions coming under increased requirements and expectations regarding the valuedisclosure and management of these companies could be adversely affected.

Our business may be further adversely affected if New York City experiences a sustained economic downturn.

Historically, a significant portion of our loan revenue is derived from medallion loans collateralized by New York City taxi medallions. An economic downturn in New York City could lead to an additional increase in defaults on our medallion loanstheir climate risks and related lending activities. For example, in October 2023, the federal bank regulatory agencies jointly issued principles for climate-related financial risk management for large financial institutions, which apply to regulated financial institutions with more than $100 billion in total consolidated assets.

An economic downturn While these principles do not apply to us, we may also become subject to new or heightened regulatory requirements relating to climate change, such as requirements relating to operational resiliency or analyses for various climate stress scenarios. Any such new or heightened requirements could result in additional commercialincreased regulatory, compliance or other costs or higher capital requirements. The risk associated with, and consumer loan customers experiencing declines in business activities and/or personal resources,the perspective of regulators, employees and other stakeholders regarding, climate change is evolving rapidly, which could leadmakes it difficult to difficulties in their servicingassess the ultimate impact on us of their loans with us,climate change-related risks and increasing the level of delinquencies, defaults,uncertainties, and loan losses in our commercial and consumer loan portfolios.we expect that climate change-related risk will increase over time.

Our portfolio companies may incur debt that ranks equally with, or senior to, our investments in such companies.

We invest in our portfolio companies primarily through senior secured loans, junior secured loans, and subordinated debt issued by small- tosmall-to mid-sized companies. Our portfolio companies may have, or may be permitted to incur, other debt that ranks equally with, or senior to, the debt in which we invest. By their terms, such debt instruments may entitle the holders to receive payment of interest or principal on or before the dates on which we are entitled to receive payments with respect to the debt instruments in which we invest. Also, in the event of insolvency, liquidation, dissolution, reorganization, or bankruptcy of a portfolio company, holders of debt instruments ranking senior to our investment in that portfolio company would typically be entitled to receive payment in full before we receive any distribution. After repaying such senior creditors, such portfolio company may not have any remaining assets to use for repaying its obligation to us. In the case of debt ranking equally with debt instruments in which we invest, we would have to share on an equal basis any distributions with other creditors holding such debt in the event of an insolvency, liquidation, dissolution, reorganization, or bankruptcy of the relevant portfolio company.

32


There may be circumstances where our debt investments could be subordinated to claims of other creditors or we could be subject to lender liability claims.

Even though we may have structured most of our investments as senior loans, if one of our portfolio companies were to go bankrupt, depending on the facts and circumstances, including the extent to which we actually provided managerial assistance to that portfolio company, a bankruptcy court might recharacterize our debt investment and subordinate all or a portion of our claim to that of other creditors. We may also be subject to lender liability claims for actions taken by us with respect to a borrower’s business or instances where we exercise control over the borrower. It is possible that we could become subject to a lender’s liability claim, including as a result of actions taken in rendering significant managerial assistance.


If our underwriting processes do not adequately assess risk, contain errors or are otherwise ineffective, whether due to automation or otherwise, our reputation and relationships with dealerships, contractors and FSPs could be harmed, our market share could decline and our financial condition, liquidity and result of operations could be adversely affected.

Our ability to maintain relationships with dealerships, contractors and FSPs is significantly dependent on our ability to effectively evaluate a borrower's credit profile and likelihood of default in a timely fashion. To conduct this evaluation, we utilize credit, pricing, loss forecasting and scoring models that allow us to automate elements of our underwriting processes. Our models are based on algorithms that evaluate several factors, including behavioral data, transactional data, bank data and employment information, which may not effectively predict future credit loss. We have also been increasing the role of technology and automation in our credit underwriting processes. If we are unable to effectively segment borrowers into relative risk profiles, we may be unable to offer attractive interest rates. Additionally, if these models fail to adequately assess the creditworthiness of our borrowers, whether due to flaws in model design, inaccurate or insufficient data or otherwise, we may experience higher than forecasted losses and our financial condition, liquidity and results of operations could be adversely affected.

We regularly refine these algorithms based on new data and changing macro-economic conditions. However, the models that we use may not accurately assess the creditworthiness of our borrowers and may not be effective in assessing creditworthiness in the future. In addition, allegations, whether or not accurate, that underwriting decisions do not treat borrowers fairly, or comply with applicable laws or regulations, can result in negative publicity, reputational harm and regulatory scrutiny.

We may not control many of Medallion Capital’s portfolio companies.

We maydo not control many of Medallion Capital’s portfolio companies, even though we may have board representation or board observation rights. As a result, we are subject to the risk that a Medallion Capital portfolio company in which we invest may make business decisions with which we disagree, and the management of such company may take risks or otherwise act in ways that do not serve our interests as debt investors.

We may not realize gains from our equity investments.

Certain investments that we have made in the past and may make in the future include warrants or other equity securities. In addition, we may from time to time make non-control, equity co-investments in companies in conjunction with private equity sponsors. Our goal is ultimately to realize gains upon our disposition of such equity interests. However, the equity interests we receive may not appreciate in value and, in fact, may decline in value. Accordingly, we may not be able to realize gains from our equity interests, and any gains that we do realize on the disposition of any equity interests may not be sufficient to offset any other losses we experience. We also may be unable to realize any value if a portfolio company does not have a liquidity event, such as a sale of the business, recapitalization, or public offering, which would allow us to sell the underlying equity interests.

33


ITEM 1B. UNRESOLVED STAFF COMMENTS

None.

ITEM 1C. CYBERSECURITY

Risk Management and Strategy

Identifying, assessing, and managing material cybersecurity risks is an important function of our enterprise risk management program. Material cybersecurity risks from cybersecurity threats are managed across Medallion Financial Corp., the Bank, Medallion Capital, and third-party vendors and monitoring such risks and threats involves coordination between us as the parent company and our two main operating subsidiaries. We continue to integrate our cybersecurity programs into our enterprise risk management program, which is led by various senior representatives of the Company and overseen by the Audit Committee of the Company’s Board of Directors.

Medallion Financial Corp., the Bank and Medallion Capital are each responsible for developing cybersecurity programs appropriate for their respective entities, including as may be required by applicable law or regulation. These programs have been guided by the National Institute of Standards and Technology Cybersecurity Framework, other industry-recognized standards, and contractual requirements, as applicable, and seek to protect each entity against cybersecurity risks and provide a foundation to respond promptly to cybersecurity events. Each entity maintains technical and organizational safeguards, including, among other things, employee testing and training, incident response programs and tabletop exercises, evaluations and assessments by third parties, vulnerability scanning, vendor management, cybersecurity insurance, and business continuity mechanisms for the protection of Company assets. Our programs also assess and manage third party risks, and we perform third-party risk management to identify and mitigate risks from third parties such as vendors and other business partners associated with our use of third-party service providers.

Our business strategy, results of operations and financial condition have not been materially affected by risks from cybersecurity threats, and we currently do not expect that risks from cybersecurity threats are reasonably likely to materially affect us, but we cannot provide assurance that we will not be materially affected in the future by such risks or any future material incidents. For more information on our cybersecurity related risks, see Item 1A Risk Factors of this Annual Report on Form 10-K.

Governance

The Audit Committee of our Board of Directors is responsible for overseeing the Company’s enterprise risk management program, including overseeing the adequacy of protection of the Company’s technology, including physical security, patent and trademark program, proprietary information, and information security. The Audit Committee receives quarterly reports from our Information Security Director and third parties on cybersecurity matters. In addition, the Audit Committee receives quarterly reports addressing cybersecurity as part of our enterprise risk management program and to the extent cybersecurity matters are addressed in regular business updates. These reports include, among other things, existing and new cybersecurity risks, status on how management is addressing and/or mitigating those risks, cybersecurity and data privacy incidents, if any, and the status of key information security initiatives. Our Audit Committee members also engage in ad hoc conversations with management on cybersecurity-related news and events, and discuss any updates, as needed, to our cybersecurity risk management and strategy programs.

Medallion Financial Corp. employs a Director of Information Security, and our main operating subsidiaries have similar functions and/or roles conducted by various individuals. Such information security leadership are responsible for developing cybersecurity programs appropriate for their respective entities, including as may be required by applicable law or regulation. These individuals’ expertise in information security and cybersecurity generally has been gained from a combination of education, including relevant degrees and/or certifications, and prior work experience. They are informed by their respective cybersecurity teams and third-party vendors about, and monitor, the prevention, detection, mitigation and remediation efforts relating to any cybersecurity incidents as part of the cybersecurity programs described above.

Information regarding cybersecurity risks may be elevated from information security leadership through a variety of different channels, including discussions between or among subsidiary and parent company management, reports to subsidiary and parent company risk committees and reports to subsidiary and parent company boards and board committees. As noted above, the Audit Committee regularly receives reports on cybersecurity matters from our Information Security Director and third parties as well as part of our enterprise risk management program.

34


ITEM 2. PROPERTIES

ITEM 1B.

UNRESOLVED STAFF COMMENTS

None.

ITEM 2.

PROPERTIES

We lease office space in New York City for our corporate headquarters under a lease expiring in April 2027. We also lease office space for loan origination offices and subsidiary operations in Newark, New Jersey, which, along with our New York City office, handles our taxi medallion loan segment, and in Minneapolis,Excelsior, Minnesota, which handles our commercial lending segment. Medallion Bank leases office space in Salt Lake City, Utah under a lease expiring in November 2027,2030, which handles the recreation and home improvement lending segments, and in Bothell, Washington, which handles our home improvement lending segment.segments. We do not own any real property, other than foreclosed properties obtained as a result of lending relationships. We believe that our leased properties, taken as a whole, are in good operating condition and are suitable for our current business operations.

ITEM 3.

See Note 10 “Commitments and Contingencies” subsections (c) and (d) to the consolidated financial statements included in variousItem 15 of this Annual Report on Form 10-K for details of the Company’s legal proceedings, incident toincluding the ordinary course of our business, including collection matters with respect to certain loans. We intend to vigorously defend any outstanding claims and pursue our legal rights. In the opinion of our management and based upon the advice of legal counsel, there is no proceeding pending or to the knowledge of management threatened, which in the event of an adverse decision could result in a material adverse effect on our results of operations or financial condition.SEC litigation.

ITEM 4. MINE SAFETY DISCLOSURES

ITEM 4.

MINE SAFETY DISCLOSURES

Not applicable.


35


PART II

ITEM 5. MARKET FOR REGISTRANT’S COMMON EQUITY, RELATED STOCKHOLDER MATTERS AND ISSUER PURCHASES OF EQUITY SECURITIES

ITEM 5.

MARKET FOR REGISTRANT’S COMMON EQUITY, RELATED STOCKHOLDER MATTERS AND ISSUER PURCHASES OF EQUITY SECURITIES

STOCK PERFORMANCE GRAPH

The following graph commences as of December 31, 20152018 and compares the Company’s common stock with the cumulative total return for the NASDAQ Composite Index and the Russell 2000 Index. Furthermore, the following graph assumes the investment of $100 on December 31, 20152018 in each of the Company’s common stock, the stocks comprising the NASDAQ Composite Index and the Russell 2000 Index and assumes dividends are reinvested.

Cumulative Total Return

Based on Initial Investment of $100 on December 31, 2015

2018, with dividends reinvested

img89325101_0.jpg 

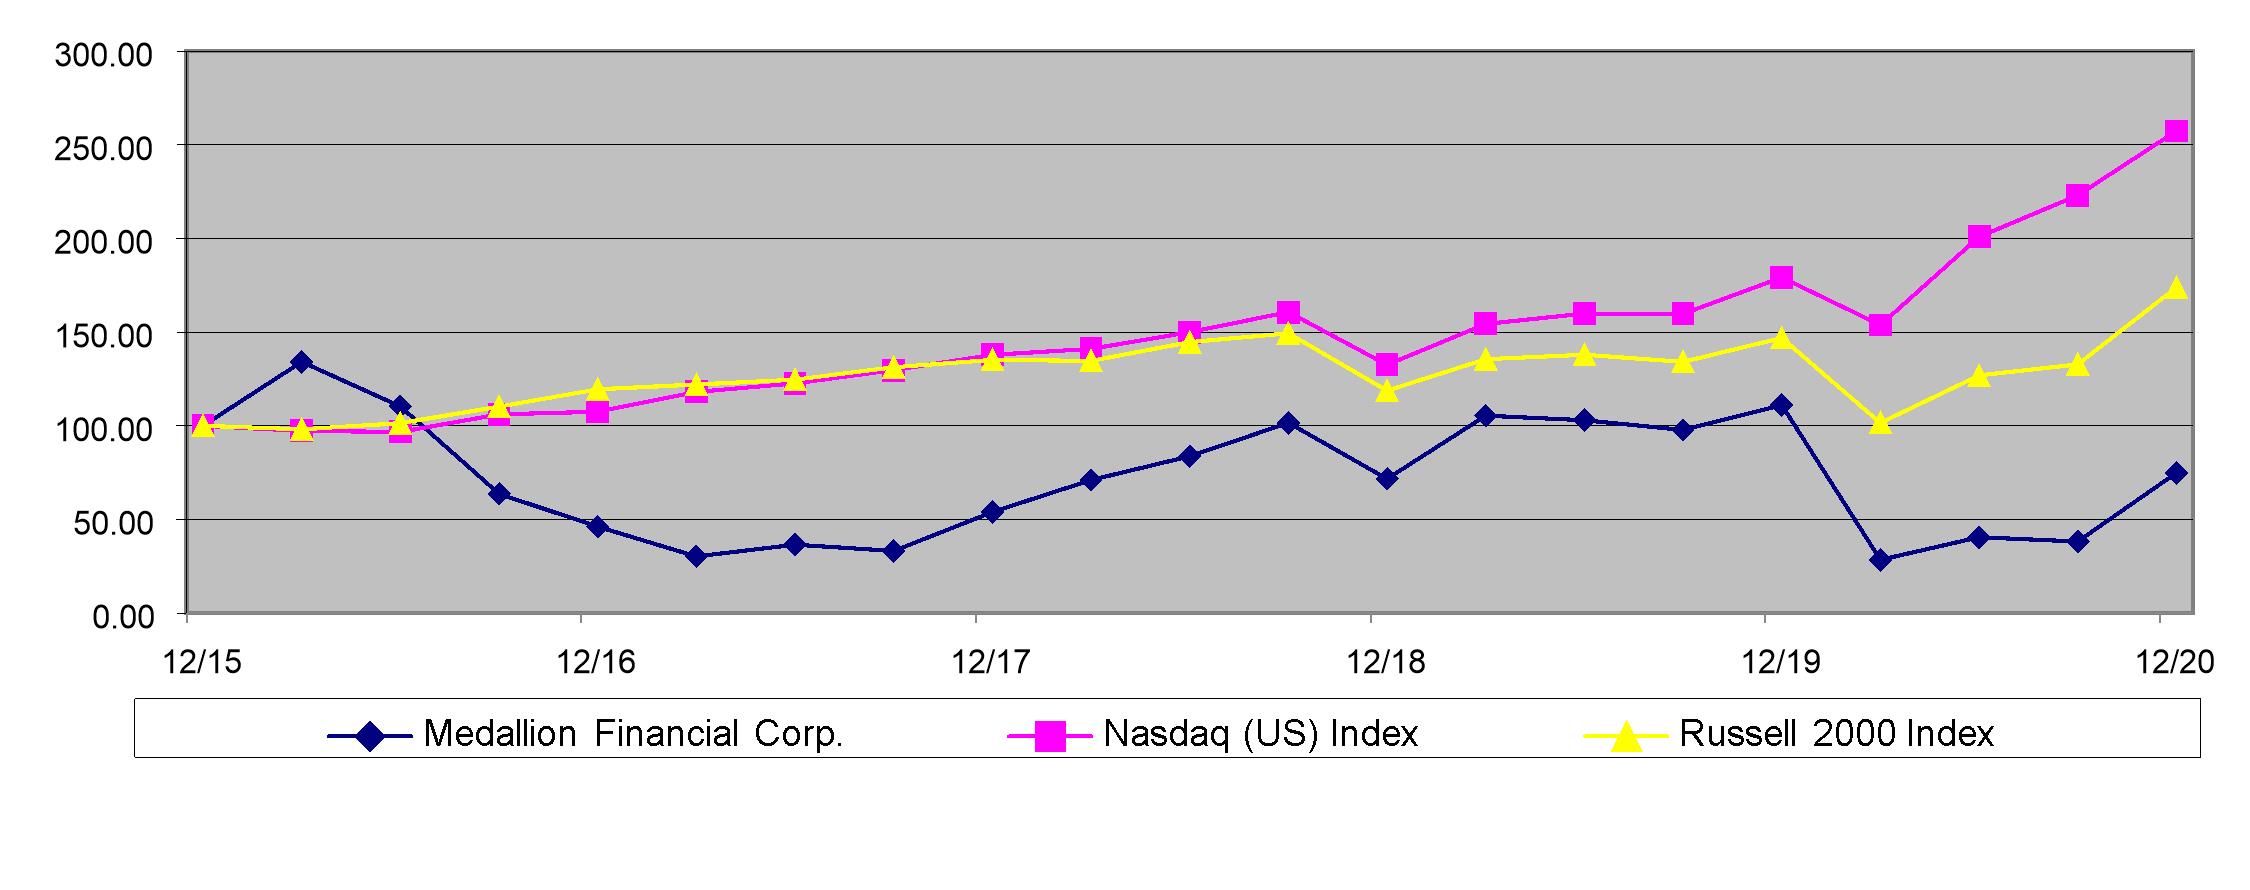
Our common stock is quoted on NASDAQ under the symbol “MFIN.” Our common stock commenced trading on May 23, 1996. As of March 12, 2021,6, 2024, there were approximately 348172 holders of record of our common stock. On March 12, 2021,6, 2024, the last reported sale price of our common stock was $7.56$8.37 per share.

We are subject to federal and applicable state corporate income taxes on our taxable ordinary income and capital gains. We have notBeginning in March 2022, the Company's board of directors reinstated our quarterly dividend. A dividend of $0.08 per share was paid in March, May, and August 2023. On October 24, 2023, the Company’s board of directors authorized and increased the quarterly dividend to $0.10 per share, and a dividend of $0.10 per share was paid in November 2023. The Company currently expects to continue to pay quarterly dividends since 2016 and do not currently anticipate paying dividends.at the current rate for the foreseeable future. We may, however, re-evaluate paying dividendsthe dividend policy in the future depending on market conditions. There can be no assurance that we will continue to pay any cash distributions, as we may retain our earnings to facilitate the growth of our business, to finance our investments, to provide liquidity, or for other corporate purposes.

We have adopted a dividend reinvestment plan pursuant to which stockholders may elect to have distributions reinvested in additional shares of common stock. When we declare a distribution, all participants will have credited to their plan accounts the number of full and fractional shares (computed to three decimal places) that could be obtained with the cash, net of any applicable withholding taxes that would have been paid to them if they were not participants. The number of full and fractional shares is computed at the weighted average price of all shares of common stock purchased for plan participants within the 30 days after the distribution is declared plus brokerage commissions. The automatic reinvestment of distributions will not release plan participants of any income tax that may be payable on the distribution. Stockholders may terminate their participation in the dividend reinvestment plan by providing written notice to the Plan Agent at least 10 days before any given distribution payment date. Upon termination, we will issue to a stockholder both a certificate for the number of full shares of common stock owned and a check for any fractional shares, valued at the then current market price, less any applicable brokerage commissions and any other costs of sale. There are no additional fees or expenses for participation in the dividend reinvestment plan. Stockholders may obtain additional information about the dividend reinvestment plan by contacting the American Stock Transfer &Equiniti Trust Company, LLC at 6201 15th Avenue, Brooklyn, NY, 11219.PO Box 10027, Newark, NJ, 07101.


36


UNREGISTERED SALESPURCHASES OF EQUITY SECURITIES BY THE ISSUER AND USE OF PROCEEDSAFFILIATED PURCHASERS

We did notOn April 29, 2022, our board of directors authorized a new stock repurchase anyprogram with no expiration date, pursuant to which we were authorized to repurchase up to $35 million of our shares, duringwhich was increased to $40 million on August 10, 2022, also with no expiration date. Such new repurchase program replaced the three months endedprevious one, which was terminated. As of December 31, 2020. Accordingly, under our Stock Repurchase Program previously authorized by our Board of Directors,2023, up to $22,874,509$19,998,012 of shares remain authorized for repurchase under our stock repurchase program.

The Company did not repurchase shares of common stock during the program.quarter ended December 31, 2023.

ITEM 6. [Reserved]

ITEM 7. MANAGEMENT’S DISCUSSION AND ANALYSIS OF FINANCIAL CONDITION AND RESULTS OF OPERATIONS

OBJECTIVE

ITEM 6.

SELECTED FINANCIAL DATA

Reserved

ITEM 7.

MANAGEMENT’S DISCUSSION AND ANALYSIS OF FINANCIAL CONDITION AND RESULTS OF OPERATIONS

OBJECTIVE

The information contained in this section should be read in conjunction with the consolidated financial statements and the accompanying notes thereto for the years ended December 31, 2020, 2019,2023, 2022, and 2018.2021. This section is intended to provide managementsmanagement's perspective of our financial condition and results of operation.operations. In addition, this section contains forward-looking statements. These forward-looking statements are subject to the inherent uncertainties in predicting future results and conditions. Certain factors that could cause actual results and conditions to differ materially from those projected in these forward-looking statements are described in the Risk Factors section on page 20.19. Additionally, more information about our business activities can be found in “Business.”

GENERALCOMPANY BACKGROUND

We are a specialty finance company whose strategic focus and growth in recent years has been throughour consumer finance and commercial lending businesses operated by Medallion Bank, (aor the Bank, and Medallion Capital, Inc., or Medallion Capital. The Bank is a wholly-owned subsidiary), whichsubsidiary that originates consumer loans for the purchase of recreational vehicles, boats, motorcycles, and trailers,home improvements, and provides loan origination and other services to finance home improvements. Historically we have hadfintech partners. Medallion Capital is a leading position in originating, acquiring, and servicingwholly-owned subsidiary that originates commercial loans that finance taxi medallions and various types of commercial businesses.

Since Medallion Bank acquired a consumer loan portfolio and began originating consumer loans in 2004, it has increasedthrough its consumer loan portfolio at a compound annual growth rate of 16% (19% if there had been no loan sales during 2016, 2017, and 2018). We have transitioned away from medallion lending and have placed our strategic focus on our growing consumer finance portfolios.mezzanine financing business. As a result of our change in strategy, as of December 31, 2020,2023, our consumer loans represented 93%95% of our netgross loan portfolio withand commercial loans representing 6% and medallion loans representing 1%represented 5%. Total assets under management, which includes assets serviced for third party investors, were $1.8$2.6 billion as of December 31, 2020,2023 and $1.7$2.3 billion as of December 31, 2019, and have grown at a compound annual growth rate of 9% from $215,000,000 at the end of 1996.2022.

Our loan-related earnings depend primarily on our level of net interest income. Net interest income is the difference between the total yield on our loan portfolio and the average cost of borrowed funds. We fund our operations through a wide variety of interest-bearing sources, such asincluding bank certificates of deposit issued to customers,consumers, debentures issued to and guaranteed by the SBA, privately placed notes, and bank term debt.trust preferred securities. Net interest income fluctuates with changes in the yield on our loan portfolioportfolios and changes in the cost of borrowed funds, as well as changes in the amount of interest-earning assets and interest-bearing liabilities held by us. Net interest income is also affected by economic, regulatory, and competitive factors that influence interest rates, loan demand, and the availability of funding to finance our lending activities. We, like other financial institutions, are subject to interest rate risk to the degree that our interest-earning assets reprice, either due to inflation or other factors, on a different basis than our interest-bearing liabilities. We continue to monitor global supply chain disruptions, gas prices, labor shortages, unemployment, and other factors contributing to U.S. inflation and economic health, as well as other factors which contribute to competition and changes in the demand for our loan products. We are taking steps in the event of a potential economic downturn and in light of the current inflationary environment to moderate the pace of our recent growth.

We also provide debt, mezzanine, and equity investment capital to companies in a variety of industries, consistent with our investment objectives.commercial industries. These investments may be venture capital style investments which may not be fully collateralized. Our investments are typically in the form of secured debt instruments with fixed interest rates accompanied by an equity stake or warrants to purchase an equity interest for a nominal exercise price (such warrants are included in equity investments on the consolidated balance sheets). Interest income is earned on the debt instruments.

Beginning in 2019, Medallion Bank began the process to build-out a strategic partnership program with financial technology, or fintech, companies. Medallion Bank entered into an initial partnership in 2020 and began issuing its first loans, while continuing to explore opportunities with additional fintech companies.

In recent years, we have focused on growing our consumer lending segments and maintaining the profitability of our commercial lending segment. During the year ended December 31, 2020, we have taken various steps to pursue this strategy and improve our corporate governance, including:


carrying-out cost-cutting measures, such as reducing our employee headcount by 21% at our parent company Medallion Financial Corp. and closing satellite offices in Long Island City, New York, Chicago, Illinois, and Boston, Massachusetts;

exiting non-core investments, such as selling the assets of LAX Group, LLC on December 16, 2020, and expecting to sell, when practicable to maximize our proceeds, other non-core investments like our remaining art investments of less than $1,000,000 in Medallion Fine Art, Inc.;

strengthening our initiative to grow the Bank by partnering with two fintech companies in our strategic partnership program; and  

electing Cynthia A. Hallenbeck as our independent director, resulting in a more independent and diverse board of directors.

On March 7, 2018, a majority of the Company’s shareholders authorized our board of directors to withdraw our election to be regulated as a business development company, or BDC, under the Investment Company Act of 1940, as amended, or the 1940 Act, and we withdrew such election effective April 2, 2018. At that point, we were no longer a BDC or subject to the provisions of the 1940 Act applicable to BDCs. Historically, the composition of our assets caused it to meet the definition of an “investment company,” and we made a corresponding election to be treated as a BDC. Now that we have de-elected BDC status, it operates so as to fall outside the definition of an “investment company” or within an applicable exception.

As a result of this change in status, commencing with the three months ended June 30, 2018:

we consolidated the results of Medallion Bank and our other subsidiaries in our financial statements, which, as an investment company, we were previously precluded from doing; and

with the consolidation of Medallion Bank, given its significance to our overall financial results, we now report as a bank holding company for accounting purposes under Article 9 and Guide 3 of Regulation S-X (but we are not a bank holding company for regulatory purposes).

As we made this change to our financial reporting prospectively, in this report we refer to both accounting in accordance with US generally accepted accounting principles, or GAAP, applicable to bank holding companies, or Bank Holding Company Accounting, which applies commencing April 2, 2018, and to that applicable to investment companies under the 1940 Act, or Investment Company Accounting, which applies to prior periods.

Our wholly-owned subsidiary, Medallion Bank, or theThe Bank is aan industrial bank regulated by the FDIC and the Utah Department of Financial Institutions whichthat originates consumer loans, raises deposits, and conducts other banking activities. The Bank generally provides us with our lowest cost of funds which it raises through bank certificates of deposit. To take advantage of this low cost of funds, historically we have referred a portion of our taxi medallion and commercial loans to the Bank, which originated these loans, and have since been serviced by Medallion Servicing Corp., or MSC. However, at this timeother than in connection with dispositions of existing taxi medallion assets, the Bank ishas not originatingoriginated any new taxi medallion loans since 2014 (and Medallion Financial Corp. has not originated any new taxi medallion loans since 2015) and is working with MSC to service its existing portfolio.remaining portfolio, as it winds down. MSC earns referral and servicing fees for these activities.

COVID-19

In 2019, the Bank launched a strategic partnership program to provide lending and other services to financial technology, or fintech, companies. The ongoing coronavirus, or COVID-19, pandemic,Bank entered into an initial partnership in 2020 and began issuing its broad impactfirst loans. The Bank continues to evaluate and preventive measures taken to contain or mitigate the outbreak have had, and are likely tolaunch additional partnership programs with fintech companies.

37


We continue to consider various alternatives for the Bank, which may include an initial public offering of its common stock, the sale of all or part of the Bank, a spin-off or other potential transaction. We do not have significant negative effects on the US and global economy, employment levels, employee productivity, and financial market conditions. This has had, and may continue to have increasingly negative effects on the ability of our borrowers to repay outstanding loans, the value of collateral securing loans, the demanda deadline for loans and other financial services products and consumer discretionary spending. As a resultits consideration of these or other consequences, the outbreak has adverselyalternatives, and materially affected our business, results of operations and financial condition. The effects of the outbreak on us couldthere can be exacerbated givenno assurance that our business model is largely consumer and small business directed, which are more severely affected by COVID-19 and the preventative measures taken to contain or mitigate the outbreak, including its significant negative effects on consumer discretionary spending. The full extent to which the outbreakthis process will continue to impact our operations will depend on future developments, which are highly uncertain and cannot be predicted at this time, and include the duration, severity and scope of the continued outbreak, the actions taken to contain or mitigate the outbreak and how long, and to what extent the economic recovery from its effects will take.


We have taken steps to operate through this crisis. For example, in late June our employees returned to work in our New York City offices on a part-time basis in accordance with guidelines issued by New York, while our employees outside New York largely continue to work remotely. While there are elevated risks with our workforce working remotely, we have implemented additional mitigating controls to help reduce such risks. In addition, to better align our structure with profitability and reduce expenses, effective May 11, 2020, we had furloughed approximately 28% of the employees at our parent company, Medallion Financial Corp. As of December 31, 2020, 21% of employees, all of whom were employees of our parent company, Medallion Financial Corp., and no employees of our consolidated subsidiaries remain on furlough. As part of our expense-cutting measures, effective March 2, 2021, we terminated such Medallion Financial Corp. employees on furlough. Additionally, we closed our satellite offices in Long Island City, New York, Chicago, Illinois, and Boston, Massachusetts.

The Bank temporarily increased its cash levels by increasing its deposits, and in order to take advantage of the current lower interest rates. MCI drew on its remaining unfunded commitments and received a commitment from the SBA for $25,000,000 in debenture financing with a ten-year term upon a capital infusion from Medallion Financial. RPAC received $747,000 under the Paycheck Protection Program in the second quarter, and has not yet applied for forgiveness, but expects to do so.

With our consumer business, in March 2020, we adjusted our payment policies and procedures, and created a program to support our borrowers during the pandemic. We have been negotiating payment terms with our borrowers, and allowed them to defer payments up to 180 days. As of December 31, 2020, there were minimal consumer loans on deferral and the level of potential loans 90 days or more past due would have likely resulted in increased charge-offs on the consumer loan portfolios had they not been granted. For our consumer loan portfolios, although we believe that our deferral programs have been effective to date in mitigating the effect of COVID-19, the ultimate effects of COVID-19 on the consumer portfolio remains to be seen. In addition, we increased our allowance for loan losses on consumer loans, and continued to monitor our loan portfolios as market conditions changed in both March and June of 2020. Overall, the effects of the pandemic on us could be exacerbated given that our business model is largely consumer-directed and the pandemic, and preventative measures taken to contain or mitigate the pandemic, had and may increasingly have significant negative effects on consumer discretionary spending.

With our medallion business, we also adjusted our payment policies and procedures and allowed borrowers to defer payments up to 180 days. As of December 31, 2020, there were no medallion loans on deferral and we determined that anticipated payment activity on our medallion portfolio was impossible to quantify upon exit of the deferral moratorium, and therefore deemed all such loans as impaired. As a result, all medallion loans were placed on nonaccrual and written down to a net collateral value of $90,300 for New York City medallions along with write downs in most other markets during the 2020 third quarter and we wrote down the New York City collateral an additional $10,800, to $79,500 net in the 2020 fourth quarter. These writedowns of the medallion assets led to an increase of provision of approximately $25,945,000 related to medallion loans and approximately an additional $20,142,000 related to collateral write down on other owned assets.

Substantially all our medallion loans and related assets are concentrated in New York City. As a result of the COVID-19 pandemic, in March 2020, the Governor of New York State declared states of emergency for both the State and City of New York, and, since March 2020, economic activity generally and taxi ridership in particular have decreased dramatically in New York City. Despite New York City’s phased reopening plan, there has not been a substantial increase in ridership and gross meter fares. The extent to which the COVID-19 pandemic will continue to adversely affect New York City taxi medallion owners and, by extension, our medallion loans and related assets will depend on future developments, which are highly uncertain and cannot be predicted, including the scope and duration of the pandemic, actions taken by governmental authorities, and the direct and indirect impact of the pandemic on taxi medallion owners and the behaviors of people who have historically taken taxis.

Since March 31, 2020, payments on medallion loans have decreased significantly compared to the payments during the first quarter of 2020 and in prior periods. We are actively engaged with many borrowers about modifying their loan agreements, and as a result, we placed all medallion loans on TDR as we work with borrowers. We will continue to monitor our medallion loan portfolio and related assets, which may result in additional write-downs, charge-offsany transaction being announced or impairments, the impact of which could be material to our results of operations and financial condition.consummated.

In regards to our commercial business, many of our mezzanine portfolio companies were able to access the Paycheck Protection Program, providing needed liquidity during a period of depressed market demands. For the mezzanine portfolio, performance is slowly recovering although lingering impacts of COVID-19 continues to weigh on performance. Refer to “Risk Factors -- The ongoing COVID-19 pandemic, and the related significant negative impact on the global economy and financial markets, have had and could further have a material adverse impact on our business, operating results, and financial condition.”


CRITICAL ACCOUNTING POLICIES AND ESTIMATES

We follow financial accounting and reporting policies that are in accordance with GAAP. Some of these significant accounting policies require management to make difficult, subjective or complex judgments. The policies noted below, however, are deemed to be our “critical accounting policies” under the definition given to this term by the SEC. According to the SEC, “critical accounting policies” mean those policies that are most important to the presentation of a company’s financial condition and results of operations, and require management’s most difficult, subjective, or complex judgments, often as a result of the need to make estimates about the effect of matters that are inherently uncertain.

The judgments used by management in applying the critical accounting policies may be affected by deterioration in the economic environment, which may result in changes to future financial results. Specifically, subsequent evaluations of the loan portfolio, in light of the factors then prevailing, may result in significant changes to the allowance for loancredit losses in future periods, and the inability to collect on outstanding loans could result in increased loancredit losses.

Provision and Allowance for LoanCredit Losses

The allowance for credit losses is evaluated on a regular basis by management and is based upon management’s periodic review of the collectability of the loans in light of historical experience, the nature and volume of the loan portfolio, adverse situations that may affect the borrower’s ability to repay, estimated value of any underlying collateral, prevailing economic conditions, and excess concentration risks. In analyzing the adequacy of the allowance for loancredit losses, the Company uses historical delinquency and actual loss rates with a three-year look-back period for taxi medallion loans and a one-year look-back period for recreation and home improvement loans and uses historical loss experience and other projections for commercial loans. The allowance is evaluated on a regular basis by management and is based upon management’s periodic review of the collectability of the loans in light of historical experience, the nature and size of the loan portfolio, adverse situations that may affect the borrower’s ability to repay, estimated value of any underlying collateral, prevailing economic conditions, and excess concentration risks. This evaluation is inherently subjective, as it requires estimates that are susceptible to significant revision as more information becomes available.

Our methodology to calculate the general reserve portion of the allowance includes the use of quantitative and qualitative factors. We initially determine an allowance based on quantitative loss factors for loans evaluated collectively for impairment. The quantitative loss factors are based primarily on historical loss rates, after considering loan type, historical loss and delinquency experience. The quantitative loss factors applied in the methodology are periodically re-evaluated and adjusted to reflect changes in historical loss levels or other risks. Qualitative loss factors are used to modify the reserve determined by the quantitative factors and are designed to account for losses that may not be included in the quantitative calculation according to management’s best judgment. PerformingIf our qualitative loss factor rates were to increase 50 basis points, our recreation and home improvement general reserve would increase by $6.7 million and $3.8 million, respectively. Likewise, if our qualitative loss factor rates were to decrease 50 basis points, our recreation and home improvement general reserve would decrease by $6.7 million and $3.8 million, respectively.

The allowance is maintained at a level estimated by management to absorb probable credit losses inherent in the loan portfolios based on management’s evaluation of the portfolios, the related credit characteristics, and macroeconomic factors affecting the portfolios. As of December 31, 2023 and 2022, the allowance totaled $84.2 million and $63.8 million, which represented 3.80% and 3.33% of total loans, respectively. The increase in the allowance for credit losses as of December 31, 2023 was primarily driven by the adoption of the CECL accounting standard, which resulted in a $13.7 million increase in our allowance for credit losses, and due to growth in our recreation and home improvement loan portfolios, as well as growth in the commercial loan portfolio, offset by a reduction in allowance specific to the taxi medallion portfolio as the taxi medallion loan portfolio continued to shrink through collections.

38


All taxi medallion loans are recorded at book valuedeemed impaired and the general reserve maintained to absorb expected losses consistent with GAAP.

All medallion loans that reach 90 days or more delinquent requirehave a specific allowance for thoseeach loan, such that the underlying net loan has a value no greater than collateral value. The determination of taxi medallion collateral fair value is derived quarterly for each jurisdiction. For taxi medallion loans, whichdelinquent nonperforming loans are valued at collateral value for the most recent quarter. Collateral value for the taxi medallion loans is generally determined on an individual basis.utilizing factors deemed relevant under the circumstances of the market including but not limited to: actual transfers, pending transfers, median and average sales prices, discounted cash flows, market direction and sentiment, and general economic trends for the industry and economy. This evaluation is inherently subjective, as it requires estimates that are susceptible to significant revision as more information becomes available. We deem a loan impaired when, based on current information and events, it is probable that we will be unable to collect the amounts due in accordance with the original contractual terms of the loan agreement, including scheduled principal and interest payments. All impaired loans also require a specific allowance. We charge-off loans in the period that such loans are deemed uncollectible or when they reach 120 days delinquent regardless of whether the loan is a recreation, home improvement, or taxi medallion loan.

The methodology used in the periodic review of reserve adequacy, which is performed at least quarterly, is designed to be responsive to changes in portfolio credit quality and inherent credit losses. The changes are reflected in both the pooled formula reserve and in specific reserves as the collectability of larger classified loans is regularly recalculated with new information as it becomes available. Management is primarily responsible for the overall adequacy of the allowance.

Medallion Loan Collateral Valuation

Due to the low volume of market transfer activity as medallion values declined in recent years, the determination of taxi medallion collateral fair value has been derived quarterly for each jurisdiction taking into consideration recent market transfer activity, to the extent it is available, as well as a discounted cash flow model when trading activity alone was deemed insufficient or unreliable. In general, recent market transfers published by each jurisdiction have been analyzed to derive the median transfer activity value.  However, depending on the circumstances, when analyzing transfer activity, transactions which management determined from available information not to be arms-length have been excluded from the calculation of the median transfer value. When discounted cash flow models have been used, significant inputs typically include the discount rate, taxi fare/lease revenue, and associated expenses such as vehicle costs, fuel, credit card processing fees, repair costs, and insurance premiums. A higher discount rate, lower taxi fare/lease revenue and higher associated expenses would each produce a lower fair value. At period end, the transfer activity and, if applicable, discounted cash flow values, are taken into consideration to arrive at a fair value of the medallion collateral in each jurisdiction. For the current period, transfer activity was the primary consideration utilized in our valuation process.


Goodwill and Intangible Assets

Goodwill and intangible assets arose as a result of the excess of the fair value that was determined by an independent third party expert over the book value of several of our previously unconsolidated portfolio investment companies as of April 2, 2018. Goodwill is tested annually for impairment by a third party expert andnot amortized, but is reviewedsubject to quarterly review by management quarterly. For theto determine whether additional impairment testing is needed, and such testing is performed at least on an annual basis. The annual goodwill testing, the assessment is based uponfocused on the Bank goodwill of $150,803,000$150.8 million and the race organization intangible assetassets of $26,165,000,$20.6 million, both of which utilized a step zero qualitative impairment analysis based on historical and projected financial data. The Bank-related intangible assets are amortized over their approximate useful life.

Deferred Taxes

Deferred taxes reflect the impact of temporary differences between the carrying amount of assets and liabilities and their tax basis and are stated at tax rates expected to be in effect when taxes are actually paid or recovered. Deferred tax assets are recognized subject to management’s judgment that it is more like than not that it will be recognized. In addition, a valuation allowance is recorded when it is deemed that some or all of the deferred tax assets will not be realized due to the temporary differences.


39


Average Balances and Rates AVERAGE BALANCES AND RATES

The following table shows the Company’sour consolidated average balance sheets, interest income and expense, and the average interest earning/bearing assets and liabilities, and which reflect the average yield on assets and average costs on liabilities as of and for the twelve monthsyears ended December 31, 20202023, 2022, and 20192021.


Year Ended December 31,


2023


2022


2021


(Dollars in thousands)


Average
Balance


Interest


Average
Yield/Cost


Average
Balance


Interest


Average
Yield/Cost


Average
Balance


Interest


Average
Yield/Cost


Interest-earning assets


Interest earning cash equivalents


$

23,773


$

881


3.71

%


$

4,288


$

153


3.57

%


$

3,149


$

56


1.78

%

Federal funds sold


70,021


3,130


4.47


71,847


956


1.33


45,096


23


0.05


Investment securities


52,065


1,728


3.32


46,832


1,176


2.51


45,195


769


1.70


Loans


Recreation


1,283,434


167,765


13.07


1,085,211


139,145


12.82


879,625


118,305


13.45


Home improvement


708,031


62,703


8.86


526,377


44,703


8.49


374,083


34,204


9.14


Commercial


99,394


12,903


12.98


87,936


9,705


11.04


66,874


7,070


10.57


Taxi medallion


5,924


1,550


26.16


13,803


627


4.54


21,266


(1,483

)


(6.97

)

Strategic partnerships


1,387


380


27.40


537


156


29.05


70


22


31.43


Total loans


2,098,170


245,301


11.69


1,713,864


194,336


11.34


1,341,918


158,118


11.78


Total interest-earning assets, before allowance


2,244,029


11.19


1,836,831


10.70


1,435,358


11.08


Allowance for credit losses


(76,596

)


(56,866

)


(50,592

)


Total interest-earning assets, net of allowance


2,167,433


251,040


11.58

%


1,779,965


196,621


11.06


1,384,766


158,966


11.51


Non-interest-earning assets


Cash


16,704


39,535


47,050


Equity investments


11,036


10,570


9,830


Loan collateral in process of foreclosure (1)


18,230


28,823


47,764


Goodwill and intangible assets


172,118


173,563


199,160


Other assets


52,680


46,794


44,129


Total non-interest-earning assets


270,768


299,285


347,933


Total assets


$

2,438,201


$

2,079,250


$

1,732,699


Interest-bearing liabilities


Deposits


$

1,764,262


$

47,784


2.71

%


$

1,440,328


$

22,666


1.57

%


$

1,134,531


$

17,543


1.55

%

Retail and privately placed notes


123,808


10,286


8.31


121,000


10,008


8.27


120,704


10,226


8.47


SBA debentures and borrowings


68,519


2,387


3.48


69,188


2,228


3.22


64,733


2,116


3.27


Trust preferred securities


33,000


2,489


7.54


33,000


1,283


3.89


33,000


981


2.97


Notes payable to banks


10,960


134


1.22


Other borrowings


6,782


140


2.06


Total interest-bearing liabilities


1,989,589


62,946


3.16


1,663,516


36,185


2.17


1,370,710


31,140


2.28


Non-interest-bearing liabilities


Deferred tax liability


23,747


22,187


7,444


Other liabilities (2)


37,749


30,574


27,634


Total non-interest-bearing liabilities


61,496


52,761


35,078


Total liabilities


2,051,085


1,716,277


1,405,788


Non-controlling interest


69,253


69,253


72,162


Total stockholders’ equity


317,863


293,720


254,749


Total liabilities and stockholders’ equity


$

2,438,201


$

2,079,250


$

1,732,699


Net interest income


$

188,094


$

160,436


$

127,826


Net interest margin, gross


8.38


8.73


8.91


Net interest margin, net of allowance


8.68

%


9.05

%


9.25

%

(1)
Includes financed sales of this collateral to third parties reported separately from the loan portfolio, and that are conducted by the nine monthsBank of $6.2 million, $7.5 million, and $7.4 million as of December 31, 2023, 2022, and 2021.
(2)
Excludes deferred financing costs of $8.5 million, $7.0 million, and $7.1 million as of December 31, 2023, 2022, and 2021.

40


For the year ended December 31, 2018.


Twelve Months Ended December 31,


Nine Months Ended December 31,


2020


2019


2018


(Dollars in thousands)


Average

Balance


Interest


Average

Yield/Cost


Average

Balance


Interest


Average

Yield/Cost


Average

Balance


Interest


Average

Yield/Cost


Interest-earning assets


Interest earning cash equivalents


$

1,528


$

37


2.42

%


$


$


0.00

%


$


$


0.00

%

Federal funds sold


65,783


129


0.20


36,444


574


1.58


45,836


508


1.47


Investment securities


46,691


997


2.14


45,283


1,285


2.84


44,789


850


2.52


Loans


Recreation


743,118


110,706


14.90


646,425


99,463


15.39


579,440


68,870


15.78


Home improvement


282,202


27,273


9.66


209,842


19,943


9.50


187,570


12,799


9.06


Commercial


69,293


7,334


10.58


63,039


7,632


12.11


78,501


7,459


12.61


Medallion


71,821


(1,518

)


(2.11

)


127,109


3,665


2.88


234,476


6,317


3.58


Strategic partnerships


9


4


44.44


Total loans


1,166,443


143,799


12.33


1,046,415


130,703


12.49


1,079,987


95,445


11.73


Total interest-earning assets


1,280,445


144,962


11.32


1,128,142


132,562


11.75


1,170,612


96,803


10.98


Non-interest-earning assets


Cash


19,312


30,494


12,131


Equity investments


10,385


9,560


10,665


Loan collateral in process of foreclosure(1)


50,893


51,924


56,397


Goodwill and intangible assets


202,618


204,063


210,441


Income tax receivable


702


771


Other assets


47,488


44,252


37,542


Total non-interest-earning assets


331,398


341,064


327,176


Total assets


$

1,611,843


$

1,469,206


$

1,497,788


Interest-bearing liabilities


Deposits


$

1,043,096


$

22,330


2.14

%


$

916,416


$

22,521


2.46

%


$

891,588


$

14,230


2.12

%

DZ loan


67,935


2,126


4.15


SBA debentures and borrowings


71,490


2,633


3.68


76,544


2,985


3.90


79,157


2,300


3.86


Retail and privately placed notes


70,384


6,813


9.68


59,252


5,789


9.77


33,625


2,625


10.36


Preferred securities


33,000


966


2.97


33,000


1,522


4.61


33,000


1,111


4.47


Notes payable to banks


32,246


1,246


3.86


45,506


2,069


4.55


67,732


2,305


4.52


Other borrowings


8,270


163


1.97


8,028


159


1.98


8,286


119


1.91


Total interest-bearing liabilities


1,258,486


34,151


2.71


1,138,746


35,045


3.08


1,181,323


24,816


2.79


Non-interest-bearing liabilities


Deferred tax liability


4,959


7,602


1,549


Other liabilities (2)


29,174


28,331


22,743


Total non-interest-bearing liabilities


34,133


35,933


24,292


Total liabilities


1,292,619


1,174,679


1,205,615


Non-controlling interest


71,904


31,450


27,318


Total stockholders’ equity


247,320


263,077


264,855


Total liabilities and stockholders’ equity


$

1,611,843


$

1,469,206


$

1,497,788


Net interest income


$

110,811


$

97,517


$

71,987


Net interest margin


8.65

%


8.64

%


8.19

%

(1)

Includes financed sales of this collateral to third parties reported separately from the loan portfolio, and that are conducted by the Bank of $3,535, $8,163 and $3,134 as of December 31, 2020, 2019 and 2018.

(2)

Includes deferred financing costs of $5,805 and $5,105 as of December 31, 2020 and 2019.

During the twelve months ended December 31, 2020,2023, our net loans receivable yielded 12.33% (compared11.69% as compared to 12.49%11.34% for the twelve monthsyear ended December 31, 2019), mainly driven by2022. The 35 basis point increase reflects a higher yield on our loan portfolios, as we have increased the slight decline inrates charged on new consumer originations over the past year as prevailing market interest rates have increased. We have used the higher interest rate environment as an opportunity to increase the rates on both newly issued recreation loan averageand home improvement loans, which is expected to continue to increase the yield which had been driven by the increase in the reserves as a result of COVID-19on these portfolios over time, as well as lowerincrease the credit quality of our new issuances, particularly in our recreation segment, with the average FICO scores, measured at origination, of our recreation loans outstanding being 683 as of December 31, 2023 compared to 671 as of December 31, 2022. We use weighted average FICO scores as an indicator of portfolio risk.

Our debt, with certificates of deposits being our largest source, funds our growing lending business. Our average interest duecost for the year ended December 31, 2023 of 3.16% increased 99 basis points from 2.17% for the year ended December 31, 2022, attributable to deferrals granted during the year. In addition, in 2020 there was a decline oncurrent higher interest rate environment, particularly the commercial loan yieldhigher cost associated with our deposits. To the extent that prevailing market interest rates remain at current levels, we expect our cost of funds to continue to increase as a result of the increase in non-accrual loans, and in the medallion


portfolio, also due to all loans being placed on non-accrual. The debt, mainlywe issue new certificates of deposit helpsto replace maturing certificates of deposit and fund our growth. We have taken, and continue to take, steps to pass along a portion of the growing consumer loan business and as market rates have decreased, so hasinterest rate increases on newly originated loans, the averageprocess for which is slower than the pace of funding cost of borrowing.increases, thereby compressing our net interest margins.

Rate/Volume AnalysisRATE/VOLUME ANALYSIS

The following table presents the change in interest income and expense due to changes in the average balances (volume) and average rates, calculated for the twelve monthsyears ended December 31, 20202023, 2022, and 2019 and2021.


Year Ended December 31,


2023


2022


2021


(Dollars in thousands)


Increase
(Decrease)
In Volume


Increase
(Decrease)
In Rate


Net Change


Increase
(Decrease)
In Volume


Increase
(Decrease)
In Rate


Net Change


Increase
(Decrease)
In Volume


Increase
(Decrease)
In Rate


Net Change


Interest-earning assets


Interest earning cash and cash equivalents


$

755


$

2,147


$

2,902


$

174


$

223


$

397


$

(31

)


$

(55

)


$

(86

)

Investment securities


174


378


552


41


366


407


(24

)


(205

)


(229

)

Loans


Recreation


25,911


2,709


28,620


26,435


(5,595

)


20,840


14,749


(7,150

)


7,599


Home improvement


16,087


1,913


18,000


12,912


(2,413

)


10,499


7,961


(1,030

)


6,931


Commercial


1,487


1,711


3,198


2,382


818


3,200


(287

)


23


(264

)

Taxi medallion


(2,062

)


2,985


923


(526

)


2,704


2,178


11,994


(11,959

)


35


Strategic partnerships


233


(9

)


224


136


(2

)


134


19


(1

)


18


Total loans


$

41,656


$

9,309


$

50,965


$

41,339


$

(4,488

)


$

36,851


$

34,436


$

(20,117

)


$

14,319


Total interest-earning assets


$

42,585


$

11,834


$

54,419


$

41,554


$

(3,899

)


$

37,655


$

34,381


$

(20,377

)


$

14,004


Interest-bearing liabilities


Deposits


$

8,774


$

16,344


$

25,118


$

4,812


$

311


$

5,123


$

1,302


$

(6,089

)


$

(4,787

)

Retail and privately placed notes


233


45


278


24


(242

)


(218

)


4,263


(850

)


3,413


SBA debentures and borrowings


(23

)


182


159


143


(31

)


112


(223

)


(294

)


(517

)

Trust preferred securities


1,206


1,206


302


302


14


14


Notes payable to banks


(134

)


0


(134

)


(261

)


(850

)


(1,111

)

Other borrowings


(140

)


0


(140

)


(31

)


8


(23

)

Total interest-bearing liabilities


$

8,984


$

17,777


$

26,761


$

4,705


$

340


$

5,045


$

5,050


$

(8,061

)


$

(3,011

)

Net


$

33,601


$

(5,943

)


$

27,658


$

36,849


$

(4,239

)


$

32,610


$

29,331


$

(12,316

)


$

17,015


For the nine monthsyear ended December 31, 2018.


Twelve Months Ended December 31,


Nine Months Ended December 31,


2020


2019


2018


(Dollars in thousands)


Increase

(Decrease)

In Volume


Increase

(Decrease)

In Rate


Net Change


Increase

(Decrease)

In Volume


Increase

(Decrease)

In Rate


Net Change


Increase

(Decrease)

In Volume


Increase

(Decrease)

In Rate


Net Change


Interest-earning assets


Interest earning cash and cash equivalents


$

29


$


$

29


$


$


$


$


$


$


Federal funds sold


472


(910

)


(438

)


(294

)


75


(219

)


142


18


160


Investment securities


46


(332

)


(286

)


3


129


132


30


12


42


Loans


Recreation


15,078


(3,832

)


11,246


10,531


(2,756

)


7,775


2,089


(1,427

)


662


Home improvement


6,933


396


7,329


2,558


487


3,045


28


160


188


Commercial


803


(1,101

)


(298

)


(1,933

)


(850

)


(2,783

)


(153

)


314


161


Medallion


(1,734

)


(3,448

)


(5,182

)


(2,245

)


(972

)


(3,217

)


(962

)


(1,460

)


(2,422

)

Strategic partnerships


Total loans


21,080


(7,985

)


13,095


8,911


(4,091

)


4,820


1,002


(2,413

)


(1,411

)

Total interest-earning assets


$

21,627


$

(9,227

)


$

12,400


$

8,620


$

(3,887

)


$

4,733


$

1,174


$

(2,383

)


$

(1,209

)

Interest-bearing liabilities


Deposits


$

3,213


$

(3,402

)


$

(189

)


$

409


$

2,913


$

3,322


$

218


$

1,203


$

1,421


DZ loan


(2,367

)


(2,367

)


(679

)


(41

)


(720

)

SBA debentures and borrowings


(190

)


(162

)


(352

)


(130

)


32


(98

)


32


(2

)


30


Retail and privately placed notes


1,093


(69

)


1,024


2,464


(172

)


2,292


(19

)


(19

)

Preferred securities


(557

)


(557

)


24


24


79


79


Notes payable to banks


(515

)


(308

)


(823

)


(979

)


32


(947

)


(190

)


108


(82

)

Other borrowings


1


2


3


1


(2

)


(1

)


2


4


6


Total interest-bearing liabilities


$

3,602


$

(4,496

)


$

(894

)


$

(602

)


$

2,827


$

2,225


$

(617

)


$

1,332


$

715


Net


$

18,025


$

(4,731

)


$

13,294


$

9,222


$

(6,714

)


$

2,508


$

1,791


$

(3,715

)


$

(1,924

)

During2023, the twelve months ended December 31, 2020,increase in interest income increased primarily due to the increased volume of our consumer loan portfolios, even as the average rate decreased on the recreation loan portfolio. Additionally, we continued to see a decline in our overall medallion portfolio as all loans had been placed on non-accrual, and they have continued to age 120 days or more past due and be charged-off to loan collateral in process of foreclosure. Interest expense decreased for 2020 primarilywas mainly driven by the increase in volume of consumer loans, with a large portion of that increase occurring in the first half of the year, as well as an increase in overall decreaseyield on interest-earning assets as we issue new loans at interest rates higher than the weighted average rates of our then current portfolio. The increase in interest expense was driven by an increase in borrowing costs, primarily the increases in deposits as older deposits mature and are replaced at current market rates, mainly on the deposits.as well as an overall increase in borrowings.

Our interest expense is driven by the interest rates payable on our bank certificates of deposit, short-term credit facilities with banks,privately placed notes, fixed-rate, long-term debentures issued to the SBA, and trust preferred securities, and has historically included credit facilities with banks and other short-term notes payable. The Bank issues brokered banktime certificates of deposit, which are, on average, our lowest borrowing costs. The Bank is able to bid on these deposits at a wide variety of maturity levelsoptions, which allows for improvedmore flexible interest rate management strategies. In September 2023, we issued and sold $39.0 million aggregate principal amount of 9.25% senior notes due in September 2028, and repurchased $33.0 million aggregate principal amount of our 8.25% senior notes due in March 2024. In December 2023, we issued and sold $12.5 million aggregate principal amount of 9.00% senior notes due in December 2033. The proceeds of both offerings were used for general corporate purposes and repayment of the senior notes maturing in March 2024.

Our cost of funds is primarily driven by the rates paid on our various debt instruments and their relative mix,borrowings and changes in the levels of average borrowings outstanding. See Note 65 to the consolidated financial statements for details onregarding the terms of our outstanding debt. Our debentures issued to the SBA typically have terms of ten years.


41


We measure our borrowing costs as our aggregate interest expense for all of our interest-bearing liabilities divided by the average amount of such liabilities outstanding during the period. The tables above as well as below showtable shows the average borrowings and related borrowing costs for the years ended December 31, 2020, 20192023, 2022, and 2018.2021. We expect our borrowing costs to further increase as prevailing interest rates continue at, or rise from, these levels.

(Dollars in thousands)


Interest

Expense


Average

Balance


Average

Borrowing

Costs


December 31, 2018 (1)


Deposits


$

14,230


$

891,588


2.14

%

DZ loan


2,928


81,256


3.60


SBA debentures and borrowings


3,049


79,016


3.86


Notes payable to banks


3,118


71,353


4.37


Retail notes


3,500


33,625


10.41


Preferred securities


1,423


33,000


4.31


Other borrowings


119


8,286


1.93


Total borrowings


$

28,367


$

1,198,124


2.37


(1)

Balance includes the nine months ended December 31, 2018 under Bank Holding Company Accounting and three months ended March 31, 2018 under Investment Company Accounting.

We continue to seek SBA funding through Medallion Capital, to the extent it offers attractive rates. SBA financing subjects its recipients to limits on the amount of secured bank debt they may incur. We use SBA funding to fund loans that qualify under the Small Business Investment Act of 1985, as amended, or the SBIA, and SBA regulations. In July 2020,2023, we obtained a $25,000,000$20.0 million commitment from the SBA. We believe that financing operations primarilySBA, $9.8 million of which has been utilized as of December 31, 2023, with short-term floating rate secured bank debt has generally decreased our interest expense, but has also increased our exposure to$5.2 million currently drawable, and the riskbalance of increases in market interest rates, which we mitigate with certain interest rate strategies.$5.5 million drawable upon the infusion of $2.4 million of capital. At December 31, 20202023 and 2019, short-term2022, adjustable rate debt constituted 4%less than 2% of total debt.debt, and was comprised solely of our trust preferred securities borrowings.

LoansLOANS

The gross loansLoans are reported at the principal amount outstanding, inclusive of deferred loan acquisition costs, which primarily includes deferred fees paid to loan originators, and which isare amortized to interest income over the life of the loan. DuringFor the twelve monthsyears ended December 31, 20202023 and 2019,2022, there was continued growth in the consumer lending segments, which was partially offset by the continued shrinkage of the medallion portfolio as loans have continued to age over 120 daysrecreation and be transferred to loan collateral in the process of foreclosure and payments received from borrowers. In addition, as a result of the COVID-19 pandemic, there was an increase in charge-offs and loans transferred for the medallion segment.home improvement segments.

Year Ended December 31, 2023
(Dollars in thousands)


Recreation


Home
Improvement


Commercial


Taxi
Medallion


Strategic
Partnership


Total


Gross loans – December 31, 2022


$

1,183,512


$

626,399


$

92,899


$

13,571


$

572


$

1,916,953


Loan originations


447,039


357,394


34,850


2,426


118,338


960,047


Principal payments, sales, maturities, and recoveries


(231,158

)


(209,894

)


(13,389

)


(6,859

)


(118,357

)


(579,657

)

Charge-offs


(50,512

)


(12,308

)


(1,019

)


(3,829

)


(67,668

)

Transfer to loan collateral in process of foreclosure, net


(18,875

)


(2,306

)


(21,181

)

Amortization of origination costs


(12,270

)


2,668


14


(9,588

)

FASB origination costs, net


18,490


(3,642

)


(164

)


660


15,344


Paid-in-kind interest


1,636


1,636


Gross loans – December 31, 2023


$

1,336,226


$

760,617


$

114,827


$

3,663


$

553


$

2,215,886


Year Ended December 31, 2022
(Dollars in thousands)


Recreation


Home
Improvement


Commercial


Taxi
Medallion


Strategic
Partnership


Total


Gross loans – December 31, 2021


$

961,320


$

436,772


$

76,696


$

14,046


$

90


$

1,488,924


Loan originations


513,062


392,543


28,172


605


49,526


983,908


Principal payments, sales, maturities, and recoveries


(259,326

)


(196,203

)


(6,610

)


(419

)


(49,044

)


(511,602

)

Charge-offs


(27,055

)


(6,393

)


(6,083

)


(314

)


(39,845

)

Transfer to loan collateral in process of foreclosure, net


(12,444

)


(347

)


(12,791

)

Amortization of origination costs


(10,470

)


1,763


(8,707

)

Amortization of loan premium


(213

)


(322

)


(535

)

FASB origination costs, net


18,638


(1,761

)


16,877


Paid-in-kind interest


724


724


Gross loans – December 31, 2022


$

1,183,512


$

626,399


$

92,899


$

13,571


$

572


$

1,916,953


Twelve Months Ended December 31, 2020

(Dollars in thousands)


Recreation


Home

Improvement


Commercial


Medallion


Strategic Partnership


Total


Gross loans – December 31, 2019


$

713,332


$

247,324


$

69,767


$

130,432


$


$

1,160,855


Loan originations


294,885


193,098


7,575


1,663


497,221


Principal payments, sales, and maturities


(187,989

)


(105,813

)


(13,183

)


(13,207

)


(1,639

)


(321,831

)

Charge-offs, net


(14,457

)


(1,229

)


(28

)


(42,648

)


(58,362

)

Transfer to loan collateral in process of foreclosure, net


(14,871

)


(32,383

)


(47,254

)

Amortization of origination costs


(7,809

)


1,910


8


(131

)


(6,022

)

Amortization of loan premium


(191

)


(320

)


(2,531

)


(3,042

)

FASB origination costs, net


9,786


(937

)


36


8,885


Paid-in-kind interest


1,188


1,188


Transfer to other foreclosed property


(1,800

)


(1,800

)

Gross loans – December 31, 2020


$

792,686


$

334,033


$

65,327


$

37,768


$

24


$

1,229,838


42


Twelve Months Ended December 31, 2019

(Dollars in thousands)


Recreation


Home

Improvement


Commercial


Medallion


Total


Gross loans – December 31, 2018


$

587,038


$

183,155


$

64,083


$

183,606


$

1,017,882


Loan originations


301,403


142,112


18,578


462,093


Principal payments, sales, and maturities


(146,873

)


(76,157

)


(13,553

)


(15,070

)


(251,653

)

Charge-offs, net


(17,419

)


(786

)


(819

)


(18,664

)


(37,688

)

Transfer to loan collateral in process of foreclosure, net


(14,512

)


(16,836

)


(31,348

)

Amortization of origination costs


(6,428

)


1,561


34


(119

)


(4,952

)

Amortization of loan premium


(247

)


(416

)


(2,626

)


(3,289

)

FASB origination costs, net


10,370


(2,145

)


610


141


8,976


Paid-in-kind interest


834


834


Gross loans – December 31, 2019


$

713,332


$

247,324


$

69,767


$

130,432


$

1,160,855


The following table presents the approximate maturities and sensitivity to change in interest rates for our loans as of December 31, 2020.2023.


Loan Maturity


(Dollars in thousands)


Within 1 year


After 1 to 5 years


After 5 to 15 years


After 15 years


Total


Fixed-rate


$

21,076


$

252,085


$

1,753,773


$

147,289


$

2,174,223


Recreation


1,874


128,397


1,131,052


29,632


1,290,955


Home improvement


8,940


33,024


604,448


117,657


764,069


Commercial


7,636


89,074


18,273


114,983


Strategic partnerships


553


553


Taxi medallion


2,073


1,590


3,663


Adjustable-rate


$

500


$

1,136


$


$


$

1,636


Recreation


500


1,136


1,636


Commercial


Taxi medallion


Total loans(1)(2)(3)


$

21,576


$

253,221


$

1,753,773


$

147,289


$

2,175,859


Loan Maturity


(Dollars in thousands)


Within 1 year


After 1 to 5 years


After 5 to 15 years


After 15 years


Total


Fixed-rate


$

25,031


$

172,189


$

947,738


$

46,749


$

1,191,707


     Recreation


1,690


76,079


678,714


59


756,542


     Home improvement


13,777


17,494


258,924


46,690


336,885


     Commercial


74


53,373


10,100


63,547


    Medallion


9,490


25,243


34,733


Adjustable-rate


$

6,522


7,498


26


14,046


     Recreation


5,101


5,706


26


10,833


     Home improvement


     Commercial


1,792


1,792


    Medallion


1,421


-


1,421


Total loans(1)(2)


$

31,553


$

179,687


$

947,764


$

46,749


$

1,205,753


(1)
Excludes strategic partnership loans.

(1)

Excludes strategic partnership loans.

(2)
Excludes deferred costs.

(2)

(3)

As of December 31, 2020, there were no floating-rate loans.


Provision and Allowance for Loan Loss

During the twelve months ended December 31, 2020,2023, there were no floating-rate loans.

PROVISION AND ALLOWANCE FOR CREDIT LOSSES

The allowance is maintained at a level estimated by management to absorb probable credit losses inherent in the loan portfolios based on management’s quarterly evaluation of the portfolios, the related credit characteristics, and macroeconomic factors affecting the portfolios. As of December 31, 2023 and 2022, the allowance totaled $84.2 million and $63.8 million, which represented 3.80% and 3.33% of total loans, respectively. The increase in the allowance for credit losses as of December 31, 2023 was primarily driven by the adoption of the CECL accounting standard, which resulted in a $13.7 million increase in our allowance for credit losses, and due to growth in our recreation and home improvement loan portfolios, as well as growth in the commercial loan portfolio, offset by a reduction in allowance specific to the taxi medallion portfolio as the taxi medallion loan portfolio continued to shrink through collections.

The following table sets forth the activity in the allowance for credit losses for December 31, 2023 and 2022.


December 31,


(Dollars in thousands)


2023


2022


Allowance for credit losses – beginning balance (1)


$

63,845


$

50,166


CECL transition amount upon ASU 2016-13 adoption


13,712


Charge-offs


Recreation


(50,512

)


(27,055

)

Home improvement


(12,308

)


(6,393

)

Commercial


(1,019

)


(6,083

)

Taxi medallion


(3,829

)


(314

)

Total charge-offs


(67,668

)


(39,845

)

Recoveries


Recreation


11,449


13,785


Home improvement


2,886


2,761


Commercial


10


47


Taxi medallion


22,191


6,872


Total recoveries


36,536


23,465


Net charge-offs (2)


(31,132

)


(16,380

)

Provision for credit losses


37,810


30,059


Allowance for credit losses – ending balance (3)


$

84,235


$

63,845


(1)
Represents allowance prior to the adoption of ASU 2016-13.
(2)
As of December 31, 2023, cumulative net charge-offs of loans and loan collateral in process of foreclosure in the taxi medallion portfolio were $176.8 million, including $107.9 million related to loans secured by New York taxi medallion values decreased to a net realizable valuemedallions, some of $79,500, from $167,000 atwhich may represent collection opportunities for us.
(3)
As of December 31, 2019,2023, there was no allowance for credit loss and all medallions were deemed impaired duenet charge-offs related to the strategic partnership loans.

With the adoption of ASC 326, we also adopted ASU 2022-02, Financial Instruments – Credit Losses, or Topic 326: Troubled Debt Restructurings and Vintage Disclosures. Under this standard, we are required to disclose current COVID-19 pandemic. The impairment and decline in medallion values led to an increase in provisionperiod gross write-offs, by year of approximately $25,945. For certain consumer loans, the reserve percentages were increased 25-100 basis points, also due to the COVID-19 pandemic. Both consumer and medallion loans were placed on deferral during the year, but as loans were no longer in deferral, there was continuing aging of recreation and medallion loans to 120 days or more, and charged-down to their collateral value. For the twelve months ended December 31, 2019, New York taxi medallion values decreased from $181,000 to $167,000.origination, for financing receivables.

(Dollars in thousands)


2023


2022


2021


2020


2019


Prior


Total


Recreation


$

3,136


$

18,836


$

10,857


$

5,115


$

5,001


$

7,567


$

50,512


Home improvement


2,196


5,686


2,662


702


435


627


12,308


Commercial


119


900


1,019


Taxi medallion


3,829


3,829


Total


$

5,332


$

24,522


$

13,638


$

5,817


$

6,336


$

12,023


$

67,668


Twelve Months Ended December 31,


(Dollars in thousands)


2020


2019


Allowance for loan losses – beginning balance


$

46,093


$

36,395


Charge-offs


Recreation


(23,543

)


(24,433

)

Home improvement


(2,909

)


(2,504

)

Commercial


(31

)


(819

)

Medallion


(49,361

)


(22,205

)

Total charge-offs


(75,844

)


(49,961

)

Recoveries


Recreation


9,086


7,014


Home improvement


1,680


1,718


Commercial


3


Medallion


6,713


3,541


Total recoveries


17,482


12,273


Net charge-offs (1)


(58,362

)


(37,688

)

Provision for loan losses


69,817


47,386


Allowance for loan losses – ending balance (2) (3)


$

57,548


$

46,093


43


(1)

As of December 31, 2020, net cumulative charge-offs of loans and loan collateral in process of foreclosure in the medallion portfolio were $279,188, some of which represents collection opportunities for the Company.

(2)

As of December 31, 2020, the general reserves previously recorded for the Company’s medallion loan portfolio had been reversed as all loans had been deemed impaired and written down to collateral value.

(3)

As of December 31, 2020, there was no allowance for loan loss and net charge-offs related to the strategic partnership loans.

The following tables set forth the allowance for loancredit losses, by type, as of December 31, 20202023 and 2019.2022 follows:

December 31, 2023
(Dollars in thousands)


Amount


Percentage
of Allowance


Allowance as
a Percent of
Loan Category


Allowance as a Percent of Nonaccrual


Recreation


$

57,532


68

%


4.31

%


221.50

%

Home improvement


21,019


25


2.76


80.92


Commercial


4,148


5


3.61


15.97


Taxi medallion


1,536


2


41.93


5.91


Total


$

84,235


100

%


3.80

%


324.31

%

December 31, 2020

(Dollars in thousands)


Amount


Percentage

of Allowance


Allowance as

a Percent of

Loan Category


Allowance as a Percent of Nonaccrual


December 31, 2022
(Dollars in thousands)


Amount


Percentage
of Allowance


Allowance as
a Percent of
Loan Category


Allowance as a Percent of Nonaccrual


Recreation


$

27,348


48

%


3.45

%


378.20

%


$

41,966


66

%


3.55

%


130.60

%

Home improvement


5,157


9


1.54


NM


11,340


18


1.81


35.29


Commercial


1,049


1


1.13


3.26


Medallion


25,043


43


66.31


68.01


Taxi medallion


9,490


15


69.93


29.53


Total


$

57,548


100

%


4.68

%


93.17

%


$

63,845


100

%


3.33

%


198.69

%

December 31, 2019

(Dollars in thousands)


Amount


Percentage

of Allowance


Allowance as

a Percent of

Loan Category


Allowance as a Percent of Nonaccrual


Recreation


$

18,075


39

%


2.53

%


228.25

%

Home improvement


2,608


6


1.05


NM


Commercial


Medallion


25,410


55


19.48


389.84


Total


$

46,093


100

%


3.97

%


174.04

%


As of December 31, 2020, there was an increase2023, the total allowance rate for credit losses increased 47 basis points from December 31, 2022, due to the adoption of CECL and rising loss rates which resulted in higher allowances for recreation, home improvement, and commercial loans, offset by a reduction in the allowance for loan losses as related to the recreation loan portfolio as compared to December 31, 2019. This change wastaxi medallion loans due to the significant increase in loans originatedrecoveries and structured settlements entered into during the year, along with the increased in reserve percentages as a result of the COVID-19 pandemic. For the medallion loans, there was a significant increase in the reserve as a percentage of the total loans which had been driven by all medallion loans being deemed impaired, and also driven by the COVID-19 pandemic.

The following table sets forth the pre-tax changes in our unrealized appreciation (depreciation) on investments, for the three months ended March 31, 2018 under Investment Company Accounting.

(Dollars in thousands)


Medallion

Loans


Commercial

Loans


Investments

in

Subsidiaries


Equity

Investments


Investments

Other Than

Securities


Total


Balance December 31, 2017


$

(20,338

)


$

(513

)


$

158,920


$

3,121


$

(1,490

)


$

139,700


Net change in unrealized


Appreciation on investments


38,795


(998

)


37,797


Depreciation on investments


(38,170

)


18


(1,915

)


(40,067

)

Reversal of unrealized appreciation

   (depreciation) related to realized


Gains on investments


Losses on investments


34,747


34,747


Balance March 31, 2018


(23,761

)


(495

)


197,715


2,123


(3,405

)


172,177


Under both Bank Holding Company Accounting and Investment Company Accounting, we generally follow a practice of discontinuing the accrual of interest income on our loans that are in arrears as to payments for a period of 90 days or more. We deliver a default notice and begin foreclosure and liquidation proceedings when management determines that pursuit of these remedies is the most appropriate course of action under the circumstances. A loan is considered to be delinquent if the borrower fails to make a payment on time; however, during the course of discussion on delinquent status, we may agree to modify the payment terms of the loan with a borrower that cannot make payments in accordance with the original loan agreement. For loan modifications, the loan will only be returned to accrual status if all past due interest and principal payments are brought fully current. For credit that is collateral based, we evaluate the anticipated net residual value we would receive upon foreclosure of such loans, if necessary. There can be no assurance, however, that the collateral securing these loans will be adequate in the event of foreclosure. For credit that is cash flow-based, we assess our collateral position, and evaluate most of these relationships as ongoing businesses, expecting to locate and install a new operator to run the business and reduce the debt. We cannot predict the ultimate impact that the ongoing COVID-19 pandemic will have on the loan portfolios due to the greater than typical uncertainty surrounding COVID-19 and its related significant negative effects on the economy and financial markets.year.

For the consumer loan portfolio, the process to repossess the collateral is started at 60 days past due. If the collateral is not located and the account reaches 120 days delinquent, the account is charged-off to realized losses. If the collateral is repossessed, a realized loss is recorded to write the collateral down to its net realizable value, and the collateral is sent to auction. When the collateral is sold, the net auction proceeds are applied to the account, and any remaining balance is written off as a realized loss, and any excess proceeds are recorded as a recovery. Proceeds collected on charged-off accounts are recorded as recoveries. All collection, repossession, and recovery efforts are handled on behalf of the Bank by the servicer.

The following table shows the trend in loans 90 days or more past due as of the dates indicated.


Year Ended December 31,


2023


2022


2021


(Dollars in thousands)


Amount


% (1)


Amount


% (1)


Amount


% (1)


Recreation


$

9,095


0.4

%


$

7,365


0.4

%


$

3,818


0.3

%

Home improvement


1,502


0.1

%


579


*


132


*


Commercial


6,240


0.3

%


74


*


74


*


Taxi medallion


*


885


*


*


Total loans 90 days or more past due


$

16,837


0.8

%


$

8,903


0.5

%


$

6,878


0.6

%

(1)
Percentages are calculated against the total or managed loan portfolio, as appropriate.

(*) Less than 0.1%.


December 31, 2020


December 31, 2019


December 31, 2018


(Dollars in  thousands)


Amount


% (1)


Amount


% (1)


Amount


% (1)


Recreation


$

5,343


0.5

%


$

5,800


0.5

%


$

4,133


0.4

%

Home improvement


170


0.0


184


0.0


135


0.0


Commercial


75


0.0


107


0.0


279


0.0


Medallion


1,290


0.1


2,572


0.2


16,678


1.7


Total loans 90 days or more past due


$

6,878


0.6

%


$

8,663


0.7

%


$

21,225


2.1

%

(1)

Percentages are calculated against the total or managed loan portfolio, as appropriate.  


We estimate that the weighted average loan-to-value ratio of our medallion loans was approximately 327%, 190%, and 220% as of December 31, 2020, 2019, and 2018.

Recreation and taxi medallion loans that reach 120 days past due are charged down to collateral value and reclassified to loan collateral in process of foreclosure. The following table showstables show the activity of loan collateral in process of foreclosure for the twelve months ended December 31, 20202023 and 2019.2022.

Year Ended December 31, 2023
(Dollars in thousands)


Recreation


Taxi
Medallion
(1)


Total


Loan collateral in process of foreclosure – December 31, 2022


$

1,376


$

20,443


$

21,819


Transfer from loans, net


18,875


2,306


21,181


Sales


(7,890

)


(700

)


(8,590

)

Cash payments received


(730

)


(11,311

)


(12,041

)

Collateral valuation adjustments


(9,852

)


(745

)


(10,597

)

Loan collateral in process of foreclosure – December 31, 2023


$

1,779


$

9,993


$

11,772


Twelve Months Ended December 31, 2020

(Dollars in thousands)

��

Recreation


Medallion


Total


Loan collateral in process of foreclosure December 31, 2019


$

1,476


$

51,235


$

52,711


Transfer from loans, net


14,871


32,403


47,274


Sales


(7,512

)


(300

)


(7,812

)

Cash payments received


(5,687

)


(5,687

)

Collateral valuation adjustments


(7,403

)


(24,523

)


(31,926

)

Loan collateral in process of foreclosure December 31, 2020


$

1,432


$

53,128


$

54,560


(1)

Twelve Months Ended December 31, 2019

(Dollars in thousands)


Recreation


Medallion


Total


Loan collateral in process of foreclosure December 31, 2018


$

1,503


$

47,992


$

49,495


Transfer from loans, net


14,512


16,836


31,348


Sales


(7,591

)


(1,515

)


(9,106

)

Cash payments received


(7,697

)


(7,697

)

Collateral valuation adjustments


(6,948

)


(4,381

)


(11,329

)

Loan collateral in process of foreclosure December 31, 2019


$

1,476


$

51,235


$

52,711


The following table presents the gain/loss experience on the investment portfolio for the three months ended MarchAs of December 31, 2018 under Investment Company Accounting.

(Dollars in thousands)


March 31, 2018


Realized gains (losses) on loans and equity

   investments


Medallion loans


$

(34,747

)

Commercial loans


2


Total loans


(34,745

)


Total realized losses on loans

   and equity investments


$

(34,745

)

Net realized losses on investments at Medallion

   Bank and other controlled subsidiaries


(23,073

)


Total managed realized losses on loans

   and equity investments


$

(57,818

)

Realized gains (losses) as a % of average

   balances outstanding


Medallion loans


(65.74

)%

Commercial loans


0.01


Total loans


(45.96

)


Net investments


(30.89

)

Net investments at Medallion Bank and other

   controlled subsidiaries


(9.66

)%

Managed net investments


(18.22

)%

The following table sets forth the pre-tax changes in our unrealized and realized gains and losses2023, taxi medallion loans in the investment portfolio forprocess of foreclosure included 333 taxi medallions in the three months ended MarchNew York market, 206 taxi medallions in the Chicago market, 31 2018 under Investment Company Accounting.taxi medallions in the Newark market, and 31 taxi medallions in various other markets.

Year Ended December 31, 2022
(Dollars in thousands)


Recreation


Taxi
Medallion
(1)


Total


Loan collateral in process of foreclosure – December 31, 2021


$

1,720


$

35,710


$

37,430


Transfer from loans, net


12,444


347


12,791


Sales


(7,707

)


(2,668

)


(10,375

)

Cash payments received


(12,289

)


(12,289

)

Collateral valuation adjustments


(5,081

)


(657

)


(5,738

)

Loan collateral in process of foreclosure – December 31, 2022


$

1,376


$

20,443


$

21,819


(1)
As of December 31, 2022, taxi medallion loans in the process of foreclosure included 452 taxi medallions in the New York market, 335 taxi medallions in the Chicago market, 54 taxi medallions in the Newark market, and 39 taxi medallions in various other markets.

(Dollars in thousands)


March 31, 2018


Net change in unrealized appreciation

   (depreciation) on investments


Unrealized appreciation


$

(998

)

Unrealized depreciation


(38,152

)

Net unrealized appreciation on investments in

   Medallion Bank and other controlled subsidiaries


29,115


Realized gains


Realized losses


34,747


Net unrealized losses on investments other than

   securities and other assets


(1,915

)

Total


$

22,797


Net realized gains (losses) on investments


Realized gains


$


Realized losses


(34,747

)

Other gains


Direct recoveries (charge-offs)


2


Total


$

(34,745

)

44


SEGMENT RESULTS

We manage our financial results under four operating segments; recreation lending, home improvement lending, commercial lending, and taxi medallion lending. We also show results for twoa non-operating segments; RPAC andsegment, corporate and other investments. All results are for the twelve months ended December 31, 2020 and 2019 and the nine months ended December 31, 2018.

Recreation Lending

The recreationRecreation lending segment is a high-growthgrowth oriented business focused on originating prime and non-prime consumer finance businessrecreation loans which is a significant source of income for us, accounting for 76%67%, 71%, and 75%74% of our interest income for the twelve monthsyears ended December 31, 20202023, 2022, and 20192021.

We maintain relationships with approximately 3,200 dealers and 71%financial service providers, or FSPs, not all of which are active at any one time. FSPs are entities that provide finance and insurance, or F&I, services to small dealers that do not have the desire or ability to provide F&I services themselves. The ability of FSPs to aggregate the financing and relationship management for many small dealers makes them valuable. We receive approximately half of our loan volume from dealers and the other half from FSPs. Our top ten dealer and FSP relationships were responsible for 43% of recreation lending’s new loan originations for the nine monthsyear ended December 31, 2018. 2023. The percentage of new loan originations by the top ten dealer and FSP relationships is a measure of concentration, which management uses to determine whether to undertake diversification efforts, and which provides investors with information about origination concentration.

The recreation loan portfolio consists of thousands of geographically distributed loans with an average loan size of approximately $20,000 as of December 31, 2023. The loans are fixed rate with an average term at origination of 12.9 years. The weighted average maturity of our loans outstanding as of December 31, 2023 is 10.0 years.

The loans are secured primarily by RVs, boats, and trailers, with RV loans making up 60%54% of the portfolio and boat loans making up 19% of the portfolio and trailer loans making up 12% of the portfolio as of December 31, 2020,2023, compared to 61%,58% and 19%, and 12% as of December 31, 2019.2022. Recreation loans are made to borrowers residing in all fifty states,nationwide, with the highest concentrations in Texas California, and Florida, at 17%,15% and 10%, and 9% of loans outstanding at December 31, 2020 and 2019 and with no other states over 9%at or above 10%.

During As of December 31, 2023, 2022, and 2021, the twelve monthsweighted average FICO, measured at origination, scores of our recreation loans outstanding were 683, 671, and 668. The weighted average FICO scores at the time of origination for the loans funded in the years ended December 31, 20202023, 2022, and 2019,2021 were 686, 676, and 684.

During the year ended December 31, 2023, the recreation portfolio continuedgrew 13% from $1.2 billion to grow, leading$1.3 billion, with the average interest rate increasing 51 basis points to 14.79% from a year ago. Additionally, during the year ended December 31, 2023, allowance for credit losses increased 76 basis points from December 31, 2022, reflecting an increase in interest incomereserves due to the adoption of CECL, rising loss rates and net income for the year, even as the allowance percentage increased. various economic factors.

During the nine monthsyear ended December 31, 2018, the recreation segment grew and also included a third quarter sale of $55,979,000 of2023, we originated $447.0 million recreation loans, for a gaindecrease of $3,093,000, included$66.0 million compared to $513.1 million from a year ago. The decrease was driven by more restrictive underwriting standards in non-interest income (expense).

2023 compared to 2022 and management's efforts to mitigate concentration risk by moderating portfolio growth, as well as lower demand than what was experienced in the years following the COVID-19 pandemic. The following table presents certainquarterly originations for the years ended December 31, 2023, 2022, and 2021.


Year Ended December 31,


(Dollars in thousands)


2023


2022


2021


First Quarter


$

101,681


$

114,406


$

93,850


Second Quarter


190,007


170,207


134,467


Third Quarter


92,603


149,151


118,407


Fourth Quarter


62,748


79,298


95,197


Year Ended


$

447,039


$

513,062


$

441,921


45


As of December 31, 2023, 38% of the recreation loan portfolio were non-prime receivables with obligors who do not qualify for conventional consumer finance products as a result of, among other things, adverse credit history. The following table presents non-prime originations in comparison to total originations for the years ended December 31, 2023, 2022, and 2021.

(Dollars in thousands)


Total
Originations


Non-prime
Originations


Non-prime
Originations (%)


2023


$

447,039


$

152,045


34

%

2022


$

513,062


$

180,697


35

%

2021


$

441,921


$

130,296


29

%

The following table presents selected financial data and ratios as of and for the twelve monthsyears ended December 31, 20202023, 2022, and 2019 and the nine months ended December 31, 2018.2021.


Year Ended December 31,


(Dollars in thousands)


2023


2022


2021


Selected Earnings Data


Total interest income


$

167,765


$

139,145


$

118,305


Total interest expense


31,436


17,932


9,993


Net interest income


136,329


121,213


108,312


Provision for credit losses


44,592


22,802


7,671


Net interest income after loss provision


91,737


98,411


100,641


Other income


376


Other expenses


(32,601

)


(30,463

)


(30,156

)

Net income before taxes


59,512


67,948


70,485


Income tax provision


(17,231

)


(17,989

)


(18,699

)

Net income after taxes


$

42,281


$

49,959


$

51,786


Balance Sheet Data


Total loans, gross


$

1,336,222


$

1,183,512


$

961,320


Total credit allowance


57,532


41,966


32,435


Total loans, net


1,278,690


1,141,546


928,885


Total assets


1,297,870


1,154,680


943,753


Total borrowings


1,062,584


936,789


744,701


Selected Financial Ratios


Return on average assets


3.36

%


4.38

%


5.93

%

Return on average equity


21.24


26.66


29.66


Interest yield


13.07


12.82


13.45


Net interest margin, gross


10.62


11.17


12.31


Net interest margin, net of allowance


11.09


11.57


12.76


Reserve coverage


4.31


3.55


3.37


Delinquency status (1)


0.70


0.64


0.41


Charge-off ratio


3.04


1.22


0.29


(1)
Loans 90 days or more past due.


Twelve Months Ended December 31,


Nine Months Ended December 31,


(Dollars in thousands)


2020


2019


2018


Selected Earnings Data


Total interest income


$

110,706


$

99,463


$

68,870


Total interest expense


13,013


13,304


6,986


Net interest income


97,693


86,159


61,884


Provision for loan losses


23,736


28,638


15,118


Net interest income after loss provision


73,957


57,521


46,766


Total other income (expense), net


(27,341

)


(23,490

)


(14,242

)

Net income before taxes


46,616


34,031


32,524


Income tax provision


(12,004

)


(8,813

)


(8,579

)

Net income after taxes


$

34,612


$

25,218


$

23,945


Balance Sheet Data


Total loans, gross


$

792,686


$

713,332


$

587,038


Total loan allowance


27,348


18,075


6,856


Total loans, net


765,338


695,257


580,182


Total assets


777,605


707,377


590,746


Total borrowings


621,735


563,805


434,527


Selected Financial Ratios


Return on average assets


4.59

%


3.84

%


5.48

%

Return on average equity


22.93


17.19


22.60


Interest yield


14.90


15.39


15.78


Net interest margin


13.15


13.33


14.18


Reserve coverage


3.45


2.53


1.17


Delinquency status (1)


0.70


0.84


0.73


Charge-off%


1.95


2.69


1.89


46


(1)

Loans 90 days or more past due.


Home Improvement Lending

The home improvement lending segment works with contractors and financial service providers to finance residential home improvements and is concentrated in roofs, swimming pools, roofs,and windows and solar panels at 27%41%, 24%, 13%20%, and 8% at December 31, 2020, as compared to 23%, 21%, 14%, and 12%13% of total loans outstanding atas of December 31, 2019,2023, as compared to 37%, 23%, and 12% as of December 31, 2022, with no other collateral types over 8%at or above 10%. Home improvement loans are made to borrowers residing in all fifty states,nationwide, with the highest concentrations in Florida, Texas and OhioFlorida each at 11%, 11%, and 9% at December 31, 2020, as compared to 11%, 11%, and 10% of loans outstanding at December 31, 2019, and2023, with no other states over 9%at or above 10%.

For As of December 31, 2023, 2022, and 2021, the twelve monthsweighted average FICO scores, measured at origination, of our home improvement loans outstanding were 764, 753, and 754. The weighted average FICO scores at the time of origination for the loans funded in the years ended December 31, 20202023, 2022, and 2019,2021 were 771, 758, and 759.

A large proportion of our home improvement-financed sales are facilitated by contractor salespeople with limited financing backgrounds rather than by contractor employees who provide F&I services. The result is contractor demand for financing services that facilitate an in-home transaction (e.g., digital tools, including mobile applications for phone or tablet, support for E-SIGN compliant electronic signatures, and extended operating hours), and additional resources for the salesperson throughout the financing process. We currently maintain relationships with approximately 800 contractors and FSPs. Our top ten contractors and FSP relationships were responsible for over 50% of home improvement lending’s new loan originations for the years ended December 31, 2023 and 2022. The percentage of new loan originations by the top ten contractor and FSP relationships is a measure of concentration, which management uses to determine whether to undertake diversification efforts, and which provides investors with information about origination concentration.

The home improvement loan portfolio consists of thousands of geographically distributed loans with an average loan size of approximately $20,000 as of December 31, 2023. The loans are fixed rate with an average term at origination of 13.6 years. The weighted average maturity of our loans outstanding as of December 31, 2023 is 12.3 years.

During the year ended December 31, 2023, the home improvement portfolio grew 21% from $626.4 million to $760.6 million, with allowance for credit losses increasing 95 basis points from a year ago reflecting an increase in reserves due to the adoption of CECL and rising loss rates. The average interest rate increased 86 basis points to 9.51% from the prior year.

During the year ended December 31, 2023, we originated $357.4 million home improvement loans, compared to $392.5 million in the prior year. The decrease was driven by more restrictive underwriting standards in 2023 compared to 2022 and management's efforts to mitigate concentration risks. The following table presents quarterly originations for the years ended December 31, 2023, 2022, and 2021.


Year Ended December 31,


(Dollars in thousands)


2023


2022


2021


First Quarter


$

94,981


$

89,820


$

48,059


Second Quarter


117,035


105,172


62,992


Third Quarter


79,333


100,451


68,692


Fourth Quarter


66,045


97,100


78,295


Year Ended


$

357,394


$

392,543


$

258,038


47


As of December 31, 2023, 1% of the home improvement loan portfolio continued to grow, leading to an increase in interest income and overall net income. In September 2018, we sold $44,909,000were non-prime receivables with obligors who do not qualify for conventional consumer finance products as a result of, home improvement loans for a gain of $2,079,000, which is included inamong other income (expense).

things, adverse credit history. The following table presents certainnon-prime originations in comparison to total originations for the years ended December 31, 2023, 2022, and 2021.

(Dollars in thousands)


Total
Originations


Non-prime
Originations


Non-prime
Originations (%)


2023


$

357,394


$

3,094


1

%

2022


$

392,543


$

5,068


1

%

2021


$

258,038


$

4,034


2

%

The following table presents selected financial data and ratios as of and for the twelve monthsyears ended December 31, 20202023, 2022, and 2019 and the nine months ended December 31, 2018.2021.


Year Ended December 31,


(Dollars in thousands)


2023


2022


2021


Selected Earnings Data


Total interest income


$

62,703


$

44,703


$

34,204


Total interest expense


18,137


7,697


4,153


Net interest income


44,566


37,006


30,051


Provision for credit losses


17,583


7,616


2,750


Net interest income after loss provision


26,983


29,390


27,301


Other income


6


14


63


Other expenses


(16,752

)


(13,514

)


(11,703

)

Net income before taxes


10,237


15,890


15,661


Income tax provision


(2,964

)


(4,207

)


(4,155

)

Net income after taxes


$

7,273


$

11,683


$

11,506


Balance Sheet Data


Total loans, gross


$

760,621


$

626,399


$

436,772


Total credit allowance


21,019


11,340


7,356


Total loans, net


739,602


615,059


429,416


Total assets


744,904


618,923


442,503


Total borrowings


609,863


502,131


349,172


Selected Financial Ratios


Return on average assets


1.04

%


1.95

%


2.90

%

Return on average equity


6.60


12.08


14.49


Interest yield


8.86


8.49


9.14


Net interest margin, gross


6.29


7.03


8.03


Net interest margin, net of allowance


6.45


7.16


8.17


Reserve coverage


2.76


1.81


1.68


Delinquency status (1)


0.20


0.09


0.03


Charge-off ratio


1.33


0.69


0.15


(1)
Loans 90 days or more past due.


Twelve Months Ended December 31,


Nine Months Ended December 31,


(Dollars in thousands)


2020


2019


2018


Selected Earnings Data


Total interest income


$

27,273


$

19,943


$

12,799


Total interest expense


5,699


4,757


2,290


Net interest income


21,574


15,186


10,509


Provision for loan losses


3,778


1,598


2,453


Net interest income after loss provision


17,796


13,588


8,056


Other income (expense), net


(9,611

)


(7,520

)


(3,093

)

Net income before taxes


8,185


6,068


4,963


Income tax provision


(2,108

)


(1,572

)


(1,319

)

Net income after taxes


$

6,077


$

4,496


$

3,644


Balance Sheet Data


Total loans, gross


$

334,033


$

247,324


$

183,155


Total loan allowance


5,157


2,608


1,796


Total loans, net


328,876


244,716


181,359


Total assets


340,494


252,704


188,892


Total borrowings


272,284


201,605


143,815


Selected Financial Ratios


Return on average assets


2.07

%


2.20

%


2.56

%

Return on average equity


10.35


10.22


11.30


Interest yield


9.66


9.50


9.06


Net interest margin


7.62


7.24


7.44


Reserve coverage


1.54


1.05


0.98


Delinquency status (1)


0.05


0.07


0.07


Charge-off%


0.44


0.37


0.46


48


(1)

Loans 90 days or more past due.

Commercial Lending

We originate both senior and subordinated loans nationwide to businesses in a variety of industries, more than 53%with California, Minnesota, and Wisconsin having 27%, 12%, and 10% of which are located in the Midwest region, with the rest scattered across the country.segment portfolio, and no other states having a concentration at or above 10%. These mezzanine loans are primarily secured by a second position on all assets of the businesses and generally range in amount from $2,000,000$2.5 million to $5,000,000$6.0 million at origination, and typically include an equity component as part of the financing. The commercial lending business has concentrations in manufacturing, construction, and professional, scientific,wholesale trade that make up 53%, 13%, and technical services making up 57%11% of total loans outstanding as of December 31, 2023, as compared to 50%, 11%, and 14% as of December 31, 2022. During the year ended December 31, 2023, we originated $34.9 million of loans, outstanding atcompared to $28.2 million in originations in 2022. As of December 31, 2020, and 63% and 13% at December 31, 2019.2023, commercial loans totaled $114.8 million.


The following table presents certainselected financial data and ratios as of and for the twelve monthsyears ended December 31, 20202023, 2022, and 2019 and the nine months ended December 31, 2018.2021. The commercial segment encompasses the mezzanine lending business, and the other legacy commercial loans (immaterial to total) have been allocated to corporate and other investments.


Year Ended December 31,


(Dollars in thousands)


2023


2022


2021


Selected Earnings Data


Total interest income


$

12,719


$

9,348


$

6,592


Total interest expense


3,597


3,040


2,720


Net interest income


9,122


6,308


3,872


Provision for credit losses


1,988


5,963


Net interest income after loss provision


7,134


345


3,872


Other income


5,971


3,306


6,542


Other expenses


(3,547

)


(4,910

)


(3,441

)

Net income (loss) before taxes


9,558


(1,259

)


6,973


Income tax (provision) benefit


(2,767

)


333


(1,850

)

Net income (loss) after taxes


$

6,791


$

(926

)


$

5,123


Balance Sheet Data


Total loans, gross


$

114,827


$

92,899


$

76,696


Total credit allowance


4,148


1,049


1,141


Total loans, net


110,679


91,850


75,555


Total assets


110,850


101,447


102,711


Total borrowings


90,754


82,304


81,048


Selected Financial Ratios


Return on average assets


6.65

%


(0.91

)%


6.12

%

Return on average equity


41.51


(5.50

)


30.61


Interest yield


12.80


10.63


9.86


Net interest margin, gross


9.18


7.17


5.79


Net interest margin, net of allowance


9.45


7.28


5.81


Reserve coverage


3.61


1.13


1.49


Delinquency status (1)


5.40


0.08


0.10


Charge-off ratio


1.02


6.86


0.00


Twelve Months Ended December 31,


Nine Months Ended December 31,


(Dollars in thousands)


2020


2019


2018


Selected Earnings Data


Total interest income


$

6,926


$

7,183


$

7,076


Total interest expense


2,538


2,833


1,502


Net interest income


4,388


4,350


5,574


Provision for loan losses


364


Net interest income after loss provision


4,388


3,986


5,574


Other income (expense), net


(3,196

)


(1,149

)


(1,824

)

Net income before taxes


1,192


2,837


3,750


Income tax provision


(299

)


(684

)


(862

)

Net income after taxes


$

893


$

2,153


$

2,888


Balance Sheet Data


Total loans, gross


$

62,037


$

66,405


$

59,973


Total loan allowance


Total loans, net


62,037


66,405


59,973


Total assets


80,622


84,924


93,807


Total borrowings


65,924


68,666


53,719


Selected Financial Ratios


Return on average assets


1.07

%


2.44

%


4.27

%

Return on average equity


5.17


12.21


9.43


Interest yield


10.51


11.39


14.25


Net interest margin


6.66


6.90


11.23


Reserve coverage(1)


0.00


0.00


0.00


Delinquency status (1) (2)


0.11


0.15


0.44


Charge-off% (3)


0.04


1.30


0.00


(1)
Loans 90 days or more past due.


As of December 31,


2023


2022


Geographic Concentrations
(Dollars in thousands)


Total Gross
Loans


% of
Market


Total Gross
Loans


% of
Market


California


$

31,225


27

%


$

21,585


23

%

Minnesota


13,879


12


12,048


13


Wisconsin


11,393


10


5,054


5


Texas


10,725


9


9,853


11


Illinois


8,474


7


12,873


14


Other (1)


39,131


35


30,690


34


Total


$

114,827


100

%


$

92,103


100

%

(1)

Ratio is based off of total commercial balances, and relates solely to the legacy commercial loans balances.

(1)
Includes 13 other states, which were all under 10% as of December 31, 2023 and 9 other states, which were all under 10% as of December 31, 2022.

(2)

Loans 90 days or more past due.

(3)

Ratio is based on total commercial lending business, and relates to the total loan business.


December 31, 2020


December 31, 2019


Geographic Concentrations


Total Gross

Loans


% of

Market


Total Gross

Loans


% of

Market


Michigan


$

10,461


17

%


$

10,331


16

%

Illinois


9,473


15


9,359


14


North Carolina


6,836


11


5,250


8


Minnesota


5,679


9


9,462


14


Texas


5,559


9


3,306


5


California


5,000


8


4,997


8


Other (1)


19,029


31


23,700


35


Total


$

62,037


100

%


$

66,405


100

%

(1)

Includes seven other states, which were all under 7% as of December 31, 2020, and nine other states, which were all under 8% as of December 31, 2019.


49


Taxi Medallion Lending

The taxi medallion lending segment operates mainly in the New York City Newark, and Chicago markets. We have a long history of owning, managing, and financing taxi fleets, taxi medallions, and corporate car services. Formetropolitan area. During the twelve monthsyear ended December 31, 2020, we saw a significant decline in the medallion collateral value from $167,000 at December 31, 2019 to $79,500 as of December 31, 2020, which was primarily due to the current COVID-19 pandemic, and we recognized an additional net loss of $41,652,000 due to the reserves and write-down of collateral related to the loans in process of foreclosure. Additionally, we had deemed all medallion loans impaired and placed them on nonaccrual in the third quarter of 2020. For the twelve months ended December 31, 2019, we saw the2023, taxi medallion values decline slightlyremained consistent in the New York City and ChicagoNewark markets although we did see an improvement in collections. For the nine months ended December 31, 2018, we saw a leveling off in the medallion values in the New York City market, while inwith all other markets there were declinesbeing valued at $0 at the end of the year. We continued to not recognize interest income with all loans being placed on nonaccrual as of the third quarter 2020 (except for settled loans with interest being paid in values. Duringexcess of the 2018 fourth quarter, we deconsolidated Trust III, which resultedloan balance), and by transferring underperforming loans from the portfolio to loan collateral in a gainprocess of $25,325,000, leadingforeclosure with charge-offs to an overall decline in medallion loans.collateral value, once loans become more than 120 days past due. All the loans are secured by thetaxi medallions and enhanced by personal guarantees of the shareholders and owners.

During the year ended December 31, 2023, we collected $45.2 million related to taxi medallion and related assets, which resulted in net recoveries and gains of $29.6 million. The amount of cash collected as well as recoveries recorded vary greatly from period to period due to a wide variety of circumstances surrounding each of the underlying assets, and while we continue to focus on collection and recovery efforts, it is unlikely that there will be future collections at the levels experienced in the current year.

The following table presents certainselected financial data and ratios as of and for the twelve monthsyears ended December 31, 20202023, 2022, and 2019 and the nine months ended December 31, 2018.2021.


Year Ended December 31,


(Dollars in thousands)


2023


2022


2021


Selected Earnings Data


Total interest income (loss)


$

1,596


$

632


$

(1,483

)

Total interest expense


72


508


5,914


Net interest income


1,524


124


(7,397

)

Benefit for credit losses


(26,318

)


(6,474

)


(7,752

)

Net interest income after loss provision


27,842


6,598


355


Other income (loss)


3,358


4,341


(641

)

Other expenses


(7,256

)


(10,520

)


(1,350

)

Net income (loss) before taxes


23,944


419


(1,636

)

Income tax (provision) benefit


(6,933

)


(111

)


433


Net income (loss) after taxes


$

17,011


$

308


$

(1,203

)

Balance Sheet Data


Total loans, gross


$

3,663


$

13,571


$

14,046


Total credit allowance


1,536


9,490


9,234


Total loans, net


2,127


4,081


4,812


Total assets


12,247


25,496


86,526


Total borrowings


10,027


20,685


68,276


Selected Financial Ratios


Return on average assets


91.25

%


1.18

%


(0.13

)%

Return on average equity


574.86


6.97


(0.64

)

Interest yield


26.94


4.58


(6.97

)

Net interest margin, gross


25.73


0.90


(34.78

)

Net interest margin, net of allowance


61.60


2.76


(93.60

)

Reserve coverage


41.93


69.93


65.74


Delinquency status (1)


6.52


0.00


Charge-off ratio


(309.96

)


(47.51

)


41.72


(1)
Loans 90 days or more past due.


As of December 31,


2023


2022


Geographic Concentration
(Dollars in thousands)


Total Gross
Loans


% of
Market


Total Gross
Loans


% of
Market


New York City


$

3,436


94

%


$

12,626


93

%

Newark


227


6


916


7


All Other


29


*


Total


$

3,663


100

%


$

13,571


100

%

(*) Less than 1%.


As of December 31,


2023


2022


Geographic Concentration
(Dollars in thousands)


Total Loan Collateral in Process of Foreclosure


% of
Market


Total Loan Collateral in Process of Foreclosure


% of
Market


New York City


$

8,863


89

%


$

16,720


82

%

Newark


1,130


11


2,965


14


Chicago


732


4


All Other


26


*


Total


$

9,993


100

%


$

20,443


100

%

(*) Less than 1%.


Twelve Months Ended December 31,


Nine Months Ended December 31,


(Dollars in thousands)


2020


2019


2018


Selected Earnings Data


Total interest income (loss)


$

(1,518

)


$

3,665


$

6,317


Total interest expense


3,610


7,962


10,125


Net interest loss


(5,128

)


(4,297

)


(3,808

)

Provision for loan losses


42,276


16,331


41,437


Net interest loss after loss provision


(47,404

)


(20,628

)


(45,245

)

Other income (expense), net


(30,366

)


(10,493

)


9,742


Net loss before taxes


(77,770

)


(31,121

)


(35,503

)

Income tax benefit


19,520


7,596


7,938


Net loss after taxes


$

(58,250

)


$

(23,525

)


$

(27,565

)

Balance Sheet Data


Total loans, gross


$

37,768


$

130,432


$

183,606


Total loan allowance


25,043


25,410


27,743


Total loans, net


12,725


105,022


155,863


Total assets


124,554


217,483


273,501


Total borrowings


98,636


176,825


294,465


Selected Financial Ratios


Return on average assets


(33.21

)%


(9.73

)%


(10.13

)%

Return on average equity


(165.21

)


(48.49

)


NM


Interest yield


(2.11

)


2.88


3.58


Net interest margin


(7.14

)


(3.38

)


(2.16

)

Reserve coverage


66.31


19.48


15.11


Delinquency status (1)


3.57


2.04


9.43


Charge-off%


59.38


14.68


7.76


(1)

Loans 90 days or more past due.


December 31, 2020


December 31, 2019


Geographic Concentration


Total Gross

Loans


% of

Market


Total Gross

Loans


% of

Market


New York City


$

33,657


89

%


$

115,340


88

%

Newark


3,811


10


14,316


11


All Other


300


1


776


1


Total


$

37,768


100

%


$

130,432


100

%


December 31, 2020


December 31, 2019


Geographic Concentration


Total Loan Collateral in Process of Foreclosure

Loans


% of

Market


Total Loan Collateral in Process of Foreclosure

Loans


% of

Market


New York City


$

38,738


73

%


$

41,494


81

%

Newark


7,994


15


2,277


4


Chicago


6,057


11


6,425


13


All Other


339


1


1,039


2


Total


$

53,128


100

%


$

51,235


100

%

RPAC

We are the majority owner and managing member of RPAC Racing, LLC, a performance and marketing company for NASCAR. Revenues are mainly earned through sponsorships and race winning activity over the ten month race season (February through November) during the year. As a result of COVID-19, the race season was suspended from March 15, 2020 through May 17, 2020. As states began to reopen, NASCAR began racing and completed all races on a revised schedule.50


The following table presents certain financial data and ratios as of and for the twelve months ended December 31, 2020 and 2019 and the nine months ended December 31, 2018. 


Twelve Months Ended December 31,


Nine Months Ended December 31,


(Dollars in thousands)


2020


2019


2018


Selected Earnings Data


Sponsorship, race winnings, and other income


$

20,042


$

18,742


$

14,368


Race and other expenses


16,339


15,938


18,597


Interest expense


163


159


121


Total expenses


16,502


16,097


18,718


Net income (loss) before taxes


3,540


2,645


(4,350

)

Income tax (provision) benefit


(889

)


(329

)


1,108


Net income (loss) after taxes


$

2,651


$

2,316


$

(3,242

)


Balance Sheet Data


Total assets


$

33,711


$

31,538


$

29,925


Total borrowings


8,689


7,794


7,649


Selected Financial Ratios


Return on average assets


7.98

%


7.28

%


(11.69

)%

Return on average equity


NM


(96.37

)


NM


Corporate and Other Investments

This non-operating segment relates to our equity and investment securities as well as our legacy commercial business, and other assets, liabilities, revenues, and expenses, which are not specifically allocated to the operating segments. Commencing with the 2020 second quarter, the Bank began issuing loans related to the new strategic partnership business, which is currently included within this segment, forsegment. The associated activities of the strategic partnership business are currently limited to originating loans or other receivables facilitated by our strategic partners and selling those loans or receivables to our strategic partners or other third parties, without recourse, within a total of $24,000 ofspecified time after origination, such as three business days. Strategic partnerships represent $0.6 million in net loans as of both December 31, 2020.2023 and December 31, 2022, with originations of $118.3 million during the year ended December 31, 2023. This segment also reflects the eliminationgains (losses) on the dispositions of all intercompany activity among the consolidated entities.certain non-core assets.

The following table presents certainselected financial data and ratios as of and for the twelve monthsyears ended December 31, 20202023, 2022, and 20192021.

(Dollars in thousands)


Year Ended December 31,


2023


2022


2021


Selected Earnings Data


Total interest income


$

6,257


$

2,793


$

1,348


Total interest expense


9,704


7,008


7,814


Net interest expense


(3,447

)


(4,215

)


(6,466

)

Provision (benefit) for credit losses


(35

)


152


1,953


Net interest expense after loss provision


(3,412

)


(4,367

)


(8,419

)

Other income


1,609


1,865


12,319


Other expenses


(15,412

)


(12,646

)


(10,866

)

Net loss before taxes


(17,215

)


(15,148

)


(6,966

)

Income tax benefit


4,985


4,011


1,552


Net loss after taxes


$

(12,230

)


$

(11,137

)


$

(5,414

)

Balance Sheet Data


Total loans, gross


$

553


$

572


$

90


Total credit allowance


Total loans, net


553


572


90


Total assets


421,956


359,333


297,564


Total borrowings


345,462


291,526


234,804


Selected Financial Ratios


Return on average assets


(3.13

)%


(3.02

)%


(2.01

)%

Return on average equity


(19.78

)


(18.40

)


(14.49

)

Summary Consolidated Financial Ratios

The following table presents selected financial data and ratios as of and for the nine monthsyears ended December 31, 2018.2023, 2022, and 2021.


Year Ended December 31,


(Dollars in thousands)


2023


2022


2021


Return on average assets


2.51

%


2.40

%


3.33

%

Return on average stockholder's equity


17.33


14.92


21.24


Return on average equity


15.79


13.74


17.64


Net interest margin, gross


8.38


8.73


8.91


Equity to assets (1)


15.91


16.40


19.00


Debt to equity (2)


5.1x


4.9x


4.2x


Net loans receivable to assets


82

%


82

%


77

%

Net charge-offs


31,132


16,380


12,004


Net charge-offs as a % of average loans receivable


1.48

%


0.99

%


0.93

%

Reserve coverage


3.80


3.33


3.37


(1)
Includes $68.8 million, related to non-controlling interests in consolidated subsidiaries as of December 31, 2023, 2022, and 2021.
(2)
Excludes deferred financing costs of $8.5 million, $7.0 million, and $7.1 million as of December 31, 2023, 2022, and 2021.


51


(Dollars in thousands)


Twelve Months Ended December 31,


Nine Months Ended December 31,


2020


2019


2018


Selected Earnings Data


Total interest income


$

1,575


$

2,308


$

1,741


Total interest expense


9,128


6,030


3,792


Net interest loss


(7,553

)


(3,722

)


(2,051

)

Total interest expense


27


Net interest loss


(7,580

)


(3,722

)


(2,051

)

Other income (expense), net


(11,164

)


(8,401

)


(6,489

)

Net loss before taxes


(18,744

)


(12,123

)


(8,540

)

Income tax benefit


5,854


3,461


1,005


Net loss after taxes


$

(12,890

)


$

(8,662

)


$

(7,535

)


Balance Sheet Data


Total loans, gross


$

3,314


$

3,362


$

4,110


Total loan allowance


Total loans, net


3,314


3,362


4,110


Total assets


285,425


247,641


204,975


Total borrowings


244,987


150,898


127,853


Selected Financial Ratios


Return on average assets


(5.06

)%


(3.71

)%


(4.07

)%

Return on average equity


(23.29

)


(14.26

)


(12.37

)

Summary Consolidated Financial Ratios

The below presents selected financial ratios for the Company, for the twelve months ended December 31, 2020 and 2019 and the nine months ended December 31, 2018.

(Dollars in thousands, Except  per share data)


Twelve Months Ended

December 31, 2020


Twelve Months Ended

December 31, 2019


Nine Months Ended

December 31, 2018


Selected financial ratios


Return on average assets (ROA)


(2.16

)%


(0.12

)%


(0.90

)%

Return on average equity (ROE)


(10.90

)


(0.59

)


(4.62

)

Dividend payout ratio


Net interest margin


8.65


8.64


8.19


Other income ratio (2)


(0.46

)


1.81


1.88


Total expense ratio (3)


7.51


9.18


9.77


Equity to assets (1)


18.54


21.70


21.00


Debt to equity (1)


4.3x


3.5x


3.7x


Loans receivable to assets


71

%


72

%


71

%

Net charge-offs


58,362


37,688


22,613


Net charge-offs as a % of average loans receivable


5.00

%


3.60

%


2.73

%

Allowance coverage ratio


4.68


3.97


3.58


(1)

Includes $73,153, $71,320 and $27,596 related to the non-controlling interests in consolidated subsidiaries as of December 31, 2020, 2019, and 2018.

(2)

Other income ratio represents other income divided by average interest earning assets, and excludes the gain on the deconsolidation of Trust III of $25,325 for the nine months ended December 31, 2018. See Note 20 for additional information.

(3)

Total expense ratio represents total expenses (interest expense, operating expenses, and income taxes) divided by average interest earning assets.


Consolidated Results of OperationsCONSOLIDATED RESULTS OF OPERATIONS

For the Year Ended December 31, 20202023 Compared to the Year Ended December 31, 20192022

Net lossincome attributable to shareholders was $34,783,000,$55.1 million, or $1.42$2.37 per share, for the year ended December 31, 2020,2023, compared to the net loss attributable to shareholders of $1,762,000,$43.8 million, or $0.07$1.83 per share, for the year ended December 31, 2019.2022.

Total interest income was $144,962,000$251.0 million for the year ended December 31, 2020,2023, compared to $132,562,000$196.6 million for the year ended December 31, 2019.2022. The increase in interest income reflected thereflects continued growth in the consumerrecreation and home improvement lending segments, which was partially offset by contractionand to a lesser extent, growth in the medallionour commercial lending segment, driven by both a decline in overall medallion loans along with all loans being placed on nonaccrual.as well as higher interest rates. The yield on interest earning assets was 11.32%11.19% for 2020,the year ended December 31, 2023, compared to 11.75%10.70% for 2019.the year ended December 31, 2022, reflecting new originations being priced at higher rates given the current interest rate environment. Average interest earning assets were $1,280,445,000$2.2 billion for the year ended December 31, 2023, an increase from $1,255,251,000$1.8 billion for the year ended December 31, 2022, due to continued growth of both recreation and home improvement loans, largely in the prior year.first half of 2023. In 2023, loan originations were $960.1 million, down from $983.9 million in 2022, with $447.0 million and $357.4 million of the 2023 originations attributable to the recreation and home improvement loans. In 2023, we raised credit standards and increased rates charged on new originations for both of our consumer loan products. This, along with lower demand than what was experienced in the years following the COVID-19 pandemic, resulted in somewhat lower originations.

Loans before the allowance for loancredit losses were $1,229,838,000$2.2 billion as of December 31, 2020,2023, comprised of recreation ($792,686,000)1.3 billion), home improvement ($334,033,000)0.8 billion), commercial ($65,327,000)114.8 million), taxi medallion ($37,768,000)3.7 million), and strategic partnership ($24,000)(less than $0.6 million) loans. The CompanyWe had an allowance for loancredit losses as of December 31, 20202023 of $57,548,000,$84.2 million, which was attributable to the recreation (48%(68%), medallion (43%home improvement (25%), commercial (5%), and home improvement (9%taxi medallion (2%) loan portfolios. As of December 31, 2019, 2022, loans before allowance for loancredit losses were $1,160,855,000,$1.9 billion, comprised of recreation ($713,332,000)1.2 billion), home improvement ($247,324,000)0.6 billion), commercial ($92.9 million), taxi medallion ($130,432,000)13.6 million), and commercialstrategic partnership ($69,767,000)0.6 million) loans. The CompanyWe had an allowance for loancredit losses as of December 31, 20192022 of $46,093,000,$63.8 million, which was attributable to medallion (55%recreation (66%), recreation (39%home improvement (18%), and home improvement (6%taxi medallion (15%) loans. The allowance for credit losses increased during the year, as a result of the adoption of CECL on January 1, 2023, which required provision for lifetime losses in our portfolio, as well as a result of the loan portfolio growth during the year.

Loans increased $68,983,000,$0.3 billion, or 6%16%, from December 31, 2019 to $1.2$2.2 billion as of December 31, 20202023 from $1.9 billion as a result of $497,221,000December 31, 2022. The growth resulted primarily due to nearly $1.0 billion of loan originations partiallyoutpacing the rate of repayments on existing loans, offset, to a lesser extent, by principal payments, net charge-offs (mainly on medallion loans), and transfers to loan collateral in process of foreclosure. The provision for loancredit losses was $69,817,000$37.8 million for the year ended December 31, 2020,2023, compared to $47,386,000 for 2019. The increase was mainly due to all medallion loans being deemed impaired due to the continued uncertainty of the potential continued impact of the COVID-19 pandemic on those borrowers. In addition, New York City and almost all other market net collateral values decreased, and the loans were written down, leading to an increase in provisions of approximately $25,945,000. Additionally, this change reflected the increase of reserve percentages ranging from 25 to 100 basis points on the recreation subprime loan business, related to the uncertainty about the potential impact on the businesses as a result of COVID-19. The charge-off ratios on the loan portfolios increased to 5.00%$30.1 million for the year ended December 31, 20202022. The current year provision included a net benefit of $26.3 million associated with taxi medallion loan recoveries, compared to 3.60% fora net benefit of $6.2 million associated with these loans in the prior year. While we continue to focus on collection and recovery efforts on our taxi medallion loans, it is unlikely that there will be future collections at the levels in the current period. The increase in the provision, in large part, related to higher charge-offs in both the recreation and home improvement loan portfolios from the prior year, mostlyas charge-offs continued to trend higher to levels more comparable with our pre-pandemic historical norms. Additionally, the increased charge-off experience resulted in the medallion segment.need for a higher allowance for credit losses, as we are now required to reserve for lifetime expected losses under CECL. As of December 31, 2023 the allowance for credit loss was 4.31% and 2.76% for recreation and home improvement loans, compared to 3.55% and 1.81% a year ago and 4.39% and 2.05% at January 1, 2023 after the adoption of CECL. See Note 4 of the accompanying consolidated financial statements for additional information on loans and the allowance for loancredit losses.

Interest expense was $34,151,000$62.9 million for the year ended December 31, 2020,2023, compared to $35,045,000$36.2 million for the year ended December 31, 2019.2022. The increase from the prior year is attributable to both an increase in cost of borrowings, with our average cost up 99 basis points from a year ago, as well as an overall increase in our borrowings, primarily certificates of deposit. The average cost of borrowed funds was 2.71%3.16% for 2020,the year ended December 31, 2023, compared to 3.08%2.17% for 2019, mainly driven by the declineyear ended December 31, 2022. The average cost of the certificates of deposit was 2.71% during the current year, 114 basis points higher than the 1.57% average cost in marketthe prior year, reflecting a higher rate on newly issued deposits when compared to the maturing deposits which were issued at lower rates for deposits.in previous years. We expect our average cost of funds to increase from these levels in this current inflationary environment as we continue to rely upon the issuance of new certificates of deposit to fund our growing lending business. Average debt outstanding was $1,258,257,000$2.0 billion for 2020, compared to $1,138,746,000the year ended December 31, 2023, up from $1.7 billion for 2019. This increase was driven by the issuanceyear ended December 31, 2022, as we issued additional certificates of depositsdeposit to increasefund our liquidity and help fund the growing consumer segment along with the new issuance of privately placed notes.loan growth. See page 4140 for a table which showstables that show average balances and cost of funds for our funding sources.

Net interest income was $110,811,000$188.1 million for the year ended December 31, 2020,2023, compared to $97,517,000 for the prior year. The net interest margin was 8.65%, compared to 8.64%$160.4 million for the year ended December 31, 2019,2022. Net interest margin, excluding the impact of allowance for credit loss, was 8.38% for the year ended December 31, 2023, compared to 8.73%, for the year ended December 31, 2022, reflecting the above. We expect our net interest margin to continue to tighten in 2024, as we expect our cost of funds to increase at a rate somewhat lower than the rate of increase on the average coupon on our loan portfolios.

52


Net other income, (loss), which is comprised primarily of sponsorship and race winnings,net gains related to equity investments, net gains associated with the disposition of taxi medallion assets, prepayment fees, servicing fee income, late charges, and write-downs of loan collateral, impairment of equity investments, and other miscellaneous income was a loss of $5,936,000$11.3 million for the year ended December 31, 2020,2023, compared to income of $20,387,000$9.5 million for the year ended December 31, 2019. 2022. The declineincrease was mainly dueattributable to significant reductions in collateral values for$2.4 million of higher gains on the New York City taxi medallions and other markets, along with a $4,145,000 gain on debt extinguishment in 2019, and a $3,510,000 charge in connection with the writeoffexit of a non-core sports-related investment in 2020, all which was partly offset by an increase in sponsorship and race winnings in the year ended December 31, 2020.equity investments.

Operating expenses were $72,039,000$75.6 million for the year ended December 31, 2020, compared to $68,181,0002023, up from $72.1 million for the prior year.year ended December 31, 2022. Salaries and benefits were $28,172,000$37.6 million for 2020, anthe year ended December 31, 2023, up from $31.1 million for the year ended December 31, 2022, with the increase from $24,971,000 for 2019, which was mainly attributable to increased salaries related to the Bank due to its continued growth, an increase in bonuses for the entire Company, as well as increased stock option expense. Race team costs were $8,366,000 in 2020, compared to $8,996,000 for 2019, which reflected the condensed race schedulea higher head count, annual cost of living increases, and lower travel and racing costs.higher performance based compensation. Professional fees were $8,047,000$5.9 million for the year an increaseended December 31, 2023, down from $13.1 million for the $7,402,000 for 2019, primarily reflective ofyear ended December 31, 2022, reflecting lower legal and professional costs during the current year for a variety of corporate matters. Loan servicingmatters, with costs were $6,737,000 for the year, up from $5,253,000 for 2019, primarily reflecting the increased costs of servicing the growing recreation and home improvement consumer loans, which have grown 17% from December 31, 2019. Loan collection costs declined from $6,638,000 for 2019, to $5,454,000 for 2020, due to improvement in contracts with the collectors. Occupancy and other operating expenses were $15,263,000 for the year, which increased $342,000, or 2%, compared to the prior year being elevated due to race related otherthe SEC litigation. These elevated costs partly offset by lower travel, meals and entertainment expensesincurred in 2022 gave rise to an approximate $6.5 million liability as a result of the shut-downs relatedcollection of insurance coverage with respect to COVID-19.those costs. The Company anticipates recognizing the benefit of this liability, offsetting future costs, through the remainder of this SEC matter. Other operating costs increased over the prior year consistent with the growth that we have experienced in our businesses and lending segments.


Total income tax benefitexpense was $10,074,000$24.9 million for 2020,the year ended December 31, 2023, compared to an income$18.0 million for the year ended December 31, 2022. Income tax provision of $341,000expense for 2019. The 2020 year benefit2023 included $1,228,000 of benefit$1.6 million tax expense related to a change in the effectivevaluation allowance with respect to certain tax rate, while the 2019 year included benefits of $380,000 attributable to net operating loss revaluations, $916,000 of benefits related to a change in the effective income tax rate and $600,000 tax benefit related to the settlement of a state audit. See Note 8 for more information.assets which we believe will not be realized.

Loan collateral in process of foreclosure was $54,460,000$11.8 million at December 31, 2020, an increase2023, a decline from $52,711,000$21.8 million at December 31, 2019. The increase was primarily reflective2022 with the decrease largely related to a drop in taxi medallion assets, due to the higher levels of additional loans having reached 120 days past duecash payments and being charged down to their collateral value and reclassified to loan collateral in process of foreclosure, partly offset bystructured settlements received during the continued decline in collateral values on the medallion portfolio.year.

For the Twelve MonthsYear Ended December 31, 20192022 Compared to the Nine MonthsYear Ended December 31, 20182021

Net loss attributable to stockholders was $1,762,000 or $0.07 per diluted common shareFor a comparison of the Company’s results of operations for the twelve monthsyear ended December 31, 2019, compared2022 to a net loss of $10,172,000 or $0.42 per diluted common share for the nine monthsyear ended December 31, 2018.

Total interest income was $132,562,0002021, see Item 7, Management’s Discussion and Analysis of Financial Condition and Results of Operations in the Company’s Annual Report on Form 10-K for the twelve monthsyear ended December 31, 2019, compared to $96,803,000 for the nine months ended December 31, 2018. Interest income reflected the continued growth in the consumer lending segments partly offset by the contraction in the lower yielding medallion lending segment. The yield on interest earning assets was 11.75% for the twelve months ended December 31, 2019, an improvement from 10.98% for the nine months ended December 31, 2018. Average interest earning assets were $1,128,479,000 for the twelve months ended December 31, 2019, a decline from $1,170,612,000 for the nine months ended December 31, 2018.

Loans before allowance for loan losses were $1,160,855,000 as of December 31, 2019, comprised of recreation ($713,332,000), home improvement ($247,324,000), medallion ($130,432,000), and commercial ($69,767,000) loans. The Company had an allowance for loan losses as of December 31, 2019 of $46,093,000,2022, which was attributable to medallion (55%), recreation (39%),filed with the Securities and home improvement (6%) loans. As of December 31, 2018, loans before allowance for loan loss were $1,017,882,000, which were comprised of recreation ($587,038,000), home improvement ($183,155,000), medallion ($183,606,000), and commercial ($64,083,000) loans. The Company had an allowance for loan losses as of December 31, 2018 of $36,395,000, which was attributable to the medallion (76%), recreation (19%), and home improvement (5%) loan portfolios. Loans increased $142,973,000, or 14%, from the prior year end primarily due to $462,093,000 of loan originations mostly in the consumer segments, offset partly by principal payments, transfer to loans in process of foreclosure, and net charge-offs. The provision for loan losses was $47,386,000 for the twelve months ended December 31, 2019, compared to $59,008,000 for the nine months ended December 31, 2018. The improvement was reflective of lower net charge-offsExchange Commission on the medallion portfolio, along with taxi medallion values remaining relatively consistent during 2019. The charge off ratios on the loan portfolio increased to 3.60% for the twelve months ended December 31, 2019 compared to 2.73% for the nine months ended December 31, 2018, driven by the recreation segment. See Note 4 for additional information on loans and the allowance for loan losses.

Interest expense was $35,045,000 for the twelve months ended December 31, 2019, compared to $24,816,000 for the nine months ended December 31, 2018. The average cost of borrowed funds was 3.08%, compared to 2.79%, mainly driven by new borrowings at higher rates and the roll off of lower cost borrowings. Average debt outstanding was $1,138,746,000 for the twelve months ended December 31, 2019, compared to $1,181,323,000 for the nine months ended December 31, 2018. See page 41 for a table which shows average balances and cost of funds for our funding sources.

Net interest income was $97,517,000 for the twelve months ended December 31, 2019, compared to $71,987,000 for the nine months ended December 31, 2018, and the net interest margin was 8.64%, compared to 8.19%, reflecting the above.

Noninterest income, which is comprised of sponsorship and race winnings, prepayment fees, servicing fee income, late charges, write-downs of loan collateral, impairment of equity investments, and other miscellaneous income was $20,387,000 for the twelve months ended December 31, 2019, compared to $41,946,000 for the nine months ended December 31, 2018. The decrease was primarily driven by the one-time gain on the deconsolidation of Trust III of $25,325,000 in the prior year.

Operating expenses were $68,181,000 for the twelve months ended December 31, 2019, compared to $62,081,000 for the nine months December 31, 2018. Salaries and benefits expense was $24,971,000 for the twelve months ended December 31, 2019 compared to $19,357,000 for the nine months ended December 31, 2018, professional fees were $7,402,000 for the twelve months ended December 31, 2019, compared to $8,609,000 for the nine months ended December 31, 2018, primarily reflecting legal costs for a variety of corporate and investment-related matters, and collections costs were $6,638,000 for the twelve months ended December 31, 2019, compared to $5,207,000 for the nine months ended December 31, 2018. The remaining expenses for the twelve months ended December 31, 2019 included race team costs of $8,996,000, loan servicing costs of $5,253,000, primarily reflecting costs of


servicing the recreation and home improvement consumer loans, and occupancy and other expenses of $14,921,000, whereas for the nine months ended December 31, 2018, race team costs were $7,121,000, loan servicing costs were $3,470,000, and occupancy and other operating expenses were $18,317,000, which included the impairment on goodwill of $5,615,000March 10, 2023.

Total income tax expense was $341,000 for the twelve months ended December 31, 2019, compared to $709,000 for the nine months ended December 31, 2018. The current year tax expense included $891,000 due to changes in effective state income tax rates, partly offset by $380,000, $640,000 and $309,000 of benefit due to the revaluation of the net operating losses, changes in state income tax accruals and income attributable to non-controlling interest. See Note 8 for more information.

Loan collateral in process of foreclosure was $52,711,000 at December 31, 2019, an increase from $49,495,000 at December 31, 2018, reflecting $31,348,000 of net loans transferred, partly offset by sales, cash payments, and valuation adjustments incurred during the current year.

Goodwill and intangible assets were $203,339,000 at December 31, 2019, down from $204,785,000 at December 31, 2018, reflecting the amortization of the intangible assets during 2019. See Note 2 for further information regarding goodwill and intangible assets.

ASSET/LIABILITY MANAGEMENT

Interest Rate Sensitivity

We, like other financial institutions, are subject to interest rate risk to the extent that our interest-earning assets (consisting of consumer, commercial, and taxi medallion loans, and investment securities) reprice on a different basis over time in comparison to our interest-bearing liabilities (consisting primarily of bank certificates of deposit, SBA debentures and borrowings, historically credit facilities, and borrowings withfrom banks and other lenders, and SBA debentures and borrowings)lenders).

Having interest-bearing liabilities that mature or reprice more frequently on average than assets may be beneficial in times of declining interest rates, although such an asset/liability structure may result in declining net earnings during periods of rising interest rates. Abrupt increases in market rates of interest may have an adverse impact on our earnings until we are able to originate new loans at the higher prevailing interest rates. Conversely, having interest-earning assets that mature or reprice more frequently on average than liabilities may be beneficial in times of rising interest rates, although this asset/liability structure may result in declining net earnings during periods of falling interest rates. This mismatch between maturities and interest rate sensitivities of our interest-earning assets and interest-bearing liabilities results in interest rate risk.

The effect of changes in interest rates is mitigated by regular turnover of the portfolios. We believe that the average life of our loan portfolios varies to some extent as a function of changes in interest rates. Borrowers are more likely to exercise prepayment rights in a decreasing interest rate environment because the interest rate payable on the borrower’s loan is high relative to prevailing interest rates. Conversely, borrowers are less likely to prepay in a rising interest rate environment. However, borrowers may prepay for a variety of other reasons, such as to monetize increases in the underlying collateral values. In addition, we manage our exposure to increases in market rates of interest by incurring fixed-rate indebtedness, such as ten year subordinated SBA debentures, and by setting repricing intervals on certificates of deposit, for terms of up to five years.

A relative measure of interest rate risk can be derived from our interest rate sensitivity gap. The interest rate sensitivity gap represents the difference between interest-earning assets and interest-bearing liabilities, which mature and/or reprice within specified intervals of time. The gap is considered to be positive when repriceable assets exceed repriceable liabilities, and negative when repriceable liabilities exceed repriceable assets. A relative measure of interest rate sensitivity is provided by the cumulative difference between interest sensitive assets and interest sensitive liabilities for a given time interval expressed as a percentage of total assets.


53


The following table presents our interest rate sensitivity gap at December 31, 2020.2023. The principal amounts of interest earning assets are assigned to the time frames in which such principal amounts are contractually obligated to be repriced. We havedo not reflected an assumed annualreflect any prepayment assumptions in preparing the analysis, despite historical average life experience being significantly shorter than contractual terms.

December 31, 2023 Cumulative Rate Gap (1)


(Dollars in thousands)


Less
Than
1 Year


More
Than
1 and Less
Than 2
Years


More
Than 2
and Less
Than 3
Years


More
Than 3
and Less
Than 4
Years


More
Than 4
and Less
Than 5
Years


More
Than
5 and Less
Than 6
Years


Thereafter


Total


Earning assets


Fixed-rate


$

20,524


$

26,244


$

47,623


$

96,001


$

82,217


$

78,902


$

1,822,160


$

2,173,671


Adjustable rate


500


846


263


28


1,637


Investment securities


18,455


3,444


1,954


4,750


1,833


4,849


38,722


74,007


Cash


148,595


500


750


149,845


Total earning assets


$

188,074


$

31,034


$

50,590


$

100,751


$

84,078


$

83,751


$

1,860,882


$

2,399,160


Interest bearing liabilities


Deposits


$

678,846


$

533,405


$

325,498


$

184,458


$

147,232


$


$


$

1,869,439


Retail and privately placed notes


3,000


31,250


53,750


39,000


12,500


139,500


SBA debentures and borrowings


5,000


14,000


14,000


2,000


1,250


39,000


75,250


Trust preferred securities


33,000


33,000


Total liabilities


$

686,846


$

547,405


$

370,748


$

240,208


$

187,482


$


$

84,500


$

2,117,189


Interest rate gap


$

(498,772

)


$

(516,371

)


$

(320,158

)


$

(139,457

)


$

(103,404

)


$

83,751


$

1,776,382


$

281,971


Cumulative interest rate gap


$

(498,772

)


$

(1,015,143

)


$

(1,335,301

)


$

(1,474,758

)


$

(1,578,162

)


$

(1,494,411

)


$

281,971


$


December 31, 2022 (2)


$

(367,803

)


$

(807,687

)


$

(1,158,706

)


$

(1,283,654

)


$

(1,372,105

)


$

(1,314,604

)


$

222,536


$


December 31, 2021 (2)


$

(230,601

)


$

(455,807

)


$

(770,239

)


$

(891,489

)


$

(1,007,810

)


$

(940,350

)


$

153,539


$


(1)
The ratio of the cumulative one-year gap to total interest rate for suchsensitive assets in this table.was (21%), (18%), and (14%) as of December 31, 2023, 2022, and 2021.
(2)

December 31, 2020 Cumulative Rate Gap (1)


(Dollars in thousands)


Less

Than

1 Year


More

Than

1 and Less

Than 2

Years


More

Than 2

and Less

Than 3

Years


More

Than 3

and Less

Than 4

Years


More

Than 4

and Less

Than 5

Years


More

Than

5 and Less

Than 6

Years


Thereafter


Total


Earning assets


Floating-rate


$

58,977


$


$


$


$


$


$


$

58,977


Adjustable rate


6,523


8,258


1,845


40


26


16,692


Fixed-rate


26,845


37,141


44,606


53,989


56,643


60,328


954,388


1,233,940


Cash


54,743


54,743


Total earning assets


$

147,088


$

45,399


$

46,451


$

54,029


$

56,643


$

60,354


$

954,388


$

1,364,352


Interest bearing liabilities


Deposits


$

393,835


$

241,605


$

190,387


$

120,040


$

121,955


$


$


$

1,067,822


Retail and privately placed notes


33,625


36,000


33,600


103,225


SBA debentures and borrowings


22,508


5,000


5,000


14,000


14,000


7,500


68,008


Preferred securities


33,000


33,000


Notes payable to banks


30,421


840


31,261


Other borrowings


500


7,442


747


8,689


Total liabilities


$

513,889


$

249,047


$

195,387


$

161,880


$

136,702


$

14,000


$

41,100


$

1,312,005


Interest rate gap


$

(366,801

)


$

(203,648

)


$

(148,936

)


$

(107,851

)


$

(80,059

)


$

46,354


$

913,288


$

52,347


Cumulative interest rate gap


$

(366,801

)


$

(570,449

)


$

(719,385

)


$

(827,236

)


$

(907,295

)


$

(860,941

)


$

52,347


$


December 31, 2019 (2)


$

(260,024

)


$

(500,953

)


$

(651,546

)


$

(689,819

)


$

(748,187

)


$

(706,935

)


$

83,402


$


December 31, 2018 (2)


$

(232,323

)


$

(409,272

)


$

(563,100

)


$

(638,264

)


$

(600,146

)


$

(554,335

)


$

59,833


$


Excludes federal funds sold and investment securities.

(1)

The ratio of the cumulative one year gap to total interest rate sensitive assets was (27%), as of December 31, 2020, and was (21%) as of December 31, 2019 and 2018.

(2)

Excludes federal funds sold and investment securities.

Our interest rate sensitive assets were $1,364,352,000$2.4 billion and interest rate sensitive liabilities were $1,312,005,000$2.1 billion at December 31, 2020.2023. The one-year cumulative interest rate gap was a negative $366,801,000$0.5 billion or 27%21% of interest rate sensitive assets. We seekactively monitor the level of exposure with the goal that movements in interest rates not adversely and unexpectedly negatively affect future earnings. We use net interest income sensitivity analysis as our primary metric to measure and manage the interest rate risk by originating adjustable-rate loans, by incurring fixed-rate indebtedness, by evaluating appropriate derivatives, pursuing securitization opportunities,sensitivities of our loan and by other options consistent with managing interest rate risk.investment securities portfolios.

With the cessation of LIBOR at the end of 2021, we are currently reviewing the impactterminated on our loans and borrowings.June 30, 2023. We dodid not have lendingsany loans tied to LIBOR. Our trust preferred securities bore a variable rate of interest of 90 day LIBOR and do not expectplus 2.13% until June 30, 2023. For these borrowings, the 90-day Secured Overnight Financing Rate (SOFR) adjusted by a significant impact on our loans. We expect to rely on our lenders to adjust and communicate rate adjustments, however, we do not expect a material impact on our borrowings.relevant spread adjustment of approximately 26 basis points has replaced the previous LIBOR-based rate.

Liquidity and Capital Resources

Our sources of liquidity are with a varietyinclude brokered certificates of localdeposit and regional banking institutions,other borrowings at the Bank, unfunded commitments to sell debentures to the SBA, loan amortization and prepayments, private and public issuances of debt securities, participations or sales of loans to third parties, issuances of preferred securities at our subsidiaries, and the disposition of our other assetsassets.

In December 2023, we completed a private placement to certain institutional investors of the Company, and dividends from Medallion Capital and$12.5 million aggregate principal amount of 9.00% unsecured senior notes due December 2033, with interest payable semiannually.

In September 2023, we completed a private placement to certain institutional investors of $39.0 million aggregate principal amount of 9.25% unsecured senior notes due September 2028, with interest payable semiannually.

In April 2023, the Bank began to originate retail savings deposits through a third-party service provider and, are subject to compliance with regulatory ratios.as of December 31, 2023, the Bank had $18.0 million in retail savings deposit balances.

In March 2023, the Bank established a discount window line of credit at the Federal Reserve. As of December 31, 2020, we had unfunded commitments from the SBA of $25,000,000.

Additionally,2023, the Bank has accesshad approximately $38.0 million in investment securities pledged as collateral to independent sourcesthe Federal Reserve. The current advance rate on the pledged securities is 100% of fundsfair value, for our business originated at the Bank, primarily through brokered certificatesa total of deposit. approximately $38.0 million in secured borrowing capacity, of which none was utilized as of December 31, 2023.

The Bank has $45,000,000 available under federal funds linesborrowing arrangements with several commercial banks. These agreements are accommodations that can be terminated at any time, for any reason and allow the Bank to borrow up to $75.0 million. As of December 31, 2023, nothing was outstanding on these lines.

54


In addition, on February 28, 2024, Medallion Capital accepted a commitment from the BankSBA for $18.5 million in debenture financing with a ten-year term. Medallion Capital can retain earningsdraw funds under the commitment, in its businesswhole or in part, until September 30, 2028. In connection with the commitment, Medallion Capital paid the SBA a leverage fee of $0.2 million, with the remaining $0.4 million of the fee to fund future growth.be paid pro rata as Medallion Capital draws under the commitment.

In February 2021, we completed a private placement to certain institutional investors of $25,000,000$25.0 million aggregate principal amount of 7.25% unsecured senior notes due February 2026, with interest payable semiannually. A follow-on offeringFollow-on offerings of these notes in March and April 2021 raised an additional $3,250,000.$3.3 million and $3.0 million.


In December 2020, we completed a private placement to certain institutional investors of $33,600,000$33.6 million aggregate principal amount of 7.50% unsecured senior notes due December 2027, with interest payable semiannually. A follow-on offeringFollow-on offerings of these notes in both February and March 2021 raised an additional $8,500,000.

The net proceeds from the December 2020 and February 2021 private placements will be used for general corporate purposes, including repayment of outstanding debt such as the maturing 9.00% retail notes in$8.5 million. In April 2021, we raised an additional $11.7 million in a follow-on offering, and may also be used to pay down other borrowings outstanding, possibly including some borrowings at a discount.repaid substantially all of our remaining bank borrowings.

In December 2019, the Bank closed an initial public offering of $46,000,000 aggregate liquidation amount, yielding net proceeds of $42,485,000,1,840,000 shares of its Fixed-to-Floating Rate Non-Cumulative Perpetual Preferred Stock, Series F.F, with a $46.0 million aggregate liquidation amount, yielding net proceeds of $42.5 million, which were recorded in the Bank’s shareholders’ equity. Dividends are payable quarterly from the date of issuance to, but excluding April 1, 2025, at a rate of 8% per annum, and from and including April 1, 2025, at a floating rate equal to a benchmark rate (which is expected to be three-monthbased on the Secured Overnight Financing Rate, or SOFR, and is expected to be three-month Term SOFR) plus a spread of 6.46% per annum.

InThe net proceeds from the December 2020, February 2021, March 2019, we completed2021, April 2021, September 2023, and December 2023 private placements were used for general corporate purposes, including repayment of our 9.00% retail notes at maturity in April 2021 and to pay down other borrowings, including some borrowings at a private placementdiscount, and to certain institutional investorsrepurchase and cancel $33.0 million of $30,000,000 aggregate principal amount ofour 8.25% unsecured senior notes due 2024, with interest payable semiannually. A follow-on offering of these notes in the 2019 third quarter raised an additional $6,000,000.March 2024.

The table below presents the components of our debt were as follows atof December 31, 2020,2023, exclusive of deferred financing costs of $5,805,000.$8.5 million. See Note 65 to the consolidated financial statements for details of the contractual terms of our borrowings.

(Dollars in thousands)


Balance


Percentage


Rate (1)


Deposits (2)


$

1,869,439


88

%


3.07

%

Retail and privately placed notes


139,500


7


8.08


SBA debentures and borrowings


75,250


3


3.69


Trust preferred securities


33,000


2


7.75


Total outstanding debt


$

2,117,189


100

%


3.50

%

(Dollars in thousands)


Balance


Percentage


Rate (1)


Deposits (2)


$

1,068,072


81

%


1.71

%

Retail and privately placed notes


103,225


8


8.25


SBA debentures and borrowings


68,008


5


3.36


Preferred securities


33,000


3


2.35


Notes payable to banks


31,261


2


3.67


Other borrowings


8,689


1


1.91


Total outstanding debt


$

1,312,255


100

%


2.37

%

(1)

(1)

Weighted average contractual rate as of December 31, 2020.

(2)

Balance includes $250 of strategic partner reserve deposits as of December 31, 2020.

We have employment agreements with certain key officers for either one-, two- or five-year terms. They all expire at various dates through 2025, with payments under these agreements of approximately $12,056,000 as of December 31, 2020.

2023.
(2)
Balance includes $1.5 million of strategic partner reserve deposits as of December 31, 2023.

Our contractual obligations expire on or mature at various dates through September 2037. The following table shows allour contractual obligations at December 31, 2020, but does not reflect the additional notes issued in February 2021,2023.


Payments due by period


(Dollars in thousands)


Less than
1 year


1 – 2
years


2 – 3
years


3 – 4
years


4 – 5
years


More than
5 years


Total (1)


Borrowings


Deposits (2)


$

678,846


$

533,405


$

325,498


$

184,458


$

147,232


$


$

1,869,439


Retail and privately placed notes


3,000


31,250


53,750


39,000


12,500


139,500


SBA debentures and borrowings


5,000


14,000


14,000


2,000


1,250


39,000


75,250


Trust preferred securities


33,000


33,000


Total outstanding borrowings


686,846


547,405


370,748


240,208


187,482


84,500


2,117,189


Operating lease obligations


2,536


2,546


2,567


1,342


573


1,139


10,703


Total contractual obligations


$

689,382


$

549,951


$

373,315


$

241,550


$

188,055


$

85,639


$

2,127,892


(1)
Total debt is exclusive of deferred financing costs of $8.5 million.
(2)
Balance excludes $1.5 million of strategic partner reserve deposits as described above.


Payments due by period


(Dollars in thousands)


Less than

1 year


1 – 2 years


2 – 3 years


3 – 4 years


4 – 5 years


More than

5 years


Total (1)


Deposits (2)


$

393,835


$

241,605


$

190,387


$

120,040


$

121,955


$


$

1,067,822


Retail and privately placed notes


33,625


36,000


33,600


103,225


SBA debentures and borrowings


22,508


5,000


5,000


14,000


21,500


68,008


Preferred securities


33,000


33,000


Notes payable to banks


30,701


280


280


31,261


Other borrowings


500


7,442


747


8,689


Operating lease obligations


2,474


2,406


2,356


2,373


2,390


3,521


15,520


Total


$

483,643


$

251,733


$

198,023


$

163,413


$

139,092


$

91,621


$

1,327,525


of December 31, 2023.

(1)

Total debt is exclusive of deferred financing costs of $5,805.

(2)

Balance excludes $250 of strategic reserve deposits as of December 31, 2020.

Approximately $730,000,000$1.2 billion of our borrowing relationshipsborrowings have maturity dates during 2021 through 2022, including almost $635,000,000the next two years, a vast majority of which are brokered CD’s. Wecertificates of deposit that have been in active and ongoing discussions with eachno right of these lenders and, to date, have


extended each of the facilities as they matured. We have arranged for changes to the terms of the notes and payment and borrowing base calculations which we anticipate will facilitate our operations for the foreseeable future. As a result of the cash flow shortages due to the slowdown in the taxi industry resulting from the COVID-19 pandemic, we received 180 day payment deferrals that terminated in August and modifications to provide for interest only payments through the end of 2020 for the notes payable to banks.voluntary withdrawal.

On July 16, 2019, we paid $10,819,000 at maturity in satisfaction of all our outstanding obligations under one of our credit facilities. In connection with this payment, we obtained a waiver from one of our other lenders, with a term note of $1,839,000, of certain resulting repayment and other obligations, which waiver expires on June 15, 2021.

In addition, the illiquidity of portions of our loan portfolio and investments may adversely affect our ability to dispose of them at times when it may be advantageous for us to liquidate such portfolio or investments. In addition, if we were required to liquidate some or all of our portfolio, the proceeds of such liquidation may be significantly less than the current value of such investments. Because we borrow money to make loans and investments, our net operating income is dependent upon the difference between the rate at which we borrow funds and the rate at which we invest these funds. As a result, there can be no assurance that a significant change in market interest rates will not have a material adverse effect on our interest income. In periods of sharply rising interest rates, our cost of funds would increase, which would reduce our net interest income.

55


We use a combination of long-term and short-term borrowings and equity capital to finance our lending and investing activities. Our long-term fixed-rate loans and investments are financed primarily with short-term floating-rate debt, and to a lesser extent by term fixed-rate debt. We may use interest rate risk management techniques in an effort to limit our exposure to interest rate fluctuations. We have analyzed the potential impact of changes in interest rates on net interest income. Assuming that the balance sheet were to remain constant and no actions were taken to alter the existing interest rate sensitivity a hypothetical immediate 1% increase in interest rates would result in an increase to net income as of December 31, 20202023 by $1,183,000$1.6 million on an annualized basis, and the impact of such an immediate increase of 1% over a one year period would have been ($1,763,000)a reduction in net income by $1.9 million at December 31, 2020.2023. Although management believes that this measure is indicative of our sensitivity to interest rate changes, it does not adjust for potential changes in credit quality, size, and composition of the assets on the balance sheet, and other business developments that could affect net income from operations in a particular quarter or for the year taken as a whole. Accordingly, no assurances can be given that actual results would not differ materially from the potential outcome simulated by these estimates.

We continueFrom time to time, we work with investment banking firms and other financial intermediaries to investigate the viability of a number ofseveral other financing options which include, among others, the sale or spinoff of certain assets or divisions, the development of a securitization conduit program, and other independent financing for certain subsidiaries or asset classes. These financing options would also provide additional sources of funds for both external expansion and continuation of internal growth.

The following table illustrates sources of available funds for us and each of our subsidiaries, and amounts outstanding under credit facilities and their respective end of period weighted average interest rates at December 31, 2020.2023. See Note 65 to the consolidated financial statements for additional information about each credit facility.

(Dollars in thousands)


Medallion
Financial Corp.


MFC


MCI


FSVC


MB


December 31,
2023


December 31,
2022


Cash, cash equivalents and federal funds sold


$

30,946


$

242


$

6,057


 (2)

$

2,557


 (2)

$

110,043


$

149,845


$

105,598


Trust preferred securities


33,000


33,000


33,000


Average interest rate


7.75

%


7.75

%


6.86

%

Maturity


9/37


9/37


9/37


Retail notes and privately placed borrowings


139,500


139,500


121,000


Average interest rate


8.08

%


8.08

%


7.66

%

Maturity


3/24 - 12/33


3/24 - 12/33


3/24-12/27


SBA debentures & borrowings


Amounts available


10,250


10,250


4,750


Amounts outstanding


75,250


75,250


68,512


Average interest rate


3.69

%


3.69

%


3.08

%

Maturity


3/24 - 3/34


3/24 - 3/34


3/23 - 3/33


Brokered CDs


1,870,939


 (3)


1,870,939


1,610,922


Average interest rate


3.07

%


3.07

%


1.91

%

Maturity


1/24 - 12/28


1/24 - 12/28


1/23-12/27


Total cash


$

30,946


$

242


$

6,057


$

2,557


$

110,043


$

149,845


$

105,598


Total debt outstanding (1)


$

172,500


$


$

75,250


$


$

1,870,939


$

2,118,689


$

1,833,434


(1)
Excludes deferred financing costs of $8.5 million and $7.0 million as of December 31, 2023 and 2022.
(2)
Cash resides in the applicable SBIC and is generally not available for corporate use.
(3)
Balance includes $1.5 million of strategic partner reserve deposits and $8.7 million related to listing services.

(Dollars in thousands)


Medallion Financial Corp.


MB


MFC


MCI


FSVC


RPAC and

Other


December 31, 2020(1)


December 31, 2019(1)


Cash and cash equivalents


$

33,743


(2

)

$

58,877


$

4,261


$

10,674


$

69


$

4,416


$

112,040


$

67,821


Brokered CDs & other borrowed funds


1,068,072


1,068,072


954,245


Average interest rate


1.71

%


1.71

%


2.35

%

Maturity


1/21-12/25


1/21-12/25


1/20-9/24


Retail and privately placed notes


103,225


103,225


69,625


Average interest rate


8.25

%


8.25

%


8.61

%

Maturity


4/21-12/27


4/21-12/27


4/21-3/24


SBA debentures and

   borrowings


79,000


14,008


93,008


74,746


Amounts undisbursed


25,000


25,000


3,000


Amounts outstanding


54,000


14,008


68,008


71,746


Average interest rate


3.39

%


3.25

%


3.36

%


3.42

%

Maturity


3/21- 9/30


4/21


3/21-9/30


2/20-3/29


Bank loans


19,734


11,527


31,261


33,183


Average interest rate


3.75

%


3.54

%


3.67

%


4.11

%

Maturity


2/21-9/21


2/21 - 12/23


2/21-12/23


9/20-12/23


Preferred securities


33,000


33,000


33,000


Average interest rate


2.35

%


2.35

%


4.01

%

Maturity


9/37


9/37


9/37


Other borrowings


8,689


8,689


7,794


Average interest rate


1.91

%


1.91

%


2.00

%

Maturity


12/21 -  6/25


12/21 -  6/25


3/20-12/20


Total cash


$

33,743


$

58,877


$

4,261


$

10,674


$

69


$

4,416


$

112,040


$

67,821


Total debt outstanding


$

155,959


$

1,068,072


$

11,527


$

54,000


$

14,008


$

8,689


$

1,312,255


$

1,169,593


(1)

Total debt is exclusive of deferred financing costs of $5,805 and $5,105 as of December 31, 2020 and 2019.

(2)

Includes $2,970 of an interest reserve associated with the 2019 private placement, which can be used for no other purpose for three years.

Loan amortization, prepayments, and sales also provide a source of funding for us. Prepayments on loans are influenced significantly by general interest rates, taxi medallion loan market values, economic conditions, and competition.

We also generate liquidity through deposits generated at the Bank, borrowing arrangements with other banks, andthe offering of privately placed notes, through the issuance of SBA debentures, through our trust preferred securities, and through preferred securities at our subsidiaries and have utilized borrowing arrangements with other banks in the past, as well as from cash flow from operations. In addition, we may choose to participate a greater portion of our loan portfolio to third parties. We are actively seekingregularly seek additional sources of liquidity; however, given current market conditions, there can be no assurance that we will be able to secure additional liquidity on terms favorable to us or at all. If that occurs, we may decline to underwrite lower yielding loans in order to conserve capital until credit conditions in the market become more favorable; or we may be required to dispose of assets when we would not otherwise do so, and at prices which may be below the net book value of such assets in order for us to repay indebtedness on a timely basisbasis..

56


Recently Issued Accounting Standards

In June 2016, the FASB issued ASUOn January 1, 2023, we adopted Accounting Standards Update 2016-13, “Financial Instruments—"Financial Instruments – Credit Losses or Topic 326:(Topic 326): Measurement of Credit Losses on Financial Instruments.”Instruments", or ASC 326, which replaced the incurred loss methodology that delayed recognition until it was probable a loss had been incurred with a lifetime expected loss methodology using "reasonable and supportable" expectations about the future, referred to as the current expected credit loss, or CECL, methodology. For consumer loans, we use historical delinquency and actual loss rates modified by quantitative adjustments based on macroeconomic factors over a twelve-month reasonable and supportable forecast period. For commercial loans, we assess the historical impact that macroeconomic indicators have had on the loan portfolio, to determine an approximate allowance for credit loss. Unlike consumer loans, where loans may have similar performing characteristics, each commercial loan is unique. We evaluate each commercial loan for specific impairment with additional allowance for credit losses recognized as necessary. For taxi medallion loans, we maintain specific reserves adjusting the carrying amount of loans down to net collateral value. The allowance is evaluated on a quarterly basis by management based on the collectability of the loans in light of historical experience, the nature and size of the loan portfolio, adverse situations that may affect the borrowers' ability to repay, estimated value of any underlying collateral, prevailing economic conditions, and excess concentration risks. This evaluation is inherently subjective, as it requires estimates, including those based on changes in economic conditions, that are susceptible to significant revision as more information becomes available. Credit losses are deducted from the allowance, and subsequent recoveries are added back to the allowance.

We adopted ASC 326 using the modified retrospective method for all financial assets measured at amortized cost and off-balance-sheet credit exposures. Results for reporting periods beginning after December 15, 2022 are presented under ASC 326. The transition to the CECL methodology on January 1, 2023 resulted in an increase of $13.7 million to our allowance for credit losses on loans (“ACL”) and a net-of-tax cumulative-effect adjustment of $9.9 million to the beginning balance of retained earnings. The CECL methodology transition effects on the allowance for credit losses are shown in the following table:

(Dollars in thousands)


December 31, 2022
Pre-Topic 326
Adoption


Effect of ASC 326
Adoption
(Transition Amounts)


January 1, 2023
Post-ASC 326
Adoption


Assets:


Loans:


Recreation


$

41,966


$

10,037


$

52,003


Home improvement


11,340


1,518


12,858


Commercial


1,049


2,157


3,206


Taxi medallion


9,490


9,490


Strategic partnership


Allowance for credit losses on loans


$

63,845


$

13,712


$

77,557


Prior to January 1, 2023, we used historical delinquency and actual loss rates with a three-year look-back period for taxi medallion loans and a one-year look-back period for recreation and home improvement loans and used historical loss experience and other projections for commercial loans. The allowance was evaluated on a quarterly basis by management based on the collectability of the loans in light of historical experience, the nature and size of the loan portfolio, adverse situations that may affect the borrowers' ability to repay, estimated value of any underlying collateral, prevailing economic conditions, and excess concentration risks. This evaluation was inherently subjective, as it required estimates that were susceptible to significant revision as more information became available.

In March 2023, the FASB issued ASU 2023-02, Investments - Equity Method and Joint Ventures, or Topic 323: Accounting for Investments in Tax Credit Structures Using the Proportional Amortization Method. The main objective of this new standard is to provide financial statement users with more decision-useful information aboutallow reporting entities to consistently account for equity investments made primarily for the expected credit losses on financial assetspurpose of receiving income tax credits and other commitments to extend credit held by a reporting entity at each reporting date. Under the new standard, the concepts used by entities to account for credit losses on financial instruments will fundamentally change.income tax benefits. The existing “probable” and ��incurred” loss recognition threshold is removed. Loss estimatesamendments in this update are based upon lifetime “expected” credit losses. The use of past and current events must now be supplemented with “reasonable and supportable” expectations about the future to determine the amount of credit loss. The collective changes to the recognition and measurement accounting standards for financial instruments and their anticipated impact on the allowance for credit losses modeling have been universally referred to as the CECL (current expected credit loss) model. ASU 2016-13 applies to all entities and is effective for fiscal years beginning after December 15, 2019 for public entities, with early adoption permitted. In November 2019 the FASB issued ASU 2019-10 to defer implementation of the standard for smaller reporting companies, such as us, to fiscal years


beginning after December 15, 2022.2023. We are assessing the impact of the update will have on ourthe accompanying financial statements,statements.

In October 2023, the FASB issued ASU 2023-06, Disclosure Improvements. The amendments in this update seek to clarify or improve disclosure and expectpresentation requirements. We are assessing the impact of the update on the accompanying financial statements.

In November 2023, the FASB issued ASU 2023-07, Segment Reporting, or Topic 280: Improvements to have a materialReportable Segment Disclosures. The main objective of this update is to provide transparency about income tax information through improvements to income tax disclosures primarily related to the rate reconciliation and income taxes paid information. The amendments in this update are effective for fiscal years beginning after December 15, 2023. We are assessing the impact of the update on our accounting for estimated credit losses on our loans.the accompanying financial statements.

57


In December 2023, the FASB issued ASU 2023-09, Income Taxes, or Topic 740: Improvements to Income Tax Disclosures. The main objective of this update is to improve financial reporting disclosure of incremental segment information on an annual and interim basis for all public entities to enable investors to develop more decision-useful financial analyses. The amendments in this update are effective for the annual periods beginning after December 15, 2024. We are assessing the impact of the update on the accompanying financial statements.

ITEM 7A. QUANTITATIVE AND QUALITATIVE DISCLOSURES ABOUT MARKET RISK

ITEM 7A.

QUANTITATIVE AND QUALITATIVE DISCLOSURES ABOUT MARKET RISK

Our business activities contain elements of risk. We consider the principal types of risk to be fluctuations in interest rates and portfolio valuations. We consider the management of risk essential to conducting our businesses. Accordingly, our risk management systems and procedures are designed to identify and analyze our risks, to set appropriate policies and limits, and to continually monitor these risks and limits by means of reliable administrative and information systems and other policies and programs.

In addition, the illiquidity of portions of our loan portfolio and investments may adversely affect our ability to dispose of them at times when it may be advantageous for us to liquidate such portfolio or investments. In addition, if we were required to liquidate some or all of our portfolio, the proceeds of such liquidation may be significantly less than the current value of such investments. Because we borrow money to make loans and investments, our net operating income is dependent upon the difference between the rate at which we borrow funds and the rate at which we invest these funds. As a result, there can be no assurance that a significant change in market interest rates will not have a material adverse effect on our interest income. In periods of sharply rising interest rates, our cost of funds would increase, which would reduce our net interest income. We use a combination of long-term and short-term borrowings and equity capital to finance our investing activities. Our long-term fixed-rate investments are financed primarily with short-term floating-ratelong-term fixed-rate debt, and to a lesser extent by term fixed-ratefloating-rate debt. We may use interest rate risk management techniques in an effort to limit our exposure to interest rate fluctuations. We have analyzed the potential impact of changes in interest rates on net interest income. Assuming that the balance sheet were to remain constant and no actions were taken to alter the existing interest rate sensitivity a hypothetical immediate 1% increase in interest rates would result in an increase to net income as of December 31, 20202023 by $1,183,000$1.6 million on an annualized basis, and the impact of such an immediate increase of 1% over a one year period would have been ($1,763,000)a reduction in net income by $1.9 million at December 31, 2020.2023. Although management believes that this measure is indicative of our sensitivity to interest rate changes, it does not adjust for potential changes in credit quality, size, and composition of the assets on the balance sheet, and other business developments that could affect net income from operations in a particular quarter or for the year taken as a whole. Accordingly, no assurances can be given that actual results would not differ materially from the potential outcome simulated by these estimates.

ITEM 8. FINANCIAL STATEMENTS AND SUPPLEMENTARY DATA

ITEM 8.

FINANCIAL STATEMENTS AND SUPPLEMENTARY DATA

Reference is made to the financial statements set forth under Item 15 (A) (1) in this Annual Report on Form 10-K, which financial statements are incorporated herein by reference in response to this Item 8.

ITEM 9. CHANGES IN AND DISAGREEMENTS WITH ACCOUNTANTS ON ACCOUNTING AND FINANCIAL DISCLOSURE

None.

ITEM 9A. CONTROLS AND PROCEDURES

ITEM 9.

CHANGES IN AND DISAGREEMENTS WITH ACCOUNTANTS ON ACCOUNTING AND FINANCIAL DISCLOSURE

None.

ITEM 9A.

CONTROLS AND PROCEDURES

Evaluation of Disclosure Controls and Procedures

Our Chief Executive Officer and Chief Financial Officer have evaluated the effectiveness of our disclosure controls and procedures pursuant to Rules 13a—15(e) and 15d – 15(e) under the Securities Exchange Act of 1934, and have concluded that they are effective as of December 31, 20202023 to provide reasonable assurance that information required to be disclosed by the Company in reports that it files or submits under the Exchange Act is (i) recorded, processed, summarized, and reported within the time periods specified in the SEC rules and forms and (ii) accumulated and communicated to the Company’s management, including its Chief Executive Officer and Chief Financial Officer, as appropriate, to allow timely decisions regarding required disclosures.


58


Management’s Annual Report on Internal Control over Financial Reporting

Our management is responsible for establishing and maintaining adequate internal control over financial reporting. Internal control over financial reporting is defined in Rule 13a-15(f) and 15d-15(f) promulgated under the Exchange Act as a process designed by, or under the supervision of, our principal executive and principal financial officers and effected by our Board of Directors, management, and other personnel, to provide reasonable assurance regarding the reliability of financial reporting and the preparation of financial statements for external purposes in accordance with generally accepted accounting principles, and includes those policies and procedures that:

Pertain to the maintenance of records that in reasonable detail accurately and fairly reflect the transactions and dispositions of our assets;
Provide reasonable assurance that transactions are recorded as necessary to permit preparation of financial statements in accordance with generally accepted accounting principles, and that our receipts and expenditures are being made only in accordance with authorizations of our management and directors; and
Provide reasonable assurance regarding prevention or timely detection of unauthorized acquisition, use, or disposition of our assets that could have a material effect on the financial statements.

Pertain to the maintenance of records that in reasonable detail accurately and fairly reflect the transactions and dispositions of our assets;

Provide reasonable assurance that transactions are recorded as necessary to permit preparation of financial statements in accordance with generally accepted accounting principles, and that our receipts and expenditures are being made only in accordance with authorizations of our management and directors; and

Provide reasonable assurance regarding prevention or timely detection of unauthorized acquisition, use, or disposition of our assets that could have a material effect on the financial statements.

Because of its inherent limitations, internal control over financial reporting may not prevent or detect misstatements. Projections of any evaluation of effectiveness to future periods are subject to the risk that controls may become inadequate because of changes in conditions, or that the degree of compliance with the policies or procedures may deteriorate.

Our management assessed the effectiveness of our internal control over financial reporting as of December 31, 2020.2023. In making this assessment, management used the criteria set forth by the Committee of Sponsoring Organizations of the Treadway Commission, or COSO, in Internal Control-Integrated Framework (2013). Based on its assessment and those criteria, management believes that we maintained effective internal control over financial reporting as of December 31, 2020.2023.

We believe that the consolidated financial statements included in this report fairly represent our consolidated financial position and consolidated results of operations for all periods presented.

Our Independent Registered Public Accounting Firm, Mazars USA LLP, has audited and issued a report on management’s assessment of our internal control over financial reporting. The report of Mazars USA LLP appears below.

Changes in Internal Control over Financial Reporting

As required by Rule 13a-15(d) under the Exchange Act, our management, including our Chief Executive Officer and Chief Financial Officer, have evaluated our internal control over financial reporting to determine whether any changes occurred during the 20202023 fourth quarter that have materially affected, or are reasonably likely to materially affect, our internal control over financial reporting, and have concluded that there have been no changes that occurred during the 20202023 fourth quarter that have materially affected, or are reasonably likely to materially affect, our internal control over financial reporting.


59


Report of Independent Registered Public Accounting Firm

To the Stockholders and Board of Directors of Medallion Financial Corp.

Opinion on Internal Control over Financial Reporting

We have audited Medallion Financial Corp. and subsidiaries’ (the “Company’s”) internal control over financial reporting as of December 31, 2020, 2023,based on criteria established in Internal Control – Integrated Framework: (2013) issued by the Committee of Sponsoring Organizations of the Treadway Commission (“COSO”). In our opinion, the Company maintained, in all material respects, effective internal control over financial reporting as of December 31, 2020,2023, based on criteria established in Internal Control – Integrated Framework: (2013) issued by COSO.

We also have audited,in accordance with the standards of the Public Company Accounting Oversight Board (United States) (“PCAOB”), the consolidated balance sheets of Medallion Financial Corp. and subsidiaries (the “Company”) as of December 31, 20202023 and 20192022 and the related consolidated statements of operations, other comprehensive income (loss), changes in stockholders’ equity, and changes in net assets, and cash flows for each of the three years in the three-yearthree year period ended December 31, 2020, and selected financial ratios and other data (see note 14) for the year ended December 31, 2018 of the Company,2023, and our report dated March 15, 20217, 2024 expressed an unqualified opinion.

Basis for Opinion

The Company’s management is responsible for maintaining effective internal control over financial reporting and for its assessment of the effectiveness of internal control over financial reporting,included in the accompanying Management’s Annual Report on Internal Control over Financial Reporting. Our responsibility is to express an opinion on the Company’s internal control over financial reporting based on our audit. We are a public accounting firm registered with the PCAOB and are required to be independent with respect to the Company in accordance with the U.S. federal securities laws and the applicable rules and regulations of the Securities and Exchange Commission and the PCAOB.

We conducted our audit in accordance with the standards of the PCAOB. Those standards require that we plan and perform the audit to obtain reasonable assurance about whether effective internal control over financial reporting was maintained in all material respects. Ourrespects.Our audit of internal control over financial reporting included obtaining an understanding of internal control over financial reporting, assessing the risk that a material weakness exists, and testing and evaluating the design and operating effectiveness of internal control based on the assessed risk. Our audit also included performing such other procedures as we considered necessary in the circumstances. We believe that our audit provides a reasonable basis for our opinion.

Definition and Limitations of Internal Control over Financial Reporting

A company’s internal control over financial reporting is a process designed to provide reasonable assurance regarding the reliability of financial reporting and the preparation of financial statements for external purposes in accordance with generally accepted accounting principles. A company’s internal control over financial reporting includes those policies and procedures that (1) pertain to the maintenance of records that, in reasonable detail, accurately and fairly reflect the transactions and dispositions of the assets of the company; (2) provide reasonable assurance that transactions are recorded as necessary to permit preparation of financial statements in accordance with generally accepted accounting principles, and that receipts and expenditures of the company are being made only in accordance with authorizations of management and directors of the company; and (3) provide reasonable assurance regarding prevention or timely detection of unauthorized acquisition, use, or disposition of the company’s assets that could have a material effect on the financial statements.

Because of its inherent limitations, internal control over financial reporting may not prevent or detect misstatements. Also, projections of any evaluation of effectiveness to future periods are subject to the risk that controls may become inadequate because of changes in conditions, or that the degree of compliance with the policies and procedures may deteriorate.

/s/ Mazars USA LLP

Edison, New JerseyYork, New York

March 15, 20217, 2024


60


ITEM 9B. OTHER INFORMATION

None of our directors or officers adopted, modified or terminated a Rule 10b5-1 trading arrangement or a non-Rule 10b5-1 trading arrangement during our fiscal quarter ended December 31, 2023, as such terms are defined under Item 408(a) of Regulation S-K.

ITEM 9C. DISCLOSURE REGARDING FOREIGN JURISDICTIONS THAT PREVENT INSPECTIONS

Not applicable.

ITEM 9B.

OTHER INFORMATION

None.

PART III

ITEM 10. DIRECTORS, EXECUTIVE OFFICERS AND CORPORATE GOVERNANCE

ITEM 10.

DIRECTORS, EXECUTIVE OFFICERS AND CORPORATE GOVERNANCE

Incorporated by reference from our Definitive Proxy Statement expected to be filed by April 30, 202129, 2024 for our fiscal year 20212024 Annual Meeting of Shareholders under the captions “Proposal No. 1 Election of Class I Directors", “Our Directors and Executive Officers,”Officers", “Corporate Governance,”Governance”, and “Section 16(a) Beneficial Ownership Reporting Compliance.”"Executive Compensation".

ITEM 11. EXECUTIVE COMPENSATION

ITEM 11.

EXECUTIVE COMPENSATION

Incorporated by reference from our Definitive Proxy Statement expected to be filed by April 30, 202129, 2024 for our fiscal year 20212024 Annual Meeting of Shareholders under the captions “Corporate Governance,”Governance”, “Executive Compensation”, "Director Compensation", and “Compensation Committee Interlocks and Insider Participation.”

ITEM 12. SECURITY OWNERSHIP OF CERTAIN BENEFICIAL OWNERS AND MANAGEMENT AND RELATED STOCKHOLDER MATTERS

ITEM 12.

SECURITY OWNERSHIP OF CERTAIN BENEFICIAL OWNERS AND MANAGEMENT AND RELATED STOCKHOLDER MATTERS

Incorporated by reference from our Definitive Proxy Statement expected to be filed by April 30, 202129, 2024 for our fiscal year 20212024 Annual Meeting of Shareholders under the captions “Stock Ownership of Certain Beneficial Owners and Management” and “Equity Compensation Plan Information.”

ITEM 13.

Incorporated by reference from our Definitive Proxy Statement expected to be filed by April 30, 202129, 2024 for our fiscal year 20212024 Annual Meeting of Shareholders under the captions “Certain Relationships and Related Party Transactions”, “Our Directors and Executive Officers,” and “Corporate Governance.”

ITEM 14. PRINCIPAL ACCOUNTANT FEES AND SERVICES

ITEM 14.

PRINCIPAL ACCOUNTANT FEES AND SERVICES

Incorporated by reference from our Definitive Proxy Statement expected to be filed by April 30, 202129, 2024 for our fiscal year 20212024 Annual Meeting of Shareholders under the caption “Principal Accountant Fees and Services.”

61


PART IV

ITEM 15. EXHIBITS AND FINANCIAL STATEMENT SCHEDULES

ITEM 15.

EXHIBITS AND FINANCIAL STATEMENT SCHEDULES

(A) 1. FINANCIAL STATEMENTS

The consolidated financial statements of Medallion Financial Corp. and the Report of Independent Public Accountants thereon are included as set forth on the Index to Financial Statements on F-1.

2. FINANCIAL STATEMENT SCHEDULES

See Index to Financial Statements on F-1.


3. EXHIBITS

Number

Description

3.1(a)

Restated Medallion Financial Corp. Certificate of Incorporation. Filed as Exhibit 3.1 to the Annual Report on Form 10-K for the fiscal year ended December 31, 1996 (File No. 000-27812) and incorporated by reference herein.

3.1(b)

Amendment to Restated Certificate of Incorporation. Filed as Exhibit 3.1.1 to the Quarterly Report on Form 10-Q for the quarterly period ended June 30, 1998 (File No.000-27812) and incorporated by reference herein.

3.2

Second Amended and Restated By-Laws of Medallion Financial Corp., as amended and restated as of May 1, 2022. Filed as Exhibit 3.1 to the Current Report on Form 8-K filed on April 27, 2018May 2, 2022 (File No. 001-37747) and incorporated by reference herein.

4.1

Description of Registered Securities of Medallion Financial Corp. Filed as Exhibit 4.1 to the Annual Report on Form 10-K for the fiscal year ended December 31, 2019, as amended by Amendment No. 1 thereto filed on June 5, 20202022 (File No. 001-37747) and incorporated by reference herein.

4.2

Fixed/Floating Rate Junior Subordinated Note, dated June 7, 2007, by Medallion Financial Corp., in favor of Medallion Financing Trust I. Filed as Exhibit 4.1 to the Current Report on Form 8-K filed on June 11, 2007 (File No. 814-00188) and incorporated by reference herein.

4.3

Indenture, dated April 15, 2016, between Medallion Financial Corp. and Wilmington Trust, National Association. Filed as Exhibit d.6 to the Registration Statement on Form N-2 filed on April 15, 2016 (File No. 333-206692) and incorporated by reference herein.

4.4

First Supplemental Indenture, dated April 15, 2016, between Medallion Financial Corp. and Wilmington Trust, National Association. Filed as Exhibit d.7 to the Registration Statement on Form N-2 filed on April 15, 2016 (File No. 333-206692) and incorporated by reference herein.4.3

4.5

Note, effective March 1, 2017, by Freshstart Venture Capital Corp., in favor of Small Business Administration. Filed as Exhibit 4.1 to the Current Report on Form 8-K filed on January 31, 2017 (File No. 814-00188) and incorporated by reference herein.

4.6

Amendment No. 1 to Note, dated and effective as of January 31, 2018, by and between U.S. Small Business Administration and Freshstart Venture Capital Corp. Filed as Exhibit 4.1 to the Current Report on Form 8-K filed on February 5, 2018 (File No. 814-00188) and incorporated by reference herein.

4.7

Amendment No. 2 to Note, dated and effective as of January 31, 2019, by and between U.S. Small Business Administration and Freshstart Venture Capital Corp. Filed as Exhibit 4.1 to the Current Report on Form 8-K filed on February 1, 2019 (File No. 001-33747) and incorporated by reference herein.

4.8

Amendment No. 3 to Note, dated and effective as of February 15, 2019, by and between U.S. Small Business Administration and Freshstart Venture Capital Corp. Filed as Exhibit 4.1 to the Current Report on Form 8-K filed on February 21, 2019 (File No. 001-37747) and incorporated by reference herein.

4.9

Amendment No. 4 to Note, dated and effective as of March 14, 2019, by and between U.S. Small Business Administration and Freshstart Venture Capital Corp. Filed as Exhibit 4.1 to the Current Report on Form 8-K filed on March 15, 2019 (File No. 001-37747) and incorporated by reference herein.

4.10

Amendment No. 5 to Note, dated and effective as of March 27, 2019, by and between U.S. Small Business Administration and Freshstart Venture Capital Corp. Filed as Exhibit 4.1 to the Current Report on Form 8-K filed on March 29, 2019 (File No. 001-37747) and incorporated by reference herein.

4.11

Amendment No. 6 to Note, dated and effective as of January 30, 2020, by and between U.S. Small Business Administration and Freshstart Venture Capital Corp. Filed as Exhibit 4.1 to the Current Report on Form 8-K filed on February 3, 2020 (File No. 001-37747) and incorporated by reference herein.

4.12

Amendment No. 7 to Note, dated and effective as of March 27, 2020, by and between U.S. Small Business Administration and Freshstart Venture Capital Corp. Filed as Exhibit 4.11 to the Annual Report on Form 10-K for fiscal year ended December 31, 2019 (File No. 001-37747) and incorporated by reference herein.

4.13

Amendment No. 8 to Note, dated and effective as of June 1, 2020, by and between U.S. Small Business Administration and Freshstart Venture Capital Corp. Filed as Exhibit 4.1 to the Current Report on Form 8-K filed on June 4, 2020 (File No. 001-37747) and incorporated by reference herein.

4.14

Amendment No. 9 to Note, dated and effective as of September 1, 2020, by and between U.S. Small Business Administration and Freshstart Venture Capital Corp. Filed as Exhibit 4.1 to the Current Report on Form 8-K filed on September 3, 2020 (File No. 001-37747) and incorporated by reference herein.

4.15

Amendment No. 10 to Note, dated and effective as of September 14, 2020, by and between U.S. Small Business Administration and Freshstart Venture Capital Corp. Filed as Exhibit 4.1 to the Current Report on Form 8-K filed on September 15, 2020 (File No. 001-37747) and incorporated by reference herein.

4.16

Amendment No. 11 to Note, dated and effective as of September 23, 2020, by and between U.S. Small Business Administration and Freshstart Venture Capital Corp. Filed as Exhibit 4.1 to the Current Report on Form 8-K filed on September 24, 2020 (File No. 001-37747) and incorporated by reference herein.

4.17

Form of Note Purchase Agreement, including the form of Note attached thereto. Filed as Exhibit 4.1 to the Current Report on Form 8-K filed on March 26, 2019 (File No. 001-37747) and incorporated by reference herein.

4.184.4

Form of Note Purchase Agreement, including the form of Note attached thereto. Filed as Exhibit 4.1 to the Current Report on Form 8-K filed on December 23, 2020 (File No. 001-37747) and incorporated by reference herein.

4.194.5

Form of Note Purchase Agreement, including the form of Note attached thereto. Filed as Exhibit 4.1 to the Current Report on Form 8-K filed on March 1, 20202021 (File No. 001-37747) and incorporated by reference herein.

4.6

Form of Note Purchase Agreement, including the form of Note attached thereto. Filed as Exhibit 4.1 to the Current Report on Form 8-K filed on October 2, 2023 (File No. 001-37747) and incorporated by reference herein.

4.7

Form of Note Purchase Agreement, including the form of Note attached thereto. Filed as Exhibit 4.1 to the Current Report on Form 8-K filed on December 28, 2023 (File No. 001-37747) and incorporated by reference herein.

10.1

First Amended and Restated Employment Agreement, between Medallion Financial Corp. and Alvin Murstein dated May 29, 1998. Filed as Exhibit 10.19 to the Annual Report on Form 10-K for the fiscal year ended December 31, 1998 (File No. 814-00188) and incorporated by reference herein.*

10.2

Amendment No. 1 to First Amended and Restated Employment Agreement, dated and effective as of April 27, 2017, by and between Medallion Financial Corp. and Alvin Murstein. Filed as Exhibit 10.1 to the Current Report on Form 8-K filed on May 3, 2017 (File No. 814-00188) and incorporated by reference herein.*

10.3

Amendment No. 2 to First Amended and Restated Employment Agreement, dated and effective as of December 22, 2017, by and between Medallion Financial Corp. and Alvin Murstein. Filed as Exhibit 10.3 to the Annual Report on Form 10-K for the fiscal year ended December 31, 2017 (File No. 814-00188) and incorporated by reference herein.*

62


10.4

First Amended and Restated Employment Agreement, between Medallion Financial Corp. and Andrew Murstein dated May 29, 1998. Filed as Exhibit 10.20 to the Annual Report on Form 10-K for the fiscal year ended December 31, 1998 (File No. 814-00188) and incorporated by reference herein.*

10.5

Amendment No. 1 to First Amended and Restated Employment Agreement, dated and effective as of April 27, 2017, by and between Medallion Financial Corp. and Andrew Murstein. Filed as Exhibit 10.2 to the Current Report on Form 8-K filed on May 3, 2017 (File No. 814-00188) and incorporated by reference herein.*

10.6

Amendment No. 2 to First Amended and Restated Employment Agreement, dated and effective as of December 22, 2017, by and between Medallion Financial Corp. and Andrew Murstein. Filed as Exhibit 10.6 to the Annual Report on Form 10-K for the fiscal year ended December 31, 2017 (File No. 814-00188) and incorporated by reference herein.*

10.7

Amendment No. 3 to First Amended and Restated Employment Agreement, dated April 27, 2023, by and between Medallion Financial Corp. and Andrew Murstein. Filed as Exhibit 10.1 to the Quarterly Report on Form 10-Q for the quarterly period ended March 31, 2023 (File No. 001-37747) and incorporated by reference herein.*

10.710.8

Employment Agreement, dated June 27, 2016, between Donald Poulton, Medallion Financial Corp. and Medallion Bank. Filed as Exhibit 10.2 to the Current Report on Form 8-K filed on June 30, 2016 (File No. 814-00188) and incorporated by reference herein.*

10.9

Amended and Restated Employment Agreement, dated June 13, 2022, by and between Anthony N. Cutrone and Medallion Financial Corp. Filed as Exhibit 10.1 to the Current Report on Form 8-K filed on June 15, 2022 (File No. 001-37747) and incorporated by reference herein.*

10.810.10

LetterAmended and Restated Employment Agreement, dated March 7, 2017,August 10, 2021, by and between David Justin Haley and Medallion Financial Corp. and Larry D. Hall.Medallion Bank. Filed as Exhibit 10.810.9 to the Annual Reportreport on Form 10-K for the fiscal year ended December 31, 20172022 (File No. 814-00188)001-37747) and incorporated by reference herein.*

10.9

2006 Employee Stock Option Plan. Filed as Exhibit II to our definitive proxy statement for our 2006 Annual Meeting of Shareholders filed on April 28, 2006 (File No. 814-00188) and incorporated by reference herein.*10.11

10.10

First Amended and Restated 2006 Non-Employee Director Stock Option Plan. Filed as Exhibit B to Amendment No. 3 to Form 40-APP filed on June 18, 2012 (File No. 812-13666) and incorporated by reference herein.*

10.11

2015 Employee Restricted Stock Plan. Filed as Exhibit B to Amendment No. 1 to Form 40-APP filed on December 11, 2015 (File No. 812-14433) and incorporated by reference herein.*

10.12

2015 Non-Employee Director Stock Option Plan. Filed as Exhibit B to Amendment No. 2 to Form 40-APP filed on January 14, 2016 (File No. 812-14458) and incorporated by reference herein.*

10.13

2018 Equity Incentive Plan. Filed as Annex A to our definitive proxy statement for our 2018 Annual Meeting of Shareholders filed on April 30, 2018 (File No. 001-37747) and incorporated by reference herein.*

10.14

Amendment to Medallion Financial Corp. 2018 Equity Incentive Plan. Filed as Annex A to our definitive proxy statement for our 2020 Annual Meeting of Shareholders filed on April 28, 2020 (File No. 001-37747) and incorporated by reference herein.*

10.15

Amendment No. 2 to Medallion Financial Corp. 2018 Equity Incentive Plan. Filed as Annex A to our definitive proxy statement for our 2022 Annual Meeting of Shareholders filed on May 2, 2022 (File No. 001-37747) and incorporated by reference herein.*

10.1510.16

Medallion Financial Corp. Annual Short Term Incentive Plan, adopted by the Board of Directors on June 1, 2022. Filed as Exhibit 10.1 to the Current Report on Form 8-K filed on June 7, 2022 (File No. 001-37747) and incorporated by reference herein.*

10.17

Form of Performance Stock Unit Notice and Agreement. Filed as Exhibit 10.2 to the Quarterly Report on Form 10-Q for the quarterly period ended September 30, 2022 (File No. 001-37747) and incorporated by reference herein.*

10.18

Indenture of Lease, dated October 31, 1997, by and between Sage Realty Corporation, as Agent and Landlord, and Medallion Financial Corp., as Tenant. Filed as Exhibit 10.64 to the Annual Report on Form 10-K for the fiscal year ended December 31, 1997 (File No. 812-09744) and incorporated by reference herein.

10.1610.19

First Amendment of Lease, dated September 6, 2005, by and between Medallion Financial Corp. and Sage Realty Corporation. Filed as Exhibit 10.1 to the Current Report on Form 8-K filed on September 12, 2005 (File No. 814-00188) and incorporated by reference herein.

63


10.1710.20

Second Amendment of Lease, dated August 5, 2015, by and between Sage Realty Corporation and Medallion Financial Corp. Filed as Exhibit 10.1 to the Current Report on Form 8-K filed on August 7, 2015 (File No. 814-00188) and incorporated by reference herein.

10.1810.21

Agreement of Lease, dated July 3, 2002, by and between B-LINE Holdings, L.C. and Medallion Bank. Filed as Exhibit 10.17 to the Annual Report on Form 10-K for the fiscal year ended December 31, 2018 (File No. 001-37747) and incorporated by reference herein.

10.1910.22

Amendment of Lease Agreement, dated October 29, 2004, by and between B-LINE Holdings, L.C. and Medallion Bank. Filed as Exhibit 10.18 to the Annual Report on Form 10-K for the fiscal year ended December 31, 2018 (File No. 001-37747) and incorporated by reference herein.

10.2010.23

Assignment of Lease, dated July 6, 2006, by and between Medallion Bank and Zerop Medical, LLC, and consented and agreed to by B-LINE Holdings, L.C. Filed as Exhibit 10.19 to the Annual Report on Form 10-K for the fiscal year ended December 31, 2018 (File No. 001-37747) and incorporated by reference herein.

10.2110.24

Second Amendment of Lease Agreement, dated January 9, 2007, by and between B-LINE Holdings, L.C. and Medallion Bank. Filed as Exhibit 10.20 to the Annual Report on Form 10-K for the fiscal year ended December 31, 2018 (File No. 001-37747) and incorporated by reference herein.

10.2210.25

Third Amendment of Lease Agreement, dated October 31, 2007, by and between B-LINE Holdings, L.C. and Medallion Bank. Filed as Exhibit 10.21 to the Annual Report on Form 10-K for the fiscal year ended December 31, 2018 (File No. 001-37747) and incorporated by reference herein.

10.2310.26

Third Amendment of Lease Agreement, dated November 15, 2011, by and between B-LINE Holdings, L.C. and Medallion Bank. Filed as Exhibit 10.22 to the Annual Report on Form 10-K for the fiscal year ended December 31, 2018 (File No. 001-37747) and incorporated by reference herein.

10.2410.27

Fourth Amendment of Lease Agreement, dated November 21, 2011, by and between B-LINE Holdings, L.C. and Medallion Bank. Filed as Exhibit 10.23 to the Annual Report on Form 10-K for the fiscal year ended December 31, 2018 (File No. 001-37747) and incorporated by reference herein.

10.2510.28

Fifth Amendment of Lease Agreement, dated November 26, 2012, by and between B-LINE Holdings, L.C. and Medallion Bank. Filed as Exhibit 10.24 to the Annual Report on Form 10-K for the fiscal year ended December 31, 2018 (File No. 001-37747) and incorporated by reference herein.

10.2610.29

Sixth Amendment of Lease Agreement, dated January 26, 2017, by and between Investment Property Group, LLC, as successor-in-interest to B-LINE Holdings, L.C., and Medallion Bank. Filed as Exhibit 10.25 to the Annual Report on Form 10-K for the fiscal year ended December 31, 2018 (File No. 001-37747) and incorporated by reference herein.

10.2710.30

Seventh Amendment of Lease Agreement, dated May 10, 2017, by and between Investment Property Group, LLC and Medallion Bank. Filed as Exhibit 10.26 to the Annual Report on Form 10-K for the fiscal year ended December 31, 2018 (File No. 001-37747) and incorporated by reference herein.

10.2810.31

Eighth Amendment of Lease Agreement, dated March 28, 2018, by and between Investment Property Group, LLC and Medallion Bank. Filed as Exhibit 10.27 to the Annual Report on Form 10-K for the fiscal year ended December 31, 2018 (File No. 001-37747) and incorporated by reference herein.

10.2910.32

Letter from Mountain High Real Estate Advisors, Inc. to Medallion Bank, dated July 23, 2018, regarding 8th Amendment Lease Commencement. Filed as Exhibit 10.28 to the Annual Report on Form 10-K for the fiscal year ended December 31, 2018 (File No. 001-37747) and incorporated by reference herein.

10.3010.33

Ninth Amendment to Agreement of Lease, dated August 19, 2019, by and between Investment Property Group, LLC and Medallion Bank. Filed as Exhibit 10.1 to the Current Report on Form 8-K filed on August 21, 2019 (File No. 001-37747) and incorporated by reference herein.

64


10.34

Tenth Amendment to Agreement of Lease, dated April 5, 2022, by and between Investment Property Group, LLC and Medallion Bank. Filed as Exhibit 10.34 to the Annual Report on Form 10-K for the fiscal year ended December 31, 2022 (File No. 001-37747) and incorporated by reference herein.

10.3110.35

Eleventh Amendment to Agreement of Lease, dated February 22, 2024, by and between Investment Property Group, LLC and Medallion Bank. Filed herewith.

10.36

Commitment Letter, dated July 31, 2020,February 28, 2024, by the Small Business Administration to Medallion Capital, Inc., accepted and agreed to by Medallion Capital, Inc. on August 3, 2020.February 28, 2024. Filed as Exhibit 10.1 to the Current Report on Form 8-K filed on August 3, 2020 (filedFebruary 29, 2024 (File No. 001-33747) and incorporated by reference herein.herein.

10.3210.37

Junior Subordinated Indenture, dated as of June 7, 2007, between Medallion Financing Trust I and Wilmington Trust Company as trustee. Filed as Exhibit 10.1 to the Current Report on Form 8-K filed on June 11, 2007 (File No. 814-00188) and incorporated by reference herein.

10.3310.38

Purchase Agreement, dated as of June 7, 2007, among Medallion Financial Corp., Medallion Financing Trust I, and Merrill Lynch International. Filed as Exhibit 10.3 to the Current Report on Form 8-K filed on June 11, 2007 (File No. 814-00188) and incorporated by reference herein.

10.34

Custodian Agreement, effective July 23, 2003, among Wells Fargo Bank Minnesota, National Association, as custodian, and Medallion Financial Corp., Medallion Funding Corp. and Freshstart Venture Capital Corp. Filed as Exhibit j.1 to the Registration Statement on Form N-2 filed on December 20, 2011 (File No. 333-178644) and incorporated by reference herein.

10.3510.39

LoanCooperation Agreement, effectivedated as of January 25, 2017,May 1, 2022, by and among U.S. Small Business Administration, Freshstart Venture Capital Corp. and Medallion Financial Corp., KORR Value L.P., KORR Acquisitions Group, Inc., Kenneth Orr, David Orr, and Jonathan Orr. Filed as Exhibit 10.1 to the Current Report on Form 8-K filed on January 31, 2017 (File No. 814-00188) and incorporated by reference herein.

10.36

Amendment No. 1 to Loan Agreement, dated as of October 20, 2017, by and between U.S. Small Business Administration and Freshstart Venture Capital Corp. Filed as Exhibit 10.1 to the Current Report on Form 8-K filed on October 26, 2017 (File No. 814-00188) and incorporated by reference herein.

10.37

Amendment No.May 2, to Loan Agreement, dated and effective as of January 31, 2018, by and between U.S. Small Business Administration and Freshstart Venture Capital Corp. Filed as Exhibit 10.1 to the Current Report on Form 8-K filed on February 5, 2018 (File No. 814-00188) and incorporated by reference herein.

10.38

Amendment No. 3 to Loan Agreement, dated and effective as of January 31, 2019, by and between U.S. Small Business Administration and Freshstart Venture Capital Corp. Filed as Exhibit 10.1 to the Current Report on Form 8-K filed on February 1, 20192022 (File No. 001-37747) and incorporated by reference herein.

10.3910.40

Amendment No. 4 to LoanCooperation Agreement, dated and effective as of February 15, 2019,August 10, 2022, by and between U.S. Small Business Administrationamong Medallion Financial Corp., KORR Value L.P., KORR Acquisitions Group, Inc., Kenneth Orr, David Orr, and Freshstart Venture Capital Corp.Jonathan Orr. Filed as Exhibit 10.110.2 to the Current Report on Form 8-K8-K/A filed on February 21, 2019August 11, 2022 (File No. 001-37747) and incorporated by reference herein.

10.40

Amendment No. 5 to Loan Agreement, dated and effective as of March 14, 2019, by and between U.S. Small Business Administration and Freshstart Venture Capital Corp. Filed as Exhibit 10.1 to the Current Report on Form 8-K filed on March 15, 2019 (File No. 001-37747) and incorporated by reference herein.21.1

10.41

Amendment No. 6 to Loan Agreement, dated and effective as of March 27, 2019, by and between U.S. Small Business Administration and Freshstart Venture Capital Corp. Filed as Exhibit 10.1 to the Current Report on Form 8-K filed on March 29, 2019 (File No. 001-37747) and incorporated by reference herein.

10.42

Amendment No. 7 to Loan Agreement, dated and effective as of January 30, 2020, by and between U.S. Small Business Administration and Freshstart Venture Capital Corp. Filed as Exhibit 10.1 to the Current Report on Form 8-K filed on February 3, 2020 (File No. 001-37747) and incorporated by reference herein.

10.43

Amendment No. 8 to Loan Agreement, dated and effective as of March 27, 2020, by and between U.S. Small Business Administration and Freshstart Venture Capital Corp. Filed as Exhibit 10.42 to the Annual Report on Form 10-K filed for the Fiscal Year ended December 31, 2019 (File No. 001-37747) and incorporated by reference herein.

10.44

Amendment No. 9 to Loan Agreement, dated and effective as of June 1, 2020, by and between U.S. Small Business Administration and Freshstart Venture Capital Corp. Filed as Exhibit 10.1 to the Current Report on Form 8-K filed on June 4, 2020 (File No. 001-37747) and incorporated by reference herein.

10.45

Amendment No. 10 to Loan Agreement, dated and effective as of September 1, 2020, by and between U.S. Small Business Administration and Freshstart Venture Capital Corp. Filed as Exhibit 10.1 to the Current Report on Form 8-K filed on September 3, 2020 (File No. 001-37747) and incorporated by reference herein.

10.46

Amendment No. 11 to Loan Agreement, dated and effective as of September 14, 2020, by and between U.S. Small Business Administration and Freshstart Venture Capital Corp. Filed as Exhibit 10.1 to the Current Report on Form 8-K filed on September 15, 2020 (File No. 001-37747) and incorporated by reference herein.

10.47

Amendment No. 12 to Loan Agreement, dated and effective as of September 23, 2020, by and between U.S. Small Business Administration and Freshstart Venture Capital Corp. Filed as Exhibit 10.1 to the Current Report on Form 8-K filed on September 24, 2020 (File No. 001-37747) and incorporated by reference herein.

21.1

List of Subsidiaries of Medallion Financial Corp. Filed herewithherewith..

23.1

Consent of Mazars USA LLP, independent registered public accounting firm, related to reports on financial statements of Medallion Financial Corp. Filed herewith.

31.1

Certification of Alvin Murstein pursuant to Rule 13a-14(a) and 15d-14(a) as adopted pursuant to section 302 of the Sarbanes-Oxley Act of 2002. Filed herewith.

31.2

Certification of Larry D. HallAnthony N. Cutrone pursuant to Rule 13a-14(a) and 15d-14(a) as adopted pursuant to section 302 of the Sarbanes-Oxley Act of 2002. Filed herewith.

32.1

Certification of Alvin Murstein pursuant to 18 USC. Section 1350, as adopted, pursuant to Section 906 of the Sarbanes-Oxley Act of 2002. Filed herewith.

32.2

Certification of Larry D. HallAnthony N. Cutrone pursuant to 18 USC. Section 1350, as adopted, pursuant to Section 906 of the Sarbanes-Oxley Act of 2002. Filed herewith.

97.1

Medallion Financial Corp. Amended and Restated Compensation Recoupment Policy. Filed herewith.

101.INS

101.INS

XBRL Instance Document – the instance document does not appear in the Interactive Data File because its XBRL tags are embedded within the Inline XBRL document

101.SCH

101.SCH

Inline XBRL Taxonomy Extension Schema Document

101.CAL

Inline XBRL Taxonomy Extension Calculation Linkbase Document

101.DEF

Inline XBRL Taxonomy Extension Definition Linkbase Document

101.LAB

Inline XBRL Taxonomy Extension Labels Linkbase Document

101.PRE

Inline XBRL Taxonomy Extension Presentation Linkbase Document

104

Cover Page Interactive Data File (embedded within the Inline XBRL document)

* Compensatory plan or arrangement required to be identified pursuant to Item 15(a)(3) of this Annual Report on Form 10-K.

ITEM 16. FORM 10-K SUMMARY

*

Compensatory plan or arrangement required to be identified pursuant to Item 15(a)(3) of this Annual Report on Form 10-K.

ITEM 16.

FORM 10-K SUMMARY

Not applicable.


65


SIGNATURES

Pursuant to the requirements of Section 13 or 15(d) of the Securities Exchange of Act of 1934, registrant has duly caused this report to be signed on its behalf by the undersigned, thereunto duly authorized.

MEDALLION FINANCIAL CORP.

Date:

March 15, 20217, 2024

By:

/s/ Alvin Murstein

Alvin Murstein

Chairman and Chief

Executive Officer

Pursuant to the requirements of the Securities Exchange Act of 1934, this report has been signed below by the following persons on behalf of the Registrant and in the capacities and on the dates indicated.

Signatures

Title

Date

/s/ Alvin Murstein

Chairman of the Board of Directors

and Chief Executive Officer

(Principal Executive Officer)

March 15, 20217, 2024

Alvin Murstein

/s/ Larry D. HallAnthony N. Cutrone

SeniorExecutive Vice President and Chief Financial Officer

(Principal Financial and Accounting Officer)

March 15, 20217, 2024

Larry D. HallAnthony N. Cutrone

/s/ Andrew M. Murstein

President and Director

March 15, 20217, 2024

Andrew M. Murstein

/s/ John Everets

Director

March 15, 20217, 2024

John Everets

/s/ Cynthia Hallenbeck

Director

March 15, 20217, 2024

Cynthia Hallenbeck

/s/ Frederick A. MenowitzBrent O. Hatch

Director

March 15, 20217, 2024

Frederick A. MenowitzBrent O. Hatch

/s/ Robert M. Meyer

Director

March 7, 2024

Robert M. Meyer

/s/ David L. Rudnick

Director

March 15, 20217, 2024

David L. Rudnick

/s/ Allan J. Tanenbaum

Director

March 15, 20217, 2024

Allan J. Tanenbaum

66


MEDALLION FINANCIAL CORP.

INDEX TO FINANCIAL STATEMENTS

Page

Report of Independent Registered Public Accounting Firm (Mazars USA LLP, New York, NY, PCAOB ID 339)

F-2

Consolidated Balance Sheets as of December 31, 20202023 and 20192022

F-5F-4

Consolidated Statements of Operations for the Years ended EndedDecember 31, 2020, 2019,2023, 2022, and 20182021

F-6F-5

Consolidated Statements of Other Comprehensive Income (Loss) for the Years Ended December 31, 2020, 2019,2023, 2022, and 20182021

F-8F-6

Consolidated Statements of Changes in Stockholders’ Equity and Changes in Net Assets for the Years endedEnded December 31, 2020, 2019,2023, 2022, and 20182021

F-9F-7

Consolidated Statements of Cash Flows for the Years endedEnded December 31, 2020, 2019,2023, 2022, and 20182021

F-12F-8

Notes to Consolidated Financial Statements

F-14F-9

F-1


Report of Independent Registered Public Accounting Firm

To the Stockholders and Board of Directors of Medallion Financial Corp.

Opinion on the Consolidated Financial Statements and Selected Financial Ratios and Other Data

We have audited the accompanying consolidated balance sheets of Medallion Financial Corp. and subsidiaries (the “Company”) as of December 31, 20202023 and 2019,2022, and the related consolidated statements of operations, other comprehensive income (loss), changes in stockholders’ equity, and changes in net assets, and cash flows for each of the three years in the three-yearthree year period ended December 31, 20202023 and the related notes to the financial statements and the selected financial ratios and other data (see Note 14) for the three months ended March 31, 2018 (collectively referred to as the “consolidated financial statements and selected financial ratios and other data”statements”). In our opinion, the consolidated financial statements and selected financial ratios and other data present fairly, in all material respects, the financial position of the Company as of December 31, 20202023 and 2019,2022, and the results of its operations, changes in stockholders’ equity, and net assets, and cash flows for each of the three years in the three-yearthree year period ended December 31, 2020, and the selected financial ratios and other data for the year ended December 31, 2018,2023, in conformity with accounting principles generally accepted in the United States of America.

We have also audited, in accordance with the standards of the Public Company Accounting Oversight Board (United States) (“PCAOB”), the Company’s internal control over financial reporting as of December 31, 2020,2023, based on the criteria established in Internal Control-Integrated Framework (2013) issued by the Committee of Sponsoring Organizations of the Treadway Commission, and our report dated March 15, 20217, 2024 expressed an unqualified opinion on the effectiveness of the Company’s internal control over financial reporting.

Basis for Opinion

These consolidated financial statements and selected financial ratios and other data are the responsibility of the Company’s management. Our responsibility is to express an opinion on the Company’s consolidated financial statements and selected financial ratios and other data based on our audits. We are a public accounting firm registered with the PCAOB and are required to be independent with respect to the Company in accordance with the U.S. federal securities laws and the applicable rules and regulations of the Securities and Exchange Commission and the PCAOB.

We conducted our audits in accordance with the standards of the PCAOB. Those standards require that we plan and perform the audit to obtain reasonable assurance about whether the consolidated financial statements and selected financial ratios and other data are free of material misstatement, whether due to error or fraud. Our audits included performing procedures to assess the risks of material misstatement of the consolidated financial statements, and selected financial ratios and other data, whether due to error or fraud, and performing procedures that respond to those risks. Such procedures included examining, on a test basis, evidence regarding the amounts and disclosures in the consolidated financial statements and selected financial ratios and other data.statements. Our audits also included evaluating the accounting principles used and significant estimates made by management, as well as evaluating the overall presentation of the consolidated financial statements and selected financial ratios and other data.statements. We believe that our audits provide a reasonable basis for our opinion.

Critical Audit Matters

The critical audit matters communicated below are matters arising from the current period audit of the consolidated financial statements that were communicated or required to be communicated to the audit committee and that: (1) relate to accounts or disclosures that are material to the consolidated financial statements and (2) involved our especially challenging, subjective, or complex judgments. The communication of critical audit matters does not alter in any way our opinion on the consolidated financial statements, taken as a whole, and we are not, by communicating the critical audit matters below, providing separate opinions on the critical audit matters or on the accounts or disclosures to which they relate.

F-2


Allowance for LoanCredit Losses

Critical Audit Matter Description

As discussed in Notes 2 and 4 to the consolidated financial statements, the allowance for loanscredit losses (“ACL”) is assessed on a regular basis on loans segregated into homogenous pools based on similarities. ThroughFor consumer loans, the evaluation, general allowances for loan losses are assessed based onCompany uses historical delinquency and actual loss rates. General allowances are evaluatedrates modified by quantitative adjustments based on macroeconomic factors over a regular basis by managementtwelve month reasonable and is based upon management’s periodic reviewsupportable forecast period. For commercial loans, the Company assesses the historical impact that macroeconomic indicators have had on the loan portfolio, to determine an approximate allowance for credit loss.

We identified the valuation of the collectabilityACL as a critical audit matter. The principal considerations for that determination included the high degree of judgment and subjectivity involved in evaluating management’s estimates, particularly as it related to evaluating management’s assessment of the loans in light of historical experience, the nature and size of the loan


portfolio, adverse situations that may affect the borrower’s ability to repay, estimated value of any underlying collateral, prevailing economic conditions, and excess concentration risks. Management also analyzes and considers several other relevant internal and externalqualitative factors. Considering the estimation and judgment required by management in determining adjustments for loan losses, our audit of the allowance for loan losses and the related disclosuresThis required a high degree of auditor judgment regardingand an increased extent of effort when performing audit procedures to evaluate the qualitative adjustments.reasonableness of management’s significant estimates and assumptions.

How the Critical Matter Was Addressed in the Audit

Our audit procedures related to the allowance for loan losscredit losses included the following, among others:

We tested the effectiveness

Obtained an understanding of controls over the Company’s allowance for loan loss analysis inclusive of the controls over loan charge-off activity and including additional considerations with respect to current economic conditions and management’s review of the adequacy of the allowance for loan loss.

We evaluated management’s judgement and assumptions used in the development of the qualitative adjustments for reasonableness, and the reliability of the underlying data on which the adjustments are based.

We tested the mathematical accuracy of (i) the historical charge-off activity, (ii) the quantitative measure of the qualitative loss factors, and (iii) the formula analysis model calculations.

We evaluated analytics and trends of the overall allowance loan loss analysis to assess for reasonableness.

Income Taxes

Critical Audit Matter Description

As discussed in Notes 2 and 8 to the consolidated financial statements, the Company’s management is required to interpretprocess for establishing the ACL, including the qualitative and apply tax laws and regulations in determining the amount of its deferred tax asset and provision. When an uncertain tax position is identified by management, the Company must evaluate whether it is more likely to be sustained than not on the basis of its technical merits. A valuation allowance is provided against a deferred tax asset when it is more likely than not the same or allforecast factor adjustments of the deferred tax assets will not be realized. All available evidence, both positiveACL.

Evaluated the design and negative, is consideredtested the operating effectiveness of internal controls over the Company’s ACL including controls over:
o
Management’s process for identification, basis for development and related adjustments; including reasonableness, of the qualitative factor components of the ACL.
o
Management’s review of reliability and accuracy of data used to determine whethercalculate and estimate the various components for the ACL, including accuracy of the calculation.
Evaluated the reasonableness of management’s application of qualitative adjustments to historical loss rates in the ACL, including:
o
Evaluated completeness and accuracy of the information utilized as a valuationbasis for the qualitative factors to third party or internal sources.
o
Evaluated the relevance of inputs in the calculation utilized as a basis for qualitative factors.
Evaluated analytics and trends of the overall allowance for deferred tax assets is needed. Items consideredcredit loss analysis to assess for reasonableness.
Evaluated the mathematical accuracy of formulas used in determining the valuation allowance include expectations of future earningssetting qualitative factors and applications of the appropriate tax character, recent historical financial results, tax planning strategies,factors to loan segments.
Utilized professionals with specialized skills and knowledge to assist in evaluating the lengthappropriateness of statutory carryforward periodsthe quantitative models and the expected timingreasonableness of the reversal of temporary differences. Considering the estimation and judgement requiredjudgments used by management in determining the deferred tax valuation allowance, our audit of the account and the related disclosures required a high degree of auditor judgement regarding the valuation allowance.certain qualitative adjustments.

How the Critical Matter Was Addressed in the Audit

Our audit procedures related to income taxes and valuation allowance included the following, among others:

We tested the effectiveness of controls over the Company’s income taxes, including those over the deferred tax asset valuation allowance analysis.

We tested the mathematical accuracy of the deferred tax asset valuation allowance analysis.

We evaluated, with the assistance of our tax specialists, the Company’s deferred tax asset valuation by performing the following:

o

Obtaining management opinions regarding the analysis and evaluating management’s judgements related to the assumptions used in the determination of the estimate of future taxable income.

o

Evaluating and testing management’s process, including the completeness and accuracy of data inputs used as a basis for assumptions in the analysis.  

Impairment Assessment of Goodwill and Long-Lived Assets

Critical Audit Matter Description

As discussed in Note 2 to the consolidated financial statements, the Company’s goodwill and long-lived assets arose as a result of the excess of fair value over book value for several of the Company’s previously unconsolidated portfolio investment companies as of April 2, 2018. Goodwill and long lived assets are tested for impairment at least annually at the reporting unit level. The determination of the fair value of the reporting units requires management to make significant estimates and assumptions related to forecasts of future revenues and expenses and discount rates. Considering the estimation and judgement required by management in determining the future revenues, our audit of the impairment assessment of goodwill and long-lived assets required a high degree of auditor judgement.  


How the Critical Matter Was Addressed in the Audit

Our audit procedures related to the impairment assessment of goodwill and long-lived assets included the following, among others:

We tested the effectiveness of controls over the Company’s goodwill and long-lived assets impairment tests, including controls over the determination of the fair value and discounted cash flow methodology.

We evaluated management’s process and discounted cash flow model of the reporting units. This included evaluating the reasonableness of the assumptions used by a Company engaged valuation specialist.

We evaluated whether the assumptions used were reasonable by considering the past performance of reporting units.

We substantively tested management’s estimate, including evaluating their judgements and assumptions, which included evaluation of key financial data for accuracy.

/s/ Mazars USA LLP

We have served as the Company’s auditor since 2005.

Edison,

New JerseyYork, New York

March 15, 2021

7, 2024


F-3


MEDALLION FINANCIAL CORP.

CONSOLIDATED BALANCE SHEETS


December 31,


(Dollars in thousands, except share and per share data)


2023


2022


Assets


Cash and cash equivalents


$

52,591


$

33,172


Federal funds sold


97,254


72,426


Investment securities


54,282


48,492


Equity investments


11,430


10,293


Loans


2,215,886


1,916,953


Allowance for credit losses


(84,235

)


(63,845

)

Net loans receivable


2,131,651


1,853,108


Goodwill


150,803


150,803


Intangible assets, net


20,591


22,035


Property, equipment, and right-of-use lease asset, net


14,076


13,168


Accrued interest receivable


13,538


12,613


Loan collateral in process of foreclosure (1)


11,772


21,819


Income tax receivable


671


2,095


Other assets


29,168


19,855


Total assets


$

2,587,827


$

2,259,879


Liabilities


Deposits (2)


$

1,866,657


$

1,607,110


Long-term debt (3)


235,544


214,320


Deferred tax liabilities, net


21,207


26,753


Short-term debt


8,000


5,000


Operating lease liabilities


7,019


8,408


Accrued interest payable


6,822


4,790


Accounts payable and accrued expenses (4)


30,804


22,974


Total liabilities


2,176,053


1,889,355


Commitments and contingencies (5)


Stockholders’ equity


Preferred stock (1,000,000 shares of $0.01 par value stock authorized-none outstanding)


Common stock (50,000,000 shares of $0.01 par value stock authorized - 29,051,800
shares at December 31, 2023 and 28,663,827 shares at December 31, 2022 issued)


291


287


Additional paid in capital


288,046


283,663


Treasury stock (5,602,154 shares at December 31, 2023 and December 31, 2021)


(45,538

)


(45,538

)

Accumulated other comprehensive income (loss)


(3,696

)


(3,349

)

Retained earnings


103,883


66,673


Total stockholders’ equity


342,986


301,736


Non-controlling interest in consolidated subsidiaries


68,788


68,788


Total equity


411,774


370,524


Total liabilities and equity


$

2,587,827


$

2,259,879


Number of shares outstanding


23,449,646


23,061,673


Book value per share


$

14.63


$

13.08


(Dollars in thousands, except share and per share data)


December 31, 2020


December 31, 2019


Assets


Cash and cash equivalents (1)


$

54,743


$

17,700


Federal funds sold


57,297


50,121


Equity investments


9,746


10,079


Investment securities


46,792


48,998


Loans


1,229,838


1,160,855


Allowance for loan losses


(57,548

)


(46,093

)

Net loans receivable


1,172,290


1,114,762


Accrued interest receivable


10,338


8,662


Property, equipment, and right-of-use lease asset, net


12,404


14,375


Loan collateral in process of foreclosure (2)


54,560


52,711


Goodwill


150,803


150,803


Intangible assets, net


51,090


52,536


Income tax receivable


1,757


1,516


Other assets


20,591


19,404


Total assets


$

1,642,411


$

1,541,667


Liabilities


Accounts payable and accrued expenses (3)


$

14,902


$

16,234


Accrued interest payable


4,673


4,398


Deposits (4)


1,065,398


951,651


Short-term borrowings


87,334


38,223


Deferred tax liabilities, net


807


9,341


Operating lease liabilities


11,018


12,738


Long-term debt (5)


153,718


174,614


Total liabilities


1,337,850


1,207,199


Commitments and contingencies (6)


Stockholders’ equity


Preferred stock (1,000,000 shares of $0.01 par value stock authorized-NaN outstanding)


Common stock (50,000,000 shares of $0.01 par value stock authorized- 27,828,871

   shares at December 31, 2020 and 27,597,802 shares at December 31, 2019 issued)


278


276


Additional paid in capital


277,539


275,511


Treasury stock (2,951,243 shares at December 31, 2020 and December 31, 2019)


(24,919

)


(24,919

)

Accumulated other comprehensive income (loss)


2,012


999


Retained earnings (accumulated deficit)


(23,502

)


11,281


Total stockholders’ equity


231,408


263,148


Non-controlling interest in consolidated subsidiaries


73,153


71,320


Total equity


304,561


334,468


Total liabilities and equity


$

1,642,411


$

1,541,667


Number of shares outstanding


24,877,628


24,646,559


Book value per share


$

9.30


$

10.68


(1)
Includes financed sales of this collateral to third parties that are reported separately from the loan portfolio, and that are conducted by the Bank of $6.2 million and $7.5 million as of December 31, 2023 and 2022.
(2)
Includes $4.3 million and $3.8 million of deferred financing costs as of December 31, 2023 and 2022. Refer to Note 5 for more details.
(3)
Includes $4.2 million and $3.2 million of deferred financing costs as of December 31, 2023 and 2022. Refer to Note 5 for more details.
(4)
Includes the short-term portion of lease liabilities of $2.5 million and $2.2 million as of December 31, 2023 and 2022. Refer to Note 6 for more details.
(5)
Refer to Note 10 for details.

(1)

Includes restricted cash of $2,970 as of December 31, 2020 and 2019.

(2)

Includes financed sales of this collateral to third parties that are reported separately from the loan portfolio, and that are conducted by Medallion Bank of $3,535 and $8,163 as of December 31, 2020 and 2019.

(3)

Includes the short-term portion of lease liabilities of $2,004 and $2,085 as of December 31, 2020 and 2019. Refer to Note 7 for more details.

(4)

Includes $2,674 and $2,594 of deferred financing costs as of December 31, 2020 and 2019. Refer to Note 6 for more details.

(5)

Includes $3,131 and $2,511 of deferred financing costs as of December 31, 2020 and 2019. Refer to Note 6 for more details.

(6)

Refer to Note 11 for details.

The accompanying notes should be read in conjunction with these consolidated financial statements.


F-4


MEDALLION FINANCIAL CORP.

CONSOLIDATED STATEMENTS OF OPERATIONS


Year Ended December 31,


(Dollars in thousands, except share and per share data)


2023


2022


2021


Interest and fees on loans


$

244,829


$

195,074


$

157,990


Interest and dividends on investment securities


6,211


1,547


976


Total interest income(1)


251,040


196,621


158,966


Interest on deposits


47,780


22,666


17,543


Interest on long-term debt


12,670


13,387


12,907


Interest on short-term borrowings


2,496


132


690


Total interest expense(2)


62,946


36,185


31,140


Net interest income


188,094


160,436


127,826


Provision for credit losses


37,810


30,059


4,622


Net interest income after provision for credit losses


150,284


130,377


123,204


Other income


Gain on equity investments


5,178


2,779


17,379


Gain on sale of loans and taxi medallion


4,992


5,448


1,788


Write-down of loan collateral in process of foreclosure


(1,696

)


(657

)


(5,592

)

Sponsorship and race winnings, net


12,567


Gain on extinguishment of debt


4,626


Other income


2,846


1,956


798


Total other income, net


11,320


9,526


31,566


Other expenses


Salaries and employee benefits


37,562


31,130


31,591


Loan servicing fees


9,543


8,371


7,013


Collection costs


6,000


5,314


5,279


Professional fees


5,886


13,054


5,311


Regulatory fees


3,194


2,418


1,872


Rent expense


2,472


2,378


2,454


Amortization of intangible assets


1,445


1,445


1,445


Race team related expenses


9,559


Other expenses


9,466


7,943


8,375


Total other expenses


75,568


72,053


72,899


Income before income taxes


86,036


67,850


81,871


Income tax provision


(24,910

)


(17,963

)


(24,217

)

Net income after taxes


61,126


49,887


57,654


Less: income attributable to the non-controlling interest


6,047


6,047


3,546


Total net income attributable to Medallion Financial Corp.


$

55,079


$

43,840


$

54,108


Basic net income per share


$

2.45


$

1.86


$

2.20


Diluted net income per share


$

2.37


$

1.83


$

2.17


Weighted average common shares outstanding


Basic


22,510,435


23,583,049


24,599,804


Diluted


23,248,323


23,927,342


24,943,169


Bank Holding Company Accounting


Combined (1)


For the Years Ended


(Dollars in thousands, except share and per share data)


December 31, 2020


December 31, 2019


December 31, 2018


Interest and fees on loans


$

143,701


$

130,167


$

95,080


Interest and dividends on investment securities


1,208


2,225


1,644


Medallion lease income


53


170


133


Interest income on investments


3,287


Dividend income from controlled subsidiaries


28


Interest income from affiliated investments


654


Interest income from controlled subsidiaries


10


Total interest income (2)/total investment income (2)


144,962


132,562


100,836


Interest on deposits


22,330


22,521


14,230


Interest on short-term borrowings


2,006


3,242


4,441


Interest on long-term debt


9,815


9,282


6,145


Interest expense


3,551


Total interest expense (3)


34,151


35,045


28,367


Net interest income/net investment income


110,811


97,517


72,469


Provision for loan losses


69,817


47,386


59,008


Net interest income after provision for loan losses


40,994


50,131


13,461


Other income (loss)


Writedown of loan collateral in process of foreclosure


(24,523

)


(4,381

)


(2,188

)

Sponsorship and race winnings, net


20,042


18,742


14,368


Gain (loss) on equity investments


(2,985

)


(939

)

Gain on the extinguishment of debt


4,145


Gain on deconsolidation of Trust III


25,325


Gain on sale of loans


4,946


Other income


1,530


1,881


494


Total other income (loss), net


(5,936

)


20,387


42,006


Other expenses


Salaries and employee benefits


28,172


24,971


21,706


Race team related expenses


8,366


8,996


7,121


Professional fees


8,047


7,402


9,332


Loan servicing fees


6,737


5,253


3,470


Collection costs


5,454


6,638


5,207


Rent expense


2,833


2,419


2,040


Regulatory fees


1,822


1,722


1,703


Amortization of intangible assets


1,445


1,446


1,083


Travel, meals, and entertainment


375


1,138


1,448


Intangible asset impairment


5,615


Other expenses


8,788


8,196


7,464


Total other expenses (4)


72,039


68,181


66,189


Income (loss) before income taxes/net investment loss before taxes (4)


(36,981

)


2,337


(10,722

)

Income tax (provision) benefit


10,074


(341

)


(373

)

Net income (loss) after taxes/net investment income (loss) after taxes


(26,907

)


1,996


(11,095

)

Net realized losses on investments (5)


(34,745

)

Income tax benefit


8,426


Total net realized losses on investments


(26,319

)

Net change in unrealized appreciation on Medallion Bank and other

   controlled subsidiaries


29,115


Net change in unrealized depreciation on investments other than securities


(1,915

)

Net change in unrealized appreciation (depreciation) on investments


(4,403

)

Income tax (provision) benefit


(8,122

)

Net unrealized appreciation on investments


14,675


Net realized/unrealized gains (losses) on investments


(11,644

)

Net income (loss) after taxes/net increase (decrease) on net assets resulting

   from operations


(26,907

)


1,996


(22,739

)

Less: income attributable to the non-controlling interest


7,876


3,758


2,307


Total net income (loss) attributable to Medallion Financial Corp./net

   increase (decrease) on net assets resulting from operations


$

(34,783

)


$

(1,762

)


$

(25,046

)

Basic net loss per share


$

(1.42

)


$

(0.07

)


$

(1.03

)

Diluted net loss per share


$

(1.42

)


$

(0.07

)


$

(1.03

)

Distributions declared per share


$


$


$


Weighted average common shares outstanding


Basic


24,445,452


24,342,979


24,214,978


Diluted


24,445,452


24,342,979


24,214,978


(1)
Included in interest and investment income is $1.6 million, $0.7 million, and $0.8 million of paid-in-kind interest for the years ended December 31, 2023, 2022, and 2021.
(2)
Average borrowings outstanding were $2.0 billion, $1.7 billion and $1.4 billion as of December 31, 2023, 2022, and 2021 and the related average borrowing costs were 3.16%, 2.17%, and 2.28% for the years ended December 31, 2023, 2022, and 2021.

(1)

Balance includes the nine months ended December 31, 2018 under Bank Holding Company Accounting and the three months ended March 31, 2018 under Investment Company Accounting.


(2)

Included in interest and investment income is $1,188, $834, and $1,869 of paid in kind interest for the years ended December 31, 2020, 2019, and 2018.

(3)

Average borrowings outstanding were $1,258,486, $1,138,746, and $1,198,124, and the related average borrowing costs were 2.71%, 3.08%, and 2.37% for the years ended December 31, 2020, 2019, and 2018.

(4)

Includes $256 of net revenues received from Medallion Bank for the year ended December 31, 2018, primarily for expense reimbursements. See Notes 5 and 12 for additional information.

(5)

There were 0 net losses on investment securities of affiliated issuers for the year ended December 31, 2018.

The accompanying notes should be read in conjunction with these consolidated financial statements.


F-5


MEDALLION FINANCIAL CORP.

CONSOLIDATED STATEMENTS OF OTHER COMPREHENSIVE INCOME (LOSS)


Bank Holding Company Accounting


Combined (1)


For the Years Ended


(Dollars in thousands)


December 31, 2020


December 31, 2019


December 31, 2018


Net income (loss) after taxes/net decrease on net assets resulting from operations


$

(26,907

)


$

1,996


$

(22,739

)

Other comprehensive income (loss), net of tax


1,013


1,081


(82

)

Total comprehensive income (loss)


(25,894

)


3,077


(22,821

)

Less: comprehensive income attributable to the non-controlling interest


7,876


3,758


2,307


Total comprehensive loss attributable to Medallion Financial Corp.


$

(33,770

)


$

(681

)


$

(25,128

)


Year Ended December 31,


(Dollars in thousands)


2023


2022


2021


Net income after taxes


$

61,126


$

49,887


$

57,654


Other comprehensive loss, net of tax


(347

)


(4,383

)


(978

)

Total comprehensive income


60,779


45,504


56,676


Less comprehensive income attributable to the non-controlling interest


6,047


6,047


3,546


Total comprehensive income attributable to Medallion Financial Corp.


$

54,732


$

39,457


$

53,130


(1)

Balance includes the nine months ended December 31, 2018 under Bank Holding Company Accounting and the three months ended March 31, 2018 under Investment Company Accounting.

The accompanying notes should be read in conjunction with these consolidated financial statements.


F-6


MEDALLION FINANCIAL CORP.

CONSOLIDATED STATEMENT OF CHANGES IN STOCKHOLDERS’ EQUITY AND CHANGES IN NET ASSETS

(Dollars in thousands)


Common
Stock
Shares


Common
Stock


Capital in
Excess of Par


Treasury
Stock
Shares


Treasury
Stock


Retained Earnings
(Accumulated
Deficit)


Accumulated
Other
Comprehensive
Income (Loss)


Total
Stockholders’
Equity


Non-
controlling
Interest


Total
Equity


Balance at December 31, 2020


27,828,871


$

278


$

277,539


(2,951,243

)


$

(24,919

)


$

(23,502

)


$

2,012


$

231,408


$

73,153


$

304,561


Net income


54,108


54,108


3,546


57,654


Distributions to non-controlling interest


(6,516

)


(6,516

)

Disposition of RPAC


(1,395

)


(1,395

)

Stock-based compensation


3


2,258


2,261


2,261


Issuance of restricted stock, net


258,120


Forfeiture of restricted stock, net


(21,940

)


Issuance in connection with vesting of restricted stock units


15,508


Exercise of stock options


44,070


241


241


241


Other comprehensive loss, net of tax


(978

)


(978

)


(978

)

Balance at December 31, 2021


28,124,629


$

281


$

280,038


(2,951,243

)


$

(24,919

)


$

30,606


$

1,034


$

287,040


$

68,788


$

355,828


Net income


43,840


43,840


6,047


49,887


Distributions to non-controlling interest


(6,047

)


(6,047

)

Stock-based compensation


6


3,470


3,476


3,476


Issuance of restricted stock, net


522,475


Forfeiture of restricted stock, net


(29,359

)


Issuance in connection with vesting of restricted stock units


22,337


Exercise of stock options


23,745


155


155


155


Purchase of common stock


(2,650,911

)


(20,619

)


(20,619

)


(20,619

)

Dividends paid on common stock


(7,773

)


(7,773

)


(7,773

)

Other comprehensive loss, net of tax


(4,383

)


(4,383

)


(4,383

)

Balance at December 31, 2022


28,663,827


$

287


$

283,663


(5,602,154

)


$

(45,538

)


$

66,673


$

(3,349

)


$

301,736


$

68,788


$

370,524


Adoption of ASU 2016-13, net of tax


(9,935

)


(9,935

)


(9,935

)

Balance at January 1, 2023


28,663,827


287


283,663


(5,602,154

)


(45,538

)


56,738


(3,349

)


291,801


68,788


360,589


Net income


55,079


55,079


6,047


61,126


Distributions to non-controlling interest


(6,047

)


(6,047

)

Stock-based compensation


3


4,710


4,713


4,713


Withheld restricted stock for employees' tax obligation


(91,169

)


(768

)


(768

)


(768

)

Issuance of restricted stock, net


399,793


Forfeiture of restricted stock, net


(12,807

)


Issuance in connection with vesting of restricted stock units


23,211


Exercise of stock options


68,945


1


441


442


442


Dividends paid on common stock


(7,934

)


(7,934

)


(7,934

)

Other comprehensive loss, net of tax


(347

)


(347

)


(347

)

Balance at December 31, 2023


29,051,800


$

291


$

288,046


(5,602,154

)


$

(45,538

)


$

103,883


$

(3,696

)


$

342,986


$

68,788


$

411,774


(Dollars in thousands)


Common

Stock

Shares


Common

Stock


Preferred

Stock


Capital in

Excess of Par


Treasury

Stock

Shares


Treasury

Stock


Retained

Earnings


Accumulated

Other

Comprehensive

Income (Loss)


Total

Stockholders’

Equity


Non-

controlling

Interest


Total

Equity


Balance at December 31, 2019


27,597,802


$

276


$


$

275,511


(2,951,243

)


$

(24,919

)


$

11,281


$

999


$

263,148


$

71,320


$

334,468


Net income (loss)


(34,783

)


(34,783

)


7,876


(26,907

)

Distributions to non-controlling interest


(6,043

)


(6,043

)

Stock-based compensation


2


2,028


2,030


2,030


Issuance of restricted stock, net


229,408


0


Forfeiture of restricted stock, net


(8,755

)


0


Issuance of restricted stock units, net


10,416


Net change in unrealized gains on investments, net of tax


1,013


1,013


1,013


Balance at December 31, 2020


27,828,871


$

278


$

-


$

277,539


(2,951,243

)


$

(24,919

)


$

(23,502

)


$

2,012


$

231,408


$

73,153


$

304,561


The accompanying notes should be read in conjunction with these consolidated financial statements.

F-7


MEDALLION FINANCIAL CORP.


CONSOLIDATED STATEMENTS OF CASH FLOWS


Year Ended December 31,


(Dollars in thousands)


2023


2022


2021


CASH FLOWS FROM OPERATING ACTIVITIES


Net income/net decrease in net assets resulting from operations


$

61,126


$

49,887


$

57,654


Adjustments to reconcile net income/net decrease in net assets resulting from
operations to net cash provided by operating activities:


Provision for credit losses


37,810


30,059


4,622


Paid-in-kind interest income


(1,636

)


(724

)


(814

)

Depreciation and amortization


5,243


5,229


6,519


Amortization of origination fees, net


9,588


8,707


7,996


(Decrease) increase in deferred and other tax liabilities, net


(345

)


7,281


18,327


Net change in value of loan collateral in process of foreclosure


10,597


5,738


8,966


Net gains on equity investments


(5,178

)


(2,779

)


(17,380

)

Stock-based compensation expense


4,713


3,476


2,261


Gain on extinguishment of debt


(4,626

)

Increase in accrued interest receivable


(925

)


(1,992

)


(283

)

Gain on disposition of RPAC


(715

)

Increase in other assets


(15,470

)


(3,919

)


(5,354

)

Decrease in accounts payable and accrued expenses


6,209


6,382


2,694


(Decrease) increase in accrued interest payable


2,032


1,395


(1,141

)

Net cash provided by operating activities


113,764


108,740


78,726


CASH FLOWS FROM INVESTING ACTIVITIES


Loans originated


(975,391

)


(1,000,785

)


(760,790

)

Proceeds from principal receipts, sales, and maturities of loans


616,193


535,067


464,448


Purchases of investments


(11,573

)


(20,713

)


(19,354

)

Proceeds from disposition of RPAC, net


17,676


Proceeds from principal receipts, sales, and maturities of investments


9,444


14,762


35,647


Proceeds from the sale and principal payments on loan collateral in process of foreclosure


20,631


22,664


24,052


Net cash used for investing activities


(340,696

)


(449,005

)


(238,321

)

CASH FLOWS FROM FINANCING ACTIVITIES


Proceeds from time deposits and funds borrowed


975,175


839,104


805,577


Repayments of time deposits and funds borrowed


(689,920

)


(483,671

)


(627,263

)

Treasury stock repurchased


(20,619

)


Cash dividend paid on common stock


(7,703

)


(7,543

)


Distributions to non-controlling interests


(6,047

)


(6,047

)


(6,516

)

Payment of withholding taxes on net settlement of vested stock


(768

)


Proceeds from the exercise of stock options


442


155


241


Net cash provided by financing activities


271,179


321,379


172,039


NET INCREASE (DECREASE) IN CASH AND CASH EQUIVALENTS


44,247


(18,886

)


12,444


Cash and cash equivalents, beginning of period


105,598


124,484


112,040


Cash and cash equivalents, end of period (1)


$

149,845


$

105,598


$

124,484


SUPPLEMENTAL INFORMATION


Cash paid during the period for interest


$

57,509


$

31,976


$

29,867


Cash paid during the period for income taxes


25,102


8,848


5,479


NON-CASH INVESTING


Loans transferred to loan collateral in process of foreclosure, net


$

21,181


$

12,791


$

15,888


(1)
Includes federal funds sold.

(Dollars in thousands)


Common

Stock

Shares


Common

Stock


Preferred

Stock


Capital in

Excess of Par


Treasury

Stock

Shares


Treasury

Stock


Retained

Earnings


Accumulated

Other

Comprehensive

Income (Loss)


Total

Stockholders’

Equity


Non-

controlling

Interest


Total

Equity


Balance at December 31, 2018


27,385,600


$

274


$


$

274,292


(2,951,243

)


$

(24,919

)


$

13,043


$

(82

)


$

262,608


$

27,596


$

290,204


Net income (loss)


(1,762

)


(1,762

)


3,758


1,996


Non-controlling interest equity raised by Medallion Bank (1)


42,485


42,485


Distributions to non-controlling interest


(2,519

)


(2,519

)

Stock-based compensation


2


1,219


1,221


1,221


Issuance of restricted stock, net


216,148


0


Forfeiture of restricted stock, net


(3,946

)


0


Net change in unrealized gains on investments, net of tax


1,081


1,081


1,081


Balance at December 31, 2019


27,597,802


$

276


$

-


$

275,511


(2,951,243

)


$

(24,919

)


$

11,281


$

999


$

263,148


$

71,320


$

334,468


(1)

Refer to Note 18 for details.

The accompanying notes should be read in conjunction with these consolidated financial statements.


F-8


Bank Holding & Investment Company Accounting


Investment Company

Accounting


Bank Holding Company Accounting


Bank Holding &

Investment

Company

Accounting


(Dollars in thousands)


Common

Stock

Shares


Common

Stock


Preferred

Stock


Capital in

Excess of Par


Treasury

Stock

Shares


Treasury

Stock


Accumulated

Undistributed

Net Investment

Loss


Net

Unrealized

Appreciation

on Investments,

Net of tax


Retained

Earnings


Accumulated

Other

Comprehensive

Loss


Total

Stockholders’

Equity


Non-

controlling

Interest


Total

Equity


Balance at December 31, 2017


27,294,327


$

273


$


$

273,716


(2,951,243

)


$

(24,919

)


$

(65,592

)


$

103,681


$


$


$

287,159


$


$

287,159


Net increase (decrease) in net assets

   resulting from operations


��


(38,299

)


23,425


(14,874

)


(14,874

)

Stock-based compensation expense


1


151


152


152


Issuance of restricted stock, net


95,726


Balance at March 31, 2018


27,390,053


274


273,867


(2,951,243

)


(24,919

)


(103,891

)


127,106


272,437


272,437


Adoption of Bank Holding Company

   Accounting


103,891


(127,106

)


23,215


Balance at April 2, 2018


27,390,053


274


273,867


(2,951,243

)


(24,919

)


23,215


272,437


27,065


299,502


Net loss


(10,172

)


(10,172

)


2,307


(7,865

)

Distributions to non-controlling interest


(1,776

)


(1,776

)

Stock-based compensation


425


425


425


Issuance of restricted stock, net


Forfeiture of restricted stock, net


(4,453

)


Net change in unrealized losses on

   investments, net of tax


(82

)


(82

)


(82

)

Balance at December 31, 2018


27,385,600


$

274


$


$

274,292


(2,951,243

)


$

(24,919

)


$


$


$

13,043


$

(82

)


$

262,608


$

27,596


$

290,204


The accompanying notes should be read in conjunction with these consolidated financial statements.


MEDALLION FINANCIAL CORP.

CONSOLIDATED STATEMENTS OF CASH FLOWS


Bank Holding Company Accounting


Combined (1)


Year Ended December 31,


(Dollars in thousands)


2020


2019


2018


CASH FLOWS FROM OPERATING ACTIVITIES


Net income (loss)/net decrease in net assets resulting from operations


$

(26,907

)


$

1,996


$

(22,739

)

Adjustments to reconcile net income (loss)/net decrease in net assets resulting from operations to net cash provided by operating activities:


Provision for loan losses


69,817


47,386


59,008


Paid-in-kind interest


(1,188

)


(834

)


(1,869

)

Depreciation and amortization


7,714


7,499


5,564


Amortization of origination fees, net


6,022


4,952


3,132


(Decrease) increase in deferred and other tax liabilities, net


(8,776

)


853


13,637


Net change in value of loan collateral in process of foreclosure


31,926


11,838


9,926


Net realized (gains) losses on sale of investments


4,305


(1,820

)


(5,921

)

Net change in unrealized (appreciation) depreciation on investments


1,734


6,457


Stock-based compensation expense


2,030


1,221


576


Gain on deconsolidation of Trust III


(25,325

)

Gain on extinguishment of debt


(4,145

)


Intangible asset impairment


5,615


(Increase) decrease in accrued interest receivable


(1,676

)


(1,249

)


797


Decrease in other assets


2,223


2,838


1,309


Decrease in accounts payable and accrued expenses


(7,206

)


(8,024

)


(675

)

Increase in accrued interest payable


422


690


139


Loans originated


(8,193

)

Proceeds from principal receipts, sales, and maturities of loans


13,279


Capital returned by Medallion Bank and other controlled subsidiaries, net


93


Net change in unrealized depreciation on investment other than securities


1,915


Increase in unrealized appreciation on Medallion Bank and other controlled

   subsidiaries


(29,115

)

Net realized losses on investments


34,745


Increase in other liabilities


4,196


Net cash provided by operating activities


78,706


64,935


66,551


CASH FLOWS FROM INVESTING ACTIVITIES


Loans originated


(506,106

)


(471,069

)


(333,740

)

Proceeds from principal receipts, sales, and maturities of loans


321,831


251,653


302,409


Purchases of investments


(15,580

)


(10,507

)


(10,376

)

Proceeds from principal receipts, sales, and maturities of investments


15,399


7,119


6,417


Proceeds from the sale and principal payments on loan collateral in process of foreclosure


13,499


16,294


11,593


Net cash used for investing activities


(170,957

)


(206,510

)


(23,697

)

CASH FLOWS FROM FINANCING ACTIVITIES


Proceeds from time deposits and funds borrowed


668,577


525,842


364,139


Repayments of time deposits and funds borrowed


(526,064

)


(414,277

)


(389,951

)

Purchase of federal funds


4,000


8,000


Repayments of federal funds


(4,000

)


(8,000

)

Non-controlling interest equity raised by Medallion Bank


42,485


Distributions to non-controlling interests


(6,043

)


(2,367

)


(1,776

)

Payments of declared distributions


(66

)

Net cash provided by (used for) financing activities


136,470


151,683


(27,654

)

NET INCREASE (DECREASE) IN CASH AND CASH EQUIVALENTS


44,219


10,108


15,200


Cash and cash equivalents, beginning of period (2)(3)


67,821


57,713


42,513


Cash and cash equivalents, end of period (3)


$

112,040


$

67,821


$

57,713


SUPPLEMENTAL INFORMATION


Cash paid during the period for interest


$

31,204


$

32,008


$

25,102


Cash paid during the period for income taxes


104


310


85


NON-CASH INVESTING


Loans transferred to loan collateral in process of foreclosure, net


$

47,254


$

31,348


$

32,125


Loans transferred to other foreclosed property


1,800


(1)

Balance includes the nine months ended December 31, 2018 under Bank Holding Company Accounting and the three months ended March 31, 2018 under Investment Company Accounting.


(2)

Included in the beginning balance for the year ended December 31, 2018 was $29,923 of cash, cash equivalents, and federal funds sold as a result of the consolidation of previously unconsolidated subsidiaries and excludes $100 of cash held by the Company on deposit with the Bank.

(3)

Includes federal funds sold.

The accompanying notes should be read in conjunction with these consolidated financial statements.


MEDALLION FINANCIAL CORP.

NOTES TO CONSOLIDATED FINANCIAL STATEMENTS

DECEMBER 31, 20202023

(1) ORGANIZATION OF MEDALLION FINANCIAL CORP. AND ITS SUBSIDIARIES

Medallion Financial Corp., or the Company, is a specialty finance company organized as a Delaware corporation that reports as a bank holding company, but is not a bank holding company for regulatory purposes. The Company conducts its business through various wholly-owned subsidiaries including its primary operating company, Medallion Bank, or the Bank, a Federal Deposit Insurance Corporation, or FDIC, insured industrial bank that originates consumer loans, raises deposits, and conducts other banking activities. The Bank is subject to competition from other financial institutions and to the regulations of certain federal and state agencies, and undergoes examinations by those agencies. The Bank was initially formed in May 2002 for the primary purpose of originatingobtaining an industrial bank charter pursuant to the laws of the State of Utah. The Bank originates consumer loans on a national basis for the purchase of recreational vehicles, or “RVs”, boats and other consumer recreational equipment and to finance home improvements such as roofs, swimming pools, and windows. Prior to 2015, the Bank originated commercial loans in three categories: 1) loans to finance the purchase of taxi medallions, 2) asset-based commercialall of which are serviced by the Company. The loans and 3) SBA 7(a) loans. Subsequent to its formation, the Bank began originating consumer loans to finance the purchasesare financed primarily with time certificates of recreational vehicles, or RVs, boats, and other related items, and to finance home improvements. The Company also conducts businessdeposit which are originated nationally through Medallion Funding LLC, or MFC, a Small Business Investment Company, or SBIC, which originates and services taxi medallion and commercial loans.variety of brokered deposit relationships.

The Company also conducts business through its subsidiaries Medallion Capital, Inc., or MCI, ana Small Business Investment Company, or SBIC, which conducts a mezzanine financing business,business; Medallion Funding LLC, or MFC, an SBIC, which historically was the Company's primary taxi medallion lending company; and Freshstart Venture Capital Corp., or FSVC, an SBIC thatwhich historically originated and servicesserviced taxi medallion and commercial loans. MFC,loans and was an SBIC through 2023. MCI, and FSVC,MFC, as SBICs, are regulated by the Small Business Administration, or SBA. MCI and FSVC areis financed in part by the SBA.

The Company has a controlling ownership stake in Medallion Motorsports, LLC, the primary owner of RPAC Racing, LLC, or RPAC, a professional car racing team that competes in the Monster Energy NASCAR Cup Series, which is also consolidated with the Company.

The Company formed a wholly-owned subsidiary, Medallion Servicing Corporation, or MSC, to provide loan services to the Bank. The Company has assigned all of its loan servicing rights for the Bank, which consists of servicing medallion loans originated by the Bank, to MSC, which bills and collects the related service fee income from the Bank, and is allocated and charged by the Company for MSC’s share of these servicing costs.

Beginning in 2019, the Bank began the process to build out a strategic partnership program with financial technology, or fintech, companies. The Bank entered into an initial partnership in 2020 and began issuing its first loans, while continuing to explore opportunities with additional fintech companies.

Taxi Medallion Loan Trust III, or Trust III, was established for the purpose of owning medallion loans originated by MFC or others. Trust III is a variable interest entity, or VIE, and MFC was the primary beneficiary until the 2018 fourth quarter. As a result, the Company consolidated Trust III in its financial results until consummation of a restructuring in the 2018 fourth quarter. For a discussion of the restructuring, see Note 20. Trust III is a separate legal and corporate entity with its own creditors which, in any liquidation of Trust III, will be entitled to be satisfied out of Trust III’s assets prior to any value in Trust III becoming available to Trust III’s equity holders. The assets of Trust III are not available to pay obligations of its affiliates or any other party, and the assets of affiliates or any other party are not available to pay obligations of Trust III. Trust III’s loans are serviced by MFC.

The Company established a wholly-owned subsidiary, Medallion Financing Trust I, or Fin Trust, for the purpose of issuing unsecured trust preferred securities to investors. Fin Trust is a separate legal and corporate entity with its own creditors who, in any liquidation of Fin Trust, will be entitled to be satisfied out of Fin Trust’s assets prior to any value in Fin Trust becoming available to Fin Trust’s equity holders. The assets of Fin Trust, aggregating $36,083,000$34.0 million at December 31, 2020,2023, are comprised solely of a subordinated note from the Company and are not available to pay obligations of its affiliates or any other party, and the assets of affiliates or any other party are not available to pay obligations of Fin Trust.

MFC, through several wholly-owned subsidiaries, or together, Medallion Chicago, purchased $8,689,000 of City of Chicago taxi medallions out of foreclosure, some of which are leased to fleet operators. The 159 medallions are carried at a net realizable value of $2,932,000 in other assets on the Company’s consolidated balance sheet at December 31, 2020, compared to a net realizable value of $3,091,000 at December 31, 2019.


(2) SUMMARY OF SIGNIFICANT ACCOUNTING POLICIES

Change to Bank Holding Company Accounting

Effective April 2, 2018, the Company withdrew its previous election to be regulated as a business development company, or BDC, under the Investment Company Act of 1940, or the 1940 Act. Prior to such time, the Company was a closed-end, non-diversified management investment company that had elected to be treated as a BDC under the 1940 Act. Accordingly, commencing with the three months ended June 30, 2018, the Company (which now consolidates the results of the Bank and its other subsidiaries) reports in accordance with Bank Holding Company Accounting; periods prior to such change in status are reported in accordance with Investment Company Accounting. Significant accounting policies that differ between such periods are described in more detail below.

Use of Estimates

The preparation of the consolidated financial statements in conformity with accounting principles generally accepted in the US,U.S., or GAAP, requires management to make estimates that affect the amounts reported in the consolidated financial statements and the accompanying notes. Accounting estimates and assumptions are those that management considers to be the most critical to an understanding of the consolidated financial statements because they inherently involve significant judgments and uncertainties. All of these estimates reflect management’s best judgment about current economic and market conditions and their effects based on information available as of the date of these consolidated financial statements. If such conditions change, it is reasonably possible that the judgments and estimates could change, which may result in future impairments of loans and loansloan collateral in process of foreclosure, goodwill and intangible assets, and investments, among other effects.

Principles of Consolidation

The consolidated financial statements include the accounts of the Company and all of its wholly-owned and controlled subsidiaries commencing with the three months ended June 30, 2018.subsidiaries. All significant intercompany transactions, balances, and profits (losses) have been eliminated in consolidation. As a result of the Company’s election to withdraw from being regulated as a BDC under the 1940 Act, effective April 2, 2018, the Bank and various other Company subsidiaries were not consolidated with the Company prior to the three months ended June 30, 2018.

The consolidated financial statements have been prepared in accordance with GAAP. The Company consolidates all entities it controls through a majority voting interest, a controlling interest through other contractual rights, or as being identified as the primary beneficiary of VIEs. The primary beneficiary is the party who has both (1) the power to direct the activities of a VIE that most significantly impact the entity’s economic performance, and (2) an obligation to absorb losses of the entity or a right to receive benefits from the entity that could potentially be significant to the entity. For consolidated entities that are less than wholly owned, the third-party’s holding is recorded as non-controlling interest.

F-9


Cash and Cash Equivalents

The Company considers all highly liquid instruments with an original purchased maturity of three months or less to be cash equivalents. Cash balances are generally held in accounts at large national or regional banking organizations in amounts that exceed the federally insured limits. Cash includes $2,970,000As of an interest reserve associated with the private placements of debt in March and August 2019, which cannot be used for any other purpose until March 2022. CashDecember 31, 2023, cash also includes $1,500,000included $1.3 million of interest-bearing funds deposited in other banks that are mainly callable, with original terms of 45 to 76 years.

Fair Value of Assets and Liabilities

The Company follows the Financial Accounting Standards Board, or FASB, FASB Accounting Standards Codification Topic 820, Fair Value Measurements and Disclosures, or FASB ASC 820, which defines fair value, establishes a framework for measuring fair value, and expands disclosures about fair value measurements. FASB ASC 820 defines fair value as an exit price (i.e. a price that would be received to sell, as opposed to acquire, an asset or transfer a liability), and emphasizes that fair value is a market-based measurement. It establishes a fair value hierarchy that distinguishes between assumptions developed based on market data obtained from independent external sources and the reporting entity’s own assumptions. Further, it specifies that fair value measurement should consider adjustment for risk, such as the risk inherent in the valuation technique or its inputs. See also Notes 1614 and 1715 to the consolidated financial statements.


Equity Investments

The Company follows FASB ASC Topic 321, Investments – Equity Securities, or ASC 321, which requires all applicable investmentinvestments in equity securities with a readily determinable fair value to be valued as such, and those that do notwithout a readily determinable fair value, are measured at cost, less any impairment plus or minus any observable price change.changes. Equity investments of $9,746,000$11.4 million and $10,079,000 at$10.3 million as of December 31, 20202023 and 2019,2022, were comprised mainly of nonmarketable stock and stock warrants, are recorded at cost less any impairment plus or minus observable price changes.changes, and a vast majority are held by our SBIC subsidiary in connection with its mezzanine lending business. As of December 31, 2020 and 2019,2023, cumulative impairment of $3.5 million had been recorded with respect to these investments.

During 2021, the Company determined that there was no impairment or observable price change.purchased $2.0 million of equity securities with a readily determinable fair value. As a result, all unrealized gains and losses are included in gain (loss) on equity investments. As of December 31, 2023 and 2022, the fair value of these securities were $1.7 million and $1.7 million and are included in other assets on the consolidated balance sheet.

The following table presents the unrealized portion related to the equity securities held as of December 31, 2023.


Year Ended December 31,


(Dollars in thousands)


2023


2022


2021


Net gains (losses) recognized during the period on equity securities


$

24


$

(226

)


$

(50

)

Less: Net gains (losses) recognized during the period on equity
   securities sold during the period


Unrealized gains (losses) recognized during the reporting period on
   equity securities still held at the reporting date


$

24


$

(226

)


$

(50

)

Investment Securities (Bank Holding Company Accounting)

The Company follows FASB ASC Topic 320, Investments – Debt Securities, or ASC 320, which requires that all applicable investments in debt securities be classified as trading securities, available-for-sale securities, or held-to-maturity securities.securities. Investment securities are purchased from time to timetime-to-time in the open market at prices that are greater or lesser than the par value of the investment. The resulting premium or discount is deferred and recognized on a level yield basis as an adjustment to the yield of the related investment. The net premium on investment securities totaled $278,000 and $248,000 at$0.1 million as of both December 31, 20202023 and 2019,2022, and $291,000less than $0.1 million, $0.1 million, and $79,000$0.1 million was amortized to interest income for the years ended December 31, 20202023, 2022, and 2019, and $80,000 was amortized to interest income for the nine months ended December 31, 2018. The Bank, a previously unconsolidated subsidiary under Investment Company Accounting prior to April 2, 2018, amortized $21,000 to interest income for the three months ended March 31, 2018. Refer to Note 3 for more details.2021. ASC 320 further requires that held-to-maturity securities be reported at amortized cost and available-for-sale securities be reported at fair value, with unrealized gains and losses excluded from earnings at the date of the consolidated financial statements, and reported in accumulated other comprehensive income (loss) as a separate component of stockholders’ equity, net of the effect of income taxes, until they are sold. At the time of sale, any gains or losses, calculated by the specific identification method, will be recognized as a component of operating results and any amounts previously included in stockholder’sstockholders’ equity, which were recorded net of the income tax effect, will be reversedreversed. In accordance with ASC 326, we do not maintain an allowance for credit losses for accrued interest receivable.

.Loans

Other Investment Valuation (Investment Company Accounting)

Prior to April 2, 2018, under the 1940 Act, the Company’s investment in the Bank, as a wholly owned portfolio investment, was subject to quarterly assessments of fair value. The Company conducted a thorough valuation analysis, and also received an opinion regarding the valuation from an independent third party to assist the Board of Directors in its determination of the fair value of the Bank on at least an annual basis. The Company’s analysis included factors such as various regulatory restrictions that were established at the Bank’s inception, by the FDIC and State of Utah, and also by additional regulatory restrictions, such as the prior moratorium imposed by the Dodd-Frank Act on the acquisition of control of an industrial bank by a “commercial firm” (a company whose gross revenues are primarily derived from non-financial activities) which expired in July 2013 and the lack of any new charter issuances since the moratorium’s expiration. Because of these restrictions and other factors, the Company’s Board of Directors had previously determined that the Bank had little value beyond its recorded book value. As a result of this valuation process, the Company had previously used the Bank’s actual results of operations as the best estimate of changes in fair value, and recorded the results as a component of unrealized appreciation (depreciation) on investments. In the 2015 second quarter, the Company first became aware of external interest in the Bank and its portfolio assets at values in excess of their book value. Expression of interest in the Bank from both investment bankers and interested parties has continued. The Company incorporated these new factors in the Medallion Bank’s fair value analysis and the Board of Directors determined that the Bank had a fair value in excess of book value. In addition, in the 2016 third quarter there was a court ruling involving a marketplace lender that the Company believes heightened the interest of marketplace lenders to acquire or merge with Utah industrial banks. The Company also engaged a valuation specialist to assist the Board of Directors in their determination of the Bank’s fair value, and this appreciation of $15,500,000 was thereby recorded in 2015, and additional appreciation of $128,918,000 was recorded in 2016, $7,849,000 was recorded in 2017, and $39,826,000 was recorded in the 2018 first quarter. Refer to Note 5 for additional details.

Loans

The Company’s loans are currently reported at the principal amount outstanding, inclusive of deferred loan acquisition costs, which primarily includes deferred fees paid to loan originators, and which is amortized to interest income over the life of the loan.Effective April 2, 2018, the Company withdrew its previous election to be regulated as a business development company under the Investment Company Act of 1940, and therefore changed the Company’s financial reporting from Investment Company Accounting to Bank Holding Company Accounting. As a result, the existing loan balances were adjusted to fair value in connection with the change in reporting, and balances, net of reserves and fees, became the opening balances.


Loan origination fees and certain direct origination costs are deferred and recognized as an adjustment to the yield of the related loans. AtAs of December 31, 20202023 and 2019,2022, net loan origination costs were $20,684,000$40.0 million and $17,839,000.$34.9 million. Net amortization to income for the years ended December 31, 2020, 20192023, 2022, and 2018 was $6,021,000, $4,952,000,2021 were $8.3 million, $8.7 million, and 3,128,000 ($3,993,000 when combined with the Bank).$8.0 million.

F-10


Interest income is recorded on the accrual basis. MedallionTaxi medallion and commercial loans are placed on nonaccrual status, and all uncollected accrued interest is reversed, when there is doubt as to the collectability of interest or principal, or if loans are 90 days or more past due, unless management has determined that they are both well-secured and in the process of collection. Interest income on nonaccrual loans is generally recognized when cash is received, unless a determination has been made to apply all cash receipts to principal. The consumer loan portfolio has different characteristics, typified by a larger number of lowersmaller dollar loans that have similar characteristics. A loan is considered to be impaired, or nonperforming, when based on current information and events, it is likelyunlikely the Company will be unableable to collect all amounts due according to the contractual terms of the original loan agreement. Management considers loans that are in bankruptcy status, but have not been charged-off, to be impaired. TheseConsumer loans are placed on nonaccrual when they become 90 days past due, or earlier if they enter bankruptcy, and are charged offcharged-off in their entirety when deemed uncollectible, or when they become 120 days past due, whichever occurs first, at which time appropriate collection and recovery efforts against both the borrower and the underlying collateral are initiated. For the recreation loan portfolio, the process to repossess the collateral is started at 60 days past due. If the collateral is not located and the account reaches 120 days delinquent, the account is charged off.charged-off. If the collateral is repossessed, a loss is recorded to writeby writing the collateral down to its fair value less selling costs, and the collateral is sent to auction. When the collateral is sold, the net auction proceeds are applied to the account, and any remaining balance is written off. Proceeds collected on charged-off accounts are recorded as a recovery.recoveries. Total loans 90 days or more past due were $6,878,000 at December 31, 2020,$16.8 million or 0.57%0.77% of the total loan portfolio as of December 31, 2023, as compared to $8,663,000,$8.9 million, or 0.76% at0.47% as of December 31, 2019.2022. Beginning in the first quarter of 2023, the Company began charging off recreation loans at the point when borrowers filed for bankruptcy. This change resulted in approximately $2.5 million of loans being charged off in the first quarter of 2023.

InThe Company may modify the contractual cash flow of loans in situations where for economic or legal reasons related to a borrower’sborrowers are experiencing financial difficulties, the Company grants a concessions to the borrower for other than an insignificant period of time that the Company would not otherwise consider, the related loan is classified as a troubled debt restructuring, or TDR.difficulties. The Company strives to identify borrowers in financial difficulty early and work with them to modify their loans to more affordable terms before they reach nonaccrual status. These modified terms may include interest rate reductions, principal forgiveness, term extensions, payment forbearance and other actions intended to minimize the economic loss to the Company and to avoid foreclosure or repossession of the collateral. For modifications where the Company forgives principal, the entire amount of such principal forgiveness is immediately charged off. Loans classified as TDRsModified loans are considered impaired loans. Beginning in 2019, all consumer loans which are party to a Chapter 13 bankruptcy are immediately classified as TDRs. The Company’s policy with regard to bankrupt loans is take an immediate 40% write down of the loan balance. As a result of the Consolidated Appropriations Act, the CARES Act relief period was extended to the later of January 1, 2022 or 60 days after the date which the coronavirus, or COVID-19, national emergency terminates, companies may elect to (a) suspend the requirements of US GAAP for loan modifications related to COVID-19 that would otherwise be categorized as TDRs and (b) suspend any determination of a loan modified as a result of the effects of COVID-19 as a TDR, including impairment for accounting purposes. Any such suspension is applicable for the term of the loan modification, but solely with respect to any modification that occurs during the applicable period for a loan that was not more than 30 days past due as of December 31, 2019, and shall not apply to any adverse impact on the credit of a borrower that is not related to COVID-19. As of December 31, 2020, there were no consumer or medallion loan modifications related to COVID-19 that would have otherwise been classified as a TDR, and therefore there was no need for the Company to elect this relief under the CARES Act during 2020. However, we expect to have loan modifications related to COVID-19 that would apply under this provision of the CARES Act in the future.

Loan collateral in process of foreclosure primarily includes taxi medallion loans that have reached 120 days past due and have been charged downcharged-down to their net realizable value, in addition to consumer repossessed collateral in the process of being sold. For New York City taxi medallion loans in the process of foreclosure, the Company continued to utilize a net value of $79,500 when assessing net realizable value for these taxi medallion loans, despite fluctuating current transfer prices which may exceed that level from time to time. The medallion loan component"loan collateral in the process of foreclosure" designation reflects that the collection activities on thethese loans have transitioned from working with the borrower, to the liquidation of the collateral securing the loans.

The Company had $15,367,000 and $28,833,000 of net loans pledged as collateral under borrowing arrangements at December 31, 2020 and 2019.

The Company accounts for its sales of loans in accordance with FASB Accounting Standards Codification Topic 860, Transfers and Servicing, or FASB ASC 860, which provides accounting and reporting standards for transfers and servicing of financial assets and extinguishments of liabilities. In accordance with FASB ASC 860, the Company had elected the fair value measurement method for its servicing assets and liabilities. The principal portion of loans serviced for others by the Company and its affiliates was $107,131,000 and $113,581,000$14.0 million at December 31, 20202023 and 2019.$19.5 million December 31, 2022. The Company has evaluated the servicing aspect of its business in accordance with FASB ASC 860 which relates to servicing assets held by MFC (related to the remaining assets in Trust III) and the Bank, and determined that no material servicing asset or liability existed as of December 31, 20202023 and 2019.2022.

Allowance for Credit Losses

On January 1, 2023, the Company adopted Accounting Standards Update 2016-13, "Financial Instruments – Credit Losses (Topic 326): Measurement of Credit Losses on Financial Instruments", or ASC 326, which replaced the incurred loss methodology that delayed recognition until it was probable a loss had been incurred with a lifetime expected loss methodology using "reasonable and supportable" expectations about the future, referred to as the current expected credit loss, or CECL, methodology. For consumer loans, the Company uses historical delinquency and actual loss rates modified by quantitative adjustments based on macroeconomic factors over a twelve-month reasonable and supportable forecast period. For commercial loans, the Company assesses the historical impact that macroeconomic indicators have had on the loan portfolio, to determine an approximate allowance for credit loss. Unlike consumer loans, where loans may have similar performing characteristics, each commercial loan is unique. The Company assigned its servicing rights of the Bank’s portfolio to MSC. The costs of servicing were allocated to MSC byevaluates each commercial loan for specific impairment with additional allowance for credit losses recognized as necessary. For taxi medallion loans, the Company andmaintains specific reserves adjusting the servicing fee income was billedcarrying amount of loans down to and collected from the Bank by MSC.


Allowance for Loan Losses (Bank Holding Company Accounting)

net collateral value. The allowance for loan losses is evaluated on a regularquarterly basis by management and is based upon management’s periodic review ofon the collectability of the loans in light of historical experience, the nature and volumesize of the loan portfolio, adverse situations that may affect the borrower’sborrowers' ability to repay, estimated value of any underlying collateral, prevailing economic conditions, and excess concentration risks. In analyzing the adequacy of the allowance for loan losses, the Company uses historical delinquency and actual loss rates with a one year lookback period for consumer loans. For commercial loans deemed nonperforming, the historical loss experience and other projections are looked at. For medallion loans, delinquent nonperforming loans are valued at the median sales price for the collateral over the most recent quarter, historically non-delinquent nonperforming loans are valued at either the median sales price for the collateral over the most recent quarter or the discounted cash flow if such loans were modified and it is clear that sources other than the taxi business were instrumental in keeping such loans current, and performing medallion loans are reserved utilizing historical loss ratios over a three-year lookback period. This evaluation is inherently subjective, as it requires estimates, including those based on changes in economic conditions, that are susceptible to significant revision as more information becomes available. As a result of COVID-19, there was an increase in the reserve percentages of 50 basis points on the recreation subprime loan business during the twelve months ended December 31, 2020. In addition, the Company determined that anticipated payment activity on the medallion portfolio was impossible to quantify upon exit of the six month deferral period with borrowers, and therefore deemed all such loans as impaired. As a result, all medallion loans were written down to collateral value, net of liquidation costs, of $79,500 for New York City medallions. In total, write-downs on medallion assets were approximately $46,087,000 during 2020.  The Company continues to monitor the impact of COVID-19 on the consumer, commercial, and medallion loans. Had there been no payment deferrals offered to borrowers under the CARES Act, potential loans 90 days or more past due would have resulted in increased reserves and/or charge-offs. Credit losses are deducted from the allowance, and subsequent recoveries are added back to the allowanceallowance..

Unrealized Appreciation (Depreciation)

F-11


The Company adopted ASC 326 using the modified retrospective method for all financial assets measured at amortized cost and Realized Gains (Losses)off-balance-sheet credit exposures. Results for reporting periods beginning after December 15, 2022 are presented under ASC 326. The transition to the CECL methodology on Investments (Investment Company Accounting)January 1, 2023 resulted in an increase of $13.7 million to the Company's allowance for credit losses on loans, or ACL, and a net-of-tax cumulative-effect adjustment of $9.9 million to the beginning balance of retained earnings. The CECL methodology transition effects on the allowance for credit losses are shown in the following table:

(Dollars in thousands)


December 31, 2022
Pre-Topic 326
Adoption


Effect of ASC 326
Adoption
(Transition Amounts)


January 1, 2023
Post-ASC 326
Adoption


Assets:


Loans:


Recreation


$

41,966


$

10,037


$

52,003


Home improvement


11,340


1,518


12,858


Commercial


1,049


2,157


3,206


Taxi medallion


9,490


9,490


Strategic partnership


Allowance for credit losses on loans


$

63,845


$

13,712


$

77,557


Prior to April 2, 2018, under InvestmentJanuary 1, 2023, the Company Accounting, the Company’sused historical delinquency and actual loss rates with a three-year look-back period for taxi medallion loans net of participations and any unearned discount, were considered investment securities under the 1940 Acta one-year look-back period for recreation and recorded at fair value. As part of the fair value methodology,home improvement loans were valued at cost adjusted for any unrealized appreciation (depreciation). Since no ready market existed for these loans, the fair value was determined in good faith by the Board of Directors. In determining the fair value, the Board of Directors considered factors such as the financial condition of the borrower, the adequacy of the collateral, individual credit risks, cash flows of the borrower, market conditions for loans (e.g. valuesand used by other lenders and any active bid/ask market), historical loss experience and other projections for commercial loans. The allowance was evaluated on a quarterly basis by management based on the relationships between current and projected market rates and portfolio rates of interest and maturities. Investments other than securities, which represent collateral received from defaulted borrowers, were valued similarly.

Under Investment Company Accounting, the Company recognized unrealized appreciation (depreciation) on investments as the amount by which the fair value estimated by the Company is greater (less) than the cost basiscollectability of the investment portfolio. Realized gains or losses on investmentsloans in light of historical experience, the nature and size of the loan portfolio, adverse situations that may affect the borrowers' ability to repay, estimated value of any underlying collateral, prevailing economic conditions, and excess concentration risks. This evaluation was inherently subjective, as it required estimates that were generated through sales of investments, foreclosure on specific collateral, and writeoffs of loans or assets acquired in satisfaction of loans, net of recoveries. Refersusceptible to Note 5 for additional details.significant revision as more information became available.


Goodwill and Intangible Assets

The Company’s goodwill and intangible assets arose as a result of the excess of fair value over book value for several of the Company’s previously unconsolidated portfolio investment companies as of April 2, 2018. This fair value was brought forward under the Company’s new reporting, and was subject to a purchase price accounting allocation process conducted by an independent third partythird-party expert to arrive at the current categories and amounts. Goodwill is not amortized, but is subject to quarterly review by management to determine whether additional impairment testing is needed, and such testing is performed at least on an annual basis. Intangible assets are amortized over their useful life of approximately 20 years. As of December 31, 20202023 and 2019,2022, the Company had goodwill of $150,803,000, which all related to the Bank, and intangible assets of $51,090,000$20.6 million and $52,536,000, and the$22.0 million. The Company recognized $1,445,000, $1,446,000 and $1,083,000$1.4 million of amortization expense on the intangible assets for each of the twelve monthsyears ended December 31, 2020, 2019,2023 and 2018.2022. Additionally, loan portfolio premiums of $12,387,000$12.4 million were determined as of April 2, 2018, of which $2,717,000 and $5,758,000none were outstanding atas of December 31, 20202023 and 2019,2022, and of which $3,041,000, $3,289,000$0.0 million, $0.5 million, and $3,339,000 were$2.2 million was amortized to interest income for the twelve monthsyears ended December 31, 2020, 2019,2023, 2022, and 2018. The Company engaged an expert to assess2021. Management performed a step 0 analysis in assessing the goodwill and intangibles for impairment at December 31, 20202023 and 2019, who concluded2022, concluding that there was 0no impairment on the Bank and on the RPAC intangible asset.of these assets.

The following table below shows the details of the intangible assets as of the dates presented.December 31, 2023 and 2022:


December 31,


(Dollars in thousands)


2023


2022


Brand-related intellectual property


$

4,916


$

16,775


Home improvement contractor relationships


15,675


5,260


Total intangible assets


$

20,591


$

22,035


(Dollars in thousands)


December 31, 2020


December 31, 2019


Brand-related intellectual property


$

18,974


$

20,075


Home improvement contractor relationships


5,951


6,296


Race organization


26,165


26,165


Total intangible assets


$

51,090


$

52,536


Fixed Assets

Fixed assets are carried at cost less accumulated depreciation and amortization, and are depreciated on a straight-line basis over their estimated useful lives of 3 to 10 years.years. Leasehold improvements are amortized on a straight-line basis over the shorter of the lease term or the estimated economic useful life of the improvement. Depreciation and amortization expense was $412,000, $418,000,$0.4 million, $0.4 million, and $422,000$0.3 million for the years ended December 31, 2020, 2019,2023, 2022, and 2018.2021.

F-12


Deferred Costs

Deferred financing costs represent costs associated with obtaining the Company’s borrowing facilities, and are amortized on a straight line basis over the lives of the related financing agreements and life of the respective pool. Amortization expense was $2,558,000, $2,348,000,$3.1 million, $2.6 million, and $1,864,000$2.4 million for the years ended December 31, 2020, 2019,2023, 2022, and 2018, recorded as interest expense.2021. In addition, the Company capitalizes certain costs for transactions in the process of completion (other than business combinations), including those for potential investments, and the sourcing of other financing alternatives. Upon completion or termination of the transaction, any accumulated amounts will be amortized against income over an appropriate period, or written off. The amountsamount on the Company’s balance sheet for all of these purposes were $5,805,000$8.5 million and $5,105,000 at$7.0 million as of December 31, 20202023 and 2019.2022.


Income Taxes

Income taxes are accounted for using the asset and liability approach in accordance with FASB ASC Topic 740, Income Taxes, or ASC 740. Deferred tax assets and liabilities reflect the impact of temporary differences between the carrying amount of assets and liabilities and their tax basis and are stated at tax rates expected to be in effect when taxes are actually paid or recovered. Deferred tax assets are also recorded for net operating losses, capital losses and any tax credit carryforwards. A valuation allowance is provided against a deferred tax asset when it is more likely than not that some or all of the deferred tax assets will not be realized. All available evidence, both positive and negative, is considered to determine whether a valuation allowance for deferred tax assets is needed. Items considered in determining the Company’s valuation allowance include expectations of future earnings of the appropriate tax character, recent historical financial results, tax planning strategies, the length of statutory carryforward periods and the expected timing of the reversal of temporary differences. The Company recognizes tax benefits of uncertain tax positions only when the position is more likely than not to be sustained assuming examination by tax authorities. The Company records income tax related interest and penalties, if applicable, within current income tax expenseexpense..

Sponsorship and Race Winnings

The Company accounts for sponsorship and race winnings revenue under FASB ASC Topic 606, Revenue from Contracts with Customers. Sponsorship revenue is recognized when the Company’s performance obligations are completed in accordance with the contract terms of the sponsorship contract. Race winnings revenue is recognized after each race during the season based upon terms provided by NASCAR and the placement of the driver.

Earnings (Loss) Per Share (EPS)

Basic earnings (loss) per share are computed by dividing net income (loss)/net increase (decrease) in net assets resulting from operations available to common stockholders by the weighted average number of common shares outstanding for the period. Diluted earnings per share reflect the potential dilution that could occur if option contracts to issue common stock were exercised, or if restricted stock vests, and has been computed after giving consideration toconsidering the weighted average dilutive effect of the Company’s stock options and restricted stock. The Company uses the treasury stock method to calculate diluted EPS, which is a method of recognizing the use of proceeds that could be obtained upon exercise of options and warrants, including unvested compensation expense related to the shares, in computing diluted EPS. It assumes that any proceeds would be used to purchase common stock at the average market price during the period. The table below shows the calculation of basic and diluted EPS.


Years Ended December 31,


(Dollars in thousands, except share and per share data)


2020


2019


2018


Net loss/net increase in net assets resulting from

   operations available to common stockholders


$

(34,783

)


$

(1,762

)


$

(25,046

)

Weighted average common shares outstanding applicable

   to basic EPS


24,445,452


24,342,979


24,214,978


Effect of dilutive stock options


Effect of restricted stock grants


Adjusted weighted average common shares outstanding

   applicable to diluted EPS


24,445,452


24,342,979


24,214,978


Basic loss per share


$

(1.42

)


$

(0.07

)


$

(1.03

)

Diluted loss per share


(1.42

)


(0.07

)


(1.03

)


Year Ended December 31,


(Dollars in thousands, except share and per share data)


2023


2022


2021


Net income attributable to common stockholders


$

55,079


$

43,840


$

54,108


Weighted average common shares outstanding applicable to basic EPS


22,510,435


23,583,049


24,599,804


Effect of restricted stock grants


461,098


276,469


250,763


Effect of dilutive stock options


142,216


67,825


92,602


Effect of performance stock unit grants


134,574


Adjusted weighted average common shares outstanding applicable to diluted EPS


23,248,323


23,927,342


24,943,169


Basic income per share


$

2.45


$

1.86


$

2.20


Diluted income per share


2.37


1.83


2.17


Potentially dilutive common shares excluded from the above calculations aggregated 934,003, 462,180,92,310 shares, 347,963 shares, and 100,000421,190 shares as of December 31, 2020, 2019,2023, 2022, and 2018.2021.

Stock Compensation

The Company follows FASB ASC Topic 718, or ASC 718, Compensation – Stock Compensation, for its equity incentive, stock option, and restricted stock plans, and accordingly, the Company recognizes the expense of these grants as required. Stock-based employee compensation costs pertaining to stock options are reflected in net income/ net increase in net assetsincome resulting from operations for any new grants using the fair values established by usage of the Black-Scholes option pricing model, expensed over the vesting period of the underlying option. Stock-based employee compensation costs pertaining to restricted stock are reflected in net income/net increase net assetsincome resulting from operations for any new grants using the grant date fair value of the shares granted, expensed over the vesting period of the underlying stock.


During 2020, 2019,the years ended December 31, 2023, 2022, and 2018,2021, the Company issued 229,408, 216,148,399,793, 522,475, and 101,010258,120 restricted shares of stock-based compensation awards, issued 444,557, 449,450,296,444, 0, and 39,0000 performance stock units, 83,158, 129,638, and 16,803 restricted stock units, and 0, 0, and 317,398 shares of other stock-based compensation awards, and issued 47,156, 26,040, and 0 of restricted share units of stock based compensation awards,awards; and recognized $2,030,000, $1,221,000,$4.7 million, $3.5 million, and $576,000,$2.3 million, or $0.08, $0.05,$0.20, $0.15, and $0.02,$0.09 per diluted common share for each respective year, of non-cash stock-based compensation expense related to the grants. As of December 31, 2020,2023, the total remaining unrecognized compensation cost related to unvested stock options and restricted stock was $2,405,000,$5.0 million, which is expected to be recognized over the next 16 quarters9. See Note 9 for additional details. quarters.

F-13


Regulatory Capital

The Bank is subject to various regulatory capital requirements administered by the FDIC and the Utah Department of Financial Institutions. Failure to meet minimum capital requirements can initiate certain mandatory and possible additional discretionary actions by regulators that, if undertaken, could have a direct material effect on the Bank’s financial statements. Under capital adequacy guidelines and the regulatory framework for prompt corrective action, the Bank must meet specific capital guidelines that involve quantitative measures of the Bank’s assets, liabilities, and certain off-balance sheet items as calculated under regulatory accounting practices. The Bank’s capital amounts and classifications are also subject to qualitative judgments by the bank regulators about components, risk weightings, and other factors.

FDIC-insured banks, including the Bank, are subject to certain federal laws, which impose various legal limitations on the extent to which banks may finance or otherwise supply funds to certain of their affiliates. In particular, the Bank is subject to certain restrictions on any extensions of credit to, or other covered transactions with, such as certain purchases of assets, with the Company or its affiliates.

Quantitative measures established by regulation to ensure capital adequacy require the Bank to maintain minimum amounts and ratios as defined in the regulations (set forth in the table below). Additionally, as conditions of granting the Bank’s application for federal deposit insurance, the FDIC ordered that the Tier 1 leverage capital to total assets ratio, as defined, be not less than 15%15%, a level which could preclude its ability to pay dividends to the Company, and that an adequate allowance for loancredit losses be maintained. As of December 31, 2020,2023, the Bank’s Tier 1 leverage ratio was 16.93%16.2%. The Bank’s actual capital amounts and ratios, and the regulatory minimum ratios are presented in the following table.


Regulatory


Regulatory


December 31,


(Dollars in thousands)


Minimum


Well-Capitalized


December 31, 2020


December 31, 2019


Minimum


Well-Capitalized


2023


2022


Common equity tier 1 capital


0


0


$

148,507


$

158,187


$

293,774


$

242,049


Tier 1 capital


0


0


217,295


226,975


362,561


310,837


Total capital


0


0


233,460


241,842


390,153


334,913


Average assets


0


0


1,283,664


1,172,866


2,232,816


1,917,904


Risk-weighted assets


0


0


1,243,783


1,144,337


2,155,641


1,888,530


Leverage ratio (1)


4.0

%


5.0

%


16.9

%


19.4

%


4.0

%


5.0

%


16.2

%


16.2

%

Common equity tier 1 capital ratio (2)


7.0


6.5


11.9


13.8


7.0


6.5


13.6


12.8


Tier 1 capital ratio (3)


8.5


8.0


17.5


19.8


8.5


8.0


16.8


16.5


Total capital ratio (3)


10.5


10.0


18.8


21.1


10.5


10.0


18.1


17.7


(1)
Calculated by dividing Tier 1 capital by average assets.
(2)
Calculated by subtracting preferred stock or non-controlling interest from Tier 1 capital and dividing by risk-weighted assets.
(3)
Calculated by dividing Tier 1 or total capital by risk-weighted assets.

(1)

Calculated by dividing Tier 1 capital by average assets.

(2)

Calculated by subtracting preferred stock or non-controlling interests from Tier 1 capital and dividing by risk-weighted assets.

(3)

Calculated by dividing Tier 1 or total capital by risk-weighted assets.

In the table above, the minimum risk-based ratios as of December 31, 20202023 and 20192022 reflect the capital conservation buffer of 2.5%2.5%. TheThe minimum regulatory requirements, inclusive of the capital conservation buffer, were the binding requirements for the risk-based requirements, and the “well-capitalized” requirements were the binding requirements for Tier 1 leverage capital as of both December 31, 20202023 and 20192022..

Recently Issued Accounting Standards

On January 1, 2023, the Company adopted ASC 326. Please refer to Allowance for Credit Losses, within this footnote, for the impact of adopting this standard.

In June 2016,March 2023, the FASB issued ASU 2016-13, Financial Instruments – Credit Losses,2023-02, Investments - Equity Method and Joint Ventures, or Topic 326: Measurement of323: Accounting for Investments in Tax Credit Losses on Financial Instruments.Structures Using the Proportional Amortization Method. The main objective of this new standard is to provide financial statement users with more decision-useful information aboutallow reporting entities to consistently account for equity investments made primarily for the expected credit losses on financial assetspurpose of receiving income tax credits and other commitments to extend credit held by a reporting entity at each reporting date. Under the FASB’s new standard, the concepts used by entities to account for credit losses on financial instruments will fundamentally change.income tax benefits. The existing “probable” and “incurred” loss recognition threshold is removed. Loss estimates


amendments in this update are based upon lifetime “expected” credit losses. The use of past and current events must now be supplemented with “reasonable and supportable” expectations about the future to determine the amount of credit loss. The collective changes to the recognition and measurement accounting standards for financial instruments and their anticipated impact on the allowance for credit losses modeling have been universally referred to as the CECL (current expected credit loss) model. ASU 2016-13 applies to all entities and is effective for fiscal years beginning after December 15, 2019 for public entities, with early adoption permitted. 2023. The Company is assessing the impact of the update on the accompanying financial statements.

In November 2019,October 2023, the FASB issued ASU 2019-102023-06, Disclosure Improvements. The amendments in this update seek to defer implementationclarify or improve disclosure and presentation requirements. The Company is assessing the impact of the standardupdate on the accompanying financial statements.

In November 2023, the FASB issued ASU 2023-07, Segment Reporting, or Topic 280: Improvements to Reportable Segment Disclosures. The main objective of this update is to provide transparency about income tax information through improvements to income tax disclosures primarily related to the rate reconciliation and income taxes paid information. The amendments in this update are effective for smaller reporting companies, such as the Company, to fiscal years beginning after December 15, 2022. 2023. The Company is assessing the impact of the update will have on itsthe accompanying financial statements,statements.

F-14


In December 2023, the FASB issued ASU 2023-09, Income Taxes, or Topic 740: Improvements to Income Tax Disclosures. The main objective of this update is to improve financial reporting disclosure of incremental segment information on an annual and expectsinterim basis for all public entities to enable investors to develop more decision-useful financial analyses. The amendments in this update are effective for the annual periods beginning after December 15, 2024. The Company is assessing the impact of the update to have a material impact on the Company’s accounting for estimated credit losses on its loans.accompanying financial statements.

Reclassifications

Reclassifications

Certain reclassifications have been made to prior year balances to conform with the current year presentation. These reclassifications have no effect on the previously reported results of operations.

(3) INVESTMENT SECURITIES

FixedThe following tables present details of fixed maturity securities available for sale atas of December 31, 20202023 and 2019 consisted of the following:2022.

December 31, 2023
(Dollars in thousands)


Amortized
Cost


Gross
Unrealized
Gains


Gross
Unrealized
Losses


Fair
Value


Mortgage-backed securities, principally obligations of U.S. federal agencies


$

44,653


$


$

(4,791

)


$

39,862


State and municipalities


13,733


21


(1,501

)


12,253


Agency bonds


2,187


(20

)


2,167


Total


$

60,573


$

21


$

(6,312

)


$

54,282


December 31, 2022
(Dollars in thousands)


Amortized
Cost


Gross
Unrealized
Gains


Gross
Unrealized
Losses


Fair
Value


Mortgage-backed securities, principally obligations of U.S. federal agencies


$

43,286


$


$

(4,933

)


$

38,353


State and municipalities


11,015


13


(889

)


10,139


Total


$

54,301


$

13


$

(5,822

)


$

48,492


December 31, 2020

(Dollars in thousands)


Amortized

Cost


Gross

Unrealized

Gains


Gross

Unrealized

Losses


Fair

Value


Mortgage-backed securities, principally obligations of US

   federal agencies


$

34,929


$

1,495


$

(45

)


$

36,379


State and municipalities


10,226


189


(2

)


10,413


Total


$

45,155


$

1,684


$

(47

)


$

46,792


December 31, 2019

(Dollars in thousands)


Amortized

Cost


Gross

Unrealized

Gains


Gross

Unrealized

Losses


Fair

Value


Mortgage-backed securities, principally obligations of US

   federal agencies


$

36,335


$

411


$

(112

)


$

36,634


State and municipalities


12,279


186


(101

)


12,364


Total


$

48,614


$

597


$

(213

)


$

48,998


The amortized cost and estimated market value of investment securities as of December 31, 20202023 by contractual maturity are shown below. Actual maturities will differ from contractual maturities because borrowers may have the right to call or prepay obligations with or without call or prepayment penalties.

December 31, 2023
(Dollars in thousands)


Amortized
Cost


Fair
Value


Due in one year or less


$

2,395


$

2,336


Due after one year through five years


7,313


7,049


Due after five years through ten years


8,833


7,808


Due after ten years


42,032


37,089


Total


$

60,573


$

54,282


(Dollars in thousands)


Amortized

Cost


Fair

Value


Due in one year or less


$

25


$

25


Due after one year through five years


12,485


12,956


Due after five years through ten years


14,499


15,214


Due after ten years


18,146


18,597


Total


$

45,155


$

46,792


The following tables show information pertaining to securities with gross unrealized losses atas of December 31, 20202023 and 2019,2022, aggregated by investment category and length of time that individual securities have been in a continuous loss position follows.


Less than Twelve Months


Twelve Months and Over


December 31, 2020

(Dollars in thousands)


Gross

Unrealized

Losses


Fair

Value


Gross

Unrealized

Losses


Fair

Value


Mortgage-backed securities, principally obligations of US

federal agencies


$

(45

)


$

4,028


$


$


Less than Twelve Months


Twelve Months and Over


December 31, 2023
(Dollars in thousands)


Gross
Unrealized
Losses


Fair
Value


Gross
Unrealized
Losses


Fair
Value


Mortgage-backed securities, principally obligations of U.S. federal agencies


$

(78

)


$

5,797


$

(4,714

)


$

33,971


State and municipalities


(2

)


196


$

(204

)


$

4,839


$

(1,296

)


$

7,371


Agency bonds


(20

)


2,167


Total


$

(45

)


$

4,028


$

(2

)


$

196


$

(282

)


$

10,636


$

(6,030

)


$

43,509


Less than Twelve Months


Twelve Months and Over


Less than Twelve Months


Twelve Months and Over


December 31, 2019

(Dollars in thousands)


Gross

Unrealized

Losses


Fair

Value


Gross

Unrealized

Losses


Fair

Value


Mortgage-backed securities, principally obligations of US

federal agencies


$

(74

)


$

8,291


$

(38

)


$

4,939


December 31, 2022
(Dollars in thousands)


Gross
Unrealized
Losses


Fair
Value


Gross
Unrealized
Losses


Fair
Value


Mortgage-backed securities, principally obligations of U.S. federal agencies


$

(731

)


$

12,321


$

(4,202

)


$

26,023


State and municipalities


(17

)


2,099


(84

)


2,739


(286

)


4,628


(603

)


3,502


Total


$

(91

)


$

10,390


$

(122

)


$

7,678


$

(1,017

)


$

16,949


$

(4,805

)


$

29,525


UnrealizedAs of December 31, 2023 and 2022, the Company had 60 and 57 securities with unrealized losses on securitiesthat have not been recognized intoin income because the issuers’issuers' bonds are of high credit quality, and the Company has the intent and ability to hold the securities for the foreseeable future. The fair value is expected to recover as the bonds approach the maturity date.

F-15


(4) LOANS AND ALLOWANCE FOR LOANCREDIT LOSSES

The following table shows the major classification of loans, inclusive of capitalized loan origination costs, at December 31, 20202023 and 2019.2022.


As of December 31,


2023


2022


(Dollars in thousands)


Amount


As a
Percent of
Gross Loans


Amount


As a
Percent of
Gross Loans


Recreation


$

1,336,226


60

%


$

1,183,512


62

%

Home improvement


760,617


34


626,399


33


Commercial


114,827


5


92,899


5


Taxi medallion


3,663


*


13,571


1


Strategic partnership


553


*


572


*


Total gross loans


2,215,886


100

%


1,916,953


100

%

Allowance for credit losses


(84,235

)


(63,845

)


Total net loans


$

2,131,651


$

1,853,108


(*) Less than 1%.


As of December 31, 2020


As of December 31, 2019


(Dollars in thousands)


Amount


As a

Percent of

Gross Loans


Amount


As a

Percent of

Gross Loans


Recreation


$

792,686


65

%


$

713,332


62

%

Home improvement


334,033


27


247,324


21


Commercial


65,327


5


69,767


6


Medallion


37,768


3


130,432


11


Strategic partnership


24


Total gross loans


1,229,838


100

%


1,160,855


100

%

Allowance for loan losses


(57,548

)


(46,093

)


Total net loans


$

1,172,290


$

1,114,762


The following tables show the activity of the gross loans for the twelve monthsyears ended December 31, 20202023 and 2019.2022.


(Dollars in thousands)


Recreation


Home
Improvement


Commercial


Taxi
Medallion


Strategic
Partnership


Total


Gross loans – December 31, 2022


$

1,183,512


$

626,399


$

92,899


$

13,571


$

572


$

1,916,953


Loan originations


447,039


357,394


34,850


2,426


118,338


960,047


Principal payments, sales, maturities, and recoveries


(231,158

)


(209,894

)


(13,389

)


(6,859

)


(118,357

)


(579,657

)

Charge-offs


(50,512

)


(12,308

)


(1,019

)


(3,829

)


(67,668

)

Transfer to loan collateral in process of foreclosure, net


(18,875

)


(2,306

)


(21,181

)

Amortization of origination costs


(12,270

)


2,668


14


(9,588

)

FASB origination costs, net


18,490


(3,642

)


(164

)


660


15,344


Paid-in-kind interest


1,636


1,636


Gross loans – December 31, 2023


$

1,336,226


$

760,617


$

114,827


$

3,663


$

553


$

2,215,886


(Dollars in thousands)


Recreation


Home
Improvement


Commercial


Taxi
Medallion


Strategic
Partnership


Total


Gross loans – December 31, 2021


$

961,320


$

436,772


$

76,696


$

14,046


$

90


$

1,488,924


Loan originations


513,062


392,543


28,172


605


49,526


983,908


Principal payments, sales, maturities, and recoveries


(259,326

)


(196,203

)


(6,610

)


(419

)


(49,044

)


(511,602

)

Charge-offs


(27,055

)


(6,393

)


(6,083

)


(314

)


(39,845

)

Transfer to loan collateral in process of foreclosure, net


(12,444

)


(347

)


(12,791

)

Amortization of origination costs


(10,470

)


1,763


(8,707

)

Amortization of loan premium


(213

)


(322

)


(535

)

FASB origination costs, net


18,638


(1,761

)


16,877


Paid-in-kind interest


724


724


Gross loans – December 31, 2022


$

1,183,512


$

626,399


$

92,899


$

13,571


$

572


$

1,916,953


Twelve Months Ended December 31, 2020

(Dollars in thousands)


Recreation


Home

Improvement


Commercial


Medallion


Strategic Partnership


Total


Gross loans – December 31, 2019


$

713,332


$

247,324


$

69,767


$

130,432


$


$

1,160,855


Loan originations


294,885


193,098


7,575


1,663


497,221


Principal payments, sales, and maturities


(187,989

)


(105,813

)


(13,183

)


(13,207

)


(1,639

)


(321,831

)

Charge-offs, net


(14,457

)


(1,229

)


(28

)


(42,648

)


(58,362

)

Transfer to loan collateral in process of foreclosure, net


(14,871

)


(32,383

)


(47,254

)

Amortization of origination costs


(7,809

)


1,910


8


(131

)


(6,022

)

Amortization of loan premium


(191

)


(320

)


(2,531

)


(3,042

)

FASB origination costs, net


9,786


(937

)


36


8,885


Paid-in-kind interest


1,188


1,188


Transfer to other foreclosed property


(1,800

)


(1,800

)

Gross loans – December 31, 2020


$

792,686


$

334,033


$

65,327


$

37,768


$

24


$

1,229,838


F-16


Twelve Months Ended December 31, 2019

(Dollars in thousands)


Recreation


Home

Improvement


Commercial


Medallion


Total


Gross loans – December 31, 2018


$

587,038


$

183,155


$

64,083


$

183,606


$

1,017,882


Loan originations


301,403


142,112


18,578


462,093


Principal payments, sales, and maturities


(146,873

)


(76,157

)


(13,553

)


(15,070

)


(251,653

)

Charge-offs, net


(17,419

)


(786

)


(819

)


(18,664

)


(37,688

)

Transfer to loan collateral in process of foreclosure, net


(14,512

)


(16,836

)


(31,348

)

Amortization of origination costs


(6,428

)


1,561


34


(119

)


(4,952

)

Amortization of loan premium


(247

)


(416

)


(2,626

)


(3,289

)

FASB origination costs, net


10,370


(2,145

)


610


141


8,976


Paid-in-kind interest


834


834


Gross loans – December 31, 2019


$

713,332


$

247,324


$

69,767


$

130,432


$

1,160,855


The following table sets forth the activity in the allowance for loancredit losses for the twelve monthsyears ended December 31, 20202023 and 2019.2022.


December 31,


(Dollars in thousands)


2023


2022


Allowance for credit losses – beginning balance (1)


$

63,845


$

50,166


CECL transition amount upon ASU 2016-13 adoption


13,712


Charge-offs


Recreation


(50,512

)


(27,055

)

Home improvement


(12,308

)


(6,393

)

Commercial


(1,019

)


(6,083

)

Taxi medallion


(3,829

)


(314

)

Total charge-offs


(67,668

)


(39,845

)

Recoveries


Recreation


11,449


13,785


Home improvement


2,886


2,761


Commercial


10


47


Taxi medallion


22,191


6,872


Total recoveries


36,536


23,465


Net charge-offs (2)


(31,132

)


(16,380

)

Provision for credit losses


37,810


30,059


Allowance for credit losses – ending balance (3)


$

84,235


$

63,845


(1)
Represents allowance prior to the adoption of ASU 2016-13.
(2)
As of December 31, 2023, cumulative net charge-offs of loans and loan collateral in process of foreclosure in the taxi medallion portfolio were $176.8 million, including $107.9 million related to loans secured by New York taxi medallions, some of which may represent collection opportunities for the Company.
(3)
As of December 31, 2023 and 2022, there was no allowance for credit losses and net charge-offs related to the strategic partnership loans.

With the adoption of ASC 326, the Company also adopted ASU 2022-02, Financial Instruments – Credit Losses, or Topic 326: Troubled Debt Restructurings and Vintage Disclosures. Under this standard, the Company is required to disclose current period gross write-offs, by year of origination, for financing receivables.


Twelve Months Ended


(Dollars in thousands)


December 31, 2020


December 31, 2019


Allowance for loan losses – beginning balance


$

46,093


$

36,395


Charge-offs


Recreation


(23,543

)


(24,433

)

Home improvement


(2,909

)


(2,504

)

Commercial


(31

)


(819

)

Medallion


(49,361

)


(22,205

)

Total charge-offs


(75,844

)


(49,961

)

Recoveries


Recreation


9,086


7,014


Home improvement


1,680


1,718


Commercial


3


Medallion


6,713


3,541


Total recoveries


17,482


12,273


Net charge-offs (1)


(58,362

)


(37,688

)

Provision for loan losses


69,817


47,386


Allowance for loan losses – ending balance (2) (3)


$

57,548


$

46,093


(Dollars in thousands)


2023


2022


2021


2020


2019


Prior


Total


Recreation


$

3,136


$

18,836


$

10,857


$

5,115


$

5,001


$

7,567


$

50,512


Home improvement


2,196


5,686


2,662


702


435


627


12,308


Commercial


119


900


1,019


Taxi medallion


3,829


3,829


Total


$

5,332


$

24,522


$

13,638


$

5,817


$

6,336


$

12,023


$

67,668


(1)

As of December 31, 2020, cumulative charge-offs of loans and loan collateral in process of foreclosure in the medallion loan portfolio were $279,188, some of which represents collection opportunities for the Company.

(2)

As of December 31, 2020, the general reserves previously recorded for the Company’s medallion loan portfolio had been reversed as all loans had been deemed impaired and written down to collateral value.

(3)

As of December 31, 2020, there was 0 allowance for loan losses and net charge-offs related to the strategic partnership loans.

The following tables set forth the allowance for loancredit losses by type as of December 31, 20202023 and 2019.2022.

December 31, 2023
(Dollars in thousands)


Amount


Percentage
of Allowance


Allowance as
a Percent of
Loan Category


Allowance as
a Percent of
Nonaccrual


Recreation


$

57,532


68

%


4.31

%


221.50

%

Home improvement


21,019


25


2.76


80.92


Commercial


4,148


5


3.61


15.97


Taxi medallion


1,536


2


41.93


5.91


Total


$

84,235


100

%


3.80

%


324.31

%

December 31, 2022
(Dollars in thousands)


Amount


Percentage
of Allowance


Allowance as
a Percent of
Loan Category


Allowance as
a Percent of
Nonaccrual


Recreation


$

41,966


66

%


3.55

%


130.60

%

Home improvement


11,340


18


1.81


35.29


Commercial


1,049


1


1.13


3.26


Taxi medallion


9,490


15


69.93


29.53


Total


$

63,845


100

%


3.33

%


198.69

%

December 31, 2020

(Dollars in thousands)


Amount


Percentage

of Allowance


Allowance as

a Percent of

Loan Category


Allowance as

a Percent of

Nonaccrual


Recreation


$

27,348


48

%


3.45

%


378.20

%

Home improvement


5,157


9


1.54


NM


Commercial


Medallion


25,043


43


66.31


68.01


Total


$

57,548


100

%


4.68

%


93.17

%


December 31, 2019

(Dollars in thousands)


Amount


Percentage

of Allowance


Allowance as

a Percent of

Loan Category


Allowance as

a Percent of

Nonaccrual


Recreation


$

18,075


39

%


2.53

%


228.25

%

Home improvement


2,608


6


1.05


NM


Commercial


Medallion


25,410


55


19.48


389.84


Total


$

46,093


100

%


3.97

%


174.04

%

The following table presents total nonaccrual loans and foregone interest, substantially all of which is in the taxi medallion portfolio. The fluctuation in nonaccrual interest foregone is due to past due loans and market conditions.


December 31,


(Dollars in thousands)


2020


2019


2018


Total nonaccrual loans


$

61,767


$

26,484


$

34,877


Interest foregone for the year


3,311


2,152


1,153


Amount of foregone interest applied to principal

   for the year


602


254


535


Interest foregone life-to-date


5,252


2,744


1,952


Amount of foregone interest applied to principal

   life-to-date


792


471


1,214


Percentage of nonaccrual loans to gross loan portfolio


5

%


2

%


3

%

Percentage of allowance for loan losses to nonaccrual loans


93


174


104


Year Ended December 31,


(Dollars in thousands)


2023


2022


2021


Total nonaccrual loans


$

25,974


$

32,133


$

35,571


Interest foregone for the year


928


1,267


1,620


Amount of foregone interest applied to principal for the year


238


375


432


Interest foregone life-to-date


2,119


2,419


3,623


Amount of foregone interest applied to principal life-to-date


822


1,204


942


Percentage of nonaccrual loans to gross loan portfolio


1.2

%


1.7

%


2.4

%

Percentage of allowance for credit losses to nonaccrual loans


324.3

%


198.7

%


141.0

%


F-17


The following tables present the performance status of loans as of December 31, 20202023 and 2019.2022.

December 31, 2020

(Dollars in thousands)


Performing


Nonperforming


Total


Percentage of

Nonperforming

to Total


December 31, 2023
(Dollars in thousands)


Performing


Nonperforming


Total


Percentage of
Nonperforming
to Total


Recreation


$

785,047


$

7,639


$

792,686


0.96

%


$

1,326,567


$

9,655


$

1,336,222


0.72

%

Home improvement


333,862


171


334,033


0.05


759,128


1,493


760,621


0.20


Commercial


48,731


16,596


65,327


25.40


103,664


11,163


114,827


9.72


Medallion


37,768


(1)


37,768


100.00


Taxi medallion


3,663


3,663


100.00


Strategic partnership


24


24


0.00


553


553


Total


$

1,167,664


$

62,174


(2)

$

1,229,838


5.06

%


$

2,189,912


$

25,974


$

2,215,886


1.17

%


December 31, 2019

(Dollars in thousands)


Performing


Nonperforming


Total


Percentage of

Nonperforming

to Total


December 31, 2022
(Dollars in thousands)


Performing


Nonperforming


Total


Percentage of
Nonperforming
to Total


Recreation


$

705,070


$

8,262


$

713,332


1.16

%


$

1,173,846


$

9,666


$

1,183,512


0.82

%

Home improvement


247,139


185


247,324


0.07


625,820


579


626,399


0.09


Commercial


57,905


11,862


69,767


17.00


84,165


8,734


92,899


9.40


Medallion


88,248


42,184


130,432


32.34


Taxi medallion


13,571


13,571


100.00


Strategic partnership


572


572


Total


$

1,098,362


$

62,493


(2)

$

1,160,855


5.38

%


$

1,884,403


$

32,550


$

1,916,953


1.70

%

(1)

Includes medallion loan premiums of $1,615 as of December 31, 2020.

(2)

Includes $408 and $36,009 of TDRs as of December 31, 2020 and 2019, which are accruing and paying currently, but which are considered nonperforming loans under GAAP.

For those performing loans aged under 90 days past due, there is a possibility that their delinquency status will continue to deteriorate and they will subsequently be placed on nonaccrual status and be reserved for, and as such, deemed nonperforming.

The following tables provide additional information on attributes of the nonperforming loan portfolio as of December 31, 20202023 and 2019,2022, all of which had an allowance recorded against the principal balance.


December 31,


2023


2022


(Dollars in thousands)


Recorded
Investment


Unpaid
Principal
Balance


Related
Allowance


Recorded
Investment


Unpaid
Principal
Balance


Related
Allowance


With an allowance recorded


Recreation


$

9,655


$

9,655


$

416


$

9,666


$

9,666


$

343


Home improvement


1,493


1,493


41


579


579


10


Commercial


11,163


11,301


1,897


8,734


8,823


963


Taxi medallion


3,663


4,347


1,536


13,571


14,686


9,490


Total nonperforming loans with an allowance


$

25,974


$

26,796


$

3,890


$

32,550


$

33,754


$

10,806


Year Ended December 31,


2023


2022


(Dollars in thousands)


Average
Investment
Recorded


Interest Income
Recognized


Average
Investment
Recorded


Interest Income
Recognized


With an allowance recorded


Recreation


$

9,048


$

16


$

9,093


$

401


Home improvement


1,382


1


514


4


Commercial


7,368


13,381


Taxi medallion


4,607


16,019


Total nonperforming loans with an allowance


$

22,405


$

17


$

39,007


$

405


December 31, 2020


December 31, 2019


(Dollars in thousands)


Recorded

Investment


Unpaid

Principal

Balance


Related

Allowance


Recorded

Investment


Unpaid

Principal

Balance


Related

Allowance


With an allowance recorded


Recreation


$

7,639


$

7,639


$

264


$

8,262


$

8,262


$

329


Home improvement


171


171


3


185


185


3


Commercial


16,596


16,600


11,862


11,867


Medallion


37,768


38,368


25,043


42,184


42,650


14,824


Total nonperforming loans with an allowance


$

62,174


$

62,778


$

25,310


$

62,493


$

62,964


$

15,156


F-18


For the Twelve Months Ended


December 31, 2020


December 31, 2019


(Dollars in thousands)


Average

Investment

Recorded


Interest Income

(Expense)

Recognized


Average

Investment

Recorded


Interest Income

(Expense)

Recognized


With an allowance recorded


Recreation


$

7,949


$

560


$

8,317


$

471


Home improvement


172


2


185


Commercial


16,884


123


7,886


392


Medallion


40,928


465


44,721


346


Total nonperforming loans with an allowance


$

65,933


$

1,150


$

61,109


$

1,209


The following tables show the aging of all loans as of December 31, 20202023 and 2019.2022.

December 31, 2023


Days Past Due


Recorded
Investment
90 Days and


(Dollars in thousands)


30-59


60-89


90 +


Total


Current


Total (1)


Accruing


Recreation


$

40,282


$

15,039


$

9,095


$

64,416


$

1,228,175


$

1,292,591


$


Home improvement


3,936


2,562


1,502


8,000


756,069


764,069


Commercial


2,156


6,240


8,396


107,140


115,536


Taxi medallion


201


201


3,462


3,663


Strategic partnership


553


553


Total


$

44,419


$

19,757


$

16,837


$

81,013


$

2,095,399


$

2,176,412


$


Days Past Due


Recorded

Investment


December 31, 2020

(Dollars in thousands)


30-59


60-89


90 +


Total


Current


Total (1)


90 Days and

Accruing


Recreation


$

22,058


$

7,582


$

5,343


$

34,983


$

732,391


$

767,374


$

0


Home improvement


813


218


170


1,201


335,684


336,885


0


Commercial


75


75


65,265


65,340


0


Medallion


2,019


973


1,290


4,282


31,871


36,153


0


Strategic partnership


24


24


0


Total


$

24,890


$

8,773


$

6,878


$

40,541


$

1,165,235


$

1,205,776


$

0


(1)

(1)

Excludes loan premiums of $2,717 resulting from purchase price accounting and $21,345 of capitalized loan origination costs.


Days Past Due


Recorded

Investment


December 31, 2019

(Dollars in thousands)


30-59


60-89


90 +


Total


Current


Total (1)


90 Days and

Accruing


Recreation


$

27,357


$

8,426


$

5,800


$

41,583


$

648,227


$

689,810


$

0


Home improvement


931


427


184


1,542


249,288


250,830


0


Commercial


107


107


69,660


69,767


0


Medallion


12,491


2,118


2,572


17,181


109,106


126,287


0


Total


$

40,779


$

10,971


$

8,663


$

60,413


$

1,076,281


$

1,136,694


$

0


(1)Excludes loan premiums of $5,758 resulting from purchase price accounting and $18,403$40.0 million of capitalized loan origination costs.

December 31, 2022


Days Past Due


Recorded
Investment
90 Days and


(Dollars in thousands)


30-59


60-89


90 +


Total


Current


Total (1)


Accruing


Recreation


$

31,781


$

11,877


$

7,365


$

51,023


$

1,095,072


$

1,146,095


$


Home improvement


3,266


1,256


579


5,101


623,776


628,877


Commercial


74


74


93,396


93,470


Taxi medallion


142


393


885


1,420


12,151


13,571


Strategic partnership


572


572


Total


$

35,189


$

13,526


$

8,903


$

57,618


$

1,824,967


$

1,882,585


$


(1)
Excludes $34.9 million of capitalized loan origination costs.

The Company estimates that the weighted average loan-to-value ratio of the taxi medallion loans was approximately 327%183% and 190%339% as of December 31, 20202023 and 2019.2022.

Under ASU 2022-02, "Financial Instruments - Credit Losses (Topic 326): Troubled Debt Restructurings and Vintage Disclosures," concurrent with the elimination of troubled debt restructuring, or TDR, disclosures, the Company must disclose loans to borrowers experiencing financial difficulty that were modified during the reporting period. The Company did not have any such loan modifications on January 1, 2023 or during the year ended December 31, 2023.

The following table shows the TDR’sTDRs, which the Company entered into during the year ended December 31, 2020.2022.

(Dollars in thousands)


Number of Loans


Pre-

Modification

Investment


Post-

Modification

Investment


Number of Loans


Pre-
Modification
Investment


Post-
Modification
Investment


Recreation loans


77


1,053


749


80


1,203


1,203


Commercial loans


1


1,821


1,821


Medallion loans


59


33,505


33,505


Taxi medallion loans


2


252


252


During the twelve months endedAs of December 31, 2020, 52022, no taxi medallion loans and two commercial loans were modified as TDRs in the previous 12 months. Modified taxi medallion loans and commercial loans had a respective investment value of $0.9 million and $5.3 million. As of December 31, 2022, 63 recreation loans modified as troubled debt restructuringsTDRs were in default and had an investment value of $738,000 as of December 31, 2020, net of $331,000 of an allowance for loan loss, 43 recreation loans modified as troubled debt restructuring were in default and had an investment value of $433,000 as of December 31, 2020, net of a $15,000 allowance for loan losses, and 0 commercial loans modified as trouble debt restructurings were in default.

The following table shows the TDR’s which the Company entered into during the year ended December 31, 2019.

$0.9 million.

(Dollars in thousands)


Number of Loans


Pre-

Modification

Investment


Post-

Modification

Investment


Recreation loans


294


$

4,433


$

2,831


Medallion loans


71


31,376


31,385


During the year ended December 31, 2019, 4 medallion loans modified as a troubled debt restructurings were in default and had an investment value of $1,023,000 as of December 31, 2019, net of $428,000 of an allowance for loan loss, and 213 recreation loans modified as troubled debt restructurings were in default and had an investment value of $1,905,000 as of December 31, 2019, net of a $76,000 allowance for loan losses.


The following tables show the activity of the loan collateral in process of foreclosure, which relates only to the recreation and taxi medallion loans, for the twelve monthsyears ended December 31, 20202023 and 2019.2022.

Year Ended December 31, 2023
(Dollars in thousands)


Recreation


Taxi
Medallion
(1)


Total


Loan collateral in process of foreclosure – December 31, 2022


$

1,376


$

20,443


$

21,819


Transfer from loans, net


18,875


2,306


21,181


Sales


(7,890

)


(700

)


(8,590

)

Cash payments received


(730

)


(11,311

)


(12,041

)

Collateral valuation adjustments


(9,852

)


(745

)


(10,597

)

Loan collateral in process of foreclosure – December 31, 2023


$

1,779


$

9,993


$

11,772


(1)
As of December 31, 2023, taxi medallion loans in the process of foreclosure included 333 taxi medallions in the New York market, 206 taxi medallions in the Chicago market, 31 taxi medallions in the Newark market, and 31 taxi medallions in various other markets.

Year Ended December 31, 2022
(Dollars in thousands)


Recreation


Taxi
Medallion
(1)


Total


Loan collateral in process of foreclosure – December 31, 2021


$

1,720


$

35,710


$

37,430


Transfer from loans, net


12,444


347


12,791


Sales


(7,707

)


(2,668

)


(10,375

)

Cash payments received


(12,289

)


(12,289

)

Collateral valuation adjustments


(5,081

)


(657

)


(5,738

)

Loan collateral in process of foreclosure – December 31, 2022


$

1,376


$

20,443


$

21,819


(1)
As of December 31, 2022, taxi medallion loans in the process of foreclosure included 452 taxi medallions in the New York market, 335 taxi medallions in the Chicago market, 54 taxi medallions in the Newark market, and 39 taxi medallions in various other markets.

F-19


(5) FUNDS BORROWED

Twelve Months Ended December 31, 2020

(Dollars in thousands)


Recreation


Medallion


Total


Loan collateral in process of foreclosure – December 31, 2019


$

1,476


$

51,235


$

52,711


Transfer from loans, net


14,871


32,403


47,274


Sales


(7,512

)


(300

)


(7,812

)

Cash payments received


(5,687

)


(5,687

)

Collateral valuation adjustments


(7,403

)


(24,523

)


(31,926

)

Loan collateral in process of foreclosure – December 31, 2020


$

1,432


$

53,128


$

54,560


Twelve Months Ended December 31, 2019

(Dollars in thousands)


Recreation


Medallion


Total


Loan collateral in process of foreclosure – December 31, 2018


$

1,503


$

47,992


$

49,495


Transfer from loans, net


14,512


16,836


31,348


Sales


(7,591

)


(1,515

)


(9,106

)

Cash payments received


(7,697

)


(7,697

)

Collateral valuation adjustments


(6,948

)


(4,381

)


(11,329

)

Loan collateral in process of foreclosure – December 31, 2019


$

1,476


$

51,235


$

52,711


(5) UNREALIZED APPRECIATION (DEPRECIATION) AND REALIZED GAINS (LOSSES) ON INVESTMENTS (Investment Company Accounting)

The following table sets forth the pre-tax change in the Company’s unrealized appreciation (depreciation) on investments for the three months ended March 31, 2018 under Investment Company Accounting.

(Dollars in thousands)


Medallion

Loans


Commercial

Loans


Investments

in

Subsidiaries


Equity

Investments


Investments

Other Than

Securities


Total


Balance December 31, 2017


$

(20,338

)


$

(513

)


$

158,920


$

3,121


$

(1,490

)


$

139,700


Net change in unrealized


Appreciation on investments


38,795


(998

)


37,797


Depreciation on investments


(38,170

)


18


(1,915

)


(40,067

)

Reversal of unrealized appreciation

   (depreciation) related to realized


Gains on investments


Losses on investments


34,747


34,747


Balance March 31, 2018


$

(23,761

)


$

(495

)


$

197,715


$

2,123


$

(3,405

)


$

172,177


The following table sets forth the pre-tax changes in our unrealized and realized gains and losses in the investment portfolio for the three months ended March 31, 2018 under Investment Company Accounting.


(Dollars in thousands)


Three Months Ended

March 31, 2018


Net change in unrealized appreciation

   (depreciation) on investments


Unrealized appreciation


$

(998

)

Unrealized depreciation


(38,152

)

Net unrealized appreciation on investments in

   Medallion Bank and other controlled subsidiaries


29,115


Realized gains


Realized losses


34,747


Net unrealized losses on investments other than

   securities and other assets


(1,915

)

Total


$

22,797


Net realized gains (losses) on investments


Realized gains


$


Realized losses


(34,747

)

Other gains


Direct charge-offs


2


Total


$

(34,745

)

(6) FUNDS BORROWED

Thepresents outstanding balances of funds borrowed were as follows.of December 31, 2023.


Payments Due for the Year Ending December 31,


(Dollars in thousands)


2024


2025


2026


2027


2028


Thereafter


December 31, 2023 (1)


December 31, 2022 (1)


Interest
Rate
(2)


Deposits (3)


$

678,846


$

533,405


$

325,498


$

184,458


$

147,232


$


$

1,869,439


$

1,609,672


3.07

%

Privately placed notes


3,000


31,250


53,750


39,000


12,500


139,500


121,000


8.08


SBA debentures and borrowings


5,000


14,000


14,000


2,000


1,250


39,000


75,250


68,512


3.69


Trust preferred securities


33,000


33,000


33,000


7.75


Total


$

686,846


$

547,405


$

370,748


$

240,208


$

187,482


$

84,500


$

2,117,189


$

1,832,184


3.50

%


Payments Due for the Year Ending December 31,


(Dollars in  thousands)


2021


2022


2023


2024


2025


Thereafter


December 31, 2020(1)


December 31, 2019(1)


Interest

Rate (2)


Deposits (3)


$

393,835


$

241,605


$

190,387


$

120,040


$

121,955


$


$

1,067,822


$

954,245


1.71

%

Retail and privately placed

   notes (4)


33,625


36,000


33,600


103,225


69,625


8.25

%

SBA debentures and

   borrowings


22,508


5,000


5,000


14,000


21,500


68,008


71,746


3.36

%

Preferred securities (4)


33,000


33,000


33,000


2.35

%

Notes payable to banks


30,701


280


280


31,261


33,183


3.67

%

Other borrowings


500


7,442


747


8,689


7,794


1.91

%

Total


$

481,169


$

249,327


$

195,667


$

161,040


$

136,702


$

88,100


$

1,312,005


$

1,169,593


2.37

%

(1)
Excludes deferred financing costs of $8.5 million and $7.0 million as of December 31, 2023 and 2022.
(2)
Weighted average contractual rate as of December 31, 2023.
(3)
Balance excludes $1.5 million and $1.3 million of strategic partner reserve deposits as of December 31, 2023 and 2022.

(1)

Excludes deferred financing costs of $5,805 and $5,105 as of December 31, 2020 and 2019.

(2)

Weighted average contractual rate as of December 31, 2020.

(3)

Balance excludes $250 of strategic partner reserve deposits as of December 31, 2020.

(4)

Relates to loans held at Medallion Financial Corp. (parent company only).


(A) DEPOSITS

DepositsMost deposits are raised through the use of investment brokerage firms that package time deposits in denominations of less than $250,000$250,000 qualifying for FDIC insurance into larger pools that are sold to the Bank. The rates paid on the deposits are highly competitive with market rates paid by other financial institutions. Additionally, a brokerage fee is paid, depending on the maturity of the deposits, which averages less than 0.15%0.15%. Interest on the deposits is accrued daily and paid monthly, quarterly, semiannually, or at maturity. The Bank did 0t have any individual time deposits greater than $100,000 as of December 31, 2020. In October 2020, the Bank began to originate time deposits through an internet listing service.services. These deposits are from other financial institutions whichand, as of December 2020,31, 2023 and 2022, the Bank had $995,000$11.8 million and $12.4 million in listing services deposits.service deposit balances. In April 2023, the Bank began to originate retail savings deposits through a third-party service provider and, as of December 31, 2023, the Bank had $14.9 million in retail savings deposit balances. The following table presents the maturity of the brokerdeposit pools, excludingwhich includes strategic partner reserve deposits, as of December 31, 2020.2023.

(Dollars in thousands)


December 31, 2023


Three months or less


$

191,715


Over three months through six months


190,494


Over six months through one year


296,637


Over one year


1,190,593


Deposits


1,869,439


 Strategic partner collateral deposits


1,500


Total deposits


$

1,870,939


(B) FEDERAL RESERVE DISCOUNT WINDOW AND OTHER BORROWINGS

In March 2023, the Bank established a discount window line of credit at the Federal Reserve. As of December 31, 2023, the Bank had approximately $38.0 million in investment securities pledged as collateral to the Federal Reserve. The current advance rate on the pledged securities is 100% of fair value, for a total of approximately $38.0 million in secured borrowing capacity, of which none was utilized as of December 31, 2023.

The Bank has borrowing arrangements with several commercial banks. These agreements are accommodations that can be terminated at any time, for any reason and allow the Bank to borrow up to $75.0 million. As of December 31, 2023, nothing was outstanding on these lines.

(C) PRIVATELY PLACED NOTES

In December 2023, the Company completed a private placement to certain institutional investors of $12.5 million aggregate principal amount of 9.00% unsecured senior notes due December 2033, with interest payable semiannually. The Company intends to use the net proceeds from the offering for general corporate purposes, including the repayment of the remaining 8.25% notes maturing in March 2024.

In September 2023, the Company completed a private placement to certain institutional investors of $39.0 million aggregate principal amount of 9.25% unsecured senior notes due September 2028, with interest payable semiannually. The Company used the net proceeds from the offering for general corporate purposes, including the repurchase of $33.0 million of the 8.25% notes issued in March 2019 with a maturity date of March 2024 described below.

In February 2021, the Company completed a private placement to certain institutional investors of $25.0 million aggregate principal amount of 7.25% unsecured senior notes due February 2026, with interest payable semiannually. In March 2021, an additional $3.3 million principal amount of such notes was issued to certain institutional investors. Subsequently in April 2021, an additional $3.0 million principal amount of such notes was issued to certain institutional investors. The Company used the net proceeds from the offering for general corporate purposes, including repayment of outstanding debt.

(Dollars in  thousands)


December 31, 2020


Three months or less


$

125,766


Over three months through six months


117,602


Over six months through one year


150,467


Over one year


673,987


Total deposits


$

1,067,822


F-20


In December 2020, the Company completed a private placement to certain institutional investors of $33.6 million aggregate principal amount of 7.50% unsecured senior notes due December 2027, with interest payable semiannually. In February and March 2021, an additional $8.5 million principal amount of such notes was issued to certain institutional investors. Subsequently in April 2021, an additional $11.7 million principal amount of such notes was issued to certain institutional investors. The Company used the net proceeds from the offering for general corporate purposes, including repayment of outstanding debt.

In March 2019, the Company completed a private placement to certain institutional investors of $30.0 million aggregate principal amount of 8.25% unsecured senior notes due in March 2024, with interest payable semiannually. The Company used the net proceeds from the offering for general corporate purposes, including repaying certain borrowings under its notes payable to banks at a discount which led to a gain of $4.1 million in 2019. In August 2019, an additional $6.0 million principal amount of such notes was issued to certain institutional investors. As described above, in September 2023, the Company repurchased and cancelled $33.0 million of these notes, leaving $3.0 million principal amount remaining outstanding as of December 31, 2023.

(B)(D) SBA DEBENTURES AND BORROWINGS

Over the years, the SBA has approved commitments for MCI and FSVC, typically for a four and half year term and a 1% fee, which was paid.1% fee. During 2017, the SBA restructured FSVC’s debentures with SBA totaling $33,485,000$33.5 million in principal into a new loan by the SBA to FSVC in the principal amount of $34,024,756,$34.0 million, or the SBA Loan. In connection with the SBA Loan, FSVC executed a Note, or the SBA Note, with an effective date of March 1, 2017, in favor of SBA, in the principal amount of $34,024,756.$34.0 million. The SBA Loan bearsbore an interest at a rate of 3.25% per annum, required a minimum of $5,000,000 of principal and interest to be paid on or before February 1, 2018 (which was paid) and a minimum of $7,600,000 of principal and interest to be paid on or before March 27, 2019 (which was paid), and3.25% with all remaining unpaid principal and interest being due on or before February 1, 2020,April 30, 2024, the final maturity date, which was extendeddate. In October 2023, FSVC repaid, in full, all amounts due to the maturity date of the Company’s publicly-traded 9.000% Senior Notes, which is currently April 15, 2021; or the Public Debt, provided, however, that (1) upon the Company’s refinancing of such senior notes, the maturity date shall mean the earlier of (a) the maturity date of such refinanced debt or (b) April 30, 2024, and (2) upon the Company’s repayment of such senior notes without refinancing, the maturity date shall mean April 30, 2024. As of December 31, 2020, $175,485,000 of commitments had been fully utilized, there were $25,000,000 of commitments available, and $68,008,000 was outstanding, including $14,008,000SBA under the SBA Note.

On July 31, 2020,10, 2023, MCI accepted a commitment from the SBA for $25,000,000$20.0 million in debenture financing with a ten-year term. MCI can draw funds under the commitment, in whole or in part, until September 24, 2024.financing. In connection with the commitment, MCI paid the SBA a leverage fee of $250,000,$0.2 million, with the remaining $500,000 of thean additional $0.4 million fee to be paid pro ratapro-rata as MCI draws under the commitment. OfAs of December 31, 2023, $9.8 million of the committed amount, $8,500,000 hascommitment had been reserved to replace $8,500,000 of debentures which mature in 2021. The remainingdrawn, and $5.5 million was drawable, with the balance of $16,500,000 is$4.7 million drawable upon the infusion of $8,250,000$2.4 million of capital from either the capitalization of retained earnings or a capital infusion into MCI from the Company. As of December 31, 2020, NaN of the commitments had been drawn.

(C) NOTES PAYABLE TO BANKS

The Company and its subsidiaries have entered into note agreements with a variety of local and regional banking institutions over the years. The notes are typically secured by various assets of the underlying borrower.


The table below summarizes the key attributes of the Company’s various borrowing arrangements with these lenders as of December 31, 2020.

(Dollars in thousands)

Borrower


# of

Lenders/

Notes


Note

Dates


Maturity

Dates


Type


Note

Amounts


Balance

Outstanding at

December 31,

2020


Payment


Average

Interest

Rate at

December 31,

2020


Interest Rate

Index(1)

Medallion

  Financial Corp.


5/5


4/11 - 8/14


2/21 - 9/21


Term loans and demand notes secured by pledged loans (2)


$

19,734


(2)

$

19,734


Interest only(3)


3.75

%


Various(3)

Medallion

   Chicago


2/23


11/11 - 12/11


2/21


Term loans secured by owned Chicago taxi medallions (4)


18,449


10,687


$134 of principal & interest paid monthly


3.50

%


N/A

Medallion

   Funding


1/1


11/18


12/23


Term loan unsecured


1,400


840


$70 principal & interest paid quarterly


4.00

%


N/A


$

39,583


$

31,261


(1)

At December 31, 2020, 30 day LIBOR was 0.14%, 360 day LIBOR was 0.34%, and the prime rate was 3.25%.

(2)

One note has an interest rate of Prime, one note has an interest rate of Prime plus 0.50%, one note has a fixed interest rate of 3.75%, one note has an interest rate of LIBOR plus 3.75%, and the other interest rates on these borrowings are LIBOR plus 2%.

(3)

Various agreements call for remittance of all principal received on pledged loans subject to minimum monthly payments ranging from $12 to $85.

(4)

Guaranteed by the Company.

On July 6, 2019, the Company paid $10,819,000 at maturity in satisfaction of all its outstanding obligations under one of its credit facilities. In connection with this payment, the Company obtained a waiver from one of its other lenders, with a term note of $1,839,000, of certain resulting repayment and other obligations, which waiver expires on June 15, 2021.

In March 2019, the Company used some of the proceeds of the privately placed notes to pay off one of the notes payable to banks at a 50% discount, resulting in a gain on debt extinguishment of $4,145,000 in the 2019 first quarter.(E) TRUST PREFERRED SECURITIES

In November 2018, MFC entered into a note to the benefit of DZ Bank for $1,400,000 at a 4.00% interest rate due December 2023, as part of the restructuring of the DZ loan. See Note 20 for more information.

As a result of the cash flow shortages due to the slowdown in the taxi industry resulting from the COVID-19 pandemic, the Company received 180 day payment deferrals that terminated in August and modifications to provide for interest only payments from September through the end of 2020 for the notes payable to banks described above. Beginning in 2021, the Company returned to repaying the principal balance along with interest.

(D) RETAIL AND PRIVATELY PLACED NOTES

In February 2021, the Company completed a private placement to certain institutional investors of $25,000,000 aggregate principal amount of 7.25% unsecured senior notes due February 2026, with interest payable semiannually. In March 2021, an additional $3,250,000 principal amount of such notes was issued to certain institutional investors. The Company will use the net proceeds from the offering for general corporate purposes, including repayment of outstanding debt.

In December 2020, the Company completed a private placement to certain institutional investors of $33,600,000 aggregate principal amount of 7.50% unsecured senior notes due December 2027, with interest payable semiannually. In February and March 2021, an additional $8,500,000 principal amount of such notes was issued to certain institutional investors. The Company will use the net proceeds from the offering for general corporate purposes, including repayment of outstanding debt.

In March 2019, the Company completed a private placement to certain institutional investors of $30,000,000 aggregate principal amount of 8.25% unsecured senior notes due 2024, with interest payable semiannually. The Company used the net proceeds from the


offering for general corporate purposes, including repaying certain borrowings under its notes payable to banks at a discount, which led to a gain of $4,145,000 in the 2019 first quarter. In August 2019, an additional $6,000,000 principal amount of such notes was issued to certain institutional investors.

In April 2016, the Company issued a total of $33,625,000 aggregate principal amount of 9.00% unsecured notes due 2021, with interest payable quarterly in arrears. The Company used the net proceeds from the offering of approximately $31,786,000 to make loans and other investments in portfolio companies and for general corporate purposes, including repaying borrowings under its DZ loan in the ordinary course of business.

(E) PREFERRED SECURITIES

In June 2007, the Company issued and sold $36,083,000$36.1 million aggregate principal amount of unsecured junior subordinated notes to Fin Trust which, in turn, sold $35,000,000$35.0 million of trust preferred securities to Merrill Lynch International and issued 1,083 shares of common stock to the Company. ThePrior to the cessation of LIBOR on June 30, 2023, the notes bearbore a variable rate of interest of 90 day90-day LIBOR (0.24% at December 31, 2020) plus 2.13%2.13%. With the cessation of LIBOR, interest is calculated using the Secured Overnight Financing Rate (SOFR) adjusted by a relevant spread adjustment of approximately 26 basis points, plus 2.13%. The notes mature in September 2037 and are prepayable at par. Interest is payable quarterly in arrears. The terms of the trust preferred securities and the notes are substantially identical. In December 2007, $2,000,000$2.0 million of the trust preferred securities were repurchased from a third partythird-party investor. AtAs of December 31, 2020, $33,000,0002023, $33.0 million was outstanding on the trust preferred securities.

(F) OTHER BORROWINGS

In November and December 2017, RPAC amended the terms of various promissory notes with affiliate Richard Petty (refer to Note 12 for more details). At December 31, 2020, the total outstanding on these notes was $7,442,000 at a 2.00% annual interest rate compounded monthly and due March 31, 2022. Additionally, RPAC has a short term promissory note to an unrelated party, for $500,000 due on December 31, 2021.

On June 17, 2020, RPAC was approved for and received a Paycheck Protection Program, or PPP, loan under the CARES Act. As of December 31, 2020, the total outstanding balance of such loan was $747,000 at a 1.00% annual interest rate due in five years. Under the terms of the note, RPAC could be granted forgiveness for all or a portion of the balance if the loan proceeds are used in accordance with the requirements set forth in the PPP. As of December 31, 2020, RPAC had not applied for forgiveness of this loan.(F) COVENANT COMPLIANCE

(G) COVENANT COMPLIANCE

Certain of the Company’sCompany's debt agreements contain restrictionsfinancial covenants that require the Company and its subsidiaries to maintain certain financial ratios including debt to equity and minimum tangible net worth. TheAs of December 31, 2023, the Company was in compliance with all such restrictions as of December 31, 2020.covenants.

(7)(6) LEASES

The Company has leased premises that expire at various dates through November 30, 20272030 subject to various operating leases. The Company has implemented ASC Topic 842 under a modified retrospective approach, in which no adjustments have been made to the prior year balances.

The following table presents the operating lease costs and additional information for the twelve monthsyears ended December 31, 20202023, 2022, and 2019.2021.


December 31,


(Dollars in thousands)


2023


2022


2021


Operating lease costs


$

2,390


$

2,216


$

2,287


Cash paid for amounts included in the measurement of lease liabilities


Operating cash flows from operating leases


2,472


2,378


2,454


Right-of-use asset obtained in exchange for lease liability


(226

)


(187

)


(118

)

(Dollars in  thousands)


December 31, 2020


December 31, 2019


Operating lease costs


$

2,384


$

2,184


Cash paid for amounts included in the measurement of lease liabilities


Operating cash flows from operating leases


2,821


2,419


Right-of-use asset obtained in exchange for lease liability


251


2,413


F-21


The following table presents the breakout of the operating leases as of December 31, 20202023 and 2019.2022.


December 31,


(Dollars in thousands)


2023


2022


Operating lease right-of-use assets


$

8,785


$

9,723


Other current liabilities


2,472


2,239


Operating lease liabilities


7,019


8,408


Total operating lease liabilities


9,491


10,647


Weighted average remaining lease term


4.9 years


5.5 years


Weighted average discount rate


5.47

%


5.66

%

(Dollars in  thousands)


December 31, 2020


December 31, 2019


Operating lease right-of-use assets


$

11,737


$

13,482


Other current liabilities


2,004


2,085


Operating lease liabilities


11,018


12,738


Total operating lease liabilities


13,022


14,823


Weighted average remaining lease term


6.4 years


7.3 years


Weighted average discount rate


5.54%


5.54

%

At December 31, 2020,The following table presents maturities of the lease liabilities were as follows.

(Dollars in  thousands)


2021


$

2,474


2022


2,406


2023


2,356


2024


2,373


2025


2,390


Thereafter


3,521


Total lease payments


15,520


Less imputed interest


2,498


Total operating lease liabilities


$

13,022


Occupancy expense was $2,833,000, $2,436,000, and $2,287,000 for the years endedof December 31, 2020, 2019, and 2018.2023.

(Dollars in thousands)


2024


$

2,536


2025


2,546


2026


2,567


2027


1,342


2028


573


Thereafter


1,139


Total lease payments


10,703


Less imputed interest


1,212


Total operating lease liabilities


$

9,491


(8)(7) INCOME TAXES

The Company is subject to federal and applicable state corporate income taxes on its taxable ordinary income and capital gains. As a corporation taxed under Subchapter C of the Internal Revenue Code, the Company is able, and intends, to file a consolidated federal income tax return with corporate subsidiaries in which it holds 80% or more of the outstanding equity interest measured by both vote and fair value.

The following table sets forth the significant components of ourthe Company's deferred and other tax assets and liabilities as of December 31, 20202023 and 2019.2022.


December 31,


(Dollars in thousands)


2023


2022


Goodwill and other intangibles


$

43,034


$

43,397


Provision for credit losses


(13,032

)


(9,945

)

Net operating loss carryforwards (1)


(3,802

)


(3,730

)

Accrued expenses, compensation, and other assets


(6,976

)


(3,819

)

Unrealized gains on other investments


(1,877

)


(1,445

)

Total deferred tax liability


17,347


24,458


Valuation allowance


3,860


2,295


Deferred tax liability, net


$

21,207


$

26,753


(Dollars in thousands)


2020


2019


Goodwill and other intangibles


$

(44,799

)


$

(45,595

)

Provision for loan losses


19,556


19,198


Net operating loss carryforwards (1)


30,493


22,607


Accrued expenses, compensation, and other assets


1,174


1,701


Unrealized gains on other investments


(6,769

)


(6,790

)

Total deferred tax liability


(345

)


(8,879

)

Valuation allowance


(462

)


(462

)

Deferred tax liability, net


(807

)


(9,341

)

Taxes receivable


1,757


1,516


Net deferred and other tax liabilities


$

950


$

(7,825

)

(1)
As of December 31, 2023, the Company had an estimated $11.1 million of net operating loss carryforwards, $1.7 million of which expires at various dates between December 31, 2026 and December 31, 2035, which had a net carrying value of $1.2 million of December 31, 2023.

(1)

As of December 31, 2020, the Company and its subsidiaries had an estimated $124,150 of net operating loss carryforwards, $1,712 which expires at various dates between December 31, 2026 and December 31, 2035, and which had a net asset value of $30,031 as of December 31, 2020.


The following table shows the components of ourthe Company's tax (provision) benefitprovision for the years ended December 31, 2020, 2019,2023, 2022, and 2018 were as follows.2021.


Year Ended December 31,


(Dollars in thousands)


2023


2022


2021


Current


Federal


$

18,634


$

5,213


$

3,550


State


6,014


560


1,563


Deferred


0


0


0


Federal


(52

)


8,090


13,686


State


314


4,100


5,418


Net provision for income taxes


$

24,910


$

17,963


$

24,217


(Dollars in thousands)


2020


2019


2018


Current


Federal


$


$


$

(2,797

)

State


(260

)


519


(1,078

)

Deferred


Federal


7,702


(489

)


5,270


State


2,632


(371

)


(1,464

)

Net (provision) benefit for income taxes


$

10,074


$

(341

)


$

(69

)

The following table presents a reconciliation of statutory federal income tax (provision) benefitprovision to consolidated actual income tax (provision) benefit reported for the years ended December 31, 2020, 2019,2023, 2022, and 2018.2021.


Year Ended December 31,


(Dollars in thousands)


2023


2022


2021


Statutory Federal income tax provision at 21%


$

18,068


$

14,249


$

17,193


State and local income taxes, net of federal income tax benefit


3,534


2,787


3,363


Valuation allowance against deferred tax assets


1,565


1,833


Change in effective state income tax rates and accrual


(222

)


(811

)


1,691


Income attributable to non-controlling interest


(628

)

Non-deductible expenses


2,024


1,987


178


Other


(59

)


(249

)


587


Total income tax provision


$

24,910


$

17,963


$

24,217


(Dollars in thousands)


2020


2019


2018


Statutory Federal income tax (provision) benefit at 21%


$

7,766


$

(642

)


$

4,935


State and local income taxes, net of federal income

   tax benefit


1,518


(120

)


440


Revaluation of net operating losses


1,228


380


Change in effective state income tax rate


(145

)


(891

)


(2,564

)

Change in state income tax accruals


(260

)


640


Income attributable to non-controlling interest


460


309


Non deductible expenses


(453

)


Utilization of carry forwards


(910

)

Appreciation of Medallion Bank


(1,974

)

Other


(40

)


(17

)


4


Total income tax (provision) benefit


$

10,074


$

(341

)


$

(69

)

F-22


In assessing the realizability of deferred tax assets, management considers whether it is more likely than not that some portion or all of the deferred tax assets will not be realized. The realization of deferred tax assets is dependent upon the generation of future taxable income during the periods in which temporary differences become deductible pursuant to ASC 740. The Company considers the reversal of deferred tax liabilities, projected future taxable income, and tax planning strategies in making this assessment. The Company’s evaluation of the realizability of deferred tax assets must consider both positive and negative evidence. The weight given to the potential effects of positive and negative evidence is based on the extent to which it can be objectively verified. Based upon these considerations, the Company determined the necessary valuation allowance as of December 31, 2020.2023.

The Company has filed tax returns in many states. Federal, New York State, New York City, and Utah state tax filings of the Company for the tax years 20172020 through the present are the more significant filings that are open for examination.

(9)(8) STOCK OPTIONS AND RESTRICTED STOCK

The Company’s Board of Directors approved the 2018 Equity Incentive Plan, or the 2018 Plan, which was approved by the Company’s stockholders on June 15, 2018. The terms of 2018 Plan provide for grants of a variety of different type of stock awards to the Company’s employees and non-employee directors, including options, restricted stock, restricted stock units, performance stock units, and stock appreciation rights, etc. On April 22, 2020, the Company’s Board of Directors approved an amendment to the 2018 Plan to increase the number of shares of the Company’s common stock authorized for issuance thereunder, which was approved by the Company’s stockholders on June 19, 2020. 2020, and subsequently on April 26, 2022, the Company’s Board of Directors approved an additional amendment to the 2018 Plan to further increase the number of shares of the Company’s common stock authorized for issuance thereunder, which was approved by the Company’s stockholders on June 14, 2022. A total of 2,210,9685,710,968 shares of the Company’s common stock are issuable under the 2018 Plan, and 862,069 remained2,228,057 were issuable as of December 31, 2020.2023. Awards under the 2018 Plan are subject to certain limitations as set forth in the 2018 Plan, which will terminate when all shares of common stock authorized for delivery have been delivered and the forfeiture restrictions on all awards have lapsed, or by action of the Board of Directors pursuant to the 2018 Plan, whichever occurs first.

The Company’s Board of Directors approved the 2015 Employee Restricted Stock Plan, or the 2015 Restricted Stock Plan, on February 13, 2015, which was approved by the Company’s shareholders on June 5, 2015. The 2015 Restricted Stock Plan became effective upon the Company’s receipt of exemptive relief from the SEC on March 1, 2016. The terms of 2015 Restricted Stock Plan provided for grants of restricted stock awards to the Company’s employees. A grant of restricted stock is a grant of shares of the Company’s common stock which, at the time of issuance, is subject to certain forfeiture provisions, and thus is restricted as to transferability until such forfeiture restrictions have lapsed. A total of 700,000 shares of the Company’s common stock were issuable under the 2015 Restricted Stock Plan, and 241,919 remained issuable as of June 15, 2018. Effective June 15, 2018, the 2018 Plan was


approved, and these remaining shares were rolled into the 2018 Plan. Awards under the 2015 Restricted Stock Plan are subject to certain limitations as set forth in the 2015 Restricted Stock Plan. The 2015 Restricted Stock Plan will terminate when all shares of common stock authorized for delivery under the 2015 Restricted Stock Plan have been delivered and the forfeiture restrictions on all awards have lapsed, or by action of the Board of Directors pursuant to the 2015 Restricted Stock Plan, whichever occurs first.

The Company had a stock option plan, or the 2006 Stock Option Plan, available to grant both incentive and nonqualified stock options to employees. The 2006 Stock Option Plan, which was approved by the Board of Directors on February 15, 2006 and shareholders on June 16, 2006, provided for the issuance of a maximum of 800,000 shares of common stock of the Company. NaN additional shares are available for issuance under the 2006 Stock Option Plan. The 2006 Stock Option Plan was administered by the Compensation Committee of the Board of Directors. The option price per share could not be less than the current market value of the Company’s common stock on the date the option was granted. The term and vesting periods of the options were determined by the Compensation Committee, provided that the maximum term of an option could not exceed a period of ten years.

The Company’s Board of Directors approved the 2015 Non-Employee Director Stock Option Plan, or the 2015 Director Plan, on March 12, 2015, which was approved by the Company’s shareholders on June 5, 2015, and on which exemptive relief to implement the 2015 Director Plan was received from the SEC on February 29, 2016. A total of 300,000 shares of the Company’s common stock were issuable under the 2015 Director Plan, and 258,334 remained issuable as of June 15, 2018. Effective June 15, 2018, the 2018 Plan was approved, and these remaining shares were rolled into the 2018 Plan. Under the 2015 Director Plan, unless otherwise determined by a committee of the Board of Directors comprised of directors who are not eligible for grants under the 2015 Director Plan, the Company granted options to purchase 12,000 shares of the Company’s common stock to a non-employee director upon election to the Board of Directors, with an adjustment for directors who were elected to serve less than a full term. The option price per share could not be less than the current market value of the Company’s common stock on the date the option was granted. Options granted under the 2015 Director Plan are exercisablevested annually, as defined in the 2015 Director Plan. The term of the options could not exceed ten years.years.

The Company’s Board of Directors approved the First Amended and Restated 2006 Director Plan, or the Amended Director Plan, on April 16, 2009, which was approved by the Company’s shareholders on June 5, 2009, and on which exemptive relief to implement the Amended Director Plan was received from the SEC on July 17, 2012. A total of 200,000 shares of the Company’s common stock were issuable under the Amended Director Plan. NaNNo additional shares are available for issuance under the Amended Director Plan. Under the Amended Director Plan, unless otherwise determined by a committee of the Board of Directors comprised of directors who are not eligible for grants under the Amended Director Plan, the Company would grant options to purchase 9,000 shares of the Company’s common stock to an Eligible Director upon election to the Board of Directors, with an adjustment for directors who were elected to serve less than a full term. The option price per share could not be less than the current market value of the Company’s common stock on the date the option was granted. Options granted under the Amended Director Plan are exercisablevested annually, as defined in the Amended Director Plan. The term of the options could not exceed ten years.years.

Additional shares are only available for future issuance under the 2018 Plan. At December 31, 2020, 951,6692023, 959,522 options on the Company’s common stock were outstanding under the Company’s plans, of which 178,307697,647 options were exercisable.vested. Additionally, as of December 31, 2023, there were 416,140 unvested shares of the Company’s common stock outstanding and 62,780995,376 unvested restricted shareshares, 296,444 unvested performance stock units, 84,822 unvested restricted stock units, and 160,595 vested restricted stock units under the Company’s restricted stock plans.2018 Plan.

F-23


The fair value of each restricted stock grant is determined on the date of grant by the closing market price of the Company’s common stock on the grant date. The fair value of each option grant is estimated on the date of grant using the Black-Scholes option-pricing model. The weighted average fair value ofThere were no options granted was $3.09, $3.10, and $1.06 per share forduring the yearsyear ended December 31, 2020, 2019, and 2018. 2023. The following assumption categories are used to determine the value of any option grants.


Year ended December 31,


Year Ended December 31,


2020


2019


2018


2023


2022


2021


Risk free interest rate


1.23

%


2.29

%


2.82

%


0.97

%

Expected dividend yield


0.66


4.86


Expected life of option in years (1)


6.25


6.25


6.00


6.25


Expected volatility (2)


51.03

%


49.03

%


30.00

%


53.98

%

(1)
Expected life is calculated using the simplified method.
(2)
The Company determines its expected volatility based on the Company's historical volatility.

During 2023, the Company’s Compensation Committee of the Board of Directors began granting performance stock units, or PSUs, to certain officers and employees of the Company. Granted PSUs are subject to specified performance criteria for a particular performance period. The number of PSUs that vest can range from zero to 200% of the grant amount. In addition, dividends that accrue during the vesting period are reinvested in dividend equivalent PSUs. PSUs and the related dividend equivalent PSUs are converted into shares of common stock after vesting. Once the PSUs and dividend equivalent PSUs have vested, shares of common stock are delivered.

(1)

Expected life is calculated using the simplified method.

(2)

We determine our expected volatility based on our historical volatility.


The following table presents the activity for the stock option programs for the years ended December 31, 2020, 2019,2023, 2022, and 2018.2021.


Number of
Options


Exercise
Price Per
Share


Weighted
Average
Exercise Price


Outstanding at December 31, 2020 (2)


951,669


2.14 - 12.55


6.41


Granted


317,398


6.79


6.79


Cancelled


(113,310

)


4.89 - 11.53


6.64


Exercised (1)


(44,070

)


5.21 - 7.25


5.58


Outstanding at December 31, 2021 (2)


1,111,687


2.14-12.55


6.41


Granted


Cancelled


(26,093

)


4.89 - 12.55


7.08


Exercised (1)


(23,745

)


4.89 - 7.25


6.51


Outstanding at December 31, 2022 (2)


1,061,849


2.14 - 9.38


6.51


Granted


Cancelled


(33,382

)


4.89 - 9.38


6.80


Exercised (1)


(68,945

)


4.89 - 7.25


6.44


Outstanding at December 31, 2023 (2)


959,522


$

2.14 - 9.38


$

6.51


Options exercisable at


December 31, 2021


320,922


2.14-12.55


$

6.53


December 31, 2022


548,426


2.14 - 9.38


6.51


December 31, 2023


697,647


2.14 - 9.38


6.51


(1)
The aggregate intrinsic value, which represents the difference between the price of the Company’s common stock at the exercise date and the related exercise price of the underlying options, was $0.1 million, $0.1 million, and $0.2 million for the years ended December 31, 2023, 2022, and 2021.
(2)
The aggregate intrinsic value, which represents the difference between the price of the Company’s common stock at December 31, 2023 and the related exercise price of the underlying options, was $3.2 million for outstanding options and $2.3 million for exercisable options as of December 31, 2023. The remaining contractual life was 6.1 years for outstanding options and 5.9 years for exercisable options at December 31, 2023.

The following table presents the activity for the unvested options outstanding under the plans for the year ended December 31, 2023.


Number of
Options


Exercise Price
Per Share


Weighted
Average
Exercise Price


Outstanding at December 31, 2022


513,423


$

4.89 - 7.25


$

6.52


Granted


Cancelled


(3,336

)


4.89 - 7.25


5.51


Vested


(248,212

)


4.89 - 7.25


6.55


Outstanding at December 31, 2023


261,875


$

4.89 - 7.25


$

6.49


The intrinsic value of the options vested was $0.4 million, $0.3 million, and less than $0.1 million for the years ended December 31, 2023, 2022, and 2021.


Number of

Options


Exercise

Price Per

Share


Weighted

Average

Exercise Price


Outstanding at December 31, 2017


320,626


$2.14-13.84


$

8.78


Granted


39,000


5.27-5.58


5.46


Cancelled


(214,960

)


9.22-9.24


9.22


Exercised (1)


0


0


0


Outstanding at December 31, 2018


144,666


2.14-13.84


7.23


Granted


449,450


5.21-7.25


6.61


Cancelled


(44,076

)


6.55-13.84


9.00


Exercised (1)


0


0


0


Outstanding at December 31, 2019


550,040


2.14-13.53


6.58


Granted


444,557


4.89-6.68


6.24


Cancelled


(42,928

)


2.22-13.53


6.91


Exercised (1)


0


0


0


Outstanding at December 31, 2020 (2)


951,669


$2.14-12.55


$

6.41


Options exercisable at


December 31, 2018


81,889


$2.14-13.84


$

9.25


December 31, 2019


62,778


2.14-13.53


7.60


December 31, 2020 (2)


178,307


2.14-12.55


6.33


F-24


(1)

The aggregate intrinsic value, which represents the difference between the price of the Company’s common stock at the exercise date and the related exercise price of the underlying options, was $0 for 2020, 2019, and 2018.

(2)

The aggregate intrinsic value, which represents the difference between the price of the Company’s common stock at December 31, 2020 and the related exercise price of the underlying options, was $45,000 for outstanding options and $43,000 for exercisable options as of December 31, 2020. The remaining contractual life was 8.60 years for outstanding options and 7.23 years for exercisable options at December 31, 2020.

The following table presents the activity for the restricted stock programs for the years ended December 31, 2020, 2019,2023, 2022, and 2018.2021.


Number of
Shares


Grant
Price Per
Share


Weighted
Average
Grant Price


Outstanding at December 31, 2020


416,140


4.39 - 7.25


$

6.24


Granted


258,120


6.79 - 8.40


7.38


Cancelled


(21,940

)


4.89 - 7.25


5.98


Vested (1)


(158,994

)


4.39 - 7.25


6.16


Outstanding at December 31, 2021 (2)


493,326


4.89 - 7.25


6.87


Granted


522,475


6.86 -7.68


7.46


Cancelled


(29,373

)


4.89 - 8.40


7.32


Vested (1)


(129,140

)


4.89 - 7.25


6.53


Outstanding at December 31, 2022 (2)


857,288


$

4.89 - 7.25


7.27


Granted


399,793


7.67 - 9.37


8.34


Cancelled


(12,807

)


4.89 - 8.40


7.24


Vested (1)


(248,898

)


4.89 - 7.68


7.10


Outstanding at December 31, 2023 (2)


995,376


$

4.89 - 9.37


$

7.74


Number of

Shares


Grant

Price Per

Share


Weighted

Average

Grant Price


Outstanding at December 31, 2017


408,582


$2.06-10.38


$

3.45


Granted


101,010


3.93-5.27


4.41


Cancelled


(9,737

)


3.93-9.08


4.66


Vested (1)


(308,940

)


2.06-10.38


3.35


Outstanding at December 31, 2018


190,915


2.14-5.27


4.06


Granted


216,148


4.80-7.25


6.59


Cancelled


(3,946

)


3.93-6.55


4.97


Vested (1)


(118,238

)


2.06-4.80


3.89


Outstanding at December 31, 2019


284,879


3.95-7.25


6.01


Granted


229,408


4.89-6.68


6.21


Cancelled


(8,755

)


3.95-7.25


6.93


Vested (1)


(89,392

)


3.95-6.55


5.37


Outstanding at December 31, 2020 (2)


416,140


$4.39-7.25


$

6.24


(1)
The aggregate fair value of the restricted stock vested was $2.1 million, $1.0 million, and $1.1 million for the years ended December 31, 2023, 2022, and 2021.

(1)

The aggregate fair value of the restricted stock vested was $579,000, $736,000, and $1,270,000 for 2020, 2019, and 2018.

(2)

The aggregate fair value of the restricted stock was $9.8 million as of December 31, 2023. The remaining vesting period was 2.2 years at December 31, 2023.

The aggregate fair value of the restricted stock was $2,039,000 as of December 31, 2020. The remaining vesting period was 2.03 years at December 31, 2020.


During the twelve monthsyear ended December 31, 2020,2023, the Company granted 47,15683,158 restricted stock units, that vest onor RSUs, with a vesting date of June 19, 2021 with22, 2024 at a grant price of $3.16. Unitholders have$9.14 and during the year ended December 31, 2022 granted 129,638 RSUs with a vesting date of June 14, 2023 at a grant price of $6.75. For the RSUs granted in 2023 and 2022, unitholders had the option of deferring settlement until a future date if the recipient makes a formal election under the guidelines of IRC Section 409A,409A. As of December 31, 2023, there were 245,417 RSUs outstanding, including 160,595 which was done for 16,524 units. The remaining 10,416 units vested and settled.had previously vested.

The following table presents the activity for the unvested options outstanding under the plans forDuring the year ended December 31, 2020.


Number of

Options


Exercise Price

Per Share


Weighted

Average

Exercise Price


Outstanding at December 31, 2019


487,262


$2.14-7.25


$

6.45


Granted


444,557


4.89-6.68


6.24


Cancelled


(20,630

)


6.55-7.25


6.76


Vested


(137,827

)


2.14-6.55


6.05


Outstanding at December 31, 2020


773,362


$4.89-7.25


$

6.42


2023, the Company granted 296,444 PSUs at a grant price of $6.08. No PSUs were granted during the year ended December 31, 2022. The intrinsic valuePSUs have vesting conditions based upon certain levels of total pre-tax income as well as return on common equity attained over a three-year period. The PSUs cliff vest after three years based upon the performance of the options vested was $45,000, $43,000,Company. Dividend equivalent PSUs accumulate and $32,000 in 2020, 2019, and 2018.convert to additional shares for the benefit of the grantee at the vesting date or are forfeited if the performance conditions are not met.

(10)(9) SEGMENT REPORTING

The Company has 6five business segments, which include 4four lending and 2one non-operating segments, which are reflective of how Company management makes decisions about its business and operations.

The four lending segments reflect the main types of lending performed at the Company, which are recreation, home improvement, commercial, and taxi medallion. The recreation and home improvement lending segments are conducted by the Bank in all fifty states, with theand loans are made to borrowers residing nationwide. The highest concentrations of recreation loans are in Texas and Florida at 15% and California, at 15%, 10%, and 9%10% of loans outstanding and with no other states over 9%at or above 10% as of December 31, 2020.2023. The recreation lending segment is a consumer finance business that works with third-party dealers and financial service providers for the purpose of financing RVs, boats, and other consumer recreational equipment, of which RVs boats, and trailersboats make up 60%, 19%,54% and 12%19% of the segment portfolio with no other product lines exceeding 10% as of December 31, 2020.2023. The home improvement lending segment works with contractors and financial service providers to finance residential home improvements concentrated inimprovement with the largest product lines being roofs, swimming pools, roofs,and windows and solar panels, at 27%41%, 24%, 13%20%, and 8%13% with no other product lines exceeding 10%. The highest concentrations of total home improvement loans are in Texas and Florida, both at 10% of loans outstanding and with no other product lines over 8%states at or above 10% as of December 31, 2020.2023. The commercial lending segment focuses on enterpriseserving a wide variety of industries, includingwith concentrations in manufacturing, construction, and variouswholesale trade making up 53%, 13%, and 11% of the loans outstanding as of December 31, 2023 with no other industries,product lines exceeding 10%. The commercial lending segment invests across the United States with concentrations in which 53%California, Minnesota, and Wisconsin having 27%, 12%, and 10% of these loans are made in the Midwest.segment portfolio, and no other states having a concentration at or above 10%. The taxi medallion lending segment arose in connection with the financing of taxi medallions, taxis, and related assets, primarily all of which 89% wereare located in the New York City metropolitan area as of December 31, 2020.2023.

In addition, our non-operating segments include RPAC, which is a race car team, and ourThe Company's corporate and other investments segment whichis a non-operating segment that includes items not allocated to ourthe Company's operating segments such as investment securities, equity investments, intercompany eliminations, and other corporate elements. AsAdditionally, through December 1, 2021, the date of disposition, the Company had another non-operating segment, RPAC, a result of COVID-19, the race season had been suspended from March 15, 2020 through May 17, 2020. As states began to reopen, NASCAR resumed races and completed all races scheduled. Commencing with the second quarter 2020, the Bank began issuing loans related to the new strategic partnership business, which is currently included within the corporate and other investment segment due to its small size.car team.

As part of the segment reporting, capital ratios for all operating segments have been normalized at 20%, which approximates theas a percentage of consolidated total equity divided by total assets, with the net adjustment applied to corporate and other investments. In addition, the commercial segment exclusivelyprimarily represents the mezzanine lending business, and thewith certain legacy commercial loan businessloans (immaterial to total) hasallocated to corporate and other investments.

F-25


As part of segment reporting, capital ratios for all operating segments have been re-allocatednormalized as a percentage of consolidated total equity divided by total assets, with the net adjustment applied to corporate and other investments. In addition, the commercial segment primarily represents the mezzanine lending business, with certain legacy commercial loans (immaterial to total) allocated to corporate and other investments.


The following tables presenttable presents segment data as of and for the twelve monthsyear ended December 31, 2020 and 2019, and2023.

Year Ended December 31, 2023


Consumer Lending


(Dollars in thousands)


Recreation


Home
Improvement


Commercial
Lending


Taxi Medallion
Lending


Corporate and Other Investments


Consolidated


Total interest income


$

167,765


$

62,703


$

12,719


$

1,596


$

6,257


$

251,040


Total interest expense


31,436


18,137


3,597


72


9,704


62,946


Net interest income (loss)


136,329


44,566


9,122


1,524


(3,447

)


188,094


Provision (benefit) for credit losses


44,592


17,583


1,988


(26,318

)


(35

)


37,810


Net interest income (loss) after loss provision


91,737


26,983


7,134


27,842


(3,412

)


150,284


Other income


376


6


5,971


3,358


1,609


11,320


Operating expenses


(32,601

)


(16,752

)


(3,547

)


(7,256

)


(15,412

)


(75,568

)

Net income (loss) before taxes


59,512


10,237


9,558


23,944


(17,215

)


86,036


Income tax (provision) benefit


(17,231

)


(2,964

)


(2,767

)


(6,933

)


4,985


(24,910

)

Net income (loss) after taxes


42,281


7,273


6,791


17,011


(12,230

)


61,126


Income attributable to the non-controlling interest


6,047


Total net income attributable to Medallion Financial Corp.


$

55,079


Balance Sheet Data


Total loans


$

1,336,222


$

760,621


$

114,827


$

3,663


$

553


$

2,215,886


Total assets


1,297,870


744,904


110,850


12,247


421,956


2,587,827


Total funds borrowed


1,062,584


609,863


90,754


10,027


345,462


2,118,690


Selected Financial Ratios


Return on average assets


3.36

%


1.04

%


6.65

%


91.25

%


(3.13

)%


2.51

%

Return on average stockholders' equity


*


*


*


*


*


17.33


Return on average equity


21.24


6.60


41.51


574.86


(19.78

)


15.79


Interest yield


13.07


8.86


12.80


26.94


N/A


11.19


Net interest margin, gross


10.62


6.29


9.18


25.73


N/A


8.38


Net interest margin, net of allowance


11.09


6.45


9.45


61.60


N/A


8.68


Reserve coverage


4.31


2.76


3.61


41.93


N/A


3.80


Delinquency status (1)


0.70


0.20


5.40


N/A


0.77


Charge-off (recovery) ratio (2)


3.04


1.33


1.02


(309.96

)


N/A


1.48


(1)
Loans 90 days or more past due.
(2)
Negative balances indicate recoveries for the period.

(*) Line item is not applicable to segments.

F-26


The following table presents segment data as of and for the nine monthsyear ended December 31, 2018.2022.

Year Ended December 31, 2022


Consumer Lending


(Dollars in thousands)


Recreation


Home
Improvement


Commercial
Lending


Taxi Medallion
Lending


Corporate and Other Investments


Consolidated


Total interest income


$

139,145


$

44,703


$

9,348


$

632


$

2,793


$

196,621


Total interest expense


17,932


7,697


3,040


508


7,008


36,185


Net interest income (loss)


121,213


37,006


6,308


124


(4,215

)


160,436


Provision (benefit) for credit losses


22,802


7,616


5,963


(6,474

)


152


30,059


Net interest income (loss) after loss provision


98,411


29,390


345


6,598


(4,367

)


130,377


Other income


14


3,306


4,341


1,865


9,526


Operating expenses


(30,463

)


(13,514

)


(4,910

)


(10,520

)


(12,646

)


(72,053

)

Net income (loss) before taxes


67,948


15,890


(1,259

)


419


(15,148

)


67,850


Income tax (provision) benefit


(17,989

)


(4,207

)


333


(111

)


4,011


(17,963

)

Net income (loss) after taxes


49,959


11,683


(926

)


308


(11,137

)


49,887


Income attributable to the non-controlling interest


6,047


Total net income attributable to Medallion Financial Corp.


$

43,840


Balance Sheet Data


Total loans


$

1,183,512


$

626,399


$

92,899


$

13,571


$

572


$

1,916,953


Total assets


1,154,680


618,923


101,447


25,496


359,333


2,259,879


Total funds borrowed


936,789


502,131


82,304


20,685


291,526


1,833,435


Selected Financial Ratios


Return on average assets


4.38

%


1.95

%


(0.91

)%


1.18

%


(3.02

)%


2.40

%

Return on average stockholders' equity


*


*


*


*


*


14.92


Return on average equity


26.66


12.08


(5.50

)


6.97


(18.40

)


13.74


Interest yield


12.82


8.49


10.63


4.58


N/A


10.70


Net interest margin, gross


11.17


7.03


7.17


0.90


N/A


8.73


Net interest margin, net of allowance


11.57


7.16


7.28


2.76


N/A


9.05


Reserve coverage


3.55


1.81


1.13


69.93


N/A


3.33


Delinquency status (1)


0.64


0.09


0.08


6.52


N/A


0.47


Charge-off (recovery) ratio (2)


1.22


0.69


6.86


(47.51

)


N/A


0.96


(1)
Loans 90 days or more past due.
(2)
Negative balances indicate recoveries for the period.

(*) Line item is not applicable to segments.

Year Ended December 31, 2020


Consumer Lending


(Dollars in thousands)


Recreation


Home

Improvement


Commercial

Lending


Medallion

Lending


RPAC


Corporate and Other Investments


Consolidated


Total interest income


$

110,706


$

27,273


$

6,926


$

(1,518

)


$


$

1,575


$

144,962


Total interest expense


13,013


5,699


2,538


3,610


163


9,128


34,151


Net interest income (loss)


97,693


21,574


4,388


(5,128

)


(163

)


(7,553

)


110,811


Provision for loan losses


23,736


3,778


42,276


27


69,817


Net interest income (loss) after loss provision


73,957


17,796


4,388


(47,404

)


(163

)


(7,580

)


40,994


Sponsorship and race winnings


20,042


20,042


Race team related expenses


(8,366

)


(8,366

)

Other income (expense), net


(27,341

)


(9,611

)


(3,196

)


(30,366

)


(7,973

)


(11,164

)


(89,651

)

Net income (loss) before taxes


46,616


8,185


1,192


(77,770

)


3,540


(18,744

)


(36,981

)

Income tax (provision) benefit


(12,004

)


(2,108

)


(299

)


19,520


(889

)


5,854


10,074


Net income (loss) after taxes


$

34,612


$

6,077


$

893


$

(58,250

)


$

2,651


$

(12,890

)


$

(26,907

)

Balance Sheet Data


Total loans net


$

765,338


$

328,876


$

62,037


$

12,725


$


$

3,314


$

1,172,290


Total assets


777,605


340,494


80,622


124,554


33,711


285,425


1,642,411


Total funds borrowed


621,735


272,284


65,924


98,636


8,689


244,987


1,312,255


Selected Financial Ratios


Return on average assets


4.59

%


2.07

%


1.07

%


(33.21

%)


7.98

%


(5.06

%)


(2.16

)%

Return on average equity


22.93


10.35


5.17


(165.21

)


(363.66

)


(23.29

)


(10.90

)

Interest yield


14.90


9.66


10.51


(2.11

)


N/A


N/A


11.32


Net interest margin


13.15


7.62


6.66


(7.14

)


N/A


N/A


8.65


Reserve coverage


3.45


1.54


0.00


(1)


66.31


N/A


N/A


4.68


Delinquency status(2)


0.70


0.05


0.11


(1)


3.57


N/A


N/A


0.57


Charge-off ratio


1.95


0.44


0.04


(3)


59.38


N/A


N/A


5.00


F-27


The following table presents segment data as of and for the year ended December 31, 2021.

Year Ended December 31, 2021


Consumer Lending


(Dollars in thousands)


Recreation


Home
Improvement


Commercial
Lending


Taxi Medallion
Lending


RPAC (2)


Corporate and Other Investments


Consolidated


Total interest income (loss)


$

118,305


$

34,204


$

6,592


$

(1,483

)


$


$

1,348


$

158,966


Total interest expense


9,993


4,153


2,720


5,914


546


7,814


31,140


Net interest income (loss)


108,312


30,051


3,872


(7,397

)


(546

)


(6,466

)


127,826


Provision (benefit) for credit losses


7,671


2,750


(7,752

)


1,953


4,622


Net interest income (loss) after loss provision


100,641


27,301


3,872


355


(546

)


(8,419

)


123,204


Sponsorship and race winnings


12,567


12,567


Race team related expenses


(9,559

)


(9,559

)

Other income (loss)


63


6,542


(641

)


716


12,319


18,999


Operating expenses


(30,156

)


(11,703

)


(3,441

)


(1,350

)


(5,824

)


(10,866

)


(63,340

)

Net income (loss) before taxes


70,485


15,661


6,973


(1,636

)


(2,646

)


(6,966

)


81,871


Income tax (provision) benefit


(18,699

)


(4,155

)


(1,850

)


433


(1,498

)


1,552


(24,217

)

Net income (loss) after taxes


51,786


11,506


5,123


(1,203

)


(4,144

)


(5,414

)


57,654


Income attributable to the non-controlling interest


3,546


Total net income attributable to Medallion Financial Corp.


$

54,108


Balance Sheet Data


Total loans net


$

961,320


$

436,772


$

76,696


$

14,046


$


$

90


$

1,488,924


Total assets


943,753


442,503


102,711


86,526


297,564


1,873,057


Total funds borrowed


744,701


349,172


81,048


68,276


234,804


1,478,001


Selected Financial Ratios


Return on average assets


5.93

%


2.90

%


6.12

%


(0.13

)%


(16.03

)%


(2.01

)%


3.33

%

Return on average stockholders' equity


*


*


*


*


*


*


21.24


Return on average equity


29.66


14.49


30.61


(0.64

)


(697.38

)


(14.49

)


17.64


Interest yield


13.45


9.14


9.86


(6.97

)


N/A


N/A


11.08


Net interest margin, gross


12.31


8.03


5.79


(34.78

)


N/A


N/A


8.91


Net interest margin, net of allowance


12.76


8.17


5.81


(93.60

)


N/A


N/A


9.25


Reserve coverage


3.37


1.68


1.49


65.74


N/A


N/A


3.37


Delinquency status (1)


0.41


0.03


0.10


N/A


N/A


0.28


Charge-off (recovery) ratio


0.29


0.15


41.72


N/A


N/A


0.89


(1)

Ratio is based on total commercial lending balances, and relates solely to the legacy commercial loan business.

(1)
Loans 90 days or more past due.

(2)

Loans 90 days or more past due.

(2)
The Company sold its interest in RPAC in December 2021. Selected earnings data are applicable through the date of sale.

(*) Line item is not applicable to segments.

(3)

Ratio is based on total commercial lending balances, and relates to the total loan business.


Year Ended December 31, 2019


Consumer Lending


(Dollars in thousands)


Recreation


Home

Improvement


Commercial

Lending


Medallion

Lending


RPAC


Corporate and Other Investments


Consolidated


Total interest income


$

99,463


$

19,943


$

7,183


$

3,665


$


$

2,308


$

132,562


Total interest expense


13,304


4,757


2,833


7,962


159


6,030


35,045


Net interest income (loss)


86,159


15,186


4,350


(4,297

)


(159

)


(3,722

)


97,517


Provision for loan losses


28,638


1,598


364


16,331


455


47,386


Net interest income (loss) after loss provision


57,521


13,588


3,986


(20,628

)


(159

)


(4,177

)


50,131


Sponsorship and race winnings


18,742


18,742


Race team related expenses


(8,996

)


(8,996

)

Other income (expense), net


(23,490

)


(7,520

)


(1,149

)


(10,493

)


(6,942

)


(7,946

)


(57,540

)

Net income (loss) before taxes


34,031


6,068


2,837


(31,121

)


2,645


(12,123

)


2,337


Income tax (provision) benefit


(8,813

)


(1,572

)


(684

)


7,596


(329

)


3,461


(341

)

Net income (loss) after taxes


$

25,218


$

4,496


$

2,153


$

(23,525

)


$

2,316


$

(8,662

)


$

1,996


Balance Sheet Data


Total loans net


$

695,257


$

244,716


$

66,405


$

105,022


$


$

3,362


$

1,114,762


Total assets


707,377


252,704


84,924


217,483


31,538


247,641


1,541,667


Total funds borrowed


563,805


201,605


68,666


176,825


7,794


150,898


1,169,593


Selected Financial Ratios


Return on average assets


3.84

%


2.20

%


2.44

%


(9.73

%)


7.28

%


(3.71

%)


(0.12

)%

Return on average equity


17.19


10.22


12.21


(48.49

)


(96.37

)


(14.26

)


(0.59

)

Interest yield


15.39


9.50


11.39


2.88


N/A


N/A


11.75


Net interest margin


13.33


7.24


6.90


(3.38

)


N/A


N/A


8.64


Reserve coverage


2.53


1.05


0.00


(1)


19.48


N/A


N/A


3.97


Delinquency status(2)


0.84


0.07


0.15


(1)


2.04


N/A


N/A


0.76


Charge-off ratio


2.69


0.37


1.30


(3)


14.68


N/A


N/A


3.60


(1)

Ratio is based on total commercial lending balances, and relates solely to the legacy commercial loan business.

(2)

Loans 90 days or more past due.

(3)

Ratio is based on total commercial lending balances, and relates to the total loan business.


Nine Months Ended December 31, 2018


Consumer Lending


(Dollars in thousands)


Recreation


Home

Improvement


Commercial

Lending


Medallion

Lending


RPAC


Corporate and Other Investments


Consolidated


Total interest income


$

68,870


$

12,799


$

7,076


$

6,317


$


$

1,741


$

96,803


Total interest expense


6,986


2,290


1,502


10,125


121


3,792


24,816


Net interest income (loss)


61,884


10,509


5,574


(3,808

)


(121

)


(2,051

)


71,987


Provision for loan losses


15,118


2,453


41,437


59,008


Net interest income (loss) after loss

   provision


46,766


8,056


5,574


(45,245

)


(121

)


(2,051

)


12,979


Sponsorship and race winnings


14,368


14,368


Race team related expenses


(7,121

)


(7,121

)

Other income (expense), net


(14,242

)


(3,093

)


(1,824

)


9,742


(11,476

)


(6,489

)


(27,382

)

Net income (loss) before taxes


32,524


4,963


3,750


(35,503

)


(4,350

)


(8,540

)


(7,156

)

Income tax (provision) benefit


(8,579

)


(1,319

)


(862

)


7,938


1,108


1,005


(709

)

Net income (loss) after taxes


$

23,945


$

3,644


$

2,888


$

(27,565

)


$

(3,242

)


$

(7,535

)


$

(7,865

)

Balance Sheet Data


Total loans net


$

580,182


$

181,359


$

59,973


$

155,863


$


$

4,110


$

981,487


Total assets


590,746


188,892


93,807


273,501


29,925


204,975


1,381,846


Total funds borrowed


434,527


143,815


53,719


294,465


7,649


127,853


1,062,028


Selected Financial Ratios


Return on average assets


5.48

%


2.56

%


4.27

%


(10.13

)%


(11.69

)%


(4.07

)%


(0.90

)%

Return on average equity


22.60


11.30


9.43


NM


NM


(12.37

)


(4.62

)

Interest yield


15.78


9.06


14.25


3.58


N/A


N/A


10.98


Net interest margin


14.18


7.44


11.23


(2.16

)


N/A


N/A


8.19


Reserve coverage


1.17


0.98


0.00


15.11


N/A


N/A


3.58


Delinquency status(2)


0.73


0.07


0.44


(1)


9.43


N/A


N/A


2.14


Charge-off ratio


1.89


0.46


0.00


7.21


N/A


N/A


2.73


(1)

Ratio is based on total commercial lending balances, and relates solely to the legacy commercial loan business.

(2)

Loans 90 days or more past due.

(11)(10) COMMITMENTS AND CONTINGENCIES

(A) EMPLOYMENT AGREEMENTS

The Company has employment agreements with certain key officers, including Mr. Alvin Murstein and Mr. Andrew Murstein, for either a one-, two-, three-, four-, or five-year term. Annually, the contracts with a five-year term will renew for new five-year terms unless prior to the end of the first year of each five-year term, either the Company or the executive provides notice to the other party of its intention not to extend the employment period beyond the current five-year term. Typically, the contracts with a one- or two-year term will renew for new one- or two-year terms unless prior to the term either the Company or the executive provides notice to the other party of its intention not to extend the employment period beyond the current one or two-year terms;term (as applicable); however, in addition to Mr. Andrew Murstein's employment agreement, as further described below, there is currently one agreement that renews after two years for additional one- yearone-year terms and one agreement with a two-yearthree-year term that does not have a renewal period. In the event of a change in control, as defined, during the employment period, the agreements provide for severance compensation to the executive in an amount equal to the balance of the salary, bonus, and value of fringe benefits which the executive would be entitled to receive for the remainder of the employment period.

On April 25, 2023, Mr. Alvin Murstein, the Company’s Chairman of the Board and Chief Executive Officer, notified the Company of his election not to renew the term of his employment pursuant to the First Amended and Restated Employment Agreement, dated May 29, 1998, as amended, between him and the Company. Accordingly, the term of his employment as Chief Executive Officer of the Company will expire on May 28, 2027, unless sooner terminated in accordance with the provisions thereof.

In addition, on April 27, 2023, Mr. Andrew Murstein, the Company’s President and Chief Operating Officer, entered into an amendment to the First Amended and Restated Employment Agreement, dated May 29, 1998, as amended, between him and the Company. Pursuant to such amendment, effective as of May 29, 2023, (i) the expiration of his then current term of employment shall be revised to end on May 28, 2027, and (ii) on May 29, 2024, and on each May 29 thereafter, such term of employment shall automatically renew each year for a three-year term unless, prior to the end of the first year of the then-applicable three-year term, either Mr. Murstein or the Company provides at least 30 days’ advance notice to the other party of its intention not to renew the then-applicable term of employment for a new three-year term, in each case unless such employment term is otherwise terminated pursuant to the terms thereof.

F-28


Employment agreements expire at various dates through 2025,2027, with future minimum payments under these agreements of approximately $12,056,000$9.9 million as follows.

follows:

(Dollars in thousands)


2021


$

3,965


2022


3,081


2023


2,073


2024


2,073


$

4,259


2025


864


2,547


2026


2,161


2027


900


Thereafter


Total


$

12,056


$

9,867


(B) OTHER COMMITMENTS

TheAs of December 31, 2023 the Company had no commitments to extend credit or make investments outstanding at December 31, 2020. other commitments. Generally, any commitments would be on the same terms as loans to or investments in existing borrowers or investees, and generally have fixed expiration dates. Since some commitments would be expected to expire without being drawn upon, the total commitment amounts do not necessarily represent future cash requirements.

(C) SEC LITIGATION

(C)On December 29, 2021, the SEC filed a civil complaint in the U.S. District Court for the Southern District of New York against the Company and its President and Chief Operating Officer alleging certain violations of the antifraud, books and records, internal controls and anti-touting provisions of the federal securities laws. The litigation relates to certain issues that occurred during the period 2015 to 2017, including (i) the Company’s retention of third parties in 2015 and 2016 concerning posting information about the Company on certain financial websites and (ii) the Company’s financial reporting and disclosures concerning certain assets, including Medallion Bank, in 2016 and 2017, a period when the Company had previously reported as a business development company (BDC) under the Investment Company Act of 1940. Since April 2018, the Company does not report as a BDC, and has not worked with such third parties since 2016. The Company does not expect to change previously reported financial results. The Company filed a motion to dismiss the complaint on March 22, 2022, the SEC filed an amended complaint on April 26, 2022 and the Company filed a motion to dismiss the amended complaint on August 5, 2022.

The SEC is seeking injunctive relief, disgorgement plus pre-judgment interest and civil penalties in amounts unspecified, as well as an officer and director bar against the Company’s President and Chief Operating Officer. The Company and its President and Chief Operating Officer intend to defend themselves vigorously and believe that the SEC will not prevail on its claims. Nevertheless, depending on the outcome of the litigation, the Company could incur a loss and other penalties that could be material to the Company, its results of operations and/or financial condition, as well as a bar against its President and Chief Operating Officer. In addition, the Company has and expects to further incur significant legal fees and expenses in defending such charges by the SEC and the Company may be subject to shareholder litigation relating to these SEC matters.

(D) OTHER LITIGATION AND REGULATORY MATTERS

The Company and its subsidiaries become defendantsare subject to inquiries from certain regulators and are currently involved in various legal proceedings arising fromincident to the normal course of business.business, including collection matters with respect to certain loans. The Company intends to vigorously defend any outstanding claims and pursue its legal rights. In the opinion of management, based on the advice of legal counsel, except for the pending SEC litigation, as described above, there is no proceeding pending, or to the knowledge of management threatened, which in the event of an adverse decision could result in a material adverse impact on the financial condition or results of operations of the Company.

(D) REGULATORY

In the ordinary course of business, the Company and its subsidiaries are subject to inquiries from certain regulators. During 2014, FSVC was examined by the SBA. The foregoing regulatory examination was resolved in January 2017 as a result of FSVC transfer to liquidation status and the restructure of the FSVC loan described in Note 6.

(12)(11) RELATED PARTY TRANSACTIONS

Certain directors, officers, and stockholders of the Company are also directors and officers of its main consolidated subsidiaries, MFC, MCI, FSVC, and the Bank, as well as other subsidiaries. Officer salaries are set by the Board of Directors of the Company.

Jeffrey Rudnick, the son of one of the Company’s directors, was an officer of LAX Group, LLC, or LAX, one of the Company’s equity investments that sold its assets on December 16, 2020. Mr. Rudnick receives a salary from LAX of $178,000 per year, which was reduced to $133,000 in the 2020 second quarter, and certain equity from LAX consisting of 10% ownership in LAX Class B stock, vesting at 3.34% per year; 5% of any new equity raised from outside investors at a valuation of $1,500,000 or higher; and 10% of LAX’s profits as a year-end bonus. In addition, Mr. Rudnick provided consulting services to the Company directly for a monthly retainer of $4,200. Effective March 1, 2021, Mr. Rudnick servesserved as the Company’s Senior Vice President at a salary of $195,000 per year$250,950, $239,000, and is no longer providing consulting services$195,000 for the years ended December 31, 2023, 2022, and 2021, which was increased to the Company.

The Company’s subsidiary RPAC, has an agreement with minority shareholder Richard Petty, in which it makes$260,988 effective January 1, 2024. Mr. Rudnick received an annual paymentcash bonus of $700,000 per year for services provided to$95,000, $85,000, and $75,000 as well as an equity bonus in the entity. In addition, RPAC has a note payable to a trust controlled by Mr. Pettyamount of $7,442,000, that earns interest at an annual rate of 2% through March 2022, NaN of which has been paid to date.

$In the 2019 second quarter, RPAC entered into a sponsorship agreement with Victory Junction, a 501(c)(3) public charity of which Richard Petty is a board member, for $7,000,000 of sponsorship payments to RPAC during the 2019 race car season, of which $5,600,000 was subsequently earned52,000, $50,000, and received in 2019, and the balance which was written off as it was not expected to be received.$

The Company had assigned its servicing rights to the Bank portfolio to MSC, a wholly-owned entity that had been unconsolidated under Investment Company Accounting. The costs of servicing are allocated to MSC by the Company, and the servicing fee income is billed and collected from the Bank by MSC. As a result, $1,290,000 of servicing fee income was earned by MSC45,019 for the three monthsyears ended MarchDecember 31, 2018.2023, 2022, and 2021.

For the three months ended March 31, 2018, other income received from the Bank that was not eliminated under Investment Company Accounting was $256,000.

F-29


(13)(12) STOCKHOLDERS’/SHAREHOLDERS’ EQUITY

In November 2003, the Company announcedOn April 29, 2022, our board of directors authorized a new stock repurchase program with no expiration date, pursuant to which we were authorized theto repurchase of up to $10,000,000$35 million of common stock. In November 2004, theour shares, which was increased to $40 million on August 10, 2022, also with no expiration date. Such new repurchase program was increased by an additional $10,000,000,replaced the previous one, which was further increased to a total of $20,000,000 in July 2014, and which was further increased to a total of $26,000,000 in July 2015.terminated. As of December 31, 2020, a total of 2,931,125 shares had been repurchased for $24,587,000, and $22,874,5092023, up to $19,998,012 of shares remain authorized for repurchase under our stock repurchase program.

The Company did not repurchase any shares during the program. There were 0 purchases in 2020, 2019, and 2018.

(14) SELECTED FINANCIAL RATIOS AND OTHER DATA (Investment Company Accounting)

The following table provides selected financial ratios and other data for the periods indicated.


Three

Months

Ended

March 31,


(Dollars in thousands, except per share data)


2018


Net share data


Net asset value at the beginning of the year


$

11.80


Net investment income (loss)


(0.15

)

Income tax provision (benefit)


0.03


Net realized gains (losses) on investments


(1.44

)

Net change in unrealized appreciation on investments


0.94


Net increase (decrease) in net assets resulting from

   operations


(0.62

)

Issuance of common stock


(0.03

)

Total increase (decrease) in net asset value


(0.65

)

Net asset value at the end of the period/year (1)


$

11.15


Per share market value at beginning of year


$

3.53


Per share market value at end of period/year


4.65


Total return (2)


(129

%)

Ratios/supplemental data


Total shareholders’ equity (net assets)


$

272,437


Average net assets


284,021


Total expense ratio (3) (4)


10.02

%

Operating expenses to average net assets (4)


5.87


Net investment income (loss) after income taxes to average

   net assets (4)


(4.61

)

(1)year ended December 31, 2023.

Includes $0.00 of undistributed net investment income per share as of March 31, 2018 and $0.00 of undistributed net realized gains per share for the period presented.

(2)

Total return is calculated by dividing the change in market value of a share of common stock during the year, assuming the reinvestment of distributions on the payment date, by the per share market value at the beginning of the year.

(3)

Total expense ratio represents total expenses (interest expense, operating expenses, and income taxes) divided by average net assets.

(4)

MSC has assumed certain of the Company’s servicing obligations, and as a result, servicing fee income of $1,290, and operating expenses of $1,150, which formerly were the Company’s, were now MSC’s for the three months ended March 31, 2018. Excluding the impact of the MSC amounts, the total expense ratio, operating expense ratio, and net investment income (loss) ratio would have been 11.75%, 6.88%, and 7.51% in the March 31, 2018 quarter.


(15)(13) EMPLOYEE BENEFIT PLANS

The Company has a 401(k) Investment Plan, or the 401(k) Plan, which, effective June 1, 2022, covers all full-time and part-time employees of the Company who have attained the age of 2118 and have a minimum of thirty (30) days of service, including the employees of Medallion Bank.service. Under the 401(k) Plan, an employee may elect to defer not less than 1%1% of total annual compensation, up to the applicable limits set forth in the Internal Revenue Code. Employee contributions are invested in various mutual funds according to the directions of the employee. Once eligible full-time employees have completed a minimum of one (1) yearninety (90) days of service, and part time employees have worked at least 5001,000 hours, the Company matches employee contributions to the 401(k) Plan in an amount per employee equal to one-thirdfifty percent of the first 6%8% of the employee’s annual contributions, subject to legal limits. Prior to June 1, 2022, the 401(k) Plan covered full- and part-time employees of the Company aged 21 and older that had completed a minimum of thirty (30) days of service, with the Company matching one-third of the first 6% of the contributions of eligible employees that had completed at least one (1) year of service (in the case of full-time employees) or 1,000 hours (in the case of part-time employees). The Company’s 401(k) plan expense including amounts for the employees of Medallion Bank and other consolidated subsidiaries in the prior year periods, was approximately $203,000, $193,000,$0.5 million, $0.3 million, and $182,000$0.3 million for the years ended December 31, 2020, 2019,2023, 2022, and 2018.2021.

(16)(14) FAIR VALUE OF FINANCIAL INSTRUMENTS

FASB ASC Topic 825, “Financial Instruments,” requires disclosure of fair value information about certain financial instruments, whether assets, liabilities, or off-balance-sheet commitments, if practicable. The following methods and assumptions were used to estimate the fair value of each class of financial instrument. Fair value estimates that were derived from broker quotes cannot be substantiated by comparison to independent markets and, in many cases, could not be realized in immediate settlement of the instrument.

(a)

Cash – Book value equals fair value.

(a)
Cash and cash equivalents – Book value equals fair value.

(b)

Equity securities – The Company’s equity securities are recorded at cost less impairment plus or minus observable price changes.

(b)
Equity securities – The Company’s equity securities are recorded at cost less impairment plus or minus observable price changes.

(c)

Investment securities – The Company’s investments are recorded at the estimated fair value of such investments.

(c)
Investment securities – The Company’s investments are recorded at the estimated fair value of such investments.

(d)

Loans receivable – The Company’s loans are recorded at book value which approximated fair value.

(d)
Loans receivable – The Company’s loans are recorded at book value which approximated fair value.

(e)

Floatingrateborrowings – Due to the short-term nature of these instruments, the carrying amount approximates fair value.

(e)
Floatingrateborrowings – Due to the short-term nature of these instruments, the carrying amount approximates fair value.

(f)

Commitmentstoextendcredit – The fair value of commitments to extend credit is estimated using the fees currently charged to enter into similar agreements, taking into account the remaining terms of the agreements and present creditworthiness of the counter parties. For fixed rate loan commitments, fair value also includes a consideration of the difference between the current levels of interest rates and the committed rates. At December 31, 2020 and December 31, 2019, the estimated fair value of these off-balance-sheet instruments was not material.

(f)
Commitmentstoextendcredit – The fair value of commitments to extend credit is estimated using the fees currently charged to enter into similar agreements, taking into account the remaining terms of the agreements and present creditworthiness of the counter parties. For fixed rate loan commitments, fair value also includes a consideration of the difference between the current levels of interest rates and the committed rates. At December 31, 2023 and 2022, the estimated fair value of these off-balance-sheet instruments was not material.

(g)

Fixedrateborrowings – The fair value of the debentures payable to the SBA is estimated based on current market interest rates for similar debt.

(g)
Fixedrateborrowings – The fair value of the debentures payable to the SBA is estimated based on current market interest rates for similar debt.


December 31, 2020


December 31, 2019


(Dollars in  thousands)


Carrying

Amount


Fair

Value


Carrying

Amount


Fair

Value


Financial assets


Cash, cash equivalents, and federal funds sold (1)


$

112,040


$

112,040


$

67,821


$

67,821


Equity investments


9,746


9,746


10,079


10,079


Investment securities


46,792


46,792


48,998


48,998


Loans receivable


1,172,290


1,172,290


1,114,762


1,114,762


Accrued interest receivable (2)


10,338


10,338


8,662


8,662


Financial liabilities


Funds borrowed (3)


1,312,255


1,312,591


1,169,593


1,171,274


Accrued interest payable (2)


4,673


4,673


4,398


4,398


F-30


(1)

Categorized as level 1 within the fair value hierarchy, excluding $1,500 of interest-bearing deposits categorized as level 2. See Note 17.

(2)

Categorized as level 3 within the fair value hierarchy. See Note 17.

The following table presents the carrying amounts and fair values of the Company’s financial instruments as of December 31, 2023 and 2022.


December 31,


2023


2022


(Dollars in thousands)


Carrying
Amount


Fair
Value


Carrying
Amount


Fair
Value


Financial assets


Cash, cash equivalents, and federal funds sold (1)


$

149,845


$

149,845


$

105,598


$

105,598


Equity investments


11,430


11,430


10,293


10,293


Investment securities


54,282


54,282


48,492


48,492


Loans receivable


2,131,651


2,131,651


1,853,108


1,853,108


Accrued interest receivable (2)


13,538


13,538


12,613


12,613


Equity securities(3)


1,748


1,748


1,724


1,724


Financial liabilities


Funds borrowed


2,118,689


2,118,689


1,833,434


1,833,434


Accrued interest payable (2)


6,822


6,822


4,790


4,790


(1)
Categorized as level 1 within the fair value hierarchy, excluding $1.3 million as of December 31, 2023 and $1.3 million as of December 31, 2022 of interest-bearing deposits categorized as level 2. See Note 15.

(3)

As of December 31, 2020 and 2019, publicly traded unsecured notes traded at a premium to par of $336 and $1,681.

(2)
Categorized as level 3 within the fair value hierarchy. See Note 15.

(3)
Included within other assets on the balance sheet.

(17)(15) FAIR VALUE OF ASSETS AND LIABILITIES

The Company follows the provisions of FASB ASC 820, which defines fair value, establishes a framework for measuring fair value, establishes a fair value hierarchy based on the quality of inputs used to measure fair value, and enhances disclosure requirements for fair value measurements.

In accordance with FASB ASC 820, the Company has categorized its assets and liabilities measured at fair value, based on the priority of the inputs to the valuation technique, into a three-level fair value hierarchy. The fair value hierarchy gives the highest priority to quoted prices in active markets for identical assets or liabilities (level 1) and the lowest priority to unobservable inputs (level 3). OurThe Company's assessment and classification of an investment within a level can change over time based upon maturity or liquidity of the investment and would be reflected at the beginning of the quarter in which the change occurred.

As required by FASB ASC 820, when the inputs used to measure fair value fall within different levels of the hierarchy, the level within which the fair value measurement is categorized is based on the lowest level input that is significant to the fair value measurement in its entirety. For example, a level 3 fair value measurement may include inputs that are observable (levels 1 and 2) and unobservable (level 3). Therefore, gains and losses for such assets and liabilities categorized within the level 3 table below may include changes in fair value that are attributable to both observable inputs (levels 1 and 2) and unobservable inputs (level 3).

Assets and liabilities measured at fair value, recorded on the consolidated balance sheets, are categorized based on the inputs to the valuation techniques as follows:

Level 1. Assets and liabilities whose values are based on unadjusted quoted prices for identical assets or liabilities in an active market that the Company has the ability to access (examples include active exchange-traded equity securities, exchange-traded derivatives, most USU.S. Government and agency securities, and certain other sovereign government obligations).

Level 2. Assets and liabilities whose values are based on quoted prices in markets that are not active or model inputs that are observable either directly or indirectly for substantially the full term of the asset or liability. Level 2 inputs include the following:

a)
Quoted prices for similar assets or liabilities in active markets (for example, restricted stock);
b)
Quoted price for identical or similar assets or liabilities in non-active markets (for example, corporate and municipal bonds, which trade infrequently);
c)
Pricing models whose inputs are observable for substantially the full term of the asset or liability (examples include most over-the-counter derivatives, including interest rate and currency swaps); and
d)
Pricing models whose inputs are derived principally from or corroborated by observable market data through correlation or other means for substantially the full term of the asset or liability (examples include certain residential and commercial mortgage-related assets, including loans, securities, and derivatives).

A)

Quoted prices for similar assets or liabilities in active markets (for example, restricted stock);

B)

Quoted price for identical or similar assets or liabilities in non-active markets (for example, corporate and municipal bonds, which trade infrequently);

C)

Pricing models whose inputs are observable for substantially the full term of the asset or liability (examples include most over-the-counter derivatives, including interest rate and currency swaps); and

D)

Pricing models whose inputs are derived principally from or corroborated by observable market data through correlation or other means for substantially the full term of the asset or liability (examples include certain residential and commercial mortgage-related assets, including loans, securities, and derivatives).

Level 3. Assets and liabilities whose values are based on prices or valuation techniques that require inputs that are both unobservable and significant to the overall fair value measurement. These inputs reflect management’s own assumptions about the assumptions a market participant would use in pricing the assets or liability (examples include certain private equity investments, and certain residential and commercial mortgage-related assets, including loans, securities, and derivatives).

F-31


A review of fair value hierarchy classification is conducted on a quarterly basis. Changes in the observability of valuation inputs may result in a reclassification for certain assets or liabilities. Reclassifications impacting level 3 of the fair value hierarchy are reported as transfers in/out of the level 3 category as of the beginning of the quarter in which the reclassifications occur.

Equity investments were recorded at cost less impairment plus or minus observable price changes. Commencing in 2020, the Company elected to measure equity investments at fair value on a non-recurring basis, which have been adjusted for all periods presentedpresented..


The following tables present the Company’s fair value hierarchy for those assets and liabilities measured at fair value on a recurring basis as of December 31, 20202023 and 2019.2022.

December 31, 2023
(Dollars in thousands)


Level 1


Level 2


Level 3


Total


Assets


Interest-bearing deposits


$


$

1,250


$


$

1,250


Available for sale investment securities


54,282


54,282


Equity securities


1,748


1,748


Total(1)


$

1,748


$

55,532


$


$

57,280


December 31, 2020

(Dollars in thousands)


Level 1


Level 2


Level 3


Total


Assets


Interest-bearing deposits


$


$

1,500


$


$

1,500


Available for sale investment securities


46,792


46,792


Total(1)


$


$

48,292


$


$

48,292


(1)
Total unrealized losses of $0.3 million, net of tax, was included in comprehensive loss for the year ended December 31, 2023 related to these assets.

December 31, 2022
(Dollars in thousands)


Level 1


Level 2


Level 3


Total


Assets


Interest-bearing deposits


$


$

1,250


$


$

1,250


Available for sale investment securities


48,492


48,492


Equity securities


1,724


1,724


Total(1)


$

1,724


$

49,742


$


$

51,466


(1)
Total unrealized losses of $4.4 million, net of tax, was included in other comprehensive loss for the year ended December 31, 2022 related to these assets.

(1)

Total unrealized gains of $1,013, net of tax, was included in accumulated other comprehensive income (loss) for the twelve months ended December 31, 2020 related to these assets.

December 31, 2019

(Dollars in thousands)


Level 1


Level 2


Level 3


Total


Assets


Available for sale investment securities (1)


$


$

48,998


$


$

48,998


Total


$


$

48,998


$


$

48,998


(1)

Total unrealized gains of $1,081, net of tax, was included in accumulated other comprehensive income (loss) for the twelve months ended December 31, 2019 related to these assets.

The following tables present the Company’s fair value hierarchy for those assets and liabilities measured at fair value on a non-recurring basis as of December 31, 20202023 and 2019.2022.

December 31, 2023
(Dollars in thousands)


Level 1


Level 2


Level 3


Total


Assets


Equity investments


$


$


$

11,430


$

11,430


Impaired loans


25,974


25,974


Loan collateral in process of foreclosure


11,772


11,772


Total


$


$


$

49,176


$

49,176


December 31, 2022
(Dollars in thousands)


Level 1


Level 2


Level 3


Total


Assets


Equity investments


$


$


$

10,293


$

10,293


Impaired loans


32,133


32,133


Loan collateral in process of foreclosure


21,819


21,819


Total


$


$


$

64,245


$

64,245


December 31, 2020

(Dollars in thousands)


Level 1


Level 2


Level 3


Total


Assets


Equity investments


$


$


$

9,746


$

9,746


Impaired loans


62,174


62,174


Loan collateral in process of foreclosure


54,560


54,560


Total


$


$


$

126,480


$

126,480


F-32


December 31, 2019

(Dollars in thousands)


Level 1


Level 2


Level 3


Total


Assets


Equity investments


$


$


$

10,079


$

10,079


Impaired loans


34,915


34,915


Loan collateral in process of foreclosure


52,711


52,711


Total


$


$


$

97,705


$

97,705


Significant Unobservable Inputs

ASC Topic 820 requires disclosure of quantitative information about the significant unobservable inputs used in the valuation of assets and liabilities classified as level 3 within the fair value hierarchy. The tables below are not intended to be all-inclusive, but rather to provide information on significant unobservable inputs and valuation techniques used by the Company.

The valuation techniques and significant unobservable inputs used in non-recurring level 3 fair value measurements of assets and liabilities as of December 31, 20202023 and 2019.2022.

(Dollars in thousands)


Fair Value
at December 31, 2023


Valuation Techniques


Unobservable Inputs


Range
(Weighted Average)

Equity investments


$

11,157


Investee financial analysis


Financial condition and operating performance of the borrower (1)


N/A


Collateral support


N/A


273


Precedent market transaction


Offering price


$8.73 / share

Impaired loans


25,974


Market approach


Historical and actual loss experience


0.00% - 28.48%


60% of balance


Transfer prices (2)


$0.0 - $79.5


Collateral value


N/A

Loan collateral in process of foreclosure


11,772


Market approach


Transfer prices (2)


$0.0 - $79.5


Collateral value (3)


$2.3 - $45.0

(Dollars in thousands)


Fair Value
at December 31, 2022


Valuation Techniques


Unobservable Inputs


Range
(Weighted Average)

Equity investments


$

10,020


Investee financial analysis


Financial condition and operating performance of the borrower (1)


N/A


Collateral support


N/A


273


Precedent market transaction


Offering price


$8.73 / share

Impaired loans


32,133


Market approach


Historical and actual loss experience


0.00% - 6.55%


60% of balance


Transfer prices (2)


$0.0 - 79.5


Collateral value


N/A

Loan collateral in process of foreclosure


21,819


Market approach


Transfer prices (2)


$0.0 - 79.5


Collateral value (3)


$2.5 - $54.1

(Dollars in thousands)


Fair Value

at 12/31/20


Valuation Techniques


Unobservable Inputs


Range

(Weighted Average)

Equity investments


$

8,291


Investee financial analysis


Financial condition and operating performance of the borrower (1)


N/A


Collateral support


N/A


1,455


Precedent market transaction


Offering price


$8.73 / share

Impaired loans


62,174


Market approach


Historical and actual loss experience


1.50% - 6.00%


60% of balance


Median transfer price (2)


$0.6 - 108.7


Collateral value


N/A

Loan collateral in process of foreclosure


53,128


Market approach


Median transfer price (2)


$0.6 - 108.7


1,432


Collateral value (3)


$0.7 - 32.3

(1)
Includes projections based on revenue, EBITDA, leverage and liquidation amounts. These assumptions are based on a variety of factors, including economic conditions, industry and market developments, market valuations of comparable companies, and company-specific developments, including exit strategies and realization opportunities.

(1)

Includes projections based on revenue, EBITDA, leverage and liquidation amounts. These assumptions are based on a variety of factors, including economic conditions, industry and market developments, market valuations of comparable companies, and company-specific developments, including exit strategies and realization opportunities.

(2)

Represents amount net of liquidation costs.

(2)
Represents amount net of liquidation costs.

(3)

(3)

Relates to the recreation portfolio.

(Dollars in thousands)


Fair Value

at 12/31/19


Valuation Techniques


Unobservable Inputs


Range

(Weighted Average)

Equity Investments


$

7,435


Investee financial analysis


Financial condition and operating performance of the borrower


N/A


Collateral support


N/A


1,189


Investee book value adjusted for market appreciation


Financial condition and operating performance of the investee


N/A


Public company comparables


Business enterprise value


$4,855 – $6,120


Business enterprise value/revenue multiples


1.59-5.98x


Discount for lack of marketability


25%


1,455


Precedent market transaction


Offering price


$8.73 / share

(18)(16) MEDALLION BANK PREFERRED STOCK (Non-controlling interest)

On December 17, 2019, the Bank closed an initial public offering of 1,840,000 shares of its Fixed-to-Floating Rate Non-Cumulative Perpetual Preferred Stock, Series F, with a $46,000,000$46.0 million aggregate liquidation amount, yielding net proceeds of $42,485,000,$42.5 million, which were recorded in the Bank’s shareholders’ equity. Dividends are payable quarterly from the date of issuance to, but excluding April 1, 2025, at a rate of 8%8% per annum, and from and including April 1, 2025, at a floating rate equal to a benchmark rate (which is expected to be three-month Secured Overnight Financing Rate, or SOFR)SOFR) plus a spread of 6.46%6.46% per annum.

On July 21, 2011, the Bank issued, and the USU.S. Treasury purchased, 26,303 shares of Senior Non-Cumulative Perpetual Preferred Stock, Series E or Series E, for an aggregate purchase price of $26,303,000$26.3 million under the Small Business Lending Fund Program, or SBLF, with a liquidation amount of $1,000$1,000 per share. The SBLF is a voluntary program intended to encourage small


business lending by providing capital to qualified smaller banks at favorable rates. The Bank pays a dividend rate of 9%9% on the Series E.

F-33


(19)

(17) PARENT COMPANY ONLY CONDENSED FINANCIAL STATEMENTS

The following shows the condensed financial information of Medallion Financial Corp. (parent company only).

Condensed Balance Sheets


December 31,


(Dollars in thousands)


2023


2022


Assets


Cash


$

31,001


$

20,669


Investment in bank subsidiary(1)


523,189


479,496


Investment in non-bank subsidiaries


88,931


83,727


Income tax receivable


21,951


22,835


Net loans receivable


2,403


2,538


Loan collateral in process of foreclosure


795


2,001


Other assets


6,613


7,603


Total assets


$

674,883


$

618,869


Liabilities


Long-term borrowings (2)


$

166,625


$

151,808


Short-term borrowings


3,000


Deferred tax liabilities


35,719


38,091


Intercompany payables


32,600


33,378


Other liabilities


25,165


25,068


Total liabilities


263,109


248,345


Parent company equity


342,986


301,736


Non-controlling interest


68,788


68,788


Total stockholders’ equity


411,774


370,524


Total liabilities and equity


$

674,883


$

618,869


(1)
Includes $171.4 million and $172.8 million of goodwill and intangible assets of the Company which relate specifically to the Bank and $68.8 million related to non-controlling interests in consolidated subsidiaries as of December 31, 2023 and 2022.
(2)
Includes $2.8 million and $2.1 million of deferred financing costs as of December 31, 2023 and 2022.

(Dollars in thousands)


December 31, 2020


December 31, 2019


Assets


Cash


$

33,743


$

4,477


Net loans receivable


12,293


26,802


Loan collateral in process of foreclosure


9,960


11,104


Goodwill and intangible assets


175,731


177,176


Investment in bank subsidiaries


149,686


158,201


Investment in non-bank subsidiaries


88,165


92,856


Income tax receivable


1,470


4,708


Other assets


10,912


14,111


Total assets


$

481,960


$

489,435


Liabilities


Other liabilities


$

21,302


$

18,660


Intercompany payables


51,352


54,904


Short-term borrowings


53,359


8,188


Deferred tax liabilities


24,172


30,728


Long-term borrowings


100,367


113,807


Total liabilities


250,552


226,287


Total stockholders’ equity


231,408


263,148


Total liabilities and equity


$

481,960


$

489,435


Condensed Statements of Operations


Year Ended December 31,


(Dollars in thousands)


2023


2022


2021


Dividend income


$

25,125


$

24,750


$

19,000


Interest income (loss)


1,243


(119

)


(2,554

)

Total Dividend and interest income


26,368


24,631


16,446


Interest expense


12,771


11,289


11,209


Net interest income


13,597


13,342


5,237


Provision for credit losses


(310

)


(353

)


(4,718

)

Net interest income after provision for credit losses


13,907


13,695


9,955


Other expense, net (1)


(20,156

)


(18,423

)


(6,224

)

Income (loss) before income taxes and undistributed earnings of subsidiaries


(6,249

)


(4,728

)


3,731


Income tax benefit


5,291


7,940


4,452


Income (loss) before undistributed earnings of subsidiaries


(958

)


3,212


8,183


Undistributed earnings of subsidiaries


56,037


40,628


45,925


Net income attributable to parent company


$

55,079


$

43,840


$

54,108


Year Ended


(Dollars in thousands)


December 31, 2020


December 31, 2019


Nine Months Ended

December 31, 2018


Interest income


$

(2,824

)


$

(2,552

)


$

(1,958

)

Interest expense


8,602


8,856


5,480


Net interest loss


(11,426

)


(11,408

)


(7,438

)

Provision for loan losses


5,127


6,377


19,190


Net interest loss after provision for loan losses


(16,553

)


(17,785

)


(26,628

)

Other income (expense), net


(22,062

)


(13,686

)


(16,913

)

Loss before income taxes and undistributed earnings of

   subsidiaries


(38,615

)


(31,471

)


(43,541

)

Income tax benefit


10,454


7,013


5,328


Loss before undistributed earnings of subsidiaries


(28,161

)


(24,458

)


(38,213

)

Undistributed earnings (losses) of subsidiaries


(6,622

)


22,696


28,041


Net income (loss) attributable to parent company


$

(34,783

)


$

(1,762

)


$

(10,172

)

(1)
Includes $3.1 million, $4.9 million, and $7.8 million of net gains on the disposition of taxi medallion assets for the years ended December 31, 2023, 2022, and 2021.

Condensed Statements of Other Comprehensive Income (Loss)


Year Ended December 31,


(Dollars in thousands)


2023


2022


2021


Net income


$

55,079


$

43,840


$

54,108


Other comprehensive loss, net of tax


(347

)


(4,383

)


(978

)

Total comprehensive income attributable to Medallion
   Financial Corp.


$

54,732


$

39,457


$

53,130


Year Ended


(Dollars in thousands)


December 31, 2020


December 31, 2019


Nine Months Ended

December 31, 2018


Net loss


$

(34,783

)


$

(1,762

)


$

(10,172

)

Other comprehensive income (loss)


1,013


1,081


(82

)

Total comprehensive income (loss) attributable to Medallion Financial Corp.


$

(33,770

)


$

(681

)


$

(10,254

)

F-34


Condensed Statements of Cash Flow


Year Ended December 31,


(Dollars in thousands)


2023


2022


2021


CASH FLOWS FROM OPERATING ACTIVITIES


Net income/net decrease in net assets resulting from operations


$

55,079


$

43,840


$

54,108


Adjustments to reconcile net income/net decrease in net assets resulting from
operations to net cash provided by operating activities:


Equity in undistributed (earnings) losses of subsidiaries


(81,164

)


(64,300

)


(60,304

)

(Benefit) provision for credit losses


(310

)


(353

)


(4,718

)

Depreciation and amortization


2,198


2,740


4,485


Change in deferred and other tax assets/liabilities, net


(947

)


(1,780

)


(5,666

)

Net change in loan collateral in process of foreclosure


252


64


1,619


Gain on extinguishment of debt


(2,204

)

Net realized gains on sale of investments


(11,701

)

Stock-based compensation expense


4,713


3,476


2,261


Decrease (increase) in other assets


990


1,055


(1,150

)

Increase in deferred financing costs


(1,437

)


(39

)


(1,504

)

Decrease in intercompany payables


(778

)


(6,325

)


(11,649

)

(Decrease) increase in other liabilities


(134

)


5,430


(1,894

)

Net cash used for operating activities


(21,538

)


(16,192

)


(38,317

)

CASH FLOWS FROM INVESTING ACTIVITIES


Loans originated


(1,612

)


(92

)


Proceeds from principal receipts, sales, and maturities of loans and investments


2,057


723


28,552


Purchases of investments


(90

)

Proceeds from sale and principal payments of loan collateral in process of foreclosure


954


3,697


666


Investment in subsidiaries


(5,125

)


(4,750

)


(3,500

)

Dividends from subsidiaries


25,125


24,750


19,000


Net cash provided by investing activities


21,399


24,328


44,628


CASH FLOWS FROM FINANCING ACTIVITIES


Proceeds from funds borrowed


51,500


51,400


Repayments of funds borrowed


(33,000

)


(51,155

)

Treasury stock repurchased


(20,619

)


Dividends paid to shareholders


(7,703

)


(7,543

)


Payment of withholding taxes on net settlement of vested stock


(768

)


Proceeds from the exercise of stock options


442


155


241


Net cash (used for) provided by financing activities


10,471


(28,007

)


486


NET (DECREASE) INCREASE IN CASH AND CASH EQUIVALENTS


10,332


(19,871

)


6,797


Cash and cash equivalents, beginning of period


20,669


40,540


33,743


Cash and cash equivalents, end of period


$

31,001


$

20,669


$

40,540


Year Ended


(Dollars in thousands)


December 31, 2020


December 31, 2019


Nine Months Ended

December 31, 2018


CASH FLOWS FROM OPERATING ACTIVITIES

   Net loss


$

(34,783

)


$

(1,762

)


$

(10,172

)

Adjustments to reconcile net loss to net cash provided by

   operating activities:


Equity in undistributed (earnings) losses of subsidiaries


6,622


(22,696

)


(28,041

)

Provision for loan losses


5,127


6,377


19,190


Depreciation and amortization


5,357


5,484


5,451


Change in deferred and other tax assets/liabilities, net


(3,317

)


(2,225

)


4,512


Net change in loan collateral in process of foreclosure


4,940


906


678


Net change in unrealized depreciation on investments


3,493


1,786


Stock-based compensation expense


2,031


1,221


425


Decrease in other assets


2,299


988


4,073


Increase in deferred financing costs


(1,233

)


(1,297

)


Decrease in intercompany payables


(3,552

)


(8,448

)


(3,368

)

Increase in other liabilities


2,336


(1,759

)


4,237


Net cash used by operating activities


(10,680

)


(21,425

)


(3,015

)

CASH FLOWS FROM INVESTING ACTIVITIES


Loans originated


(14

)


(3,312

)


(309

)

Proceeds from principal receipts, sales, and maturities of loans and investments


1,193


2,313


10,900


Purchases of investments


(2,304

)


(1,125

)


Proceeds from sale and principal payments of loan collateral in process of foreclosure


1,276


2,403


487


Dividends from subsidiaries


7,597


6,248


5,200


Net cash provided by investing activities


7,748


6,527


16,278


CASH FLOWS FROM FINANCING ACTIVITIES


Proceeds from funds borrowed


33,600


36,000


Repayments of funds borrowed


(1,402

)


(17,735

)


(17,208

)

Net cash provided by (used for) financing activities


32,198


18,265


(17,208

)

NET INCREASE (DECREASE) IN CASH AND

   CASH EQUIVALENTS


29,266


3,367


(3,945

)

Cash and cash equivalents, beginning of period


4,477


1,110


5,055


Cash and cash equivalents, end of period


$

33,743


$

4,477


$

1,110


(20)(18) VARIABLE INTEREST ENTITIES

During the 2018 third quarter, the Company determined that Taxi Medallion Trust III, or Trust III, was a VIE. Trust III had historically been consolidated as a subsidiary of MFC, historically, although it should have been consolidated under the variable interest model, since MFC was its primary beneficiary until October 31, 2018. Trust III iswas a VIE since the key decision-making authority restsrested in the servicing agreement (where MFC iswas the servicer for Trust III) rather than in the voting rights of the equity interests and as a result the decision-making rights are


were considered a variable interest. This conclusion iswas supported by a qualitative assessment that Trust III doesdid not have sufficient equity at risk. Since the inception of Trust III, MFC had also been party to a limited guaranty which was considered a variable interest because, pursuant to the guaranty, MFC absorbed variability as a result of the on-going performance of the loans in Trust III. As of October 31, 2018, the Company determined that MFC was no longer the primary beneficiary of Trust III and accordingly deconsolidated the VIE, leading to a net gain of $25,325,000$25.3 million recorded as well as a new promissory note payable by MFC of $1,400,000$1.4 million issued in settlement of the limited guaranty. See Note 6 for more details. TheSubsequent to deconsolidation, the Company’s interest in Trust III iswas accounted for as an equity investment and hashad a value of $0 as of December 31, 2020 and 2019. $0 through its transfer to a third party in 2021. In addition, MFC remainsthe Company remained the servicer of the assets of Trust III for a fee.fee, until its disposition.

(19) SUBSEQUENT EVENTS

In December 2008, Trust III entered into the DZ loan agreement with DZ Bank, to provide up to $200,000,000 of financing through a commercial paper conduit to acquire medallion loans from MFC, or the DZ loan. The loan, which has an outstanding balance of $86,825,000, currently terminates on May 15, 2021. Borrowings under the DZ loan are collateralized by Trust III’s assets.

(21) SUBSEQUENT EVENTS

The Company has evaluated the effects of events that have occurred subsequent to the year ended December 31, 2020,2023, through the date of financial statement issuance.issuance for potential recognition or disclosure. As of such date, there was one subsequent event that required disclosure.

On March 11, 2021, oneFebruary 28, 2024, MCI accepted a commitment from the SBA for $18.5 million in debenture financing with a ten-year term. MCI can draw funds under the commitment, in whole or in part, until September 30, 2028. In connection with the commitment, MCI paid the SBA a leverage fee of $0.2 million, with the remaining $0.4 million of the notes payablefee to banks with a maturity of September 1, 2021 wasbe paid off.

On March 12, 2021, one ofpro rata as MCI draws under the notes payable to banks with a maturity of April 15, 2021 was paid off.commitment.

A lender for one of the notes payable to banks with a maturity date of February 1, 2021 has agreed to extend such note until December 31, 2021.F-35

A lender for nine of the notes payable to banks with maturity dates of February 9, 2021 has agreed to extend such notes until December 31, 2021.

Fourteen of the notes payable to banks with maturity dates of February 1, 2021 were extended until April 1, 2021.

F-49