Page | ||||
3 | ||||
Item 1. | 4 | |||
Item 1A. |
| |||
Item 1B. |
| |||
Item | 23 | |||
Item 2. |
| |||
Item 3. |
| |||
Item 4. |
| |||
Item 5. |
| |||
Item 6. |
| |||
Item 7. | Management’s Discussion and Analysis of Financial Condition and Results of Operations |
| ||
Item 7A. |
| |||
Item 8. |
| |||
Item 9. | Changes in and Disagreements with Accountants on Accounting and Financial Disclosure |
| ||
Item 9A. |
| |||
Item 9B. |
| |||
Item 10. |
| |||
Item 11. |
| |||
Item 12. | Security Ownership of Certain Beneficial Owners and Management and Related Stockholder Matters |
| ||
Item 13. | Certain Relationships and Related Transactions, and Director Independence |
| ||
Item 14. |
| |||
Item 15. |
| |||
| ||||
2
SPECIAL NOTE REGARDING FORWARD-LOOKING STATEMENTS
This Annual Report contains “forward-looking statements.” Such statements can be identified by the use of forward-looking terminology such as “objectives,” “goals,” “preliminary,” “range,” “believes,” “expects,” “may,” “estimates,” “will,” “should,” “plans” or “anticipates” or the negative thereof or other variations thereon or comparable terminology, or by discussions of strategy. Readers are cautioned that any such forward-looking statements are not guarantees of future performance and may involve significant risks and uncertainties, and that actual results may vary materially from those anticipated or implied in the forward-looking statements as a result of various factors. Among the factors that significantly impact the metals distribution industry and our business are:
| • highly cyclical fluctuations resulting from, among others, seasonality, market uncertainty, and costs of goods sold; • remaining competitive and maintaining market share in the highly competitive and fragmented metals distribution industry; • managing the costs of purchased metals relative to the price at which we sell our products during periods of rapid price escalation or deflation; • the management of inventory and other costs and expenses; • customer, supplier, and competitor consolidation, bankruptcy, or insolvency; • the impairment of goodwill that could result from, among other things, volatility in the markets in which we operate; • the impact of geopolitical events; • future funding for postretirement employee benefits may require substantial payments from current cash flow; • the failure to effectively integrate newly acquired operations; • the regulatory and other operational risks associated with our operations located outside of the United States (“U.S.”); • the ability of management to focus on North American and foreign operations; • currency fluctuations in the U.S. dollar versus the Canadian dollar, the Chinese renminbi, the Mexican peso, and the Hong Kong dollar; • the adequacy of our efforts to mitigate cyber security risks and threats; • reduced production schedules, layoffs or work stoppages by our own, our suppliers’, or customers’ personnel; • certain employee retirement benefit plans are underfunded and the actual costs could exceed current estimates; • prolonged disruption of our processing centers; • the ability to retain and attract management and key personnel; • our risk management strategies may result in losses; • the incurrence of substantial costs or liabilities to comply with, or as a result of violations of, environmental laws; • the impact of new or pending litigation against us; • the risk of product liability claims; • our indebtedness and the covenants in instruments governing such indebtedness; • the ability to comply with the terms of our asset-based credit facility; and • the influence of a single investor group over our policies and procedures.
|
|
|
|
|
|
|
|
|
|
|
|
|
|
|
|
|
|
|
|
|
|
|
|
|
|
|
|
|
|
|
|
|
|
|
|
|
|
|
|
|
|
|
|
|
|
|
|
|
|
These risks and uncertainties could cause actual results to differ materially from those suggested by the forward-looking statements. Forward-looking statements should, therefore, be considered in light of various factors, including those set forth in this Annual Report under “Risk Factors” and the caption “Industry and Operating Trends” included in “Management’s Discussion and Analysis of Financial Condition and Results of Operations” and elsewhere in this Annual Report. Moreover, we caution you not to place undue reliance on these forward-looking statements, which speak only as of the date they were made. We do not undertake any obligation to revise or publicly release any revisions to these forward-looking statements to reflect events or circumstances after the date of this Annual Report or to reflect the occurrence of unanticipated events.
3
PART I
ITEM 1. BUSINESS.
|
|
Ryerson Holding Corporation (“Ryerson Holding”), a Delaware corporation, is the parent company of Joseph T. Ryerson & Son, Inc. (“JT Ryerson”), a Delaware corporation. Affiliates of Platinum Equity, LLC (“Platinum”) own approximately 21,037,5003,924,478 shares of our common stock, which is approximately 55%11.5% of our issued and outstanding common stock.
We are a leading metals service center, value-added processor and distributor of industrial metals with operations in the United States ("U.S.") through JT Ryerson and other U.S. subsidiaries, in Canada through our indirect wholly-owned subsidiary Ryerson Canada, Inc., a Canadian corporation (“Ryerson Canada”), and in Mexico through our indirect wholly-owned subsidiary Ryerson Metals de Mexico, S. de R.L. de C.V., a Mexican corporation (“Ryerson Mexico”). In addition to our North American operations, we conduct metal processing and distribution operations in China through an indirect wholly-owned subsidiary, Ryerson China Limited, a Chinese limited liability company (“Ryerson China”). Unless the context indicates otherwise, Ryerson Holding, JT Ryerson, Ryerson Canada, Ryerson Mexico, and Ryerson China together with their subsidiaries, are collectively referred to herein as “Ryerson,” “we,” “us,” “our,” or the “Company.”
Our Company
We are one of the largest value-add processors and distributors of industrial metals in North America measured in terms of sales. We have approximately 4,0004,600 employees across 91110 facilities in North America and four facilities in China. Through this network we serve approximately 40,000 customers across a wide range of manufacturing end-markets. Our customers range from local, independently owned fabricators and machine shops to large, international original equipment manufacturers. We carry a full line of nearlyapproximately 75,000 products in stainless steel, aluminum, carbon steel, and alloy steels and a limited line of nickel and red metals in various shapes and forms. In addition to our metals products, we offer numerous value-added processing and fabrication services, and nearly 80% of the products we sell are processed to meet customer requirements.
Our business strategy includes providing a superior level of customer service and responsiveness, technical services, and inventory management solutions while maintaining low operating costs in order to maximize financial results. Our growth strategy is based on increasing our operating results through organic growth activities and strategic acquisitions.
To that end, we continue to focus on our interconnected network, systems, and to enhanceenhancing our value-added services and online presence to provide increased access, functionality, and flexibility to our customers. We are using advanced analytics to improve pricing and inventory utilization. Our service centers are strategically located near our customers, which permits us to quickly process and deliver our products and services, often the day after receiving an order. We own, lease, or contract a fleet of tractors and trailers, allowing us to efficiently meet our customers’ delivery demands. Our range of products together with our breadth of services allows us to service a diverse customer base and to create long-term partnerships with our customers and enhances our profitability.
We focus on strategic acquisitions that complement and enhance our product, customer, and geographic diversification. Ryerson’s M&A strategy includes both transformative turnaround acquisitions and value-add, bolt-on acquisitions. Recently, Ryerson has focused on bolt-on acquisitions. In 2023, Ryerson's acquisitions such as its September 1, 2021 acquisitionincluded BLP Holdings, LLC, Norlen Incorporated, TSA Processing, and Hudson Tool Steel Corporation. Please refer to the Section titled “Acquisitions” of Specialty Metals Processing, Inc. (“SMP”). SMP is a toll processorItem 7, “Management’s Discussion and Analysis of stainless steel, aluminum, titanium,Financial Conditions and nickel alloy products that expanded the Company’s value-add servicesResults of Operations,” and Note 2 — “Acquisitions” of Part II, Item 8 "Financial Statements and Supplementary Data" for further information regarding all acquisitions made in a variety of industries including aerospace. SMP was purchased for $14.0 million, net of cash acquired.2023.
Industry Overview
Metals service centers serve as key intermediaries between metal producers and end users of metal products. They purchase in scale and sell in smaller quantities. End-users often look for “one-stop” suppliers that offer lower order volumes, shorter lead times, more reliable delivery, and processing services. Metal producers mainly sell metals in the form of standard-sized coils, sheets, plates, structurals, bars, and tubes in large quantities, with longer lead times, and limited inventory. Metal service centers serve as key intermediaries closing the gap between metal producers’ supply and end-users’ demand.
By aggregating end-users’ demand and purchasing metal in bulk to take advantage of economies of scale, metals service centers may purchase, process, and deliver metal to end‑users in a more efficient and cost‑effective manner than the end‑user may achieve by dealing directly with the primary producer. Further, specialized metals processing equipment is costly and requires high‑volume production to be cost effective. In addition,effective, and many customers are not able or willing to invest in the necessary technology, equipment, and warehousing of inventory to efficiently and effectively perform metal processing for their own operations. Due to this, many customers have reduced their in-house processing capabilities, opting to source processed metal from service centers like us. This
4
saves our customers time, labor, and expense, reducing their overall manufacturing costs, while permitting us to increasingly focus on value-added
services and increasingexpanding our mix of fabrication mix.products, which typically sell at higher margins. This supports our capital expenditures on processing equipment to grow annual gross profit margin.
Our industry is highly fragmented with the largest companies accounting for only a small percentage of total market share. The majority of metals services companies have limited product lines and inventories, with customers located in a specific geographic area. In general, competition is based on quality, service, price, and geographic proximity. We primarily compete with other metals service centers and to a lesser extent with metal producers.
The metals service center industry typically experiences cash flow trends that are counter-cyclical to the revenue and volume growth of the industry. During an industry downturn, companies generally reduce working capital assets and generate cash as inventory and accounts receivable balances decline. Asdecline, and as a result, operating cash flow and liquidity tend to increase during a downturn, which typically facilitates industry participants’ ability to cover fixed costs and repay outstanding debt.downturn.
Competitive Strengths
Leading Market Position in North America.
Based on sales, we believe we are one of the largest service center companies for carbon, stainless steel, and aluminum in the North American market where we have a broad geographic presence with 91110 facilities.
Our service centers are located near our customer locations, enabling us to provide timely deliverydeliver to customers across numerous geographic markets. Additionally, our widespread network of locations in the United States,U.S., Canada, and Mexico helps us to utilize our expertise to more efficiently serve customers with complex supply chain requirements across multiple manufacturing locations. We believe this is a key differentiator for customers who need a supplier that can reliably and consistently support them. Our ability to transfer inventory among our facilities better enables us to more timely and profitably source and process specialized items at regional locations throughout our network than if we were required to maintain inventory of all products and specialized equipment at each location.
Broad Geographic Reach Across Attractive End Markets.
Our operations serve a diverse range of industries including commercial ground transportation, metal fabrication and machine shops, industrial machinery and equipment manufacturing, consumer durable equipment, HVAC manufacturing, construction equipment manufacturing, food processing and agricultural equipment manufacturing, and oil and gas. We believe this broad range of industries in which we sell our products and services reduces our risk related to a downturn in a specific industry. We believe that our ability to quickly adjust our offeringofferings based on regional and industry specific trends creates stability while also providing the opportunity to access specific growth markets. We are focused on expanding our presence within growing, secular markets, including electric vehicles and renewable energy.
Established Platform for Organic and Acquisition Growth.
Our growth strategy is based on increasing our operating results through organic growth activities and strategic acquisitions that enhance our service, product, customer, and geographic diversification. Our strategies include investing in value-added processing capabilities, analytically targeting attractive customers and end markets with our supply chain optimization service model, industry consolidation through targeted M&A, and providing customers faster and easier solutions to their metal needs, which we believe will provide us with growth opportunities.
Given the highly fragmented nature of the metals service center industry, we believe there are numerous additional opportunities to acquire businesses and incorporate them into our existing infrastructure. In addition, due to our large scale and geographic reach, we believe we can improve operating performance through efficiencies byWhen integrating acquired businesses into our operational model, thus providingwe may draw on our large scale and geographic reach to improve operational and financial performance through greater purchasing power, improvingimproved expense and working capital management, increased access to additional end markets, and broadening product mix.
Lean Operating Structure Providing Operating Leverage.
Ryerson has demonstrated the ability to effectively manage expenses through tactical productivity and spending improvements. In a stronger metals service center environment characterized by increases in demand and/or pricing, we believe that most additional expenses to service higher revenue and margins would come from variable expenses while further leveraging economies of scale on our existing fixed expenses. In 2021, although impacted by supply chain tightness, industry volumes improved compared to 2020. In response to increased volumes, our warehousing, selling, general, and administrative expenses increased by $156.9 million compared to 2020, but decreased as a percentage of sales by 350 basis points, illustrating our ability to manage cost pressures and realize expense leverage.
Throughout 2021, we continued to focus on and execute strong inventory management and had average inventory days excluding LIFO of 73 days in 2021, within our target inventory range.
Extensive Breadth of Products and Services for Diverse Customer Base.
We believe our broad product mix and marketing approach provides customers with a “one-stop shop” solution few other metals service center companies are able to offer. We provide a broad range of processing and fabrication services to meet the needs of our approximately 40,000 customers and typically fulfill more than 1,100,000approximately 1,000,000 orders per year. We provide supply chain solutions, including just-in-time delivery and value-added processing, to many original equipment manufacturing customers.
5
For the year ended December 31, 2021,2023, no single customer, including their subcontractors, accounted for more than 5%8% of our sales, and our top 10 customers, including their subcontractors accounted for less than 13%16% of our sales.
Strong Relationships with Suppliers.
We are among the largest purchasers of metals in North America and have long-term relationships with many of our North American suppliers. We believe we are frequently one of the largest customers of our suppliers and that concentrating our orders among a core group of suppliers is effective for obtaining favorable pricing and service. We believe we have the opportunity to further leverage this strength through continued focus on price and volume using an analytics-driven approach to procurement. In addition, we view our strategic suppliers as supply chain partners. We focus on logistics, lead times, rolling schedules, and scrap return programs to drive value-based buying that is advantageous for us. Metals producers worldwide are consolidating, and large, geographically diversified customers, such as Ryerson, are desirable partners for these larger suppliers. Our relationships with suppliers often provide us with access to metals when supply is constrained. Through our knowledge of the global metals marketplace and capabilities of specific mills, we believe we have developed an advantageous global purchasing strategy.
Experienced Management Team with Deep Industry Knowledge.
Our senior management team has extensive industry and operational experience and has been instrumental in optimizing and implementing our strategy. Our senior management has an average of more than 30 years of experience in the metals or service center industries. Our Chief Executive Officer (“CEO”) and President, Mr. Edward Lehner, who joined the Company in August 2012 as Chief Financial Officer (“CFO”) and became CEO in June 2015, has 3032 years of experience, predominantly in the metals industry. Mr. Mike Burbach, our Chief Operating Officer, has over 3840 years of experience with the Company and previously served as the President of the North-West Region of the Company. Mr. Jim Claussen, Executive Vice President & CFO, has 2729 years of industry experience.
Industry Outlook
The Institute for Supply Management’s Purchasing Managers’ Index (“PMI”) reported growthcontracting factory activity throughout 20212023 with readings above 50%, indicating expansionconsistently below the growth threshold of 50. The contractionary trend indicated by PMI began with readings dropping below 50 starting in factory activity. This growth trend continued intoNovember 2022 and continuing through December of 2023, marking 14 consecutive months, with athe most recent reading of 57.647.4 for January. While PMI reported contraction in March, April, and May of 2020 due to the onset of the COVID-19 pandemic in the U.S., PMI has overall reported general economic expansion for the last three years as readings have exceeded 50% for 28 of the last 36 months.December 2023. The PMI measures the economic health of the manufacturing sector and is a composite index based on five indicators: new orders, inventory levels, production, supplier deliveries, and the employment environment. PMI readings can be a good indicator of industrial activity and general economic growth.
Additionally, theThe Department of Commerce announced that real GDP increased 5.72.5 percent in 20212023 and the Federal Reserve Bank of Philadelphia projected that the median growth rate in real GDP would be 4.0%, 2.2%,1.7 percent, 1.8 percent, and 2.0%2.1 percent for 2022, 2023,2024, 2025, and 2024,2026, respectively.
Steel demand in North America is largely dependent on growth of the automotive, industrial equipment, consumer appliance, and construction end markets. Our end markets are supported byreflect the strengthperformance of the manufacturing economy, and according to the latest Livingston Survey, published by the Federal Reserve Bank of Philadelphia, U.S. industrial production is expected to have expanded by 5.5%0.3 percent in 20212023 and is further expected to grow by 4.2%0.5 percent in 20222024 and 2.8%1.4 percent in 2023.2025.
Products and Services
We carry a full line of carbon steel, stainless steel, alloy steels, and aluminum, and a limited line of nickel and red metals. These materials are stocked in a number of shapes, including coils, sheets, rounds, hexagons, square and flat bars, plates, structurals, and tubing.
We also provide a wide variety of processing services to meet our customers’ needs. Most of the products that we carry require expensive specialized equipment for material handling and processing. We believe few of our customers have the capability to process the metal into the desired sizes, forms, or finishes or they are unwilling to incur the significant capital expenditures to acquire the necessary equipment. We are growing and diversifying our product mix mainly as a result of our targeted growth strategy to provide increased levels of value-added processing services. We believe our enhanced processing capabilities will increase our ability to sell higher-margin metals processing services to a larger group of customers. We expect this, together and with our focus on maintaining pricing discipline related to our processing services, will increase our gross profit margin.
We had capital expenditures of $194.6$358.1 million in the five-year period ended December 31, 2021.2023. We are increasing our investments in processing equipment due to offer more value-added processing to our customers requesting higher levels of value-added processing. We expect thisin an effort to increase our margins and profitability. We currently perform processing services on nearly 80% of the materials sold by us.
6
The following pie charts show our percentage of sales by major product lines for 20212023 and 2020:

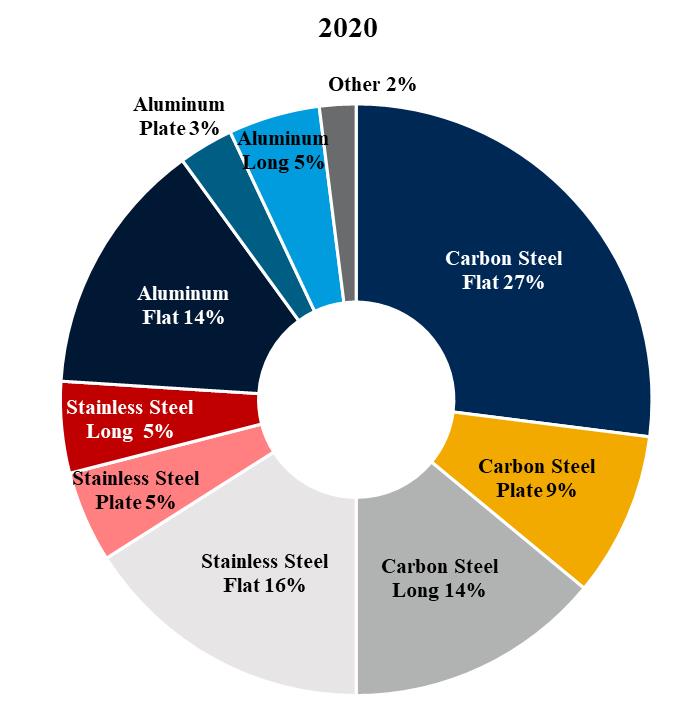


We are not dependent on any particular customer group or industry because we process and distribute a variety of metals. This diversity of product type and material reduces our exposure to fluctuations or other weaknesses in the financial or economic stability of particular customers or industries. We are also less dependent on any particular suppliers as a result of our product diversification. See pie charts showing our sales by metal consuming industry within “Customers and Markets” discussion below.
Customers and Markets
Our customer base is diverse, numbering approximately 40,000 in a variety of industries, including metal fabrication and machine shops, industrial machinery and equipment, commercial ground transportation, consumer durable, food processing and agricultural equipment, construction equipment, HVAC, and HVAC.oil & gas. Although we sell directly to many large original equipment manufacturers, the majority of our sales are to smaller customers, including small machine shops and fabricators, in small quantities with frequent deliveries, helping them manage their working capital and credit needs more efficiently.
For the year ended December 31, 2021,2023, no single customer, including their subcontractors, accounted for more than 5%8% of our sales, and ourtop 10 customers, including their subcontractors, accounted for approximately 13%less than 16% of our sales. Substantially all of our sales are attributable to our U.S. operations and substantially all of our long-lived assets are located in the United States.U.S.
7
The following pie charts show the Company’s percentage of sales by metal consuming industry for 20212023 and 2020:2022:
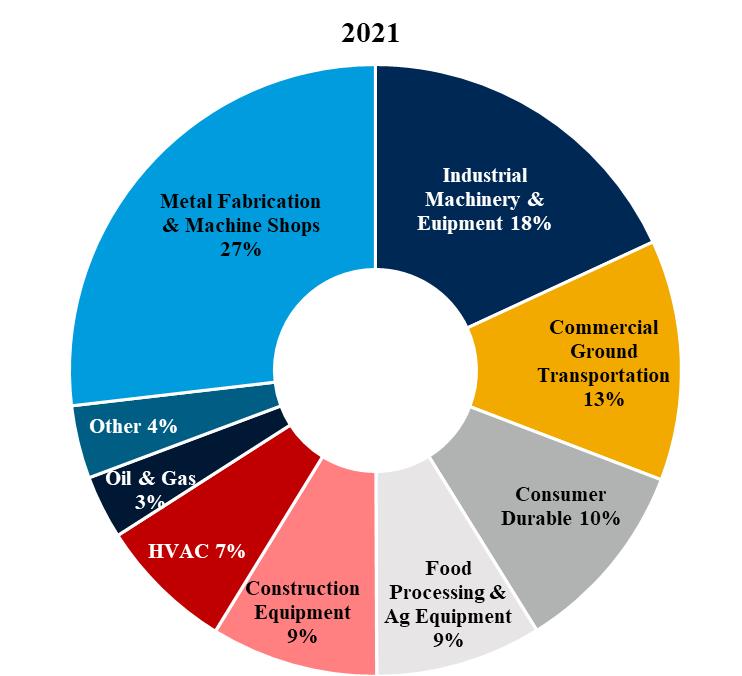
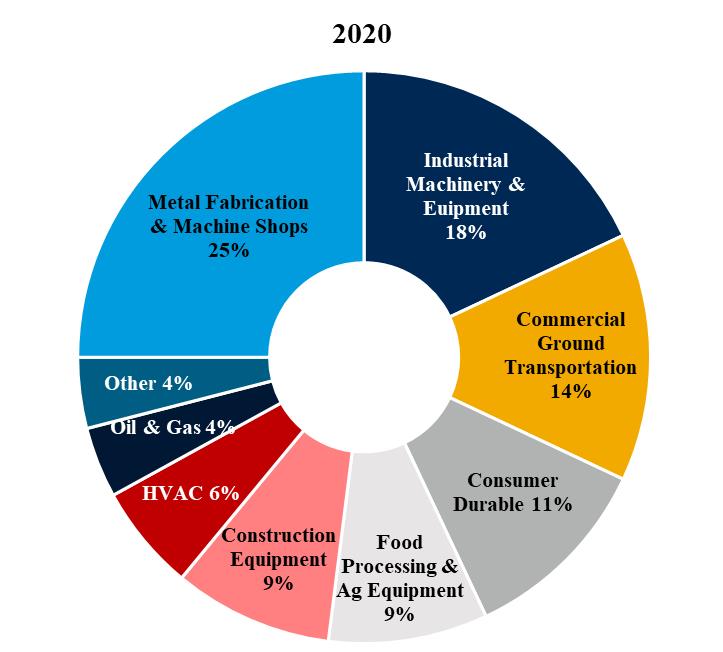


Our customers are primarily located throughout the United States,U.S., but we also have international customers. Most customers areOur decentralized operating structure and facilities located near oneor close to most of our facilities, thus enablingcustomers enable an efficient delivery system capable of handling a high frequency of short lead time orders. We transport our products directly to customers via our in-house and dedicated truck fleet, which further supports the just-in-time delivery requirements of our customers, and via third-party trucking firms.
We process our metals to specific customer orders as well as for stocking programs. Many of our larger customers commit to purchase on a regular basis at agreed upon or indexed prices for periods ranging from three to twelve months. To help mitigate price volatility risks, these price commitments are generally matched with corresponding supply arrangements, or to a lesser degree by commodity hedges. Customers notify us of specific release dates for processed products. Customers typically notify us of release dates anywhere from on a just-in-time basis to one month before the release date. Consequently, we are required to carry sufficient inventory to meet the short lead time and just-in-time delivery requirements of our customers.
We also have international facilities located in Canada, Mexico, and China. Net sales of our international locations (based on where the shipments originated) accounted for 9.7%9.1% of our consolidated 20212023 net sales, or $551.6$466.4 million. See Note 1413 — “Segment information” of Part II, Item 8 “Financial Statements and Supplementary Data” for further information on U.S. and foreign revenues and assets.
Customer demand may change from time to time based on, among other things, general economic conditions and industry capacity. Many of the industries in which our customers compete are cyclical in nature. We believe that our various and diverse offerings, ways-to-markets,ways-to-market, and end markets reduce the volatility of our business in the aggregate, thus somewhat reducing earnings volatility. A portion of our customers experience seasonal slowdowns. Our sales, as measured in tonnage sold, in the months of July, November, and December traditionally have been lower than in other months because of a reduced number of shipping days and holiday or vacation closures for some customers. Consequently, our sales in the first two quarters of the year are usually higher than in the third and fourth quarters.
Suppliers
We purchase the majority of our inventories from key domestic metals suppliers. Because of our total volume of purchases and our long‑term relationships with our suppliers, we believe that we are generally able to purchase inventory at the best prices offered by our suppliers.
For the year ended December 31, 2021,2023, our top 25 suppliers, including their subcontractors, accounted for approximately 77%78% of our purchase dollars. We are generally able to meet our materials requirements because we use many suppliers, there is a substantial overlap of product offerings from these suppliers, and there are several other suppliers able to provide identical or similar
8
products. While the metals producing supply base has experienced significant consolidation and supply interruptions duringin the past,
year, we believe both our size and our long-term relationships with our suppliers has enabled us to meet our material requirements and will continue to allow us to do so in the future.
Sales and Marketing
We maintain our own professional sales force. In addition to our office sales staff, we market and sell our products through the use of our field sales force that we believe has extensive product and customer knowledge and offers a comprehensive catalog of our products. Our office and field sales staff, which together consist of approximately 800850 employees, include technical personnel. Additionally, we offer our customers the ability to purchase our products through our e-commerce website.
Because much of our business is relationship-based, we operate under many different trade names. Businesses we acquire often have strong customer relationships and solid reputations, and we will often continue to use the acquired business name to maintain existing customer relationships.
Capital Expenditures
In 2021,2023, we continued to focus on organic growth by expanding and modernizing existing facilities, adding new state-of -the-art facilities, and adding processing equipment.equipment to support value-added business. Investments by us in property, plant, and equipment, together with asset retirements for the five years ended December 31, 2021,2023, excluding the initial purchase price of acquisitions are set forth below. The net capital change during such period aggregated to an increase of $38.0$223.2 million.
|
| Additions |
|
| Retirements |
|
| Net |
| |||
|
| (In millions) |
| |||||||||
2023 |
| $ | 121.9 |
|
| $ | 0.4 |
|
| $ | 121.5 |
|
2022 |
|
| 105.1 |
|
|
| 8.3 |
|
|
| 96.8 |
|
2021 |
|
| 59.3 |
|
|
| 68.5 |
|
|
| (9.2 | ) |
2020 |
|
| 26.0 |
|
|
| 0.2 |
|
|
| 25.8 |
|
2019 |
|
| 45.8 |
|
|
| 57.5 |
|
|
| (11.7 | ) |
|
| Additions |
|
| Retirements or Sales |
|
| Net |
| |||
|
| (In millions) |
| |||||||||
2021 |
| $ | 59.3 |
|
| $ | 68.5 |
|
|
| (9.2 | ) |
2020 |
|
| 26.0 |
|
|
| 0.2 |
|
|
| 25.8 |
|
2019 |
|
| 45.8 |
|
|
| 57.5 |
|
|
| (11.7 | ) |
2018 |
|
| 38.4 |
|
|
| 5.5 |
|
|
| 32.9 |
|
2017 |
|
| 25.1 |
|
|
| 24.9 |
|
|
| 0.2 |
|
The net reductions in 2019 and 2021 are related to sale lease-back transactions. See Part II, Item 8, Note 5: Property, Plant, and Equipment for additional information on the 2021 sale-leaseback transactions. The lower amount of additions in 2020 was caused by maintenance capital expenditures deferred to 2021 and 2022 as spending was reduced due to uncertainties surrounding the COVID-19 pandemic. We currently anticipate capital expenditures, excluding acquisitions, of up to approximately $100$110 million for 2022,2024, much of which is related to organic activities comprised of maintenance and purchases geared towards highly accretive strategic initiatives, IT infrastructure investment, and growth, along with maintenance projects. We expect nearly halfall of the 20222024 capital expenditures to be funded using proceeds from the 2021 sale-leasebacks of two properties with the remainder funded from cash generated by operations and available borrowings.operations. We will continue to evaluate and execute each growth project in light of the economic conditions and outlook at the time of investment and may significantly reduce our capital expenditures if economic conditions warrant a more conservative approach to capital allocation. For the long term, we expect capital expenditures to normalize to a rate that approximates depreciation.
Environmental, Health, and Safety Matters
Our facilities and operations are subject to many foreign, federal, state, local, and localforeign laws and regulations relating to the protection of the environment and to health and safety. In particular, our operations are subject to extensive requirements relating to waste disposal, recycling, air and water emissions, the handling of regulated materials, remediation, underground storage tanks, asbestos-containing building materials, workplace exposure, and other matters. We believe that our operations are currently in substantial compliance with all such laws and do not presently anticipate substantial expenditures in the foreseeable future in order to meet environmental, workplace health or safety requirements, or to pay for any investigations, corrective action, or claims. However, claims, enforcement actions, or investigations regarding personal injury, property damage, or violation of environmental laws could result in substantial costs to us, divert our management’s attention, and result in significant liabilities, fines, or the suspension or interruption of our facilities.
We continue to analyze and implement safeguards to mitigate any environmental, health, and safety risks we may face. As a result, additional costs and liabilities may be incurred to comply with future requirements, including California and the proposed SEC climate disclosure requirements, or to address newly discovered conditions, and these costs and liabilities could have a material adverse effect on the results of operations, financial condition, or cash flows. For example, there is increasing likelihood that additional regulation of greenhouse gas emissions will occur at the foreign, federal, state, and local level, which could affect us, our suppliers, and our customers. While the costs of compliance could be significant, given the uncertain outcome and timing of future action by the U.S. federal government and states on this issue, we cannot accurately predict the
full financial impact of current and future greenhouse gas regulations on our operations or our customers at this time. We do not currently anticipate any new programs disproportionately impacting us compared to our competitors.
9
Some of the properties currently or previously owned or leased by us are located in industrial areas or have a long history of heavy industrial use. We may incur environmental liabilities with respect to these properties in the future including costs of investigations, corrective action, claims for natural resource damages, claims by third parties relating to property damages, or claims relating to contamination at sites where we have sent waste for treatment or disposal. Based on currently available information we do not expect any investigation, remediation matters, or claims related to properties presently or formerly owned, operated, or to which we have sent waste for treatment or disposal would have a material adverse effect on our financial condition, results of operations, or cash flows.
In October 2011, the United States Environmental Protection Agency (the “EPA”) named JT Ryerson as one of more than 100 businesses that may be a potentially responsible party (“PRP”) for the Portland Harbor Superfund Site (the “PHS Site”). On January 6, 2017, the EPA issued an initial Record of Decision (“ROD”) regarding the site. The ROD includes a combination of dredging, capping,Site. See Note 12: Commitments and enhanced natural recovery that would take approximately thirteen years to construct plus additional time for monitored natural recovery, at an estimated present value cost of $1.05 billion. At a December 4, 2018 meeting with the Portland Harbor Participation and Common Interest Group (“PCI Group”), of which JT Ryerson is a member, the EPA indicated that it expected PRPs to submit a plan during 2019 to start remediation of the river and harbor per the ROD within the next two to three years. The EPA also indicated that it expected allocation of amounts among the parties to be determinedContingencies in the same two to three-year time frame.
The EPA met with various PRPs throughout 2019 and 2020 regarding remedial design. The EPA did not include JT Ryerson in those meetings. It did include Schnitzer Steel, which is developing a remedial design plan for the river area which includes the area where the former JT Ryerson facilities were located. Schnitzer Steel’s 2020 disclosures filed with the EPA acknowledged that Schnitzer Steel is the legal successornotes to the prior operators (including JT Ryerson)consolidated financial statements included in the designated area. On February 12, 2021, the EPA announced that one hundred percent (100%)Part II, Item 8 of the PHS Site is now in the active remedial design phase.
In June 2021, the EPA issued a Fact Sheet setting forth the status of the entire site. The primary area of relevance for JT Ryerson is River Mile 3.5 East, with Swan Island Basin being of secondary interest. For River Mile 3.5, remedial design work is ongoing; the Sufficiency Assessment and the Pre-Design Investigation work plans are finalized, and design investigation sampling is underway. Schnitzer Steel and MMGL Corp. are the working parties for River Mile 3.5. For Swan Island, remedial design is just beginning, with Daimler Trucks, Shipyard Commerce, and various government entities as the working parties. JT Ryerson has not been asked to participate in the remedial design phase.
The PCI Group has engaged a third party to prepare cost estimates for each of the Sediment Management Areas at the site. That work is still in progress and is expected to be completed in early 2022. Once the cost estimates are completed, the voting parties of the PCI Group (which does not include JT Ryerson) will likely begin the “advocacy process,” during which the voting parties submit written arguments to the Allocation Team regarding how costs should be allocated among the various PRPs. This process is anticipated to be completed sometime in 2022. Once the advocacy process is completed, the Allocation Team will prepare a proposed allocation of costs among the PRPs. All PRPs, including JT Ryerson, will then participate in the “mediation process,” during which the PRPs will attempt to agreethis Report on a final cost allocation. The mediation process is currently anticipated to occur sometime in 2022 or 2023.
The EPA has stated that it is willing to consider de minimis settlements, which JT Ryerson is trying to pursue; however, the EPA has not begun meeting with any of the smaller parties who have requested de minimis or de micromis status, stating that it does not have sufficient information to determine whether any parties meet such criteria and does not intend to begin those considerations until after the remedial design work is completed. It has met with selected parties that we believe to be larger targets. JT Ryerson has not been invited to meet with the EPA. As a result of the ongoing negotiations and filings over the ROD and the EPA’s decision not to meet with smaller parties, we cannot determine how allocations will be made and whether a de minimus settlement can be reached with the EPA.
Form 10-K. As the EPA has not yet allocated responsibility for the contamination among the potentially responsible parties, including JT Ryerson, we do not currently have sufficient information available to us to determine whether the RODRecord of Decision will be executed as currently stated, whether and to what extent JT Ryerson may be held responsible for any of the identified contamination, and how much (if any) of the final plan’s costs might ultimately be allocated to JT Ryerson. Therefore, management cannot predict the ultimate outcome of this matter or estimate a range of potential loss at this time.
There are various other claims and pending actions against the Company. The amount of liability, if any, for those claims and actions as of December 31, 20212023 is not determinable but, in the opinion of management, such liability, if any, will not have a material
adverse effect on the Company’s financial position, results of operations, or cash flows. We maintain liability insurance coverage to assist in protecting our assets from losses arising from or related to activities associated with business operations.
Our United StatesU.S. operations are also subject to the Department of Transportation Federal Motor Carrier Safety Regulations. We operate a private trucking motor fleet for making deliveries to some of our customers. Our drivers do not carry any material quantities of hazardous materials. Our foreign operations are subject to similar regulations. Future regulations could increase maintenance, replacement, and fuel costs for our fleet. These costs could have a material adverse effect on our results of operations, financial condition, or cash flows.
Intellectual Property
We own several U.S. and foreign trademarks, service marks, and copyrights. Certain of the trademarks are registered with the U.S. Patent and Trademark Office and, in certain circumstances, with the trademark offices of various foreign countries. We consider certain other information owned by us to be trade secrets. We protect our trade secrets by, among other things, entering into confidentiality agreements with our employees regarding such matters and implementing measures to restrict access to sensitive data and computer software source code on a need-to-know basis. We believe that these safeguards adequately protect our proprietary rights and we vigorously defend these rights. While we consider all our intellectual property rights as a whole to be important, we do not consider any single right to be essential to our operations as a whole.
Environmental, SocialSustainability
In December 2023, Ryerson released its second Sustainability Report. The report builds on the Company’s inaugural 2022 report and Governance
Ryerson is committed to operating with a high level of integrity. We are driven by our dedication to support our employees andprovides an update on ongoing sustainability efforts, the communities we serve, deliver products that meet our stringent quality and compliance standards, and maintain high environmental, health, and safety standards to protect ourinvestments being made in its people and service center network, and how it is serving its communities. Similar to the places where we operate. Weinaugural report, the 2023 edition illustrates the Company’s focus on energy and emissions reductions, sustainable products, data security, diversity, equity, and inclusion ("DEI"), and talent and future workforce while also providing updates on Ryerson’s advancement in these categories. A few achievements include Ryerson’s recognition by Forbes as one of America’s best mid-sized companies to work to continually improve eachfor, its launch of these areas to makethe award-winning Ryerson an even better company for tomorrow.
Below are some highlights of our corporate responsibility programs.Illuminator app, and its continued role in the circular metals economy.
Additionally, the Sustainability
As part of our efforts to operate with a high level of integrity, Report includes important content on governance practices, including how we continuously monitor and analyze ourselves and our supply-chain relationships.relationships in order to operate with a high level of integrity and how we protect Company and stakeholder information through strong cybersecurity practices. We strive, and expect our suppliers, to comply with all applicable laws and regulations andas well as Ryerson's Human Rights Policy, Conflict Minerals Policy,and Code of Ethics and Business Conduct.
We are committed to mitigating the impact our operations and products have on the environment. As an operator of metals service centers, our day-to-day business consists of the sale, distribution, and processing of a broad variety of metal products sourced from numerous primary metal producers. Our operations, by their nature, do not emit significant amounts of carbon dioxide or other greenhouse gases. Further, according to the Steel Recycling Institute, we believe steel, one of our most significant products,is the most recycled material on the planet—more than plastic, paper, and glass combined each year—which provides a strong foundation for our sustainability efforts. The Steel Recycling Institute notes that two out of every three tons of new steel are produced from old steel. As part of our commitment to environmental sustainability, we:
|
|
|
|
|
|
|
|
|
|
We alsouse propane fuel to operate forklifts, have installed energy efficient lighting in many of our facilities, and utilize energy efficient diesel tractors that consume less fuel and reduce emissions for the majority of our trucking fleet to further mitigate our impact on the environment.
Community & Social Vitality
Being a responsible neighbor and helping build better communities in the areas we operate is a central part of our company culture. We understand that supporting our communities through giving back is an important and increasing interest of our current and future employees.Human Capital
Employees are provided the opportunity to volunteer their time in the communities they call home through the Ryerson Gives Back program. Established in 2017, Ryerson Gives Back encourages teams across the Company to volunteer in their community, allotting four paid volunteer hours annually to each employee. From food banks to local construction projects, we have watched employees step up to support underserved groups and areas on behalf of Ryerson.
In addition to giving back, we encourage employees to exercise their civic responsibilities. Employees were granted an additional four hours of paid time off to vote in the 2020 presidential election. We also support various charitable organizations, including those that promote social justice and equality, good health, children's causes, educational advancement, and community programs.
Human Capital
In order to provide best in class customer experiences, it is crucial that we continue to work to attract and retain top talent. To facilitate talent attraction and retention, we strive to create a diverse, inclusive, and safe workplace, with opportunities for our
10
employees to grow and develop in their careers, supported by strong compensation, benefits, and wellness programs, and by programs that build connections between our employees and their communities.
Employees.Talent and Future Workforce. AsOur recruitment and talent management teams lead our mission to attract, retain and develop diverse talent. These teams are organized under our Talent Management Office ("TMO"), which includes our Chief Human Resources Officer, our Director of December 31, 2021, we employed approximately 3,700 persons in North AmericaTalent Management, and 300 persons in China. Our North American workforce was comprised of approximately 1,600 office employeesother senior leaders. The TMO is responsible for our recruiting efforts, attracting the best talent, increasing diversity and approximately 2,100 plant employees. Seventeen percent of our plant employees were members of various unions, including the United Steel Workershiring efficiencies, facilitating onboarding, and The International Brotherhood of Teamsters.
Five renewal contracts covering 100 employees were successfully negotiated in 2021. Four contracts covering 104 employees are currently scheduled to expire in 2022.
Employee Development & Engagement. Ryerson believes in promoting from within and provides the resources for long-term career development. Our summer internship program and Ryerson Academy provide meaningful training to entry-level employees. Ryerson Academy is a unique, 12-week immersive training program that runs three sessions per year for entry-level inside sales associates. The program provides intensive training and experience in sales and customer service with up to 15 participants in each session. Ryerson Academy also teaches critical communication, negotiation, and presentation skills, and participants regularly interact with Ryerson’s senior leadership and subject matter experts.
For decades, we have supported the continuing education of our employees’ families through a college scholarship program. In 2021,opportunities to engage employees as they join Ryerson and build their careers with us.
As part of this program, we awarded almost $32,000 in academic scholarships to students graduating from high school that are children or dependents ofretaining and developing talent, Ryerson employees. We also support the continuing education of ouroffers employees competitive compensation, expanded benefits including a parental leave policy, career growth through its learning platform, mentorship and tuition reimbursement programs.
We have a robust training platform, Ryerson EDvantage, available to all employees which offers Ryerson product training along with general skills courses that are customized for our employees’ development. We focus on succession planning and ensure that proper cross-training and knowledge transfer is in place.
Our commitment to listening to and working with our employees led to the launch of our company-wide engagement survey in 2018. Using Quantum Workplace, a leading engagement survey software, our employees anonymously provided their perspectives on a variety of topics. Ryerson achieved overall favorability of 67% with a participation rate of nearly 80%, which exceeded industry benchmarks. We distributed the results to our department heads and managers to hold team meetings to discuss the outcomes and gain additional insights. We identified key improvement opportunities and established advisory teams to address them. In early 2020, we conducted a follow-up “pulse” survey with a subset of the organization and, encouragingly, found that favorability scores increased in locations where leaders had worked to affect change. From this collective effort came company-wide initiatives including new health and wellness programs, and improved sick, vacation, and parental leave policies for U.S. employees.engagement through all-employee surveys conducted periodically.
Diversity and Inclusion.Ryerson is dedicated to building a diverse workplaceembracing diversity and inclusion via our Diversity, Equity, and Inclusion council ("DEI Council") that focuses on employee engagement, DEI training, and community outreach efforts with the mission of associates from a variety of cultures, educational backgrounds, and life experiences. A well-rounded community of talent helps cultivate new ideas and perspectives that help the Company expand its thinking and refine its practices and processes to continue growing in a smart way. Ryerson is aggressively working to engage diverse and under-represented individuals through its recruiting efforts in diverse and underserved communities. We have a Diversity & Inclusion Council whose mission is to fosterfostering an environment across the organization that values
diversity of experiences and perspectives and encourages inclusivity in all aspects of the business. Only
In 2023, Ryerson’s DEI Council announced the establishment of three employee resource groups ("ERGs") to be available to employees in 2024: Women in Search of Excellence (WISE), Next Generation of Leaders (NextGen), and Leveraging All Diversity (LEAD). These ERGs are voluntary, employee-led groups that work to foster a more inclusive workplace by respecting eachuniting people with common interests, identities, or backgrounds. Each of the three ERGs established is purposefully aligned with Ryerson’s DEI mission and strategic goals.
Further, Ryerson is invested in DEI training by providing employees with training on being inclusive, avoiding bias, and workplace intervention. Training is available at any time on the Company’s learning platform, where employees can select from a growing catalog of DEI courses.
Employee Health, Wellness, and Safety. Health, safety, and wellness are fundamental expectations of our unique perspectives, experiences,Board, executives, employees, and needs can we unlock the full potential of our workforce and attract the best talent. The council seeks to achieve this through:
|
|
|
|
|
|
|
|
We promote the advancement of women in our organization through our Women’s Sponsorship Program which provides sponsorship of women in various levels and positions throughout the organization. Ryerson’s employees also participate in Association of Women in the Metals Industry membership and events. Additionally, effective January 1, 2022, we adopted a new parental leave policy which provides all U.S. non-union, full-time employees with four weeks of fully paid parental leave plus eight weeks of fully paid maternity leave.
From a governance perspective, Ryerson has adopted a Code of Ethics & Business Conduct, a Board Corporate Governance Guidelines and Nominating Corporate Governance Committee Charter, an Equal Employment Opportunity Policy, and Anti-harassment Policy to support our diversity, equity, and inclusion values. Our Board of Directors and Compensation Committee provide oversight of our policies, programs, and initiatives focusing on workforce diversity and inclusion.
Employee Safety. Upholding a safe workplace is one of our core values and a part of the company's culture.customers. Our safety standards, which go beyond industry standards and the minimum legal requirements, required by applicable law, have helped protect the well-being of our people and prevent workplace injuries that can impact business productivity. We continuously work to maintaininjuries. Our commitment towards a safety performance rating that consistently outperforms the industry averagezero-injury workplace is constant and have implementeddriven by an Environmental, Health, and Safety policy that reinforces the goal of a zero-injury workplace.goal. Our low recordable injury rate compared to our peers in the metal services industry, based on U.S. Occupational Safety and Health Administration (“OSHA”) criteria, reflects our effectiveness in protecting our employees. Our 20212023 performance at our facilities, measured as the number of OSHA recordable injuries per 200,000 labor hours, was 2.08,2.26, which was better than the industry average as reported by the Bureau of Labor Statistics.
Health and Wellness. The success of our business is fundamentally connected to the well-being of our people. Accordingly, we are committed to the health and wellness of our employees. We provide our employees and their families with access to a variety of innovative, flexible, and convenient health and wellness programs, including benefits that provide protection and security so they can have peace of mind concerning events that may require time away from work or that impact their financial well-being; that support their physical and mental health by providing tools and resources to help them improve or maintain their health status, and encourage engagement in healthy behaviors; and that offer choice where possible so they can customize their benefits to meet their needs and the needs of their families.In response to the COVID-19 pandemic, we implemented significant changes that we determined were in the best interests of our employees and the communities in which we operate, and which comply with government regulations, such as having office employees work from home and implementing additional safety measures for employees continuing critical on-site work.
Compensation and Benefits. We provide robust compensation and benefits programs to help meet the financial needs of our employees. In addition to salaries, we provide annual and quarterly sales incentive plans, healthcare and insurance benefits, health savings and flexible spending accounts, retirement savings contribution matching, paid time off, parental and maternity leave, employee assistance programs, and tuition assistance. Additionally, we have targeted equity-based grant programs with vesting conditions to facilitate retention of personnel, particularly those with critical skills and experience.
Employee Headcount and Unions. See Item 1A, Risks Related to Operating our Business, sub-section "Any significant work stoppages can harm our business", as well as Note 12: Commitments and Contingencies within Part II, Item 8 "Financial Statements and Supplementary Data" for further information.
Available Information
All periodic and current reports and other filings that we are required to file with the Securities and Exchange Commission (“SEC”), including our annual report on Form 10-K, quarterly reports on Form 10-Q, current reports on Form 8-K, and amendments to those reports filed or furnished pursuant Section 15(d) of the Securities Exchange Act of 1934, as amended, are available free of charge from the SEC’s website (www.sec.gov) or through our Investor Relations website at http://ir.ryerson.com. Such documents are available as soon as reasonably practicable after electronic filing of the material with the SEC. Copies of these reports (excluding
11
exhibits) may also be obtained free of charge, upon written request to: Investor Relations, Ryerson Holding Corporation, 227 W. Monroe St., 27th Floor, Chicago, Illinois 60606.
The Company also posts its Code of Ethics on its website. See Part III, Item 10 for more information regarding our Code of Ethics.
Our website address is included in this report for informational purposes only. Our website and the information contained therein or connected thereto are not incorporated into this annual report on Form 10-K.
ITEM 1A. RISK FACTORS.
|
|
Our business faces many risks. You should carefully consider the risks and uncertainties described below, together with the other information in this report, including the consolidated financial statements and notes to consolidated financial statements. We cannot assure you that any of the events discussed in the risk factors below will not occur. These risks could have a material and adverse impact on our business, results of operations, financial condition, and cash flows.
RISKS RELATED TO OUR INDUSTRY
Weakness in the economy, market trends, and other conditions affecting the profitability and financial stability of our customers could negatively impact our sales growth and results of operations.
Economic and industry trends affect our business environments. We serve several metals-consuming industries in which the demand for our products and services is sensitive to the production activity, capital spending, and demand for products and services of our customers. Many of these customers operate in markets that are subject to highly cyclical fluctuations resulting from seasonality, market uncertainty, costs of goods sold, currency exchange rates, foreign competition, offshoring of production, oil and natural gas prices, geopolitical developments, and a variety of other factors beyond our control. Any of these factors could cause customers to idle or close facilities, delay purchases, reduce production levels, or experience reductions in the demand for their own products or services.
Any of these events could impair the ability of our customers to make full and timely payments or reduce the volume of products and services these customers purchase from us and could cause increased pressure on our selling prices and terms of sale.
We do not expect the cyclical nature of our industry to change and any downturn in our customers’ industries could reduce our revenues and profitability or a significant or prolonged slowdown in activity in the U.S., Canada, or any other major world economy, or a segment of any such economy, could negatively impact our sales growth and results of operations.
The metals services business is very competitive and increased competition could reduce our revenues and gross margins.
We face competition in all markets we serve, from metals producers that sell directly to certain customers or segments of the market, to other metal services companies. The metals services industry itself is highly fragmented and competitive. There are a few large competitors, but most of the market is served by small local and regional competitors. Competition is based principally on price, service, quality, production capabilities, inventory availability, and timely delivery.
We are experiencing increased pressure from online businesses that compete with price transparency. We expect technological advancements and the increased use of e-commerce solutions within the industry to continue to evolve at a rapid pace. As a result, our ability to effectively compete requires us to respond and adapt to new industry trends and developments, and implement new technology and innovations that may result in unexpected costs or may take longer than expected.
To remain competitive, we must be willing and able to respond to market pressures.pressures timely. These pressures, and the implementation, timing, and results of our strategic pricing and other responses, could have a material effect on our sales and profitability. If we are unable to grow sales or reduce costs, among other actions, to wholly or partially offset the effect on profitability of our pricing actions, our results of operations and financial condition may be adversely affected.
Changing metals prices may have a significant impact on our liquidity, net sales, gross margins, operating income, and net income.
The metals services industry as a whole is cyclical and, at times, pricing and availability of metal can be volatile due to numerous factors beyond our control, including, but not limited to, general domestic and international economic conditions, labor costs, sales levels, competition, levels of inventory held by other metals service centers, consolidation of metals producers, higher raw material costs for the producers of metals, import duties and tariffs, and currency exchange rates. This volatility can significantly
12
affect the availability and cost of materials for us. Our ability to pass on increases in costs in a timely manner depends on market conditions and may result in lower gross margins. In addition, higher prices could impact demand for theseour products, resulting in lower sales volumes. Moreover, we maintain substantial inventories of metal to accommodate the short lead times and just-in-time delivery requirements of our customers. Accordingly, we purchase metals in an effort to maintain inventory at levels that we believe to be appropriate to satisfy
the anticipated needs of our customers based upon historic buying practices, contracts with customers, and market conditions. Commitments for metal purchases are generally at prevailing market prices in effect at the time orders are placed or at the time of shipment. During periods of rising metal prices, we may be negatively impacted by delays between the time of increases in the cost of metals to us and increases in the prices that we charge for our products if we are unable to pass these increased costs on to our customers. In addition, when metal prices decline, this could result in lower selling prices for our products and, as we use existing inventory that we purchased at higher metal prices, lower gross profit margins. Declines in prices or further reductions in sales volumes could adversely impact our ability to maintain our liquidity and to remain in compliance with certain financial covenants under our $1.0$1.3 billion revolving credit facility (“the Ryerson Credit Facility”), as well as result in us incurring inventory or goodwill impairment charges. Consequently, changing metals prices could significantly impact our liquidity, net sales, gross margins, operating income, and net income.
Unexpected product shortages could negatively impact customer relationships, resulting in an adverse impact on results of operations.
Disruptions could occur due to factors beyond our control, including economic downturns, political unrest, port slowdowns, trade issues, including increased export or import duties or trade restrictions, health crises, climate related disruptions, and other factors, anyfactors. Recent unrest in the Red Sea has increased both shipping times and costs presenting new challenges to the metals industry. Any of whichthe aforementioned items could adversely affect a supplier’s ability to manufacture or deliver products to us. Public health problems may result in quarantines, business closures, transportation restrictions, import and export complications, and otherwise cause shortages in the supply of materials, higher costs for available supplies, or cause other disruptions within our operations and supply chain. Public health problems may cause increased costs of certain supplies and disruptions and delays within our supply chain, and may expose us to unanticipated liability or require us to change our business practices.
Any disruption resulting from these events could cause significant delays in shipments of products or difficulties in obtaining products, any of which may expose us to unanticipated liability or require us to change our business practices in a manner materially adverse to our business, results of operations, and financial condition. For our sources of lower cost products from Asia and other areas of the world, the effect of disruptions is typically increased due to the additional lead time required and distances involved. Further, the risk of disruption is increased due to the current political climate seeking trade reform. In addition, we have strategic relationships with a number of vendors. In the event we are unable to maintain those relations, there might be a loss of competitive pricing advantages which could, in turn, adversely affect results of operations.
Changes in customer or product mix could cause our gross margin percentage to decline.
From time to time, we experience changes in customer and product mix that affect gross margin. Changes in customer and product mix result primarily from business acquisitions, changes in customer demand, customer acquisitions, selling and marketing activities, and competition. If rapid growth with lower margin customers occurs, we will face pressure to maintain current gross margins, as these customers receive more discounted pricing due to their higher sales volume. There can be no assurance that we will be able to maintain historical gross margins in the future.
We may not be able to retain or expand our customer base if the North American manufacturing industry erodes through acquisition and merger or consolidation activity in our customers’ industries.
Our customer base primarily includes manufacturing and industrial firms. Some of our customers operate in industries that are undergoing consolidation through acquisition and merger activity and some customers have closed as they were unable to compete successfully with overseas competitors. Our facilities are predominately located in the United StatesU.S. and Canada. To the extent that our customers cease U.S. operations or relocate to regions in which we do not have a presence, we could lose their business. Acquirers of manufacturing and industrial firms may have suppliers of choice that do not include us, which could impact our customer base and market share.
Global metal overcapacity and imports of metal products into the United States have adversely affected, and may again adversely affect, United States metal prices, which could impact our sales and results of operations.
At times, global metal production capacity may exceed global consumption of metal products. Such excess capacity sometimes results in metal manufacturers in certain countries exporting steel at prices that are lower than prevailing domestic prices and sometimes at or below their cost of production. Excessive imports of metal into the United States, such as in recent years,U.S. have exerted and may exert in the future, downward pressure on United StatesU.S. steel prices which may negatively affect our results of operations.
13
Lead time and the cost of our products could increase if we were to lose one of our primary suppliers.
If, for any reason, our primary suppliers of aluminum, carbon steel, stainless steel, or other metals should curtail or discontinue their delivery of such metals in the quantities needed and at prices that are competitive, our business could suffer. The number of available suppliers could be reduced by factors such as industry consolidation and bankruptcies affecting steel and metal producers. For the year ended December 31, 2021,2023, our top 25 suppliers represented approximately 77%78% of our purchases. We could be significantly and adversely affected if delivery were disrupted from a major supplier. If, in the future, we were unable to obtain sufficient amounts of the necessary metals at competitive prices and on a timely basis from our traditional suppliers, we may not be able to obtain such metals from alternative sources at competitive prices to meet our delivery schedules, which could have a material adverse effect on our sales and profitability.
RISKS RELATED TO MARKET AND ECONOMIC VOLATILITY
Changes in inflation may adversely affect financial performance.
Fluctuations in inflation could result in, and recent inflationary pressures have resulted in, lower revenues, higher costs, and decreased margins, profits, and earnings. Rapid or significant inflation could continue to increase the costs we incur to procure, process, package, and deliver our metal to customers and we may not be able to increase selling prices to customers at the same rate, resulting in decreased margins and operating profits. Prolonged periods of deflation could adversely affect the degree to which we are able to maintain or increase selling prices resulting in decreased revenues, margins, and operating profits. Additionally, prolonged deflation could impact our availability on the Ryerson Credit Facility as the value of our accounts receivable and inventory decreases.
In addition, we rely on arrangements with third-party shipping and freight companies for the delivery of our products. Freight and shipping costs may increase due to inflation, and any such increases could adversely affect our margins unless we are able to increase selling prices at the same rate.
We monitor the risk that the principal markets in which we operate could continue to experience increased inflationary conditions. The onset, duration, and severity of an inflationary period cannot be estimated with precision.
The volatility of the market could result in a material impairment of goodwill.
We evaluate goodwill annually on October 1 and whenever events or changes in circumstances indicate potential impairment. Events or changes in circumstances that could trigger an impairment review include significant underperformance relative to our historical or projected future operating results, significant changes in the manner or the use of our assets or the strategy for our overall business, and significant negative industry or economic trends. We test for impairment of goodwill by assessing various qualitative factors with respect to developmentdevelopments in our business and the overall economy and calculating the fair value of a reporting unit using a combination of an income approach based on discounted future cash flows and a market approach at the date of valuation, as necessary. Under the discounted cash flow method, the fair value of each reporting unit is estimated based on expected future economic benefits discounted to a present value at a rate of return commensurate with the risk associated with the investment. Projected cash flows are discounted to present value using an estimated weighted average cost of capital, which considers both returns to equity and debt investors. Please refer to the Section titled “Critical Accounting Estimates - Goodwill,” of Item 7, “Management’s Discussion and Analysis of Financial Conditions and Results of Operations,” and Note 1 — “Summary of Accounting and Financial Policies” of Part II, Item 8 "Financial Statements and Supplementary Data" for further information.
Poor investment performance or other factors could require us to make significant unplanned contributions to our pension plan and future funding for postretirement employee benefits other than pensions also may require substantial payments from current cash flow.
We provide defined benefit pension plans for certain eligible employees and retirees. The performance of the debt and equity markets affect the value of plan assets. A decline in the market value may increase the funding requirements for these plans. The cost of providing pension benefits is also affected by other factors, including interest rates used to measure the required minimum funding levels, the rate of return on plan assets, discount rates used in determining future benefit obligations, future government regulation, and prior contributions to the plans. Significant unanticipated changes in any of these factors may have an adverse effect on our financial condition, results of operations, liquidity, and cash flows.
14
RISKS RELATED TO EXPANSION AND INTERNATIONAL OPERATIONS
We may not be able to successfully consummate and complete the integration of future acquisitions, and if we are unable to do so, it could disrupt operations and cause unanticipated increases in costs and/or decreases in revenues and results of operations.
We have grown through a combination of internal expansion, acquisitions, and joint ventures. We intend to continue to grow through selective acquisitions, but we may not be able to identify appropriate acquisition candidates, obtain financing on satisfactory terms, consummate acquisitions, or integrate acquired businesses effectively and profitably into our existing operations. Restrictions contained in the agreements governing our notes, the Ryerson Credit Facility, or our other existing or future debt may also inhibit our ability to make certain investments, including acquisitions, and participations in joint ventures.
Acquisitions, partnerships, joint ventures, and other business combination transactions, both foreign and domestic, involve various inherent risks, such as uncertainties in assessing value, strengths, weaknesses, liabilities, and potential profitability. There is also risk relating to our ability to achieve identified operating and financial synergies anticipated to result from the transactions. Additionally, problems could arise from the integration of acquired businesses, including unanticipated changes in the business or industry or general economic conditions that affect the assumptions underlying the acquisition. Our future success will depend on our ability to complete the integration of these future acquisitions successfully into our operations. Specifically, after any acquisition, customers may choose to diversify their supply chains to reduce reliance on a single supplier for a portion of their metals needs. We may not be able to retain all of our and an acquisition’s customers, which may adversely affect our business and sales. Integrating acquisitions, particularly large acquisitions, requires us to enhance our operational and financial systems and employ additional qualified personnel, management, and financial resources, and may adversely affect our business by diverting management away from day-to-day operations. Further, failure to successfully integrate acquisitions may adversely affect our profitability by creating significant operating inefficiencies that could increase our operating expenses as a percentage of sales and reduce our operating income. In addition, we may not realize expected cost savings from acquisitions. Any one or more of these factors could cause us to not realize the benefits anticipated or have a negative impact on the fair value of the reporting units. Accordingly, goodwill and intangible assets recorded as a result of acquisitions could become impaired.
Certain of our operations are located outside of the United States, which subjects us to risks associated with international activities.
Certain of ourWe have certain operations which are located outside of the United States, primarilyU.S., in Canada, China, and Mexico. We are subject to the Foreign Corrupt Practices Act (“FCPA”), which generally prohibits U.S. companies and their intermediaries from making corrupt payments or otherwise corruptly giving anything of value to foreign officials for the purpose of obtaining or keeping business or otherwise obtaining favorable treatment, and requires companies to maintain adequate record-keeping and internal accounting practices. The FCPA applies to covered companies, individual directors, officers, employees, and agents. Under the FCPA, U.S. companies may be held liable for some actions taken by strategic or local partners or representatives. If we or our intermediaries fail to comply with the requirements of the FCPA, governmental authorities in the United StatesU.S. could seek to impose civil and/or criminal penalties.
Our international operations and potential joint ventures may cause us to incur costs and risks that may distract management from effectively operating our North American business, and such operations or joint ventures may not be profitable.
We maintain foreign operations in Canada, China, and Mexico. International operations are subject to certain risks inherent in conducting business in, and with, foreign countries, including price controls, exchange controls, export controls, economic sanctions, duties, tariffs, limitations on participation in local enterprises, nationalization, expropriation and other governmental action, and changes in currency exchange rates. In addition, we may be subject to business disruptions created by health crises and outbreaks of communicable diseases. While we believe that our current arrangements with local partners provide us with experienced business partners in foreign countries, events or issues, including disagreements with our partners, may occur that require attention of our senior executives and may result in expenses or losses that erode the profitability of our foreign operations or cause our capital investments abroad to be unprofitable.
We may be adversely affected by currency fluctuations in the U.S. dollar versus the Canadian dollar, the Chinese renminbi, and the Hong Kong dollar.dollar, and the Mexican peso.
We have significant operations in Canada which incur the majority of their metal supply costs in U.S. dollars but earn the majority of their sales in Canadian dollars. Additionally, we have significant assets in China.China and conduct operations in Mexico. We may from time to time experience losses when the value of the U.S. dollar strengthens against the Canadian dollar, the Chinese renminbi, or the Hong Kong dollar, or the Mexican peso, which could have a material adverse effect on our results of operations. In addition, we are subject to translation risk when we consolidate our Canadian, Chinese, and ChineseMexican subsidiaries’ net assets into our balance sheet. Fluctuations in the value of the U.S. dollar versus the Canadian dollar, Chinese renminbi, or the Hong Kong dollar, or the Mexican peso could reduce the value of these assets as reported in our financial statements, which could, as a result, reduce our stockholders’ equity.
15
The Chinese government exerts substantial influence over the manner in which we must conduct our business activities, particularly with regards to the land our facilities are located on.
The Chinese government has exercised and continues to exercise substantial control over the Chinese economy through regulation and state ownership. Our ability to operate in China may be harmed by changes in its laws and regulations, including those relating to taxation, import and export tariffs, environmental regulations, land use rights, property, and other matters. We believe that our operations in China are in material compliance with all applicable legal and regulatory requirements. However, the central or local governments of the jurisdictions in which we operate may impose new, stricter regulations or interpretations of existing regulations that would require additional expenditures and efforts on our part to ensure our compliance with such regulations or interpretations.
Moreover, the Chinese court system does not provide the same property and contract right guarantees as do courts in the United StatesU.S. and, accordingly, disputes may be protracted and resolution of claims may result in significant economic loss.
Additionally, there is no private ownership of land in China and all land ownership is held by the government of China, its agencies, and collectives, which issue land use rights that are generally renewable. We lease the land where our Chinese facilities are located from the Chinese government. If the Chinese government decided to terminate our land use rights agreements, our assets could become impaired and our ability to meet customer orders could be impacted.
RISKS RELATED TO CYBERSECURITY AND INFORMATION TECHNOLOGY
Damage to our information technology infrastructure could harm our business.
The unavailability of any of our computer-based systems for any significant period of time could have a material adverse effect on our operations. In particular, our ability to manage inventory levels successfully largely depends on the efficient operation of our computer hardware and software systems. We use management information systems to track inventory information at individual facilities, provide pricing recommendations for sales quotes, communicate customer information, and aggregate daily sales, margin, and promotional information. Difficulties associated with upgrades, installations of major software or hardware, and integration with new systems could have a material adverse effect on results of operations. We could be required to expend substantial resources to integrateupgrade our information systems or integrate them with the systems of companies we have acquired. The upgrade or integration of these systems may disrupt our business or lead to operating inefficiencies. In addition, these systems are vulnerable to, among other things, damage or interruption from fire, flood, tornado, and other natural disasters, power loss, computer system and network failures, operator negligence, physical and electronic loss of data, or security breaches and computer viruses.
We are subject to cybersecurity risks and may incur increasing costs in an effort to minimize those risks.
We depend on the proper functioning and availability of our information technology platform, including communications and data processing systems, in operating our business. These systems include software programs that are integral to the efficient operation of our business. We have established security measures, controls, and procedures, including established recovery procedures for critical systems and business functions, to safeguard our information technology systems and to prevent unauthorized access to such systems and any data processed or stored in such systems, and we periodically evaluate and test the adequacy of such systems, measures, controls, and procedures; however, there can be no guarantee that such systems, measures, controls, and procedures will be effective. Security breaches could expose us to a risk of loss or misuse of our information, litigation, and potential liability. In addition, cyber incidents that impact the availability, reliability, speed, accuracy, or other proper functioning of these systems could have a significant impact on our operations, and potentially on our results. We may not have the resources or technical sophistication to anticipate or prevent rapidly evolving types of cyberattacks. A significant cyber incident, including system failure, security breach, disruption by malware, or other damage could interrupt or delay our operations, result in a violation of applicable privacy and other laws, damage our reputation, cause a loss of customers, or give rise to monetary fines and other penalties, which could be significant. Refer to Item 1C: "Cybersecurity" for further information on our Cybersecurity processes, policies, and programs.
RISKS RELATED TO OPERATING OUR BUSINESS
Any significant work stoppages can harm our business.
As of December 31, 2021,2023, we employed approximately 3,7004,300 persons in North America and 300 persons in China. Our North American workforce was comprised of approximately 1,6001,900 office employees and approximately 2,1002,400 plant employees. SeventeenSixteen percent of our plant employees were members of various unions, including the United Steel Workers and The International Brotherhood of Teamsters.
FiveEight renewal contracts covering 100160 employees were successfully negotiated in 2021. Four2023. Eight contracts covering 104152 employees are currently scheduled to expire in 2022.2024.
16
Certain employee retirement benefit plans are underfunded and the actual cost of those benefits could exceed current estimates, which would require us to fund the shortfall.
As of December 31, 2021,2023, our pension plan had an unfunded liability of $96$63.9 million and our other postretirement benefits plan had an unfunded liability of $35.7 million. Our actual costs for benefits required to be paid may exceed those projected and future actuarial assessments to the extent that those costs exceed the current assessment.assessments. Under those circumstances, the adjustments required to be made to our recorded liability for these benefits could have a material adverse effect on our results of operations and financial condition and cash payments to fund these plans could have a material adverse effect on our cash flows. We may be required to make substantial future contributions to improve the plan’s funded status.
Any prolonged disruption of our processing centers could harm our business.
We have dedicated processing centers that permit us to produce standardized products in large volumes while maintaining low operating costs. We may suffer prolonged disruption in the operations of any of these facilities, whether due to labor or technical difficulties, destruction, or damage sustained as a result of natural disasters or climate-related events to any of the facilities or otherwise, which could adversely affect our operating results.
If we are unable to retain, attract, and motivate management and key personnel, it may adversely affect our business.
In order to compete and have continued growth, we must attract, retain, and motivate executives and other key employees, including those in managerial, technical, sales, marketing, and support positions. We believe that our success is due, in part, to our experienced management team. Losing the services of one or more members of our management team such as our CEO, Edward J. Lehner, could adversely affect our business and possibly prevent us from improving our operational, financial, and information management systems and controls. We compete to hire employees and then must train them and develop their skills and competencies. In the future, we may need to retain and hire additional qualified sales, marketing, administrative, operating, and technical personnel, and to train and manage new personnel. Our ability to implement our business plan is dependent on our ability to retain, hire, and train a large number of qualified employees each year. Our results of operations could be adversely affected by increased costs due to increased competition for employees, higher employee turnover, or increased employee benefit costs.
Our risk management strategies may result in losses.
From time to time, we may use fixed-price and/or fixed-volume supplier contracts to offset contracts with customers. Some of our existing supply agreements have required minimum purchase quantities. Under adverse economic conditions, those minimums may exceed our needs. Absent exceptions for force majeure and other circumstances affecting the legal enforceability of the agreements, these minimum purchase requirements may compel us to purchase quantities of raw materials that could significantly exceed our anticipated needs or pay damages to the supplier for shortfalls. In these circumstances, we would attempt to negotiate agreements for new purchase quantities. There is a risk, however, that we would not be successful in reducing purchase quantities, either through negotiation or litigation. If that occurred, we would likely be required to purchase more of a particular raw material in a particular year than we need, negatively affecting our results of operations and cash flows.
Additionally, we may use commodity contracts, foreign exchange contracts, and interest rate swaps to manage our exposure to commodity price risk, foreign currency exchange risk, and interest rate risk. These risk management strategies pose certain risks, including the risk that losses on a hedge position may exceed the amount invested in such instruments. Moreover, a party in a hedging transaction may be unavailable or unwilling to settle our obligations, which could cause us to suffer corresponding losses. A hedging instrument may not be effective in eliminating all of the risks inherent in any particular position. Our profitability may be adversely affected during any period as a result of the use of such instruments.
RISKS RELATED TO REGULATORY AND LEGAL MATTERS
We could incur substantial costs related to environmental, health, and safety laws.
Our operations are subject to increasingly stringent environmental, health, and safety laws. These include laws that impose limitations on the discharge of pollutants into the air and water and establish standards for the treatment, storage, and disposal of regulated materials, and the investigation and remediation of contaminated soil, surface water, and groundwater. Failure to maintain or achieve compliance with these laws or with the permits required for our operations could result in substantial increases in operating costs and capital expenditures. In addition, we may be subject to fines and civil or criminal sanctions, third party claims for property damage or personal injury, worker’s compensation or personal injury claims, cleanup costs, or temporary or permanent discontinuance of operations. Certain of our facilities are located in industrial areas, have a history of heavy industrial use, and have been in operation for many years and, over time, we and other predecessor operators of these facilities have generated, used, handled, and disposed of
17
hazardous and other regulated wastes. Environmental liabilities could exist, including cleanup obligations at these facilities or at off-site locations where materials from our operations were disposed of, which could result in future expenditures that cannot be currently quantified and which could have a material adverse effect on our financial position, results of operations, or cash flows. Such liabilities may be imposed without regard to fault or the legality of a party’s conduct and may, in certain circumstances, be joint and several. Future changes to environmental, health, and safety laws, including those related to climate change, could result in material liabilities and costs, constrain operations, or make such operations more costly for us, our suppliers, and our customers.
In October 2011, the United States Environmental Protection Agency (the “EPA”) named JT Ryerson as one of more than 100 businesses that may be a potentially responsible party for the Portland Harbor Superfund Site. See Note 13:12: Commitments and Contingencies in the notes to the consolidated financial statements included in Part II, Item 8 of this Report on Form 10-K.
As the EPA has not yet allocated responsibility for the contamination among the potentially responsible parties, including JT Ryerson, we do not currently have sufficient information available to us to determine whether the Record of Decision will be executed
as currently stated, whether and to what extent JT Ryerson may be held responsible for any of the identified contamination, and how much (if any) of the final plan’s costs might ultimately be allocated to JT Ryerson. Therefore, management cannot predict the ultimate outcome of this matter or estimate a range of potential loss at this time.
Environmental, social, and governance matters, and any related reporting obligation may impact our business
Our business is subject to evolving corporate governance and public disclosure regulations and expectations, including with respect to environmental, social, and governance matters ("ESG"), that could expose us to numerous risks. These rules and regulations continue to evolve in scope and complexity, and many new requirements have been created in response to laws enacted by Congress, making compliance more difficult and uncertain. In addition, increasingly regulators, customers, investors, employees, and other stakeholders are focusing on ESG type matters and related disclosures. Our implementation of these evolving rules and regulations will require additional resources and implementation of new practices and reporting processes, all entailing additional compliance risk. Moreover, the progress and disclosure of our initiatives within the ESG scope could be criticized for accuracy, adequacy, and completeness, or may not advance at a sufficient pace. If our ESG-related data, processes, and reporting are incomplete or inaccurate, or if we fail to achieve progress with respect to our sustainability goals, or at all, our reputation, business, financial performance, and growth could be adversely affected.
Overall increased emphasis of ESG in itself and ESG reporting has increased stakeholder focus, including by U.S. and foreign governmental authorities, investors, and customers on environmental sustainability matters, such as climate change, the reduction of greenhouse gases, and water consumption. Legislative, regulatory, or other efforts to combat climate change or other environmental concerns could result in future increases in taxes, restrictions on or increases in the costs of supplies, transportation, and utilities, any of which could increase our operating costs, and necessitate future investments in facilities and equipment. Further, the customers we serve may impose emissions reduction or other environmental standards and requirements. As a result, we may experience increased compliance burdens and costs and the sourcing of our products may be adversely affected. These risks also include the increased pressure to make commitments, set targets, or establish additional goals and take actions to meet them, which could expose us to market, operational, execution, and reputation costs or risks.
Regulations related to conflict-free minerals may force us to incur additional expenses and place us at a competitive disadvantage.
On August 22, 2012, under the Dodd-Frank Wall Street Reform and Consumer Protection Act of 2010 (the “Dodd-Frank Act”), the SEC adopted new requirements for reporting companies that use certain minerals and metals, known as “conflict minerals”, in their products, whether or not these products are manufactured by third parties. These requirements require companies to diligence, disclose, and report whether or not such minerals originate from the Democratic Republic of Congo and adjoining countries. Since our supply chain is complex, we may not be able to conclusively verify the origins for all metals used in our products and we may face reputational challenges with our customers. Additionally, as there may be only a limited number of suppliers offering “conflict free” metals, we cannot be sure that we will be able to obtain necessary metals from such suppliers in sufficient quantities or at competitive prices. Accordingly, we could incur significant costs related to the compliance process, including potential difficulty or added costs in satisfying the disclosure requirements. Moreover, we may encounter challenges to satisfy those customers who require that all of the components of our products be certified as conflict free which could place us at a competitive disadvantage if we are unable to do so.
Tax changes could affect our effective tax rate, the value of our deferred tax assets, and future profitability.
Our future results could be adversely affected by changes in the effective tax rate or changes in the treatment of deferred tax assets as a result of changes in Ryerson’s overall profitability, changes in the mix of earnings in countries with differing statutory tax rates, changes in tax legislation, the results of the examination of previously filed tax returns, and continuing assessment of the Company’s tax exposures. In particular, although the passage of the Tax Cut and Jobs Act of 2017 reduced the U.S. tax rate to 21%, our future earnings could be negatively impacted by changes in tax legislation including changing tax rates and tax base such as
18
limiting, phasing-out, or eliminating deductions or tax credits, changing rules for earnings repatriations, and changing other tax laws in the U.S. or other countries.
We are subject to litigation that could strain our resources and distract management.
From time to time, we are involved in a variety of claims, lawsuits, and other disputes arising in the ordinary course of business. These suits concern issues including product liability, contract disputes, employee-related matters, and personal injury matters. It is not feasible to predict the outcome of all pending suits and claims, and the ultimate resolution of these matters as well as future lawsuits that could have a material adverse effect on our business, financial condition, results of operations, cash flows, or reputation.
We may face product liability claims that are costly and create adverse publicity.
If any of the products that we sell cause harm to any of our customers, we could be exposed to product liability lawsuits. If we were found liable under product liability claims, we could be required to pay substantial monetary damages. Further, even if we successfully defended ourselves against this type of claim, we could be forced to spend a substantial amount of money in litigation expenses, our management could be required to spend valuable time in the defense against these claims, and our reputation could suffer.
Changes in the method of determining the London Interbank Offered Rate (“LIBOR”), or the replacement of LIBOR with an alternative reference rate, may adversely affect interest rates on our outstanding variable rate indebtedness.
Certain of our variable rate debt, including the Ryerson Credit Facility, currently uses LIBOR as a benchmark for establishing certain interest rates. LIBOR is the subject of recent proposals for reform, and on July 27, 2017, the U.K. Financial Conduct Authority announced that it intends to stop compelling banks to submit rates for the calculation of LIBOR after 2021. In March 2021, the U.K. Financial Conduct Authority confirmed its intention to cease publication of the one-week and two-month USD LIBOR tenors and all tenors for EUR, CHF, JPY, and GBP LIBOR after December 31, 2021 and to cease publication of all other USD LIBOR after June 30, 2023. The Alternative Reference Rates Committee, which was convened by the Federal Reserve Board and the Federal Reserve Bank of New York, has identified the Secured Overnight Financing Rate (“SOFR”) as the recommended risk-free alternative rate for USD LIBOR. On June 30, 2023, when LIBOR rates cease to be published, the interest rate on the Ryerson Credit Facility will be replaced with SOFR. At this time, it is not possible to predict the effect any discontinuance, modification, or other reforms to LIBOR, or the establishment of alternative reference rates such as SOFR, or any other reference rate, will have on the Company or its borrowing costs. The consequences of these developments with respect to LIBOR cannot be entirely predicted but may result in an increase in the interest cost of our variable rate indebtedness. In addition, the overall financial market may be disrupted as a result of the phase-out or replacement of LIBOR. Disruption in the financial market could have a material adverse effect on our financial position, results of operations, and liquidity.
RISKS RELATED TO OWNERSHIP OF OUR COMMON STOCK
Our stock price has fluctuated in the past, has recently been volatile, and may be volatile in the future, and as a result, investors in our common stock could incur substantial losses.
We may incur rapid and substantial decreases in our stock price in the foreseeable future that are unrelated to our operating performance or prospects.
As a result of this volatility, investors may experience losses on their investment in our common stock. The market price for our common stock may be volatile.influenced by many factors, including the following:
Historically, there has been volatility
| political or economic instability.
|
|
|
|
|
|
|
|
|
|
|
|
|
|
|
|
|
|
|
|
In the past, the stock market has experienced significant price and volume fluctuations. This volatility has had a significant effect on the market prices of securities issued by many companies for reasons unrelated to their specific operating performance. These factors may adversely affect the trading price of our common stock, regardless of actual operating performance.
In addition, stock markets from time to time experience extreme price and volume fluctuations that may be unrelated or disproportionate to the operating performance of companies. In the past, some shareholders have brought securities class action lawsuits against companies following periods of volatility in the market, price of their securities. In the future we may be the target of similar litigation. Securitiessecurities class-action litigation regardless of whether our defense is ultimately successful,has often been instituted against companies. Such litigation, if instituted against us, could result in substantial costs and divert management’sdiversion of management's attention and resources.resources, which could materially and adversely affect our business, financial condition, results of operations, and growth prospects.
19
There can be no guarantee that our stock price will remain at current levels or that future sales of our common stock will not be at prices lower than those sold to investors.
We paid cash dividends on our common stock in the third and fourtheach quarter of 20212023, but any future dividend payments are at the discretion of our Board of Directors.
The amounts that may be available to us to paySince the third quarter of 2021 we have paid regular quarterly cash dividends are restricted underon our debt agreements.common stock. Any declaration and payment of cash dividends on our common stock in the future, whether at current levels or at all, will be at the discretion of our Board of Directors and will depend upon our results of operations, earnings, capital requirements, financial condition, future prospects, contractual restrictions, and other factors deemed relevant by our Board of Directors. Therefore, you should not rely on dividend income from shares of our common stock. For more information, see “Dividend Policy.”"Dividend Policy" of Part II, Item 5 "Market for Registrant's Common Equity, Related Stockholder Matters, and Issuer Purchases of Equity Securities". Your only opportunity to achieve a return on your investment in us may be if the market price of our common stock appreciates and you sell your shares at a profit, but there is no guarantee that the market price for our common stock will ever exceed the price that you pay for our common stock.
Our corporate documents and Delaware law contain provisions that could discourage, delay, or prevent a change in control of the Company.
Our amended and restated certificate of incorporation and amended and restated bylaws contain provisions that may make the acquisition of our company more difficult without the approval of our Board of Directors. These provisions:
| • establish a classified Board of Directors so that not all members of our Board of Directors are elected at one time; • authorize the issuance of undesignated preferred stock, the terms of which may be established and the shares of which may be issued without stockholder approval, and which may include super voting, special approval, dividend, or other rights or preferences superior to the rights of the holders of common stock; • provide that the Board of Directors is expressly authorized to make, alter, or repeal our amended and restated bylaws; • prohibit stockholders from acting by written consent if less than a majority of the voting power of our outstanding stock is controlled by Platinum; and • establish advance notice requirements for nominations for elections to our Board of Directors or for proposing matters that can be acted upon by stockholders at stockholder meetings.
|
|
|
|
|
|
|
|
|
|
These anti-takeover provisions and other provisions under Delaware law could discourage, delay, or prevent a transaction involving a change in control of our company, even if doing so would benefit our stockholders. These provisions could also discourage proxy contests and make it more difficult for our stockholders to elect directors of their choosing and to cause us to take other corporate actions they desire.choosing.
Any issuance of preferred stock could make it difficult for another company to acquire us or could otherwise adversely affect holders of our common stock, which could depress the price of our common stock.
Our Board of Directors will havehas the authority to issue preferred stock and to determine the preferences, limitations, and relative rights of shares of preferred stock and to fix the number of shares constituting any series and the designation of such series, without any further vote or action by our stockholders. Our preferred stock could be issued with voting, liquidation, dividend, and other rights superior to the rights of our common stock. The potential issuance of preferred stock may delay or prevent a change in control of us, discouraging bids for our common stock at a premium over the market price, and adversely affect the market price and the voting and other rights of the holders of our common stock.
RISKS RELATED TO OUR CAPITAL STRUCTURE
We have a substantial amount of indebtedness under our Ryerson Credit Facility, which could adversely affect our financial position and prevent us from fulfilling our financial obligations.
We currently have a substantial amount of indebtedness. As of December 31, 2021,2023, our total indebtedness under the Ryerson Credit Facility was $639.3$433 million and we had approximately $670$560 million of unused capacity underon the Ryerson Credit Facility.facility. Our substantial indebtedness may:
| • make it difficult for us to satisfy our financial obligations, including making scheduled principal and interest payments on our indebtedness; • limit our ability to borrow additional funds for working capital, capital expenditures, acquisitions, or other general corporate purposes; 20 • limit our ability to use our cash flow for future working capital, capital expenditures, acquisitions, or other general corporate purposes; • require us to use a substantial portion of our cash flow from operations to make debt service payments; • limit our flexibility to plan for, or react to, changes in our business and industry; • place us at a competitive disadvantage compared to our less leveraged competitors; and • increase our vulnerability to the impact of adverse economic and industry conditions.
|
|
|
|
|
|
|
|
|
|
|
|
|
|
We may also incur additional indebtedness in the future. The terms of the Ryerson Credit Facility and the indenture governing our outstanding notes restrict but do not prohibit us from doing so, and the indebtedness incurred in compliance with these restrictions could be substantial. If new indebtedness is added to our current debt levels, the related risks that we now face could intensify.
The covenants in the Ryerson Credit Facility and the indenture governing our notes impose, and covenants contained in agreements governing indebtedness that we incur in the future may impose restrictions that may limit our operating and financial flexibility.
The Ryerson Credit Facility and the indenture governing our outstanding notes containcontains a number of significant restrictions and covenants that limit our ability and the ability of our restricted subsidiaries, including JT Ryerson, to:
| • incur additional debt; • make certain investments or other restricted payments; • create liens or use assets as security in other transactions; • merge, consolidate, transfer, or dispose of substantially all of our assets; and • engage in transactions with affiliates.
|
|
|
|
|
|
|
|
|
|
|
|
The terms of the Ryerson Credit Facility require that, in the event availability under the facility declines to a certain level, we maintain a minimum fixed charge coverage ratio at the end of each fiscal quarter. Total credit availability is limited by the amount of eligible accounts receivable, inventory, and qualified cash pledged as collateral under the agreement insofar as the Company is subject to a borrowing base comprised of the aggregate of these three amounts, less applicable reserves. As of December 31, 2021,2023, total credit availability under the Ryerson Credit Facility was $670$560 million. See discussion regarding the Ryerson Credit Facility in Note 10:9: “Debt” of Part II, Item 8 “Financial Statements and Supplementary Data” as well as the discussion within the “Liquidity and Capital Resources” section of Item 7 “Management’s Discussion and Analysis of Financial Condition and Results of Operations.”
Additionally, subject to certain exceptions, the indenture governing the outstanding notes restricts JT Ryerson’s ability to pay Ryerson Holding dividends. Our future indebtedness may contain covenants more restrictive in certain respects than the restrictions contained in the Ryerson Credit Facility and the indenture governing the notes.Facility. Operating results below current levels or other adverse factors, including a significant increase in interest rates, could result in our being unable to comply with financial covenants that are contained in the Ryerson Credit Facility or that may be contained in any future indebtedness. In addition, complying with these covenants may also cause us to take actions that are not favorable to holders of our notesstockholders and may make it more difficult for us to successfully execute our business strategy and compete against companies that are not subject to such restrictions.
We may not be able to generate sufficient cash to service all of our indebtedness.
We are highly leveraged. Our ability to make payments on our indebtedness depends on our ability to generate cash in the future. OurBalances outstanding notes,on the Ryerson Credit Facility and our other outstanding indebtedness are expected to account for significant cash interest expenses. Accordingly, we will have to generate significant cash flows from operations to meet our debt service requirements. If we do not generate sufficient cash flow to meet our debt service and working capital requirements, we may be required to sell assets, seek additional capital, reduce capital expenditures, restructure or refinance all or a portion of our existing indebtedness, or seek additional financing. Moreover, insufficient cash flow may make it more difficult for us to obtain financing on terms that are acceptable to us, or at all.
The right to receive payment onBecause the 2028 Notes and the guarantees will be subordinated to the liabilities of non-guarantor subsidiaries.
The notes and related guarantees are structurally subordinated to all indebtedness of our subsidiaries that are non-guarantors of the 2028 Senior Secured Notes (the “2028 Notes”). While the indenture governing the 2028 Notes limits the indebtedness and activities of these non-guarantor subsidiaries, holders of indebtedness of, and trade creditors of, non-guarantor subsidiaries, including lenders under bank financing agreements, are entitled to payments of their claims from the assets of such subsidiaries before those assets are made available for distribution to any guarantor, as direct or indirect shareholder. While the non-guarantor subsidiaries have agreed under the indenture not to pledge or encumber their assets (other than with respect to permitted liens) without equally and ratably securing the notes, they will not guarantee the 2028 Notes notwithstanding any such pledge or encumbrance in favor of the 2028 Notes.
The non-guarantor subsidiaries represented, respectively, 9.7% and 14.3% of our net sales and EBITDA for the fiscal year ended December 31, 2021. In addition, these non-guarantor subsidiaries represented respectively, 12.7% and 8.5% of our assets and liabilities, as of December 31, 2021.
Accordingly, in the event that any of the non-guarantor subsidiaries or joint venture entities become insolvent, liquidates, or otherwise reorganizes:
|
|
|
|
Because a portionmajority of our indebtedness bears interest at rates that fluctuate with changes in certain prevailing short-term interest rates, we are vulnerable to interest rate increases.
A portionThe majority of our indebtedness, including the Ryerson Credit Facility, bears interest at rates that fluctuate with changes in certain short-term prevailing interest rates. As of December 31, 2021,2023, we had $316.0$433.0 million of outstanding borrowings under the Ryerson Credit Facility, with an additional $670$560 million available for borrowing under such facility. Assuming a consistent level of
21
debt through-out 2021 and considering the impact of interest rate swaps,2023 a 100 basis point increase in the interest rate on our floating rate debt effective from the beginning of the year would increase our interest expense under the Ryerson Credit Facility and the China credit facility by approximately $2.0$4.7 million, on an annual basis. The Federal Reserve has continued to increase interest rates in 2023, increasing our interest expense on the Ryerson Credit Facility. If interest rates increase dramatically,continue to rise in the future, we could be unable to service our debt, which could have a material adverse effect on our business, financial condition, results of operations, or cash flows.
Changes in our credit ratings and outlook may reduce access to capital and increase borrowing costs.
Our credit ratings are based on a number of factors, including our financial strength and factors outside of our control, such as conditions affecting our industry generally or the introduction of new rating practices and methodologies. We cannot provide assurances that our current credit ratings will remain in effect or that the ratings will not be lowered, suspended, or withdrawn entirely by the rating agencies. If rating agencies lower, suspend, or withdraw the ratings, the market price or marketability of our securities may be adversely affected. In addition, any negative change in ratings could make it more difficult for us to raise capital on acceptable terms, impact the ability to obtain adequate financing, and result in higher interest costs for our existing credit facilities, including the Ryerson Credit Facility, or on future financings.
RISKS RELATED TO OUR STOCKHOLDER BASE
Platinum owns a significantsubstantial percentage of our stock and has the right to nominate a majority of thetwo members of the Corporation’s board and will be able to exert controlinfluence over matters subject to stockholder approval.approval.
Platinum owns approximately 21,037,5003,924,478 shares of our common stock, which is approximately 55%11.5% of our issued and outstanding common stock. Therefore, Platinum may be able to determineinfluence all matters requiring stockholder approval. For example, Platinum may be able to controlinfluence elections of directors, amendments of our organizational documents, or approval of any merger, sale of assets, or other major corporate transaction. This may prevent or discourage unsolicited acquisition proposals or offers for our common stock that our stockholders may believe are in their best interest as stockholders.
The Company is party to an investor rights agreement (the “Investor Rights Agreement”) with certain affiliates of Platinum which provides, among other things, that for so long as Platinum collectively beneficially owns (i) at least 30% of the voting power of the outstanding capital stock of the Company, Platinum will have the right to nominate for election to the board of directors of the Company no fewer than that number of directors that would constitute a majority of the number of directors if there were no vacancies on the board, (ii) at least 15% but less than 30% of the voting power of the outstanding capital stock of the Company, Platinum will have the right to nominate two directors, and (iii) at least 5% but less than 15% of the voting power of the outstanding capital stock of the Company, Platinum will have the right to nominate one director. The agreement also provides that if the size of the board of directors is increased or decreased at any time, Platinum’s nomination rights will be proportionately increased or decreased, respectively, rounded up to the nearest whole number. As a resultBased on Platinum's current voting power of Platinum’s ownership of a majority of the Company’s outstanding capital stock as well its board nomination rightsof the Company and the current size of the Board, Platinum has the right to nominate up to two directors pursuant to the Investor Rights Agreement,Agreement. As a result, Platinum may significantly influence or effectively control our policies and operations, including the appointment of management, future issuances of our common stock or other securities, and the payment of dividends. In addition, Platinum has significant control over ourdividends, as well as impact decisions to enter into any other corporate transaction.
The interests of Platinum may not in all cases be aligned with the interests of the other holders of our common stock. For example, a sale of a substantial number of shares of stock in the future by Platinum could cause our stock price to decline. Further, Platinum could cause us to make acquisitions that increase the amount of the indebtedness that is secured or senior to the Company’s existing debt or sell revenue-generating assets, impairing our ability to make payments under such debt. Additionally, Platinum is in the business of making investments in companies and may from time to time acquire and hold interests in businesses that compete
directly or indirectly with us. Accordingly, Platinum may also pursue acquisition opportunities that may be complementary to our business, and as a result, those acquisition opportunities may not be available to us. In addition, Platinum may have an interest in pursuing acquisitions, divestitures, and other transactions that, in their judgment, could enhance their equity investment, even though such transactions might involve risks to holders of our common stock.
ITEM 1B. UNRESOLVED STAFF COMMENTS.
|
|
Not applicable.
22
ITEM 1C. CYBERSECURITY.
We are committed to protecting Company information and the confidential information of our employees, customers, partners, and suppliers. To that end, we have in place various policies, procedures, and processes to identify, assess, manage, and prevent potential cybersecurity risk's, and to timely detect the occurrence, and mitigate the effects of, cyberattacks and data breaches. Our Chief Information Officer ("CIO"), who has more than 25 years of information security and cybersecurity experience, manages cybersecurity, and oversees a team of dedicated cybersecurity personnel with various experience and certifications in information security and cybersecurity. Our personnel, along with external parties engaged to assess the sufficiency of our risk management processes (e.g., through penetration testing), continuously work to maintain and improve our cybersecurity program and the security and integrity of our information systems and infrastructure through our ongoing risk management program, including (i) by conducting cybersecurity assessments and audits to address threats and to stay in step with emerging malicious trends, and (ii) by performing due diligence on partners and suppliers to ensure similar values and appropriate security standards and safeguards are maintained by such partners and suppliers with respect to our information security assets and to third-party systems on which we rely. In addition, our Incident Response Team is trained to identify, quarantine, and remediate cybersecurity threats, and all of our employees are regularly trained to increase awareness of threats and to identify how to spot and avoid them.
Cybersecurity is a formal component of our overall risk management program, and our management, including our Chief Information Officer, regularly update the Audit Committee of the Board of the status of our cybersecurity program. In the event that management identifies significant cybersecurity risk exposures, it will present such exposures to the Audit Committee, which oversees the actions, security, and risk mitigation efforts taken across our cybersecurity framework. With this input from management, the Audit Committee evaluates our cybersecurity risks and the responses implemented to prevent and/or mitigate any such risks.
We have adopted an incident response plan that applies in the event of a cybersecurity incident involving a breach of our information technology systems and applications. Pursuant to this response plan, in the event of an incident, a multi-disciplinary team is assembled that is led by our CIO. The team in turn may leverage the expertise of third-party consultants, external legal counsel, and other resources. The plan includes procedures designed to facilitate containment of, and responses to, a cybersecurity incident, which are based on the type of incident, the location of the incident, and the breadth of the incident. The plan also establishes procedures for escalating incidents depending on severity and for notifying any impacted parties, including our customers, law enforcement and regulatory authorities, third-party vendors, and insurance providers. Our CIO will provide periodic updates to the Audit Committee and, when appropriate, the Board of Directors during this process. In addition to internal resources, we utilize third-party service providers to supplement and maintain our cybersecurity and our information technology systems.
As of the date of this report, we are not aware of any material risks from cybersecurity threats, including as a result of any cybersecurity incident, which have materially affected, or are reasonably likely to materially affect, us, our business strategy, our results of operations, or our financial condition.
23
ITEM 2. PROPERTIES.
|
|
As of December 31, 2021,2023, the Company’s facilities are set forth below:
Operations in the United States
JT Ryerson maintains 78and its U.S. affiliates maintain 96 operational facilities, including 610 locations that are dedicated to administration services. All of our metals service center facilities are in good condition and are adequate for JT Ryerson’s existing operations. Approximately 65%67% of these facilities are leased. The lease terms expire at various times through 2036.2043. JT Ryerson’s properties and facilities are adequate to serve its present and anticipated needs.
Location | Own/Lease | |
Birmingham, AL | Owned | |
Mobile, AL | Owned | |
Fort Smith, AR | Owned | |
Hickman, AR** | Leased | |
Little Rock, AR** | Leased | |
Phoenix, AZ | Leased | |
| Leased | |
| Leased | |
|
| |
|
| |
|
| |
| Owned | |
| Leased | |
|
| |
|
| |
|
| |
| Leased | |
| Owned | |
Des Moines, IA | Owned | |
Eldridge, IA** | Leased | |
Marshalltown, IA | Owned | |
Chicago, IL (Headquarters)* | Leased | |
Chicago, IL | Leased | |
| Leased | |
Elgin, IL | Leased | |
Lisle, IL* | Leased | |
|
| |
|
| |
|
| |
|
| |
|
| |
| Owned | |
|
| |
|
| |
|
| |
|
| |
|
| |
|
| |
| Leased | |
Minneapolis, MN | Leased | |
Plymouth, MN | Owned | |
Maryland Heights, MO | Leased | |
North Kansas City, MO | Leased | |
| Owned |
Jackson, MS | Owned | |
Charlotte, NC | Owned | |
Greensboro, NC (2) | Owned |
24
Pikeville, NC | Leased | |
Winston-Salem, NC* | Leased | |
Youngsville, NC | Leased | |
Omaha, NE | Owned | |
Dover, NH | Leased | |
Hampstead, NH* | Leased | |
Las Vegas, NV | Leased | |
Lancaster, NY | Leased | |
Cincinnati, OH | Owned | |
Columbus, OH | Leased | |
Hamilton, OH* | Leased | |
Hilliard, OH | Leased | |
Stow, OH*** |
| |
|
| |
| Leased | |
| Leased | |
|
| |
| Leased | |
| Leased | |
| Owned | |
|
| |
|
| |
|
| |
| Leased | |
| Leased | |
| Leased | |
| Leased | |
| Leased | |
| Leased | |
|
| |
|
| |
|
| |
|
| |
|
| |
|
| |
|
| |
|
| |
|
| |
|
| |
|
| |
|
| |
|
| |
|
| |
Salt Lake City, UT | Leased | |
Pounding Mill, VA | Leased | |
Richmond, VA | Leased | |
| Leased | |
Spokane, WA | Leased | |
|
| |
Green Bay, WI |
| |
| Leased | |
|
| |
|
|
|
| |
Schofield, WI | Owned | |
Wausau, WI | Owned |
* Office space only
** Processing centers
***Toll Processing centers
25
Operations in Canada
Ryerson Canada, a wholly-owned indirect Canadian subsidiary of Ryerson Holding, has nineten operational facilities in Canada. All of the metals service center facilities are in good condition and are adequate for Ryerson Canada’s existing and anticipated operations. FourFive facilities are leased. The lease terms expire at various times through 2025.2027.
Location | Own/Lease | |
Calgary, AB | Owned | |
Edmonton, AB | Owned | |
Richmond, BC | Owned | |
Winnipeg, MB | Owned | |
Winnipeg, MB | Leased | |
Saint John, NB | Owned | |
Brampton, ON | Leased | |
Burlington, ON (includes Canadian Headquarters) | Leased | |
| Leased | |
Vaudreuil, QC | Leased |
Operations in China
Ryerson China, an indirect wholly-owned subsidiary of Ryerson Holding, has four service and processing centers in China, in Guangzhou, Dongguan, Kunshan, and Tianjin, performing coil processing, sheet metal fabrication, and plate processing. Ryerson China’s headquarters office building is located in Kunshan. We own all of our China facilities and have purchased the related land use rights. All of the facilities are in good condition and are adequate for Ryerson China’s existing and anticipated operations.
Operations in Mexico
Ryerson Mexico, an indirect wholly-owned subsidiary of Ryerson Holding, has four facilities in Mexico. We have service centers in Monterrey, Tijuana, Hermosillo, and Queretaro, all of which are leased. The lease terms expire at various times through 2029. The facilities are in good condition and are adequate for Ryerson Mexico’s existing and anticipated operations.
ITEM 3. LEGAL PROCEEDINGS.
|
|
For information concerning legal proceedings as of December 31, 2021,2023, please refer to Note 13:12: Commitments and Contingencies in the notes to the consolidated financial statements included in Part II, Item 8 of this Report on Form 10-K, which is incorporated into this item by reference.
ITEM 4. MINE SAFETY DISCLOSURES.
|
|
Not applicable.
26
PART II
ITEM 5. MARKET FOR REGISTRANT’S COMMON EQUITY, RELATED STOCKHOLDER MATTERS, AND ISSUER PURCHASES OF EQUITY SECURITIES.
|
|
Market Information for Common Stock
Our common stock has been listed on the New York Stock Exchange under the symbol “RYI” and was first traded on August 13, 2014.
Holders
As of February 21, 2022,2024, there were 27 stockholders of record of our common stock. Because many shares of our common stock are held by brokers and other institutions on behalf of stockholders, we are unable to estimate the total number of beneficial stockholders represented by these record holders.
Dividend Policy
We paid cash dividends on our common stock in all four quarters of 2023; $0.170 per share in the first quarter, $0.180 per share in the second quarter, $0.1825 per share in the third quarter, and fourth quarter of 2021, of $0.08 and $0.085$0.185 per share respectively. Anyin the fourth quarter. The declaration and payment of cash dividends on our common stock in the future, whether at current levels or at all, will be at the discretion of our Board of Directors and will depend upon our results of operations, earnings, capital requirements, financial condition, future prospects, contractual restrictions, including under the Ryerson Credit Facility, and our outstanding notes, and other factors deemed relevant by our Board of Directors.
27
Performance Graph
The following graph and accompanying table show the cumulative total return to stockholders of Ryerson Holding’s common stock relative to the cumulative total returns of the S&P 500 and a metals service center peer group (the “Peer Group”). The graph tracks the performance of a $100 investment in each of the indices (with reinvestment of dividends) from December 31, 20162018 to December 31, 2021.2023. While there is no nationally-recognized industry index consisting of metals service center companies, Ryerson considers its Peer Group to consist of Reliance Steel & Aluminum Co., Olympic Steel Inc., and Worthington Industries,Steel, Inc., each of which has securities listed for trading on the NASDAQ; and Russel Metals Inc., which has securities listed for trading on the Toronto Stock Exchange; and Klöckner & Co SE., which has securities listed for trading on the XETRA Frankfurt Stock Exchange. The returns of each member of the Peer Group are weighted according to that member’s stock market capitalization. On December 1, 2023 Worthington Industries spun off their steel division into Worthington Steel, Inc. The chart below includes Worthington Industries data for December 31, 2018 through November 30, 2023 and Worthington Steel, Inc. data thereafter, with returns and market capitalization weighted for each respective period. The stock price performance included in this graph is not necessarily indicative of future stock price performance.
Comparison of 5 Year Cumulative Total Return
Assumes Initial Investment of $100
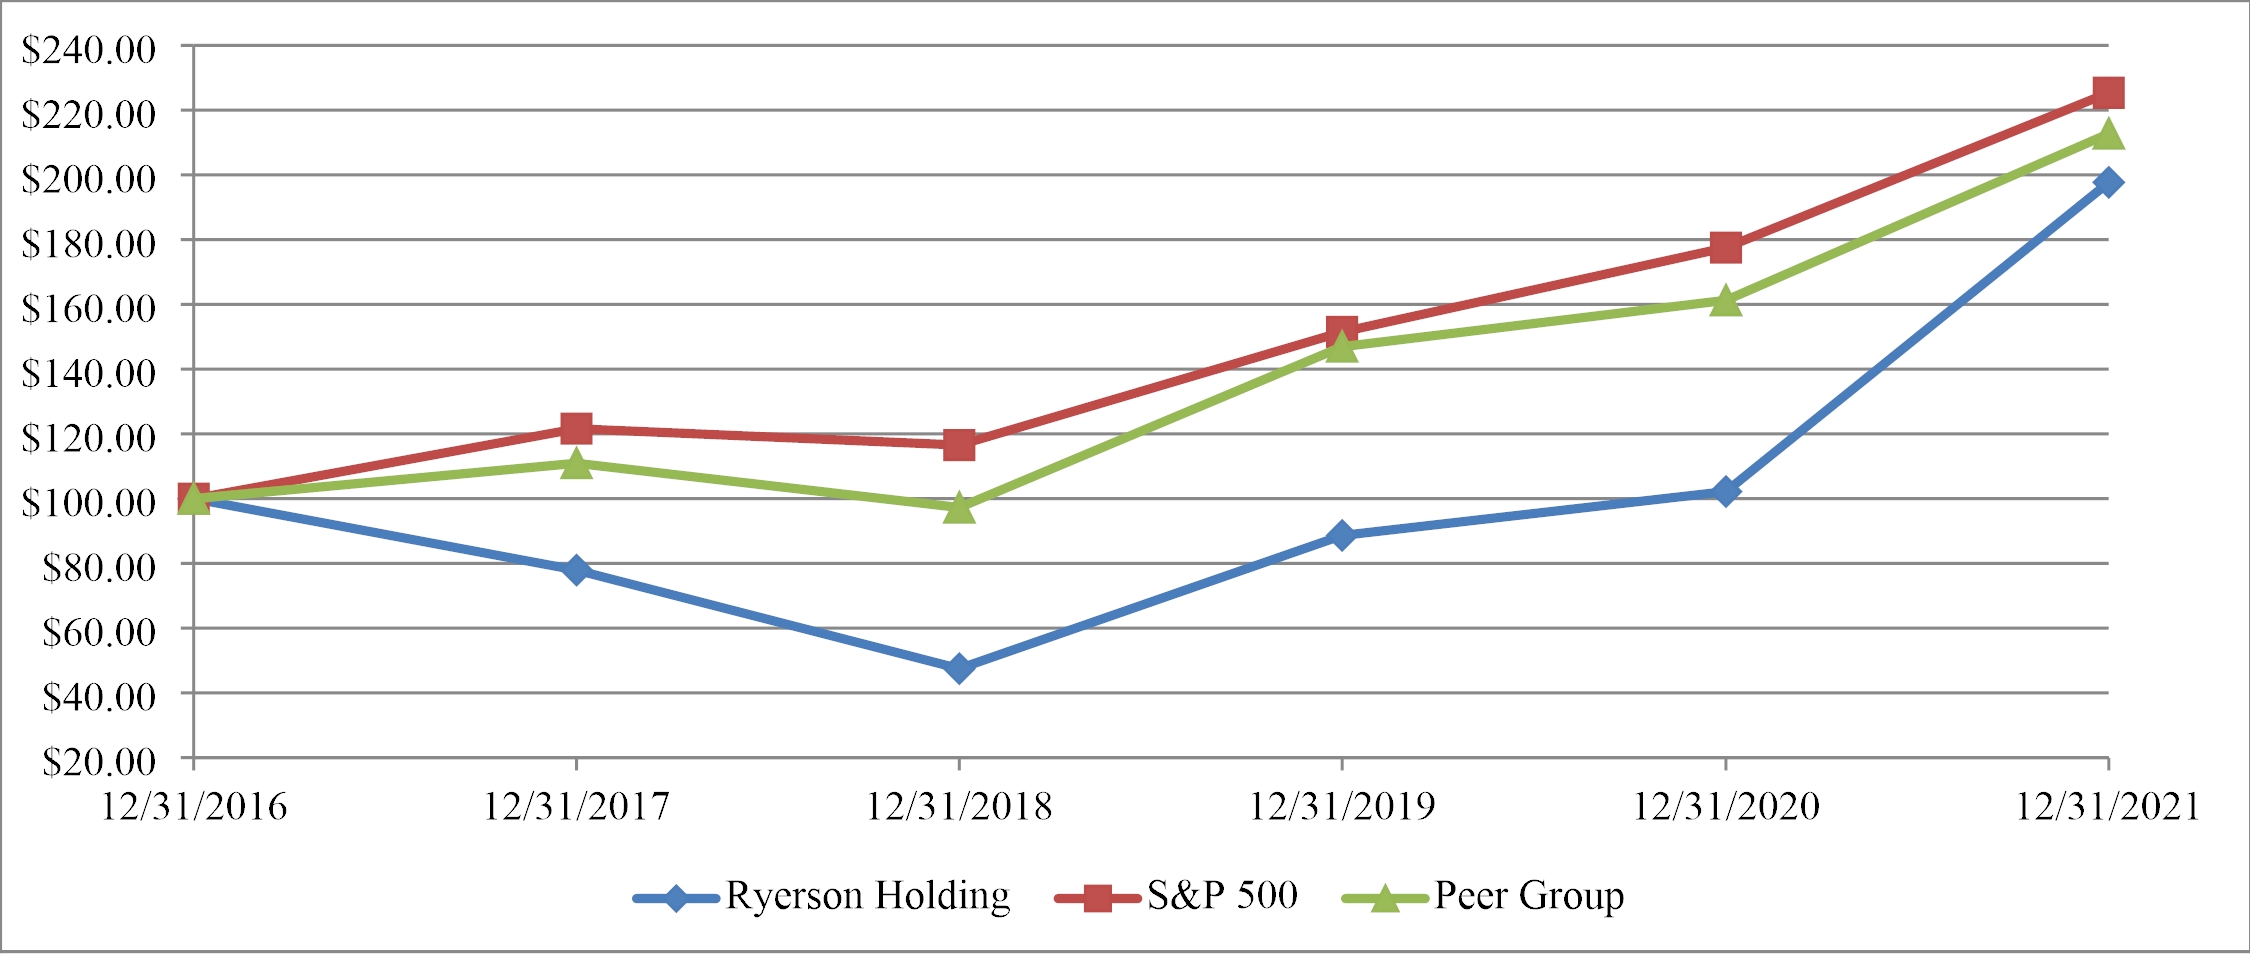

This graph is not deemed to be “filed” with the SEC or subject to the liabilities of Section 18 of the Securities Exchange Act of 1934 (“the Exchange Act”), and should not be deemed to be incorporated by reference into any of our prior or subsequent filings under the Securities Act of 1933 or the Exchange Act.
| 12/31/18 |
| 12/31/19 |
| 12/31/20 |
| 12/31/21 |
| 12/31/22 |
| 12/31/23 |
| ||||||
Ryerson Holding | $ | 100.00 |
| $ | 192.67 |
| $ | 222.15 |
| $ | 427.04 |
| $ | 504.40 |
| $ | 588.08 |
|
S&P 500 | $ | 100.00 |
| $ | 132.78 |
| $ | 156.34 |
| $ | 199.56 |
| $ | 164.85 |
| $ | 205.25 |
|
Peer Group | $ | 100.00 |
| $ | 152.67 |
| $ | 166.30 |
| $ | 217.74 |
| $ | 258.47 |
| $ | 359.06 |
|
| 12/31/16 |
| 12/31/17 |
| 12/31/18 |
| 12/31/19 |
| 12/31/20 |
| 12/31/21 |
| ||||||
Ryerson Holding | $ | 100.00 |
| $ | 77.93 |
| $ | 47.51 |
| $ | 88.64 |
| $ | 102.20 |
| $ | 197.70 |
|
S&P 500 | $ | 100.00 |
| $ | 121.61 |
| $ | 116.56 |
| $ | 151.49 |
| $ | 177.56 |
| $ | 225.37 |
|
Peer Group | $ | 100.00 |
| $ | 110.34 |
| $ | 94.62 |
| $ | 146.71 |
| $ | 163.00 |
| $ | 216.47 |
|
28
Purchases of Equity Securities by the Issuer and Affiliated Purchasers
On August 4, 2021, our3, 2022, the Board of Directors authorized a new $75 million share repurchase program that permitsafter the purchase of up to $50 millionexhaustion of the Company’s outstanding sharesprevious share repurchase program. On May 1, 2023, the Board of common stock. The authorization is effective through August 4, 2023, unless terminated.Directors authorized an increase to $100.0 million and extended the program to April 2025. Under the share repurchase program, management is not obligated to repurchase shares, but has discretion in determining the conditions under which shares may be purchased from time to time. We may opportunistically repurchase shares through open market purchases, privately negotiated transactions, and transactions structured through investment banking institutions under plans relying on Rule 10b5-1 or Rule 10b-18 promulgated under the Securities Exchange Act of 1934, as amended. Repurchased shares are reverted to the status of Treasury Stock. During the year ended December 31, 2021,2023, we repurchased 80,4323,253,313 shares at an average cost of $22.39$35.00 per share, or $1.8$113.9 million in total. AsFollowing the increase in the share repurchase program to $100 million on May 1, 2023, we have repurchased $60.6 million in shares and $39.4 million remains outstanding as of December 31, 2021, we had remaining authorization to purchase an additional $48.2 million of shares.2023.
Our share repurchase activity during the three months ended December 31, 20212023 was as follows:
Period |
| Total Number of Shares Purchased |
|
| Average Price Paid per Share |
|
| Total Number of Shares Purchased as Part of Publicly Announced Program |
|
| Maximum Dollar Value of Shares that May Yet be Purchased under the Program |
| ||||||
|
| (In millions, except shares and per share data) |
| |||||||||||||||
October 1, 2021 - October 31, 2021 |
|
| 41,505 |
|
| $ | 22.46 |
|
|
| 41,505 |
|
| $ | 48.2 |
| ||
November 1, 2021 - November 30, 2021 |
|
| — |
|
|
| — |
|
|
| — |
|
|
| 48.2 |
| ||
December 1, 2021 - December 31, 2021 |
|
| — |
|
|
| — |
|
|
| — |
|
|
| 48.2 |
| ||
|
|
| 41,505 |
|
|
|
|
|
|
| 41,505 |
|
|
|
|
| ||
Period |
| Total Number of Shares Purchased |
|
| Average Price Paid per Share |
|
| Total Number of Shares Purchased as Part of Publicly Announced Program |
|
| Maximum Dollar Value of Shares that May Yet be Purchased under the Program |
| ||||
|
| (In millions, except shares and per share data) |
| |||||||||||||
October 1, 2023 - October 31, 2023 |
|
| 100,329 |
|
| $ | 27.96 |
|
|
| 100,329 |
|
| $ | 42.9 |
|
November 1, 2023 - November 30, 2023 |
|
| 81,736 |
|
|
| 28.89 |
|
|
| 81,736 |
|
|
| 40.5 |
|
December 1, 2023 - December 31, 2023 |
|
| 37,549 |
|
|
| 30.49 |
|
|
| 37,549 |
|
|
| 39.4 |
|
|
|
| 219,614 |
|
|
|
|
|
| 219,614 |
|
|
|
| ||
Recent Sale of Unregistered Securities and Use of Proceeds
None.
ITEM 6. RESERVED.
29 |
|
ITEM 7. MANAGEMENT’S DISCUSSION AND ANALYSIS OF FINANCIAL CONDITION AND RESULTS OF OPERATIONS.
|
|
The following discussion and analysis should be read in conjunction with the audited Consolidated Financial Statements of Ryerson Holding Corporation and Subsidiaries and the Notes thereto in Item 8. “Financial Statements and Supplementary Data.” This discussion contains forward-looking statements that involve risks and uncertainties. See the section entitled “Special Note Regarding Forward-Looking Statements.” Our actual results and the timing of selected events could differ materially from those discussed in these forward-looking statements as a result of certain factors, including those discussed in Item 1A. “Risk Factors” and elsewhere in this Form 10-K.
This section of this Form 10-K generally discusses 20212023 and 20202022 items and year-over-year comparisons between 20212023 and 2020.2022. Discussions of 20192021 items and year-over-year comparisons between 20202022 and 20192021 that are not included in this Form 10-K can be found in “Management’s Discussion and Analysis of Financial Condition and Results of Operations” in Part II, Item 7 of the Company’s Annual Report on Form 10-K for the fiscal year ended December 31, 2020.2022.
Overview
Business
Ryerson Holding Corporation (“Ryerson Holding”), a Delaware corporation, is the parent company of Joseph T. Ryerson & Son, Inc. (“JT Ryerson”), a Delaware corporation. Affiliates of Platinum Equity, LLC (“Platinum”) own approximately 21,037,5003,924,478 shares of our common stock, which is approximately 55%11.5% of our issued and outstanding common stock.
We are a leading metals service center, value-added processor and distributor of industrial metals with operations in the United States ("U.S.") through JT Ryerson and other U.S. subsidiaries, in Canada through our indirect wholly-owned subsidiary Ryerson Canada, Inc., a Canadian corporation (“Ryerson Canada”), and in Mexico through our indirect wholly-owned subsidiary Ryerson Metals de Mexico, S. de R.L. de C.V., a Mexican corporation (“Ryerson Mexico”). In addition to our North American operations, we conduct metal processing and distribution operations in China through an indirect wholly-owned subsidiary, Ryerson China Limited, a Chinese limited liability company (“Ryerson China”). Unless the context indicates otherwise, Ryerson Holding, JT Ryerson, Ryerson Canada, Ryerson China,Mexico, and Ryerson Mexico,China together with their subsidiaries, are collectively referred to herein as “Ryerson,” “we,” “us,” “our,” or the “Company.”
Industry and Operating Trends
We are a metals service center providing value-added processing and distribution of industrial metals with operations in the United States,U.S., Canada, Mexico, and China. We purchase large quantities of metal products from primary producers and sell these materials in smaller quantities to a wide variety of metals-consuming industries. We carry a full line of nearlyapproximately 75,000 products in stainless steel, aluminum, carbon steel, and alloy steels and a limited line of nickel and red metals in various shapes and forms. In addition to our metals products, we offer numerous value-added processing and fabrication services, and nearly 80% of the metals products we sell are processed by us by bending, beveling, blanking, blasting, burning, cutting-to-length, drilling, embossing, flattening, forming, grinding, laser cutting, machining, notching, painting, perforating, polishing, punching, rolling, sawing, scribing, shearing, slitting, stamping, tapping, threading, welding, or other techniques to process materials to a specified thickness, length, width, shape, and surface quality pursuant to specific customer orders.
Similar to other metals service centers, we maintain substantial inventories of metals to accommodate the short lead times and just-in-time delivery requirements of our customers. Accordingly, we purchase metals to maintain our inventory at levels that we believe to be appropriate to satisfy the anticipated needs of our customers based upon customer forecasts, historic buying practices, supply agreements with customers, mill lead times, and market conditions. Our commitments to purchase metals are generally at prevailing market prices in effect at the time we place our orders. At the request of our customers, we have entered into swaps in order to mitigate our customers’ risk of volatility in the price of metals and we have entered into metals hedges to mitigate our own risk of volatility in the price of metals. We have no long-term, fixed-price metals purchase contracts. When metals prices decline, customer demands for lower prices and our competitors’ responses to those demands could result in lower sale prices and, consequently, lower gross profits and earnings as we sell existing metals inventory. When metals prices increase, competitive conditions will influence how much of the price increase we may pass on to our customers.
The metals service center industry is cyclical and volatile in both demand and pricing, and difficult to predict. In 2021,2023, Ryerson experienced both stronger pricing and demand compared to 2020, witha decline in average selling prices 57.0%of 15.7% and a decline in shipments of 4.2% when compared to 2022 as the period was characterized by normalizing global supply and declining demand during 2023, with higher inflation and shipments 4.3% higher, as steel supply was limited throughout much of the year while end-market demand was strong.high interest rates contributing to slower economic conditions for industrial manufacturing. Changes in average selling
prices are primarily driven by commodity metals prices, which impact Ryerson’s selling prices over the subsequent three to six-month period.
30
Throughout 2021,2023, indicators in the key steel industry end markets that had previously reported weakness as a result of the COVID-19 pandemic, reported growth.contraction in industrial activity. This is evidenced by the Institute for Supply Management’s Purchasing Managers’ Index (“PMI”), which reported strength in each month ofcontracting activity during the year with readings abovebelow the growth threshold of 50%, indicating general expansiona slowdown in factory activity. This strength has continued into 2022 with a January reading of 57.6, which marks the twentieth consecutive month of expansion. Similarly, U.S. Industrial Production, which reports year-over-year industrial sector business output, reported low or slowing growth in output for most of the eleventh consecutive month in January 2022.year.
According to the Metal Service Center Institute, North American service center volumes increased by 7.6%1.5% in 20212023 compared to 2020. 2022. On a North American basis, this volume growth outpaced Ryerson’s, as Ryerson’sRyerson's North American volumes increased by 4.5%declined 4.8% over the same period. Ryerson’sWhile most sectors experienced declines in volumes, Ryerson experienced demand growth was experienced most significantly in HVAC, commercial ground transportation and construction sectorsoil & gas on a year-over-year basis.
COVID-19
At this time, our business, financial results, and the business of our customers continue to be impacted by COVID-19, including economic pressures, as well as supply chain disruptions and tightness stemming from COVID-19. This is perpetuated by increasing demand momentum. There is uncertainty in the nature and degree of COVID-19’s continued effects over time. Meanwhile, we remain committed to ensuring the safety of our employees and protecting the health and well-being of the communities in which we operate. We continue to operate our business under COVID-19 safety policies until we are certain that related risks have subsided.2023 Performance
2021 Performance Highlights
These key metrics illustrate Ryerson’s financial performance for the full year 20212023 compared to 2020:2022:
$5.7B |
|
| 20.2% |
|
| $294M |
| |||||||||||||||
$5.1B |
|
| 20.0% |
|
| $146M |
| |||||||||||||||
Total Revenues | Total Revenues |
|
| Gross Margin |
| Net Income Attributable to Ryerson Holding Corporation |
| Total Revenues |
| Gross Margin |
| Net Income Attributable to Ryerson Holding Corporation | ||||||||||
| 64% increase |
|
|
230bps increase |
|
| $360M increase | 19% decrease |
|
| 70bps decrease |
|
| $245M decrease | ||||||||
|
|
|
|
|
|
| ||||||||||||||||
$7.56 |
|
| $7.46 |
|
| $35M |
| |||||||||||||||
$4.10 |
|
| $4.08 |
|
| $365M |
| |||||||||||||||
Diluted EPS | Diluted EPS |
|
| Adjusted Diluted EPS |
| Cash from Operating Activities | Diluted EPS |
| Adjusted Diluted EPS |
| Cash from Operating Activities | |||||||||||
| $9.29 increase |
|
| $7.54 increase |
|
| $243M decrease | $6.11 decrease |
|
| $6.46 decrease |
|
| $136M decrease | ||||||||
A reconciliation of diluted EPS to adjusted diluted EPS is provided below.
Domestic steel demand was strongLower commodity prices and slower economic conditions in 2021 while supply remained limited throughout much of the year, driving significant increasesmetals markets in average selling prices. Compared to 2020,2023 caused lower average selling prices increasedand lower volumes. Compared to 2022, average selling prices decreased by 57.0%15.7% and tons shipped increaseddecreased by 4.3%4.2%, resulting in a year-over-year revenue increasedecrease of 63.7%19.2%. Gross margin expandedcontracted by 23070 bps from 20202022 as rapidly increasingdecreasing market prices, and therefore selling prices, outpaced the decrease in inventory costs. Warehousing, delivery, selling, general, and administrative expenses for 20212023 increased by $156.9$58.3 million compared to 20202022 driven primarily by inclusion of operating expenses from companies acquired in 2022 and 2023 and increased variable compensation. However, expensesreorganization costs, primarily due to increased system conversion activity as a percentage of sales decreased from 16.0% to 12.5%well as the Company effectively managed inflationary pressures in labor, logistics, and operating supplies. As a resultstart up costs associated with our new state of the Company’s exceptional performance amidst the year’s supportive conditions, weart University Park location. We generated record net income attributable to Ryerson Holding Corporation of $294.3$145.7 million, or $7.56$4.10 per diluted share, in 2021.2023. This compares to a net lossincome attributable to Ryerson Holding Corporation of $65.8$391.0 million, or a lossearnings of $1.73$10.21 per diluted share, for 2020.2022. The year over year decreases are a result of the decline in commodity prices and slower economic conditions,
31
To provide greater insight into the Company’s 20212023 operating trends apart from the year’s one-time transactions, Ryerson provides adjusted net income (loss) and adjusted diluted adjusted earnings (loss) per share figures, which are not U.S. generally accepted accounting principles (“GAAP”) financial measures, to compliment the reported GAAP net income (loss) and diluted earnings (loss) per share figures. Management uses these metrics to assess year-over-year performance excluding non-recurring transactions. Adjusted net income (loss) and adjusted diluted earnings (loss) per share do not represent, and should not be used as a substitute for, net income or earnings per share determined in accordance with GAAP. Illustrated in the below table, the 20212023 net income attributable to Ryerson Holding Corporation of $294.3$145.7 million includes a $109.6$0.8 million curtailment gain related to various retirement benefit plans. After adjusting for this non-core business transaction and the sale-leaseback transactions
completed duringrelated income taxes, the year. It also includes $5.5adjusted net income attributable to Ryerson Holding Corporation for 2023 is $145.1 million, a decrease of $258.5 million compared to the prior year’s adjusted net income attributable to Ryerson Holding Corporation of $403.6 million which included $21.3 million of expenses related to the redemption of $100.0$300.0 million of the 8.50% senior secured notes due 2028 (the “2028 Notes”), which was enabled bya $3.8 million gain on the sale-leaseback transaction proceeds, as well assale of assets, and a $50$0.6 million redemption utilizing cash on hand. Both of these 2028 Notes redemptions were exercised in-line with the optional redemption features secured in the Company’s 2020 bond issuance. 2021 net income additionally includes $98.3 million of nonrecurring pension settlement expenses driven by the third quarter partial annuitization of our pension liabilities. See “Pension Funding” discussion below for further details on this transaction. After adjusting for these non-core business transactions and the related provision for income taxes, the adjusted net income attributable to Ryerson Holding Corporation for 2021 is $290.0 million, an increase of $293.1 million compared to the prior year’s adjusted net loss attributable to Ryerson Holding Corporation of $3.1 million which included adjustments for restructuring and other charges, loss on retirement of debtbargain purchase gain related to the redemption price paid to creditors as well as unamortized debt issuance costs written off related to the refinanceacquisition of the 11.0% Senior Secured Notes, pension settlement charges related to a partial annuitization of pension liabilities, and a lump sum settlement offering in 2020,Ford Tool Steels, Inc., and related income taxes.
(Dollars and shares in millions, except per share data) |
| 2021 |
| 2020 |
Net income (loss) attributable to Ryerson Holding Corporation | $ | 294.3 | $ | (65.8) |
Gain on sale of assets |
| (109.6) |
| — |
Restructuring and other charges |
| — |
| 2.2 |
Loss on retirement of debt |
| 5.5 |
| 17.7 |
Pension settlement charge |
| 98.3 |
| 64.6 |
Provision (benefit) for income taxes |
| 1.5 |
| (21.8) |
Adjusted net income (loss) attributable to Ryerson Holding Corporation | $ | 290.0 | $ | (3.1) |
Diluted earnings (loss) per share | $ | 7.56 | $ | (1.73) |
Adjusted diluted earnings (loss) per share |
| 7.46 |
| (0.08) |
Shares outstanding - diluted |
| 38.9 |
| 38.0 |
(Dollars and shares in millions, except per share data) |
| 2023 |
|
| 2022 |
| ||
Net income attributable to Ryerson Holding Corporation |
| $ | 145.7 |
|
| $ | 391.0 |
|
Gain on bargain purchase |
|
| — |
|
|
| (0.6 | ) |
Gain on sale of assets |
|
| — |
|
|
| (3.8 | ) |
Loss on retirement of debt |
|
| — |
|
|
| 21.3 |
|
Benefit plan curtailment gain |
|
| (0.8 | ) |
|
| — |
|
Provision (benefit) for income taxes |
|
| 0.2 |
|
|
| (4.3 | ) |
Adjusted net income attributable to Ryerson Holding Corporation |
| $ | 145.1 |
|
| $ | 403.6 |
|
Diluted earnings per share |
| $ | 4.10 |
|
| $ | 10.21 |
|
Adjusted diluted earnings per share |
| $ | 4.08 |
|
| $ | 10.54 |
|
Shares outstanding - diluted |
|
| 35.6 |
|
|
| 38.3 |
|
Ryerson generated cash from operating activities of $35$365.1 million in 2021,2023, a decrease compared to $278$501.2 million generated in 2020 driven by increased working capital requirements amidst recovering demand2022. The decrease in cash generation year over year is primarily due to lower net income generation. See further details within the the section titled "Liquidity and rising costs in the industry.Capital Resources" within this Item.
Ryerson’s 20212023 Strategy Achievements
Ryerson’s market strategy focuses on providing excellent customer experiences consistently with speed at scale. Our culture is based on our trademarked “say yes, figure it out” mantra as we strive to grow volume and sustainably expand margins by increasing our fabrication business, transactional sales and improving our speed through our use of both tools and analytics.
Ryerson’s financial strategy includes a focus on generating strong cash from operating activities enabled by industry-leading working capital management and an improved throughcontinuously improving a “through the cyclecycle” operating model in order to effectively decrease both net debtmaintain a strong balance sheet, re-invest in the growth of the business, and fixed cash commitments. In 2021, the Company continuedgenerate returns to progress its financial strategy and recorded several milestone achievements. shareholders.
During the year, Ryerson successfully executed sale-leaseback transactions pursuant to which the Company sold thirteen propertiesinvested in optimizing its service center network through organic growth investments as well as strategic acquisitions. In 2023, Ryerson’s newly constructed 214,000 square foot service center facility in Centralia, Washington became fully operational, which serves the Pacific Northwest market and generated proceedsfeatures advanced processing capabilities for sheet, plate, and long products. Over the year, Ryerson also progressed with construction on a 900,000 square foot service center facility for its wholly-owned subsidiary, Central Steel & Wire Company, located in University Park, IL, which will feature expanded bar and tube processing capabilities and is expected to be operational by the second quarter of $163 million. The2024.
In addition, Ryerson augmented its service center network through the acquisition of four companies, BLP Holdings, LLC ("BLP"), Norlen Incorporated ("Norlen"), TSA Processing ("TSA"), and Hudson Tool Steel Corporation ("Hudson"). These acquisitions bolster value-added processing capabilities in custom engineering and robotic manufacturing, broaden supply chain networks and service points, and diversify Ryerson’s transactional customer portfolio to secular end markets, which include HVAC, Agriculture, Oil & Gas, and Aerospace-related applications. Please refer to the section titled "Acquisitions" within this Item as well as Note 2 — “Acquisitions” of Part II, Item 8 "Financial Statements and Supplementary Data" for further consolidated information on our 2023 acquisitions.
During 2023, the Company subsequently utilized the proceeds to redeem $100repurchased $113.9 million of its 2028 Notes.common stock including the repurchase of 2.9 million shares from its largest shareholder, Platinum Equity. Overall, Platinum Equity's sale of shares increased the share free float to 88.5% of shares outstanding, up from 57% as of December 31, 2022. As of May 1, 2023, $20 million of $75 million remained under the existing share repurchase authorization and the Board of Directors authorized increasing and extending the Company's share repurchase program by $80.0 million to $100.0 million expiring in April 2025. Throughout the year, Ryerson’s Board of Directors increased the quarterly cash dividend consecutively across all four quarters, and returned $24.8 million to shareholders in the form of dividends. In addition2023, through share repurchases and dividends, Ryerson returned approximately $139 million to this redemption,shareholders.
32
In December of 2023, Ryerson also redeemed another $50published its second Sustainability Report, which describes the Company’s commitment to making meaningful progress in five key focus areas: diversity, equity and inclusion, energy and emissions, talent and future workforce, circular economy, and data security. Additionally, the report highlights Ryerson’s scope 1 and 2 emissions, relative emissions comparisons to metals and distribution peers, commitment to employee safety and continued outperformance of industry average OSHA rates, as well as initiatives by the Company’s talent management office to develop its workforce.
In 2023, the Company progressed in its financial strategy. In adherence with a core pillar of our financial priorities announced at our investor day in 2022, we maintained our leverage ratio within the target range between 0.5x to 2.0x throughout the year. In recognition of the Company’s substantial reduction in debt in 2022, achieved by retiring the remaining $300 million of the 2028 Notes, at a price of 103%. After these partial redemptions, $300 million aggregate principal amount of the 2028 Notes remains outstanding, a decrease of 40% compared to the $500 million in original principal issued in July of 2020. This $200 million reduction in the Notes decreased the Company’s annual interest expense by $17 million. As a result of the Notes redemptions, total debt decreased from $740 million as of December 31, 2020 to $639 million as of December 31, 2021 and net debt (defined as total debt less cash and cash equivalents, and restricted cash from sales of property, plant, and equipment) decreased from $679 million to $588 million. Net debt is not a GAAP financial measure. We believe that net debt provides a clearer perspective of the Company’s overall debt situation. Net debt should not be used as a substitute for total debt outstanding as determined in accordance with GAAP. A reconciliation of debt to net debt is provided with the “Liquidity and Capital Resources” discussion below.
In addition, Ryerson furthered its financial transformation by completing another partial pension obligation annuitization in the third quarter of 2021. This $206 million annuitization not only reduced the Company’s legacy liability risks but is also expected to yield economic savings of approximately $5 million on a net present value basis.
In August, Ryerson’s Board of Directors declared a first-time quarterly cash dividend of $0.08 per share of common stock which was paid on September 16, 2021. At the same time, the Board also approved a share repurchase program authorizing the Company to purchase up to an aggregate of $50 million of the Company’s common stock over the following two years. These additions to Ryerson’s capital allocation plan reflect the Company’s commitment of delivering value to shareholders and underscore its confidence in its transformed balance sheet and improved operating model while also providing the ability to purchase shares below intrinsic value. Further underscoring this commitment and confidence, Ryerson’s Board of Directors approved a half-cent increase to the dividend in November 2021. The Company distributed this increased dividend of $0.085 per share of common stock to
holders on December 16, 2021. As of December 31, 2021, the Company had repurchased approximately 80,000 shares at an average price of $22.46, resulting in a return to shareholders of approximately $1.8 million. Combined with distributed dividend payments, Ryerson returned a total of $8.2 million to shareholders in 2021.
In recognition of the Company’s substantially reduced debt, Ryerson received a credit upgradesupgrade from eachFitch in February of 2023. Two of its covering agencies also gave the Company an upgrade in 2021.2022. Moody’s upgraded Ryerson’s corporate rating to B1Ba3 from B2,B1, Standard & Poor’s (“S&P”) upgraded it to B+BB- from B,B+, and Fitch issued an upgrade to BB-BB from B+.BB-. The following table summarizes the Company’s current ratings by agency as of December 31, 2021.agency.
Agency | Corporate | Revolving Credit Facility |
| Outlook |
Moody's |
|
|
| Stable |
S&P |
| N/A |
| Stable |
Fitch |
|
|
| Stable |
As a result of the July 2020 bond refinance and subsequent debt reductions, cash interest payments in 2021 totaled $51 million, compared to $62 million in 2020. Pension and retiree medical contributions increased compared to the prior year to $27 million as Ryerson paid an additional $12 million of pension contributions in 2021 that were deferred from 2020 as allowed under the Coronavirus Aid, Relief, and Economic Security Act (“The CARES Act”). Additionally, given the improved operating environment of 2021, the Company increased its capital expenditure budget, driving cash contributions to maintenance capital expenditures up to $37 million for the year, which includes maintenance capital expenditures that were deferred from 2020 as spending was reduced due to uncertainties surrounding the COVID-19 pandemic. In all, fixed cash commitments totaled $115 million in 2021, an increase compared to $88 million in the previous year.
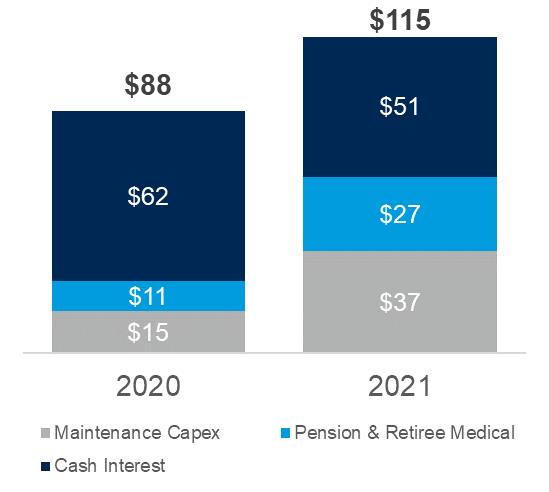
Industry Developments
On August 10, 2021, the Senate passed the Infrastructure Investment and Jobs Act, a $1.2 trillion bill which features $550 billion in new federal spending over 5 years. Included in this spending is investment in roads, bridges, passenger and freight rail, electrical grid improvements, expansion of broadband access, transit systems, infrastructure for electric vehicles, and improvements to water systems. As of the date of this report, the bill is yet to receive passage by the House of Representatives. The Company believes that the additional government spending on infrastructure projects contemplated under the Infrastructure Investment and Jobs Act, as proposed, may generate additional demand for our products especially within the industrial equipment, construction, green energy, and transportation industries. Accordingly, we would anticipate that the Infrastructure Investment and Jobs Act would be beneficial to the Company, but ultimately the impact on the Company’s operations is unclear.
On April 22, 2021, the U.S. International Trade Commission (“USITC”) confirmed the Department of Commerce’s affirmative antidumping duty determinations and injury determinations regarding US imports of common alloy aluminum sheet. As a result, the USITC has issued final antidumping duty orders on U.S. imports of common alloy aluminum sheet from the following sixteen countries: Bahrain, Brazil, Croatia, Egypt, Germany, India, Indonesia, Italy, Oman, Romania, Serbia, Slovenia, South Africa, Spain, Taiwan, and Turkey. Antidumping rates differ greatly depending on country of origin and producing mill and range from the low single digits to as high as 243%. Ryerson anticipates that the actions of the USITC will support the prices of domestically produced aluminum sheet and therefore benefit the Company’s average selling prices.
On March 1, 2018,February 24, 2023, the White HouseUS government announced trade actions targeting goods and entities from Russia, which included a 25% tariffproclamation to impose 200% ad valorem tariffs on all imported steelRussian-origin aluminum products and 10% tariff on all importedderivative products and other articles made from Russian primary aluminum products for an indefinite amount of timeor Russian aluminum castings. The duties will be imposed under Sectionsection 232 of the Trade Expansion Act (“("Section 232”232"). These tariffs, while and cited by the White House due to (1) challenges faced by US aluminum producers in effect,the face of high levels of aluminum imports and high energy prices; (2) recent increases in imports of aluminum from Russia, whose market is especially export-oriented, by 53 percent between March and July 2022; and (3) the fact that the Russian aluminum industry is a key part of Russia's defense industrial base. Ryerson has communicated to all vendors that we will not accept any Russian originating metal. The trade actions announced by the US government should support prices for Ryerson's product sales mix prices as the underlying domestic and North American supply-demand balance is protected from oversupply.
After the Russian forces invaded Ukraine on February 24, 2022, the Biden administration issued executive orders prohibiting
the importation of goods from covered regions related to Ukraine and Russia. Ryerson takes this very seriously and has reviewed our
direct and indirect material purchases to ensure compliance. On April 8, 2022, President Biden signed into law the Suspending Normal
Trade Relations with Russia and Belarus Act, which denies "most-favored nation" tariff treatment to products of Russia and Belarus
and extends the President’s authority to impose sanctions under the Global Magnitsky Human Rights Accountability Act. Beginning
April 9, 2022, the Act imposes a 10.5% import duty on unalloyed primary aluminum and 11.0% on value-add aluminum products. The
import duties are not expected to have discouraged metal imports from non-exempt countries and have had a favorablemeaningful impact on the pricesavailability of aluminum for Ryerson. In 2023, the products we sellCompany has
not purchased material from Russia or the named Ukrainian regions and our results has no open purchases orders issued to Russian suppliers as
of operations. OverDecember 31, 2023.
Acquisitions
On March 1, 2023, JT Ryerson acquired BLP. Based out of Houston, Texas, BLP is comprised of three divisions: Absolute Metal Products, Metal Cutting Specialists, and Houston Water Jet, serving various industries such as oil & gas, aerospace, telecommunications, and structural fabrication. BLP provides complex fabrication services in addition to toll processing, including saw cutting, machining, and water jet cutting. The total amount paid by JT Ryerson for the weekendacquisition amounted to $39.9 million.
On October 2, 2023, JT Ryerson acquired Norlen. Based out of October 30thSchofield, Wisconsin, Norlen is a full-service metal fabricator, providing stamping, machining, painting, and 31st, 2021,additional value-added fabrication services to industries including agriculture, HVAC, and defense. The total amount paid by JT Ryerson, net of cash acquired, for the USacquisition amounted to $30.5 million.
On November 1, 2023, JT Ryerson acquired TSA. Headquartered in Houston, Texas, with five other locations across the Midwest and European Union agreed to revise Section 232 tariffs applied to the import of EuropeanSouthern United States, TSA is a stainless steel and aluminum allowingcoil and sheet processor. The total amount paid by JT Ryerson, net of cash acquired, for the duty-free import of European steel and aluminum into the US, subjectacquisition amounted to tariff rate quotas. Specifically, the tariff rate quota includes the duty-free import of 3.3 million metric tons of steel melted and poured in the EU, 18 thousand metric tons of unwrought aluminum, and 366 thousand metric tons of semi-finished aluminum. The revision was to be applied on January 1, 2022. At this time, the scope of this agreement and its impact to Ryerson are unclear.$37.7 million.
Acquisitions33
On SeptemberDecember 1, 2021,2023, JT Ryerson acquired Specialty Metals Processing, Inc. (“SMP”), a toll processorHudson. Hudson is headquartered in Cerritos, California, with two facilities located in Stow, Ohio, for $14.0 million,the Midwest and Northeast. Hudson is a supplier of tool steels and high-speed, carbon, and alloy steels. The total amount paid by JT Ryerson, net of cash acquired. SMP processesacquired, for the acquisition amounted to $19.4 million.
Additionally, during the first six months of 2023, JT Ryerson completed the purchase of certain assets from ExOne Operating, LLC. The total amount paid by JT Ryerson for the acquired assets was $9.7 million.
The 2023 acquisitions strengthen and expand JT Ryerson's valued-add services within our industry-leading stainless and aluminum franchises as well as our tool steel aluminum, titanium,capabilities which will allow us to increase our offerings to better serve our diverse customer base across our entire network. The 2023 acquisitions are not individually significant to the consolidated financial statements. Please refer to Note 2 — “Acquisitions” of Part II, Item 8 "Financial Statements and nickel alloy products in a variety of industries including aerospace. SMP's expertise in buffing, grinding, and polishing finishes adds to Ryerson's value-added processing capabilities.Supplementary Data" for further consolidated information on our 2023 acquisitions.
Components of Results of Operations
We generate substantially all of our revenue from sales of our metals products. The majority of revenue is recognized upon delivery of product to customers. The timing of shipment is substantially the same as the timing of delivery to customers given the proximity of our distribution sites to our customers. Revenues associated with products which we believe have no alternative use, and where the Company has an enforceable right to payment, are recognized on an over-time basis. Over-time revenues are recorded in proportion with the progress made toward completing the performance obligation.
Sales, cost of materials sold, gross profit, and operating expense control are the principal factors that impact our profitability:
Net Sales. Our sales volume and pricing are driven by market demand, which is largely determined by overall industrial production and conditions in specific industries in which our customers operate. Sales prices are also primarily driven by market factors such as overall demand and availability of product. Our net sales include revenue from product sales, net of returns, allowances, customer discounts, and incentives.
Cost of materials sold. Cost of materials sold includes metal purchase and in-bound freight costs, third-party processing costs, and direct and indirect internal processing costs. The cost of materials sold fluctuates with our sales volume and our ability to purchase metals at competitive prices. Increases in sales volume generally enable us to improve purchasing leverage with suppliers as we buy larger quantities of metals inventories.
Gross profit. Gross profit is the difference between net sales and the cost of materials sold. Our sales prices to our customers are subject to market competition. Achieving acceptable levels of gross profit is dependent on our acquiring metals at competitive prices, our ability to manage the impact of changing prices, and efficiently managing our internal and external processing costs.
Operating expenses. Optimizing business processes and asset utilization to lower fixed expenses such as employee, facility, and truck fleet costs, which cannot be rapidly reduced in times of declining volume, and maintaining low fixed cost structure in times of increasing sales volume, have a significant impact on our profitability. Operating expenses include costs related to warehousing and distributing our products as well as selling, general, and administrative expenses.
34
Results of Operations
The following table sets forth our condensed consolidated statementsConsolidated Statements of operations data:Operations data (certain percentages may not calculate due to rounding):
|
| Year Ended December 31, 2023 |
|
| % of Net |
|
| Year Ended December 31, 2022 |
|
| % of Net |
| ||||
Net sales |
| $ | 5,108.7 |
|
|
| 100.0 | % |
| $ | 6,323.6 |
|
|
| 100.0 | % |
Cost of materials sold |
|
| 4,087.1 |
|
|
| 80.0 |
|
|
| 5,013.5 |
|
|
| 79.3 |
|
Gross profit |
|
| 1,021.6 |
|
|
| 20.0 |
|
|
| 1,310.1 |
|
|
| 20.7 |
|
Warehousing, delivery, selling, general, and |
|
| 793.5 |
|
|
| 15.5 |
|
|
| 735.2 |
|
|
| 11.6 |
|
Gain on sale of assets |
|
| — |
|
|
| — |
|
|
| (3.8 | ) |
|
| (0.1 | ) |
Operating profit |
|
| 228.1 |
|
|
| 4.5 |
|
|
| 578.7 |
|
|
| 9.2 |
|
Other expenses |
|
| (34.4 | ) |
|
| (0.7 | ) |
|
| (55.8 | ) |
|
| (0.9 | ) |
Income before income taxes |
|
| 193.7 |
|
|
| 3.8 |
|
|
| 522.9 |
|
|
| 8.3 |
|
Provision for income taxes |
|
| 47.3 |
|
|
| 0.9 |
|
|
| 131.4 |
|
|
| 2.1 |
|
Net income |
|
| 146.4 |
|
|
| 2.9 |
|
|
| 391.5 |
|
|
| 6.2 |
|
Less: Net income attributable to noncontrolling interest |
|
| 0.7 |
|
|
| — |
|
|
| 0.5 |
|
|
| — |
|
Net income attributable to Ryerson |
| $ | 145.7 |
|
|
| 2.9 | % |
| $ | 391.0 |
|
|
| 6.2 | % |
Basic earnings per share |
| $ | 4.17 |
|
|
|
|
| $ | 10.41 |
|
|
|
| ||
Diluted earnings per share |
| $ | 4.10 |
|
|
|
|
| $ | 10.21 |
|
|
|
| ||
|
| Year Ended December 31, 2021 |
|
| % of Net Sales |
|
| Year Ended December 31, 2020 |
|
| % of Net Sales |
| ||||
Net sales |
| $ | 5,675.3 |
|
|
| 100.0 | % |
| $ | 3,466.6 |
|
|
| 100.0 | % |
Cost of materials sold |
|
| 4,528.5 |
|
|
| 79.8 |
|
|
| 2,845.5 |
|
|
| 82.1 |
|
Gross profit |
|
| 1,146.8 |
|
|
| 20.2 |
|
|
| 621.1 |
|
|
| 17.9 |
|
Warehousing, delivery, selling, general, and administrative expenses |
|
| 711.2 |
|
|
| 12.5 |
|
|
| 554.3 |
|
|
| 16.0 |
|
Gain on sale of assets |
|
| (109.6 | ) |
|
| (1.9 | ) |
|
| — |
|
|
| — |
|
Restructuring and other charges |
|
| — |
|
|
| — |
|
|
| 2.2 |
|
|
| — |
|
Operating profit |
|
| 545.2 |
|
|
| 9.6 |
|
|
| 64.6 |
|
|
| 1.9 |
|
Other expenses |
|
| (156.1 | ) |
|
| (2.7 | ) |
|
| (154.7 | ) |
|
| (4.5 | ) |
Income (loss) before income taxes |
|
| 389.1 |
|
|
| 6.9 |
|
|
| (90.1 | ) |
|
| (2.6 | ) |
Provision (benefit) for income taxes |
|
| 93.7 |
|
|
| 1.7 |
|
|
| (24.8 | ) |
|
| (0.7 | ) |
Net income (loss) |
|
| 295.4 |
|
|
| 5.2 |
|
|
| (65.3 | ) |
|
| (1.9 | ) |
Less: Net income attributable to noncontrolling interest |
|
| 1.1 |
|
|
| — |
|
|
| 0.5 |
|
|
| — |
|
Net income (loss) attributable to Ryerson Holding Corporation |
| $ | 294.3 |
|
|
| 5.2 | % |
| $ | (65.8 | ) |
|
| (1.9 | )% |
Basic earnings (loss) per share |
| $ | 7.67 |
|
|
|
|
|
| $ | (1.73 | ) |
|
|
|
|
Diluted earnings (loss) per share |
| $ | 7.56 |
|
|
|
|
|
| $ | (1.73 | ) |
|
|
|
|
35
The following charts show the Company’s percentage of sales by major product lines for 20212023 and 2020:
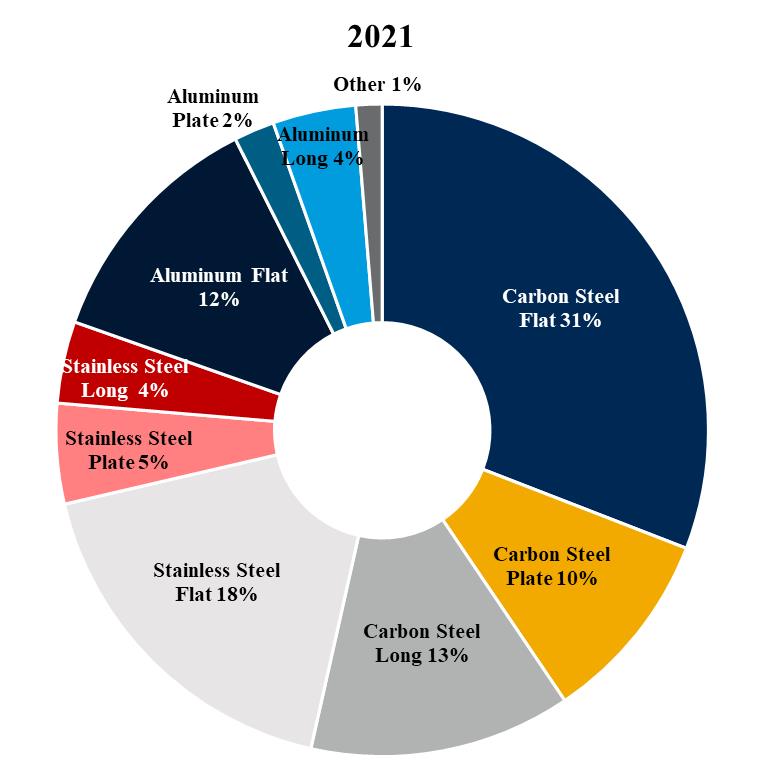


Comparison of the year ended December 31, 20212023 with the year ended December 31, 20202022
Net Sales
|
| Year Ended December 31, |
|
| Dollar |
|
| Percentage |
|
| Year Ended December 31, |
|
| Dollar |
| Percentage |
| |||||||||||||||
|
| 2021 |
|
| 2020 |
|
| change |
|
| change |
|
| 2023 |
|
| 2022 |
|
| change |
|
| change |
| ||||||||
|
| ($ in millions) |
|
| ($ in millions) |
| ||||||||||||||||||||||||||
Net sales |
| $ | 5,675.3 |
|
| $ | 3,466.6 |
|
| $ | 2,208.7 |
|
|
| 63.7 | % |
| $ | 5,108.7 |
|
| $ | 6,323.6 |
|
| $ | (1,214.9 | ) |
|
| (19.2 | )% |
|
|
|
|
|
|
|
|
|
|
|
|
|
|
|
|
|
|
|
|
|
|
|
|
|
| |||||||
|
| Year Ended December 31, |
|
| Tons |
|
| Percentage |
|
| Year Ended December 31, |
|
| Tons |
| Percentage |
| |||||||||||||||
|
| 2021 |
|
| 2020 |
|
| change |
|
| change |
|
| 2023 |
|
| 2022 |
|
| change |
|
| change |
| ||||||||
|
| (in thousands) |
|
| (in thousands) |
| ||||||||||||||||||||||||||
Tons sold |
|
| 2,095 |
|
|
| 2,009 |
|
|
| 86 |
|
|
| 4.3 | % |
|
| 1,943 |
|
|
| 2,029 |
|
|
| (86 | ) |
|
| (4.2 | )% |
|
|
|
|
|
|
|
|
|
|
|
|
|
|
|
|
|
|
|
|
|
|
|
|
|
| |||||||
|
| Year Ended December 31, |
|
| Price |
|
| Percentage |
|
| Year Ended December 31, |
|
| Price |
| Percentage |
| |||||||||||||||
|
| 2021 |
|
| 2020 |
|
| change |
|
| change |
|
| 2023 |
|
| 2022 |
|
| change |
|
| change |
| ||||||||
Average selling price per ton sold |
| $ | 2,709 |
|
| $ | 1,726 |
|
| $ | 983 |
|
|
| 57.0 | % |
| $ | 2,629 |
|
| $ | 3,117 |
|
| $ | (488 | ) |
|
| (15.7 | )% |
Revenue for the year ended December 31, 2021, increased2023, decreased from the same period a year ago due to higherlower average selling prices caused by supply constraintslower commodity prices and to lower volume caused by slower economic conditions in metal markets in 2023. Commodity prices were at cyclical highs in 2021 and higher tons sold as metals market conditions began2022 before beginning to improvedecline in the second half of 2020 after declining sharply at the beginning of 2020 due to the global outbreak of COVID-19.2022. Compared to the year ago period, average selling price increaseddecreased for all of our product lines in 20212023 with the largest increasesdecreases in our carbon plate, carbon flat, stainless flat, and stainlesscarbon plate products. Tons sold increaseddecreased in 20212023 overall, with increasesthe largest decreases in our aluminum flat, stainless flat, aluminum long, and aluminumcarbon long product lines partially offset by decreasesan increase in our stainless, aluminum, and carbon plate aluminum plate, and stainless plate product lines.shipments. Tons sold per ship day were 8,3137,741 in 2021 as2023 compared to 7,9418,084 in 2020.2022.
36
Cost of Materials Sold
|
| Year Ended December 31, |
|
|
|
|
|
|
|
|
|
| Year Ended December 31, |
|
|
|
|
|
| |||||||||||||||||||||||||||||
|
| 2021 |
|
| 2020 |
|
|
|
|
|
|
|
|
|
| 2023 |
|
| 2022 |
|
|
|
|
|
| |||||||||||||||||||||||
|
| $ |
|
| % of Net Sales |
|
| $ |
|
| % of Net Sales |
|
| Dollar change |
|
| Percentage change |
|
| $ |
|
| % of Net |
|
| $ |
|
| % of Net |
|
| Dollar change |
|
| Percentage change |
| ||||||||||||
|
| ($ in millions) |
|
| ($ in millions) |
| ||||||||||||||||||||||||||||||||||||||||||
Cost of materials sold |
| $ | 4,528.5 |
|
|
| 79.8 | % |
| $ | 2,845.5 |
|
|
| 82.1 | % |
| $ | 1,683.0 |
|
|
| 59.1 | % |
| $ | 4,087.1 |
|
|
| 80.0 | % |
| $ | 5,013.5 |
|
|
| 79.3 | % |
| $ | (926.4 | ) |
|
| (18.5 | )% |
|
|
|
|
|
|
|
|
|
|
|
|
|
|
|
|
|
|
|
|
|
|
|
|
|
|
|
|
|
|
|
|
|
|
|
|
|
| |||||||||||
|
|
|
|
|
|
|
|
|
| Year Ended December 31, |
|
| Dollar |
|
| Percentage |
|
|
|
|
|
| Year Ended December 31, |
|
| Dollar |
| Percentage |
| |||||||||||||||||||
|
|
|
|
|
|
|
|
|
| 2021 |
|
| 2020 |
|
| change |
|
| change |
|
|
|
|
|
| 2023 |
|
| 2022 |
|
| change |
|
| change |
| ||||||||||||
Average cost of materials per ton sold |
|
|
|
|
|
|
|
|
| $ | 2,162 |
|
| $ | 1,417 |
|
| $ | 745 |
|
|
| 52.6 | % |
|
|
|
|
| $ | 2,103 |
|
| $ | 2,471 |
|
| $ | (368 | ) |
|
| (14.9 | )% | ||||
The increasedecrease in cost of materials sold in 20212023 compared to the year ago period is primarily due to an increasea decrease in average cost of materials sold per ton driven by supply constraints and the increase into lower tons sold. The average cost of materials sold increaseddecreased across all of our product lines with the average cost of materials sold for our carbon plate, carbon flat, and carbon long product lines increasingdecreasing more than our other product lines during 2021. 2023.
During 2021,2023, LIFO expenseincome was $366$98 million related to increasesdecreases in pricing for all product lines, with the largest impact from carbon products.products, slightly offset by the liquidation of older LIFO layers for stainless and aluminum products that were at a net higher cost. During 2020,2022, LIFO income was $12$58 million related to decreasesa decrease in pricing for allcarbon product lines, which was mutedpartially offset by increases in pricing in stainless and aluminum products as well as the impact of a reduction in carbon tons in inventory, which led to the liquidation of older LIFO layers that were at a higher cost.
Gross Profit
|
| Year Ended December 31, |
|
|
|
|
|
|
|
|
| |||||||||||||
|
| 2021 |
|
| 2020 |
|
|
|
|
|
|
|
|
| ||||||||||
|
| $ |
|
| % of Net Sales |
|
| $ |
|
| % of Net Sales |
|
| Dollar change |
|
| Percentage change |
| ||||||
|
| ($ in millions) |
| |||||||||||||||||||||
Gross profit |
| $ | 1,146.8 |
|
|
| 20.2 | % |
| $ | 621.1 |
|
|
| 17.9 | % |
| $ | 525.7 |
|
|
| 84.6 | % |
|
| Year Ended December 31, |
|
|
|
|
|
|
| |||||||||||||||
|
| 2023 |
|
| 2022 |
|
|
|
|
|
|
| ||||||||||||
|
| $ |
|
| % of Net |
|
| $ |
|
| % of Net |
|
| Dollar change |
|
| Percentage change |
| ||||||
|
| ($ in millions) |
| |||||||||||||||||||||
Gross profit |
| $ | 1,021.6 |
|
|
| 20.0 | % |
| $ | 1,310.1 |
|
|
| 20.7 | % |
| $ | (288.5 | ) |
|
| (22.0 | )% |
Gross profit dollars increaseddecreased in 20212023 compared to 2020 due to an increase in volume as well2022 as average selling price increasingdecreased faster than the increasedecrease in the average cost of materials sold which resultedresulting in an increasea decrease in gross margin.
Operating Expenses
|
| Year Ended December 31, |
|
|
|
|
|
|
| |||||||||||||||
|
| 2023 |
|
| 2022 |
|
|
|
|
|
|
| ||||||||||||
|
| $ |
|
| % of Net |
|
| $ |
|
| % of Net |
|
| Dollar change |
|
| Percentage change |
| ||||||
|
| ($ in millions) |
| |||||||||||||||||||||
Warehousing, delivery, selling, general, and administrative expenses |
| $ | 793.5 |
|
|
| 15.5 | % |
| $ | 735.2 |
|
|
| 11.6 | % |
| $ | 58.3 |
|
|
| 7.9 | % |
Gain on sale of assets |
| $ | — |
|
|
| — |
|
| $ | (3.8 | ) |
|
| (0.1 | )% |
| $ | 3.8 |
|
|
| (100.0 | )% |
Warehousing, delivery, selling, general, and administrative expenses increased $58.3 million in 2023 compared to 2022 with $28.4 million of the increase driven by including the expenses of companies acquired during 2022 and 2023. Excluding the impact of acquisitions, expenses changed in the following categories:
|
| Year Ended December 31, |
|
|
|
|
|
|
|
|
| |||||||||||||
|
| 2021 |
|
| 2020 |
|
|
|
|
|
|
|
|
| ||||||||||
|
| $ |
|
| % of Net Sales |
|
| $ |
|
| % of Net Sales |
|
| Dollar change |
|
| Percentage change |
| ||||||
|
| ($ in millions) |
| |||||||||||||||||||||
Warehousing, delivery, selling, general, and administrative expenses |
| $ | 711.2 |
|
|
| 12.5 | % |
| $ | 554.3 |
|
|
| 16.0 | % |
| $ | 156.9 |
|
|
| 28.3 | % |
Gain on sale of assets |
| $ | (109.6 | ) |
|
| (1.9 | )% |
| $ | — |
|
|
| — |
|
| $ | (109.6 | ) |
|
| — |
|
Restructuring and other charges |
| $ | — |
|
|
| — |
|
| $ | 2.2 |
|
|
| — |
|
| $ | (2.2 | ) |
|
| (100.0 | )% |
Total operating expenses•
37
In addition, expenses were impacted by changes in the following categories:
|
|
|
|
|
|
|
|
Partially offsetting these increases were gains on the sale and leaseback of facilities in 2021. In the first quarter of 2021,2022, we recognizedrecorded a gain on sale of assets of $20.3$3.8 million from the sale and leaseback of our Renton, Washington, facility. In the second quarter of 2021, we recognized a gain of $87.4 million on the sale-leaseback of twelve of our facilities across the United States. In the fourth quarter of 2021, we recognized a gain of $1.9 million on the sale of a purchase option for a facility in Ohio.Texas that Ryerson had an option to purchase.
In addition, reorganization costs were $9.6 million lower in 2021 compared to 2020. Included in the reorganization costs in 2020 was $3.7 million of system implementation costs and a restructuring charge of $2.2 million of severance costs for staff reductions.
On a per ton basis, total operating expenses increased to $287$408 per ton in 20212023 from $277$360 per ton in 2020.2022.
Operating Profit
|
| Year Ended December 31, |
|
|
|
|
|
|
|
|
| |||||||||||||
|
| 2021 |
|
| 2020 |
|
|
|
|
|
|
|
|
| ||||||||||
|
| $ |
|
| % of Net Sales |
|
| $ |
|
| % of Net Sales |
|
| Dollar change |
|
| Percentage change |
| ||||||
|
| ($ in millions) |
| |||||||||||||||||||||
Operating profit |
| $ | 545.2 |
|
|
| 9.6 | % |
| $ | 64.6 |
|
|
| 1.9 | % |
| $ | 480.6 |
|
|
| 744.0 | % |
|
| Year Ended December 31, |
|
|
|
|
|
|
| |||||||||||||||
|
| 2023 |
|
| 2022 |
|
|
|
|
|
|
| ||||||||||||
|
| $ |
|
| % of Net |
|
| $ |
|
| % of Net |
|
| Dollar change |
|
| Percentage change |
| ||||||
|
| ($ in millions) |
| |||||||||||||||||||||
Operating profit |
| $ | 228.1 |
|
|
| 4.5 | % |
| $ | 578.7 |
|
|
| 9.2 | % |
| $ | (350.6 | ) |
|
| (60.6 | )% |
Our operating profit increaseddecreased in 20212023 compared to 20202022 primarily due to increasesthe decrease in average selling prices and gross profit and the increase in tons sold.operating expenses as discussed above.
Other Expenses
|
| Year Ended December 31, |
|
|
|
|
|
|
|
|
|
| Year Ended December 31, |
|
|
|
|
|
| |||||||||||||||||||||||||||||
|
| 2021 |
|
| 2020 |
|
|
|
|
|
|
|
|
|
| 2023 |
|
| 2022 |
|
|
|
|
|
| |||||||||||||||||||||||
|
| $ |
|
| % of Net Sales |
|
| $ |
|
| % of Net Sales |
|
| Dollar change |
|
| Percentage change |
|
| $ |
|
| % of Net |
|
| $ |
|
| % of Net |
|
| Dollar change |
|
| Percentage change |
| ||||||||||||
|
| ($ in millions) |
|
| ($ in millions) |
| ||||||||||||||||||||||||||||||||||||||||||
Interest and other expense on debt |
| $ | (51.0 | ) |
|
| (0.9 | )% |
| $ | (76.4 | ) |
|
| (2.2 | )% |
| $ | 25.4 |
|
|
| (33.2 | )% |
| $ | (34.7 | ) |
|
| (0.7 | )% |
| $ | (33.2 | ) |
|
| (0.5 | )% |
| $ | (1.5 | ) |
|
| 4.5 | % |
Other income and (expense), net |
| $ | (0.9 | ) |
|
| — |
|
| $ | 5.3 |
|
|
| 0.1 | % |
| $ | (6.2 | ) |
|
| (117.0 | )% |
| $ | 0.3 |
|
|
| — |
|
| $ | (1.3 | ) |
|
| — |
|
| $ | 1.6 |
|
|
| (123.1 | )% |
Pension settlement charges |
| $ | (98.7 | ) |
|
| (1.7 | )% |
| $ | (65.9 | ) |
|
| (1.9 | )% |
| $ | (32.8 | ) |
|
| 49.8 | % | ||||||||||||||||||||||||
Loss on retirement of debt |
| $ | (5.5 | ) |
|
| (0.1 | )% |
| $ | (17.7 | ) |
|
| (0.5 | )% |
| $ | 12.2 |
|
|
| (68.9 | )% |
| $ | — |
|
|
| — |
|
| $ | (21.3 | ) |
|
| (0.4 | )% |
| $ | 21.3 |
|
|
| (100.0 | )% |
Interest and other expense on debt decreasedincreased in 20212023 compared to 20202022 primarily due to higher interest rates on credit facility borrowings under our $1.3 billion revolving credit facility (“the Ryerson Credit Facility”) and a higher level of borrowings outstanding under the Ryerson Credit Facility compared to the prior year. Partially offsetting this increase was the redemption and repurchase of $300.0 million principal amount of our 11.00% Senior Secured Notes due 2022 (the “2022 Notes”) which had an outstanding balance of $530.3 million at the redemption date of August 21, 2020 following the redemption of $57.6 million of the 2022 Notes during the first six months of 2020. The 2022 Notes were replaced by a lower level of debt at a lower interest rate with the issuance of $500.0 million of 8.50% senior secured notes due 2028 (the “2028 Notes”). In October 2020, $50.0 million of during 2022, bringing the 2028 Notes were redeemed andoutstanding principal balance to zero in July 2021, $150 million of the 2028 Notes were redeemed. In addition, interest and other expense on debt was lower in 2021 due to a lower level of borrowings outstanding under our $1.0 billion revolving credit facility (“the Ryerson Credit Facility”) compared to 2020 as excess funds were borrowed in 2020 to maintain access to cash during the COVID-19 pandemic.2022. Interest expense in 20212022 included a $2.8$2.6 million chargein charges to write-off unamortized bond issuance costs related to the $150.0$300.0 million of 2028 Notes redeemed in July 2021. Interest expense in 2020 included a $1.0 million charge to write-off unamortized bond issuance costs related to the $50.0 million of 2028 Notes redeemed in October 2020 and a $0.4 million charge to write-off unamortized bond issuance costs related to the $57.6 million of 2022 Notes repurchased during the first six months of 2020.2022.
The year 2021 includes a $98.7 million pension settlement loss due to the annuitization and lump-sum payouts of a portion of our pension liability and a $5.5 million loss on the repurchase of $150.0 million of the 2028 Notes. In addition, the other income and (expense), net in 20212023 includes a $2.1$0.8 million loss from the change in the fair value of an embedded derivative within the 2028 Notes indenture, and a $0.7 million credit from net periodic benefit cost other than service cost. The year 2020 includes a $65.9 million pension settlement loss due the annuitization and lump-sum buyouts of a portion of our pension liability, a $16.2 million lossgain on the repurchasecurtailment of certain Central Steel & Wire ("CSW") pension and redemptionother post-employment benefit plans. The curtailment is due to a reduction in future years of service resulting from workforce reductions at CSW as the 2022 Notes,CSW headquarters is closing and operations are moving to a $1.5 million loss on the redemption of $50.0 million of the 2028 Notes. In addition,new facility in University Park, IL. The other income and (expense), net in 2020 included a $2.32022 includes foreign currency translation losses of $1.3 million. In addition, the year 2022 includes losses of $21.3 million gain on the recognitionredemption and repurchase of $300.0 million of the fair value of an embedded derivative in the 2028 Notes indenture and a $2.1 million credit from net periodic benefit cost other than service cost. See the Pension Funding section below for further details on the transactions that resulted in the pension settlement losses in both years. Notes.
Provision for Income Taxes
The $93.7$47.3 million income tax provision in 20212023 and the $131.4 million tax provision in 2022 primarily representsrepresent taxes at federal and local statutory rates where the Company operates, but generally excludesexclude any tax benefit for losses in jurisdictions with historical losses. During 2021, the Company recorded a $1.6 million benefit as a result of releasing valuation allowances on certain state and foreign net operating losses, and a $0.8 million benefit related to the statute of limitations expiring on an uncertain tax position.
The $24.8 million income tax benefit in 2020 primarily represents taxes at federal and local statutory rates where the Company operates, but generally excludes any tax benefit for losses in jurisdictions with historical losses. During 2020, the Company recorded a benefit of $1.8 million related to the statute of limitations expiring on an uncertain tax position.
Noncontrolling Interest
In both 20212023 and 2020,2022, Ryerson China’s results of operations was income and the portion attributable to the noncontrolling interest was $1.1$0.7 million and $0.5 million, respectively.
Earnings Per Share
Basic and diluted earnings per share was $7.67$4.17 and $7.56,$4.10, respectively, in 2021.2023. Basic and diluted lossearnings per share was $1.73$10.41 and $10.21, respectively, in 2020.2022. The changes in earnings per share are due to the results of operations discussed above.above as
38
well as having fewer shares outstanding in 2023 after the repurchase in 2023 of 3,253,313 shares of common stock, including 2,882,720 shares from Platinum, in addition to the repurchase of 1,700,766 shares of common stock during 2022.
Liquidity and Capital Resources
The Company’s primary sources of liquidity are cash and cash equivalents, cash flows from operations, and borrowing availability under the Ryerson Credit Facility that matures on November 5, 2025.Facility. Our principal source of operating cash is from the sale of metals and other materials. Our principal uses of cash are for payments associated with the procurement and processing of metals and other materials inventories, costs incurred for the warehousing and delivery of inventories, the selling and administrative costs of the business, capital expenditures, and for interest payments on debt.
The global COVID-19 pandemic led to disruption and volatility in the global capital markets, which, depending on future developments, could adversely impact our capital resources and liquidity in the future. As a proactive, precautionary measure, we borrowed approximately $166 million under the Ryerson Credit Facility in the first quarter of 2020 to maintain access to cash during the COVID-19 pandemic. As of December 31, 2021, we are no longer holding excess cash due to COVID-19 concerns. We had cash and cash equivalents of $51.2$54.3 million at December 31,2023, compared to $39.2 million at December 31, 2021, compared to $61.4 million at December 31, 2020.2022. Our total debt outstanding at December 31, 2021 decreased2023 increased to $639$436.5 million compared to $740$367.0 million of total debt outstanding at December 31, 20202022 due to proceeds received from the facility saleacquisitions, capital expenditures, share repurchases and leaseback transactions and cash flowdividends paid, partially offset by income from operations in 2021. See Part II. Item 8, Financial Statements and Supplementary Data, Note 5: Property, Plant, and Equipment for further discussion.2023. We had a debt-to-capitalization ratio of 54%32% and 84%29% at December 31, 20212023 and at December 31, 2020,2022, respectively. We had total liquidity (defined as cash and cash equivalents, restricted cash from sales of property, plant, and equipment, and availability under the Ryerson Credit Facility and foreign debt facilities) of $741$656 million at December 31, 20212023 versus $373$909 million at December 31, 2020.2022. Our net debt (defined as total debt less cash and cash equivalents, and restricted cash from sales of property, plant, and equipment)equivalents) was $588$382 million and $679$328 million at December 31, 20212023 and December 31, 2020,2022, respectively. Total liquidity and net debt are not U.S. generally accepted accounting principles (“GAAP”) financial measures. We believe that total liquidity provides additional information for measuring our ability to fund our operations. Total liquidity does not represent, and should not be used as a substitute for, net income or cash flows from operations as determined in accordance with GAAP and total liquidity is not necessarily an indication of whether cash flow will be sufficient to fund our cash requirements. We believe that net debt provides a clearer perspective of the Company’s overall debt situation given the excess borrowings discussed above.situation. Net debt should not be used as a substitute for total debt outstanding as determined in accordance with GAAP.
Below is a reconciliation of cash and cash equivalents to total liquidity:
|
| December 31, 2021 |
|
| December 31, 2020 |
|
| December 31, 2019 |
| |||
|
| (In millions) |
| |||||||||
Cash and cash equivalents |
| $ | 51 |
|
| $ | 61 |
|
| $ | 11 |
|
Restricted cash from sales of property, plant, and equipment |
|
| — |
|
|
| — |
|
|
| 48 |
|
Availability under Ryerson Credit Facility and foreign debt facilities |
|
| 690 |
|
|
| 312 |
|
|
| 380 |
|
Total liquidity |
| $ | 741 |
|
| $ | 373 |
|
| $ | 439 |
|
|
| December 31, 2023 |
|
| December 31, 2022 |
|
| December 31, 2021 |
| |||
|
| (In millions) |
| |||||||||
Cash and cash equivalents |
| $ | 54 |
|
| $ | 39 |
|
| $ | 51 |
|
Availability under Ryerson Credit Facility and foreign debt facilities |
|
| 602 |
|
|
| 870 |
|
|
| 690 |
|
Total liquidity |
| $ | 656 |
|
| $ | 909 |
|
| $ | 741 |
|
Below is a reconciliation of total debt to net debt:
|
| December 31, 2021 |
|
| December 31, 2020 |
|
| December 31, 2019 |
|
| December 31, 2023 |
|
| December 31, 2022 |
|
| December 31, 2021 |
| ||||||
|
| (In millions) |
|
| (In millions) |
| ||||||||||||||||||
Total debt |
| $ | 639 |
|
| $ | 740 |
|
| $ | 982 |
|
| $ | 436 |
|
| $ | 367 |
|
| $ | 639 |
|
Less: cash and cash equivalents |
|
| (51 | ) |
|
| (61 | ) |
|
| (11 | ) |
|
| (54 | ) |
|
| (39 | ) |
|
| (51 | ) |
Less: restricted cash from sales of property, plant, and equipment |
|
| — |
|
|
| — |
|
|
| (48 | ) | ||||||||||||
Net debt |
| $ | 588 |
|
| $ | 679 |
|
| $ | 923 |
|
| $ | 382 |
|
| $ | 328 |
|
| $ | 588 |
|
Of the total cash and cash equivalents, as of December 31, 2021, $20.92023, $34.2 million was held in subsidiaries outside the United States whichU.S. that is deemed to be permanently reinvested. Ryerson does not currently foresee a need to repatriate earnings from its non-U.S. subsidiaries. Although Ryerson has historically satisfied needs for more capital in the U.S. through debt or equity issuances and a significant portion of the earnings held in foreign jurisdictions is deemed to have been repatriated under the 2017 U.S. Tax Cuts and Jobs Act, Ryerson could elect to repatriate additional earnings, held in foreign jurisdictions, which could result in higher effective tax rates.foreign withholding taxes and potential U.S. state income taxes. We have not recorded a deferred tax liability for the effect of a possible repatriation of these earnings as management intends to permanently reinvest these earnings outside of the U.S. Specific plans for reinvestment include funding for future international acquisitions and funding of existing international operations.
39
The following table summarizes the Company’s cash flows:
|
| Year Ended December 31, |
| |||||||||||||
|
| 2021 |
|
| 2020 |
|
| Year Ended December 31, |
| |||||||
|
| (In millions) |
|
| 2023 |
|
| 2022 |
| |||||||
Net income (loss) |
| $ | 295.4 |
|
| $ | (65.3 | ) | ||||||||
|
| (In millions) |
| |||||||||||||
Net income |
| $ | 146.4 |
|
| $ | 391.5 |
| ||||||||
Depreciation and amortization |
|
| 55.9 |
|
|
| 53.9 |
|
|
| 62.5 |
|
|
| 59.0 |
|
Pension settlement charge |
|
| 98.7 |
|
|
| 65.9 |
| ||||||||
Gain on sale of assets |
|
| (109.6 | ) |
|
| — |
| ||||||||
Loss on retirement of debt |
|
| — |
|
|
| 21.3 |
| ||||||||
Change in operating assets and liabilities: |
|
|
|
|
|
|
|
|
|
|
|
|
|
| ||
Receivables |
|
| (252.5 | ) |
|
| 46.7 |
|
|
| 67.9 |
|
|
| 126.7 |
|
Inventories |
|
| (227.9 | ) |
|
| 138.9 |
|
|
| 28.8 |
|
|
| 39.9 |
|
Accounts payable |
|
| 123.6 |
|
|
| 25.8 |
|
|
| 24.8 |
|
|
| (72.1 | ) |
Accrued liabilities |
|
| 32.0 |
|
|
| 16.7 |
| ||||||||
Deferred employee benefit costs |
|
| (25.0 | ) |
|
| (10.6 | ) | ||||||||
Accrued taxes payable/receivable |
|
| 23.3 |
|
|
| (52.9 | ) | ||||||||
Tenant improvement allowance |
|
| 15.9 |
|
|
| — |
| ||||||||
Other operating asset and liability balances |
|
| 1.9 |
|
|
| 11.8 |
|
|
| (22.5 | ) |
|
| (6.0 | ) |
All other operating cash flows |
|
| 42.5 |
|
|
| (5.9 | ) |
|
| 18.0 |
|
|
| (6.2 | ) |
Net cash provided by operating activities |
|
| 35.0 |
|
|
| 277.9 |
|
|
| 365.1 |
|
|
| 501.2 |
|
Acquisitions |
|
| (14.5 | ) |
|
| — |
|
|
| (137.8 | ) |
|
| (57.0 | ) |
Capital expenditures |
|
| (59.3 | ) |
|
| (26.0 | ) |
|
| (121.9 | ) |
|
| (105.1 | ) |
Proceeds from sale of property, plant, and equipment |
|
| 166.3 |
|
|
| 0.1 |
|
|
| 0.5 |
|
|
| 8.0 |
|
Proceeds from other investing activities |
|
| 1.9 |
|
|
| — |
| ||||||||
Net cash provided by (used in) investing activities |
|
| 94.4 |
|
|
| (25.9 | ) | ||||||||
Long term debt issued |
|
| — |
|
|
| 500.0 |
| ||||||||
Other investing activities |
|
| (2.9 | ) |
|
| (5.9 | ) | ||||||||
Net cash used in investing activities |
|
| (262.1 | ) |
|
| (160.0 | ) | ||||||||
Repayment of debt |
|
| (157.3 | ) |
|
| (654.7 | ) |
|
| (1.7 | ) |
|
| (321.3 | ) |
Net proceeds (repayments) of short-term borrowings |
|
| 45.8 |
|
|
| (93.8 | ) | ||||||||
Bond issuance costs |
|
| — |
|
|
| (10.9 | ) | ||||||||
Net proceeds from short-term borrowings |
|
| 69.8 |
|
|
| 26.1 |
| ||||||||
Net increase (decrease) in book overdrafts |
|
| (7.7 | ) |
|
| 27.4 |
|
|
| (7.1 | ) |
|
| 29.6 |
|
Dividends paid to shareholders |
|
| (24.8 | ) |
|
| (19.9 | ) | ||||||||
Share repurchases |
|
| (113.9 | ) |
|
| (50.0 | ) | ||||||||
All other financing cash flows |
|
| (18.7 | ) |
|
| (18.2 | ) |
|
| (10.6 | ) |
|
| (14.6 | ) |
Net cash used in financing activities |
|
| (137.9 | ) |
|
| (250.2 | ) |
|
| (88.3 | ) |
|
| (350.1 | ) |
Effect of exchange rates on cash and cash equivalents |
|
| (1.6 | ) |
|
| 0.9 |
|
|
| 0.2 |
|
|
| (3.0 | ) |
Net increase (decrease) in cash and cash equivalents |
| $ | (10.1 | ) |
| $ | 2.7 |
|
| $ | 14.9 |
|
| $ | (11.9 | ) |
Operating activities. In 2023, average selling prices were 15.7% lower than in 2022 resulting in lower cash generated from operations. Working capital fluctuates throughout the year based on business needs. Working capital needs tend to be counter-cyclical, meaning that in periods of expansion the Company will use cash to fund working capital requirements, but in periods of contraction the Company will generate cash from reduced working capital requirements. Working capital requirements decreased in 2023 primarily due to a decline in average selling prices and lower shipments in the fourth quarter of 2023 compared to the fourth quarter of 2022, which resulted in lower sales and the related accounts receivable. Additionally, inventory costs decreased as market prices for metals decreased in 2023, resulting in a lower inventory investment. Material purchases were higher at the end of the fourth quarter of 2023 compared to the end of the fourth quarter of 2022 resulting in an increase in accounts payable in the fourth quarter of 2023. In 2022, average selling prices were 15.1% higher than in 2021 increasedresulting in significantly as improved economic conditions increased demandhigher operating profits and supply constraints increased metals pricing,higher cash generated from operations. Working capital requirements in 2022 decreased due to lower shipments and a decline in average selling prices in the fourth quarter of 2022, which increasedresulted in lower sales and the related accounts receivable. Inventory quantities were increasedon hand decreased to meet the higheralign with softer demand and inventory costs increased due to rising metal prices throughout the year.conditions. The higherlower inventory investment also increaseddecreased accounts payable balances. In 2020, working capital requirements significantly decreased, contributing to the operating cash flows generated2022, we made estimated tax payments based on our forecasted income. Sales slowed in the period, as the Company had lower sales levels driven by lower tons sold and lower average selling pricesfourth quarter of 2022, creating a tax overpayment, which was applied toward 2023 taxes due to weak economic
conditions resulting from the COVID-19 pandemic. Consequently, the Company brought inventory levels down significantlycausing less cash payments for taxes in line with the weak market conditions. The Company also increased the days payable cycle in 2020 by working with our vendors on payment terms resulting in an increase in accounts payable year over year. Pension contributions were higher in 2021 than in 2020 as the Company elected in 2020 to defer $12 million of U.S. contributions due in 2020 to 2021, as permitted under the CARES Act that was passed in March 2020. The Company made contributions of $23.7 million in 2021 to the Company’s pension plans compared to contributions of $7.1 million in 2020. Interest paid to third parties was $10.9 million lower in 2021 compared to 2020 due to lower outstanding debt and interest rates, mainly due to the repurchase in 2020 of our 2022 Notes at 11% and the issuance of our 2028 Notes at 8.5% and lower LIBOR rates on our revolving line of credit borrowings.2023.
Investing activities. The Company's main investing activities are acquisitions, capital expenditures, and proceeds from the sale of property, plant, and equipment. In 2021, we sold and leased back a group of properties with net proceeds of approximately $163.2 million. Capital expenditures increased year-over-year to $121.9 million in 2023 compared to $105.1 million in 2022, as the Company reducedcontinued its investment in a new facility in University Park, Illinois, a project which began in 2022 and expanded and modernized its Shelbyville, Kentucky location in 2023. In 2023, the 2020 annual capital expenditures budget dueCompany paid $127.5 million to acquire BLP, TSA, Norlen, and Hudson, and paid $9.7 million to purchase certain assets from ExOne Operating, LLC. See Note 2: Acquisitions within Part II, Item 8 of this report, for further discussion of the COVID-19 pandemic. In 2021, we acquired SMPacquisitions. The Company paid $57.0 million in 2022 to acquire Apogee Steel Fabrication Incorporated, Ford Tool Steels, Inc., Howard Precision Metals, Inc., and Excelsior, Inc. The Company sold property, plant, and equipment and assets held for $14.0sale generating cash proceeds of $0.5 and $8.0 million net of cash acquired.in 2023 and 2022, respectively.
40
Financing activities. The Company's main source of liquidity to fund working capital requirements is borrowings on our credit facility. In 2021,2023, acquisitions and capital expenditures, as well as share repurchases and dividends paid, were in excess of cash from operations, which increased borrowings on the Ryerson Credit Facility. In 2022, we repurchased, redeemed, $150.0and retired $300.0 million principal of our 2028 Notes, which was partially offset by credit facilityan increase of $49.0 million in Credit Facility borrowings. At December 31, 2020, we borrowed approximately $40 million of excess credit facility funds to maintain access to cash during the COVID-19 pandemic. This borrowing was offset by credit facility repayments from operating cash flows that were generated in 2020. In addition, during 2020 we redeemed and repurchased the outstanding principal amount of $587.9 million of our 2022 Notes. In the third quarter of 2020, we issued $500 million of our 2028 Notes to replace the 2022 Notes at a lower interest rate and debt level and paid $10.9 million of issuance fees on the transaction. In the fourth quarter of 2020, we redeemed $50.0 million of our 2028 Notes. Book overdrafts fluctuate based on the timing of payments. Cash dividends paid in 2023 were $24.8 million compared to $19.9 million paid to shareholders in 2022. We repurchased $113.9 million of common stock during the 2023 compared to $50.0 of common stock repurchased in 2022.
As market conditions warrant and subject to our contractual restrictions, liquidity position, and other factors, we may from time to time seek to repurchase or retire our outstanding debt through cash purchases and/or exchanges for other debt or equity securities in open market transactions, privately negotiated transactions, by tender offer, or otherwise. Any such cash repurchases by us may be funded by cash on hand or incurring new debt. The amounts involved in any such transactions, individually or in the aggregate, may be material. Furthermore, any such repurchases or exchanges may result in our acquiring and retiring a substantial amount of such indebtedness, which would impact the trading liquidity of such indebtedness.
In the normal course of business with customers, vendors, and others, we have entered into off-balance sheet arrangements, such as letters of credit, which totaled $20$10.9 million as of December 31, 2021.2023. We do not have any other material off-balance sheet financing arrangements. Our off-balance sheet arrangements are not likely to have a material effect on our current or future financial condition, results of operations, liquidity, or capital resources.
Total Debt
Total debt at December 31, 2021 decreased $100.72023 increased $69.5 million to $639.3$436.5 million from $740.0$367.0 million at December 31, 2020,2022, mainly due to cash generated from sale-leaseback transactions and the net cash provided by operating activitiesfunding new acquisitions in 2021.2023.
Total debt outstanding as of December 31, 20212023 consisted of the following amounts: $316.0$433.0 million borrowings under the Ryerson Credit Facility, $300.0 million under the 2028 Notes, $27.0$6.0 million of foreign debt, and $6.0$2.2 million of other debt, less $9.7$4.7 million of unamortized debt issuance costs. Availability under the Ryerson Credit Facility was $670$560 million and $277$826 million at December 31, 20212023 and December 31, 2020,2022, respectively. For further information, see Note 10:9: Debt in Part II, Item 8 – Financial Statements and Supplementary Data.
Pension Funding
The Company made contributions of $8.8 million in 2023, $6.8 million in 2022, and $23.7 million in 2021 $7.1 million in 2020, and $25.7 million in 2019 to improve the Company’s pension plans funded status. At December 31, 2021,2023, as reflected in Part II. Item 8, Financial Statements and Supplementary Data, Note 11,10, pension liabilities exceeded plan assets by $95.8$63.9 million. The Company anticipates that it will have a minimum required pension contribution of approximately $5.8$11.0 million in 20222024 under the Employee Retirement Income Security Act of 1974 (“ERISA”), Pension Protection Act in the U.S., and the Ontario Pension Benefits Act in Canada. The expected future contributions reflect recent pension funding relief measures under the American Rescue Plan Act (“ARPA”) passed in March 2021. Future contribution requirements depend on the investment returns on plan assets, the impact of discount rates on pension liabilities, and changes in regulatory requirements. The Company is unable to determine the amount or timing of any such contributions required by ERISA or whether any such contributions would have a material adverse effect on the Company’s financial position or cash flows.
Effective September 24, 2021, the Ryerson Pension Plan purchased $206.6 million of annuities on behalf of a portion of plan participants which, due to the size of the transaction, resulted in settlement accounting. The pension plan was remeasured as of September 30, 2021. The remeasurement resulted in a settlement loss of $98.3 million which was recorded within Other income and (expense), net in the Statement of Operations as of September 30, 2021.
Changes in returns on plan assets may affect our plan funding, cash flows, and financial condition. Differences between actual plan asset returns and the expected long-term rate of return on plan assets impact the measurement of the following year’s pension expense and pension funding requirements. However, we believe that cash flow from operations and the Ryerson Credit Facility described above will provide sufficient funds to make the minimum required contributions.
Income Tax Payments
The Company made income tax payments of $6.2 million in 2023, $176.9 million in 2022, and $70.2 million in 2021 and received income tax refunds of $5.7 million and $6.6 million in 2020 and 2019, respectively.2021. Income tax payments in 2021 increased as the Company fully utilized existing federal income tax net operating loss carryforwards and had increased2023 decreased due to lower pre-tax income year over year.year in addition to prior year tax over payments being applied toward 2023 taxes due. See Part II. Item 8, Financial Statements and Supplementary Data, Note 19:18: Income Taxes for further discussion.
Material Cash Requirements
The Company expects to make approximately $649$441 million in principal payments to satisfy its debt obligations, consisting of $27$6 million in foreign debt coming due in 2022, $62024, $2 million of other debt coming due between 2023in 2024, and 2024, $316$433 million for the Ryerson Credit Facility coming due in 2025, and $300 million for the 2028 Notes due in 2028.2027. Please refer to Part II. Item 8, Financial Statements and Supplementary Data, Note 10:9: Debt for further information.
The Company leases various assets including real estate, trucks, trailers, mobile equipment, processing equipment, and IT equipment. We have noncancelable operating leases expiring at various times through 2036, and finance leases expiring at various times through 2027. The total amount of future lease payments is estimated to be $278 million with $44 million for the next 12 months. Including leases signed but not yet commenced as of December 31, 2021, total lease payments are $471 million. Please refer to Part II, Item 8 – Financial Statements and Supplementary Data, Note 6: Leases for further information.
The Company expects to pay approximately $32$29 million of interest on the 2028 Notes, Ryerson Credit Facility, foreign debt, and other debt over the next 12 months and $160$72 million thereafter. Interest payments related to the variable rate debt were estimated using the weighted average interest rate for the Ryerson Credit Facility,respective debt instrument.
41
The Company leases various assets including real estate, trucks, trailers, cars, mobile equipment, processing equipment, and IT equipment. We have noncancelable operating leases expiring at various times through 2043, and finance leases expiring at various times through 2030. The total amount of future lease payments is estimated to be $485 million with $48 million for the effect of the interest rate swaps.next 12 months. Please refer to Part II, Item 8 – Financial Statements and Supplementary Data, Note 6: Leases for further information.
Purchase obligations with suppliers are entered into when we receive firm sales commitments with certain of our customers. As of December 31, 2021,2023, we had outstanding purchase obligations of approximately $14$20 million expiring in 2022.
Restructuring
2021
During 2021, the Company paid the remaining $0.5 million of employee-related costs related to prior year staff reductions. The Company has a $0.7 million reserve for tenancy-related costs for facilities closed in prior years, which are expected to be paid through 2025.
2020
In 2020, the Company recorded a $2.2 million charge for employee-related costs primarily for severance costs for corporate staff reductions. The Company paid $1.9 million of the employee costs related to these actions. In addition, the Company paid $0.8 million related to 2019 staff reductions.
During 2020, the Company also paid $0.3 million for costs related to facilities closed in prior years and recorded an addition of $0.1 million to the reserve for tenancy-related costs, which was charged to warehousing, delivery, selling, general, and administrative expense in the Consolidated Statements of Operations.
2019
In 2019, the Company recorded a $2.1 million charge for employee-related costs primarily for severance costs for corporate staff reductions. The Company paid $1.2 million for employee costs related to these actions. In addition, the Company paid $0.3 million related to 2018 staff reductions.
During 2019, the Company also recorded a $0.3 million charge to increase the reserve for tenancy-related costs for a facility closed in 2013. The Company paid $0.9 million in 2019 for costs related to facilities closed in prior years.2024.
Deferred Tax Amounts
At December 31, 2021,2023, the Company had a net deferred tax liability of $94$136 million comprised primarily of a deferred tax asset of $24$17 million related to pension liabilities, a deferred tax asset related to postretirement benefits other than pensions of $15$9 million, deferred tax assets of $10$7 million related to state, local, and foreign tax loss carryforwards, $93 million related to operating lease liabilities, and $26$22 million of other deferred taxes relating to accrued compensation and other items, offset by a valuation allowance of $5$4 million and deferred tax liabilities of $57$86 million related to fixed assets, $97$99 million related to inventory, $88 million related to operating lease assets, and $10$7 million related to intangibles. The Company’s deferred tax assets include $10 million related to state net operating loss (“NOL”) carryforwards and $0.3 million related to foreign NOL carryforwards at December 31, 2021. Due to the volatile macro-economic conditions associated with the COVID-19 pandemic, weWe may experience fluctuations in our forecasted earnings before income taxes as a result of events which cannot be predicted, which could affect our deferred tax balances.
In accordance with ASC Topic 740, “Income Taxes,” the Company assesses the realizability of its deferred tax assets. The Company records a valuation allowance when, based upon the evaluation of all available evidence, it is more-likely-than-not that all or a portion of the deferred tax assets will not be realized. In making this determination, we analyze, among other things, our recent history of earnings, the nature and timing of reversing book-tax temporary differences, tax planning strategies, and future income. After considering both the positive and negative evidence available, in the second quarter of 2009, the Company determined that it was more-likely-than-not that it would not realize a portion of its U.S. deferred tax assets. As a result, the Company established a valuation allowance against a portion of its U.S. deferred tax assets. The Company released a portion of the valuation allowance related to one of its U.S. subsidiaries, JT Ryerson, during 2012. The Company released most of the remaining U.S. related valuation allowance during 2013. In 2018, the Company further reduced its valuation allowance related to state and foreign net operating losses. As of December 31, 2019, the Company had a valuation allowance of $13.7 million, a decrease of $15.6 million from the prior year mainly related to expiring NOLs and changes to U.S. foreign tax credits previously recorded.As of December 31, 2020, the company had a valuation allowance of $6.6 million, a decrease of $7.1 million from the prior year mainly related to expiring NOLs and changes to U.S foreign tax credits previously recorded. As of December 31, 2021, the Company had a valuation allowance of $5.0 million, a decrease of $1.6 million from the prior year mainly related to a release of a valuation allowance on state NOL deferred tax assets, which we now expect to realize due to improved profitability. The valuation allowance did not change during 2022, remaining at $5.0 million as of December 31, 2022 related to U.S. federal tax credit deferred tax assets and foreign tax assets. As of December 31, 2023, the Company had a valuation allowance of $4.0 million, a decrease of $1.0 million from the prior year mainly related to an adjustment to certain U.S. federal tax credits and deferred tax assets which were fully reserved. As of December 31, 2023, the valuation allowance continues to be related to U.S. federal tax credit deferred tax assets and foreign tax assets.
As described in Note 1 to the Consolidated Financial Statements, the Company assesses the need for a valuation allowance considering all available positive and negative evidence, including past operating results, projections of future taxable income, and the feasibility of ongoing tax planning strategies.
The Company will continue to maintain a valuation allowance on certain U.S. federal and foreign deferred tax assets until such time as in management’s judgment, considering all available positive and negative evidence, the Company determines that these deferred tax assets are more likely than not realizable.
Critical Accounting Estimates
Preparation of this Form 10-K requires us to make estimates and assumptions that affect the reported amount of assets and liabilities, disclosure of contingent assets and liabilities at the date of our financial statements, and the reported amounts of sales and expenses during the reporting period. Our critical accounting policies, including the assumptions and judgments underlying them, are disclosed in Item 8 within Note 1: Summary of Accounting and Financial Policies. These policies have been consistently applied and address such matters as revenue recognition, depreciation methods, inventory valuation, asset impairment recognition, and pension and postretirement expense. While policies associated with estimates and judgments may be affected by different assumptions or conditions, we believe our estimates and judgments associated with the reported amounts are appropriate in the circumstances. Actual results may differ from those estimates.
We consider the policies discussed below as critical to an understanding of our financial statements, as application of these policies places the most significant demands on management’s judgment, with financial reporting results relying on estimation of matters that are uncertain.
Provision for allowances, claims, and doubtful accounts: We perform ongoing credit evaluations of customers and set credit limits based upon review of the customers’ current credit information, payment history, and the current economic and industry environments. We monitor customer payments and maintain a provision for estimated credit losses based on historical experience and specific customer collection issues that we have identified. Estimation of such losses requires adjusting historical loss experience for current economic conditions and judgments about the probable effects of economic conditions on certain customers. We cannot
guarantee that the rate of future credit losses will be similar to past experience. Provisions for allowances and claims are based upon
42
historical rates, expected trends, and estimates of potential returns, allowances, customer discounts, and incentives. We consider all available information when assessing the adequacy of the provision for allowances, claims, and doubtful accounts.
Inventory valuation: Our inventories are stated at the lower of cost or market. The valuation of our inventories at the lower of cost or market could be subject to certain estimates; however, the measurement is primarily based on historical purchasing and sales information rather than forecasted metals pricing. Inventory costs reflect metal and in-bound freight purchase costs, third-party processing costs, and internal direct and allocated indirect processing costs. Cost is primarily determined by the LIFO method. We regularly review inventory on hand and record provisions for obsolete and slow-moving inventory based on historical and current sales trends. Changes in product demand and our customer base may affect the value of inventory on hand which may require higher provisions for obsolete inventory.
Income Taxes: Our income tax expense, deferred tax assets and liabilities, and reserve for uncertain tax positions reflect our best estimate of taxes to be paid. The Company is subject to income taxes in the U.S. and several foreign jurisdictions. The determination of the consolidated income tax expense requires judgment and estimation by management. It is possible that actual results could differ from the estimates that management has used to determine its consolidated income tax expense.
We record operating loss and tax credit carryforwards and the estimated effect of temporary differences between the tax basis of assets and liabilities and the reported amounts in the Consolidated Balance Sheet.Sheets. We follow detailed guidelines in each tax jurisdiction when reviewing tax assets recorded on the balance sheet and provide for valuation allowances as required. Deferred tax assets are reviewed for recoverability based on historical taxable income, the expected reversals of existing temporary differences, tax planning strategies, and on forecasts of future taxable income. The forecasts of future taxable income require assumptions regarding volume, selling prices, margins, expense levels, and industry cyclicality. If we are unable to generate sufficient future taxable income in certain tax jurisdictions, we may be required to record additional valuation allowances against our deferred tax assets related to those jurisdictions.
The Company’s income tax provisions are based on calculations and assumptions that are subject to examination by the Internal Revenue Service and other tax authorities. Although the Company believes that the positions taken on filed tax returns are reasonable, it has established tax and interest reserves in recognition that various taxing authorities may challenge the positions taken. For uncertain tax positions, the Company applies the provisions of relevant authoritative guidance, which requires application of a “more likely than not” threshold to the recognition and derecognition of tax positions. The Company’s ongoing assessments of the more likely than not outcomes of tax authority examinations and related tax positions require significant judgment and can increase or decrease the Company’s effective tax rate.
Long-lived Assets and Other Intangible Assets: Long-lived assets held and used are reviewed for impairment whenever events or changes in circumstances indicate that the carrying amount of an asset may not be recoverable. We estimate the future cash flows expected to result from the use of the asset and its eventual disposition. If the sum of the expected future cash flows (undiscounted and without interest charges) is less than the carrying amount of the asset, an impairment is recognized. Determining whether an impairment has occurred typically requires various estimates and assumptions, including determining which undiscounted cash flows are directly related to the potentially impaired asset, the useful life over which cash flows will occur, their amount, and the asset’s residual value, if any. Any related impairment loss is calculated based upon comparison of the fair value to the carrying value of the asset. Separate intangible assets that have finite useful lives are amortized over their useful lives. An impaired long-lived or intangible asset would be written down to fair value, based on various available valuation techniques, including the discounted cash flow method.
Goodwill: We assess the recoverability of the carrying value of recorded goodwill annually in the fourth quarter of each year or whenever indicators of potential impairment exist. We test for impairment of goodwill by assessing various qualitative factors with respect to developments in our business and the overall economy. Factors that may be considered indicators of impairment include: deterioration in general economic conditions; declines in the market conditions of our products, including metals prices; a sustained significant decline in our share price and market capitalization; reduced future cash flow estimates; and slower growth rates in our industry, among others. If we determine that it is more likely than not that the fair value of a reporting unit is less than the carrying value based on our qualitative assessment, we will proceed to the goodwill impairment test. We compare the fair value of the reporting unit in which goodwill resides to its carrying value. If the carrying amount exceeds the fair value, an impairment loss is recognized in an amount equal to that excess, not to exceed the carrying amount of the goodwill. The fair value of the reporting unit is estimated using a combination of an income approach and a market approach as this combination is deemed to be the most indicative of our fair value in an orderly transaction between market participants. An income approach based on discounted future cash flows requires us to estimate income from operations based on projected results and discount rates based on a weighted average cost of capital of comparable companies. A market approach estimates fair value using market multiples of various financial measures of comparable
public companies. If these estimates or their related assumptions for commodity prices and demand change in the future, we may be required to record impairment charges for these assets.
43
Based on the impairment test performed on October 1, 2021,2023, the Company concluded that the fair value of the reporting unitunits tested for impairment exceeded the carrying value. The discount rate for the reporting unit was estimated to be 15.5%13.5% at October 1, 2021.2023. The Company determines a discount rate based on an estimate of a reasonable risk-adjusted return an investor would expect to realize on an investment in the reporting unit. Deterioration in market conditions in our industry or products, changes in expected future cash flows, expected growth rates, or to discount rates could result in impairment charges in future periods.
Purchase Price Accounting: Business combinations are accounted for using the acquisition method of accounting. This method requires the Company to record assets and liabilities of the business acquired at their estimated fair market values as of the acquisition date. Any excess of the cost of the acquisition over the fair value of the net assets acquired is recorded as goodwill. Any shortfall in the cost of the acquisition compared to the fair value of the net assets acquired is recorded in the StatementConsolidated Statements of Operations as a bargain purchase gain. The Company uses valuation specialists, where necessary, to perform appraisals and assist in the determination of the fair values of the assets acquired and liabilities assumed. These valuations require management to make estimates and assumptions that are critical in determining the fair values of the assets and liabilities.
Assets acquired and liabilities assumed that do not constitute a business are accounted for using the cost accumulation and allocation model under which the cost of the acquisition is allocated to the assets acquired and liabilities assumed.
Pension and postretirement benefit plan assumptions: We sponsor various benefit plans covering a portion of our employees for pension and postretirement medical costs. Statistical methods are used to anticipate future events when calculating expenses and liabilities related to the plans. The statistical methods include assumptions about, among other things, the discount rate, expected return on plan assets, rate of increase of health care costs, and the rate of future compensation increases. Our actuarial consultants also use subjective factors such as withdrawal and mortality rates when estimating expenses and liabilities. The discount rate used for U.S. plans reflects the market rate for high-quality fixed-income investments on our annual measurement date (December 31) and is subject to change each year. The discount rate wasis determined by matching, on an approximate basis, the coupons and maturities for a portfolio of corporate bonds (rated Aa or better by Moody’s Investor Services or AA or better by Standard and Poor’s) to the expected plan benefit payments defined by the projected benefit obligation. The discount rates used for plans outside the U.S. are based on the yield of long term high quality corporate bonds, the duration of the liability, and appropriate judgment.
When calculating pension expense for 2021,2023, we assumed the pension plans’ assets would generate a long-term rate of return between 4.35% and 5.05%of 6.05% for the JT Ryerson plan (adjusted for the remeasurement in 2021) and 2.05%3.80% for the Central Steel and Wire Company a JT Ryerson subsidiary, plan, and between 1.75%4.25% and 4.25%6.00% for the Canadian plans. The expected long-term rate of return assumption was developed based on historical experience and input from the trustee managing the plans’ assets. The expected long-term rate of return on plan assets is based on a target allocation of assets, which is based on a goal of earning the highest rate of return while maintaining risk at acceptable levels. Our projected long-term rate of return for the JT Ryerson pension plan is slightly higher than some market indices due to the active management of our plans’ assets, and is supported by the historical returns on our plans’ assets. The plans strive to have assets sufficiently diversified so that adverse or unexpected results from one security class will not have an unduly detrimental impact on the entire portfolio. We regularly review actual asset allocation and the pension plans’ investments are periodically rebalanced to the targeted allocation when considered appropriate. Pension expense increases as the expected rate of return on plan assets decreases. Lowering the expected long-term rate of return on plan assets by 50 basis points would have increased 20212023 pension expense by approximately $2$1 million.
Future pension obligations for the U.S. plans were discounted using rates between of 2.84%5.05% and 3.27%5.24% at December 31, 2021.2023. Future pension obligations for the Canadian plans were discounted using 2.85%4.64% at December 31, 2021.2023. Lowering the discount rate by 50 basis points would increase the pension liability at December 31, 20212023 by approximately $26$15 million.
The calculation of other postretirement benefit obligations requires the use of a number of assumptions, including the assumed discount rate between 4.63% and 5.06% at December 31, 2023 for measuring future payment obligations. A decrease in the weighted average discount rate of 50 basis points would increase the postretirement benefit liability by approximately $3$2 million.
The assumptions used in the actuarial calculation of expenses and liabilities may differ materially from actual results due to changing market and economic conditions, higher or lower withdrawal rates, or longer or shorter life spans of participants. These differences may result in a significant impact on the amount of pension or postretirement benefit expense we may record in the future.
Legal contingencies: We are involved in a number of legal and regulatory matters including those discussed in Item 8 within Note 13:12: Commitments and Contingencies. We determine whether an estimated loss from a loss contingency should be accrued by assessing whether a loss is deemed probable and can be reasonably estimated. We analyze our legal matters based on available information to assess potential liability. We consult with outside counsel involved in our legal matters when analyzing potential outcomes. We cannot determine at this time whether any potential liability related to this litigation would materially affect our financial position, results of operations, or cash flows.
44
Recent Accounting Pronouncements
Recent accounting pronouncements are discussed within Note 1: Summary of Accounting and Financial Policies in Part II, Item 8 Financial Statements and Supplementary Data.
ITEM 7A. QUANTITATIVE AND QUALITATIVE DISCLOSURES ABOUT MARKET RISK.
|
|
Our primary areas of market risk include changes in interest rates, foreign currency exchange rates, and commodity prices. We continually monitor these risks and develop strategies to manage them.
Interest rate risk
Market risk is the potential loss arising from adverse changes in market rates and prices, such as interest rates. We are exposed to market risk related to our fixed-rate and variable-rate long-term debt. Changes in interest rates may affect the marketAs of December 31, 2023 and December 31, 2022, we have no publicly traded debt. The carrying value of our fixed-rate debt. The estimated fair value of our long-term debt was $436.5 million and the current portions thereof using quoted market prices of Company debt securities recently traded and market-based prices of similar securities for those securities not recently traded was $666.8$367.0 million at December 31, 20212023 and $800.3 million at December 31, 2020 as compared with the2022, respectively. The carrying value approximates our fair value due to the short-term nature of $639.3 million and $740.0 million at December 31, 2021 and 2020, respectively. the underlying borrowings on the Ryerson Credit Facility.
We manage interest rate risk in our capital structure by holding a combination of variable and fixed-rate debt.
Wemay use interest rate swaps to manage our exposure to interest rate changes. As of December 31, 2021,2023, we have two receive variable, pay fixed,no outstanding interest rate swaps to manage the exposure to variable interest rates of the Ryerson Credit Facility. In June 2019, we entered into a forward agreement for $60 million of “pay fixed” interest at 1.729% through June 2022, and in November 2019, we entered into a forward agreement for $100 million of “pay fixed” interest at 1.539% through November 2022.swaps.
Effective November 1, 2020, the Company de-designated its interest rate swaps as cash flow hedges and terminated its hedge accounting treatment. Prior to de-designation, the Company would mark these interest rate swaps to market with all changes in fair value recorded in accumulated other comprehensive income. Subsequent to de-designation, changes in fair value are recorded in current earnings. The fair value of the interest rate swaps as of December 31, 2021 was a net liability of $1.4 million. For the year ended December 31, 2021, the Company recognized a mark-to-market gain of $2.6 million, which was partially offset by a $2.5 million loss recognized from other comprehensive income. After de-designation, the amounts reclassified from other comprehensive income relate to prior gains and losses that are being amortized into income as the forecasted interest payments affect earnings.
After considering the effects of our interest rate swaps, 71%Approximately 1% of our debt wasis at fixed interest rates as of December 31, 2021. Considering the impact of interest rate swaps, a2023. A hypothetical 1% increase in interest rates on variable debt would have increased interest expense for 2021the twelve months of 2023 by approximately $2.0$4.7 million.
Foreign exchange rate risk
We are subject to foreign currency risks primarily through our operations in Canada, Mexico, and China and we use foreign currency exchange contracts to reduce our exposure to currency price fluctuations. Foreign currency contracts are principally used to purchase U.S. dollars. We had foreign currency contracts with a U.S. dollar notional amount of $4.5$1.6 million outstanding at December 31, 20212023 and a net liabilityfair value of zero. We do not currently account for these contracts as hedges but rather mark these contracts to market with a corresponding offset to current earnings. For the year ended December 31, 2021,2023, the Company recognized azero gain of $0.2 millionor loss associated with its foreign currency contracts. A hypothetical strengthening or weakening of 10% in the foreign exchange rates underlying the foreign currency contracts from the market rate as of December 31, 20212023 would increase or decrease the fair value of the foreign currency contracts by $0.4$0.1 million and $0.5$0.2 million, respectivelyrespectively..
The currency effects of translating the financial statements of our foreign subsidiaries are included in accumulated other comprehensive loss and will not be recognized in the statement of operations until there is a liquidation or sale of those foreign subsidiaries.
Commodity price risk
In general, we purchase metals in an effort to maintain our inventory at levels that we believe to be appropriate to satisfy the anticipated needs of our customers based upon historic buying practices, customer contracts, and market conditions. Our commitments to purchase metals are generally at prevailing market prices in effect at the time we place our orders.
Metal prices can fluctuate significantly due to several factors including changes in foreign and domestic production capacity, raw material availability, metals consumption, and foreign currency rates. Derivative financial instruments have been used to manage a limited portion of our exposure to fluctuations in the cost of certain commodities. No derivatives are held for trading purposes.
As of December 31, 2021,2023, we had 176,85964,819 tons of hot roll coil swap contracts with a net liability value of $19.8$1.1 million, 85720,319 tons of aluminum swap contracts with a net asset value of $0.9 million, and 1,375 tons of nickel swap contracts with a net liabilityasset value of $1.6 million, 20,949 tons of aluminum swap contracts with a net liability value of $0.7 million, and 840,000 gallons of diesel swap contracts with a net value of zero.$8.1 million. We do not currently account for these contractsswaps as hedges, but rather mark these contracts to market with a corresponding offset to current earnings. For the yeartwelve months ended December 31, 2021,2023, the Company recognized a lossgain of $47.3$10.7 million associated with its commodity derivatives.
A hypothetical strengthening or weakening of 10% in the commodity prices underlying the commodity derivative contracts from the market rate as of December 31, 20212023 would increase or decrease the fair value of the commodity derivative contracts by $2.8$2.0 million.
45
ITEM 8. FINANCIAL STATEMENTS AND SUPPLEMENTARY DATA.
|
|
Index to Consolidated Financial Statements
Page | ||
Financial Statements | ||
Management’s Report on Internal Control over Financial Reporting |
| |
The report of Ryerson Holding Corporation’s independent registered public accounting firm (PCAOB ID: | ||
| ||
| ||
| ||
| ||
Consolidated Balance Sheets at December 31, |
| |
| ||
| ||
Financial Statements Schedule | ||
| ||
| ||
All other schedules are omitted because they are not applicable. The required information is shown in the Financial Statements or Notes thereto. |
46
MANAGEMENT’S REPORT ON INTERNAL CONTROL OVER FINANCIAL REPORTING
The management of Ryerson Holding Corporation (“the Company”) is responsible for establishing and maintaining adequate internal control over financial reporting. The Company’s internal control system was designed to provide reasonable assurance to the Company’s management and Board of Directors regarding the reliability of financial reporting and the preparation of financial statements for external purposes in accordance with accounting principles generally accepted in the United States of America.
Because of its inherent limitations, internal control over financial reporting may not prevent or detect misstatements under all potential conditions. Therefore, effective internal control over financial reporting provides only reasonable, and not absolute, assurance with respect to the preparation and presentation of financial statements.
The Company’s management assessed the effectiveness of the Company’s internal control over financial reporting as of December 31, 2021,2023, based on criteria established in Internal Control - Integrated Framework issued by the Committee of Sponsoring Organizations of the Treadway Commission (2013 framework) (the COSO criteria). Based on its assessment under that framework and the criteria established therein, the Company’s management concluded that the Company’s internal control over financial reporting was effective as of December 31, 2021.2023. Management’s assessment and conclusion on the effectiveness of internal control over financial reporting as of December 31, 2023 excludes the internal control over financial reporting related to BLP Holdings, LLC (acquired on March 1, 2023), Norlen Incorporated (acquired on October 2, 2023), TSA Processing (acquired on November 1, 2023), and Hudson Tool Steel Corporation (acquired on December 1, 2023). These 4 acquisitions are included in the 2023 consolidated financial statements and when combined constituted 7.0% and 1.8% of total assets and total liabilities, respectively, as of December 31, 2023 and 0.8% and 1.2% of net sales and net income, respectively, for the year then ended.
Ernst & Young LLP, an independent registered public accounting firm, has audited the Company’s internal control over financial reporting as of December 31, 2021,2023, as stated in their report, which is included herein.
47
REPORT OF INDEPENDENT REGISTERED PUBLIC ACCOUNTING FIRM
To the Stockholders and the Board of Directors of Ryerson Holding Corporation and Subsidiary Companies
Opinion on the Financial Statements
We have audited the accompanying consolidated balance sheets of Ryerson Holding Corporation and subsidiariesSubsidiary Companies (the Company) as of December 31, 20212023 and 2020,2022, the related consolidated statements of operations, comprehensive income, stockholders' equity, and cash flows for each of the three years in the period ended December 31, 2021,2023, and the related notes and financial statement schedulesschedule listed in the Index at Item 15(a) (collectively referred to as the “consolidated financial statements”). In our opinion, the consolidated financial statements present fairly, in all material respects, the financial position of the Company at December 31, 20212023 and 2020,2022, and the results of its operations and its cash flows for each of the three years in the period ended December 31, 2021,2023, in conformity with U.S. generally accepted accounting principles.
We also have audited, in accordance with the standards of the Public Company Accounting Oversight Board (United States) (PCAOB), the Company's internal control over financial reporting as of December 31, 2021,2023, based on criteria established in Internal Control-Integrated Framework issued by the Committee of Sponsoring Organizations of the Treadway Commission 2013 framework,(2013 framework), and our report dated February 23, 202221, 2024 expressed an unqualified opinion thereon.
Basis for Opinion
These financial statements are the responsibility of the Company's management. Our responsibility is to express an opinion on the Company’s financial statements based on our audits. We are a public accounting firm registered with the PCAOB and are required to be independent with respect to the Company in accordance with the U.S. federal securities laws and the applicable rules and regulations of the Securities and Exchange Commission and the PCAOB.
We conducted our audits in accordance with the standards of the PCAOB. Those standards require that we plan and perform the audit to obtain reasonable assurance about whether the financial statements are free of material misstatement, whether due to error or fraud. Our audits included performing procedures to assess the risks of material misstatement of the financial statements, whether due to error or fraud, and performing procedures that respond to those risks. Such procedures included examining, on a test basis, evidence regarding the amounts and disclosures in the financial statements. Our audits also included evaluating the accounting principles used and significant estimates made by management, as well as evaluating the overall presentation of the financial statements. We believe that our audits provide a reasonable basis for our opinion.
Critical Audit Matter
The critical audit matter communicated below is a matter arising from the current period audit of the financial statements that was communicated or required to be communicated to the audit committee and that: (1) relates to accounts or disclosures that are material to the financial statements and (2) involved our especially challenging, subjective, or complex judgments. The communication of the critical audit matter does not alter in any way our opinion on the consolidated financial statements, taken as a whole, and we are not, by communicating the critical audit matter below, providing a separate opinion on the critical audit matter or on the account or disclosure to which it relates.
DefinedPension and Other Postretirement Benefit Pension ObligationObligations
Description of the Matter | At December 31, |
48
nature of the actuarial assumptions, such as discount rates and |
How We Addressed the Matter in Our Audit | We obtained an understanding, evaluated the design, and tested the operating effectiveness of controls over the Company’s valuation of the projected benefit obligation. For example, we tested the Company’s controls over management’s review of the significant assumptions utilized in the valuation, including discount and |
/s/ Ernst & Young LLP
We have served as the Company’s auditor since 2006.
Chicago, Illinois
February 23, 202221, 2024
49
Report of Independent Registered Public Accounting Firm
To the Stockholders and the Board of Directors of Ryerson Holding Corporation and Subsidiary Companies
Opinion on Internal Control overOver Financial Reporting
We have audited Ryerson Holding Corporation and subsidiaries’Subsidiary Companies' internal control over financial reporting as of December 31, 2021,2023, based on criteria established in Internal Control—Integrated Framework issued by the Committee of Sponsoring Organizations of the Treadway Commission (2013 framework) (the COSO criteria). In our opinion, Ryerson Holding Corporation and subsidiariesSubsidiary Companies (the Company) maintained, in all material respects, effective internal control over financial reporting as of December 31, 2021,2023, based on the COSO criteria.
As indicated in the accompanying Management’s Report on Internal Control over Financial Reporting, management’s assessment of and conclusion on the effectiveness of internal control over financial reporting did not include the internal controls of BLP Holdings, LLC, Norlen Incorporated, TSA Processing, and Hudson Tool Steel Corporation, which are included in the 2023 consolidated financial statements of the Company and constituted 7.0% and 1.8% of total assets and total liabilities, respectively, as of December 31, 2023 and 0.8% and 1.2% of net sales and net income, respectively, for the year then ended. Our audit of internal control over financial reporting of the Company also did not include an evaluation of the internal control over financial reporting of BLP Holdings, LLC, Norlen Incorporated, TSA Processing, and Hudson Tool Steel Corporation.
We also have audited, in accordance with the standards of the Public Company Accounting Oversight Board (United States) (PCAOB), the 20212023 consolidated financial statements of the Company and our report dated February 23, 202221, 2024 expressed an unqualified opinion thereon.
Basis for Opinion
The Company’s management is responsible for maintaining effective internal control over financial reporting and for its assessment of the effectiveness of internal control over financial reporting included in the accompanying Management’s Report on Internal Control over Financial Reporting. Our responsibility is to express an opinion on the Company’s internal control over financial reporting based on our audit. We are a public accounting firm registered with the PCAOB and are required to be independent with respect to the Company in accordance with the U.S. federal securities laws and the applicable rules and regulations of the Securities and Exchange Commission and the PCAOB.
We conducted our audit in accordance with the standards of the PCAOB. Those standards require that we plan and perform the audit to obtain reasonable assurance about whether effective internal control over financial reporting was maintained in all material respects.
Our audit included obtaining an understanding of internal control over financial reporting, assessing the risk that a material weakness exists, testing and evaluating the design and operating effectiveness of internal control based on the assessed risk, and performing such other procedures as we considered necessary in the circumstances. We believe that our audit provides a reasonable basis for our opinion.
Definition and Limitations of Internal Control overOver Financial Reporting
A company’s internal control over financial reporting is a process designed to provide reasonable assurance regarding the reliability of financial reporting and the preparation of financial statements for external purposes in accordance with generally accepted accounting principles. A company’s internal control over financial reporting includes those policies and procedures that (1) pertain to the maintenance of records that, in reasonable detail, accurately and fairly reflect the transactions and dispositions of the assets of the company; (2) provide reasonable assurance that transactions are recorded as necessary to permit preparation of financial statements in accordance with generally accepted accounting principles, and that receipts and expenditures of the company are being made only in accordance with authorizations of management and directors of the company; and (3) provide reasonable assurance regarding prevention or timely detection of unauthorized acquisition, use, or disposition of the company’s assets that could have a material effect on the financial statements.
Because of its inherent limitations, internal control over financial reporting may not prevent or detect misstatements. Also, projections of any evaluation of effectiveness to future periods are subject to the risk that controls may become inadequate because of changes in conditions, or that the degree of compliance with the policies or procedures may deteriorate.
50
/s/ Ernst & Young LLP
Chicago, Illinois
February 23, 202221, 2024
RYERSON HOLDING CORPORATION AND SUBSIDIARY COMPANIES
CONSOLIDATED STATEMENTS OF OPERATIONS
(In millions, except per share data)
|
| Year Ended December 31, |
|
| Year Ended December 31, |
| ||||||||||||||||||
|
| 2021 |
|
| 2020 |
|
| 2019 |
|
| 2023 |
|
| 2022 |
|
| 2021 |
| ||||||
Net sales |
| $ | 5,675.3 |
|
| $ | 3,466.6 |
|
| $ | 4,501.6 |
|
| $ | 5,108.7 |
|
| $ | 6,323.6 |
|
| $ | 5,675.3 |
|
Cost of materials sold |
|
| 4,528.5 |
|
|
| 2,845.5 |
|
|
| 3,673.7 |
|
|
| 4,087.1 |
|
|
| 5,013.5 |
|
|
| 4,528.5 |
|
Gross profit |
|
| 1,146.8 |
|
|
| 621.1 |
|
|
| 827.9 |
|
|
| 1,021.6 |
|
|
| 1,310.1 |
|
|
| 1,146.8 |
|
Warehousing, delivery, selling, general, and administrative |
|
| 711.2 |
|
|
| 554.3 |
|
|
| 636.8 |
|
|
| 793.5 |
|
|
| 735.2 |
|
|
| 711.2 |
|
Gain on sale of assets |
|
| (109.6 | ) |
|
| — |
|
|
| (20.6 | ) |
|
| — |
|
|
| (3.8 | ) |
|
| (109.6 | ) |
Gain on insurance settlement |
|
| — |
|
|
| — |
|
|
| (1.5 | ) | ||||||||||||
Restructuring and other charges |
|
| — |
|
|
| 2.2 |
|
|
| 2.4 |
| ||||||||||||
Operating profit |
|
| 545.2 |
|
|
| 64.6 |
|
|
| 210.8 |
|
|
| 228.1 |
|
|
| 578.7 |
|
|
| 545.2 |
|
Other income (expense): |
|
|
|
|
|
|
|
|
|
|
|
|
|
|
|
|
|
|
|
|
| |||
Interest and other expense on debt |
|
| (51.0 | ) |
|
| (76.4 | ) |
|
| (93.2 | ) |
|
| (34.7 | ) |
|
| (33.2 | ) |
|
| (51.0 | ) |
Pension settlement charges |
|
| (98.7 | ) |
|
| (65.9 | ) |
|
| (1.6 | ) |
|
| — |
|
|
| — |
|
|
| (98.7 | ) |
Loss on retirement of debt |
|
| (5.5 | ) |
|
| (17.7 | ) |
|
| (0.2 | ) |
|
| — |
|
|
| (21.3 | ) |
|
| (5.5 | ) |
Other income and (expense), net |
|
| (0.9 | ) |
|
| 5.3 |
|
|
| (0.6 | ) |
|
| 0.3 |
|
|
| (1.3 | ) |
|
| (0.9 | ) |
Income (loss) before income taxes |
|
| 389.1 |
|
|
| (90.1 | ) |
|
| 115.2 |
| ||||||||||||
Provision (benefit) for income taxes |
|
| 93.7 |
|
|
| (24.8 | ) |
|
| 32.5 |
| ||||||||||||
Net income (loss) |
|
| 295.4 |
|
|
| (65.3 | ) |
|
| 82.7 |
| ||||||||||||
Income before income taxes |
|
| 193.7 |
|
|
| 522.9 |
|
|
| 389.1 |
| ||||||||||||
Provision for income taxes |
|
| 47.3 |
|
|
| 131.4 |
|
|
| 93.7 |
| ||||||||||||
Net income |
|
| 146.4 |
|
|
| 391.5 |
|
|
| 295.4 |
| ||||||||||||
Less: Net income attributable to noncontrolling interest |
|
| 1.1 |
|
|
| 0.5 |
|
|
| 0.3 |
|
|
| 0.7 |
|
|
| 0.5 |
|
|
| 1.1 |
|
Net income (loss) attributable to Ryerson Holding Corporation |
| $ | 294.3 |
|
| $ | (65.8 | ) |
| $ | 82.4 |
| ||||||||||||
Basic earnings (loss) per share |
| $ | 7.67 |
|
| $ | (1.73 | ) |
| $ | 2.19 |
| ||||||||||||
Diluted earnings (loss) per share |
| $ | 7.56 |
|
| $ | (1.73 | ) |
| $ | 2.17 |
| ||||||||||||
Net income attributable to Ryerson Holding Corporation |
| $ | 145.7 |
|
| $ | 391.0 |
|
| $ | 294.3 |
| ||||||||||||
Basic earnings per share |
| $ | 4.17 |
|
| $ | 10.41 |
|
| $ | 7.67 |
| ||||||||||||
Diluted earnings per share |
| $ | 4.10 |
|
| $ | 10.21 |
|
| $ | 7.56 |
| ||||||||||||
|
|
|
|
|
|
|
|
|
|
|
|
|
|
|
|
|
|
|
|
|
| |||
Dividends declared per share |
| $ | 0.165 |
|
| $ | — |
|
| $ | — |
|
| $ | 0.7175 |
|
| $ | 0.5350 |
|
| $ | 0.1650 |
|
See Notes to Consolidated Financial Statements
51
RYERSON HOLDING CORPORATION AND SUBSIDIARY COMPANIES
CONSOLIDATED STATEMENTS OF COMPREHENSIVE INCOME
(In millions)
|
| Year Ended December 31, |
| |||||||||||||||||||||
|
| 2021 |
|
| 2020 |
|
| 2019 |
|
| Year Ended December 31, |
| ||||||||||||
Net income (loss) |
| $ | 295.4 |
|
| $ | (65.3 | ) |
| $ | 82.7 |
| ||||||||||||
|
| 2023 |
|
| 2022 |
|
| 2021 |
| |||||||||||||||
Net income |
| $ | 146.4 |
|
| $ | 391.5 |
|
| $ | 295.4 |
| ||||||||||||
Other comprehensive income (loss), before tax: |
|
|
|
|
|
|
|
|
|
|
|
|
|
|
|
|
|
|
|
|
| |||
Foreign currency translation adjustments |
|
| (2.1 | ) |
|
| 1.6 |
|
|
| 4.3 |
|
|
| 4.7 |
|
|
| (7.8 | ) |
|
| (2.1 | ) |
Gain (loss) on cash flow hedges |
|
| 2.1 |
|
|
| (3.8 | ) |
|
| (1.8 | ) | ||||||||||||
Gain on cash flow hedges |
|
| — |
|
|
| 1.9 |
|
|
| 2.1 |
| ||||||||||||
Changes in defined benefit pension and other post-retirement benefit plans |
|
| 142.4 |
|
|
| 41.8 |
|
|
| 14.0 |
|
|
| (0.3 | ) |
|
| 38.6 |
|
|
| 142.4 |
|
Other comprehensive income, before tax |
|
| 142.4 |
|
|
| 39.6 |
|
|
| 16.5 |
|
|
| 4.4 |
|
|
| 32.7 |
|
|
| 142.4 |
|
Income tax provision related to items of other comprehensive income |
|
| 35.6 |
|
|
| 9.5 |
|
|
| 2.6 |
|
|
| — |
|
|
| 12.0 |
|
|
| 35.6 |
|
Comprehensive income (loss), after tax |
|
| 402.2 |
|
|
| (35.2 | ) |
|
| 96.6 |
| ||||||||||||
Less: Comprehensive income attributable to the noncontrolling interest |
|
| 1.1 |
|
|
| 0.5 |
|
|
| 0.4 |
| ||||||||||||
Comprehensive income (loss) attributable to Ryerson Holding Corporation |
| $ | 401.1 |
|
| $ | (35.7 | ) |
| $ | 96.2 |
| ||||||||||||
Comprehensive income, after tax |
|
| 150.8 |
|
|
| 412.2 |
|
|
| 402.2 |
| ||||||||||||
Less: Comprehensive income attributable to noncontrolling interest |
|
| 0.7 |
|
|
| 0.5 |
|
|
| 1.1 |
| ||||||||||||
Comprehensive income attributable to Ryerson Holding Corporation |
| $ | 150.1 |
|
| $ | 411.7 |
|
| $ | 401.1 |
| ||||||||||||
See Notes to Consolidated Financial Statements
52
RYERSON HOLDING CORPORATION AND SUBSIDIARY COMPANIES
CONSOLIDATED STATEMENTS OF CASH FLOWS
(In millions)
|
| Year Ended December 31, |
|
| Year Ended December 31, |
| ||||||||||||||||||
|
| 2021 |
|
| 2020 |
|
| 2019 |
|
| 2023 |
|
| 2022 |
|
| 2021 |
| ||||||
Operating activities: |
|
|
|
|
|
|
|
|
|
|
|
|
|
|
|
|
|
|
|
|
| |||
Net income (loss) |
| $ | 295.4 |
|
| $ | (65.3 | ) |
| $ | 82.7 |
| ||||||||||||
Adjustments to reconcile net income (loss) to net cash provided by operating activities: |
|
|
|
|
|
|
|
|
|
|
|
| ||||||||||||
Net income |
| $ | 146.4 |
|
| $ | 391.5 |
|
| $ | 295.4 |
| ||||||||||||
Adjustments to reconcile net income to net cash provided by |
|
|
|
|
|
|
|
|
| |||||||||||||||
Depreciation and amortization |
|
| 55.9 |
|
|
| 53.9 |
|
|
| 58.4 |
|
|
| 62.5 |
|
|
| 59.0 |
|
|
| 55.9 |
|
Stock-based compensation |
|
| 5.5 |
|
|
| 1.9 |
|
|
| 3.1 |
|
|
| 13.8 |
|
|
| 9.1 |
|
|
| 5.5 |
|
Deferred income taxes |
|
| 0.6 |
|
|
| (16.6 | ) |
|
| 48.0 |
|
|
| 16.8 |
|
|
| 7.4 |
|
|
| 0.6 |
|
Provision for allowances, claims, and doubtful accounts |
|
| 3.2 |
|
|
| (0.7 | ) |
|
| 3.5 |
|
|
| (0.1 | ) |
|
| 0.2 |
|
|
| 3.2 |
|
Restructuring and other charges |
|
| — |
|
|
| 2.2 |
|
|
| 2.4 |
| ||||||||||||
Loss on retirement of debt |
|
| 5.5 |
|
|
| 17.7 |
|
|
| 0.2 |
|
|
| — |
|
|
| 21.3 |
|
|
| 5.5 |
|
Gain on sale of assets |
|
| (109.6 | ) |
|
| — |
|
|
| (20.6 | ) |
|
| — |
|
|
| (3.8 | ) |
|
| (109.6 | ) |
Gain on bargain purchase |
|
| — |
|
|
| (0.6 | ) |
|
| — |
| ||||||||||||
Non-cash (gain) loss from derivatives |
|
| 27.6 |
|
|
| (10.6 | ) |
|
| 0.6 |
|
|
| (11.3 | ) |
|
| (17.9 | ) |
|
| 27.6 |
|
Gain on insurance settlement |
|
| — |
|
|
| — |
|
|
| (1.5 | ) | ||||||||||||
Pension settlement charge |
|
| 98.7 |
|
|
| 65.9 |
|
|
| 1.6 |
|
|
| — |
|
|
| — |
|
|
| 98.7 |
|
Pension and other postretirement benefits curtailment gain |
|
| (0.8 | ) |
|
| — |
|
|
| — |
| ||||||||||||
Other items |
|
| 0.1 |
|
|
| 0.2 |
|
|
| 1.2 |
|
|
| (0.4 | ) |
|
| (0.6 | ) |
|
| 0.1 |
|
Change in operating assets and liabilities, net of effects of acquisitions: |
|
|
|
|
|
|
|
|
|
|
|
|
|
|
|
|
|
|
|
|
| |||
Receivables |
|
| (252.5 | ) |
|
| 46.7 |
|
|
| 92.5 |
|
|
| 67.9 |
|
|
| 126.7 |
|
|
| (252.5 | ) |
Inventories |
|
| (227.9 | ) |
|
| 138.9 |
|
|
| 65.9 |
|
|
| 28.8 |
|
|
| 39.9 |
|
|
| (227.9 | ) |
Other assets and liabilities |
|
| (23.3 | ) |
|
| 13.0 |
|
|
| 4.9 |
|
|
| 6.4 |
|
|
| 19.2 |
|
|
| (23.3 | ) |
Accounts payable |
|
| 123.6 |
|
|
| 25.8 |
|
|
| (78.2 | ) |
|
| 24.8 |
|
|
| (72.1 | ) |
|
| 123.6 |
|
Accrued liabilities |
|
| 32.0 |
|
|
| 16.7 |
|
|
| (34.6 | ) |
|
| (17.3 | ) |
|
| (17.5 | ) |
|
| 32.0 |
|
Accrued taxes payable/receivable |
|
| 25.2 |
|
|
| (1.2 | ) |
|
| (7.6 | ) |
|
| 23.3 |
|
|
| (52.9 | ) |
|
| 25.2 |
|
Deferred employee benefit costs |
|
| (25.0 | ) |
|
| (10.6 | ) |
|
| (29.4 | ) |
|
| (11.6 | ) |
|
| (7.7 | ) |
|
| (25.0 | ) |
Tenant improvement allowance |
|
| 15.9 |
|
|
| — |
|
|
| — |
| ||||||||||||
Net adjustments |
|
| (260.4 | ) |
|
| 343.2 |
|
|
| 110.4 |
|
|
| 218.7 |
|
|
| 109.7 |
|
|
| (260.4 | ) |
Net cash provided by operating activities |
|
| 35.0 |
|
|
| 277.9 |
|
|
| 193.1 |
|
|
| 365.1 |
|
|
| 501.2 |
|
|
| 35.0 |
|
Investing activities: |
|
|
|
|
|
|
|
|
|
|
|
|
|
|
|
|
|
|
|
|
| |||
Acquisitions, net of cash acquired |
|
| (14.5 | ) |
|
| — |
|
|
| — |
|
|
| (137.8 | ) |
|
| (57.0 | ) |
|
| (14.5 | ) |
Capital expenditures |
|
| (59.3 | ) |
|
| (26.0 | ) |
|
| (45.8 | ) |
|
| (121.9 | ) |
|
| (105.1 | ) |
|
| (59.3 | ) |
Proceeds from sale of property, plant, and equipment |
|
| 166.3 |
|
|
| 0.1 |
|
|
| 70.4 |
|
|
| 0.5 |
|
|
| 8.0 |
|
|
| 166.3 |
|
Proceeds from insurance settlement |
|
| — |
|
|
| — |
|
|
| 1.8 |
|
|
| 0.3 |
|
|
| — |
|
|
| — |
|
Proceeds from other investing activities |
|
| 1.9 |
|
|
| — |
|
|
| — |
| ||||||||||||
Investment in subsidiary |
|
| — |
|
|
| (2.0 | ) |
|
| — |
| ||||||||||||
Other investing activities |
|
| (3.2 | ) |
|
| (3.9 | ) |
|
| 1.9 |
| ||||||||||||
Net cash provided by (used in) investing activities |
|
| 94.4 |
|
|
| (25.9 | ) |
|
| 26.4 |
|
|
| (262.1 | ) |
|
| (160.0 | ) |
|
| 94.4 |
|
Financing activities: |
|
|
|
|
|
|
|
|
|
|
|
|
|
|
|
|
|
|
|
|
| |||
Long term debt issued |
|
| — |
|
|
| 500.0 |
|
|
| — |
| ||||||||||||
Repayment of debt |
|
| (157.3 | ) |
|
| (654.7 | ) |
|
| (12.7 | ) |
|
| (1.7 | ) |
|
| (321.3 | ) |
|
| (157.3 | ) |
Net proceeds (repayments) of short-term borrowings |
|
| 45.8 |
|
|
| (93.8 | ) |
|
| (164.6 | ) | ||||||||||||
Bond issuance costs |
|
| — |
|
|
| (10.9 | ) |
|
| — |
| ||||||||||||
Net proceeds of short-term borrowings |
|
| 69.8 |
|
|
| 26.1 |
|
|
| 45.8 |
| ||||||||||||
Credit facility issuance costs |
|
| — |
|
|
| (4.9 | ) |
|
| — |
|
|
| — |
|
|
| (2.7 | ) |
|
| — |
|
Net increase (decrease) in book overdrafts |
|
| (7.7 | ) |
|
| 27.4 |
|
|
| 0.1 |
|
|
| (7.1 | ) |
|
| 29.6 |
|
|
| (7.7 | ) |
Principal payments on finance lease obligations |
|
| (10.5 | ) |
|
| (13.1 | ) |
|
| (13.6 | ) |
|
| (7.1 | ) |
|
| (9.2 | ) |
|
| (10.5 | ) |
Dividends paid to shareholders |
|
| (24.8 | ) |
|
| (19.9 | ) |
|
| (6.4 | ) | ||||||||||||
Share repurchases |
|
| (113.9 | ) |
|
| (50.0 | ) |
|
| (1.8 | ) | ||||||||||||
Contingent payment related to acquisitions |
|
| — |
|
|
| — |
|
|
| (1.3 | ) |
|
| (0.3 | ) |
|
| — |
|
|
| — |
|
Proceeds from sale leaseback transactions |
|
| — |
|
|
| — |
|
|
| 8.3 |
| ||||||||||||
Dividends paid to shareholders |
|
| (6.4 | ) |
|
| — |
|
|
| — |
| ||||||||||||
Dividends paid to non-controlling interest |
|
| — |
|
|
| (0.2 | ) |
|
| — |
| ||||||||||||
Share repurchases |
|
| (1.8 | ) |
|
| — |
|
|
| — |
| ||||||||||||
Tax withholdings on stock-based compensation awards |
|
| (3.2 | ) |
|
| (2.7 | ) |
|
| — |
| ||||||||||||
Net cash used in financing activities |
|
| (137.9 | ) |
|
| (250.2 | ) |
|
| (183.8 | ) |
|
| (88.3 | ) |
|
| (350.1 | ) |
|
| (137.9 | ) |
Net increase (decrease) in cash, cash equivalents, and restricted cash |
|
| (8.5 | ) |
|
| 1.8 |
|
|
| 35.7 |
|
|
| 14.7 |
|
|
| (8.9 | ) |
|
| (8.5 | ) |
Effect of exchange rate changes on cash, cash equivalents, and restricted cash |
|
| (1.6 | ) |
|
| 0.9 |
|
|
| (0.2 | ) |
|
| 0.2 |
|
|
| (3.0 | ) |
|
| (1.6 | ) |
Net change in cash, cash equivalents, and restricted cash |
|
| (10.1 | ) |
|
| 2.7 |
|
|
| 35.5 |
|
|
| 14.9 |
|
|
| (11.9 | ) |
|
| (10.1 | ) |
Cash, cash equivalents, and restricted cash—beginning of period |
|
| 62.5 |
|
|
| 59.8 |
|
|
| 24.3 |
|
|
| 40.5 |
|
|
| 52.4 |
|
|
| 62.5 |
|
Cash, cash equivalents, and restricted cash—end of period |
| $ | 52.4 |
|
| $ | 62.5 |
|
| $ | 59.8 |
|
| $ | 55.4 |
|
| $ | 40.5 |
|
| $ | 52.4 |
|
Supplemental disclosures: |
|
|
|
|
|
|
|
|
|
|
|
|
|
|
|
|
|
|
|
|
| |||
Cash paid (received) during the period for: |
|
|
|
|
|
|
|
|
|
|
|
| ||||||||||||
Cash paid during the period for: |
|
|
|
|
|
|
|
|
| |||||||||||||||
Interest paid to third parties, net |
| $ | 51.1 |
|
| $ | 62.0 |
|
| $ | 88.3 |
|
| $ | 29.9 |
|
| $ | 38.3 |
|
| $ | 51.1 |
|
Income taxes, net |
|
| 70.2 |
|
|
| (5.7 | ) |
|
| (6.6 | ) |
|
| 6.2 |
|
|
| 176.9 |
|
|
| 70.2 |
|
Noncash investing activities: |
|
|
|
|
|
|
|
|
|
|
|
| ||||||||||||
Asset additions under adoption of accounting principal ASC 842 |
|
| ��� |
|
|
| — |
|
|
| 82.3 |
| ||||||||||||
Noncash activities: |
|
|
|
|
|
|
|
|
| |||||||||||||||
Asset additions under operating leases |
|
| 129.6 |
|
|
| 1.6 |
|
|
| 64.8 |
|
|
| 138.8 |
|
|
| 61.6 |
|
|
| 129.6 |
|
Asset additions under finance leases and failed sale-leasebacks |
|
| 15.8 |
|
|
| 3.6 |
|
|
| 2.2 |
| ||||||||||||
Asset additions under financing arrangements |
|
| — |
|
|
| — |
|
|
| 2.2 |
| ||||||||||||
Noncash financing activities: |
|
|
|
|
|
|
|
|
|
|
|
| ||||||||||||
Short term debt converted to finance lease |
|
| — |
|
|
| — |
|
|
| 7.6 |
| ||||||||||||
Asset additions under finance leases |
|
| 5.3 |
|
|
| 3.9 |
|
|
| 15.8 |
| ||||||||||||
See Notes to Consolidated Financial Statements
53
RYERSON HOLDING CORPORATION AND SUBSIDIARY COMPANIES
CONSOLIDATED BALANCE SHEETS
(In millions, except shares and per share data)
|
| At December 31, |
|
| At December 31, |
| ||||||||||
|
| 2021 |
|
| 2020 |
|
| 2023 |
|
| 2022 |
| ||||
Assets |
|
|
|
|
|
|
|
|
|
|
|
|
|
| ||
Current assets: |
|
|
|
|
|
|
|
|
|
|
|
|
|
| ||
Cash and cash equivalents |
| $ | 51.2 |
|
| $ | 61.4 |
|
| $ | 54.3 |
|
| $ | 39.2 |
|
Restricted cash (Note 3) |
|
| 1.2 |
|
|
| 1.1 |
|
|
| 1.1 |
|
|
| 1.3 |
|
Receivables less provisions of $2.2 at December 31, 2021 and $1.7 at December 31, 2020 (Note 18) |
|
| 630.8 |
|
|
| 378.9 |
| ||||||||
Receivables less provisions of $1.7 at December 31, 2023 and $3.2 at December 31, 2022 (Note 17) |
|
| 467.7 |
|
|
| 514.4 |
| ||||||||
Inventories (Note 4) |
|
| 832.1 |
|
|
| 604.5 |
|
|
| 782.5 |
|
|
| 798.5 |
|
Prepaid expenses and other current assets |
|
| 77.7 |
|
|
| 57.5 |
|
|
| 77.8 |
|
|
| 88.2 |
|
Total current assets |
|
| 1,593.0 |
|
|
| 1,103.4 |
|
|
| 1,383.4 |
|
|
| 1,441.6 |
|
Property, plant, and equipment, net of accumulated depreciation (Note 5) |
|
| 388.3 |
|
|
| 421.8 |
|
|
| 589.6 |
|
|
| 458.4 |
|
Operating lease assets (Note 6) |
|
| 211.1 |
|
|
| 108.3 |
|
|
| 349.4 |
|
|
| 240.5 |
|
Other intangible assets (Note 7) |
|
| 42.2 |
|
|
| 43.2 |
|
|
| 73.7 |
|
|
| 50.9 |
|
Goodwill (Note 8) |
|
| 124.1 |
|
|
| 120.3 |
|
|
| 157.8 |
|
|
| 129.2 |
|
Deferred charges and other assets |
|
| 6.9 |
|
|
| 5.1 |
|
|
| 15.7 |
|
|
| 13.7 |
|
Total assets |
| $ | 2,365.6 |
|
| $ | 1,802.1 |
|
| $ | 2,569.6 |
|
| $ | 2,334.3 |
|
Liabilities |
|
|
|
|
|
|
|
|
|
|
|
|
|
| ||
Current liabilities: |
|
|
|
|
|
|
|
|
|
|
|
|
|
| ||
Accounts payable |
| $ | 481.2 |
|
| $ | 365.1 |
|
| $ | 463.4 |
|
| $ | 438.4 |
|
Accrued liabilities: |
|
|
|
|
|
|
|
|
|
|
|
|
|
| ||
Salaries, wages, and commissions |
|
| 76.6 |
|
|
| 43.1 |
|
|
| 51.9 |
|
|
| 67.3 |
|
Other accrued liabilities |
|
| 133.4 |
|
|
| 78.3 |
|
|
| 75.9 |
|
|
| 77.7 |
|
Short-term debt (Note 10) |
|
| 28.8 |
|
|
| 13.8 |
| ||||||||
Short-term debt (Note 9) |
|
| 8.2 |
|
|
| 5.8 |
| ||||||||
Current portion of operating lease liabilities (Note 6) |
|
| 24.9 |
|
|
| 20.7 |
|
|
| 30.5 |
|
|
| 25.2 |
|
Current portion of deferred employee benefits (Note 11) |
|
| 6.1 |
|
|
| 6.6 |
| ||||||||
Current portion of deferred employee benefits (Note 10) |
|
| 4.0 |
|
|
| 4.8 |
| ||||||||
Total current liabilities |
|
| 751.0 |
|
|
| 527.6 |
|
|
| 633.9 |
|
|
| 619.2 |
|
Long-term debt (Note 10) |
|
| 610.5 |
|
|
| 726.2 |
| ||||||||
Deferred employee benefits (Note 11) |
|
| 163.3 |
|
|
| 231.6 |
| ||||||||
Long-term debt (Note 9) |
|
| 428.3 |
|
|
| 361.2 |
| ||||||||
Deferred employee benefits (Note 10) |
|
| 106.7 |
|
|
| 118.0 |
| ||||||||
Noncurrent operating lease liabilities (Note 6) |
|
| 184.8 |
|
|
| 93.0 |
|
|
| 336.8 |
|
|
| 215.1 |
|
Deferred income taxes (Note 19) |
|
| 94.1 |
|
|
| 58.2 |
| ||||||||
Deferred income taxes (Note 18) |
|
| 135.5 |
|
|
| 113.5 |
| ||||||||
Other noncurrent liabilities |
|
| 17.3 |
|
|
| 20.4 |
|
|
| 13.9 |
|
|
| 14.3 |
|
Total liabilities |
|
| 1,821.0 |
|
|
| 1,657.0 |
|
|
| 1,655.1 |
|
|
| 1,441.3 |
|
Commitments and contingencies (Note 13) |
|
|
|
|
|
|
|
| ||||||||
Commitments and contingencies (Note 12) |
|
|
|
|
|
| ||||||||||
Equity |
|
|
|
|
|
|
|
|
|
|
|
|
|
| ||
Ryerson Holding Corporation stockholders’ equity: |
|
|
|
|
|
|
|
|
|
|
|
|
|
| ||
Preferred stock, $0.01 par value; 7,000,000 shares authorized and 0 shares issued at December 31, 2021 and December 31, 2020 |
|
| — |
|
|
| — |
| ||||||||
Common stock, $0.01 par value; 100,000,000 shares authorized and 38,687,094 shares issued at December 31, 2021; 100,000,000 shares authorized and 38,329,897 issued at December 31, 2020 |
|
| 0.4 |
|
|
| 0.4 |
| ||||||||
Preferred stock, $0.01 par value; 7,000,000 shares authorized and no shares issued at December 31, 2023 and December 31, 2022 |
|
| — |
|
|
| — |
| ||||||||
Common stock, $0.01 par value; 100,000,000 shares authorized and 39,450,659 shares issued at December 31, 2023; 100,000,000 shares authorized and 39,059,198 issued at December 31, 2022 |
|
| 0.4 |
|
|
| 0.4 |
| ||||||||
Capital in excess of par value |
|
| 388.6 |
|
|
| 383.1 |
|
|
| 411.6 |
|
|
| 397.7 |
|
Retained earnings |
|
| 321.7 |
|
|
| 33.8 |
|
|
| 813.2 |
|
|
| 692.5 |
|
Treasury stock at cost – Common stock of 292,932 shares at December 31, 2021 and 212,500 shares at December 31, 2020 |
|
| (8.4 | ) |
|
| (6.6 | ) | ||||||||
Accumulated other comprehensive loss (Note 16) |
|
| (165.1 | ) |
|
| (271.9 | ) | ||||||||
Treasury stock at cost – Common stock of 5,413,434 shares at December 31, 2023 and 2,070,654 shares at December 31, 2022 |
|
| (179.3 | ) |
|
| (61.1 | ) | ||||||||
Accumulated other comprehensive loss (Note 15) |
|
| (140.0 | ) |
|
| (144.4 | ) | ||||||||
Total Ryerson Holding Corporation stockholders’ equity |
|
| 537.2 |
|
|
| 138.8 |
|
|
| 905.9 |
|
|
| 885.1 |
|
Noncontrolling interest |
|
| 7.4 |
|
|
| 6.3 |
|
|
| 8.6 |
|
|
| 7.9 |
|
Total equity |
|
| 544.6 |
|
|
| 145.1 |
|
|
| 914.5 |
|
|
| 893.0 |
|
Total liabilities and equity |
| $ | 2,365.6 |
|
| $ | 1,802.1 |
|
| $ | 2,569.6 |
|
| $ | 2,334.3 |
|
See Notes to Consolidated Financial Statements
54
RYERSON HOLDING CORPORATION AND SUBSIDIARY COMPANIES
CONSOLIDATED STATEMENTS OF STOCKHOLDERS’ EQUITY
(In millions, except shares in thousands)
|
| Ryerson Holding Corporation Stockholders |
|
|
|
|
|
|
|
|
| |||||||||||||||||||||||||||||||||||||||||||||||||||||||||||||||||||||||||||||
|
|
|
|
|
|
|
|
|
|
|
|
|
|
|
|
|
|
|
|
|
|
|
|
|
| Accumulated Other Comprehensive Income (Loss) |
|
|
|
|
|
|
|
|
|
| Ryerson Holding Corporation Stockholders |
|
|
|
|
|
|
| ||||||||||||||||||||||||||||||||||||||||||||
|
| Common Stock |
|
| Treasury Stock |
|
| Capital in Excess of Par Value |
|
| Retained Earnings (Accumulated Deficit) |
|
| Foreign Currency Translation |
|
| Benefit Plan Liabilities |
|
| Cash Flow Hedge - Interest Rate Swap |
|
| Non- controlling Interest |
|
| Total Equity |
|
|
|
|
|
|
|
|
|
|
|
|
|
|
|
|
|
|
|
| Accumulated Other Comprehensive |
|
|
|
|
|
|
| ||||||||||||||||||||||||||||||||||
|
| Shares |
|
| Dollars |
|
| Shares |
|
| Dollars |
|
| Dollars |
|
| Dollars |
|
| Dollars |
|
| Dollars |
|
| Dollars |
|
| Dollars |
|
| Dollars |
|
| Common |
|
| Treasury |
|
| Capital in |
|
| Retained |
|
| Foreign |
|
| Benefit |
|
| Cash Flow |
|
| Non- |
|
| Total |
| ||||||||||||||||||||||||||||
Balance at January 1, 2019 |
|
| 37,656 |
|
| $ | 0.4 |
|
|
| (213 | ) |
| $ | (6.6 | ) |
| $ | 381.0 |
|
| $ | 14.2 |
|
| $ | (52.8 | ) |
| $ | (264.0 | ) |
| $ | 1.0 |
|
| $ | 2.7 |
|
| $ | 75.9 |
| ||||||||||||||||||||||||||||||||||||||||||||
|
| Shares |
|
| Dollars |
|
| Shares |
|
| Dollars |
|
| Dollars |
|
| Dollars |
|
| Dollars |
|
| Dollars |
|
| Dollars |
|
| Dollars |
|
| Dollars |
| |||||||||||||||||||||||||||||||||||||||||||||||||||||||
Balance at January 1, 2021 |
|
| 38,330 |
|
| $ | 0.4 |
|
|
| (213 | ) |
| $ | (6.6 | ) |
| $ | 383.1 |
|
| $ | 33.8 |
|
| $ | (47.0 | ) |
| $ | (221.8 | ) |
| $ | (3.1 | ) |
| $ | 6.3 |
|
| $ | 145.1 |
| ||||||||||||||||||||||||||||||||||||||||||||
Net income |
|
| — |
|
|
| — |
|
|
| — |
|
|
| — |
|
|
| — |
|
|
| 82.4 |
|
|
| — |
|
|
| — |
|
|
| — |
|
|
| 0.3 |
|
|
| 82.7 |
|
|
| — |
|
|
| — |
|
|
| — |
|
|
| — |
|
|
| — |
|
|
| 294.3 |
|
|
| — |
|
|
| — |
|
|
| — |
|
|
| 1.1 |
|
|
| 295.4 |
|
Foreign currency translation |
|
| — |
|
|
| — |
|
|
| — |
|
|
| — |
|
|
| — |
|
|
| — |
|
|
| 4.2 |
|
|
| — |
|
|
| — |
|
|
| 0.1 |
|
|
| 4.3 |
|
|
| — |
|
|
| — |
|
|
| — |
|
|
| — |
|
|
| — |
|
|
| — |
|
|
| (2.1 | ) |
|
| — |
|
|
| — |
|
|
| — |
|
|
| (2.1 | ) |
Changes in defined benefit pension and other post-retirement benefit plans, net of tax of $3.1 |
|
| — |
|
|
| — |
|
|
| — |
|
|
| — |
|
|
| — |
|
|
| — |
|
|
| — |
|
|
| 10.9 |
|
|
| — |
|
|
| — |
|
|
| 10.9 |
| ||||||||||||||||||||||||||||||||||||||||||||
Adoption of accounting principle ASU 2016-02 |
|
| — |
|
|
| — |
|
|
| — |
|
|
| — |
|
|
| — |
|
|
| 3.0 |
|
|
| — |
|
|
| — |
|
|
| — |
|
|
| — |
|
|
| 3.0 |
| ||||||||||||||||||||||||||||||||||||||||||||
Stock-based compensation expense |
| 340 |
|
|
| — |
|
|
| — |
|
|
| — |
|
|
| 3.1 |
|
|
| — |
|
|
| — |
|
|
| — |
|
|
| — |
|
|
| — |
|
|
| 3.1 |
| |||||||||||||||||||||||||||||||||||||||||||||
Purchase of subsidiary shares from noncontrolling interest |
|
| — |
|
|
| — |
|
|
| — |
|
|
| — |
|
|
| (2.9 | ) |
|
| — |
|
|
| — |
|
|
| — |
|
|
| — |
|
|
| 2.9 |
|
|
| — |
| ||||||||||||||||||||||||||||||||||||||||||||
Cash flow hedge - interest rate swap, net of tax of $0.5 |
|
| — |
|
|
| — |
|
|
| — |
|
|
| — |
|
|
| — |
|
|
| — |
|
|
| — |
|
|
| — |
|
|
| (1.3 | ) |
|
| — |
|
|
| (1.3 | ) | ||||||||||||||||||||||||||||||||||||||||||||
Balance at December 31, 2019 |
|
| 37,996 |
|
| $ | 0.4 |
|
|
| (213 | ) |
| $ | (6.6 | ) |
| $ | 381.2 |
|
| $ | 99.6 |
|
| $ | (48.6 | ) |
| $ | (253.1 | ) |
| $ | (0.3 | ) |
| $ | 6.0 |
|
| $ | 178.6 |
| ||||||||||||||||||||||||||||||||||||||||||||
Net income (loss) |
|
| — |
|
|
| — |
|
|
| — |
|
|
| — |
|
|
| — |
|
|
| (65.8 | ) |
|
| — |
|
|
| — |
|
|
| — |
|
|
| 0.5 |
|
|
| (65.3 | ) | ||||||||||||||||||||||||||||||||||||||||||||
Foreign currency translation |
|
| — |
|
|
| — |
|
|
| — |
|
|
| — |
|
|
| — |
|
|
| — |
|
|
| 1.6 |
|
|
| — |
|
|
| — |
|
|
| — |
|
|
| 1.6 |
| ||||||||||||||||||||||||||||||||||||||||||||
Changes in defined benefit pension and other post-retirement benefit plans, net of tax of $10.5 |
|
| — |
|
|
| — |
|
|
| — |
|
|
| — |
|
|
| — |
|
|
| — |
|
|
| — |
|
|
| 31.3 |
|
|
| — |
|
|
| — |
|
|
| 31.3 |
| ||||||||||||||||||||||||||||||||||||||||||||
Stock-based compensation expense |
| 334 |
|
|
| — |
|
|
| — |
|
|
| — |
|
|
| 1.9 |
|
|
| — |
|
|
| — |
|
|
| — |
|
|
| — |
|
|
| — |
|
|
| 1.9 |
| |||||||||||||||||||||||||||||||||||||||||||||
Dividends paid to noncontrolling interest |
|
| — |
|
|
| — |
|
|
| — |
|
|
| — |
|
|
| — |
|
|
| — |
|
|
| — |
|
|
| — |
|
|
| — |
|
|
| (0.2 | ) |
|
| (0.2 | ) | ||||||||||||||||||||||||||||||||||||||||||||
Cash flow hedge - interest rate swap, net of tax of $1.0 |
|
| — |
|
|
| — |
|
|
| — |
|
|
| — |
|
|
| — |
|
|
| — |
|
|
| — |
|
|
| — |
|
|
| (2.8 | ) |
|
| — |
|
|
| (2.8 | ) | ||||||||||||||||||||||||||||||||||||||||||||
Balance at December 31, 2020 |
|
| 38,330 |
|
| $ | 0.4 |
|
|
| (213 | ) |
| $ | (6.6 | ) |
| $ | 383.1 |
|
| $ | 33.8 |
|
| $ | (47.0 | ) |
| $ | (221.8 | ) |
| $ | (3.1 | ) |
| $ | 6.3 |
|
| $ | 145.1 |
| ||||||||||||||||||||||||||||||||||||||||||||
Net income |
|
| — |
|
|
| — |
|
|
| — |
|
|
| — |
|
|
| — |
|
|
| 294.3 |
|
|
| — |
|
|
| — |
|
|
| — |
|
|
| 1.1 |
|
|
| 295.4 |
| ||||||||||||||||||||||||||||||||||||||||||||
Foreign currency translation |
|
| — |
|
|
| — |
|
|
| — |
|
|
| — |
|
|
| — |
|
|
| — |
|
|
| (2.1 | ) |
|
| — |
|
|
| — |
|
|
| — |
|
|
| (2.1 | ) | ||||||||||||||||||||||||||||||||||||||||||||
Changes in defined benefit pension and other post-retirement benefit plans, net of tax of $35.1 |
|
| — |
|
|
| — |
|
|
| — |
|
|
| — |
|
|
| — |
|
|
| — |
|
|
| — |
|
|
| 107.3 |
|
|
| — |
|
|
| — |
|
|
| 107.3 |
| ||||||||||||||||||||||||||||||||||||||||||||
Changes in defined benefit pension and other post-retirement benefit plans, net of tax of $35.1 |
|
| — |
|
|
| — |
|
|
| — |
|
|
| — |
|
|
| — |
|
|
| — |
|
|
| — |
|
|
| 107.3 |
|
|
| — |
|
|
| — |
|
|
| 107.3 |
| ||||||||||||||||||||||||||||||||||||||||||||
Share repurchases |
|
| — |
|
|
| — |
|
|
| (80 | ) |
|
| (1.8 | ) |
|
| — |
|
|
| — |
|
|
| — |
|
|
| — |
|
|
| — |
|
|
| — |
|
|
| (1.8 | ) |
|
| — |
|
|
| — |
|
|
| (80 | ) |
|
| (1.8 | ) |
|
| — |
|
|
| — |
|
|
| — |
|
|
| — |
|
|
| — |
|
|
| — |
|
|
| (1.8 | ) |
Stock-based compensation expense |
|
| 357 |
|
|
| — |
|
|
| — |
|
|
| — |
|
|
| 5.5 |
|
|
| — |
|
|
| — |
|
|
| — |
|
|
| — |
|
|
| — |
|
|
| 5.5 |
|
|
| 357 |
|
|
| — |
|
|
| — |
|
|
| — |
|
|
| 5.5 |
|
|
| — |
|
|
| — |
|
|
| — |
|
|
| — |
|
|
| — |
|
|
| 5.5 |
|
Cash dividends and dividend equivalents |
|
| — |
|
|
| — |
|
|
| — |
|
|
| — |
|
|
| — |
|
|
| (6.4 | ) |
|
| — |
|
|
| — |
|
|
| — |
|
|
| — |
|
|
| (6.4 | ) |
|
| — |
|
|
| — |
|
|
| — |
|
|
| — |
|
|
| — |
|
|
| (6.4 | ) |
|
| — |
|
|
| — |
|
|
| — |
|
|
| — |
|
|
| (6.4 | ) |
Cash flow hedge - interest rate swap, net of tax of $0.5 |
|
| — |
|
|
| — |
|
|
| — |
|
|
| — |
|
|
| — |
|
|
| — |
|
|
| — |
|
|
| — |
|
|
| 1.6 |
|
|
| — |
|
|
| 1.6 |
| ||||||||||||||||||||||||||||||||||||||||||||
Cash flow hedge - interest rate swap, net of tax of $0.5 |
|
| — |
|
|
| — |
|
|
| — |
|
|
| — |
|
|
| — |
|
|
| — |
|
|
| — |
|
|
| — |
|
|
| 1.6 |
|
|
| — |
|
|
| 1.6 |
| ||||||||||||||||||||||||||||||||||||||||||||
Balance at December 31, 2021 |
|
| 38,687 |
|
| $ | 0.4 |
|
|
| (293 | ) |
| $ | (8.4 | ) |
| $ | 388.6 |
|
| $ | 321.7 |
|
| $ | (49.1 | ) |
| $ | (114.5 | ) |
| $ | (1.5 | ) |
| $ | 7.4 |
|
| $ | 544.6 |
|
|
| 38,687 |
|
| $ | 0.4 |
|
|
| (293 | ) |
| $ | (8.4 | ) |
| $ | 388.6 |
|
| $ | 321.7 |
|
| $ | (49.1 | ) |
| $ | (114.5 | ) |
| $ | (1.5 | ) |
| $ | 7.4 |
|
| $ | 544.6 |
|
Net income |
|
| — |
|
|
| — |
|
|
| — |
|
|
| — |
|
|
| — |
|
|
| 391.0 |
|
|
| — |
|
|
| — |
|
|
| — |
|
|
| 0.5 |
|
|
| 391.5 |
| ||||||||||||||||||||||||||||||||||||||||||||
Foreign currency translation |
|
| — |
|
|
| — |
|
|
| — |
|
|
| — |
|
|
| — |
|
|
| — |
|
|
| (7.8 | ) |
|
| — |
|
|
| — |
|
|
| — |
|
|
| (7.8 | ) | ||||||||||||||||||||||||||||||||||||||||||||
Changes in defined benefit pension and other post-retirement benefit plans, net of tax of $11.6 |
|
| — |
|
|
| — |
|
|
| — |
|
|
| — |
|
|
| — |
|
|
| — |
|
|
| — |
|
|
| 27.0 |
|
|
| — |
|
|
| — |
|
|
| 27.0 |
| ||||||||||||||||||||||||||||||||||||||||||||
Share repurchases |
|
| — |
|
|
| — |
|
|
| (1,701 | ) |
|
| (50.0 | ) |
|
| — |
|
|
| — |
|
|
| — |
|
|
| — |
|
|
| — |
|
|
| — |
|
|
| (50.0 | ) | ||||||||||||||||||||||||||||||||||||||||||||
Stock-based compensation expense |
|
| 372 |
|
|
| — |
|
|
| (77 | ) |
|
| (2.7 | ) |
|
| 9.1 |
|
|
| — |
|
|
| — |
|
|
| — |
|
|
| — |
|
|
| — |
|
|
| 6.4 |
| ||||||||||||||||||||||||||||||||||||||||||||
Cash dividends and dividend equivalents |
|
| — |
|
|
| — |
|
|
| — |
|
|
| — |
|
|
| — |
|
|
| (20.2 | ) |
|
| — |
|
|
| — |
|
|
| — |
|
|
| — |
|
|
| (20.2 | ) | ||||||||||||||||||||||||||||||||||||||||||||
Cash flow hedge - interest rate swap, net of tax of $0.4 |
|
| — |
|
|
| — |
|
|
| — |
|
|
| — |
|
|
| — |
|
|
| — |
|
|
| — |
|
|
| — |
|
|
| 1.5 |
|
|
| — |
|
|
| 1.5 |
| ||||||||||||||||||||||||||||||||||||||||||||
Balance at December 31, 2022 |
|
| 39,059 |
|
| $ | 0.4 |
|
|
| (2,071 | ) |
| $ | (61.1 | ) |
| $ | 397.7 |
|
| $ | 692.5 |
|
| $ | (56.9 | ) |
| $ | (87.5 | ) |
| $ | — |
|
| $ | 7.9 |
|
| $ | 893.0 |
| ||||||||||||||||||||||||||||||||||||||||||||
Net income |
|
| — |
|
|
| — |
|
|
| — |
|
|
| — |
|
|
| — |
|
|
| 145.7 |
|
|
| — |
|
|
| — |
|
|
| — |
|
|
| 0.7 |
|
|
| 146.4 |
| ||||||||||||||||||||||||||||||||||||||||||||
Foreign currency translation |
|
| — |
|
|
| — |
|
|
| — |
|
|
| — |
|
|
| — |
|
|
| — |
|
|
| 4.7 |
|
|
| — |
|
|
| — |
|
|
| — |
|
|
| 4.7 |
| ||||||||||||||||||||||||||||||||||||||||||||
Changes in defined benefit pension and other post-retirement benefit plans, net of tax of zero |
|
| — |
|
|
| — |
|
|
| — |
|
|
| — |
|
|
| — |
|
|
| — |
|
|
| — |
|
|
| (0.3 | ) |
|
| — |
|
|
| — |
|
|
| (0.3 | ) | ||||||||||||||||||||||||||||||||||||||||||||
Share repurchases |
|
| — |
|
|
| — |
|
|
| (3,252 | ) |
|
| (115.0 | ) |
|
| — |
|
|
| — |
|
|
| — |
|
|
| — |
|
|
| — |
|
|
| — |
|
|
| (115.0 | ) | ||||||||||||||||||||||||||||||||||||||||||||
Stock-based compensation expense |
|
| 391 |
|
|
| — |
|
|
| (90 | ) |
|
| (3.2 | ) |
|
| 13.8 |
|
|
| — |
|
|
| — |
|
|
| — |
|
|
| — |
|
|
| — |
|
|
| 10.6 |
| ||||||||||||||||||||||||||||||||||||||||||||
Issuance of common stock |
|
| 1 |
|
|
| — |
|
|
| — |
|
|
| — |
|
|
| — |
|
|
| — |
|
|
| — |
|
|
| — |
|
|
| — |
|
|
| — |
|
|
| — |
| ||||||||||||||||||||||||||||||||||||||||||||
Cash dividends and dividend equivalents |
|
| — |
|
|
| — |
|
|
| — |
|
|
| — |
|
|
| 0.1 |
|
|
| (25.0 | ) |
|
| — |
|
|
| — |
|
|
| — |
|
|
| — |
|
|
| (24.9 | ) | ||||||||||||||||||||||||||||||||||||||||||||
Balance at December 31, 2023 |
|
| 39,451 |
|
| $ | 0.4 |
|
|
| (5,413 | ) |
| $ | (179.3 | ) |
| $ | 411.6 |
|
| $ | 813.2 |
|
| $ | (52.2 | ) |
| $ | (87.8 | ) |
| $ | — |
|
| $ | 8.6 |
|
| $ | 914.5 |
| ||||||||||||||||||||||||||||||||||||||||||||
See Notes to Consolidated Financial Statements
55
NOTES TO CONSOLIDATED FINANCIAL STATEMENTS
Note 1: Summary of Accounting and Financial Policies
Business Description and Basis of Presentation. Ryerson Holding Corporation (“Ryerson Holding”), a Delaware corporation, is the parent company of Joseph T. Ryerson & Son, Inc. (“JT Ryerson”), a Delaware corporation. Affiliates of Platinum Equity, LLC (“Platinum”) own approximately 21,037,5003,924,478 shares of our common stock, which is approximately 55%11.5% of our issued and outstanding common stock. On February 28, 2023, Platinum sold 2,486,580 shares of common stock through an underwritten secondary offering. Concurrently, Ryerson Holding completed a share repurchase from Platinum of 1,513,420 shares of common stock. On May 8, 2023, Platinum sold 2,630,700 shares of its common stock through an underwritten secondary offering. Concurrently, Ryerson Holding completed a share repurchase from Platinum of 1,369,300 shares of common stock. Also, on August 8, 2023, Platinum sold 4,000,000 shares of its common stock through an underwritten secondary offering. Following the close of those transactions, Platinum's ownership of our common stock decreased from approximately 43% to approximately 11.5%. Ryerson Holding is no longer a “controlled company” within the meaning of the corporate governance standards of The New York Stock Exchange.
We are a leading value-added processor and distributor of industrial metals with operations in the United StatesU.S. through JT Ryerson and other U.S. subsidiaries, in Canada through our indirect wholly-owned subsidiary Ryerson Canada, Inc., a Canadian corporation (“Ryerson Canada”), and in Mexico through our indirect wholly-owned subsidiary Ryerson Metals de Mexico, S. de R.L. de C.V., a Mexican corporation (“Ryerson Mexico”). In addition to our North American operations, we conduct materials processing and distribution operations in China through an indirect wholly-owned subsidiary, Ryerson China Limited, a Chinese limited liability company (“Ryerson China”). Unless the context indicates otherwise, Ryerson Holding, JT Ryerson, Ryerson Canada, Ryerson Mexico, and Ryerson China together with their subsidiaries, are collectively referred to herein as “Ryerson,” “we,” “us,” “our,” or the “Company.”
Principles of Consolidation. The Company consolidates entities in which it owns or controls more than 50%50% of the voting shares. All significant intercompany balances and transactions have been eliminated in consolidationconsolidation.
Equity Investments. Investments in affiliates in which the Company’s ownership is 20% to 50% and investments in limited partnerships are accounted for by the equity method. Equity income is reported in other income and (expense), net in the Consolidated Statements of Operations. Equity loss amounted to $0.1 million for the year ended December 31, 2023. Equity income during the years ended December 31, 2022 and 2021 was zero.
Business Segments. Financial Accounting Standards Board (“FASB”) Accounting Standards Codification (“ASC”) 280, “Segment Reporting” (“ASC 280”), establishes standards for reporting information on operating segments in interim and annual financial statements. Our Board of Directors, which includes our Chief Executive Officer, together with our Board of Directors, serve as our Chief Operating Decision Maker (“CODM”). Our CODM reviews our financial information for purposes of making operational decisions and assessing financial performance. The CODM views our business globally as metals service centers. We have 1one operating and reportable segment, metal service centers, in accordance with the criteria set forth in ASC 280.
Use of Estimates. The preparation of financial statements in conformity with Generally Accepted Accounting Principles (“GAAP”) in the United StatesU.S. requires management to make estimates and assumptions that affect the amounts reported in the consolidated financial statements and related notes to the financial statements. Changes in such estimates may affect amounts reported in future periods.
Revenue Recognition. Revenue is recognized in accordance with FASB ASC 606, “Revenue from Contracts with Customers” (“ASC 606”). Revenue is recognized based on the consideration expected to be received for delivery of as-is or processed metal products when, or as, the Company satisfies its contractual obligation to transfer control of a product to a customer, which we refer to as a performance obligation. See Note 17:16: Revenue Recognition for further details.
Provision for allowances, claims, and doubtful accounts. The Company follows the guidance under ASC 326 “Financial Instruments – Credit Losses” (“ASC 326”). The Company monitors customer payments and maintains a provision for estimated credit losses based on historical experience and specific customer collection issues that the Company has identified. Estimation of such losses requires adjusting historical loss experience for current economic conditions and judgments about the probable effects of economic conditions on certain customers. See Note 18:17: Provision for Credit Losses for further details.
Shipping and Handling Fees and Costs. Shipping and handling fees billed to customers are classified in net sales in our Consolidated Statement of Operations. Shipping and handling costs primarily distribution costs, are classified in warehousing, delivery, selling, general, and administrative expenses in our Consolidated Statement of Operations. These costs totaled $125.2$139.1 million, $113.7$137.8 million, and $126.7$125.2 million for the years ended December 31, 2023, 2022, and 2021, 2020, and 2019, respectively.respectively. In accordance with ASC 606, the Company has
56
elected to treat shipping and handling costs as an activity necessary to fulfill the performance obligation to transfer product to the customer and not as a separate performance obligation. Shipping and handling costs are estimated at quarter end in proportion to revenue recognized for transactions where actual costs are not yet known.
Benefits for Retired Employees. The Company recognizes the funded status of its defined benefit pension and other postretirement plans in the Consolidated Balance Sheets, with changes in the funded status recognized through accumulated other comprehensive income (loss), in the year in which the changes occur. Service cost is included in warehousing, delivery, selling, general, and administrative expenses and all other components of net benefit costs are recognized in other income and (expense), net, in the Consolidated Statement of Operations. The estimated cost of the Company’s defined benefit pension plan and its postretirement medical benefits are determined annually or upon plan remeasurement after considering information provided by consulting actuaries. Key factors used in developing estimates of these liabilities include assumptions related to discount rates, rates of return on investments, mortality rates, future compensation costs, healthcare cost trends, benefit payment patterns, and other factors. The cost of these benefits for retirees is accrued during their term of employment. Pensions are funded primarily in accordance with the
requirements of the Employee Retirement Income Security Act (“ERISA”) of 1974 and the Pension Protection Act of 2006. Costs for retired employee medical benefits are funded when claims are submitted. Certain employees are covered by a defined contribution plan, for which the cost is expensed in the period earned.
Cash Equivalents. Cash equivalents reflected in the financial statements are highly liquid, short-term investments with original maturities of three months or less. Checks issued in excess of funds on deposit at the bank represent “book” overdrafts. We reclassified $77.3$99.7 million and $84.9 $106.8million to accounts payable at December 31, 20212023 and 2020,2022, respectively.
Inventory Valuation. Inventories are stated at the lower of cost or market value. We primarily use the last-in, first-out (“LIFO”) method for valuing our domestic inventories. We use the moving average cost and the specific cost methods for valuing our foreign inventories.
Property, Plant, and Equipment. Property, plant, and equipment, including land use rights and finance lease assets, are depreciated for financial reporting purposes using the straight-line method over the estimated useful lives of the assets. The provision for depreciation in all periods presented is based on the following estimated useful lives of the assets:
Land improvements | 20 years | |
Buildings | 45 years | |
Machinery and equipment |
| |
Furniture and fixtures | 10 years | |
Transportation equipment |
| |
Software | 5 years | |
Land use rights | 50 years |
Expenditures for normal repairs and maintenance are charged against income in the period incurred.
Internal-Use Software. Software is recognized in accordance with FASB ASC 350-40, "Internal-Use Software" ("ASC 350-40"). The Company has various software that is acquired, internally developed, or modified solely to meet the Company's internal needs, and software that the Company obtains access to in cloud computing arrangements that includes internal-use software licenses. Software development costs are capitalized when the preliminary project stage is complete and the development stage of the project commences, it is probable that the project will be complete, and the software will be used to perform the function intended. Costs associated with preliminary project stage activities, training, maintenance, and all other post implementation stage activities are expensed as incurred. The capitalization policy provides for the capitalization of certain payroll costs for employees who are directly associated with developing internal-use software as well as certain external direct costs. Capitalized employee costs are limited to the time directly spent on such projects. We also capitalize certain costs related to specific upgrades and enhancements when it is probable the expenditures will result in additional functionality. Our cloud computing arrangements that include a license to an internal use software which does not meet the criteria as defined by ASC 350-40 are accounted for as service contracts and do not constitute a purchase of a software or license to a software and as such are accounted as prepaid expenses and are amortized over the prepayment period. As of December 31, 2023 and 2022 we had $1.9 million and $2.0 million of software in prepaid expenses and other current assets on the Consolidated Balance Sheets, respectively. See Note 5: Property Plan and Equipment for the balances of software costs capitalized to fixed assets.
Leases. Leases are recognized in accordance with FASB ASC 842, “Leases” (“ASC 842”). The Company leases various assets including real estate, trucks, trailers, mobile equipment, processing equipment, and IT equipment. See Note 6: Leases, for further details.
57
Goodwill. In accordance with FASB ASC 350, “Intangibles – Goodwill and Other” (“ASC 350”), goodwill is reviewed at least annually for impairment or whenever indicators of potential impairment exist. We test for impairment of goodwill by assessing various qualitative factors with respect to developments in our business and the overall economy. If we determine that it is more likely than not that the fair value of a reporting unit is less than the carrying value based on our qualitative assessment, we will proceed to the quantitative goodwill impairment test, in which we compare the fair value of the reporting unit where the goodwill resides to its carrying value. If the carrying amount of goodwill exceeds its implied fair value, an impairment loss is recognized in an amount equal to that excess, not to exceed the carrying amount of the goodwill. The fair value of the reporting unit is estimated using a combination of an income approach and a market approach as this combination is deemed to be the most indicative of fair value in an orderly transaction between market participants.
Long-lived Assets and Other Intangible Assets. Long-lived assets held and used by the Company are reviewed for impairment whenever events or changes in circumstances indicate that the carrying amount of an asset may not be recoverable. TheWhen this occurs, the Company estimates the future cash flows expected to result from the use of the asset and its eventual disposition. If the sum of the expected future cash flows (undiscounted and without interest charges) is less than the carrying amount of the asset, an impairment is recognized. Any related impairment loss is calculated based upon comparison of the fair value to the carrying value of the asset. Separate intangible assets that have finite useful lives are amortized over their useful lives. An impaired intangible asset would be written down to fair value, using the discounted cash flow method.
Accrued Vacation Liability. In 2019, the Company changed its vacation policy such that employees earn their vacation for the current year as work is performed throughout the year and forfeit any unused vacation at the end of the year, with the exception of a partial rollover allowance subject to a cap. Under the previous policy, vacation was earned in advance of work being performed for the subsequent year. As a result of this policy change, the Company recorded a reduction of $11.0 million to accrued vacation expense, which is included within warehousing, delivery, general, and administrative expense within the Consolidated Statement of Operations in 2019.
Deferred Financing Costs. Deferred financing costs associated with the issuance of debt are being amortized using either the effective interest method or straight line method over the life of the debt in accordance with FASB ASC 470, “Debt” (“ASC 470”). Deferred financing costs related to a recognized debt liability are presented in the balance sheet as a direct deduction from the carrying amount of the related debt liability.
Foreign Currency. The Company translates assets and liabilities of its foreign subsidiaries, where the functional currency is the local currency, into U.S. dollars at the current rate of exchange on the last day of the reporting period. Revenues and expenses are translated at the average monthly exchange rates prevailing during the year.
For foreign currency transactions, the Company translates these amounts to the Company’s functional currency at the exchange rate effective on the invoice date. If the exchange rate changes between the time of purchase and the time actual payment is made, a foreign exchange transaction gain or loss results which is included in determining net income (loss) for the year. The Company recognized $0.2 millionan exchange loss 0 exchange gains/losses,of $2.0 million, $1.6 million, and a $2.4$0.2 million exchange loss for the years ended December 31, 2021, 2020,2023, 2022, and 2019,2021, respectively. These amounts are classified either in Other income and (expense), net or Warehousing, delivery, selling, general, and administrative expense in our Consolidated Statements of Operations.
Income Taxes. Deferred tax assets or liabilities reflect temporary differences between amounts of assets and liabilities for financial and tax reporting. Such amounts are adjusted, as appropriate, to reflect changes in enacted tax rates expected to be in effect when the temporary differences reverse. A valuation allowance is established to offset any deferred tax assets if, based upon the available evidence, it is more likely than not that some or all of the deferred tax assets will not be realized. The determination of the amount of a valuation allowance to be provided on recorded deferred tax assets involves estimates regarding (1) the timing and amount of the reversal of taxable temporary differences, (2) expected future taxable income, (3) the impact of tax planning strategies, and (4) the ability to carry back tax losses to offset prior taxable income. In assessing the need for a valuation allowance, the Company considers all available positive and negative evidence, including past operating results, projections of future taxable income, and the feasibility of ongoing tax planning strategies. The projections of future taxable income include a number of estimates and assumptions regarding volume, pricing, costs, and industry cyclicality.
Significant judgment is required in determining income tax provisions and in evaluating tax positions. In the normal course of business, the Company and its subsidiaries are examined by various federal, state, and foreign tax authorities. The Company records the impact of a tax position, if that position is more likely than not (i.e., greater than 50% likely) to be sustained in audit, based on the technical merits of the position. The Company regularly assesses the potential outcomes of these examinations and any future examinations for the current or prior years in determining the adequacy of our provision for income taxes. The Company continually assesses the likelihood and amount of potential adjustments and adjusts the income tax provision, the current tax liability, and deferred taxes in the period in which the facts that give rise to a revision become known.
The Company recognizes the benefit of tax positions when a benefit is more likely than not (i.e., greater than 50% likely) to be sustained on its technical merits. Recognized tax benefits are measured at the largest amount that is more likely than not to be sustained, based on cumulative probability, in final settlement of the position. The Company recognizes interest and penalties related to unrecognized tax benefits as a component of income tax expense.
58
Earnings Per Share Data. Basic earnings per share (“EPS”) is computed by dividing net earnings available to common stockholders by the weighted average number of common shares outstanding for the period. Diluted earnings per share is computed by giving effect to all dilutive potential common shares that were outstanding during the period, unless inclusion of the potential common shares would have an antidilutive effect. Basic earnings per share excludes the dilutive effect of common stock equivalents such as stock options and warrants, while diluted earnings per share, assuming dilution, includes such dilutive effects.
Stock-Based Compensation. All of our stock-based compensation plans are classified as equity awards. The fair value of restricted stock units (“RSUs”) and performance stock units (“PSUs”) is determined based on the fair value of our common stock on the grant date. The fair value of stock options is estimated based on a Monte Carlo simulation and considers variables such as volatility, dividend yield, risk-free rate, and the expected exercise multiple in computing the value of the options. The fair value of stock options, RSUs, and PSUs is expensed on a straight-line basis over their respective vesting periods. We have elected to recognize forfeitures as they occur. See Note 12:11: Stock-Based Compensation for further details.
Recent Accounting Pronouncements
Impact of Recently Issued Accounting Standards–Adopted
In December 2019, the FASBNo accounting pronouncements have been issued ASU 2019-12, “Income Taxes – Simplifying the Accounting for Income Taxes.” The guidance removes certain exceptions for recognizing deferred taxes for equity method investments, performing intraperiod allocation, and calculating income taxes in interim periods. The ASU also adds guidance to reduce complexity in certain areas, including recognizing deferred taxes for tax goodwill and allocating taxes to members of a consolidated group, among others. We adopted this guidance as of January 1, 2021 and there was nothat impact to our consolidated financial statements.
In October 2021, the FASB issued ASU 2021-08, “Business Combinations (Topic 805), Accounting for Contract Assets and Contract Liabilities from Contracts with Customers.” The amendments in this update clarify the accounting to address diversity in practice and require that an acquirer recognize and measure contract assets and contract liabilities acquired in a business combination in accordance with ASC 606. The update is effective for interim and annual reporting periods beginning after December 15, 2022 and should be applied prospectively to business combinations occurring on or after the effective date of the amendments. Early adoption is permitted including adoption in an interim period. An entity that early adopts in an interim period should apply the amendments (1) retrospectively to all business combinations for which the acquisition date occurs on or after the beginning of the fiscal year that includes the interim period of early application and (2) prospectively to all business combinations that occur on or after the date of initial application. We adopted this guidance as of October 1, 2021 and there was no impact to our consolidated financial statements or disclosures.
Impact of Recently Issued Accounting Standards–Not Yet Adopted
No accounting pronouncements have beenIn November 2023, FASB issued Accounting Standard Update (“ASU”) 2023-07, “Segment Reporting (Topic 280)”. The amendments in this update require public entities to enhance segment disclosures on both an interim and annual basis. These disclosures include, among others, significant segment expenses regularly reviewed by the chief operating decision maker (CODM), an amount for other segment items, and title and position of the CODM and how the CODM uses this information in assessing performance. The ASU is effective for fiscal years beginning after December 15, 2023 and interim periods of fiscal years beginning after December 15, 2024 and should be adopted retrospectively to all prior periods presented in the financial statements. We are still assessing the impact of adoption, but do not expect this guidance to materially impact the consolidated financial statements.
In December 2023, FASB issued ASU 2023-09, “Income Taxes (Topic 740)”. The amendments in this update require public businesses to disclose specific categories in the rate reconciliation and further information for reconciling items that we havemeet a quantitative threshold. This update also requires further disclosures of income taxes paid disaggregated by federal, state, and foreign jurisdictions as well as by the individual jurisdiction in which income taxes are paid if the amount paid is equal to or greater than five percent of total income taxes paid. Further, this update requires a disclosure of income or loss from continuing operations before income tax expense disaggregated between domestic and foreign and income tax expense or benefit disaggregated by federal, state, and foreign. This update is effective for annual periods beginning after December 15, 2024 and early adoption is permitted. We do not yet adopted.expect this guidance to materially impact the consolidated financial statements.
Note 2: Acquisitions
2023 Acquisitions
On SeptemberMarch 1, 2021,2023, JT Ryerson acquired Specialty MetalsBLP Holdings, LLC ("BLP"). Based out of Houston, Texas, BLP is comprised of three divisions: Absolute Metal Products, Metal Cutting Specialists, and Houston Water Jet, serving various industries such as oil & gas, aerospace, telecommunications, and structural fabrication. BLP provides complex fabrication services in addition to toll processing, including saw cutting, machining, and water jet cutting.
On October 2, 2023, JT Ryerson acquired Norlen Incorporated ("Norlen"). Based out of Schofield, Wisconsin, Norlen is a full-service metal fabricator, providing stamping, machining, painting, and additional value-added fabrication services to industries including agriculture, HVAC, and defense.
On November 1, 2023, JT Ryerson acquired TSA Processing Inc. (“SMP”("TSA"),. Headquartered in Houston, Texas, with five other locations across the Midwest and Southern United States, TSA is a toll processorstainless steel and aluminum coil and sheet processor.
On December 1, 2023, JT Ryerson acquired Hudson Tool Steel Corporation ("Hudson"). Hudson is headquartered in Cerritos, California, with two facilities located in Stow, Ohio. SMP processesthe Midwest and Northeast. Hudson is a supplier of tool steels and high-speed, carbon, and alloy steels.
59
The 2023 acquisitions will strengthen and expand JT Ryerson's valued-add services within our industry-leading stainless and aluminum franchises as well as our tool steel aluminum, titanium,capabilities which will allow us to increase our offerings to better serve our diverse customer base across our entire network. We paid a total of $127.5 million, net of cash acquired, as of December 31, 2023 for the 2023 acquisitions. As of December 31, 2023, there was $2.1 million of unpaid purchase consideration accrued on the Consolidated Balance Sheet relating to holdback payments expected to be paid within 18 months, working capital true ups, and nickel alloy productscontingent consideration.
We deemed the 2023 acquisitions individually immaterial, yet significant in the aggregate to the Consolidated Balance Sheet. Included in our Statement of Operations for the year-ended December 31, 2023 were net sales of $43.2 million and net income of $1.8 million related to the 2023 acquisitions. The Consolidated Statement of Operations as of December 31, 2023 includes revenues and expenses of each acquisition since its respective acquisition date. The 2023 acquisitions are insignificant to the Company's Consolidated Statement of Operations for the year-ended December 31, 2023.
The preliminary allocations of the total purchase price from our combined 2023 acquisitions to the fair values of the assets acquired and liabilities assumed were as follows:
| (In millions) |
| |
Cash and cash equivalents | $ | 5.8 |
|
Receivables, less provisions |
| 20.4 |
|
Inventories |
| 11.6 |
|
Prepaid expenses and other current assets |
| 2.2 |
|
Property, plant, and equipment |
| 47.7 |
|
Operating lease assets |
| 35.0 |
|
Other intangible assets |
| 31.3 |
|
Goodwill |
| 26.3 |
|
Other noncurrent assets |
| 1.1 |
|
Total identifiable assets acquired |
| 181.4 |
|
Accounts payable |
| (7.2 | ) |
Salaries, wages, and commissions |
| (2.0 | ) |
Other accrued liabilities |
| (0.5 | ) |
Operating lease liabilities |
| (32.4 | ) |
Deferred income taxes |
| (3.9 | ) |
Total liabilities assumed |
| (46.0 | ) |
Net identifiable assets acquired |
| 135.4 |
|
The purchase price allocations for our 2023 acquisitions are pending the completion of purchase price adjustments.
The 2023 acquisitions discussed above were all accounted for under the acquisition method of accounting and, accordingly, the purchase price for each transaction has been allocated to the assets acquired and liabilities assumed based on the estimated fair values at the date of each acquisition. As needed, for each transaction the Company used a varietythird-party valuation firm to estimate the fair values of industriesproperty, plant, and equipment, leases, earn-outs, and intangible assets. Inventory was valued by the Company using acquisition date fair values of the metals. The consolidated balance sheets reflect the allocations of each acquisition's purchase price as of December 31, 2023. The measurement period for purchase price allocations will end 12 months after each acquisition date.
Included in the total purchase price is $0.9 million of contingent consideration at fair value. The contingent consideration is based on the attainment of certain financial metrics over the course of 4 years following the acquisition date with a maximum payout of $5.1 million. The fair value of the contingent consideration as of acquisition date was determined using a Monte Carlo simulation.
As part of the purchase price allocations for the 2023 acquisitions, we allocated $7.6 million to trade names and $23.7 million to customer relationships with weighted average lives of 14.3 years and 14.0 years, respectively. The goodwill arising from the 2023 acquisitions consists largely of expected strategic benefits, including aerospace. SMP's expertiseenhanced operational scale, as well as expansion of acquired product and processing capabilities across our Company. See Note: 8 Goodwill for further information on the goodwill added in buffing, grinding,2023.
2023 Asset Acquisition
During the first six months of 2023, JT Ryerson completed the purchase of certain assets from ExOne Operating, LLC. The total amount paid by JT Ryerson for the acquired assets was $9.7 million. The transaction qualified for asset acquisition accounting and polishing finishes adds to Ryerson's value-added processing capabilities. The acquisition is not material to our consolidated financial statements.
60
2022 Acquisition Activity
On November 1, 2022, JT Ryerson paid $31.8 million to acquire Excelsior, Inc. ("Excelsior"). During the first six months of 2023, JT Ryerson paid an additional $0.6 million related to the net working capital adjustments.
Note 3: Cash, Cash Equivalents, and Restricted Cash
The following table provides a reconciliation of cash, cash equivalents, and restricted cash reported within the Consolidated Balance Sheets that sum to the total of the beginning and ending cash balances shown in the Consolidated Statements of Cash Flows:
|
| At December 31, |
|
| At December 31, |
| ||||||||||
|
| 2021 |
|
| 2020 |
|
| 2023 |
|
| 2022 |
| ||||
|
| (In millions) |
|
| (In millions) |
| ||||||||||
Cash and cash equivalents |
| $ | 51.2 |
|
| $ | 61.4 |
|
| $ | 54.3 |
|
| $ | 39.2 |
|
Restricted cash |
|
| 1.2 |
|
|
| 1.1 |
|
|
| 1.1 |
|
|
| 1.3 |
|
Total cash, cash equivalents, and restricted cash |
| $ | 52.4 |
|
| $ | 62.5 |
|
| $ | 55.4 |
|
| $ | 40.5 |
|
We had cash restricted for the purposes of covering letters of credit that can be presented for potential insurance claims.
Note 4: Inventories
The Company primarily uses the last-in, first-out ("LIFO") method of valuing inventory. Inventories, at stated LIFO value, were classified at December 31, 20212023 and 20202022 as follows:
|
| At December 31, |
| |||||
|
| 2023 |
|
| 2022 |
| ||
|
| (In millions) |
| |||||
In process and finished products |
| $ | 782.5 |
|
| $ | 798.5 |
|
|
| At December 31, |
| |||||
|
| 2021 |
|
| 2020 |
| ||
|
| (In millions) |
| |||||
In process and finished products |
| $ | 832.1 |
|
| $ | 604.5 |
|
If current cost had been used to value inventories, such inventories would have been $303$148 million higher and $63$245 million lowerhigher than reported at December 31, 20212023 and 2020,2022, respectively. Approximately 88%88% and 91%90% of inventories are accounted for under the LIFO method at December 31, 20212023 and 2020,2022, respectively. Non-LIFO inventories consist primarily of inventory at our foreign facilities using the moving average cost and the specific cost methods. Substantially all of our inventories consist of finished products.
The Company has consignment inventory at certain customer locations, which totaled $8.8$7.1 million and $4.8$7.4 million at December 31, 20212023 and 2020,2022, respectively.
Note 5: Property, Plant, and Equipment
Property, plant, and equipment consisted of the following at December 31, 20212023 and 2020:2022:
|
| At December 31, |
| |||||
|
| 2023 |
|
| 2022 |
| ||
|
| (In millions) |
| |||||
Land and land improvements |
| $ | 71.7 |
|
| $ | 66.1 |
|
Buildings and leasehold improvements |
|
| 211.7 |
|
|
| 158.4 |
|
Machinery, equipment, and other |
|
| 647.4 |
|
|
| 532.0 |
|
Finance leases |
|
| 42.2 |
|
|
| 39.0 |
|
Software |
|
| 30.8 |
|
|
| 19.7 |
|
Construction in progress |
|
| 67.7 |
|
|
| 83.4 |
|
Total |
|
| 1,071.5 |
|
|
| 898.6 |
|
Less: Accumulated depreciation |
|
| (481.9 | ) |
|
| (440.2 | ) |
Net property, plant, and equipment |
| $ | 589.6 |
|
| $ | 458.4 |
|
|
| At December 31, |
| |||||
|
| 2021 |
|
| 2020 |
| ||
|
| (In millions) |
| |||||
Land and land improvements |
| $ | 65.0 |
|
| $ | 88.0 |
|
Buildings and leasehold improvements |
|
| 141.2 |
|
|
| 202.3 |
|
Machinery, equipment, and other |
|
| 482.4 |
|
|
| 451.6 |
|
Finance leases |
|
| 56.8 |
|
|
| 66.5 |
|
Construction in progress |
|
| 47.4 |
|
|
| 14.5 |
|
Total |
|
| 792.8 |
|
|
| 822.9 |
|
Less: Accumulated depreciation |
|
| (404.5 | ) |
|
| (401.1 | ) |
Net property, plant, and equipment |
| $ | 388.3 |
|
| $ | 421.8 |
|
61
The Company recognized gains on the sale of assets classified as held for sale of 0, 0, and $0.4 million for the years ended December 31, 2021, 2020, and 2019 respectively. The Company had $1.2 million and $4.0 million of assets held for sale classified within “Prepaid expenses and other current assets” on the Consolidated Balance Sheet as of December 31, 2021 and 2020, respectively.
During the year ended December 31, 2021, the Company completed several asset sales in the form of sale-leasebacks to generate cash proceeds that were, in part, utilized to redeem a portion of the 8.50%8.50% senior secured notes due 2028 (the “2028 Notes”), and also in a continued effort to optimize our facility footprint. Each of these sale-leasebacks were for varying periods of time, ranging from 21 months to 15 years, and therefore the Company recorded right of use assets of $95.1$95.1 million and lease liabilities of $86.4$86.4 million. See Note 6: Leases for further discussion of the individually significant leaseback transaction. As a result of these transactions, $65.4$65.4 million of land and building assets, net of accumulated depreciation, were sold for net cash proceeds of $163.2$163.2 million, resulting in a total gain of $107.7 million$.107.7 million.
The Company also had normal course asset sale activity which generated additional cash proceeds of $3.1$0.5 million, for the year ended$8.0 million, and $3.1 million at December 31, 2021.2023, 2022 and 2021, respectively.
Note 6: Leases
The Company leases various assets including real estate, trucks, trailers, cars, mobile equipment, processing equipment, and IT equipment. The Company has noncancelable operating leases expiring at various times through 2036,2043, and finance leases expiring at various times through 2027. 2030.
Policy Elections & Practical Expedients
The Company has made an accounting policy election not to record leases with an initial term of twelve months or less (“short term leases”) on the balance sheet as allowed within ASC 842. Short term lease expense is recognized on a straight-line basis over the lease term. The Company has elected to apply the practical expedient that allows for the combination of lease and non-lease components for all asset classes. In addition, the Company elected the package of practical expedients permitted under the transition guidance within the new standard, which among other things, allowed the Company to carry forward the historical lease classification for leases that existed at the transition date.
Significant Judgments
Many of our real estate leases include one or more options to renew, with renewal terms that can extend the lease term from one to 5 years or more.more. To determine the expected lease term, we include any noncancelable periods within the lease agreement as well as any periods covered by an option to extend the lease if we are reasonably certain to exercise the option. The equipment leases do not typically include options for renewal but domay include options for purchase at the end of the lease. We determine the likelihood of exercising the option for purchase by assessing the option price versus the estimated fair value at the end of the lease term to determine if the option price is lowadvantageous enough that we are reasonably certain to exercise it. The depreciable life of finance lease assets and leasehold improvements are limited by the expected lease term, unless there is a transfer of title or purchase option reasonably certain of exercise.
Lease payments include fixed payments, the exercise price of a purchase option that is reasonably certain of exercise, variable payments based on a known index, and the amount probable that the Company will owe under a residual value guarantee. Variable lease payments that are not based on a known index are not included in lease payments and are expensed as incurred.
The discount rate used to determine the amount of right of use assets, lease liabilities, and lease classification is the interest rate implicit in the lease, when known. If the rate implicit in the lease is not known, the Company will use its incremental borrowing rate defined as the interest rate swap rate that approximates the lease term plus the long-term expected spread on the $1.0$1.3 billion revolving credit facility amended as of November 5, 2020June 29, 2022 (the “Ryerson Credit Facility”).
In December 2019, we sold and leased back a group of service center properties located in Arizona, Arkansas, Georgia, New York, Ohio, Texas, Virginia, and Washington for net proceeds of approximately $61.5 million. The total annual rent for the properties was approximately $4.3 million for the first year and is subject to annual rent escalations over the 12-year lease term. Under the terms of the lease agreement, the Company is responsible for all taxes, insurance, and utilities and is required to adequately maintain the properties for the lease term. The lease includes 2 renewal options for five years each.
The 2019 transaction met the requirements for sale leaseback accounting under ASC 842 and ASC 606. Accordingly, the Company recognized the sale of the properties, which resulted in a gain of approximately $20.6 million recorded in the Consolidated Statement of Operations.
Similarly, in June 2021, we sold and leased back a group of service center properties located in Delaware, Florida, Kentucky, Minnesota, Missouri, Oklahoma, Pennsylvania, Tennessee, Texas, and Virginia for net proceeds of approximately $104$104 million. The total annual rent for the properties starts at approximately $6.4$6.4 million per year, with the amount increasing at 1.5%1.5% annually over the 15-year lease term, including, without limitation, during any renewal term. Under the terms of the lease agreement,agreements, the Company is responsible for all taxes, insurance, and utilities and is required to adequately maintain the properties for the lease term. The lease includes 2two renewal options for five years each.
The 2021 This transaction met the requirements for sale leaseback accounting under ASC 842 and ASC 606. Accordingly, the Company recognized the sale of the properties, which resulted in a gain of approximately $62.5$62.5 million recorded in the Consolidated Statement of Operations. The related land and buildings were removed from property, plant, and equipment and operating lease assets and liabilities of $84.4$84.4 million, respectively, were recorded in the Consolidated Balance Sheets.Sheet.
In the third quarter of 2022, a long-term operating lease commenced for a new state-of-the-art facility in Centralia, Washington. The starting annual rent is approximately $2.8 million per year, with annual increases of 2.25% over the 20-year lease term and any renewal terms. The lease includes two renewal options of five years each. Under the terms of the lease agreement, the Company is responsible for all taxes, insurance, and utilities, as well as adequately maintaining the property for the lease term. The initial right of use asset and operating lease liability recorded in the Consolidated Balance Sheet was $51.2 million and $46.1 million, respectively, the difference of $5.1 million is related to a lease prepayment.
62
In the second quarter of 2023, a long-term operating lease commenced for a new state-of-the-art service center facility in University Park, Illinois. The starting annual rent is approximately $7.3 million per year, with annual increases of 2.2% over the 15-year and 4-month lease term. The lease includes four renewal options of five years each at fair market value. Under the terms of the lease agreement, the Company is responsible for all taxes, insurance, and property management fees. The initial right of use asset and operating lease liability recorded in the Condensed Consolidated Balance Sheet was $99.9 million.
The following table summarizes the location and amount of lease assets and lease liabilities reported in our Consolidated Balance SheetSheets as of December 31, 20212023 and 2020:2022:
|
|
|
| At December 31, |
| |||||
Leases |
| Balance Sheet Location |
| 2023 |
|
| 2022 |
| ||
|
|
|
| (In millions) |
| |||||
Assets |
|
|
|
|
|
|
|
| ||
Operating lease assets |
| Operating lease assets |
| $ | 349.4 |
|
| $ | 240.5 |
|
Finance lease assets |
| Property, plant, and equipment, net(a) |
|
| 25.7 |
|
|
| 26.5 |
|
Total lease assets |
|
|
| $ | 375.1 |
|
| $ | 267.0 |
|
Liabilities |
|
|
|
|
|
|
|
| ||
Current |
|
|
|
|
|
|
|
| ||
Operating |
| Current portion of operating lease liabilities |
| $ | 30.5 |
|
| $ | 25.2 |
|
Finance |
| Other accrued liabilities |
|
| 6.8 |
|
|
| 7.1 |
|
Noncurrent |
|
|
|
|
|
|
|
| ||
Operating |
| Noncurrent operating lease liabilities |
|
| 336.8 |
|
|
| 215.1 |
|
Finance |
| Other noncurrent liabilities |
|
| 10.6 |
|
|
| 12.0 |
|
Total lease liabilities |
|
|
| $ | 384.7 |
|
| $ | 259.4 |
|
|
|
|
| At December 31, |
| |||||
Leases |
| Balance Sheet Location |
| 2021 |
|
| 2020 |
| ||
|
|
|
| (In millions) |
| |||||
Assets |
|
|
|
|
|
|
|
|
|
|
Operating lease assets |
| Operating lease assets |
| $ | 211.1 |
|
| $ | 108.3 |
|
Finance lease assets |
| Property, plant, and equipment, net(a) |
|
| 41.2 |
|
|
| 45.5 |
|
Total lease assets |
|
|
| $ | 252.3 |
|
| $ | 153.8 |
|
Liabilities |
|
|
|
|
|
|
|
|
|
|
Current |
|
|
|
|
|
|
|
|
|
|
Operating |
| Current portion of operating lease liabilities |
| $ | 24.9 |
|
| $ | 20.7 |
|
Finance |
| Other accrued liabilities |
|
| 12.5 |
|
|
| 9.0 |
|
Noncurrent |
|
|
|
|
|
|
|
|
|
|
Operating |
| Noncurrent operating lease liabilities |
|
| 184.8 |
|
|
| 93.0 |
|
Finance |
| Other noncurrent liabilities |
|
| 16.0 |
|
|
| 14.3 |
|
Total lease liabilities |
|
|
| $ | 238.2 |
|
| $ | 137.0 |
|
(a)
The following table summarizes the location and amount of lease expense reported in our Consolidated Statements of Operations for the twelve months ended December 31, 2021, 20202023, 2022 and 2019:2021:
|
|
|
| Year Ended December 31, |
| |||||||||
Lease Expense |
| Location of Lease Expense Recognized in Income |
| 2023 |
|
| 2022 |
|
| 2021 |
| |||
|
|
|
|
|
|
| (In millions) |
|
|
|
| |||
Operating lease expense |
| Warehousing, delivery, selling, general, and administrative |
| $ | 43.6 |
|
| $ | 36.8 |
|
| $ | 30.5 |
|
Finance lease expense |
|
|
|
|
|
|
|
|
|
|
| |||
Amortization of lease assets |
| Warehousing, delivery, selling, general, and administrative |
|
| 5.0 |
|
|
| 4.5 |
|
|
| 5.4 |
|
Interest on lease liabilities |
| Interest and other expense on debt |
|
| 0.8 |
|
|
| 0.8 |
|
|
| 1.0 |
|
Variable lease expense |
| Warehousing, delivery, selling, general, and administrative |
|
| 3.4 |
|
|
| 2.6 |
|
|
| 2.8 |
|
Short-term lease expense |
| Warehousing, delivery, selling, general, and administrative |
|
| 2.4 |
|
|
| 2.8 |
|
|
| 2.7 |
|
Total lease expense |
|
|
| $ | 55.2 |
|
| $ | 47.5 |
|
| $ | 42.4 |
|