7.

UNITED STATES

SECURITIES AND EXCHANGE COMMISSION

Washington, D.C. 20549

FORM 10-K

(Mark One)

ANNUAL REPORT PURSUANT TO SECTION 13 OR 15(d) OF THE SECURITIES EXCHANGE ACT OF 1934

For the fiscal year ended December 31, 20212023

OR

TRANSITION REPORT PURSUANT TO SECTION 13 OR 15(d) OF THE SECURITIES EXCHANGE ACT OF 1934

For the transition period from to

Commission File Number 001-39061

DIRTT ENVIRONMENTAL SOLUTIONS LTD.LTD.

(Exact name of Registrant as specified in its Charter)

Alberta, Canada

N/A

(State or other jurisdiction of

incorporation or organization)

(IRS Employer

Identification No.)

7303 30th Street S.E.

Calgary, Alberta, Canada

T2C 1N6

(Address of principal executive offices)

(Zip code)

Registrant’s telephone number, including area code: (403) (403) 723-5000

Securities registered pursuant to Section 12(b) of the Exchange Act:

Title of Each Class

Trading

Symbol(s)

Name of Each Exchange on Which Registered

Common Shares, without par valueN/A

DRTTN/A

The Nasdaq Stock Market LLCN/A

Securities registered pursuant to Section 12(g) of the Exchange Act: NoneCommon Shares, without par value

Indicate by check mark if the registrant is a well-known seasoned issuer, as defined in Rule 405 of the Securities Act. Yes No

Indicate by check mark if the registrant is not required to file reports pursuant to Section 13 or 15(d) of the Act. Yes No

Indicate by check mark whether the registrant: (1) has filed all reports required to be filed by Section 13 or 15(d) of the Securities Exchange Act of 1934 during the preceding 12 months (or for such shorter period that the Registrant was required to file such reports), and (2) has been subject to such filing requirements for the past 90 days. Yes No

Indicate by check mark whether the registrant has submitted electronically every Interactive Data File required to be submitted pursuant to Rule 405 of Regulation S-T (§232.405 of this chapter) during the preceding 12 months (or for such shorter period that the registrant was required to submit such files). Yes No

Indicate by check mark whether the registrant is a large accelerated filer, an accelerated filer, a non-accelerated filer, a smaller reporting company or an emerging growth company. See the definitions of “large accelerated filer,” “accelerated filer,” “smaller reporting company,” and “emerging growth company” in Rule 12b-2 of the Exchange Act.

Large accelerated filer

Accelerated filer

Non-accelerated filer

Smaller reporting company

Emerging growth company

If an emerging growth company, indicate by check mark if the registrant has elected not to use the extended transition period for complying with any new or revised financial accounting standards provided pursuant to Section 13(a) of the Exchange Act.

Indicate by check mark whether the registrant has filed a report on and attestation to its management’s assessment of the effectiveness of its internal control over financial reporting under Section 404(b) of the Sarbanes-Oxley Act (15 U.S.C. 7262(b)) by the registered public accounting firm that prepared or issued its audit report.

If securities are registered pursuant to Section 12(b) of the Act, indicate by check mark whether the financial statements of the registrant included in the filing reflect the correction of an error to previously issued financial statements.

Indicate by check mark whether any of those error corrections are restatements that required a recovery analysis of incentive-based compensation received by any of the registrant’s executive officers during the relevant recovery period pursuant to §240.10D-1(b).

Indicate by check mark whether the registrant is a shell company (as defined in Rule 12b-2 of the Act). Yes No

The aggregate market value of the voting and non-voting common equity held by non-affiliates of the registrant, based on the closing price of the shares of common shares on The Nasdaq Stock Market on June 30, 2021,2023, was $364,706,983.$17,074,379.

The registrant had 85,351,261191,110,385 common shares outstanding as of February 23, 2022.16, 2024.

DOCUMENTS INCORPORATED BY REFERENCE

Portions of the registrant’s Proxy Statement relating to the Annual and Special Meeting of Shareholders, scheduled to be held on April 26, 2022,May 9, 2024, are incorporated by reference into Part III of this Annual Report on Form 10-K.


TABLE OF CONTENTS

Page

PART I

Item 1.

Business

6

Item 1A.

Risk Factors

15

Item 1B.

Unresolved Staff Comments

2325

Item 1C.

Cybersecurity

25

Item 2.

Properties

2326

Item 3.

Legal Proceedings

2326

Item 4.

Mine Safety Disclosures

27

24

PART II

PART II

Item 5.

Market for Registrant’s Common Equity, Related Stockholder Matters and Issuer Purchases of Equity Securities

2428

Item 6.

[Reserved]

2528

Item 7.

Management’s Discussion and Analysis of Financial Condition and Results of Operations

2629

Item 7A.

Quantitative and Qualitative Disclosures About Market Risk

4247

Item 8.

Financial Statements and Supplementary Data

4349

Item 9.

Changes in and Disagreements With Accountants on Accounting and Financial Disclosure

7184

Item 9A.

Controls and Procedures

7184

Item 9B.

Other Information

7184

Item 9C.

Disclosure Regarding Foreign Jurisdictions that Prevent Inspections

84

71

PART III

PART III

Item 10.

Directors, Executive Officers and Corporate Governance

7285

Item 11.

Executive Compensation

7285

Item 12.

Security Ownership of Certain Beneficial Owners and Management and Related Stockholder Matters

7285

Item 13.

Certain Relationships and Related Transactions, and Director Independence

7285

Item 14.

Principal Accounting Fees and Services

85

72

PART IV

PART IV

Item 15.

Exhibits, Financial Statement Schedules

7386

Item 16.

Form 10-K Summary

7690

2


EXPLANATORY NOTE

Currency and Exchange Rate Information

Unless otherwise indicated, references in this Annual Report on Form 10-K (the “Annual Report”) to “$” or “dollars” are expressed in U.S. dollars (US$). References in this Annual Report to Canadian dollars are noted as “C$.”

Our consolidated financial statements that are included in this Annual Report are presented in U.S. dollars. Unless otherwise stated, all figures presented in Canadian dollars and translated into U.S. dollars were calculated using the daily average exchange rate as reported by the H.10 statistical release of the Board of Governors of the Federal Reserve System on January 28, 2022December 29, 2023 of C$1.27531.3202 = US$1.00.

Market and Industry Data

Certain market and industry data contained in this Annual Report, including Item 1. “Business” and Item 7. “Management’s Discussion and Analysis of Financial Condition and Results of Operations,” are based upon information from government or other third-party publications, reports and websites or based on estimates derived from such publications, reports and websites. Government and other third-party publications, reports and websites do not guarantee the accuracy or completeness of their information. While management believes this data to be reliable, market and industry data are subject to variations and cannot be verified with complete certainty due to limits on the availability and reliability of raw data, the voluntary nature of the data-gathering process, and other limitations and uncertainties inherent in any statistical survey.


3


SPECIAL NOTE REGARDING FORWARD-LOOKING STATEMENTS

Certain statements contained in this Annual Report are “forward-looking statements” within the meaning of “safe harbor” provisions of the United States Private Securities Litigation Reform Act of 1995 and Section 21E of the Securities Exchange Act of 1934 (the “Exchange Act”) and “forward-looking information” within the meaning of applicable Canadian securities laws. All statements, other than statements of historical fact included in this Annual Report, regarding without limitation our strategy, future operations, financial position, estimated revenues and losses, projected costs, prospects, plans and objectives of management are forward-looking statements. When used in this Annual Report, the words “anticipate,” “believe,” “expect,” “estimate,” “intend,” “plan,” “project,” “outlook,” “may,” “will,” “should,” “would,” “could,” “can,” “continue,” the negatives thereof, variations thereon and other similar expressions are intended to identify forward-looking statements, although not all forward-looking statements contain such identifying words. In particular and without limitation, this Annual Report contains forward-looking information pertaining to the effect of our strategic priorities on increasing value creation; the application of our processes and technology and the benefits therefrom, forecast operating and financial results, including 20222024 revenue, and the impact of certain cost-saving measures, including anticipated proceeds from the sale of assets at the Rock Hill Facility (as defined herein), the development, timing and success of strategic accounts, the outcome of non-dilutive strategy initiatives, the competitiveness of the Company’s solutions, the liquidity and capital resources of the Company, the effects that current claims against the Company and expiring patents will have on the Company’s business, financial condition, results of operations and growth prospects; our executive management team and the effect the rating systems established by the U.S. Green Building Council will have on demand for products, systems and services in the U.S. market. Forward-looking statements are based on certain estimates, beliefs, expectations and assumptions made in light of management’s experience and perception of historical trends, current conditions and expected future developments, as well as other factors that may be appropriate.

Forward-looking statements necessarily involve unknown risks and uncertainties, which could cause actual results or outcomes to differ materially from those expressed or implied in such statements. Due to the risks, uncertainties and assumptions inherent in forward-looking information, you should not place undue reliance on forward-looking statements. Factors that could have a material adverse effect on our business, financial condition, results of operations and growth prospects include, but are not limited to, the severity and duration of the coronavirus (“COVID-19”) pandemic and related economic repercussions and other risks describedcan be found in Item 1A. “Risk Factors,” Item 7. “Management’s Discussion and Analysis of Financial Condition and Results of Operations,” and elsewhere in this Annual Report. These factors include, but are not limited to, the following:

general economic and business conditions in the jurisdictions in which we operate;
our ability to implement our strategic plan, including realization of benefits from certain cost-optimization initiatives undertaken since 2022 and into 2024, and the ability of our board of directors (“Board of Directors”) to successfully implement its transformation plan;
inflation and material fluctuations of commodity prices, including raw materials, and our ability to set prices for our products that satisfactorily adjust for inflation and fluctuations in commodity prices;
volatility of our share price and potentially limited liquidity for U.S. investors due to our common shares being quoted on the “OTC Pink Tier”;
the availability of capital or financing on acceptable terms, or at all, which may impact our liquidity and impair our ability to make investments in the business;
turnover of our key executives and difficulties in recruiting or retaining key employees;
our history of negative cash flow from operating activities;
our ability to generate sufficient revenue to achieve and sustain profitability and positive cash flows;
our ability to attract, train and retain qualified hourly labor on a timely basis to increase overall productive capacity in our manufacturing facilities to enable us to capture rising demand in the construction industry;
our ability to achieve and manage growth effectively;
competition in the interior construction industry;
our two largest shareholders are able to exercise a significant amount of control over the Company due to their significant ownership of our common shares, and their interests may conflict with or differ from the interests of our other shareholders;
competitive behaviors by our co-founders and former executives;
the condition and changing trends of the overall construction industry;

4


our reliance on our network of construction partners for sales, marketing and installation of our solutions;
our ability to introduce new designs, solutions and technology and gain client and market acceptance;
defects in our designing and manufacturing software and warranty and product liability claims brought against us;
the effectiveness of our manufacturing processes and our success in implementing improvements to those processes;
the effectiveness of certain elements of our administrative systems and the need for investment in those systems;
shortages of supplies of certain key components and materials or disruption in supplies due to global events;
global economic, political and social conditions affecting financial markets, such as the war in Ukraine and the Israel-Hamas war;
our exposure to currency exchange rates, tax rates, interest rates and other fluctuations, including those resulting from changes in laws or administrative practice;
legal and regulatory proceedings brought against us;
infringement on our patents and other intellectual property and our ability to protect and enforce our intellectual property rights, including certain intellectual property rights that are jointly owned with a third party;
cyber-attacks and other security breaches of our information and technology systems;
damage to our information technology and software systems;
our requirements to comply with applicable environmental, health and safety laws;
the impact of increasing attention to environmental, social and governance (ESG) matters on our business;
periodic fluctuations in our results of operations and financial conditions;
the effect of being governed by the corporate laws of a foreign country, including the difficulty of enforcing civil liabilities against directors and officers residing in a foreign country;
the availability and treatment of government subsidies (including any current or future requirements to repay or return such subsidies);
future mergers, acquisitions, agreements, consolidations or other corporate transactions we may engage in; and
other factors and risks described under the heading “Risk Factors” in Item 1A. of this Annual Report.

the impact of the COVID-19 pandemic and any strain variants or resurgences thereof on our business;

our ability to implement our strategic plan;

our ability to maintain and manage growth effectively;

competition in the interior construction industry;

competitive behaviors by our co-founders and former executives;

the condition and changing trends of the overall construction industry;

our reliance on our network of Distribution Partners (as defined herein) for sales, marketing and installation of our solutions;

our ability to introduce new designs, solutions and technology and gain client and market acceptance;

defects in our designing and manufacturing software and warranty and product liability claims brought against us;

material fluctuations of commodity prices, including raw materials;

shortages of supplies of certain key components and materials or disruption in supplies due to global events, including the COVID-19 pandemic;

global economic, political and social conditions and financial markets;

our exposure to currency exchange rates, tax rates and other fluctuations, including those resulting from changes in laws or administrative practice;

legal and regulatory proceedings brought against us;

infringement on our patents and other intellectual property;

cyber-attacks and other security breaches of our information and technology systems;

damage to our information technology and software systems;

our requirements to comply with applicable environmental, health and safety laws, including those relating to the COVID-19 pandemic;


the impact of border crossing blockades on our ability to deliver our solutions on anticipated time frames and impacts on transportation costs;

our ability to generate sufficient revenue to achieve and sustain profitability;

our periodic fluctuations in results of operations and financial conditions;

volatility of our share price;

the effect of being governed by the corporate laws of Alberta, Canada, including obstacles to investors seeking to acquire control of our company;

the effect of being governed by the corporate laws of a foreign country, including the difficulty of enforcing civil liabilities against directors and officers residing in a foreign country;

turnover of our key executives, recruitment efforts to find a permanent chief executive officer, and difficulties in recruiting or retaining key employees;

the impact of the shareholder meeting requisition notice delivered by 22NW Fund and the results thereof;

the availability of capital or financing on acceptable terms, which may impact our liquidity and impair our ability to make investments in the business;

the availability and treatment of government subsidies (including any current or future requirements to repay or return such subsidies);

future mergers, acquisitions, agreements, consolidations or other corporate transactions we may engage in; and

other factors and risks described under the heading “Risk Factors” in Item 1A. of this Annual Report.

These risks are not exhaustive. Because of these risks and other risks and uncertainties, our actual results, performance or achievement, or industry results, may be materially different from the anticipated or estimated results discussed in the forward-looking statements in this Annual Report. New risk factors emerge from time to time, and it is not possible for our management to predict all risk factors nor can we assess the effects of all factors on our business or the extent to which any factor, or combination of factors, may cause actual results to differ materially from those contained in, or implied by, any forward-looking statements. Our past results of operations are not necessarily indicative of our future results. You should not place undue reliance on any forward-looking statements, which represent our beliefs, assumptions and estimates only as of the dates on which they were made, as predictions of future events. We undertake no obligation to update these forward-looking statements, even though circumstances may change in the future, except as required under applicable securities laws. We qualify all of our forward-looking statements by these cautionary statements.


5


PART I

Item 1.

Business.

Overview

Item 1. Business.

Overview

DIRTT Environmental Solutions Ltd. is an innovativeinterior construction company whose system of physical products and digital tools empowers design freedom, drives efficiency, supports sustainability goals, and readily adapts to change. Since 2004, DIRTT has grown to become a leader in industrialized construction for dynamic interior spaces, translating unique visions into compelling spaces where people work, learn, and heal.

DIRTT’s construction system offers unrivaled design freedom, accuracy, and quality assurance together with greater certainty in cost, schedule, and outcomes. By empowering faster decision making, rapid manufacturing, company featuring proprietaryand efficient installation, DIRTT can reduce construction timelines by as much as 30% compared to conventional construction methods.

DIRTT spaces are built for change and ready to adapt as organizational needs evolve. Design for disassembly ensures components are interchangeable and can be repurposed for small updates or full reconfigurations without major renovation, cost, or waste.

Our approach to industrialized construction combines a sophisticated product infrastructure with a dedicated team of construction experts and advanced digital tools. DIRTT’s first-of-its-kind software and virtual reality visualization platform, coupled with vertically integrated manufacturing that designs, configures and manufactures prefabricated interior solutions used primarily in commercial spaces across a wide range of industries and businesses. We combine innovative product design with our industry-leading, proprietary ICE® Softwarecalled ICE® (“ICE” or “ICE Software”), serves as the engine for our industrialized construction system, enabling solutions to be designed, visualized, organized, configured, priced, and technology-driven, leanmanufactured off-site, with final assembly and installation completed at the job site. Our clients’ design visions are translated into the intelligent software platform, empowering faster decision making during design with real-time changes, visualization, and pricing information. ICE connects directly to DIRTT manufacturing practicesfacilities for end-to-end integration, precise manufacturing, production management, and sustainable materials to provide end-to-end solutions forcoordination of the traditionally inefficient and fragmented interior construction industry. We create customized interiors with aesthetics of conventional construction but with greater schedule and cost certainty, shorter lead times, greater future flexibility, and better environmental sustainability than conventional construction.

DIRTT scope. Our ICE Software allows usis also licensed to sell, design, visualize (including 3Dunrelated companies and Construction Partners (as defined herein) of the Company, including Armstrong World Industries, Inc. (“AWI”) which owns a 50% interest in the rights, title and interests in certain intellectual property rights in a portion of the ICE Software that is used by AWI. In addition to the core ICE platform, our cloud-based virtual reality modeling of interiors), configure, price, communicate, engineer, specify, ordertool and manage projects, thereby reducing challenges associated with traditional construction, including cost overruns, change orders, inconsistent quality, delays and material waste. While other software programs and virtual reality tools are usedapp, called ICEreality, connects teams from anywhere in the architecturalworld to walk through their virtual space together, while design changes can be made with real-time feedback on pricing.

We work with some of the most innovative clients, design teams, and construction industries,professionals. We reach our ICE Software provides end-to-end integration, from designclients through order engineering, manufacturingan internal sales team and installation. Our interior construction solutions include prefabricated, customized interior modular walls, ceilings, and floors; decorative and functional millwork; power infrastructure; network infrastructure; and pre-installed medical gas piping systems. We strive to incorporate environmentally sustainable materials and reusable components into our solutions while creating flexible, functional and well-designed environments for the people who will use them.

We offer our interior construction solutions throughout the United States and Canada through ainternational network of independent distribution partnersDIRTT Construction Partners (“DistributionConstruction Partners” or “Partners”). Their DIRTT expertise makes them trusted professionals in their regions for pre-construction, order, installation, and an internal sales team. Our Distributionadaptation of interior spaces. DIRTT Construction Partners use ICE to work with stakeholders, including end users, to envisionclients and designconstruction teams, ensuring effective management and execution of the DIRTT scope on every project. Long term, they support reconfigurations, adaptations, and adjustments, continuously protecting our clients’ investments in DIRTT while ensuring their spaces and orders are electronically routed through ICE to our manufacturing facilities for production, packing and shipping. Our Distribution Partners then coordinate the receipt and installations of our interior solutions at the end users’ locations.stay relevant.

Our name “DIRTT” stands for Doing It Right This Time. DIRTT was incorporated in Alberta, Canada, under the Business Corporations Act (Alberta) (“ABCA”) on March 4, 2003. Our headquarters are located at 7303 30th30 Street S.E.,SE, Calgary, Alberta, T2C 1N6, Canada, and our telephone number at that address is (403) 723-5000.403-723-5000. Our manufacturing facilities are in Calgary, Alberta; Rock Hill, South Carolina;Alberta and Savannah, Georgia.

We completed our initial public offering in Canada in November 2013 and listed our common shares on Thethe Nasdaq Global Select Market (“Nasdaq”) in October 2019. Our common shares trade on the Toronto Stock Exchange (“TSX”) under the ticker symbol “DRT” and. Effective October 12, 2023, DIRTT’s common shares ceased to trade on Nasdaqthe Nasdaq. DIRTT’s common shares are quoted on the OTC markets on the “OTC Pink Tier” under the ticker symbol “DRTT.“DRTTF.

Unless otherwise specified or the context otherwise requires, references to “we,” “us,” “our,” “its,” “the Company” or “DIRTT” mean DIRTT Environmental Solutions Ltd. and, where the context so requires, includes our subsidiaries.

Available Information

We file or furnish annual, quarterly and current reports, proxy statements and other documents with the U.S. Securities and Exchange Commission (“SEC”) under the Exchange Act. The SEC maintains a website (www.sec.gov) that contains reports, proxy and information statements, and other information regarding issuers, including DIRTT, that file electronically with the SEC. We are also subject to requirements of applicable securities laws in Canada, and documents that we file with the securities commissions or similar regulatory authorities in Canada may be found at www.sedar.comwww.sedarplus.ca.

6


We make available free of charge through our website (www.dirtt.com) our Annual Reports on Form 10-K, Quarterly Reports on Form 10-Q, Current Reports on Form 8-K and, if applicable, amendments to those reports filed or furnished pursuant to Section 13(a) of the Exchange Act as soon as reasonably practicable after we electronically file such material with, or furnish it to, the SEC or the securities commissions or similar regulatory authorities in Canada. In addition to the reports filed or furnished with the SEC and the securities commissions or similar regulatory authorities in Canada, we publicly disclose information from time to time in our press releases, investor presentations posted on our website and at publicly accessible conferences. SuchReferences to such information, including information posted on or connectedreferences to our Environmental, Social, and Governance (ESG) Report, and references to our website is not a part of, or incorporated by reference in this Annual Report, are provided as a convenience and do not constitute, and should not be deemed, an incorporation by reference of the information contained on, or any other document we file with or furnish toavailable through, the SEC or the securities commissions or similar regulatory authorities in Canada.website, and such information should not be considered part of this Annual Report.


We will provide without charge to you, upon your request, a copy of our annual report on Form 10-K for the year ended December 31, 20212023, filed with the SEC and the applicable securities commissions or similar regulatory authorities in Canada. Requests for copies should be addressed to 7303 30th30 Street S.E.,SE, Calgary, Alberta, T2C 1N6, Canada, Attention: Investor Relations.

Our Solutions

We offer a wideOur array of interior construction solutions powered by technologyproducts and integrations give our clients the tools to create high-performing interiors that addressstay relevant into the challenges inherent in traditional interior designing and construction methods.future. Unlike traditional interior construction, including traditionalconventional prefabricated products, our solutions do not have predetermined shapes, sizes, or configurations, soempowering clients are free towith design any shape, size or configuration that is necessaryfreedom to meet their needs. Our design and visualization technologies integrate with our manufacturing capabilities and enable short and precise manufacturing times. With a strong network of Distribution Partners, we are able to complete an interior construction project in as few as 30 days, from visualization and completion of design to installation and move-in. Because our solutions remain highly adaptable over time, clients are able to change and customize our solutions even after installation to maintain satisfaction with the functionality and aesthetics of their space as their needs change.

Sustainability practices are aThe core part of our business, from design and manufacturingproduct philosophy is a construction system that uses a universal interface. By allowing interchangeable parts, DIRTT can maximize the life cycle for most of our products. Committed to installation and beyond.sustainability, we subscribe to non-obsolescence, where new DIRTT components work with DIRTT products that came before. Our solutions can be disassembled and reconfigured with minimal waste. With both design freedom and adaptability benefits, client spaces are form-fit, so the only waste produced at job sites is packing material, which is biodegradable, recyclabletailored to their unique needs on Day One and can be more easily reconfigured or ableadapted to be returned to DIRTT for reuse.stay relevant on Day Two and beyond.

DIRTT Solutions

Our solutions (“DIRTT Solutions”) are typically are able to address over 90% of an interior space. Walls, doors, cabinetry, access floor, ceilings, power solutions, data networks, timber and medical gas componentsComponents are all fabricatedmanufactured in our manufacturingDIRTT facilities and shipped to the site for final assembly and installation. The following table provides a brief description of our primary solutions (together with related complementary offerings, “DIRTT Solutions”):solutions:

DIRTT Solution

Description

Description 

Solid Walls

DIRTT’s solid walls offer extensive options with 4”, 6”, and 2” furring wall offerings. Solid walls connect seamlessly to other products in the DIRTT construction system and enable unique finishes, colors, and configurations. Wall cavities support electric, network, and technology integrations.

DIRTTGlass Walls

Prefabricated, customized, modular solid or glass interior wall solutions that support new and legacy furniture, that includeDIRTT’s glass walls doorsare available as double pane, classic center-mount, or windows,Inspire™ profiles. DIRTT glass walls can accommodate base building variance and that support integrated technology for commercial, healthcare, education, hospitality and other industries and medical gas piping systems for healthcare.acoustic requirements.

Combination Walls

Solid and glass walls can be combined for a mix of privacy and transparency. Combination walls can be customized and configured to fit any design with the benefits of the DIRTT system.

DIRTT MillworkLeaf Folding Walls®

Fully customizedThe retractable modular cabinetry that maywall system adds functionality with an effortless solution to quickly adapt space. Like other walls in the DIRTT portfolio, dimensions and finishes of Leaf™ can be used in a variety of industries, including commercial, healthcare, education and hospitality.customized.

Headwalls

This modular, multi-trade healthcare headwall system is an efficient, adaptable approach to healthcare construction. With extensive customization options and integrations, DIRTT Headwalls are an efficient way to meet unique healthcare compliance requirements.

DIRTT FloorsDoors

Low-profile floors that allow quick access to modular powerDIRTT doors integrate seamlessly with DIRTT solid and network infrastructure, facilitating future adaptationglass wall assemblies. A wide range of types and reconfiguration in both existing facilitiesstyles are available, including swing doors, sliding doors, and new buildings.pivot doors. Door options can meet smoke-rating and acoustic requirements.

Casework

DIRTT offers custom cabinets, closets, and storage solutions with consistent quality and efficient installation. Precision-manufactured casework is delivered with predictable lead times.

DIRTT CeilingsTimber

PrefabricatedTraditional craftsmanship meets advanced, custom ceilings that increase sound privacymanufacturing to create striking designs and reduce noise. In 2021 we discontinued manufacturing ceilings and entered into a referral agreementstructural elements. Engineered to meet local requirements, DIRTT Timber integrates with a major ceiling manufacturer.broader DIRTT scopes to bring natural elements to spaces with rapid assembly on-site.

Electrical

DIRTT’s modular electrical system supports connected infrastructure needs. The pre-wired, modular distribution system includes pre-mounted and terminated device boxes installed at the factory to reduce project time and cost on-site. Plug-in connections allow for quick installations and easy modifications.

DIRTT PowerNetworks

Quick-connect, pre-tested adaptable power solutions that are prefabricatedDIRTT’s Fiber to arrive on-site in correct lengths with factory components ready for installationthe Edge networks deliver unlimited bandwidth capability and use, eliminating wastelonger-reaching signal strength while reducing supporting infrastructure needs and providing futurematerial costs. Industry-leading technology and future-ready infrastructure empowers smart building benefits. Copper-based network options reduce install time and increase flexibility.

Access Floors

DIRTT Networks

Prefabricated pre-testedLow-profile, fixed-height access floor provides an adaptable foundation for connected infrastructure with long-term accessibility for easy moves, additions, and componentized passive optical networks utilizing single mode fiber cables instead of traditional copper cables. Similar to DIRTT Power, data infrastructure components arrive on the job site pre-cut to correct lengths and with components ready for quick-connect installation and use.

DIRTT Timber

Prefabricated timber construction for interior mezzanines, structural elements for low-rise buildings, and other architectural elements, including completely customized cross-laminated timber and glue-laminated (glulam) timber.changes.

Our DIRTT Power and DIRTT Networks solutions may be integrated with DIRTT Walls, and DIRTT Networks solutions may also be integrated with DIRTT Floors and DIRTT Ceilings. DIRTT Millwork solutions may be added to DIRTT Walls for decorative and functional purposes. Additionally, DIRTT Walls, DIRTT Floors, DIRTT Ceilings and DIRTT Timber may be integrated among each solution.

ICE® Software

Our manufacturing is built on a foundation of technology, the core of which is our proprietary ICE Software. We use ICE to sell, design, visualize, configure, price, communicate, engineer, construct, specify and order projects. ICE enables us to efficiently manufacture fully custom interiors while addressing challenges associated with traditional construction, including cost overruns,


7


inconsistent quality, delays and significant material waste. ICE also gives our clients control over the look, cost and timing of their interior construction projects.

Clients typically engage an architect or designer and initially design their interior including space planning, materials, colors, finishes, which are then often presented in two-dimensional renderings or a building information model (“BIM”). A Distribution Partner imports this design into ICE and prices projects in real time. Clients can make changes after the design is imported into ICE, which will immediately be reflected in the price quote. Throughout these iterations, clients can explore and walk through their proposed space in immersive and interactive 3D virtual reality, on-screen computer renderings, and floorplan details so they can more readily understand the design. Throughout every stage of the process design changes can be made easily and in real time. We believe this is a significantly enhanced experience for our clients as compared with the experience of reviewing a two-dimensional blueprint or CAD drawing or user expertise intensive BIM file. In addition to our core product offering, DIRTT enables integrations with technology, custom graphics, writable surfaces, and Breathe® Living Walls. Further product information can be found on dirtt.com.

Sustainability and Environmental Matters

DIRTT aims to minimize the ICE toolsenvironmental impact of interior construction through careful material selection, efficient operations, a system designed for future adaptability, and long product lifecycles. We work with clients to understand their unique sustainability goals and identify how building with DIRTT can support LEED, WELL, Living Building Challenge, and other green building standards they may be targeting. Our sustainability team helps to calculate various elements of the DIRTT scope that enable these experiences at eachsupport certification.

Approximately 40% of solid waste in the United States derives from construction and demolition. In contrast, DIRTT’s agile construction system makes it quick, easy, and cost effective to evolve interior spaces through future reconfigurations and relocations, while reducing waste. Our agile system is designed for disassembly to reduce the carbon footprint of new construction and future changes. We further reduce waste through efficient manufacturing and pre-assembled solutions.

We regularly evaluate the environmental impact of our Distribution Partners,materials, considering impact on the wellness of the occupants using the spaces we currently have four specialized virtual reality walk-through centers, including one at our corporate headquarters, that allow clientsbuild and life cycles of the products we make. DIRTT endeavors to use virtual reality headsetsmaterials with high recycled content, bio-based content, and low or no volatile organic compounds (VOCs). Most DIRTT assemblies are certified through Science Certification Systems (SCS) Indoor Advantage Gold, recognizing their low-emitting properties. DIRTT wall panel and casework facilities are certified to physically walkhandle materials with FSC® certification (FSC-C006900), ensuring FSC certified products may be specified.

We recognize the vital importance of reducing embodied carbon within DIRTT products. Our environmentally conscious production facilities are regularly evaluated by cross-functional teams who assess and implement energy efficiency strategies. For example, to further reduce our operational carbon footprint, DIRTT’s U.S. factories are powered by renewable energy through a 3D virtual reality modelour purchase of their design. Further, ICE’s virtualGreen-e® certified renewable energy credits (RECs). We further reduce the impact of our operations with recycling and augmented reality technology, including applications for phones, tabletswaste diversion programs.

DIRTT releases an annual Environmental, Social, and PCs, also allows project stakeholders in different physical locationsGovernance (ESG) report outlining our commitments to meet in real time to visualize, move about, interact with, discusssustainability and edit their future spaces from any location. ICEthe environment. It also provides the abilitydisclosure of our current environmental and sustainability impacts. DIRTT has set goals to export a BIM file for use in design reviewsreduce landfill waste by 2025 and to source or produce renewable energy to cover 100% of an entire project consisting of non-DIRTT construction elements coming from many different types of software.our factory operations.

Once the client is satisfied with the design in ICE, the specifications are transmitted to our manufacturing facilities, where the physical product solutions are created to the exact design standards and specifications set forth in the design. ICE’s detailed bill of material data output is key to managing the many aspects of the manufacturing process, including product inventory and cataloguing, price quotation, order submission, parts manufacturing, and production management, thereby facilitating the delivery of custom solutions with shorter production times. We allocate production among our manufacturing facilities based on proximity to the job site and available capacity. ICE’sFurther information allows a project to be tracked in detail across the entire life of the project, from sales, production, delivery, and installation. The ICE file (containing a project’s bill of material and manufacturing data) generated during the design and specification process is preserved andabout DIRTT’s sustainability practices can be used for optimizing future reconfigurations, renovations, technology integration initiatives and changes to a client’s spacefound at lower cost than traditional construction methods.dirtt.com/sustainability.

Our Business Strategy

Our goal is to help clients envision and design interior construction projects and then build and deliver those projects faster, cleaner, more efficiently and with a better overall client experience and satisfaction than traditionalconventional construction methods. The modular aspect of our DIRTT Solutionsconstruction system allows them to be easily reconfigured with a minimal amount of waste as client space needs change. Our innovative, technology-driven approach includes outstanding product design that is customized for each client application, and delivered on time and on budget.

Our strategy is founded on the following priorities:

The identification and pursuit of client segments that benefit most from DIRTT’s value proposition;
Client-centric, continuous innovation in DIRTT construction systems and our technology to enhance product differentiation and drive market penetration and growth;
Technology-enabled manufacturing processes that facilitate short lead times, a reliable client service platform, and outstanding quality on a cost-effective basis; and
Ongoing development and support of our Construction Partners to ensure flawless execution and a superior end client experience.

The identification and pursuit of client segments that benefit most from DIRTT’s value proposition;

Client-centric, continuous innovation in DIRTT Solutions and our technology to enhance product differentiation and drive market penetration and growth;

Technology-enabled manufacturing processes that facilitate short lead times, a reliable client service platform, and outstanding quality on a cost-effective basis; and

Ongoing development and support of our Distribution Partners to ensure flawless execution and a superior end client experience.

In combination with a focus on cost-discipline, a continuous improvement philosophy, and a focused approach to capital investment, we believe these strategic priorities will drive increased value creation for our employees, clients, DistributionConstruction Partners, and shareholders.

8


Our Competitive Strengths

We believe the following attributes provide us with competitive strengths in the industrialized construction industry:

Leader in Integrated Design and Manufacturing Technology. We believe our ICE Software is the only interior construction technology that efficiently integrates the design, configuration, and virtual reality visualization processes with the manufacturing process. The use of 3D technology in a design environment, utilizing video game technology for real time decision making, is an approach pioneered by DIRTT.
Easy and Intuitive Software Interface. Our ICE Software is a fast, powerful tool with an intuitive user interface. Our software’s ease of use enables rapid time-to-value for our clients and collaboration among all the stakeholders involved in the design, reconfiguration, budgeting and manufacturing processes. Our use of 3D virtual reality and augmented (mixed) reality technologies enables clients to visualize and modify their designs before manufacturing begins, thereby reducing cost and time to completion.
Proprietary Solutions Components. The physical components that comprise our DIRTT construction system have been designed to provide clients with numerous options and full modularity. As a result, we are able to create interior environments that are fully customizable and not limited by a pre-set product list. The modular nature of our components allows them to be reconfigured or adapted easily, with minimal disruption to the occupants of the space and with minimal job site waste.
Strong Construction Partner and Sales Network. Our strong network of Construction Partners and DIRTT sales representatives allows us to maximize our geographic reach, helps build brand awareness in the interior construction market, and enhances our positioning in our target markets.
Superior Results Compared to Conventional Design and Construction. We believe we produce superior client results as compared with conventional design and construction methods in sequencing, certainty, budget allocation, and outcome.
Effective Sequencing. Conventional construction generally follows a rigid sequencing process. Typically, wall framing is constructed first, followed by floors and electrical and data networks. This process is then followed by drywall installation, painting, and flooring, and then installation or building of casework (millwork) and fixtures. These steps generate significant waste and create opportunities for delay, change orders, cost overruns and rework. In contrast, DIRTT’s approach integrates various product applications as tailored to specific project needs. They are manufactured off-site and arrive on-site organized, labeled and ready to be installed. This enables the interior solutions to be produced concurrently with on-site construction work, thereby reducing on-site time and the overall construction schedule.
Certainty. Our technology-based design and manufacturing industry:

Leader in Integrated Design and Manufacturing Technology. We believe our ICE Software is the only interior construction technology that efficiently integrates the design, configuration, and virtual reality visualization processes

solutions address changes in design, communications with clients, and material costs with more certainty than conventional construction methods, which often involve retrofitting electrical and data networks, change orders, uncertain timelines, and costly rework. Our controlled manufacturing environment reduces deficiencies and errors and produces more consistent solutions in predictable time frames.

Budget. Because of our integrated design, visualization and manufacturing technologies, we can price the effect of design choices and changes immediately and deliver the fully designed, manufactured interior solutions ready to install. This provides budget certainty both in the cost of our DIRTT Solutions as well as in on-site labor for the installation process.

with the manufacturing process. The use of 3D technology in a design environment, utilizing video game technology for real time decision making, is an approach pioneered by DIRTT.

Outcome. Our interior spaces look like the images our clients expect from the design drawings and virtual visualizations, because those same drawings and visualizations drive the manufacturing process. Plumbing, electrical, A/V and data networks are integrated into the architecture of our DIRTT Solutions. For example, DIRTT Walls carry an aesthetic of permanent walls, but if an IT or facilities team needs to get inside the wall for any reason, they can use a tool to remove the surface of the wall to examine the wall cavity quickly, cleanly and quietly. This eliminates the need to knock down, and then patch and repaint, drywall or reconfigure fixtures and cabinetry. Our modular designs offer flexibility and interconnectivity with any technology, furniture, casework (millwork) or DIRTT Solutions that were previously used or that may be used in the future, allowing clients to reconfigure and repurpose their space while reducing disruptive and time-consuming demolition and waste removal.

Easy and Intuitive Software Interface. Our ICE Software is a fast, powerful tool with an intuitive user interface. Our software’s ease of use enables rapid time-to-value for our clients and collaboration among all the stakeholders involved in the design, reconfiguration, budgeting and manufacturing processes. Our use of 3D virtual reality and augmented (mixed) reality technologies enables clients to visualize and modify their designs before manufacturing begins, thereby reducing cost and time to completion.

Proprietary Solutions Components. The physical components that comprise our DIRTT Solutions have been designed to provide clients with numerous options and full modularity. As a result, we are able to create interior environments that are fully customizable and not limited by a pre-set product list. The modular nature of our components allows them to be reconfigured easily, with minimal disruption to the occupants of the space and with minimal job site waste.

Strong Distribution Partner and Sales Network. Our strong network of Distribution Partners and DIRTT sales representatives allows us to maximize our geographic reach, helps build brand awareness in the interior construction market, and enhances our positioning in our target markets.

Superior Results Compared to Traditional Design and Construction. We believe we produce superior client results as compared with traditional design and construction methods in sequencing, certainty, budget allocation, and outcome.

Effective Sequencing. Conventional construction generally follows a rigid sequencing process. Typically, wall framing is constructed first, followed by floors and electrical and data networks. This process is then followed by drywall installation, painting, and flooring, and then installation or building of millwork and fixtures. These steps generate significant waste and create opportunities for delay, change orders, cost overruns and rework. In contrast, DIRTT Solutions design and integrate the walls, floors and ceiling, including the finish, electrical wiring and data networks. They are manufactured off-site and arrive on-site organized, labeled and ready to be installed. This enables the interior solutions to be produced concurrently with on-site construction work, thereby reducing on-site time and the overall construction schedule.

Certainty. Our technology-based design and manufacturing solutions address changes in design, communications with clients, and material costs with more certainty than conventional construction methods, which often involve retrofitting electrical and data networks, change orders, uncertain timelines, and costly rework. Our controlled manufacturing environment reduces deficiencies and errors and produces more consistent solutions in predictable time frames.

Budget. Because of our integrated design, visualization and manufacturing technologies, we can price the effect of design choices and changes immediately and deliver the fully designed, manufactured interior solutions ready to install. This provides budget certainty both in the cost of our DIRTT Solutions as well as in on-site labor for the installation process.

Outcome. Our interior spaces look like the images our clients expect from the design drawings and virtual visualizations, because those same drawings and visualizations drive the manufacturing process. Plumbing, electrical, A/V and data networks are integrated into the architecture of our DIRTT Solutions. For example, DIRTT Walls carry an aesthetic of permanent walls, but if an IT or facilities team needs to get inside the wall for any reason, they can use a tool to remove the surface of the wall to examine the wall cavity quickly, cleanly and quietly. This eliminates the need to knock down, and then patch and repaint, drywall or reconfigure fixtures and cabinetry. Our modular designs offer flexibility and interconnectivity with any technology, furniture, millwork or DIRTT Solutions that were previously used or that will be used in the future, allowing clients to reconfigure and repurpose their space while reducing disruptive and time-consuming demolition and waste removal.

DistributionConstruction Partners and Sales Network

We primarily sell DIRTT Solutions through a network of independent DistributionConstruction Partners working in conjunction with local DIRTT sales representatives, as well as internal DIRTT industry specialists, business development professionals and a dedicated DistributionConstruction Partner support team. DistributionConstruction Partners and local sales representatives are located in cities throughout the United States and Canada.Canada, with additional locations in Saudi Arabia, Mexico, the United Kingdom and Singapore. The use of a dispersed network of DistributionConstruction Partners greatly enhances our ability to drive awareness of the DIRTT brand and understanding of our approach to construction throughout our markets.

9


As part of our distribution agreements, our DistributionConstruction Partners are typically required to invest in their own DIRTT Experience Center (“DXC”) so that they are able to effectively showcase DIRTT Solutions. These DXCs are showrooms that provide mock-ups of


DIRTT Solutions and related product offerings. As well, DIRTT maintains DXCs in Calgary, Toronto, Chicago, New York City, Savannah, Salt Lake CityDallas and Dallas. On February 22, 2022 we announced our intention to close our Phoenix DXC.Chicago.

Our DistributionConstruction Partners operate under agreements that outline sales goals and marketing territories which are generally non-exclusive. We expect our DistributionConstruction Partners to build regional DIRTT-dedicated teams (sales, design and project management) and to use our ICE Software in the sales process. In addition to sales and marketing, our DistributionConstruction Partners provide value throughout the construction process. At the pre-construction stage, DistributionConstruction Partners provide design assistance services to the architect and designer; throughout the construction process, DistributionConstruction Partners act as a specialty subcontractor to the general contractor and provide installation and other construction services. Post-move in, DistributionConstruction Partners provide warranty work, ongoing maintenance and reconfiguring support. Local DIRTT sales representatives work closely with the DistributionConstruction Partners throughout the process to ensure successful project implementation and the highest client satisfaction. DistributionConstruction Partners generally place orders for DIRTT Solutions directly with us and pay us directly for such orders.

We have the ability to bring on new DistributionConstruction Partners in a wide range of geographic areas, which permits us to quickly establish a presence in new market areas. Our DistributionConstruction Partners also scale our virtual reality technology, such as our smart phone- and tablet-based applications, to fit their capacity and needs.

At December 31, 2021,2023, we had a total of 69 Distribution72 Construction Partners and 6539 sales representatives across North America. We are not dependent on any one DistributionConstruction Partner or sales representative.

Strategic accounts are a cornerstone in our strategy to drive long-term sustainable and predictable growth. These types of clients manage large real estate footprints in numerous locations. For these clients, it is advantageous and important to establish consistency in design and execution, repeatability, and speed to market. While these relationships can take time to develop, once they are established, the time and resources required to execute additional projects is reduced, which we believe will create profitable, predictable revenue streams. In return, clients benefit from a single point of accountability at DIRTT, a strong network of partners, full lifecycle support from established design standards and pre-construction expert support for their architects, designers and general contractors from field work to post installation support.

Manufacturing and Properties

Our DIRTT Solutions are currently manufactured at our facilities in Calgary, Alberta;Alberta (the “Calgary Facility”) and Savannah, Georgia; and Rock Hill, South Carolina.Georgia (the “Savannah Facility”). On February 22, 2022, we announced the closure of our aluminum manufacturing facility in Phoenix, Arizona (the “Phoenix Facility”). On August 23, 2022, we announced the temporary suspension of operations at our Rock Hill, South Carolina facility (the “Rock Hill Facility”). On September 27, 2023, we announced our intention to permanently close the Phoenix manufacturing facility and move related production toRock Hill Facility because the Calgary and Savannah manufacturing facilities. This includes the Phoenix DXC as discussedFacilities can meet current demands with annual production capacity of $400 million in Item 1. Business in this Annual Report. Ourrevenue. Currently our wall surfaces (which we call tiles) are manufactured in Calgary and Rock Hill,panels), casework and timber solutions are manufactured in Calgary, while aluminum, glass and power components are manufactured in Calgary and Savannah. Through distributed manufacturing, we can shift production of some components among our manufacturing sites, reduce transportation times and costs, and meet targeted lead times. In 2019, we conducted an evaluation of our aluminum, tile and millwork capacities under various growth scenarios and concluded that the capacity of our aluminum manufacturing facilities is currently sufficient to support our anticipated growth. Given the longer lead time to acquire tile and millwork manufacturing equipment, combined with a lack of redundancy in those manufacturing facilities, we also concluded that we should commence construction of a new combined tile and millwork facility. In the fourth quarter of 2019, we entered into a lease for a building located in Rock Hill, South Carolina (the “South Carolina Facility”), which added approximately 130,000 square feet of manufacturing space for the combined tile and millwork factory. We substantially completed construction of the South Carolina Facility and commissioned the chromacoat tile line in the second quarter of 2021 with the millwork capabilities deferred until activity improves. In February 2022, we announced our intention to expand our tile manufacturing capabilities at the South Carolina Facility to include thermofoil through the relocation of existing underutilized equipment from the Calgary tile facility and back painted glass capabilities through the relocation of equipment from the Phoenix facility. Should the need arise, we have the right to lease an additional 130,000 square feet of space at our South Carolina Facility. If we experience additional growth, we may need to add or expand additional manufacturing facilities.

Suppliers and Raw Materials

Our inventory balances consist primarily of raw materials, which are kept on hand as components of our custom manufacturing process. Managing our raw material inventory is essential to our business, given our short lead times from order to shipment and our high level of order customization. Our key manufacturing materials are aluminum, hardware, wood and glass. For the twelve months ended December 31, 2021,2023, aluminum accounted for approximately 30.1%31% of our purchased materials, while wood, hardware wood and glassfinishing powder & paint accounted for approximately 13.9%12%, 11.1%9%, and 7.8%9%, respectively. While we maintain multiple suppliers for key materials, for the twelve months ended December 31, 2021,2023, (i) one supplier accounted for approximately 59%61% of our aluminum supply with threeand two additional suppliers providing approximately 14% each,provided 19% and 18%, respectively, (ii) two suppliers accounted for approximately 58%46% and 36%44% of our wood supply (iii) one supplier accounted for 100% of our paint & powder and (iv) one supplier accounted for approximately 44%42% of our hardware supply.

Materials are sourced domestically and, to a much lesser extent, overseas. Approximately 93% of our materials are manufactured and purchased in North America. Purchase decisions are made on the basis of quality, cost, and ability to meet delivery requirements. We do not typically enter into long-term agreements with suppliers. In general, adequate supplies of raw materials are available to all our operations, andbut we continue to date we have not been materiallybe impacted by supply chain disruptions due to the COVID-19 pandemic, other than inflationary price pressures across substantially all of our raw material requirements althoughand aluminum purchases may be subject to market capacity constraints.


10


Technology and Development

We continue to focus on developing client-centric innovations and enhancements of both ICE Software and DIRTT Solutions with a primary focus on improving client experience, increasing market penetration and growing key markets. At December 31, 2021,2023, we employed 10073 employees within our technology and development groups and, including capitalized amounts, invested $8.3 million, $10.3 million and $11.1 million $11.6 millionin 2023, 2022 and $11.3 million in 2021, 2020 and 2019, respectively, in innovation activities.

ClientsOn May 9, 2023, the Company entered into a Partial Patent Assignment Agreement and a Co-Ownership Agreement (the “AWI Agreement”) with AWI. The AWI Agreements provide for the partial assignment to AWI and co-ownership of an undivided 50% interest in certain intellectual property rights (including related patents) in a portion of the Company’s ICE software that is used by AWI (the “Applicable ICE Code”), in exchange for a cash payment of $10.0 million. As part of the AWI Agreements, the Company has agreed to provide AWI a transfer of knowledge concerning the Applicable ICE Code, upon completion of which the Company received an additional cash payment of $1 million. This additional cash payment was received in the fourth quarter of 2023. The AWI Agreement provide that the Company and AWI will have separate exclusive fields of use and restrictive covenants with respect to the Applicable ICE Code and related intellectual property rights which survive until either party elects to separate its relationship from the other and for a period of five years thereafter.

Clients

DIRTT’s principal geographic markets are the United States and Canada. Our revenue is derived almost entirely from projects in North America sold by our North American DistributionConstruction Partners.

Our revenue opportunities primarily come from commercial projects, including both new construction projects and renovations of existing buildings. Clients range from small owner-managed businesses to multinational Fortune 500 companies across a variety of industries, including healthcare, education, financial services, government and military, manufacturing, non-profit, energy, professional services, retail, technology, and hospitality. We view DIRTT Solutions as generally industry agnostic, with applications in many different industries with minimal adjustments. We are not dependent on any one client or industry segment. NoIn 2023, one Construction Partner represented more than 10% of our revenue (12% in 2023), while no single client represented more than 10% of our revenue for the years ended December 31, 2021, 2020,2022 or 2019.2021.

Competition

The overall market for interior construction is fragmented and highly competitive. The principal competitive factors in the interior construction industry include price (including cost certainty), speed, quality, customization, and service. Our main competitors are comprised primarily of conventional construction firms, individual tradespeople (including framers, drywall installers, and interior product designers) and modular systems manufacturers. Additionally, conventional construction firms are beginning to develop customizable wall paneling and other interior construction solutions and may directly compete with our DIRTT Solutions. We also compete with commercial furniture manufacturers, such as Teknion Corporation, Haworth Inc. and Allsteel Inc., who offer a variety of prefabricated interior wall solutions. We expect competition to increase as new entrants or solutions enter the interior construction market. See Item 1A. “Risk Factors”.

Seasonality

The construction industry has also historically experienced seasonal slowdowns related to winter weather conditions and holiday schedules, which affect shipping and on-site installation dates, in the fourth and first quarters of each calendar year. Our business has generally, but not always, followed this trend with a slight time lag, leading to stronger sales in the second half of the year versus the first half. Weather factors can also influence third-party exterior construction schedules and site conditions, which may in turn affect timing of interior renovations.builds.

Due to the fixed nature of certain of our manufacturing costs, such as our facilities leases and related indirect operating costs, periods of higher revenue volume tend to generate higher gross profit and operating income margins, while periods of lower volume tend to result in lower gross profit and operating income margins. Quarters that contain consistent monthly manufacturing volumes tend to generate higher gross profit than those where manufacturing levels vary significantly from month to month.

11


Patent and Intellectual Property Rights

Our success depends, in part, upon our intellectual property rights relating to our products, production processes, our technology, including our ICE Software, and other operations. We rely on a combination of trade secret, nondisclosure and other contractual arrangements, as well as patent, copyright and trademark laws, to protect our proprietary rights and competitive advantage. We register our patents and trademarks as we deem appropriate and take measures to defend patents where we deem others are


infringing on our patents. The following table presents the status as of December 31, 20212023, of our issued and pending patents relating to various aspects of DIRTT Solutions and ICE Software:


Granted


Applications


Granted


Applications


Jurisdiction


Patents


Pending


Patents


Pending


Canada


66


44


78


37


United States


119


22


128


16


European Union


48


27


47


3


Singapore


22


4


8


1


Patent Cooperation Treaty


-


8


-


8


Other


82


4


32


-


Total


337


109


293


65


Our issued patents expire between 20222024 and 2039. We do not believe that the expiration of any individual patent will have a material adverse effect on our business, financial condition or results of operations. As we develop innovations and new technology, we expect to file additional and supplemental patents to protect our rights in those innovations and new technology.

Sustainability and Environmental Matters

The construction industry generates As described in more detail above, the Company entered into the AWI Agreement with AWI, under which AWI owns a significant amount of waste and is estimated to contribute approximately 39% of global carbon emissions.In order to address the growing climate challenges and meet the goals set50% interest in the Paris Agreement,rights, title and interests in all the construction industry has begun moving towards decarbonization and sustainable design integration. This includes sustainable material selection and offsite construction.Applicable ICE Code, including a 50% interest in the patent rights that relate to the Applicable ICE Code.

 Sustainability is an integral component of DIRTT's corporate brand identity. From our solution design and material selection to installation and beyond, sustainable behaviors are built into our decisions and processes. DIRTT's industrialized construction approach utilizes lean manufacturing methods and strategic material sourcing to limit waste production. Renewable energy is leveraged to help reduce the carbon footprint of our operations and solutions. Our innovations and products generally work with prior iterations, and our solutions can adapt to changing needs. We believe our projects help reduce the wastefulness present in conventional construction methods because our clients obtain customized spaces that can be more easily reconfigured over time and with higher recycled or recyclable content.

 In 2021, we released our first Environment, Social and Governance (ESG) report outlining our commitment to sustainability and the environment, as well as providing full disclosure of our current environmental and sustainability impacts. As we continue to work towards the goals set forth in our ESG report and advance our efforts by setting new goals, we continue to better our business and solutions for our clients.

Government Regulations

The operation of our business is subject to stringent and complex laws and regulations pertaining to health, safety, and the environment. As an owner or operator of various manufacturing facilities, we must comply with these laws and regulations at the federal, state, provincial and local levels in both the United States and Canada. Failure to comply with environmental laws and regulations may trigger a variety of administrative, civil, or criminal enforcement actions, including the assessment of monetary penalties, the imposition of investigative or remedial requirements, or the issuance of orders limiting current or future operations. Certain environmental statutes impose strict, joint and several liability for costs required to clean up and restore sites where hazardous substances or industrial wastes have been mismanaged or otherwise released.

While we do not believe that compliance with federal, state, provincial, or local environmental laws and regulations will have a material adverse effect on our business, financial position or results of operations, we cannot provide any assurances that future events, such as changes in existing laws or regulations, the promulgation of new laws or regulations, or the development or discovery of new facts or conditions related to our operations, will not cause us to incur significant costs.

Legal and Regulatory Proceedings

We may be involved from time to time in various lawsuits, claims, investigations, and other legal matters that arise in the ordinary course of business, including matters involving our products, intellectual property, relationships with suppliers, relationships with DistributionConstruction Partners, relationships with competitors, employees, and other matters. We may, for example, be a party to various litigation matters that involve product liability, tort liability, and claims under other allegations, including claims from our employees either individually or collectively. We do not believe that any current claims, individually or in the aggregate, will have a material


adverse effect on our financial condition, liquidity or results of operations. For additional information regarding our current legal proceedings, see Item 3. “Legal Proceedings.”

Implications of Being an Emerging Growth Company

We are an “emerging growth company” as defined in the Jumpstart Our Business Startups Act enacted in April 2012. Certain specified reduced reporting and other regulatory requirements are available to public companies that are emerging growth companies. These provisions include:

an exemption from the auditor attestation requirement in the assessment of our internal controls over financial reporting required by Section 404 of the Sarbanes-Oxley Act of 2002;
an exemption from the adoption of new or revised financial accounting standards until they would apply to private companies;

12


an exemption from compliance with any new requirements adopted by the Public Company Accounting Oversight Board requiring mandatory audit firm rotation or a supplement to the auditor’s report in which the auditor would be required to provide additional information about our audit and our financial statements; and
reduced disclosure about our executive compensation arrangements.

an exemption from the auditor attestation requirement in the assessment of our internal controls over financial reporting required by Section 404 of the Sarbanes-Oxley Act of 2002;

an exemption from the adoption of new or revised financial accounting standards until they would apply to private companies;

an exemption from compliance with any new requirements adopted by the Public Company Accounting Oversight Board requiring mandatory audit firm rotation or a supplement to the auditor’s report in which the auditor would be required to provide additional information about our audit and our financial statements; and

reduced disclosure about our executive compensation arrangements.

We will continue to be an emerging growth company until the earliest of:

the last day of our fiscal year in which we have total annual gross revenues of $1.07 billion (as such amount is indexed for inflation every five years by the SEC to reflect the change in the Consumer Price Index for All Urban Consumers published by the Bureau of Labor Statistics, setting the threshold to the nearest $1 million) or more;
December 31, 2024;
the date on which we have, during the prior three-year period, issued more than $1 billion in non-convertible debt; or
the date on which we are deemed to be a “large accelerated filer” under the rules of the SEC, which means the market value of our common shares that is held by non-affiliates (or public float) exceeds $700 million as of the last day of our second fiscal quarter in our prior fiscal year.

the last day of our fiscal year in which we have total annual gross revenues of $1.07 billion (as such amount is indexed for inflation every five years by the SEC to reflect the change in the Consumer Price Index for All Urban Consumers published by the Bureau of Labor Statistics, setting the threshold to the nearest $1 million) or more;

December 31, 2024;

the date on which we have, during the prior three-year period, issued more than $1 billion in non-convertible debt; or

the date on which we are deemed to be a “large accelerated filer” under the rules of the SEC, which means the market value of our common shares that is held by non-affiliates (or public float) exceeds $700 million as of the last day of our second fiscal quarter in our prior fiscal year.

We have elected to take advantage of certain of the reduced disclosure obligations in this Annual Report and may elect to take advantage of other reduced reporting requirements in future filings. As a result, the information that we provide to our shareholders may be different than what you might receive from other public reporting companies in which you hold equity interests. However, we have irrevocably elected not to avail ourselves of the extended transition period for complying with new or revised accounting standards and, therefore, we will be subject to the same new or revised accounting standards as other public companies that are not emerging growth companies.

We expect to lose emerging growth company status by December 31, 2024.

Human Capital Resources

As ofat December 31, 2021,2023, DIRTT employed 1002879 employees, 99% full time, 1% part time. We had 989874 full-time employees consisting of 588592 employees in production, 110100 employees in sales and marketing, 10073 employees in technology and development, 11248 employees in operations support, and 7961 general and administrative employees. At year-end, approximately 56%45% of our workforce are salaried employees and approximately 44%55% are compensated on an hourly basis. As ofat December 31, 2021,2023, approximately 33%24% of our workforce was based in the United States, and approximately 67%76% was based in Canada. Our 20212023 hiring efforts were directed towards both our manufacturing and non- manufacturingnon-manufacturing functions. This reflects the build out of our commercial organization, accounting for 20% of our new hires, and streamlining our operations space, accounting for 59% of our hiring activities. The Company’s recent gender diversity data shows that 28% (202025% (202228%25%) of our employees are female company wide. In 20212023, we hired 137174 employees, with 36%27% of new employees being female. On February 22, 2022, we announced an intended reduction of our salaried headcount by approximately 18%.

Diversity & Inclusion

DIRTT recognizes the importance of progressing conversations and initiatives around diversity and inclusion. “Grow through diversity” is one of our core values. Our strategy encompasses leadership training around key topics related to unconscious bias, allyship, and the value of attracting and retaining a diverse and inclusive organization. The strategy further focuses on the establishment and deployment of learning streams, mentoring circles, and incorporation of inclusive language into our offer packages and benefit materials. Our efforts begin at the early stages of the employee life cycle, where diversity candidates are highlighted and


presented to hiring managers for review. We seek to hire based on talent, skill, capability needs, and fit. DIRTT has also incorporated diversity into various internal programs including succession planning and risk profiles.

Culture & Engagement

DIRTT has put measures in place to assess and enhance the level of engagement and satisfaction of our employees. Specific activities include the deployment of a performance management tool catered to drive discussions around team goals, performance and development opportunities, and greater transparency around policy and procedures tied to cost and risk mitigation.

In the first quarter of 2021,2023, we introducedconducted two employee engagement surveys through a leadership development program with a total of 146 employees registeredplatform called Employee Voice that focuses on six core leadership competencies; feedback, communication, conflict, emotional intelligence, leadership presence and navigating change.

In the fourth quarter of 2021, we deployed our company-wide engagement surveysurveys focused on core themes of meaningful work, supportive management, positive work environment, growth opportunity, trust in leadershipworkplace civility, communication, work-life balance, retention, job satisfaction, employee engagement and mental health awareness.diversity and inclusion. Targeted initiatives are being put in place companywide to assess the progression of themes from the survey on overall employee engagement and experience.

13


Additional initiatives that we attribute to the progression of culture and engagement include launching learning and development opportunities, enhanced communication platforms, employee recognition programs, a company-wide philanthropic organization, and a strong focus on virtual social events to further support engagement and connection throughout the COVID-19 pandemic.of remote employees.

Connecting to our community is a critical piece of the DIRTT story. We continue to focus on establishing a stronger community investment program that demonstrates our drive to put community at the center of the business. This involves developing a strategy, carving out a roadmap of initiatives, and establishing a committee of employees across the organization. As part of our strategy, we are focusing our efforts on establishing meaningful engagement opportunities, creating inclusive giving campaigns, driving sustainable impact, and enabling our employees to connect on philanthropic efforts. In the fourth quarter of 2021,2023, we successfully completed our holiday giving campaign which was a coordinated in-person and virtual effort in support of food banks across North America, focusing on the cities in which we operate. The support for this campaign helped to reconnect DIRTT employees’ desire to give back with tangible outcomes for their communities. We take measures to address the mental health of our employees through a variety of company-wide initiatives.

Our core commitment to organizational safety resulted in a Total Recordable Incident Frequency (“TRIF”)(TRIF) of 0.50.4 in 2021 and 2020,2023, more than 88%92% below the industry average and a significant improvement from 4.9 TRIF in 2019. Our enhanced health and safety protocols have been effective thus far in mitigating the spread of COVID-19 infections within our facilities and have helped us to avoid any material production disruptions.average.

We use a range of compensation incentives which vary by role, including annual variable compensation determined based on a combination of achieving team objectives and financial targets for the Company; quarterly bonuses for our manufacturing personnel paid on adherence to targets related to safety, quality, delivery, inventory and productivity; and commissions based on sales. We also use various forms of stock-based compensation as a retention tool and to further align employee interests with the interests of our shareholders. We monitor our retention by way of voluntary turnover, which was 15%14% in 2021.

In response to the COVID-19 pandemic, DIRTT established a business continuity and response committee to develop robust company-wide COVID-19 protocols and guidelines. Our COVID protocols encompass our employees, visitors and our contractors. The committee has prepared easily accessible COVID-19 guidelines for all areas of the business, including manufacturing, travel, client tours and day-to-day operations. In addition, we have established protocols for reporting and contact tracing, and we have a mandate to limit access to our facilities, offices and other spaces to only essential personnel to further minimize the risk of exposure to COVID-19. DIRTT provides financial support to our employees who test positive or have been identified as a close contact. To ensure that our teams are healthy and safe, we have implemented regular fogging (sanitization) at all our manufacturing facilities and our head office. We have also implemented enhanced cleaning protocols (including the use of stronger chemical concentrations with a focus on high touch areas), increased signage, shift rotations in cafeterias, limited headcounts in conference and meeting rooms, and work-from-home guidelines and other best practices. We provide all our employees, visitors, and contractors with the required COVID-19 controls including personal protective equipment.

In addition, we have taken measures to address the mental health of our employees through a variety of company-wide initiatives. We have established a safety champions committee responsible for ensuring any employee or visitor coming into our spaces is briefed on our COVID-19 protocols and guidelines. Lastly, we have implemented an app for reserving workspaces to help


our employees adhere to our social distancing protocols, provide for greater support of contact tracing and ensure we adhere to capacity levels that will help us maintain safety protocols related to COVID-19.2023.

None of our employees are covered by collective bargaining agreements. We have never experienced labor-related work stoppages or strikes, and we believe we currently have a positive relationship with our employees.

14


Item 1A. Risk Factors.

Item 1A.

Risk Factors.

Investing in our common shares involves a high degree of risk. You should carefully consider the risks described below, as well as the other information in this Annual Report, including our consolidated financial statements and the related notes and Part II, Item 7. entitled “Management’s Discussion and Analysis of Financial Condition and Results of Operations,” and in any documents incorporated in this Annual Report by reference, before deciding whether to invest in our common shares. The occurrence of any of the events or developments described below could harm our business, financial condition, results of operations, and growth prospects. In such an event, the market price of our common shares could decline, and you may lose all or part of your investment. Although we have discussed all known material risks, the risks described below are not the only ones that we may face. Additional risks and uncertainties not currently known to us or that we currently deem immaterial may also impair our business operations. Certain statements below are forward-looking statements. See also “Special Note Regarding Forward-Looking Statements” in this Annual Report.

Risks Related to Our Business and Industry

OurWe are under the leadership of a reconstituted Board of Directors who are in the process of implementing a variety of operational, organizational, cultural and other changes to our business, financial condition, results of operations and growth could be harmed by the effects of the COVID-19 pandemic and related government measures.

The COVID-19 pandemic has created significant volatility, uncertainty and economic disruption. The extent to which COVID-19, or other public health pandemics or epidemics, impact our employees, operations, customers, suppliers and financial results will depend on numerous evolving factors that we may not be able to accurately predict, including: the duration and scopeachieve some or all of the COVID-19 pandemic (and whetheranticipated benefits of this transformation plan.

Our Board of Directors was entirely reconstituted at our annual and special meeting of shareholders held on April 26, 2022 and, since that meeting, there has been significant turnover in the Company’s leadership. In addition to overseeing the changes to DIRTT’s leadership, the reconstituted Board of Directors has undertaken an extensive review of DIRTT’s operations, a process which is still ongoing (see Item 7. “Management’s Discussion and Analysis of Financial Condition and Results of Operations – Outlook”), and are in the process of implementing a resurgence or multiple resurgencesvariety of operational, organizational, cultural and other changes to our business, including plans to meet pipeline demand and expand revenues. The timely integration of senior management will be critical in the successful implementation of the virusBoard of Directors’ plans. We may not be successful in achieving some or all of the future, including as a resultanticipated benefits of strain variations); the actions taken by governments and public health officials in response to the pandemic; the availability and effectiveness of vaccines, approvals thereof and the speed of vaccine distribution; the impact on construction activity (including related supply chain and labor shortages and their effects on construction schedules and timing); the effect on our customers’ demand for our DIRTT solutions; our ability to manufacture and sell our products; and the ability of our customers to pay for our products. For example, while many of our products support life sustaining activities and essential construction, we, and certain of our customers or suppliers, may be impacted by state or provincial actions, orders and policies regarding the COVID-19 pandemic, including temporary closures of non-life sustaining businesses, shelter-in-place orders, and travel, social distancing and quarantine policies, the implementation and enforcement ofthese plans, which may vary by individual jurisdictions. On September 9, 2021, President Biden issued executive orders establishing, among other things, new vaccination requirements applicable to U.S. federal workers and contractors, large employers and healthcare workers. Subject to limited exceptions, the executive order requires U.S. employees of federal contractors to be fully vaccinated against COVID-19 by January 18, 2022. In January 2022, the U.S. District Court for the Southern District of Georgia issued a ruling enjoining the vaccine mandate portion of the executive order. As a federal contractor, we are subject to the executive order and, despite the injunction, have implemented mandatory vaccination rules for all U.S. employees and subcontractors to satisfy the requirements by January 18, 2022. Further, additional vaccine mandates may be announced in jurisdictions in which our businesses operate. Our implementation of these rules may result in attrition, including attrition of skilled labor, and difficulty securing future labor needs. Additionally, our implementation of these rules may impact our ability to maintain satisfactory arrangements with third-party vendors and service providers, to the extent they are subject to vaccination requirements and they or their employees are unable or unwilling to comply. Any of the foregoing events could have a materialan adverse effect on our business, liquidity or results of operations.

The shareholder meeting requisition notice delivered by 22NW Fund, LP (“22NW Fund”) could cause us to incur substantial costs, disrupt ourfrom operations and strategy, divert the board’s and management’s attention, or have other material adverse effects on us.financial condition.

On November 17, 2021, 22NW Fund took steps to requisition a special meetingCertain elements of the Company’s shareholders in order to remove six of the independent directors of the Company and replace them with hand-picked nominees of Mr. Aron English of 22NW Fund.The intentions of 22NW FundDIRTT’s administrative systems may not be aligned witheffective.

DIRTT has identified the interests of ourneed to upgrade its inventory management and cost accounting systems at some point in the future to enable scalable growth, and other shareholders. Respondinginformation technology investments may be required in the future. The Company is currently unable to estimate the costs and timeline related to such actions mayupgrades. However, the success, in whole or in part, of such investments cannot be costly and time-consuming, disrupt our operations and strategy, and divert the attention of the board of directors (the “Board”) and our management team from running our business, executing our strategic plan and maximizing performance for our shareholders. In addition, the uncertainty arising from the shareholder requisition could lead to the perception of a change in the direction of our


business or instability with our Distribution Partners, clients, suppliers or customers, which may be exploited by our competitors, and may result in the loss of potential business opportunities and make it more difficult to attract and retain qualified personnel and business partners, any of which could materially and adversely affect our business and operating results. Moreover, the results of the requisition could impact the strategic direction ofguaranteed. If the Company in a manner that is adversedoes not successfully or timely upgrade its inventory management and cost accounting systems, it may experience unforeseen challenges to our businessits inventory and operating results.pricing strategies.

We may not be successful in implementing our strategic plan or managing growth.growth

In November 2019, we unveiled a four-year strategic plan to scale our business based on three key pillars: commercial execution, manufacturing excellence and innovation. We have implemented several steps in furtherance of our strategic plan, including improvements in our commercial function and enhancements to our product suite and software platform.  

While we are confident in our strategy, we no longer believe that the financial targets articulated in November 2019 will be achieved by the end of 2023.Implementation of our strategy will require maturity of systems and processes across the organization. There is also no assurance that successful implementation will lead to sustainable, profitable growth, and may itself be disruptive to the Company. Failure to implement our strategic plan could materially and adversely affect our near-term sales, commercial activities, and ability to develop and sustain profitable growth. In addition, the success and timing of our implementation may be dependent upon external factors outside of our control, including the COVID-19 pandemic and its negative impact on construction activities as a whole. However, we remain confident that DIRTT’s value proposition will be as or even more relevant in the post-pandemic world.control.

Our strategy also depends in part on our ability to maintain and manage growth effectively. Growth in our headcount and operations may place significant demands on our management and operational and financial resources. Additionally, managing growth of our operations and personnel requires continuous improvement of our internal controls and reporting systems and procedures. Failure to effectively manage growth could result in difficulty providing current DIRTT Solutions and introducing future solutions, difficulty in securing clients and DistributionConstruction Partners, declines in quality or client satisfaction, increases in costs or other operational difficulties. Any of these difficulties could lead to a loss of investor confidence and adversely affect our business performance, financial condition and results of operations.

Our industry is highly competitive, and we may not be successful in educating potential clients about the benefits of our innovative and unique approach to interior construction as compared to traditionalconventional interior construction methods.

We operate in the highly competitive interior construction industry that is constantly developing and changing. We compete against conventional construction firms, individual tradespeople, and modular systems, and commercial furniture manufacturers. New market entrants and conventional construction firms are also beginning to develop customizable wall paneling and other modular interior construction solutions, and we expect this trend to continue. In addition, we may face pricing pressure from competitors or new market entrants who take on projects at reduced prices or employ other competitive strategies. While we believe our innovative design, quality, schedule and cost certainty, and network of DistributionConstruction Partners makes us well-positioned in the market, increasing competition could make it difficult to secure new projects at acceptable operating margins.

15


Our products are unique and offer an alternative to traditionalconventional construction techniques. Although offsite construction methods are gaining market acceptance, this still represents only a fraction of all construction methods and the overall construction market. Our ability to grow and increase market share depends, in part, on our success in continuing to increase demand for modular construction methods and products as an alternative to more traditional construction methods. While we intend to follow a strategy of innovative product development and strategic marketing efforts to enhance our position, there is no assurance that our solutions will attain a degree of market acceptance sufficient for sustained profitable operations. Failure to compete effectively by, among other things, meeting consumer preferences, developing and marketing innovative solutions, maintaining strong client service and distribution relationships, growing market share, and expanding our solutions capabilities could have a material adverse effect on our liquidity, financial condition, or results of operations.

Our co-founders’ and former co-founders’executives' competitive behavior against us could have an adverse effect on our business, financial condition and results of operations.

Our co-founders and former executives, Mogens Smed and Barrie Loberg, have started an interior construction and manufacturing company that we believe competes with us. They, along with a number of our former employees and DistributionConstruction Partners who have joined their company, have in-depth knowledge about our business, including our customers, employees, products and prospects, and we may be adversely affected by increased competition arising out of this business venture. We are engaged in litigation with Messrs. Smed and Loberg, entities with which they are involved, and other individuals relating to, among other things, enforcement of non-competition and non-solicitation obligations, alleged patent infringement, and alleged misappropriation of proprietary information by them or by us. See Note 18 to the Consolidated Financial Statements. If Messrs. Smed and Loberg further engage in a competitive business against us or if we are not successful in litigation, our business, financial condition and results of operations may be adversely affected. See Item 3. “Legal Proceedings.”


We depend heavily on our network of DistributionConstruction Partners, and the loss or inattention of our DistributionConstruction Partners, or the failure of our DistributionConstruction Partners to meet their obligations to us, could materially and adversely affect our business, financial condition and results of operations.

We currently do not engage in many direct sales projects and rely almost exclusively on our network of DistributionConstruction Partners to promote brand awareness, sell and market DIRTT Solutions, and provide design, installation, distribution and other services to clients on each project. While we are not dependent on any single DistributionConstruction Partner, sales generated by approximately 10% of our DistributionConstruction Partners comprised approximately 40%37% of our total revenues for 2021 (20202023 (202240%39%) with one Construction partner making up approximately 12% of total revenues (2022 - 7%). The loss of any top performing DistributionConstruction Partners, particularly to our competitors, may negatively affect our sales, financial condition or results of operations. It may further impair our ability to maintain a market presence in a particular geographic region until a new DistributionConstruction Partner relationship is established, which would require significant time and resources.resources, given DIRTT is typically a standalone line of business in their portfolio.

Although we provide our DistributionConstruction Partners with training, education, and support, they may be unable to successfully sell our DIRTT Solutions, execute projects or manage client experiences and relationships. In addition, our DistributionConstruction Partners and their clients may face financial difficulties or may become insolvent, which could result in the delay or cancellation of their plans to purchase DIRTT Solutions or lead to our inability to obtain payment of accounts receivable that they may owe. If we are unable to maintain a successful DistributionConstruction Partner network, our business, financial condition, and results of operations could be materially and adversely affected.

Increasing attention to environmental, social and governance (ESG) matters and conservation measures may adversely impact our or our customers’ business.

Increasing attention to, and societal expectations on companies to address, environmental and social impacts and investor, regulatory and societal expectations regarding voluntary and mandatory ESG-related disclosures may result in increased costs, reduced demand for our customers’ products, reduced profits, increased investigations and litigation, negative impacts on our stock price and reduced access to capital markets.

16


Moreover, while we may publish voluntary disclosures from time to time, certain statements in those voluntary disclosures may be based on hypothetical expectations and assumptions that may or may not be representative of current or actual risks or events or forecasts of expected risks or events, including the costs associated therewith. Mandatory ESG-related disclosure is also emerging as an area where we may be, or may become, subject to required disclosures in certain jurisdictions, and any such mandatory disclosures may similarly necessitate the use of hypothetical, projected or estimated data, some of which is not controlled by us and is inherently subject to imprecision. Disclosures reliant upon such expectations and assumptions are necessarily uncertain and may be prone to error or subject to misinterpretation given the long timelines involved and the lack of an established single approach to identifying, measuring and reporting on many ESG matters. Further, we have announced various voluntary ESG targets in our annual Environmental, Social, and Governance (ESG) report outlining our commitments to sustainability, the environment, health and safety, and diversity and inclusion. However, we cannot guarantee that we will be able to meet such voluntary targets in the manner or on such a timeline as initially contemplated, including, but not limited to, as a result of unforeseen costs or technical difficulties associated with achieving such results. Any actual or perceived failure to meet our ESG targets could adversely impact our reputation and our customers’ image of our products and result in the loss of business or impede our growth initiatives. Adverse publicity regarding ESG issues and similar matters, whether or not justified, could have a negative impact on our reputation and may result in the loss of customers and our inability to secure new customer relationships. Further, our customers may be more selective for products that meet their ESG goals or standards, such as increasing demand for goods that result in lower emissions, and our products could be less competitive if we are unable to meet these standards. Despite our efforts to adapt to and address these concerns, our efforts may be insufficient. Additionally, the implementation of these initiatives may increase our costs. It is difficult to predict how our efforts with respect to social and sustainability matters will be evaluated by current and prospective investors or by our customers or business partners. Despite our voluntary actions, we may receive pressure from certain investors, lenders, or other groups to adopt more aggressive ESG-related goals or policies, but we cannot guarantee that we will be able to implement such goals because of potential costs or technical or operational obstacles.

Furthermore, our reputation, as well as our stakeholder relationships, could be adversely impacted as a result of stakeholder perceptions of statements made by us, our employees and executives, agents, or other third parties or public pressures from investors or policy groups to change our policies. Such statements with respect to ESG matters are becoming increasingly subject to heightened scrutiny from public and governmental authorities related to the risk of potential “greenwashing,” i.e., misleading information or false claims overstating potential ESG benefits. As a result, we may face increased litigation risks from private parties and governmental authorities related to our ESG efforts. Moreover, any alleged claims of greenwashing against us or others in our industry may lead to negative sentiment. To the extent that we are unable to respond timely and appropriately to any negative publicity, our reputation could be harmed. Damage to our overall reputation could have a negative impact on our financial results and require additional resources to rebuild our reputation. Additionally, to the extent ESG matters negatively impact our reputation, we may not be able to compete as effectively to recruit or retain employees, which may adversely affect our operations. Such ESG matters may also impact our customers, which may result in reduced demand for certain of our products and services.

Risks Relating to Our Products and Software

We may be unsuccessful in designing, introducing, or selling new innovative solutions, solution features, or software.software, which also may cause us to become less competitive.

As our competitors and others develop new technologies in the future, we may be placed at a competitive disadvantage if we fail to keep pace with technological advancements within our industry. Our future success depends in part on our continuing ability to promote and demonstrate the value proposition of DIRTT Solutions, as well as our ability to develop and sell new innovative solutions, solution features, or software that differentiate our solutions and achieve market acceptance in a timely and cost-effective manner. We incur significant costs associated with the investment in our research and development in furtherance of our strategy that may not result in increased revenue or demand for DIRTT Solutions and that could negatively affect our results of operations. Rapidly changing technology, evolving regulatory and industry standards, and changing consumer trends, demands, and requirements require us to continuously innovate and develop new, high-quality solutions, solutions features and software. Additionally, such rapid technological changes, standards and preferences could render the complex and proprietary technology of our software and solutions obsolete. We may alsonot be unableable to successfully address these developmentsimplement new technologies on a timely basis or at all.an acceptable cost. New solutions, solution features, or software may also be less successful than we anticipated, and such offerings may fail to achieve market acceptance. If we fail to respond quickly and cost-effectively to a changing market and changing consumer preferences, our competitive position, financial condition, and results of operations could be materiallyadversely affected. Outside of the ongoing evaluation of new construction market sectors, we are considering various partnerships that aide into the advancement and adversely affected.development of the construction industry. This includes diversifying our current prefabricated offerings, aligning with sourcing companies, and establishing initiatives with other companies embracing the mindset of change. While these actions strengthen our stakes in the prefabrication market, we may be unsuccessful in generating revenue through these initiatives.

17


Our software and products may have design defects, deficiencies, or other unknown risks, and we may incur additional costs to fix any such defects, deficiencies, or other risks, or be subject to warranty or product liability claims.

Our software and solutions are complex and must meet both the technical requirements of our clients and applicable building codes and regulations. Our solutions may contain undetected errors or design and manufacturing defects, and our software may experience quality or reliability problems, or contain bugs or other defects. Software defects may also cause errors in our manufacturing or miscalculations in ordering and pricing, andwhich could lead us to incur losses and perhaps lose market share to competitors. Product or software defects could cause us to incur warranty costs, product liability costs, and repair and remediation costs. Although we maintain warranty reserves based on production, historical claims, and estimates, future warranty claims may exceed this amount.our reserves. Similarly, while we maintain insurance of the types and amounts we consider commercially prudent and consistent within view of industry practice, such insurance coverage may not be sufficient to protect us against substantial claims. Such claims cancould be expensive to defend, could divert resources, including the attention of management and other personnel for significant periods, and regardless of the ultimate outcome and could result in negative publicity. Increased costs to address product warranty claims or to defend against product liability claims, may result in increased expenses and adversely affect our financial condition andor results of operations.

We are subject to fluctuations in the prices of raw materials and commodities, which could adversely affect our liquidity, operating margins and financial condition.

We purchase raw materials, including aluminum, glass, and wood, from a number of local and global suppliers. The costs of these commodities can fluctuate due to changes in global supply and demand, inflation, speculation in commodities futures, and changes in tariffs or trade barriers, which can also interrupt supply. In addition, we have not historically entered into long-term agreements with vendors and may be exposed to short-term and long-term price fluctuations as a result.

Aluminum represents the largest component of our raw materials consumption. We have experienced fluctuations in the price of aluminum and anticipate that these fluctuations will continue in the future. In particular, during 2021 through 2023, we experienced significant price inflation across substantially all of our materials, largely due to pandemic-induced supply chain constraints, and it is unclear whether such price increases will be temporary or permanent in nature. Since 2018,From time to time, the U.S. government has imposed tariffs on steel and aluminum and limited the amounts of steel and aluminum coming into the United States based on the countries of origin of those


imports. In 2021 and 2020,2023, we sourced the majority of our aluminum from North America and sourced under 10% of our raw materials from outside North America. Nonetheless, substantial, prolonged upward trends in aluminum and other commodity prices, along with tariffs and import limitations, could significantly increase our costs and adversely affect our liquidity, operating margins, and financial condition.

We rely on a limited number of outside suppliers for certain key components and materials, and failure or delay in obtaining the necessary components or materials could delay or prevent the manufacturing or distribution of our DIRTT Solutions.

We rely on certain key suppliers for raw materials and components, including aluminum, glass, wood, paint, and hardware. We maintain multiple suppliers for key materials, although for the year ended December 31, 2021,2023, (i) one supplier accounted for approximately 59%61% of our aluminum supply, with threerespectively, and two additional suppliers providingprovided approximately 14% each,19% and 18%, respectively (ii) two suppliers accounted for approximately 58%46% and 36%44% of our wood supply, and(iii) one supplier accounted for approximately 44%100% of our paint and powder supply, and (iv) one supplier accounted for approximately 42% of our hardware supply.

While we believe there are other vendors for most of our key requirements, certain materials and components meeting our quality standards are available only through a limited number of vendors. If we are required to obtain another source for these materials or components, we may not be able to obtain pricing on as favorable terms or on terms comparable to our competitors. Any failure or delay in obtaining the necessary raw materials or components in the quantities and quality required may result in increased costs and delays in manufacturing or distributing our products, which could have a material adverse effect on our liquidity, financial condition, or results of operations. A vendor may also choose, subject to existing contracts, to modify its relationship with us due to general economic concerns or specific concerns relating to that vendor or us, at any time. These modifications might include additional requirements from our suppliers that we provide them additional security in the form of prepayments or with letters of credit. Any significant change in the terms that we have with our key suppliers could materially and adversely affect our liquidity, financial condition, or results of operations.

18


Risks Relating to Market Conditions

Global economic, political and social conditions and financial markets, such as the Ukraine and the Israel-Hamas war, may impact our ability to do business and adversely affect our liquidity, financial condition, and results of operations.

Our industry is cyclical and highly sensitive to macroeconomic conditions. Overall declines or reductions in construction and renovation due to economic downturns, unemployment and office vacancies, changing return-to-office trends, difficulties in the financial services sector and credit markets, and imposition of trade barriers can impact the demand for our products. Financial difficulties experienced by our suppliers, DistributionConstruction Partners or clients could also result in, among other things, inadequate project financing, project delays, inability to pay accounts receivable or disruptions in our supply chain. Any general economic, political, or social conditions that may contribute to financial difficulties experienced by us, our suppliers, DistributionConstruction Partners, or clients may adversely affect our liquidity, financial condition and results of operations.

We are exposed to currency exchange rates, interest rates, tax rates, and other fluctuations, including those resulting from changes in laws.

Our revenues and expenses are collected and paid in different currencies, including the U.S. dollar and Canadian dollar. Fluctuations in the relative values of any such currency expose us to foreign exchange risk and could have a material and adverse effect on our cash flows, revenues and results of operations. We also have currency exchange exposure to the extent of a mismatch between foreign-currency denominated revenues and expenditures – in particular, where U.S. dollar revenues do not equal U.S. dollar expenditures. We are not currently using exchange rate derivatives to manage currency exchange rate risks. There are currently no significant restrictions on the repatriation of capital and distribution of earnings to foreign entities from any of the jurisdictions in which we operate. There can be no assurance that such restrictions will not be imposed in the future.

Most of DIRTT’s debt is on fixed interest rates. The Second Extended RBC Facility (as defined below) is subject to market interest rates. We are not currently using interest rate derivatives to manage interest rate risks. If interest rates rise, this could have a material and adverse effect on our cash flows, revenues and results of operations and may adversely affect our ability to access financing. We are currently undrawn on our Second Extended RBC Facility.

Compliance with new or amended tax laws and regulations could have a material adverse effect on our business. We base our tax positions upon our understanding of the tax laws (including, applicable tax treaties) of the countries in which we have assets or conduct business activities. However, our tax positions are subject to review and possible challenges by taxing authorities, including as to the computation and allocation of income, transfer pricing and other complex issues. This includes adverse changes to the manner in which Canada, the United States and other countries tax local and foreign corporations and interpret or change their tax laws and applicable tax treaties, including in light of the increased focus by the U.S. Congress, the Canadian government, the OrganisationOrganization for Economic Co-operation and Development and other government agencies in jurisdictions where we do business on issues related to the taxation of multinational corporations. We cannot determine in advance the extent to which such jurisdictions may amend their tax laws, review our tax positions, or assess additional taxes or interest and penalties on such taxes. In addition, our effective tax rate may be increased by changes in the valuation of deferred tax assets and liabilities, our cash management strategies, local tax rates, or interpretations of tax laws.


Risks Relating to Intellectual Property and Information Security

We may be unable to maintain, protect or enforce our intellectual property adequately from infringement by third parties,rights, and we may also be subject to claims that we infringe onaccused of infringing intellectual property rights of others.

We rely on a combination of contract, copyright, patent, trademark and trade secret laws, confidentiality procedures and other measures to protect our intellectual property. There can beis no assuranceguarantee that our various contractual rights, patents, copyrights, or trademarks and trade secrets will offer sufficient protection of our products and services or prevent misappropriation of our proprietary rights in our products, software or processes. We also may not be granted patents, copyrights registrations or trademarkstrademark registrations on our pending or proposed applications, and granted applications may be challenged, invalidated or circumvented in the future. Despite our best efforts to maintain and enforce our intellectual property, monitoring unauthorized use of our intellectual property is difficult and costly, and the steps we have taken may not be sufficient to effectively prevent third parties from infringing, misappropriating, diluting or otherwise violating our intellectual property rights. Despite our precautions, it may be possible for unauthorized third parties to copy our applications and use information that we regard as proprietary to create products or services that compete with ours. We enforce our intellectual property rights where appropriate, but the cost of doing so may be substantial and could outweigh the potential benefits, and we may be unsuccessful in our enforcement efforts. Failure to protect or maintain the proprietary nature of our intellectual property could adversely affect our ability to sell original products and materially and adversely affect our business, financial condition and results of operations.

19


Additionally, our competitors or other third parties may own, or claim to own, intellectual property in technology areas relating to our technology, including ICE Software, manufacturing processes, and DIRTT Solutions. Although we do not believe that our software or DIRTT Solutions infringe onor misappropriate the proprietary rights of any third parties, litigation related to such claims, may arise regarding infringementwhether or invalidity claims (or claims for indemnification resulting from infringement claims). Such assertions or prosecutions, regardless of their merit,not meritorious, may subject us to significant liabilities, require us to enter into royalty and licensing arrangements on unfavorable terms, prevent us from assembling certain of our products or licensing certain of our products,intellectual property, subject us to injunctions restricting our sale of products or services, cause severe disruptions to our operations or the marketplaces in which we compete, or require us to satisfy indemnification commitments with our clients, including contractual provisions under various license arrangements. A damages award against us could include an award of royalties or lost profits and, if thea court finds willful infringement, treble damages and attorneys’ fees. This may cause us to expend significant costs and resources, and could adversely affect our business, financial condition or results of operations.

If we are unable to protect our information technology systems against data corruption, cyber-based attacks or network security breaches, our operations could be disrupted and our reputation and profitability could be negatively affected.

In the ordinary course of our business, we generate, collect and store confidential and proprietary information, including intellectual property, business information, and businessother proprietary information. The secure storage, maintenance, and transmission of, and access to, this information is important to our operations and reputation. We use automated software and hardware solutions to protect our on-premise and cloud infrastructure; conduct routine third-party evaluations and vulnerability testing to identify and mitigate risks; and deploy employee training programs throughout the company. WeAlthough we have experienced cyber-based attacks, but to our knowledge, we have not experienced any material disruptions or breaches of our information technology systems or platforms. However, there is no guarantee that our security systems, or processes or procedures designed to protect our information technology systems are adequate to safeguard against all data security breaches, misuse of data, cyber-attacks, acts of vandalism, computer viruses, misplaced or lost data, programmingcybersecurity risks or human errors or other similar events.error. Any security breach involving the misappropriation,misuse, loss or other unauthorized disclosure of confidential information of a client, DistributionConstruction Partner, employee, supplier or Company information could result in financial losses, exposure to litigation risks and liability (including regulatory liability), damage to our reputation, and disruptions indisruption to our operations, all of which could have a material adverse effect on our business, financial condition andor results of operations. While we maintain cybersecurity insurance of the types and amounts, we consider it commercially prudent andcybersecurity insurance consistent with industry practice, such insurance may not be sufficient to cover all losses relating to data loss or an information security breach.

The regulatory environment related to information security, data collection and use, and privacy is increasingly rigorous, with newcomplex and frequently changing requirements,continuously evolving and compliance with thoselaws, rules, regulations or other requirements could result in additional costs. The costs associated with information security, such as increased investment in technology, the costs of compliance with privacy laws, and costs incurred to prevent or remediate information security breaches, could be substantial and adversely affect our business. A significant compromise of sensitive employee, DistributionConstruction Partner, client or supplier data in our possession could result in legal damages and regulatory penalties. In addition, the costs of defending such actions, responding to complaints, or remediating breaches could be material.

Damage to our information technology and software systems could impair our ability to effectively provide DIRTT Solutions and adversely affect our reputation, relationships with clients, financial condition andor results of operations.

Our information technology and software networks and systems, which include the processing, transmission and storage of information, are integrated with our manufacturing processes andare essential to our business operations. These systems are vulnerable to, among other things, damage or interruption from power outages, network failures or natural disasters, loss or corruption of data, human error, employee misconduct and difficulties associated with upgrades, installations of major software or hardware, and integration with new systems. While we maintain retention backups to geo-diverse digital and physical locations and have a recovery data center, the data center and other protective measures we take could prove to be inadequate. Any disruption in our systems or unauthorized disclosure of information could result in delayed manufacturing and delivery of our DIRTT Solutions, legal claims, a


loss of intellectual property and a disruption in operations, all of which could adversely affect our reputation, relationships with clients, financial condition or results of operations.

Our core intellectual property in the ICE Code is jointly owned with a third party, who may fail to comply with its contractual obligations to protect and enforce our intellectual property rights.

AWI owns a 50% interest in the rights, title and interests in certain intellectual property rights in the Applicable ICE Code, including a 50% interest in the patent rights that relate to the Applicable ICE Code. As part of AWI’s purchase of the Applicable ICE Code, AWI must comply with contractual obligations designed to protect the Applicable ICE Code from infringement, misappropriation, misuse or exposure to unauthorized third parties. However, despite our efforts to monitor AWI’s actions, we may not become aware of AWI’s failure to comply with its obligations or we may not have adequate time to address such failure before there are adverse impacts to our business. Additionally, even if we attempt to require AWI to comply with its obligations to enforce our intellectual property rights, AWI may refuse or may not take adequate steps to do so. AWI’s failure to protect or maintain the proprietary nature of the Applicable ICE Code could adversely affect our ability to sell original products or adversely affect our business, financial condition or results of operations.

20


AWI may fail to meet certain security and non-disclosure obligations designed to prevent our competitors or other unauthorized third parties from accessing the Applicable ICE Code. Despite our efforts to enforce our rights and monitor any inadequacies, we may not have access to AWI’s internal security or business practices. Additionally, we may not be successful in preventing AWI from exposing the source code of the Applicable ICE Code to third parties or in protecting our intellectual property rights in the Applicable ICE Code. Any unauthorized access to the Applicable ICE Code in AWI’s possession could substantially and adversely affect our business or competitive advantage and management may have to expend significant time and resources to address unauthorized access and disclosure, all of which could have a material adverse effect on our business, financial condition or results of operations.

Risks Relating to Government Regulations and Enforcement

We may incur significant costs complying with environmental, health and safety laws and related claims, and failure to comply with these laws and regulations could expose us to significant liabilities, which could materially adversely affect our business and results of operations.

We are subject to laws, regulations, and other requirements with respect to workers’ health and safety and environmental matters in the United States, Canada and other countries in which we operate. Environmental laws and regulations impose, among other things, restrictions, liabilities and obligations in connection with the production, processing, preparation, handling, storage, transportation, disposal and management of wastes and other substances, and the prevention and remediation of environmental effects. Health and safety laws and regulations impose, among other things, requirements designed to ensure the protection of workers. New or more stringent laws and regulations, including those relating to climate change and greenhouse gas emissions, may be adopted in the future and could impact our facilities, raw material suppliers, the transportation and distribution of our solutions, and our clients, which could reduce demand for our solutions or cause us to incur additional operating costs. In addition, certain foreign laws and regulations may affect our ability to export products outside of, or import products into, the United States or Canada. Failure to comply with these requirements may result in civil or criminal liability, damages and fines, and our operations could be curtailed, suspended or shutdown and our reputation, ability to attract employees, and results of operations could be adversely affected. Private lawsuits, including claims for remediation of contamination, personal injury or property damage, or actions by regional, national, state and local regulatory agencies, including enforcement or cost-recovery actions, may materially increase our costs.

These factors may materially increase the amount we must invest to bring our processes into compliance with legal requirements and impose additional expenses on our operations. In addition, any changes in these laws or regulations or changes in our manufacturing processes may require us to request changes to our existing permits or obtain new permits. We may also be unable to obtain or maintain, from time to time, all required environmental regulatory approvals. A delay in obtaining any required environmental regulatory approvals or the failure to obtain and comply with such approvals could materially adversely affect our business and results of operations.

Risks Relating to Financial Results

We have had negative cash flow from operating activities.

We had negative cash flow from operating activities for prior years, including the years ended December 31, 2022 and 2021. Continued negative operating cash flow may compromise our ability to make interest and principal payments on the convertible unsecured subordinated debentures issued on January 25, 2021 and December 1, 2021 (collectively, the “Debentures”) on a timely basis, or at all, and to execute our strategic plan. Until we are able to generate positive cash flow from operating activities over a sustained period, our ability to finance our operations will be dependent on our cash reserves and available credit facilities and, if required, our ability to obtain additional external financing. Although we had $14.8 million in cash provided from operating activities for the year ended December 31, 2023, and we anticipate we will have positive cash flow from operating activities over at least the next twelve months, we cannot guarantee that such future cash flow will be sufficient, or other changes to our circumstances will not necessitate additional financial resources to fund our operating activities.

We have undertaken various actions to improve our cash flow and balance sheet in the short term, see “Management’s Discussion and Analysis of Financial Condition and Results of Operations–Liquidity and Capital Resources”. Although we anticipate these actions will strengthen our balance sheet and liquidity position, we cannot guarantee that such future cash flow will be sufficient or other changes to our circumstances will not necessitate additional financial resources to fund our operating activities.

21


We have experienced a history of losses, and despite certain periods of profitability in recent years, we may not be able to generate sufficient revenue to achieve and sustain profitability.

We have incurred significant losses since commencing business. We incurred net losses after tax of $53.7$14.6 million, $55.0 million and $11.3$53.7 million for the years ended December 31, 2023, 2022 and 2021, and 2020, respectively. AtAs at December 31, 2021,2023, we had an accumulated deficit of $111.3$180.9 million. These losses and accumulated deficits were due in part to the substantial investments made to grow our business and acquire clients, to further develop our service offerings through product and software development, to ensure that we have sufficient production capacity and capability to deliver on our commitment of rapid delivery times and to preserve our production, innovation and commercial capabilities through the economic disruption caused by the global COVID-19 pandemic in anticipation of a significantan increase in construction activity as the pandemic impacts abate.abated. Past results may not be indicative of our future performance, and there can be no assurance that we will generate net income in the future.

We have experienced, and may experience in the future, quarterly and yearly fluctuations in results of operations and financial condition.

Our results of operations and financial condition may continue to fluctuate from one quarter or year to another due to a number of factors, some of which are outside of our control. For example, we usually experience seasonal slowdowns in the first and fourth quarters of each calendar year, leading to stronger sales in the second half of the year versus the first half, and weather conditions may also delay delivery and installation on some projects. Furthermore, sales that we anticipate in one quarter may be pushed into another quarter, affecting both quarters’ results, and our actual or projected results of operations may fail to match our past performance. These events could in turn cause the market price of our common shares to fluctuate. In particular, if our results of operations do not meet the expectations of securities analysts or investors, who may derive their expectations by extrapolating data from recent historical results of operations, the market price of our common shares will likely decline. Due to our high fixed manufacturing costs and operating expenses, quarterly volatility in sales volumes could result in periods of low operating cash flow and negatively affect our liquidity. Due to these risk factors, quarter-to-quarter or year-to-year comparisons of our results of operations may not be an indicator of future performance.

We have negative cash flow from operating activities.

We had negative cash flow from operating activities for the year ended December 31, 2021. Continued negative operating cash flow may compromise our ability to make interest and principal payments on the convertible unsecured subordinated debentures issued on January 25, 2021 and December 1, 2021 (collectively, the “Debentures”) on a timely basis, or at all, and to execute our


strategic plan. Until we are able to generate positive cash flow from operating activities, our ability to finance our operations will be dependent on our cash reserves and available credit facilities and, if required, our ability to obtain additional external financing. Although we anticipate we will have positive cash flow from operating activities in future periods, we cannot guarantee that such future cash flow will be sufficient or that a prolonged recovery from the COVID-19 pandemic, or other changes to our circumstances, will not necessitate additional financial resources to fund our operating activities.

In response to our negative cash flow from operations, on February 22, 2022, we commenced the process of closing our Phoenix aluminum manufacturing facility, shifting related manufacturing to both our Savannah and Calgary aluminum facilities. This is expected to result in a net headcount reduction of approximately 26 and annualized cost savings of approximately $2.4 million. Additionally, we announced our intention to eliminate approximately 18% of our salaried workforce including manufacturing and office positions which, along with other cost reduction initiatives, are expected to yield annualized savings of approximately $13.0. One-time costs associated with these workforce reductions and other costs savings measures are approximately $5 million.

We have recognized, and may recognize in the future, impairment charges for our goodwill and certain other non-current assets.

During the year ended December 31, 2021, we impaired the $1.4 million net carrying value of goodwill on our consolidated balance sheet. Significant negative industry or economic trends, disruptions to our business, planned or unexpected significant changes in the use of the assets, and sustained market capitalization declines may result in the impairment of goodwill or other intangiblenon-current assets. We annually testIn 2022 and 2021, we had an indicator of impairment for our goodwillnon-current assets. In 2023, we announced our intention to close the Rock Hill Facility, which resulted in an impairment charge on the reclassification of assets held for impairment during the fourth quarter of the calendar year. Based on our testing, the fair value of goodwill did not exceed the carrying value of its netuse to assets and, accordingly, the entire $1.4 million balance of goodwill was impaired asheld for sale. As at December 31, 2021.2023, we did not have any impairment indicators for our non-current assets. Any further charges relating to impairments could have a material adverse impact on our resultsconsolidated statement of operations in the period in which the impairment is recognized.

Risks Related to Our Common Shares and Corporate Structure

Our share price has been and may continue to be volatile, which could cause the value of your investment to decline.

Our common shares are currently listed on the TSX under the symbol “DRT” and are quoted on Nasdaqthe OTC under the symbol “DRTT.“DRTTF.” The price of our common shares has in the past fluctuated significantly, and may fluctuate significantly in the future, depending upon a number of factors, many of which are beyond our control and may adversely affect the market price of our common shares. These factors include: (i) variations in quarterly results of operations; (ii) deviations in our earnings from publicly disclosed forward-looking guidance; (iii) changes in earnings estimates by analysts; (iv) our announcements or our competitors’ announcements of significant contracts, acquisitions, strategic partnerships or joint ventures; (v) general conditions in the offsite construction and manufacturing industries; (vi) sales of our common shares by our significant shareholders; (vii) fluctuations in stock market price and volume; and (viii) other general economic conditions.

In the past, following periods of volatility in the trading price of a company’s securities, securities class action litigation has been brought against that company. If our share price is volatile, we may become the target of securities litigation in both the United States and Canada. Securities litigation could result in substantial costs and divert management’s attention and resources from our business and could have an adverse effect on our business, financial condition and results of operations.

22


Our common shares are quoted on the OTC’s Pink Tier, and there may be a limited trading market in the Company’s common shares in the United States. As a result of the limited trading market, investors may experience limited liquidity, and may experience limited ability to sell shares in the open market.

Our common shares are quoted on the OTC’s Pink Tier under the symbol “DRTTF.” There may be a limited trading market in the Company’s common shares in the United States. As a result of the limited trading market of our common shares, investors in our common shares may experience limited demand for their common shares, which may limit their ability to sell their shares in the open market.

We are governed by the corporate laws of Alberta, Canada, which in some cases have a different effect on shareholders than the corporate laws of the United States.

We are governed by the ABCA and other relevant laws, which may affect the rights of shareholders differently than those of a company governed by the laws of a U.S. jurisdiction, and may, together with our charter documents, have the effect of delaying, deterring or discouraging another party from acquiring control of our company by means of a tender offer, a proxy contest or otherwise, or may affect the price an acquiring party would be willing to offer in such an instance. The material differences between the ABCA and Delaware General Corporation Law (“DGCL”), that may have the greatest such effect include, but are not limited to, the following: (i) for certain extraordinary corporate transactions (such as amalgamations or amendments to our articles), the ABCA generally requires the voting threshold to be a special resolution passed by not less than two-thirds of the votes cast by the shareholders who voted in respect of the resolution, whereas DGCL generally only requires a majority vote; and (ii) under the ABCA, registered holders or beneficial owners (as defined in the ABCA) of not less than 5% of our common shares in aggregate can requisition our directors to call a special meeting of shareholders, whereas such right does not exist under the DGCL. We cannot predict whether investors will find our company and our common shares less attractive because we are governed by the corporate laws of Alberta, Canada.

We will cease to be an “emerging growth company,” as defined in the Jumpstart Our Business Startups Act enacted in April 2012, no later than December 31, 2024.

On December 31, 2024, we will cease to be an emerging growth company. Once we cease to be an emerging growth company, we may be required to have our independent registered public accounting firm attest to the effectiveness of our internal controls if no other exemptions to such requirements apply. Once it is required to do so, our independent registered public accounting firm may issue a report that is adverse in the event it is not satisfied with the level at which our controls are documented, designed, operated or reviewed. Compliance with these requirements may strain our resources, increase our costs and distract management, and we may be unable to comply with these requirements in a timely or cost-effective manner.

Additionally, if our independent registered public accounting firm is required to express an opinion on the effectiveness of our controls when we cease to be an emerging growth company, we may be unable to confirm that our internal control over financial reporting is effective. If that is the case, or if our independent registered public accounting firm is unable to express an unqualified opinion on the effectiveness of our controls, we could lose investor confidence in the accuracy and completeness of our financial reports, which could cause the price of our common shares to decline.

Our two largest shareholders are able to exercise a significant amount of control over the Company due to their significant ownership of our common shares, and their interests may conflict with or differ from the interests of our other shareholders.

As of February 16, 2024, 22NW Fund, LP and Aron English (collectively, the “22NW Group”) and WWT Opportunity #1 LLC (“WWT”) each owned 30.1% and 27.9% of our common shares, respectively, together beneficially owning approximately 58.0% of our common shares. Shaun Noll is the Managing Member of WWT. In addition to the common shares, the 22NW Group owns C$18,915,000 principal amount of our January Debentures (as defined below) and C$13,638,000 principal amount of our December Debentures (as defined below). Both the January Debentures and the December Debentures are convertible into common shares in accordance with the terms thereof. Thus, the 22NW Group could further increase its ownership in the Company through the conversion of its January Debentures or December Debentures into common shares.

So long as the 22NW Group and WWT and their respective affiliates continue to directly or indirectly own a significant amount of our common shares, they will be able to exercise a significant level of control over all matters requiring shareholder approval, including the election of directors, amendments to our amended and restated articles of amalgamation, and approval of significant corporate transactions, barring any requirement for such shareholder to recuse itself from any such vote pursuant to applicable securities law, corporate law or the rules and regulations of any applicable stock exchanges. Further, affiliates of the 22NW Group and WWT also serve as directors on the Company’s Board of Directors. This control could have the effect of delaying or preventing a change of control of the Company or changes in management and would make the approval of certain transactions difficult or impossible without the support of these shareholders. Additionally, the perception that these shareholders would have the ability to control or significantly influence the Company could cause our common shares to be less attractive to certain investors or otherwise result in a decline in the trading price of our common shares. To the Company’s knowledge, the 22NW Group and the WWT are not acting in concert and do not constitute a “group” (as defined in Section 13(d)(3) of the Exchange Act).

23


Since the 22NW Group and WWT each exercise a significant amount of control over the Company due to their significant ownership of our common shares, if the 22NW Group and WWT were to disagree about key decisions with respect to the Company we may not be able to effectively address challenges facing our business, which could adversely affect our business, financial condition or results of operations.

Because we are a corporation incorporated in Alberta and some of our directors and officers are residents of Canada, it may be difficult for investors in the United States to enforce civil liabilities against us or our directors and officers based solely upon the


federal securities laws of the United States. Similarly, it may be difficult for Canadian investors to enforce civil liabilities against our directors and officers residing outside of Canada.

We are a corporation amalgamated and existing under the laws of Alberta with our principal place of business in Calgary, Alberta, Canada. Some of our directors and officers are residents of Canada and a substantial portion of our assets and those of such persons are located outside the United States. Consequently, it may be difficult for U.S. investors to effect service of process within the United States upon us or our directors or officers who are not residents of the United States, or to realize in the United States upon judgments of courts of the United States predicated upon civil liabilities under the Securities Act of 1933. Investors should not assume that Canadian courts: (i) would enforce judgments of U.S. courts obtained in actions against us or such persons predicated upon the civil liability provisions of the U.S. federal securities laws or the securities or blue sky laws of any state within the United States or (ii) would enforce, in original actions, liabilities against us or such persons predicated upon the U.S. federal securities laws or any such state securities or blue sky laws.

Similarly, some of our directors and officers are residents of countries other than Canada and all or a substantial portion of the assets of such persons are located outside Canada. As a result, it may be difficult for Canadian investors to initiate a lawsuit within Canada against these non-Canadian residents. In addition, it may not be possible for Canadian investors to collect from these non-Canadian residents judgments obtained in courts in Canada predicated on the civil liability provisions of securities legislation of certain of the provinces and territories of Canada. It may also be difficult for Canadian investors to succeed in a lawsuit in the United States, based solely on violations of federal, provincial or territorial securities laws.

General Risks

Difficulties in recruiting and retaining qualified officers or employees, or experiencing labor shortages or disruptions, could have a material adverse effect on our business and results of operations.

Our success will depend in part on our ability to attract, develop, and retain qualified personnel as needed. We are currently searching forhave undergone significant changes at a permanent replacement for our chief executive officer position; however, the marketplace for attracting senior executives is competitive, and there can be no assurances concerning the timing or outcome of our search for a new chief executive officer.management level during recent years as discussed elsewhere in this Annual Report. Although we anticipate smooth transitions, any changes to members of our senior management may be disruptive to our operations, including by diverting our Board’sBoard of Directors’ and management’s time and attention and a decline in employee morale. If there are any delays in this process, our business could be negatively impacted. We may be affected by labor shortages or disruptions, particularly in locations where we operate manufacturing facilities. If we fail to attract or retain qualified personnel, or experience labor shortages or disruptions, we could incur higher recruiting expenses, a loss of manufacturing capabilities, or inability to respond to significant increases in demand, all of which could have a material adverse effect on our business and results of operations.

We may have additional capital needs in the future and may not be able to obtain additional capital or financing on acceptable terms.

We plan to continually invest in business growth and may require additional funds to respond to business opportunities, such as expanding our sales and marketing activities, developing new software, acquiring complementary businesses, products or technology, and expanding or enhancing our manufacturing capabilities, including factory automation. To the extent that our existing capital is insufficient to meet our requirements, we may need to undertake equity or debt financings to secure additional funds. Further issuances of equity or convertible debt securities may result in significant share dilution. Additional new equity securities issued could have rights, preferences and privileges superior to those of our currently issued and outstanding common shares. Additional debt financings may involve restrictive covenants relating to our capital-raising activities and other financial and operational matters, which may make it more difficult for us to obtain additional capital and to pursue business opportunities. We cannot provide any assurance that sufficient debt or equity financing will be available for necessary or desirable expenditures or acquisitions, or to cover losses, and accordingly, our ability to continue to support our business growth and to respond to business challenges could be significantly limited, and our liquidity could be materially and adversely affected.

24


We may engage in future mergers, acquisitions, agreements, consolidations, or other corporate transactions that could adversely affect our business, financial condition, and results of operations.

While we currently have no specific plans to acquire any businesses, we may, in the future, seek to expand our business and capabilities through acquiring compatible technology, products or businesses. Additionally, we may explore other corporate transactions, including mergers, agreements, consolidations, or joint ventures, that we believe may be beneficial to our business or further specific business goals. Acquisitions involve certain risks and uncertainties, including, among other things, (i) difficulty integrating the newly acquired businesses and operations in an efficient and cost-effective manner; (ii) inability to maintain relationships with key clients, vendors and other business partners of the acquired businesses; (iii) potential loss of key employees of the acquired businesses; (iv) exposure to litigation or other claims in connection with our assumption of certain claims and liabilities of the acquired businesses; (v) diversion of management’s time and focus; and (vi) possible write-offs or impairment charges related to the acquired businesses. The occurrence of any of these risks could adversely affect our business, financial condition, and results of operations.

Item 1B. Unresolved Staff Comments.

None.

Item 1C. Cybersecurity.

The security of our information technology systems and Company data is important to our operations and reputation. Accordingly, we are committed to identifying and managing cybersecurity risks. Our Cybersecurity team performs periodic risk assessments and, on a quarterly basis, provides to our Enterprise Risk Management Committee (“ERM”) information related to the Company’s cybersecurity, including statistics on attempted cyber-attacks, status of employee information security training awareness, and information on any security investigations. The Cybersecurity team advises the ERM of significant global cyber events that occurred during the quarter and whether they impacted DIRTT. The Cybersecurity team regularly discusses with the ERM the Company’s cybersecurity posture and whether the Company should implement additional protections and controls to assist the Company in protecting, responding to, or mitigating potential future cyber-attacks.

DIRTT has developed and implemented a cybersecurity risk management strategy which consists of 5 phases: Identify, Protect, Detect, Respond, and Recover. Each phase has multiple processes and technologies supporting those processes.

Identify

Identification processes at DIRTT include: system asset identification, threat identification, vulnerability identification and maintaining cybersecurity policies and standards.

Protect

Protection processes at DIRTT include: cyber awareness training, cyber awareness assessment (each employee is assigned a cybersecurity awareness grade calculated by a best in class cybersecurity vendor), implementation of identity and access controls, perimeter and endpoint security, annual vulnerability assessments and remediation, data encryption in transit, key vendor (third parties) control effectiveness assessment, and pre-implementation of software and systems cybersecurity assessments.

Detect

Detection processes at DIRTT include: automated event collection, collation, analysis, alerting and end user incident reporting.

Respond

Respond processes at DIRTT include: containment, communication, investigation and analysis, and long-term mitigation planning.

Recover

Recovery processes at DIRTT include: impact identification and analysis, system restoration, internal and external communications as deemed necessary.

DIRTT engages external assessors annually for specific controls, to assess and provide assurance on the health of DIRTT’s cybersecurity posture and controls.


25


DIRTT’s Senior Vice President (“SVP”) of Technology, who reports to the CEO, is responsible for DIRTT’s cybersecurity and has over 15 years of technology experience. The SVP of Technology is supported by dedicated Cybersecurity staff and Governance, Risk and Compliance (“GRC”) staff. DIRTT’s cybersecurity team leader has over 20 years of experience in cybersecurity, multiple industry standard cybersecurity certifications, and extensive offensive and defensive cybersecurity tactical skills. DIRTT’s GRC lead has over 20 years of GRC experience and industry standard certifications. Cybersecurity incidents, response and remediation activities and statuses are reported directly to the SVP of Technology.

The ERM of the Board of Directors oversees risks resulting from cybersecurity threats. DIRTT’s management, represented by the SVP of Technology, is responsible for identifying, assessing, and managing risks arising from cybersecurity threats. Quarterly, DIRTT's SVP of Technology reports to the ERM on the health of DIRTT’s cybersecurity, incidents, and emerging threats and vulnerabilities that may impact the Company.

As of the date of this Annual Report, the Company has not identified any cybersecurity incidents that have materially affected or are reasonably likely to materially affect the Company’s results of operations and/or financial condition. See “Item 1A. Risk Factors” for additional information about cybersecurity risk.

Item 2. Properties.

Item 1B.

Unresolved Staff Comments.

None.

Item 2.

Properties.

Our principal executive offices are located in Calgary, Alberta, where we lease approximately 73,000 square feet of office and manufacturing space. Our lease expires in September 2022 and we are in the process of negotiating a five-year extension.2027. Our principal manufacturing facilities are currently located in Calgary, Alberta; Rock Hill, South Carolina; and Savannah, Georgia. On February 22, 2022, we announced our intention to close the Phoenix manufacturing facility and DXCDXC. On September 27, 2023, we announced our intention to permanently close the Rock Hill Facility, as discussed in Item 1. “Business” in this Annual Report. As a result, in February 2022, we announced our intention to expand our tile manufacturing capabilities at the South Carolina Facility to include thermofoil through the relocation of existing underutilized equipment from the Calgary tile facility and back painted glass capabilities through the relocation of equipment from the Phoenix facility.

Our wall surfaces (which we call tiles) are manufactured in Calgary and Rock Hill,panels), casework and timber solutions are manufactured in Calgary, while aluminum, glass and power components are manufactured in Calgary and Savannah. In Calgary, we lease an aggregate of approximately 358,000400,000 square feet of manufacturing space across threefour facilities (excluding our principal offices), which leases expire in January 20232026, January 2027, September 2027, and January 2024.2034. In Phoenix, we lease approximately 130,000 square feet of manufacturing space across two facilities, which leases expire in March 2027 and we intend to sublease2027. We are currently utilizing the Phoenix manufacturingspace as a storage facility and DXC upon closure.have subleased the remaining premises. In Savannah, we lease approximately 81,000 square feet of manufacturing space, which lease expires in February 2029. In October 2019, we entered into a 15-yearfifteen-year lease, which DIRTT may extend for two additional 5 yearfive-year periods at its option, for a tilepanel factory of approximately 130,000 square feet in Rock Hill, South Carolina. Should the need arise, we have the expansion rights to lease an additional 130,000 square feet of space. We are pursuing options to sublease this area following the September 27, 2023, announcement of our intention to permanently close operations at this location and do not plan to exercise the additional five-year extension period. In March 2020, we entered into an 8 yeareight-year lease, which DIRTT may extend an additional 5five years at its option, of approximately 18,000 square feet of space for a DXC in Dallas, Texas. During March 2023, we entered into an agreement to sublease our DXC in Dallas to one of our Construction Partners in that region, from April 1, 2023, through December 31, 2024.

Our ICE development offices are located in Calgary, Alberta and Salt Lake City, Utah. In Calgary, we sublease approximately 8,700 square feet of office space pursuant to a lease that expires on January 31, 2023. In our Salt Lake City development office, which also houses a DXC, we lease approximately 6,600 square feet of office space pursuant to a lease that expires in December 2023. In New York City, New York, we lease approximately 4,100 square feet of space to operate a DXC; this lease expires in February 2024. In Chicago, Illinois, we own approximately 6,200 square feet of office space, which we use to operate a DXC.

Through distributed manufacturing, we can shift production of some components among our manufacturing sites, reduce transportation times and costs, and meet targeted lead times. We believe that our current and planned facilities are adequate for our current needs and that suitable additional or substitute space would be available if needed.

Item 3.

DIRTT is pursuing multiple lawsuits against our formerits founders, Mogens Smed and Barrie Loberg, their new companyas well as Falkbuilt Ltd. (“Falkbuilt”), and otherFalkbuilt, Inc. (collectively, “Falkbuilt”) and related individualindividuals and corporate defendants for violationscorporations. DIRTT alleges breaches of fiduciary duties and noncompetitionnon-competition and non-solicitation covenants, contained in their executive employment agreements, and the misappropriation of ourits confidential and proprietary information in(in violation of numerous Canadian and U.S. state and federal laws pertaining to the protection of our trade secrets and proprietary information and the prevention of false advertising and deceptive trade practices.

As ofpractices). Except as described below, there have been no material developments in the legal proceedings previously disclosed in our Annual Report on Form 10-K for the year ended December 31, 2021, our2022.

26


DIRTT’s litigation against Falkbuilt, Messrs. Smed and Loberg, and their associates wasis comprised of fourthree main lawsuits: (i) an action in the Alberta Court of Queen’sKing’s Bench institutedcommenced on May 9, 2019 against Falkbuilt, Messrs. Smed and Loberg, and several other former DIRTT employees alleging breaches of restrictive covenants, fiduciary duties, and duties of loyalty, fidelity and confidentiality, and the misappropriation of ourDIRTT’s confidential information (the “Canadian Non-Compete Case”); (ii) an action in the U.S. District Court for the Northern District of Utah instituted on December 11, 2019 against Falkbuilt, Smed, and other individual and corporate defendants alleging misappropriation of ourDIRTT’s confidential information, trade secrets, business intelligence and customer information (the “Utah Misappropriation Case”); (iii) an action for federal patent infringement in the U.S. District Court for the Northern District of Illinois instituted on August 6, 2020 against Falkbuilt, alleging that Falkbuilt is infringing certain of DIRTT’s patents relating to our proprietary ICE® software (the “Patent Infringement Case”); and (iv)(iii) an action in the U.S. District Court for the Northern District of Texas instituted on June 24, 2021 alleging that Falkbuilt has unlawfully used ourDIRTT’s confidential information in the United States and intentionally caused confusion in the United States in an attempt to steal customers, opportunities, and business intelligence, with the aim of establishing a competing business in the United States market (the “Texas Unfair Competition Case”). We intendDIRTT intends to pursue the cases vigorously. We recently requested the Court of King’s Bench of Alberta to schedule the summary judgment application for our Canadian litigation. The court has proposed three potential dates in September 2025 and we expect to have the date finalized in the next several weeks.

In the Canadian Non-Compete Case, we have conducted extensive document productionon February 14, 2023, the Court of King’s Bench of Alberta granted DIRTT’s application to schedule the hearing of its summary judgment application and questioning ofdismissed Falkbuilt’s cross-application to strike the defendants that support our claims, as follows: (i) Smed and Loberg, and others, breached their duties owed to DIRTT, including their contractual and


fiduciary duties; (ii)  Smed, Loberg, and others began developing the new competing company immediately after Smed’s departure; (iii) before it was called Falkbuilt, the new competing company operated through a covert group comprised of then-current DIRTT employees and distribution partners known as the TTIMit Group (which stands for “This Time I Mean It”); (iv) members of the TTIMit Group took steps to conceal their communications by creating and using alias names, using private and personal email addresses and phone numbers, and holding secret meetings and gatherings; (v) the TTMit Group also used then-current DIRTT employees to build out Falkbuilt's warehouse premises and offices, source and purchase equipment for Falkbuilt, assist with market research and develop Falkbuilt's products, build vignettes and drawings, address Falkbuilt's software and computer needs, and name Falkbuilt; and (vi) members of the TTIMit Group conspired together to solicit DIRTT employees and distribution partners, design and sell competing products using DIRTT's confidential information, including DIRTT's pricing lists, DIRTT's product designs, DIRTT's personnel information, and revenue forecast information for DIRTT's distribution partners.summary judgment application. DIRTT is seeking, among other things, an order stopping the defendants from competing with DIRTT,aggressively pursuing its summary judgment for damages and losses, and an accounting and disgorgement of the defendants' gains from their wrongful misconduct.application.

In the Utah Misappropriation Case, on April 11, 2023, the United States Court dismissed certain of Appeals for the defendants, Falkbuilt Ltd., Falkbuilt, Inc. and Mogens Smed without prejudice, findingTenth Circuit reversed the U.S. District Court for the Northern District of Utah’s decision that Utah was an inconvenient forum. Weforum for DIRTT’s claims against Falkbuilt and others for the misappropriation of confidential information, trade secrets, business intelligence and customer information. The Utah Court had previously, and erroneously, found that DIRTT’s United States-based claims should be litigated in Canada. The Court of Appeals remanded the matter back to the Utah District Court. Falkbuilt filed motions to stay the Tenth Circuit decision pending its petition for a Writ of Certiorari to the Supreme Court of the United States. The Court of Appeals promptly denied the motion to stay. A similar motion subsequently filed with the Supreme Court of the United States on the same basis was also promptly denied. Falkbuilt also petitioned the Supreme Court to accept review, even after losing the stay motion, which petition was also denied in early October 2023. As a result of these appellate orders, the Utah federal trial court assumed jurisdiction over the pending claims. The Utah judge who issued the erroneous order dismissing DIRTT’s claims recused himself and the newly assigned judge reaffirmed all prior orders. As such, the case is resumed in the posture it was when the appeals began but with a different Judge.

The Texas Unfair Competition Case was dismissed in March 2022, without prejudice, in reliance upon the now-reversed decision in the Utah Misappropriation Case, described above. DIRTT appealed that decision, and the United States Court of Appeals for the Fifth Circuit stayed the appeal pending the Tenth Circuit ruling at Falkbuilt’s request. After prevailing in the Tenth Circuit, DIRTT asked Falkbuilt if it would, consistent with its prior representations, agree to remand the appeal to the Texas Court for disposition to Utah. Falkbuilt refused and alsoDIRTT filed a motionMotion to set aside the previously granted order granting a partial motion to dismiss without prejudice.Remand. The Court denied the Motion for Remand without prejudice and asked for full briefing. Argument proceeded on December 7, 2023 in New Orleans. The Court will either order the claims transferred to Utah or, if it affirms the lower court, those claims would proceed, inconveniently, in Canada. We believe it is very unlikely the claims would proceed in Texas as neither DIRTT or Falkbuilt currently desires that denial is consolidated withoutcome.

Prior to the initial appeal. The remaining portionargument, DIRTT sought leave to amend the Utah claims to include the Texas claims and notified the Fifth Circuit Court of Appeals of the proposed amendment in Utah. Falkbuilt did not object to the amendment, but answered the Complaint and reserved the right to dismiss the Amended Complaint on grounds of inconvenient forum or international comity. The Amended Complaint not only presents the Texas claims in Utah Misappropriation Case is stayed pending resolution of the appeal.

In the Patent Infringement Case, we are seeking, among other things, an order enjoining Falkbuilt from infringing our patentsbut also updates DIRTT’s allegations as to events and damages for past or continuing infringement. Recently, Falkbuilt was unsuccessfulincurred during the time the parties were participating in attempting to initiate an inter partes review and post grant review of our subject patents. The Patent Office found that Falkbuilt had not shown it would be likely to succeed in its invalidity challenges to our patents. Following those denials, the U.S. District Court ordered Falkbuilt to produce discovery regarding our claims. In January 2022, Falkbuilt informedappellate process.

On February 4, 2024, the Court that it had discontinued use of its infringing “Echo Dome” software. On the basis of this representation, the partiesCompany entered into a stipulated dismissal without prejudice, which was filedLitigation Funding Agreement with a third party for the funding of up to $4.0 million of litigation costs in respect of specific claims against Falkbuilt, Inc., Falkbuilt Ltd. and Henderson. In return, the Company has agreed to pay from any proceeds received from the settlement of such claims, a reimbursement of funded amounts plus diligence and underwriting costs, plus a multiple of such funded amount based on February 14, 2022.certain milestones. For additional information, please see Item 7, “Management’s Discussion and Analysis of Financial Condition and Results of Operations – Liquidity and Capital Resources”.

In the Texas Unfair Competition Case, we allege violations of the U.S. Lanham Act, the Texas Uniform Trade Secrets Act, the Federal Defend Trade Secrets Act, the Pennsylvania Uniform Trade Secrets Act, the Colorado Consumer Protection Act, and the Ohio Deceptive Practices Act, and are seeking preliminary and permanent injunctive relief to restrain Falkbuilt from using or disclosing our confidential business information in the United States, and awards of compensatory damages, exemplary damages, and attorneys’ fees. The defendants have moved to dismiss the Texas case without prejudice arguing that Texas is an inconvenient forum.

Falkbuilt also filed a lawsuit against us on November 5, 2019 in the Court of Queen’s Bench of Alberta, alleging that DIRTT has misappropriated and misused their alleged proprietary information in furtherance of DIRTT’s product development. Falkbuilt seeks monetary relief and an interim, interlocutory and permanent injunction of DIRTT’s alleged use of the alleged proprietary information. We believe that the suit is without merit and filed an application for summary judgement to dismiss Falkbuilt’s claim.

Item 4.Mine SafeSafety Disclosures.ty Disclosures.

Not applicable.

27


PART II

Item 5. Market for Registrant’s Common Equity, Related Stockholder Matters and Issuer Purchases of Equity Securities.

Item 5.

Market for Registrant’s Common Equity, Related Stockholder Matters and Issuer Purchases of Equity Securities.

Market Information; Holders of Record

Our common shares are traded on the TSX under the symbol “DRT” and are quoted on Nasdaqthe OTC Markets on the “OTC Pink Tier” under the symbol “DRTT.”“DRTTF”. Quotations of our common shares on the OTC Pink Tier reflect inter-dealer prices, without retail mark-up, mark-down or commission and may not necessarily represent actual transactions.

As of February 23, 2022,16, 2024, there were 85,351,261191,110,385 common shares outstanding and 192158 shareholders of record.

Dividends

We have not declared or paid any cash dividends on our common shares to date. The declaration and payment of dividends is at the discretion of the Board of Directors, taking into account (i) our earnings, capital requirements and financial condition, (ii) restrictions on our ability to pay dividends under ourthe Second Extended RBC Facility, (as defined below), and (iii) such other factors as the Board of Directors considers relevant. OurThe Second Extended RBC Facility generally limits our ability to pay any dividends or make any other distribution on our outstanding common shares. See


Item 7. “Management’s Discussion and Analysis of Financial Condition and Results of Operations – Credit Facility” for more information.

Performance Graph

The following graph illustrates a comparison If and when our Board of the total cumulative shareholder return ofDirectors declares cash dividends on our common shares, with the cumulative return of the S&P/TSX Composite Indexsuch dividends may be declared and the S&P 600 Building Products Index for the period commencing December 31, 2016 and ending on December 31, 2021. The graph assumes an initial investment of $100 on December 31, 2016,paid in our common shares, the shares comprising the S&P/TSX Composite Index, and the shares comprising the S&P 600 Building Products Index. The below shareholder return calculations are based on the exchange rates as reported by the H.10 statistical release of the Board of Governors of the Federal Reserve System as of the year-end exchange rate for the applicable period. The comparisons in the table are required by the SEC and applicable securities laws in Canada and are not intended to forecasteither U.S. dollars or be indicative of possible future performance of our common shares. This graph and related materials shall not be deemed “soliciting material” or be deemed “filed” for purposes of Section 18 of the Exchange Act, or otherwise subject to the liabilities under that section, and shall not be deemed to be incorporated by reference into any of our filings under the Securities Act of 1933, whether made before or after the date hereof and irrespective of any general incorporation language in any such filing.Canadian dollars.

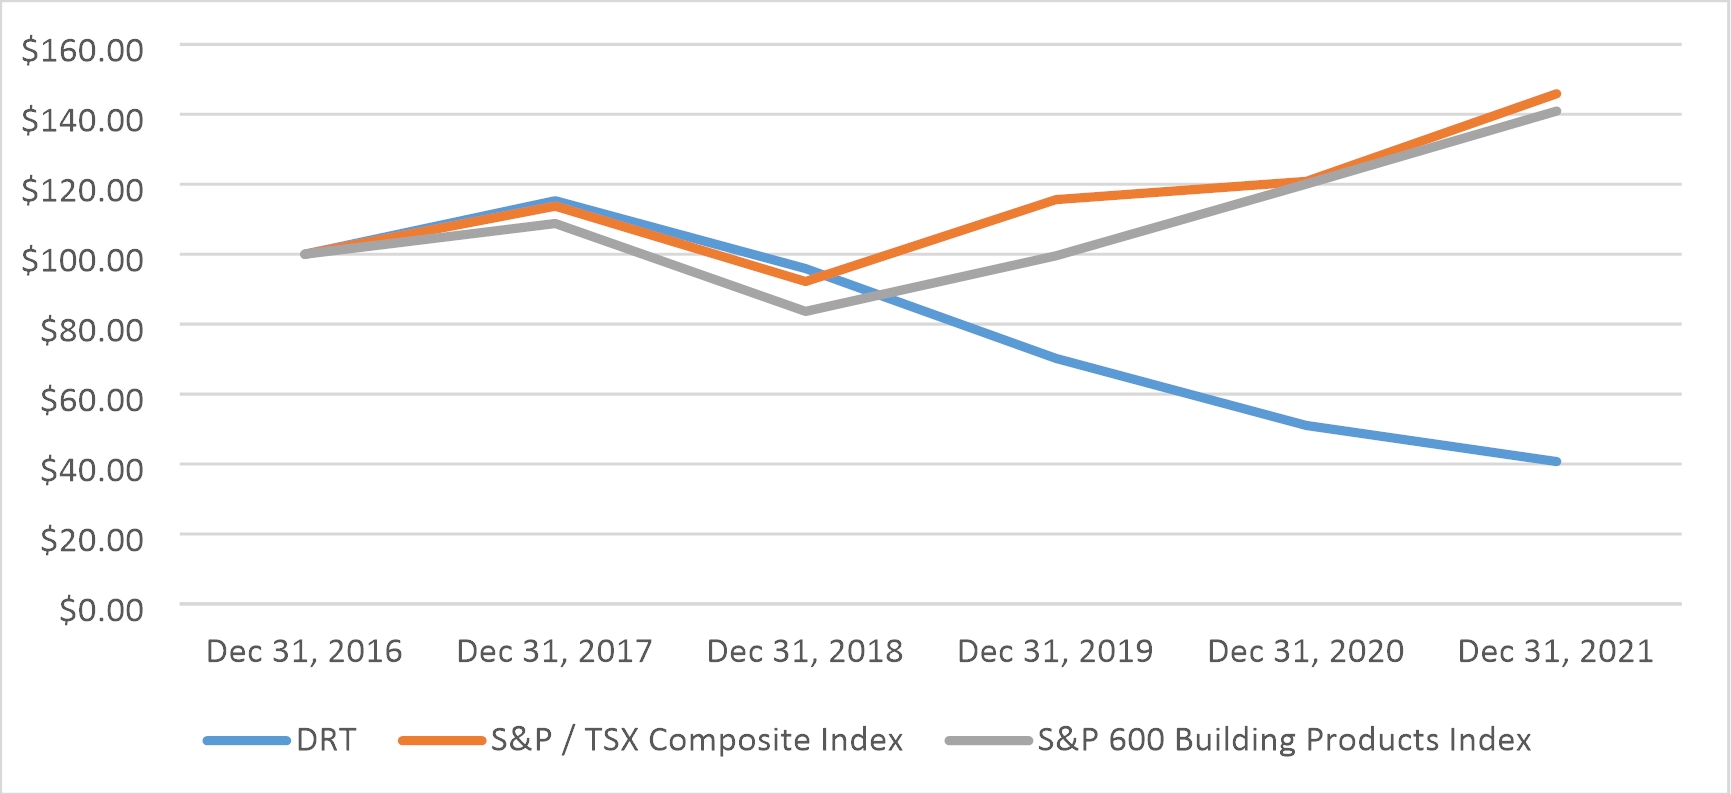
$100 investment in stock


December 31,


December 31,


December 31,


December 31,


December 31,


December 31,


or index


Ticker


2016


2017


2018


2019


2020


2021


DIRTT Environmental Solutions Ltd.


DRT


$

100.00


$

115.30


$

95.89


$

70.21


$

51.04


$

40.72


S&P/TSX Composite Index


SPTSX


$

100.00


$

113.73


$

92.19


$

115.61


$

120.83


$

145.88


S&P 600 Building Products Index


SML


$

100.00


$

108.78


$

83.65


$

99.55


$

120.04


$

140.93


Recent Sales of Unregistered Securities; Issuer’s PurchasesSecurities

None.

Item 6. [Reserved]

28


Item 7. Management’s Discussion and Analysis of Equity SecuritiesFinancial Condition and Results of Operations

None.

Item 6.

[Reserved]


Item 7.

Management’s Discussion and Analysis of Financial Condition and Results of Operations

You should read the following discussion and analysis of our financial condition and results of operations for the fiscal years ended December 31, 20212023 and 20202022 together with our consolidated financial statements and related notes and other financial information appearing in this Annual Report. The discussion contains forward-looking statements reflecting our current expectations and estimates and assumptions concerning events and financial trends that may effectaffect our future operating results or financial position. Actual results and the timing of events may differ materially from those contained in these forward-looking statements due to a number of factors, including those described under the headings “Risk Factors” and “Special Note Cautionary Statement Regarding Forward LookingForward-Looking Statements” appearing elsewhere in the Annual Report.

Overview

We are an innovative manufacturing company featuring proprietary software and virtual reality visualization platform, coupled with vertically integrated manufacturing that designs, configures and manufactures prefabricated interior solutions used primarily in non-residential spaces across a wide range of industries and businesses. We combine innovative product design with our industry-leading, proprietary ICE Software, and technology-driven, lean manufacturing practices and sustainable materials to provide end-to-end solutions for the traditionally inefficient and fragmented interior construction industry. We create customized interiors with aesthetics of conventional construction but with greater schedule and cost certainty, shorter lead times, greater future flexibility, and better environmental sustainability than conventional construction.

Our ICE Software allows us to sell, design, visualize (including 3D virtual reality modeling of interiors), configure, price, communicate, engineer, specify, order and manage projects, thereby reducing challenges associated with traditional construction, including cost overruns, change orders, inconsistent quality, delays and material waste. While other software programs and virtual reality tools are used in the architectural and construction industries, our ICE Software is the only interior construction technology that provides end-to-end integration, from design through order engineering, manufacturing and installation. Our interior construction solutions include prefabricated, customized interior modular walls, ceilings, and floors; decorative and functional millwork; power infrastructure; network infrastructure; and pre-installed medical gas piping systems. We strive to incorporate environmentally sustainable materials and reusable components into our solutions while creating flexible, functional and well-designed environments for the people who will use them.

We offer our interior construction solutions throughout the United States and Canada through a network of independent Distribution Partners and an internal sales team. Our Distribution Partners use ICE to work with stakeholders, including end users, to envision and design their spaces, and orders are electronically routed through ICE to our manufacturing facilities for production, packing and shipping. Our Distribution Partners then coordinate the receipt and installations of our interior solutions at the end users’ locations.

Summary of Financial Results

DIRTT Environmental Solutions Ltd. and its subsidiary (“DIRTT”, the “Company”, “we” or “our”) is a leader in industrialized construction for interior spaces. DIRTT’s system of physical products and digital tools empowers organizations, together with construction and design leaders, to build high-performing, adaptable, interior environments. Operating in the workplace, healthcare, education, and public sector markets, DIRTT’s system provides total design freedom, and greater certainty in cost, schedule, and outcomes.

DIRTT’s proprietary design integration software, ICE® (“ICE” or “ICE software”), translates the vision of architects and designers into a 3D model that also acts as manufacturing information. ICE is also licensed to unrelated companies and Construction Partners of the Company. As of May 9, 2023, AWI owns a 50% interest in the rights, title and interest in certain intellectual property rights in the Applicable ICE Code, including a 50% interest in the patent rights that relate to the Applicable ICE Code.

Key Fourth Quarter 2023 Highlights

Revenues for the year ended December 31, 2021 were $147.6 million, a decline of $23.9 million or 14% from $171.5 million for the year ended December 31, 2020. We believe this decrease principally reflects the severe economic and social impact of the COVID-19 pandemic since March 2020, including a major contraction in construction activity levels in North America due to non-essential business closures, work-from-home requirements, lock-down measures and other regulatory responses implemented by governments and public health officials. The majority of the decrease was incurred in the first quarter of 2021 when the full impact of the contraction in construction activity was experienced and with most of our pre-pandemic projects in process completed in 2020. Additionally, in the third quarter of 2021, a resurgence of COVID-19 infections due to the Delta variant delayed return to work plans, customer investment decisions and associated construction activities.

Revenues for the fourth quarter of 2023 were $50.9 million, an increase of $8.5 million or 20% from $42.4 million for the same period in 2022. The fourth quarter of 2023 benefited from several large projects compared to the fourth quarter of 2022.

Gross profit for the year ended December 31, 2021 was $23.5 million or 15.9%

Gross profit and gross profit margin for the fourth quarter of 2023 was $19.2 million or 37.8% of revenue, an increase from $11.6 million or 27.3% of revenue for the same period of 2022.
Adjusted Gross Profit and Adjusted Gross Profit Margin(see “– Non-GAAP Financial Measures”) for the fourth quarter of 2023 was $20.1 million or 39.5% of revenue. This represents an improvement from $13.6 million or 32.0% of revenue a decline of $29.8 million or 56% from $53.3 million or 31.1% of revenue for the year ended December 31, 2020. The decrease largely reflects lower revenue levels, significant inflationary increases in the realized cost of materials, transportation and packaging, negative fixed cost leverage and under-utilized labor capacity, incremental fixed costs of our new South Carolina Facility and the impact of a stronger Canadian dollar. Of the 15.2% difference in gross profit as a percentage of revenue in 2021 versus 2020, approximately 6% is due to higher material, transportation and packaging costs, 2% is due to negative fixed cost leverage, 2% is due to the incremental South Carolina facility fixed costs, and 2% is due to a stronger Canadian dollar with the balance related to inherent labor inefficiency at lower revenue levels and reduced timber provision reversals.

On October 12, 2021 we announced an approximate 6.5% overall increase in our product and transportation prices effective on new orders subsequent to November 15, 2021 to offset these increased materials, transportation and packaging costs, the benefits of which are expected to be largely realized in 2022.


Adjusted Gross Profit and Adjusted Gross Profit Margin (see “Non-GAAP Financial Measures”) for the year ended December 31, 2021 was $34.0 million or 23.1%, respectively, a decrease from $63.4 million or 37.0%, respectively, for the year ended December 31, 2020, due to the reasons described above. Excluded from Adjusted Gross Profit for the year ended December 31, 2021 and 2020 are $1.8 million and $2.0 million, respectively, of overhead costs associated with operating at lower than normal capacity levels, which were charged directly and separately to cost of sales rather than as a cost attributable to production.

Net loss for the year ended December 31, 2021 was $53.7 million compared to $11.3 million for the year ended December 31, 2020. The higher net loss is primarily the result of the above noted reduction in gross profit, a $10.8 million increase in operating expenses, explained below, a $2.8 million increase in interest expense and a $1.3 million decrease of government subsidies. These decreases were partially offset by a $2.3 million reduction in income tax expense and a $0.2 million decrease in foreign exchange losses.

Operating expenses increased by $10.8 million to $85.4 million in 2021 from $74.6 million in 2020. This increase is largely due to an estimated $2.7 million impact of a stronger Canadian dollar on Canadian-based operating expenses, $2.4 million of increased stock based compensation costs, $2.1 million of incremental depreciation, primarily from our new and renovated DXCs, $1.4 million of goodwill impairment charges, $0.9 million of incremental professional fees, higher salary and wage expenses as we continue to build our sales organization, and increased travel, meals and entertainment costs due to easing of COVID-19 restrictions. These increases in operating costs were partially offset by $2.5 million of lower commissions on reduced sales activities. Additionally, in 2020 operating expenses included a $1.2 million reversal of a provision relating to a claim for severance by one of our former founders and a $0.6 million provision recorded for expected credit losses against our accounts receivable balances, both of which did not re-occur in 2021.

Adjusted EBITDA (see “– Non-GAAP Financial Measures”) for the year ended December 31, 2021 was a $41.3 million loss or (28.0)%, a decline of $34.1 million from a $7.2 million loss or (4.2)% for the year ended December 31, 2020 for the above noted reasons.

Outlook

DIRTT believes there are two very significant changes taking place in the market that it can capitalize on. The first is that organizations are beginning to decisively move forward with planning and implementing ‘return to work’ strategies. There is a strong need to modify their workspace to accommodate a more flexible environment in the short-term, which in turn could change again over the medium- to long-term as post-pandemic requirements continue to evolve. The second, not related to the pandemic, is one in which many organizations in different sectors are trying to enhance their physical presence in local communities by adopting a single design model that works in multiple jurisdictions. We believe we are well-positioned to capitalize on both trends, but DIRTT needs to modify how it operates to capture these opportunities.

As a result, on January 18, 2022, we announced a change in its leadership, appointing Todd Lillibridge, the Board Chair, as interim chief executive officer and he is expected to serve until a permanent chief executive officer is selected. Mr. Lillibridge has led the implementation of a process that the Board was directing since the summer of 2021 to modify and adapt the Company’s strategic plan.

Subsequent to the change in leadership, DIRTT announced several initiatives to better position itself to pursue these market opportunities while simultaneously establishing goals to achieve or exceed break-even profitability through both operational efficiency and improved sales effectiveness in the context of our long-term strategic plan.

We are implementing a master facility plan which will expand aluminum manufacturing in our Calgary and Savannah manufacturing facilities while closing its Phoenix facility. This is expected to result in net headcount reduction of approximately 26 and annualized cost savings of approximately $2.4 million, excluding severance and other one-time costs of approximately $1.7 million, which costs are expected to be incurred in the first half of 2022. We are also expanding capabilities of the South Carolina Facility, which produces chromacoat panels, to add thermofoil panels and back-painted glass production. This enhancement will enable us to significantly cut the shipping time and cost for thermofoil panels to customers located in the East and Midwest regions of the United States, as well to as leverage the fixed cost base of the South Carolina Facility. This expansion is being achieved through the transfer of existing equipment from the Calgary and Phoenix facilities and is not expected to incur any material capital costs. This is the first of several capability enhancements that were envisioned when the South Carolina Facility was launched last year.

After these changes to our manufacturing facilities, we will continue to have manufacturing capacity close to $500 million in annual revenue, sufficient to remain responsive to fluctuations in demand and to accommodate mid-term growth.


The Company is optimizing its order process, which it believes will facilitate a reduction in standby production capacity. DIRTT is changing its standard payment terms to 50% due on shipment, not order. By separating its deposit requirement from the order entry process, management believes the Company can encourage earlier order entry, thereby improving both internal revenue forecasting and production scheduling such that we expect to reduce standby production labor capacity by up to 20%, while continuing to provide certainty in scheduling.

We have finalized an organization-wide restructuring of positions that reduced our salaried headcount by approximately 18%, including the elimination of manufacturing and office positions which, along with other cost reduction initiatives are expected to yield annualized savings of approximately $13 million.

Lastly, the Company is also implementing several initiatives regarding pricing.

Effective June 1, it will introduce a 5% price increase in response to continued inflation in our material costs;

Launching new aggressive pricing strategies on its Reflect® and Inspire® lines of glass fronts and applied headwalls, with a view to capturing greater market share in an important entry point into its full solution suite of offerings; and

Recognizing the considerable value DIRTT adds during the pre-construction stage of projects, particularly within our strategic accounts group, we will begin offering certain of those services for a fee.

These steps are in addition to the following actions taken in the fourth quarter of 20212022. The increase in Adjusted Gross Profit and Adjusted Gross Profit Margin compared to preserve financial liquiditythe comparative quarter is due to having better leverage over fixed costs through price increases and address inflationary impacts on raw materials and transportation and the effects of that year’s sales softness on our financial position.

A price increase on our interior solutions and an adjustment to our freight charges, effective November 16, 2021, resulting in an overall increase of approximately 6.5%;

The successful completion of an offering of C$35.0 million (approximately $25.6 million net) aggregate principal amount of 6.25% convertible unsecured subordinated debentures due 2026; and

A reduction in 2022 planned capital expenditures to approximately $7.0 million from $14.1 million in 2021 reflecting the successful completion of our Dallas DXC and our South Carolina Facility. Our 2022 capital expenditure program is comprised of approximately $2.5 million related to refreshes of DXCs, continued enhancement of our customer relationship management system and website redesign, approximately $2.5 million on software development and approximately $2.0 million on manufacturing and other capital upgrades.

Building on the transformative work that has been implemented to date in our commercial function, in 2022 we are focused on improving our overall sales effectiveness by adopting a more strategic sales focus on our core, innovative productsreorganization initiatives, which deliver higher margins, and which continue to provide clients design freedom, and certainty in cost, schedule, and outcomes.

Our partners have been and remain a key element indesigned to align our go-to-market strategy. Enhancing both partner effectiveness and accountability will be a priority in 2022. This includes improvingcost structure with current expected levels of demand.

Net income after tax for the geographic and capability coveragefourth quarter of our partner network through recruitment of new partners, including those with general contracting construction experience, clarifying roles and responsibilities to reduce duplication of effort and improve overall efficiency, and simplifying the sales process through an increased emphasis on core product sales. Our partners are a direct conduit to many of our end customers and we commenced establishing a partner council to elevate partner feedback within our organization and provide further insight to support our commercial and operational decision making.

Strategic accounts are a cornerstone in our strategy to drive long-term sustainable and predictable growth. These types of clients manage large real estate footprints in numerous locations. For these clients it is advantageous and important to establish consistency in design and execution, repeatability, and speed to market. While these relationships can take time to develop, once they are established, the time and resources required to execute additional projects is reduced, creating profitable, predictable revenue streams. In return, clients benefit from a single point of accountability at DIRTT, a strong North American network of partners, full lifecycle support from established design standards and pre-construction expert support for their architects, designers and general contractors to field work and post installation support. At year end, relationships in development with this group expanded to 55. Of those relationships, we delivered projects in 2021 for 28 and we have identified project opportunities for 42 in 2022. Over half of these are in healthcare and financial services industries. We will monitor both the expansion of relationships in development and the number of projects for these clients as a measure of our success.

We intend to continue to invest to advance our capabilities in strategic marketing. These efforts include maturing and evolving our presence in the market from being champions of our own disruptive concept to being enablers of others’ innovation and growth.


The focus is on strengthening our voice in the customer with the architect and design community and driving brand awareness. We plan to launch a refined brand identity later this year that better demonstrates our improved offering and capabilities.

We are budgeting for annual 2022 revenue of between $170 and $180 million for 2022, based on our product and transportation project pipeline for 2022 at January 1, 2022 of $302 million at a conversion rate of 55%, which is consistent with historical ranges and represents an estimated 20% increase in revenues over 2021 pandemic impacted levels. While this 12-month forward pipeline increased by 8% at January 1, 2022 compared to January 1, 2021, the quality of the pipeline has improved in 2022.

The distribution of our current pipeline among our verticals of commercial, healthcare, education and government is 62%, 17%, 12% and 9%, respectively and is generally consistent with prior years. We anticipate first quarter 2022 revenues will be between $38 million and $422023 was $1.0 million compared to firsta $5.9 million net loss after tax for the same period of 2022. The increase in net income is primarily the result of the higher gross profit margin, explained above, of $7.6 million. Other items that impacted net income in the period included a $1.5 million increase in operating expenses (includes a $1.0 million reduction in reorganization expenses and a decrease in the fair value less costs to sell related to the Rock Hill Facility assets held for sale, which resulted in an additional $0.8 million impairment charge), receipt of $1.0 million on the sale of software due to the completion of the knowledge transfer to AWI, and a $0.2 million increase in interest income. These increases were offset by a $0.2 million increase in the foreign exchange loss, a $0.1 million increase in interest expense, and a $0.3 million increase in tax expense.

Adjusted EBITDA (see “– Non-GAAP Financial Measures”) for the fourth quarter 2021 revenues of $29.52023 was $4.3 million or 8.5% of revenue, an improvement of $3.7 million from $0.6 million or 1.4% of revenue for the fourth quarter of 2022.
The Company generated approximately $10.1 million of cash through operations in the fourth quarter of 2023 compared to $3.2 million in the same period of 2022. During the fourth quarter of 2023, the Company received $1.0 million on the sale of software to offset cash used for investing activities and repaid outstanding equipment leases related to the Rock Hill Facility of $7.8 million.
On November 21, 2023, we announced the Rights Offering (as defined herein) to our common shareholders. The Rights Offering closed on January 9, 2024 with gross proceeds of C$30.0 million.

Based on budgeted

29


Key Annual 2023 Highlights

Revenues for the year ended December 31, 2023, were $181.9 million, an increase of $9.8 million or 6% from $172.2 million for the year ended December 31, 2022, driven primarily by the pricing actions over the past two years.
Gross profit and gross profit margin for the year ended December 31, 2023, was $59.5 million or 32.7% of revenue, an increase from $28.2 million or 16.4% of revenue for the year ended December 31, 2022.
Adjusted Gross Profit (see “– Non-GAAP Financial Measures”) for the year ended December 31, 2023, was $65.1 million or 35.8% of revenue, an increase from $38.9 million or 22.6% of revenue for the year ended December 31, 2022. Adjusted Gross Profit Margin (see “– Non-GAAP Financial Measures”) for the year ended December 31, 2023, was 35.8%, a 13% improvement from 22.6% for the year ended December 31, 2022. The improved Adjusted Gross Profit and Adjusted Gross Profit Margin is due to having better leverage over fixed costs through price increases and reduced fixed costs. Product cost of sales in 2023 included $2.0 million of idle facility costs related to the Rock Hill Facility ($0.5 million in the year ended December 31, 2022). We are pursuing options to sublease the Rock Hill Facility to offset these costs in 2024 and beyond.
Management has taken steps to align our manufacturing footprint and salaried workforce with our current activity levels as well as cost reduction and profitability initiatives. During the third quarter of 2023, we announced the intention to permanently close the Rock Hill Facility. With annual production capacity at DIRTT facilities in Savannah, Georgia and Calgary, Alberta, of approximately $400 million in annual revenue, levels, takingthe closure is part of DIRTT’s ongoing focus on realigning the organization, increasing efficiency, and improving profitability. Non-cash impairment charges related to the Rock Hill Facility equipment of $8.7 million has been recorded in the year ended December 31, 2023. During the fourth quarter, we initiated the process to move certain equipment to our Calgary Facility and sell various other assets at the Rock Hill Facility. We expect to receive $1.6 million for the sale of the assets in the next 12 months.
On May 9, 2023, we entered into account the initiatives previously describedCo-Ownership Agreement and excluding our related one-time restructuring costsPartial Patent Assignment Agreement with AWI. We concurrently entered into the Amended and expected incremental professional fees, (1)Restated Master Services Agreement (the “ARMSA”) with AWI, under which AWI has also prepaid certain development services to be provided by DIRTT. Through these arrangements, we believe that our annual Adjusted EBITDAreceived $12.8 million of cash and recognized a gain on the sale of software and patents of $7.1 million during the year ended December 31, 2023.
Net loss and net loss will demonstrate a significant improvement from 2021 levels, (2) we believe we will shiftafter tax for the year ended December 31, 2023, was $14.6 million compared to positive Adjusted EBITDA in 2023, with a corresponding$55.0 million for the year ended December 31, 2022. The decrease in net loss is primarily the result of the above noted increase in gross profit of $31.4 million. Other items that decreased the net loss in 2023 included a $11.1 million decrease in operating expenses (which includes an $8.7 million impairment charge and $1.5 million of related party expense in the current year), a $7.1 million gain on software sale, $0.4 million increase in interest income and a $0.2 million decrease in interest expense. These increases were offset by a $7.5 million decrease in government subsidies, a $2.1 million decrease in foreign exchange, and a $0.3 million increase in income tax expense.
Adjusted EBITDA (see “– Non-GAAP Financial Measures”) for the year ended December 31, 2023 was $7.9 million or 4.4% of revenue, an improvement of $34.1 million from a $26.2 million loss or (15.2)% of revenue for the year ended December 31, 2022, for the above noted reasons.

Pipeline

In the first quarter of 2023, we changed our methodology for calculating and disclosing our forward twelve month pipeline. We are now disclosing qualified leads, defined as quantity of projects being pursued, and our pipeline, defined as working with an engaged client on assessment of DIRTT as a prefabricated interior solution provider. We began using these new measures as we believe they better measure expected near term performance given that our operating environment has been prone to change due to bothmacroeconomic factors such as worksite labor availability, interest rate changes, and potential recessionary impacts on construction projects.

As of January 1, 2024, our twelve-month forward pipeline has grown 9.5% year-over-year and has contracted 4.6% since the improvedprevious quarter. We are focused on refilling our pipeline after achieving above trend revenue in the fourth quarter of 2023.

We continue to focus on pipeline and forecasting integrity as our ten-day lead time is one of DIRTT’s key value propositions. The ability to produce and ship products in that time frame requires close attention to sales & operational planning.

30


As at


January 1, 2024


January 1, 2023


% Change


October 1, 2023


% Change


Twelve Month Forward Pipeline ($ 000s)


Commercial


176,789


141,293


25

%


192,773


(8

%)


Healthcare


41,221


55,719


(26

%)


39,230


5

%


Government


34,813


32,313


8

%


34,866


(0

%)


Education


17,117


17,201


(0

%)


16,235


5

%


269,940


246,526


9

%


283,104


(5

%)


Leads (#)


861


721


19

%


999


(14

%)


Our Commercial segment continues to benefit from post-COVID return-to-office policies in addition to focusing our strategy on premium quality products for large corporations. Due to the success of our Healthcare segment in 2023 and the long sales cycle inherent in Healthcare construction, our pipeline has contracted since the beginning of the year, but continues to grow from our previous quarter.

Our Government and Education segments continue to provide stability and diversity to our revenues from our more volatile segments. We are closely monitoring the U.S. Federal Government’s budgeting process and the impact it may have on our revenue levels.

Outlook

We achieved an annual revenue of $181.9 million, a 6% increase over 2022 revenue of $172.2 million. We are pleased to report another consecutive year of revenue growth since the COVID-19 pandemic, and despite the volatility in the tech and banking sectors in early 2023. Our revenue for the fourth quarter of 2023 was the highest quarterly revenue since 2019.

During 2023, we built on our successes in 2022 with further balance sheet improvement ($24.7 million vs. $10.8 million cash and cash equivalents at year end), expansion of our Gross Profit Margin (32.7% vs. 16.4%) and Adjusted Gross Profit Margins (35.8% vs. 22.6%), reductions of our net loss after tax from $(55.0) million to $(14.6) million and expansion of our Adjusted EBITDA Margins (4.4% vs. (15.2%)). In 2023, we saw macroeconomic factors stabilize our supply chains and input costs. Our focus on sales and operational planning as well as process efficiencies described above,allowed us to achieve significant improvement in our adjusted gross margins. These actions also led to reductions in labor and assuminginventory carrying costs during 2023. Further, we reduced expenses in our back office and general and administrative overhead to levels commensurate with our current and expected revenue levels.

In the year ahead, we anticipate continued pipeline and revenue growth, but we also remain cautious about macroeconomic uncertainty and remain focused on preparing the Company for a variety of economic scenarios. The unprecedented pace of the US Federal Reserve’s interest rate hikes as well as geopolitical volatility in the Middle East and Asian Pacific have encouraged us to pay close attention to our fixed cost footprint and supply chain resiliency. The upcoming presidential election in the United States adds to this uncertainty and may impact the capital expenditure budgets of our clients. As noted in last quarter’s outlook, the first quarter of the year is typically our seasonally slowest quarter.

As post-pandemic workplaces continue to evolve, the ability of DIRTT’s solutions to anticipate and respond to an improved macroeconomic environment asuncertain future is at the pandemic recovery takes hold. Nevertheless,core of our value proposition. Encouraging access to our full product offering unlocks workplace transformations with more flexible and adaptable environments. Our sustainable product offerings, featuring low carbon footprint, high recycled content, and minimal waste, also enable our Commercial, Government, Healthcare, and Education clients to make meaningful progress toward their environmental commitments and goals.

On January 9, 2024 we no longer believe thatsuccessfully closed a C$30 million Rights Offering. As previously disclosed, we expect to use the financial targetsproceeds of the Rights Offering for general corporate purposes, which may include investments in our business, funding potential future cash needs or operating losses, funding working capital and capital expenditure needs, or reductions to our outstanding indebtedness. We plan to use some of the funds to invest in our commercial business in all verticals, especially Healthcare, and are looking at additional opportunities and partnerships to support our revenue growth.

In line with our objectives for the Rights Offering, on February 15, 2024, we initially articulated in November 2019 are achievableannounced a Substantial Issuer Bid for our convertible debentures of C$15 million, intended to strengthen our balance sheet by the endreducing debt. For additional information, please see Item 7, “Management’s Discussion and Analysis of 2023.Financial Condition and Results of Operations – Liquidity and Capital Resources.”

31


Non-GAAP Financial Measures

Note Regarding Use of Non-GAAP Financial Measures

Our consolidated financial statements are prepared in accordance with accounting principles generally accepted in the United States of America (“GAAP”). These GAAP financial statements include non-cash charges and other charges and benefits that we believe are unusual or infrequent in nature or that we believe may make comparisons to our prior or future performance difficult.

As a result, we also provide financial information in this Annual Report that is not prepared in accordance with GAAP and should not be considered as an alternative to the information prepared in accordance with GAAP. Management uses these non-GAAP financial measures in its review and evaluation of the financial performance of the Company. We believe that these non-GAAP financial measures also provide additional insight to investors and securities analysts as supplemental information to our GAAP results and as a basis to compare our financial performance period-over-period and to compare our financial performance with that of other companies. We believe that these non-GAAP financial measures facilitate comparisons of our core operating results from period to period and to other companies by removing the effects of our capital structure (net interest income on cash deposits, interest expense on outstanding debt and debt facilities, or foreign exchange movements), asset base (depreciation and amortization), the impact of under-utilized capacity on gross profit, tax consequences, reorganization expense, one-time non-recurring charges or gains (such as gain on sale of software and patents), and stock-based compensation. We remove the impact of all foreign exchange from Adjusted EBITDA. Foreign exchange gains and losses can vary significantly period-to-period due to the impact of changes in the U.S. and Canadian dollar exchange rates on foreign currency denominated monetary items on the balance sheet and are not reflective of the underlying operations of the Company. We remove the impact of under-utilized capacity from gross profit, and fixed production overheads are allocated to inventory on the basis of normal capacity of the production facilities. In periods where production levels are abnormally low, unallocated overheads are recognized as an expense in the period in which they are incurred. In addition, management bases certain forward-looking estimates and budgets on non-GAAP financial measures, primarily Adjusted EBITDA.

Government subsidies, depreciation and amortization, stock-based compensation expense, reorganization expenses, foreign exchange gains and losses and impairment expensescharges are excluded from our non-GAAP financial measures because management considers them to be outside of the Company’s core operating results, even though some of those receipts and expenses may recur, and because management believes that each of these items can distort the trends associated with the Company’s ongoing performance. We believe that excluding these receipts and expenses provides investors and management with greater visibility to the underlying performance of the business operations, enhances consistency and comparativeness with results in prior periods that do not, or future periods that may not, include such items, and facilitates comparison with the results of other companies in our industry.

The following non-GAAP financial measures are presented in this Annual Report, and a description of the calculation for each measure is included.

Adjusted Gross Profit

Gross profit before deductions for costs of under-utilized capacity, depreciation and amortization

Adjusted Gross Profit Margin

Adjusted Gross Profit divided by revenue


EBITDA

Net income before interest, taxes, depreciation and amortization

Adjusted EBITDA

EBITDA adjusted to remove foreign exchange gains or losses; impairment charges; reorganization expenses; stock-based compensation expense; government subsidies; one-time, non-recurring charges and gains; and any other non-core gains or losses

Adjusted EBITDA Margin

Adjusted EBITDA divided by revenue

You should carefully evaluate these non-GAAP financial measures, the adjustments included in them, and the reasons we consider them appropriate for analysis supplemental to our GAAP information. Each of these non-GAAP financial measures has important limitations as an analytical tool due to exclusion of some but not all items that affect the most directly comparable GAAP financial measures. You should not consider any of these non-GAAP financial measures in isolation or as substitutes for an analysis of our results as reported under GAAP. You should also be aware that we may recognize income or incur expenses in the future that are the same as, or similar to, some of the adjustments in these non-GAAP financial measures. Because these non-GAAP financial measures may be defined differently by other companies in our industry, our definitions of these non-GAAP financial measures may not be comparable to similarly titled measures of other companies, thereby diminishing their utility.

32


Results of Operations

Year Ended December 31, 20212023 Compared to the Year Ended December 31, 20202022


For the Year Ended December 31,


2021


2020


% Change


($ in thousands)


Revenue


147,593


171,507


(14

)

Gross Profit


23,460


53,283


(56

)

Gross Profit Margin


15.9

%


31.1

%


Operating Expenses


Sales and Marketing


31,041


28,049


11


General and Administrative


30,595


26,663


15


Operations Support


9,372


9,381


-


Technology and Development


8,234


8,111


2


Stock-based Compensation


4,713


2,351


100


Goodwill Impairment


1,443


-


N/A


Total Operating Expenses


85,398


74,555


15


Operating Loss


(61,938

)


(21,272

)


191


Operating Margin


(42.0

)%


(12.4

)%


For the Year Ended December 31,


2023


2022


% Change


($ in thousands)


Revenue


181,931


172,161


6


Gross Profit(1)


59,542


28,160


111


Gross Profit Margin


32.7

%


16.4

%


Operating expenses


Sales and marketing


25,235


26,950


(6

)

General and administrative


21,655


25,462


(15

)

Operations support


7,832


9,498


(18

)

Technology and development


5,820


7,555


(23

)

Stock-based compensation


2,306


4,277


(46

)

Reorganization


3,009


13,461


(78

)

Impairment charge on Rock Hill Facility


8,716


-


100


Related party expense


1,524


-


100


Total Operating expenses


76,097


87,203


(13

)

Operating loss


(16,555

)


(59,043

)


72


Operating margin


(9.1

)%


(34.3

)%


Government subsidies


236


7,765


(97

)

Gain on sale of software and patents


7,130


-


100


Foreign exchange (loss) gain


(626

)


1,445


(143

)

Interest income


490


51


861


Interest expense


(4,927

)


(5,160

)


5


2,303


4,101


(44

)

Net loss before tax


(14,252

)


(54,942

)


74


Current income tax expense


332


21


1,481


332


21


1,481


Net loss after tax


(14,584

)


(54,963

)


73


(1) Gross Profit for the year ended December 31, 2022, included $1.0 million primarily related to the write off of inventory of discounted product lines, and $2.1 million of accelerated depreciation and amortization on software associated with discontinued product lines and the closure of the Phoenix Facility.


Revenue

Revenue reflects sales to our Construction Partners for resale to their clients and, in limited circumstances, our direct sales to clients. Our revenue is generally affected by the timing of when orders are executed, particularly large orders, which can add variability to our financial results and shift revenue between quarters.

Beginning in 2020, we experienced significant increases in nearly all of our material input costs, including raw materials, shipping materials, labor, and freight. This led to significant gross margin compression in 2021 and 2022. Effective November 16, 2021, DIRTT increased product and transportation prices on new projects by approximately 6.5%. On February 17, 2022, we announced a further price increase of 5% that came into effect June 1, 2022. On June 21, 2022, an additional price increase of 10% was announced effective July 21, 2022. The increases have improved revenue and profitability through better recovery of the material input costs previously discussed.

The following table sets forth the contribution to revenue of our DIRTT Solutions and related offerings.


For the Year Ended December 31,


2023


2022


% Change


($ in thousands)


Product


158,405


147,448


7


Transportation


17,674


18,030


(2

)

License fees from Construction Partners


840


778


8


Total product revenue


176,919


166,256


6


Installation and other services


5,012


5,905


(15

)


181,931


172,161


6


For the Year Ended December 31,


2021


2020


% Change


($ in thousands)


Product


129,031


150,004


(14

)

Transportation


13,231


15,491


(15

)

License fees from Distribution Partners


738


1,194


(38

)

Total product revenue


143,000


166,689


(14

)

Installation and other services


4,593


4,818


(5

)


147,593


171,507


(14

)

33


Our sales activity and associated revenues continue to be impacted by the severe economic and social impact of the COVID-19 pandemic since March 2020, including a major contraction in construction activity levels in North America due to work-from-home requirements, lock-down measures and other regulatory responses implemented by governments and public health officials. While we did not experience any material cancellations of projects that were underway at the start of the COVID-19 pandemic, it is uncertain as to the impact of the pandemic, including effects of resurgent infection rates due to variants, on future projects that are either in the


planning or conceptual stage. It is highly likely that future projects will also experience similar delays as the COVID-19 pandemic runs its course. See Item 1A. “Risk Factors”.

Revenue decreased infor the year ended December 31, 2021 by $23.92023, was $181.9 million, an increase of $9.8 million or 14% compared to 2020. The majority6% from the year ended December 31, 2022. Revenue in early 2023 was impacted by macroeconomic conditions, including layoffs in the technology sector and rising interest rates, both of which have affected our pipeline. For example, one large project with a customer in the decreasetechnology sector that was incurred inoriginally scheduled for the first quarter of 2021 when2023 was deferred indefinitely. Our fourth quarter revenue was $50.9 million, an increase of $8.5 million or 20% from $42.4 million for the full impact of the contractionsame period in construction activity was experienced as most of the pre-pandemic2022. Historically, our fourth quarter revenue is lower than second and third quarter revenues due to seasonality. However, we benefited from two large healthcare projects in processthat were completed in 2020,the quarter and from a resurgence of COVID-19 infections due toproject delayed earlier in the Delta variant delayed return to work plans, customer investment decisions and associated construction activity.

Throughout 2020, we were able to partially mitigate the COVID-19 induced slowdown in overall construction activity through the completion of projectsyear that were in progress when the pandemic started. With most of these projects delivered by the end ofpushed into the fourth quarterquarter. Macroeconomic conditions showed signs of 2020, the first quarter of 2021 was the low point for sales and represents $11.5 million of the year over year decrease, reflecting the full impact of the slowdown in non-residential construction activity on DIRTT’s business. Second quarter 2021 revenues returned to 2020 levels, driven largely by increased activity with a large strategic health care provider and the delivery of COVID-19 vaccination trailers. Third quarter 2021 revenues, which started out consistent with 2020 levels, were adversely impacted by a combination of a resurgence in COVID-19 infection ratesimprovement in late August and September 2021 due to2023, which also benefited the Delta variant and upstream supply chain issues, resulting in a $12.1 million decrease in year over year revenues. Fourth quarter 2021 revenues of $42.9 million returned to 2020 levels, including three significant projects in the banking sector and a large government project.fourth quarter.

We have made substantial improvements to our commercial function, as outlined in our strategic plan, including building an appropriate organizational structure, improving the effectiveness of our existing sales force, attracting new sales talent, establishing strategic marketing and lead generation functions, as well as expanding and better supporting our Distribution Partner network. While we believe these actions are critical to driving long-term, sustainable growth, particularly as the recovery from the COVID-19 pandemic commences, these actions did not have a measurable effect on 2021 revenues in light of the severe economic adversity caused by the pandemic. Additionally, in response to significant increases in the costs of raw materials, shipping materials and freight, effective November 16, 2021, DIRTT increased product and transportation prices on new projects by approximately 6.5%, with the benefits largely expected to be realized in 2022.

Installation and other services revenue was $4.6$5.0 million for the year ended December 31, 20212023, compared to $4.8$5.9 million in 2020. The changes in installationthe year ended December 31, 2022. This revenue primarily reflects services performed by our ICE and other services revenue are primarily due to the timing of projects.design teams for third parties. Except in limited circumstances, our DistributionConstruction Partners, rather than the Company, perform installation services, and accordingly, we are not anticipating significant growth in this revenue stream.services.

Our success is partly dependent on our ability to profitably develop our DistributionConstruction Partner network to expand our market penetration and ensure best practices are shared across local markets. At December 31, 2021,2023, we had 69 Distribution72 (2022 - 67) Construction Partners servicing multiple locations. During 2020 and 2021,the year ended December 31, 2023, we made several changes and upgrades toannounced the expansion of seven of our Distribution Partner network, expanding our relationships withDIRTT Construction Partners into new and existing partners and ending our relationships with others. Our clients,markets, as serviced primarily through our Distribution Partners, exist within a varietywe expand the reach of industries, including healthcare, education, financial services, government and military, manufacturing, non-profit, energy, professional services, retail, technology and hospitality.DIRTT products, predominantly in North America.

We periodically analyze our revenue growth by vertical markets in the defined markets of commercial, healthcare, government and education. The following table presents our product and transportation revenue by vertical market.


For the Year Ended December 31,


For the Year Ended December 31,


2021


2020


% Change


2023


2022


% Change


($ in thousands)


($ in thousands)


Commercial


84,488


102,245


(17

)


116,693


115,102


1


Healthcare


30,130


35,400


(15

)


33,970


19,739


72


Government


16,012


14,128


13


13,446


16,564


(19

)

Education


11,632


13,722


(15

)


11,970


14,073


(15

)

License fees from Distribution Partners


738


1,194


(38

)

License fees from Construction Partners


840


778


8


Total product revenue


143,000


166,689


(14

)


176,919


166,256


6


Service revenue


4,593


4,818


(5

)


5,012


5,905


(15

)


147,593


171,507


(14

)


181,931


172,161


6


For the Year Ended December 31,


2023


2022


(in %)


Commercial


66


70


Healthcare


19


12


Government


8


10


Education


7


8


Total Product Revenue(1)


100


100


(1) Excludes license fees from Construction Partners.


For the Year Ended December 31,


2021


2020


(in %)


Commercial


60


63


Healthcare


21


21


Government


11


8


Education


8


8


Total Product Revenue(1)


100


100


(1)

Excludes license fees from Distribution Partners.

Revenue decreasedCommercial revenues for the year ended December 31, 2023 were consistent with the prior year. Healthcare revenues increased by 72% in the year ended December 31, 2021 by 14% compared to the year ended December 31, 2020 and was driven primarily by the full impact of the COVID-19 induced slowdown in non-residential construction activity experienced beginning in the first quarter of 2021 and by ongoing upstream supply chain issues on overall construction schedules. Commercial revenues decreased by 17%2023, from the prior year, due largely to the severe impact of COVID-19 on commercial construction activities in North America since March 2020, particularlywhich included $12.1 million from two large projects. Sales in the first and third quarters of 2021 as described in more detail above. Healthcare saleshealthcare sector tend to be larger individual projects and are subject to timing due to a typically longer sales cycle, resulting in variability in sales levels. In 2021, healthcare sales were 15% lower, respectively, due primarily to the timing of projects with the 2020 period including two large projects of approximately $4.0 million each that did not re-occur in 2021. Education sales in 20212023 decreased by 15% overfrom the prior period. Atyear and government revenues in 2023 decreased by 19% from 2022. Both the beginninggovernment and education sectors include a higher volume of the pandemic, education spending effectively paused with many institutions suspending in-person classes. Government revenues increased duesmaller projects as compared to the timing of certain projects.fiscal year 2022.

Revenue continues to be derived almost exclusively from projects in North America and predominantly from the United States. The following table presents our revenue dispersion by geography:

34


For the Year Ended December 31,


2023


2022


% Change


($ in thousands)


Canada


19,934


25,477


(22

)

U.S.


161,997


146,684


10


181,931


172,161


6


For the Year Ended December 31,


2021


2020


% Change


($ in thousands)


Canada


17,299


18,848


(8

)

U.S.


130,294


152,659


(15

)


147,593


171,507


(14

)

In 2023, 11% of revenue was from Canada, as compared to 15% in 2022. Historically, approximately 15-25%11-15% and 75-85%85-89% of revenues are derived from sales to Canada and the United States, respectively. In 2020 and 2021, revenues from Canada fell to 11% and 12%, respectively, of total sales while sales to the United States increased to 89% and 88%, respectively, of total sales. COVID-19 infection rates and resulting regulatory responses by governments and public health officials have varied significantly by region, impacting the relative contribution of sales from each country.

Sales and Marketing Expenses

Sales and marketing expenses increaseddecreased by $3.0$1.7 million to $31.0$25.2 million for the year ended December 31, 20212023, from $28.0$27.0 million for the year ended December 31, 2020.2022. The increases weredecrease was largely related to increased salarya realignment of back-office support, territory coverage and wage expenses as we continue to build our sales organization, higher depreciationcost structure with current demand levels. The decrease was largely made up of a $1.7 million decrease in salaries and operating expenses as we completed our Chicago and Dallas DXCsbenefits, a $0.8 million decrease in 2020 and 2021, respectively, and increased travel meals and entertainment as restrictions on travel have eased. As economies re-open, we anticipate travel, mealscosts, a $0.5 million decrease in marketing and entertainment expenses will increase over current levels,tradeshow costs and the timing and amountbenefit of such expenses, however, are indeterminate at this time. These increasesoffsetting our lease costs by subleasing our Dallas DXC during the year. The decreases were partially offset by lower commission expense.

Our salesa $1.5 million increase in commissions expenses, a $0.2 million increase in communications costs, and marketing efforts are focused on establishing the appropriate sales organization and personnel, significantly improving our marketing approach and driving returns on sales and marketing expenditures, as outlineda $0.2 million increase in our strategic plan. In light of uncertainty caused by the COVID-19 pandemic, we have prioritized critical hires that are necessaryprofessional services related to continue to advance our overall strategy, including the implementation of necessary systems and tools while ensuring appropriate cost control and cash conservation.consulting services.

General and Administrative Expenses

General and administrative (“G&A”) expenses increased $3.9decreased $3.8 million to $30.6$21.7 million for the year ended December 31, 20212023, from $26.7$25.5 million for the year ended December 31, 2020.2022. The increasedecrease was due to higher salaries, benefitsdriven by a $3.2 million decrease in professional fees made up of legal and severanceoutside consulting costs, and $0.9a $0.8 million of incremental professional fees. In addition, the year ended December 31, 2020 included a $1.2 million reversal of a


provision relating to a claim for severance by one of our former foundersdecrease in depreciation costs, and a $0.6 million credit loss, both of whichdecrease in office and communications costs. These decreases were not repeatedslightly offset by a $0.4 million increase in 2021.building costs related to higher costs to operate in our existing facilities and $0.2 million higher travel and entertainment costs.

Operations Support Expenses

Operations support is comprised primarily of project managers, order entry and other professionals that facilitate the integration of our DistributionConstruction Partner project execution and our manufacturing operations. Operations support expenses of $9.4$7.8 million were consistent with 2020.in 2023 decreased $1.7 million from $9.5 million in 2022. The decrease was largely driven by a $1.4 million decrease in salaries and benefits and a $0.2 million reduction in travel and entertainment costs related to planned headcount reductions and the reorganization initiatives undertaken.

Technology and Development Expenses

Technology and development expenses relate to non-capitalizable costs associated with our product and software development teams and are primarily comprised of salaries and benefits of technical staff.

Technology and development expenses increaseddecreased by $0.1$1.7 million to $8.2$5.8 million for the year ended December 31, 2021,2023, compared to $8.1$7.6 million for the year ended December 31, 2020,2022. The decrease was primarily related to a $1.1 million decrease in capitalized software developmentsalaries and benefits costs, offset by lower variable compensation provisiona $0.2 million decrease in office and communication costs, a $0.2 million decrease in professional fees related to outside consulting services and a $0.2 million decrease in other burdens in the current year.expenses.

Stock-Based Compensation

Stock-based compensation expense for the year ended December 31, 20212023, was $4.7$2.3 million compared to $2.4$4.3 million in 2020.2022. The increasedecrease in this expense was largely due to RSU grants in lieu of restricted share units and deferred share units, loweredcash compensation to the Company’s interim Chief Executive Officer in 2022, which were not repeated in 2023. DSUs were granted to the Board of Directors but were offset by the impact of fair value adjustments on cash settled awards as a result of our share price decreasing during the twelve months ended December 31, 2023.

Reorganization

For the year ended December 31, 2021.2023, we incurred $3.0 million of reorganization costs compared to $13.5 million during the year ended December 31, 2022. Fiscal year 2023 costs related primarily to costs associated with the Rock Hill Facility suspension and subsequent closure, and termination costs associated with actions taken to streamline our back office and operational support functions, as discussed herein. Reorganization costs in 2022 were driven by the closure of the Phoenix Facility, the one-time costs associated with reductions of salaried workforce throughout 2022, and changes in management.

35


Impairment charge on Rock Hill Facility

Goodwill ImpairmentOn September 27, 2023, the Company announced our intention to permanently close the Rock Hill Facility in South Carolina. For the year ended December 31, 2023, certain assets located at the Rock Hill Facility that were classified as property, plant and equipment, were reclassified as assets held for sale. Certain Rock Hill Facility assets had been approved by management for sale and had committed to a formal plan to market these assets, which is expected to be completed within the next twelve months. These were measured at the lower of the fair value less costs to sell and their net book value, which resulted in an $8.7 million impairment charge in the year ended December 31, 2023.

Goodwill impairmentRelated party expense

On March 15, 2023, the Company entered into a Debt Settlement Agreement (the “Debt Settlement Agreement”) with 22NW Fund, LP (“22NW”) and Aron English, 22NW’s principal and a director of DIRTT, (together, the “22NW Group”) who, collectively, beneficially owned approximately 19.5% of the Company’s issued and outstanding common shares at such time. Pursuant to the Debt Settlement Agreement, the Company agreed to reimburse the 22NW Group for the costs incurred by the 22NW Group in connection with the contested director election at the annual and special meeting of shareholders of the Company held on April 26, 2022, being $1.6 million (the “22NW Debt”).

Pursuant to the Debt Settlement Agreement, the Company agreed to repay the 22NW Debt by either, or a combination of (i) a payment in cash by the Company to the 22NW Group, and/or (ii) the issuance of equity securities of the Company to the 22NW Group.

In connection with the Debt Settlement Agreement, on March 15, 2023, the Company entered into a share issuance agreement with the 22NW Group, pursuant to which the Company agreed to repay the 22NW Debt with the issuance to the 22NW Group of 3,899,745 common shares at a deemed price of $0.40 per common share, subject to approval by shareholders.

At the annual general and special meeting of shareholders held on May 30, 2023, shareholders voted to approve the issuance of common shares, and on June 2, 2023, the Company issued 3,899,745 common shares to 22NW Group as repayment for the 22NW Debt. Upon settlement, the debt was revalued at the higher of the deemed price of $0.40 per common share and the May 30, 2023, market price of $0.38 per common share, resulting in a recovery from the balance recorded at March 31, 2023 which had been valued at a price of $0.53 per common share.

Government Subsidies

The Company was not eligible and did not receive any new government subsidies in the year ended December 31, 2023. The Company received $0.2 million of interest with the collection of the Employee Retention Credit (“ERC”) during the year ended December 31, 2023.

Gain on sale of software and patents

On May 9, 2023, we entered into the AWI Agreement and Partial Patent Assignment Agreement with AWI. The agreements provided for a cash payment from AWI to the Company of $10.0 million in exchange for the partial assignment to AWI and resulting co-ownership of a 50% interest in the rights, title and interests in certain intellectual property rights in the Applicable ICE Code, including a 50% interest in the patent rights that relate to the Applicable ICE Code. Pursuant to the AWI Agreement, we also provided AWI a transfer of knowledge concerning the source code of the Applicable ICE Code. In exchange for completing the knowledge transfer, we received an additional cash payment of $1.0 million in the fourth quarter of 2023. The AWI Agreement provides that we and AWI have separate exclusive fields of use and restrictive covenants with respect to the Applicable ICE Code and related intellectual property, which survive until either party elects to separate from its relationship with the other and for five years thereafter. We concurrently entered into the ARMSA with AWI, under which AWI has also prepaid for certain development services to be provided by DIRTT. The ARMSA will automatically terminate if the AWI Agreement is terminated or expires and may also be terminated if either party breaches the exclusive fields of use or restrictive covenants in the AWI Agreement.

The $11.0 million of proceeds on the sale of the 50% interest in the Applicable ICE code, pursuant to the AWI Agreement, was received during the year ended December 31, 2023. In accordance with GAAP, the proceeds were first applied to the net book value of the related cost of software of $2.9 million and patents (other assets) of $0.9 million. The residual amount of $7.1 million was recognized as a gain in the consolidated statement of operations. Further, $1.8 million was received as a prepayment under the ARMSA, which is recognized into revenue as the performance obligation is met. During the year ended December 31, 2023, $1.6 million of the $1.8 million payment was received into revenue, and $0.2 million remains in customer deposits to be received as revenue in 2024. Part of the proceeds of this transaction were used to settle one of our equipment leases of $1.6 million and resulted in the release of $0.4 million of restricted cash (refer to Note 14 to our Consolidated Financial Statements for additional information).

36


Foreign Exchange (loss) gain

In the year ended December 31, 2023, we had a foreign exchange loss of $0.6 million compared to a gain of $1.4 million in the year ended December 31, 2022, due to fluctuations of the Canadian dollar relative to the U.S. dollar.

Interest Income

Interest income increased to $0.5 million for the year ended December 31, 2021 was $1.4 million2023, compared to $nil$0.1 million in 2020. We test goodwill for impairment annually during the fourth quarter of the calendar year. Due to the ongoing impact of the COVID-19 pandemic on our financial results in 2021, we determined it was necessary to use the quantitative approach to perform our goodwill impairment test. Based on our testing, the fair value of goodwill did not exceed the carrying value of its net assets and, accordingly, the entire $1.4 million balance of goodwill was impaired as atyear ended December 31, 2021.2022, as we benefited from higher interest rates on higher cash balances.

Government SubsidiesInterest expense

Government subsidiesInterest expense decreased by $0.2 million from $5.2 million for the year ended December 31, 2021 was $11.5 million compared2022, to $12.7$4.9 million for the same period of 2020 and all amounts were fully collected atyear ended December 31, 2021.

As part of the Canadian federal government’s COVID-19 Economic Response Plan, the Canadian government established the Canada Emergency Wage Subsidy (“CEWS”), providing employers with a taxable subsidy in respect of a specific portion of wages paid to Canadian employees during qualifying periods extending from March 15, 2020 to October 23, 2021, based on the percentage decline of certain Canadian-sourced revenues during each qualifying period. The Company’s eligibility for the CEWS was subject to change for each qualifying period and was reviewed by the Company for each qualifying period, with amounts being received for various, but not each, qualifying period. Pursuant to amendments enacted as part of the 2021 Canadian federal budget, the Company may be required to repay all or a portion of the CEWS amounts for any qualifying period commencing after June 5, 2021 where the aggregate compensation for “specified executives” (within the meaning of the CEWS) during the 2021 calendar year exceeds the aggregate compensation for “specified executives” during the 2019 calendar year.On November 19, 2020, the Canadian government also implemented the Canada Emergency Rent Subsidy (“CERS”), which provided a taxable subsidy to cover eligible expenses for qualifying properties, subject to certain maximums, for qualifying periods extending from September 27, 2020 to October 23, 2021, with the amount of the subsidy available2023, mostly related to the Company being basedweaker Canadian dollar relative to the U.S dollar on the percentage decline of certain of the Company’s Canadian-sourced revenues in each qualifying period. The Company’s eligibility for the CERS was subject to change for each qualifying period and was reviewed by the Company for each qualifying period. The CEWS and CERS programs expiredour interest expense on October 23, 2021.Canadian convertible debentures.

Income Tax

The provision for income taxes is comprised ofcomprises U.S. and Canadian federal, state and provincial taxes based on pre-tax income. Income tax recoveryexpense for the year ended December 31, 20212023, was $0.2$0.3 million, compared to a $2.1$0.02 million expense for the same period of 2020.2022. For the year ended December 31, 2021,2023, the Company recorded valuation allowances of $12.0$4.2 million (2020(2022 - $5.2$13.6 million) against deferred tax assets dueincurred during the year as the Company has experienced cumulative losses in recent years. Due to ongoingthe Company’s three-year history of negative earnings, it is not more likely than not that the Company’s deferred tax assets will be utilized in the near term uncertainties on the business caused by the COVID-19 pandemic and the related decline in business activity which impacted our ability to generate sufficient taxable income in Canada and the United States to fully deduct historical losses. term.

As at December 31, 2021,2023, we had C$65.0114.1 million of loss carry-forwards in Canada and $42.2$55.5 million in the United States. These loss carry-forwards will begin to expire in 2032.


Net Loss after tax

Net loss increasedafter tax decreased to $53.7$14.6 million or $0.63$0.13 net loss after tax per share in the year ended December 31, 20212023, from a net loss after tax of $11.3$55.0 million or $0.13$0.55 net loss after tax per share for the year ended December 31, 2020.2022. The increaseddecreased loss is primarily the result of a $29.8$31.4 million increase in gross profit and a $11.1 million decrease in gross profit, a $10.8 million increase in operating expenses (which includes a $2.8$10.5 million decrease in reorganization expenses, $8.7 million of impairment charges on the Rock Hill Facility and a $1.5 million related party expense), a $0.4 million increase in interest expense as a result of the convertible unsecured subordinated debentures issued on January 25, 2021 and December 1, 2021 (collectively, the “Debentures”) and draws on the Leasing Facilities (as defined below) and a $1.3 million decrease in government subsidies. These decreases were partially offset by a $2.3 million decrease in income tax expense and a $0.2 million decrease in interest expense, offset by a $7.5 million decrease in government subsidies, a $2.1 million decrease in foreign exchange losses.gain, and a $0.3 million increase in income tax expense.

Three Months Ended December 31, 2023 Compared to the Three Months ended December 31, 2022


For the Three Months Ended December 31,


2023


2022


% Change


($ in thousands)


Revenue


50,933


42,427


20


Gross Profit


19,238


11,589


66


Gross Profit Margin


37.8

%


27.3

%


Operating expenses


Sales and marketing


6,933


5,856


18


General and administrative


5,652


4,050


40


Operations support


2,268


2,151


5


Technology and development


1,765


1,841


(4

)

Stock-based compensation


(237

)


731


(132

)

Reorganization


152


1,180


(87

)

Impairment charge on Rock Hill Facility


764


-


100


Total Operating expenses


17,297


15,809


9


Operating income (loss)


1,941


(4,220

)


146


Operating margin


3.8

%


(9.9

)%


Gain on sale of software and patents


985


-


100


Foreign exchange (loss) gain


(567

)


(425

)


(33

)

Interest income


219


1


21,800


Interest expense


(1,291

)


(1,225

)


(5

)


(654

)


(1,649

)


60


Net income (loss) before tax


1,287


(5,869

)


122


Current income tax expense


332


37


797


332


37


797


Net income (loss) after tax


955


(5,906

)


116


37


Annual 2023 Non-GAAP Measures

Adjusted Gross Profit and Adjusted Gross Profit Margin for the Years Ended December 31, 2023, 2022 and 2021

The following table presents a reconciliation for the years ended December 31, 2023, 2022, and 2021 of Adjusted Gross Profit to our gross profit and Adjusted Gross Profit Margin to gross profit margin, which are the most directly comparable GAAP measures for the periods presented:


For the Year Ended December 31,


2023


2022


2021


($ in thousands)


Gross profit


59,542


28,160


23,460


Gross profit margin


32.7

%


16.4

%


15.9

%

Add: Depreciation and amortization expense


5,525


10,789


8,808


Add: Costs of under-utilized capacity


-


-


1,756


Adjusted Gross Profit


65,067


38,949


34,024


Adjusted Gross Profit Margin


35.8

%


22.6

%


23.1

%

For the year ended December 31, 2023, gross profit and gross profit margin increased to $59.5 million or 32.7% from $28.2 million or 16.4% for the prior period. Adjusted Gross Profit and Adjusted Gross Profit Margin increased 67% to $65.1 million or 35.8% for the year ended December 31, 2023, from $38.9 million or 22.6% for the year ended December 31, 2022. Gross profit for the year ended December 31, 2022, included $2.1 million of accelerated depreciation and amortization arising from the change in useful lives of the Phoenix Facility’s equipment. The improvement in Adjusted Gross Profit was due to having better leverage over fixed costs through price increases and reduced fixed costs. Labor costs decreased $3.4 million and fixed costs decreased $2.7 million in 2023 compared to 2022 as a result of initiatives to align our fixed costs with anticipated demand. Actions taken that impacted our overheads included the closure of our Phoenix Facility during the second quarter of 2022 and the temporary suspension of operations at our Rock Hill Facility in the third quarter of 2022. Idle facility costs incurred since the suspension of operations at the Rock Hill Facility were $2.0 million for the year ended December 31, 2023, compared to $0.5 million for the previous year, and are included in cost of sales. We are pursuing options to sublease the Rock Hill Facility to offset idle facility costs in 2024 and beyond.

EBITDA and Adjusted EBITDA for the Years Ended December 31, 2021, 20202023, 2022 and 20192021

The following table presents a reconciliation for the year-to-date results of 2021, 20202023, 2022 and 20192021 of EBITDA and Adjusted EBITDA to our net loss, which is the most directly comparable GAAP measure for the years presented:presented, and of Adjusted EBITDA Margin to net loss margin:


For the Year Ended December 31,


2023


2022


2021


($ in thousands)


Net loss after tax for the year


(14,584

)


(54,963

)


(53,668

)

Add back (deduct):


Interest expense


4,927


5,160


3,131


Interest income


(490

)


(51

)


(77

)

Income tax expense (recovery)


332


21


(204

)

Depreciation and amortization


8,934


15,119


14,513


EBITDA


(881

)


(34,714

)


(36,305

)

Foreign exchange (gain) loss


626


(1,445

)


335


Stock-based compensation


2,306


4,277


4,713


Government subsidies


(236

)


(7,765

)


(11,455

)

Related party expense


1,524


-


-


Reorganization expense


3,009


13,461


-


Gain on sale of software and patents


(7,130

)


-


-


Impairment charge on Rock Hill Facility


8,716


-


-


Goodwill impairment


-


-


1,443


Adjusted EBITDA


7,934


(26,186

)


(41,269

)

Net Loss Margin(1)


(8.0

)%


(31.9

)%


(36.4

)%

Adjusted EBITDA Margin


4.4

%


(15.2

)%


(28.0

)%


For the Year Ended December 31,


2021


2020


2019


($ in thousands)


Net loss for the year


(53,668

)


(11,298

)


(4,396

)

Add back (deduct):


Interest Expense


3,131


305


131


Interest Income


(77

)


(238

)


(529

)

Income Tax Expense (Recovery)


(204

)


2,104


1,019


Depreciation and Amortization


14,513


11,706


12,242


EBITDA


(36,305

)


2,579


8,467


Foreign Exchange Losses


335


576


1,324


Stock-based Compensation


4,713


2,351


3,876


Government Subsidies


(11,455

)


(12,721

)


-


Goodwill Impairment


1,443


-


-


Reorganization Expense


-


-


4,560


Adjusted EBITDA


(41,269

)


(7,215

)


18,227


Net Loss Margin(1)


(36.4

)%


(6.6

)%


(1.8

)%

Adjusted EBITDA Margin


(28.0

)%


(4.2

)%


7.4

%

(1)
Net loss divided by revenue.

38


(1)

Net loss divided by revenue.

For the year ended December 31, 2021,2023, Adjusted EBITDA and Adjusted EBITDA Margin decreasedincreased by $34.1 million to $7.9 million or 4.4% from a $41.3$26.2 million loss or (28.0)% from $7.2 million loss or (4.2)(15.2)% in the same period of 2020.2022. This reflects a $29.4$26.1 million decreaseincrease in Adjusted Gross Profit, and $0.3discussed above, a $4.2 million decrease in lower costs of underutilized capacity, discussed below, higher salary and wage expenses, reflecting the cumulative effectimpact of hires in line with our strategic plan,headcount reductions resulting from reorganization initiatives, $3.2 million of decreased professional fees, and $0.9 million of incremental professional fees, as well as the estimated $2.7 million impact of a stronger Canadian dollar on Canadian-baseddecrease in other operating expenses excluding depreciation and stock-based compensation. Reductions in Adjusted EBITDA were partially offset by $2.5 million of lower commissions. Additionally, in 2020 operating expenses benefited from a $1.2 million reversal of a provision relating to a claim for severance by one of our former founders and lower costs as a result of reduced activity due to COVID-19, offset by a $0.6 million provision recorded for expected credit losses againstcontinued evaluation of our accounts receivable balances, which did not re-occur in 2021.fixed cost structure and overhead costs.

Reconciliation of Q4 2023 Non-GAAP Measures

Adjusted Gross Profit and Adjusted Gross Profit Margin for the YearsThree Months Ended December 31, 2021, 20202023, 2022 and 20192021

The following table presents a reconciliation for the yearsthree months ended December 31, 2021, 2020,2023, 2022, and 20192021 of Adjusted Gross Profit to our gross profit, and Adjusted Gross Profit Margin to gross profit margin, which is the most directly comparable GAAP measure for the periods presented:


For the Three Months Ended December 31,


2023


2022


2021


($ in thousands)


Gross profit


19,238


11,589


8,416


Gross profit margin


37.8

%


27.3

%


19.6

%

Add: Depreciation and amortization expense


869


1,997


2,425


Adjusted Gross Profit


20,107


13,586


10,841


Adjusted Gross Profit Margin


39.5

%


32.0

%


25.3

%


For the Year Ended December 31,


2021


2020


2019


($ in thousands)


Gross profit


23,460


53,283


86,424


Gross profit margin


15.9

%


31.1

%


34.9

%

Add: Depreciation and amortization expense


8,808


8,110


9,195


Add: Costs of under-utilized capacity


1,756


2,010


2,240


Adjusted Gross Profit


34,024


63,403


97,859


Adjusted Gross Profit Margin


23.1

%


37.0

%


39.5

%


Gross profitEBITDA and gross profit margin decreased to $23.5 million or 15.9%Adjusted EBITDA for the year endedThree Months Ended December 31, 2023, 2022 and 2021 from $53.3 million or 31.1%

The following table presents a reconciliation for the yearthree months ended December 31, 2020. Adjusted Gross Profitresults of 2023, 2022 and 2021 of EBITDA and Adjusted Gross Profit Margin decreasedEBITDA to $34.0 million or 23.1%our net income (loss), which is the most directly comparable GAAP measure for the year ended December 31, 2021, from $63.4 million or 37.0% for the year ended December 31, 2020.

The decrease largely reflects lower revenue levels, significant inflationary increases in the realized costperiods presented, and of materials, transportation and packaging, negative fixed cost leverage and under-utilized labor capacity, incremental fixed costs of our new South Carolina Facility and the impact of a stronger Canadian dollar. Of the 15.2% difference in gross profit as a percentage of revenue in 2021 versus 2020, approximately 6% is dueAdjusted EBITDA Margin to higher material, transportation and packaging costs, 2% is due to negative fixed cost leverage, 2% is due to the incremental South Carolina Facility fixed costs, and 2% is due to a stronger Canadian dollar with the balance related to inherent labor inefficiency at lower revenue levels and reduced timber provision reversals. The decrease was largely due to the impact of fixed costs on lower revenues.net income (loss) margin:

Like many other industries, we experienced a significant increase in the cost of raw materials, transportation and packaging, largely driven


Three months ended December 31,


2023


2022


2021


($ in thousands)


Net income (loss) after tax for the period


955


(5,906

)


(16,012

)

Add back (deduct):


Interest expense


1,291


1,225


1,014


Interest income


(219

)


(1

)


(15

)

Income tax expense (recovery)


332


37


(551

)

Depreciation and amortization


1,718


2,917


3,875


EBITDA


4,077


(1,728

)


(11,689

)

Foreign exchange (gain) loss


567


425


621


Stock-based compensation


(237

)


731


921


Government subsidies


-


-


(1,021

)

Reorganization expense


152


1,180


-


Gain on sale of software and patents


(985

)


-


-


Impairment charge on Rock Hill Facility


764


-


-


Goodwill impairment


-


-


1,443


Adjusted EBITDA


4,338


608


(9,725

)

Net Income (Loss) Margin(1)


1.9

%


(13.9

)%


(37.3

)%

Adjusted EBITDA Margin


8.5

%


1.4

%


(22.7

)%

(1)
Net loss divided by the effects of the pandemic with much of the increases experienced in the second half of 2021. As previously discussed and in response, effective November 16, 2021, we increased prices on new orders by approximately 6.5% to effectively offset these cost increases, with the benefits largely expected to be realized in 2022. We expect such inflationary pressures to continue into 2022 and accordingly announced a further 5% price increase on February 17, 2022, effective June 1, 2022.revenue.

39


Approximately $28.3 million of our annual costs are fixed, related primarily to rent, utilities and other production overhead costs including $2.7 million of incremental costs related to our new South Carolina Facility. Furthermore, at these revenue levels our manufacturing workforce, which would normally be variable, is effectively fixed. We have reduced our manufacturing workforce by 31% since December 31, 2019, not including the net headcount reductions announced on February 22, 2022, while ensuring we can deliver to our customer lead times given inter-week variability in production volumes.

A stronger Canadian dollar on Canadian-based manufacturing costs negatively impacted gross margin by approximately $2.5 million. The year ended December 31, 2021 included a $0.5 million reversal of a timber provision compared to a $1.8 million reversal in the year ended December 31, 2020, discussed further below.

During the fourth quarter of 2019, we determined that we were carrying abnormal excess capacity in our manufacturing facilities as a result of the slowdown in sales and determined certain production overheads should be directly expensed in cost of sales, representing production overheads that were not attributable to production. In the first quarter of 2020, we separately classified $2.0 million as costs related to our under-utilized capacity (1.2% of 2020 annual gross profit margin) in cost of sales. We took steps to manage our excess capacity, including the reduction in staffing by 14%, with a further 12% reduction in April 2020 for a total reduction of 25% from prior year levels, and the undertaking of planned factory curtailments. The staffing reductions realigned our capacity with expected activity levels; however, our fixed costs continued to affect our Adjusted Gross Profit Margin, which we expect to remain below historical percentages until sales improve. In the first quarter of 2021, we experienced the full impact of the slowdown in non-residential construction activity on our business. In anticipation of a recovery in demand for our products and services and to preserve our skilled workforce, we deliberately maintained manufacturing headcount, while implementing selective furlough days, in the first quarter of 2021 despite the shortfall in revenues relative to capacity. As a result, in the first quarter of 2021 we separately classified $1.8 million as costs related to our under-utilized capacity (1.2% of 2021 annual gross profit margin) in cost of sales. For the remaining quarters of 2021, we did not have abnormal excess capacity as our workforce was better aligned with current production volumes.

Following the completion of third party testing in 2019, we determined that timber included in certain projects installed between 2016 and 2019 potentially did not meet the fire-retardant specifications under which the projects were sold. As a result, we recorded a $2.5 million provision in the fourth quarter of 2019 and began contacting customers to determine whether remedial actions were required. In the second quarter of 2020, we identified and validated an in-situ solution that we believe will meet the fire-retardant specification under which the projects were sold and accordingly reduced the associated provision to $1.3 million, which represents expected costs to prepare impacted sites and apply the in-situ solution. In the third quarter of 2020, we completed building code reviews of the affected projects and determined that the timber as installed met the requisite building code requirements as it related to fire retardance. As a result, we further reduced our timber provision by $0.5 million in the third quarter of 2020 as we believe this reduced any obligation to remediate previously installed projects. Additionally, we entered into agreements with certain customers to compensate them for product charges not fulfilled. During the year ended December 31, 2021, we incurred no costs (2020 – $0.1 million) associated with remediating previously installed timber projects and we reduced our provision by a further $0.5 million to a remaining balance of $0.1 million given limited take-up by our customers to remediate these identified projects.


Year Ended December 31, 20202022 Compared to the Year Ended December 31, 20192021

Discussion and analysis of our financial condition and results of operations for the fiscal year ended December 31, 20202022, compared to the fiscal year ended December 31, 20192021, is included under the heading Item 7. “Management’s Discussion and Analysis of Financial Condition and Results of Operations,” in our Annual Report on Form 10-K for the fiscal year ended December 31, 2020,2022, as filed with the SEC and applicable securities commissions or similar regulatory authorities in Canada on February 24, 2021.22, 2023.

Liquidity and Capital Resources

Cash and cash equivalentsAs at December 31, 2021 totaled $60.32023, the Company had $24.7 million an increase of $14.5cash on hand and C$13.6 million from($10.3 million) of available borrowings, compared to $10.8 million of cash on hand and C$7.2 million ($5.3 million) of available borrowings as at December 31, 2020. The change2022. Through the year ended December 31, 2023, the Company generated $14.8 million in cash primarily reflectsflow from operations, compared to a cash usage of $44.3 million over fiscal year 2022. The Company benefited from the receipt of $7.3 million of government subsidies during 2023.

We have implemented multiple price increases during the past two years to mitigate the impact of $55.1inflation on raw materials, costs and improve liquidity. These actions have resulted in a meaningful improvement in our gross profit margins and have served to reduce our cash usage to operate the business. Gross profit for the year ended December 31, 2023, was $59.5 million, or 32.7% of net proceeds fromrevenue, compared to the issuancesame period in 2022, which generated gross profit of $28.2 million, or 16.4% of revenue.

Over the Debentures and $9.8 millionsame period, we have executed upon several initiatives to improve liquidity. First, in May 2023, we entered into an agreement with AWI resulting in the receipt of drawings under our Leasing Facilities (as defined below), less scheduled Leasing Facilities repayments of $1.8 million, offset by cash used in operations of $31.2 million, capital expenditures of $14.6 million and the restriction of $3.1$12.8 million of cash under the terms of our senior secured credit facility.

In January 2021, we issued C$40.3 million of convertible debentures for net proceeds after costs of C$37.6 million ($29.5 million). These convertible debentures accrue interest at a rate of 6.00% per annum and are convertible into common shares of DIRTT at an exercise price of C$4.65 per common share, or if not converted will mature and be repayable on January 31, 2026. Interest and principal are payablethroughout 2023. Second, in cash or shares at the option of the Company.

In February 2021,March 2023, we entered into a loanan agreement governing a C$25.0 million senior secured revolving credit facility (the “RBC Facility”) with the Royal Bankto sublease our Dallas “DXC” to one of Canada (“RBC”).our Construction Partners in that region. Under the RBCsublease agreement, the subtenant has assumed responsibility for the monthly rent, utilities, maintenance, taxes and other costs as of April 1, 2023, through December 31, 2024, providing us annualized savings of approximately $1 million. We are continuing to evaluate other properties for sale and leaseback or sublease opportunities, including our Rock Hill Facility, the “Borrowing Base” isand expect these initiatives to result in positive cash inflows in 2024. Third, we completed a maximumprivate placement of 90%8,667,449 common shares in November 2022 for aggregate gross proceeds of investment grade or insured accounts receivable plus 85% of eligible accounts receivable plus the lesser of 75%$2.8 million (the “Private Placement”), with certain significant shareholders and directors and officers of the book value of eligible inventoryCompany to bridge cash requirements before the completion and 85%closing of the net orderly liquidation valuenoted strategic transactions. The Company entered into irrevocable subscription agreements with its two largest shareholders, 22NW and 726 BC LLC and 726 BF (together “726” (which subsequently transferred its holdings to WWT)) and all the directors and officers of eligible inventory less any reservesthe Company on November 14, 2022, to issue 8.7 million shares for potential prior ranking claims. Available borrowingsgross consideration of $2.8 million. The Private Placement closed on November 30, 2022.

On November 21, 2023, the Company announced a rights offering to common shareholders for aggregate gross proceeds of C$30.0 million (the “Rights Offering”). The Rights Offering closed on January 9, 2024, for aggregate gross proceeds of C$30.0 million.

On February 15, 2024, the Company announced a substantial issuer bid and tender offer (the "Issuer Bid"), under which the RBC FacilityCompany will offer to repurchase for cancellation: (i) up to C$6,000,000 principal amount of its issued and outstanding January Debentures") (or such larger principal amount as the Company, in its sole discretion, may determine it is willing to take-up and pay for, subject to applicable law) at a purchase price of C$720 per C$1,000 principal amount of January Debentures; and (ii) up to C$9,000,000 principal amount of its issued and outstanding 6.25% convertible unsecured subordinated debentures due December 31, 2021 were C$13.2 million or $10.4 million.

In December 2021, we issued C$35.0 million of convertible debentures for net proceeds after costs of C$32.7 million ($25.6 million). These convertible debentures accrue interest at a rate of 6.25% per annum and are convertible into common shares of DIRTT at an exercise price of C$4.20 per common share, or if not converted will mature and be repayable on December 31, 2026. Interest and principal are payable in cash or shares at the option of the Company.

The Company has a C$5.0 million equipment leasing facility in Canada2026 (the “Canada Leasing Facility”) of which C$3.6 million ($2.6 million) has been drawn, and a $14.0 million equipment leasing facility in the United States (the “U.S. Leasing Facility”"December Debentures", and, together with the Canada Leasing Facility,January Debentures, the “Leasing Facilities”“Debentures” or the “convertible debentures”) (or such larger principal amount as the Company, in its sole discretion, may determine it is willing to take-up and pay for, subject to applicable law) at a purchase price of C$600 per C$1,000 principal amount of December Debentures. Holders of Debentures who validly tender and do not withdraw their Debentures will receive the applicable purchase price, plus a cash payment for all accrued and unpaid interest up to, but excluding, the date on which $13.3such Debentures are taken up by the Company. The applicable purchase price will be denominated in Canadian dollars and payments of amounts owed to holders of deposited Debentures, including for interest, will be made in Canadian dollars. The Issuer Bid will remain open for acceptance until 5:00 p.m. (Eastern Standard Time) on March 22, 2024, unless withdrawn or extended by the Company. If the aggregate principal amount of the Debentures properly tendered and not withdrawn under the Issuer Bid exceeds C$6,000,000 for the January Debentures or C$9,000,000 for the December Debentures, the Company will purchase a pro-rated portion of the January Debentures or the December Debentures so tendered, as applicable (with adjustments to maintain C$1,000 minimum denominations of Debentures). DIRTT will return all Debentures not purchased under the Issuer Bid, including Debentures not purchased because of pro-ration. Debentures taken up and paid for by the Company will be immediately cancelled.

The Company intends to fund the Issuer Bid with a portion of the proceeds from the Company’s previously completed rights offering to its common shareholders, which closed in January 2024 for aggregate gross proceeds of C$30.0 million.

40


On February 4, 2024, the Company entered into a Litigation Funding Agreement with a third party for the funding of up to $4.0 million of litigation costs in respect of specific claims against Falkbuilt, Inc., Falkbuilt Ltd. and Henderson. In return, the Company has been drawn with RBCagreed to pay from any proceeds received from the settlement of such claims, a reimbursement of funded amounts plus diligence and oneunderwriting costs, plus a multiple of its affiliates. The Leasing Facilitiessuch funded amount based on certain milestones.

While we are available for equipment expendituresencouraged by the improved profitability and certain equipment expenditures already incurred.

Incash flow, we have continued to evaluate our fixed cost structure and overhead in light of the uncertainty caused by the near and potential mid-term impacts of COVID-19, we have evaluated multiple downside scenarios andrecent macroeconomic uncertainty. We have implemented multiple reorganization initiatives designed to align our cost control and expenditure management processes. Whilestructure with current expected levels of demand. In addition, the previously discussed COVID-19 impacts and upstream supply chain issues causing project delays during 2021 resulted in a significant usage of cash reserves,Company has reduced headcount by approximately 10%, from January 2022 through December 2023.

We have assessed the combination of an improvedCompany’s liquidity as at December 31, 2023, taking into account our sales outlook for 2022,the next twelve months, our cost optimization activities and ourexisting cash reservesbalances and available credit facilities lead usfacilities. Based upon this analysis, we believe the Company has sufficient liquidity to believe that we have sufficient liquidityremain a going concern for at least the next twelve months. We assess our financial strength on an ongoing basis and may seek additional financing to bolster our balance sheet to mitigate the risk of ongoing delays in sales recovery.

A prolonged and complete cessation of or sustained significant decrease in North American construction activities or a sustained economic depression and its adverse impacts on customer demand could continue to adversely affect our liquidity. To the extent that existing cash and cash equivalents and increased liquidity from the aforementionedavailable facilities are not sufficient to fund future activities, we may seek to raise additional funds through equity or debt financings. If additional funds are raised through the incurrence of indebtedness, such indebtedness may have rights that are senior to holders of our Debentures and our equity securities or contain instruments that may be dilutive to our existing shareholders. Any additional equity or debt financing may be dilutive to our existing shareholders. While we believe we can access capital markets when needed or under acceptable terms, there can be no assurance we will be able to do so.

SinceIn January 2021, we issued C$40.3 million of 6.00% convertible unsecured subordinated debentures due January 31, 2026 (the “January Debentures”) for net proceeds after costs of C$37.6 million ($29.5 million). The January Debentures accrue interest at a rate of 6.00% per annum and are convertible into common shares of DIRTT at an exercise price of C$4.65 per common share, or if not converted will mature and be repayable on January 31, 2026. As a result of the Rights Offering, the conversion price was adjusted to C$4.03 per common share. Interest and principal are payable in cash or shares at the option of the Company. As at December 31, 2023, C$18.9 million of the January Debentures are held by a related party, 22NW. 22NW holds approximately 30.1% of our inception,issued and outstanding common shares as of February 16, 2024. Aron English, manager of 22NW Fund GP, LLC, the general partner of 22NW, is a director of the Company.

In February 2021, we have financed operations primarily through cash flows from operations, long-term debt,entered into a loan agreement governing a C$25.0 million senior secured revolving credit facility with the Royal Bank of Canada (“RBC”), as lender (the “RBC Facility”). Under the RBC Facility, the “Borrowing Base” is a maximum of 90% of investment grade or insured accounts receivable plus 85% of eligible accounts receivable plus the lesser of 75% of the book value of eligible inventory and 85% of the salenet orderly liquidation value of equity securities. Overeligible inventory less any reserves for potential prior ranking claims. On February 9, 2023, the past three years, we have funded our operations and capital expenditures through a combination of cash flow from operations, long-term debt, government subsidies and cash on hand. We had no amounts outstandingCompany extended the RBC Facility. The maximum availability under the Extended RBC


Facility is subject to the borrowing base calculation to a maximum of C$15 million and a one-year term. Available borrowings under the Extended RBC Facility as ofat December 31, 2023, were C$13.6 million ($10.3 million).

On December 1, 2021, $13.9 million outstanding under the Leasing Facilities and $55.1we issued C$35.0 million of 6.25% convertible unsecured subordinated debentures outstanding as ofdue December 31, 2021.2026 (the “December Debentures” and together with the January Debentures, the “Debentures”) for net proceeds after costs of C$32.7 million ($25.6 million). The December Debentures accrue interest at a rate of 6.25% per annum and are convertible into common shares of DIRTT at an exercise price of C$4.20 per common share, or if not converted, will mature and be repayable on December 31, 2026. As a result of the Rights Offering, the conversion price was adjusted to C$3.64 per common share.Interest and principal are payable in cash or shares at the option of the Company. As at December 31, 2023, C$13.6 million of the December Debentures are held by a related party, 22NW.

The Company has a C$5.0 million equipment leasing facility in Canada (the “Canada Leasing Facility”) of which C$4.4 million ($3.4 million) has been drawn and C$3.8 million ($2.9 million) has been repaid, and a $14.0 million equipment leasing facility in the United States of which $13.3 million has been drawn and repaid (the “U.S. Leasing Facility” and, together with the Canada Leasing Facility, the “Leasing Facilities”) with RBC, and one of its affiliates. The Canada Leasing Facility has a seven-year term and bears interest at 4.25%. In connection with the Company’s decision to close the Rock Hill Facility, we settled the liability related to the U.S. Leasing Facility ($7.8 million). The U.S. Leasing Facility is no longer available to be drawn on. With the settlement of this liability, we released $2.6 million of restricted cash.

41


The following table summarizes our consolidated cash flows for the years indicated:


For the Year Ended December 31,


2021


2020


2019


($ in thousands)


Net cash flows provided by (used in) operating activities


(31,210

)


12,485


13,359


Net cash flows used in investing activities


(14,138

)


(19,392

)


(15,189

)

Net cash provided by (used in) financing activities


62,452


5,724


(5,484

)

Effect of foreign exchange on cash, cash equivalents and

   restricted cash


458


(145

)


1,076


Net increase (decrease) in cash, cash equivalents and restricted cash


17,562


(1,328

)


(6,238

)

Cash, cash equivalents and restricted cash, beginning of period


45,846


47,174


53,412


Cash, cash equivalents and restricted cash, end of period


63,408


45,846


47,174


For The Year Ended December 31,


2023


2022


2021


($ in thousands)


Net cash flows provided by (used in) operating activities


14,821


(44,260

)


(31,210

)

Net cash flows provided by (used in) investing activities


7,657


(4,024

)


(14,138

)

Net cash flows (used in) provided by financing activities


(11,605

)


(874

)


62,452


Effect of foreign exchange on cash, cash equivalents and restricted cash


(13

)


(11

)


458


Net increase (decrease) in cash, cash equivalents and restricted cash


10,860


(49,169

)


17,562


Cash, cash equivalents and restricted cash, beginning of year


14,239


63,408


45,846


Cash, cash equivalents and restricted cash, end of year


25,099


14,239


63,408


For the Year Ended December 31,


2021


2020


2019


For the Year Ended December 31,


($ in thousands)


2023


2022


2021


Cash and cash equivalents


60,313


45,846


47,174


24,744


10,821


60,313


Restricted cash


3,095


-


-


355


3,418


3,095


Total cash, cash equivalents and restricted cash


63,408


45,846


47,174


25,099


14,239


63,408


Operating Activities

Net cash flows used inprovided by operating activities were $31.2$14.8 million for the year ended December 31, 2021 and $12.52023, compared to $44.3 million providedused by operating activities for the year ended December 31, 2020.2022. The decreaseimprovement in cash flows fromused in operations is largely due to the $34.1 million increase in Adjusted EBITDA and a $10.5 million decrease in gross profit, higherreorganization costs. We achieved positive operating costscash flows through the realization of price increases and higher inventory, partially offsetreorganization initiatives which have been designed to align our cost structure with current expected levels of demand.

Investing Activities

Cash flows provided by higher accounts payable and accrued liabilities, a decrease in trade and other receivables and higher customers deposits. Forinvesting activities during the year ended December 31, 2021, we were eligible for $11.52023, benefited from $11.0 million (2020 - $12.7 million) of government subsidies.proceeds from the AWI transaction.

Investing Activities

We invested $11.8$1.2 million in property, plant and equipment during the year ended December 31, 20212023, compared to $16.6$2.4 million during the year ended December 31, 2020.

Our2022. Expenditures consisted of $0.3 million of information technology investments, $0.4 million of DXC refreshes and $0.5 million of manufacturing upgrades for the year ended December 31, 2023. We invested $1.8 million on capitalized software during the year ended December 31, 2021 included $3.9 million in costs to complete the construction of the South Carolina Facility and $4.6 million of investment in our DXCs, primarily related to our DXC in Plano, Texas. These investments are substantially complete and until pre-COVID revenues return, no new significant capital projects are planned. Maintenance capital expenditures for the year ended December 31, 2021 were $3.3 million, which includes new equipment to complete our transition to one-piece flow manufacturing in our aluminum plants as well as equipment necessary to ensure business continuity in our aluminum plants. We anticipate maintenance capital requirements to be lower in future periods as there are no significant projects ongoing at this time.

During the year ended December 31, 2020, our spending included $9.9 million related to the construction of the South Carolina Facility, $2.9 million on our Chicago DXC, $0.5 million on development of our new Dallas DXC and $3.3 million of maintenance capital.

Software development and capitalized patent costs for the year ended December 31, 2021 were $2.8 million2023, compared to $3.5$1.7 million for the year ended December 31, 2020. Software development expenditure primarily consists of the capitalization of salaries of our software development team members. We expect the level of expenditure to be consistent with the current year, and any fluctuations will increase or decrease technology and development expenditures on the statement of operations.2022.

Financing Activities

For the year ended December 31, 2021, $62.52023, $11.6 million of cash was provided byused in financing activities, mainly due to the net proceeds received from the issuance of the Debentures in January and December of 2021 of C$37.5 million ($29.5 million) and C$32.7 million ($25.6 million), respectively, and the receipt of $9.8comprising $2.2 million of cash considerationscheduled repayments and $9.4 million of early repayments under the U.S. Leasing Facility which was used to finance equipment purchases for our new South Carolina Facility largely paid for in installments in 2019 and 2020.


Cash provided by financing activities forthe Canada Leasing Facility. For the year ended December 31, 20202022, $0.9 million of cash was $5.7 million entirely comprised of draws andused in financing activities mainly driven by the scheduled repayments under the Leasing Facilities.Facilities, offset by the receipt of $2.0 million net proceeds from the Private Placement and a draw of C$0.9 million ($0.7 million) under the Canada Leasing Facility.

We currently expect to fund anticipated future investments with available cash, including the proceeds from our issuance of the DebenturesRights Offering and drawings on the Second Extended RBC Facility. As of December 31, 2023, our Leasing Facilities.strategic initiatives have generated cash through proceeds from the Private Placement in November 2022, the receipt of $7.3 million of government subsidy through the ERC application during the year ended December 31, 2023, and proceeds of $12.8 million received in 2023 through the AWI transaction. We continue to evaluate properties we own for sale and lease back and opportunities to sub-lease available spaces. Apart from cash flow from operations, issuing equity and debt has been our primary source of capital to date. Additional debt or equity financing may be pursued in the future as we deem appropriate. We may also use debt or pursue equity financing depending on the share price of our common shares at the time, interest rates, and nature of the investment opportunity and economic climate. No assurance can be given that any of these actions will be successful or will be sufficient for our needs.

42


Consolidated cash flows for the quarter as indicated:


For the three months ended December 31,


2023


2022


2021


($ in thousands)


Net cash flows provided by (used in) operating activities


10,134


3,249


(7,338

)

Net cash flows provided by (used in) investing activities


568


(429

)


(1,582

)

Net cash flows (used in) provided by financing activities


(8,193

)


928


26,369


Effect of foreign exchange on cash, cash equivalents and restricted cash


153


62


(123

)

Net increase in cash, cash equivalents and restricted cash


2,662


3,810


17,326


Cash, cash equivalents and restricted cash, beginning of period


22,437


10,429


46,082


Cash, cash equivalents and restricted cash, end of period


25,099


14,239


63,408


Credit Facility

On February 12, 2021, the Company entered into the RBC Facility. Under the RBC Facility, the Borrowing Base is up to a maximum of 90% of investment grade or insured accounts receivable plus 85% of eligible accounts receivable plus the lesser of 75% of the book value of eligible inventory and 85% of the net orderly liquidation value of eligible inventory less any reserves for potential prior ranking claims. At December 31, 2021, available borrowings are C$13.2 million ($10.4 million), of which no amounts have been drawn. Interest is calculated at the Canadian or U.S. prime rate plus 30 basis points or at the Canadian Dollar Offered Rate or LIBOR plus 155 basis points. Under the RBC Facility, if the “Aggregate Excess Availability”, defined as the Borrowing Base less any loan advances or letters of credit or guarantee and if undrawn including unrestricted cash is less than C$5.0 million, the Company is subject to a fixed charge coverage ratio (“FCCR”) covenant of 1.10:1 on a trailing twelve monthtwelve-month basis. Additionally, if the FCCR has been below 1.10:1 for the three immediately preceding months, the Company is required to maintain a reserve account equal to the aggregate of one year of payments on outstanding loans on the Leasing Facilities. The Company did not meet the three month FCCR requirement during the fourth quarter of 2021, which resulted in requiring the restriction of $3.1 million of cash. Should an event of default occur or the Aggregate Excess Availability be less than C$6.25 million for five consecutive business days, the Company would enter a cash dominion period whereby the Company’s bank accounts would be blocked by RBC and daily balances will set-off any borrowings and any remaining amounts made available to the Company.

During 2020,On February 9, 2023, the Company entered intoextended the RBC Facility (the “Extended RBC Facility”). The Extended RBC Facility has a maximum borrowing base of C$15 million and a one-year term. Interest is calculated as at the Canadian or U.S. prime rate plus 75 basis points or at the Canadian Dollar Offered Rate or LIBOR plus 200 basis points. Under the Extended RBC Facility, until such time that the trailing twelve-month FCCR is above 1.25 for three consecutive months, a cash balance equivalent to one-year’s worth of Leasing Facilities payments must be maintained. At December 31, 2023, available borrowings are C$13.6 million ($10.3 million) (2022 – C$7.2 million ($5.3 million) of available borrowings), calculated in the same manner as the RBC Facility described above, of which no amounts have been drawn. The Company did not meet the three-month FCCR requirement during the year end 2023, which resulted in the restriction of $0.4 million of cash (2022 - $3.4 million).

On February 9, 2024, the Company extended the Extended RBC Facility (the “Second Extended RBC Facility”). The maximum availability under the Second Extended RBC Facility is subject to the borrowing base calculation to a maximum of C$15 million and a one-year term. Interest is calculated as at the Canadian or U.S. prime rate plus 75 basis points or at the Canadian Dollar Offered Rate or Adjusted Term CORRA or Term SOFR plus the Term SOFR Adjustment, in each case, plus 200 basis points.

The Company has a C$5.0 million equipment leasing facility in Canada (the “Canada Leasing Facility”) of which C$4.4 million ($3.4 million) has been drawn and C$3.8 million ($2.9 million) has been repaid, and a $14.0 million equipment leasing facility in the United States of which $13.3 million has been drawn and repaid (the “U.S. Leasing Facility” and, together with the Canada Leasing Facility, the “Leasing Facilities”) with RBC. The Canada Leasing Facility has a seven-year term and bears interest at 4.25%.

The Company did not make any draws on the Leasing Facilities consistingduring 2023. During the year ended December 31, 2022, the Company received C$0.9 million ($0.7 million) under the Canada Leasing Facility.

As part of the C$5.0 million Canada Leasingdecision to close the Rock Hill Facility, and the $14.0 millionCompany fully settled the liability related to the U.S. Leasing Facility with RBC, which are available for equipment expenditures and certain equipment expenditures already incurred. The Leasing Facilities, respectively, have seven and five-year terms and bear interest at 4.25% and 5.59%.of $7.8 million in the fourth quarter of 2023. The U.S. Leasing Facility is amortized over a six-year term and is extendible atno longer available to be drawn on. With the Company’s option for an additional year.settlement of this liability, $2.6 million was released from restricted cash.

The Company has drawn $13.3As part of RBC’s consent to the AWI transaction, one of the Canadian lease agreements of $1.6 million was fully settled using proceeds from the AWI transaction. This resulted in the release of $0.4 million of restricted cash consideration underassociated with the U.S. Leasing Facility and commenced the lease term in 2020 for the equipment at the South Carolina Facility. The Company has drawn C$3.6 million ($2.6 million)one year of cash consideration under the Canada Leasing Facility and commenced the lease term for the Canadian equipment expenditures during 2020.payments on this lease.

43


We are restricted from paying dividends unless Payment Conditions (as defined in the Second Extended RBC Facility) are met, including having a net borrowing availability of at least C$10 million over the proceeding 30-day period, and having a trailing twelve monthtwelve-month fixed charge coverage ratio above 1.10:1 and certain other conditions. The Second Extended RBC Facility is currently secured by substantially all of our real property located in Canada and the United StatesStates.


Contractual Obligations

The following table summarizes DIRTT’s contractual obligations at December 31, 2021:2023:


Payments due by period


Less than


Greater than


1 year


1 to 3 years


3 to 5 years


5 years


Total


($ in thousands)


Accounts payable and accrued liabilities


19,880


-


-


-


19,880


Other liabilities


2,482


-


-


-


2,482


Customer deposits and deferred revenue


5,290


-


-


-


5,290


Current and long-term portion of long-term debt and accrued interest1


7,190


59,692


134


-


67,016


Lease liabilities (undiscounted)


5,424


11,542


8,209


19,929


45,104


Purchase obligations


2,797


-


-


-


2,797


Total


43,063


71,234


8,343


19,929


142,569


Payments due by period


Less than


Greater than


1 year


1 to 3 years


3 to 5 years


5 years


Total


($ in thousands)


Accounts payable and accrued liabilities


22,751


-


-


-


22,751


Other liabilities


2,379


-


-


-


2,379


Customer deposits and deferred revenue


2,420


-


-


-


2,420


Current and long-term portion of long-term debt and

   accrued interest1


6,717


13,434


72,309


157


92,617


Lease liabilities (undiscounted)


6,406


7,901


6,451


28,963


49,721


Purchase obligations


3,732


-


-


-


3,732


Total


44,405


21,335


78,760


29,120


173,620


(1)

Includes principal and interest. SeeRefer to Note 12 to14 of our Consolidated Financial Statements for additional information.

Critical Accounting Policies and Estimates

Our significant accounting policies are described in Note 2 to our Consolidated Financial Statements appearing elsewhere in Item 8 of this Annual Report. Our critical accounting estimates include the areas where we have made what we consider to be particularly difficult, subjective or complex judgments in making estimates, and where these estimates can significantly affect our financial results under different assumptions and conditions. We prepare our financial statements in conformity with GAAP. As a result, we are required to make estimates, judgments and assumptions that we believe are reasonable based upon the information available. These estimates, judgments and assumptions affect the reported amounts of assets and liabilities at the date of the financial statements and reported amounts of revenue and expenses during the periods presented. Actual results could be different from these estimates. Critical estimates and assumptions made by management include:

Estimates of liabilities associated with the potential and amount of warranty, legal claims and other contingencies

We have warranty obligations with respect to manufacturing defects on most of our manufactured products. Warranty periods generally range from one to ten years. We have recorded a reserve for estimated warranty and related costs based on historical experience and periodically adjust these provisions to reflect actual experience. We assess the adequacy of our warranty accrual on a quarterly basis, and adjust the previous amounts recorded, if necessary, to reflect the change in estimate of the future costs of claims yet to be serviced. Typically, product deficiencies requiring our warranty are identified and remediated within a year of production. The following provides information with respect to our warranty accrual. At December 31, 20212023 and 2020,2022, we had $1.5$0.9 million and $1.8$1.3 million, respectively, accrued for warranty and other provisions, and third-party costs associated with remedying deficiencies were $0.8$1.2 million during the fiscal year ended December 31, 2021,2023, as compared to $1.8$1.1 million during the fiscal year ended December 31, 2020. Following the completion of third-party testing in 2019, we determined that timber included in certain projects installed between 2016 and 2019 potentially did not meet the fire-retardant specifications under which the projects were sold. As a result, we recorded a $2.5 million provision in the fourth quarter of 2019 and have been contacting customers to determine whether remedial actions are required. In the second quarter of 2020, we identified and validated an in-situ solution that we believe will meet the fire-retardant specification under which the projects were sold and reduced the associated provision to $1.3 million, which represents expected costs to prepare impacted sites and apply the in-situ solution. In the third quarter of 2020, we completed building code reviews of the affected projects and determined that the timber as installed met the requisite building code requirements as it related to fire retardance. We further reduced our timber provision by $0.5 million in 2020 as we believe this reduces any obligation to remediate previously installed projects. Additionally, we entered into agreements with certain customers to compensate them for product charges not fulfilled. During the fourth quarter of 2021, we reduced our timber provision by an additional $0.5 million to $1.0 million to reflect our expected remaining obligation.2022.

We establish reserves for estimated legal contingencies when we believe a loss on litigation is probable and the amount of the loss can be reasonably estimated. Revisions to contingent liability reserves are reflected in operations in the period in which there are changes in facts and circumstances that affect our previous assumptions with respect to the likelihood or amount of loss. Reserves for contingent liabilities are based upon our assumptions and estimates regarding the probable outcome of the matter. We estimate the probable cost by evaluating historical precedent as well as the specific facts relating to each contingency (including the opinion of outside advisors). Should the outcome differ from our assumptions and estimates, or other events result in a material adjustment to the


accrued estimated reserves, revisions to the estimated reserves for contingent liabilities would be required and would be recognized in the period the new information becomes known. At December 31, 20212023 and 2020,2022, we had $0.1 and $0.05 million provided for legal provisions, respectively.provisions.

44


Estimates of useful lives of depreciable assets, and the fair value of long-term assets used for impairment calculations and the fair value less costs to sell for assets held for sale

We evaluate the recoverability of our property, plant, and equipment (“PP&E”), capitalized software costs and right of use assets when events or changes in circumstances indicate a potential impairment exists. If impairment is indicated, the impairment loss is measured as the amount the assets carrying value exceeds the fair value of the assets.

Our determination of the fair value associated with long-term assets involves significant estimates and assumptions, including those with respect to the determination of asset groups, future cash inflows and outflows, discount rates, and asset lives. In the current year, estimates of cash inflows are dependent on the timing and extent of recovery of the slowdown experienced as a result of the COVID-19 pandemic. These significant estimates require considerable judgment, which could affect our future results if the current estimates of future performance and fair values change.

We estimate the useful lives of PP&E, capitalized software costs and right of use assets based on the period over which the assets are expected to be available for use. The estimated useful lives are reviewed annually and are updated if expectations differ from previous estimates due to physical wear and tear, technical or commercial obsolescence and legal or other limits on the use of the relevant assets. In addition, the estimation of the useful lives of the relevant assets may be based on internal technical evaluation and experience with similar assets. It is possible, however, that future results of operations could be materially affected by changes in the estimates brought about by changes in factors mentioned above. The amounts and timing of recorded expenses for any period would be affected by changes in these factors and circumstances. A reduction in the estimated useful lives of the PP&E and capitalized software assets would increase the recorded expenses and decrease the non-current assets.

We test goodwill for impairment annually during the fourth quarter of the calendar year. Due to the ongoing impact of the COVID-19 pandemic on our financial results inAs at December 31, 2021, we determined it was necessary to use the quantitative approach to perform our goodwill impairment test. Based on our testing, the fair value of goodwill did not exceed the carrying value of its net assets and, accordingly, the entire $1.4 million balance of goodwill was impaired as at December 31, 2021. There was no impairment charge for the year ended December 31, 2023, or December 31, 2022.

The Company classifies an asset group (“asset”) as held for sale in the period that (i) it has approved and committed to a plan to sell the asset, (ii) the asset is available for immediate sale in its present condition, (iii) an active program to locate a buyer and other actions required to sell the asset have been initiated, (iv) the sale of the asset is probable and transfer of the asset is expected to qualify for recognition as a completed sale within one year (subject to certain events or circumstances), (v) the asset is being actively marketed for sale at a price that is reasonable in relation to its current fair value, and (vi) it is unlikely that significant changes to the plan will be made or that the plan will be withdrawn. The Company initially and subsequently measures a long-lived asset that is classified as held for sale at the lower of its carrying value or fair value less any costs to sell. Any loss resulting from this measurement is recognized in the consolidated statement of operations and comprehensive loss in the period in which the held for sale criteria are met. We estimate the fair value less costs to sell based on market prices and discussions with potential buyers on the assets that are held for sale. The amounts and timing that the assets held for sale are sold could be impacted on the ability to market and sell the assets held for sale, and find a suitable buyer.

Estimates of future taxable earnings used to assess the realizable value of deferred tax assets

We use the asset and liability method of accounting for income taxes. Under this method, deferred income tax assets and liabilities arise from temporary differences between the tax bases of assets and liabilities and their carrying amounts reported in the financial statements. Deferred income tax assets also reflect the benefit of unutilized tax losses that can be carried forward to reduce income taxes in future years. Such method requires the exercise of significant judgment in determining whether or not it is more likely than not our deferred tax assets are probable of recovery from taxable income of future yearsmay be realized and, therefore, can be recognized in the financial statements. Also, estimates are required to determine the expected timing upon which tax assets will be realized and upon which tax liabilities will be settled. We assess the ability to recover our deferred tax assets every quarter and concluded that a valuation allowance was required against our deferred tax assets at December 31, 20212023 of $17.3$34.5 million (2020(2022 - $5.3$29.8 million).

Tax interpretations, regulations, and legislation in the various jurisdictions in which the Company and its subsidiariessubsidiary operate

The determination of our provision for income taxes requires significant judgment, the use of estimates and the interpretation and application of complex tax laws. Our provision for income taxes reflects a combination of income earned and taxed in the various U.S. federal and state, and Canadian federal and provincial, jurisdictions. Jurisdictional tax law changes, increases or decreases in permanent differences between book and tax items, accruals or adjustments of accruals for tax contingencies or valuation allowances, and the change in the mix of earnings from these taxing jurisdictions all affect the overall effective tax rate.

We have no liability for uncertain tax positions. However, should we accrue for such liabilities, when and if they arise in the future, we will recognize interest and penalties associated with uncertain tax positions as part of our income tax provision.

45


Estimates of the fair value of stock awards, including whether the performance criteria will be met and measurement of the ultimate payout amount

We use a fair-value based approach for measuring stock-based compensation and record compensation expense over an award’s vesting period based on the award’s fair value at the date of grant. Our awards vest based on service conditions, and compensation


expense is recognized on a straight-line basis. Stock-based compensation expense is recognized only for those awards that ultimately vest.

Estimates of ability and timeliness of customer payments of accounts receivable

Our expected credit loss reflects reserves for customer receivables to reduce receivables to amounts expected to be collected. Management uses significant judgment in estimating expected credit losses. In estimating the Company’s current estimate of expected credit losses, management considers historical credit loss experience as well as forward- lookingforward-looking information in order to establish rates for each class of financial receivable with similar risk characteristics. While we believe these processes effectively address our exposure for doubtful accounts and credit losses which have historically been within expectations, changes in the economy, industry, or specific customer conditions may require adjustments to the expected credit loss. We have a contract with a trade credit insurance provider, whereby a portion of our trade receivables are insured. The trade credit insurance provider determines the coverage amount, if any, on a customer-by-customer basis. Based on our trade receivables balance as at December 31, 20212023 and 2020,2022, approximately 90%93% and 84%77%, respectively, of that balance was covered by the trade credit insurance provider.

At December 31, 2021,2023, we had an allowance for expected credit loss of $0.1 million (2020(2022 - $0.6$0.1 million).

Recent Accounting Pronouncements

Please refer to Note 3 to our Consolidated Financial Statements presented elsewhere in this Annual Report.

46


Item 7A. Quantitative and Qualitative Disclosures About Market Risk.


Item 7A.

Quantitative and Qualitative Disclosures About Market Risk.

Our financial assets and liabilities consist primarily of cash and cash equivalents, restricted cash, trade and accrued receivables, other receivables, long-term deposits and long-term receivables, accounts payable and accrued liabilities, other liabilities, lease liabilities and long-term debt and accrued interest. We are exposed to market, credit and liquidity risks associated with financial assets and liabilities. We currently do not use financial derivatives to reduce exposures from changes in foreign exchange rates, commodity prices, or interest rates. We do not hold or use any derivative instruments for trading or speculative purposes. Our Board of Directors has responsibility for the establishment and approval of overall risk management policies, including those related to financial instruments. Management performs continuous assessments to ensure that all significant risks related to financial instruments are reviewed and addressed in light of changes to market conditions and operating activities.

Credit risk

Our principal financial assets are cash and cash equivalents, restricted cash, trade and tradeaccrued receivables and other receivables.

Our credit risk is primarily concentrated in our trade and accrued receivables as we do not believe that we are exposed to any significant credit risk related to our cash and cash equivalents, other receivables and restricted cash balances. The amounts disclosed in the consolidated balance sheet for trade and accrued receivables and other receivables are net of allowances for doubtful accounts. Allowances are provided for the Company’s current estimate of all expected credit losses using the lifetime expected credit loss model. As at December 31, 2023 and 2022, our allowance was $0.1 million. In order to manage and assess our risk, management maintains credit policies that include regular review of credit limits of individual receivables and systematic monitoring of aging of trade receivables and the financial wellbeing of our customers. In addition, we acquired trade credit insurance effective April 1, 2020. At December 31, 2021,2023, approximately 90%93% of our trade accounts receivable are insured, relating to accounts receivables from counterparties deemed creditworthy by the insurer and excluding accounts receivable from government entities, that have arisen since April 1, 2020, when the trade credit insurance became effective. Our trade balances are spread over a broad DistributionConstruction Partner base, which is geographically dispersed. No DistributionOne Construction Partner accountsaccounted for greater than 10% of revenue.revenue in 2023 (2022- none). In addition, and where possible, we collect a 50% deposit on sales, excluding government and certain other clients.

The overall change and uncertainty in the economy as a result of the COVID-19 pandemic had caused us to increase our expectation of credit losses during the first quarter of 2020, and additionally, we believe the COVID-19 pandemic has affected the ability of certain Distribution Partners and other customers to pay amounts owed or owing to DIRTT due to the impact of local shutdowns on businesses in certain markets. During the year ended December 31, 2021, we decreased our provision for expected credit losses by $0.5 million to $0.1 million which was related to an uncollectable amount written off during 2021.

Market risk

Market risk is the risk that changes in market prices, such as interest rates and foreign currency exchange rates, will affect our income or the value of the financial instruments held.

Foreign exchange risk

Historically, theThe majority (approximately 80%85% to 88%90%) of our revenue is collected in U.S. dollars, and approximately 45%40% of our costs are also incurred in U.S. dollars. Most other revenue and costs are denominated in Canadian dollars. As a result, we are exposed to fluctuations in the U.S. dollar against the Canadian dollar, which could have a positive or negative impact on our revenue and costs. The recent weakeningstrengthening of the U.S. dollar versus the Canadian dollar in 2023 has had a negativemarginally positive impact on results because reported cost reductionscosts are lesslower than reported revenue reductions.revenue.

47


Our financial instruments are exposed primarily to fluctuations in the Canadian dollar. The following table details our exposure to currency risk at the reporting dates and a sensitivity analysis to changes in currency. The sensitivity analysis includes Canadian dollar-denominated monetary items and adjusts their translation at period end for their respective change in the Canadian dollar. For the respective weakening of the Canadian dollar, there would be an equal and opposite impact on net loss and comprehensive loss.


Effect of net


loss and


comprehensive


loss for the


Amount


Change in


year ended


(C$ in thousands)


Currency (%)


December 31, 2023


Cash and cash equivalents


1,623


10

%


162


Restricted cash


153


10

%


15


Trade and accrued receivables


2,538


10

%


254


Other receivables


575


10

%


58


Other assets


158


10

%


16


Accounts payable and accrued liabilities


16,348


10

%


1,635


Other liabilities


2,048


10

%


205


Current portion of long-term debt and accrued interest


105


10

%


11


Long-term debt


72,560


10

%


7,256


Total


96,108


10

%


9,612


Effect of net


loss and


comprehensive


loss for the


Amount


Change in


year ended


(C$ in thousands)


Currency (%)


December 31, 2021


Cash and cash equivalents


30,407


10

%


3,041


Trade and other receivables


4,402


10

%


440


Long-term deposits and long-term receivables


1,723


10

%


172


Accounts payable and accrued liabilities


(14,172

)


10

%


(1,417

)

Other liabilities


(1,519

)


10

%


(152

)

Lease liabilities


(5,785

)


10

%


(579

)

Long-term debt and accrued interest


(74,769

)


10

%


(7,477

)

Total


(59,713

)


(5,972

)

Commodity price risk

We consume raw materials such as aluminum, hardware, wood and veneer, timber, plastic, electrical wiring and components, paint and powder, and fabric and vinyl. While aluminum represents the largest component of our raw materials’ expenditures, overall aluminum spend comprises only approximately 11%9% of product revenues and, therefore, absolute exposure to price fluctuations has a minimal impact on profitability.

Interest rate risk

OnIn February 2021, we entered into the RBC Facility. On February 9, 2023, the Company entered into the Extended RBC Facility. The Extended RBC Facility replacedhas a maximum borrowing base of C$15 million and a one-year term. Interest is calculated as at the Previous RBC Facility (as defined below)  that was entered intoCanadian or U.S. prime rate plus 75 basis points or at the Canadian Dollar Offered Rate or LIBOR plus 200 basis points. We did not draw on July 19, 2019the facilities during 2021, 2022 or 2023 and that had no amounts outstanding at December 31, 2020. An increase in overallwere, therefore, not exposed to any interest rates by 0.5% would have increased interest expense related to these items and decreased net loss and comprehensive loss by $nil for 2021 and 2020. An equal decrease in rates would generate an equal amount of interest savings.rate risk.

The Company’s Leasing Facilities and Debentures bear interest at fixed interest rates and are therefore not subject to interest rate risk.

48


Item 8.Financial StatementsStatements and Supplementary Data.


INDEX

Page No.

Report of Independent Registered Public Accounting Firm (PCAOB ID 271)271)

44

Consolidated Balance Sheets, as at December 31, 20212023 and 20202022

51

45

Consolidated Statements of Operations and Comprehensive Loss for the years ended December 31, 2021, 20202023, 2022 and 20192021

52

46

Consolidated Statements of Changes in Shareholders’ Equity for the years ended December 31, 2021, 20202023, 2022 and 20192021

54

47

Consolidated Statements of Cash Flows for the years ended December 31, 2021, 20202023, 2022 and 20192021

55

48

Notes to the Consolidated Financial Statements

4956

49


Report of Independent Registered Public Accounting Firm

To the Shareholders and Board of Directors of DIRTT Environmental Solutions Ltd.

Opinion on the Financial Statements

We have audited the accompanying consolidated balance sheets of DIRTT Environmental Solutions Ltd. and its subsidiaries (together, the Company) as of December 31, 20212023 and 2020,2022, and the related consolidated statements of operations and comprehensive loss, changes in shareholders’ equity and cash flows for each of the three years in the period ended December 31, 2021,2023, including the related notes (collectively referred to as the consolidated financial statements). In our opinion, the consolidated financial statements present fairly, in all material respects, the financial position of the Company as of December 31, 20212023 and 2020,2022, and the results of its operations and its cash flows for each of the three years in the period ended December 31, 20212023 in conformity with accounting principles generally accepted in the United States of America.

Basis for Opinion

These consolidated financial statements are the responsibility of the Company’s management. Our responsibility is to express an opinion on the Company’s consolidated financial statements based on our audits. We are a public accounting firm registered with the Public Company Accounting Oversight Board (United States) (PCAOB) and are required to be independent with respect to the Company in accordance with the U.S. federal securities laws and the applicable rules and regulations of the Securities and Exchange Commission and the PCAOB.

We conducted our audits of these consolidated financial statements in accordance with the standards of the PCAOB. Those standards require that we plan and perform the audit to obtain reasonable assurance about whether the consolidated financial statements are free of material misstatement, whether due to error or fraud. The Company is not required to have, nor were we engaged to perform, an audit of its internal control over financial reporting. As part of our audits we are required to obtain an understanding of internal control over financial reporting but not for the purpose of expressing an opinion on the effectiveness of the Company’s internal control over financial reporting. Accordingly, we express no such opinion.

Our audits included performing procedures to assess the risks of material misstatement of the consolidated financial statements, whether due to error or fraud, and performing procedures that respond to those risks. Such procedures included examining, on a test basis, evidence regarding the amounts and disclosures in the consolidated financial statements. Our audits also included evaluating the accounting principles used and significant estimates made by management, as well as evaluating the overall presentation of the consolidated financial statements. We believe that our audits provide a reasonable basis for our opinion.

  /s/

/s/ PricewaterhouseCoopers LLP

Chartered Professional Accountants

Calgary, Canada

February 23, 2022

Chartered Professional Accountants

Calgary, Alberta, Canada

February 21, 2024

We have served as the Company’s auditor since 2017.

PricewaterhouseCoopers LLP

111-5th Avenue SW, Suite 3100, Calgary, Alberta, Canada T2P 5L3

T: +1 403 509 7500, F: +1 403 781 1825

“PwC” refers to PricewaterhouseCoopers LLP, an Ontario limited liability partnership.


50


DIRTT Environmental Solutions Ltd.

Consolidated Balance Sheets

(Stated in thousands of U.S. dollars)


As At

December 31,


As at

December 31,


As at December 31,


As at December 31,


2021


2020


2023


2022


ASSETS


Current Assets


Cash and cash equivalents


60,313


45,846


24,744


10,821


Restricted cash


3,095


-


355


3,418


Trade and other receivables, net of expected credit losses of $0.1

million at December 31, 2021 and $0.6 million at December 31, 2020


17,540


18,953


Trade and accrued receivables, net of expected credit losses of
$
0.1 million at December 31, 2023 and at December 31, 2022


15,787


13,930


Other receivables


484


7,880


Inventory


18,457


15,978


16,577


22,251


Prepaids and other current assets


4,399


4,068


4,023


3,825


Assets held for sale


1,555


-


Total Current Assets


103,804


84,845


63,525


62,125


Property, plant and equipment, net


51,697


49,847


25,077


41,522


Capitalized software, net


7,395


8,344


2,450


4,406


Operating lease right-of-use assets, net


30,880


33,643


29,813


30,490


Goodwill


-


1,449


Other assets


5,663


5,016


3,452


5,110


Total Assets


199,439


183,144


124,317


143,653


LIABILITIES


Current Liabilities


Accounts payable and accrued liabilities


22,751


20,350


19,880


19,881


Other liabilities


2,379


2,779


2,482


2,056


Customer deposits and deferred revenue


2,420


1,819


5,290


4,866


Current portion of long-term debt and accrued interest


3,323


898


841


3,306


Current portion of lease liabilities


6,214


5,503


5,255


5,889


Total Current Liabilities


37,087


31,349


33,748


35,998


Deferred tax liabilities, net


-


414


Long-term debt


67,319


5,069


55,267


62,129


Long-term lease liabilities


27,267


29,781


28,201


27,534


Total Liabilities


131,673


66,613


117,216


125,661


SHAREHOLDERS’ EQUITY


Common shares, unlimited authorized without par value, 85,345,433 issued

and outstanding at December 31, 2021 and 84,681,364 at December 31, 2020


181,782


180,639


Common shares, unlimited authorized without par value, 105,377,667 issued
and outstanding at December 31, 2023 and
97,882,844 at December 31, 2022


196,128


191,347


Additional paid-in capital


13,200


10,175


7,954


9,023


Accumulated other comprehensive loss


(15,916

)


(17,018

)


(16,125

)


(16,106

)

Accumulated deficit


(111,300

)


(57,265

)


(180,856

)


(166,272

)

Total Shareholders’ Equity


67,766


116,531


7,101


17,992


Total Liabilities and Shareholders’ Equity


199,439


183,144


124,317


143,653


Refer to Note 1720 for commitmentsCommitments.

Refer to Note 14 and Note 23 for Subsequent Events.

The accompanying notes are an integral part of these consolidated financial statements.


51


DIRTT Environmental Solutions Ltd.

Consolidated Statements of Operations and Comprehensive Loss

(Stated in thousands of U.S. dollars, except per share data)


For the Year Ended December 31,


For the Year Ended December 31,


2021


2020


2019


2023


2022


2021


Product revenue


143,000


166,689


240,659


176,919


166,256


143,000


Service revenue


4,593


4,818


7,076


5,012


5,905


4,593


Total revenue


147,593


171,507


247,735


181,931


172,161


147,593


Product cost of sales


118,525


113,445


153,128


119,728


140,058


120,281


Costs of under-utilized capacity


1,756


2,010


2,240


Service cost of sales


3,852


2,769


5,943


2,661


3,943


3,852


Total cost of sales


124,133


118,224


161,311


122,389


144,001


124,133


Gross profit


23,460


53,283


86,424


59,542


28,160


23,460


Expenses


Sales and marketing


31,041


28,049


33,939


25,235


26,950


31,041


General and administrative


30,595


26,663


27,645


21,655


25,462


30,595


Operations support


9,372


9,381


11,037


7,832


9,498


9,372


Technology and development


8,234


8,111


7,818


5,820


7,555


8,234


Stock-based compensation


4,713


2,351


3,876


2,306


4,277


4,713


Reorganization


3,009


13,461


-


Impairment charge on Rock Hill Facility


8,716


-


-


Goodwill impairment


1,443


-


-


-


-


1,443


Reorganization


-


-


4,560


Related party expense


1,524


-


-


Total operating expenses


85,398


74,555


88,875


76,097


87,203


85,398


Operating loss


(61,938

)


(21,272

)


(2,451

)


(16,555

)


(59,043

)


(61,938

)

Government subsidies


11,455


12,721


-


236


7,765


11,455


Foreign exchange loss


(335

)


(576

)


(1,324

)

Gain on sale of software and patents


7,130


-


-


Foreign exchange (loss) gain


(626

)


1,445


(335

)

Interest income


77


238


529


490


51


77


Interest expense


(3,131

)


(305

)


(131

)


(4,927

)


(5,160

)


(3,131

)


8,066


12,078


(926

)


2,303


4,101


8,066


Loss before tax


(53,872

)


(9,194

)


(3,377

)

Net loss before tax


(14,252

)


(54,942

)


(53,872

)

Income taxes


Current tax expense (recovery)


210


(3,521

)


1,064


Deferred tax expense (recovery)


(414

)


5,625


(45

)

Current income tax expense


332


21


210


Deferred income tax recovery


-


-


(414

)


(204

)


2,104


1,019


332


21


(204

)

Net loss


(53,668

)


(11,298

)


(4,396

)

Loss per share


Basic and diluted loss per share


(0.63

)


(0.13

)


(0.05

)

Net loss after tax


(14,584

)


(54,963

)


(53,668

)


Net loss per share


Net loss per share - basic and diluted


(0.13

)


(0.55

)


(0.55

)


Weighted average number of shares outstanding (in thousands)


Basic and Diluted


85,027


84,681


84,671


Basic and diluted


116,135


99,826


96,826


Consolidated Statement of ComprehensiveRefer to Note 22 for Related Party Transactions included in this statement.

The prior year comparatives have been revised in line with current year presentation - refer to Inventory in Note 10 and Net Loss


For the Year Ended December 31,


2021


2020


2019


Loss for the year


(53,668

)


(11,298

)


(4,396

)

Exchange differences on translation of foreign operations


1,102


1,010


4,064


Comprehensive loss for the year


(52,566

)


(10,288

)


(332

)

per share in Note 17.

The accompanying notes are an integral part of these consolidated financial statements.


52


DIRTT Environmental Solutions Ltd.

Consolidated StatementsStatement of Changes in Shareholders’ EquityComprehensive Loss

(Stated in thousands of U.S. dollars, except for share data)dollars)


For the Year Ended December 31,


2023


2022


2021


Net loss for the year


(14,584

)


(54,963

)


(53,668

)

Exchange differences on translation of foreign operations


(19

)


(190

)


1,102


Comprehensive loss for the year


(14,603

)


(55,153

)


(52,566

)


Accumulated


Number of


Additional


other


Total


Common


Common


paid-in


comprehensive


Accumulated


shareholders’


shares


shares


capital


income (loss)


deficit


equity


As at December 31, 2018


84,660,319


180,562


6,615


(22,092

)


(41,571

)


123,514


Issued on exercise of options


21,045


77


(1

)


-


-


76


Stock-based compensation


-


-


1,729


-


-


1,729


Foreign currency translation adjustment


-


-


-


4,064


-


4,064


Net loss for the year


-


-


-


-


(4,396

)


(4,396

)

As at December 31, 2019


84,681,364


180,639


8,343


(18,028

)


(45,967

)


124,987


Stock-based compensation


-


-


1,832


-


-


1,832


Foreign currency translation adjustment


-


-


-


1,010


-


1,010


Net loss for the year


-


-


-


-


(11,298

)


(11,298

)

As at December 31, 2020


84,681,364


180,639


10,175


(17,018

)


(57,265

)


116,531


Stock-based compensation


-


-


4,453


-


-


4,453


Issued on vesting of RSUs


664,069


1,143


(1,143

)


-


-


-


RSUs withheld to settle employee tax obligations


-


(285

)


-


(367

)


(652

)

Foreign currency translation adjustment


-


-


-


1,102


-


1,102


Net loss for the year


-


-


-


-


(53,668

)


(53,668

)

As at December 31, 2021


85,345,433


181,782


13,200


(15,916

)


(111,300

)


67,766


The accompanying notes are an integral part of these consolidated financial statements.


53


DIRTT Environmental Solutions Ltd.

Consolidated Statements of Cash FlowsChanges in Shareholders’ Equity

(Stated in thousands of U.S. dollars)dollars, except for share data)


For the Year Ended December 31,


2021


2020


2019


Cash flows from operating activities:


Net loss for the period


(53,668

)


(11,298

)


(4,396

)

Adjustments:


Depreciation and amortization


14,513


11,706


12,242


Stock-based compensation, net of settlements


4,248


2,351


202


Foreign exchange (gain) loss


112


746


345


Accretion of convertible debentures


352


-


-


Loss (gain) on disposal of property, plant and equipment


12


(46

)


53


Deferred income tax expense (recovery)


(414

)


5,625


(45

)

Goodwill impairment


1,443


-


-


Changes in operating assets and liabilities:


Trade and other receivables


1,452


6,067


21,025


Inventory


(2,449

)


1,638


1,667


Prepaid and other assets, current and long term


(1,132

)


(241

)


(873

)

Accounts payable and accrued liabilities


2,702


752


(17,379

)

Customer deposits and deferred revenue


601


(1,754

)


(4,276

)

Other liabilities


(213

)


(3,971

)


5,196


Accrued interest


948


-


-


Lease liabilities


283


910


(402

)

Net cash flows provided by (used in) operating activities


(31,210

)


12,485


13,359


Cash flows from investing activities:


Purchase of property, plant and equipment, net of accounts payable changes


(11,781

)


(16,597

)


(12,303

)

Capitalized software development expenditures


(2,340

)


(2,998

)


(2,604

)

Other asset expenditures


(496

)


(517

)


(848

)

Recovery of software development expenditures


461


674


511


Proceeds on sale of property, plant and equipment


18


46


55


Net cash flows used in investing activities


(14,138

)


(19,392

)


(15,189

)

Cash flows from financing activities:


Proceeds received on long-term debt


64,912


6,130


-


Repayment of long-term debt


(1,808

)


(406

)


(5,561

)

Employee tax payments on vesting of RSUs


(652

)


-


-


Cash received on exercise of options


-


-


77


Net cash flows provided by (used in) financing activities


62,452


5,724


(5,484

)

Effect of foreign exchange on cash, cash equivalents and restricted cash


458


(145

)


1,076


Net increase (decrease) in cash, cash equivalents and restricted cash


17,562


(1,328

)


(6,238

)

Cash, cash equivalents and restricted cash, beginning of period


45,846


47,174


53,412


Cash, cash equivalents and restricted cash, end of period


63,408


45,846


47,174


Supplemental disclosure of cash flow information:


Interest paid


(1,543

)


(103

)


(99

)

Income taxes (paid) received


433


1,817


(2,518

)


         The following table provides a reconciliation of cash, cash equivalents and restricted cash reported within the consolidated balance sheets.


For the Year Ended December 31,


2021


2020


2019


Cash and cash equivalents


60,313


45,846


47,174


Restricted cash


3,095


-


-


Total cash, cash equivalents and restricted cash


63,408


45,846


47,174


Accumulated


Number of


Additional


other


Total


Common


Common


paid-in


comprehensive


Accumulated


shareholders’


shares


shares


capital


loss


deficit


equity


As at December 31, 2020


84,681,364


180,639


10,175


(17,018

)


(57,265

)


116,531


Stock-based compensation


-


-


4,453


-


-


4,453


Issued on vesting of RSUs and Share Awards


664,069


1,143


(1,143

)


-


-


-


RSUs and Share Awards withheld to settle employee tax obligations


-


-


(285

)


-


(367

)


(652

)

Foreign currency translation adjustment


-


-


-


1,102


-


1,102


Net loss for the year


-


-


-


-


(53,668

)


(53,668

)

As at December 31, 2021


85,345,433


181,782


13,200


(15,916

)


(111,300

)


67,766


Stock-based compensation


-


-


3,943


-


-


3,943


Issued on vesting of RSUs and Share Awards


3,149,061


7,088


(7,088

)


-


-


-


RSUs and Share Awards withheld to settle employee tax obligations


-


-


(1,032

)


-


(9

)


(1,041

)

Issued for employee share purchase plan


720,901


296


-


-


-


296


Issued on private placement


8,667,449


2,181


-


-


-


2,181


Foreign currency translation adjustment


-


-


-


(190

)


-


(190

)

Net loss for the year


-


-


-


-


(54,963

)


(54,963

)

As at December 31, 2022


97,882,844


191,347


9,023


(16,106

)


(166,272

)


17,992


Stock-based compensation


-


-


1,713


-


-


1,713


Issued on vesting of RSUs and Share Awards


1,886,868


2,756


(2,756

)


-


-


-


Issued for employee share purchase plan


1,708,210


502


-


-


-


502


RSUs and Share Awards withheld to settle employee tax obligations


-


-


(26

)


-


-


(26

)

Issued to settle related party debt


3,899,745


1,523


-


-


-


1,523


Foreign currency translation adjustment


-


-


-


(19

)


-


(19

)

Net loss for the year


-


-


-


-


(14,584

)


(14,584

)

As at December 31, 2023


105,377,667


196,128


7,954


(16,125

)


(180,856

)


7,101


The accompanying notes are an integral part of these consolidated financial statements.


54


DIRTT Environmental Solutions Ltd.

Consolidated Statements of Cash Flows

(Stated in thousands of U.S. dollars)


For the Year Ended December 31,


2023


2022


2021


Cash flows from operating activities:


Net loss for the period


(14,584

)


(54,963

)


(53,668

)

Adjustments:


Depreciation and amortization


8,934


15,119


14,513


Impairment charge on Rock Hill Facility


8,716


-


-


Stock-based compensation, net of settlements


2,306


3,342


4,248


Foreign exchange loss (gain)


1,099


(1,813

)


112


Gain on sale of software and patents


(7,130

)


-


-


Loss (gain) on disposal of equipment


153


(133

)


12


Accretion of convertible debentures


698


676


352


Deferred income tax (recovery)


-


-


(414

)

Goodwill impairment


-


-


1,443


Changes in operating assets and liabilities:


Trade and accrued receivables


(1,833

)


(179

)


(2,118

)

Other receivables


7,406


(4,432

)


3,570


Inventory


5,961


(4,716

)


(2,449

)

Prepaid and other assets, current and long term


474


129


(1,132

)

Accounts payable and accrued liabilities


2,137


260


2,702


Other liabilities


(421

)


(109

)


(213

)

Customer deposits and deferred revenue


243


2,477


601


Current portion of long-term debt and accrued interest


(40

)


(149

)


948


Lease liabilities


702


231


283


Net cash flows provided by (used in) operating activities


14,821


(44,260

)


(31,210

)

Cash flows from investing activities:


Purchase of property, plant and equipment, net of accounts
    payable changes


(1,242

)


(2,394

)


(11,781

)

Capitalized software development expenditures


(1,794

)


(1,677

)


(2,340

)

Other asset expenditures


(398

)


(443

)


(496

)

Recovery of software development expenditures


127


263


461


Proceeds on sale of software and patents


10,950


-


-


Proceeds on sale of equipment


14


227


18


Net cash flows provided by (used in) investing activities


7,657


(4,024

)


(14,138

)

Cash flows from financing activities:


Proceeds received on long-term debt


-


647


64,912


Repayment of long-term debt


(11,579

)


(2,470

)


(1,808

)

Proceeds issued on private placement


-


1,990


-


Employee tax payments on vesting of RSUs


(26

)


(1,041

)


(652

)

Net cash flows (used in) provided by financing activities


(11,605

)


(874

)


62,452


Effect of foreign exchange on cash, cash equivalents and
    restricted cash


(13

)


(11

)


458


Net increase (decrease) in cash, cash equivalents and
    restricted cash


10,860


(49,169

)


17,562


Cash, cash equivalents and restricted cash, beginning of year


14,239


63,408


45,846


Cash, cash equivalents and restricted cash, end of year


25,099


14,239


63,408


Supplemental disclosure of cash flow information:


Interest paid


(3,977

)


(4,423

)


(1,543

)

Income taxes received


4


3,212


433


         The following table provides a reconciliation of cash, cash equivalents and restricted cash reported within the consolidated balance sheets.


For the Year Ended December 31,


2023


2022


2021


Cash and cash equivalents


24,744


10,821


60,313


Restricted cash


355


3,418


3,095


Total cash, cash equivalents and restricted cash


25,099


14,239


63,408


The accompanying notes are an integral part of these consolidated financial statements.

55


DIRTT Environmental Solutions Ltd.

Notes to the Consolidated Financial Statements

(Amounts stated in thousands of U.S. dollars unless otherwise stated)

1. GENERAL INFORMATION

DIRTT Environmental Solutions Ltd. and its subsidiariessubsidiary (“DIRTT,”DIRTT”, the “Company,”“Company”, “we” or “our”) is a leading technology-driven manufacturerleader in industrialized construction. DIRTT’s system of highly customized interiors. DIRTT combines itsphysical products and digital tools empowers organizations, together with construction and design leaders, to build high-performing, adaptable, interior environments. Operating in the workplace, healthcare, education, and public sector markets, DIRTT’s system provides total design freedom, and greater certainty in cost, schedule, and outcomes.

DIRTT’s proprietary 3D design configuration and manufacturingintegration software, ICE® software (“ICE” or “ICE Software”software”) with integrated in-house, translates the vision of architects and designers into a 3D model that also acts as manufacturing of its innovative prefabricated interior construction solutions and an extensive distribution partners network (“Distribution Partners”). ICE provides accurate design, drawing, specification, pricing and manufacturing process information, allowing rapid production of high-quality custom solutions using fewer resources than traditional manufacturing methods.information. ICE is also licensed to unrelated companies and DistributionConstruction Partners of the Company. As of May 9, 2023, Armstrong World Industries, Inc. (“AWI”) owns a 50% interest in the rights, titles and interest in certain intellectual property rights in a portion of the ICE Software that is used by AWI.

DIRTT is incorporated under the laws of the province of Alberta, Canada, its headquarters is located at 7303 – 30th Street S.E., Calgary, AB, Canada T2C 1N6 and its registered office is located at 4500, 855 – 2nd Street S.W., Calgary, AB, Canada T2P 4K7. DIRTT’s common shares trade on the Toronto Stock Exchange under the symbol “DRT” and. Effective October 12, 2023, DIRTT’s common shares ceased to trade on The Nasdaq Global Select Market (“Nasdaq”)Capital Markets. DIRTT’s common shares are quoted on the OTC Markets on the “OTC Pink Tier” under the symbol “DRTT”“DRTTF”.

2. SIGNIFICANT ACCOUNTING POLICIES

Basis of presentation

These consolidated financial statements (“Financial Statements”), including comparative figures, have been prepared in accordance with accounting principles generally accepted in the United States of America (“GAAP”).

In these Financial Statements, unless otherwise indicated, all dollar amounts are expressed in United States (“U.S.”) dollars. DIRTT’s financial results are consolidated in Canadian dollars, the Company’s functional currency, and the Company has adopted the U.S. dollar as its reporting currency. All references to US$ or $ are to U.S. dollars and references to C$ are to Canadian dollars.

Principles of consolidation

The Financial Statements include the accounts of DIRTT and its subsidiaries.subsidiary. All intercompany balances, income and expenses, unrealized gains and losses and dividends resulting from intercompany transactions have been eliminated upon consolidation.

Basis of measurement

These Financial Statements have been prepared on the historical cost convention except for certain financial instruments, assets held for sale and stock-based compensation that are measured at fair value, as explained in the accounting policies below. Historical cost is generally based on the fair value of the consideration given in exchange for assets.

Use of estimates

The preparation of the Financial Statements in conformity with GAAP requires management to make estimates and assumptions that affect the reported amounts of assets, liabilities and the disclosure of contingent liabilities at the date of the financial statements and reported amounts of revenues and expenses during the reporting period. Such estimates primarily relate to unsettled transactions and events as of the date of the Financial Statements. Estimates are based on historical data and experience, as well as various other factors that management considers reasonable under the circumstances. Actual outcomes can differ from these estimates.

Significant estimates and assumptions made by management include:

Estimates of ability and timeliness of customer payments of trade receivables;
Estimates of useful lives of depreciable assets as well as the fair value of long-term assets and future cash flows used for impairment calculations;
Determining the fair value less costs to sell of the assets held for sale;

56


Estimates of future taxable earnings used to assess the realizable value of deferred tax assets and the ability to recognize a deferred tax asset;
Tax interpretations, regulations and legislation in the various jurisdictions in which the Company and its subsidiary operate;
Estimates of the fair value of stock awards, including whether the performance criteria will be met and measurement of the ultimate payout amount; and
Estimates of liabilities associated with the potential and amount of warranty, legal claims and other contingencies.

Segments

Estimates of ability and timeliness of customer payments of accounts receivable;

Estimates of useful lives of depreciable assets as well as the fair value of long-term assets and future cash flows used for impairment calculations;

Estimates of future taxable earnings used to assess the realizable value of deferred tax assets;

Tax interpretations, regulations and legislation in the various jurisdictions in which the Company and its subsidiaries operate;


Estimates of the fair value of stock awards, including whether the performance criteria will be met and measurement of the ultimate payout amount; and

Estimates of liabilities associated with the potential and amount of warranty, legal claims and other contingencies.

Segments

Management has determined that DIRTT has 1one operating segment. The Company’s chief executive officer, who is DIRTT’s chief operating decision maker, reviews financial information on a consolidated and aggregate basis, together with certain operating metrics principally, to make decisions about how to allocate resources and to measure the Company’s performance.

Foreign currency translation

DIRTT Environmental Solutions Ltd. is a Canadian company and its functional currency is the Canadian dollar. DIRTT’s wholly owned subsidiary is domiciled in the United States and its functional currency is the U.S. dollar.

Assets and liabilities denominated in foreign currencies, other than those held through foreign subsidiaries, are translated into the transacting company’s functional currency at the year-end exchange rate for monetary items, and at the historical exchange rates for non-monetary items. Foreign currency revenues and expenses are translated at the exchange rates in effect on the dates of the related transactions. Foreign exchange gains and losses, other than those arising from the translation of the Company’s net investments in its foreign subsidiaries,subsidiary, are included in income.

The accounts of the Company’s U.S. dollar subsidiary is translated into Canadian dollars, and the Financial Statements are translated into U.S. dollars for financial statement presentation. Assets and liabilities are translated using year-end exchange rates, and revenues, expenses, gains and losses are translated using average monthly exchange rates. Foreign exchange gains and losses arising from the translation of the Company’s assets and liabilities are included in “comprehensive loss for the year”.

Cash and cash equivalents and restricted cash

Cash and cash equivalents include cash on hand held at banks and cash equivalents, which are defined as highly liquid investments with original maturities of three months or less. Restricted cash is a reserve account not available for immediate or general business use and is required when certain requirements are not met under the terms of the Company’s senior secured credit facility (as defined in Note 12)14).

Trade and other receivables, net of expected credit losses

Accounts receivable are recorded at the invoiced amount, do not require collateral and do not bear interest. The Company estimates its allowance for doubtful accounts using the current expected credit loss (“CECL”) methodology, which is designed to capture the Company’s current estimate of all expected credit losses.

Inventory

Inventory

Inventory is comprised of raw materials and work in progress. The Company does not typically carry a significant amount of finished goods inventory. Inventory is valued at the lower of weighted average cost and net realizable value. Net realizable value is based on an item’s usability in the manufacturing of the Company’s products. The Company records an allowance for obsolescence when the net realizable value of inventory items declines below weighted average cost, netcost. Net realizable value is determined based on current market prices for inventory less the estimated cost to sell. Work in progress is valued at an estimate of cost, including attributable overheads, based on stage of completion.

Fixed production overheads are allocated to inventory on the basis of normal capacity of the production facilities. In periods where production levels are abnormally low, unallocated overheads are separately recognized as an expense in the period in which they are incurred.

57


Assets held for sale

LeasesThe Company classifies an asset group (“asset”) as held for sale in the period that (i) it has approved and committed to a plan to sell the asset, (ii) the asset is available for immediate sale in its present condition, (iii) an active program to locate a buyer and other actions required to sell the asset have been initiated, (iv) the sale of the asset is probable and transfer of the asset is expected to qualify for recognition as a completed sale within one year (subject to certain events or circumstances), (v) the asset is being actively marketed for sale at a price that is reasonable in relation to its current fair value, and (vi) it is unlikely that significant changes to the plan will be made or that the plan will be withdrawn. The Company initially and subsequently measures a long-lived asset that is classified as held for sale at the lower of its carrying value or fair value less any costs to sell. Any loss resulting from this measurement is recognized in the consolidated statement of operations and comprehensive loss in the period in which the held for sale criteria are met. Upon designation as an asset held for sale, the Company stops recording depreciation expense on the asset.

The Company assesses the fair value of assets held for sale less any costs to sell at each reporting period until the asset is no longer classified as held for sale.

Leases

The Company categorizes leases at their inception as either operating or finance leases. Leases where the Company assumes substantially all of the rewards or ownership and leases where ownership is transferred at the end of the lease term, or by way of a bargain purchase option, are classified as finance leases. Upon initial recognition, the leased asset is measured at an amount equal to the lower of its fair value and the present value of the minimum lease payments. Lease payments are apportioned between finance


charges and reduction of the lease liability, so as to achieve a constant rate of interest on the balance of the liability. Finance charges are recognized in the statement of operations.

The Company’s Leasing Facilities (as defined in Note 5)8) are accounted for as finance leases as ownership of the equipment is expected to return to the Company at the end of the lease term. These transactions are not accounted for as a sale of the underlying equipment as the Company continues to control the equipment.

For leases categorized as operating, the Company determines if an arrangement is a lease or contains a lease element at inception. The arrangement is a lease if it conveys the right to the Company to control the use of identified property, plant, or equipment for a period of time in exchange for consideration. Operating leases are separately disclosed as operating lease right-of-use (“ROU”) assets, with a corresponding lease liability split between current and long-term components on the balance sheet. Operating leases with an initial term of 12 months or less are not included on the balance sheet.

The Company recognizes lease expense for these leases on a straight-line basis over the lease term. ROU assets represent the right to use an underlying asset for the lease term and operating lease liabilities represent the obligation to make lease payments arising from the lease. Operating lease ROU assets and liabilities are recognized at commencement date based on the present value of lease payments over the lease term.

Property, plant and equipment

Property, plant and equipment are recorded at cost, including direct costs, attributable indirect costs and carrying costs, less accumulated depreciation and any accumulated impairment losses. Expenditures for repairs and maintenance are expensed as incurred, while renewals and betterments are capitalized.

Depreciation is charged to the consolidated statement of operations on a straight-line basis over the estimated useful lives of the assets. The estimated useful lives of the Company’s property, plant and equipment are as follows:

Building

25 years

Manufacturing equipment

10 years

Leasehold improvements

Over term of lease (1 (1 to 1014 years)

Office equipment

5 years

Tooling and prototypes

4 years

Computer equipment

3 years

Vehicles

3 years

When assets are disposed of or retired, the cost and accumulated depreciation and impairment losses are removed from the respective accounts and any resulting gain or loss is reflected in operating expenses.

58


Capitalized software costs

The Company capitalizes costs related to internally developed software during the application development stage when (i) the preliminary project stage is completed, (ii) management has authorized further funding for the completion of the project, and (iii) it is probable that the project will be completed and performed as intended. Capitalized costs includesinclude costs of personnel and related expenses for employees and third parties directly attributable to the projects. Capitalization of these costs ceases once the project is substantially complete and the software is ready for its intended purpose. Costs incurred for significant upgrades and enhancements are also capitalized. Costs related to preliminary project activities and post implementation activities, including training, maintenance and minor modifications or enhancements are expensed as incurred. Capitalized software costs are amortized on a straight-line basis over the estimated useful life of the developed asset, which is generally three to five years.years. Management evaluates the useful lives of these assets on an annual basis and tests for impairment whenever events or changes in circumstances occur that could impact the recoverability of the assets.

Software development is considered internal-use as it is used to design and sell the DIRTT products and is not included in the end client’s product. Revenues received from DistributionConstruction Partners for ICE Software are recognized as revenues as they are considered an element of the product sale. Any incidental third-party revenues received for the ICE Software are credited against capitalized software costs. The Company follows this accounting policy for cloud computing arrangements that are considered a service contract, however, these projects are capitalized to prepaids and other assets on the balance sheet and are expensed as an operating cost, as opposed to amortization, over the expected term of the software service contract. The Company adopted this amendment on January 1, 2020 using the prospective transition approach and classified $0.7 million as other assets on the consolidated balance sheet for the year ended December 31, 2021.


Impairment of long-lived assets

Management evaluates the recoverability of the Company’s property, plant and equipment, capitalized software costs and ROU assets when events or changes in circumstances indicate a potential impairment exists. Events and changes in circumstances considered by the Company in determining whether the carrying value of long-lived assets may not be recoverable include, but are not limited to, significant changes in performance relative to expected operating results, significant changes in the use of the assets, significant negative industry or economic trends, and changes in the Company’s business strategy. Impairment testing is performed at an asset level that represents the lowest level for which identifiable cash flows are largely independent of the cash flows of other assets and liabilities (an “asset group”). In determining if impairment exists, the Company estimates the undiscounted cash flows to be generated from the use and ultimate disposition of the asset group. If impairment is indicated based on a comparison of the assets’ carrying values and the undiscounted cash flows, the impairment loss is measured as the amount by which the carrying amount of the assets exceeds the fair value of the assets.

Goodwill

Goodwill represents the excess of the purchase price over the fair value of net assets acquired and liabilities assumed in a business combination. Goodwill is tested for impairment at the reporting unit level at least annually or whenever changes in circumstances indicate that goodwill might be impaired. The Company early adopted ASU 2017-04 in 2019, which simplified the subsequent measurement of goodwill by eliminating the second step of the goodwill impairment test.

The carrying value of goodwill, which is not amortized, is assessed for impairment annually in the fourth quarter of each year, or more frequently as economic events dictate. The Company has the option of performing an assessment of certain qualitativefactors to determine if it is more likely than not that the fair value of a reporting unit is less than its carrying value. If goodwill is determined to be impaired, the impairment charge that would be recognized is based on the amount by which a reporting unit’s carrying value exceeds its fair value, not to exceed the carrying value of goodwill.

Convertible Debentures

The Company accounts for convertible debentures as liabilities. Embedded features included in the convertible debentures that require bifurcation are accounted for separately. Costs incurred directly related to the issuance of convertible debentures are presented as a direct deduction against the carrying amount of the convertible debentures and are amortized to interest expense using the effective interest method.

Income taxes

Income tax expense is comprised of current and deferred tax. Income tax is recognized in the consolidated statement of operations and comprehensive income (loss)loss except to the extent it relates to items recognized directly in equity.

Current tax

Current tax expense is based on the results for the year, adjusted for items that are not taxable or not deductible. Current tax is calculated using tax rates and laws that were enacted at the end of the reporting period. Management periodically evaluates positions taken in tax returns with respect to situations in which applicable tax regulation is subject to interpretation. Provisions are established where appropriate on the basis of amounts expected to be paid to the tax authorities.

Deferred tax

Deferred tax is recognized, using the liability method, on temporary differences arising between the tax bases of assets and liabilities and their carrying amounts in the consolidated balance sheet. Deferred income tax assets and liabilities are determined based on differences between the financial reporting and tax bases of assets and liabilities using enacted tax rates and laws that will be in effect when the differences are expected to reverse.

59


The effect of a change in income tax rates on deferred income tax assets and liabilities is recognized in income in the period during which the change occurs.

When appropriate, the Company records a valuation allowance against deferred tax assets to reflect that these tax assets may not be realized. In determining whether a valuation allowance is appropriate, the Company considers whether it is more likely than not


that all or some portion of the Company’s deferred tax assets will not be realized, based on management’s judgment using available evidence about future events.

At times, tax benefits claims may be challenged by a tax authority. Tax benefits are recognized only for tax positions that are more likely than not sustainable upon examination by tax authorities. The amount recognized is measured as the largest amount of benefit that is greater than 50%50% likely to be realized upon settlement. A liability for “unrecognized tax benefits” is recorded for any tax benefits claimed in the Company’s tax returns that do not meet these recognition and measurement standards.

Revenue recognition

The Company accounts for revenue in accordance with topic 606, Revenue from Contracts with Customers, (“ASC 606”) and Subtopic 340-40, Other Assets and Deferred Costs – Contracts with Customers. Under ASC 606, an entity recognizes revenue in a manner that reflects the transfer of promised goods or services to customers in an amount which the entity expects to be entitled in exchange for those goods or services.

The Company recognizes revenue upon transfer of control of promised goods or services to customers at the transaction price, an amount that reflects the consideration the Company expects to receive in exchange for those goods or services. Transaction price is calculated as selling price net of variable consideration which may include estimates for sales incentives related to current period product revenue. Revenue is measured at the fair value of the consideration received or receivable, after discounts, rebates and sales taxes or income taxes and duties.

Product sales

The Company recognizes revenue upon transfer of control of products to the customer, which typically occurs upon shipment. The Company’s main performance obligation to customers is the delivery of products in accordance with purchase orders. Each purchase order defines the transaction price for the products purchased under the arrangement. DistributionConstruction Partners typically sell DIRTT product to end clients and issue purchase orders to the Company to manufacture the product. DistributionConstruction Partners utilize ICE licenses to sell DIRTT products, theproducts. The ICE licenses sold to DistributionConstruction Partners are not considered a separate performance obligation as they are not distinct, and ICE license revenue is recognized in conjunction with product sales. The DistributionConstruction Partner ICE Software revenue is recognized over the license period.

The Company’s standard sales terms are Free On Board (“FOB”) shipping point, which comprise the majority of sales. The Company usually requires a 50%50% progress payment on receipt of certain orders, excluding certain government orders or in some special contractual situations. Customer deposits received are recognized as a liability on the balance sheet until revenue recognition criteria is met. At the point of shipment, the customer is generally required to pay the balance of the sales price within 30 days. The Company’s sales arrangements do not have any material financing components. In addition, the Company’s customer arrangements do not produce contract assets that are material to its consolidated financial statements.

The Company provides sales commissions to internal and external sales representatives which are earned in the period in which revenue is recognized.

The Company accounts for product transportation revenue and costs as fulfillment activities and presentpresents the associated costs in costs of goods sold in the period in which the Company sells its product.

Contracts containing multiple performance obligations

The Company offers certain arrangements whereby a customer can purchase products and installation together, which are generally capable of being distinct and accounted for as separate performance obligations. Where multiple performance obligations exist, the Company determines revenue recognition by (1) identifying the contract with the customer, (2) identifying the performance obligation in the contract, (3) determining the transaction price, (4) allocating the transaction price to the performance obligations based on the relative standalone selling prices, typically based on cost plus a reasonable margin, and (5) recognizing revenue as the performance obligations are satisfied.

60


Installation and other services

The Company provides installation and other services for certain customers as a distinct performance obligation. Revenue from installation services is recognized over time as the service is performed.


Principal vs Agent Considerations

The Company evaluates the presentation of revenue on a gross vs. net basis based on whether it acts as a principal by controlling the product or service sales to customers. In certain instances, the Company facilitates contracting of certain sales on behalf of DistributionConstruction Partners. The Company records these revenues on a gross basis when the Company is obligated to fulfill the service and has the risk associated with service delivery. The Company records these revenues on a net basis when the DistributionConstruction Partner has the obligation to fulfill the services and has the risk associated with service delivery.

DistributionConstruction Partner rebates

Rebates to DistributionConstruction Partners (“Partner Rebates”) are accrued for and recognized as a reduction of revenue at the date of the sale to the customer. Partner Rebates include amounts collected directly by the Company owed to DistributionConstruction Partners in accordance with their DistributionConstruction Partner agreements, being the difference between the price to the end customer and the DistributionConstruction Partners’ price. Other sales discounts are deducted immediately from sales invoices.

Contract balances

Timing of revenue recognition may differ from the timing of invoicing to customers. The Company records an unbilled receivable when revenue is recognized prior to invoicing. As the Company’s contracts are less than one year in duration, the Company has elected to apply the practical expedients to expense costs related to costs to obtain contracts and not disclose unfulfilled performance obligations. As deferred revenue and customer deposits are typically recognized during the year, the Company does not account for financing elements.

Warranties

The Company provides a warranty on all products sold to its clients and DistributionConstruction Partner’s clients. Warranties are not sold separately to customers. Provisions for the expected cost of warranty obligations are recognized based on an analysis of historical costs for warranty claims relative to current activity levels and adjusted for factors based on management’s assessment that increase or decrease the provision. Warranty provision is recognized in cost of goods sold. Warranty claims have historically not been material and do not constitute a separate performance obligation.

Stock-based compensation

The Company follows the fair value-based approach to account for options, share awards and restricted share units (“RSUs”). Compensation expense and an increase in “Additional paid-in capital” are recognized for options and RSUs over their vesting period based on their estimated fair values on the grant date, as determined using the Black-Scholes option pricing model for the majority of options and the market value of the Company’s common shares on the grant date for share awards and RSUs. Certain executive stock options and RSUs have performance conditions and are valued using a Monte Carlo model.

On exercise of stock options and RSUs, the recorded fair value of the option or RSU is removed from “Additional paid-in capital” and credited to “Share capital”. For options, any consideration paid by employees is credited to “Share capital” when the option is exercised. The Company’s stock options and RSUs are not shares of the Company and have no rights to vote, receive dividends, or any other rights as a shareholder of the Company.

During 2018 and 2019, the Company provided a cash settlement alternative for certain stock options. The fair value on grants attributable to those awards was reclassified on the balance sheet from shareholders’ equity to other liabilities, and at period end the liability is adjusted to fair value and the excess of fair value over previously recognized stock-based compensation is expensed. The fair value of the awards at the date of modification was greater than the grant date fair value of the previously vested equity awards, therefore the additional fair value was treated as an expense at the date of modification. Increases or decreases in fair value subsequent to the modification date will be recorded in earnings except that the Company shall not recognize a cumulative expense lower than the grant date fair value of the original equity awards. On October 9, 2019, following the listing of its common shares on Nasdaq, the Company ceased cash-settlement of stock options and the associated liability accounting for stock options and returned to equity settlement accounting for stock options, as described above.

Stock basedStock-based compensation expense is also recognized for performance share units (“PSUs”) and deferred share units (“DSUs”) using the fair value method. Compensation expense is recognized over the vesting period and the corresponding amount is recorded as a liability on the balance sheet.

The Company measures the DSUs granted under the 2023 LTIP (the “New DSUs”) using the closing price of the Company’s common shares on the grant date as the present intention is to settle the New DSUs in equity. This is recognized as an increase to stock-based compensation and the corresponding liability on the balance sheet.


61


Technology and development expenditures

Technology and development expenses are comprised primarily of salaries and benefits associated with the Company’s product and software development personnel which do not qualify for capitalization. These costs are expensed as incurred and exclude certain information and technology costs used in operations which are classified as general and administrative costs.

Government subsidies

The Company accounts for government subsidies on an accrual basis when the conditions for eligibility are met. The Company has adopted an accounting policy to present government subsidies as other income. The nature, significant terms and conditions of government subsidies are disclosed in the Financial Statements.

Earnings per share (“EPS”)

Basic earnings per share is calculated using the weighted average number of common shares outstanding during the year.year and adjusted for any change in capital structure events triggering retroactive changes to weighted average number of common shares outstanding. Diluted earnings per share is calculated using the treasury stock method for determining the dilutive impact of stock options.options, RSUs, and New DSUs. The Company follows the “if converted” method for accounting for the impact of convertible debentures on earningsnet (loss) per share, whereby interest charges applicable to the convertible debentures are added to the numerator and the convertible debentures are assumed to have been converted at the beginning of the period (or time of issuance, if later), and the resulting common shares are added to the denominator.

Fair value of financial instruments

ASC 820, “Fair Value Measurements,” requires entities to disclose the fair value of financial instruments, both assets and liabilities recognized and not recognized on the consolidated balance sheet, for which it is practicable to estimate fair value. Fair value is defined as the exchange price that would be received for an asset or paid to transfer a liability (an exit price) in the principal or most advantageous market for the asset or liability in an orderly transaction between market participants on the measurement date.

The Company’s fair value analysis is based on the degree to which the fair value is observable and grouped into categories accordingly:

Level 1 financial instruments are those which can be derived from quoted market prices (unadjusted) in active markets for similar financial assets or liabilities.
Level 2 financial instruments are those which can be derived from inputs that are observable for the asset or liability, either directly (i.e., as prices) or indirectly (i.e., derived from prices). Level 2 financial instruments include current and long-term debt. The carrying amounts of these instruments approximates fair value due to limited changes to interest rates and the Company’s credit rating since issuance.
Level 3 financial instruments are those derived from valuation techniques that include inputs for the financial asset or liability which are not based on observable market data (unobservable inputs). The Company does not have any Level 3 financial instruments.

Level 1 financial instruments are those which can be derived from quoted market prices (unadjusted) in active markets for similar financial assets or liabilities.

Level 2 financial instruments are those which can be derived from inputs that are observable for the asset or liability, either directly (i.e., as prices) or indirectly (i.e., derived from prices). Level 2 financial instruments include current and long-term debt. The carrying amounts of these instruments approximates fair value due to limited changes to interest rates and the Company’s credit rating since issuance.

Level 3 financial instruments are those derived from valuation techniques that include inputs for the financial asset or liability which are not based on observable market data (unobservable inputs). The Company does not have any Level 3 financial instruments.

The carrying amounts of cash and cash equivalents and restricted cash; trade and accrued receivables, other receivables; accounts payable and accrued liabilities; other liabilities; and customer deposits approximate fair value due to their short-term nature.

62


3. ADOPTION OF NEW AND REVISED ACCOUNTING STANDARDS AND RECENT PRONOUNCEMENTS ISSUED

OnIn November 2023, the Financial Accounting Standards Board ("FASB") issued ASU No. 2023-07 "Segment Reporting (Topic 280): Improvements to Reportable Segment Disclosures (ASU 2023-07), which requires an enhanced disclosure of significant segment expenses on an annual and interim basis. This guidance will be effective for the annual periods beginning the year ended December 31, 2024, and for interim periods beginning January 1, 2021,2025. Early adoption is permitted. The Company has chosen to early adopt. Upon adoption, the Company adoptedguidance is applied retrospectively to all prior periods presented in the financial statements.

On December 14, 2023, the Financial Accounting Standards Board issued Accounting Standards Update No. 2020- 06, “Debt – Debt with Conversion and other Options (Subtopic 470-20) and Derivatives and Hedging – Contracts in Entity’s Own Equity (Subtopic 815-40)”2023-09, “Improvements to Income Tax Disclosures” (the “ASU”). The ASU eliminates the beneficial conversion and cash conversion accounting models for convertible instruments. It also amends the accounting for certain contracts in further disaggregated information on an entity’s own equity that are currently accounted for as derivatives because of specific settlement provisions. In addition, the new guidance modifies how particular convertible instrumentstax rate reconciliation and certain contracts that may be settled in cash or shares impact the diluted earnings per share computation.income taxes paid. The amendments in thethis ASU are effective for fiscal years beginning after MarchDecember 15, 2021 and early adoption is permitted, but no earlier than fiscal years beginning after March 15, 2020, including interim periods within those fiscal years.

2024, on a prospective basis with an option of retrospective application. The Company early adoptedwill continue to evaluate the impact of the adoption of this standard on January 1, 2021. The Company had 0 convertible debt instruments outstanding at December 31, 2020 and the convertible unsecured subordinated debentures issued in January 2021 and November 2021 (see Note 12) have been evaluated under this new guidance and there were no other transitional impacts to consider.standard.


Although there are several other new accounting standards issued or proposed by the Financial Accounting Standards Board, which the Company has adopted or will adopt, as applicable, the Company does not believe any of these accounting pronouncements has had or will have a material impact on its Financial Statements.

4. LIQUIDITY

4. COVID-19As at December 31, 2023, the Company had $24.7 million of cash on hand and C$13.6 million ($10.3 million) of available borrowings (2022 – $10.8 million and C$7.2 million ($5.3 million) of available borrowings). Through the year ended December 31, 2023, the Company generated $14.8 million in cash flows from operations, compared to a cash usage of $44.3 million over fiscal year 2022. The Company benefited from the receipt of $7.3 million of government subsidies during 2023, compared to $nil for the year ended December 31, 2022 (refer to Note 5).

On March 11, 2020, COVID-19 was declared a global pandemic byWe have implemented multiple price increases during the World Health Organization and has had extraordinary and rapid negative impacts on global societies, workplaces, economies and health systems. The resulting adverse economic conditions have negatively impacted construction activity and consequently DIRTT’s business, with significant negative impacts extending through 2021 and potentially beyond.

While many construction sites remain open and re-opening strategies have been implemented across North America, certain projects have experienced delays, impacted by both the implementation of social distancing and other safety-related measures and the re-emergence of COVID-19 in certain geographic areas. It is not possiblepast two years to predict the timing and pace of economic recovery, or the resumption of delayed construction activity and related demand, nor is it possible to predictmitigate the impact of such developmentsinflation on raw materials and improve liquidity. These actions have resulted in a meaningful improvement in our gross profit margins and have served to reduce our cash usage to operate the business. Gross profit for the year ended December 31, 2023, was $59.5 million or 32.7% of revenue, compared to the same period in 2022, which generated gross profit of $28.2 million or 16.4% of revenue.

Over the same period, we have also executed upon several initiatives. First, in May 2023, we entered into an agreement with AWI (refer to Note 7) resulting in the receipt of $12.8 million of cash during 2023. Second, in March 2023, we entered into an agreement to sublease our Dallas DIRTT Experience Center (“DXC”) to one of our Construction Partners in that region. Under the sublease agreement, the subtenant has assumed responsibility for the monthly rent, utilities, maintenance, taxes and other costs as of April 1, 2023, through December 31, 2024, which will provide us annualized savings of approximately $1 million. We are continuing to evaluate other properties for sale and leaseback or sublease opportunities and expect these strategic initiatives to result in positive cash inflows in 2024. Third, we completed a private placement of common shares in November 2022 for aggregate proceeds of $2.8 million (the "Private Placement"), with certain significant shareholders and directors and officers of the Company, to bridge cash requirements before the completion and closing of the noted strategic transactions. The Company entered into irrevocable subscription agreements with its two largest shareholders, 22NW and 726 BC LLC and 726 BF (together “726” (which subsequently transferred its holdings to WWT)) and all the directors and officers of the Company on November 14, 2022, to issue 8.7 million shares for gross consideration of $2.8 million. The Private Placement closed on November 30, 2022 (refer to Note 22).

On November 21, 2023, we announced the Rights Offering to common shareholders for aggregate gross proceeds of C$30.0 million (the “Rights Offering”). The Rights Offering closed on January 9, 2024 (refer to Note 23).

While we are encouraged by our improved profitability and cash flow, we have continued to evaluate our fixed cost structure and overhead in light of macroeconomic uncertainty. We have implemented multiple reorganization initiatives (refer to Note 6) designed to align our cost structure with current expected levels of demand. In addition, the Company has reduced headcount by approximately 10% from January 2022 through December 2023.

We have assessed the Company’s abilityliquidity position as at December 31, 2023, taking into account our sales outlook for the next twelve-months, our existing cash balances and available credit facilities. Based on this analysis, we believe the Company has sufficient liquidity to achieve its business objectives.support ongoing operations for at least the next twelve months.

63


5. GOVERNMENT SUBSIDIES

In the United States, the Employee Retention Credit (“ERC”) was established by Section 2301 of the Coronavirus Aid, Relief, and Economic Security Act to provide an incentive for employers to keep their employees on their payroll during COVID-19 closures. The ERC is a refundable payroll tax credit based on qualified wages paid by an eligible employer between March 12, 2020, and October 1, 2021, for companies experiencing a significant decline in gross receipts during a calendar quarter or having operations fully or partially suspended during the quarter due to COVID-19. During the third quarter of 2022, the Company determined it was eligible for the ERC for the first three quarters of 2021 and filed a claim for $7.3 million in payroll tax credits ($7.1 million net of expenses). As at December 31, 2023, the $7.3 million of these claimed credits (plus an additional $0.2 million of interest) have been received.

6. REORGANIZATION AND ASSETS HELD FOR SALE

Over the past two years, the Company has increasedundertaken a number of reorganization initiatives:

Closure of Phoenix Aluminum Manufacturing Facility (the “Phoenix Facility”)

On February 22, 2022, we commenced the complexityprocess of estimatesclosing our Phoenix Facility, shifting related manufacturing to both our Savannah and assumptions usedCalgary aluminum manufacturing facilities. The closure of the Phoenix Facility was substantially completed in the second quarter of 2022. The Company entered into a sublease arrangement during the second quarter of 2022, commencing July 1, 2022, which exceeds the contractual lease commitments under the Right of Use assets.

Workforce Reductions, Board and Management Changes

In February and July of 2022, we announced our intention to prepareeliminate a portion of our salaried workforce, including manufacturing and office positions, along with other cost reduction initiatives. The Company’s Board of Directors was reconstituted following a proxy contest in April 2022, which was deemed a change of control under the Company’s consolidated financial statementsinsurance policy resulting in additional insurance expenditures. Further, the Company made changes to several executive officer roles during the year ended December 31, 2022. During the year ended December 31, 2023, we continued to review costs, resulting in the elimination of additional salaried positions in the second and third quarters of 2023. These actions resulted in the Company incurring certain one-time termination costs.

Temporary Suspension of Operations and Subsequent Closure at the Rock Hill Facility

On August 23, 2022, we announced the temporary suspension of operations at our Rock Hill Facility, shifting related manufacturing to our Calgary manufacturing facility. Costs associated with this idle facility, included in costs of sales, were $2.0 million (2022 - $0.5 million).

On September 27, 2023, we announced our intention to permanently close the Rock Hill Facility. We plan to move certain assets to our other facilities and dispose of remaining assets. The assets to be disposed of have been reclassified and measured as assets held for sale (see table below). As a result of this decision, we incurred $8.7 million of impairment charges associated with the transfer of assets from held for use to held for sale. We also expect to incur $0.2 million of costs in dismantling and decommissioning the Rock Hill Facility assets. The Company will continue to maintain the Rock Hill Facility building lease and is pursuing a sublease arrangement. Based on prevailing market prices in the area, no impairment indicators exist for the Right of Use asset of $6.7 million and the following key sourcesrelated leasehold improvements of estimation uncertainty:$2.7 million.

Reorganization costs incurred related to the above-mentioned initiatives:


For the Year Ended December 31,


2023


2022


 Termination benefits


2,162


7,042


 Insurance costs on change of control


-


3,691


 Phoenix Facility closure


99


756


 Professional Services


-


1,021


 Rock Hill Facility temporary suspension and closure of operations


295


129


 Other costs


453


822


 Total reorganization costs


3,009


13,461


64


 Reorganization costs in accounts payable and accrued liabilities at January 1, 2023

2,277

 Reorganization expense

3,009

 Reorganization costs paid

(4,690

)

 Reorganization costs in accounts payable and accrued liabilities at December 31, 2023

596

Credit riskOf the $0.6 million payable, $0.5 million relates to termination benefits and $0.1 million relates to other reorganization costs (2022 - of the $2.3 million payable, $2.1 million relates to termination benefits and $0.2 million relates to other reorganization costs).

COVID-19 may cause DIRTT’s Distribution PartnersAssets held for sale

Assets classified as held for sale as at December 31, 2023, of $1.6 million consist of manufacturing equipment previously used in the Rock Hill Facility (refer to Note 11). As part of the decision to permanently close the Rock Hill Facility, $10.3 million of assets were assessed against the assets held for sale criteria and customersreclassified from property, plant and equipment to experience liquidity issuesassets held for sale in the third quarter of 2023. The assets are measured at the lower of the net book value versus the fair value less cost to sell resulting in an impairment charge of $8.7 million. In the fourth quarter, the fair value was remeasured and an adjustment of $(0.8) million was recorded. It is expected that these assets will be sold within the next twelve months.


As at December 31,


2023


2022


 Assets held for sale, opening


-


-


 Net book value transferred from property, plant and equipment


10,271


-


 Impairment charge on reassessment


(8,716

)


-


 Assets held for sale, ending


1,555


-


To move the assets or dispose of the assets at the Rock Hill Facility, the Company fully settled the principal balance of the U.S. leasing facility in the fourth quarter of 2023. Principal payments of $7.8 million and interest penalties of $0.4 million were incurred (refer to Note 14). As a result of this may resultsettlement, $2.6 million of restricted cash was released to the Company in higher expected credit losses or slower collections. Management estimated the impactfourth quarter of expected credit losses2023.

Discontinuation of Reflect Product Line and increasedOther Charges Incurred

In August 2022, the provision by $0.6Company discontinued the Reflect and other product lines, resulting in a one-time inventory write-down of $1.0 million, and an acceleration of amortization expense associated with ICE development for Reflect.

Additionally, the Company accelerated the depreciation of certain items of property, plant and equipment associated with the closure of the Phoenix Facility resulting in additional depreciation incurred in the first quarter of 2020 (see Note 6)2022.

These costs were included in cost of sales:


For the Year Ended December 31,


2023


2022


 Provision for inventory of discontinued product lines


-


1,035


 Accelerated amortization associated with product line discontinuation


-


1,019


 Accelerated depreciation and amortization associated with closure of the Phoenix Facility


-


1,054


 Incremental cost of sales


-


3,108


65


7. GAIN ON SALE OF SOFTWARE

On May 9, 2023, we entered into the AWI Agreement and during 2021 reducedPartial Patent Assignment Agreement with AWI. The agreements provided for a cash payment from AWI to the Company’s provision for an uncollectible amount that was relatedCompany of $10.0 million, subject to a specific customer. Management has continued to reassess the impact of COVID-19 on the Company’s Distribution Partners. The estimation of such credit losses is complex because of limited historical precedentcertain routine closing conditions, in exchange for the current economic situation. In addition, the Company acquired trade credit insurance effective April 1, 2020 which remained in place during 2021 (see Note 6).

Liquidity risk

The Company may have lower cash flows from operating activities availablepartial assignment to service debts due to lower sales or collections as a result of COVID-19. To address this riskAWI and the uncertainty around the timingresulting co-ownership of a recovery from COVID-19,50% interest in the Company issued convertible unsecured subordinated debenturesrights, title and interests in January and December of 2021, for net proceeds of $29.5 million and $25.6 million, respectively, and has credit facilities available. See Note 12 for information about our credit facilities.

Government subsidies

As part of the Canadian federal government’s COVID-19 Economic Response Plan, the Canadian government established the Canadian Emergency Wage Subsidy (“CEWS”). The CEWS provided the Company with a taxable subsidycertain intellectual property rights in respect of a specific portion of wages paid to Canadian employees during qualifying periods extending from March 15, 2020 to October 23, 2021 based on the percentage decline of certain of the Company’s Canadian sourced revenues during each qualifying period. The Company’s eligibility for the CEWS was subject to change for each qualifying period and was reviewed by the Company for each qualifying period, with amounts being received by the Company for various, but not each, qualifying period. Pursuant to amendments enacted as part of the 2021 Canadian federal budget, the Company may be required to repay all or a portion of the CEWS amounts received for any qualifying period commencing after June 5, 2021 whereICE software that is used by AWI (the “Applicable ICE Code”), including a 50% interest in the aggregate compensation for “specified executives” (withinpatent rights that relate to the meaningApplicable ICE Code. Pursuant to the AWI Agreement, we also provided AWI a transfer of knowledge concerning the source code of the CEWS)Applicable ICE Code. In exchange for completing the knowledge transfer, we received additional cash payment of $1.0 million in the fourth quarter of 2023. The AWI Agreement provides that we and AWI have separate exclusive fields of use and restrictive covenants with respect to the Applicable ICE Code and related intellectual property, which survive until either party elects to separate from its relationship with the other and for five years thereafter. We concurrently entered into an Amended and Restated Master Services Agreement (the “ARMSA”) with AWI, under which AWI has also prepaid certain development services to be provided by DIRTT. The ARMSA will automatically terminate if the AWI Agreement is terminated or expires and may also be terminated if either party breaches the exclusive fields of use or restrictive covenants in the AWI Agreement.

The $11.0 million of proceeds on the sale of the 50% interest in the Applicable ICE code, pursuant to the AWI Agreement, was received during the 2021 calendar year exceedsended December 31, 2023. In accordance with GAAP, the aggregate compensation for “specified executives” duringproceeds were first applied to the 2019 calendar year.

On November 19, 2020,net book value of the Canadian government also implemented the Canada Emergency Rent Subsidy (“CERS”).related cost of software of $2.9 million and patents (other assets) of $0.9 million. The CERS provided a taxable subsidy to cover eligible expenses for qualifying properties, subject to certain maximums, for qualifying periods extending from September 27, 2020 to October 23, 2021, with theresidual amount of $7.1 million was recognized as a gain in the subsidy available toconsolidated statement of operations. Further, $1.8 million was received as a prepayment under the Company being based onARMSA, which is recognized into revenue as the percentage decline of certainperformance obligation is met. During the year ended December 31, 2023, $1.6 million of the Company’s Canadian-sourced revenues$1.8 million payment was recognized into revenue and $0.2 million remains a customer deposit to be recognized as revenue in each qualifying period. The Company’s eligibility for the CERSfirst quarter of 2024. Part of the proceeds of this transaction was subjectused to change for each qualifying periodsettle one of our equipment leases of $1.6 million and was reviewed byresulted in the Company for each qualifying period.release of $0.4 million of restricted cash (refer to Note 14).

8. LEASES

The CEWS and CERS programs ended on October 23, 2021.


5. LEASES

The Company leases office and factory space under various operating leases. As the Company’s leases do not provide an implicit rate, the Company uses its incremental borrowing rate based on the information available at the commencement date in determining the present value of lease payments. The Company gives consideration to instruments with similar characteristics when calculating its incremental borrowing rate. The Company’s operating leases have remaining lease terms of 1 year to 2414 years. Lease terms may include options to extend or terminate the lease when it is reasonably certain that the Company will exercise that option.

The weighted average remaining lease term and weighted average discount rate at December 31, 2021 were 142023, was nine years (2020 (2022 - 14 years)thirteen years) and 5.2% (20206.3% (20225.1%4.9%), respectively.

The Company entered into a sublease arrangement for part of the Phoenix Facility during the second quarter of 2022, commencing July 1, 2022. Additionally, the Company entered into a sublease agreement for the Dallas DXC to one of our Construction Partners in that region, in which the subtenant has assumed responsibility for all monthly rent, utilities, maintenance, taxes and other costs as of April 1, 2023, through December 31, 2024.

The following table includes ROU assets included on the balance sheet at December 31, 20212023 and 2020:2022:


ROU Assets


Cost


Accumulated depreciation


Net book value


At January 1, 2022


44,055


(13,175

)


30,880


Additions


139


-


139


Modifications


4,809


50


4,859


Depreciation expense


-


(5,057

)


(5,057

)

Exchange differences


(943

)


611


(332

)

At December 31, 2022


48,061


(17,571

)


30,490


Disposals


(2,667

)


2,308


(359

)

Modifications


3,866


(196

)


3,670


Depreciation expense


-


(4,312

)


(4,312

)

Exchange differences


596


(272

)


324


At December 31, 2023


49,856


(20,043

)


29,813


ROU Assets


Cost


Accumulated depreciation


Net book value


At January 1, 2020


24,778


(4,117

)


20,661


Additions


16,805


-


16,805


Depreciation expense


-


(3,884

)


(3,884

)

Exchange differences


257


(196

)


61


At December 31, 2020


41,840


(8,197

)


33,643


Additions


2,401


-


2,401


Depreciation expense


-


(4,989

)


(4,989

)

Exchange differences


(186

)


11


(175

)

At December 31, 2021


44,055


(13,175

)


30,880


66


The components of the lease cost for the years ended December 31, 2023 and 2022 were as follows:


For the year ended December 31,


2023


2022


Operating lease cost (1)


Fixed lease cost


6,688


6,719


Sublease income


(1,393

)


(344

)

Total operating lease cost


5,295


6,375


(1) The lease costs, net of sublease income, are reflected in the Consolidated Statements of Operations and Comprehensive Loss as follows:


For the year ended December 31,


2023


2022


Cost of goods sold


4,427


4,647


Selling and marketing


793


1,356


General and administrative


(113

)


107


Technology and development


188


265


Total operating lease cost


5,295


6,375


The following table includes lease liabilities included on the balance sheet at December 31, 20212023 and 2020:2022:


Lease Liability


2023


2022


At January 1,


33,423


33,481


Additions


-


139


Disposals


(406

)


-


Modifications


3,866


4,809


Accretion


2,272


1,722


Repayment of lease liabilities


(5,942

)


(6,558

)

Lease inducements


-


124


Exchange differences


243


(294

)

At December 31,


33,456


33,423


Current lease liabilities


5,255


5,889


Long-term lease liabilities


28,201


27,534


In February 2023, the Company modified an existing agreement for a Calgary manufacturing facility to extend the leasing term for an additional five years. An extension option period of five years was also determined to be more likely than not to occur. Undiscounted cash flows associated with this modification are $16.3 million. The rent obligations have been discounted at a rate of 8.58% to determine the lease liability.

In May 2023, the Company modified an existing agreement through early termination for the Seattle DXC. This amendment caused the derecognition of the lease, albeit DIRTT maintaining guarantor status for the remainder of the original lease term which terminates in August 2027. Undiscounted cash flows associated with this modification were $0.5 million.

On September 27, 2023, we announced our intention to permanently close the Rock Hill Facility (refer to Note 6). As a result of this decision, DIRTT no longer assumes the two five-year extension options under the related property lease will be exercised.


Lease Liability


2021


2020


At January 1,


35,284


21,403


Additions


2,401


17,255


Accretion


1,758


1,175


Repayment of lease liabilities


(6,509

)


(5,358

)

Lease inducements


720


750


Exchange differences


(173

)


59


At December 31,


33,481


35,284


Current lease liabilities


6,214


5,503


Long-term lease liabilities


27,267


29,781


67


Undiscounted cash flows associated with this modification were $13.7 million. The rent obligations have been discounted at a rate of 6.77% to determine the lease liability.

The following table includes maturities of operating lease liabilities at December 31, 2021:2023:

2022


6,406


2023


4,751


2024


3,150


2025


3,184


2026


3,267


Thereafter


28,963


Total


49,721


Total lease liability


33,481


Difference between undiscounted cash flows and lease liability


16,240


In September 2020, the Company commenced the 15 year lease associated with the construction of the South Carolina Facility. The lease may be extended for up to two 5 year periods. Undiscounted rent obligations associated with this lease are $28.1 million which includes the initial 15 year term and two 5 year extensions. The rent obligations have been discounted at a rate of 5.5% to determine the lease liability. 


2024


5,424


2025


6,051


2026


5,491


2027


4,375


2028


3,834


Thereafter


19,929


Total


45,104


Total lease liability


33,456


Difference between undiscounted cash flows and lease liability


11,648


In December 2020, the Company entered into a lease agreement with an initial term of 8 years and one 5 year extension associated with a new DXC in Dallas, Texas. Undiscounted rent obligations associated with this lease are $6.7 million. The rent obligations have been discounted at a rate of 4.75% to determine the lease liability. 

6.9. TRADE AND ACCRUED RECEIVABLES AND OTHER RECEIVABLES

Accounts receivable are recorded at the invoiced amount, do not require collateral and do not bear interest. The Company estimates an allowance for credit losses using the lifetime expected credit loss at each measurement date, taking into account historical credit loss experience as well as forward-looking information in order to establish rates for each class of financial receivable with similar risk characteristics. Adjustments to this estimate are recognized in the statement of operations.

In order to manage and assess our risk, management maintains credit policies that include regular review of credit limits of individual receivables and systematic monitoring of aging of trade receivables and the financial wellbeing of our customers. In addition, we acquired trade credit insurance effective April 1, 2020. At December 31, 2021,2023, approximately 90%93% of our trade accounts receivable are insured, relating to accounts receivables from counterparties deemed creditworthy by the insurer and excluding accounts receivable from government entities, that have arisen since April 1, 2020 when the trade credit insurance became effective.

Our trade balances are spread over a broad Distribution Partner base, which is geographically dispersed. For the years ended December 31, 2021 and 2020 no Distribution Partner accounted for greater than 10% of revenue.entities. In addition, and where possible, we collect a 50%50% deposit on sales, excluding government and certain other clients.

Our trade balances are spread over a broad Construction Partner base, which is geographically dispersed. For the year ended December 31, 2023, one Construction Partner accounted for greater than 10% of revenue, compared to 2022 in which no Construction Partner accounted for greater than 10% of revenue.


As at December 31,


As at December 31,


2021


2020


2023


2022


Current


13,659


12,500


12,070


12,381


Overdue


621


1,211


3,818


1,675


14,280


13,711


15,888


14,056


Less: expected credit losses


(130

)


(588

)


(101

)


(126

)


14,150


13,123


15,787


13,930


Sales tax receivable


196


242


Government subsidies receivable


-


1,743


Income tax receivable


3,194


3,845


17,540


18,953


Due to the uncertainties associated with the COVID-19 pandemic as well as the disruption to businesses in North America, the overall credit quality of certain receivables declined at March 31, 2020 compared to January 1, 2020. As a result of this consideration and the Company’s ongoing review of the credit quality of receivables, expected credit losses were increased by $0.6 million during the quarter ended March 31, 2020. During 2021, $0.5 million of receivables for a specific customer balance was written off (2020 - $0.1 million). No significant increasechange to our expected credit lossesloss was required atduring the year ended December 31, 2021.2023, or December 31, 2022. Receivables are generally considered to be past due when over 60 days old, unless there is a separate payment arrangement in place for the collection of the receivable.

7.10. INVENTORY


As at December 31,


As at December 31,


2021


2020


2023


2022


Raw material


18,388


16,730


16,787


22,218


Allowance for obsolescence


(646

)


(1,073

)


(1,666

)


(1,242

)

Work in progress


715


321


1,456


1,275


18,457


15,978


16,577


22,251


In 2021,68


As of December 31, 2023, the Company provided $0.6had $1.7 million (2020(2022 - $1.1$1.2 million) provided for inventory that is not expected to be used in future production and the associated expense was recorded to cost of goods sold. During 20212023, the Company wrote off $1.0 million of inventory against the provision (2022 - $0.5 million) and 2020,increased the allowance for obsolescence by $0.4 million (2022 - $0.9 million). In addition, the Company recorded direct write offs against inventory of $0.5 million (2022 - $0.3 million). Production overheads capitalized in work in progress were $0.2 million at December 31, 2023 (2022 - $0.2 million).

Additional costs included in cost of goods sold

During 2021, the Company experienced periods where it was operating below normal capacity levels. During those periods,that period, overheads included in inventory were not increased and


$$1.8 million (2020 - $2.0 million) was recognized directly and separatelyincluded in cost of sales. Production overheads capitalized in work in progress were $In 2022, we temporarily suspended operations at the Rock Hill Facility. On September 27, 2023, we announced our intention to permanently close the Rock Hill Facility. 0.1 million atAs of December 31, 2021 (December 31, 2020 - $2023, the Company leases the Rock Hill Facility and is actively pursuing sublease arrangements. Idle facility costs being incurred at the Rock Hill Facility are included in cost of sales.0.1 million).


For the Year Ended December 31,


2023


2022


2021


Under-utilized capacity


-


-


1,756


Idle facility costs


1,977


506


-


1,977


506


1,756


Change in presentation in Consolidated Statement of Operations


For the Year Ended December 31,


2023


2022


2021


Product cost of sales, as previously presented


119,728


140,058


118,525


Cost of under-utilized capacity, as previously presented


-


-


1,756


Product cost of sales, per Statement of Operations


119,728


140,058


120,281


69


8.

11. PROPERTY, PLANT AND EQUIPMENT, NET


Office and computer equipment


Factory equipment


Leasehold improvements


Total


Office and computer equipment


Factory equipment


Leasehold improvements


Total


Cost


At December 31, 2019


22,743


54,640


39,231


116,614


At December 31, 2021


28,646


71,484


47,567


147,697


Additions


1,139


11,719


3,777


16,635


738


775


341


1,854


Disposals


(28

)


(120

)


(138

)


(286

)


(1,347

)


(2,983

)


(6,688

)


(11,018

)

Exchange differences


1,134


284


235


1,653


(581

)


(3,167

)


(1,457

)


(5,205

)

At December 31, 2020


24,988


66,523


43,105


134,616


At December 31, 2022


27,456


66,109


39,763


133,328


Additions


3,422


4,515


4,372


12,309


790


320


132


1,242


Disposals


-


(53

)


-


(53

)


(127

)


(375

)


(2,186

)


(2,688

)

Transferred to assets held for sale


-


(13,260

)


-


(13,260

)

Exchange differences


236


499


90


825


6


870


619


1,495


At December 31, 2021


28,646


71,484


47,567


147,697


At December 31, 2023


28,125


53,664


38,328


120,117


Accumulated depreciation and impairment


At December 31, 2019


13,912


32,274


29,063


75,249


At December 31, 2021


19,981


39,271


36,748


96,000


Depreciation expense


1,723


3,059


3,656


8,438


2,355


4,425


3,680


10,460


Disposals


(28

)


(120

)


(138

)


(286

)


(1,272

)


(2,831

)


(6,688

)


(10,791

)

Exchange differences


755


311


302


1,368


(540

)


(2,044

)


(1,279

)


(3,863

)

At December 31, 2020


16,362


35,524


32,883


84,769


At December 31, 2022


20,524


38,821


32,461


91,806


Depreciation expense


3,589


3,670


3,817


11,076


2,041


3,661


1,824


7,526


Disposals


-


(23

)


-


(23

)


(127

)


(272

)


(2,098

)


(2,497

)

Transferred to assets held for sale


-


(2,989

)


-


(2,989

)

Exchange differences


30


100


48


178


124


687


383


1,194


At December 31, 2021


19,981


39,271


36,748


96,000


At December 31, 2023


22,562


39,908


32,570


95,040


Net book value


At December 31, 2020


8,626


30,999


10,222


49,847


At December 31, 2021


8,665


32,213


10,819


51,697


At December 31, 2022


6,932


27,288


7,302


41,522


At December 31, 2023


5,563


13,756


5,758


25,077


As at December 31, 2021,2023, the Company had $2.2$0.2 million of assets in progress of completion which were excluded from assets subject to depreciation (December 31, 2020(2022$16.2 million, primarily related to equipment procured for the South Carolina Facility)$0.1 million).


During the year ended December 31, 2021, we impaired goodwill (see2022, depreciation expense included $1.1 million of incremental depreciation on the acceleration of useful lives associated with the closing of the Phoenix Facility. The year ended December 31, 2023, did not include any significant amounts related to accelerated depreciation (refer to Note 10)6).

On September 27, 2023, the Company announced its intention to permanently close the Rock Hill Facility in South Carolina. $10.3 million of manufacturing equipment at Rock Hill was transferred to assets held for sale (refer to Note 6).

As at December 31, 2023, the Company determined that there were no impairment indicators warranting an impairment test.

During the year ended December 31, 2022, the Company has incurred negative cash flows from operations and accordingly management determined that this was an indicator of impairment for property, plant and equipment.equipment assets. The Company estimated the undiscounted cash flows to be generated from the use and ultimate disposition of the property, plant and equipment assets using the same methodology and assumptions included in the goodwill impairment test (see Note 10). The results of the test indicated that the fair value exceeded the carrying values of property, plant and equipment, therefore, 0 impairment charge was required at December 31, 2021.


9. CAPITALIZED SOFTWARE, NET


For the Year Ended December 31,


2021


2020


Cost


As at January 1


35,480


32,419


Additions


2,340


2,998


Recovery of software development expenditures


(461

)


(674

)

Exchange differences


133


737


As at December 31


37,492


35,480


Accumulated amortization


As at January 1


27,136


24,206


Amortization expense


2,878


2,428


Exchange differences


83


502


As at December 31


30,097


27,136


Net book value


7,395


8,344


Estimated amortization expense on capitalized software is $2.4 million in 2022, $1.5 million in 2023, $0.9 million in 2024, $0.7 million in 2025, and $0.1 million in 2026.

10. GOODWILL


For the Year Ended December 31,


2021


2020


As at January 1


1,449


1,421


Goodwill impairment


(1,443

)


-


Exchange differences


(6

)


28


-


1,449


The Company’s goodwill is assessed at the consolidated company level which represents the Company’s sole operating and reporting unit. The Company tests its goodwill for impairment annually during the fourth quarter of the calendar year. Due to the ongoing impact of the COVID-19 pandemic on its financial results in 2021, the Company determined it was necessary to use the quantitative approach to perform its goodwill impairment test. The quantitative impairment test requires estimates to determine the fair value of the reporting unit, as such, requires the Company to make significant assumptions and judgements.

assets. To estimate the fair valueundiscounted cash flows of the reporting unit, the Company applied the income approach using discounted future cash flows.approach. Sales and cost projections were based on assumptions driven by current economic conditions. Due to the uncertainty around the future impact of COVID-19, its projectionsThe Company considered various scenarios and the Company probability-weighted the likelihood of each scenario in determining the reporting unit’s fair value. The average compounded annual growth rate of revenues was 10% and the Company assumed a 10% 5%- 15% annualized reduction in operating costs in the model.10%. Other key assumptions used in the quantitative assessment of the reporting unit’s goodwill were applying a discount rate of 13%and aundiscounted cashflows was terminal growth rate of 2%2%. The Company estimated the undiscounted cash flows to be generated from the use and ultimate disposition of the property, plant and equipment assets. The results of the test indicated that the undiscounted cash flows exceeded the carrying values of property, plant and equipment, therefore, no

Based on its testing, the fair value of goodwill did not exceed the recoverable amount and, accordingly, the entire $1.4 million balance of goodwillimpairment charge was impaired asrequired at December 31, 2021. 2022.

70


12. CAPITALIZED SOFTWARE, NET


For the Year Ended December 31,


2023


2022


 Cost


 As at January 1


34,546


37,492


 Additions


1,794


1,677


 Recovery of software development expenditures


(127

)


(263

)

 Disposals


(6,641

)


(1,990

)

 Exchange differences


680


(2,370

)

 As at December 31


30,252


34,546


 Accumulated amortization


 As at January 1


30,140


30,097


 Amortization expense


840


3,887


 Disposals


(3,766

)


(1,916

)

 Exchange differences


588


(1,928

)

 As at December 31


27,802


30,140


 Net book value


2,450


4,406


The impairment chargedisposal of capitalized software in 2023 with a net book value of $2.9 million, relates to the AWI transaction (refer to Note 7).

Estimated amortization expense on goodwill has been separately classifiedcapitalized software is $0.8 million in 2024, $0.8 million in 2025, $0.5 million in 2026, $0.3 million in 2027, and $0.1 million in 2028.

During the year ended December 31, 2022, amortization expense was impacted by $1.0 million of incremental amortization on the consolidated statementacceleration of operations and comprehensive loss.useful lives associated with discontinued product lines (refer to Note 6). Amortization expense for the year ended December 31, 2023, was not impacted by any incremental amortization of this kind.

11.13. ACCOUNTS PAYABLE AND ACCRUED LIABILITIES AND OTHER LIABILITIES


As at December 31,


As at December 31


2021


2020


2023


2022


Trade accounts payable(2)


7,820


4,921


12,378


8,944


Accrued liabilities(2)


9,649


9,266


5,500


5,394


Wages and commissions payable


4,275


4,577


1,688


3,410


Rebates accrued(1)


1,007


1,586


314


2,133


22,751


20,350


19,880


19,881


(1)
In 2023, $2.6 million of rebates were earned (2022 - $4.8 million) and $4.4 million were paid (2022 - $3.7 million).

(2)
In 2022, $3.4 million of trade accruals were previously included in the Accrued liabilities balance.

71


(1)

In 2021, $4.1 million of rebates were earned (2020 - $4.5 million) and $4.7 million were paid (2020 -$3.9 million).

Other liabilities


As at December 31,


2023


2022


Warranty provisions (1)


873


1,278


DSU liability


1,086


594


Income taxes payable


289


-


Sublease deposits


184


139


Other provisions


50


45


Other liabilities


2,482


2,056


During

(1)
The following table presents a reconciliation of the year December 31, 2021, the Company separately classified the current portion of long-term debt and accrued interest on the balance sheet, prior year figures have been reclassified to conform with the current year’s presentation:warranty provisions balance:


As at December 31,


2023


2022


As at January 1


1,278


1,451


Additions to warranty provision


1,208


1,134


Payments related to warranties


(1,613

)


(1,307

)


873


1,278


As at December 31,


2021


2020


Legal provisions(1)


143


45


Deferred and performance share unit liability


785


971


Warranty and other provisions(2)


1,451


1,763


Current portion of long-term debt and

   accrued interest


3,323


898


Other liabilities, as previously presented


5,702


3,677


Reclassified to "Current portion of

   long-term debt and accrued interest"


(3,323

)


(898

)

Other liabilities


2,379


2,779


(1)

The Company has provided $0.1 million (2020 - $0.05 million) as the estimated amount likely payable for various claims against the Company. The amount provided for is management’s best estimate of the potential payments for amounts claimed.

(2)

The following table presents a reconciliation of the warranty and other provisions balance:


As at December 31,


2021


2020


As at January 1


1,763


4,008


Adjustments to timber provision


(500

)


(1,750

)

Additions to warranty provision


1,019


1,301


Payments related to warranties


(831

)


(1,796

)


1,451


1,763


12.14. LONG-TERM DEBT


Revolving

Credit Facility


Leasing

Facilities


Convertible

Debentures


Total Debt


Balance on January 1, 2020


-


-


-


-


Issuances


-


6,130


-


6,130


Accrued interest


-


103


-


103


Interest payments


-


(103

)


-


(103

)

Principal repayments


-


(406

)


-


(406

)

Exchange differences


-


243


-


243


Balance at December 31, 2020


-


5,967


-


5,967


Current portion of long-term debt and accrued interest


-


898


-


898


Long-term debt


-


5,069


-


5,069


Revolving
Credit Facility


Leasing
Facilities


Convertible
Debentures


Total Debt


Balance on December 31, 2020


-


5,967


-


5,967


Balance at December 31, 2021


-


13,909


56,733


70,642


Issuances


-


9,805


55,107


64,912


-


647


-


647


Accretion of issue costs


-


-


352


352


-


-


676


676


Accrued interest


-


556


1,935


2,491


-


735


3,539


4,274


Interest payments


-


(556

)


(987

)


(1,543

)


-


(735

)


(3,688

)


(4,423

)

Principal repayments


-


(1,808

)


-


(1,808

)


-


(2,470

)


-


(2,470

)

Exchange differences


-


(55

)


326


271


-


(274

)


(3,637

)


(3,911

)

Balance at December 31, 2021


-


13,909


56,733


70,642


Balance at December 31, 2022


-


11,812


53,623


65,435


Current portion of long-term debt and accrued interest


-


2,386


937


3,323


-


2,561


745


3,306


Long-term debt


-


11,523


55,796


67,319


-


9,251


52,878


62,129


Balance at December 31, 2022


-


11,812


53,623


65,435


Accretion of issue costs


-


-


698


698


Accrued interest


-


526


3,411


3,937


Interest payments


-


(526

)


(3,451

)


(3,977

)

Principal repayments


-


(11,579

)


-


(11,579

)

Exchange differences


-


251


1,343


1,594


Balance at December 31, 2023


-


484


55,624


56,108


Current portion of long-term debt and accrued interest


-


79


762


841


Long-term debt


-


405


54,862


55,267


Revolving Credit Facility

On July 19, 2019, the Company entered into a C$50.0 million senior secured revolving credit facility (the “Previous RBC Facility”) with the Royal Bank of Canada (“RBC”). The Previous RBC Facility had a three-year term and could be extended for up to two additional years at the Company’s option. Interest was calculated at the Canadian or U.S. prime rate with no adjustment, or the bankers’ acceptance rate plus 125 basis points. The Previous RBC Facility was subject to a minimum fixed charge coverage ratio of 1.15:1 and a maximum debt to Adjusted EBITDA ratio of 3.0:1 (earnings before interest, tax, depreciation and amortization, non-cash stock-based compensation, plus or minus extraordinary or unusual non-recurring revenue or expenses) calculated on a trailing four quarter basis (the “Covenants”).

During the second quarter of 2020, the Company entered into a letter agreement with RBC pursuant to which the Covenants were waived for the June 30, 2020 and September 30, 2020 quarterly measurement dates (the “Covenant Holiday Period”). In the fourth quarter of 2020, the Company entered into a letter agreement with RBC pursuant to which the Covenants were waived for the December 31, 2020 quarterly measurement date (the “Covenant Holiday Period Extension”). During the Covenant Holiday Period and the Covenant Holiday Period Extension, the Company was able to borrow to a maximum of 75% of eligible accounts receivable and 25% of eligible inventory, less priority payables, subject to an aggregate limit of $50.0 million including amounts borrowed under the Leasing Facilities. During the Covenant Holiday Period and the Covenant Holiday Period Extension, the Company was required to maintain a cash balance of C$10.0 million if no loans were drawn under the facility, have Adjusted EBITDA of not less than a loss of $7.0, $16.5 million and $3.0 million for the twelve month periods ended June 30, September 30, 2020 and December 31, 2020, and make capital expenditures of no more than $10.7 million during the Covenant Holiday Period and $8.8 million during the Covenant Holiday Period Extension. As at December 31, 2020, the Previous RBC Facility was undrawn and the available borrowing base was $10.6 million. The Company was in compliance with the requirements of the covenant holiday as at December 31, 2020.

On February 12, 2021, the Company entered into a loan agreement governing a C$25.0 million senior secured revolving credit facility with RBCthe Royal Bank of Canada (“RBC”), as lender (the “ RBC“RBC Facility”), replacing the Previous RBC Facility. . Under the RBC Facility, the Company is able to borrow up to a maximum of 90% of investment grade or insured accounts receivable plus 85% of eligible accounts receivable plus the lesser of (i) 75% of the book value of eligible inventory and (ii) 85% of the net orderly liquidation value of eligible inventory less any reserves for potential prior ranking claims (the “Borrowing Base”). At December 31, 2021, available borrowings are C$13.2 million ($10.4 million), of which no amounts have been drawn. Interest iswas calculated at the Canadian or U.S. prime rate plus 30 basis points or at the Canadian Dollar Offered Rate or LIBOR plus 155 basis points. Under the RBC Facility, if the Aggregate“Aggregate Excess Availability, definedAvailability”, (defined as the Borrowing Base less any loan advances or letters of credit or guarantee and if undrawn including unrestricted cash,cash), is less than C$5.0 million, the Company iswas subject to a FCCRfixed charge coverage ratio (“FCCR”) covenant of 1.10:1 on a trailing twelve monthtwelve-month basis. Additionally, if the FCCR has been abovebelow 1.10:1 for the 3three immediately preceding months, the Company is required to maintain a reserve account equal to the aggregate of one-yearone year of payments on outstanding loans on the Leasing Facilities (defined below). The Company did not meet the 3 month FCCR requirement during the fourth quarter of 2021 which would result in requiring the restriction of $3.1 million of cash at December 31, 2021. Should an event of default occur or the Aggregate Excess Availability be less than C$6.25 million for 5five consecutive business days, the Company would enter a cash dominion period whereby the Company’s bank accounts would be blocked by RBC and daily balances will set-offoffset any borrowings and any remaining amounts made available to the Company.

Leasing Facilities72


During 2020,

On February 9, 2023, the Company entered intoextended the RBC Facility (the “Extended RBC Facility”). The Extended RBC Facility has a maximum borrowing base of C$15 million and a one-year term. Interest is calculated as at the Canadian or U.S. prime rate plus 75 basis points or the Canadian Dollar Offered Rate or Term Secured Overnight Financing Rate (“SOFR”) plus 200 basis points plus the Term SOFR Adjustment (as defined in the amended loan agreement governing the Extended RBC Facility). Under the Extended RBC Facility, if the trailing twelve-month FCCR is not above 1.25 for three consecutive months, a cash balance equivalent to one year’s worth of Leasing Facilities payments must be maintained. Effective October 2023, inventory was scoped out of the Borrowing Base. At December 31, 2023, available borrowings are C$13.6 million ($10.3 million) (2022 – C$7.2 million ($5.3 million) of available borrowings), calculated in the same manner as the RBC Facility described above, of which no amounts have been drawn. The Company did not meet the three-month FCCR requirement during the year end 2023, which resulted in the restriction of $0.4 million of cash (2022 - $3.4 million).

On February 9, 2024, the Company extended the Extended RBC Facility (the “Second Extended RBC Facility”). The Second Extended RBC Facility is subject to the borrowing base calculation to a maximum of C$15 million and a one-year term. Interest is calculated as at the Canadian or U.S. prime rate plus 75 basis points or at the Canadian Dollar Offered Rate or Adjusted Term CORRA or Term SOFR plus the Term SOFR Adjustment, in each case plus 200 basis points.

Leasing Facilities

The Company has a C$5.0 million equipment leasing facility in Canada (the “Canada Leasing Facility”) of which C$4.4 million ($3.4 million) has been drawn and C$3.8 million ($2.9 million) has been repaid, and a $16.0$14.0 million equipment leasing facility in the United States of which $13.3 million has been drawn and repaid (the “U.S. Leasing Facility” and, together with the Canada Leasing Facility, the “Leasing Facilities”) with RBC,RBC. The Canada Leasing Facility has a seven-year term and one of its affiliates, which are available for equipment expenditures and certain equipment expenditures already incurred. Pursuant tobears interest at 4.25%.

The Company did not make any draws on the Covenant Holiday Period Extension, the equipment leasing facility in the United States was reduced from US$16 million to US$14 million and the revolving Lease Facilities were amended to be amortizing facilities. The Leasing Facilities respectively, have seven and five-year terms and bear interest at 4.25% and 5.59%. The U.S. leasing facility is amortized over a six-year term and extendible atduring 2023. During the Company’s option for an additional year.

During 2021,year ended December 31, 2022, the Company received $9.8C$0.9 million (2020 - $3.5($0.7 million) of cash consideration under the U.S. leasing facility related to reimbursements for equipment purchases for its South CarolinaCanada Leasing Facility. During 2021, the Company received $nil (2020 - C$3.6 million or $2.6 million) of cash consideration under the leasing facility in Canada. The associated financial liabilities are shown on the consolidated balance sheet in the current other liabilities andportion of long-term debt and other liabilities.accrued interest and long-term debt.

As part of RBC’s consent to the AWI transaction (refer to Note 7), one of the Canadian lease agreements of $1.6 million was fully settled using AWI proceeds. This resulted in the release of $0.4 million of restricted cash associated with the one year of payments on this lease, as described above.

Refer to Note 6 on the decision to permanently close the Rock Hill Facility. As part of this decision, the Company fully settled the $7.8 million principal balance of the U.S. Leasing Facility in the fourth quarter of 2023. The U.S. Leasing Facility is no longer available to be drawn on. With the settlement of this liability, $2.6 million was released from restricted cash.

Convertible Debentures

On January 25, 2021, the Company completed a C$3535.0 million ($27.5 million) bought-deal financing of convertible unsecured subordinated debentures with a syndicate of underwriters.underwriters (the “January Debentures”). On January 29, 2020,2021, the Company issued a further C$5.25 million ($4.1


million) of convertible debenturesthe January Debentures under the terms of an overallotment option granted to the underwriters. These convertible debenturesThe January Debentures will mature and be repayable on January 31, 2026 (the “January NotesDebentures Maturity Date”) and will accrue interest at the rate of 6.00%6.00% per annum payable semi-annually in arrears on the last day of January and July of each year commencing on July 31, 2021, until the January NotesDebentures Maturity Date, interestDate. Interest and principal are payable in cash or shares at the option of the Company. These convertible debenturesCosts of the transaction were approximately C$2.7 million, including the underwriters’ commission. The January Debentures will be convertible into common shares of DIRTT, at the option of the holder, at any time prior to the close of business on the business day prior to the earlier of the January NotesDebentures Maturity Date and the date specified by the Company for redemption of these convertible debenturesthe January Debentures at a conversion price of C$4.65 per common share, being a ratio of approximately 215.0538 common shares per C$1,000 principal amount of convertible debentures. Coststhe January Debentures. Subsequent to the Rights Offering (refer to Note 23), the conversion price is now C$4.03 per common share representing a conversion rate of approximately 248.1390 common shares per C$1,000 principal amount of the transaction were approximatelyJanuary Debentures. As at December 31, 2023, C$2.718.9 million includingof the underwriters’ commission.January Debentures are held by a related party (refer to Note 22).

73


On November 15,December 1, 2021, the Company completed a C$3535.0 million ($27.4 million) bought-deal financing of convertible unsecured subordinated debentures with a syndicate of underwriters.underwriters (the “December Debentures” and, together with the January Debentures, the “Debentures”). These convertible debenturesDecember Debentures will mature and be repayable on December 31, 2026 (the “November Notes“December Debentures Maturity Date”) and will accrue interest at the rate of 6.25%6.25% per annum payable semi-annually in arrears on the last day of June and December of each year commencing on June 30, 2022, until the November NotesDecember Debentures Maturity Date, interestDate. Interest and principal are payable in cash or shares at the option of the Company. These convertible debenturesCosts of the transaction were approximately C$2.3 million, including the underwriters’ commission. The December Debentures will be convertible into common shares of DIRTT, at the option of the holder, at any time prior to the close of business on the business day prior to the earlier of the November NotesDecember Debentures Maturity Date and the date specified by the Company for redemption of the convertible debenturesDecember Debentures at a conversion price of C$4.20 per common share, being a ratio of approximately 238.0952 common shares per C$1,000 principal amount of convertible debentures. Coststhe December Debentures. Subsequent to the Rights Offering (refer to Note 23), the conversion price is now C$3.64 per common share representing a conversion rate of approximately 274.7253 common shares per C$1,000 principal amount of the transaction were approximatelyDecember Debentures. As at December 31, 2023, C$2.313.6 million includingof the underwriters’ commission.December Debentures are held by a related party (refer to Note 22).

13.

15. INCOME TAXES

Reconciliation of income taxes

The following reconciles income taxes calculated at the Canadian statutory rate with the actual income tax expense. The Canadian statutory rate includes federal and provincial income taxes. This rate was used because Canada is the domicile of the parent entity of the Company.


For the Year Ended December 31,


2021


2020


2019


Net loss before tax


(53,872

)


(9,194

)


(3,377

)

Canadian statutory rate


23.3

%


24.2

%


26.5

%

Expected income tax


(12,552

)


(2,225

)


(895

)


Effect on taxes resulting from:


Valuation allowance


12,046


5,241


-


Non-deductible expenses


542


261


550


Non-deductible stock-based compensation


189


269


674


Tax rate impacts


(488

)


(1,288

)


999


Adjustments related to prior year tax filings


59


(105

)


(205

)

Other


-


(49

)


(104

)

Income tax expense (recovery)


(204

)


2,104


1,019


Current tax expense (recovery)


210


(3,521

)


1,064


Deferred tax expense (recovery)


(414

)


5,625


(45

)

Income tax expense


(204

)


2,104


1,019


For the Year Ended December 31,


2023


2022


2021


 Net loss before tax


(14,252

)


(54,942

)


(53,872

)

 Canadian statutory rate


24.6

%


24.4

%


23.3

%

 Expected income tax


(3,506

)


(13,406

)


(12,552

)


 Effect on taxes resulting from:


 Valuation allowance


4,224


13,590


12,046


 Non-deductible expenses


189


422


542


 Non-deductible stock-based compensation


-


23


189


 Tax rate impacts


(243

)


(665

)


(488

)

 Adjustments related to prior year tax filings


(332

)


57


59


 Income tax expense


332


21


(204

)


 Current tax expense


332


21


210


 Deferred tax recovery


-


-


(414

)

 Income tax expense


332


21


(204

)

The provision for income taxes is comprised of federal, state, provincial and foreign taxes based on pre-tax income. In the United States, the CARES Act of 2020 allows, among other provisions, for the recovery of taxes paid over the preceding five years from current year losses.

The Company’s U.S. subsidiary’s result was taxable income for the year ended December 31, 2023. The Company utilized prior year operating losses against this income; however, U.S. tax law does not allow for the full offset of losses against current year taxable income to reduce tax payable to zero. This resulted in current tax payable of $0.3 million in 2023.

74


Deferred tax assets and liabilities

Significant components of the Company’s deferred tax assets and liabilities as at December 31, 20212023 and 20202022 were as follows:


As at December 31, 2023


Assets


Liabilities


Net


 Operating losses


35,690


-


35,690


 Research and development expenditures


367


-


367


 Property and equipment


-


(3,883

)


(3,883

)

 Capitalized software and other assets


-


(1,033

)


(1,033

)

 Valuation allowance


-


(34,529

)


(34,529

)

 Other


3,388


-


3,388


 Net deferred taxes


39,445


(39,445

)


-


As at December 31, 2022


Assets


Liabilities


Net


 Operating losses


33,740


-


33,740


 Research and development expenditures


336


-


336


 Property and equipment


-


(6,017

)


(6,017

)

 Capitalized software and other assets


-


(1,599

)


(1,599

)

 Valuation allowance


-


(29,812

)


(29,812

)

 Other


3,352


-


3,352


 Net deferred taxes


37,428


(37,428

)


-


At December 31, 2021


Assets


Liabilities


Net


Operating losses


24,032


-


24,032


Research and development expenditures


362


-


362


Property and equipment


-


(7,572

)


(7,572

)

Capitalized software and other assets


-


(2,023

)


(2,023

)

Valuation allowance


(17,291

)


-


(17,291

)

Other


-


2,492


2,492


Net deferred taxes


7,103


(7,103

)


-


At December 31, 2020


Assets


Liabilities


Net


Operating losses


9,528


-


9,528


Research and development expenditures


360


-


360


Property and equipment


-


(2,218

)


(2,218

)

Capitalized software and other assets


-


(4,588

)


(4,588

)

Valuation allowance


-


(5,330

)


(5,330

)

Other


1,834


-


1,834


Net deferred taxes


11,722


(12,136

)


(414

)

Summary of temporary difference movements during the year:

Balance


Recognized


Foreign


Balance


Balance


Recognized


Foreign


Balance


January 1, 2021


in Income


Exchange


December 31, 2021


January 1, 2023


in Income


Exchange


December 31, 2023


Operating losses


9,528


14,542


(38

)


24,032


33,740


1,431


519


35,690


Research and development expenditures


360


(87

)


89


362


336


22


9


367


Property and equipment


(4,588

)


(2,844

)


(140

)


(7,572

)


(6,017

)


2,182


(48

)


(3,883

)

Capitalized software and other assets


(2,218

)


209


(14

)


(2,023

)


(1,599

)


583


(17

)


(1,033

)

Valuation allowance


(5,330

)


(12,046

)


85


(17,291

)


(29,812

)


(4,224

)


(493

)


(34,529

)

Other


1,834


640


18


2,492


3,352


6


30


3,388


Net deferred taxes


(414

)


414


-


-


-


-


-


-


Balance


Recognized


Foreign


Balance


January 1, 2022


in Income


Exchange


December 31, 2022


 Operating losses


24,032


10,924


(1,216

)


33,740


 Research and development expenditures


362


(3

)


(23

)


336


 Property and equipment


(7,572

)


1,410


145


(6,017

)

 Capitalized software and other assets


(2,023

)


311


113


(1,599

)

 Valuation allowance


(17,291

)


(13,590

)


1,069


(29,812

)

 Other


2,492


948


(88

)


3,352


 Net deferred taxes


-


-


-


-


Balance


Recognized


Foreign


Balance


January 1, 2020


in Income


Exchange


December 31, 2020


Operating losses


6,899


2,451


178


9,528


Research and development expenditures


353


594


(587

)


360


Property and equipment


(1,916

)


(3,600

)


928


(4,588

)

Capitalized software and other assets


(2,345

)


251


(124

)


(2,218

)

Valuation allowance


-


(5,241

)


(89

)


(5,330

)

Other


2,373


(80

)


(459

)


1,834


Net deferred taxes


5,364


(5,625

)


(153

)


(414

)

For the year ended December 31, 2021,2023, the Company recorded valuation allowances of $12.0$4.2 million against deferred tax assets (“DTAs”) incurred during the year asyear. A valuation allowance is recognized to the Company has experienced cumulative losses in recent years (December 31, 2020 –$5.2 million recorded in the Company’s Canadian entity). Although earnings were positive in 2019, ongoing near-term uncertainties on the business caused by the COVID-19 pandemic and the related decline in business activity impacted the Company’s ability to generate earnings. Accordingly,extent that it is not more likely than not that the Company’s DTAsdeferred tax assets will not be utilized in the near term.realized (2022 – $13.6 million).

The provincial corporate tax rate in Alberta, Canada was decreased on June 28, 2019 from 11.5% to 11% for the second half of 2019, and was scheduled to further reduce to 10% for 2020, 9% for 2021 and 8% thereafter. As part of Alberta’s Recovery Plan, the decrease in provincial tax rates was accelerated such that the provincial corporate tax rate is 8% effective July 1, 2020. As a result of this rate change, DIRTT reduced its DTAs by $0.9 million with a corresponding deferred income tax expense recorded in the second quarter of 2019.


The amount shown on the balance sheet as deferred income tax liabilities represent the net differences between the tax basis and book carrying values on the Company’s balance sheet at enacted tax rates.

On an annual basis, the Company and its subsidiariessubsidiary file tax returns in Canada and various foreign jurisdictions. In Canada, the Company’s federal and provincial tax returns for the years 20182019 to 20202022 remain subject to examination by taxation authorities. In the United States, both the federal and state tax returns filed for the years 20172018 to 20202022 remain subject to examination by the taxation authorities.

75


Tax loss carryforwards and other tax pools

The significant components of the Company’s net future income tax deductions in these consolidated financial statements are summarized as follows:


As at December 31,


2021


2020


2021


2020


2023


2022


2023


2022


Canadian Entity C$


US Entity $


C$


C$


$


$


Non-capital loss carry-forwards


64,961


45,299


42,220


-


114,119


106,730


55,469


55,654


Undepreciated capital costs


12,267


13,225


10,268


3,944


3,903


9,207


5,626


9,765


Share issuance costs


2,454


3,603


-


-


Scientific research and experimental development

tax incentives


1,971


1,971


-


-


1,971


1,971


-


-


Total future tax deductions


79,199


60,495


52,488


3,944


122,447


121,511


61,095


65,419


14.16. STOCK-BASED COMPENSATION

In May 2020, shareholders approved the DIRTT Environmental Solutions Ltd. Long-Term Incentive Plan (the “2020 LTIP”). The 2020 LTIP replaced the predecessor incentive plans, being the Performance Share Unit Plan (“PSU Plan”) and the Amended and Restated Stock Option Plan (“Stock Option Plan”). Following the approval of the 2020 LTIP, no further awards will be made under either the Stock Option Plan or the PSU Plan, but both remain in place to govern the terms of any awards that were granted pursuant to such plans and remain outstanding.

In May 2023, shareholders approved the DIRTT Environmental Solutions Ltd. Amended and Restated Long-Term Incentive Plan (the “2023 LTIP”) at the annual and special meeting of shareholders. The 20202023 LTIP gives the Company the ability to award options, share appreciation rights, restricted share units, deferred share units, restricted shares, dividend equivalent rights, granted in connection with restricted share units, vested share awards, and other share-based awards and cash awards to eligible employees, officers, consultants and directors of the Company and its affiliates. In accordance with the 20202023 LTIP, the sum of (i) 5,850,00012,350,000 common shares plus (ii) the number of common shares subject to stock options previously granted under the Company’s Amended and Restated Incentive Stock Option Plan (the “Stock Option Plan”) that, following May 22, 2020,30, 2023, expire or are cancelled or terminated without having been exercised in full, have been reserved for issuance under the 20202023 LTIP. Upon vesting of certain LTIP awards, the Company may withhold and sell shares as a means of meeting DIRTT’s tax withholding requirements in respect of the withholding tax remittances required in respect of award holders. To the extent the fair value of the withheld shares upon vesting exceeds the grant date fair value of the instrument, the excess amount is credited to retained earnings or deficit.

The Company also maintainsDeferred share units (“DSUs”) have historically been granted to non-employee directors under the DIRTT Environmental Solutions Ltd. Deferred Share Unit Plan for Non-Employee Directors pursuant(as amended and restated, the “DSU Plan”) and settleable only in cash. The 2023 LTIP gives the Company the ability to whichsettle DSUs are granted to the Company’s non-employee directors. DSUs are settled solely in cash.

Prior to the approvaleither cash or common shares, while consolidating future share-based awards under a single plan. The terms of the 2020 LTIP,DSU Plan are otherwise materially unchanged as incorporated into the Company granted awards of options under the Stock Option Plan and awards of performance share units (“PSUs”) under the DIRTT Environmental Solutions Ltd. Performance Share Unit Plan (the “PSU Plan”). Following the approval of the 2020 LTIP,2023 LTIP. Effective May 30, 2023, no furthernew awards will be made under either the Stock Option Plan or the PSUDSU Plan, but both remain in placeawards previously granted under the DSU Plan will continue to governbe governed by the termsDSU Plan. DSUs are settled following cessation of any awards that were granted pursuant to such plans and remain outstandingservices with the Company.

Stock-based compensation expense


For the Year Ended December 31,


2023


2022


2021


Equity-settled awards


2,331


3,943


4,453


Cash-settled awards


(25

)


334


260


2,306


4,277


4,713


For the Year Ended December 31,


2021


2020


2019


Equity-settled awards


4,453


1,832


3,512


Cash-settled awards


260


519


364


4,713


2,351


3,876


76


The following summarizes RSUs, Share Awards, PSUs, and DSUs and RSUs granted, exercised, forfeited and expiredactivity during the periods:


RSU Time-


RSU Performance-


Based


Based


DSU


PSU


RSU Time-


RSU Performance-


Share


Number of


Number of


Number of


Number of


Based


Based


Awards


PSU


DSU


units


units


units


units


Number of


Number of


Number of


Number of


Number of


Outstanding at December 31, 2019


-


-


132,597


223,052


units


units


units


units


units


Outstanding at December 31, 2021


3,216,536


1,021,739


-


157,200


361,577


Granted


2,419,609


200,000


251,470


-


2,157,149


863,279


222,170


-


1,305,658


Exercised


-


-


(20,403

)


-


Forfeited


(5,546

)


-


-


(25,581

)

Outstanding at December 31, 2020


2,414,063


200,000


363,664


197,471


Granted


1,976,697


878,601


144,969


-


Vested


(661,775

)


(2,294

)


(147,056

)


(34,635

)

Vested or settled


(2,199,034

)


(796,011

)


(154,016

)


-


(501,916

)

Withheld to settle employee tax obligations


(174,103

)


(1,960

)


-


-


(526,346

)


(242,460

)


(68,154

)


-


-


Forfeited


(338,346

)


(52,608

)


-


(5,636

)


(762,968

)


(502,628

)


-


(157,200

)


-


Outstanding at December 31, 2021


3,216,536


1,021,739


361,577


157,200


Outstanding at December 31, 2022


1,885,337


343,919


-


-


1,165,319


Granted


3,599,500


-


522,883


2,584,161


2,276,731


Vested or settled


(1,105,225

)


(258,760

)


(522,883

)


-


(355,878

)

Withheld to settle employee tax obligations


(64,230

)


-


-


-


-


Forfeited


(783,655

)


(21,130

)


-


(738,553

)


-


Expired


(1,163

)


-


-


-


-


Outstanding at December 31, 2023


3,530,564


64,029


-


1,845,608


3,086,172


Restricted share units (time-based vesting)

Restricted share units that vest based on time have an aggregate time-based vesting period of three years and generally one-third of the RSUs vest every year over a three-year period from the date of grant (the “RSU’s”“RSUs”). At the end of a three-year term, the associated RSUs will be settled by way of the provision of cash or shares to employees (or a combination thereof), at the discretion of the Company. The weighted average fair value of the RSUs granted in 20212023 was C$2.78 (20200.46 (2022 – C$2.05)2.37), which was determined using the closing price of the Company’s common shares on their respective grant dates. During 2023, 150,000 RSUs were granted to each of the chief executive officer, chief operations officer and chief financial officer which vest in one year.

Restricted share units (performance-based vesting)

During 2022 and 2021, restricted share units were granted to executives with service and performance-based conditions for vesting (the “Performance RSUs” or “PRSUs”), if. If the Company’s share price increases to certain values for 20 consecutive trading days, as outlined below, a percentage of the PRSUs will vest at the end of the three-year service period.

Theperiod or on their departure, based on terms agreed. All PRSUs awarded in 2020 grant was for onewere awarded to a single executive if the Company’s share price increases to C$3.00 for 20 consecutive trading days within three years of the grant date, then 50% (100,000) of the Performance RSUs will vest at the end of the three-year service period. If the Company’s share price increases to C$4.00 for 20 consecutive trading days within three years of the grant date, 100% (200,000) of the Performance RSUs will vest at the end of the three-year service period. If the Company’s share price increases to C$6.00 for 20 consecutive trading days within three years of the grant date, then 150% (300,000) of the Performance RSUs will vest at the end of the three-year service period. Onwho forfeited those awards in January 18, 2022 these awards were forfeited upon the departure of the executive from the Company.

The grant date fair value of the 2022 and 2021 and 2020 Performance RSUsPRSUs were valued using the Monte Carlo valuation method and determined to have a weighted average grant date fair value of C$3.271.87 and C$1.70,3.27, respectively.

Based on share price performance since the date of grant, 66.7%none of the 20212022 PRSUs and 100%66.7% of the 20202021 PRSUs will vest upon completion of the three-year service period.


% of PRSUs vesting


33.3%

50.0%

66.7%

100.0%

150.0%

2021 PRSUs

$3.00

-

$4.00

$5.00

$7.00

2020 PRSUs

-

C$3.00

-

C$4.00

C$6.00


% of PRSUs Vesting


33.3

%


66.7

%


100.0

%


150.0

%

2021 and 2022 PRSUs


$

3.00


$

4.00


$

5.00


$

7.00


DeferredShare awards

During the first quarter of 2022, certain executives were issued share units

awards in lieu of cash paid variable incentive compensation (“Share Awards”). These Share Awards vested upon grant. The fair value of the Share Awards granted was C$2.40 ($1.88), which was determined using the closing price of the Company’s common shares on the grant date. In the fourth quarter of 2022, 59,488 Share Awards were issued to employees as a component of their compensation.

77


In the first quarter of 2023, 36,254 Share Awards were issued to a consultant as compensation for services rendered. During the second quarter of 2023, certain executives were issued Share Awards in lieu of cash paid variable incentive compensation. These Share Awards vested upon grant. The fair value of the Share Awards granted was C$0.49 ($0.34), which was determined using the closing price of the Company’s common shares on the grant date.

Performance share units

During the second quarter of 2023, certain executives were issued a strategic equity grant through Performance Share Units (“PSUs”). The performance period of the PSUs is from January 1, 2023, to December 31, 2026, with a cliff vesting term for December 31, 2026. 2,584,161 PSUs were granted and depending on the level of performance, the PSUs will vest 100%, 160% or 190% up to a maximum of 4,909,907 PSUs. Settlement will be made in the form of shares issued from treasury. The performance measures are a combination of Revenue and Earnings Before Interest, Taxes, Depreciation and Amortization and both targets have to be achieved. As of December 31, 2023, the fair value of these PSUs have been deemed to be nil based on the likelihood of achieving the targets compared to current results. During the third quarter of 2023, 738,553 PSUs with a $nil value were forfeited as a result of an executive departure and 1,845,608 PSUs with a $nil value are outstanding as at December 31, 2023.

Deferred share units

Granted under the DSU Plan

The fair value of the DSU liability and the corresponding expense is charged to profit or loss at the grant date. Subsequently, at each reporting date between the grant date and settlement date, the fair value of the liability is remeasured with any changes in fair value recognized in profit orthe statement of operations and comprehensive loss for the year.period. The weighted average fair value of the DSUs granted in 2023 was C$0.63 ($0.47), which was determined using the closing price of the Company’s common shares on the grant date. DSUs outstanding at December 31, 20212023, had a fair value of $0.8$0.5 million which is included in other liabilities on the balance sheet (2020(2022 $0.9$0.6 million).


Performance share units

UnderGranted under the terms2023 LTIP

DSUs granted after May 30, 2023, (the “New DSUs”) will be settled by way of the PSU Plan, PSUs granted vestprovision of cash or shares (or a combination thereof) to the Directors, at the enddiscretion of a three-year term. At the endCompany. The Company intends to settle these DSUs through issuances of a three-year term, employees will be awarded cash, calculated based on certain Adjusted EBITDA, total shareholder return, or revenue growth related to performance conditions.

common shares. The weighted average fair value of the liability andNew DSUs granted in 2023 was C$0.46 ($0.34), which was determined using the expense attributable toclosing price of the vesting period is charged to profit or loss atCompany’s common shares on the grant date. Subsequently, at each reporting date between the grant date and settlement date, the fair value of the liability is remeasured with any changes in fair value recognized in profit or loss. AsNew DSUs outstanding at December 31, 2021, outstanding PSUs2023, had a fair value of $nil$0.6 million which is included in other liabilities on the balance sheet (2020(2022 $0.1 million)$nil).


Options

In 2018, the Company allowed certain vested stock options to be surrendered by their holders for cash. On October 9, 2019, following the listing of its common shares on Nasdaq, the Company ceased permitting the cash-settlement of stock options and the associated liability accounting for stock options. In 2019, $1.8 million was expensed to adjust the liability to fair value, and an additional $0.4 million was charged back to paid-in capital as, for certain stock options, the cumulative expense calculated was lower that the grant date fair value of the original equity awards. During 2019, $3.6 million of stock options were surrendered by their holders for cash.     

The following summarizes options granted, exercised, forfeited and expired during the periods:


Number of


Weighted average


options


exercise price C$


Outstanding at December 31, 2021


4,064,489


6.64


Forfeited or expired


(2,584,420

)


6.41


Outstanding at December 31, 2022


1,480,069


7.03


Forfeited or expired


(1,270,660

)


7.00


Outstanding at December 31, 2023


209,409


7.71


Exercisable at December 31, 2023


209,409


7.71


Number of


Weighted average


options


exercise price C$


Outstanding at December 31, 2019


6,156,652


6.49


Forfeited


(227,368

)


6.81


Expired


(1,154,956

)


6.29


Outstanding at December 31, 2020


4,774,328


6.52


Forfeited


(44,102

)


7.05


Expired


(665,737

)


5.76


Outstanding at December 31, 2021


4,064,489


6.64


Exercisable at December 31, 2021


2,079,479


6.71


In 2018, 1,725,000 stock options were granted to an executive with performance conditions for vesting. For 825,000 stock options, vesting is conditioned upon an increase in the Company’s share price to C$13.26, and for 900,000 stock options, vesting is conditioned upon an increase in the Company’s share price to C$19.89. These options were valued using the Monte Carlo valuation method and determined to have a weighted average grant fair value of C$2.14 on original grant. These awards were accounted for at the fair value attributable to the vesting period until October 9, 2019 when these were reclassified to equity accounting and were re-valued at a weighted average fair value of C$0.83. On January 18, 2022, these awards were forfeited upon the departure of the executive from the Company.

Range of exercise prices outstanding at December 31, 2021:2023:


Options outstanding


Options exercisable


Weighted


Weighted


Weighted


Weighted


average


average


average


average


Number


remaining


exercise


Number


remaining


exercise


 Range of exercise prices


outstanding


life


price C$


exercisable


life


price C$


C$6.01 – C$7.00


16,350


0.71


$

6.12


16,350


0.71


$

6.12


C$7.01 – C$8.00


193,059


0.38


$

7.84


193,059


0.38


$

7.84


Total


209,409


209,409


Options outstanding


Options exercisable


Weighted


Weighted


Weighted


Weighted


average


average


average


average


Number


remaining


exercise


Number


remaining


exercise


Range of exercise prices


outstanding


life


price C$


exercisable


life


price C$


C$4.01 – C$5.00


22,537


2.89


4.12


15,025


2.89


4.12


C$5.01 – C$6.00


-


-


-


-


-


-


C$6.01 – C$7.00


3,281,199


1.79


6.38


1,549,301


1.87


6.36


C$7.01 – C$8.00


760,753


2.37


7.84


515,153


2.37


7.84


Total


4,064,489


2,079,479


78


Range of exercise prices outstanding at December 31, 2020:2022:


Options outstanding


Options exercisable


Options outstanding


Options exercisable


Weighted


Weighted


Weighted


Weighted


Weighted


Weighted


Weighted


Weighted


average


average


average


average


average


average


average


average


Number


remaining


exercise


Number


remaining


exercise


Number


remaining


exercise


Number


remaining


exercise


Range of exercise prices


outstanding


life


price C$


exercisable


life


price C$


outstanding


life


price C$


exercisable


life


price C$


C$4.01 – C$5.00


22,537


3.89


4.12


7,513


3.89


4.12


C$5.01 – C$6.00


669,236


0.89


5.76


669,236


0.89


5.76


C$4.01 – C$6.00


15,025


1.89


4.12


15,025


1.89


4.12


C$6.01 – C$7.00


3,299,993


2.79


6.38


1,126,772


2.93


6.34


758,142


1.07


6.33


758,142


1.07


6.33


C$7.01 – C$8.00


782,562


3.37


7.84


262,417


3.37


7.84


706,902


1.37


7.84


706,902


1.37


7.84


Total


4,774,328


2,065,938


1,480,069


1,480,069


The stock options granted had a weighted average grant date fair value ofC$2.40 in 2019,estimated using the Black-Scholes option-pricing model with the following assumptions for December 31, 2019: a 3.5 year expected life for all periods, 1.6% risk-free interest rate; a 4.2% expected forfeitures rate;and 39.2% expected volatility.These awards were accounted for using the fair value approach as they were accounted for as liabilities until October 9, 2019 when the Company ceased allowing cash surrenders of stock options. On October 9, 2019, the stock options had a weighted average fair value of C$1.32 estimated using the Black-Scholes option pricing model with the following assumptions: a 2.9 year expected life, 1.4% risk-free interest rate; and 39.2% expected volatility.  

Dilutive instruments

For the year ended December 31, 2021, 4.12023, 0.2 million options (2020(20224.81.5 million, 201920210.54.1 million) and 3.43.6 million RSUs and PRSUs (2020(20222.72.2 million, 2019 -2021 – 3.4 million), 1.8 million new DSUs (2022 and 2021 – nil) and 27.4156.8 million shares which would be issued if the principal amount of the Debentures were settled in our common shares at the year endyear-end share price (2020(2022 – 109.1 million and 2019 - nil)2021 – 27.4 million) were excluded from the diluted weighted average number of common shares calculation as their effect would have been anti-dilutive to the net loss per share.

17. NET LOSS PER SHARE


15.On November 21, 2023, the Company announced a Rights Offering which allowed holders of common shares, as of the close of business on December 12, 2023, transferable subscription rights to purchase up to an aggregate of 85,714,285 common shares at a subscription price of C$0.35 per common share (refer to Note 23). An adjustment is required on the calculation of net loss per share for the year ended December 31, 2023, as well as retrospectively for the years ended December 31, 2022 and December 31, 2021, to account for the bonus factor that resulted from this event.


For the year ended December 31,


2023


2022


2021


Net loss per share − basic and diluted


Net loss after tax (thousands of U.S. dollars)


$

(14,584

)


$

(54,963

)


$

(53,668

)

Weighted average number of shares outstanding (thousands of shares as previously reported)


101,984


87,662


85,027


Weighted average number of shares outstanding (thousands of shares restated)


116,135


99,826


96,826


Net loss per share − basic and diluted (as previously calculated, prior to Rights Offering)


$

(0.14

)


$

(0.63

)


$

(0.63

)

Net loss per share − basic and diluted (as on the Consolidated Statement of Comprehensive Income)


$

(0.13

)


$

(0.55

)


$

(0.55

)

18. REVENUE

In the following table, revenue is disaggregated by performance obligation and timing of revenue recognition. All revenue comes from contracts with customers. SeeRefer to Note 1619 for the disaggregation of revenue by geographic region.


For the Year Ended December 31,


2023


2022


2021


Product


158,405


147,448


129,031


Transportation


17,674


18,030


13,231


License fees from Construction Partners


840


778


738


Total product revenue


176,919


166,256


143,000


Installation and other services


5,012


5,905


4,593


181,931


172,161


147,593


For the Year Ended December 31,


2021


2020


2019


Product


129,031


150,004


215,109


Transportation


13,231


15,491


23,903


License fees from Distribution

   Partners


738


1,194


1,647


Total product revenue


143,000


166,689


240,659


Installation and other services


4,593


4,818


7,076


147,593


171,507


247,735


79


DIRTT sells its products and services pursuant to fixed-price contracts which generally have a term of one year or less. The transaction price used in determining the amount of revenue to recognize from fixed-price contracts is based upon agreed contractual terms with each customer and is not subject to variability.


For the Year Ended December 31,


For the Year Ended December 31,


2021


2020


2019


2023


2022


2021


At a point in time


142,262


165,495


239,012


176,079


165,478


142,262


Over time


5,331


6,012


8,723


5,852


6,683


5,331


147,593


171,507


247,735


181,931


172,161


147,593


Revenue recognized at a point in time represents the majority of the Company’s sales. Revenue is recognized when a customer obtains legal title to the product, which is when ownership of the product is transferred to, or services are delivered to, the customer.


Revenue recognized over time is limited to installation and ongoing maintenance contracts with customers and is recorded as performance obligations are satisfied over the term of the contract.

Contract Liabilities


As at December 31,


As at December 31,


2021


2020


2019


2023


2022


2021


Customer deposits


1,959


1,292


2,436


5,290


4,458


1,959


Deferred revenue


461


527


1,131


-


408


461


Contract liabilities


2,420


1,819


3,567


5,290


4,866


2,420


Contract liabilities primarily relate to deposits received from customers and maintenance revenue from license subscriptions. The balance of contract liabilities was higher as at December 31, 20212023, compared to the prior year period mainly due to the timing of orders and payments. Contract liabilities as at December 31, 20202022 and 2019,2021, respectively, totaling $1.8$4.9 million and $3.6$2.4 million were recognized as revenue during 20212023 and 2020,2022, respectively.

Sales by Industry

The Company periodically reviews product revenue by industry vertical market to evaluate trends and the success of industry specific sales initiatives. The nature of products sold to the various industries is consistent and therefore the periodic review is focused on sales performance.


For the Year Ended December 31,


For the Year Ended December 31,


2021


2020


2019


2023


2022


2021


Commercial


84,488


102,245


158,256


116,693


115,102


84,488


Healthcare


30,130


35,400


44,197


33,970


19,739


30,130


Government


16,012


14,128


14,879


13,446


16,564


16,012


Education


11,632


13,722


21,680


11,970


14,073


11,632


License fees from Distribution

Partners


738


1,194


1,647


Total product revenue


143,000


166,689


240,659


Service revenue


4,593


4,818


7,076


License fees from Construction Partners


840


778


738


Total product and transportation revenue


176,919


166,256


143,000


Installation and other services


5,012


5,905


4,593


147,593


171,507


247,735


181,931


172,161


147,593


16.19. SEGMENT REPORTING

The Company has 1one reportable and operating segment, and operates in 2two principal geographic locations, Canada and the United States. Revenue continues to be derived almost exclusively from projects in North America and predominantly from the United States. The Company’s revenue from operations from external customers, based on location of operations, and information about its non-current assets, is detailed below.

80


Revenue from external customers


For the Year Ended December 31,


2023


2022


2021


Canada


19,934


25,477


17,299


U.S.


161,997


146,684


130,294


181,931


172,161


147,593


For the Year Ended December 31,


2021


2020


2019


Canada


17,299


18,848


34,085


U.S.


130,294


152,659


213,650


147,593


171,507


247,735


Non-current assets excluding deferred tax


As at December 31,


2023


2022


Canada


30,033


28,251


U.S.


30,759


53,277


60,792


81,528


The DIRTT solution segment derives revenues from customers by providing physical products and digital tools through our ICE software to create interior spaces for our customers across commercial, healthcare, education and government industries. The accounting policies of the solution segment are the same as those described in Note 2 - significant accounting policies.

The chief operating decision maker assesses performance for the solution segment and decides how to allocate resources based on gross profit and net loss that also is reported on the consolidated statement of operations and comprehensive loss as consolidated gross profit and net loss. The measure of segment assets


As at December 31,


2021


2020


Canada


34,912


42,947


U.S.


60,723


55,352


95,635


98,299


is reported on the balance sheet as total consolidated assets. The chief operating decision maker uses net income to evaluate income generated from segment assets (return on assets) in deciding whether to reinvest profits into the solution segment or into other parts of the entity, such as to repay long term debt.

Gross profit and net income (loss) are used to monitor budget versus actual results. The chief operating decision maker also uses net income in competitive analysis by benchmarking to DIRTT’s competitors. The competitive analysis along with the monitoring of budgeted versus actual results are used in assessing performance of the segment and in establishing management’s compensation.

DIRTT has one reportable segment: Solutions. The solutions segment provides digital tools (access to ICE software) and physical products to create modular interior construction spaces for our customers. DIRTT derives revenue in North America and manages the business activities on a consolidated basis. The technology used in the customer arrangements is based on a single software platform that is deployed to, and implemented by, customers in a similar manner. DIRTT’s chief operating decision maker is the executive leadership team that includes the chief operating officer, chief financial officer, and the chief executive officer.


20. COMMITMENTS

(1)

Amounts include property, plant and equipment, capitalized software, operating lease right-of-use assets, goodwill and other assets. Goodwill was included in the Canadian segment.

17. COMMITMENTS

As at December 31, 2021,2023, the Company had outstanding purchase obligations of approximately $3.7$2.8 million related to inventory and property, plant and equipment purchases (December 31, 2020(2022$3.2$2.2 million). Refer to Note 58 for lease commitments.

18.21. LEGAL PROCEEDINGS

The Company is pursuing multiple lawsuits against its former founders, Mogens Smed and Barrie Loberg, their new company Falkbuilt Ltd. (“Falkbuilt”), and other related individual and corporate defendants for violations of fiduciary duties and non-competition and non-solicitation covenants contained in their executive employment agreements, and the misappropriation of DIRTT’s confidential and proprietary information in violation of numerous Canadian and U.S. state, and federal laws pertaining to the protection of DIRTT’s trade secrets and proprietary information and the prevention of false advertising and deceptive trade practices.

81


As of December 31, 2021,2023, the Company’s litigation against Falkbuilt, Messrs. Smed and Loberg, and their associates was comprised of fourthree main lawsuits: (i) an action in the Alberta Court of Queen’sKing’s Bench instituted on May 9, 2019, against Falkbuilt, Messrs. Smed and Loberg, and several other former DIRTT employees alleging breaches of restrictive covenants, fiduciary duties, and duties of loyalty, fidelity and confidentiality, and the misappropriation of DIRTT’s confidential information (the “Canadian Non-Compete Case”); (ii) an action in the U.S. District Court for the Northern District of Utah instituted on December 11, 2019, against Falkbuilt, Smed, and other individual and corporate defendants alleging misappropriation of DIRTT’s confidential information, trade secrets, business intelligence and customer information (the “Utah Misappropriation Case”); (iii) an action for federal patent infringement in the U.S. District Court for the Northern District of Illinois instituted on August 6, 2020 against Falkbuilt, alleging that Falkbuilt is infringing certain of DIRTT’s patents relating to our proprietary ICE® software (the “Patent Infringement Case”); and (iv)(iii) an action in the U.S. District Court for the Northern District of Texas instituted on June 24, 2021, alleging that Falkbuilt has unlawfully used DIRTT’s confidential information in the United States and intentionally caused confusion in the United States in an attempt to steal customers, opportunities, and business intelligence, with the aim of establishing a competing business in the United States market (the “Texas Unfair Competition Case”). DIRTT intends to pursue the cases vigorously. We recently requested the Court of King’s Bench of Alberta to schedule the summary judgment application for our Canadian litigation. The court has proposed three potential dates in September 2025 and we expect to have the date finalized in the next several weeks.

Falkbuilt also filed a lawsuit against the Company on November 5, 2019, in the Court of Queen’sKing’s Bench of Alberta, alleging that DIRTT has misappropriated and misused their alleged proprietary information in furtherance of DIRTT’s product development. Falkbuilt seeks monetary relief and an interim, interlocutory and permanent injunction of DIRTT’s alleged use of the alleged proprietary information. The Company believes that the suit is without merit and filed an application for summary judgementjudgment to dismiss Falkbuilt’s claim.

NaNNo amounts are accrued for the above legal proceedings.

22. RELATED PARTY TRANSACTIONS

19.On November 30, 2022, the Company closed a private placement of 8,667,449 common shares for aggregate gross consideration of $2.8 million (the “Private Placement”) with its two largest shareholders, 22 NW Fund, LP (“22NW”) and 726 BC LLC and 726 BF LLC (together “726”) and all the directors and officers, including 638,996 common shares issued at the deemed per share price equal to the Subscription Price, as reimbursement for the costs incurred by 726 in connection with the Company’s contested director elections in 2022.

On March 15, 2023, the Company entered into a Debt Settlement Agreement (the “Debt Settlement Agreement”) with 22NW and Aron English, 22NW’s principal and a director of DIRTT, (together, the "22NW Group") who, collectively, beneficially owned approximately 19.5% of the Company’s issued and outstanding common shares at such time.

Pursuant to the Debt Settlement Agreement, the Company agreed to reimburse the 22NW Group for the costs incurred by the 22NW Group in connection with the contested director election at the annual and special meeting of shareholders of the Company held on April 26, 2022, being approximately $1.6 million (the “Debt”). Pursuant to the Debt Settlement Agreement, the Company agreed to repay the Debt by either, or a combination of (i) a payment in cash by the Company to the 22NW Group, and/or (ii) the issuance of equity securities of the Company to the 22NW Group. In connection with the Debt Settlement Agreement, on March 15, 2023, the Company entered into a share issuance agreement with the 22NW Group, pursuant to which the Company agreed to repay the Debt with the issuance to the 22NW Group of 3,899,745 common shares at a deemed price of $0.40 per common share, subject to approval by the Company’s shareholders. At the annual general and special meeting of shareholders held on May 30, 2023, shareholders voted to approve the issuance of common shares to 22NW Group, and on June 2, 2023, the Company issued 3,899,745 common shares to 22NW Group as repayment for the Debt. Upon settlement, the debt was revalued at the higher of the deemed price of $0.40 per common share and the May 30, 2023, market price of $0.38 per common share resulting in a recovery from the balance recorded at March 31, 2023, which had been valued at a price of $0.53 per common share.

As at December 31, 2023, C$18.9 million and C$13.6 million of the January Debentures and December Debentures, respectively, are held by 22NW Group. Interest accrued on the debentures owned by 22NW Group for the year ended December 31, 2023, is C$0.4 million and interest expense paid was C$0.5 million (2022 – $nil and $nil respectively). Interest is earned on terms applicable to all Debenture holders.

Other related party transactions for the year ended December 31, 2023, relate to the sale of DIRTT products and services to the 22NW Group for $0.3 million (2022 – $nil). The sale to 22NW Group was based on price lists in force and terms that are available to all employees. 2023 reorganization costs include $nil paid to related parties (2022 - $0.2 million).

23. SUBSEQUENT EVENTS

On February 22, 2022,November 21, 2023, the Company announced that the Board of Directors had approved a Rights Offering to its common shareholders for aggregate gross proceeds of C$30.0 million.

82


In connection with the Rights Offering, the Company entered into a standby purchase agreement with 22NW Fund, LP (“22NW”) and 726 dated November 20, 2023 (the “Standby Purchase Agreement”), pursuant to which each of 22NW and 726, or their permitted assigns (collectively and including WWT Opportunity #1 LLC, to which 726 transferred their entire holdings on December 1, 2023, the “Standby Purchasers”). Subject to the terms and conditions of the Standby Agreement, each Standby Purchaser agreed to exercise its Basic Subscription Privilege in full and to collectively purchase from the Company, at the Subscription Price, all common shares not subscribed for by holders of Rights under the Basic Subscription Privilege or Additional Subscription Privilege, up to a maximum of C$15.0 million each, so that the maximum number of common shares that may be issued in connection with the Rights Offering will be issued and the Company will receive aggregate gross proceeds of C$30.0 million. No standby fee will be paid to the Standby Purchasers in connection with the Rights Offering; however, DIRTT will reimburse the Standby Purchasers for their reasonable expenses in connection with the Standby Agreement up to a maximum of C$30,000.

On January 9, 2024, the Company announced the intentioncompletion of the Rights Offering to close its Phoenix facility,common shareholders and the issuance of 85,714,285 common shares at a price of C$0.35 ($0.26) per whole Common Share for aggregate gross proceeds of C$30.0 million ($22.4 million). Each right distributed under the Rights Offering (each, a “Right”) entitled eligible holders to subscribe for 0.81790023 common shares, exercisable for whole common shares only, meaning 1.22264301 Rights were required to purchase one Common Share (the “Basic Subscription Privilege”). In accordance with applicable law, the Rights Offering included an additional subscription privilege (the “Additional Subscription Privilege”) under which eligible holders of Rights who fully exercised the Rights issued to them under their Basic Subscription Privilege, were entitled to subscribe for additional common shares, on a pro rata basis, that were not otherwise subscribed for under the Basic Subscription Privilege.

DIRTT issued an aggregate of 67,379,471 common shares pursuant to the Basic Subscription Privilege and 18,334,814 common shares pursuant to the Additional Subscription Privilege. As a result of the common shares issued under the Basic Subscription Privilege and Additional Subscription Privilege, no common shares were available for issuance pursuant to the Standby Agreement.

On February 4, 2024, the Company entered into a Litigation Funding Agreement with a third party for the funding of up to $4.0 million of litigation costs in respect of specific claims against Falkbuilt, Inc., Falkbuilt Ltd. and Henderson. In return, the Company has agreed to pay from any proceeds received from the settlement of such claims, a reimbursement of funded amounts plus diligence and underwriting costs, plus a multiple of such funded amount based on certain milestones.

On February 15, 2024, the Company announced a substantial issuer bid and tender offer (the "Issuer Bid"), under which the Company will offer to repurchase for cancellation: (i) up to C$6,000,000 principal amount of its issued and outstanding January Debentures (or such larger principal amount as wellthe Company, in its sole discretion, may determine it is willing to take‑up and pay for, subject to applicable law) at a purchase price of C$720 per C$1,000 principal amount of January Debentures; and (ii) up to C$9,000,000 principal amount of its issued and outstanding December Debentures (or such larger principal amount as an 18% reductionthe Company, in its sole discretion, may determine it is willing to take‑up and pay for, subject to applicable law) at a purchase price of C$600 per C$1,000 principal amount of December Debentures. Holders of Debentures who validly tender and do not withdraw their Debentures will receive the applicable purchase price, plus a cash payment for all accrued and unpaid interest up to, but excluding, the date on which such Debentures are taken up by the Company. The applicable purchase price will be denominated in Canadian dollars and payments of amounts owed to holders of deposited Debentures, including for interest, will be made in Canadian dollars. The Issuer Bid will remain open for acceptance until 5:00 p.m. (Eastern Standard Time) on March 22, 2024, unless withdrawn or extended by the Company. If the aggregate principal amount of the Debentures properly tendered and not withdrawn under the Issuer Bid exceeds C$6,000,000 for the January Debentures or C$9,000,000 for the December Debentures, the Company will purchase a pro-rated portion of the January Debentures or the December Debentures so tendered, as applicable (with adjustments to maintain C$1,000 minimum denominations of Debentures). DIRTT will return all Debentures not purchased under the Issuer Bid, including Debentures not purchased because of pro-ration. Debentures taken up and paid for by the Company will be immediately cancelled.

The Company intends to fund the Issuer Bid with a portion of the proceeds from the Company’s salaried workforce. One-time costs associated with these reductions,previously completed Rights Offering to be incurredits common shareholders, which closed in the first halfJanuary 2024 for aggregate gross proceeds of 2022, are expected to be approximately $5.0C$30.0 million.

83


Item 9. Changes in and Disagreements With Accountants on Accounting and Financial Disclosure.

None.


Item 9A. Controls and Procedures.

Item 9.

Changes in and Disagreements With Accountants on Accounting and Financial Disclosure.

None.

Item 9A.

Controls and Procedures.

Evaluation of Disclosure Controls and Procedures

Disclosure controls and procedures are controls and other procedures that are designed to ensure that information required to be disclosed in our reports filed or submitted under the Exchange Act is recorded, processed, summarized and reported within the time periods specified in the SEC’s rules and forms. Disclosure controls and procedures include, without limitation, controls and procedures designed to ensure that information required to be disclosed in the Company’s reports filed or submitted under the Exchange Act is accumulated and communicated to management, including our principal executive officer and principal financial officer, as appropriate to allow timely decisions regarding required disclosure.

As required by Rule 13a-15 under the Exchange Act, our principal executive officer and principal financial officer carried out an evaluation of the effectiveness of the design and operation of our disclosure controls and procedures as of December 31, 2021.2023. Based upon their evaluation, our principal executive officer and principal financial officer concluded that our disclosure controls and procedures (as defined in Rules 13a-15(e) and 15d-15(e) under the Exchange Act) were effective.

Management’s Annual Report on Internal Control Over Financial Reporting

Our management is responsible for establishing and maintaining adequate internal control over financial reporting, as such term is defined in Rule 13a-15(f) and 15(d)-15(f)15d-15(f) under the Exchange Act, as amended. Our management conducted an evaluation of the effectiveness of our internal control over financial reporting based on the 2013 framework in Internal Control—Integrated Framework issued by the Committee of Sponsoring Organizations of the Treadway Commission (COSO framework) to evaluate the effectiveness of internal control over financial reporting. Management believes that the COSO framework is a suitable framework for its evaluation of financial reporting because it is free from bias, permits reasonably consistent qualitative and quantitative measurements of our internal control over financial reporting, is sufficiently complete so that those relevant factors that would alter a conclusion about the effectiveness of our internal control over financial reporting are not omitted and is relevant to an evaluation of internal control over financial reporting.

Based on its evaluation under the framework in Internal Control—Integrated Framework, our management concluded that the Company maintained effective internal control over financial reporting at a reasonable assurance level as of December 31, 2021,2023, based on those criteria.

Changes in Internal Control Over Financial Reporting

There have been no changes in our internal control over financial reporting (as defined in Rule 13a-15(f) and 15(d)-15(f)15d-15(f) under the Exchange Act) during the quarter ended December 31, 2021,2023, that have materially affected, or are reasonably likely to materially affect, our internal control over financial reporting.

Item 9B. Other Information.

None.

Item 9C. Disclosure Regarding Foreign Jurisdictions that Prevent Inspections

Item 9B.

Other Information.

None.

Item 9C.

Disclosure Regarding Foreign Jurisdictions that Prevent Inspections

Not applicable.


84


PART III

Item 10. Directors, Executive Officers and Corporate Governance.

Item 10.

Directors, Executive Officers and Corporate Governance.

The information required by this Item is incorporated herein by reference to the information that will be contained in our information circular and proxy statement (“proxy statement”) related to the 20222024 Annual Meeting of Shareholders, which we intend to file with the SEC within 120 days of the end of our fiscal year pursuant to General Instruction G(3) of Form 10-K.

Item 11. Executive Compensation.

Item 11.

Executive Compensation.

The information required by this Item is incorporated herein by reference to the information that will be contained in our proxy statement related to the 20222024 Annual Meeting of Shareholders, which we intend to file with the SEC within 120 days of the end of our fiscal year pursuant to General Instruction G(3) of Form 10-K.

Item 12. Security Ownership of Certain Beneficial Owners and Management and Related Stockholder Matters.

Item 12.

Security Ownership of Certain Beneficial Owners and Management and Related Stockholder Matters.

The information required by this Item is incorporated herein by reference to the information that will be contained in our proxy statement related to the 20222024 Annual Meeting of Shareholders, which we intend to file with the SEC within 120 days of the end of our fiscal year pursuant to General Instruction G(3) of Form 10-K.

Item 13.

The information required by this Item is incorporated herein by reference to the information that will be contained in our proxy statement related to the 20222024 Annual Meeting of Shareholders, which we intend to file with the SEC within 120 days of the end of our fiscal year pursuant to General Instruction G(3) of Form 10-K.

Item 14. Principal Accounting Fees and Services.

Item 14.

Principal Accounting Fees and Services.

The information required by this Item is incorporated herein by reference to the information that will be contained in our proxy statement related to the 20222024 Annual Meeting of Shareholders, which we intend to file with the SEC within 120 days of the end of our fiscal year pursuant to General Instruction G(3) of Form 10-K.


85


PART IV

Item 15. Exhibits, Financial Statement Schedules.

(a)
The following documents are filed as part of the report:
(1)
Financial Statements

Item 15.

Exhibits, Financial Statement Schedules.

(a)

The following documents are filed as part of the report:

(1)

Financial Statements

Report of Independent Registered Public Accounting Firm

Consolidated Balance Sheets, as at December 31, 20212023 and 20202022

Consolidated Statements of Operations and Comprehensive Loss for the Years Ended December 31, 2021, 20202023, 2022 and 20192021

Consolidated Statements of Changes in Shareholders’ Equity for the Years Ended December 31, 2021, 20202023, 2022 and 20192021

Consolidated Statements of Cash Flows for the Years Ended December 31, 2021, 20202023, 2022 and 20192021

Notes to the Consolidated Financial Statements

(2)
Financial Statement Schedules

(2)

Financial Statement Schedules

All schedules have been omitted as they are either not required or not applicable or the required information is included in the Consolidated Financial Statements or notes thereto.

(3)
See Item 15(b)
(b)
Exhibits:

Exhibit

No.

(3)

See Item 15(b)

(b)

Exhibits:

Exhibit

No.

Exhibit or Financial Statement Schedule

    3.1

Restated Articles of Amalgamation of DIRTT Environmental Solutions Ltd. (incorporated by reference to Exhibit 3.1 to the Registrant’s Registration Statement on Form 10, File No. 001-39061, filed on September 20, 2019).

    3.2

Amended and Restated Bylaw No.1 of DIRTT Environmental Solutions Ltd. (incorporated by reference to Exhibit 3.1 to the Registrant’s Current Report on Form 8-K, File No. 001-39061, filed on May 22, 2020).

    4.1

Description of Registrant’s Securities (incorporated by reference to Exhibit 4.2 to the Registrant’s Annual Report on Form 10-K, File No. 001-39061, filed on February 26, 2020).

    4.2

Base Indenture, dated January 25, 2021, by and among DIRTT Environmental Solutions Ltd., Computershare Trust Company of Canada and Computershare Trust Company, National Association as Trustees (incorporated by reference to Exhibit 4.1 to the Registrant’s Current Report on Form 8-K, File No. 001-39061, filed on January 29, 2021).

    4.3

Supplemental Indenture, dated January 25, 2021, by and among the Company, Computershare Trust Company of Canada and Computershare Trust Company, National Association as Trustees (incorporated by reference to Exhibit 4.1 to the Registrant’s Current Report on Form 8-K, File No. 001-39061, filed on January 29, 2021).

4.4

Second Supplemental Indenture, dated December 1, 2021, by and among the Company, Computershare Trust Company of Canada and Computershare Trust Company, National Association as Trustees (incorporated by reference to Exhibit 4.1 to the Registrant’s Current Report on Form 8-K, File No. 001-39061, filed on December 1, 2021).

4.5  10.1+#

Rights Agreement, dated as of December 7, 2021, by and between DIRTT Environmental Solutions Ltd. and Computershare Trust Company of Canada, as rights agent (incorporated by reference to Exhibit 4.1 to the Registrant’s Current Report on Form 8-K, File No. 001-39061, filed on December 8, 2021).

  10.1+#

Loan Agreement, dated February 12, 2021, by and among the Royal Bank of Canada, DIRTT Environmental Solutions Ltd. and DIRTT Environmental Solutions, Inc., as borrowers (incorporated by reference to Exhibit 10.1 to the Registrant’s Current Report on Form 8-K, File No. 001-39061, filed on February 19, 2021).

10.2+#

First Amendment and Consent to Loan Agreement, dated November 15, 2021, by and among the Royal Bank of Canada, as lender, and DIRTT Environmental Solutions Ltd. and DIRTT Environmental Solutions, Inc., as borrowers (incorporated by reference to Exhibit 10.1 to the Registrant’s Current Report on Form 8-K, File No. 001-39061, filed on November 23, 2021).


Exhibit

No.

Exhibit or Financial Statement Schedule

  10.3+

Amended and Restated Incentive Stock Option Plan (incorporated by reference to Exhibit 10.2 to the Registrant’s Registration Statement on Form 10, File No. 001-39061, filed on September 20, 2019).

86


Exhibit

No.

Exhibit or Financial Statement Schedule

10.4+

10.4+

DIRTT Environmental Solutions Ltd. Long-Term Incentive Plan (incorporated by reference to Exhibit 10.1 to the Registrant’s Current Report on Form 8-K, File No. 001-39061, filed on May 22, 2020).

10.5+

Form of Option Award Agreement Under the DIRTT Environmental Solutions Ltd. Long-Term Incentive Plan (incorporated by reference to Exhibit 4.4 to the Registrant’s Registration Statement on Form S-8, File No. 333-238689, filed on May 26, 2020).

10.6+

Form of Time-Based Restricted Share Unit Award Agreement Under the DIRTT Environmental Solutions Ltd. Long-Term Incentive Plan (incorporated by reference to Exhibit 4.5 to the Registrant’s Registration Statement on Form S-8, File No. 333-238689, filed on May 26, 2020).

10.7+

DIRTT Environmental Solutions Ltd. 2022 Employee Share Purchase Plan (incorporated by reference to Exhibit 10.2 to the Registrant’s Quarterly Report on Form 10-Q File No. 001-39061, filed on May 4, 2022).

10.8+

Form of Performance-Based Restricted Share Unit Award Agreement Under the DIRTT Environmental Solutions Ltd. Long-Term Incentive Plan (incorporated by reference to Exhibit 4.6 to the Registrant’s Registration Statement on Form S-8, File No. 333-238689, filed on May 26, 2020).

  10.8+  10.9+

Deferred Share Unit Plan for Non-Employee Directors (incorporated by reference to Exhibit 10.4 to the Registrant’s Registration Statement on Form 10, File No. 001-39061, filed on September 20, 2019).

  10.9+  10.10+

DIRTT Environmental Solutions Ltd. Amended and Restated Employee Share Purchase Plan (incorporated by reference to Exhibit 4.4 to the Registrant’s Registration Statement on Form S-8, File No. 333-234143, filed on October 9, 2019).

  10.10+10.11+

Executive Employment Agreement, dated September  8, 2018,June 22, 2022 by and between DIRTT Environmental Solutions Ltd. and Kevin O’MearaBenjamin Urban (incorporated by reference to Exhibit 10.710.4 to the Registrant’s Registration Statement onRegistrant's Form 10,10-Q, File No. 001-39061, filed on September 20, 2019)July 27, 2022).

  10.11+10.12+

Amended and Restated Executive Employment Agreement, dated July 4, 2018, by and between DIRTT Environmental Solutions Ltd. and Geoffrey Krause (incorporated by reference to Exhibit 10.9 to the Registrant’s Registration Statement on Form 10, File No.  001-39061, filed on September 20, 2019).

  10.12+

Executive Employment Agreement, dated February 27, 2019, by and between DIRTT Environmental Solutions Ltd. and Jeffrey A. Calkins (incorporated by reference to Exhibit 10.10 to the Registrant’s Registration Statement on Form 10, File No.  001-39061, filed on September 20, 2019).

  10.13+

Executive Employment Agreement, dated January 15, 2019, by and between DIRTT Environmental Solutions Ltd. and Mark Greffen (incorporated by reference to Exhibit 10.14 to the Registrant’s Registration Statement on Form 10, File No.  001-39061, filed on September 20, 2019).

  10.14+

Employment Agreement, dated August 31, 2019, by and between DIRTT Environmental Solutions Ltd. and Jennifer Warawa (incorporated by reference to Exhibit 10.15 to the Registrant’s Registration Statement on Form 10, File No. 001-39061,  filed on September 20, 2019).

10.15+

Employment Agreement, dated March 13, 2020,12, 2022, by and between DIRTT Environmental Solutions Inc. and Charles R. KrausRichard Hunter (incorporated by reference to Exhibit 10.2 to the Registrant’sRegistrant's Form 10-Q, File No. 001-39061, filed on May 6, 2020)November 14, 2022).

  10.16+10.13+

Executive Employment Agreement, dated August 2, 2023, by and between DIRTT Environmental Solutions Inc. and Fareeha Khan (incorporated by reference to Exhibit 10.1 to the Registrant's Form 10-Q, File No. 001-39061, filed on November 9, 2023).

10.14+

Indemnity Agreement, dated August 1, 2020,April 26, 2022, between the Company and Shauna R. King,Douglas A. Edwards, together with a schedule identifying other substantially identical agreements between the Company and each of the other persons identified on the schedule (incorporated by reference to Exhibit 10.1610.3 to the Registrant's AnnualRegistrant’s Quarterly Report onForm 10-K,10-Q File No. 001-39061, filed on February 24, 2021)May 4, 2022).

  10.17#10.15+

Indemnity Agreement, dated June 22, 2022, between DIRTT Environmental Solutions Ltd and Benjamin Urban, together with a schedule identifying other substantially identical agreements between the Company and each of the other persons identified on the schedule (incorporated by reference to Exhibit 10.5 to the Registrant's Form 10-Q, File No. 001-39061, filed on July 27, 2022).

10.16+

Indemnity Agreement, dated August 11, 2022, between DIRTT Environmental Solutions Ltd and Richard Hunter, together with a schedule identifying other substantially identical agreements between the Company and each of the other persons identified on the schedule (incorporated by reference to Exhibit 10.6 to the Registrant's Form 10-Q, File No. 001-39061, filed on November 14, 2022).

10.17+

Indemnity Agreement, dated August 2,2023, between DIRTT Environmental Solutions Ltd and Fareeha Khan (incorporated by reference to Exhibit 10.2 to the Registrant's Form 10-Q, File No. 001-39061, filed on November 9, 2023).

87


Exhibit

No.

Exhibit or Financial Statement Schedule

  10.18#

Industrial Lease, dated September 15, 2012, by and between Piret (7303-30th Street SE) Holdings Inc. and DIRTT Environmental Solutions Ltd. (incorporated by reference to Exhibit 10.23 to the Registrant’s Registration Statement on Form 10, File No. 001-39061, filed on September 20, 2019).


Exhibit

No.

Exhibit or Financial Statement Schedule

  10.19#

  10.18#

Agreement of Lease, dated November 5, 2013, by and between Dundee Industrial Twofer (GP) Inc. and DIRTT Environmental Solutions Ltd., as amended by the Lease Amending Agreement, dated October 21, 2016, by and between Dream Industrial Twofer (GP) Inc. (formerly known as Dundee Industrial Twofer (GP) Inc.) and DIRTT Environmental Solutions Ltd. (incorporated by reference to Exhibit 10.24 to the Registrant’s Registration Statement on Form 10, File No. 001-39061, filed on September 20, 2019).

  10.19#  10.20#

Lease of Industrial Space, dated February 12, 2015, by and between Hoopp Realty Inc./Les Immeubles Hoopp Inc., by its duly authorized agent, Triovest Realty Advisors Inc., and DIRTT Environmental Solutions Ltd., as amended by the Amendment of Lease, dated April 16, 2015, the Lease Modification Agreement, dated October 27, 2015, the Third Amendment of Lease, dated November 12, 2015, and the Fourth Amendment of Lease, dated January 8, 2016, the Fifth Amendment of Lease, dated August 9, 2019, the Sixth Amendment of Lease, dated February 6, 2023 (incorporated by reference to Exhibit 10.25 to the Registrant’s Registration Statement on Form 10, File No. 001-39061, filed on September 20, 2019).

  10.20#  10.21#

Lease Agreement, dated March 29, 2011, by and between EastGroup Properties, L.P. and DIRTT Environmental Solutions, Inc. (incorporated by reference to Exhibit 10.26 to the Registrant’s Registration Statement on Form 10, File No. 001-39061, filed on September 20, 2019).

 10.21# 10.22#

Lease, dated July 1, 2015, by and between Majik Ventures, L.L.C. and DIRTT Environmental Solutions, Inc., as amended by the First Amendment to Lease, dated May 11, 2017, by and between CAM Investment 352 LLC and DIRTT Environmental Solutions, Inc. (incorporated by reference to Exhibit 10.27 to the Registrant’s Registration Statement on Form 10, File No. 001-39061, filed on September 20, 2019).

  10.22#  10.23#

Industrial Lease Agreement, dated October 2, 2008, by and between 141 Knowlton Way, LLC and DIRTT Environmental Solutions, Inc., as amended by the First Amendment to Industrial Lease Agreement, dated March 11, 2009, and the Second Amendment to Industrial Lease Agreement, dated August 23, 2018, by and between SH7-Savannah, LLC and DIRTT Environmental Solutions, Inc. (incorporated by reference to Exhibit 10.28 to the Registrant’s Registration Statement on Form 10, File No. 001-39061, filed on September 20, 2019).

  10.23#  10.24#

Lease Agreement, dated October 7, 2019, by and between DIRTT Environmental Solutions, Inc. and SP Rock Hill Legacy East #1, LLC (incorporated by reference to Exhibit 10.4 to the Registrant’s Form 10-Q, File No. 001-39061, filed on November 7, 2019).

10.24#10.25#

Second Amendment to Lease made as of the 6th day of July, 2020, by and between SP ROCK HILL LEGACY EAST #1, LLC, an Indiana limited liability company, and DIRTT ENVIRONMENTAL SOLUTIONS, INC., a Colorado corporation (incorporated by reference to Exhibit 10.4 to the Registrant’s Form 10-Q, File No. 001-39061, filed on July 29, 2020).

10.25#10.26#

Lease Agreement between Tennyson Campus Owner, LP and DIRTT Environmental Solutions, Inc. dated March 4, 2020 (incorporated by reference to Exhibit 10.1 to the Registrant’s Form 10-Q, File No. 001-39061, filed on May 6, 2020).

10.2610.27#

LetterLease Amending Agreement, dated as of January 18,April 6, 2022, by and between Todd W. LillibridgePiret (7303 - 30th Street SE) Holdings Inc. and DIRTT Environmental Solutions Ltd.Ltd (incorporated by reference to Exhibit 10.110.2 to the Registrant’sRegistrant's Form 8-K,10-Q, File No. 001-39061, filed on January 19,July 27, 2022).

10.2710.28

Letter Agreement, dated January 7, 2021, by and among DIRTT Environmental Solutions Ltd., DIRTT Environmental Solutions, Inc. and Royal Bank of Canada (incorporated by reference to Exhibit 1.1 to the Registrant’s Current Report on Form 8-K, File No. 001-39061, filed on January 13, 2021).

88


Exhibit

No.

Exhibit or Financial Statement Schedule

10.28+

10.29+

Indemnification Agreement, by and between DIRTT Environmental Solutions Ltd. and James A. Lynch, dated March 22, 2021 (incorporated by reference to Exhibit 10.1 to the Registrant’s Current Report on Form 8-K, File No. 001-39061, filed on March 23, 2021).

10.29+10.30+

IndemnificationSubscription Agreement, dated November 14, 2022, by and between DIRTT Environmental Solutions Ltd. and 22NW Fund, LP, together with a schedule identifying substantially identical agreements between DIRTT Environmental Solutions Ltd. and each shareholder and U.S. director and executive officer listed on the schedule and identifying the material differences between each of those agreements and the filed Subscription Agreement (incorporated by reference to Exhibit 10.1 to the Registrant's Form 8-K, File No. 001-39061, filed on November 18, 2022).

10.31+

Subscription Agreement, dated November 14, 2022, by and between DIRTT Environmental Solutions Ltd. and Mark Greffen, together with a together with a schedule identifying substantially identical agreements between DIRTT Environmental Solutions Ltd. and each shareholder and Canadian executive officer listed on the schedule and identifying the material differences between each of those agreements and the filed Subscription Agreement (incorporated by reference to Exhibit 10.2 to the Registrant's Form 8-K, File No. 001-39061, filed on November 18, 2022).

10.32

Release, dated November 30, 2022, by and among DIRTT Environmental Solutions Ltd., 726 BC LLC and 726 BF LLC ((incorporated by reference to Exhibit 10.1 to the Registrant's Form 8-K, File No. 001-39061, filed on November 30, 2022).

10.33#†

Second Amendment to Loan Agreement, dated February 9, 2023, by and among DIRTT Environmental Solutions Ltd., DIRTT Environmental Solutions, Inc. and Royal Bank of Canada (incorporated by reference to Exhibit 10.45 to the Registrant's Form 10-K,File No. 001-39061, filed on February 22, 2023).

10.34+#†

Co-ownership Agreement by and between DIRTT Environmental Solutions Ltd. and Diana R. Rhoten, dated March 22, 2021Armstrong World Industries, Inc., effective May 9, 2023 (incorporated by reference to Exhibit 10.1 to the Registrant's Form 10-Q,File No. 001-39061, filed on August 2, 2023).

10.35+#

DIRTT Environmental Solutions Ltd. Amended and Restated Long Term Incentive Program effective May 30, 2023(incorporated by reference to Exhibit 10.2 to the Registrant's Form 10-Q,File No. 001-39061, filed on August 2, 2023).

10.36

DIRTT Environmental Solutions Ltd. 2022 Employee Share Purchase Plan (incorporated by reference to Exhibit 10.2 to the Registrant’s Quarterly Report on Form 10-Q File No. 001-39061, filed on May 4, 2022)

10.37

Debt Settlement Agreement, dated March 15, 2023, by and between DIRTT Environmental Solutions Ltd., 22NW Fund, LP and Aron English (incorporated by reference to Exhibit 10.1 to the Registrant's Current Report on Form 8-K, File No. 001-39061, filed on March 23, 2021)21, 2023).


Exhibit

No.

Exhibit or Financial Statement Schedule

10.38

Share Issuance Agreement, dated March 15, 2023, by and between DIRTT Environmental Solutions Ltd., 22NW Fund, LP and Aron English (incorporated by reference to Exhibit 10.2 to the Registrant's Current Report on Form 8-K, File No. 001-39061, filed on March 21, 2023).

  21.1*10.39*#†

Third Amendment to Loan Agreement, dated February 9, 2024, by and among DIRTT Environmental Solutions Ltd., DIRTT Environmental Solutions, Inc. and Royal Bank of Canada

10.40*

Lease Amending Agreement, dated February 6, 2023, by and between HOOPP Realty Inc./Les Immeubles HOOPP Inc., (6335 - 57th Street SE) and DIRTT Environmental Solutions Ltd.

  21.1*

Subsidiaries of DIRTT Environmental Solutions Ltd.

  23.1*

Consent of PricewaterhouseCoopers, L.L.P., independent registered public accounting firm.

  31.1*

Certification of the Principal Executive Officer required by Rule 13a-14(a) or Rule 15d-14(a) under the Securities Exchange Act of 1934, as Adopted Pursuant to Section 302 of the Sarbanes-Oxley Act of 2002.

89


Exhibit

No.

Exhibit or Financial Statement Schedule

  31.2*

  31.2*

Certification of the Principal Financial Officer required by Rule 13a-14(a) or Rule 15d-14(a) under the Securities Exchange Act of 1934, as Adopted Pursuant to Section 302 of the Sarbanes-Oxley Act of 2002.

  32.1**

Certification of the Principal Executive Officer required by 18 U.S.C. 1350, as Adopted Pursuant to Section 906 of the Sarbanes-Oxley Act of 2002.

  32.2**

  32.2**

Certification of the Principal Financial Officer required by 18 U.S.C. 1350, as Adopted Pursuant to Section 906 of the Sarbanes-Oxley Act of 2002.

101.INS*

101.INS*

Inline XBRL Instance Document

101.SCH*

Inline XBRL Taxonomy Extension Schema Document

101.CAL*

Inline XBRL Taxonomy Extension Calculation Linkbase Document

101.DEF*

Inline XBRL Taxonomy Extension Definition Linkbase Document

101.LAB*

Inline XBRL Taxonomy Extension Label Linkbase Document

101.PRE*

Inline XBRL Taxonomy Extension Presentation Linkbase Document

104

Cover Page Interactive Data File (embedded within the Inline XBRL document)

* Filed herewith.

** Furnished herewith.

+ Compensatory plan or agreement.

# Information in this exhibit identified by brackets is confidential and has been omitted pursuant to Item 601(b)(10)(iv) of Regulation S-K because it is not material and is the type of information that the Company customarily treats as private or confidential. An unredacted copy of this exhibit will be furnished to the Securities and Exchange Commission on a supplemental basis upon request.

† Certain exhibits and schedules have been omitted pursuant to Item 601(a)(5) of Regulation S-K. A copy of any omitted schedule or exhibit will be furnished to the Securities and Exchange Commission upon request.

Item 16. Form 10-K Summary

None.

90


SIGNATURES

*

Filed herewith.

**

Furnished herewith.

+

Compensatory plan or agreement.

#

Specific terms in this exhibit (indicated therein by asterisks) have been omitted because such terms are both not material and would likely cause competitive harm to the Company it publicly disclosed.

Item 16.

Form 10-K Summary

None.


SIGNATURES

Pursuant to the requirements of Section 13 or 15(d) of the Securities Exchange Act of 1934, as amended, the Registrant has duly caused this Report to be signed on its behalf by the undersigned, thereunto duly authorized.

DIRTT ENVIRONMENTAL SOLUTIONS LTD.

Date: February 23, 202221, 2024

By:

/s/ Todd Lillibridge Benjamin Urban

Name: Todd LillibridgeBenjamin Urban

Title: Interim Chief Executive Officer

Pursuant to the requirements of the Securities Exchange Act of 1934, as amended, this Report has been signed below by the following persons on behalf of the Registrant in the capacities and on the dates indicated.

Signature

Title

Date

/s/ Todd W. LillibridgeBenjamin Urban

Todd W. LillibridgeBenjamin Urban

Interim Chief Executive Officer and Director

(Principal Executive Officer)

February 23, 202221, 2024

/s/ Geoffrey D. KrauseFareeha Khan

Geoffrey D. KrauseFareeha Khan

Chief Financial Officer

(Principal Financial Officer and Principal Accounting Officer)

February 23, 202221, 2024

/s/ Michael FordKen Sanders

Michael FordKen Sanders

Director

February 23, 202221, 2024

/s/ Denise KarkkainenDouglas Edwards

Denise KarkkainenDouglas Edwards

Director

February 23, 202221, 2024

/s/ Shauna KingAron English

Shauna KingAron English

Director

February 23, 202221, 2024

/s/ Jim LynchScott Robinson

Jim LynchScott Robinson

Director

February 23, 202221, 2024

/s/ Steven ParryShaun Noll

Steven ParryShaun Noll

Director

February 23, 202221, 2024

/s/ Diana RhotenScott Ryan

Diana RhotenScott Ryan

Director

February 23, 202221, 2024

91

77