Page | ||
PART I | ||
Item 1. | 2 | |
Item 1A. | 10 | |
Item 1B. | 24 | |
Item 1C. | 24 | |
Item 2. |
| |
Item 3. |
| |
Item 4. |
| |
PART II | ||
Item 5. |
| |
Item 6. |
| |
Item 7. | Management’s Discussion and Analysis of Financial Condition and Results of Operations |
|
Item 7A. |
| |
Item 8. |
| |
Item 9. | Changes in and Disagreements With Accountants on Accounting and Financial Disclosure |
|
Item 9A. |
| |
Item 9B. |
| |
Item 9C. | Disclosure Regarding Foreign Jurisdictions that Prevent Inspections |
|
PART III | ||
Item 10. |
| |
Item 11. |
| |
Item 12. | Security Ownership of Certain Beneficial Owners and Management and Related Stockholder Matters |
|
Item 13. | Certain Relationships and Related Transactions, and Director Independence |
|
Item 14. |
| |
PART IV | ||
Item 15. |
| |
Item 16. |
|
i
CAUTIONARY NOTE REGARDING FORWARD-LOOKING STATEMENTS
This Annual Report on Form 10-K contains forward-looking statements within the meaning of the U.S. Private Securities Litigation Reform Act of 1995. You can generally identify forward-looking statements by our use of forward-looking terminology such as “anticipate,” “believe,” “continue,” “could,” “estimate,” “expect,” “intend,” “may,” “might,” “plan,” “potential,” “predict,” “seek” or “should,” or the negative thereof or other variations thereon or comparable terminology. In particular, statements about general economic conditions, or more specifically about the markets in which we operate, including growth of our various markets, and our expectations, beliefs, plans, strategies, objectives, prospects, assumptions or future events or performance contained in this report are forward-looking statements.
We have based these forward-looking statements on our current expectations, assumptions, estimates and projections. While we believe these expectations, assumptions, estimates and projections are reasonable, such forward-looking statements are only predictions and involve known and unknown risks and uncertainties, many of which are beyond our control. These and other important factors, including the severe ongoing impact of the COVID-19 pandemictrends and the other risk factors discussed in this report under the heading “Management’s Discussion and Analysis of Financial Condition and Results of Operations,” may cause our actual results, performance or achievements to differ materially from any future results, performance or achievements expressed or implied by these forward-looking statements, or could affect the trading price of our common stock on the New York Stock Exchange. Some of the factors that could cause actual results to differ materially from those expressed or implied by the forward-looking statements include, but are not limited to, those discussed in Part I, Item 1A of this Form 10-K under the heading “Risk Factors,” which are incorporated herein by reference.
Given these risks and uncertainties, you are cautioned not to place undue reliance on such forward-looking statements. The forward-looking statements contained in this report are not guarantees of future performance and our actual results of operations, financial condition and liquidity, and the development of the industry in which we operate, may differ materially from the forward-looking statements contained in this report. In addition, even if our results of operations, financial condition and liquidity, and events in the industry in which we operate, are consistent with the forward-looking statements contained in this report, they may not be predictive of results or developments in future periods.
Any forward-looking statement that we make in this Annual Report on Form 10-K speaks only as of the date of such statement. Except as required by law, we do not undertake any obligation to update or revise, or to publicly announce any update or revision to, any of the forward-looking statements, whether as a result of new information, future events or otherwise, after the date of this report.
Except where the context requires otherwise, references in this Annual Report on Form 10-K to “Emerald”, “the Company”, “we”, “us”, and “our” refer to Emerald Holding, Inc., formerly known as Emerald Expositions Events, Inc., together with its consolidated subsidiaries. In this Annual Report on Form 10-K, when we refer to our fiscal years, we refer to the year number, as in “2021,“2023,” which refers to our fiscal year ended December 31, 2021.2023.
1
PART I
Item 1. Business.
BUSINESS
Our Company
Emerald is a leading operator of business-to-business (“B2B”) trade shows in the United States. Leveraging our shows as key market-driven platforms, we integrate live events, and media content, including a broad array of industry insights, digital tools, and data-focused solutions to create uniquely rich experiences for our customers. We have been recognized with many awards and accolades that reflect our industry leadership as well as the importancee-commerce platforms into three complementary business lines – Connections, Content and Commerce.
Our Connections division consists of our shows to the exhibitors and attendees we serve.
Oura collection of leading B2B trade show franchises, which typically hold market-leading positions within their respective industry verticals, with significant brand value established over a long period of time. Each
Our Content division consists of B2B print publications and digital media products that complement our shows is typically held at least annually, with certain franchises offering multiple editions per year. As our shows are frequently the largestexisting trade show properties. These print and most well attended in their respectivedigital media products provide industry verticals, we are able to attract high-quality attendees, including those who have the authority to make purchasing decisions on the spot or subsequent to the show. The participation of these qualified attendees makes our trade shows compelling events for our exhibitors, further reinforcing the leading positions of our trade shows within their respective industries. specific business news and information across 20 sectors, facilitating year-round customer contact, new customer acquisition and content marketing vehicles.
Our attendees use our shows to fulfill procurement needs, source new suppliers, reconnect with existing suppliers, identify trends, learn about new products and network with industry peers, which we believe are factors that make our in-person shows difficult to replace. Our portfolio of trade shows is well-balanced and diversified across both industry sectors and customers. The scale and qualified attendance at our trade shows translates into an exceptional value proposition for participants, resulting in a self-reinforcing “network effect” whereby the participation of high-value attendees and exhibitors drives high participant loyalty and predictable, recurring revenue streams.
In addition to organizing our trade shows, conferences and other events, we also operate content and content-marketing websites and related digital products, and produce publications, each of which is aligned with a specific event sector. We also offerCommerce division offers B2B ecommercee-commerce and digital merchandising solutions, serving the needs of manufacturers and retailers through our Elastic Suite platform creatingand Bulletin platforms, which create a digital year-round transactional platform for use by Emerald’s customers, regardless of location. In addition
We also generate a substantial amount of first-party data across our events, content, and e-commerce platforms. We continue to their respective revenues, eachdevelop products and processes based on our first-party data assets to enhance the customer experience, by providing actionable insights and measurable results through metrics such as content impressions, lead capture rates, conversion rates and transaction value per customer. Our efforts to provide customers with a clearer picture of these products support our livethe return on investment they receive from Emerald’s events should help incentivize customers to deploy more marketing dollars with Emerald, ultimately driving higher revenue per customer. The data we generate should also create efficiencies within Emerald’s sales efforts by delivering year-round channels for customer acquisitionenabling cross-selling of events, content, and development. e-commerce opportunities, contributing to lower sales costs and higher margins.
Our History
In June 2013, certain investment funds managed by an affiliate of Onex Corporation (such funds, collectively with Onex Partners V LP, “Onex”) acquired our business from an affiliate of Nielsen Holdings N.V. (the “Onex Acquisition”). We have since focused on expanding our portfolio of leading events organically, complemented by an increased focus on acquisitions. Since the Onex Acquisition, we have acquired and integrated 2226 industry-leading, high-quality events and complementary businesses of various sizes for aggregate consideration of approximately $866$934 million.
In June 2020, we entered into an investment agreement with Onex Partners V LP (“Onex Partners V”), pursuant to which we agreed to issue to Onex Partners V, in a private placement transaction, 47,058,332 shares of our 7% Series A Convertible Participating Preferred Stock (the “redeemable convertible preferred stock”) for a purchase price of $5.60 per share (the “Series A Price per Share”), for which we received aggregate proceeds of approximately $252.0 million, net of fees and estimated expenses of $11.6 million. In conjunction with the investment agreement with Onex Partners V, we announced a rights offering to holders of our outstanding common stock of one non-transferable subscription right for each share of our common stock held, with each right entitling the holder to purchase one share of redeemable convertible preferred stock at the Series A Price per Share, backstopped by Onex Partners V (the “Onex Backstop”). The rights offering was completed in July of 2020. We received net proceeds of approximately $9.7 million from this rights offering. Pursuant to the Onex Backstop, on August 13, 2020, an additional 22,660,587 shares of redeemable convertible preferred stock were sold to Onex in exchange for proceeds of approximately $121.3 million, net of fees and expenses of $5.6 million.
2
As of December 31, 2021,2023, Onex owned 47,058,332 shares of our common stock, representing 67.2%74.8% of our outstanding common stock. In addition, as of December 31, 2021,2023, Onex owned 69,718,919 shares of our redeemable convertible preferred stock, representing 170,056,580which combined, represents 183,697,428 shares of our common stock on an as-converted basis, after accounting for the accumulated accreting return at a rate per annum equal to 7% on the accreted liquidation preference and paid in-kind. Onex’s beneficial ownership of our common stock, on an as-converted basis, is approximately 86.1%90.5%.
In 2021, we completed two acquisitions. In April,2023, we acquired Sue Bryce Education andLodestone Events, the Portrait Masters, a subscription-based photography business education and e-learning service with a photography conference.
On December 31, 2021, we purchased substantially allproducers of the assets associated with a business known and operated as MJBiz (“MJBiz”), a leading event producer and content platform servingOverland Expo series of vehicle-based, adventure travel consumer shows throughout the wide range of commercial companies operating in the rapidly growing cannabis industry. Founded in 2011, MJBiz produces MJBizCon, the oldest and leading B2B cannabis trade show in America, the Emerald Conference, focusing on science and data analysis in the cannabis industry and related media brands including MjBizDaily, Hemp Industry Daily and MJBIZ Magazine. MJBizConUS. Overland Expo is a top trade showpremier event series for do-it-yourself adventure travel enthusiasts, with hundreds of classes for 4-wheel-drive enthusiasts and adventure motorcyclists, inspirational programs, speakers, and trainers from all over the world. The acquisition supports the Company’s strategic expansion into the growing business to consumer (B2C) event space specifically in the cannabis industry having featured more than 1,200 exhibiting companies and 27,000 attendees at the October 2021 live event. In addition to diversifying and enhancing Emerald’s portfolio in a high growth industry,markets like the addition of MJBiz further accelerates the Company’s strategy of delivering 365-day customer engagement.increasing demand for outdoor experiences.
Products and Services
We operateEmerald goes to market across three distinct business lines, Connections, Content and Commerce. Each provides a distinct portfolio of products and services that are integral to Emerald’s growth and profitability.
Connections
Our Connections division consists of our collection of leading B2B trade show franchises, which typically hold market-leading positions within their respective industry verticals, with significant brand value established over a long period of time. Each of our shows is typically held at least annually, with certain franchises offering multiple editions per year. Our shows are frequently the preeminent event, drawing the highest attendance in their respective industry verticals. As a result, we are able to attract high-quality attendees, including those who have the authority to make purchasing decisions on the spot or subsequent to the show. The participation of these qualified buyers makes our trade shows compelling events for our exhibitors, offering them an efficient platform for high quality lead generation. Revenue in multiple attractive, fragmentedthis segment is generated from the production of trade shows and conference events, including booth space sales, registration fees and sponsorship fees.
Our attendees use our shows for a variety of reasons, most notably to fulfill procurement needs, source new suppliers and reconnect with existing suppliers, identify trends, learn about new products and network with industry peers. We believe that these factors help demonstrate that our in-person shows are paramount and difficult to replace. Our portfolio of trade shows is well-balanced and diversified across both industry sectors that represent significant portionsand customers. The scale and qualified attendance at our trade shows translates into an exceptional value proposition for participants, resulting in a self-reinforcing “network effect,” whereby the participation of the U.S. economyhigh-value attendees and serve a largeexhibitors drives high participant loyalty and diverse setpredictable, recurring revenue streams.
We categorize our diversified portfolio of global exhibitorsevents according to seven industry verticals:
Design, Renovation & Construction
Our Design, Renovation & Construction vertical is targeted toward commercial-scale design and attendees. This fragmentation of exhibitors and attendees is an especially important characteristic of the trade show industry. In markets characterized by diverse groups ofconstruction, with buyers and sellers trade shows offer a great opportunityfrequently transacting in high unit counts for interaction between large numbers of participants on both sides of a potential transaction (a “many-to-many” environment) within a short period of time, thus enhancing the value delivered to all trade show participants. Further, the highly fragmented nature of our markets enhances the stability of our entire platform as the loss of any single exhibitor or attendee is unlikely to cause other exhibitors or attendees to derive less value from and cease participatinguses in a show.
We typically generate the significant majority of our revenue through the live events that we operate, with the remaining revenue generated by other marketing services, including digital media and print publications that complement our event properties in the industry sectors we serve. The ongoing COVID-19 pandemic and its consequences forced us to cancel or postpone a significant portion of our event calendar beginning in March 2020 through the end of the year and the first half of 2021. As expected, the continued effects of COVID-19 related issuesprojects such as international travel restrictionshotels and the need to cancel or postpone several events, negatively impacted the financial results of our fiscal year of 2021. While travel restrictions on international travelers to the United States were lifted in the fourth quarter of 2021, the ongoing effects of COVID-19 on our operationssenior living facilities. Industries served include kitchen & bath, hospitality, senior living, healthcare, education, general construction and event calendar have had, and will continue to have, a material negative impact on our financial results and liquidity, and this negative impact may continue beyond the containment of the pandemic. As a result, only 71% of our revenue for the year ended December 31, 2021 was generated through in person events, and 29% from virtual events and other marketing services. For the year ended December 31, 2020, 75% of our revenue was generated through in person events, and 25% from virtual events and other marketing services. By contrast, we generated 92% of our revenue for the year ended December 31, 2019 through the live events that we operated. The remaining 8% of our revenue for the year ended December 31, 2019 was generated from other marketing services. Each of our other marketing services products allows us to remain in close contact with, and market to, our existing event audiences throughout the year.
Trade Shows & Other Events
The following is a summary and example of several of our trade shows and other events by sector and a discussion of our complementary products.
Retail
Spanning a vast market of products, our retail experiences cover merchandising, licensing, sourcing, and marketing to enable professionals to shop intelligently, make informed decisions, and meet consumer demands. Buying customers are able to discover rare finds and big sellers in a complete marketplace of options, along with new brands, potential partners, and beneficial seminars across popular and profitable categories. Events produced in this category include:
|
|
|
|
|
|
|
|
|
|
Design & Construction
Our shows in the Design & Construction industry sector catering to the construction, hospitality, and interior design sectors serving the hotel, resort, retail, healthcare facilities, restaurant, bar, spa, and in-store marketing categories. Targeted attendees include interior designers, architects, owners and operators, developers, and specifiers and purchasers working within these industries. This sector is well-suited for trade shows because design and construction are highly visual and tactile processes, requiring the in-person experience and interaction provided by trade shows. By aggregating a wide range of products under one roof, these trade shows save time and expense for designers and other attendees who would otherwise have to independently visit hundreds of showrooms that may be located in different cities.more. Examples of our events produced in this category include:
☐ Boutique Design | ☐ Hospitality Design Expo (“HD Expo”) |
☐ Environments for Aging Expo & Conference (“EFA”) | ☐ ICFF (previously International Contemporary Furniture Fair) |
☐ Healthcare Design Expo & Conference
| ☐ Kitchen & Bath Industry Show (“KBIS”) |
☐ EDspaces | ☐ Connecting Point Marketing Group hosted buyer events |
3
Food
Technology
With technology expanding at a rapid pace, professionals in every aspect of commerce—from engineering to electronics,Our Food vertical brings together retailers, restaurateurs, and visual arts to security—must stay on topsuppliers across specialty food categories, including the fast-growing pizza and Latin specialty food categories. International Pizza Expo is one of the latest advancements to help them stay informed, efficient,largest events serving this popular sector, and competitive. Our technology events provide experiences that connect businesses of all sizes with innovative products, operational strategies,Cocina Sabrosa is the largest and integration opportunities to drive new business, increased profits, and streamlined processes. Through exciting show floors, thought leadership, and networking events, decision-makers in these industries can thriveonly national Latin food expo in the midstUnited States. Examples of our events produced in this category include:
☐ Cocina Sabrosa | ☐ Pizza Expo |
☐ Pizza & Pasta Northeast |
Home, Gift & General Merchandise
Our Home, Gift & General Merchandise vertical connects product manufacturers and retailers through premiere events and insightful content for the market’s most on-trend consumer products and merchandise. Through these invaluable connections and content, Emerald unites a vast global network of buyers and suppliers, offering unparalleled access to one of the world’s most extensive selections of merchandise. Events produced in this category include:
☐ ASD Market Week (“ASD”) | ☐ NY NOW |
☐ International Gift Exposition in the Smokies (“IGES”) |
Technology, Advertising & Marketing
Our Technology, Advertising & Marketing vertical is a market-leading portfolio of events and resources dedicated to advertising and harnessing the power of next-generation digital progressmedia and change. marketing technology. The growing group of business sectors served includes advertising, automotive, intelligent traceability technology, business technology integration, communications, ecommerce, connected home technology, and more. Some examples of our events produced in this category include:
☐ Advertising Week (“AW”) | ☐ B2B Marketing Exchange |
☐ | ☐ CEDIA |
☐ Digital Dealer | ☐ Prosper |
☐ | ☐ RFID |
☐ Total Tech Summit |
EquipmentIndustrial
Our equipment experiences outfit aerospace, construction, industrial, medical,Demonstrating leadership across established and hospitality professionals with the tools and resources necessary to operate, build, and repair structures, vehicles, and devices of every kind. Theseemerging industries through collaborative B2B events and surrounding platforms serve as a marketplace featuring vendorsinsightful forums. Perhaps the most diverse group of industry sectors served by Emerald, our expertise across the industrial category is unmatched in both content and innovative productsevents. The growing range of business sectors includes photography, security, hospitality, home medical, US Military, paving, fasteners, farming & agricultural supplies largely serving the cannabis industry, and services, as well as educational centers, supporting a wide arraymore. Examples of industries. our events produced in this category include:
4
☐ Campus Safety | ☐ MJBiz |
☐ Fastener | ☐ Security Sales & Integration |
☐ Modern Day Marine | ☐ National Pavement Expo |
☐ Medtrade | ☐ reMind |
☐ Wedding & Portrait Photographers International |
Luxury
Our Luxury vertical provides dynamic and profitable marketplaces that emulate the highest level of artistic expression and showcase the most exceptional curation of upscale, luxury and designer products. Emerald’s luxury market of events unites an elite community of renowned heritage brands, emerging design talent, the finest retailers and award-winning media from around the globe. Examples of our events produced in this category include:
☐ | ☐ |
☐ | ☐ |
|
|
SafetySports & Outdoor
SeekingOur Sports & Outdoor vertical includes industry-leading wholesale and consumer events with globally recognizable brands, highlighting the latest products and innovations to ensure physical and cyber security, these experiences prepare professionals with advanced systems, training,attracting a diverse audience. Our premiere events serve the growing markets of surf, swimwear, lifestyle apparel, winter sports, outdoor recreation and networking. With an integration of eventsoverlanding, mountaineering, adventuring, camping, sports merchandise licensing, and media, representatives and decision-makers from leading-edge companies have access to key resources year-round.professional sports fan experiences. Examples of our events produced in this category include:
☐ | ☐ |
☐ | ☐ Outdoor Retailer (“OR”) |
☐ Overland Expo | ☐ Surf Expo |
☐ Sports Licensing and Tailgate Show |
Other Marketing ServicesContent
Other Marketing Services consistOur Content division consists of B2B print publications and digital media products that complement our existing trade show properties, which generated 21.2% of our revenues for the year ended December 31, 2021.properties. These print and digital media products are closely aligned with several of our eventsprovide industry specific business news and information across the portfolio categories,20 sectors, facilitating year-round customer contact, new customer generation and content marketing vehicles. Some examplesLeveraging our industry-leading trade shows allows us to create unique and timely editorials in the sectors we serve. We plan to continue to invest in product development to ensure our advertisers have new and effective ways to engage our audiences. We are also expanding our content portfolio to support audience acquisition across a wider array of these products are:sectors and constituencies served by our trade shows, conferences, and other events. Revenue in this segment primarily consists of advertising sales for industry publications and digital products.
|
|
|
|
|
Subscription Software and Services
We provideOur Commerce division largely offers software-as-a-service technology that enables year-round B2B buying and selling through our Elastic Suite platform. Elastic Suite’s platform streamlines the wholesale buying process for both brands and retail buyers, creating a digital year-round transactional platformBulletin platforms for use by Emerald’s customers. We believe this platform will accelerate Emerald’s strategy to provide 365-day-per-year engagement for our customer basecustomers, regardless of location by expanding our digital commerce capabilities and providing our customers with transactional functionality, including enterprise-level integration to brands’ ERP systems, allowing customers to manage orders, real-time inventory, and product merchandising.location. Elastic Suite is integrated with leading manufacturers and retailers across numerous industries, most notably in the outdoor, surf, cycling, footwear and sporting goods verticals, and is expected to complement Emerald’s portfolio of leading show brands including Outdoor Retailer and Surf Expo, among others. ElasticSuite’s B2B platform bridges the gap between sellers’ order processing systems and allows brands to sell directly to their buyers using print-free digital product catalogs and merchandising technology, enabling brands to increase their efficiency, effectiveness, sustainability and profitability. We believe these platforms will accelerate
5
Emerald’s strategy to provide 365-day-per-year engagement for our customer base, by expanding our digital commerce capabilities and providing our customers with transactional functionality. Elastic Suite is integrated with leading manufacturers and retailers across numerous industries, most notably in the outdoor, home appliance and electronics, surf, cycling, footwear and sporting goods verticals. Revenue in this segment consists of subscription revenue, implementation fees and professional services.
Reportable Segments
As described in Note 1, Description of Business and Summary of Significant Accounting Policies and Note 18, Segment Information, in the notes to our audited consolidated financial statements included elsewhere in this Annual Report on Form 10-K, the determination ofeffective October 31, 2023, our business is organized into one reportable segments issegment, consistent with the information provided to our Chief Executive Officer, who is considered the chief operating decision-maker ("CODM"(“CODM”). The CODM evaluates performance based on the results of six executive brand portfolios,our Connections, Content and Commerce business lines (collectively, the “three C’s”), which represent our sixthree operating segments. Based on an evaluationThe Connections segment is primarily comprised of economic similaritiesEmerald’s trade shows and the nature of services and types of customers, four of these operating segments have been aggregated into two reportable segments, the Commerce reportable segment and the Design and Technology reportable segment.other live events. The remaining threetwo operating segments do not meet the quantitative thresholds to be considered reportable operating segments and are included in the “All Other” category. In addition, we have a Corporate-Level Activities“Corporate-Level Activities” category consisting of finance, legal, information technology and administrative functions.
Prior year disclosures below have been updated to reflect the new reportable segment structure described in Note 18, Segment Information. The following discussion provides additional detailed disclosure for the twoone reportable segments, the All Other“All Other” category and the Corporate-Level Activity“Corporate-Level Activity” category:
Commerce:Connections: This segment includes all of Emerald’s trade shows and other live events and services covering merchandising, licensing, retail sourcing and marketing to enable professionals to make informed decisions and meet consumer demands.
Design and Technology: This segment includes events and services that support a wide variety of industries connecting businesses and professionals with products, operational strategies, and integrationprovide exhibitors opportunities to drive new businessinfluence their market, engage with significant buyers, generate incremental sales and streamline processes and creative solutions.expand their brand’s awareness in their industry.
All Other: This category consists of Emerald’s remaining operating segments, which provide diverse eventsmedia services and servicese-commerce software solutions, but are not aggregated with the reportable segments.segment. Each of operating segments in the All Other category do not meet the criteria to be a separate reportable segment.
Corporate-Level Activity: This category consists of Emerald’s finance, legal, information technology and administrative functions.function.
Competition
The trade show industry is highly fragmented, with approximately 9,400 B2B trade shows held per year in the United States according to the Center for Exhibition Industry Research, of which a majority are owned by industry associations, according to Advanced Market Research. Individual trade shows typically compete for attendees and exhibitors only against the other trade shows that are relevant to their industry vertical. The level of competition each of our trade shows faces therefore varies by industry vertical. In addition, the Elastic Suite platform competesplatforms compete with several other well-capitalized software-as-a-service technology platforms.
Other well-established for-profit companies competing in the U.S. trade show industry include Reed Exhibitions, Informa Exhibitions and Clarion Events.
Seasonality
As is typical for the trade show industry, our business has historically been seasonal, with our pre-COVID revenue recognized from trade shows typically reaching its highest level during the first quarterand third quarters of each calendar year, and its trough during the fourth quarter, largelyentirely due to the timing of our trade shows. In 2019, 40%, 28%, 22%As a result of the MJBiz and 10%Advertising Week acquisitions at the end of 2021 and during the second quarter of 2022, respectively, our trade showseasonality trend shifted, where revenue was generatednow typically reaches its highest level during the first second, third and fourth quarters respectively. In 2020, 98% of our trade show revenue was generated during the first quarter because substantially all of our in-person events were cancelled beginning in March 2020 and through December 31, 2020. In 2021, 67% and 26% of our trade show revenue was generated during the third quarter and fourth quarter, respectively, because substantially all of our in-person events were cancelled in the first half of 2021each calendar year, entirely due to the on-going COVID-19 pandemic.timing of our live events.
6
Intellectual Property
Our intellectual property and proprietary rights are important to our business. We undertake tobusiness and we strategically and proactively develop our intellectual property portfolio by registering our trademarks. We currentlytrademarks and rely primarily on trademark laws to protect our intellectual property rights. We do not own, but have a license to use, certain trademarks belonging to an industry associationassociations in connection with our Kitchen & Bath Industry ShowKBIS and CEDIA Expo. The KBIS license runs through 2043 and the CEDIA Expo license continues in perpetuity. We also license certain intellectual property from the NBA in connection with producing NBA Con. See “Risk
Factors—Risks Related to our Intellectual Property and Information Technology” for further discussion relating to our trademarks.
Human Capital Resources
At Emerald, we consider our employees to be the foundation of our growth and success. As such, our future depends in large part on our ability to attract, retain, and motivate qualified and diverse personnel.
As of December 31, 2021,2023, we had 600673 full-time employees. Our management team principally works from our New York City headquarters (84(62 employees) and our Southern California corporate offices (51(49 employees), with members of our sales team distributedlocated throughout the United States, mainly near the geographic markets they serve.States. As of February 2, 2022,December 31, 2023, our senior management team was 55%50% female and our overall employee population was 60%63% female.
Emerald knows its ultimate success is directly linked to its ability to identify and hire talented individuals from all backgrounds and perspectives, and we are committed to developing and fostering a culture of diversity and inclusion. Starting in January 2022, Emerald hired an experienced consultant to act as Chair of Diversity, Equity and Inclusion. This individual will build upon Emerald’s existing programs and help us develop and maintain best practices to foster a diverse and inclusive work environment. Further, as part of our commitment to equity, Emerald has partnered with the non-profit organization called OneTen, which cultivates economic opportunities for Black talent in the United States with a goal of providing 1 million jobs to Black talent in the next 10 Years. In order to partner with OneTen, an employer must agree to certain pillars such as significantly increasing the hiring of Black talent into family-sustaining jobs that do not require 4-year college degrees. At the same time, Emerald has also eliminated the college-degree requirement for a range of positions to expand the application process to include candidates with more diverse backgrounds, skills and experiences. Emerald also requires all hiring personnel to attend training programs focused on unconscious bias training and interview skills. In addition, Emerald is one of 15 organizations that formed The COUTURE Diversity Action Council (DAC), which strives to be a catalyst for addressing the issues of systemic and institutionalized discrimination that has contributed to the lack of diversity within the fine jewelry industry. DAC’s purpose is to contribute to the creation of a more diverse, inclusive, and equitable industry through the implementation of mentoring and other programs and initiatives that promote and support Black, Indigenous, People of Color (BIPOC) within all facets of the jewelry ecosystem.
Providing all our employees with the resources to develop their talents, grow their careers and reach their goals is a top priority at Emerald. To enable this, the Company provides numerous opportunities for employees to expand their professional and personal development, including unlimited access to Skillsoft’s online platform which provides continuous learning and career enhancement resources coupled with formal sales development and training from a professional sales coach. Emerald also offers a yearlong wellness program led by a top mindfulness coach focused on employees’ mental health and well-being.
Career development at Emerald is fostered through ongoing employee feedback, performance reviews and employee satisfaction surveys. These surveys regularly solicit employees’ every quarter to help Emerald track the progress and the well-being of our workforce. In addition to monthly town halls conducted by our CEO, which foster transparent and consistent communication throughout the Company, on December 2021, Emerald held its first ever Company-wide,hosts an annual company-wide, in-person conference in Dallas, Texas called ACE (Agility, Commitment and Excellence). ACE broughtbrings together team members from around the country togetherworld to reconnect face-to-face, and take part in presentations from top executives and smaller breakout sessions that focusedfocus on Emerald’s new business ventures and strategic roadmap androadmap. ACE concludes with an employee award presentation which recognizedrecognizes individuals chosen by their peers as true leaders.
Emerald’s corporate culture and benefitbenefits offerings are also designed to meet the wide range of needs of our workforce including:
|
|
|
|
•
|
|
|
|
|
|
These resources are intended to support the physical, emotional and financial well-being of our employees.
In order to protect our workforce from the outbreak of COVID-19, in March 2020, Emerald transitioned all of our employees to a remote/work-from-home arrangement, and as of November 2021, we permanently adopted a hybrid work structure whereby employees have the flexibility to work from home and come in tointo the office to maximize in-person collaborationcollaboration. As we resumehave resumed in-person events, we have prioritized the health and safety of our employees as well as our exhibitors and attendees, taking extensive COVID-19 protective measures.
Providing all our employees with the resources to develop their talents, develop their careers and reach their goals is a top priority at Emerald. To enable this, the Company provides numerous opportunities for employees to expand their professional and personal development, including unlimited access to Skillsoft’s online platform which
7
provides continuous learning and career enhancement resources coupled with formal sales development and training from a professional sales coach. In addition, we have implemented a manager effectiveness training program and formalized an employee mentorship program.
Emerald is not involved in any material disputes with our employees and we believe that relations with our employees are good. None of our employees are subject to collective bargaining agreements with unions. However, some facilities where we hold our trade shows require our decorators to use unionized labor.
Commitment to Corporate Sustainability and Governance
Emerald is dedicated to advancing its Environmental, Sustainability
WeSocial and Governance practices across the organization. This commitment and purpose fuels our innovation, drives our collaboration, and creates lasting value for our customers, employees, shareholders, and the communities in which we live, work, and do business. To that end, we are committed to minimizing our environmental impact with the goal of reducing the environmental footprint of our events. In partnership with the global Net Zero Carbon Events initiative, Emerald has taken the Net Zero Carbon Events pledge to chart a path towards net zero carbon emissions by 2050, with an interim goal to reduce greenhouse gas emissions by 50% by 2030. As part of this pledge, we have undertaken efforts to identify and prioritize actions to reduce greenhouse gas emissions, including energy management, water conservation, materials management, food and beverage waste reduction, sustainable procurement, stakeholder management and employee engagement initiatives.
We are also working Emerald continues to develop, gather and track key event metrics to measure the environmental impact of our events and benchmark success against our pledged goals. We intend toalso collaborate with key partners and suppliers throughout the event industry, including venues, hotels, and general service contractors in furtherance of our sustainability initiatives.
Equally important to Emerald is creating an employee experience that fosters the Company’s culture of respect and inclusion. Emerald knows its ultimate success is directly linked to its ability to identify and hire talented individuals from all backgrounds and perspectives, and we are committed to developing and fostering a culture of diversity and inclusion. By welcoming the diverse perspectives and experiences of our employees, we all share in the creation of a more vibrant, unified, and engaging place to work. In early 2022, we formed an official Diversity, Equity and Inclusion Committee, made up of employees from throughout the organization, to help Emerald build upon our existing programs and maintain best practices to foster a diverse and inclusive work environment.
InsuranceEmerald partners with the non-profit OneTen which cultivates economic opportunities for Black talent in the United States with a goal of providing one million jobs to Black individuals within the next ten years. We have also eliminated the college-degree requirement for a range of positions to expand the application process to include candidates with more diverse backgrounds, skills, and experiences. Further, all personnel are required to attend training programs focused on unconscious bias training and interview skills.
In addition to company-wide initiatives, many of our trade shows sponsor ESG related initiatives, such as:
Emerald is committed to sound corporate governance and effective leadership practices to ensure that the Company delivers the best results for its stakeholders. We believe that the composition and professional background of our board and our executive leadership team are well-balanced and position the Company for long term growth.
8
Insurance
We maintain insurance policies to cover the principal risks associated with our business, including event cancellation, business interruption, workers’ compensation, directors’ and officers’ liability, cyber security, product liability, auto, property, and umbrella and excess liability insurance. All of our insurance policies are with third-party carriers and syndicates with financial ratings of AA- or better. We believe the premiums, deductibles, coverage limits and scope of coverage under such policies are reasonable and appropriate for our business. Event cancellation insurance provides coverage that allows us to refund a proportionate share, relative to the compromised enforced attendance reduction or show closure, of the deposits and booth and sponsorship fees paid to us by exhibitors in the event that we are forced to cancel a trade show or other event for reasons covered by the policies, such as natural disasters, terrorism, or venue closures. Business interruption insurance provides further coverage for our office property leases in cases where we are not able to conduct ongoing business, including sales and event planning. The continued availability of appropriate insurance policies on commercially reasonable terms is important to our ability to operate our business and to maintain our reputation.
Our event cancellation insurance policies protect against losses due to the unavoidable cancellation, postponement, relocation and enforced reduced attendance at events due to certain covered causes. Specifically, for the policies covering calendar years 2020 and 2021, these causes includeincluded event cancellation caused by the outbreak of communicable diseases, including COVID-19. However, coverage for the outbreak of communicable disease, including COVID-19, is not included in the 2022our event cancellation insurance policy.policies for policy years beginning in 2022. In addition, coverage for each of our event cancellation insurance policies extends to include additional promotional and marketing expenses necessarily incurred by us should a covered loss occur. These policies also include a terrorism endorsement covering
an act of terrorism and/or threat of terrorism directed at the insured event or within the United States or its territories. The aggregate limit under thesefor our renewed 2024 primary event cancellation insurance policiespolicy is approximately $191.1 million in 2020, $191.4 million in 2021, and $100.0 million in 2022 if losses arise for reasons within the scope of the respective policies.
In addition to these primary policies, Emerald maintainsmillion. We have also obtained a similar separate event cancellation insurance policiespolicy for the Surf Expo Summer 2020, Surf Expo Winter 2021, Surf Expo Winter 20222024 and Surf Expo Summer 20222024 shows, with respectivea coverage limitslimit of $6.0 million, $7.7 million, $8.4approximately $7.6 million and $6.5 million. Similar$7.8 million, respectively.
On August 3, 2022, we reached an agreement to the primarysettle outstanding insurance litigation relating to event cancellation insurance policies, coveragefor proceeds of $148.6 million. During the year ended December 31, 2022, we recorded other income, net of $182.8 million related to event cancellation insurance claim and settlement proceeds deemed to be realizable by our management team. All of the other income, net for the outbreakyear ended December 31, 2022 was received during the period. We received payments of communicable disease, including COVID-19, is included for$95.3 million from our insurance carrier to recover the policies covering Surf Expo Summer 2020 and Surf Expo Winter 2021, but not included forlost revenues, net of costs saved, of the policies covering Surf Expo Winter 2022 and Surf Expo Summer 2022.
The Company is inaffected trade shows during the process of pursuing claims under theyear ended December 31, 2021 and 2020we concluded that the receipt of $17.8 million of additional insurance policies to offset the financial impactproceeds was realizable as of cancelled and postponed events asDecember 31, 2020. As a result, of COVID-19. As ofduring the year ended December 31, 2021, we have received proceedsreported other income, net of $184.4$77.4 million to recognize the amount that was recovered from the insurance company. Further, in respect of claims filed under ourSeptember 2023, we reached an agreement to settle the last remaining outstanding insurance litigation relating to Surf Expo event cancellation insurance policies. To date, we have submitted $249.0 million in claims for impacted or cancelled events previously scheduled to take place in 2020 and 2021. There is no guarantee or assurance as to the amount or timing of future recoveries from Emerald’s event cancellation insurance policies.proceeds for $2.8 million.
See “Management’s Discussion and Analysis of Financial Condition and Results of Operations—Liquidity and Capital Resources” for further discussion relating to our event cancellation insurance coverage and proceeds received under the Company’s policies.
Available Information
Our Annual Reports on Form 10-K, Quarterly Reports on Form 10-Q, Current Reports on Form 8-K, and amendments to reports filed pursuant to Sections 13(a) and 15(d) of the Exchange Act, are filed with the SEC. We are subject to the informational requirements of the Exchange Act and file or furnish reports, proxy statements and other information with the SEC. Such reports and other information filed by us with the SEC are available free of charge on our website at investor.emeraldx.com when such reports are made available on the SEC’s website. The SEC maintains an Internet site that contains reports, proxy and information statements and other information regarding issuers that file electronically with the SEC at www.sec.gov. The contents of these websites are not incorporated into this filing. Further, our references to the URLs for these websites are intended to be inactive textual references only.
9
Item 1A. Risk Factors.
RISK FACTORS
Investing in our common stock involves a high degree of risk. You should carefully consider the following factors, as well as other information contained in this Annual Report on Form 10-K, in evaluating our Company and business. If any of the following risks occur, our business, results of operations, and financial condition may be materially adversely affected.
Risks Relating to Our Industry and Macroeconomic Conditions
General economic conditions may have an adverse impact on the industry sectors in which our trade shows, conferences and other events operate and therefore may negatively affect demand for exhibition space and attendance at our trade shows, conferences and other events.
Our business depends upon the ability and willingness of companies to attend our shows, and such attendance is sensitive to general economic conditions and corporate spending patterns. Consequently, in addition to general domestic and global economic conditions affecting our business, certain industry-specific conditions could affect our trade shows, conferences and other events. The longer a recession or economic downturn continues, or the longer a particular industry sector is impacted by macroeconomic headwinds, the more likely it becomes that our customers reduce their marketing and advertising or procurement budgets. Any material decrease in marketing or procurement budgets could reduce the demand for exhibition space or reduce attendance at our trade shows, conferences and other events, which could have a material adverse effect on our business, financial condition, cash flows and results of operations.
Inflationary pressures and increased interest rates could negatively impact demand for exhibition space, attendance at our tradeshows, conferences, events, and profitability
We and our customers may also be adversely affected by the impact of the rise of interest rates and sustained inflationary conditions. Throughout 2022 and the first half of 2023, the Federal Reserve approved almost a dozen interest increases to as high as 5.50% in July 2023. Additionally, inflation influences interest rates, which in turn impact the fair value of our investments and yields on new investments as well as increasing our financing costs. While inflation has not historically had a material effect on our business, results of operations, or financial condition, if our costs were to become subject to significant inflationary pressures, we may not be able to fully offset such higher costs. Our inability or failure to do so could harm our business, results of operations and financial condition. Operating expenses, including cost of labor, are impacted to a certain degree by the inflation rate as well.
Our operations, business and financial results have been, and continue tomay in the future be, materially impacted by COVID-19 or future public health emergencies, including outbreaks of communicable disease or other public health emergency.
The Company’s operations and operating results were materially impacted by the COVID-19 pandemic.
The global spread ofpandemic, and the COVID-19 pandemic has been severe and rapidly evolving, withactions taken by governments public institutions and other organizations imposing or recommending, and businesses and individuals implementing, restrictions on various activities or other actionsaround the world to combat its spread.the virus had a significant negative impact on our live events, which depend on our ability to hold such in-person events and the willingness of exhibitors and attendees to attend. These restrictions includegovernmental actions included limitations and bans on travel or transportation; limitations on the size of gatherings; closures of work facilities, public buildings and businesses; cancellation of events, including trade shows, conferences and meetings; and quarantines and lockdowns. The pandemic and its consequences forced us to cancel or postpone a substantial portion of our event calendar for 2020 and 2021. These cancellations and postponements have had, and will continueIf similar actions were to have, a severely negative impact onbe taken in response to future public health emergencies, our business, operations, and financial results.results could be negatively impacted. While we have begun to stage liveoperated a full slate of events again,in both 2022 and 2023, exhibitor participation and attendance at some of our events remain significantlytrade shows was still below pre-pandemic levels. The extent to which the ongoing pandemicCOVID-19 continues to impact our business, operations, and financial results, including the duration and magnitude of such effects, will depend on numerous evolving factors that we may not be able to accurately predict or assess, including the durationadvent of new variants; government, social and scopebusiness restrictions on in-person events; the availability, adoption and efficacy of vaccines and treatments; and the effect of the pandemic; the negative impact it will havepandemic on global and regional economies and economic activity, including the duration and magnitude of its impact on the industry sectors in which our trade shows, conferences and other events operate; its short and longer-termlong term general economic conditions. The impact on our customers’ marketing, advertising or procurement budgetsof
10
COVID-19 could also cause a long-term reduction in the willingness of exhibitors and their willingness or abilityattendees to travel to our events; actions that federal, state and local governments take in response to the pandemic, including limiting or banning travel and large gatherings; quarantine requirements; effectiveness and distribution of vaccinations; and how quickly economies, travel activity, and demand for face-to-face trade shows, conferences and other events, recover after the pandemic subsides.
More specifically, the COVID-19 pandemic has subjectedwhich could have a material adverse effect on our business, operations and financial condition, to a numbercash flows and results of risks, including, but not limited to, those discussed below:operations.
|
Attendance at our shows could decline as a result of |
|
|
COVID-19, and the volatile regional and global economic conditions stemming from the pandemic, as well as reactions to future pandemics or resurgences of COVID-19, could also precipitate or aggravate the other risks we face, which in turn could materially adversely affect our business, financial condition, liquidity, results of operations (including revenues and profitability) and/or stock price. Further, COVID-19 may also affect our operating and financial results in a manner that is not presently known to us or that we currently do not consider to present significant risks to our operations. In these dynamic circumstances, there may be developments outside our control requiring us to adjust our operating plan.
Attendance at our shows has declined as a result of the COVID-19 pandemic, and may continue to decline due to disruptions in global or local travel conditions, such as congestion at airports, the risk of or an actual terrorist action, adverse weather or outbreaks or fear of communicable diseases.diseases such as COVID-19.
Our business depends largely on the ability
The number of attendees and willingnessexhibitors at our trade shows may be affected by a variety of people, whetherfactors that are outside our control. Because many attendees and exhibitors or attendees, to travel to our events. As a result,trade shows via airplane, factors that depress the ability or desire of attendees and exhibitors to travel to our trade shows, including, but not limited to: outbreaks of contagious disease, such as the continuing COVID-19 pandemic; increased costs associated with air travel;to, an increased frequency of flight delays or accidents; actualaccidents, outbreaks of contagious disease or threatened terrorist attacks;the potential for infection (including COVID-19 and any new variants), increased costs associated with air travel, the imposition of heightened security standards bans or travel restrictionsbans on visitors from foreign countries;particular countries outside the United States, delays in acquiring visas for travel to the United States, or acts of nature, such as earthquakes, storms and other natural disasters, could have a material adverse effect on our business, financial condition, cash flows and results of operations. In addition to the impact of the COVID-19 pandemic, in the past we have experienced disruptions to several events due to hurricanes in Florida, and may be forced to cancel or re-locate future trade shows in the event of other natural or man-made disasters. While we are generally insured against direct losses resulting from event cancellations due to circumstances outside of our reasonable control, our 2022 event cancellation insurance policies for policy doesyears beginning in 2022 do not include coverage for losses due to the outbreak of communicable disease, including COVID-19. Furthermore, the occurrence of one or more of the factors described above, including a prolonged recovery from the COVID-19, pandemic or a spike or resurgence in cases of COVID-19, could cause a long-term reduction in the willingness of exhibitors and attendees to travel to attend our trade shows, which could have a material adverse effect on our business, financial condition, cash flows and results of operations.
General economic conditions may have an adverse impact on the industry sectors in which our trade shows, conferences and other events operate, and therefore may negatively affect demand for exhibition space and attendance at our trade shows, conferences and other events.
In addition to general domestic and global economic conditions affecting our business, certain industry-specific conditions could affect our trade shows, conferences and other events. The longer a recession or economic downturn continues, or the longer a particular industry sector is impacted by macroeconomic headwinds, the more likely it becomes that our customers may reduce their marketing and advertising or procurement budgets. We and our customers may also be adversely affected by the impact of sustained inflationary conditions. Any material decrease in marketing or procurement budgets could reduce the demand for exhibition space or reduce attendance at our trade shows, conferences and other events, which could have a material adverse effect on our business, financial condition, cash flows and results of operations.
Increased spending on digital marketing and advertising, or other marketing channels, could reduce the amount spent on in-person trade shows.
The success of our trade shows depends on the willingness of companies to continue committing marketing budget allocations towards in-person shows and live events. Alternative channels for marketing spend such as digital, social media and telemarketing could draw marketing budgets away from in-person trade shows and live events. Moreover, digital marketing and social media have experienced meaningful growth over the last several years and, although we have not observed a material decline in demand for our trade shows as a result of the increasing use of the internet and social media for advertising and marketing, the increasing influence of online marketing and any resulting reductions or eliminations of the budgets our participants allocate to our trade shows could have a material adverse effect on our business, financial condition, cash flows and results of operations.
Risks Relating to Our Business and Operations
Our inability to secure or retain desirable dates and locations for our trade shows could have a material effect on our business, financial condition, cash flows and results of operations.
The date and location of a trade show can impact its profitability, prospects and the demand and competition for desirable dates and locations for trade shows is high. Consistent with industry practice, we typically maintain multi-year non-binding reservations for dates at our trade show venues. Aside from a nominal deposit in some cases, we do not pay for these reservations. However, these reservations are not binding on the facility owners until we execute a definitive contract with the owners and we are not always provided a last looknotice before the venue is rented to a third party during the reservation period. We typically sign contracts that guarantee the right to specific dates at venues only one or two years in advance. Therefore, our multi-year reservations may not lead to binding contracts with facility owners. Consistency in location and all other aspects of our trade shows is important to maintaining a high retention rate from year to year, and we rely on our highly loyal customer base for the success of our shows. Moving major shows to new cities, such as the move of Outdoor RetailerOR from Denver, Colorado to Salt Lake City, Utah to Denver, Colorado in January 2018,2023, can adversely affect customer behavior. Similarly, significant timing and frequency changes, such as the move of Outdoor RetailerOR Winter Market from January 2024 to November 2019 to January 20202024 and the shift from a three-show to two-show format for Outdoor RetailerOR in 2019, can also result in unanticipated customer reactions. ExternalOur business has from time to time been negatively impacted by these moves and changes in scheduling. In addition, external factors such as legislation and government policies at the local or state level, including policy related to social, political and economic issues, may depressweaken the desire of exhibitors and attendees to attend our trade shows held in certain locations, or cause us to move our trade shows.
11
The success of each of our trade shows depends on the strong reputation of that show’s brand.
Our exhibitors and attendees primarily know us by the names of our trade shows that operate in their specific industry sector rather than by our corporate brand name, Emerald. In addition, a single brand name is sometimes used for shows that occur more than once a year; foryear. For example, the brand name “ASD Market Week” is used at our ASD Market Week March and ASD Market Week August shows. If the image or reputation of one or more of these shows is tarnished, it could impact the number of exhibitors and attendees attending that show orthose shows. A decline in one of our larger shows could have a material adverse effect on our business, financial condition, cash flows and results of operations.
If we fail to attract leading brands as exhibitors in, or high-quality attendees to, our trade shows, we may lose the benefit of the self-reinforcing “network effect” that many of our shows enjoy today.
The leading brands represented by our exhibitors attract attendees who, in many cases, have authority to make purchasing decisions, or who offer other benefits (such as publicity or press coverage) by virtue of their attendance. The presence of these exhibitors and attendees creates the self-reinforcing “network effect” that benefits our business; however, if representatives of leading brands decide for any reason not to participate in our trade shows, the number and quality of attendees could decline, which could lead to a rapid decline in the results of one or more trade shows and have an adverse effect on our business, financial condition, cash flows and results of operations.
We may fail to accurately monitor or respond to changing market trends and adapt our trade show portfolio accordingly.
Our success depends in part upon our ability to monitor changing market trends and to adapt our trade shows, acquire existing trade shows or launch new trade shows to meet the evolving needs of existing and emerging target audiences. The process of researching, developing, launching, relaunching and establishing profitability for a new trade show may lead to initial operating losses. While we did not launch any new in-person events in 2021 or 2020 due to the impact of COVID-19, we launched five new events in 2019, and expect to continueOur strategy is to launch new eventstrade shows from time to time in future periods, including several in 2022.order to take advantage of these trends. Our efforts to adapt our trade shows, or to introduce new trade shows into our portfolio, in response to our perception of changing market trends, may not succeed, which could have a material adverse effect on our business, financial condition, cash flows and results of operations.
We may face increased competition from existing trade show operators or new competitors.
Although the trade show market is highly fragmented, we currently face increased competition in certain of our industry sectors. Further, our high profit margins and low start-up costs could encourage new operators to enter the trade show business. Both existing and new competitors present an alternative to our product offerings, and if competition increases or others are successful in attracting away our exhibitors and attendees, it could have a material adverse effect on our business, financial condition, cash flows and results of operations.
A significant portion of our revenue has historically been generated by a concentrated number of our top trade shows.
We have historically depended on a concentrated number of our top trade shows to generate a significant portion of our revenues. For the year ended December 31, 2019,2022, which is the last year in which our operations were not materially impacted by the COVID-19 pandemic, our top five shows represented 30%29% of our total revenues. For the year ended December 31, 2023, these shows generated 28% of our total revenue. While we continue to make efforts to diversify our business, a significant decline in the performance or prospects of any one of our toptrade shows could have a material adverse effect on our business, financial condition, results of operations and cash flows.
We may not fully realize the expected results and/or operating efficiencies associated with our strategic initiatives or restructuring programs, which may have an adverse impact on our business.
We depend on our ability to evolve and grow, and as changes in our business environment occur, we may adjust our business plans by introducing new strategic initiatives or restructuring programs to meet these changes. Recent strategic initiatives include our efforts to:to (i) implement various sales effectiveness initiatives to improve productivity of our sales efforts, (ii) establish three dedicated divisions focused on Connections, Content and
12
Commerce, (iii) implement event plans to standardize marketing and sales planning across our event portfolio, (ii)(iv) introduce value-based pricing in order to improve transparency and customer satisfaction while driving yield improvement, and (iii)(v) enhance our data analytics capabilities to develop new commercial insights. If we are not able to effectively execute on our strategic initiatives, if we do not adequately leverage technology to improve operating efficiencies or if we are unable to develop the data analytics capabilities needed to generate actionable commercial insights, our business performance may be impacted, which may negatively impact our financial condition and results of operations.
Our acquisition growth strategy entails risk and our future acquisitions may not be successful.
We may explore opportunities to purchase or invest in other businesses or assets that we believe will complement, enhance or expand our current business or that might otherwise offer us growth opportunities. Any transactions we identify may entail various risks, including, among others:
• the risks inherent in identifying desirable acquisition candidates, including management time spent away from running our core business and external costs associated with identifying such acquisition candidates; • the risk that we turn out to be wrong with respect to selecting and consummating what we had believed to be accretive acquisitions; • the risk of overpaying for a particular acquisition; • the risks of failing to successfully integrate acquisitions and retain the key employees and/or customers of acquired businesses; • the risks inherent in expanding into new lines of business, including our expansion into the digital commerce software-as-a-service business through the acquisition of PlumRiver, LLC (“PlumRiver”) which included the Elastic Suite product, and our recent acquisition of Bulletin Inc., a digital wholesale platform connecting brands and buyers; • the risks inherent in expanding our existing business into new categories or industries, including our recent expansion into the highly regulated cannabis industry through the acquisition of MJBiz; • the risks inherent in expanding into consumer events through our acquisition of the Overland Expo outdoor adventure events from Lodestone; • the risks relating to potential unknown liabilities of acquired businesses; • the cultural, execution, currency, tax and other risks associated with international expansion including our recent acquisition of Advertising Week and any future further expansion; and • the risks associated with financing an acquisition, which may involve diluting our existing stockholders, reducing our liquidity or incurring additional debt, which in turn could result in increased debt service costs and/or a requirement to comply with certain financial or other covenants. |
|
|
|
|
|
|
|
|
|
|
|
|
|
|
|
|
|
|
In furtherance of our strategy of growth through acquisitions, we routinely review and conduct investigations of potential acquisitions, some of which may be material. When we believe a favorable opportunity exists, we typically seek to enter into discussions with target shows or sellers regarding the possibility of such acquisitions. At any given time, we may be in discussions with one or more counterparties. There can be no assurances that any such negotiations will lead to definitive agreements, or if such agreements are reached, that any transactions would be consummated.
The acquisition of MJBiz may subject us to new regulatory, business and financial risks relating to the cannabis industry.
On December 31, 2021, we completed the acquisition of MJBiz. MJBiz publishes MJBiz Daily, a leading publication addressing business, regulatory, operational, and legal issues relevant to the cannabis and hemp industries, and also sponsors the annual MJBizCon, a trade event and conference for the cannabis industry and an annual educational conference in San Diego for the scientific community focused on research, testing, and lab services in the cannabis industry. Although we do not grow, sell or distribute cannabis products, and sale and distribution of cannabis
13
products are not permitted at MJBiz-sponsored events, our connection with businesses that serve the cannabis industry could subject us to regulatory, financial, operational and reputational risks and challenges.
Under U.S. federal law, and more specifically the Controlled Substances Act (“CSA”), the cultivation, processing, distribution, sale, advertisement, and possession of cannabis are illegal, notwithstanding the legalization of sales for medicinal or adult recreational use in many individual states. As a result, federal law enforcement authorities, or authorities in certain U.S. jurisdictions that criminalize the processing, sale or possession of cannabis products, may seek to bring criminal actions against exhibitors, attendees or subscribers to MJBiz’s events and publications.If our exhibitors or customers are found to be violating applicable state or federal law relating to cannabis, they may be subject not only to criminal charges and convictions, but also to forfeiture of property, significant fines and penalties, disgorgement of profits, administrative sanctions, cessation of business activities, or civil liabilities arising from proceedings initiated by either government entities or private citizens. Further, the perception that businesses that participate in MJBiz events or subscribe to or advertise in MJBiz publications are engaged in or promoting socially undesirable activity could have an adverse impact on our overall corporate reputation. In addition, the breadth of federal conspiracy and aiding and abetting statutes could potentially subject us to prosecution for aiding and abetting or conspiring to violate the CSA by virtue of our sponsoring events or publications that are directed to businesses that directly or indirectly service the cannabis industry. Any of these actions or consequences could have a material adverse effect on our business, operating results or financial condition, particularly if law enforcement authorities seek to treat MJBiz as participating directly in the cannabis industry.
We rely on digital media and print publications to stay in close contact with, and market to, our existing event audiences.
Our ability to effectively engage with target audiences for our events depends in part on our ability to generate engaging and informative content for our other marketing services, including our digital media and print publication properties. The media industry is highly competitive and continues to evolve rapidly, with an increasing number of alternative methods for the production and delivery of content. If we are unable to generate timely and relevant content for our audiences, exploit new and existing technologies to distinguish our digital media and print publications from those of our competitors, or adapt to new distribution methods in order to provide enhanced user experiences, both our other marketing services and event revenues could decline, which may have a material adverse effect on our business, financial condition, cash flows and results of operations.
A loss or disruption of the services from one or more of the limited number of outside contractors who specialize in decoration, facility set-up and other services in connection with our trade shows could harm our business.
We, and to a greater extent, our exhibitors, use a limited number of outside contractors for decoration, facility set-up and other services in connection with our trade shows, and we and our exhibitors rely on the availability, capability and willingness of these contractors to provide services on a timely basis and on favorable economic and other terms. Notwithstanding our long-term contracts with many of these contractors, many factors outside our control could harm these relationships and the availability, capability or willingness of these contractors to provide these services on acceptable terms. The partial or complete loss of services from these contractors, or a significant adverse change in our or our exhibitors’ relationships with any of these contractors, could result in service delays, reputational damage and/or added costs that could harm our business and customer relationships to the extent we or our exhibitors are unable to replace them in a timely or cost-effective fashion, which could have a material adverse effect on our business, financial condition, cash flows and results of operations.
In addition, some facilities where we hold our trade shows require decorators, facility set-up and other service providers to use unionized labor. Any union strikes or work stoppages could result in delays in launching or running our trade shows and other events held at such facilities, reputational damage and/or added costs, which could have a material adverse effect on our business, financial condition, cash flows and results of operations.
The industry associations that sponsor and market certain of our trade shows could cease to do so effectively or could be replaced or supplemented by new industry associations who do not sponsor or market our trade shows.
We often enter into long-term sponsorship agreements with industry associations whereby the industry association endorses and markets our trade show to its members, typically in exchange for a percentage of the trade
14
show’s revenue. Our success depends, in part, on our continued relationships with these industry associations and our ability to enter into similar relationships with other industry associations. Although we frequently enter into long-term agreements with these counterparties, these relationships remain subject to various risks, including, among others:
• failure of an industry trade association to renew a sponsorship agreement upon its expiration; • termination of a sponsorship agreement by an industry trade association in specified circumstances; • the willingness, ability and effectiveness of an industry trade association to market our trade shows to its members; • dissolution of an industry trade association and/or the failure of a new industry trade association to support us; and • the ability on the part of an industry trade association to organize a trade show itself. |
|
|
|
|
|
|
|
|
|
|
Any disruptions or impediments in these existing relationships, or the inability to establish a new relationship, could have a material adverse effect on our business, financial condition, cash flows and results of operations.
We face risks associated with event cancellations or other interruptions to our business, which our insurance may not fully cover.
We maintain business interruption, event cancellation, casualty, general commercial and umbrella and excess liability insurance, as well as policies relating to workers’ compensation, director and officer insurance, property and product liability insurance, and cyber security insurance. Our insurance policies may not cover all risks associated with the operation of our business and may not be sufficient to offset the costs of all losses, lost sales or increased costs experienced during business interruptions or event cancellations. For example, in addition to the ongoing impact of the COVID-19, pandemic, we previously experienced disruptions to several events held in Florida due to hurricanes, and we may be forced to cancel future trade shows in the event of other natural or man-made disasters. Our recent claims history due to COVID-19, combined with the increased frequency of natural disasters due to climate change or other factors, has resulted in increased event cancellation insurance premiums and higher deductibles, and we cannot guarantee that such premium increases will not continue in the future or that we will be able to renew our insurance policies or procure other desirable insurance on commercially reasonably terms, if at all. Further, while we have been able to secure event cancellation insurance for the calendar year 2022,2023, this insurance policy does not include coverage for event cancellations due to the outbreak of communicable disease, including COVID-19. Losses and liabilities from uninsured or underinsured events and delay in the payment of insurance proceeds could have a material adverse effect on our financial condition and results of operations.
Failure to establish and maintain effective internal control over financial reporting could have a material adverse effect on our business and stock price.
We are required to comply with the SEC’s rules implementing Sections 302 and 404 of the Sarbanes-Oxley Act, which require management to certify financial and other information in our quarterly and annual reports, and provide an annual management report on the effectiveness of internal control over financial reporting. As an emerging growth company,reporting and include the attestation form from our independent registered public accounting firm willfirm. If we do not be required to attest to the effectiveness of ourdevelop and maintain effective internal control over financial reporting until the fiscal year ended December 31, 2022. At such time,controls, our independent registered public accounting firm may issue a report that is adverse, which would be required if there are material weaknesses in our internal control over financial reporting.
In connection with becoming a public company, we have undertakenundertook various actions to enable us to develop and will need to take additional actions,maintain effective internal controls, such as implementing numerous internal controlsbuilding compliance and testing processes, and hiring additional accounting or internal audit staff or consultants. We have hired a third-party service provider to assist us with implementationexecution and management of our internal audit function. Testing and maintaining internal control over financial reporting can divert our management’s attention from other matters that are important to the operation of our business. Additionally, when evaluating our internal control over financial reporting, we may identify material weaknesses that we may not be able to remediate on a timely basis. If we identify any material weaknesses in our internal control over financial reporting and conclude that our internal control over financial reporting is not effective, or if our independent registered public accounting firm is unable to express an unqualified opinion as to the effectiveness of our internal control over financial reporting, once we are no longer an emerging growth company, investors may lose confidence in the accuracy and completeness of our financial
15
reports and the market price of our common stock could be negatively affected, and we could become subject to investigations by the New York Stock Exchange, the SEC or other regulatory authorities, which could require additional financial and management resources. In addition, if we fail to remedy any material weakness, our financial statements could be inaccurate and we could face restricted access to capital markets.
Because we no longer qualify as an “emerging growth company” as defined in the JOBS Act as of December 31, 2022, we have increased our legal and financial compliance costs, and management and other personnel are required to divert increased attention from operations and other business matters to devote substantial time to the public company reporting requirements that apply to us as an accelerated filer. If we do not comply with our public reporting requirements, the market price of our stock could decline and we could be subject to sanctions or investigations by the New York Stock Exchange, the SEC or other regulatory authorities, which would result in additional financial and management resources.
We have identified ain the past material weaknessweaknesses in our internal control over financial reporting. If we are unable to develop and maintain effective internal control over financial reporting, we may not be able to accurately report our financial results in a timely manner, which may adversely affect investor confidence in us; materially and adversely affect our business and operating results; and expose us to potential litigation.
A material weakness is a deficiency, or a combination of deficiencies, in internal control over financial reporting such that there is a reasonable possibility that a material misstatement of our annual or interim consolidated financial statements will not be prevented or detected and corrected on a timely basis.
Specifically, we did not design and maintain effective controls related to the evaluation of the impact of the arrangement’s terms and conditions on the accounting and reporting for preferred stock instruments. This material weakness resulted in the restatement of our previously filed consolidated financial statements as of and for the year ended December 31, 2020, as well as the quarterly condensed consolidated financial information for the 2020 interim periods ended June 30, September 30, and December 31, 2020 related to temporary equity, permanent equity, additional paid in capital, accretion to redemption value of redeemable convertible preferred stock, net loss and comprehensive loss attributable to common shareholders, loss per share and the related disclosures. Additionally, this material weakness could result in misstatements of the aforementioned account balances or disclosures that would result in a material misstatement to the annual or interim consolidated financial statements that would not be prevented or detected.
Effective internal control over financial reporting is necessary for us to provide reliable financial reports and prevent fraud. We continue to evaluate stepsDuring the year ended December 31, 2022, we undertook efforts to remediate the material weakness.weaknesses. These remediation measures maycan be time consuming and costly and there is no assurance that these initiatives will ultimately have the intended effects.
costly. In order to remediate the material weakness, we planhave expended resources to enhance the design of our control activities related to the evaluation of the impact of the terms and conditions on the accounting and reporting for preferred stock issuances.issuances and recognizing payment obligations payable to third parties upon recognition of insurance claim proceeds.
If we are not able to remediate the material weakness, or if we identify any new material weaknesses in the future, we may be unable to maintain compliance with the requirements of securities laws, stock exchange listing rules, or debt instrument covenants regarding timely filing of information; we could lose access to sources of capital or liquidity; and investors may lose confidence in our financial reporting and our stock price may decline as a result. Though we are taking steps to remediate thehave resolved existing material weakness,weaknesses as of December 31, 2022, we cannot assure you that the measures we have taken to date, or any measures we may take in the future will be sufficient to remediate the material weaknessavoid or avoidremediate potential future material weaknesses.
As a result of the material weaknessweaknesses and the related restatements due to the change in the accounting for redeemable convertible preferred stock from permanent to temporary equity,previously identified, and other matters raised or that may in the future be identified, we face potential for adverse regulatory consequences, including investigations, penalties or suspensions by the SEC or the New York Stock Exchange, litigation or other disputes which may include, among others, claims invoking the federal and state securities laws, contractual claims or other claims arising from the restatements and material weakness in our internal control over financial reporting and the preparation of our consolidated financial statements. As of the date of this filing, we have no knowledge of any such regulatory consequences, litigation, claim or dispute. However, we can provide no assurance that such regulatory consequences, litigation, claim or dispute will not arise in the future. Any such regulatory consequences, litigation, claim or dispute, whether successful or not, could subject us to additional costs, divert the attention of our management, or impair our reputation. Each of these consequences could have a material adverse effect on our business, results of operations and financial condition.
16
During 20202021 and 2021,2022, we recorded noncash adjustments to our recorded asset balance for certain intangible assets, and we may be required to record further such adjustment in future periods that could significantly impact our operating results.
Our balance sheet includes significant intangible assets, including trade names, goodwill and other acquired intangible assets. The determination of related estimated useful lives and whether these assets have been impaired involves significant judgment and subjective assessments, including as to our future business performance, and is subject to factors and events over which we have no control. The continued impact of potential new COVID-19 variants or other communicable disease outbreaks on our business, slower growth rates, the introduction of new competition into our markets or other external or macroeconomic factors could impair the value of our intangible assets if they create market conditions that adversely affect the competitiveness of our business. Further, declines in our market capitalization may be an indicator that the carrying values of our intangible assets or goodwill exceed their fair values, which could lead to potential impairments that could impact our operating results. For the year ended December 31, 2022, we recorded non-cash goodwill impairments of $6.3 million and non-cash intangible asset impairments of $1.6 million for certain trade names. For the year ended December 31, 2021, we recorded non-cash goodwill impairments of $7.2 million and non-cash intangible asset impairments of $24.3$21.0 million and $8.4 million for certain trade names and certain customer relationships, respectively. For the year ended December 31, 2020, we recorded
non-cash goodwill impairments of $603.4 million and non-cash intangible asset impairments of $60.9 million and $15.9$11.7 million for certain customer relationships and certain trade names, respectively. There can be no assurance that we will not record further impairment charges in future periods.
Changes in our income tax rates or other indirect taxes may affect our future financial results.
Our future effective income tax rates may be favorably or unfavorably affected by unanticipated changes in the valuation of our deferred tax assets and liabilities, by changes in our stock price, or by changes in tax laws or their interpretation, including the Tax Cuts and Jobs Act enacted in December 2017. The Tax Cuts and Jobs Act introduced significant changes to U.S. income tax law. Accounting for the income tax effects of the Tax Cuts and Jobs Act has required significant judgments and estimates as well as accumulation of information not previously provided for in U.S. tax law. As additional regulatory or accounting guidance related to the Tax Cuts and Jobs Act is issued, our analysis may change, which could materially affect our tax obligations and effective tax rate. In addition, we are subject to the continuous examination of our income tax returns by the Internal Revenue Service and other tax authorities. We regularly assess the likelihood of adverse outcomes resulting from these examinations to determine the adequacy of our provision for income taxes. These continuous examinations may result in unforeseen tax-related liabilities, which may harm our future financial results.
On August 16, 2022, President Biden signed the Inflation Reduction Act of 2022 (“IRA”) into law. The IRA establishes a 15% corporate minimum tax effective for taxable years beginning after December 31, 2022, and imposes a 1% excise tax on the repurchase after December 31, 2022 of stock by publicly traded corporations. We currently do not expect the tax-related provisions of the IRA to have a material impact on our financial results.
The loss of key management personnel or other company talent could have an adverse effect on our business.
We rely on certain key management personnel in the operation of our businesses. While we maintain long-term and emergency transition plans for key management personnel and believe we could either identify internal candidates or attract outside candidates to fill any vacancy created by the loss of any key management personnel, the loss of one or more of our key management personnel could have a negative impact on our businesses.
Risks Relating to our Indebtedness
Our significant indebtedness could adversely affect our financial condition and limit our ability to raise additional capital to fund our operations.
We have a significant amount of indebtedness. As of December 31, 2021,2023, we had $519.7$413.3 million of term loan borrowings outstanding under theour Amended and Restated Term Loan Facility,Senior Secured Credit Facilities, with $109.0 million in additional borrowing capacity under the revolving portion of our Amended and Restated RevolvingSenior Secured Credit Facility (as defined below)Facilities (after giving effect to $1.0 million of outstanding letters of credit).
Our high level of indebtedness could have important consequences to us, including: limiting our ability to obtain additional financing to fund future working capital, capital expenditures, investments or acquisitions or other general
17
corporate requirements; requiring a substantial portion of our cash flows to be dedicated to debt service payments instead of other purposes, thereby reducing the amount of cash flows available for working capital, capital expenditures, investments or acquisitions or other general corporate purposes; increasing our vulnerability to adverse changes in general economic, industry and competitive conditions; exposing us to the risk of increased interest rates as borrowings under our Amended and Restated Senior Secured Credit Facilities (to the extent not hedged) bear interest at variable rates, including increases or changes resulting from the replacement or unavailability of LIBOR, which could further adversely impact our cash flows; limiting our flexibility in planning for and reacting to changes in our business and the industry in which we compete; restricting us from making strategic acquisitions or causing us to make non-strategic divestitures; impairing or restricting our ability to repay or refinance borrowings under the Amended and Restated Term Loan Facility;Senior Secured Credit Facilities; impairing our ability to obtain additional financing in the future; and increasing our cost of borrowing.
Any one of these limitations could have a material effect on our business, financial condition, cash flows, results of operations and ability to satisfy our obligations in respect of our outstanding debt.
Despite our current debt levels, we may incur substantially more indebtedness, which could further exacerbate the risks associated with our substantial leverage.
We and our subsidiaries may be able to incur additional indebtedness in the future, which may be secured. While our Amended and Restated Senior Secured Credit Facilities limit our ability and the ability of our subsidiaries to incur additional indebtedness, these restrictions are subject to a number of qualifications and exceptions and thus, notwithstanding these restrictions, we may still be able to incur substantially more debt. In addition, provided that no default or event of default (as defined in the Amended and RestatedExtended Senior Secured Credit Facilities) has occurred and is continuing, we have the option to request to add one or more incremental term loan or revolving credit facilities or increase commitments under the Amended and RestatedExtended Revolving Credit Facility. As of December 31, 2021,2023, we had $519.7$413.3 million of borrowings outstanding under the Amended and RestatedExtended Term Loan Facility, with
$109.0 $109.0 million in additional borrowing capacity under the Amended and RestatedExtended Revolving Credit Facility (after giving effect to $1.0 million of outstanding letters of credit). To the extent that we incur additional indebtedness, the risks that we now face related to our substantial indebtedness could increase.
The covenants in our Amended and Restated Senior Secured Credit Facilities impose restrictions that may limit our operating and financial flexibility.
Our Amended and Restated Senior Secured Credit Facilities contain, and any future debt agreements may contain, significant restrictions and covenants that limit our ability to operate our business, including restrictions on our ability to incur additional indebtedness; pay dividends, repurchase or redeem our capital stock; prepay, redeem or repurchase specified indebtedness; create certain liens; sell, transfer or otherwise convey certain assets; consolidate, merger or transfer all or substantially all of our assets, make certain investments; engage in transactions with affiliates, and enter into new lines of business. In addition, the Amended and RestatedExtended Revolving Credit Facility also contains a financial covenant requiring us to comply with a 5.50 to 1.00 total first lien net secured leverage ratio test. This financial covenant is tested quarterly if the aggregate amount of revolving loans, swingline loans and letters of credit outstanding under the Amended and RestatedExtended Revolving Credit Facility (net of up to $10.0 million of outstanding letters of credit) exceeds 35% of the total commitments thereunderthereunder.
As a result of these covenants, our ability to respond to changes in business and economic conditions and engage in beneficial transactions, including to obtain additional financing as needed, may be limited. Further, our compliance with these covenants may be affected by circumstances and events beyond our control. A breach of any of these covenants could result in a default under our debt agreements, which could permit the holders to accelerate our obligation to repay the debt. If that occurs, we may not be able to make all of the required payments or borrow sufficient funds to refinance such debt. Even if new financing were available at that time, it may not be on terms that
18
are acceptable to us or terms as favorable as our current agreements. If our debt is in default for any reason, our business, results of operations and financial condition could be materially and adversely affected.
Regulatory and Technology Risks
We face continually evolving cybersecurity and similar risks, which could result in loss, disclosure, theft, destruction or misappropriation of, or access to, our confidential information and cause disruption to our business, damage to our brands and reputation, legal exposure and financial losses.
We and third parties on our behalf, collect and store, including by electronic means, certain personal, proprietary and other sensitive information, including payment card information that is provided to us through registration on our websites or otherwise in communication or interaction with us. These activities require the use of centralized data storage, including through third-party service providers. Data maintained in electronic form is always subject to the risk of security incidents, including breach, compromise, intrusion, tampering, theft, misappropriation or other malicious activity, all of which are continuing to occur in our industry, as well as the industries of our exhibitors, vendors and suppliers. Unauthorized access to or security breaches of our systems could result in the loss of data, loss of business, severe reputational damage adversely affecting customer or investor confidence, diversion of our management’s attention, litigation, indemnity obligations, damages for contract breach, penalties for violation of applicable laws or regulations and significant costs for remediation that may include liability for stolen or lost assets or information and repair of system damage that may have been caused and other liabilities. Further, an actual or perceived security incident, such as penetration of our or our third-party vendors’ networks, affecting personal or other sensitive information could subject us to business and litigation risk (e.g., under the California Consumer Privacy Act), or damage our reputation, including with exhibitors, sponsors and attendees. In addition, we are exposed to potentially heightened liability pursuant to the new SEC disclosure rules regarding material cybersecurity incidents. Exposure as a result of any of the above factors could have a material negative effect on our business and results of operations.
As our business evolves digitally, we are using data more and more in our business operations. A cyber breach or loss of sensitive or valuable data, content or intellectual property could mean a loss of reputation and trust, losses for our shareholders, fines, regulatory reprimands and business interruption. Managing these impacts could be disruptive and could cause reputational damage if handled inadequately.
Our ability to safeguard such personal information, business information, and other sensitive information is important to our business. We take these matters seriously and take significant steps to protect our stored information, including the implementation of systems and processes to thwart malicious activity and invest in protecting and securing our information. These protections are costly and require ongoing monitoring and updating as technologies change and efforts to overcome security measures become more sophisticated, including as a result of increasingly sophisticated AI tools becoming available. Further, we exercise only limited control over our third-party vendors, which increases our vulnerability to problems with services they provide.
Our information technology systems, including our Enterprise Resource Planning (“ERP”) business management system, could be disrupted.
The efficient operation of our business depends on our information technology systems. We rely on our information technology systems and certain third-party providers to effectively manage our business data, communications, vendor relationships, order entry and fulfillment and other business and financial processes. We also rely on internet service providers, mobile networks and other third-party systems to operate our business. We are currently in the process of reviewing and updating our information technology systems and processes in order to enhance our data analytics capability. This implementation process will consume time and resources and may not result in our desired outcome or improved financial performance. Our failure to properly and efficiently implement our information technology systems, or the failure of our information technology systems to perform as we anticipate, could disrupt our business and could result in transaction errors, processing inefficiencies and the loss of revenue and customers, causing our business and results of operations to suffer. In addition, our information technology systems may be vulnerable to damage or interruption from circumstances beyond our control, including fire, natural disasters,
19
power outages, systems failures and viruses. While we maintain disaster recovery plans, any such damage or interruption could have a material adverse effect on our business.
We are subject to governmental regulation including a variety of U.S. and international privacy and consumer protection laws, and any failure to comply with these regulations may have a material negative effect on our business and results of our operations.
We are subject to substantial governmental regulations affecting the use of certain types of data in our business. These include, but are not limited to, data privacy and protection laws, regulations, policies, and contractual obligations that apply to the collection, transmission, storage, security, processing, retention, and use of personally identifiable information or personal data, which among other things, impose certain requirements relating to the privacy and security of such information.
The data protection landscape is rapidly evolving in the United States, the European Union and elsewhere, including the European Union’s General Data Privacy Regulation (“GDPR”). As our operations and business grow, we may become subject to or affected by new or additional data protection laws and regulations and face increased scrutiny or attention from regulatory authorities. Substantial expenses and operational changes may be required in connection with maintaining compliance with such laws, and even an unsuccessful challenge by customers or regulatory authorities of our activities could result in adverse publicity and could require a costly response from and defense by us. In addition, certain privacy laws are still subject to a high degree of uncertainty as to their interpretation, application and impact, and may require extensive system and operational changes, be difficult to implement, increase our operating costs, adversely impact the cost or attractiveness of the products or services we offer, or result in adverse publicity and harm our reputation. State-specific data privacy laws and regulations continue to evolve and each state imposes different requirements. For example, the California Consumer Privacy Act imposes certain legal obligations on our use and processing of personal information related to California residents and gives residents the right to bring certain actions against companies. Further, there are several legislative proposals in the United States, at both the federal and state level, that could impose new privacy and security obligations. Complying with emerging and changing requirements may cause us to incur substantial costs and make enhancements to relevant data practices. Noncompliance could result in significant penalties or legal liability having an adverse effect on our operations and financials.
We do not own certain of the trade shows and events that we operate or certain trademarks associated with some of our shows and therefore rely on ongoing license agreements with certain third parties.
The risks associated with some of our relationships with industry trade associations or other third-party sponsors of our events such as KBIS (which is owned by the National Kitchen and Bath Association), CEDIA, our Military trade shows, and NBA CON, which are the trade shows or events in our portfolio where the trademarks are owned by an industry association or other third party and not by us. Any material disruption to our relationship with these third parties could have a material adverse impact on the revenue stream from these trade shows or events. In addition, any of these third party owners may allege that we have breached a license agreement, whether with or without merit, and accordingly seek to terminate our license. If successful, this could result in our loss of the right to use the licensed intellectual property, which could adversely affect the success of our trade shows’ and events.
The infringement or invalidation of proprietary rights could have an adverse effect on our business.
We rely on trademark, trade secret and copyright laws in the United States and abroad to protect our proprietary rights, including with respect to the names of our trade shows and publications. Failure to obtain or maintain adequate protection of our intellectual property rights for any reason could have a material adverse effect on our business. Our trademarks, trade names and brand names distinguish our trade shows from those of our competitors and we have registered and applied to register many of these trademarks to prevent others from using or capitalizing our names. There can be no assurance that our trademark applications will be approved or that our federal registrations will be upheld if challenged. Third parties may oppose our applications or otherwise challenge our use of our trademarks through administrative processes or costly litigation which if successful, could force us to rebrand our products and/or services resulting in the loss of brand recognition. Further, there can be no assurance that competitors will not infringe upon our trademarks, or that we will identify all such infringements or have adequate resources to properly enforce our trademarks.
20
We have begun to use certain artificial intelligence (“AI”) technologies in our business, and challenges with properly managing its use could result in reputational harm, legal liability, and financial cost.
Uncertainty around new and evolving AI use, including generative AI, may require additional investment to develop responsible use frameworks, develop or license proprietary content and develop new approaches and processes to attribute or compensate content creators, which could be costly. We currently use artificial intelligence applications embedded in third party-platforms on a relatively limited basis. For example, we use Photoshop, which provides AI capabilities in generating or editing images. The use or adoption of new and emerging technologies may increase our exposure to intellectual property claims, and the availability of copyright and other intellectual property protection for AI-generated material is uncertain. While we continue to develop an AI strategy for internal frameworks of use, if we do not properly manage and track AI use, this could result in reputational harm and legal liability resulting in financial cost and expense.
Risks Relating to Ownership of Our Securities
The price of our common stock has fluctuated substantially from time to time and may continue to fluctuate substantially in the future.
Our stock price has been, and may continue to be, subject to significant fluctuations, and has decreased significantly in recent months from historical trading levels as a result of a variety of factors, some of which are beyond our control, such as volatility in the stock markets and the effects of COVID-19. We may fail to meet the expectations of our stockholders or securities analysts at some point in the future, and our stock price could decline furtherin the future as a result. This volatility and the size of Onex’s investment in our equity securities may prevent you from being able to sell your common stock at or above the price you paid for your common stock. Additionally, further declines in our stock price could require further goodwill write-downs.
In addition, the stock markets in general have experienced extreme volatility recently that has often been unrelated to the operating performance of particular companies. These broad market fluctuations may adversely affect the trading price of our common stock. Securities class action litigation has often been instituted against companies following periods of volatility in the overall market and in the market price of a company’s securities. Such litigation, if instituted against us, could result in substantial costs, divert our management’s attention and resources and harm our business, operating results and financial condition.
Because Onex controls the majority of our equity securities, it may control all major corporate decisions and its interests may conflict with the interests of other holders of our equity securities.
As of December 31, 2021,2023, Onex owned 47,058,332 shares of our common stock, representing 67.2%74.8% of our outstanding common stock. In addition, as of December 31, 2021,2023, Onex owned 69,718,919 shares of our redeemable convertible preferred stock, representing 170,056,580stock. Together, Onex owned shares of our common stock and Onex owned shares of our redeemable convertible preferred stock, on an as-converted basis, represent 183,697,428 shares of our common stock, after accounting for the accumulated accreting return at a rate per annum equal to 7% on the accreted liquidation preference and paid in-kind.in-kind dividends paid. Onex’s beneficial ownership of our common stock, on an as-converted basis, is approximately 86.1%90.5%.
The holders of our redeemable convertible preferred stock have the right to approve certain matters, including (i) amendments to our organizational documents in a mannerwhich may be adverse to the Series A Preferred Stock, (ii) the creation or issuance of senior or parity equity securities or (iii) the issuance of any convertible indebtedness, other class of preferred stock or other equity securities in each case with rights to payments or distributions in which the redeemable convertible preferred stock would not participate on a pro-rata, as-converted basis. In addition, for so long as the redeemable convertible preferred stock represents more than 30% of the outstanding common stock on an as-converted basis, without the approval of a majority of the directors elected by the holders of the redeemable convertible preferred stock, we may not (i) incur new indebtedness to the extent certain financial metrics are not satisfied, (ii) redeem or repurchase any equity securities junior to the redeemable convertible preferred stock, (iii) enter into any agreement for the acquisition or disposition of assets or businesses involving a purchase price in excess of $100 million, (iv) hire or terminate the chief executive officer of the Company or (v) make a voluntary filing for bankruptcy or commence a dissolution of the Company. Holders of our redeemable convertible preferred stock also have the right, for so long as
21
the outstanding redeemable convertible preferred stock represents specified percentages of our outstanding common stock on an as-converted basis, to elect up to five members of our Board of Directors.
Accordingly, for so long as Onex continues to hold the majority of our equity securities, Onex will exercise a controlling influence over our business and affairs and will have the power to determine all matters submitted to a vote of our stockholders, including the election of directors and approval of significant corporate transactions such as amendments to our certificate of incorporation, mergers and the sale of all or substantially all of our assets. Onex could cause corporate actions to be taken that conflict with the interests of our other stockholders. This concentration of ownership could have the effect of deterring or preventing a change in control transaction that might otherwise be beneficial to our stockholders. In addition, Onex may in the future own businesses that directly compete with ours.
Future stock issuances or sales, including as a result of the conversion of our redeemable convertible preferred stock, could adversely affect the market price of our common stock.
The market price of our common stock could decline as a result of sales of a large number of our common stock in the market, or the sale of securities convertible into a large number of our common stock. The perception that these sales could occur may also depress the market price of our common stock. As of December 31, 2021,2023, we had outstanding 71,442,40771,402,907 shares of redeemable convertible preferred stock with an aggregate liquidation preference of approximately $444.1$492.6 million, after accounting for the accumulated accreting return at a rate per annum equal to 7% on the accreted liquidation preference and paid in-kind. TheIf we do not pay dividends on the redeemable convertible preferred stock in cash, the aggregate accreting return will increase the number of shares of common stock issuable upon the conversion of the redeemable convertible preferred stock, which may result in a further decrease in the market value of our common stock. In addition, the terms of the redeemable convertible preferred stock provide that the conversion price may be reduced, which would result in the shares of redeemable convertible preferred stock being convertible into additional common stock upon certain events, including distributions on our common stock or issuances of additional common stock or equity-linked securities, at a price less than the then-applicable conversion price. The issuance of common stock upon conversion of the redeemable convertible preferred stock would result in immediate dilution to existing holders of our common stock, which dilution could be substantial. In addition, the market price of our common stock may be adversely affected by such factors as whether the market price is near or above the conversion price, which could make conversion of the shares of redeemable convertible preferred stock more likely.
Further, the redeemable convertible preferred stock ranks senior to our common stock, which could affect the value of the common stock on liquidation or on a change in control transaction. Additionally, any convertible or exchangeable securities that we issue in the future may have rights, preferences and privileges more favorable than those of our common stock, and may result in dilution to owners of our common stock. Because our decision to issue additional debt or equity securities in any future offering will depend on market conditions and other factors beyond our control, we cannot predict or estimate the amount, timing or nature of our future issuances. Also, we cannot predict the effect, if any, of future issuances of our common stock on the market price of our common stock.
Our directors who have relationships with Onex may have conflicts of interest with respect to matters involving us.
Two of our nine directors are affiliated with Onex. These persons have fiduciary duties to both us and Onex. As a result, they may have real or apparent conflicts of interest on matters affecting both us and Onex, which in some circumstances may have interests adverse to ours. Onex is in the business of making or advising on investments in companies and may hold, and may from time to time in the future acquire, interests in, or provide advice to, businesses that directly or indirectly compete with certain portions of our business or that are suppliers or customers of ours. In addition, as a result of Onex’Onex’s ownership interest, conflicts of interest could arise with respect to transactions involving business dealings between us and Onex including potential acquisitions of businesses or properties, the issuance of additional securities, the payment of dividends by us and other matters. In January 2018, Onex completed its acquisition of SMG Holdings Inc. (“SMG”), a leading global manager of convention centers, stadiums, arenas, theaters, performing arts centers and other venues. SMG subsequently merged with AEG Facilities, LLC to form ASM Global (“ASM”). Certain of our events are staged in ASM managed venues and two of our directors affiliated with Onex are also directors of ASM. In November 2020, Onex committed to invest more than $300 million in Convex
22
Group Limited (“Convex”). Convex is the lead underwriter of Emerald’s 2022, 2023 and 2024 event cancellation insurance policy.
In addition, our amended and restated certificate of incorporation provides that the doctrine of “corporate opportunity” does not apply with respect to us, to Onex or certain related parties or any of our directors who are employees of Onex or its affiliates such that Onex and its affiliates are permitted to invest in competing businesses or do business with our customers. Under the amended and restated certificate of incorporation, subject to the limitations set forth therein, Onex is not required to tell us about a corporate opportunity, may pursue that opportunity for itself or it may direct that opportunity to another person without liability to our stockholders. To the extent they invest in such other businesses, Onex may have differing interests than our other stockholders.
We are a “controlled company” within the meaning of the rules of the New York Stock Exchange and, as a result, rely on exemptions from certain corporate governance requirements.
Onex owns the majority of our outstanding common stock. As a result, we are a “controlled company” within the meaning of the New York Stock Exchange corporate governance rules. As a controlled company, we have the right to elect not to comply with certain corporate governance requirements of the New York Stock Exchange, including:
| • the requirement that a majority of our board consist of independent directors; • the requirement that we have a nominating and corporate governance committee that is composed entirely of independent directors with a written charter addressing the committee’s purpose and responsibilities; • the requirement that we have a compensation committee that is composed entirely of independent directors with a written charter addressing the committee’s purpose and responsibilities; and • the requirement for an annual performance evaluation of the nominating and corporate governance committee and compensation committee.
|
|
|
|
|
|
|
|
Accordingly, while our board currently has a majority of independent directors, our nominating and corporate governance and compensation committees do not consist entirely of independent directors. As a result, our stockholders will not have the same protection afforded to stockholders of companies that are subject to all of the corporate governance requirements of the New York Stock Exchange.
Taking advantage of the reduced disclosure requirements applicable to “emerging growth companies” may make our common stock less attractive to investors.
The Jumpstart Our Business Startups Act of 2012 (the “JOBS Act”) provides that, so long as a company qualifies as an “emerging growth company,” it will, among other things:
|
|
|
|
|
|
|
|
We intend to continue to take advantage of each of the exemptions described above until we no longer qualify as an emerging growth company at December 31, 2022. We have irrevocably elected not to take advantage of the extension of time to comply with new or revised financial accounting standards available under Section 107(b) of the JOBS Act. We cannot predict if investors will find our common stock less attractive if we elect to rely on these exemptions, or if taking advantage of these exemptions will result in less active trading or more volatility in the price of our common stock.
Some provisions of our charter documents and Delaware law may have anti-takeover effects that could discourage an acquisitiona change of us by others, even if an acquisition would be beneficial tocontrol of our stockholders, and may prevent attempts bycompany or a change in our stockholders to replace or remove our current management.management
Provisions in ourOur amended and restated certificate of incorporation, as amended, and our second amended and restated bylaws, as well as provisions ofand the Delaware General Corporation Law (the “DGCL”), could make it more difficult forcontain provisions that might discourage, delay or prevent a third party to acquire usmerger, acquisition, or increase the cost of acquiring us, even if doing so would benefit ourother change in control that stockholders may consider favorable, including in transactions in which stockholders might otherwise receive a premium for their shares. These provisions may also prevent or frustrate attempts by our stockholders to replace or remove our management. Among other things, our amended and restated certificate of incorporation and amended and restated bylaws:
| • authorize the issuance of blank check preferred stock that our board of directors could issue in order to increase the number of outstanding shares and discourage a takeover attempt; • divide our board of directors into three classes with staggered three-year terms; • limit the ability of stockholders to remove directors to permit removals only “for cause” once Onex ceases to own more than 50% of all our outstanding common stock; • prohibit our stockholders from calling a special meeting of stockholders once Onex ceases to own more than 50% of all our outstanding common stock; • prohibit stockholder action by written consent once Onex ceases to own more than 50% of all our outstanding common stock, which will require that all stockholder actions be taken at a duly called meeting of our stockholders; 23 • provide that our board of directors is expressly authorized to adopt, alter, or repeal our second amended and restated bylaws; • provide, subject to limited exceptions, that the Court of Chancery of the State of Delaware will be the exclusive forum for substantially all disputes between us and our stockholders; • establish advance notice requirements for nominations for election to our board of directors or for proposing matters that can be acted upon by stockholders at stockholder meetings; and • require the approval of holders of at least two-thirds of the outstanding shares of common stock to amend our amended and restated bylaws and certain provisions of our amended and restated certificate of incorporation if Onex ceases to own more than 50% of all our outstanding common stock.
|
|
|
|
|
|
|
|
|
|
|
|
|
|
|
|
|
|
These anti-takeover defenses could discourage, delay or prevent a transaction involving a change in control of our company. These provisions could also discourage proxy contests and make it more difficult for you and other stockholders to elect directors of your choosing and cause us to take corporate actions other than those you desire.
Risks Related to our Intellectual Property and Information Technology
We do not own certain of the trade shows that we operate or certain trademarks associated with some of our shows.
The risks associated with some of our relationships with industry trade associations or other third-party sponsors of our events are particularly applicable in the case of KBIS (which is owned by the National Kitchen and Bath Association), CEDIA and our Military trade shows, which are the trade shows in our portfolio where the show trademarks are owned by an industry association or other third party and not by us. Any material disruption to our relationship with these third parties could have a material adverse impact on the revenue stream from these trade shows. In addition, any of these third party owners may allege that we have breached a license agreement, whether with or without merit, and accordingly seek to terminate our license. If successful, this could result in our loss of the right to use the licensed intellectual property, which could adversely affect our trade shows success.
The infringement or invalidation of proprietary rights could have an adverse effect on our business.
We rely on trademark, trade secret and copyright laws in the United States to protect our proprietary rights, including with respect to the names of our trade shows and publications. Failure to obtain or maintain adequate protection of our intellectual property rights for any reason could have a material adverse effect on our business. Our trademarks, trade names and brand names distinguish our trade shows from those of our competitors and we have registered and applied to register many of these trademarks to prevent others from using or capitalizing our names. There can be no assurance that our trademark applications will be approved or that our federal registrations will be upheld if challenged. Third parties may oppose our applications or otherwise challenge our use of our trademarks through administrative processes or costly litigation which if successful, could force us to rebrand our products and/or services resulting in the loss of brand recognition. Further, there can be no assurance that competitors will not infringe upon our trademarks, or that we will identify all such infringements or have adequate resources to properly enforce our trademarks.
Our information technology systems, including our ERP business management system, could be disrupted.
The efficient operation of our business depends on our information technology systems. We rely on our information technology systems and certain third-party providers to effectively manage our business data, communications, vendor relationships, order entry and fulfillment and other business and financial processes. We also rely on internet service providers, mobile networks and other third-party systems to operate our business. We are currently in the process of reviewing and updating our information technology systems and processes in order to enhance our data analytics capability. This implementation process will consume time and resources and may not result in our desired outcome or improved financial performance. Our failure to properly and efficiently implement our information technology systems, or the failure of our information technology systems to perform as we anticipate, could disrupt our business and could result in transaction errors, processing inefficiencies and the loss of revenue and customers, causing our business and results of operations to suffer. In addition, our information technology systems may be vulnerable to damage or interruption from circumstances beyond our control, including fire, natural disasters, power outages, systems failures and viruses. While we maintain disaster recovery plans, any such damage or interruption could have a material adverse effect on our business.
We face continually evolving cybersecurity and similar risks, which could result in loss, disclosure, theft, destruction or misappropriation of, or access to, our confidential information and cause disruption to our business, damage to our brands and reputation, legal exposure and financial losses.
We and third parties on our behalf, collect and store, including by electronic means, certain personal, proprietary and other sensitive information, including payment card information that is provided to us through registration on our websites or otherwise in communication or interaction with us. These activities require the use of centralized data storage, including through third-party service providers. Data maintained in electronic form is always subject to the risk of security incidents, including breach, compromise, intrusion, tampering, theft, misappropriation or other malicious activity all of which are continuing to occur in our industry, as well as the industries of our exhibitors, vendors and suppliers. Unauthorized access to or security breaches of our systems could result in the loss of data, loss of business, severe reputational damage adversely affecting customer or investor
confidence, diversion of management’s attention, litigation, indemnity obligations, damages for contract breach, penalties for violation of applicable laws or regulations and significant costs for remediation that may include liability for stolen or lost assets or information and repair of system damage that may have been caused and other liabilities. Further, an actual or perceived security incident, such as penetration of our or our third-party vendors’ networks, affecting personal or other sensitive information could subject us to business and litigation risk (e.g., under the California Consumer Privacy Act) and damage our reputation, including with exhibitors, sponsors and attendees, which could have a material negative effect on our business and results of operations.
Our ability to safeguard such personal and other sensitive information is important to our business. We take these matters seriously and take significant steps to protect our stored information, including the implementation of systems and processes to thwart malicious activity. These protections are costly and require ongoing monitoring and updating as technologies change and efforts to overcome security measures become more sophisticated. Further, we exercise only limited control over our third-party vendors, which increases our vulnerability to problems with services they provide. In addition, public attention regarding the use of personal information and data transfer has increased in recent years, and the regulatory environment governing information, security and privacy laws, as well as the requirements imposed on us by the credit card industry, are increasingly demanding and continue to evolve rapidly. Maintaining compliance with changing privacy laws in the U.S., the European Union and elsewhere, including the European Union’s General Data Privacy Regulation (“GDPR”), which became effective in May 2018, and the California Consumer Privacy Act, which became effective in January 2020 could further increase our operating costs and require significant management time and attention and may increase the risk of potential litigation from individuals. In addition to these costs, our insurance coverage may not be adequate to cover the costs, fines, indemnification obligations, or other liabilities that could result from a data breach or other cyber security incidents.
Item 1B. Unresolved Staff Comments.
None.
Item 1C. Cybersecurity.
Cybersecurity Risk Management and Strategy
Cybersecurity is an important part of our overall risk management systems and processes and an area of focus for our Board and management. We have developed and implemented an enterprise-wide information security program designed to identify, protect, detect, and respond to and manage reasonably foreseeable cybersecurity risks and threats. To protect our information systems from cybersecurity and privacy threats, we use various security tools that help prevent, identify, escalate, investigate, resolve, and recover from identified vulnerabilities and security incidents in a timely manner. These include, but are not limited to, internal reporting, monitoring and detection tools; an internal continuous pen testing program; and a third-party pen testing program to allow security researchers to assist us in identifying vulnerabilities in our products before they are exploited by malicious threat actors. We also maintain a third-party security program to identify, prioritize, assess, mitigate, and remediate third party risks; however, we rely on the third parties we use to implement security programs commensurate with their risk, and we cannot ensure in all circumstances that their efforts will be successful. Emerald's third-party security program is designed to mitigate cybersecurity risks associated with external service providers. This program includes conducting rigorous security assessments of potential third-party partners before onboarding, ensuring they meet our high standards for cybersecurity.
We regularly assess risks from cybersecurity and technology threats and monitor our information systems for potential vulnerabilities. We use widely adopted risk quantification models including those described in National Institute of Standards and Technology (NIST) special publications as well as the FAIR Institute’s Factor Analysis of Information Risk (FAIR) methodology for Quantifying and Managing Risk to identify, measure and prioritize cybersecurity and technology risks and develop related security controls and safeguards. We conduct regular reviews and tests of our information security program and also leverage audits by our internal audit team, tabletop exercises, penetration and vulnerability testing, red team exercises, simulations, and other exercises to evaluate the effectiveness of our information security program and improve our security measures and planning. We also engage an external firm to assist in our annual Payment Card Industry Data Security Standard (PCI DSS) self-attestation of compliance, as well as third-party penetration testing of our cardholder environment and related systems. We continuously enhance our cybersecurity measures by providing ongoing training for our employees, including simulated phishing exercises, to ensure they are fully prepared to address potential threats. The results of these assessments are reported to the Audit Committee as discussed below under “--Cybersecurity Governance.”
24
In the last ten years, we have not experienced any material cybersecurity incidents, and expenses incurred from cybersecurity incidents were immaterial. For a discussion of whether and how any risks from cybersecurity threats, including as a result of any previous cybersecurity incidents, have materially affected or are reasonably likely to materially affect us, including our business strategy, results of operations or financial condition, refer to Item 1A. Risk Factors – “We face continually evolving cybersecurity and similar risks, which could result in loss, disclosure, theft, destruction or misappropriation of, or access to, our confidential information and cause disruption to our business, damage to our brands and reputation, legal exposure and financial losses,” which is incorporated by reference into this Item 1C.
Cybersecurity Governance
The Board oversees our annual enterprise risk assessment, where we assess key risks within the Company, including security and technology risks and cybersecurity threats. Specifically, our Audit Committee is responsible for the oversight of risks from cybersecurity threats and receives regular updates from senior management including our Chief Information Officer and Director of Cyber Security, on various cybersecurity matters, including risk assessments, mitigation strategies, areas of emerging risks, incidents and industry trends, and other areas of importance. Our cybersecurity protocol requires that the Chair of the Audit Committee and senior management be immediately notified upon any cybersecurity incident.
Our Chief Information Officer, who has over 20 years of experience in the cybersecurity and information security space, leads our global information security team responsible for overseeing the Emerald information security program. We also have a Director of Cyber Security who brings 24 years of experience in the information technology field, including 15 years of direct experience in cybersecurity. In addition, the team members who support our information security program have relevant educational and industry experience, including holding similar positions at large technology companies. This team has primary responsibility for our overall cybersecurity risk management program and supervises both our internal cybersecurity personnel and our retained external cybersecurity consultants. The teams provide regular reports to senior management and other relevant teams on various cybersecurity threats, assessments, and findings.
Item 2. Properties.
We have fivetwo key offices located in New York, New York;York and San Juan Capistrano, California; Alpharetta, Georgia; Denver, Colorado; and Culver City, California. We also have several other smaller office locations throughout the United States, including in Lakewood, Colorado Hasbrouck Heights, New Jersey;Colorado; and Rye, New Hampshire; Framingham, Massachusetts; and Blue Ash, Ohio.Hampshire. We lease our offices from third parties on market terms and, in some cases following an acquisition, through transition services agreements with the applicable seller.
Item 3. Legal Proceedings.
From time to time, we may be involved in general legal disputes arising in the ordinary course of our business. We are not currently involved in legal proceedings that could reasonably be expected to have a material adverse effect on our business, financial condition or results of operations. Refer to Note 16, Commitments and Contingencies, in the notes to the consolidated financial statements included elsewhere in this Annual Report on Form 10-K for additional information regarding our legal proceedings.
Item 4. Mine Safety Disclosures.
None.
25
PART II
Item 5. Market for Registrant’s Common Equity, Related Stockholder Matters and Issuer Purchases of Equity Securities.
Market Information for Common Stock and Holders of Record
Our common stock has been listed on the New York Stock Exchange since April 28, 2017 and trades under the symbol "EEX"“EEX”. The approximate number of record holders of our common stock on February 22, 202229, 2024 was 37.32. Because many of our shares of common stock are held by brokers and other institutions on behalf of stockholders, we are unable to estimate the total number of stockholders represented by these record holders.
Issuer Purchases of Equity Securities
In October 2020, we announced thatNovember 2023, our Board of Directors hadapproved an extension and expansion of our previously announced share repurchase program, which allows for the repurchase of $25.0 million of our common stock through December 31, 2024, subject to early termination or extension by the Board of Directors. This approval extends and expands the previously authorized a $20$20.0 million share repurchase program and in October 2021 this programthat was extendedeffective through December 31, 2022.2023. Share repurchases under the extended plan may be made from time to time through and including December 31, 2022,2024, subject to early termination or extension by our Board of Directors. The share repurchase program may be suspended or discontinued at any time without notice. There is no minimum number of shares that we are required to repurchase. Shares may be purchased from time to time in the open market, including pursuant to one or more Rule 10b5-1 purchase plans that we may enter into from time to time, or in privately negotiated transactions. Such purchases will be at times and in amounts as we deem appropriate, based on factors such as market conditions, legal requirements and other business considerations.
In July 2019,October 2022, we announced that our Board of Directors had authorized a $30an extension and expansion of our previously authorized $20.0 million share repurchase program. This share repurchase program was terminated in July 2020.
In November 2018, we announced that our Board of Directors had authorized a $20 million share repurchase program. Share repurchases under this program were authorized through December 31, 2019.2023.
The following table presents our purchases of common stock during the fourth quarter ended December 31, 2021,2023, as part of the publicly announced share repurchase program:
(Dollars in millions, except per share data) |
| Total Number |
|
| Average Price |
|
| Approximate |
| |||
October 1, 2023 - October 31, 2023 |
|
| — |
|
| $ | — |
|
| $ | 3.0 |
|
November 1, 2023 - November 30, 2023 |
|
| — |
|
|
| — |
|
|
| 25.0 |
|
December 1, 2023 - December 31, 2023 |
|
| — |
|
|
| — |
|
|
| 25.0 |
|
Total |
|
| — |
|
|
|
|
|
|
| ||
(Dollars in millions, except per share data) |
| Total Number of Shares Purchased as Part of Publicly Announced Program |
|
| Average Price Paid Per Share |
|
| Approximate Dollar Value of Shares That May Yet Be Purchased Under the Program |
| |||
October 1, 2021 - October 31, 2021 |
|
| 267,685 |
|
| $ | 4.46 |
|
| $ | 7.4 |
|
November 1, 2021 - November 30, 2021 |
|
| 107,469 |
|
|
| 4.94 |
|
|
| 6.9 |
|
December 1, 2021 - December 31, 2021 |
|
| — |
|
|
| — |
|
|
| 6.9 |
|
Total |
|
| 375,154 |
|
|
|
|
|
|
|
|
|
Stock Performance Graph
The following performance graph and related information shall not be deemed “soliciting material” or “filed” with the SEC, nor shall such information be incorporated by reference into any future filing under the Securities Act of 1933, or the Securities Exchange Act of 1934, each as amended, except to the extent that it is specifically incorporated by reference into such filing.
The following graph compares the yearly percentage change in the cumulative total stockholder return on our common stock with corresponding changes in the cumulative total returns of the Russell 2000 Index and our peer groups for the period from April 28, 2017, the first day our stock began trading on the New York Stock Exchange,December 31, 2018 through December 31, 2021.2023. The comparison assumes an initial investment of $100 at the close of business on April 28, 2017December 31, 2018 in our stock and in each of the indices and also assumes the reinvestment of dividends where applicable.applicable. This historical performance is not necessarily indicative of future performance.
26

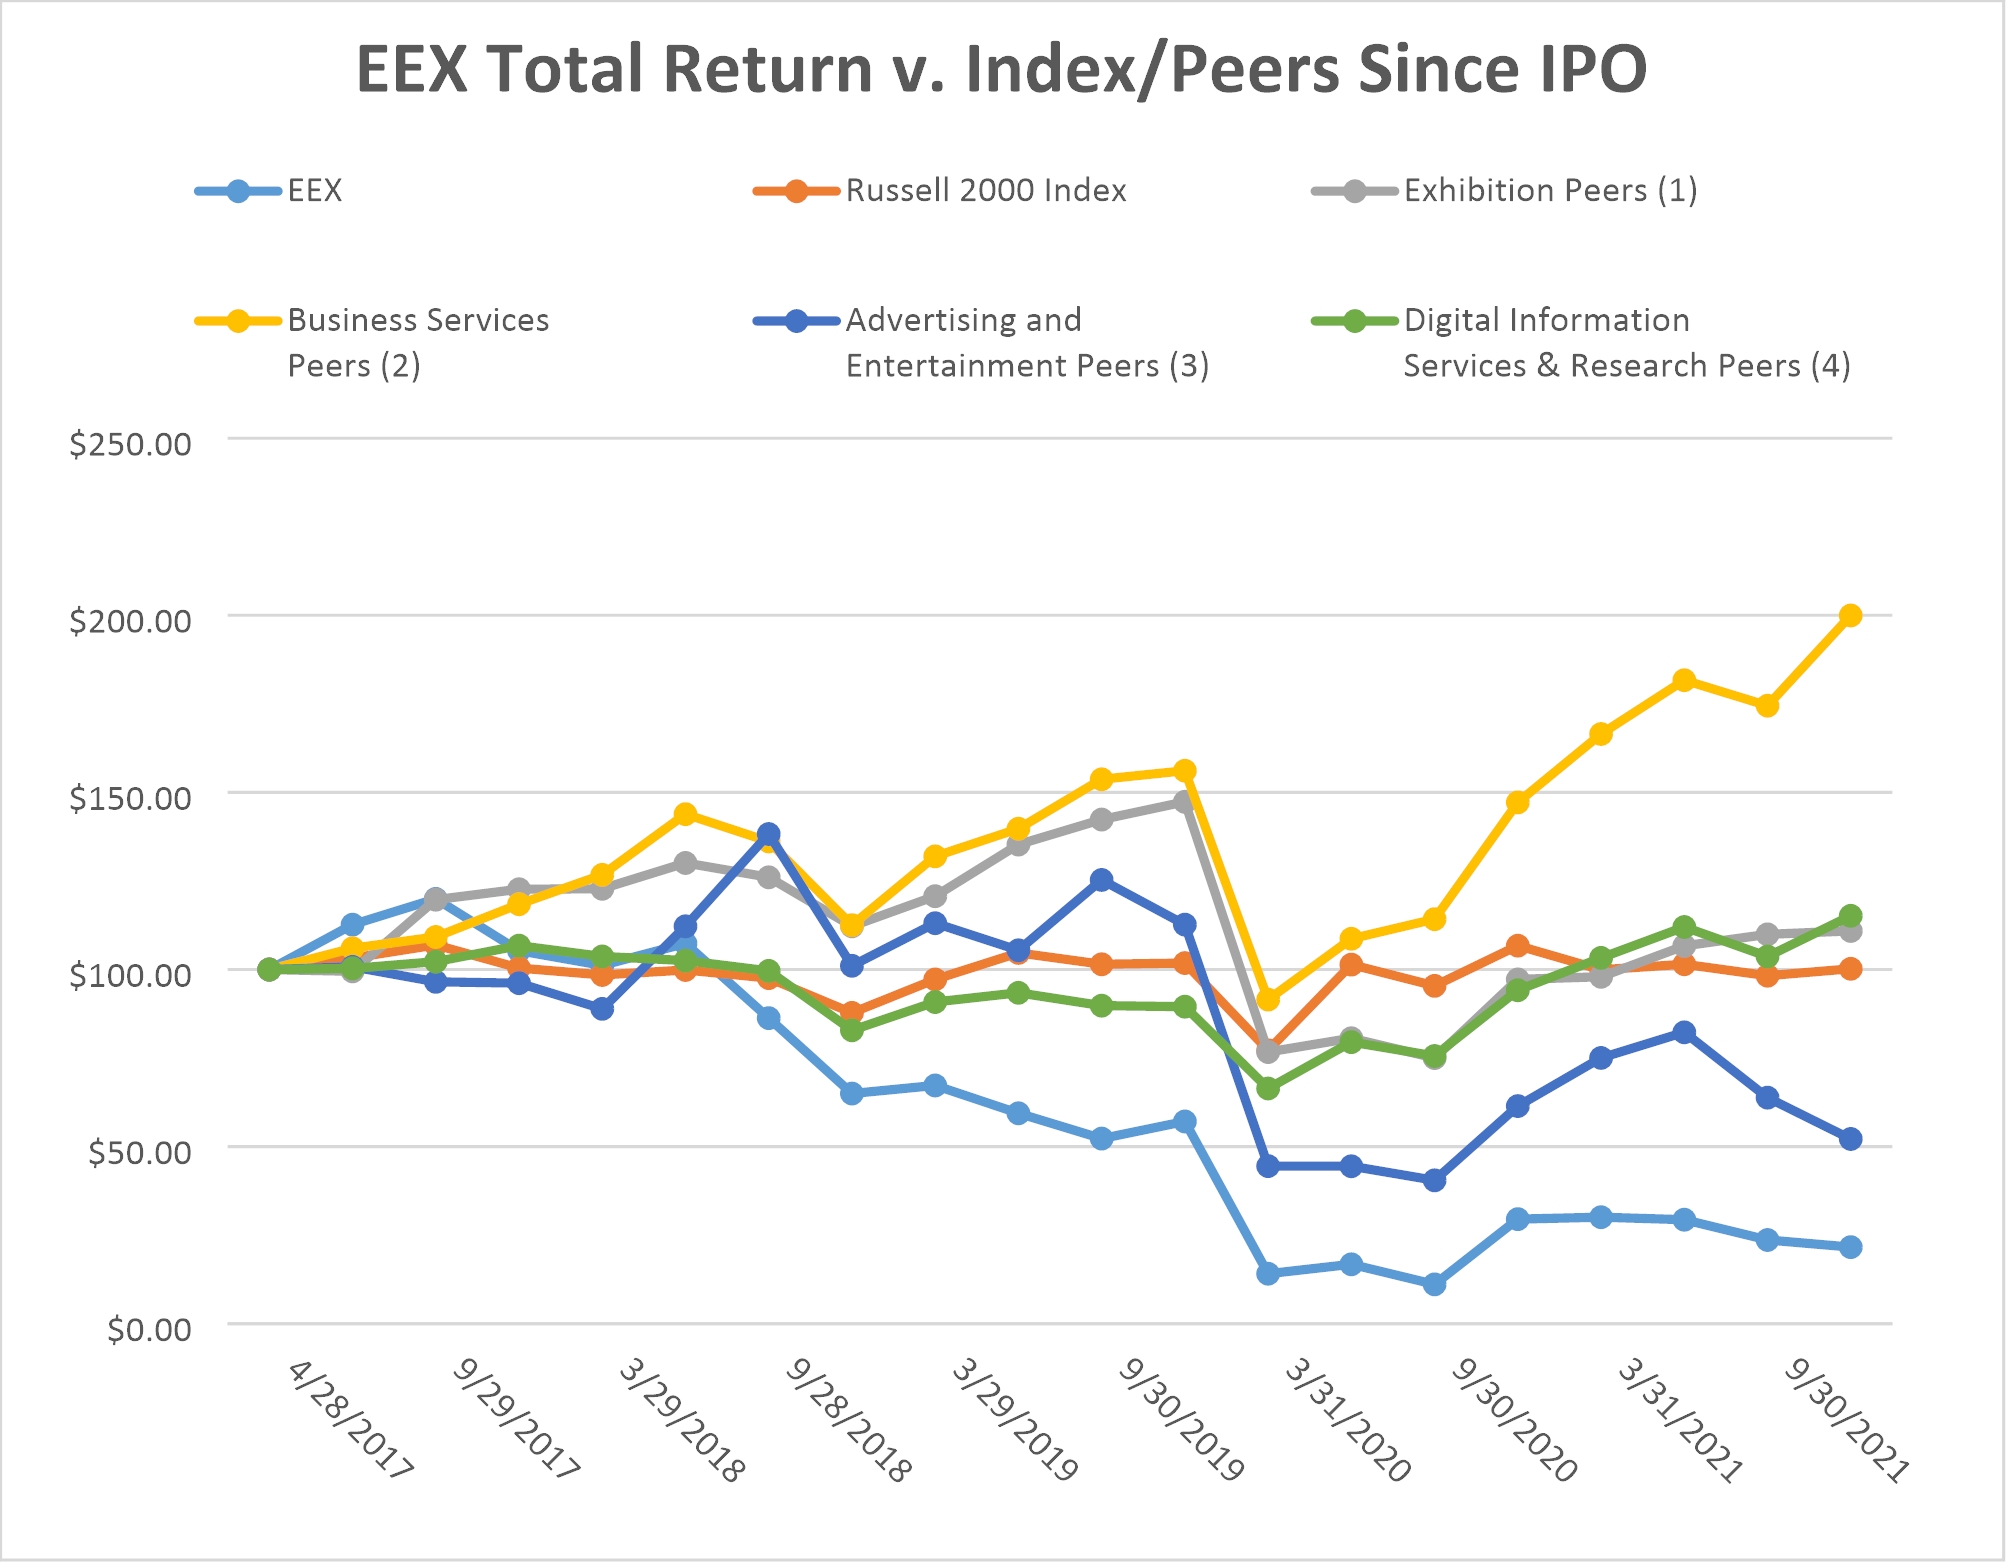
|
|
|
|
|
|
| (4) Digital Information Services & Research Peers include Gartner, Inc., IHS Markit Ltd., John Wiley & Sons, Inc. and Nielsen Holdings plc. |
Item 6. Selected Financial Data.
The following table presents selected consolidated financial data for the periods and at the dates indicated. The selected consolidated financial data as of December 31, 2023, 2022, 2021, 2020 2019, 2018 and 2017,2019, and for the years ended December 31, 2023, 2022, 2021, 2020 2019, 2018 and 2017,2019, have been derived from our audited consolidated financial statements. This financial data should be read in conjunction with the consolidated financial statements, related notes, “Management’s Discussion and Analysis of Financial Condition and Results of Operations” and other financial information appearing elsewhere in this Annual Report on Form 10-K.
The following information should be read in conjunction with “Management’s Discussion and Analysis of Financial Condition and Results of Operations”, “Business” and our consolidated financial statements included elsewhere in this Annual Report on Form 10-K.
27
|
|
|
|
| Year Ended December 31, |
| ||||||||||||||
|
| 2023(1) |
|
| 2022(1) |
|
| 2021(1) |
|
| 2020(1) |
|
| 2019(1) |
| |||||
| (dollars in millions, share data in thousands except earnings per share) |
| ||||||||||||||||||
Statement of (loss) income and comprehensive |
|
|
|
|
|
|
|
|
|
|
|
|
|
|
| |||||
Revenue |
| $ | 382.8 |
|
| $ | 325.9 |
|
| $ | 145.5 |
|
| $ | 127.4 |
|
| $ | 360.9 |
|
Other income, net |
|
| 2.8 |
|
|
| 182.8 |
|
|
| 77.4 |
|
|
| 107.0 |
|
|
| 6.1 |
|
Cost of revenues |
|
| 137.6 |
|
|
| 116.5 |
|
|
| 57.1 |
|
|
| 57.6 |
|
|
| 120.2 |
|
Selling, general and administrative |
|
| 168.3 |
|
|
| 145.0 |
|
|
| 143.0 |
|
|
| 118.6 |
|
|
| 133.4 |
|
Depreciation and amortization expense |
|
| 45.0 |
|
|
| 59.5 |
|
|
| 47.6 |
|
|
| 48.6 |
|
|
| 52.0 |
|
Goodwill impairment charge(3) |
|
| — |
|
|
| 6.3 |
|
|
| 7.2 |
|
|
| 603.4 |
|
|
| 69.1 |
|
Intangible asset impairment charge(4) |
|
| — |
|
|
| 1.6 |
|
|
| 32.7 |
|
|
| 76.8 |
|
|
| 17.0 |
|
Operating income (loss) |
|
| 34.7 |
|
|
| 179.8 |
|
|
| (64.7 | ) |
|
| (670.6 | ) |
|
| (24.7 | ) |
Interest expense |
|
| 43.3 |
|
|
| 24.5 |
|
|
| 15.9 |
|
|
| 20.6 |
|
|
| 30.3 |
|
Interest income |
|
| 8.2 |
|
|
| 2.7 |
|
|
| 0.1 |
|
|
| 0.1 |
|
|
| — |
|
Loss on extinguishment of debt(5) |
|
| 2.3 |
|
|
| — |
|
|
| — |
|
|
| — |
|
|
| — |
|
Other expense |
|
| — |
|
|
| — |
|
|
| 0.1 |
|
|
| 0.1 |
|
|
| — |
|
Loss on disposal of fixed assets |
|
| 0.2 |
|
|
| — |
|
|
| 0.4 |
|
|
| — |
|
|
| — |
|
(Loss) income before income taxes |
|
| (2.9 | ) |
|
| 158.0 |
|
|
| (81.0 | ) |
|
| (691.2 | ) |
|
| (55.0 | ) |
Provision for (benefit from) income taxes |
|
| 5.3 |
|
|
| 27.2 |
|
|
| (1.3 | ) |
|
| (57.6 | ) |
|
| (5.0 | ) |
Net (loss) income and comprehensive |
|
| (8.2 | ) |
|
| 130.8 |
|
|
| (79.7 | ) |
|
| (633.6 | ) |
|
| (50.0 | ) |
Accretion to redemption value |
|
| (42.0 | ) |
|
| (38.8 | ) |
|
| (35.6 | ) |
|
| (15.6 | ) |
|
| — |
|
Participation rights on if-converted basis |
|
| — |
|
|
| (60.2 | ) |
|
| — |
|
|
| — |
|
|
| — |
|
Net (loss) income and comprehensive |
| $ | (50.2 | ) |
| $ | 31.8 |
|
| $ | (115.3 | ) |
| $ | (649.2 | ) |
| $ | (50.0 | ) |
|
|
|
|
|
|
|
|
|
|
|
|
|
|
| ||||||
Net (loss) income per share attributable |
|
|
|
|
|
|
|
|
|
|
|
|
|
|
| |||||
Basic |
| $ | (0.78 | ) |
| $ | 0.46 |
|
| $ | (1.62 | ) |
| $ | (9.09 | ) |
| $ | (0.70 | ) |
Diluted |
| $ | (0.78 | ) |
| $ | 0.46 |
|
| $ | (1.62 | ) |
| $ | (9.09 | ) |
| $ | (0.70 | ) |
Weighted average common shares |
|
|
|
|
|
|
|
|
|
|
|
|
|
|
| |||||
Basic |
|
| 63,959 |
|
|
| 69,002 |
|
|
| 71,309 |
|
|
| 71,431 |
|
|
| 71,719 |
|
Diluted |
|
| 63,959 |
|
|
| 69,148 |
|
|
| 71,309 |
|
|
| 71,431 |
|
|
| 71,719 |
|
Dividends declared per common share |
| $ | — |
|
| $ | — |
|
| $ | — |
|
| $ | 0.0750 |
|
| $ | 0.2975 |
|
|
|
|
|
|
|
|
|
|
|
|
|
|
|
| ||||||
Statement of cash flows data: |
|
|
|
|
|
|
|
|
|
|
|
|
|
|
| |||||
Net cash provided by (used in) |
| $ | 40.3 |
|
| $ | 175.1 |
|
| $ | 90.0 |
|
| $ | (37.1 | ) |
| $ | 67.8 |
|
Net cash used in investing activities |
| $ | (21.0 | ) |
| $ | (47.9 | ) |
| $ | (131.9 | ) |
| $ | (37.3 | ) |
| $ | (16.7 | ) |
Net cash (used in) provided by |
| $ | (54.2 | ) |
| $ | (119.3 | ) |
| $ | (22.2 | ) |
| $ | 360.1 |
|
| $ | (62.0 | ) |
|
|
|
|
|
| Year Ended December 31, |
| |||||||||||||
|
| 2021(1) |
|
| 2020(1) |
|
| 2019(1) |
|
| 2018(1) |
|
| 2017(1) |
| |||||
| (dollars in millions, share data in thousands except earnings per share) |
| ||||||||||||||||||
Statement of (loss) income and comprehensive (loss) income data: |
|
|
|
|
|
|
|
|
|
|
|
|
|
|
|
|
|
|
|
|
Revenue |
| $ | 145.5 |
|
| $ | 127.4 |
|
| $ | 360.9 |
|
| $ | 380.7 |
|
| $ | 341.7 |
|
Other income |
|
| 77.4 |
|
|
| 107.0 |
|
|
| 6.1 |
|
|
| — |
|
|
| 6.5 |
|
Cost of revenues |
|
| 55.5 |
|
|
| 57.6 |
|
|
| 120.2 |
|
|
| 112.1 |
|
|
| 95.0 |
|
Selling, general and administrative expenses(2) |
|
| 143.0 |
|
|
| 118.6 |
|
|
| 133.4 |
|
|
| 121.8 |
|
|
| 121.9 |
|
Depreciation and amortization expense |
|
| 47.6 |
|
|
| 48.6 |
|
|
| 52.0 |
|
|
| 46.8 |
|
|
| 43.2 |
|
Goodwill impairments(3) |
|
| 7.2 |
|
|
| 603.4 |
|
|
| 69.1 |
|
|
| — |
|
|
| — |
|
Intangible asset impairments(4) |
|
| 32.7 |
|
|
| 76.8 |
|
|
| 17.0 |
|
|
| 104.3 |
|
|
| — |
|
Operating (loss) income |
|
| (63.1 | ) |
|
| (670.6 | ) |
|
| (24.7 | ) |
|
| (4.3 | ) |
|
| 88.1 |
|
Interest expense |
|
| 15.8 |
|
|
| 20.6 |
|
|
| 30.3 |
|
|
| 29.1 |
|
|
| 38.3 |
|
Loss on disposal of fixed assets |
|
| 0.5 |
|
|
| — |
|
|
| — |
|
|
| — |
|
|
| — |
|
Loss on extinguishment of debt(5) |
|
| — |
|
|
| — |
|
|
| — |
|
|
| — |
|
|
| 3.0 |
|
(Loss) income before income taxes |
|
| (79.4 | ) |
|
| (691.2 | ) |
|
| (55.0 | ) |
|
| (33.4 | ) |
|
| 46.8 |
|
Benefit from income taxes |
|
| (1.3 | ) |
|
| (57.6 | ) |
|
| (5.0 | ) |
|
| (8.3 | ) |
|
| (35.0 | ) |
Net (loss) income and comprehensive (loss) income |
|
| (78.1 | ) |
|
| (633.6 | ) |
|
| (50.0 | ) |
|
| (25.1 | ) |
|
| 81.8 |
|
Accretion to redemption value of redeemable convertible preferred stock(6) |
|
| (35.6 | ) |
|
| (15.6 | ) |
|
| — |
|
|
| — |
|
|
| — |
|
Net (loss) income and comprehensive (loss) income attributable to Emerald Holding, Inc. common stockholders |
| $ | (113.7 | ) |
| $ | (649.2 | ) |
| $ | (50.0 | ) |
| $ | (25.1 | ) |
| $ | 81.8 |
|
|
|
|
|
|
|
|
|
|
|
|
|
|
|
|
|
|
|
|
|
|
Net (loss) income per share attributable to common stockholders |
|
|
|
|
|
|
|
|
|
|
|
|
|
|
|
|
|
|
|
|
Basic |
| $ | (1.64 | ) |
| $ | (9.09 | ) |
| $ | (0.70 | ) |
| $ | (0.34 | ) |
| $ | 1.19 |
|
Diluted |
| $ | (1.64 | ) |
| $ | (9.09 | ) |
| $ | (0.70 | ) |
| $ | (0.34 | ) |
| $ | 1.13 |
|
Weighted average common shares outstanding |
|
|
|
|
|
|
|
|
|
|
|
|
|
|
|
|
|
|
|
|
Basic |
|
| 71,309 |
|
|
| 71,431 |
|
|
| 71,719 |
|
|
| 72,887 |
|
|
| 68,912 |
|
Diluted |
|
| 71,309 |
|
|
| 71,431 |
|
|
| 71,719 |
|
|
| 72,887 |
|
|
| 72,116 |
|
Dividends declared per common share |
| $ | — |
|
| $ | 0.0750 |
|
| $ | 0.2975 |
|
| $ | 0.2875 |
|
| $ | 0.2100 |
|
|
|
|
|
|
|
|
|
|
|
|
|
|
|
|
|
|
|
|
|
|
Statement of cash flows data: |
|
|
|
|
|
|
|
|
|
|
|
|
|
|
|
|
|
|
|
|
Net cash provided by (used in) operating activities |
| $ | 90.0 |
|
| $ | (37.1 | ) |
| $ | 67.8 |
|
| $ | 103.9 |
|
| $ | 110.8 |
|
Net cash used in investing activities |
| $ | (131.9 | ) |
| $ | (37.3 | ) |
| $ | (16.7 | ) |
| $ | (74.7 | ) |
| $ | (95.5 | ) |
Net cash (used in) provided by financing activities |
| $ | (22.2 | ) |
| $ | 360.1 |
|
| $ | (62.0 | ) |
| $ | (19.6 | ) |
| $ | (19.3 | ) |
28
|
| As of December 31, |
| |||||||||||||||||
|
| 2023 |
|
| 2022 |
|
| 2021 |
|
| 2020 |
|
| 2019 |
| |||||
|
|
|
|
| (dollars in millions) |
| ||||||||||||||
Balance sheet data: |
|
|
|
|
|
|
|
|
|
|
|
|
|
|
| |||||
Cash and cash equivalents |
| $ | 204.2 |
|
| $ | 239.1 |
|
| $ | 231.2 |
|
| $ | 295.3 |
|
| $ | 9.6 |
|
Total assets(7) |
| $ | 1,053.9 |
|
| $ | 1,098.4 |
|
| $ | 1,062.4 |
|
| $ | 1,054.4 |
|
| $ | 1,471.7 |
|
Total debt(8) |
| $ | 413.3 |
|
| $ | 415.3 |
|
| $ | 519.7 |
|
| $ | 525.2 |
|
| $ | 535.4 |
|
Total liabilities |
| $ | 649.3 |
|
| $ | 659.1 |
|
| $ | 749.5 |
|
| $ | 659.9 |
|
| $ | 831.5 |
|
(2)
29
30
|
| As of December 31, |
| |||||||||||||||||
|
| 2021 |
|
| 2020 |
|
| 2019 |
|
| 2018 |
|
| 2017 |
| |||||
|
|
|
|
|
| (dollars in millions) |
| |||||||||||||
Balance sheet data: |
|
|
|
|
|
|
|
|
|
|
|
|
|
|
|
|
|
|
|
|
Cash and cash equivalents |
| $ | 231.2 |
|
| $ | 295.3 |
|
| $ | 9.6 |
|
| $ | 20.5 |
|
| $ | 10.9 |
|
Total assets(7) |
| $ | 1,062.4 |
|
| $ | 1,054.4 |
|
| $ | 1,471.7 |
|
| $ | 1,580.0 |
|
| $ | 1,637.9 |
|
Total debt(8) |
| $ | 519.7 |
|
| $ | 525.2 |
|
| $ | 535.4 |
|
| $ | 569.9 |
|
| $ | 554.2 |
|
Total liabilities |
| $ | 747.9 |
|
| $ | 659.9 |
|
| $ | 831.5 |
|
| $ | 871.7 |
|
| $ | 876.7 |
|
|
|
|
|
|
|
|
|
|
|
|
|
|
|
|
|
|
Quarterly Results of Operations (Unaudited)
The following table sets forth our unaudited quarterly consolidated statements of (loss) income and comprehensive (loss) income data for each of the eight quarterly periods ended December 31, 2021.2023 and 2022. The information for each of these quarters has been prepared on the same basis as the audited annual consolidated financial statements included elsewhere in this Annual Report on Form 10-K and, in our opinion, includes all adjustments, consisting only of normal recurring adjustments, necessary for the fair statement of the results of operations for these periods. This information should be read in conjunction with our consolidated financial statements and related notes included elsewhere in this Annual Report on Form 10-K. These quarterly results are not necessarily indicative of our operating results for a full year or any future period.
|
| Quarter Ended | |||||||||||||||||||||||||||||||
|
| Dec. 31, |
|
| Sept. 30, |
|
| Jun. 30, |
|
| Mar. 31, |
|
| Dec. 31, |
|
| Sept. 30, |
|
| Jun. 30, |
|
| Mar. 31, |
|
| ||||||||
|
| (unaudited) | |||||||||||||||||||||||||||||||
|
| (dollars in millions, share data in thousands except earnings per share) | |||||||||||||||||||||||||||||||
Statement of (loss) income and |
|
|
|
|
|
|
|
|
|
|
|
|
|
|
|
|
|
|
|
|
|
|
|
|
| ||||||||
Revenues |
| $ | 101.5 |
|
| $ | 72.5 |
|
| $ | 86.5 |
|
| $ | 122.3 |
|
| $ | 93.6 |
|
| $ | 62.4 |
|
| $ | 71.4 |
|
| $ | 98.5 |
|
|
Other income, net |
|
| — |
|
|
| 2.8 |
|
|
| — |
|
|
| — |
|
|
| — |
|
|
| 151.0 |
|
|
| 8.1 |
|
|
| 23.7 |
|
|
Cost of revenues |
|
| 35.7 |
|
|
| 25.9 |
|
|
| 32.8 |
|
|
| 43.2 |
|
|
| 33.2 |
|
|
| 22.7 |
|
|
| 26.4 |
|
|
| 34.2 |
|
|
Selling, general and administrative |
|
| 36.1 |
|
|
| 41.6 |
|
|
| 41.8 |
|
|
| 48.8 |
|
|
| 17.4 |
|
|
| 48.7 |
|
|
| 32.3 |
|
|
| 46.6 |
|
|
Depreciation and amortization |
|
| 9.8 |
|
|
| 8.8 |
|
|
| 12.9 |
|
|
| 13.5 |
|
|
| 16.5 |
|
|
| 14.7 |
|
|
| 14.0 |
|
|
| 14.3 |
|
|
Goodwill impairment charge |
|
| — |
|
|
| — |
|
|
| — |
|
|
| — |
|
|
| — |
|
|
| — |
|
|
| — |
|
|
| 6.3 |
|
|
Intangible asset impairment charge |
|
| — |
|
|
| — |
|
|
| — |
|
|
| — |
|
|
| — |
|
|
| — |
|
|
| — |
|
|
| 1.6 |
|
|
Operating income (loss) |
|
| 19.9 |
|
|
| (1.0 | ) |
|
| (1.0 | ) |
|
| 16.8 |
|
|
| 26.5 |
|
|
| 127.3 |
|
|
| 6.8 |
|
|
| 19.2 |
|
|
Interest expense |
|
| 11.8 |
|
|
| 12.1 |
|
|
| 11.4 |
|
|
| 8.0 |
|
|
| 9.0 |
|
|
| 6.8 |
|
|
| 4.8 |
|
|
| 3.9 |
|
|
Interest income |
|
| 3.2 |
|
|
| 1.6 |
|
|
| 2.3 |
|
|
| 1.1 |
|
|
| 1.7 |
|
|
| 0.8 |
|
|
| 0.2 |
|
|
| — |
|
|
Loss on extinguishment of debt |
|
|
|
|
| — |
|
|
| 2.3 |
|
|
| — |
|
|
| — |
|
|
| — |
|
|
| — |
|
|
| — |
|
| |
Other (income) expense |
|
| (0.1 | ) |
|
| 0.1 |
|
|
| 0.1 |
|
|
| (0.1 | ) |
|
| (0.1 | ) |
|
| 0.1 |
|
|
| — |
|
|
| — |
|
|
Loss on disposal of fixed assets |
|
| — |
|
|
| — |
|
|
| — |
|
|
| 0.2 |
|
|
| — |
|
|
| — |
|
|
| — |
|
|
| — |
|
|
Income (loss) before income |
|
| 11.4 |
|
|
| (11.6 | ) |
|
| (12.5 | ) |
|
| 9.8 |
|
|
| 19.3 |
|
|
| 121.2 |
|
|
| 2.2 |
|
|
| 15.3 |
|
|
Provision for (benefit from) income |
|
| 29.3 |
|
|
| (22.3 | ) |
|
| (4.4 | ) |
|
| 2.7 |
|
|
| (3.1 | ) |
|
| 28.2 |
|
|
| 2.9 |
|
|
| (0.8 | ) |
|
Net (loss) income and |
|
| (17.9 | ) |
|
| 10.7 |
|
|
| (8.1 | ) |
|
| 7.1 |
|
|
| 22.4 |
|
|
| 93.0 |
|
|
| (0.7 | ) |
|
| 16.1 |
|
|
Accretion to redemption value |
|
| (10.8 | ) |
|
| (10.7 | ) |
|
| (10.4 | ) |
|
| (10.1 | ) |
|
| (10.1 | ) |
|
| (9.9 | ) |
|
| (9.6 | ) |
|
| (9.2 | ) |
|
Participation rights on |
|
| — |
|
|
| — |
|
|
| — |
|
|
| — |
|
|
| (8.2 | ) |
|
| (54.7 | ) |
|
| — |
|
|
| (4.4 | ) |
|
Net (loss) income and |
| $ | (28.7 | ) |
| $ | 0.0 |
|
| $ | (18.5 | ) |
| $ | (3.0 | ) |
| $ | 4.1 |
|
| $ | 28.4 |
|
| $ | (10.3 | ) |
| $ | 2.5 |
|
|
|
|
|
|
|
|
|
|
|
|
|
|
|
|
|
|
|
|
|
|
|
|
|
|
|
| ||||||||
Basic (loss) earnings per share |
| $ | (0.45 | ) |
| $ | 0.00 |
|
| $ | (0.29 | ) |
| $ | (0.04 | ) |
| $ | 0.06 |
|
| $ | 0.42 |
|
| $ | (0.15 | ) |
| $ | 0.04 |
|
|
Diluted (loss) earnings per share |
| $ | (0.45 | ) |
| $ | 0.00 |
|
| $ | (0.29 | ) |
| $ | (0.04 | ) |
| $ | 0.06 |
|
| $ | 0.41 |
|
| $ | (0.15 | ) |
| $ | 0.04 |
|
|
Basic weighted average common |
|
| 63,601 |
|
|
| 63,586 |
|
|
| 62,868 |
|
|
| 67,280 |
|
|
| 67,599 |
|
|
| 68,433 |
|
|
| 69,816 |
|
|
| 70,171 |
|
|
Diluted weighted average common |
|
| 63,601 |
|
|
| 63,586 |
|
|
| 62,868 |
|
|
| 67,280 |
|
|
| 67,943 |
|
|
| 68,643 |
|
|
| 69,816 |
|
|
| 70,280 |
|
|
|
|
|
|
|
|
|
|
|
|
|
|
|
|
|
|
|
|
|
|
|
|
|
|
|
| ||||||||
Dividend declared per common share |
| $ | — |
|
| $ | — |
|
| $ | — |
|
| $ | — |
|
| $ | — |
|
| $ | — |
|
| $ | — |
|
| $ | — |
|
|
|
| Quarter Ended | |||||||||||||||||||||||||||||||
|
| Dec. 31, 2021 |
|
| Sept. 30, 2021 |
|
| Jun. 30, 2021 |
|
| Mar. 31, 2021 |
|
| Dec. 31, 2020 |
|
| Sept. 30, 2020 |
|
| Jun. 30, 2020 |
|
| Mar. 31, 2020 |
|
| ||||||||
|
| (unaudited) | |||||||||||||||||||||||||||||||
|
| (dollars in millions, share data in thousands except earnings per share) | |||||||||||||||||||||||||||||||
Statement of (loss) income and comprehensive (loss) income data: |
|
|
|
|
|
|
|
|
|
|
|
|
|
|
|
|
|
|
|
|
|
|
|
|
|
|
|
|
|
|
|
|
|
Revenues |
| $ | 41.1 |
|
| $ | 76.5 |
|
| $ | 15.0 |
|
| $ | 12.9 |
|
| $ | 12.2 |
|
| $ | 8.5 |
|
| $ | 7.0 |
|
| $ | 99.7 |
|
|
Other income |
|
| 59.9 |
|
|
| 1.1 |
|
|
| 2.3 |
|
|
| 14.1 |
|
|
| 42.7 |
|
|
| 16.1 |
|
|
| 48.2 |
|
|
| — |
|
|
Cost of revenues |
|
| 14.2 |
|
|
| 33.7 |
|
|
| 3.6 |
|
|
| 4.0 |
|
|
| 10.5 |
|
|
| 4.3 |
|
|
| (0.8 | ) |
|
| 43.6 |
|
|
Selling, general and administrative expenses |
|
| 40.3 |
|
|
| 38.8 |
|
|
| 33.1 |
|
|
| 30.8 |
|
|
| 29.8 |
|
|
| 25.6 |
|
|
| 25.1 |
|
|
| 38.1 |
|
|
Depreciation and amortization expense |
|
| 11.5 |
|
|
| 12.2 |
|
|
| 12.1 |
|
| �� | 11.8 |
|
|
| 11.4 |
|
|
| 12.2 |
|
|
| 12.2 |
|
|
| 12.8 |
|
|
Goodwill impairments |
|
| 7.2 |
|
|
| — |
|
|
| — |
|
|
| — |
|
|
| 15.2 |
|
|
| — |
|
|
| — |
|
|
| 588.2 |
|
|
Intangible asset impairments |
|
| 32.7 |
|
|
| — |
|
|
| — |
|
|
| — |
|
|
| 17.4 |
|
|
| — |
|
|
| — |
|
|
| 59.4 |
|
|
Operating (loss) income |
|
| (4.9 | ) |
|
| (7.1 | ) |
|
| (31.5 | ) |
|
| (19.6 | ) |
|
| (29.4 | ) |
|
| (17.5 | ) |
|
| 18.7 |
|
|
| (642.4 | ) |
|
Interest expense |
|
| 3.8 |
|
|
| 3.9 |
|
|
| 4.1 |
|
|
| 4.0 |
|
|
| 4.1 |
|
|
| 4.2 |
|
|
| 5.6 |
|
|
| 6.7 |
|
|
Loss on disposal of fixed assets |
|
| 0.5 |
|
|
| — |
|
|
| — |
|
|
| — |
|
|
| — |
|
|
| — |
|
|
| — |
|
|
| — |
|
|
(Loss) income before income taxes |
|
| (9.2 | ) |
|
| (11.0 | ) |
|
| (35.6 | ) |
|
| (23.6 | ) |
|
| (33.5 | ) |
|
| (21.7 | ) |
|
| 13.1 |
|
|
| (649.1 | ) |
|
(Benefit from) provision for income taxes |
|
| (1.9 | ) |
|
| (2.0 | ) |
|
| 10.9 |
|
|
| (8.3 | ) |
|
| 0.4 |
|
|
| (6.4 | ) |
|
| 3.2 |
|
|
| (54.8 | ) |
|
Net (loss) income and comprehensive (loss) income |
|
| (7.3 | ) |
|
| (9.0 | ) |
|
| (46.5 | ) |
|
| (15.3 | ) |
|
| (33.9 | ) |
|
| (15.3 | ) |
|
| 9.9 |
|
|
| (594.3 | ) |
|
Accretion to redemption value of redeemable convertible preferred stock |
|
| (9.3 | ) |
|
| (9.0 | ) |
|
| (8.8 | ) |
|
| (8.5 | ) |
|
| (8.5 | ) |
|
| (7.0 | ) |
|
| (0.1 | ) |
|
| — |
|
|
Participation rights on if-converted basis |
|
| — |
|
|
| — |
|
|
| — |
|
|
| — |
|
|
| — |
|
|
| — |
|
|
| (0.2 | ) |
|
| — |
|
|
Net (loss) income and comprehensive (loss) income attributable to Emerald Holding, Inc. common stockholders |
| $ | (16.6 | ) |
| $ | (18.0 | ) |
| $ | (55.3 | ) |
| $ | (23.8 | ) |
| $ | (42.4 | ) |
| $ | (22.3 | ) |
| $ | 9.6 |
|
| $ | (594.3 | ) |
|
|
|
|
|
|
|
|
|
|
|
|
|
|
|
|
|
|
|
|
|
|
|
|
|
|
|
|
|
|
|
|
|
|
|
Basic (loss) earnings per share |
| $ | (0.24 | ) |
| $ | (0.25 | ) |
| $ | (0.77 | ) |
| $ | (0.33 | ) |
| $ | (0.59 | ) |
| $ | (0.31 | ) |
| $ | 0.13 |
|
| $ | (8.33 | ) |
|
Diluted (loss) earnings per share |
| $ | (0.24 | ) |
| $ | (0.25 | ) |
| $ | (0.77 | ) |
| $ | (0.33 | ) |
| $ | (0.59 | ) |
| $ | (0.31 | ) |
| $ | 0.13 |
|
| $ | (8.33 | ) |
|
Basic weighted average common shares outstanding |
|
| 70,088 |
|
|
| 71,033 |
|
|
| 71,938 |
|
|
| 72,245 |
|
|
| 71,413 |
|
|
| 71,484 |
|
|
| 71,444 |
|
|
| 71,381 |
|
|
Diluted weighted average common shares outstanding |
|
| 70,088 |
|
|
| 71,033 |
|
|
| 71,938 |
|
|
| 72,245 |
|
|
| 71,413 |
|
|
| 71,484 |
|
|
| 71,470 |
|
|
| 71,381 |
|
|
|
|
|
|
|
|
|
|
|
|
|
|
|
|
|
|
|
|
|
|
|
|
|
|
|
|
|
|
|
|
|
|
|
|
Dividend declared per common share |
| $ | — |
|
| $ | — |
|
| $ | — |
|
| $ | — |
|
| $ | — |
|
| $ | — |
|
| $ | — |
|
| $ | 0.0750 |
|
|
31
Item 7. Management’s Discussion and Analysis of Financial Condition and Results of Operations.
MANAGEMENT’S DISCUSSION AND ANALYSIS OF
FINANCIAL CONDITION AND RESULTS OF OPERATIONS
This discussion and analysis of the financial condition and results of our operations should be read in conjunction with “Item 6. Selected Financial and Operating Data” and our consolidated financial statements and related notes of Emerald Holding, Inc. included in Item 15 of this Annual Report on Form 10-K. You should review the “Item 1A. Risk Factors” section of this filing for a discussion of important factors that could cause actual results to differ materially from the results described in or implied by any forward-looking statements contained in the following discussion and analysis.
This section of this Form 10-K generally discusses 2021 and 2020 items and year-to-year comparisons between 2021 and 2020. Discussions of 2019 items and year-to-year comparisons between 2020 and 2019 that are not included in this Form 10-K can be found in "Management's Discussion and Analysis of Financial Condition and Results of Operations" in Part II, Item 7 of the Company's Annual Report on Form 10-K/A for the fiscal year ended December 31, 2020.
Overview and Background
Emerald is a leading operator of business-to-business trade shows in the United States. Leveraging our shows as key market-driven platforms, we combine our events with effective industry insights, digital tools, and data-focused solutions to create uniquely rich experiences. Emerald strives to build its customers’ businesses by creating opportunities that deliver tangible results.
All of our trade show franchises typically hold market-leading positions within their respective industry verticals, with significant brand value established over a long period of time. Each of our shows areis scheduled to stage at least annually, with certain franchises offering multiple editions per year. As our shows are frequently the largest and most well attended in their respective industry, verticals, we are able to attract high-quality attendees, including those who have the authority to make purchasing decisions on the spot or subsequent to the show. The participation of these attendees makes our trade shows “must-attend” events for our exhibitors, further reinforcing the leading positions of our trade shows within their respective industry verticals. Our attendees use our shows to fulfill procurement needs, source new suppliers, reconnect with existing suppliers, identify trends, learn about new products and network with industry peers, which we believe are factors that make our shows difficult to replace with non-face-to-face events. Our portfolio of trade shows is well-balanced and diversified across both industry sectors and customers.
In addition to organizing our trade shows, conferences and other events, we also operate content and content-marketing websites, and related digital products, and produce publications, each of which is aligned with a specific sector for which we organize an event. We also offer B2Bbusiness-to-business commerce and digital merchandising solutions, serving the needs of manufacturers and retailers, through our recently acquired Elastic Suite and Flex platforms.platform. In addition to their respective revenues, these products complement our live events and provide us year-round channels of customer acquisition and development.
Organic Growth Drivers
We are primarily focused on generating organic growth by understanding and leveraging the drivers for increased exhibitor and attendee participation at trade shows and providing year-round services that provide incremental value to those customers. Creating new opportunities for exhibitors to influence their market, engage with significant buyers, generate incremental sales and expand their brand’s awareness in their industry builds further demand for exhibit space and strengthens the value proposition of a trade show, which generally allowingallows us to modestly increase booth space pricing annually across our portfolio. At the same time, our trade shows provide attendees with the opportunity to enhance their industry connectivity, develop relationships with targeted suppliers and distributors, discover new products, learn about new industry developments, celebrate their industry’s achievements and, in certain cases, obtain continuing professional education credits, which we believe increases their propensity to return and, consequently, drives high recurring participation among our exhibitors. By investing
in and promoting these tangible and return-on-investment linked outcomes, we believe we will be able to continue to enhance the value proposition for our exhibitors and attendees alike, thereby driving strong demand and premium pricing for exhibit space, sponsorship opportunities and attendee registration.
32
Acquisitions
We are also focused on growing our national footprint through the acquisition of high-quality events that are leaders in their specific industry verticals. Since the Onex Acquisition in June 2013, we have completed 2226 strategic acquisitions, with purchase prices, excluding the $335.0 million acquisition of GLM,George Little Management in 2014, ranging from approximately $5.0 million to approximately $142.2$120.0 million, excluding the $24.0 million of contingent payment which was not earned by the acquired entity, and annual revenues ranging from approximately $1.3 million to approximately $25.6 million. Historically, we have completed acquisitions at EBITDAearnings before interest, taxes, depreciation, and amortization (“EBITDA”) purchase multiples that are typically in the mid-to-high single digits. Our acquisitions have historically been structured as asset deals that have resulted in the generation of long-lived tax assets, which in turn have reduced our purchase multiples when incorporating the value of the created tax assets. In the future, we intend to look for acquisitions with similarly attractive valuation multiples.
Transactions Affecting Recent Periods
Acquisitions
We completed the following acquisitions during the periods presented in this Management’s Discussion and Analysis of Financial Condition and Results of Operations:
We completed the following acquisition in January 2024:
Refinancing Transactions
On February 2, 2023, our wholly-owned subsidiary, Emerald X, Inc. (“Emerald X”) entered into a Fifth Amendment (the “RCF Amendment”) to its Amended and Restated Credit Agreement (such credit agreement, the “Amended and Restated Credit Agreement”). The RCF Amendment increased the aggregate amount of all revolving commitments under the Amended and Restated Credit Agreement from $100.4 million to $110.0 million. The increased revolving commitments have the same terms as the existing revolving commitments. The RCF Amendment did not change any other material terms of the Amended and Restated Credit Agreement.
On June 12, 2023, (the “Term Loan Amendment Effective Date”), Emerald X entered into a Sixth Amendment (the “Term Loan Amendment”) to its existing Amended and Restated Credit Agreement. The Term Loan Amendment, which was entered into with a syndicate of lenders and Bank of America, N.A., as administrative agent, extended the
33
maturity of the term loans outstanding under the Amended and Restated Credit Agreement (such extended term loan facility, the “Extended Term Loan Facility”) from May 22, acquisitions we2024 to May 22, 2026. The aggregate outstanding principal amount of the Extended Term Loan Facility was approximately $415.3 million as of the Term Loan Amendment Effective Date. The Term Loan Amendment also replaced the interest rate applicable to the term loans with a rate equal to, at the option of Emerald X, (i) the Term Secured Overnight Financing Rate (“Term SOFR”) plus 5.00% per annum plus a credit spread adjustment of 0.10% per annum or (ii) an alternate base rate (“ABR”) plus 4.00% per annum. Prior to the Term Loan Amendment, the interest rate applicable to the term loans was a rate equal to, at the option of Emerald X, (i) LIBOR plus 2.75% or 2.50% per annum, depending on Emerald X’s first lien net leverage ratio or (ii) ABR plus 1.75% or 1.50% per annum, depending on Emerald X’s first lien net leverage ratio. In addition, the Term Loan Amendment reset scheduled quarterly payments, each equal to 0.25% of the original principal amount of the Extended Term Loan Facility. Further, the Term Loan Amendment modified the prepayment provisions so that, upon the occurrence of a repricing transaction, subject to certain specified exceptions, Emerald X will have completedto pay a prepayment fee of 2%, in the event of a repricing transaction occurring within the first twelve months after the Term Loan Amendment Effective Date, or 1%, in the event of a repricing transaction occurring on a date that is between twelve months after the Term Loan Amendment Effective Date and eighteen months after the Term Loan Amendment Effective Date. No prepayment premium is payable for prepayments made after the eighteen month anniversary of the Term Loan Amendment Effective Date.
For more information regarding these refinancing transactions, see Note 7, Debt, to the audited financial statements included elsewhere in this Annual Report on Form 10-K.
Redeemable Preferred Stock
Dividends
Each share of redeemable convertible preferred stock will accumulate dividends at a rate per annum equal to 7% of the accreted liquidation preference, compounding quarterly by adding to the accreted liquidation preference until July 1, 2023, and thereafter, at the Company’s option, paid either in cash or by adding to the accreted liquidation preference. During the year ended December 31, 2023, the Company recorded accretion of $16.7 million with respect to the redeemable convertible preferred stock, bringing the aggregate liquidation preference to $492.6 million as of December 31, 2023. During the year ended December 31, 2022, the Company recorded accretion of $31.8 million with respect to the redeemable convertible preferred stock, bringing the aggregate liquidation preference to $475.9 million as of December 31, 2022. During the year ended December 31, 2021, the redeemable convertible preferred stock accumulated $29.8 million worth of dividends, bringing the aggregate accreted liquidation preference to $444.1 million as of December 31, 2021. Holders of redeemable convertible preferred stock are described as follows:also entitled to participate in and receive any dividends declared or paid on the Company’s common stock on an as-converted basis, and no dividends may be paid to holders of common stock unless the aggregate accreted liquidation preference on the redeemable convertible preferred stock has been paid or holders of a majority of the outstanding redeemable convertible preferred stock have consented to such dividend.
The Company’s Board of Directors approved the payment in cash of a dividend on the Company’s redeemable convertible preferred stock (the “Preferred Stock” and such dividend, the “Preferred Cash Dividend”) for the periods ending September 30, 2023, and December 31, 2023, respectively, and the Company paid the Preferred Stock Cash Dividend for a total of $17.2 million, or $0.12 per share, to preferred stock holders including Onex-related entities.
34
|
|
|
|
|
|
|
|
|
|
|
|
|
|
|
|
|
|
|
|
|
|
|
|
|
|
|
|
|
|
|
|
|
|
|
|
|
|
|
|
|
|
|
|
|
Trends and Other Factors Affecting Our Business
There are a number of existing and developing factors and trends which impact the performance of our business, and the comparability of our results from year to year and from quarter to quarter, including:
| • Impact of COVID-19 — The pandemic spread of COVID-19 and the related government restrictions and social distancing measures implemented in the United States and throughout the world significantly impacted our business from mid-March 2020 through the end of fiscal 2021, with live events resuming in the United States beginning late in the second quarter of 2021. While we were able to resume our full schedule of events during 2022 and 2023, the ongoing effects of COVID-19 on our operations continued to negatively affect our financial results and liquidity. In particular, the uncertainty of timing and amount of proceeds from event cancellation insurance caused significant variability in our year to year and quarter to quarter results, which continued throughout 2022 and into the first part of 2023. This variability has affected the comparability of results in these periods to pre-COVID-19 results and may affect comparability in future periods. For more information, see “Risk Factors—Our operations, business and financial results have been, and may in the future be, materially impacted by COVID-19 or future public health emergencies, including outbreaks of contagious disease” and “Liquidity and Capital Resources”. • Market Fragmentation — The trade show industry is highly fragmented, with the four largest companies, including Emerald, comprising only 9% of the wider U.S. market according to the International Globex Report 2022. This has afforded us the opportunity to acquire other trade show businesses, a growth opportunity we expect to continue pursuing. These acquisitions may affect our growth trends, impacting the comparability of our financial results on a year-over-year basis. • Overall Economic Environment and Industry Sector Cyclicality — Our results of operations are correlated, in part, with the economic performance of the industry sectors that our trade shows serve, as well as the state of the overall economy, which may be affected by factors such as inflation and supply chain interruption. Overall economic conditions and inflationary pressure may also affect exhibitors’ or attendees’ willingness or ability to travel to attend our in-person events. • Increases in Inflation and Interest Rates — Heightened levels of inflation present risk for us in terms of increased labor costs, venue costs and other expenses that may not be able to be passed on to customers through increased pricing. In addition, due to inflationary pressures, rising interest rates may increase our financing and borrowing costs on new and existing debt. • Lag Time — As the majority of our exhibit space is sold during the twelve months prior to each trade show, there is often a timing difference between changes in the economic conditions of an industry sector vertical and their effect on our results of operations. This lag time can result in a counter-cyclical impact on our results of operations. • Variability in Quarterly Results — Our business is seasonal, with trade show revenues typically reaching their highest levels during the first and fourth quarters of each calendar year, entirely due to the timing of our trade shows. This seasonality is typical within the trade show industry. However, as a result of outside circumstances such as COVID-19, future results may not align with this historical trend. Since event revenue is recognized when a particular event is held, we may also experience fluctuations in quarterly revenue and cash flows based on the movement of annual trade show dates from one quarter to another. Our presentation of Adjusted EBITDA and Organic revenue accounts for these quarterly movements and the timing of shows, where applicable and material.
|
|
|
|
|
|
|
|
|
|
|
How We Assess the Performance of Our Business
In assessing the performance of our business, we consider a variety of performance and financial measures. The key indicators of the financial condition and operating performance of our business are revenues, Organic revenue,
35
cost of revenues, selling, general and administrative expenses, interest expense, depreciation and amortization, income taxes, Adjusted EBITDA and Free Cash Flow.
Basis of Presentation
As described in Note 1, Description of Business and Summary of Significant Accounting Policies and Note 18, Segment Information,, in the notes to our audited consolidated financial statements included elsewhere in this Annual Report on Form 10-K, effective October 31, 2023, our business is organized into a single reportable segment, consistent with the information provided to our Chief Executive Officer, aswho is considered the chief operating decision-maker ("CODM"(“CODM”),. The CODM evaluates performance based on the results of six executive brand portfolios,our Connections, Content and Commerce business lines (collectively, the “three C’s”), which represent our sixthree operating segments. Based on an evaluationThe Connections segment is primarily comprised of economic similaritiesEmerald’s trade shows and the natureother live events. Neither of services and types of customers, four of these operating segments have been aggregated into two reportable segments, the Commerce reportable segment and the Design and Technology reportable segment. The remaining two operating segments do not meetmeets the quantitative thresholds to be considered a reportable operating segmentssegment and are included in the “All Other” category. In addition, we have a Corporate-Level Activities“Corporate-Level Activities” category consisting of finance, legal, information technology and administrative functions. Prior year disclosures below have been updated to reflect the new reportable segment structure described in Note 18, Segment Information.
The following discussion provides additional detailed disclosure for the twoone reportable segments,segment, the All Other“All Other” category and the Corporate-Level Activity“Corporate-Level Activity” category:
Commerce:
Design and Technology: This segment includes events and services that support a wide variety of industries connecting businesses and professionals with products, operational strategies, and integrationprovide exhibitors opportunities to drive new businessinfluence their market, engage with significant buyers, generate incremental sales and streamline processes and creative solutions.expand their brand’s awareness in their industry.
Revenues
Revenues
We generate revenues primarily from selling trade show exhibit space to exhibitors on a per square foot basis. Other trade show revenue streams include sponsorship, fees forconferences, sponsorships, ancillary exhibition servicesfees and attendee registration fees. Exhibitors contract for their booth space and sponsorships up to a year in advance of the trade show. Fees are typically invoiced and collected in full prior to the trade show or event. Additionally, we generate revenue through conferences, digital media and print publications that complement our trade shows. We also engage third-party sales agents to support our marketing efforts. Other marketing service revenue contracts are invoiced and recognized in the period the advertising services are delivered. Typically, the fees we charge are collected after the publications are issued.
We define “organic“Organic revenue growth” and “organic“Organic revenue decline” as the growth or decline, respectively, in our revenue from one period to the next, adjusted for the revenue impact of: (i) acquisitions and dispositions, (ii) discontinued events and (iii) material show scheduling adjustments and (iv) event cancellations for which the Company has received, or expects to receive, claim proceeds from its event cancellation insurance policy.adjustments. We disclose changes in Organic revenue because we believe it assists investors and analysts in comparing Emerald’s operating performance across reporting periods on a consistent basis by excluding items that we do not believe reflect a true comparison of the trends of the existing event calendar given changes in timing or strategy. Management and Emerald’sour Board of Directors evaluate changes in Organic revenuesrevenue to understand underlying revenue trends of its events. Organic revenue is not defined under GAAP, and has limitations as an analytical tool, and you should not consider such measure either in isolation or as a substitute for analyzing our results as reported under GAAP. Some of these limitations include that Organic revenue reflects certain adjustments that we consider not to be indicative of our ongoing operating performance. Because not all companies use identical calculations, our presentation of Organic revenue may not be comparable to other similarly titled measures used by other companies.
36
Organic Revenue
Organic revenue is a supplemental non-GAAP financial measure of performance and is not based on any standardized methodology prescribed by GAAP. Organic revenue should not be considered in isolation or as an alternative to revenues or other measures determined in accordance with GAAP. Also, Organic revenuesrevenue is not necessarily comparable to similarly titled measures used by other companies.
The most directly comparable GAAP measure to Organic revenue is revenues. For a reconciliation of Organic revenues to revenues as reported, see footnoteFootnote 6 to the table under the heading “Results of Operations - Operations—Comparison of the Year Ended December 31, 20212023 to the Year Ended December 31, 2020”2022”.
Other Income
We maintain event cancellation insurance to protect against losses due the unavoidable cancellation, postponement, relocation and enforced reduced attendance at events due to certain covered causes. Specifically,causes, including losses caused by natural disasters such as hurricanes. While these causes includeincluded event cancellation caused by the outbreak of communicable diseases, including COVID-19, for the years ended December 31, 20202021 and 2021, as well as losses caused by natural disasters such as hurricanes. However,2020, Emerald’s renewed event cancellation insurance policies for the calendarbeginning with policy year 2022 do not cover losses due to event cancellations caused by the outbreak of communicable diseases, including COVID-19. Our Other Income is primarily comprised of received or confirmed event cancellation insurance claim and insurance litigation settlement proceeds.
Cost of Revenues
• Decorating Expenses. We work with general service contractors to both set up communal areas of our trade shows and provide services to our exhibitors, who primarily contract directly with the general service contractors. We will usually select a single general service contractor for an entire show, although it is possible to bid out packages of work within a single show on a piecemeal basis to different task-specific specialists. Decorating expenses represented 19%, 17%, and 16% of our total cost of revenues for the years ended December 31, 2023, 2022 and 2021, respectively, and 7%, 6%, and 6% of our total revenues for each of the years ended December 31, 2023, 2022 and 2021, respectively. • Sponsorship Costs. We often enter into long-term sponsorship agreements with industry trade associations whereby the industry trade association endorses and markets the show to its members in exchange for a percentage of the show’s revenue. Sponsorship costs represented 13%, 13%, and 9% of our total cost of revenues for the years ended December 31, 2023, 2022 and 2021, respectively, and 5%, 5%, and 3% of our total revenues for the year ended December 31, 2023, 2022 and 2021, respectively. • Venue Costs. Venue costs represent rental costs for the venues, usually convention centers or hotels, where we host our trade shows. Given that convention centers are typically owned by local governments who have a vested interest in stimulating business activity in and attracting tourism to their cities, venue costs typically represent a small percentage of our total cost of revenues. Venue costs represented 12%, 11%, and 13% of our total cost of revenues for the years ended December 31, 2023, 2022 and 2021, respectively, and 4%, 4%, and 5% of our total revenues for each of the years ended December 31, 2023, 2022 and 2021, respectively. • Costs of Other Marketing Services. Costs of other marketing services represent paper, printing, postage, contributor and other costs related to digital media and print publications. Costs of other marketing services represented 5%, 6%, and 10% of our total cost of revenues for each of the years ended December 31, 2023, 2022 and 2021, respectively, and 2%, 2%, and 4% of our total revenues for each of the years ended December 31, 2023, 2022 and 2021, respectively. • Other Event-Related Expenses. Other event-related costs include temporary labor for services such as security, shuttle buses, speaker fees, food and beverage expenses and event cancellation insurance. Other event-related expenses represented 35%, 27%, and 51% of our total cost of revenues for the years ended December 31, 2023, 2022 and 2021, respectively, and 13%, 10%, and 20% of our total revenues for the year ended December 31, 2023, 2022 and 2021, respectively. 37 |
|
|
|
|
|
|
|
|
|
Selling, General and Administrative Expenses
| • Labor Costs. Labor costs represent the cost of employees who are involved in sales, marketing, planning and administrative activities. The actual on-site set-up of the events is contracted out to third-party vendors and is included in cost of revenues. Labor costs represented 64%, 72%, and 67% of our total selling, general and administrative expenses for the years ended December 31, 2023, 2022 and 2021, respectively, and 28%, 32%, and 66% of our total revenues for each of the years ended December 31, 2023, 2022 and 2021, respectively. • Miscellaneous Expenses. Miscellaneous expenses are comprised of a variety of other expenses, including advertising and marketing costs, promotion costs, credit card fees, travel expenses, printing costs, office supplies and office rental expense. Direct trade show costs are recorded in cost of revenues. All other costs are recorded in selling, general and administrative expenses. Miscellaneous expenses represented 36%, 28%, and 33% of our total selling, general and administrative expenses, for the years ended December 31, 2023, 2022 and 2021, respectively, and 16%, 13%, and 32% of our total revenues for the years ended December 31, 2023, 2022 and 2021, respectively.
|
|
|
|
Interest Expense
Interest expense principally represents interest payments and refinancingcertain other fees paid to lenders under our lenders. On May 22, 2017, we refinanced our senior secured credit facilities with the Amended and Restated Senior Secured Credit Facilities (the “2017 Refinancing”)(as amended, for the portion of the year ended December 31, 2023 after the Term Loan Amendment Effective Date, by the Term Loan Amendment). We further amended the Amended and Restated Senior Secured Credit Facilities in November 2017 to reduce the applicable interest rates.Interest expense for the years ended December 31, 2022 and 2021, 2020, and 2019for the portion of 2023 prior to the Term Loan Amendment Effective Date, principally represented interest paid in respect of our Amended and Restated Senior Secured Credit Facilities.Facilities (as amended and in effect during the applicable period).
Depreciation and Amortization
We have historically grown our business through acquisitions and, in doing so, have acquired significant intangible assets, the value of some of which is amortized over time. These acquired intangible assets, unless determined to be indefinite-lived, are amortized over extended periods of tenthree to thirty years from the date of each acquisition for reporting under accounting principles generally accepted in the United States of America (“GAAP”) purposes, or fifteen years for tax purposes. This amortization expense reduces our taxable income. Depreciation expense relates to property and equipment and represented approximately 1%, 1%, and less than 1% of our total revenues for the year ended December 31, 2023, and approximately 1% of our total revenues for each of the years ended December 31, 2021, 2020,2022 and 2019, respectively.2021.
Income Taxes
Income tax expense consists of U.S. federal, state, local and localforeign taxes based on income in the jurisdictions in which we operate.
We record deferred tax charges or benefits primarily associated with our utilization or generation of net operating loss carryforwards and book-to-tax differences related to amortization of goodwill, amortization of intangiblesintangible assets, depreciation, stock-based compensation charges, 163(j) interest expense limitation and deferred financing costs.
Cash Flow Model
We typically have favorable cash flow characteristics, as described below (see “—Liquidity“Liquidity and Capital Resources—Cash Flows”), as a result of our high profit margins, low capital expenditures and consistentlyconsistent negative working capital, excluding cash on hand. Our working capital, excluding cash on hand, is negative asdue to the fact that our current assets are generally lower than our current liabilities. Current assets primarily include accounts receivable and prepaid expenses, while current liabilities primarily include accounts payableborrowings under our Amended and Restated Revolving Credit Facility (the “Amended and Restated Revolving Credit Facility”) and deferred revenues. Cash received prior to an event is recorded as deferred revenue on our balance sheet and recognized as revenue upon completion of each trade show. The implication of having negative working capital, excluding cash on hand, is that changes in working capital represent a source of cash as our business grows. As a result of COVID-19, the accounts receivable and deferred revenue balances related to cancelled events have been reclassified to Cancelled event
38
liabilities in the consolidated balance sheets, as the net amount represents balances which we expect will be
refunded to our customers. While we believe that our business interruption insurance proceeds will largely mitigate this liability, cash outflows for customer refunds will likely exceed insurance claim settlement cash inflows for the foreseeable future.
The primary driver for our negative working capital, excluding cash on hand, is the sales cycle for a trade show, which typically begins during the twelve months prior to a show. In the interim period between the current show and the following show, we continue to sell to new and past exhibitors and collect payments on contracted exhibit space. Most of ourOur exhibitors pay in full in advance of each trade show, whereas the bulk of direct expenses are paid close to or after the show. Cash deposits start to be received as early as twelve months prior to a show taking place and the balance of booth space fees are typically received in cash one month prior to a show taking place. This highly efficient cash flow model, where cash is received in advance of expenses to be paid, creates a working capital benefit.
Free Cash Flow
In addition to net cash provided by operating activities presented in accordance with GAAP, we present Free Cash Flow because we believe it is a useful indicator of liquidity that provides information to our management and investors about the amount of cash generated from our core operations that, after capital expenditures, can be used for the repayment of indebtedness, paying of dividends, repurchasing of shares of our common stock and strategic initiatives, including investing in our business and making strategic acquisitions.
Free Cash Flow is a supplemental non-GAAP financial measure of liquidity and is not based on any standardized methodology prescribed by GAAP. Free Cash Flow should not be considered in isolation or as an alternative to net cash provided by operating activities or other measures determined in accordance with GAAP. Also, Free Cash Flow is not necessarily comparable to similarly titled measures used by other companies.
The most directly comparable GAAP measure to Free Cash Flow is net cash provided by operating activities. For a reconciliation of Free Cash Flow to net cash provided by operating activities, see footnote 6Footnote 5 to the table under the heading “Results of Operations - Operations—Comparison of the Year Ended December 31, 20212023 to the Year Ended December 31, 2020”2022”.
Adjusted EBITDA
Adjusted EBITDA is a key measure of our performance. We define Adjusted EBITDA as net loss(loss) income before (i) interest expense, (ii) provision for (benefit from) income tax (benefit),taxes, (iii) goodwill impairments, (iv) intangible asset impairments, (v) depreciation and amortization, (iv)(vi) stock-based compensation, (v)(vii) deferred revenue adjustment (vi) goodwill and other intangible asset impairment charges, (vii) material show scheduling adjustments, and (viii) other items that management believeswe believe are not part of our core operations. We present Adjusted EBITDA because we believe it assists investors and analysts in comparing our operating performance across reporting periods on a consistent basis by excluding items that we do not believe are indicative of our core operating performance.
Management and our Board of Directors use Adjusted EBITDA to assess our financial performance and believe it is helpful in highlighting trends because it excludes the results of decisions that are outside the control of management, while other performance metrics can differ significantly depending on long-term strategic decisions regarding capital structure, the tax jurisdictions in which we operate and capital investments. We reference Adjusted EBITDA frequently in our decision-making because it provides supplemental information that facilitates internal comparisons to the historical operating performance of prior periods.
Adjusted EBITDA is not defined under GAAP and has limitations as an analytical tool, and you should not consider such measure either in isolation or as a substitute for analyzing our results as reported under GAAP. Some of these limitations include that Adjusted EBITDA excludes certain normal recurring expenses and one-time cash adjustments that we consider not to be indicative of our ongoing operating performance. Because not all companies use identical calculations, our presentation of Adjusted EBITDA may not be comparable to other similarly titled measures used by other companies.
The most directly comparable GAAP measure to Adjusted EBITDA is net loss.(loss) income. For a reconciliation of Adjusted EBITDA to net loss,(loss) income, see footnoteFootnote 4 to the table under the heading “Results of Operations - Operations—Comparison of the Year Ended December 31, 20212023 to the Year Ended December 31, 2020”2022”.
39
Results of Operations
Comparison of the Year Ended December 31, 20212023 to the Year Ended December 31, 20202022
The tables in this section summarize key components of our results of operations for the periods indicated.
|
| Year Ended December 31, |
|
|
|
|
|
|
| |||||||
|
| 2023 |
|
| 2022 |
|
| Variance $ |
|
| Variance % |
| ||||
|
| (dollars in millions) |
| |||||||||||||
Statement of (loss) income and comprehensive |
|
|
|
|
|
|
|
|
|
|
|
| ||||
Revenues |
| $ | 382.8 |
|
| $ | 325.9 |
|
| $ | 56.9 |
|
|
| 17.5 | % |
Other income, net |
|
| 2.8 |
|
|
| 182.8 |
|
|
| (180.0 | ) |
|
| (98.5 | )% |
Cost of revenues |
|
| 137.6 |
|
|
| 116.5 |
|
|
| 21.1 |
|
|
| 18.1 | % |
Selling, general and administrative expenses(1) |
|
| 168.3 |
|
|
| 145.0 |
|
|
| 23.3 |
|
|
| 16.1 | % |
Depreciation and amortization expense |
|
| 45.0 |
|
|
| 59.5 |
|
|
| (14.5 | ) |
|
| (24.4 | )% |
Goodwill impairments(2) |
|
| — |
|
|
| 6.3 |
|
|
| (6.3 | ) |
|
| (100.0 | )% |
Intangible asset impairments(3) |
|
| — |
|
|
| 1.6 |
|
|
| (1.6 | ) |
|
| (100.0 | )% |
Operating income |
|
| 34.7 |
|
|
| 179.8 |
|
|
| (145.1 | ) |
| NM |
| |
Interest expense |
|
| 43.3 |
|
|
| 24.5 |
|
|
| 18.8 |
|
|
| 76.7 | % |
Interest income |
|
| 8.2 |
|
|
| 2.7 |
|
|
| 5.5 |
|
|
| 203.7 | % |
Loss on extinguishment of debt |
|
| 2.3 |
|
|
| — |
|
|
| 2.3 |
|
|
| 100.0 | % |
Loss on disposal of fixed assets |
|
| 0.2 |
|
|
| — |
|
|
| 0.2 |
|
|
| 100.0 | % |
(Loss) income before income taxes |
|
| (2.9 | ) |
|
| 158.0 |
|
|
| (160.9 | ) |
| NM |
| |
Provision for income taxes |
|
| 5.3 |
|
|
| 27.2 |
|
|
| (21.9 | ) |
| NM |
| |
Net (loss) income and comprehensive (loss) income |
| $ | (8.2 | ) |
| $ | 130.8 |
|
| $ | (139.0 | ) |
| NM |
| |
|
|
|
|
|
|
|
|
|
|
|
| |||||
Other financial data (unaudited): |
|
|
|
|
|
|
|
|
|
|
|
| ||||
Adjusted EBITDA(4) |
| $ | 97.8 |
|
| $ | 239.6 |
|
| $ | (141.8 | ) |
|
| (59.2 | )% |
Free Cash Flow(5) |
| $ | 28.8 |
|
| $ | 164.8 |
|
| $ | (136.0 | ) |
|
| (82.5 | )% |
Organic revenue(6) |
| $ | 370.1 |
|
| $ | 323.1 |
|
| $ | 47.0 |
|
|
| 14.5 | % |
40
|
| Year Ended December 31, |
|
|
|
|
|
|
|
|
| |||||
|
| 2021 |
|
| 2020 |
|
| Variance $ |
|
| Variance % |
| ||||
|
| (dollars in millions) |
| |||||||||||||
Statement of loss and comprehensive loss data: |
|
|
|
|
|
|
|
|
|
|
|
|
|
|
|
|
Revenues |
| $ | 145.5 |
|
| $ | 127.4 |
|
| $ | 18.1 |
|
|
| 14.2 | % |
Other income |
|
| 77.4 |
|
|
| 107.0 |
|
|
| (29.6 | ) |
|
| (27.7 | )% |
Cost of revenues |
|
| 55.5 |
|
|
| 57.6 |
|
|
| (2.1 | ) |
|
| (3.6 | )% |
Selling, general and administrative expenses(1) |
|
| 143.0 |
|
|
| 118.6 |
|
|
| 24.4 |
|
|
| 20.6 | % |
Depreciation and amortization expense |
|
| 47.6 |
|
|
| 48.6 |
|
|
| (1.0 | ) |
|
| (2.1 | )% |
Goodwill impairments(2) |
|
| 7.2 |
|
|
| 603.4 |
|
|
| (596.2 | ) |
|
| (98.8 | )% |
Intangible asset impairments(3) |
|
| 32.7 |
|
|
| 76.8 |
|
|
| (44.1 | ) |
|
| (57.4 | )% |
Operating loss |
|
| (63.1 | ) |
|
| (670.6 | ) |
|
| 607.5 |
|
|
| (90.6 | )% |
Interest expense |
|
| 15.8 |
|
|
| 20.6 |
|
|
| (4.8 | ) |
|
| (23.3 | )% |
Loss on disposal of fixed assets |
|
| 0.5 |
|
|
| — |
|
|
| 0.5 |
|
| NM |
| |
Loss before income taxes |
|
| (79.4 | ) |
|
| (691.2 | ) |
|
| 611.8 |
|
|
| (88.5 | )% |
Benefit from income taxes |
|
| (1.3 | ) |
|
| (57.6 | ) |
|
| 56.3 |
|
|
| (97.7 | )% |
Net loss and comprehensive loss |
| $ | (78.1 | ) |
| $ | (633.6 | ) |
| $ | 555.5 |
|
|
| (87.7 | )% |
|
|
|
|
|
|
|
|
|
|
|
|
|
|
|
|
|
Other financial data (unaudited): |
|
|
|
|
|
|
|
|
|
|
|
|
|
|
|
|
Adjusted EBITDA(4) |
| $ | 45.7 |
|
| $ | 71.9 |
|
| $ | (26.2 | ) |
|
| (36.4 | )% |
Free Cash Flow(5) |
| $ | 83.4 |
|
| $ | (41.1 | ) |
| $ | 124.5 |
|
|
| (302.9 | )% |
Organic revenue(6) |
| $ | 43.8 |
|
| $ | 44.1 |
|
| $ | (0.3 | ) |
|
| (0.7 | )% |
|
|
|
|
|
|
|
|
|
We define Adjusted EBITDA as net loss(loss) income before (i) interest expense, (benefit),net, (ii) provision for (benefit from) income tax expense,taxes, (iii) goodwill impairments, (iv) intangible asset impairments, (v) depreciation and amortization, (vi) stock-based compensation, (vii) deferred revenue adjustment and (viii) other items that management believeswe believe are not part of our core operations. We present Adjusted EBITDA because we believe it assists investors and analysts in comparing our operating performance across reporting periods on a consistent basis by excluding items that we do not believe are indicative of our core operating performance. Management and our Board of Directors use Adjusted EBITDA to assess our financial performance and believe they areit is helpful in highlighting trends because it excludes the results of decisions that are outside the control of our management, while other performance metrics can differ significantly depending on long-term strategic decisions regarding capital structure, the tax jurisdictions in which we operate and capital investments. We reference Adjusted EBITDA frequently in our decision-making because it provides supplemental information that facilitates internal comparisons to the historical operating performance of prior periods. Adjusted EBITDA is not defined under GAAP and has limitations as an analytical tool, and you should not consider such measure either in isolation or as a substitute for analyzing our results as reported under GAAP. Some of these limitations include that Adjusted EBITDA excludes certain normal recurring expenses and one-time cash adjustments that we consider not to be indicative of our ongoing operative performance. Because not all companies use identical calculations, our presentation of Adjusted EBITDA may not be comparable to other similarly titled measures used by other companies.
|
| Year Ended December 31, |
| |||||
|
| 2023 |
|
| 2022 |
| ||
|
| (unaudited) |
| |||||
|
| (dollars in millions) |
| |||||
Net (loss) income |
| $ | (8.2 | ) |
| $ | 130.8 |
|
Add (Deduct): |
|
|
|
|
|
| ||
Interest expense, net |
|
| 35.1 |
|
|
| 21.8 |
|
Loss on extinguishment of debt |
|
| 2.3 |
|
|
| — |
|
Provision for (benefit from) income taxes |
|
| 5.3 |
|
|
| 27.2 |
|
Goodwill impairments(a) |
|
| — |
|
|
| 6.3 |
|
Intangible asset impairments(b) |
|
| — |
|
|
| 1.6 |
|
Depreciation and amortization expense |
|
| 45.0 |
|
|
| 59.5 |
|
Stock-based compensation expense(c) |
|
| 7.8 |
|
|
| 5.8 |
|
Deferred revenue adjustment(d) |
|
| — |
|
|
| 0.6 |
|
Other items(e) |
|
| 10.5 |
|
|
| (14.0 | ) |
Adjusted EBITDA |
| $ | 97.8 |
|
| $ | 239.6 |
|
Deduct: |
|
|
|
|
|
| ||
Event cancellation insurance proceeds |
|
| 2.8 |
|
|
| 182.8 |
|
Adjusted EBITDA excluding event cancellation insurance proceeds |
| $ | 95.0 |
|
| $ | 56.8 |
|
41
|
| Year Ended December 31, |
|
| |||||
|
| 2021 |
|
| 2020 |
|
| ||
|
| (unaudited) |
|
| |||||
|
| (dollars in millions) |
|
| |||||
Net loss |
| $ | (78.1 | ) |
| $ | (633.6 | ) |
|
Add (Deduct): |
|
|
|
|
|
|
|
|
|
Interest expense |
|
| 15.8 |
|
|
| 20.6 |
|
|
Benefit from income taxes |
|
| (1.3 | ) |
|
| (57.6 | ) |
|
Goodwill impairments(a) |
|
| 7.2 |
|
|
| 603.4 |
|
|
Intangible asset impairments(b) |
|
| 32.7 |
|
|
| 76.8 |
|
|
Depreciation and amortization |
|
| 47.6 |
|
|
| 48.6 |
|
|
Stock-based compensation expense(c) |
|
| 10.4 |
|
|
| 6.7 |
|
|
Deferred revenue adjustment(d) |
|
| 2.0 |
|
|
| — |
|
|
Other items(e) |
|
| 9.4 |
|
|
| 7.0 |
|
|
Adjusted EBITDA |
| $ | 45.7 |
|
| $ | 71.9 |
|
|
|
| Year Ended December 31, |
| |||||
|
| 2023 |
|
| 2022 |
| ||
|
| (unaudited) |
| |||||
|
| (dollars in millions) |
| |||||
Net Cash Provided by Operating Activities |
| $ | 40.3 |
|
| $ | 175.1 |
|
Less: |
|
|
|
|
|
| ||
Capital expenditures |
|
| 11.5 |
|
|
| 10.3 |
|
Free Cash Flow |
| $ | 28.8 |
|
| $ | 164.8 |
|
| (6) In addition to revenues presented in accordance with GAAP, we present Organic revenue because we believe it assists investors and analysts in comparing Emerald’s operating performance across reporting periods on a consistent basis by excluding items that we do not believe reflect a true comparison of the trends of the existing event calendar given changes in timing or strategy. Our management and Board of Directors evaluate changes in Organic revenue to understand underlying revenue trends of its events. Our presentation of Organic revenue adjusts revenue for (i) acquisition revenue and (ii) scheduling adjustments.
|
|
|
|
|
|
|
|
|
|
|
|
|
|
| Year Ended December 31, |
| |||||
|
| 2021 |
|
| 2020 |
| ||
|
| (unaudited) |
| |||||
|
| (dollars in millions) |
| |||||
Net Cash Provided by (Used in) Operating Activities |
| $ | 90.0 |
|
| $ | (37.1 | ) |
Less: |
|
|
|
|
|
|
|
|
Capital expenditures |
|
| 6.6 |
|
|
| 4.0 |
|
Free Cash Flow |
| $ | 83.4 |
|
| $ | (41.1 | ) |
|
|
Organic revenue is a supplemental non-GAAP financial measure of performance and is not based on any standardized methodology prescribed by GAAP. Organic revenue should not be considered in isolation or as an alternative to revenues or other measures determined in accordance with GAAP. Also, Organic revenue is not necessarily comparable to similarly titled measures used by other companies.
|
| Year |
|
| Change |
| ||||||||||
|
| 2023 |
|
| 2022 |
|
| $ |
|
| % |
| ||||
|
| (unaudited) |
| |||||||||||||
|
| (dollars in millions) |
| |||||||||||||
Revenues |
| $ | 382.8 |
|
| $ | 325.9 |
|
| $ | 56.9 |
|
|
| 17.5 | % |
Add (deduct): |
|
|
|
|
|
|
|
|
|
|
|
| ||||
Acquisition revenues |
|
| (12.7 | ) |
|
| — |
|
|
|
|
|
|
| ||
Discontinued events |
|
| — |
|
|
| (2.8 | ) |
|
|
|
|
|
| ||
Organic revenue |
| $ | 370.1 |
|
| $ | 323.1 |
|
| $ | 47.0 |
|
|
| 14.5 | % |
Revenues
|
| Year Ended December 31, |
|
| Change |
| ||||||||||
|
| 2021 |
|
| 2020 |
|
| $ |
|
| % |
| ||||
|
| (unaudited) (dollars in millions) |
| |||||||||||||
Revenues |
| $ | 145.5 |
|
| $ | 127.4 |
|
| $ | 18.1 |
|
|
| 14.2 | % |
Add (deduct): |
|
|
|
|
|
|
|
|
|
|
|
|
|
|
|
|
Acquisition revenues |
|
| (16.6 | ) |
|
| — |
|
|
|
|
|
|
|
|
|
Discontinued events |
|
| — |
|
|
| (7.6 | ) |
|
|
|
|
|
|
|
|
COVID-19 prior year cancellations(1) |
|
| (85.1 | ) |
|
| — |
|
|
|
|
|
|
|
|
|
COVID-19 current year cancellations(2) |
|
| — |
|
|
| (75.7 | ) |
|
|
|
|
|
|
|
|
Organic revenue |
| $ | 43.8 |
|
| $ | 44.1 |
|
| $ | (0.3 | ) |
|
| (0.7 | %) |
|
|
|
|
Revenues
Total revenues of $145.5$382.8 million for the year ended December 31, 20212023 increased $18.1$56.9 million, or 14.2%17.5%, from $127.4$325.9 million for the year ended December 31, 2020.2022. See “Commerce Segment – Revenues,” “Design and Technology Segment – “Connections Segment—Revenues,” and “All Other Category – Category—Revenues” below for a discussion of the factors contributing to the changes in total revenues.
Other Income, net
Total other income, net of $77.4$2.8 million for the year ended December 31, 2023 decreased $180.0 million, from $182.8 million for the year ended December 31, 2022. See “Connections Segment—Other Income, net” and
42
“Corporate—Other Income, net” below for a discussion of the factors contributing to the changes in total other income, net.
Cost of Revenues
Total cost of revenues of $137.6 million for fiscal 2021 decreased2023 increased by $29.6$21.1 million, or 18.1%, from $107.0$116.5 million for fiscal 2020.2022. See “Commerce Segment – “Connections Segment—Cost of Revenues,” “Design and Technology Segment – Cost of Revenues” and “All Other Category – Category—Cost of Revenues” below for a discussion of the factors contributing to the changes in total cost of revenues.
Cost of Revenues
Total cost of revenues of $55.5 million for fiscal 2021 decreased by $2.1 million, or 3.6%, from $57.6 million for fiscal 2020. See “Commerce Segment – Cost of Revenues,” “Design and Technology Segment – Cost of Revenues” and “All Other Category – Cost of Revenues” below for a discussion of the factors contributing to the changes in total cost of revenues.
Selling, General and Administrative Expenses
Total selling, general and administrative expenses consist primarily of compensation and employee-related costs, sales commissions and incentive plans, stock-based compensation expense, marketing expenses, information technology expenses, travel expenses, facilities costs, consulting fees and public reporting costs. Total selling, general and administrative expenses of $143.0$168.3 million for the year ended December 31, 20212023 increased $24.4$23.3 million, or 20.6%16.1%, from $118.6$145.0 million for the year ended December 31, 2020.2022. See “Commerce Segment – Selling,
General and Administrative Expenses”, “Design and Technology Segment – “Connections Segment—Selling, General and Administrative Expenses”, “All Other category – category—Selling, General and Administrative Expenses” and “Corporate - “Corporate—Selling, General and Administrative Expenses” below for a discussion of the factors contributing to the changes in total selling, general and administrative expenses.
Depreciation and Amortization Expense
Total depreciation and amortization expense of $45.0 million for the year ended December 31, 2023 decreased $14.5 million, or 24.4%, from $59.5 million for the year ended December 31, 2022. See “Connections Segment—Depreciation and Amortization Expense,” “All Other Category—Depreciation and Amortization Expense” and “Corporate—Depreciation and Amortization Expense” below for a discussion of the factors contributing to the changes in total depreciation and amortization expense.
Goodwill Impairments
As a result of the changes in our operating segments in the first quarter of 2022, we performed a goodwill impairment assessment and recorded a $6.3 million non-cash charge related to the impairment of goodwill as of January 31, 2022. There were no charges related to impairment of goodwill recorded during the year ended December 31, 2023.
Intangible Asset Impairments
As a result of the identification of an interim impairment trigger for one of its indefinite-lived intangible assets during the first quarter of 2022, the Company performed an impairment assessment and recorded a $1.6 million non-cash charge related to the impairment of an indefinite-lived trade name asset as of January 31, 2022. There were no charges related to impairment of intangible assets recorded during the year ended December 31, 2023.
Interest Expense
Total interest expense of $43.3 million for the year ended December 31, 2023 increased $18.8 million, or 76.7%, from $24.5 million for the year ended December 31, 2022. See “Corporate—Interest Expense” below for a discussion of the factors contributing to the changes in total interest expense.
Interest Income
Total interest income of $8.2 million for the year ended December 31, 2023 increased $5.5 million, or 203.7%, from $2.7 million for the year ended December 31, 2022. See “Corporate—Interest Income” below for a discussion of the factors contributing to the changes in total interest income.
43
Loss on Extinguishment of Debt
See “Corporate—Loss on Extinguishment of Debt” below for a discussion of the factors contributing to the changes in total loss on extinguishment of debt.
Connections Segment
|
| Year Ended December 31, |
|
|
|
|
|
|
| |||||||
|
| 2023 |
|
| 2022 |
|
| Variance $ |
|
| Variance % |
| ||||
|
| (dollars in millions) |
| |||||||||||||
Revenues |
| $ | 340.2 |
|
| $ | 282.6 |
|
| $ | 57.6 |
|
|
| 20.4 | % |
Other income, net |
|
| 2.8 |
|
|
| 34.2 |
|
|
| (31.4 | ) |
|
| (91.8 | )% |
Cost of revenues |
|
| 128.0 |
|
|
| 106.9 |
|
|
| 21.1 |
|
|
| 19.7 | % |
Selling, general and administrative expenses |
|
| 79.4 |
|
|
| 77.2 |
|
|
| 2.2 |
|
|
| 2.8 | % |
Depreciation and amortization expense |
|
| 34.8 |
|
|
| 50.7 |
|
|
| (15.9 | ) |
|
| (31.4 | )% |
Goodwill impairments |
|
| — |
|
|
| 6.0 |
|
|
| (6.0 | ) |
| NM |
| |
Intangible asset impairments |
|
| — |
|
|
| 1.6 |
|
|
| (1.6 | ) |
| NM |
| |
Operating income |
| $ | 100.8 |
|
| $ | 74.4 |
|
| $ | 26.4 |
|
|
| 35.5 | % |
Revenues
During the year ended December 31, 2023, revenues for the Connections segment of $340.2 million increased by $57.6 million, or 20.4% from $282.6 million for the year ended December 31, 2022. The primary driver of the increase was organic revenue growth of $47.7 million, or 17.0%, from $279.8 million in fiscal year 2022 to $327.5 million in the current year. This growth was comprised of a recurring revenues increase of $41.8 million, or 15.0%, to $320.6 million in the current year from $278.8 million in fiscal year 2022 and $5.9 million from new event launches in the current year. Acquisitions generated incremental revenues of $12.7 million during fiscal year 2023. These increases were partially offset by $2.8 million in prior year revenues from discontinued events.
Other Income, net
Other income, net of $2.8 million and $34.2 million was recorded for the Connections segment related to event cancellation insurance proceeds during the years ended December 31, 2023 and 2022, respectively. All of the $2.8 million and $34.2 million of other income, net, for the Connections segment was received during the years ended December 31, 2023 and 2022, respectively.
Cost of Revenues
During the year ended December 31, 2023, cost of revenues for the Connections reportable segment increased $21.1 million, or 19.7%, to $128.0 million from $106.9 million for the year ended December 31, 2022. This growth was comprised of an increase in cost of recurring revenues of $10.8 million, or 10.3%, to $115.0 million in the current year from $104.2 million in fiscal year 2022, and an increase of $5.7 million in cost of revenues from new event launches in the current year. Acquisitions generated incremental cost of revenues of $6.3 million during fiscal year 2023. These increases were partially offset by a decrease of $1.7 million from prior year cost of revenues relating to discontinued events.
Selling, General and Administrative Expenses
During the year ended December 31, 2023 selling, general and administrative expenses for the Connections reportable segment increased $2.2 million, or 2.8%, to $79.4 million from $77.2 million for the comparable period in 2022. The increase was primarily due to the acquisition of Lodestone, which added incremental expense of $2.1 million.
44
Depreciation and Amortization Expense
Depreciation and amortization expense attributable to the Connections segment of $34.8 million for the year ended December 31, 2023 decreased $15.9 million, or 31.4%, from $50.7 million for the year ended December 31, 2022. The decrease was due to the full amortization of intangible assets acquired in the formation of Emerald in June 2013 as well as lower amortization on the definite-lived trade name and customer relationship intangible assets associated with the MJBiz acquisition.
Goodwill Impairments
During 2022, the Company recorded non-cash goodwill impairments of $6.0 million in connection with reporting units under the Connections segment in relation to its annual impairment assessment. Refer to the consolidated goodwill impairment discussion under the heading, Goodwill Impairments, above in this Management’s Discussion and Analysis of Financial Condition and Results of Operations for further discussion on goodwill impairment.
Intangible Asset Impairments
In connection with our 2022 annual impairment assessment, we recorded a non-cash impairment charge of $1.6 million for intangible assets related to the Connections segment. Refer to the consolidated intangible assets impairment discussion under the heading, Intangible Asset Impairments, above in this Management’s Discussion and Analysis of Financial Condition and Results of Operations for further discussion on goodwill impairment.
All Other Category
|
| Year Ended December 31, |
|
|
|
|
|
|
| |||||||
|
| 2023 |
|
| 2022 |
|
| Variance $ |
|
| Variance % |
| ||||
|
| (dollars in millions) |
| |||||||||||||
Revenues |
| $ | 42.6 |
|
| $ | 43.3 |
|
| $ | (0.7 | ) |
|
| (1.6 | )% |
Cost of revenues |
|
| 9.6 |
|
|
| 9.6 |
|
|
| - |
|
| NM |
| |
Selling, general and administrative expenses |
|
| 29.4 |
|
|
| 34.2 |
|
|
| (4.8 | ) |
|
| (14.0 | )% |
Depreciation and amortization expense |
|
| 7.2 |
|
|
| 4.3 |
|
|
| 2.9 |
|
|
| 67.4 | % |
Goodwill impairments |
|
| — |
|
|
| 0.3 |
|
|
| (0.3 | ) |
|
| (100.0 | )% |
Operating loss |
| $ | (3.6 | ) |
| $ | (5.1 | ) |
| $ | 1.5 |
|
| NM |
| |
Revenues
During the year ended December 31, 2023, revenue attributable to the All Other category of $42.6 million decreased by $0.7 million, or 1.6%, from $43.3 million for the year ended December 31, 2022. The decrease in revenues was comprised of a $4.4 million, or 15.8% and a decrease in content revenues to $23.5 million in the current year from $27.9 million in fiscal year 2022, primarily related to lower print and digital advertising revenues in the technology sector, partially offset by a $3.7 million, or 24.0%, increase in commerce revenues to $19.1 million in the current year from $15.4 million in fiscal year 2022. The increase in commerce revenues was attributable to the continued growth of the Elastic Suite e-commerce business.
Cost of Revenues
During the year ended December 31, 2023, cost of revenues attributable to the All Other category remained flat compared to the prior year at $9.6 million. Cost of revenues related to our content business of $4.7 million during the current year decreased by $0.4 million, or 7.8%, from $5.1 million in fiscal year 2022 primarily as a result of the lower revenues described above. This decline was offset by cost of revenues related to our commerce business of $4.9 million during the current year, which increased $0.4 million, or 8.9%, from $4.5 million in fiscal year 2022. The increase in commerce cost of revenues was attributable to the continued growth of the Elastic Suite e-commerce business.
45
Selling, General and Administrative Expenses
During the year ended December 31, 2023, selling, general and administrative expenses for the All Other category of $29.4 million decreased by $4.8 million, or 14.0%, from $34.2 million for the year ended December 31, 2022. The decrease in selling, general and administrative expense was primarily driven by lower salary and benefits, contractual labor and consulting expenses.
Depreciation and Amortization Expense
Depreciation and amortization expense for the All Other category of $7.2 million for the year ended December 31, 2023 increased $2.9 million, or 67.4%, from $4.3 million for the year ended December 31, 2022. The increase was due to higher amortization of software development costs related to our commerce business.
Goodwill Impairments
During 2022, the Company recorded non-cash goodwill impairments of $0.3 million in connection with reporting units under the All Other category in relation to its annual impairment assessment. Refer to the consolidated goodwill impairment discussion under the heading, Goodwill Impairments, above in this Management’s Discussion and Analysis of Financial Condition and Results of Operations for further discussion on goodwill impairment.
Corporate
|
| Year Ended December 31, |
|
|
|
|
|
|
| |||||||
|
| 2023 |
|
| 2022 |
|
| Variance $ |
|
| Variance % |
| ||||
|
| (dollars in millions) |
| |||||||||||||
Other income, net |
| $ | — |
|
| $ | 148.6 |
|
| $ | (148.6 | ) |
| NM |
| |
Selling, general and administrative expenses |
|
| 59.5 |
|
|
| 33.6 |
|
|
| 25.9 |
|
|
| 77.1 | % |
Depreciation and amortization expense |
|
| 3.0 |
|
|
| 4.5 |
|
|
| (1.5 | ) |
|
| (33.3 | )% |
Operating (loss) income |
| $ | (62.5 | ) |
| $ | 110.5 |
|
| $ | (173.0 | ) |
| NM |
| |
Other Income, net
During the year ended December 31, 2022, other income, net for the Corporate category was $148.6 million and was related to a one-time insurance litigation settlement. The one-time settlement payment was not specifically attributable to any of our outstanding event cancellation insurance claims and therefore was not recorded at the segment level.
Selling, General and Administrative Expenses
During the year ended December 31, 2023, selling, general and administrative expenses of $59.5 million for the Corporate category increased by $25.9 million, or 77.1%, from $33.6 million for the year ended December 31, 2022. The increase in selling, general and administrative expense was primarily driven by the impact in the current year of $33.3 million in prior year non-cash gains related to the remeasurement of contingent consideration liabilities, partially offset by a decrease of $7.9 million relating to insurance litigation settlement expenses incurred in fiscal year 2022.
Depreciation and Amortization Expense
Depreciation and amortization expense relating to the Corporate category of $3.0 million for the year ended December 31, 2023 decreased $1.5 million, or 33.3%, from $4.5 million for the year ended December 31, 2022. The decrease was related to lower loss on disposal of fixed assets related to office closures which occurred in fiscal year 2022.
Interest Expense; Interest Income; Loss on Extinguishment of Debt; Provision for Income Taxes; Net (Loss) Income and Comprehensive (Loss) Income; Adjusted EBITDA
46
Interest Expense
Interest expense of $43.3 million for the year ended December 31, 2023 increased $18.8 million, or 76.7%, from $24.5 million for the year ended December 31, 2022. The increase was primarily attributable to an increase in the variable interest rate on the term loan portion of our Amended and Restated Senior Secured Credit Facilities (as amended by the Term Loan Amendment), for which the average rate during 2023 was 8.98%, compared to 4.26% during 2022.
Interest Income
Interest income of $8.2 million for the year ended December 31, 2023 increased $5.5 million, from $2.7 million for the year ended December 31, 2022. The increase was primarily attributable to an increase in our cash balance due to the receipt of event cancellation insurance claim and insurance litigation settlement proceeds at the end of 2022 as well as rising interest rates throughout fiscal year 2023.
Loss on Extinguishment of Debt
Loss on extinguishment of debt of $2.3 million was recognized during the year ended December 31, 2023 as a result of the Term Loan Amendment on June 12, 2023. The loss on extinguishment of debt was comprised of $2.1 million of original issuance discount (“OID”) related to the Extended Term Loan Facility and $0.2 million of previously capitalized OID and debt issuance costs, allocated to lenders in the syndicate whose balances were extinguished in conjunction with the Term Loan Amendment.
Provision for Income Taxes
For the years ended December 31, 2023 and 2022, we recorded a provision for income taxes of $5.3 million and $27.2 million, respectively. The decrease in our provision for income taxes of $21.9 million for the year ended December 31, 2023 compared to the prior year was primarily attributable to the impact of lower other income, net from event cancellation insurance claim and insurance litigation settlement proceeds during 2023, partially offset by higher income generated by our operations.
Net (Loss) Income and Comprehensive (Loss) Income
Net loss and comprehensive loss of $8.2 million for the year ended December 31, 2023 decreased $139.0 million from net income and comprehensive income of $130.8 million for the year ended December 31, 2022. The key drivers of the decrease were lower other income, net related to event cancellation insurance claim and insurance litigation settlement proceeds and higher interest expense, net, offset in part by higher revenues as a result of the continued recovery from the COVID-19 pandemic and business acquisitions, lower provision for income taxes, lower depreciation and amortization expense and the absence of any goodwill and intangible asset impairment charges during 2023.
Adjusted EBITDA
Total Adjusted EBITDA of $97.8 million for the year ended December 31, 2023 decreased $141.8 million, or 59.2%, from $239.6 million for the year ended December 31, 2022. The decrease in Adjusted EBITDA was primarily attributable to lower other income, net related to the decrease in event cancellation insurance claim and insurance litigation settlement proceeds received during 2023, partially offset by the increased profits generated from our legacy business as it continues to recover from the impacts of the COVID-19 pandemic and profits generated by our recent acquisitions.
Adjusted EBITDA is a financial measure that is not calculated in accordance with GAAP. For a discussion of our presentation of Adjusted EBITDA, see Footnote 4 to the table under the heading “Results of Operations—Comparison of the Year Ended December 31, 2023 to the Year Ended December 31, 2022”.
47
Results of Operations
Comparison of the Year Ended December 31, 2022 to the Year Ended December 31, 2021
The tables in this section summarize key components of our results of operations for the periods indicated.
|
| Year Ended December 31, |
|
|
|
|
|
|
| |||||||
|
| 2022 |
|
| 2021 |
|
| Variance $ |
|
| Variance % |
| ||||
|
| (dollars in millions) |
| |||||||||||||
Statement of income (loss) and comprehensive |
|
|
|
|
|
|
|
|
|
|
|
| ||||
Revenues |
| $ | 325.9 |
|
| $ | 145.5 |
|
| $ | 180.4 |
|
|
| 124.0 | % |
Other income |
|
| 182.8 |
|
|
| 77.4 |
|
|
| 105.4 |
|
|
| 136.2 | % |
Cost of revenues |
|
| 116.5 |
|
|
| 57.1 |
|
|
| 59.4 |
|
|
| 104.0 | % |
Selling, general and administrative expenses(1) |
|
| 145.0 |
|
|
| 143.0 |
|
|
| 2.0 |
|
|
| 1.4 | % |
Depreciation and amortization expense |
|
| 59.5 |
|
|
| 47.6 |
|
|
| 11.9 |
|
|
| 25.0 | % |
Goodwill impairments(2) |
|
| 6.3 |
|
|
| 7.2 |
|
|
| (0.9 | ) |
|
| (12.5 | )% |
Intangible asset impairments(3) |
|
| 1.6 |
|
|
| 32.7 |
|
|
| (31.1 | ) |
|
| (95.1 | )% |
Operating income (loss) |
|
| 179.8 |
|
|
| (64.7 | ) |
|
| 244.5 |
|
| NM |
| |
Interest expense |
|
| 24.5 |
|
|
| 15.9 |
|
|
| 8.6 |
|
|
| 54.1 | % |
Interest income |
|
| 2.7 |
|
|
| 0.1 |
|
|
| 2.6 |
|
|
| 2600.0 | % |
Other expense |
|
| — |
|
|
| 0.1 |
|
|
| (0.1 | ) |
|
| (100.0 | )% |
Loss on disposal of fixed assets |
|
| — |
|
|
| 0.4 |
|
|
| (0.4 | ) |
| NM |
| |
Income (loss) before income taxes |
|
| 158.0 |
|
|
| (81.0 | ) |
|
| 239.0 |
|
|
| (295.1 | )% |
Provision for (benefit from) income taxes |
|
| 27.2 |
|
|
| (1.3 | ) |
|
| 28.5 |
|
|
| (2192.3 | )% |
Net income (loss) and comprehensive income (loss) |
| $ | 130.8 |
|
| $ | (79.7 | ) |
| $ | 210.5 |
|
|
| (264.1 | )% |
|
|
|
|
|
|
|
|
|
|
|
| |||||
Other financial data (unaudited): |
|
|
|
|
|
|
|
|
|
|
|
| ||||
Adjusted EBITDA(4) |
| $ | 239.6 |
|
| $ | 44.1 |
|
| $ | 195.5 |
|
|
| 443.3 | % |
Free Cash Flow(5) |
| $ | 164.8 |
|
| $ | 83.4 |
|
| $ | 81.4 |
|
| NM |
| |
Organic Revenue (6) |
| $ | 205.1 |
|
| $ | 145.5 |
|
| $ | 59.6 |
|
|
| 41.0 | % |
48
|
| Year Ended December 31, |
| |||||
|
| 2022 |
|
| 2021 |
| ||
|
| (unaudited) |
| |||||
|
| (dollars in millions) |
| |||||
Net income (loss) |
| $ | 130.8 |
|
| $ | (79.7 | ) |
Add (Deduct): |
|
|
|
|
|
| ||
Interest expense, net |
|
| 21.8 |
|
|
| 15.8 |
|
Provision for (benefit from) income taxes |
|
| 27.2 |
|
|
| (1.3 | ) |
Goodwill impairments(a) |
|
| 6.3 |
|
|
| 7.2 |
|
Intangible asset impairment(b) |
|
| 1.6 |
|
|
| 32.7 |
|
Depreciation and amortization expense |
|
| 59.5 |
|
|
| 47.6 |
|
Stock-based compensation expense(c) |
|
| 5.8 |
|
|
| 10.4 |
|
Deferred revenue adjustment(d) |
|
| 0.6 |
|
|
| 2.0 |
|
Other items(e) |
|
| (14.0 | ) |
|
| 9.4 |
|
Adjusted EBITDA |
| $ | 239.6 |
|
| $ | 44.1 |
|
Deduct: |
|
|
|
|
|
| ||
Event cancellation insurance proceeds |
|
| 182.8 |
|
|
| 77.4 |
|
Adjusted EBITDA excluding event cancellation insurance proceeds |
| $ | 56.8 |
|
| $ | (33.3 | ) |
49
|
| Year Ended December 31, |
| |||||
|
| 2022 |
|
| 2021 |
| ||
|
| (unaudited) |
| |||||
|
| (dollars in millions) |
| |||||
Net Cash Provided by Operating Activities |
| $ | 175.1 |
|
| $ | 90.0 |
|
Less: |
|
|
|
|
|
| ||
Capital expenditures |
|
| 10.3 |
|
|
| 6.6 |
|
Free Cash Flow |
| $ | 164.8 |
|
| $ | 83.4 |
|
Organic revenue is a supplemental non-GAAP financial measure of performance and is not based on any standardized methodology prescribed by GAAP. Organic revenue should not be considered in isolation or as an alternative to revenues or other measures determined in accordance with GAAP. Also, Organic revenue is not necessarily comparable to similarly titled measures used by other companies.
|
| Year |
|
| Change |
| ||||||||||
|
| 2022 |
|
| 2021 |
|
| $ |
|
| % |
| ||||
|
| (unaudited) |
| |||||||||||||
|
| (dollars in millions) |
| |||||||||||||
Revenues |
| $ | 325.9 |
|
| $ | 145.5 |
|
| $ | 180.4 |
|
|
| 124.0 | % |
Add (deduct): |
|
|
|
|
|
|
|
|
|
|
|
| ||||
Acquisition revenues |
|
| (44.8 | ) |
|
| — |
|
|
|
|
|
|
| ||
COVID-19 cancellations(1) |
|
| (76.0 | ) |
|
| — |
|
|
|
|
|
|
| ||
Organic revenues |
| $ | 205.1 |
|
| $ | 145.5 |
|
| $ | 59.6 |
|
|
| 41.0 | % |
Revenues
Total revenues of $325.9 million for the year ended December 31, 2022 increased $180.4 million, or 124.0%, from $145.5 million for the year ended December 31, 2021. See “Connections Segment – Revenues,” and “All Other Category – Revenues” below for a discussion of the factors contributing to the changes in total revenues.
Other Income, net
Total other income, net of $182.8 million for fiscal 2022 increased by $105.4 million, from $77.4 million for fiscal 2021. See “Connections Segment – Other Income, net”, “All Other Category – Other Income, net” and “Corporate – Other Income, net” below for a discussion of the factors contributing to the changes in total other income, net.
50
Cost of Revenues
Total cost of revenues of $116.5 million for fiscal 2022 increased by $59.4 million, or 104.0%, from $57.1 million for fiscal 2021. See “Connections Segment – Cost of Revenues,” and “All Other Category – Cost of Revenues” below for a discussion of the factors contributing to the changes in total cost of revenues.
Selling, General and Administrative Expenses
Total selling, general and administrative expenses consist primarily of compensation and employee-related costs, sales commissions and incentive plans, stock-based compensation expense, marketing expenses, information technology expenses, travel expenses, facilities costs, consulting fees and public reporting costs. Total selling, general and administrative expenses of $145.0 million for the year ended December 31, 2022 increased $2.0 million, or 1.4%, from $143.0 million for the year ended December 31, 2021. See “Connections Segment – Selling, General and Administrative Expenses”, “All Other category – Selling, General and Administrative Expenses” and “Corporate—Selling, General and Administrative Expenses” below for a discussion of the factors contributing to the changes in total selling, general and administrative expenses.
Depreciation and Amortization Expense
Total depreciation and amortization expense of $59.5 million for the year ended December 31, 2022 increased $11.9 million, or 25.0%, from $47.6 million for the year ended December 31, 2021 decreased $1.0 million, or 2.1%, from $48.6 million for the year ended December 31, 2020.2021. See “Commerce Segment – Depreciation and Amortization Expense,” “Design and Technology“Connections Segment – Depreciation and Amortization Expense,” “All Other Category – Depreciation and Amortization Expense” and “Corporate – Depreciation and Amortization Expense” below for a discussion of the factors contributing to the changes in total depreciation and amortization expense.expense.
Goodwill Impairments
As a result of the changes in our operating segments in the first quarter of 2022, we performed a goodwill impairment assessment and recorded a $6.3 million non-cash charge related to the impairment of goodwill as of January 31, 2022.
As a result of our annual goodwill impairment assessment, management recorded a $7.2 million non-cash charge related to the impairment of goodwill as of October 31, 2021.
Intangible Asset Impairments
As a result of the COVID-19 pandemic and the measures implemented to preventidentification of an interim impairment trigger for one of its spread,indefinite-lived intangible assets during the first quarter of 2020, we determined that2022, the COVID-19 outbreak would continue to have a material negative impact on our financial results even following the time when the outbreak is contained. These factors, as well as uncertainty around when we would be able to resume normal operations, caused a significantCompany performed an impairment assessment and prolonged decline in our stock price, resulting in our market capitalization falling below the Company’s carrying value. As a result, we determined that a triggering event occurred and performed a quantitative assessment of the Company’s fair value as of March 31, 2020. In connection with this assessment management recorded a $588.2$1.6 million non-cash charge related to the impairment of goodwill. In addition, as a result of our annual goodwill impairment assessment, management recorded an additional $15.2 million non-cash charge related to the impairment of goodwillindefinite-lived trade name asset as of OctoberJanuary 31, 2020.2022.
Intangible Asset Impairments
As a result of our annual impairment assessment as of October 31, 2021, managementwe recorded a non-cash impairment charge of $32.7 million, which included non-cash impairment charges of $21.0 million and $11.7 million for certain customer relationship intangible assets and definite-lived trade names, and certain indefinite-lived trade names, respectively.
51
Connections Segment
|
| Year Ended December 31, |
|
|
|
|
|
|
| |||||||
|
| 2022 |
|
| 2021 |
|
| Variance $ |
|
| Variance % |
| ||||
|
| (dollars in millions) |
| |||||||||||||
Revenues |
| $ | 282.6 |
|
| $ | 106.7 |
|
| $ | 175.9 |
|
|
| 164.9 | % |
Other income |
|
| 34.2 |
|
|
| 77.4 |
|
|
| (43.2 | ) |
|
| (55.8 | )% |
Cost of revenues |
|
| 106.9 |
|
|
| 51.2 |
|
|
| 55.7 |
|
|
| 108.8 | % |
Selling, general and administrative expenses |
|
| 77.2 |
|
|
| 53.0 |
|
|
| 24.2 |
|
|
| 45.7 | % |
Depreciation and amortization expense |
|
| 50.7 |
|
|
| 42.2 |
|
|
| 8.5 |
|
|
| 20.1 | % |
Goodwill impairments |
|
| 6.0 |
|
|
| 7.0 |
|
|
| (1.0 | ) |
|
| (14.3 | )% |
Intangible asset impairments |
|
| 1.6 |
|
|
| 32.7 |
|
|
| (31.1 | ) |
|
| (95.1 | )% |
Operating income (loss) |
| $ | 74.4 |
|
| $ | (2.0 | ) |
| $ | 76.4 |
|
| NM |
| |
Revenues
Due to the triggering event in the first quarter of 2020 described above, management performed impairment assessments of our long-lived assets and indefinite-lived assets. The assessments resulted in the recognition of a non-cash impairment charge of $59.4 million, which included non-cash impairment charges for certain of our long-lived customer relationship and trade name intangible assets, and certain of our indefinite-lived trade name intangible assets of $13.2 million and $46.2 million, respectively. As a result of our annual impairment assessment as of October 31, 2020, management recorded a non-cash impairment charge of $17.4 million, which included non-cash impairment charges for certain of our long-lived customer relationship and trade name intangible assets, and certain of our indefinite-lived trade name intangible assets of $16.8 million and $0.6 million, respectively.
Commerce Segment
|
| Year Ended December 31, |
|
|
|
|
|
|
|
|
| |||||
|
| 2021 |
|
| 2020 |
|
| Variance $ |
|
| Variance % |
| ||||
|
| (dollars in millions) |
| |||||||||||||
|
|
|
|
|
|
|
|
|
|
|
|
|
|
|
|
|
Revenues |
| $ | 57.3 |
|
| $ | 56.9 |
|
| $ | 0.4 |
|
|
| 0.7 | % |
Other income |
|
| 59.3 |
|
|
| 70.3 |
|
|
| (11.0 | ) |
|
| (15.6 | )% |
Cost of revenues |
|
| 18.1 |
|
|
| 24.6 |
|
|
| (6.5 | ) |
|
| (26.4 | )% |
Selling, general and administrative expenses |
|
| 24.9 |
|
|
| 27.8 |
|
|
| (2.9 | ) |
|
| (10.4 | )% |
Depreciation and amortization expense |
|
| 24.0 |
|
|
| 21.9 |
|
|
| 2.1 |
|
|
| 9.6 | % |
Goodwill impairments |
|
| 7.2 |
|
|
| 367.5 |
|
|
| (360.3 | ) |
| NM |
| |
Intangible asset impairments |
|
| 30.1 |
|
|
| 45.9 |
|
|
| (15.8 | ) |
|
| (34.4 | )% |
Operating income (loss) |
| $ | 12.3 |
|
| $ | (360.5 | ) |
| $ | 372.8 |
|
| NM |
| |
Revenues
During the year ended December 31, 2021,2022, revenues for the CommerceConnections segment of $57.3$282.6 million increased by $0.4$175.9 million, or 0.7%164.9% from $56.9$106.7 million for the year ended December 31, 2020. 2021. The primary driver of the increase was $44.6$76.0 million in revenues related to livefrom events that staged primarily in the second half of 20212022 but were cancelled due to COVID-19 in the prior year. This increase was offset by a $38.7 million reduction from the cancellation of nearly all events scheduled to stage in the first half of 2021 due to COVID-19. The remaining $5.6 million decline inIn addition, recurring revenues was primarily due to a $4.1increased by $51.7 million, or 43.4%50.2%, decreasefrom $102.9 million in revenues from two events that staged in bothfiscal year 2021 and 2020. This decline was largely attributable to one event that staged pre-COVID in January 2020 and was the Company’s only large event to stage$154.6 million in the first halffiscal year 2022 and new launches generated revenues of 2021. This decrease was offset by a $1.1$6.6 million. New acquisitions generated incremental revenues of $41.6 million increase in print and digital advertising and virtual event revenues. Discontinued other marketing services representing $2.7 million of 2020 revenues also impacted the currentduring fiscal year results.2022.
Other Income
Other income of $59.3$34.2 million was recorded for the CommerceConnections segment related to event cancellation insurance proceeds during the year ended December 31, 2022. All $34.2 million was received during 2022.
Other income of $77.4 million was recorded for the Connections segment related to event cancellation insurance proceeds during the year ended December 31, 2021. All $59.3$57.5 million was received during 2021.
Other income of $70.3 million was recorded for the Commerce segment related to event cancellation insurance proceeds during the year ended December 31, 2020. Of the $70.3 million, $61.3 million was received and $9.0 million was confirmed by the insurance provider during 2020. All $9.0 million of insurance receivables for the Commerce segment as of December 31, 2020 were received in January 2021.
Cost of Revenues
During the year ended December 31, 2021,2022, cost of revenues for the CommerceConnections reportable segment decreased $6.5increased $55.7 million, or 26.4%108.8%, to $18.1$106.9 million from $24.6$51.2 million for the year ended December 31, 2020.2021. The primary driversdriver of the decrease were a $12.8 million decline in expense from events that were cancelled due to COVID-19 in 2021, but staged in 2020, a $1.7 million decline from events that were cancelled in both years due to COVID-19 and $1.0 million in cost savings from several small discontinued events. These declines were offset by $9.0 million inincrease was cost of revenues related to liveof $23.8 million from events that staged in 20212022 but were cancelled in 20202021 due to COVID-19. In addition, recurring cost of revenues increased by $12.5 million, or 27.8%, from $44.9 million in fiscal year 2021 to $57.4 million in fiscal year 2022 and new launches generated cost of revenues of $4.8 million. New acquisitions generated incremental cost of revenues of $14.6 million during fiscal year 2022.
Selling, General and Administrative Expenses
During the year ended December 31, 20212022 selling, general and administrative expenses for theCommerce Connections reportable segment decreased $2.9increased $24.2 million, or 10.4%45.7%, to $24.9$77.2 million from $27.8$53.0 million for the comparable period in 2020.2021. The decreaseincrease was primarily related to lowerhigher compensation, benefits, travel and benefitspromotional expense attributable to the centralization initiatives implemented over the prior year, lowerresuming a full schedule of events in 2022 and higher sales commissions and credit card fees related to lower revenues, avoided promotional and travel costs related to cancelled events, as well as credit card fee savings during the year ended December 31, 2021.higher revenues.
Depreciation and Amortization Expense
Depreciation and amortization expense attributable to the CommerceConnections segment of $24.0$50.7 million for the year ended December 31, 20212022 increased $2.1$8.5 million, or 9.6%20.1%, from $21.9$42.2 million for the year ended December 31, 2020.2021. The increase was due to higher amortization on the definite-lived trade name and customer relationship intangible assets.assets associated with the MJBiz and Advertising Week acquisitions.
52
Goodwill Impairments
During the first quarter of 2022, we recorded non-cash goodwill impairment charges of $6.0 million in connection with reporting units under the Connections segment in relation to our interim impairment assessment.
In connection with our 2021 annual impairment assessment, managementwe recorded a $7.2$7.0 million non-cash goodwill impairment charge related to reporting units under the CommerceConnections segment.
During 2020, we recorded $367.5 million non-cash goodwill impairment charges in connection with reporting units under the Commerce segment in relation to our interim and annual impairment assessments. Refer to the consolidated goodwill impairment discussion under the heading, Goodwill Impairment,Impairments, above in this Management’s Discussion and Analysis of Financial Condition and Results of Operations for further discussion on goodwill impairment.impairment.
Intangible Asset Impairments
In connection with our 2022 interim impairment assessment, we recorded a non-cash impairment charge of $1.6 million for intangible assets related to the Connections segment.
In connection with our 2021 annual impairment assessment, managementwe recorded a non-cash impairment charge of $30.1$32.7 million for intangible assets related to the CommerceConnections segment. The non-cash charges included $21.0 million for certain definite-lived customer relationship and trade names intangible assets, and $9.1 million for certain indefinite-lived trade name intangible assets.
In connection with the triggering event in the first quarter of 2020 described above, we performed impairment assessments of long-lived assets and indefinite-lived assets and recorded non-cash impairment charges related to long-lived assets and indefinite-lived intangible assets under the Commerce segment of $6.7 million and $24.0 million, respectively. In relation to our annual impairment assessment performed as of October 31, 2020, we recorded additional non-cash impairment charges related to related to long-lived assets under the Commerce segment of $15.2 million. During 2020, we recorded total non-cash impairment charges related to long-lived assets and indefinite-lived intangible assets under the Commerce segment of $21.9 million and $24.0 million, respectively.All Other Category
|
| Year Ended December 31, |
|
|
|
|
|
|
| |||||||
|
| 2022 |
|
| 2021 |
|
| Variance $ |
|
| Variance % |
| ||||
|
| (dollars in millions) |
| |||||||||||||
Revenues |
| $ | 43.3 |
|
| $ | 38.8 |
|
| $ | 4.5 |
|
|
| 11.6 | % |
Cost of revenues |
|
| 9.6 |
|
|
| 5.9 |
|
|
| 3.7 |
|
|
| 62.7 | % |
Selling, general and administrative expenses |
|
| 34.2 |
|
|
| 28.4 |
|
|
| 5.8 |
|
|
| 20.4 | % |
Depreciation and amortization expense |
|
| 4.3 |
|
|
| 3.1 |
|
|
| 1.2 |
|
|
| 38.7 | % |
Goodwill impairments |
|
| 0.3 |
|
|
| 0.2 |
|
|
| 0.1 |
|
| NM |
| |
Operating (loss) income |
| $ | (5.1 | ) |
| $ | 1.2 |
|
| $ | (6.3 | ) |
| NM |
| |
Revenues
Design and Technology Segment
|
| Year Ended December 31, |
|
|
|
|
|
|
|
|
| |||||
|
| 2021 |
|
| 2020 |
|
| Variance $ |
|
| Variance % |
| ||||
|
| (dollars in millions) |
| |||||||||||||
Revenues |
| $ | 55.4 |
|
| $ | 51.2 |
|
| $ | 4.2 |
|
|
| 8.2 | % |
Other income |
|
| 12.3 |
|
|
| 32.5 |
|
|
| (20.2 | ) |
|
| (62.2 | )% |
Cost of revenues |
|
| 27.0 |
|
|
| 25.7 |
|
|
| 1.3 |
|
|
| 5.1 | % |
Selling, general and administrative expenses |
|
| 22.4 |
|
|
| 23.0 |
|
|
| (0.6 | ) |
|
| (2.6 | )% |
Depreciation and amortization expense |
|
| 14.9 |
|
|
| 16.4 |
|
|
| (1.5 | ) |
|
| (9.1 | )% |
Goodwill impairments |
|
| — |
|
|
| 205.7 |
|
|
| (205.7 | ) |
| NM |
| |
Intangible asset impairments |
|
| 2.6 |
|
|
| 24.9 |
|
|
| (22.3 | ) |
| NM |
| |
Operating income (loss) |
| $ | 0.8 |
|
| $ | (212.0 | ) |
| $ | 233.0 |
|
| NM |
| |
Revenues
During the year ended December 31, 2021,2022, revenues for the Design and Technology segmentAll Other category of $55.4$43.3 million increased by $4.2$4.5 million, or 8.2%11.6%, from $51.2$38.8 million for the year ended December 31, 2020. The primary drivers2021. Revenues related to our commerce business of the increase were $34.1$15.4 million during fiscal year 2022 increased by $4.4 million, or 39.4%, from $11.0 million in fiscal year 2021, as a result of growth in our Elastic Suite e-commerce business and revenues related to live events that staged primarily in the second halfour content business of 2021 but were cancelled due to COVID-19 in the prior$27.9 million during fiscal year and an increase of $0.72022 increased by $0.2 million, or 20.9%0.7%, for live events that stagedfrom $27.7 million in both years. These increases were partially offset by a $30.3 million reduction from the cancellation of nearly all live events scheduled to stage in the first half of 2021 due to COVID-19.
Other Incomefiscal year 2021.
Other income of $12.3 million was recorded for the Design and Technology segment related to event cancellation insurance claims during the year ended December 31, 2021. All $12.3 million was received during 2021.
Other income of $32.5 million was recorded for the Design and Technology segment related to event cancellation insurance claims proceeds during the year ended December 31, 2020. Of the $32.5 million, $24.8 million was received and $7.7 million was confirmed by the insurance provider during 2020. All $7.7 million of insurance receivables for the Technology and Design segment as of December 31, 2020 were received in January 2021.
Cost of Revenues
During the year ended December 31, 2021,2022, cost of revenues for the Design and Technology segmentAll Other category of $27.0$9.6 million increased by $1.3$3.7 million, or 5.1%62.7%, from $25.7$5.9 million for the year ended December 31, 2020. The primary drivers2021. Cost of the increase were $15.8 millionrevenues related to live events that staged primarilyour commerce business of $4.5 million during fiscal year 2022 increased by $3.3 million, or 275.0%, from $1.2 million in the second half of 2021 but were cancelled due to COVID-19 in the prior year. These increases were partially offset by a $14.3 million reduction from the cancellation of nearly all events scheduled to stage in the first half offiscal year 2021 due to COVID-19. the continued growth of our Elastic Suite e-commerce business and cost of revenues related to our content business of $5.1 million during fiscal year 2022 increased by $0.4 million, or 8.5%, from $4.7 million in fiscal year 2021.
Selling, General and Administrative Expenses
During the year ended December 31, 2021, selling, general and administrative expenses for the Design and Technology segment of $22.4 million decreased by $0.6 million, or 2.6%, from $23.0 million for the year ended December 31, 2020. The decrease was primarily related to lower compensation and benefits expense attributable to the centralization initiatives implemented over the prior year, lower external commission expense, as well as credit card fee savings during the year ended December 31, 2021, partly offset by higher marketing costs.
Depreciation and Amortization Expense
During the year ended December 31, 2021, depreciation and amortization expense for the Design and Technology segment of $14.9 million decreased $1.5 million, or 9.1%, from $16.4 million for the year ended December 31, 2020. The decrease was due to lower amortization on the definite-lived trade name and customer relationship intangible assets which were impaired in the first and fourth quarters of 2020.
Goodwill Impairments
During 2020, we recorded $205.7 million non-cash goodwill impairment charges in connection with reporting units under the Design and Technology segment in relation to our interim and annual impairment assessments. Refer to the consolidated goodwill impairment discussion under the heading, Goodwill Impairment, above in this Management’s Discussion and Analysis of Financial Condition and Results of Operations for further discussion on goodwill impairment.
Intangible Asset Impairments
In connection with our 2021 annual impairment assessment, management recorded a non-cash impairment charge of $2.6 million for intangible assets related to the Design and Technology segment. The non-cash charges included a $2.6 million for certain indefinite-lived trade name intangible assets.
In connection with the triggering event in the first quarter of 2020, we performed impairment assessments of long-lived assets and indefinite-lived assets and recorded non-cash impairment charges related to long-lived assets and indefinite-lived intangible assets under the Design and Technology segment of $5.7 million and $17.0 million, respectively. In relation to our 2020 annual impairment assessment performed as of October 31, 2020, we recorded additional non-cash impairment charges of $1.6 million and $0.6 million, in connection with long-lived assets and indefinite-lived intangible assets, respectively, under the Design and Technology segment. During 2020, we recorded total non-cash impairment charges related to long-lived assets and indefinite-lived intangible assets under the Design and Technology segment of $7.3 million and $17.6 million, respectively.
All Other Category
|
| Year Ended December 31, |
|
|
|
|
|
|
|
|
| |||||
|
| 2021 |
|
| 2020 |
|
| Variance $ |
|
| Variance % |
| ||||
|
| (dollars in millions) |
| |||||||||||||
Revenues |
| $ | 32.8 |
|
| $ | 19.3 |
|
| $ | 13.5 |
|
|
| 69.9 | % |
Other income |
|
| 5.8 |
|
|
| 4.2 |
|
|
| 1.6 |
|
|
| 38.1 | % |
Cost of revenues |
|
| 10.4 |
|
|
| 7.3 |
|
|
| 3.1 |
|
|
| 42.5 | % |
Selling, general and administrative expenses |
|
| 27.4 |
|
|
| 13.3 |
|
|
| 14.1 |
|
| NM |
| |
Depreciation and amortization expense |
|
| 6.3 |
|
|
| 7.4 |
|
|
| (1.1 | ) |
|
| (14.9 | )% |
Goodwill impairments |
|
| — |
|
|
| 30.2 |
|
|
| (30.2 | ) |
| NM |
| |
Intangible asset impairments |
|
| — |
|
|
| 6.0 |
|
|
| (6.0 | ) |
| NM |
| |
Operating loss |
| $ | (5.5 | ) |
| $ | (40.7 | ) |
| $ | 35.2 |
|
|
| (86.5 | )% |
Revenues
During the year ended December 31, 2021, revenue attributable to the All Other category of $32.8 million increased by $13.5 million, or 69.9%, from $19.3 million for the year ended December 31, 2020. The primary drivers of the increase were incremental revenues of $14.4 million from the acquisitions of PlumRiver and Sue Bryce, which closed in December 2020 and April 2021, respectively, $6.3 million of revenue from events that staged during 2021, but were cancelled due to COVID-19 in the prior year, and a $1.3 million organic revenues increase, primarily related to print and digital advertising business. These increases were offset by $6.7 million for events that staged in 2020 but were cancelled due to COVID-19 in 2021 and a $1.6 million decline attributable to discontinued other marketing services.
Other Income
Other income of $5.8 million was recorded for the All Other category related to event cancellation insurance claims proceeds during the year ended December 31, 2021. All $5.8 million was received during 2021.
Other income of $4.2 million was recorded for All Other category related to event cancellation insurance claims proceeds during the year ended December 31, 2020. Of the $4.2 million, $3.0 million was received and $1.2 million was confirmed by the insurance provider during 2020. All $1.2 million of insurance receivables for the All Other category as of December 31, 2020 were received in January 2021.
Cost of Revenues
During the year ended December 31, 2021, cost of revenues attributable to the All Other category of $10.4 million increased by $3.1 million, or 42.5%, from $7.3 million for the year ended December 31, 2020. The primary drivers of the increase were $2.3 million in additional expense for events that staged during the current year, but were cancelled due to COVID-19 in 2020, and incremental costs of $2.0 million from the acquisitions of PlumRiver and Sue Bryce, which closed in December 2020 and April 2021, respectively. These increases were partly offset by decreases of $0.6 million in expense related to events that were either cancelled due to COVID-19 during the current year, but staged in 2020 or cancelled in both years due to COVID-19, and a decrease of $0.5 million in expense related to discontinued virtual events and other marketing services.
Selling, General and Administrative Expenses
During the year ended December 31, 2021,2022, selling, general and administrative expenses for the All Other category of $27.4$34.2 million increased by $14.1$5.8 million, or 20.4%, from $13.3$28.4 million for the year ended December 31, 2020.2021. The increase in selling, general and administrative expense was primarily driven byattributable to higher compensation, benefits, travel and consulting expense attributable to the acquisitionscontinued ramp of PlumRiver and Sue Bryce in December 2020 and April 2021, respectively.our commerce business.
53
Depreciation and Amortization Expense
DepreciationDuring the year ended December 31, 2022, depreciation and amortization expense for the All Other category of $6.3$4.3 million increased $1.2 million, or 38.7%, from $3.1 million for the year ended December 31, 2021 decreased $1.1 million, or 14.9%, from $7.4 million for2021. The increase was due to higher amortization of software development costs related to our commerce business.
Goodwill Impairments
During the year ended December 31, 2020. The decrease was due to lower amortization on the definite-lived trade name and customer relationship intangible assets which were impaired in the first and fourth quarters of 2020.
Goodwill Impairments
During 2020,2022, we recorded $0.3 million in non-cash goodwill impairment charges of $30.2 million in connection with reporting units under the All Other category in relation to our interim andimpairment assessment.
During the year ended December 31, 2021, we recorded $0.2 million in non-cash goodwill impairment charges in connection with reporting units under the All Other category in relation to our annual impairment assessments. assessment.
Refer to the consolidated goodwill impairment discussion under the heading, Goodwill Impairment, above in this Management’s Discussion and Analysis of Financial Condition and Results of Operations for further discussion on goodwill impairment.
Intangible Asset ImpairmentsCorporate
|
| Year Ended December 31, |
|
|
|
|
|
|
| |||||||
|
| 2022 |
|
| 2021 |
|
| Variance $ |
|
| Variance % |
| ||||
|
| (dollars in millions) |
| |||||||||||||
Other income, net |
| $ | 148.6 |
|
| $ | — |
|
| $ | 148.6 |
|
| NM |
| |
Selling, general and administrative expenses |
|
| 33.6 |
|
|
| 61.6 |
|
|
| (28.0 | ) |
|
| (45.5 | )% |
Depreciation and amortization expense |
|
| 4.5 |
|
|
| 2.3 |
|
|
| 2.2 |
|
|
| 95.7 | % |
Operating income (loss) |
| $ | 110.5 |
|
| $ | (63.9 | ) |
| $ | 174.4 |
|
|
| (272.9 | )% |
Other Income, net
In connection with the triggering event in the first quarter of 2020 described above, we performed impairment assessments of long-lived assets and indefinite-lived assets and recorded non-cash impairment charges related to long-lived assets and indefinite-lived intangible assets under the All Other category of $0.8 million and $5.2 million, respectively.
Corporate
|
| Year Ended December 31, |
|
|
|
|
|
|
|
|
| |||||
|
| 2021 |
|
| 2020 |
|
| Variance $ |
|
| Variance % |
| ||||
|
| (dollars in millions) |
| |||||||||||||
Selling, general and administrative expenses |
| $ | 68.3 |
|
| $ | 54.5 |
|
| $ | 13.8 |
|
|
| 25.3 | % |
Depreciation and amortization expense |
|
| 2.4 |
|
|
| 2.9 |
|
|
| (0.5 | ) |
|
| (17.2 | )% |
Total operating expenses |
| $ | 70.7 |
|
| $ | 57.4 |
|
| $ | 13.3 |
|
|
| 23.2 | % |
Selling, General and Administrative Expenses
During the year ended December 31, 2021,2022, other income, net for the Corporate category was $148.6 million and was related to a one-time insurance litigation settlement. The one-time settlement payment was not specifically attributable to any of our outstanding event cancellation insurance claims and therefore was not recorded at the segment level.
Selling, General and Administrative Expenses
During the year ended December 31, 2022, selling, general and administrative expenses of $68.3$33.6 million for corporate-level activity increaseddecreased by $13.8$28.0 million, or 25.3%45.5%, from $54.5$61.6 million for the year ended December 31, 2020.2021. The increasedecrease in selling, general and administrative expense was primarily driven by higher compensation and benefits expense, higher stock-based compensation costs and higher transition costs, including one-time severance expense.$33.3 million in non-cash gains related to the remeasurement of contingent consideration liabilities.
Depreciation and Amortization Expense
Depreciation and amortization expense relating to corporate-level activity of $2.4$4.5 million for the year ended December 31, 2021 decreased $0.52022 increased $2.2 million, or 17.2%95.7%, from $2.9$2.3 million for the year ended December 31, 2020.2021. The increase was related to loss on disposal of fixed assets related to office closures which occurred in fiscal year 2022.
Interest Expense; Loss on Disposal of Fixed Assets; Benefit from Income Taxes; Net Loss and Comprehensive Loss; Adjusted EBITDA
Interest Expense
Interest expense of $15.8$24.5 million for the year ended December 31, 2021 decreased $4.82022 increased $8.6 million, or 23.3%54.1%, from $20.6$15.9 million for the year ended December 31, 2020.2021. The decreaseincrease was primarily attributable to a decreasean increase in the
54
variable interest rate on our Amended and Restated Term Loan Facility, for which the average rate during 20212022 was 2.60%4.26%, compared to 3.28%2.60% during 2020,2021.
Interest Income
Interest income of $2.7 million for the year ended December 31, 2022 increased $2.6 million, from $0.1 million for the year ended December 31, 2021. The increase was primarily attributable to an increase in our cash balance due to the receipt of event cancellation insurance claim and a $0.9insurance litigation settlement proceeds as well as rising interest rates throughout 2022.
Loss on Disposal of Fixed Assets
Loss on Disposal of Fixed Assets for the year ended December 31, 2022 decreased 100.0% from $0.4 million for the year ended December 31, 2021. The decrease in interest expense relatedwas primarily attributable to lower borrowings under the Amendeddisposal of leasehold improvements and Restated Revolving Credit Facility.other fixed assets associated with two office operating leases the Company abandoned during fiscal year 2021.
Benefit fromProvision for (benefit from) Income Taxes
For the years ended December 31, 20212022 and 2020,2021, we recorded a provision for income taxes of $27.2 million and a benefit from income taxes of $1.3 million, and $57.6 million, respectively. The decreaseincrease in our benefit fromprovision for income taxes of $56.2$28.5 million for the year ended December 31, 20212022 compared to the prior year was primarily attributable to the impact of lower non-cash charges related to goodwill and intangible asset impairments, offset by lowerhigher other income, net from event cancellation insurance claim and higher operating losses incurred as a resultinsurance litigation settlement proceeds.
Net Income (Loss) and Comprehensive Income (Loss)
Net income and comprehensive income of the continued impact of the COVID-19 pandemic.
Net Loss
Net loss of $78.1$130.8 million for the year ended December 31, 2021 decreased $555.52022 increased $210.5 million from net loss and comprehensive loss of $633.6$79.7 million for the year ended December 31, 2020.2021. The key drivers of the decreaseincrease in net lossincome and comprehensive income were the higher revenues attributable to executing a full schedule of events in 2022, the increase in other income, net related to event cancellation insurance claim and insurance litigation settlement proceeds during 2022 and decreases in non-cash goodwill and intangible asset impairment charges, and interest expense, partly offset by higher cost of revenues, depreciation and amortization and interest expenses as well as the higher corporate overhead expense and lower benefits fromincrease in provision for income taxes described above.
Adjusted EBITDA
Total Adjusted EBITDA of $45.7$239.6 million for the year ended December 31, 2021 decreased $26.22022 increased $195.5 million, or 36.4%443.3%, from $71.9$44.1 million for the year ended December 31, 2020.2021. The decreaseincrease in Adjusted EBITDA was primarily attributable to lowerhigher other income, net related to event cancellation insurance claim and insurance litigation settlement proceeds received or confirmed during the year as well as lower operatingthe profits asgenerated from executing a resultfull schedule of the continued impact of the COVID-19 pandemic.events in 2022.
Adjusted EBITDA is a financial measure that is not calculated in accordance with GAAP. For a discussion of our presentation of Adjusted EBITDA, see footnoteFootnote 4 to the table under the heading “Results of Operations - Operations—Comparison of the Year Ended December 31, 20212022 to the Year Ended December 31, 2020”2021”.
Liquidity and Capital Resources
Liquidity describes the ability of a company to generate sufficient cash flows to meet the cash requirements of its business operations, including working capital needs, debt service, acquisitions, other commitments and contractual obligations. We consider liquidity in terms of cash flows from operations and their sufficiency to fund our operating and investing activities.
In March 2020, the World Health Organization categorized the Coronavirus Disease 2019 (“COVID-19”) as a pandemic,Impact of COVID-19 Pandemic and the President of the United States declared the COVID-19 outbreak a national emergency. In conjunction with this declarationRelated Insurance Coverage
55
The unprecedented and therapid spread of COVID-19 acrossand the United States, recommendationsrelated government restrictions and mandates were handed down by various local, state and federal government agencies regarding social distancing containment areas and against large gatherings, as well as quarantine requirements. In addition, travel restrictions were imposed bymeasures implemented in the United States and foreign governments, and by companies with respect to their employees, and various event venues announced indefinite closures. As a result of these and various other factors, management madethroughout the decision to cancel substantially all of our face-to-face events scheduledworld significantly impacted Emerald’s business from mid-March 2020 through the end of 2020. In addition, beginningfiscal year 2021. Late in October 2020, management announced the cancellation or postponementsecond quarter of numerous2021, we began to see positive impacts of successful vaccination rollouts in many countries, with social distancing restrictions easing and live events that were scheduled forresuming in the firstUnited States. In the second half of 2021, including all but several relatively smallEmerald’s live events staging inbusiness experienced a meaningful restart with the first six monthssuccessful execution of 2021. Following the reopening of most major municipalities in the United States in June 2021, we traded 56 in-person events. As expected, the continued effectsevents, serving more than 129,000 attendees and 7,500 exhibiting companies. We have since been able to stage a full slate of COVID-19 related issues such as international travel restrictionsevents in each of 2022 and the need2023, successfully trading 124 and 141 in-person events, respectively, and serving approximately 393,000 and 516,000 attendees and 17,800 and 21,000 exhibiting companies, respectively. While we have been able to postpone severalresume our full schedule of events, negatively impacted the financial results of the Company’s fiscal year 2021. While travel restrictions on international travelers to the United States were lifted in the fourth quarter of 2021, the ongoing effects of COVID-19 on the Company’sour operations and event calendar have had, and willmay continue to have, a material negative impact on itsour financial results and liquidity, and such negative impact may continue beyond the containment of such outbreak.
liquidity. The assumptions used to estimate our liquidity are subject to greater uncertainty because we have never previously cancelled or postponed all upcoming events for a period of over a year due to a pandemic where the timing for resolution and ultimate impact of the pandemic remains uncertain. Management cannot estimatepredict with certainty (i) when we will be able to resume full event operations and, once resumed, (ii) whether event exhibitors and attendees will attend our events.events in numbers similar to pre-pandemic editions. Therefore, current estimates of revenues and the associated impact on liquidity
could differ materiallysignificantly in the future. As a consequence, management cannot estimate the ultimate impact on our business, financial condition or near or longer term financial or operational results.
On August 3, 2022, we reached an agreement to settle outstanding insurance litigation relating to event cancellation insurance for proceeds of $148.6 million. During the years ended December 31, 20202023, 2022 and 2021, we implemented several actionsrecorded other income, net of $2.8 million, $182.8 million and $77.4 million, respectively, related to preserve cashevent cancellation insurance claim and strengthensettlement proceeds deemed to be realizable by our management. All such amounts were received during the Company’s liquidity position, including, but not limited to:respective periods in which they were recorded.
|
|
|
|
|
|
|
|
Further, Emerald maintains event cancellation insurance to protect against losses due to the unavoidable cancellation, postponement, relocation and enforced reduced attendance at events due to certain covered events. Specifically, for the policies covering calendar years 2021 and 2020, Emerald iswas insured for losses due to event cancellations caused by the outbreak of communicable diseases, including COVID-19. However, Emerald’s renewed event cancellation insurance policies for the calendar yearpolicy years beginning in 2022 do not cover losses due to event cancellations caused by the outbreak of communicable diseases, including COVID-19. In addition, coverage for each of our event cancellation insurance policies extends to include additional promotional and marketing expenses necessarily incurred by us should a covered loss occur. These policies also include a terrorism endorsement covering an act of terrorism and/or threat of terrorism directed at the insured event or within the United States or its territories. The aggregate limit under thesefor our renewed 2023 and 2022 primary event cancellation insurance policiespolicy is approximately $191.1 million in 2020, $191.4 million in 2021 and $100.0 million in 2022for each year, if losses arise for reasons within the scope of these policies.
In addition to these primary policies, Emerald maintainsWe also obtained a similar separate event cancellation insurance policiespolicy for the Surf Expo Summer 2020, Surf Expo Winter 2021, Surf Expo Winter 20222023 and Surf Expo Summer 20222023 shows, with respectivea coverage limitslimit of $6.0 million, $7.7 million, $8.4 million and $6.5 million. Similar to the primary event cancellation insurance policies,$6.9 million for each respective event. We have obtained similar coverage for the outbreak of communicable disease, including COVID-19, is included for the policies covering Surf Expo Summer 2020 and Surf Expo Winter 2021, but not included for the policies covering Surf Expo Winter 2022 and Surf Expo Summer 2022.
We are in the process of pursuing claims under the 2021 and 2020 event cancellation insurance policies to offset the financial impact of cancelled and postponed events as a result of COVID-19. To date, we have submitted claims related to impacted or cancelled events previously scheduled to take place in 2020 and 2021 of approximately $167.0 million and $82.3 million, respectively. Other income recognized to date, related to insurance proceeds received or confirmed on the claims related to events previously scheduled to take place in 2021 and 2021, totaled $43.0 million and $141.4 million, respectively. During the years ended December 31, 2021 and 2020, the Company recorded Other income of $77.4 million and $107.0 million, respectively, related to event cancellation insurance claim proceeds deemed to be realizable. Allstaged during 2024.
Credit Facility Amendments
On February 2, 2023, Emerald X entered into a Fifth Amendment (the “RCF Amendment”) to its Amended and Restated Credit Agreement, which amended the previously existing Amended and Restated Credit Agreement, dated as of the $77.4 million in Other income was received in 2021. Outstanding claims are subjectMay 22, 2017, as amended prior to review and adjustment and there is no guarantee or assurance as to the amount or timing of future recoveries from Emerald’s event cancellation insurance policies.
On March 27, 2020, the U.S. government enacted the Coronavirus Aid, Relief, and Economic Security Act (“CARES Act”), which provides for the ability of employers to delay payment of employer payroll taxes during 2020 after the date of enactment. As a result, the payment approximately $1.8RCF Amendment. The RCF Amendment increased the aggregate amount of all revolving commitments under the Amended and Restated Credit Agreement from $100.4 million of our employer payroll taxes otherwise due in 2020 will be delayed, with 50% dueto $110.0 million (such facility, as amended by December 31, 2021 and the remaining 50% due by December 31, 2022. RCF Amendment, the “Extended Revolving Credit Facility”). The Company paid $0.9 millionincreased revolving commitments have the same terms as the existing revolving commitments. The RCF Amendment did not change any other material terms of the deferred employer payroll taxes in December 2021.Amended and Restated Credit Agreement.
On June 12, 2023, Emerald X entered into a Sixth Amendment (the “Term Loan Amendment”) to the Amended and Restated Credit Agreement, The Term Loan Amendment extended the maturity of the term loans outstanding under the Amended and Restated Credit Agreement (the extended term loan facility, the “Extended Term Loan Facility”) from May 22, 2024 to May 22, 2026. The Term Loan Amendment replaced the interest rate applicable to the term loans under the Amended and Restated Credit Agreement with a rate equal to, at the option of Emerald X, (i) the Term Secured Overnight Financing Rate (“Term SOFR”) plus 5.00% per annum plus a credit spread adjustment of 0.10% per annum or (ii) an alternate base rate (“ABR”) plus 4.00% per annum. Prior to the Term Loan Amendment, the interest rate applicable to the term loans under the Amended and Restated Credit Agreement was a rate equal to, at the option of Emerald X (i) LIBOR plus 2.75% or 2.50% per annum, depending on Emerald X’s first lien net leverage ratio or (ii) ABR plus 1.75% or 1.50% per annum, depending on Emerald X’s first lien net leverage ratio. The Term Loan Amendment additionally reset scheduled quarterly payments, each equal to 0.25% of the original principal amount of the Extended Term Loan Facility.
56
As of December 31, 2021,2023, we had $519.7$402.9 million of borrowings outstanding under the Amended and RestatedExtended Term Loan Facility, which includedwas recorded net of unamortized discount of $8.9 million, and net of unamortized deferred financing fees of $1.9 million and unamortized original issue discount of $1.4 million, with an additional $109.0 million available to borrow (after giving effect to $1.0 million letters of credit outstanding) under the Amended and Restated Revolving Credit Facility.$1.5 million. Borrowings under our Amended and RestatedExtended Term Loan Facility are subject to mandatory prepayments under specified circumstances, including 50.0%50% of Excess Cash Flow, subject to step-downs to 25% and 0% of excess cash flow at certain leverage based thresholds, and with 100% of the net cash proceeds of asset sales and casualty events in
excess of certain thresholds (subject to certain reinvestment rights). If these thresholds are triggered, we would be required to make these mandatory prepayments. See “--Long-Term Debt-Amended and Restated Senior Secured Credit Facilities”“—Long-Term Debt” below for more detail regarding the terms of our Amended and Restated Senior Secured Credit Facilities.
Based on these actions,our return to positive operating cash flows, current cash position and assumptions regarding the impact of COVID-19, as well as revolving commitments available to us under the Amended and expected insurance recoveries,Restated Senior Secured Credit Facilities, we believe that the Company’sour current financial resources will be sufficient to fund itsthe Company's liquidity requirements for at least the next twelve months.
Dividend Policy
We paid a dividend of $0.0725 per share in the first quarter of 2019 and $0.0750 per share in each of the second, third and fourth quarters of 2019 and first quarter of 2020. On March 20, 2020, due to the negative impact of COVID-19 on our business, our Board of Directors temporarily suspended the Company’sour regular quarterly cash dividend on its common stock. The payment of any such dividend in future quarters is subject to the discretion of our boardBoard of directorsDirectors and depending upon our results of operations, cash requirements, financial condition, contractual restrictions, restrictions imposed by applicable laws and other factors that our boardBoard of directorsDirectors may deem relevant, and the amount of any future dividend payment may be changed or terminated in the future at any time and for any reason without advance notice.
Our business is conducted through our subsidiaries. Dividends, distributions and other payments from, and cash generated by, our subsidiaries will be our principal sources of cash to repay indebtedness, fund operations and pay dividends. Accordingly, our ability to pay dividends to our stockholders is dependent on the earnings and distributions of funds from our subsidiaries. In addition, the covenants in the agreements governing our existing indebtedness, including the Amended and Restated Senior Secured Credit Facilities, significantly restrict the ability of our subsidiaries to pay dividends or otherwise transfer assets to us. See “—Long-Term Debt”, “Risk Factors—Risks Relating to Ownership of Our Common Stock—Because we are a holding company with no operations of our own, we rely on dividends, distributions, and transfers of funds from our subsidiaries” and “Risk Factors—Risks Relating to Ownership of Our Common Stock—We cannot assure you that we will continue to pay dividends on our common stock, and our indebtedness could limit our ability to pay dividends on our common stock.”
Each share of our outstanding redeemable convertible preferred stock accumulates dividends at a rate per annum equal to 7% of the accreted liquidation preference, which compounds quarterly by adding to the accreted liquidation preference until July 1, 2023 and thereafter, at our option, may be paid either in cash or by adding to the accreted liquidation preference. For each of the quarterly periods ended September 30, 2023 and December 31, 2023, we elected to pay dividends on the redeemable convertible preferred stock in cash. The aggregate amount of such dividends was $8.6 million in each of the quarterly periods ended September 30 and December 31, 2023. We may elect the form of future quarterly dividends on a quarter-by-quarter basis. There can be no assurance that we will continue to pay such quarterly dividends in cash in future periods.
Share Repurchases
OurIn November 2023, our Board of Directors approved a $30.0 millionan extension and expansion of our previously-announced share repurchase program, in the third quarter of 2019. We settledallowing for the repurchase of 853,557 sharesup to $25.0 million of our common stock for $8.3 million during the year endedthrough December 31, 2019. The $30.0 million share repurchase program was discontinued in2024, subject to early termination or extension by the first quarter of 2020.
On October 5, 2020, our Board of DirectorsDirectors. This approval extends and expands the previously authorized and approved a new $20.0 million share repurchase program (the “October 2020 share repurchase program”.that was effective through December 31, 2023. Share repurchases under the extended plan may be made from time to time through and including December 31, 2021,2024, subject to early termination or extension by the Board of Directors, through open market purchases, block transactions, privately negotiated purchases or otherwise. The Company repurchased 2,498,118 shares for $12.4 million during the year ended December 31, 2021 under this repurchase program. There was $6.8 million remaining available for share repurchases under the October 2020 Share Repurchase Program as of December 31, 2021.
On October 29, 2021, our Board of Directors approved extension and expansion of the October 2020 share repurchase program, which allows for the repurchase of $20.0 million of our Common Stock through December 31, 2022, subject to early termination or extension by the Board of Directors. The share repurchase program may be suspended or discontinued at any time without notice. There is no minimum number of shares that we are required to repurchase. Shares may be purchased from time to time in the open market, including pursuant to one or more Rule 10b5-1 purchase plans that we may enter into from time to time, or in privately negotiated transactions. Such purchases will be at times and in amounts as we deem appropriate, based on factors such as market conditions, legal requirements and other business considerations.
57
We repurchased an aggregate of 5,064,140 shares of common stock for $16.9 million under the share repurchase program during the year ended December 31, 2023. There was $25.0 million remaining available for share repurchases under the share repurchase program as of December 31, 2023.
During the year ended December 31, 2022, we repurchased an aggregate of 2,882,841 shares of common stock for $10.4 million under the repurchase program as then in effect.
58
Cash Flows
The following table summarizes the changes to our cash flows for the periods presented:
|
| Year Ended December 31, |
| |||||||||
|
| 2023 |
|
| 2022 |
|
| 2021 |
| |||
|
| (unaudited) |
| |||||||||
Statement of Cash Flows Data |
| (dollars in millions) |
| |||||||||
Net cash provided by operating activities |
| $ | 40.3 |
|
| $ | 175.1 |
|
| $ | 90.0 |
|
Net cash used in investing activities |
| $ | (21.0 | ) |
| $ | (47.9 | ) |
| $ | (131.9 | ) |
Net cash (used in) financing activities |
| $ | (54.2 | ) |
| $ | (119.3 | ) |
| $ | (22.2 | ) |
|
| Year Ended December 31, |
| |||||||||
|
| 2021 |
|
| 2020 |
|
| 2019 |
| |||
|
| (unaudited) |
| |||||||||
Statement of Cash Flows Data |
| (dollars in millions) |
| |||||||||
Net cash provided by (used in) operating activities |
| $ | 90.0 |
|
| $ | (37.1 | ) |
| $ | 67.8 |
|
Net cash used in investing activities |
| $ | (131.9 | ) |
| $ | (37.3 | ) |
| $ | (16.7 | ) |
Net cash (used in) provided by financing activities |
| $ | (22.2 | ) |
| $ | 360.1 |
|
| $ | (62.0 | ) |
Operating Activities
Operating activities consist primarily of net loss(loss) income adjusted for noncash items that include goodwill and intangible asset impairments, depreciation and amortization, deferred income taxes, amortization of deferred financing fees and debt discount, share-based compensation, plus the effect of changes during the period in our working capital.
Net cash provided by operating activities for the year ended December 31, 2021 increased $127.12023 decreased $134.8 million to $90.0$40.3 million, from $175.1 million during the year ended December 31, 2022. The decrease was primarily due to a $139.0 million decrease in net (loss) income to a net loss of $8.2 million in fiscal year 2023 from net income of $130.8 million in fiscal year 2022, primarily as a result of event cancellation insurance claim and insurance litigation settlement proceeds during the prior year as well as higher cash used for working capital of $8.2 million during 2023. The increase in cash used for working capital was primarily due to the current year payment of liabilities related to the receipt of event cancellation insurance claim proceeds and insurance litigation settlement proceeds in fiscal year 2022. These decreases to cash provided by operating activities were partly offset by a $12.4 million increase in non-cash adjustments to net loss in 2023.The increase in non-cash adjustments to net loss was primarily attributable to a $31.0 million reduction during the current year in gains from remeasurement of contingent consideration, current year loss on debt extinguishment of $2.3 million and a $2.0 million increase in stock-based compensation offset by a $14.5 million decrease in depreciation and amortization expense as well as the lack of any goodwill or intangible asset impairment add-backs in the current fiscal year.
Net cash provided by operating activities for the year ended December 31, 2022 increased $85.1 million to $175.1 million provided by operating activities, from $37.1$90.0 million used inprovided by operating activities during the year ended December 31, 2020.2021. The increase was primarily due todriven by a $150.8$210.5 million increase in cash generated by working capital,net income to net income of $130.8 million from $62.9net loss of $79.7 million in cash generated by working capital during the current year compared to the use of $87.9 million in cash for working capital during the year ended December 31, 2020. This increase was primarily attributable to higher deferred revenues, partially offset by higher accounts receivable, related to increased sales activity2021 as our live events begin to emerge from the COVID-19 pandemic as well as the receipta result of event cancellation insurance claim proceeds during the current year. TheseThis increase was partly offset by an increase in cash used for working capital improvements were partiallyof $68.9 million and a decrease in non-cash adjustments of $56.5 million. The working capital decline represented cash used for working capital of $4.4 million in the current year from cash generated by working capital of $64.5 million during the year ended December 31 2021. The working capital decline was primarily attributable to lower cash from deferred revenues of $37.6 million, and $17.8 million lower cash inflows from insurance receivables. While the increase in deferred revenues during 2022 is a sign of Emerald's continued recovery from the COVID-19 pandemic, the increase in sales in the second half of 2021 generated a more significant increase in the prior year. In addition, lower cash inflows from accounts payable during 2022 was a result of an unusually low accounts payable and other current liabilities balance at the end of 2020, which was a result of low business activities due to COVID-19. Our return to staging live events in the second half of 2021 resulted in an unusually significant increase in accounts payable and other current liabilities during 2021. Our operations have continued to return to a more normal cadence during 2022, resulting in lower cash from accounts payable and other current liabilities in the current year. Non-cash adjustments declined $56.5 million to non-cash adjustments of $48.7 million in the current year from $105.2 million during the year December 31, 2021. The decline in non-cash adjustments was driven by remeasurement of contingent consideration and lower intangible asset impairment partly offset by refunds paidan increase in depreciation and amortization driven by the amortization of intangible assets primarily related to customers for live events that were cancelled or postponed due to COVID-19 during 2020 and 2021.the 2021 acquisitions. Net lossincome (loss) and non-cash adjustments to net lossincome generated $27.1$179.5 million in cash during the year ended December 31, 20212022 compared to $50.8$25.5 million in cash generated during the prior year. The primary driver of this declineincrease was lower non-cash goodwill and impairment addbacks offset by lower net loss and deferred income tax benefit addbacks during the current year.
Net cash used in operating activities for the year ended December 31, 2020 decreased $104.9 million to $37.1 million used in operating activities, from $67.8 million provided by operating activities during the year ended December 31, 2019. The decrease was primarily due to a $583.6 millionan increase in net loss and a $70.1income (loss) of $210.5 million increase in cash used for working capital. These were partially offset by a $548.8 million increase in non-cash reconciling adjustments driven by increases in non-cash goodwill andlower add-back for intangible asset impairment chargesand higher non-cash adjustment related to the gain from remeasurement of $534.3 million and $59.8 million, respectively, partly offset by decreases of $42.7 million for deferred income taxes and $3.4 million for depreciation and amortization.contingent consideration.
59
Investing Activities
Investing activities consist of business acquisitions and purchases of other productive assets, investments in information technology and capital expenditures to furnish or upgrade our offices.
Net cash used in investing activities for the year ended December 31, 2021 increased $94.62023 decreased $26.9 million to $131.9$21.0 million from $37.3$47.9 million in the year ended December 31, 2020.2022. The increasedecrease was primarily due to increaseda decrease in aggregate cash used for business acquisitions during the year ended December 31, 20212023 of $125.3$9.5 million compared to $33.3$37.6 million in the prior year. The Company completed one and two business acquisitions in the years ended December 31, 2023 and 2022, respectively.
Net cash used in investing activities for the year ended December 31, 2022 decreased $84.0 million to $47.9 million from $131.9 million in the year ended December 31, 2021. The decrease was primarily due to a decrease in aggregate cash used for business acquisitions during the year ended December 31, 2022 of $37.6 million compared to $125.3 million during the year ended December 31, 2021. The Company completed two business acquisitions in each of the years ended December 31, 20212022 and 2020. Net cash used in investing activities for the year ended December 31, 2020 increased $20.6 million, or 123.4%, to $37.3 million from $16.7 million in the year ended December 31, 2019. The increase was due to increased cash used for business acquisitions during the year ended December 31, 2020 compared to the
prior year. In the year ended December 31, 2020, we completed two acquisitions for cash consideration of $33.3 million, while during the year ended December 31, 2019, we completed one acquisition in the prior year for aggregate cash consideration of $12.8 million. Net cash used in investing activities for the year ended December 31, 2019 decreased $58.0 million, or 77.6%, to $16.7 million from $74.7 million in the year ended December 31, 2018.2021. See Note 4, Business Acquisitions, in the notes to the audited consolidated financial statements included elsewhere in this Annual Report on Form 10-K for additional information with respect to the acquisitions. We have minimal capital expenditure requirements. Capital expenditures totaled $6.6$11.5 million, $4.0$10.3 million and $3.9$6.6 million in the years ended December 31, 2021, 20202023, 2022 and 2019,2021, respectively.
Financing Activities
Financing activities primarily consist of borrowing and repayments on our debt to fund business acquisitions and our operations.
Net cash used in financing activities for the year ended December 31, 2023 was $54.2 million, comprised of payment of an aggregate of $17.2 million of cash dividends on our outstanding redeemable convertible preferred stock, $16.9 million in share repurchases associated with our share repurchase programs, payment of $12.5 million of original issuance discount and $2.0 million in debt issuance costs related to the Term Loan Amendment, $3.7 million in payments of contingent consideration related to business acquisitions and $2.1 million in repayments of principal on our Extended Term Loan Facility.
Net cash used in financing activities for the year ended December 31, 2022 was $119.3 million, comprised of $104.2 million in repayments of principal on our Amended and Restated Term Loan Facilities, $10.4 million in share repurchases associated with our share repurchase programs, $4.4 million in payments of contingent consideration related to business acquisitions and $0.4 million of fees paid associated with the Fourth Amendment to our Amended and Restated Credit Agreement. Net cash used in financing activities for the year ended December 31, 2021 was $22.2 million, comprised of $12.4 million in share repurchases associated with our publicly announced share repurchase programs, $5.7 million in repayments of principal on our Amended and Restated Term Loan Facilities and $4.2 million in payments of deferredcontingent consideration related to business acquisitions. Net cash provided by financing activities
Free Cash Flow
Free Cash Flow of $28.8 million for the year ended December 31, 2020 was $360.12023 decreased $136.0 million, comprised of $382.7from $164.8 million of net proceeds for issuance of redeemable convertible preferred stock, partly offset by $10.0 million in repayments net of borrowings on our Amended and Restated Senior Revolving Credit Facility, $5.4 million in cash dividend payments, $0.9 million in share repurchases associated with our publicly announced share repurchase programs, $5.7 million in repayments of principal on our Amended and Restated Term Loan Facilities and a $0.8 million payment of deferred consideration related to a business acquisition. Net cash used in financing activities for the year ended December 31, 2019 was $62.0 million, comprised of $46.0 million in repayments of borrowings on our Amended and Restated Senior Revolving Credit Facility, $21.3 million in quarterly cash dividend payments, $8.3 million in share repurchases associated with our publicly announced share repurchase programs, $5.7 million in repayments of principal on our Amended and Restated Term Loan Facilities and a $1.0 million payment of deferred consideration related to a business acquisition. These were offset by net proceeds of $16.0 million borrowings on our Amended and Restated Senior Revolving Credit Facility and $4.3 million in proceeds from common stock issuances related to the exercise of employee equity awards.
Free Cash Flow
2022. Free Cash Flow of $164.8 million for the year ended December 31, 2022 increased $81.4 million, from $83.4 million for the year ended December 31, 2021 increased $124.5 million, from outflow of $41.1 million for the year ended December 31, 2020. Free Cash Flow of negative $41.1 million for the year ended December 31, 2020 decreased $105.0 million, from inflow of $63.9 million for the year ended December 31, 2019.2021.
Free Cash Flow is a financial measure that is not calculated in accordance with GAAP. For a discussion of our presentation of Free Cash Flow, see footnoteFootnote 5 to the table under the heading “Results of Operations - Operations—Comparison of the Year Ended December 31, 20212023 to the Year Ended December 31, 2020”2022”.
Off-Balance Sheet Commitments
We are not party to, and do not typically enter into any, off-balance sheet arrangements.
60
Long-Term Debt
AmendedOur wholly-owned subsidiary, Emerald X, Inc. (“Emerald X”) is a party to both a senior secured term loan facility and Restated Senior Secured Credit Facilities
On February 14, 2020, Emerald Events Holding, Inc.a senior secured revolving credit facility, in each case entered into with a syndicate of lenders and Bank of America, N.A., the borrower underas administrative agent, pursuant to the Amended and Restated Senior Secured Credit Facilities was renamed Emerald X, Inc (“Emerald X”). The Amended and Restateddescribed below.
2023 Amendment to Term Loan Facilities include a seven-year $565.0 million senior secured term loan facility, scheduled to mature on May 22, 2024 (the “Amended and Restated Term Loan Facility”) and Facilityan Amended and Restated Revolving Credit Facility (as defined below).
The Amended and Restated Senior Secured Credit Facilities allows for Emerald X to choose from the following two interest rate options:
|
|
or
-LIBOR loans bear interest at a rate equal to a spread, or applicable margin, over the LIBOR rate.
The spread, or applicable margin, was 1.75% for ABR loans and 2.75% for LIBOR loans through August 6, 2020. Beginning in the first quarter of 2018, (i) the applicable margin steps down by 0.25% if Emerald X’s Total First Lien Net Leverage Ratio (as defined in the Amended and Restated Senior Secured Credit Facilities) is lower than 2.75 to 1.00 and (ii) the applicable margin under the Amended and Restated Revolving Credit Facility (but not the Amended and Restated Term Loan Facility) steps down by an additional 0.25% if Emerald X’s Total First Lien Net Leverage Ratio is less than 2.50 to 1.00. As a result of Company’s Total First Lien Net Leverage Ratio decreasing below 2.50 to 1.00 (as defined below), from August 7, 2020 through December 31, 2020, borrowings under the Revolving Credit Facility were subject to an interest rate equal to LIBOR plus 2.25% or ABR plus 1.25%.
The Amended and Restated Senior Secured Credit Facilities also include an uncommitted incremental facility which, subject to certain conditions, provides for additional term loans in the sum of:
|
|
(ii) if the incremental loans are junior lien loans, an amount such that the Total Net Secured Leverage Ratio (as defined in the Amended and Restated Senior Secured Credit Facilities) does not exceed 4.00:1.00,
(iii) if the incremental loans are unsecured, an amount such that either the Total Net Leverage Ratio does not exceed 5.00:1.00 or the Fixed Charge Coverage Ratio (as defined in the Amended and Restated Senior Secured Credit Facilities) is not less than 2.00:1.00, or, in each case, if the incremental loans are incurred with a permitted acquisition, an amount such that the applicable leverage ratio will not increase as a result of the permitted acquisition (on a pro forma basis giving effect to the incremental loans); plus
(Y)an amount equal to certain prior voluntary prepayments, loan buybacks and commitment reductions of loans under the Amended and Restated Senior Secured Credit Facilities, plus
(Z)an amount equal to the greater of $160 million and 100% of Acquisition Adjusted EBITDA (which is defined as “Consolidated EBITDA” in the credit agreement governing the Amended and Restated Senior Secured Credit Facilities).
On June 25, 2021,12, 2023 (the “Term Loan Amendment Effective Date”), Emerald X entered into a ThirdSixth Amendment (the “Term Loan Amendment”) to its existing Amended and Restated Credit Agreement (the “Amendment”), by(such credit agreement, the “Amended and among Emerald X, as Borrower, the guarantors party thereto, theRestated Credit Agreement”). The Term Loan Amendment, which was entered into with a syndicate of lenders party thereto and Bank of America, N.A., as administrative agent, which amends that certainextended the maturity of the term loans outstanding under the Amended and Restated Credit Agreement dated(such extended term loan facility, the “Extended Term Loan Facility”) from May 22, 2024 to May 22, 2026.
The aggregate outstanding principal amount of the Extended Term Loan Facility was approximately $415.3 million as of May 22, 2017. Pursuantthe Term Loan Amendment Effective Date. The Term Loan Amendment also replaced the interest rate applicable to the Amendment, the existing Credit Agreement was modified as follows:
|
|
|
|
|
|
|
|
Emerald X is required to pay a quarterly commitment fee in respect of the unutilized commitments under the Amended and Restated Revolving Credit Facility in an amountAgreement with a rate equal to, 0.50%at the option of Emerald X, (i) the Term Secured Overnight Financing Rate (“Term SOFR”) plus 5.00% per annum calculatedplus a credit spread adjustment of 0.10% per annum or (ii) an alternate base rate (“ABR”) plus 4.00% per annum. Prior to the Term Loan Amendment, the interest rate applicable to the term loans was a rate equal to, at the option of Emerald X, (i) LIBOR plus 2.75% or 2.50% per annum, depending on the unused portionEmerald X’s first lien net leverage ratio or (ii) ABR plus 1.75% or 1.50% per annum, depending on Emerald X’s first lien net leverage ratio.
The Term Loan Amendment additionally reset scheduled quarterly payments, each equal to 0.25% of the facility, which may be reduced to 0.375%original principal amount of the Extended Term Loan Facility. Further, the Term Loan Amendment modified the prepayment provisions so that, upon achievementthe occurrence of a Total First Lien Ratiorepricing transaction, subject to certain specified exceptions, Emerald X will have to pay a prepayment fee of 2%, in the event of a repricing transaction occurring within the first twelve months after the Term Loan Amendment Effective Date, or 1%, in the event of a repricing transaction occurring on a date that is between twelve months after the Term Loan Amendment Effective Date and eighteen months after the Term Loan Amendment Effective Date. No prepayment premium is payable for prepayments made after the eighteen month anniversary of the Term Loan Amendment Effective Date.
3.50On December 28, 2022, Emerald X voluntarily prepaid $100.0 million of outstanding term loans. Prior to 1.50. Upon the issuance of letters of credit undersuch prepayment, the Amended and Restated Revolving Credit Facility, Emerald X isAgreement required to pay fronting fees, customary issuance and administration fees and a letterrepayment of credit fee equal to the then-applicable margin (as determined by reference to LIBOR) for the Amended and Restated Revolving Credit Facility.
The Amended and Restated Term Loan Facility requires repaymentterm loans outstanding thereunder in equal quarterly installments of 0.25% of the original $565.0 million of borrowings, with the balance due at maturity. Installmentmaturity.. As a result of the term loan prepayment described above, no further amortization payments were required until the Term Loan Amendment reset scheduled quarterly payments on the Amended and Restated$415.3 million in principal amount of Term Loans outstanding as of the Term Loan Facility are due on the last business day of each quarter, commencing on September 29, 2017.Amendment Effective Date.
Subject to the certain customary exceptions and limitations, Emerald X.X is also required to prepay amounts outstanding under the Amended and RestatedExtended Term Loan Facility under specified circumstances, including 50.0% of Excess Cash Flow (“ECF”), subject to step-downs to 25% and 0% of excess cash flow at certain leverage based thresholds, and with 100% of the net cash proceeds of asset sales and casualty events in excess of certain thresholds (subject to certain reinvestment rights).
2023 Amendment to Revolving Credit Facility
On February 2, 2023, Emerald X entered into a Fifth Amendment (the “RCF Amendment”) to the Amended and Restated Credit Agreement. The RCF Amendment increased the aggregate amount of all revolving commitments under the Amended and Restated Credit Agreement from $100.4 million to $110.0 million. The increased revolving
61
commitments have the same terms as the existing revolving commitments. The RCF Amendment did not change any other material terms of the Amended and Restated Credit Agreement.
2022 Amendment to Revolving Credit Facility
On December 21, 2022, Emerald X entered into a Fourth Amendment to the Amended and Restated Credit Agreement (the “Fourth Amendment”), by and among Emerald X, the guarantors party thereto, the lenders party thereto and Bank of America, N.A., as administrative agent, which extended the maturity of $100.4 million of then-existing revolving commitments under the Amended and Restated Credit Agreement (the revolving credit facility, as so extended, the “Extended Revolving Facility”) from November 23, 2023 to the earlier to occur of (i) May 23, 2026 and (ii) the day that is 91 days prior to the scheduled final maturity date of all outstanding term loans under the Amended and Restated Credit Agreement having an aggregate principal amount equal to or greater than the greater of (x) $75.0 million and (y) 100% of the Company’s Consolidated EBITDA (calculated on a pro forma basis).
The Fourth Amendment also replaced the LIBOR interest rate benchmark with a Term Secured Overnight Financing Rate (“Term SOFR”) interest rate benchmark for borrowings under the Extended Revolving Facility.
Accordingly, the Amended and Restated Credit Agreement allows the Borrower to choose from the following two interest rate options for revolver borrowings:
Under the Amended and Restated Credit Agreement, Emerald X is required to pay a quarterly commitment fee in respect of the unutilized revolving commitments in an amount equal to 0.50% per annum, calculated on the unused portion of the facility, which is reduced to 0.375% upon achievement of a Total First Lien Ratio of 3.50 to 1.00. Upon the issuance of letters of credit under the Extended Revolving Credit Facility, Emerald X is required to pay fronting fees, customary issuance and administration fees and a letter of credit fee equal to the then-applicable margin (as determined by reference to SOFR) for the Extended Revolving Credit Facility.
Guarantees; Collateral; Covenants; Events of Default
All obligations under the Amended and Restated Senior Secured FacilityCredit Facilities are guaranteed by Emerald X’s direct parent company and, subject to certain exceptions, by all of Emerald X’s direct and indirect wholly owned domestic subsidiaries. As of December 31, 2021,2023, all of Emerald X’s domestic subsidiaries and Emerald X’s direct parent have provided guarantees.
Subject to certain limitations, the obligations under the Amended and Restated Senior Secured Credit Facilities are secured by a perfected first priority security interest in substantially all tangible and intangible assets owned by Emerald X or by any guarantor.
The Amended and Restated Senior Secured Credit Facilities contain a number of customary incurrence-based covenants imposing certain restrictions on our business, including limitations on indebtedness; limitations on liens; limitations on certain fundamental changes (including, without limitation, mergers, consolidations, liquidations and dissolutions); limitations on asset sales; limitations on dividends and other restricted payments; limitations on investments, loans and advances; limitations on certain repayments of subordinated indebtedness; limitations on transactions with affiliates; limitations on changes in fiscal periods; limitations on agreements restricting liens and/or dividends; and limitations on changes in lines of business.
Certain of these incurrence-based covenants restrict, subject to various exceptions, our ability to take certain actions (such as incurring additional secured and unsecured indebtedness, making certain investments and paying certain dividends) unless we meet certain minimum Fixed Charge Coverage Ratio or maximum Total First Lien Net Leverage Ratio and/or Total Net Secured Leverage Ratio standards. These ratios are calculated on the basis of our Acquisition Adjusted EBITDA (which is defined as “Consolidated EBITDA” in the credit agreement governing the Amended and Restated Senior Secured Credit Facilities), calculated on a trailing four-quarter basis.
62
In addition, the Amended and RestatedExtended Revolving Credit Facility contains a financial maintenance covenant (the “Financial Covenant”) requiring Emerald X to comply with a 5.50 to 1.00 Total First Lien Net Leverage Ratio, which is defined as the ratio of Consolidated Total Debt (as defined in the Amended and Restated Senior Secured Credit Facilities)Agreement) secured on a first lien basis, net of unrestricted cash and cash equivalents (“Total First Lien Net Debt”) to Acquisition Adjusted EBITDA. This financial covenant is tested quarterly only if the aggregate amount of revolving loans, swingline loans and letters of credit outstanding under the Amended and RestatedExtended Revolving Credit Facility (net of up to $10.0 million of outstanding letters of credit) exceeds 35% of the total commitments thereunder. We were not required to test the Financial Covenant at December 31, 20212023 or 2020.2022.
Events of default under the Amended and Restated Senior Secured Credit Facilities include, among others, nonpayment of principal when due; nonpayment of interest, fees or other amounts; cross-defaults; covenant defaults; material inaccuracy of representations and warranties; certain bankruptcy and insolvency events; material unsatisfied or unstayed judgments; certain ERISA events; change of control; or actual or asserted invalidity of any guarantee or security document.
As of December 31, 2021,2023, we were in compliance with the terms of the Amended and Restated Senior Secured Credit Facilities.
Modifications to our Debt Agreements
We may, from time to time, repurchase or otherwise retire or extend our debt and/or take other steps to reduce our debt, lower our interest payments or otherwise improve our financial position. These actions may include open market debt repurchases, negotiated repurchases, other retirements of outstanding debt and/or opportunistic refinancing, amendment or repricing of debt. The amount of debt that may be repurchased or otherwise retired or refinanced, if any, will depend on market conditions, trading levels of our debt, our cash position, compliance with debt covenants and other considerations. Our affiliates may also purchase our debt from time to time, through open market purchases or other transactions. In such cases, our debt may not be retired, in which case we would continue to pay interest in accordance with the terms of the debt, and we would continue to reflect the debt as outstanding in our consolidated balance sheets.
Contractual Obligations and Commercial Commitments
The table below summarizes our contractual obligations as of December 31, 2021.2023.
|
| Payments Due By Period |
| |||||||||||||||||
|
| Total |
|
| Less Than |
|
| 1-3 Years |
|
| 3-5 Years |
|
| More Than |
| |||||
|
| (dollars in millions) |
| |||||||||||||||||
Contractual obligations(1) |
| $ | 73.1 |
|
| $ | 42.0 |
|
| $ | 30.8 |
|
| $ | 0.3 |
|
| $ | — |
|
Long-term debt obligations(2) |
|
| 413.3 |
|
|
| 4.2 |
|
|
| 409.1 |
|
|
| — |
|
|
| — |
|
Short-term debt obligations(3) |
|
| — |
|
|
| — |
|
|
| — |
|
|
| — |
|
|
| — |
|
Operating lease obligations(4) |
|
| 13.9 |
|
|
| 4.0 |
|
|
| 9.4 |
|
|
| 0.5 |
|
|
| — |
|
Interest on long-term debt obligations(5) |
|
| 103.7 |
|
|
| 43.8 |
|
|
| 59.9 |
|
|
| — |
|
|
| — |
|
Totals: |
| $ | 604.0 |
|
| $ | 94.0 |
|
| $ | 509.2 |
|
| $ | 0.8 |
|
| $ | — |
|
|
| Payments Due By Period |
| |||||||||||||||||
|
| Total |
|
| Less Than 1 Year |
|
| 1-3 Years |
|
| 3-5 Years |
|
| More Than 5 Years |
| |||||
|
| (dollars in millions) |
| |||||||||||||||||
Contractual obligations(1) |
| $ | 81.5 |
|
| $ | 44.3 |
|
| $ | 33.2 |
|
| $ | 4.0 |
|
| $ | — |
|
Long-term debt obligations(2) |
|
| 519.7 |
|
|
| 5.7 |
|
|
| 514.0 |
|
|
| — |
|
|
| — |
|
Short-term debt obligations(3) |
|
| — |
|
|
| — |
|
|
| — |
|
|
| — |
|
|
| — |
|
Operating lease obligations(4) |
|
| 20.2 |
|
|
| 4.7 |
|
|
| 8.4 |
|
|
| 7.1 |
|
|
| — |
|
Interest on long-term debt obligations(5) |
|
| 32.5 |
|
|
| 13.7 |
|
|
| 18.8 |
|
|
| — |
|
|
| — |
|
Totals: |
| $ | 653.9 |
|
| $ | 68.4 |
|
| $ | 574.4 |
|
| $ | 11.1 |
|
| $ | — |
|
63
|
|
|
|
|
|
|
|
|
|
Critical Accounting Policies and Estimates
The preparation of financial statements in conformity with accounting principles generally accepted in the United States requires the appropriate application of certain accounting policies, some of which require us to make estimates and assumptions about future events and their impact on amounts reported in our consolidated financial statements. Since future events and their impact cannot be determined with absolute certainty, the actual results will inevitably differ from our estimates.
We believe the application of our accounting policies, and the estimates inherently required therein, are reasonable. Our accounting policies and estimates are reevaluated on an ongoing basis and adjustments are made when facts and circumstances dictate a change.
The policies and estimates discussed below involve the selection or application of alternative accounting policies that are material to our consolidated financial statements. With respect to critical accounting policies, even a relatively minor variance between actual and expected experience can potentially have a materially favorable or unfavorable impact on subsequent results of operations.
Our accounting policies are more fully described in Note 1, Description of Business and Summary of Significant Accounting Policies, in the notes to our audited consolidated financial statements included elsewhere in this Annual Report on Form 10-K. ManagementOur management has discussed the selection of these critical accounting policies and estimates with members of our boardBoard of directors.Directors.
We have certain accounting policies that require more significant management judgment and estimates than others. These include our accounting policies with respect to revenue recognition, goodwill and indefinite-lived intangibles, definite-lived intangibles, share-based compensation and accounting for income taxes, which are more fully described below.
Revenue Recognition Deferred Revenue and Allowance for Credit Losses
Trade Shows and Other Events RevenueConnections
A significant portion of ourthe Company’s annual revenue is generated from the Connections segment through the production of trade shows and conference events, including booth space sales, registration fees and sponsorship fees. We recognize revenueRevenue from the Company’s trade shows and other events is recognized in the period the trade show or other event stages as the Company’s performance obligations have been satisfied. As a result of the COVID-19 related show cancellations described above, trade show revenues declined significantly during the years ended December 31, 2021 and 2020. Trade show and other events generated approximately 71%, 79% and 92% of revenues for the years ended December 31, 2021, 2020 and 2019, respectively.
Exhibitors contract for their booth space and sponsorships up to a year in advance of the trade show. Fees are typically invoiced and collected in-full prior to the trade show or event and deferred until the event takes place and all promised services have been provided and performance obligations are met. Similarly, attendees register and are typically qualified for attendance prior to the show staging. Attendee registration revenues are also collected prior to the show and deferred until the show stages. Revenue is recognized when our customer receives the benefit of the promised services and all performance obligations are met. Revenue is recognized at an amount that reflects the
consideration we expect to receive in exchange for those services. Customers receive the benefit of our services over the course of each trade show or other event for our trade shows and conference events. We recognized $103.5 million, $101.2 million and $330.7 million of tradeTrade show and other event revenueevents generated approximately 89%, 87% and 73% of revenues for the years ended December 31, 2021, 20202023, 2022 and 2019,2021, respectively.
Because we collect our booth space, sponsorshipContent
Revenues from the Company’s Content category primarily consist of advertising sales for digital products and attendee registration revenue prior toindustry publications that complement the trade show staging, we do not incur substantial bad debt expense, or have exposure to credit losses with relation to these revenue streams. Any trade show related receivables outstanding 60 days following the monthevent properties in which a trade show stageseach industry sector as well as custom content agency revenues. These revenues are fully reserved in the allowance for credit losses. Bad debt expense is recognized in the consolidated statementsperiod in which the digital products are provided or publications are issued or when the custom content is delivered to the customer. Typically, the fees charged are collected after the digital products are provided, the publications are issued or the custom content is delivered. Content category revenues generated approximately 6%, 8% and 19% of lossrevenues for the years ended December 31, 2023, 2022 and comprehensive loss as selling, general and administrative expense. Accounts receivable are presented on2021, respectively.
Commerce
Revenues from the faceCommerce category primarily consist of sales from the consolidated balance sheet, net of an allowance for credit losses in 2020 and 2021.
Subscription software and services
We also offer B2B ecommerce and digital merchandising solutions, serving the needs of manufacturers and retailers, through ourCompany’s software-as-a-service Elastic Suite platform. In addition to their respective revenues, these products support our live events by delivering year-round channels for customer acquisition and development.Revenue consists of subscription revenue, implementation fees and professional services. Fees associated with implementation are deferred and recognized over the expected customer life, which is four years. Subscription revenue is generally recognized over the term of the contract. The Company’s contracts associated with the subscription software and services are typicallygenerally three-year terms with one-year renewals.We recognized $11.1 million, zero and zero of subscription Subscription software and services revenuerevenues generated approximately 5%, 5% and 8% of revenues for the years ended December 31, 2023, 2022 and 2021, 2020 and 2019, respectively.
Other Marketing Services Revenue64
The remaining portion of our revenues primarily consist of advertising sales for industry publications
and digital products, which are recognized in the period in which the publications are issuedor digital products are provided. Typically, the feesBecause we charge are collected after the publications are issued. We recognized $30.9 million, $26.2 million and $30.2 million of other marketing services revenue for the years ended December 31, 2021, 2020 and 2019, respectively.
Deferred Revenue
Our deferred revenues generally consist ofcollect our booth space, sales,sponsorship and attendee registration fees and sponsorship fees that are invoicedrevenue prior to the trade show staging, we do not incur substantial bad debt expense, or other eventhave exposure to credit losses with relation to these revenue streams. Bad debt expense is recognized in the consolidated statements of (loss) income and subscription revenue, implementation feescomprehensive (loss) income as selling, general and professional services associated withadministrative expense. Accounts receivable are presented on the Company’s subscription softwareface of the consolidated balance sheet, net of an allowance for credit losses in 2023 and services. Total deferred revenues, including the current and non-current portions, were $118.3 million and $48.6 million, as of December 31, 2021 and 2020, respectively.2022.
Business Combinations
Upon acquisition of a new business, management prepares a purchase price allocation to record the acquired entity’s tangible and intangible assets and liabilities. The goodwill recorded reflects the future cash flow expectations for the acquired businesses’ market positions in their respective industries, synergies and assembled workforce. The fair values of acquired customer-relationship intangibles are estimated using a discounted cash flow analysis. The significant assumptions used in the discounted cash flow analysis include future cash flows, growth rates, discount rates, and tax rates. These assumptions are used in developing the present value of future cash flow projections which are the basis of the fair value calculation.
Goodwill and Indefinite-Lived Intangible Assets
Goodwill
Goodwill is recorded as the difference, if any, between the aggregate consideration paid for an acquisition and the fair value of the assets acquired and liabilities assumed resulting from acquisitions. Goodwill is not amortized but instead tested for impairment at least annually or more frequently should an event or circumstances indicate that a reduction in the fair value of thea reporting unit may have occurred. We test for impairment on October 31 of each year, or more frequently if events and circumstances warrant. Such events and circumstances may be a significant change in our business climate, economic and industry trends, legal factors, negative operating performance indicators, significant competition or changes in strategy. We perform our goodwill impairment test at the reporting unit level, using a fair value method based on management’s judgments and assumptions or third party valuations. The fair value of a reporting unit refers to the price that would be expected to be received to sell the reporting unit in an orderly transaction between market participants at the measurement date.
In testing goodwill for impairment, we first assess qualitative factors to determine whether the existence of events or circumstances leads to a determination that it is more likely than not that the fair value of a reporting unit is less than its carrying amount. If, after assessing the totality of events or circumstances, we determine it is not more likely than not that the fair value of a reporting unit is less than its carrying amount, then additional impairment testing is not required. If the carrying amount of goodwill exceeds the fair value, an impairment loss is recognized in
an amount equal to the excess of the carrying amount over the fair value of the reporting unit. We would also be required to reduce the carrying amounts of the related assets on our balance sheet.
Determining the fair value of a reporting unit requires the application of judgment and involves the use of significant estimates and assumptions including, projections of future cash flows, revenue growthincluding forecasted revenues, EBITDA margins, discount rates, weighted average cost ofdebt free net working capital, forecasting future sales and expenses, selecting appropriate discount ratescapital expenditures and other factors which can be affected by changes in business climate, economic conditions, the competitive environment and other factors. We base these fair value estimates on assumptions our management believes to be reasonable but which are unpredictable and inherently uncertain. A change in underlying assumptions would cause a change in the results of the tests and, as such, could cause fair value to be less than the carrying amounts and result in an impairment of goodwill in the future. Additionally, if actual results are not consistent with the estimates and assumptions or if there are significant changes to our planned strategy, it may cause fair value to be less than the carrying amounts and result in additional impairments of goodwill in the future. We corroborate the reasonableness of the total fair value of the reporting unit withby assessing the implied control premium based on our market capitalization. Our market capitalization is calculated using the number of shares outstanding and stock price of our publicly traded shares. In the event of a goodwill impairment, we would be required to record an impairment, which would impact earnings and reduce the carrying amounts of goodwill on the consolidated balance sheet.
We also consider the amount of headroom for our reporting units when determining whether an impairment existed. Headroom is the difference between the fair value of a reporting unit and its carrying value. In performing our annual impairment analysis as of October 31, 2021,2023, the fair values of the reporting units which were not impaired exceeded their carrying values by amounts ranging from zero4.2% to 458%241.5%. Reporting units in which the fair value exceeded carrying value by less than 10% included $25.6 million of goodwill. Of the $400.7$553.9 million of goodwill, the carrying value equals the fair value for $6.7 millionno reporting units as of October 31, 2021.2023. Thefair values of the respective
65
reporting units were determined primarily by discounting estimated future cash flows, which were determined based on revenue and expense long-term growth assumptions ranging from zero1.0% growth to 3.0% growth, of 3.5%, at a weighted average cost of capital (discount rate)discount rate ranging from 12.0%13.0% to 13.5%15.5%.
The discount rate and long-term growth rate used to determine the fair value of the reporting unit, which exceeded carrying value by less than 10%, were 13.7% and 3.0%, respectively. Changes in these assumptions would have a significant impact on the valuation model. Holding all other assumptions constant, a hypothetical 100 basis point increase in the discount rate assumption would decrease the fair value of the reporting unit by approximately 10.8%, which would result in a hypothetical impairment charge. Holding all other assumptions constant, a hypothetical 100 basis point decrease in the long-term growth rate assumption would decrease the fair value of the reporting unit by approximately 5.4%, which would not result in a hypothetical impairment charge.
Accordingly, a relatively small change in the underlying assumptions, including if the financial performance of the reporting unit does not meet expectations in future years or a decline occurs in the market price of our publicly traded stock, may cause a change in the results of the impairment assessment in future periods and, as such, could result in an impairment of goodwill, for which the carrying amount is $514.2$553.9 million as of December 31, 2021. 2023.The aggregate remaining goodwill carrying value of reporting units with impairment was $6.7 million as of December 31, 2021.
Indefinite-Lived Intangible Assets
The annual evaluation for impairment of indefinite-lived intangible assets is a two-step process. The first step is to perform a qualitative impairment assessment. If this qualitative assessment indicates that, more likely than not, the indefinite lived intangible assets are not impaired, then no further testing is performed. If the qualitative assessment indicates that, more likely than not, the indefinite lived intangible assets are impaired, then the fair value of the indefinite lived intangible assets must be calculated. If the carrying value exceeds the fair value, an impairment loss is recorded for that excess.
Indefinite-lived intangible assets are not amortized but instead tested for impairment at least annually or more frequently should an event or circumstances indicate that a reduction in fair value may have occurred. We test for impairment on October 31 of each year, or more frequently if events and circumstances warrant. Such events and circumstances may be a significant change in our business climate, economic and industry trends, legal factors, negative operating performance indicators, significant competition or changes in strategy. We perform testing of indefinite-lived intangible assets, other than goodwill, at the asset group level using the relief from royalty method. If the carrying value exceeds the fair value, an impairment loss is recorded for that excess.We would also be required to reduce the carrying amounts of the related assets on our balance sheet.
See Note 6, Intangible Assets and Goodwill, in the notes to the consolidated financial statements included elsewhere in this Annual Report on Form 10-K for additional information with respect to goodwill and indefinite-lived intangible assets.
Definite-Lived Intangible Assets
Definite-lived intangible assets consist of certain trade names, acquired technology, customer relationships and other amortized intangible assets. Definite-lived intangible assets are amortized over their estimated useful lives based on the pattern of expected economic benefit. Intangible assets with finite lives are stated at cost, less accumulated amortization and impairment losses, if any.
| ||||
Estimated
| Weighted
| |||
Customer relationship intangibles |
| 9 years | ||
Definite-lived trade names |
|
| ||
Acquired technology |
|
| ||
|
|
| ||
Computer software | 1-7 years | 4 years | ||
With respect to business acquisitions, the fair values of acquired definite-lived intangibles are estimated using a relief from royalty method.the income approach. Input assumptions regardingincluding future cash flows, growth rates, attrition rates, royalty rates, discount rates, tax rates and tax ratesamortization benefits are used in developing the present value of future cash flow projections are the basis of the fair value calculations.
66
Impairment of Long-Lived Assets
We review long-lived assets, including tangible assets and other intangible assets with definitive lives, for impairment whenever events or changes in circumstances indicate that the carrying amount of the assets may not be recoverable. We conduct our long-lived asset impairment analysis by grouping assets and liabilities at the lowest level for which identifiable cash flows are largely independent of the cash flows of other assets and liabilities and evaluate the asset group against the sum of the undiscounted future cash flows. If the undiscounted cash flows do not indicate the carrying amount of the asset group is recoverable, an impairment is measured as the amount by which the carrying amount of the asset group exceeds its fair value based on the discounted cash flow analysis. If the carrying amount of an intangible asset exceeds its fair value, we recognize an impairment loss in an amount equal to that excess.We would also be required to reduce the carrying amounts of the related assets on our balance sheet.
See Note 6, Intangible Assets and Goodwill, in the notes to the consolidated financial statements included elsewhere in this Annual Report on Form 10-K for additional information with respect to impairments of long-lived assets.
Stock-Based Compensation
We use share-based compensation, including stock options and restricted stock units, to provide long-term performance incentives for our employees and non-employee directors. We calculate stock-based compensation expense for each vesting tranche of stock options using the Black-Scholes option pricing model and recognize such costs, net of forfeitures, within the consolidated statements of loss(loss) income and comprehensive loss;(loss) income; however, no expense is recognized for awards that do not ultimately vest. The determination of the grant date fair value of stock options using an option-pricing model is affected by a number of assumptions, such as the fair value of the underlying stock, our expected stock price volatility over the expected term of the options, stock option forfeiture behaviors, risk-free interest rates and expected dividends, which we estimated as follows:
| • Fair Value of our Common Stock — The fair value per share of common stock for purposes of determining share-based compensation is the closing price of our common stock as reported on the New York Stock Exchange on the applicable grant date. • Expected Term — The expected option term represents the period of time the option is expected to be outstanding. The simplified method is used to estimate the term as we do not have sufficient exercise history to calculate the expected term of stock options. • Volatility — The expected volatility is based on considering our limited publicly traded stock price and historical average volatilities of similar publicly traded companies corresponding to the expected term of the awards. • Risk-Free Rate — The risk-free rate is based on the yields of United States Treasury securities with maturities similar to the expected term of stock option for each stock option grant. • Forfeiture Rate — Estimates of pre-vesting forfeitures, or forfeiture rates, were based on our internal analysis, which primarily considers the award recipients’ position within the Company. • Dividend Yield — Prior to the IPO, we had never declared or paid any cash dividends and had no intention to pay cash dividends. Consequently, we used an expected dividend yield of zero with respect to pre-IPO options. In connection with our IPO, we adopted a policy of paying quarterly cash dividends on our common stock. Our post-IPO stock option grants include an expected dividend yield which is commensurate with the annual dividends we had been paying since the IPO, until the dividend was suspended in the first quarter of 2020.
|
|
|
|
|
|
|
|
|
|
|
|
See Note 12, Stock-Based Compensation, in the notes to the consolidated financial statements included elsewhere in this Annual Report on Form 10-K for additional information with respect to stock-based compensation.
Income Taxes
We provide for income taxes utilizing the asset and liability method of accounting. Under this method, deferred income taxes are recorded to reflect the tax consequences in future years of differences between the tax basesbasis of assets and liabilities and their financial reporting amounts at each balance sheet date, based on enacted tax laws and statutory
67
tax rates applicable to the periods in which the differences are expected to affect taxable income. If it is determined that it is more likely than not that future tax benefits associated with a deferred tax asset will not be realized, a valuation allowance is provided. The effect on deferred tax assets and liabilities of a change in the tax rates is recognized in the consolidated statements of loss(loss) income and comprehensive loss(loss) income as an adjustment to income tax expense in the period that includes the enactment date.
We record a liability for unrecognized tax benefits resulting from uncertain tax positions taken or expected to be taken in a tax return. We recognize interest and penalties, if any, related to unrecognized tax benefits in income tax expense. See Note 15, Income Taxes, in the notes to our audited consolidated financial statements included elsewhere in this Annual Report on Form 10-K.
68
Item 7A. Quantitative and Qualitative Disclosures About Market Risk.
Market risk is the potential loss arising from adverse changes in market rates and prices. Our primary exposure to market risk is interest rate risk associated with our Amended and Restated Senior Secured Credit Facilities. See “Management’s Discussion and Analysis of Financial Condition and Results of Operations—Long-Term Debt—Amended and Restated Senior Secured Credit Facilities” for further description of our Amended and Restated Senior Secured Credit Facilities. As of December 31, 2021,2023, we had $519.7$413.3 million of variable rate term loan borrowings outstanding under our Amended and Restated Senior Secured Credit Facilities and no variable rate borrowings outstanding under our Amended and Restated Revolving Credit Facility with respect to which we are exposed to interest rate risk. Holding other variables constant and assuming no interest rate hedging, a 0.25% increase in the average interest rate on our variable rate indebtedness would have resulted in a $1.3$1.0 million increase in annual interest expense based on the amount of borrowings outstanding as of December 31, 2021.2023.
Inflation rates may impact the financial statements and operating results in several areas. Inflation influences interest rates, which in turn impact the fair value of our investments and yields on new investments. Operating expenses, including payrolls, are impacted to a certain degree by the inflation rate. We do not believe that inflation has had a material effect on our results of operations for the periods presented. However, recent economic trends have resulted in inflationary conditions, including pressure on wages, and sustained inflationary conditions in future periods could affect our business.
69
Item 8. Financial Statements and Supplementary Data.
INDEX TO CONSOLIDATED FINANCIAL STATEMENTS
Report of Independent Registered Public Accounting Firm (PCAOB ID: 238) |
|
Consolidated Balance Sheets as of December 31, |
|
| |
| |
| |
| |
| |
|
70
Report of Independent Registered Public Accounting Firm
To theBoard of Directors and Stockholders of Emerald Holding, Inc.
OpinionOpinions on the Financial Statements and Internal Control over Financial Reporting
We have audited the accompanying consolidatedbalance sheetsof Emerald Holding, Inc. and its subsidiaries(the (the “Company”) as of December 31, 20212023 and 2020,2022, and the related consolidated statements of loss(loss) income and comprehensive loss,(loss) income, of redeemable convertible preferred stock and stockholders’ equity (deficit)deficit and of cash flows for each of the three years in the period ended December 31, 2021,2023, including the related notes and financial statement schedulesschedules listed in the accompanying index (collectively referred to as the “consolidated“consolidated financial statements”). We also have audited the Company's internal control over financial reporting as of December 31, 2023, based on criteria established in Internal Control - Integrated Framework (2013) issued by the Committee of Sponsoring Organizations of the Treadway Commission (COSO).
In our opinion, the consolidated financial statements referred to above present fairly, in all material respects, the financial position of the Company as of December 31, 20212023 and 2020, 2022, and the results ofitsoperations and itscash flows for each of the three years in the period ended December 31, 20212023 in conformity with accounting principles generally accepted in the United States of America. Also in our opinion, the Company maintained, in all material respects, effective internal control over financial reporting as of December 31, 2023, based on criteria established in Internal Control - Integrated Framework (2013) issued by the COSO.
Basis for OpinionOpinions
These The Company's management is responsible for these consolidatedfinancial statements, are the responsibilityfor maintaining effective internal control over financial reporting, and for its assessment of the Company's management.effectiveness of internal control over financial reporting, included in Management’s Report on Internal Control over Financial Reporting appearing under Item 9A. Our responsibility is to express an opinionopinions on the Company’s consolidatedfinancial statements and on the Company's internal control over financial reporting based on our audits. We are a public accounting firm registered with the Public Company Accounting Oversight Board (United States) (PCAOB) and are required to be independent with respect to the Company in accordance with the U.S. federal securities laws and the applicable rules and regulations of the Securities and Exchange Commission and the PCAOB.
We conducted our audits of these consolidatedfinancial statements in accordance with the standards of the PCAOB. Those standards require that we plan and perform the auditaudits to obtain reasonable assurance about whether the consolidated financial statements are free of material misstatement, whether due to error or fraud. The Company is not required to have, nor were we engaged to perform, an audit of its internal control over financial reporting. As part of our audits we are required to obtain an understanding offraud, and whether effective internal control over financial reporting but not for the purpose of expressing an opinion on the effectivenesswas maintained in all material respects.
Our audits of the Company's internal control overconsolidated financial reporting. Accordingly, we express no such opinion.
Our auditsstatements included performing procedures to assess the risks of material misstatement of the consolidatedfinancial statements, whether due to error or fraud, and performing procedures that respond to those risks. Such procedures included examining, on a test basis, evidence regarding the amounts and disclosures in the consolidatedfinancial statements. Our audits also included evaluating the accounting principles used and significant estimates made by management, as well as evaluating the overall presentation of the consolidated financial statements. Our audit of internal control over financial reporting included obtaining an understanding of internal control over financial reporting, assessing the risk that a material weakness exists, and testing and evaluating the design and operating effectiveness of internal control based on the assessed risk. Our audits also included performing such other procedures as we considered necessary in the circumstances. We believe that our audits provide a reasonable basis for our opinion.opinions.
Definition and Limitations of Internal Control over Financial Reporting
A company’s internal control over financial reporting is a process designed to provide reasonable assurance regarding the reliability of financial reporting and the preparation of financial statements for external purposes in accordance with generally accepted accounting principles. A company’s internal control over financial reporting includes those policies and procedures that (i) pertain to the maintenance of records that, in reasonable detail, accurately and fairly reflect the transactions and dispositions of the assets of the company; (ii) provide reasonable assurance that transactions are recorded as necessary to permit preparation of financial statements in accordance with generally accepted accounting principles, and that receipts and expenditures of the company are being made
71
only in accordance with authorizations of management and directors of the company; and (iii) provide reasonable assurance regarding prevention or timely detection of unauthorized acquisition, use, or disposition of the company’s assets that could have a material effect on the financial statements.
Because of its inherent limitations, internal control over financial reporting may not prevent or detect misstatements. Also, projections of any evaluation of effectiveness to future periods are subject to the risk that controls may become inadequate because of changes in conditions, or that the degree of compliance with the policies or procedures may deteriorate.
Critical Audit Matters
The critical audit matters communicated below are matters arising from the current period audit of the consolidated financial statements that were communicated or required to be communicated to the audit committee and that (i) relate to accounts or disclosures that are material to the consolidated financial statements and (ii) involved our especially challenging, subjective, or complex judgments. The communication of critical audit matters does not alter in any way our opinion on the consolidated financial statements, taken as a whole, and we are not, by communicating the critical audit matters below, providing separate opinions on the critical audit matters or on the accounts or disclosures to which they relate.
Goodwill Impairment Assessments – Certain Reporting Units
As described in Notes 1 and 6 to the consolidated financial statements, the Company’s consolidated goodwill balance was $553.9 million as of December 31, 2023, of which a portion relates to certain reporting units. Management tests goodwill for impairment on October 31 of each year, or more frequently should an event or a change in circumstances occur that would indicate the carrying value may be impaired. If the carrying amount of a reporting unit exceeds its fair value, an impairment is recorded equal to the amount by which the carrying value exceeds the fair value, up to the amount of goodwill associated with the reporting unit. During the fourth quarter of 2023, the Company changed its operating segments which resulted in a change in reporting units. Under accounting standards, management is required to perform an impairment assessment of the Company’s prior reporting units immediately prior to the change in reporting units and immediately after the change on the Company’s new reporting units. Due to the change in reporting units, management performed a quantitative assessment of the fair value of the Company’s prior and new reporting units as of October 31, 2023 using an income approach, and no goodwill impairment was recorded. Determining the fair value of a reporting unit requires the application of judgment and involves the use of significant estimates and assumptions including, projections of future cash flows, which include forecasted revenue, earnings before interest, taxes, depreciation, and amortization (EBITDA) margin, discount rate, debt free net working capital, capital expenditures and other factors which can be affected by changes in business climate, economic conditions, the competitive environment and other factors.
The principal considerations for our determination that performing procedures relating to the goodwill impairment assessments of certain reporting units is a critical audit matter are (i) the significant judgment by management when developing the fair value estimate of certain reporting units; (ii) a high degree of auditor judgment, subjectivity, and effort in performing procedures and evaluating management’s significant assumptions related to forecasted revenues, EBITDA margins, discount rates, debt free net working capital, and capital expenditures with respect to each of the certain reporting units when considered applicable; and (iii) the audit effort involved the use of professionals with specialized skill and knowledge.
Addressing the matter involved performing procedures and evaluating audit evidence in connection with forming our overall opinion on the consolidated financial statements. These procedures included testing the effectiveness of controls relating to management’s goodwill impairment assessments, including controls over the valuation of certain reporting units. These procedures also included, among others (i) testing management’s process for developing the fair value estimate of certain reporting units; (ii) evaluating the appropriateness of the income approach used by management; (iii) testing the completeness and accuracy of underlying data used in the income approach; and (iv) evaluating the reasonableness of the significant assumptions used by management related to forecasted revenues, EBITDA margins, discount rates, debt free net working capital, and capital expenditures with respect to each of the certain reporting units when considered applicable. Evaluating management’s assumptions related to forecasted revenues, EBITDA margins, debt free net working capital, and capital expenditures involved evaluating whether the assumptions used by management were reasonable considering (i) the current and past performance of certain
72
reporting units; (ii) whether these assumptions were consistent with evidence obtained in other areas of the audit; and (iii) for forecasted revenues, EBITDA margins, and capital expenditures, whether the assumptions were consistent with industry data. Professionals with specialized skill and knowledge were used to assist in evaluating the appropriateness of the income approach and the reasonableness of the discount rate assumption.
Indefinite-Lived Intangible Asset Impairment Assessment - A Certain Indefinite-Lived Trade Name
As described in Notes 1 and 6 to the consolidated financial statements, the Company’s indefinite-lived intangible assets consist of trade names. The Company’s consolidated indefinite-lived trade names balance was $52.6 million as of December 31, 2023, of which a portion relates to a certain indefinite-lived trade name. Indefinite-lived intangible assets are tested annually for impairment at October 31, or between annual tests if the Company becomes aware of an event or a change in circumstances that would indicate the carrying value of an asset group may be impaired. The fair value of the trade name is then compared to the carrying value of each trade name. If the carrying amount of the trade name exceeds its fair value, an impairment loss would be reported. On October 31, 2023, management performed a quantitative analysis for the annual impairment assessment for indefinite-lived intangible assets and no impairments were identified. The fair values of the Company’s indefinite-lived trade name asset groups are calculated by management using a form of the income approach referred to as the “relief from royalty payments” method. Determining the fair value of an indefinite-lived intangible asset group requires the application of judgment and involves the use of significant estimates and assumptions, including projections of future cash flows, which include forecasted revenue, EBITDA margin, discount rate, tax rate, and royalty rate.
The principal considerations for our determination that performing procedures relating to the indefinite-lived intangible asset impairment assessment of a certain indefinite-lived trade name is a critical audit matter are (i) the significant judgment by management when developing the fair value estimate of a certain indefinite-lived trade name; (ii) a high degree of auditor judgment, subjectivity, and effort in performing procedures and evaluating management’s significant assumptions related to forecasted revenues, EBITDA margins, the discount rate, and the royalty rate; and (iii) the audit effort involved the use of professionals with specialized skill and knowledge.
Addressing the matter involved performing procedures and evaluating audit evidence in connection with forming our overall opinion on the consolidated financial statements. These procedures included testing the effectiveness of controls relating to management’s indefinite-lived intangible asset impairment assessments, including controls over the valuation of a certain indefinite-lived trade name. These procedures also included, among others (i) testing management’s process for developing the fair value estimate of a certain indefinite-lived trade name; (ii) evaluating the appropriateness of the relief from royalty payments method used by management; (iii) testing the completeness and accuracy of underlying data used in the relief from royalty payments method; and (iv) evaluating the reasonableness of the significant assumptions used by management related to forecasted revenues, EBITDA margins, the discount rate, and the royalty rate. Evaluating management’s assumptions related to forecasted revenues and EBITDA margins involved evaluating whether the assumptions used by management were reasonable considering (i) the current and past performance of the brand associated with a certain indefinite-lived trade name; (ii) the consistency with industry data; and (iii) whether these assumptions were consistent with evidence obtained in other areas of the audit. Professionals with specialized skill and knowledge were used to assist in evaluating the appropriateness of the relief from royalty payments method and the reasonableness of the discount rate and royalty rate assumptions.
/s/ PricewaterhouseCoopers LLP
Irvine, California
February 24, 2022March 4, 2024
We have served as the Company'sCompany’s auditor since 2015.
73
Emerald Holding, Inc.
Consolidated Balance Sheets
December 31, 20212023 and 20202022
(dollars in millions, share data in thousands, except par value) |
| 2023 |
|
| 2022 |
| ||
Assets |
|
|
|
|
|
| ||
Current assets |
|
|
|
|
|
| ||
Cash and cash equivalents |
| $ | 204.2 |
|
| $ | 239.1 |
|
Trade and other receivables, net of allowances of $1.4 million |
|
| 85.2 |
|
|
| 74.9 |
|
Prepaid expenses and other current assets |
|
| 21.5 |
|
|
| 17.8 |
|
Total current assets |
|
| 310.9 |
|
|
| 331.8 |
|
Noncurrent assets |
|
|
|
|
|
| ||
Property and equipment, net |
|
| 1.5 |
|
|
| 2.2 |
|
Intangible assets, net |
|
| 175.1 |
|
|
| 204.8 |
|
Goodwill, net |
|
| 553.9 |
|
|
| 545.5 |
|
Right-of-use lease assets |
|
| 8.8 |
|
|
| 10.6 |
|
Other noncurrent assets |
|
| 3.7 |
|
|
| 3.5 |
|
Total assets |
| $ | 1,053.9 |
|
| $ | 1,098.4 |
|
Liabilities, Redeemable Convertible Preferred Stock and Stockholders’ Deficit |
|
|
|
|
|
| ||
Current liabilities |
|
|
|
|
|
| ||
Accounts payable and other current liabilities |
| $ | 46.6 |
|
| $ | 58.1 |
|
Income tax payable |
|
| 0.2 |
|
|
| 1.2 |
|
Cancelled event liabilities |
|
| 0.6 |
|
|
| 3.3 |
|
Deferred revenues |
|
| 174.3 |
|
|
| 151.2 |
|
Contingent consideration |
|
| 0.2 |
|
|
| 3.5 |
|
Right-of-use lease liabilities, current portion |
|
| 4.0 |
|
|
| 4.9 |
|
Term loan, current portion |
|
| 4.2 |
|
|
| — |
|
Total current liabilities |
|
| 230.1 |
|
|
| 222.2 |
|
Noncurrent liabilities |
|
|
|
|
|
| ||
Term loan, net of discount and deferred financing fees |
|
| 398.7 |
|
|
| 413.9 |
|
Deferred tax liabilities, net |
|
| 3.1 |
|
|
| 1.8 |
|
Right-of-use lease liabilities, noncurrent portion |
|
| 8.9 |
|
|
| 10.4 |
|
Other noncurrent liabilities |
|
| 8.5 |
|
|
| 10.8 |
|
Total liabilities |
|
| 649.3 |
|
|
| 659.1 |
|
Commitments and contingencies (Note 16) |
|
|
|
|
|
| ||
Redeemable convertible preferred stock |
|
|
|
|
|
| ||
7% Series A Convertible Participating Preferred Stock, |
|
| 497.1 |
|
|
| 472.4 |
|
Stockholders’ deficit |
|
|
|
|
|
| ||
Common stock, $0.01 par value; authorized shares at December 31, 2023 |
|
| 0.6 |
|
|
| 0.7 |
|
Additional paid-in capital |
|
| 559.2 |
|
|
| 610.3 |
|
Accumulated deficit |
|
| (652.3 | ) |
|
| (644.1 | ) |
Total stockholders’ deficit |
|
| (92.5 | ) |
|
| (33.1 | ) |
Total liabilities, redeemable convertible preferred stock and |
| $ | 1,053.9 |
|
| $ | 1,098.4 |
|
The accompanying notes are an integral part of these consolidated financial statements.
74
Emerald Holding, Inc.
Consolidated Statements of (Loss) Income and Comprehensive (Loss) Income
(dollars in millions, share data in thousands, except par value) |
| 2021 |
|
| 2020 |
| ||
Assets |
|
|
|
|
|
|
|
|
Current assets |
|
|
|
|
|
|
|
|
Cash and cash equivalents |
| $ | 231.2 |
|
| $ | 295.3 |
|
Trade and other receivables, net of allowances of $1.2 million and $1.1 million, as of December 31, 2021 and 2020, respectively |
|
| 46.4 |
|
|
| 30.7 |
|
Insurance receivables |
|
| — |
|
|
| 17.8 |
|
Prepaid expenses |
|
| 12.5 |
|
|
| 8.5 |
|
Total current assets |
|
| 290.1 |
|
|
| 352.3 |
|
Noncurrent assets |
|
|
|
|
|
|
|
|
Property and equipment, net |
|
| 3.7 |
|
|
| 3.9 |
|
Intangible assets, net |
|
| 236.7 |
|
|
| 275.0 |
|
Goodwill, net |
|
| 514.2 |
|
|
| 404.3 |
|
Right-of-use lease assets |
|
| 15.1 |
|
|
| 16.0 |
|
Other noncurrent assets |
|
| 2.6 |
|
|
| 2.9 |
|
Total assets |
| $ | 1,062.4 |
|
| $ | 1,054.4 |
|
Liabilities, Redeemable Convertible Preferred Stock and Stockholders’ Deficit |
|
|
|
|
|
|
|
|
Current liabilities |
|
|
|
|
|
|
|
|
Accounts payable and other current liabilities |
| $ | 51.8 |
|
| $ | 31.1 |
|
Cancelled event liabilities |
|
| 9.8 |
|
|
| 25.9 |
|
Deferred revenues |
|
| 118.1 |
|
|
| 48.6 |
|
Right-of-use lease liabilities, current portion |
|
| 4.7 |
|
|
| 4.3 |
|
Term loan, current portion |
|
| 5.7 |
|
|
| 5.7 |
|
Total current liabilities |
|
| 190.1 |
|
|
| 115.6 |
|
Noncurrent liabilities |
|
|
|
|
|
|
|
|
Term loan, net of discount and deferred financing fees |
|
| 510.9 |
|
|
| 515.3 |
|
Deferred tax liabilities, net |
|
| 1.5 |
|
|
| 1.9 |
|
Right-of-use lease liabilities, noncurrent portion |
|
| 13.3 |
|
|
| 13.4 |
|
Other noncurrent liabilities |
|
| 32.1 |
|
|
| 13.7 |
|
Total liabilities |
|
| 747.9 |
|
|
| 659.9 |
|
Commitments and contingencies (Note 16) |
|
|
|
|
|
|
|
|
Redeemable convertible preferred stock |
|
|
|
|
|
|
|
|
7% Series A Convertible Participating Preferred Stock, $0.01 par value; authorized shares at December 31, 2021 and 2020: 80,000; 71,442 and 71,445 shares issued and outstanding; aggregate liquidation preference $444.1 million and $414.4 million at December 31, 2021 and 2020, respectively |
|
| 433.9 |
|
|
| 398.3 |
|
Stockholders' deficit |
|
|
|
|
|
|
|
|
Common stock, $0.01 par value; authorized shares at December 31, 2021 and 2020: 800,000; 70,026 and 72,195 shares issued and outstanding at December 31, 2021 and 2020, respectively |
|
| 0.7 |
|
|
| 0.7 |
|
Additional paid-in capital |
|
| 653.2 |
|
|
| 690.7 |
|
Accumulated deficit |
|
| (773.3 | ) |
|
| (695.2 | ) |
Total stockholders’ deficit |
|
| (119.4 | ) |
|
| (3.8 | ) |
Total liabilities, redeemable convertible preferred stock and stockholders’ deficit |
| $ | 1,062.4 |
|
| $ | 1,054.4 |
|
Years Ended December 31, 2023, 2022 and 2021
(dollars in millions, share data in thousands except loss per share) |
| 2023 |
|
| 2022 |
|
| 2021 |
| |||
Revenues |
| $ | 382.8 |
|
| $ | 325.9 |
|
| $ | 145.5 |
|
Other income, net |
|
| 2.8 |
|
|
| 182.8 |
|
|
| 77.4 |
|
Cost of revenues |
|
| 137.6 |
|
|
| 116.5 |
|
|
| 57.1 |
|
Selling, general and administrative expense |
|
| 168.3 |
|
|
| 145.0 |
|
|
| 143.0 |
|
Depreciation and amortization expense |
|
| 45.0 |
|
|
| 59.5 |
|
|
| 47.6 |
|
Goodwill impairment charge |
|
| — |
|
|
| 6.3 |
|
|
| 7.2 |
|
Intangible asset impairment charge |
|
| — |
|
|
| 1.6 |
|
|
| 32.7 |
|
Operating income (loss) |
|
| 34.7 |
|
|
| 179.8 |
|
|
| (64.7 | ) |
Interest expense |
|
| 43.3 |
|
|
| 24.5 |
|
|
| 15.9 |
|
Interest income |
|
| 8.2 |
|
|
| 2.7 |
|
|
| 0.1 |
|
Loss on extinguishment of debt |
|
| 2.3 |
|
|
| — |
|
|
| — |
|
Other expense |
|
| — |
|
|
| — |
|
|
| 0.1 |
|
Loss on disposal of fixed assets |
|
| 0.2 |
|
|
| — |
|
|
| 0.4 |
|
(Loss) income before income taxes |
|
| (2.9 | ) |
|
| 158.0 |
|
|
| (81.0 | ) |
Provision for (benefit from) income taxes |
|
| 5.3 |
|
|
| 27.2 |
|
|
| (1.3 | ) |
Net (loss) income and comprehensive |
| $ | (8.2 | ) |
| $ | 130.8 |
|
| $ | (79.7 | ) |
Accretion to redemption value of redeemable convertible preferred stock |
|
| (42.0 | ) |
|
| (38.8 | ) |
|
| (35.6 | ) |
Participation rights on if-converted basis |
|
| — |
|
|
| (60.2 | ) |
|
| — |
|
Net (loss) income and comprehensive (loss) income |
| $ | (50.2 | ) |
| $ | 31.8 |
|
| $ | (115.3 | ) |
Basic (loss) income per share |
| $ | (0.78 | ) |
| $ | 0.46 |
|
| $ | (1.62 | ) |
Diluted (loss) income per share |
| $ | (0.78 | ) |
| $ | 0.46 |
|
| $ | (1.62 | ) |
Basic weighted average common shares outstanding |
|
| 63,959 |
|
|
| 69,002 |
|
|
| 71,309 |
|
Diluted weighted average common shares outstanding |
|
| 63,959 |
|
|
| 69,148 |
|
|
| 71,309 |
|
|
|
|
|
|
|
|
|
|
| |||
The accompanying notes are an integral part of these consolidated financial statements.
75
Emerald Holding, Inc.
Years Ended December 31, 2021, 20202023, 2022 and 20192021
(dollars in millions, share data in thousands except loss per share) |
| 2021 |
|
| 2020 |
|
| 2019 |
| |||
Revenues |
| $ | 145.5 |
|
| $ | 127.4 |
|
| $ | 360.9 |
|
Other income |
|
| 77.4 |
|
|
| 107.0 |
|
|
| 6.1 |
|
Cost of revenues |
|
| 55.5 |
|
|
| 57.6 |
|
|
| 120.2 |
|
Selling, general and administrative expense |
|
| 143.0 |
|
|
| 118.6 |
|
|
| 133.4 |
|
Depreciation and amortization expense |
|
| 47.6 |
|
|
| 48.6 |
|
|
| 52.0 |
|
Goodwill impairments |
|
| 7.2 |
|
|
| 603.4 |
|
|
| 69.1 |
|
Intangible asset impairments |
|
| 32.7 |
|
|
| 76.8 |
|
|
| 17.0 |
|
Operating loss |
|
| (63.1 | ) |
|
| (670.6 | ) |
|
| (24.7 | ) |
Interest expense |
|
| 15.8 |
|
|
| 20.6 |
|
|
| 30.3 |
|
Loss on disposal of fixed assets |
|
| 0.5 |
|
|
| — |
|
|
| — |
|
Loss before income taxes |
|
| (79.4 | ) |
|
| (691.2 | ) |
|
| (55.0 | ) |
Benefit from income taxes |
|
| (1.3 | ) |
|
| (57.6 | ) |
|
| (5.0 | ) |
Net loss and comprehensive loss |
|
| (78.1 | ) |
|
| (633.6 | ) |
|
| (50.0 | ) |
Accretion to redemption value of redeemable convertible preferred stock |
|
| (35.6 | ) |
|
| (15.6 | ) |
|
| — |
|
Net loss and comprehensive loss attributable to Emerald Holding, Inc. common stockholders |
| $ | (113.7 | ) |
| $ | (649.2 | ) |
| $ | (50.0 | ) |
|
|
|
|
|
|
|
|
|
|
|
|
|
Basic loss per share |
| $ | (1.59 | ) |
| $ | (9.09 | ) |
| $ | (0.70 | ) |
Diluted loss per share |
| $ | (1.59 | ) |
| $ | (9.09 | ) |
| $ | (0.70 | ) |
Basic weighted average common shares outstanding |
|
| 71,309 |
|
|
| 71,431 |
|
|
| 71,719 |
|
Diluted weighted average common shares outstanding |
|
| 71,309 |
|
|
| 71,431 |
|
|
| 71,719 |
|
|
|
|
|
|
|
|
|
|
|
|
|
|
|
|
|
|
|
|
|
|
| Total Emerald Holding, Inc. Stockholders’ Deficit |
| |||||||||||||||||||
|
| Redeemable Convertible |
|
|
| Common Stock |
|
| Additional |
|
| Accumulated |
|
| Total |
| |||||||||||||
(shares in thousands; dollars in millions) |
| Shares |
|
| Amount |
|
|
| Shares |
|
| Amount |
|
| Capital |
|
| Deficit |
|
| Deficit |
| |||||||
Balances at December 31, 2020 |
|
| 71,445 |
|
| $ | 398.3 |
|
|
|
| 72,195 |
|
| $ | 0.7 |
|
| $ | 690.7 |
|
| $ | (695.2 | ) |
| $ | (3.8 | ) |
Stock-based compensation |
|
| — |
|
|
| — |
|
|
|
| 283 |
|
|
| — |
|
|
| 10.4 |
|
|
| — |
|
|
| 10.4 |
|
Issuance of common stock under equity plans |
|
| — |
|
|
| — |
|
|
|
| 42 |
|
|
| — |
|
|
| 0.1 |
|
|
| — |
|
|
| 0.1 |
|
Accretion to redemption value of redeemable convertible preferred stock |
|
| — |
|
|
| 35.6 |
|
|
|
| — |
|
|
| — |
|
|
| (35.6 | ) |
|
| — |
|
|
| (35.6 | ) |
Redeemable convertible preferred stock conversion |
|
| (3 | ) |
|
| — |
|
|
|
| 4 |
|
|
| — |
|
|
| — |
|
|
| — |
|
|
| — |
|
Repurchase of common stock |
|
| — |
|
|
| — |
|
|
|
| (2,498 | ) |
|
| — |
|
|
| (12.4 | ) |
|
| — |
|
|
| (12.4 | ) |
Net loss and comprehensive |
|
| — |
|
|
| — |
|
|
|
| — |
|
|
| — |
|
|
| — |
|
|
| (79.7 | ) |
|
| (79.7 | ) |
Balances at December 31, 2021 |
|
| 71,442 |
|
| $ | 433.9 |
|
|
|
| 70,026 |
|
| $ | 0.7 |
|
| $ | 653.2 |
|
| $ | (774.9 | ) |
| $ | (121.0 | ) |
Stock-based compensation |
|
| — |
|
|
| — |
|
|
|
| 362 |
|
|
| — |
|
|
| 5.9 |
|
|
| — |
|
|
| 5.9 |
|
Issuance of common stock under equity plans |
|
| — |
|
|
| — |
|
|
|
| 37 |
|
|
| — |
|
|
| 0.1 |
|
|
| — |
|
|
| 0.1 |
|
Accretion to redemption value of redeemable convertible preferred stock |
|
| — |
|
|
| 38.8 |
|
|
|
| — |
|
|
| — |
|
|
| (38.8 | ) |
|
| — |
|
|
| (38.8 | ) |
Redeemable convertible preferred stock conversion |
|
| (25 | ) |
|
| (0.3 | ) |
|
|
| 46 |
|
|
| — |
|
|
| 0.3 |
|
|
| — |
|
|
| 0.3 |
|
Repurchase of common stock |
|
| — |
|
|
| — |
|
|
|
| (2,883 | ) |
|
| — |
|
|
| (10.4 | ) |
|
| — |
|
|
| (10.4 | ) |
Net income and comprehensive |
|
| — |
|
|
| — |
|
|
|
| — |
|
|
| — |
|
|
| — |
|
|
| 130.8 |
|
|
| 130.8 |
|
Balances at December 31, 2022 |
|
| 71,417 |
|
| $ | 472.4 |
|
|
|
| 67,588 |
|
| $ | 0.7 |
|
| $ | 610.3 |
|
| $ | (644.1 | ) |
| $ | (33.1 | ) |
Stock-based compensation |
|
| — |
|
|
| — |
|
|
|
| 312 |
|
|
| — |
|
|
| 7.4 |
|
|
| — |
|
|
| 7.4 |
|
Issuance of common stock under equity plans |
|
| — |
|
|
| — |
|
|
|
| 53 |
|
|
| — |
|
|
| 0.2 |
|
|
| — |
|
|
| 0.2 |
|
Accretion to redemption value of redeemable convertible preferred stock |
|
| — |
|
|
| 42.0 |
|
|
|
| — |
|
|
| — |
|
|
| (42.0 | ) |
|
| — |
|
|
| (42.0 | ) |
Redeemable convertible preferred stock conversion |
|
| (14 | ) |
|
| (0.1 | ) |
|
|
| 26 |
|
|
| — |
|
|
| 0.1 |
|
|
| — |
|
|
| 0.1 |
|
Repurchase of common stock |
|
| — |
|
|
| — |
|
|
|
| (5,064 | ) |
|
| (0.1 | ) |
|
| (16.8 | ) |
|
| — |
|
|
| (16.9 | ) |
Preferred stock cash dividend |
|
| — |
|
|
| (17.2 | ) |
|
|
| — |
|
|
| — |
|
|
| — |
|
|
| — |
|
|
| — |
|
Net loss and comprehensive |
|
| — |
|
|
| — |
|
|
|
| — |
|
|
| — |
|
|
| — |
|
|
| (8.2 | ) |
|
| (8.2 | ) |
Balances at December 31, 2023 |
|
| 71,403 |
|
| $ | 497.1 |
|
|
|
| 62,915 |
|
| $ | 0.6 |
|
| $ | 559.2 |
|
| $ | (652.3 | ) |
| $ | (92.5 | ) |
The accompanying notes are an integral part of these consolidated financial statements.
76
Emerald Holding, Inc.
Consolidated Statements of Redeemable Convertible Preferred Stock and Stockholders’ Equity (Deficit)Cash Flows
Years Ended December 31, 2021, 20202023, 2022 and 20192021
|
|
|
|
|
|
|
|
|
|
| Total Emerald Holding, Inc Stockholders' Equity (Deficit) |
| |||||||||||||||||
|
| Redeemable Convertible Preferred Stock |
|
|
| Common Stock |
|
| Additional Paid-in |
|
| (Accumulated Deficit) Retained |
|
| Total Stockholders’ Equity |
| |||||||||||||
(shares in thousands; dollars in millions) |
| Shares |
|
| Amount |
|
|
| Shares |
|
| Amount |
|
| Capital |
|
| Earnings |
|
| (Deficit) |
| |||||||
Balances at December 31, 2018 |
|
| — |
|
| $ | — |
|
|
|
| 71,591 |
|
| $ | 0.7 |
|
| $ | 689.7 |
|
| $ | 17.9 |
|
| $ | 708.3 |
|
Stock-based compensation |
|
| — |
|
|
| — |
|
|
|
| 77 |
|
|
| — |
|
|
| 7.2 |
|
|
| — |
|
|
| 7.2 |
|
Dividends on common stock |
|
| — |
|
|
| — |
|
|
|
| — |
|
|
| — |
|
|
| — |
|
|
| (21.3 | ) |
|
| (21.3 | ) |
Issuance of common stock under equity plans |
|
| — |
|
|
| — |
|
|
|
| 537 |
|
|
| — |
|
|
| 4.3 |
|
|
| — |
|
|
| 4.3 |
|
Repurchase of common stock |
|
| — |
|
|
| — |
|
|
|
| (853 | ) |
|
| — |
|
|
| (0.1 | ) |
|
| (8.2 | ) |
|
| (8.3 | ) |
Net loss and comprehensive loss |
|
| — |
|
|
| — |
|
|
|
| — |
|
|
| — |
|
|
| — |
|
|
| (50.0 | ) |
|
| (50.0 | ) |
Balances at December 31, 2019 |
|
| — |
|
| $ | — |
|
|
|
| 71,352 |
|
| $ | 0.7 |
|
| $ | 701.1 |
|
| $ | (61.6 | ) |
| $ | 640.2 |
|
Stock-based compensation |
|
| — |
|
|
| — |
|
|
|
| 207 |
|
|
| — |
|
|
| 6.9 |
|
|
| — |
|
|
| 6.9 |
|
Dividends on common stock |
|
| — |
|
|
| — |
|
|
|
| — |
|
|
| — |
|
|
| (5.4 | ) |
|
| — |
|
|
| (5.4 | ) |
Issuance of common stock under equity plans |
|
| — |
|
|
| — |
|
|
|
| 46 |
|
|
| — |
|
|
| 0.2 |
|
|
| — |
|
|
| 0.2 |
|
Issuance of common stock for acquisition |
|
| — |
|
|
| — |
|
|
|
| 806 |
|
|
| — |
|
|
| 4.4 |
|
|
| — |
|
|
| 4.4 |
|
Issuance of redeemable convertible preferred stock, net of offering costs |
|
| 71,446 |
|
|
| 382.7 |
|
|
|
| — |
|
|
| — |
|
|
| — |
|
|
| — |
|
|
| — |
|
Accretion to redemption value of redeemable convertible preferred stock |
|
| — |
|
|
| 15.6 |
|
|
|
| — |
|
|
| — |
|
|
| (15.6 | ) |
|
| — |
|
|
| (15.6 | ) |
Redeemable convertible preferred stock conversion |
|
| (1 | ) |
|
| — |
|
|
|
| 2 |
|
|
| — |
|
|
| — |
|
|
| — |
|
|
| — |
|
Repurchase of common stock |
|
| — |
|
|
| — |
|
|
|
| (218 | ) |
|
| — |
|
|
| (0.9 | ) |
|
| — |
|
|
| (0.9 | ) |
Net loss and comprehensive loss |
|
| — |
|
|
| — |
|
|
|
| — |
|
|
| — |
|
|
| — |
|
|
| (633.6 | ) |
|
| (633.6 | ) |
Balances at December 31, 2020 |
|
| 71,445 |
|
| $ | 398.3 |
|
|
|
| 72,195 |
|
| $ | 0.7 |
|
| $ | 690.7 |
|
| $ | (695.2 | ) |
| $ | (3.8 | ) |
Stock-based compensation |
|
| — |
|
|
| — |
|
|
|
| 283 |
|
|
| — |
|
|
| 10.4 |
|
|
| — |
|
|
| 10.4 |
|
Issuance of common stock under equity plans |
|
| — |
|
|
| — |
|
|
|
| 42 |
|
|
| — |
|
|
| 0.1 |
|
|
| — |
|
|
| 0.1 |
|
Accretion to redemption value of redeemable convertible preferred stock |
|
| — |
|
|
| 35.6 |
|
|
|
| — |
|
|
| — |
|
|
| (35.6 | ) |
|
| — |
|
|
| (35.6 | ) |
Redeemable convertible preferred stock conversion |
|
| (3 | ) |
|
| — |
|
|
|
| 4 |
|
|
| — |
|
|
| — |
|
|
| — |
|
|
| — |
|
Repurchase of common stock |
|
| — |
|
|
| — |
|
|
|
| (2,498 | ) |
|
| — |
|
|
| (12.4 | ) |
|
| — |
|
|
| (12.4 | ) |
Net loss and comprehensive loss |
|
| — |
|
|
| — |
|
|
|
| — |
|
|
| — |
|
|
| — |
|
|
| (78.1 | ) |
|
| (78.1 | ) |
Balances at December 31, 2021 |
|
| 71,442 |
|
| $ | 433.9 |
|
|
|
| 70,026 |
|
| $ | 0.7 |
|
| $ | 653.2 |
|
| $ | (773.3 | ) |
| $ | (119.4 | ) |
(in millions) |
| 2023 |
|
| 2022 |
|
| 2021 |
| |||
Operating activities |
|
|
|
|
|
|
|
|
| |||
Net (loss) income |
| $ | (8.2 | ) |
| $ | 130.8 |
|
| $ | (79.7 | ) |
Adjustments to reconcile net (loss) income to net cash provided |
|
|
|
|
|
|
|
|
| |||
Stock-based compensation |
|
| 7.8 |
|
|
| 5.8 |
|
|
| 10.4 |
|
Allowance for credit losses |
|
| 0.3 |
|
|
| 0.4 |
|
|
| 0.4 |
|
Depreciation and amortization |
|
| 45.0 |
|
|
| 59.5 |
|
|
| 47.6 |
|
Goodwill impairments |
|
| — |
|
|
| 6.3 |
|
|
| 7.2 |
|
Intangible asset impairments |
|
| — |
|
|
| 1.6 |
|
|
| 32.7 |
|
Loss on disposal of fixed assets |
|
| 0.2 |
|
|
| — |
|
|
| 0.5 |
|
Non-cash operating lease expense |
|
| 2.6 |
|
|
| 3.4 |
|
|
| 3.3 |
|
Amortization of deferred financing fees and debt discount |
|
| 3.0 |
|
|
| 1.7 |
|
|
| 1.5 |
|
Loss on lease abandonment |
|
| 0.9 |
|
|
| 3.0 |
|
|
| — |
|
Loss on extinguishment of debt |
|
| 2.3 |
|
|
| — |
|
|
| — |
|
Deferred income taxes |
|
| 1.3 |
|
|
| 0.3 |
|
|
| (0.4 | ) |
Remeasurement of contingent consideration |
|
| (2.3 | ) |
|
| (33.3 | ) |
|
| 2.0 |
|
Changes in operating assets and liabilities, net of effect of |
|
|
|
|
|
|
|
|
| |||
Trade and other receivables |
|
| (8.6 | ) |
|
| (24.9 | ) |
|
| (15.6 | ) |
Insurance receivables |
|
| — |
|
|
| — |
|
|
| 17.8 |
|
Prepaid expenses and other current assets |
|
| (1.9 | ) |
|
| (4.8 | ) |
|
| (3.7 | ) |
Other noncurrent assets |
|
| (0.4 | ) |
|
| (0.1 | ) |
|
| 0.1 |
|
Accounts payable and other current liabilities |
|
| (11.0 | ) |
|
| 6.2 |
|
|
| 20.8 |
|
Cancelled event liabilities |
|
| (2.7 | ) |
|
| (6.5 | ) |
|
| (16.1 | ) |
Contingent consideration |
|
| — |
|
|
| (2.1 | ) |
|
| — |
|
Income tax payable |
|
| (2.7 | ) |
|
| 1.4 |
|
|
| 0.2 |
|
Deferred revenues |
|
| 19.5 |
|
|
| 29.9 |
|
|
| 67.5 |
|
Operating lease liabilities |
|
| (4.1 | ) |
|
| (4.7 | ) |
|
| (2.0 | ) |
Other noncurrent liabilities |
|
| (0.7 | ) |
|
| 1.2 |
|
|
| (4.5 | ) |
Net cash provided by operating activities |
|
| 40.3 |
|
|
| 175.1 |
|
|
| 90.0 |
|
Investing activities |
|
|
|
|
|
|
|
|
| |||
Acquisition of businesses, net of cash acquired |
|
| (9.5 | ) |
|
| (37.6 | ) |
|
| (125.3 | ) |
Purchase of marketable securities |
|
| — |
|
|
| (50.0 | ) |
|
| — |
|
Proceeds from maturity of marketable securities |
|
| — |
|
|
| 50.0 |
|
|
| — |
|
Purchases of property and equipment |
|
| (0.6 | ) |
|
| (1.8 | ) |
|
| (1.5 | ) |
Purchases of intangible assets |
|
| (10.9 | ) |
|
| (8.5 | ) |
|
| (5.1 | ) |
Net cash used in investing activities |
|
| (21.0 | ) |
|
| (47.9 | ) |
|
| (131.9 | ) |
Financing activities |
|
|
|
|
|
|
|
|
| |||
Payment of deferred consideration for acquisition of businesses |
|
| — |
|
|
| — |
|
|
| (4.2 | ) |
Payment of contingent consideration for acquisition of businesses |
|
| (3.7 | ) |
|
| (4.4 | ) |
|
| — |
|
Repayment of principal on Amended and Restated Term Loan Facility |
|
| (239.4 | ) |
|
| (104.2 | ) |
|
| (5.7 | ) |
Proceeds from Extended Term Loan Facility |
|
| 239.4 |
|
|
| — |
|
|
| — |
|
Repayment of principal on Extended Term Loan Facility |
|
| (2.1 | ) |
|
| — |
|
|
| — |
|
Original issuance discount |
|
| (12.5 | ) |
|
| — |
|
|
| — |
|
Fees paid for debt issuance |
|
| (2.0 | ) |
|
| (0.4 | ) |
|
| — |
|
Repurchase of common stock |
|
| (16.9 | ) |
|
| (10.4 | ) |
|
| (12.4 | ) |
Preferred stock cash dividend |
|
| (17.2 | ) |
|
| — |
|
|
| — |
|
Proceeds from issuance of common stock under equity plans |
|
| 0.2 |
|
|
| 0.1 |
|
|
| 0.1 |
|
Net cash used in financing activities |
|
| (54.2 | ) |
|
| (119.3 | ) |
|
| (22.2 | ) |
Net (decrease) increase in cash and cash equivalents |
|
| (34.9 | ) |
|
| 7.9 |
|
|
| (64.1 | ) |
Cash and cash equivalents |
|
|
|
|
|
|
|
|
| |||
Beginning of year |
|
| 239.1 |
|
|
| 231.2 |
|
|
| 295.3 |
|
End of year |
| $ | 204.2 |
|
| $ | 239.1 |
|
| $ | 231.2 |
|
The accompanying notes are an integral part of these consolidated financial statements.
77
Emerald Holding, Inc.
Consolidated Statements of Cash Flows (Continued)
Years Ended December 31, 2021, 20202023, 2022 and 20192021
(in millions) |
| 2021 |
|
| 2020 |
|
| 2019 |
| |||
Operating activities |
|
|
|
|
|
|
|
|
|
|
|
|
Net loss |
| $ | (78.1 | ) |
| $ | (633.6 | ) |
| $ | (50.0 | ) |
Adjustments to reconcile net loss to net cash provided (used in) by operating activities: |
|
|
|
|
|
|
|
|
|
|
|
|
Stock-based compensation |
|
| 10.4 |
|
|
| 6.7 |
|
|
| 7.7 |
|
Allowance for credit losses |
|
| 0.4 |
|
|
| 0.7 |
|
|
| 0.6 |
|
Depreciation and amortization |
|
| 47.6 |
|
|
| 48.6 |
|
|
| 52.0 |
|
Goodwill impairments |
|
| 7.2 |
|
|
| 603.4 |
|
|
| 69.1 |
|
Intangible asset impairments |
|
| 32.7 |
|
|
| 76.8 |
|
|
| 17.0 |
|
Loss on disposal of fixed assets |
|
| 0.5 |
|
|
| — |
|
|
| — |
|
Non-cash operating lease expense |
|
| 3.3 |
|
|
| 3.3 |
|
|
| 3.2 |
|
Amortization of deferred financing fees and debt discount |
|
| 1.5 |
|
|
| 1.5 |
|
|
| 1.4 |
|
Deferred income taxes |
|
| (0.4 | ) |
|
| (58.1 | ) |
|
| (15.4 | ) |
Remeasurement of contingent consideration |
|
| 2.0 |
|
|
| 1.5 |
|
|
| — |
|
Changes in operating assets and liabilities, net of effect of businesses acquired: |
|
|
|
|
|
|
|
|
|
|
|
|
Trade and other receivables |
|
| (15.6 | ) |
|
| 30.6 |
|
|
| 3.4 |
|
Insurance receivables |
|
| 17.8 |
|
|
| (17.8 | ) |
|
| — |
|
Prepaid expenses |
|
| (3.7 | ) |
|
| 15.6 |
|
|
| (4.2 | ) |
Other noncurrent assets |
|
| 0.1 |
|
|
| (1.8 | ) |
|
| 0.1 |
|
Accounts payable and other current liabilities |
|
| 19.2 |
|
|
| 5.7 |
|
|
| (7.1 | ) |
Cancelled event liabilities |
|
| (16.1 | ) |
|
| 25.9 |
|
|
| — |
|
Income tax payable |
|
| 0.2 |
|
|
| — |
|
|
| — |
|
Deferred revenues |
|
| 67.5 |
|
|
| (140.0 | ) |
|
| (6.4 | ) |
Operating lease liabilities |
|
| (2.0 | ) |
|
| (3.2 | ) |
|
| (3.2 | ) |
Other noncurrent liabilities |
|
| (4.5 | ) |
|
| (2.9 | ) |
|
| (0.4 | ) |
Net cash provided by (used in) operating activities |
|
| 90.0 |
|
|
| (37.1 | ) |
|
| 67.8 |
|
Investing activities |
|
|
|
|
|
|
|
|
|
|
|
|
Acquisition of businesses, net of cash acquired |
|
| (125.3 | ) |
|
| (33.3 | ) |
|
| (12.8 | ) |
Purchases of property and equipment |
|
| (1.5 | ) |
|
| (0.9 | ) |
|
| (1.6 | ) |
Purchases of intangible assets |
|
| (5.1 | ) |
|
| (3.1 | ) |
|
| (2.3 | ) |
Net cash used in investing activities |
|
| (131.9 | ) |
|
| (37.3 | ) |
|
| (16.7 | ) |
Financing activities |
|
|
|
|
|
|
|
|
|
|
|
|
Payment of deferred consideration for acquisition of businesses |
|
| (4.2 | ) |
|
| (0.8 | ) |
|
| (1.0 | ) |
Proceeds from borrowings on revolving credit facility |
|
| — |
|
|
| 95.0 |
|
|
| 16.0 |
|
Repayment of revolving credit facility |
|
| — |
|
|
| (105.0 | ) |
|
| (46.0 | ) |
Repayment of principal on term loan |
|
| (5.7 | ) |
|
| (5.7 | ) |
|
| (5.7 | ) |
Cash dividends paid |
|
| — |
|
|
| (5.4 | ) |
|
| (21.3 | ) |
Repurchase of common stock |
|
| (12.4 | ) |
|
| (0.9 | ) |
|
| (8.3 | ) |
Proceeds from issuance of redeemable convertible preferred stock |
|
| — |
|
|
| 400.1 |
|
|
| — |
|
Payment of redeemable convertible preferred stock offering costs |
|
| — |
|
|
| (17.4 | ) |
|
| — |
|
Proceeds from issuance of common stock under equity plans |
|
| 0.1 |
|
|
| 0.2 |
|
|
| 4.3 |
|
Net cash (used in) provided by financing activities |
|
| (22.2 | ) |
|
| 360.1 |
|
|
| (62.0 | ) |
Net (decrease) increase in cash and cash equivalents |
|
| (64.1 | ) |
|
| 285.7 |
|
|
| (10.9 | ) |
Cash and cash equivalents |
|
|
|
|
|
|
|
|
|
|
|
|
Beginning of year |
|
| 295.3 |
|
|
| 9.6 |
|
|
| 20.5 |
|
End of year |
| $ | 231.2 |
|
| $ | 295.3 |
|
| $ | 9.6 |
|
Supplemental disclosures of cash flow information |
|
|
|
|
|
|
|
|
|
|
|
|
Cash paid for income taxes |
| $ | 0.2 |
|
| $ | 1.1 |
|
| $ | 11.9 |
|
Cash paid for interest |
| $ | 13.8 |
|
| $ | 18.5 |
|
| $ | 28.8 |
|
|
|
|
|
|
|
|
|
|
|
|
|
|
Supplemental schedule of non-cash investing and financing activities |
|
|
|
|
|
|
|
|
|
|
|
|
Contingent consideration related to 2021 acquisitions |
| $ | 24.0 |
|
| $ | — |
|
| $ | — |
|
Contingent consideration related to 2020 acquisitions |
| $ | — |
|
| $ | 10.4 |
|
| $ | — |
|
Deferred payment related to 2020 acquisitions |
| $ | — |
|
| $ | 2.0 |
|
| $ | — |
|
Contingent consideration related to 2019 acquisition |
| $ | — |
|
| $ | 2.9 |
|
| $ | 4.3 |
|
Fair value of common stock issued related to 2020 acquisition |
| $ | — |
|
| $ | 4.4 |
|
| $ | — |
|
(in millions) |
| 2023 |
|
| 2022 |
|
| 2021 |
| |||
Supplemental disclosures of cash flow information |
|
|
|
|
|
|
|
|
| |||
Cash paid for income taxes |
| $ | 6.9 |
|
| $ | 25.6 |
|
| $ | 0.2 |
|
Cash paid for interest |
| $ | 38.1 |
|
| $ | 22.5 |
|
| $ | 13.8 |
|
|
|
|
|
|
|
|
|
| ||||
Supplemental schedule of non-cash investing and financing activities |
|
|
|
|
|
|
|
|
| |||
Contingent consideration related to 2023 acquisition |
| $ | 0.7 |
|
| $ | — |
|
| $ | — |
|
Contingent consideration related to 2022 acquisitions |
| $ | — |
|
| $ | 6.9 |
|
| $ | — |
|
Contingent consideration related to 2021 acquisitions |
| $ | — |
|
| $ | 8.9 |
|
| $ | 24.0 |
|
Amended and Restated Term Loan Facility |
| $ | (175.9 | ) |
| $ | — |
|
| $ | — |
|
Extended Term Loan Facility |
| $ | 175.9 |
|
| $ | — |
|
| $ | — |
|
The accompanying notes are an integral part of these consolidated financial statements.
78
Emerald Holding, Inc.
Notes to Consolidated Financial Statements
Note 1. Description of Business and Summary of Significant Accounting Policies
Emerald Holding, Inc. (“Emerald” or “the Company”) is a corporation formed on April 26, 2013, under the laws of the State of Delaware. Emerald is majority owned by investment funds managed by an affiliate of Onex Partners Manager LP (“Onex Partners”).
The Company is a leading operator of large business-to-business (“B2B”) trade shows in the United States (“U.S.”). The Company operates in a number of broadly-defined industry sectors: Retail; Design; Technology; Equipment; and Safety & Security. Each of the Company’s events are typically held at least once per year and provide a venue for exhibitors to launch new products, develop sales leads and promote their brands.
In addition to organizing trade shows, conferences and other events (collectively, “Events”), the Company operates websites and related digital products, and produces publications, each of which is aligned with a specific sector for which it organizes an event. The Company also offers B2B ecommercee-commerce and digital merchandising solutions to manufacturers and retailers, through its Elastic Suite and FlexBulletin platforms.
Basis of Presentation
The consolidated financial statements include the operations of the Company and its wholly-owned subsidiaries. These consolidated financial statements are presented in conformity with accounting principles generally accepted in the United States of America (“U.S. GAAP”). All intercompany transactions, accounts and profits, if any, have been eliminated in the consolidated financial statements.
The Company had no items of other comprehensive loss;(loss) income; as such, its comprehensive loss(loss) income is the same as net loss(loss) income for all periods presented.
Liquidity Position and Management’s Plans
In March 2020, the World Health Organization categorized the Coronavirus Disease 2019 (“COVID-19”) as a pandemic, and the PresidentResults of the United States declared the COVID-19 outbreak a national emergency. In conjunction with this declaration and the spread of COVID-19 across the United States, recommendations and mandates were handed down by various local, state and federal government agencies regarding social distancing, containment areas and against large gatherings, as well as quarantine requirements. In addition, travel restrictions were imposed by the United States and foreign governments, and by companies with respect to their employees, and various event venues announced indefinite closures. As a result of these and various other factors, management made the decision to cancel substantially all of the Company’s face-to-face events scheduled through the end of 2020. In addition, beginning in October 2020 management announced the cancellation or postponement of numerous live events that were scheduledour reportable segments for the first half of 2021, including all but several relatively small live events staging in the first six months of 2021. Following the reopening of most major municipalities in the United States in June 2021, the Company traded 56 in-person events during the second half of 2021. As expected, the continued effects of COVID-19 related issues such as international travel restrictions and the need to postpone several events, negatively impacted the financial results of the Company’s fiscal year 2021. While travel restrictions on international travelers to the United States were lifted in the fourth quarter of 2021, the ongoing effects of COVID-19 on the Company’s operations and event calendar have had, and will continue to have, a material negative impact on its financial results and liquidity, and such negative impact may continue beyond the containment of such outbreak.
The assumptions used to estimate the Company’s liquidity are subject to greater uncertainty because the Company has never previously cancelled all upcoming events for a period of multiple months and years due to a pandemic where the timing for resolution and ultimate impact of the pandemic remains uncertain. Although the Company has largely resumed nearly all of its event operations, management still cannot estimate with certainty whether event exhibitors and attendees will attend the Company’s events at levels close to pre-pandemic levels. Therefore, current estimates of revenues and the associated impact on liquidity could differ materially in the future. During the years ended December 31, 2023, 2022 and 2021 and 2020,reflect the Company implemented several actionsupdated segment presentation discussed below in Note 18, Segment Information.
Reclassifications
Certain reclassifications have been made to preserve cash and strengthen its liquidity position, including, but not limited to:
|
|
|
|
|
|
|
|
Further, Emerald maintains event cancellation insuranceprior year amounts to protect against losses dueconform to the unavoidable cancellation, postponement, relocation and enforced reduced attendance at events due to certain covered events. Specifically, for the policies covering calendar years 2021 and 2020, Emerald is insured for losses due to event cancellations caused by the outbreak of communicable diseases, including COVID-19. However, Emerald’s renewed event cancellation insurance policies for the calendar year 2022 do not cover losses due to event cancellations caused by the outbreak of communicable diseases, including COVID-19. Coverage for each of the Company’s event cancellation insurance policies extends to include additional promotional and marketing expenses necessarily incurred by us should a covered loss occur. These policies also include a terrorism endorsement covering an act of terrorism and/or threat of terrorism directed at the insured event or within the United States or its territories. The aggregate limit under these event cancellation insurance policies is approximately $191.1 million in 2020, $191.4 million in 2021 and $100.0 million in 2022 if losses arise for reasons within the scope of these policies. current year’s presentation.
In addition to these primary policies, Emerald maintains separate event cancellation insurance policies for the Surf Expo Summer 2020, Surf Expo Winter 2021, Surf Expo Winter 2022 and Surf Expo Summer 2022 shows, with respective coverage limits of $6.0 million, $7.7 million, $8.4 million and $6.5 million. Similar to the primary event cancellation insurance policies, coverage for the outbreak of communicable disease, including COVID-19, is included for the policies covering Surf Expo Summer 2020 and Surf Expo Winter 2021, but not included for the policies covering Surf Expo Winter 2022 and Surf Expo Summer 2022.
The Company is in the process of pursuing claims under the 2021 and 2020 insurance policies to offset the financial impact of cancelled events as a result of COVID-19. To date, the Company has submitted claims related to impacted or cancelled events previously scheduled to take place in 2021 and 2020 of approximately $82.3 million and $167.0 million, respectively. Other income recognized to date, related to insurance proceeds received or confirmed on the claims related to events previously scheduled to take place in 2021 and 2020, totaled $43.0 million and $141.4 million, respectively. During the years ended December 31, 2021 and 2020, the Company recorded Other income of $77.4 million and $107.0 million, respectively, related to event cancellation insurance claim proceeds deemed to be realizable. Outstanding claims are subject to review and adjustment and there is no guarantee or assurance as to the amount or timing of future recoveries from Emerald’s event cancellation insurance policies.
On March 27, 2020, the U.S. government enacted the Coronavirus Aid, Relief, and Economic Security Act (“CARES Act”), which provides for the ability of employers to delay payment of employer payroll taxes during 2020 after the date of enactment. As a result, the payment of approximately $1.8 million of employer payroll taxes otherwise due in 2020 was delayed, with 50% due by December 31, 2021 and the remaining 50% due by December 31, 2022. The Company paid $0.9 million of the deferred employer payroll taxes in December 2021.
As of December 31, 2021, the Company had $519.7 million of borrowings outstanding under the Amended and Restated Term Loan Facility and 0 borrowings outstanding under the Revolving Credit Facility. As of December
31, 2021, the Company was in compliance with the covenants contained in the Amended and Restated Senior Secured Credit Facilities.
Based on these actions, assumptions regarding the impact of COVID-19, and expected insurance recoveries, management believes that the Company’s current financial resources will be sufficient to fund its liquidity requirements for at least the next twelve months.
Use of Estimates
The preparation of financial statements in conformity with U.S. GAAP requires management to make estimates and assumptionsjudgments that affect the amounts reported amounts of assets and liabilities,disclosed in the disclosure of contingent assets and liabilities at the date of theconsolidated financial statements and accompanying notes. Actual results could differ materially from those estimates. On an ongoing basis, the reported amount of revenuesCompany evaluates its estimates and expenses during the reporting periods. Significant estimates include, butjudgments compared to historical experience and expected trends. The COVID-19 pandemic and related effects are not limited to, allowance for credit losses, useful lives of intangible assets, long-lived assetdynamic and goodwill impairmentsongoing, and assumptions used in valuing the Company’s allocation of purchase price, including acquired deferred revenues, intangible assets, contingent consideration and goodwill, deferred taxes and stock-based compensation expense. In March 2020, the COVID-19 outbreak was declared a pandemic. While the nature of the situation is dynamic, the Company has considered theits impact when developing its estimates and assumptions. Actual results and outcomes may differ from management's estimates and assumptions.
Cash and Cash Equivalents
The Company maintains its cash in bank deposit accounts and in money market mutual funds, which at times may exceed federally insured limits. As of December 31, 20212023 and 2020,2022, the Company held $209.7$177.0 million and $291.1$91.6 million of money market mutual funds, respectively, which are highly liquid and quoted in active markets. The Company considers cash deposits in banks and money market mutual funds with original maturities at purchase of three months or less to be cash equivalents. As of December 31, 20212023 and 2020,2022, amounts receivable from credit card processors, totaling $0.3$0.4 million and $0.2$0.3 million, respectively, are considered cash equivalents because they are short-term, highly liquid in nature and they are typically converted to cash within three days of the sales transaction.
79
Marketable Securities
The Company purchased $50.0 million in marketable securities during the year ended December 31, 2022. These matured during the same year and therefore the Company no longer held any marketable securities as of December 31, 2022, and did not purchase any marketable securities in the year ended December 31, 2023. Therefore, there were no unrealized holding gains or losses at December 31, 2023 or December 31, 2022. The Company has in the past held, and may from time to time, hold marketable securities that consist of certificates of deposit with financial institutions with maturities over three months and up to one year. These have historically been classified as marketable debt securities as their underlying investments primarily consist of corporate debt securities. These certificates of deposits have readily ascertainable values as they can be readily purchased or sold using established markets. These investments are generally classified as available-for-sale and reported at fair value. Fair value is generally based on available market information including quoted broker or dealer quotations, or other observable inputs.
The Company may invest its marketable securities in high-quality commercial financial instruments.
Fair Value Measurements
Fair value is the price that would be received to sell an asset or paid to transfer a liability in an orderly transaction between market participants at the measurement date. U.S. GAAP provides an established hierarchy and framework for inputs used to measure fair value. The fair value hierarchy gives the highest priority to inputs using quoted prices in active markets for identical assets or liabilities (Level 1) and the lowest priority to unobservable inputs (Level 3). Inputs are broadly defined as assumptions market participants would use in pricing an asset or liability. There are three levels of inputs that may be used to measure fair value:
| • Level 1 – includes financial instruments for which there are quoted market prices in active markets for identical assets or liabilities. • Level 2 – includes financial instruments for which there are observable market-based inputs for similar assets or liabilities that are corroborated by market data. • Level 3 – includes financial instruments for which unobservable inputs that are not corroborated by market datawhich fair value is derived from valuation techniques in which one or more significant inputs are unobservable, including the Company’s own assumptions.
|
|
|
|
|
|
Assets and liabilities measured at fair value are classified based on the lowest level of input that is significant to the fair value measurement. The inputs to the determination of fair value are based upon the best information in the circumstances and may require significant management judgment or estimation. A significant adjustment to a Level 2 input could result in the Level 2 measurement becoming a Level 3 measurement.
The Company’s contingent consideration liabilities related to theacquisitions made in 2023, 2022 and 2021 Acquisitions, 2020 Acquisitions and 2019 Acquisition are classified as Level 3 liabilities, which are measured at fair value based on significant unobservable
inputs and re-measured to an updated fair value at each reporting period. Refer to Note 9, Fair Value Measurements, for further information related to the Company’s contingent consideration.
The Company’s market-based share award liabilities are classified as Level 3 liabilities, which are measured at fair value, and are re-measured to an updated fair value at each reporting period. Refer to Note 12, Stock-basedStock-Based Compensation, for further information related to the Company’s market-based based share awards.
The Company’s money market mutual funds are quoted in an active market and classified as Level 1 assets, which are measured at fair value based on the closing price of these assets as of the reporting date. Refer to Note 9, Fair Value Measurements, for further information related to the Company’s money market mutual funds.
80
Financial Instruments
The Company’s financial instruments consist primarily of cash and cash equivalents, accounts receivable, accounts payable and certain accrued liabilities. Accounts receivable, accounts payable and certain accrued liabilities are carried at cost, which management believes approximates fair value because of the short-term maturity of these instruments. Cash and cash equivalents are recorded at fair value. Financial instruments also include the Company’s revolving credit facility and senior term loan with third party financial institutions.
Cash and cash equivalents, accounts receivable, and the revolving credit facility and term loan potentially subject the Company to concentrations of credit risk. To minimize the risk of credit loss for cash and cash equivalents, these financial instruments are primarily held with large, reputable financial institutions in the United States. As of December 31, 20212023 and 2020,2022, the Company’s uninsured cash and cash equivalents balances totaled $231.2$204.2 million and $295.3$239.1 million, respectively. As of December 31, 20212023 and 2020,2022, the Company’s trade receivables balances totaled $46.4$85.2 million and $30.7$74.9 million, respectively. No single customer accounts for more than 10% of gross accounts receivable as of December 31, 20212023 or 2020.2022. As of December 31, 20212023 and 2020,2022, an allowance for credit losses was recorded to account for potential credit losses. Credit risk with respect to trade receivables is low due to the Company’s large customer base dispersed across different industries.
As of December 31, 20212023 and 2020,2022, the fair value and carrying value of the Company’s debt is summarized in the following table:
|
| December 31, 2023 |
| |||||
(in millions) |
| Fair |
|
| Carrying |
| ||
Extended Term Loan Facility, with |
| $ | 415.0 |
|
| $ | 413.3 |
|
Total |
| $ | 415.0 |
|
| $ | 413.3 |
|
|
| December 31, 2021 |
|
| December 31, 2022 |
| ||||||||||
(in millions) |
| Fair Value |
|
| Carrying Value |
|
| Fair |
|
| Carrying |
| ||||
Amended and Restated Term Loan Facility, with interest at LIBOR plus 2.50% (equal to 2.59%) at period end, including short-term portion |
| $ | 493.6 |
|
| $ | 519.7 |
| ||||||||
Amended and Restated Term Loan Facility, with |
| $ | 404.9 |
|
| $ | 415.3 |
| ||||||||
Total |
| $ | 493.6 |
|
| $ | 519.7 |
|
| $ | 404.9 |
|
| $ | 415.3 |
|
|
| December 31, 2020 |
| |||||
(in millions) |
| Fair Value |
|
| Carrying Value |
| ||
Amended and Restated Term Loan Facility, with interest at LIBOR plus 2.50% (equal to 2.65%) at period end, including short-term portion |
| $ | 491.1 |
|
| $ | 525.4 |
|
Total |
| $ | 491.1 |
|
| $ | 525.4 |
|
|
|
|
|
|
|
|
|
|
The difference between the carrying value and fair value of the Company’s variable-rate term loan is due to the difference between the period-end market interest rates and the projected market interest rates over the term of the loan, as well as the financial performance of the Company since the issuance of the debt. In addition, the carrying value is net of discounts. The Company estimated the fair value of its variable-rate debt using observable market-based inputs that are corroborated by market data (Level 2 inputs).
Trade and Other Receivables
The Company extends non-interest bearing trade credit to its customers in the ordinary course of business which is not collateralized. Accounts receivable are presented on the face of the consolidated balance sheets, net of allowance for credit losses. The Company monitors collections and payments from its customers and maintains an allowance based upon applying an expected credit loss rate to receivables based on the historical loss rate from similar higher risk customers adjusted for current conditions, including any specific customer collection issues identified, and forecasts of economic conditions.
81
Prepaid Expenses
Prepaid expenses are primarily comprised of prepaid event costs. The Company pays certain direct event costs, such as facility rental deposits and insurance costs, in advance of the event. Such costs are deferred in prepaid expenses on the consolidated balance sheets when paid and reported on the consolidated statements of loss(loss) income and comprehensive loss(loss) income as cost of revenues upon the staging of the event.
Property and Equipment
Property and equipment is carried at cost less accumulated depreciation and impairment losses, if any. Property and equipment is depreciated on a straight-line basis over the estimated useful lives of 1 to 10 years (shorter of economic useful life or lease term) for leasehold improvements and 1 to 10 years for equipment, which includes computer hardware and office furniture.
Definite-lived Intangible Assets
Definite-lived intangible assets consist of certain trade names, acquired technology, customer relationships and other amortized intangible assets. Definite-lived intangible assets are amortized over their estimated useful lives based on the pattern of expected economic benefit.Intangible assets with finite lives are stated at cost, less accumulated amortization and impairment losses, if any.
Estimated
| Weighted
| |||
Customer |
| 9 years | ||
Definite-lived trade names |
|
| ||
Acquired technology | 1.5-7 years |
| ||
|
|
| ||
Computer software | 1-7 years | 4 years |
Refer to Note 6, Intangible Assets and Goodwill, for definite-liveddefinite-lived intangible asset impairments recorded during the years ended December 31, 2021, 20202023, 2022 and 2019.2021.
Impairment of Long-Lived Assets Other than Goodwill and Indefinite-Lived Intangible Assets
Long-lived assets other than goodwill and indefinite-lived intangible assets, held and used by the Company, including property and equipment and long-lived intangible assets, are reviewed for impairment whenever events or changes in circumstances indicate that the carrying amount of the assets may not be recoverable. The Company conducts the long-lived asset impairment analysis at the asset group level. The Company evaluates recoverability of assets to be held and used by comparing the carrying amount of an asset to the future net undiscounted cash flows expected to be generated by the asset to determine if the carrying value is not recoverable. If the carrying value is not recoverable, the Company fair values the asset and compares the resulting amount to the carrying value. If the asset is considered to be impaired, the impairment loss is measured as the amount by which the carrying amount of the asset exceeds its fair value.Refer to Note 6, Intangible Assets and Goodwill, for long-lived assets other than goodwill and indefinite-lived intangible assets impairments recorded during the years ended December 31, 2021, 20202023, 2022 and 2019.2021.
Indefinite-Lived Intangible Assets
The Company’s indefinite-lived intangible assets consist of trade names. Indefinite-lived intangible assets are tested annually for impairment at October 31, or between annual tests if the Company becomes aware of an event or a change in circumstances that would indicate the carrying value of an asset group may be impaired. The Company conducts its impairment analysis by grouping assets and liabilities at the lowest level for which identifiable cash flows are largely independent of the cash flows of other assets and liabilities and has determined it has multiple asset groups that are typically at the trade show brand level. The Company has the option to first assess qualitative factors to determine whether it is more likely than not that an indefinite-lived intangible asset group is impaired. To perform a qualitative assessment, the Company must identify and evaluate changes in economic, industry and entity-specific events and circumstances that could affect the significant inputs used to determine the fair value of an indefinite-lived
82
intangible asset group. If the result of the qualitative analysis indicates it is more likely than not that an indefinite-lived intangible asset group is impaired, a fair value calculation will be performed to measure the amount of impairment losses to be recognized, if any.
The fair values of the Company’s indefinite-lived trade name asset groups are calculated using a form of the income approach referred to as the “relief from royalty payments” method. The royalty rates are estimated using evidence of identifiable transactions in the marketplace involving the licensing of trade names similar to those owned by the Company. The fair value of the trade name is then compared to the carrying value of each trade name. If the carrying amount of the trade name exceeds its fair value, an impairment loss would be reported. Determining the fair value of an indefinite-lived intangible asset group requires the application of judgment and involves the use of significant estimates and assumptions. These estimates and assumptions, including projections of future cash flows, which include forecasted revenue, growth rates, weighted average cost of capital,EBITDA margin, discount rate, tax rate, and royalty rates.rate. The Company bases its fair value estimates on assumptions it believes to be reasonable, but which are unpredictable and inherently uncertain. Actual future results may differ from the estimates. Refer to Note 6, Intangible Assets and Goodwill, for the indefinite-lived intangible asset impairments recorded during the years ended December 31, 2021, 20202023, 2022 and 2019.2021.