| x | ANNUAL REPORT PURSUANT TO SECTION 13 OR 15(d) OF THE SECURITIES EXCHANGE ACT OF 1934 | ||||
29, 2023
| o | TRANSITION REPORT PURSUANT TO SECTION 13 OR 15(d) OF THE SECURITIES EXCHANGE ACT OF 1934 | ||||
| Cayman Islands | Not Applicable | |||||||||||||
(State or other jurisdiction of
incorporation or organization) | (IRS Employer Identification No.) | |||||||||||||
zip code)
Not Applicable
(Former name or former address, if changed since last report)
Title of each class | Trading Symbol(s) | Name of each exchange on which registered | ||||||||||||
Ordinary Shares, par value $0.0001 per share | ICHR | The NASDAQ Stock Market LLC | ||||||||||||
None
o
x
o
o
| Large accelerated filer |
| Accelerated filer |
| |||||||||||||||||
| Non-accelerated filer |
| Smaller reporting company |
| |||||||||||||||||
| Emerging Growth Company |
| o | ||||||||||||||||||
o
x
x
There are no non-voting ordinary shares.
| Page | ||||||||
| ||||||||
|
| |||||||
|
| |||||||
ITEM 1B. |
| |||||||
| ||||||||
| ||||||||
| ||||||||
| ||||||||
| ||||||||
| ||||||||
| ||||||||
| ||||||||
| ||||||||
| ||||||||
| ||||||||
| ||||||||
| ||||||||
| ||||||||
| ||||||||
| ||||||||
| ||||||||
| ||||||||
| ||||||||
| Fiscal Period | Period Ending | Weeks in Period | ||||||||||||
Fiscal Year 2023: | December 29, 2023 | 52 | ||||||||||||
| First Quarter | March 31, 2023 | 13 | ||||||||||||
| Second Quarter | June 30, 2023 | 13 | ||||||||||||
| Third Quarter | September 29, 2023 | 13 | ||||||||||||
| Fourth Quarter | December 29, 2023 | 13 | ||||||||||||
| Fiscal Year 2022: | December 30, 2022 | 52 | ||||||||||||
| First Quarter | April 1, 2022 | 13 | ||||||||||||
| Second Quarter | July 1, 2022 | 13 | ||||||||||||
| Third Quarter | September 30, 2022 | 13 | ||||||||||||
| Fourth Quarter | December 30, 2022 | 13 | ||||||||||||
| Fiscal Year 2021: | December 31, 2021 | 53 | ||||||||||||
First Quarter | March 26, 2021 | 13 | ||||||||||||
Second Quarter | June 25, 2021 | 13 | ||||||||||||
Third Quarter | September 24, 2021 | 13 | ||||||||||||
Fourth Quarter | December 31, 2021 | 14 | ||||||||||||
|
|
| ||||||||||||
|
|
| ||||||||||||
|
|
| ||||||||||||
|
|
| ||||||||||||
|
|
| ||||||||||||
|
|
| ||||||||||||
|
|
| ||||||||||||
|
|
| ||||||||||||
|
|
| ||||||||||||
|
|
| ||||||||||||
Company Overview
| Company Overview | ||
The broad technical expertise of our engineering team, coupled with our early customer engagement approach, enables us to offer innovative and reliable solutions to complex fluid delivery challenges. With over two decades of experience developing complex fluid delivery subsystems and meeting the constantly changing production requirements of leading semiconductor OEMs, we have developed expertise in fluid delivery that we offer to our OEM customers. In addition, our capital efficient model provides us the flexibility to fulfill increased demand and meet changing customer requirements with relatively low levels of capital expenditures. With an aim to provide superior customer service, we have a global footprint with many facilities strategically located in close proximity to our customers. We have long standing relationships with top tier OEM customers, including Applied Materials, Lam Research, Applied Materials, and ASML, which were our three largest customers by sales in 2021.
2023.
Our Competitive Strengths
| Our Competitive Strengths | ||
Over our 20‑plus year
Capital Efficient and Scalable Business Model
Our Growth Strategy
| Our Growth Strategy | ||
Continue to Improve Our Manufacturing Process Efficiency
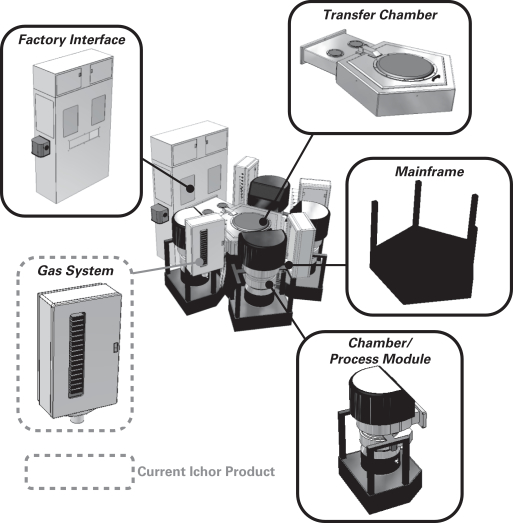
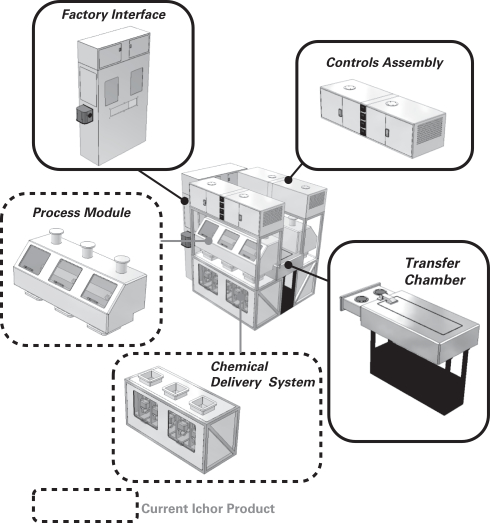
Our Products and Services
| Our Products and Services | ||


History
| History | ||
|
|
•In April 2012, we acquired Semi Scenic UK Limited to provide refurbishment services for legacy tools. |
|
•In April 2016, we purchased Ajax-United Patterns & Molds, Inc. for $17.6 million to add chemical delivery subsystem capabilities with existing customers. |
|
|
|
•In December 2017 we acquired Talon Innovations Corporation for $137.8 million to add to our gas delivery subsystem, precision machining, and component manufacturing capabilities. |
|
•In April 2018, we acquired IAN Engineering Co., Ltd. for $6.5 million to provide us exposure to and growth opportunities in the Korean semiconductor capital equipment market. |
|
•In December 2020, we acquired certain operating assets and assumed the operations of a business in Nogales, Mexico for $5.0 million to increase our precision machined component manufacturing capacity. |
|
Customers, Sales and Marketing
| Customers, Sales, and Marketing | ||
Operations, Manufacturing and Supply Chain Management
| Operations, Manufacturing, and Supply Chain Management | ||
Manufacturing
Technology Development and Engineering
| Technology Development and Engineering | ||
Competition
| Competition | ||
The fluid delivery subsystem market is concentrated, and we face competition, primarilyfor example, from Ultra Clean Technology, with additional competition from other regional suppliers. The chemical delivery subsystem, weldments, and precision machining industries are fragmented, and we face competition from numerous smaller suppliers. In addition, the market for tool refurbishment is fragmented, and we compete with many regional competitors. The primary competitive factors we emphasize include:
|
|
•customer relationships; |
|
•early engagement with customers; |
|
•large and experienced engineering staff; |
|
•design-to-delivery cycle times; and |
|
Intellectual Property
| Intellectual Property | ||
Human Capital Resources
| Human Capital Resources | ||
Total Rewards
In addition, we support employee resource groups to increase employee engagement and to grow and foster talent.
| Environmental, Health, and Safety Regulations | ||
| Available Information | ||
Our internet address is ichorsystems.com. We make a variety of information available, free of charge, at our Investor Relations website, ir.ichorsystems.com. This information includes our Annual Reports on Form 10‑K, our Quarterly Reports on Form 10‑Q, our Current Reports on Form 8‑K, and any amendments to those reports as soon as reasonably practicable after we electronically file those reports with or furnish them to the Securities and Exchange Commission (“SEC”),SEC, as well as our Code of Business Ethics and Conduct and other governance documents.
Risk Factor Summary
| Risk Factor Summary | ||
|
|
•Our business depends significantly on expenditures by manufacturers in the semiconductor capital equipment industry. |
|
•We rely on a very small number of OEM customers for a significant portion of our sales. |
|
•Our customers exert a significant amount of negotiating leverage over us. • | The industries in which we participate are highly competitive and rapidly evolving. •We are exposed to risks associated with weakness in the global economy and geopolitical instability. •If we do not keep pace with developments in the industries we serve and with technological innovation generally, our products and services may not be competitive. •We must design, develop, and introduce new products that are accepted by OEMs in order to retain our existing customers and obtain new customers. •Acquisitions may present integration challenges, and the goodwill, indefinite-lived intangible assets, and other long-term assets recorded in connection with such acquisitions may become impaired. •We are subject to fluctuations in foreign currency exchange rates. 11 Business and |
|
|
|
|
|
|
|
|
|
|
|
|
Operational Risks
|
|
•The manufacturing of our products is highly complex. |
|
•Defects in our products could damage our reputation, decrease market acceptance of our products, and result in potentially costly litigation. |
|
•We may incur unexpected warranty and performance guarantee claims. |
|
•Our dependence on a limited number of suppliers may harm our production output and increase our costs. |
|
•We may face supply chain disruptions, manufacturing interruptions or delays. |
|
•We are subject to order and shipment uncertainties. |
|
•Our customers generally require that they qualify our engineering, documentation, manufacturing and quality control procedures. |
|
•We may be subject to interruptions or failures in our information technology systems. |
|
•Certain of our customers require that we consult with them in connection with specified fundamental changes in our business. |
|
•Our business is largely dependent on the know-how of our employees, and we generally do not have an intellectual property position that is protected by patents. |
|
•Our business will suffer if we are unable to attract, hire, integrate, and retain key personnel and other necessary employees, particularly in the highly competitive technology labor market, or if we experience labor disruptions at our facilities. |
|
|
|
•Our business is subject to a variety of U.S. and international laws, rules, policies, and other obligations regarding privacy, data protection, and other matters. |
|
•Third parties have claimed and may in the future claim we are infringing their intellectual property. |
|
•From time to time, we may become involved in other litigation and regulatory proceedings. |
|
•As a global company, we are subject to the risks of doing business internationally. |
|
•Changes in U.S. or international trade policy, tariffs, and import/export regulations may have a material adverse effect on our business. |
|
•We are subject to numerous environmental laws and regulations. |
|
•Failure to maintain effective internal controls in accordance with Section 404 of the Sarbanes-Oxley Act could have a material adverse effect on our business. |
|
•We previously identified material weaknesses in our internal control over financial reporting, and the failure to maintain an effective system of internal controls and procedures may cause investors to lose confidence in our financial reporting. |
|
•Changes in tax laws, tax rates or tax assets and liabilities could materially adversely affect our financial condition and results of operations. |
|
|
|
Liquidity and Capital Resources Risks
|
|
•We have a substantial amount of indebtedness and are subject to restrictive covenants. |
|
| Economic and | ||
|
|
|
|
|
|
|
|
|
|
|
|
|
|
|
|
Economic and Strategic Risks
Our business depends significantly on expenditures by manufacturers in the semiconductor capital equipment industry, which, in turn, is dependent upon the semiconductor device industry. When that industry experiences cyclical downturns, demand for our products and services is likely to decrease, which would likely resultgenerally decreases, resulting in decreased sales. We may also be forced to reduce our prices during cyclical downturns without being able to proportionally reduce costs.
In addition, we must be able to appropriately align our cost structure with prevailing market conditions, effectively manage our supply chain and motivate and retain employees, particularly during periods of decreasing demand for our products. We may be forced to reduce our prices during periods of decreasing demand. While we operate under a low fixed cost model, we may not be able to proportionally reduce all of our costs if we are required to reduce our prices. If we are not able to timely and appropriately adapt to the changes in our business environment, our business, financial condition and results of operations will be materially adversely affected. The cyclical and volatile nature of the semiconductor device industry and the absence of long-term fixed or minimum volume contracts make any effort to project a material reduction in future sales volume difficult. If we are not able to timely and appropriately adapt to the changes in our business environment, our business, financial condition and results of operations will be materially adversely affected as a result of, for example, underutilization of capacity, charges related to obsolete inventory, asset impairment or inventory write-downs, increased operating expenses or reduced margins. Further, any capacity expansion by us or our competitors could also lead to overcapacity in our target markets, which could lead to price erosion that could adversely impact our operating results.
Certain of our competitors may have or may develop greater financial, technical, manufacturing and marketing resources than we do. As a result, they may be able to respond more quickly to new or emerging technologies and changes in customer requirements, devote greater resources to the development, promotion, sale and support of their products and services, and reduce prices to increase market share. In addition to organic growth by our competitors, there may be merger and acquisition activity among our competitors and potential competitors that may provide our competitors and potential competitors with an advantage over us by enabling them to expand their product offerings and service capabilities to meet a broader range of customer needs. The introduction of new technologies and new market entrants may also increase competitive pressures.
The withdrawal
Our business has been adversely affected by the COVID‑19 pandemic and we continue to face risks related to COVID‑19 which could significantly disrupt our operations, customer demand, and our suppliers’ ability to support us, resulting in material adverse impacts to our business, financial condition, operating results, and cash flows.Contents
COVID-19 has had, and continues to have, a significant impact around the world, prompting governments and businesses to take unprecedented measures in response. Such measures have included restrictions on travel and business operations, temporary closures of businesses, and quarantine and shelter-in-place orders. The COVID-19 pandemic has at times significantly curtailed global economic activity and caused significant volatility and disruption in global financial markets.
Shelter-in-place orders and other measures, including work-from-home and social distancing policies implemented to protect employees, have resulted in reduced workforce availability at product manufacturing sites, construction delays, and reduced output at some of our vendors and suppliers. Restrictions on our access to or operation of manufacturing facilities or on our support operations or workforce, or similar limitations for our vendors and suppliers, can impact our ability to meet customer demand and could have a material adverse effect on our financial condition and results of operations, particularly if prolonged. Similarly, current and future restrictions or disruptions of transportation, such as reduced availability of air transport, port closures, and increased border controls or closures, can also impact our ability to meet demand and could materially adversely affect us. Our customers have experienced, and may continue to experience, disruptions in their operations and supply chains, which can result in delayed, reduced, or canceled orders, or collection risks, and which may adversely affect our results of operations.
The spread of COVID‑19 has caused us to modify our business practices (including employee travel, employee work locations, cancellation of physical participation in meetings, events and conferences, and social distancing measures), and we may take further actions as may be required by government authorities or that we determine are in the best interests of our employees, customers, partners, vendors, and suppliers. Work-from-home and other measures introduce additional operational risks, including cybersecurity risks, and have affected the way we conduct our product development, validation, and qualification, customer support, and other activities, which could have an adverse effect on our operations. There is no certainty that such measures will be sufficient to mitigate the risks posed by the virus, and illness and workforce disruptions could lead to unavailability of key personnel and harm our ability to perform critical functions.
The extent of the impact of COVID‑19 on our operational and financial performance will depend on future developments outside our control, including, but not limited to, the timing, extent, trajectory and duration of the pandemic; the emergence of new variants; the development, availability and effectiveness of vaccines and treatments; and the imposition of protective public safety measures, including travel advisories and restrictions. In most countries in which we operate, the local government authorities have designated our operations as an “essential business,” which allows us to continue to operate our factories and business under specific rules and protocols designed to ensure the health and safety of our employees, suppliers, and visitors to our facilities. However, changes to this classification may result in potential closure of our operations for an uncertain duration, in turn impacting our business. Preventing the effects from, and responding to, this market disruption or any other public health threat, related or otherwise, may further increase costs of our business and may have a material adverse effect on our business, financial condition, and results of operations.
If we do not keep pace with developments in the industries we serve and with technological innovation generally, our products and services may not be competitive.
|
|
•design innovative and performance-enhancing features that differentiate our products from those of our competitors; |
|
•identify emerging technological trends in the industries we serve, including new standards for our products; |
|
•accurately identify and design new products to meet market needs; |
|
•collaborate with OEMs to design and develop products on a timely and cost-effective basis; |
|
•ramp-up production of new products, especially new subsystems, in a timely manner and with acceptable yields; |
|
•manage our costs of product development and the costs of producing the products that we sell; |
|
•successfully manage development production cycles; and |
|
We must design, develop, and introduce new products that are accepted by OEMs in order to retain our existing customers and obtain new customers.
| Business and Operational Risks | ||
Operational Risks
|
|
•cause delays in product introductions and shipments; |
|
•result in increased costs and diversion of development resources; |
|
•cause us to incur increased charges due to unusable inventory; |
|
•require design modifications; |
|
•result in liability for the unintended release of hazardous materials; |
|
•result in product warranty liability; |
|
•create claims for rework, replacement or damages under our contracts with customers, as well as indemnification claims from customers; |
|
Our dependence on a limited number of suppliers may harm our production output and increase our costs, and may prevent us from delivering acceptable products on a timely basis.
Because our customers generally require that they qualify our engineering, documentation, manufacturing and quality control procedures, our ability to add new customers quickly is limited.
We are generally required to qualify and maintain our status as a supplier for each of our customers. This is a time-consuming process that involves the inspection and approval by a customer of our engineering, documentation, manufacturing and quality control procedures before that customer will place orders with us. Our ability to lessen the adverse effect of any loss of, or reduction in sales to, an existing customer through the rapid addition of one or more new customers is limited in part because of these qualification requirements. Consequently, the risk that our business, financial condition and results of operations would be materially adversely affected by the loss of, or any reduction in orders by, any of our significant customers is increased. Moreover, if we lost our existing status as a qualified supplier to any of our customers, such customer could cancel its orders from us or otherwise terminate its relationship with us, which could have a material adverse effect on our business, financial condition and results of operations.
We may be the target of attempted cyber-attacks, computer viruses, malicious code, phishing attacks, denial of service attacks and other information security threats. In addition, to the extent artificial intelligence capabilities improve and are increasingly adopted, they may be used to identify vulnerabilities and to implement increasingly sophisticated cyber-attacks. Further, the use of artificial intelligence by us, our customers, suppliers, and third-party service providers, among others, may also introduce unique vulnerabilities. To date, cyber-attacks have not had a material impact on our financial condition, results or business; however, we could suffer material financial or other losses in the future and we are not able to predict the severity of these attacks. Our risk and exposure to these matters remains heightened because of, among other things, the evolving nature of these threats, the current global economic and political environment, our prominent size and scale, the outsourcing of some of our business operations, the ongoing shortage of qualified cyber-security professionals, and the interconnectivity and interdependence of third parties to our systems. The occurrence of a cyber-attack, breach, unauthorized access, misuse, computer virus or other malicious code or other cyber-security event could jeopardize or result in the unauthorized disclosure, gathering, monitoring, misuse, corruption, loss or destruction of confidential and other information that belongs to us, our customers, our counterparties, third-party service providers or borrowers that is processed and stored in, and transmitted through, our computer systems and networks. The occurrence of such an event could also result in damage to our software, computers or systems, or otherwise cause interruptions or malfunctions in our, our customers’, our counterparties’ or third parties’ operations. This could result in significant losses, loss of customers and business opportunities, reputational damage, litigation, regulatory fines, penalties or intervention, reimbursement or other compensatory costs, or otherwise materially adversely affect our business, financial condition or results of operations.
|
|
•entering into any new line of business; |
|
•amending or modifying our organizational documents; |
|
•selling all or substantially all of our assets, or merging or amalgamating with a third party; |
|
•incurring borrowings in excess of a specific amount; |
|
|
|
•entering into any joint venture arrangement. |
|
The technology labor market is very competitive, and ourOur business will suffer if we are unable to attract, hire, integrate and retain key personnel.
personnel and other necessary employees, particularly in the highly competitive technology labor market, or if we experience labor disruptions at our facilities.
We do not maintain key-man life insurance with respect to any
| Legal and Regulatory Risks | ||
Legal and Regulatory Risks
In addition to any litigation related to our intellectual property rights, we
|
|
•the imposition of governmental controls or changes in government regulations, including tax regulations; |
|
•difficulties in enforcing our intellectual property rights; |
|
•difficulties in developing relationships with local suppliers; |
|
•difficulties in attracting new international customers; |
|
•difficulties in complying with foreign and international laws and treaties; |
|
•restrictions on the export of technology, including those based on positions taken by governmental agencies regarding possible national, commercial or security issues posed by the development, sale or export of certain products and technologies; |
|
•compliance with U.S. and international laws involving international operations, including the Foreign Corrupt Practices Act, export control laws and export license requirements; |
|
•difficulties in achieving headcount reductions due to unionized labor and works councils; |
|
•restrictions on transfers of funds and assets between jurisdictions; |
|
•geo-political instability; |
|
changes, and we may face competition from companies that exist in a more favorable legal or regulatory environment than we do who are able to sell products for certain applications to certain customers that we are prohibited from selling to under applicable export controls, for example.
There are limitations on the effectiveness of controls, and the failure of our control systems may materially and adversely impact us.
We do not expect that disclosure controls or internal controls over financial reporting will prevent all errors and all fraud. A control system, no matter how well designed and operated, can provide only reasonable, not absolute, assurance that the control system’s objectives will be met. Further, the design of a control system must reflect the fact that there are resource constraints and the benefits of controls must be considered relative to their costs. Because of the inherent limitations in all control systems, no evaluation of controls can provide absolute assurance that all control issues and instances of fraud, if any, have been detected. Failure of our control systems to prevent error or fraud could have a material adverse effect on our business, financial condition and results of operations.
Compliance with SEC rules relating to “conflict minerals” may require us and our suppliers to incur substantial expense and may result in disclosure by us that certain minerals used in products we manufacture are not “DRC conflict free.”
Section 1502 of the Dodd-Frank Wall Street Reform and Consumer Protection Act, or the Dodd-Frank Act, required the SEC to promulgate rules requiring disclosure by a public company of any “conflict minerals” (tin, tungsten, tantalum and gold) necessary to the functionality or production of a product manufactured or contracted to be manufactured by such company. The SEC adopted final rules in 2012 which took effect at the end of January 2013. Because we manufacture products which may contain tin, tungsten, tantalum or gold, we are required under these rules to determine whether those minerals are necessary to the functionality or production of our products and, if so, conduct a country of origin inquiry with respect to all such minerals. If any such minerals may have originated in the Democratic Republic of the Congo, or the DRC, or any of its adjoining countries, or the “covered countries,” then we and our suppliers must conduct diligence on the source and chain of custody of the conflict minerals to determine if they did originate in one of the covered countries and, if so, whether they financed or benefited armed groups in the covered countries. Disclosures relating to the products which may contain conflict minerals, the country of origin of those minerals and whether they are “DRC conflict free” must be provided in a Form SD (and accompanying conflict minerals report if one is required to disclose the diligence undertaken by us in sourcing the minerals and our conclusions relating to such diligence). If we are required to submit a conflict minerals report, that report must be audited by an independent auditor pursuant to existing government auditing standards, unless (for the first two years) we are unable to determine whether the minerals are “DRC conflict free.” Compliance with this disclosure rule may be very time consuming for management and our supply chain personnel (as well as time consuming for our suppliers) and could involve the expenditure of significant amounts of money and resources by us and them. Disclosures by us mandated by the rules which are perceived by the market to be “negative” may cause customers to refuse to purchase our products. We are currently unable to assess the cost of compliance with this rule, and we cannot assure you that such cost will not have a material adverse effect on our business, financial condition and results of operations.
Changes in tax laws, tax rates or tax assets and liabilities could materially adversely affect our financial condition and results of operations.
perform certain transactions without obtaining pre-approval from our lenders. •incur additional indebtedness or contingent obligations; •create or incur liens, negative pledges or guarantees; •make investments; •make loans; •merge, consolidate or sell substantially all of our assets; •make certain payments on indebtedness; •pay dividends on or make distributions in respect of capital stock or make certain other restricted payments or investments; •enter into certain agreements that restrict distributions from restricted subsidiaries; •enter into transactions with affiliates; •change the nature of our business; and •demand for and market acceptance of our products as a result of the cyclical nature of the industries we serve or otherwise, often resulting in reduced sales during industry downturns and increased sales during periods of industry recovery or growth; •overall economic conditions; •changes in the timing and size of orders by our customers; •strategic decisions by our customers to terminate their outsourcing relationship with us or give market share to our competitors; •consolidation by our customers; •cancellations and postponements of previously placed orders; •pricing pressure from either our competitors or our customers, resulting in the reduction of our product prices or loss of market share; •disruptions or delays in the manufacturing of our products or in the supply of components or raw materials that are incorporated into or used to manufacture our products, thereby causing us to delay the shipment of products; •decreased margins for several or more quarters following the introduction of new products, especially as we introduce new subsystems or other products or services; •changes in design-to-delivery cycle times; •inability to reduce our costs quickly in step with reductions in our prices or in response to decreased demand for our products; •changes in our mix of products sold; •write-offs of excess or obsolete inventory; •one-time expenses or charges; and •provisions that authorize our Board of Directors, without action by our shareholders, to issue additional ordinary shares and preferred shares with preferential rights determined by our Board of Directors; •provisions that impose advance notice requirements, minimum shareholding periods and ownership thresholds, and other requirements and limitations on the ability of shareholders to propose matters for consideration at shareholder meetings. Contents of our facilities are leased, which allows for flexibility as business conditions and geographic demand change. The table below sets forth the approximate square footage of each of our facilities. Approximate California Oregon Scotland 37,700 Malaysia 31,900 Korea 18,500 Nevada February 24, 2023. Year Ended December 31, 2021 December 25, 2020 (dollars in thousands, except per share amounts) Net sales $ 1,096,917 $ 914,236 Gross profit $ 177,480 $ 124,892 Gross margin 16.2 % 13.7 % Non-GAAP gross margin 16.7 % 14.6 % Operating expenses $ 96,466 $ 83,340 Operating income $ 81,014 $ 41,552 Net income $ 70,899 $ 33,279 Non-GAAP net income $ 97,698 $ 59,042 Diluted EPS $ 2.45 $ 1.42 Non-GAAP diluted EPS $ 3.37 $ 2.52 enhanced process technologies. shipment, as that is when control of the promised good has transferred. assets. Net Other Expense (Income), Net Year Ended December 31, 2021 December 25, 2020 (in thousands) Net sales $ 1,096,917 $ 914,236 Cost of sales 919,437 789,344 Gross profit 177,480 124,892 Operating expenses: Research and development 15,691 13,361 Selling, general, and administrative 65,857 56,614 Amortization of intangible assets 14,918 13,365 Total operating expenses 96,466 83,340 Operating income 81,014 41,552 Interest expense, net 6,451 8,727 Other expense, net 807 534 Income before income taxes 73,756 32,291 Income tax expense (benefit) 2,857 (988 ) Net income $ 70,899 $ 33,279 Year Ended December 31, 2021 December 25, 2020 Net sales 100.0 100.0 Cost of sales 83.8 86.3 Gross profit 16.2 13.7 Operating expenses: Research and development 1.4 1.5 Selling, general, and administrative 6.0 6.2 Amortization of intangible assets 1.4 1.5 Total operating expenses 8.8 9.1 Operating income 7.4 4.5 Interest expense, net 0.6 1.0 Other expense, net 0.1 0.1 Income before income taxes 6.7 3.5 Income tax expense (benefit) 0.3 (0.1 ) Net income 6.5 3.6 Year Ended Change December 31, 2021 December 25, 2020 Amount % (dollars in thousands) Net sales $ 1,096,917 $ 914,236 $ 182,681 20.0 % 2023. 2023. Year Ended Change December 31, 2021 December 25, 2020 Amount % (dollars in thousands) Cost of sales $ 919,437 $ 789,344 $ 130,093 16.5 % Gross profit $ 177,480 $ 124,892 $ 52,588 42.1 % Gross margin 16.2 % 13.7 % + 250 bps approximately 60 basis points. Year Ended Change December 31, 2021 December 25, 2020 Amount % (dollars in thousands) Research and development $ 15,691 $ 13,361 $ 2,330 17.4 % Selling, General, and Administrative Year Ended Change December 31, 2021 December 25, 2020 Amount % (dollars in thousands) Selling, general, and administrative $ 65,857 $ 56,614 $ 9,243 16.3 % of $1.7 million. Year Ended Change December 31, 2021 December 25, 2020 Amount % (dollars in thousands) Amortization of intangibles assets $ 14,918 $ 13,365 $ 1,553 11.6 % Year Ended Change December 31, 2021 December 25, 2020 Amount % (dollars in thousands) Interest expense, net $ 6,451 $ 8,727 $ (2,276 ) -26.1 % Year Ended Change December 31, 2021 December 25, 2020 Amount % (dollars in thousands) Other expense (income), net $ 807 $ 534 $ 273 51.1 % Year Ended Change December 31, 2021 December 25, 2020 Amount % (dollars in thousands) Income tax expense (benefit) $ 2,857 $ (988 ) $ 3,845 n/m losses. Non-GAAP gross margin and non-GAAP operating margin are defined as non-GAAP gross profit and non-GAAP operating income, respectively, divided by net sales. infrequent charges and gains that are outside of normal business operations. Year Ended December 31, 2021 December 25, 2020 (dollars in thousands) U.S. GAAP gross profit $ 177,480 $ 124,892 Non-GAAP adjustments: Share-based compensation 1,384 991 Facility shutdown costs (1) 2,611 2,215 Contract settlement loss (2) — 1,386 Fair value adjustment to inventory from acquisitions (3) 1,652 — Other non-recurring expense, net (4) 106 3,743 Non-GAAP gross profit $ 183,233 $ 133,227 U.S. GAAP gross margin 16.2 % 13.7 % Non-GAAP gross margin 16.7 % 14.6 % (1)As part of the purchase price allocation of our acquisition of IMG in November 2021, we recorded acquired-inventories at fair value, resulting in a fair value step-up. This amount represents the release of the step-up to cost of sales as acquired-inventories were sold. Included in this amount LiquidityIn addition, in October 2021, the Organization for Economic Co-operation and Capital Resources RisksRestrictive covenants under our credit facilities may limit our current and future operations. If we failDevelopment (“OECD”) issued model rules for a new global minimum tax framework, commonly referred to comply with those covenants,as “Pillar Two,” which includes the lenders could cause outstanding amounts, which are currently substantial,introduction of a 15% global minimum to become immediately dueeffective beginning after January 1, 2024. To date, approximately 140 countries have tentatively signed a framework agreeing in principle to this initiative several countries are in various stages of implementing Pillar Two proposals in local tax legislation. The OECD continues to refine the technical guidance. Our effective tax rate and payable, and we might notcash tax payments could increase in future years as a result of these changes.27Liquidity and Capital Resources Risks We have sufficient funds and assetsa substantial amount of indebtedness, which could adversely affect us, including by decreasing our business flexibility. The agreement that governs our indebtedness contains covenants that could impact our ability to pay such loans.As of December 31, 2021,29, 2023, we had total principal outstanding of $150.0$135.0 million under our term loan facility and $145.0$115.0 million under our revolving credit facility (collectively “credit facilities”). We may incur additional indebtedness in the future. Our credit facilities contain certain restrictive covenants and conditions, including limitations on our ability to, among other things:•incur additional indebtedness or contingent obligations;•create or incur liens, negative pledges or guarantees;•make investments;•make loans;•sell or otherwise dispose of assets;•merge, consolidate or sell substantially all•sell or otherwise dispose of our assets;•make certain payments on indebtedness;•pay dividends on or make distributions in respect of capital stock or make certain other restricted payments or investments;•enter into certain agreements that restrict distributions from restricted subsidiaries;•enter into transactions with affiliates;•change the nature of our business; and•amend the terms of our organizational documents.•amend the terms of our organizational documents.As a result of these covenants, we may be restricted in our ability to pursue new business opportunities or strategies or to respond quickly to changes in the industries that we serve. A violation of any of these covenants would be deemed an event of default under our credit facilities. In such event, upon the election of the lenders, the loan commitments under our credit facilities would terminate and the principal amount of the loans and accrued interest then outstanding would be due and payable immediately. A default may also result in the acceleration of any other debt to which a cross-acceleration or cross-default provision applies. In the event our lenders accelerate the repayment of our borrowings, we cannot assure youensure that we and our subsidiaries would have sufficient funds to repay such indebtedness or be able to obtain replacement financing on a timely basis or at all. These events could force us into bankruptcy or liquidation, which could have a material adverse effect on our business, financial condition and results of operations.We also may need to negotiate changes to the covenants in the agreements governing our credit facilities in the future if there are material changes in our business, financial condition or results of operations, but we cannot assure youensure that we will be able to do so on terms favorable to us or at all.We may not be able to generate sufficient cash to service all ofFurthermore, our indebtedness, including under our credit facilities, and may be forced to take other actions to satisfy our obligations under our indebtedness, which may not be successful.Our ability to make scheduled payments on or to refinance our indebtedness, including under our credit facilities, depends on our financial condition and results of operations, which are subject to prevailing economic and competitive conditions and other factors beyond our control. We may be unable to maintain a level of cash flows from operating activities sufficient to permit us to fund our day-to-day operations or to pay the principal, premium, if any, and interest on our indebtedness. If our cash flows and capital resources are insufficient to fund our debt service obligations, we could face substantial liquidity problems and could be forced to reduce or delay investments and capital expenditures or to sell assets or operations, seek additional capital or restructure or refinance our indebtedness. If we cannot make scheduled payments on our debt, we will be in default and, as a result, the lenders under our credit facilities could terminate their commitments to loan money, or foreclose against the assets securing such borrowings, and we could be forced into bankruptcy or liquidation, in each case, which would have a material adverse effect on our business, financial condition and results of operations.Ordinary Share Ownership Risks28The interest expense associated with our indebtedness is subject to variable rates, and increased debt service costs as a result of higher interest rates could adversely affect our business, financial condition and results of operations.Borrowings under our credit facilities are generally subject to variable interest rates, which fluctuate depending on macroeconomic factors, and expose us to interest rate risk. If interest rates increase, our debt service costs on these borrowings would also increase, even if the amount borrowed remains the same, and would require us to use more of our available cash to service our indebtedness, resulting in decreased net income and cash flows, including cash available for servicing our indebtedness. There can also be no assurance that we will be able to enter into swap agreements or other hedging arrangements in the future if we desire to do so, or that any future hedging arrangements will offset increases in interest rates.Ordinary Share Ownership Risks Our quarterly sales and operating results fluctuate significantly from period to period, and this may cause volatility in our share price.Our quarterly sales and operating results have fluctuated significantly in the past, and we expect them to continue to fluctuate in the future for a variety of reasons, including the following:•demand for and market acceptance of our products as a result of the cyclical nature of the industries we serve or otherwise, often resulting in reduced sales during industry downturns and increased sales during periods of industry recovery or growth;•overall economic conditions;•changes in the timing and size of orders by our customers;•strategic decisions by our customers to terminate their outsourcing relationship with us or give market share to our competitors;•consolidation by our customers;•cancellations and postponements of previously placed orders;•pricing pressure from either our competitors or our customers, resulting in the reduction of our product prices or loss of market share;•disruptions or delays in the manufacturing of our products or in the supply of components or raw materials that are incorporated into or used to manufacture our products, thereby causing us to delay the shipment of products;•decreased margins for several or more quarters following the introduction of new products, especially as we introduce new subsystems or other products or services;•changes in design-to-delivery cycle times;•inability to reduce our costs quickly in step with reductions in our prices or in response to decreased demand for our products;•changes in our mix of products sold;•write-offs of excess or obsolete inventory;•one-time expenses or charges; and•announcements by our competitors of new products, services or technological innovations, which may, among other things, render our products less competitive.•announcements by our competitors of new products, services or technological innovations, which may, among other things, render our products less competitive.As a result of the foregoing, we believe that quarter-to-quarter comparisons of our sales and results of operations may not be meaningful and that these comparisons may not be an accurate indicator of our future performance. Changes in the timing or terms of a small number of transactions could disproportionately affect our results of operations in any particular quarter. Moreover, our results of operations in one or more future quarters may fail to meet our guidance or the expectations of securities analysts or investors. If this occurs, we would expect to experience an immediate and significant decline in the trading price of our ordinary shares.The price of our ordinary shares may fluctuate substantially.You should consider an investment in our ordinary shares to be risky, and you should invest in our ordinary shares only if you can withstand a significant loss and wide fluctuations in the market value of your investment. Some factors that may cause the market price of our ordinary shares to fluctuate, in addition to the other risks mentioned in this report, are:•our announcements or our competitors’ announcements regarding new products or services, enhancements, significant contracts, acquisitions or strategic investments;•changes in earnings estimates or recommendations by securities analysts, if any, who cover our ordinary shares;•speculation about our business in the press or investment community;•failures to meet external expectations or management guidance;•fluctuations in our quarterly financial results or the quarterly financial results of companies perceived to be similar to us;•changes in our capital structure or dividend policy, future issuances of securities, sales of large blocks of ordinary shares by our shareholders, our incurrence of additional debt or our failure to comply with the agreements governing our Credit Facilities;•our decision to enter new markets;•reputational issues;•changes in general economic and market conditions in any of the regions in which we conduct our business;•material litigation or government investigations;•changes in industry conditions or perceptions; and•changes in applicable laws, rules or regulations.In addition,Further, if the market for stocks in our industry or industries related to our industry, or the stock market in general, experiences a loss of investor confidence, the trading price of our ordinary shares could decline for reasons unrelated to our business, financial condition and results of operations. If any of the foregoing occurs, it could cause our share price to fall and may expose us to lawsuits that, even if unsuccessful, could be costly to defend and a distraction to management.29Future salesTable of our ordinary shares, or the perception in the public markets that these sales may occur, may depress our share price.ContentsWe may seek to raise additional capital from time to time in the future, which may involve the issuance of additional ordinary shares, or securities convertible into ordinary shares. Sales of substantial amounts of our ordinary shares in the public market, or the perception that these sales could occur, could adversely affect the price of our ordinary shares and could impair our ability to raise capital through the sale of additional shares.Our articles of association contain anti-takeover provisions that could adversely affect the rights of our shareholders.Our articles of association contain provisions to limit the ability of others to acquire control of our company or cause us to engage in change-of controlchange-of-control transactions, including, among other things:•provisions that authorize our Board of Directors, without action by our shareholders, to issue additional ordinary shares and preferred shares with preferential rights determined by our Board of Directors;•provisions that permit only a majority of our Board of Directors or the chairman of our Board of Directors to call shareholder meetings and therefore do not permit shareholders to call shareholder meetings;•provisions that impose advance notice requirements, minimum shareholding periods and ownership thresholds, and other requirements and limitations on the ability of shareholders to propose matters for consideration at•provisions that permit only a majority of our Board of Directors or the chairman of our Board of Directors to call shareholder meetings and therefore do not permit shareholders to call shareholder meetings; and•a staggered board whereby our directors are divided into three classes, with each class subject to re-election once every three years on a rotating basis.These provisions could have the effect of depriving our shareholders of an opportunity to sell their shares at a premium over prevailing market prices by discouraging third parties from seeking to obtain control of our company in a tender offer or similar transaction. With our staggered Board of Directors, at least two annual meetings of shareholders are generally required in order to effect a change in a majority of our directors. Our staggered Board of Directors can discourage proxy contests for the election of our directors and purchases of substantial blocks of our shares by making it more difficult for a potential acquirer to gain control of our Board of Directors in a relatively short period of time.The issuance of preferred shares could adversely affect holders of ordinary shares.Our Board of Directors is authorized to issue preferred shares without any action on the part of holders of our ordinary shares. Our Board of Directors also has the power, without shareholder approval, to set the terms of any such preferred shares that may be issued, including voting rights, dividend rights, and preferences over our ordinary shares with respect to dividends or if we liquidate, dissolve or wind up our business and other terms. If we issue preferred shares in the future that have preference over our ordinary shares with respect to the payment of dividends or upon our liquidation, dissolution or winding up, or if we issue preferred shares with voting rights that dilute the voting power of our ordinary shares, the rights of holders of our ordinary shares or the price of our ordinary shares could be adversely affected.Our shareholders may face difficulties in protecting their interests as a shareholder, as Cayman Islands law provides substantially less protection when compared to the laws of the United States.Our corporate affairs are governed by our amended and restated memorandum and articles of association and by the Companies Law (2013 Revision) and common law of the Cayman Islands. The rights of shareholders to take legal action against our directors and us, actions by minority shareholders and the fiduciary responsibilities of our directors to us under Cayman Islands law are to a large extent governed by the common law of the Cayman Islands. The common law of the Cayman Islands is derived in part from comparatively limited judicial precedent in the Cayman Islands as well as from English common law, which has persuasive, but not binding, authority on a court in the Cayman Islands. The rights of our shareholders and the fiduciary responsibilities of our directors under Cayman Islands law are not as clearly established as they would be under statutes or judicial precedents in the United States. In particular, the Cayman Islands have a less exhaustive body of securities laws as compared to the United States. In addition, Cayman Islands companies may not have standing to initiate a shareholder derivative action before the United States federal courts.Furthermore, since we are a Cayman Islands company with a portion our assets located outside of the United States, it may be difficult or impossible for shareholders to bring an action against us in the United States in the event that shareholders believe that their rights have been infringed under U.S. federal securities laws or otherwise. Even if shareholders are successful in bringing an action of this kind, the laws of the Cayman Islands may render shareholders unable to enforce a judgment against our assets. There is no statutory recognition in the Cayman Islands of judgments obtained in the United States.As a result of all of the above, our shareholders may have more difficulty in protecting their interests through actions against us or our officers, directors or major shareholders than would shareholders of a corporation incorporated in a jurisdiction in the United States.30Certain judgments obtained against us by our shareholders may not be enforceable.We are a Cayman Islands company and a portion our assets are located outsideTable of the United States. As a result, it may be difficult or impossible for you to bring an action against us in the United States in the event that you believe that your rights have been infringed under U.S. federal securities laws or otherwise. Even if you are successful in bringing an action of this kind, the laws of the Cayman Islands may render you unable to enforce a judgment against our assets. There is no statutory recognition in the Cayman Islands of judgments obtained in the United States, although the courts of the Cayman Islands will generally recognize and enforce a non-penal judgment of a foreign court of competent jurisdiction without retrial on the merits.There can be no assurance that we will not be a passive foreign investment company for any taxable year, which could result in adverse U.S. federal income tax consequences to U.S. Holders of our ordinary shares.A non-U.S. corporation will be a passive foreign investment company, or PFIC, for any taxable year if either (i) at least 75% of its gross income for such year is passive income or (ii) at least 50% of the value of its assets (generally based on an average of the quarterly values of the assets) during such year is attributable to assets that produce or are held for the production of passive income. Our PFIC status for any taxable year can be determined only after the close of that year.Based on the value of our assets and the composition of our income and assets, we do not believe we were treated as a PFIC for U.S. federal income purposes for our taxable year ended December 31, 2021. The determination of PFIC status is based on an annual determination that cannot be made until the close of a taxable year, involves extensive factual investigation, including ascertaining the fair market value of all of our assets on a quarterly basis and the character of each item of income that we earn, and is subject to uncertainty in several respects. Accordingly, we cannot assure you that we were not treated as a PFIC for our taxable year ended December 31, 2021 or any prior taxable year, that we will not be treated as a PFIC for the current or any future taxable year or that the IRS will not take a position contrary to any position that we take.If we are a PFIC for any taxable year during which a U.S. person holds ordinary shares, certain adverse U.S. federal income tax consequences could apply to such U.S. person. You are strongly urged to consult your tax advisors as to whether or not we will be a PFIC and the consequences of such status on an investment in our shares in your particular circumstances.If a U.S. person is treated as owning at least 10% of our shares, such person may be subject to adverse U.S. federal income tax consequences.If a U.S. person is treated as owning (directly, indirectly, or constructively) at least 10% of the value or voting power of our shares, such person may be treated as a “United States shareholder” with respect to each “controlled foreign corporation” in our group (if any). Because our group includes one or more U.S. subsidiaries, in certain circumstances we could be treated as a controlled foreign corporation and/or certain of our non-U.S. subsidiaries could be treated as controlled foreign corporations (regardless of whether we are or are not treated as a controlled foreign corporation).A United StatesU.S. shareholder of a controlled foreign corporation may be required to annually report and include in its U.S. taxable income its pro rata share of “Subpart F income,” “global intangible low-taxed income” and investments in United StatesU.S. property by controlled foreign corporations, whether or not we make any distributions. An individual that is a United StatesU.S. shareholder with respect to a controlled foreign corporation generally would not be allowed certain tax deductions or foreign tax credits that would be allowed to a United StatesU.S. shareholder that is a U.S. corporation. A failure to comply with these reporting obligations may subject a United StatesU.S. shareholder to significant monetary penalties and may prevent starting of the statute of limitations with respect to such shareholder’s U.S. federal income tax return for the year for which reporting was due. We do not intend to monitor whether we are or any of our current or future non-U.S. subsidiaries is treated as a controlled foreign corporation or whether any investor is treated as a United StatesU.S. shareholder with respect to us or any of our controlled foreign corporation subsidiaries. In addition, we cannot provide assurances that we will furnish to any United StatesU.S. shareholders information that may be necessary to comply with the aforementioned reporting and tax paying obligations.A U.S. investor should consult its tax advisors regarding the potential application of these rules to an investment in our shares in its particular circumstances.ITEM 1B. UNRESOLVED STAFF COMMENTSNone.ITEM 1C. CYBERSECURITYRisk Management and StrategyOur cybersecurity program is designed from a risk- and compliance-based approach to achieve systemwide resilience and protection across our operations. We regularly assess risks from cybersecurity threats and monitor our information systems for potential vulnerabilities. We utilize the National Institute of Standards and Technology Cybersecurity Framework to deliver clear and proactive processes, multi-layered defenses, and relevant technologies that are designed to control, audit, monitor, and protect access to sensitive information. Our cybersecurity program includes physical, administrative, and technical safeguards, and we maintain plans and procedures the objective of which is to help us prevent, detect and timely and effectively respond to, and as necessary, recover from, cybersecurity incidents. Through our cybersecurity risk management program, we have established operational processes to address issues including monitoring and patching of vulnerabilities, regularly updating our information systems, and evaluating new countermeasures made to defend against an evolving landscape of threats. This process is overseen by the Audit Committee of our Board.In addition, we periodically engage third-party consultants and providers to assist us in assessing, testing, enhancing and monitoring our cybersecurity risk management programs and responding to any incidents. These third parties work in conjunction with our information security team in an effort to continuously improve our cyber risk posture. Examples of third-party actions include the engagement of a security operations center for real-time monitoring and response to incidents, independent audits, risk assessments and security certifications.We believe cybersecurity awareness is important in helping prevent cyber threats. To that end, we provide annual cybersecurity awareness training and regular phishing awareness exercises to our tech-enabled employees. We monitor and assess the success rate of employees reporting phishing scams, and the results inform the development of our security trainings, systems and programs. Additionally, role-based security training is provided to employees in certain higher-risk positions (including those who handle sensitive information, technology or funds), which is tailored to the heightened cybersecurity risks they face.31We have experienced, and may in the future experience, whether directly or through our service providers or other channels, cybersecurity incidents. While prior incidents have not had a material impact on us, future incidents could have a material impact on our business, operations and reputation. Although our processes are designed to help prevent, detect, respond to and mitigate the impact of such incidents, there is no guarantee that they will be sufficient to prevent or mitigate the risk of a cyberattack or the potentially serious reputational, operational, legal or financial impacts that may result. Refer to “Item 1A. – Risk Factors” in this annual report on Form 10-K, including, “We may be subject to interruptions or failures in our information technology systems,” for additional discussion on our cybersecurity related risks.Cybersecurity GovernanceCybersecurity is an important part of our risk management and strategy activities and an area of focus for our Board and management. Our Audit Committee is responsible for reviewing and monitoring our cybersecurity and information security policies and our internal controls regarding cybersecurity and information security. Our Audit Committee receives regular reports from members of our senior management and other personnel that include assessments and potential mitigation of the risks and exposures to cybersecurity incidents.Our cybersecurity risk management and strategy activities are overseen by executive management, made up of the IT Steering Committee and Chief Information Officer. Our Chief Information Officer has over 25 years of experience in information technology and security as well as extensive experience working in and leading our information systems and technology function. The IT Steering Committee and Chief Information Officer receive regular updates on cybersecurity matters, results of mitigation efforts and cybersecurity incident response and remediation through the management of, and participation in, the cybersecurity risk management and strategy activities described above, and report to the Audit Committee on any appropriate items.ITEM 2. PROPERTIESOur principal executive office isoffices are located at 3185 Laurelview Ct., Fremont, California 94538. As of December 31, 2021,29, 2023, our principal manufacturing and administrative facilities, including our executive offices, are comprised of approximately 753,200865,700 square feet. AllLocation
Square
Footage255,000271,300 138,300172,100 Singapore97,700113,300 Minnesota80,90097,700 Texas47,80062,900 Mexico37,90047,800 7,50012,500 We do not anticipate difficulty in either retaining occupancy of any of our facilities through lease renewals prior to expiration or through month-to-month occupancy or replacing them with equivalent facilities. We believe that our existing facilities and equipment are well maintained, in good operating condition, and are adequate to meet our currently anticipated requirements.32ITEM 3. LEGAL PROCEEDINGSWe may be subject to various legal claims and proceedings which arise in the ordinary course of our business involving claims incidental to our business, including employment-related claims. We are presently not a party to any material litigation or regulatory proceeding and are not aware of any pending or threatened litigation or regulatory proceeding against us which, individually or in the aggregate, could have a material adverse effect on our business, financial condition, or results of operations.ITEM 4. MINE SAFETY DISCLOSURESNot applicable.PART IIITEM 5. MARKET FOR THE REGISTRANT’S COMMON EQUITY, RELATED SHAREHOLDERSTOCKHOLDER MATTERS AND ISSUER PURCHASES OF EQUITY SECURITIESHolders of RecordHolders of Record As of February 22, 2022,21, 2024, all of our issued ordinary shares were held in “nominee” or “street” name or in our treasury account.DividendsDividends We do not anticipate that we will pay any cash dividends on our ordinary shares for the foreseeable future. Any determination to pay dividends in the future will be at the discretion of our Board of Directors and will depend upon our financial condition, results of operations, contractual restrictions (including those under our credit facilities and any potential indebtedness we may incur in the future), restrictions imposed by applicable law, tax considerations, and other factors our Board of Directors deems relevant.33Stock Performance GraphTable of ContentsStock Performance Graph The information included under the heading Item 55. – Stock Performance Graph is “furnished” and not “filed” for purposes of Section 18 of the Securities Exchange Act of 1934, as amended (the “Exchange Act”), or otherwise subject to the liabilities of that section, nor shall it be deemed to be “soliciting material” subject to Regulation 14A or incorporated by reference in any filing under the Securities Act of 1933, as amended or the Exchange Act.Our ordinary shares are listed for trading on the NASDAQ under the symbol “ICHR.” The Stock Price Performance Graph set forth below plots the cumulative total shareholder return on a quarterly basis of our ordinary shares from December 9, 2016, the date on which our shares began trading,28, 2018 through December 31, 2021,29, 2023, with the cumulative total return of the Nasdaq Composite Index and the PHLX Semiconductor Sector Index over the same period. The comparison assumes $100 was invested on December 9, 201628, 2018 in the ordinary shares of Ichor Holdings, Ltd., in the Nasdaq Composite Index, and in the PHLX Semiconductor Sector Index and assumes reinvestment of dividends, if any.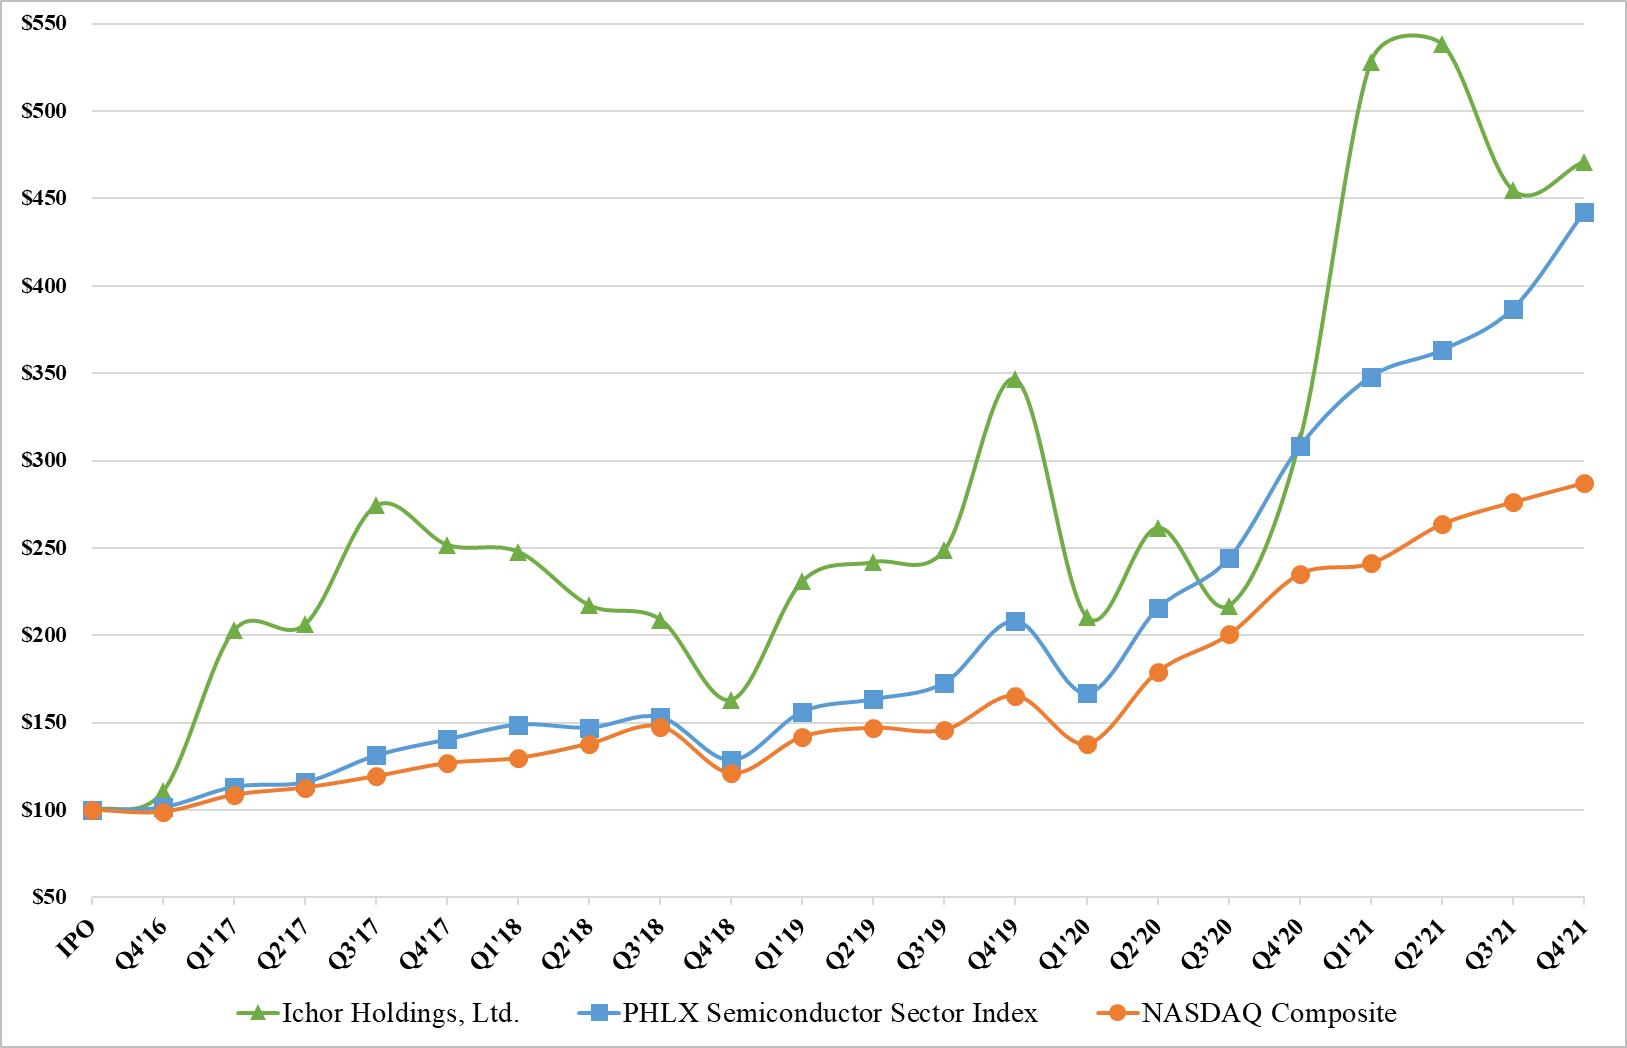
 The stock price performance shown on the graph above is not necessarily indicative of future price performance. Information used in the graph was obtained from the Nasdaq Stock Market, a source believed to be reliable, but we are not responsible for any errors or omissions in such information.ITEM 6. [RESERVED]ITEM 7. MANAGEMENT’S DISCUSSION AND ANALYSIS OF FINANCIAL CONDITION AND RESULTS OF OPERATIONSYou should read the following discussion and analysis of our financial condition and results of operations in conjunction with our consolidated financial statements and related notes included elsewhere in this report. The following discussion contains forward-looking statements based upon our current plans, expectations and beliefs that involve risks and uncertainties. Our actual results may differ materially from those anticipated in these forward-looking statements. Factors that could cause or contribute to these differences include those discussed below and elsewhere in this report, particularly in the section entitled Item
 1A1A. – Risk Factors. For a comparison of our financial condition, results of operations, and cash flows for 20202022 to 2019,2021, refer to Part II, Item 77. in our 20202022 Annual Report on Form 10‑K, which was filed with the Securities and Exchange CommissionSEC on March 5, 2021.Overview34Overview We are a leader in the design, engineering, and manufacturing of critical fluid delivery subsystems and components for semiconductor capital equipment. Our primary product offerings include gas and chemical delivery systems and subsystems, collectively known as fluid delivery systems and subsystems, which are key elements of the process tools used in the manufacturing of semiconductor devices. Our gas delivery subsystems deliver, monitor, and control precise quantities of the specialized gases used in semiconductor manufacturing processes such as etch and deposition. Our chemical delivery systems and subsystems precisely blend and dispense the reactive liquid chemistries used in semiconductor manufacturing processes such as chemical-mechanical planarization, electroplating, and cleaning. We also provide precision-machined components, weldments, e‑beam and laser-welded components, precision vacuum and hydrogen brazing and surface treatment technologies, and other proprietary products. This vertically integrated portion of our business is primarily focused on metal and plastic parts that are used in gas and chemical systems, respectively.Fluid delivery subsystems ensure accurate measurement and uniform delivery of specialty gases and chemicals at critical steps in the semiconductor manufacturing processes. Any malfunction or material degradation in fluid delivery reduces yields and increases the likelihood of manufacturing defects in these processes. Most OEMs outsource all or a portion of the design, engineering, and manufacturing of their gas delivery subsystems to a few specialized suppliers, including us. Additionally, many OEMs are outsourcing the design, engineering, and manufacturing of their chemical delivery subsystems due to the increased fluid expertise required to manufacture these subsystems. Outsourcing these subsystems has allowed OEMs to leverage the suppliers’ highly specialized engineering, design, and production skills while focusing their internal resources on their own value-added processes. We believe that this outsourcing trend has enabled OEMs to reduce their costs and development time, as well as provide growth opportunities for specialized subsystems suppliers like us.We have a global footprint with production facilities in California, Minnesota, Oregon, Texas, Singapore, Malaysia, the United Kingdom, Korea, and Mexico.The following table summarizes key financial information for the periods indicated. Amounts are presented in accordance with GAAP unless explicitly identified as being a non-GAAP metric. For a description of our non-GAAP metrics and reconciliations to the most comparable GAAP metrics, please refer to Item 77. – Management’s Discussion and Analysis of Financial Condition and Results of Operations – Non-GAAP Financial Results within this Annual Report.Year Ended December 29,
2023December 30,
2022(dollars in thousands, except per share amounts) Net sales $ 811,120 $ 1,280,069 Gross margin 12.7 % 16.6 % Gross margin, non-GAAP 13.4 % 17.0 % Operating margin (1.3) % 6.7 % Operating margin, non-GAAP 2.9 % 9.8 % Net income (loss) $ (42,985) $ 72,804 Net income, non-GAAP $ 12,257 $ 104,863 Diluted EPS $ (1.47) $ 2.51 Diluted EPS, non-GAAP $ 0.42 $ 3.62 Key Factors Affecting Our Business35Key Factors Affecting Our Business Investment in Semiconductor Manufacturing EquipmentThe design and manufacturing of semiconductor devices is constantly evolving and becoming more complex in order to achieve greater performance and efficiency. To keep pace with these changes, OEMs need to refine their existing products and invest in developing new products. In addition, semiconductor device manufacturers will continue to invest in new wafer fabrication equipment to expand their production capacity and to support new manufacturing processes.Outsourcing of Subsystems by Semiconductor OEMsFaced with increasing manufacturing complexities, more complex subsystems, shorter product lead times, shorter industry spend cycles, and significant capital requirements, outsourcing of subsystems and components by OEMs has continued to grow. In the past two decades, OEMs have outsourced most of their gas delivery systems to suppliers such as us. OEMs have also started to outsource their chemical delivery systems in recent years. Our results will be affected by the degree to which outsourcing of these fluid delivery systems by OEMs continues to grow.Cyclicality of Semiconductor Capital Equipment IndustryOur business is subject to the cyclicality of the capital expenditures of the semiconductor industry, which drives cyclicality in the semiconductor capital equipment industry in which we operate. In 2021,2023, we derived over 95%90% of our sales from the semiconductor capital equipment industry. Demand for semiconductor capital equipment can fluctuate significantly based on changes in regulatory intervention and general economic conditions, including consumer spending, demand for semiconductor products, pricing, and other factors. In the past, these fluctuations have resulted in significant variations in the levels of spending within the semiconductor capital equipment industry, and as a result, our results of operations. The cyclicality of the semiconductor industry will continue to impact our results of operations in the future.Customer ConcentrationThe number of capital equipment manufacturers for the semiconductor device industry is significantly consolidated, resulting in a small number of large manufacturers. Our customers are a significant component of this consolidation, resulting in our sales being concentrated in a few customers. In 2021,2023, our top twothree customers were Applied Materials, Lam Research, and Applied Material,ASML, accounting for approximately 53% and 32%a combined 82% of sales, respectively.sales. Our customers often require reduced prices or other pricing, quality, or delivery commitments as a condition to their purchasing from us in any given period or increasing their purchase volume, which can, among other things, result in reduced gross margins in order to maintain or expand our market share. Although we do not have any long-term contracts that require customers to place orders with us, Applied Materials, Lam Research, and Applied MaterialsASML have been our customers for over a decade.AcquisitionsIn November 2021, we acquired IMG, anda California-based leader in precision machining and specialty joining and plating, for approximately $270.0 million. Between 2017 and 2020, we engaged in four separate business combinations for a combined investment of approximately $200.0 million. These acquisitions continue to have a significant impact on our financial position and results of operations. We intend to continue to evaluate opportunistic acquisitions to supplement our organic growth, and any such acquisitions could have a material impact on our business and results of operations.COVID‑19 Pandemic36Macroeconomic ConditionsThe semiconductor industry is cyclical in nature, and Global Supply ChainThe COVID‑19 pandemicmatching customer demand can be challenging based on a variety of factors, including market trends, supply chain shortages and related economic repercussions have created,lead times, customer buying patterns, availability of skilled labor, and are expected to continue to create, significant volatility, uncertainty,macroeconomic and turmoil in our industry. While our facilities are currently not subject to any site-wide government shutdowns, in June 2021, the Malaysian government instituted an Enhanced Movement Control Order (“EMCO”), whichother factors. During much of 2022, many of these factors impacted our weldment facility in Malaysia through both on-site employee restrictions as well asability to fulfill high customer demand; however, the industry entered a complete shutdown of all manufacturingcyclical downturn in the region during early July. Whilefourth quarter of 2022, leading to reductions in spending on semiconductor capital equipment, the primary industry in which we were ableoperate, resulting in weakened customer demand in 2023. In particular, industry overcapacity and a number of macroeconomic factors may have contributed to reopenthis reduced spending environment, including persistent levels of high inflation, higher interest rates, supply chain disruptions, and other macroeconomic uncertainties. Additionally, increased export controls for semiconductor-related goods and services shipped to China and delayed business investment in electronic memory capacity had varying levels of unfavorable consequences to our factory in mid-July, once the government confirmed we were an essentialbusiness. To help mitigate these impacts and to better align our resources and cost structure with current and expected future levels of business, we remained under headcount limitations until the third week of August. With 50% of our weldment capacity located in Malaysia, our overall outputinitiated labor and other cost reduction initiatives starting in the country was reduced by 40% in the thirdfourth quarter of 2021 due to the EMCO restrictions.In addition to the recent impacts in Malaysia, we experienced increases in direct costs within our factories associated with employee personal protective equipment (“PPE”), facility cleaning2022 and layout changes, together with increases in logistics costs and employee labor costs, as well as other operating inefficiencies. Additionally, our supply chain has been negatively impacted ascontinuing through 2023. As a result of the larger, ongoing global supply chain disruption, impacting our ability to source certain components timely. These factorsthese programs, we incurred severance charges of $1.1 million and $2.3 million in 2022 and 2023, respectively.While challenging macroeconomic conditions have resultedin,impacted and maywill continue to resultimpact our business and customers in lower revenuesthe near term, we believe demand for semiconductors, semiconductor capital equipment, and operating margins. The extentour products will return to growth, fueled by the long-term growing need for more semiconductor productive capacity and duration of these impacts cannot be specifically quantified given the dynamic nature and breadth of the pandemic’s impact on our operations and that of our customers and suppliers.Components of Our Results of OperationsComponents of Our Results of Operations The following discussion sets forth certain components of our statements of operations as well as significant factors that impactimpacting those items.SalesWe generate sales primarily from the design, manufacture, and sale of subsystems and components primarily for semiconductor capital equipment. Sales are recognized when control of promised goods or services is transferred to our customers, in an amount that reflects the consideration we expect to be entitled to in exchange for those goods or services. Our shipping terms are generally “shipping point.” Accordingly, control transfers, and salesSales are recognized at a point-in-time, upon "delivery," as such term is defined within the point-in-timecontract, which is generally at the time of shipment.Cost of Sales and Gross ProfitCost of sales consists primarily of purchased materials, direct labor, indirect labor, factory overhead cost, and depreciation expense for our manufacturing facilities and equipment. Our business has a highly variable cost structure, with low fixed overhead ascosts comprising a smaller percentage of cost of sales. In addition, oursales compared to variable costs. Our existing global manufacturing plant capacity is scalable, and we are able to adjust to increased customer demand for our products without significant additional capital investment. We operate our business in this manner to avoid having excessive fixed costs during a cyclical downturn, while retaining flexibility to expand our production volumes during periods of growth. However, this approach resultsduring a cyclical downturn, fixed costs become a larger percentage of cost of sales, which could result in a smaller increase indecrease to gross margin as a percentage of sales in times of increased demand.Sincemargin. Additionally, since the gross margin on each of our products differs,can differ, our overall gross margin as a percentage of our sales changescan change based on the mix of products we sell in any period.37Operating ExpensesOur operating expenses primarily include research and development and sales, general, and administrative expenses. Personnel costs are the most significant component of operating expenses and consist of salaries, benefits, bonuses, and share-based compensation. Operating expenses also include overhead costs for facilities, IT, and depreciation. In addition, our operating expenses include amortization expense of acquired intangible assets and certain non-recurring costs, including facility shutdown costs and executive transition-related costs.Research and development – Research and development expense consists primarily of activities related to product design and other development activities, new component testing and evaluation, and test equipment and fixture development. We expect research and development expense will continue to increase in absolute dollars due to continued development of our own IPintellectual property and product offerings for existing and new customer markets and increases in our customers’ demand for new product designs.Selling, general, and administrative – Selling expense consists primarily of salaries and commissions paid to our sales and sales support employees and other costs related to the sales of our products. General and administrative expense consists primarily of salaries, professional fees, and overhead associated with our administrative staff, professional fees, and depreciation and other allocated facility related costs.staff. We expect selling expenses to increase in absolute dollars as we continue to invest in expanding our markets and as we expand our international operations. We expect general and administrative expenses to also increase in absolute dollars as our business grows, due to an increase in employee-related costs, regulatory compliance, and accountingaccounting-related expenses.Amortization of intangibles – Amortization of intangible assets is related to our finite-lived intangible assets and is computed using the straight-line method over the estimated economic life of the asset.Interest Expense,Interest expense, net of interest income on our cash deposits, consists of interest on our outstanding debt under our credit facilities, including amortization of debt issuance costs, and any other indebtedness we may incur in the future. Borrowings under our credit facilities are generally subject to variable interest rates, which fluctuate depending on macroeconomic factors and can result in increased interest expense in periods of rising interest rates.The functional currency of our international operations is the U.S. dollar. Transactions denominated in currencies other than the functional currency generate foreign exchange gains and losses that are included in other expense (income), net on the accompanying consolidated statements of operations. Substantially all of our sales contracts, and most of our agreements with third-party suppliers, provide for pricing and payment in U.S. dollars. Accordingly, these transactions are not subject to material exchange rate fluctuations.Income Tax Expense (Benefit)Income tax expense (benefit) consists primarily of taxes on our taxable income related to our domestic and foreign operations, offset by the benefit of our tax holiday in Singapore, which was extendedis expected to continue through 2026. In 2021,2023, the tax benefit related toresulting from our Singapore tax holiday, compared to the Singapore statutory tax rate, was $9.7approximately $5.0 million. During 2023, we recorded a valuation allowance against our U.S. state and federal deferred tax assets; therefore, we are unable to record income tax benefits related to our losses under GAAP losses. Income tax is also impacted by certain withholding taxes, stock option and RSUrestricted share unit (“RSU”) activity, and credit generation. Stock options and RSUs have historically provided a discrete benefit to our provision for income taxes in the period they were exercised or vested, respectively, due to increases in our stock price.Critical Accounting Estimates38Critical Accounting Estimates Our consolidated financial statements have been prepared in accordance with U.S. generally accepted accounting principles.GAAP. The preparation of these consolidated financial statements requires us to make estimates and assumptions that affect the reported amounts of assets, liabilities, sales, expenses, and related disclosures. We base our estimates on historical experience and on various other assumptions that we believe are reasonable under the circumstances. We evaluate our estimates and assumptions on an ongoing basis. Actual results may differ from these estimates. To the extent that there are material differences between these estimates and our actual results, our future financial statements will be affected.The critical accounting policies requiring estimates, assumptions, and judgments that we believe have the most significant impact on our consolidated financial statements are described below.Inventory ValuationInventories are stated at the lower of cost or net realizable value. The majority of our inventory valuesinventories are based uponvalued on a standard costs. Oncost basis, which approximates actual costs on a quarterlyfirst-in, first-out basis. The remainder of our inventories are valued on an average cost basis, which approximates actual costs on a first-in, first-out basis. Quarterly, we analyzeassess the value of our inventory and periodically record write-downswrite it down for excess quantities or obsolescence to its estimated excess and obsolete inventory.net realizable value. This analysisassessment is based on estimated future consumption compared to inventory quantities on-hand. The estimate for future consumption is based on how assumptions of historical consumption, recency of purchases, backlog, and other factors indicate future consumption. Once the value of inventory is adjusted, the original cost of our inventory, less the write-down, represents its new cost basis. Reversal of these write-downs are recognized only when the related inventory has been scrapped or sold. During 2021, 2020,2023, 2022, and 2019,2021, we wrote down inventory determined to be excessive or obsolete by $9.8 million, $5.0 million, and $1.9 million, $4.6 million,respectively. We believe the accounting estimate related to excess and $1.1 million, respectively.Business CombinationsWe account for business combinations using the acquisition methodobsolete inventory is a critical accounting estimate because it requires us to make assumptions about future inventory consumption and recoverability of accounting,cost, which requires that assets acquired and liabilities assumed are recorded at fair value. Any excess of the purchase price over the fair value of specifically identifiable assets is recorded as goodwill.Significant judgment is required in estimating the fair value of intangible assets. Our typical intangible assets acquired include customer relationships and order backlogs. The most critical areas of judgment in applying the acquisition method include selecting the appropriate valuation techniques and assumptions that are used to measure the acquired assets and assumed liabilities at fair value. There are several methods that can be used to determine the fair value of intangible assets. We typically use an income approach to value the specifically identifiable intangible assets, which is baseduncertain. Changes in these estimates can have a material impact on forecasts of expected future cash flows. Under the income approach, we utilize a multi-period excess earnings methodology to value the primary intangible asset of a business combination. Assumptions around expected future cash flows used in the fair value estimates are based on available historical information and industry, market, and peer data to inform our future expectations. We typically consult with an independent advisor to assist in the valuation of intangible assets. While we use our best estimates and assumptions to accurately value assets acquired and liabilities assumed at the acquisition dates, our estimates are inherently uncertain and subject to refinement. In addition, unanticipated market or macroeconomic events and circumstances may occur that could affect the accuracy or validity of the estimates and assumptions. If the estimates do not reflect future results or assumptions utilized in the valuation are inaccurate, then our recorded intangible assets and goodwill may become impaired. In November 2021, in connection with our acquisition of IMG, we recorded identifiable intangibles and preliminary goodwill of $65.0 million and $161.0 million, respectively.Results of OperationsResults of Operations The following table sets forth our results of operations for the periods presented. The period-to-period comparison of results is not necessarily indicative of results for future periods.Year Ended Year Ended December 29,
2023December 29,
2023December 30,
2022(in thousands) (in thousands) Research and development Research and development Operating income (loss) Other expense (income), net Income (loss) before income taxes Income tax expense Net income (loss) 39The following table sets forth our results of operations as a percentage of our total sales for the periods presented.Year Ended Year Ended December 29, 2023 December 29, 2023 December 30, 2022 Net sales Net sales Research and development Research and development Operating income (loss) Other expense (income), net Income (loss) before income taxes Income tax expense Net income (loss) Comparison of 2021 and 2020Comparison of 2023 and 2022 Net SalesYear Ended Change December 29,
2023December 30,
2022Amount % (dollars in thousands) Net sales $ 811,120 $ 1,280,069 $ (468,949) (36.6) % The increasedecrease in net sales from 20202022 to 20212023 was primarily due to strongreduced customer demand stemming from our customers as a result of continued growth inreduced spending within the global wafer fabricationsemiconductor capital equipment market, partially offset by production constraints as a result of challenges in our supply chain, as noted above in the commentaryindustry. Further detail is provided above under the heading, section entitled Item 7 – Management’s Discussion and Analysis of Financial Condition and Results of Operations – "Key Factors Affecting Our Business – COVID‑19 Pandemic and Global Supply ChainBusiness"..Net sales to U.S. customers increaseddecreased by $53.1$290.8 million in 20212023 to $544.1$281.3 million. On a relative basis, net sales to U.S. customers as a percent of total net sales decreased from 53.7%44.7% in 20202022 to 49.6%34.7% in 2021.Net sales to international customers increaseddecreased by $129.5$178.1 million in 20212023 to 552.8$529.8 million. On a relative basis, net sales to international customers as a percent of total net sales increased from 46.4%55.3% in 20202022 to 50.4%65.3% in 2021.40Cost of Sales and Gross ProfitYear Ended Year Ended Change December 29,
2023December 29,
2023December 30,
2022Amount % (dollars in thousands) (dollars in thousands) Cost of sales $ 707,724 $ $ 1,068,205 $ $ (360,481) (33.7 (33.7 %) Gross profit $ 103,396 $ $ 211,864 $ $ (108,468) (51.2 (51.2 %) Gross margin 12.7 % 16.6 % -390 bps The increasedecrease in the gross amounts of cost of sales and gross profit from 20222020 to 20212023 was primarily due to the factors mentioned in the commentary above under the above heading, "Net SalesSales".The 250390 basis point increasedecrease in our gross margin from 20202022 to 20212023 was primarily due to was primarilyreduced factory utilization as a result of lower volume due to increased factory utilization, cost reduction initiatives, andreduced customer demand, as well as a lower revenue mix partially offset by increased materials and logistics costs and increased factory inefficiencyfrom sales of components, due to challenges inexcess inventory levels at our supply chain, as noted above in the commentary above under the heading, Item 7 – Management’s Discussioncustomers. Additionally, increased excess and Analysis of Financial Condition and Results of Operations – Key Factors Affecting Our Business – COVID‑19 Pandemic and Global Supply Chain.Additionally, ourobsolete inventory expense unfavorably impacted gross margin for 2021 was impacted by the following discrete items on a year-over-year basis: We incurred a $1.4 million contract settlement loss in 2020 that did not recur in 2021, favorably impacting gross margin, and we incurred $1.7 million in charges related to acquired-inventory being recorded at fair value, the majority of which was from our acquisition of IMG, unfavorably impacting gross margin..Research and DevelopmentYear Ended Change December 29,
2023December 30,
2022Amount % (dollars in thousands) Research and development $ 20,223 $ 19,564 $ 659 3.4 % The increase in research and development expenses from 20202022 to 2021 2023 was primarily due to increased employee-relatedmaterials and professional fees of $1.0 million for program costs related to the development of our new products, partially offset by lower employee related expenses, inclusive of share-based compensation expense, as we expand our engineering team to design and engineer next generation high performance solutions for our customers.of $0.5 million.Year Ended Change December 29,
2023December 30,
2022Amount % (dollars in thousands) Selling, general, and administrative $ 79,334 $ 88,572 $ (9,238) (10.4) % The increasedecrease in selling, general, and administrative expense from 20202022 to 20212023 was primarily due to (i) $4.4 million in transaction costs associated with our acquisitionreduced employee-related expenses, inclusive of IMG in November 2021, a (ii) $4.3 million in employee-related costs (excluding share-based compensation expense) due to increased headcount, salaries, and bonus charges, (iii) $1.3 million in increased IT hardware, software, and service costs, and (iv) $0.8 million in increased share-based compensation expense, of $6.0 million, loss accruals recorded in 2022 relating to an expected settlement of employment-related legal matters totaling $4.1 million, and reduced occupancy-related costs of $0.8 million, partially offset by $1.8 million in executive transitionincreased information technology systems and related consulting and software costs that we incurred in 2020 that did not recur in 2021.Amortization of Intangible AssetsYear Ended Change December 29,
2023December 30,
2022Amount % (dollars in thousands) Amortization of intangibles assets $ 14,734 $ 17,905 $ (3,171) (17.7) % The increasedecrease in amortization expense from 20202022 to 2021 was due to incremental amortization expense from intangible assets acquired in connection with our acquisition of IMG in November 2021.Interest ExpenseThe decrease in interest expense from 2020 to 2021 2023 was primarily due to a 101 basis point decreasecertain intangible assets becoming fully amortized in 2023.41Interest Expense, NetYear Ended Change December 29,
2023December 30,
2022Amount % (dollars in thousands) Interest expense, net $ 19,379 $ 11,056 $ 8,323 75.3 % Weighted average borrowings outstanding $ 292,661 $ 303,036 $ (10,375) (3.4 %) Weighted average borrowing rate 6.80 % 3.37 % + 343 bps The increase in interest expense, net from 2022 to 2023 was due to increases in our weighted average interestborrowing rate, during the year, from 3.75% to 2.74%, and a $10.7 million decreasepartially offset by decreases in theour average amount borrowed during the year.borrowed. The decreaseincrease in our weighted average interestborrowing rate from 2020 to 2021 was primarily due to decreasesan increase in risk-free, short-term borrowing rates as a result of tightening monetary policy, which impacts the applicable marginBloomberg Short Term Bank Yield ("BSBY"), the variable component of our all-in borrowing rate due to continuousunder our credit facilities. The decreases in our leverage ratio during 2020 and 2021 and a lower overall applicable margin we incur for borrowings under our October 2021 amended and restated credit agreement.Other Expense, NetThe increase in other expense, net from 2020 to 2021average amount borrowed was primarily due to a $0.7 million lossquarterly term loan payments and payments on extinguishmentour revolving credit facilities in the second, third, and fourth quarters of debt we incurred2023.Other Expense (Income), NetYear Ended Change December 29,
2023December 30,
2022Amount % (dollars in thousands) Other expense (income), net $ 804 $ (563) $ 1,367 n/m The change in connection with entering into an amended and restated credit agreement in October 2021, partially offset by favorable foreign currency fluctuations for transaction denominated in currencies other than the U.S. dollar.Income Tax BenefitThe increase in tax expense (income), net from 20202022 to 20212023 was primarily due to increasedcurrency exchange rate fluctuations during the year related to our local currency payables of our foreign operations.Income Tax ExpenseYear Ended Change December 29,
2023December 30,
2022Amount % (dollars in thousands) Income tax expense $ 11,907 $ 2,526 $ 9,381 371.4 % Income before income taxes $ (31,078) $ 75,330 $ (106,408) n/m Effective income tax rate (38.3) % 3.4 % -4,170 bps The increase in income tax expense from 2022 to 2023 was primarily due to recording a valuation allowance against our U.S. federal and state deferred tax assets, resulting in an $11.1 million charge to income tax expense during the second quarter of 2023. Because we recorded a valuation allowance against our U.S. state and federal deferred income taxes, we currently do not record tax benefits on our GAAP U.S. taxable income in the U.S, partially offset by increased discrete benefits from share-based compensation activity.Non-GAAP Results42Non-GAAP Financial Results Management uses certain non-GAAP metrics to evaluate our operating and financial results. We believe the presentation of non-GAAP results is useful to investors for analyzing business trends and comparing performance to prior periods, along with enhancing investors’ ability to view our results from management’s perspective. Non-GAAP gross margin is defined as non-GAAP gross profit, divided by net sales. Non-GAAP gross profitoperating income, and non-GAAP net income are defined as: gross profit, operating income (loss), or net income (loss), respectively, excluding as applicable, (1) amortization of intangible assets, share-based compensation expense, and non-recurring expenses,discrete or infrequent charges and gains that are outside of normal business operations, including acquisition-related costs, contract and legal settlement gains and losses, and facility shutdown costs, and severance costs associated with reduction-in-force programs, to the extent they are present in gross profit, oroperating income (loss), and net income;income (loss), respectively; and (2) the tax impacts associated with ourthese non-GAAP adjustments, as well as non-recurring discrete tax items.items, including deferred tax asset valuation allowance changes. All non-GAAP adjustments are presented on a gross basis; the related income tax effects, including current and deferred income tax expense, are included in the adjustment line under the heading "Tax adjustments related to non-GAAP adjustments." Non-GAAP diluted earnings per share (“EPS”shares ("EPS") is defined as non-GAAP net income divided by weighted average diluted ordinary shares outstanding during the period.Non-GAAP results have limitations as an analytical tool, and you should not consider them in isolation or as a substitute for our results reported under GAAP. Other companies may calculate non-GAAP results differently or may use other measures to evaluate their performance, both of which could reduce the usefulness of our non-GAAP results as a tool for comparison.Because of these limitations, you should consider non-GAAP results alongside other financial performance measures and results presented in accordance with GAAP. In addition, in evaluating non-GAAP results, you should be aware that in the future we will incur expenses such as those that are the subject of adjustments in deriving non-GAAP results and you should not infer from our presentation of non-GAAP results that our future results will not be affected by these expenses or any unusualother discrete or non-recurring items.The following table presents our unaudited non‑GAAP gross profit and non-GAAP gross margin and and a reconciliation from gross profit, the most comparable GAAP measure, for the periods indicated:Year Ended Year Ended December 29,
2023December 29,
2023December 30,
2022(dollars in thousands) (dollars in thousands) Share-based compensation Share-based compensation Fair value adjustment to inventory from acquisitions (1) Other (2) U.S. GAAP gross margin 12.7 % 16.6 % Non-GAAP gross margin 13.4 % 17.0 % (2)(1)During the second quarter of 2020, we announced the closure of our manufacturing facility in Union City, California, which we completed during the second quarter of 2021.for 2021 are (i) write-off costs associated with inventories determined during the period to be obsolete of $2.9 million and (ii) severance costs associated with affected employeesour global reduction-in-force programs.
| Year Ended | |||||||||||
| December 29, 2023 | December 30, 2022 | ||||||||||
| (dollars in thousands) | |||||||||||
| U.S. GAAP operating income (loss) | $ | (10,895) | $ | 85,823 | |||||||
| Non-GAAP adjustments: | |||||||||||
| Amortization of intangible assets | 14,734 | 17,905 | |||||||||
| Share-based compensation | 17,338 | 13,924 | |||||||||
| Settlement loss (1) | — | 4,146 | |||||||||
| Fair value adjustment to inventory from acquisitions (2) | — | 2,492 | |||||||||
| Acquisition costs (3) | — | 296 | |||||||||
| Other (4) | 2,298 | 1,144 | |||||||||
| Non-GAAP operating income | $ | 23,475 | $ | 125,730 | |||||||
| U.S. GAAP operating margin | (1.3) | % | 6.7 | % | |||||||
| Non-GAAP operating margin | 2.9 | % | 9.8 | % | |||||||
sales as acquired-inventories were sold.
|
|
|
|
|
|
The following table presents our unaudited non‑GAAP net income and non-GAAP diluted EPS and and a reconciliation from net income (loss), the most comparable GAAP measure, for the periods indicated:
|
| Year Ended |
| |||||
|
| December 31, 2021 |
|
| December 25, 2020 |
| ||
|
| (dollars in thousands, except per share amounts) |
| |||||
U.S. GAAP net income |
| $ | 70,899 |
|
| $ | 33,279 |
|
Non-GAAP adjustments: |
|
|
|
|
|
|
|
|
Amortization of intangible assets |
|
| 14,918 |
|
|
| 13,365 |
|
Share-based compensation |
|
| 11,473 |
|
|
| 9,875 |
|
Facility shutdown costs (1) |
|
| 2,996 |
|
|
| 2,463 |
|
Contract settlement loss (2) |
|
| — |
|
|
| 1,386 |
|
Fair value adjustment to inventory from acquisitions (3) |
|
| 1,652 |
|
|
| — |
|
Acquisition costs (4) |
|
| 4,386 |
|
|
| — |
|
Other non-recurring expense, net (5) |
|
| 498 |
|
|
| 7,181 |
|
Loss on extinguishment of debt (6) |
|
| 737 |
|
|
| — |
|
Tax adjustments related to non-GAAP adjustments (7) |
|
| (9,861 | ) |
|
| (8,507 | ) |
Non-GAAP net income |
| $ | 97,698 |
|
| $ | 59,042 |
|
U.S. GAAP diluted EPS |
| $ | 2.45 |
|
| $ | 1.42 |
|
Non-GAAP diluted EPS |
| $ | 3.37 |
|
| $ | 2.52 |
|
Shares used to compute diluted EPS |
|
| 28,979,352 |
|
|
| 23,460,105 |
|
|
|
Includedindicated. All non-GAAP adjustments are presented on a gross basis; the related income tax effects, including current and deferred income tax expense, are included in this amount for 2021 are (i) write-off costs associated with inventories determined during the periodadjustment line under the heading "Tax adjustments related to be obsoletenon-GAAP adjustments."
| Year Ended | |||||||||||
| December 29, 2023 | December 30, 2022 | ||||||||||
| (dollars in thousands, except per share amounts) | |||||||||||
| U.S. GAAP net income (loss) | $ | (42,985) | $ | 72,804 | |||||||
| Non-GAAP adjustments: | |||||||||||
| Amortization of intangible assets | 14,734 | 17,905 | |||||||||
| Share-based compensation | 17,338 | 13,924 | |||||||||
| Settlement loss (1) | — | 4,146 | |||||||||
| Fair value adjustment to inventory from acquisitions (2) | — | 2,492 | |||||||||
| Acquisition costs (3) | — | 296 | |||||||||
| Other (4) | 2,298 | 1,144 | |||||||||
| Tax adjustments related to non-GAAP adjustments (5) | 9,778 | (7,848) | |||||||||
| Tax expense from valuation allowance (6) | 11,094 | — | |||||||||
| Non-GAAP net income | $ | 12,257 | $ | 104,863 | |||||||
| U.S. GAAP diluted EPS | $ | (1.47) | $ | 2.51 | |||||||
| Non-GAAP diluted EPS | $ | 0.42 | $ | 3.62 | |||||||
| Shares used to compute diluted non-GAAP EPS | 29,514,553 | 28,963,031 | |||||||||
Included in this amount for 2020 are (i) write-off costs associated with inventories determined during the period to be obsolete of $1.3 million, (ii) severance costs associated with affected employees of $0.5 million, and (iii) accelerated depreciation charges associated with property and equipment that was expected to be abandoned at the time of facility closure of $0.6 million.
|
|
(3) |
|
|
|
|
|
Included in this amount for 2020 are primarily (i) a $3.6 million loss on the sale of inventories and property and equipment from our Tampa, Florida facility, (ii) non-capitalizedtransaction-related costs incurred in connection with our implementationacquisition of a new ERP system and a SOX compliance program, and (iii)IMG.
| Liquidity and | ||
|
|
Liquidity and Capital Resources
The following section discusses our liquidity and capital resources, including our primary sources of liquidity and our material cash requirements. Our cash and cash equivalents are maintained in highly liquid and accessible accounts with no significant restrictions.
|
| Year Ended |
| |||||||||||||||||||||||||||||||||||||||||||
|
| December 31, 2021 |
|
| December 25, 2020 |
|
| December 27, 2019 |
| |||||||||||||||||||||||||||||||||||||
|
| (in thousands) |
| |||||||||||||||||||||||||||||||||||||||||||
| Year Ended | Year Ended | |||||||||||||||||||||||||||||||||||||||||||||
| December 29, 2023 | December 29, 2023 | December 30, 2022 | December 31, 2021 | |||||||||||||||||||||||||||||||||||||||||||
| (in thousands) | (in thousands) | |||||||||||||||||||||||||||||||||||||||||||||
Cash provided by operating activities |
| $ | 15,272 |
|
| $ | 38,259 |
|
| $ | 57,150 |
| ||||||||||||||||||||||||||||||||||
Cash used in investing activities |
|
| (289,585 | ) |
|
| (14,597 | ) |
|
| (20,490 | ) | ||||||||||||||||||||||||||||||||||
Cash provided by (used in) financing activities |
|
| 96,909 |
|
|
| 168,625 |
|
|
| (19,882 | ) | ||||||||||||||||||||||||||||||||||
Net increase (decrease) in cash |
| $ | (177,404 | ) |
| $ | 192,287 |
|
| $ | 16,778 |
| ||||||||||||||||||||||||||||||||||
The 2022. Cash provided by financing activities during $1.0 million.The change in net payments on, and net proceeds from, our facilities relates to fluctuations in cash required for working capital purposes relative to the geographic distribution of available cash during the periods then ended. The increase in net proceeds from share-based compensation activity from 2022 to 2023 was due to increased stock option exercises. 29, 2023. statements. December 29, 2023. Our independent registered public accounting firm, KPMG, LLP, Other than the changes in connection with our implementation of the material 29, 2023. 29, 2023. (a)The following documents are filed as a part of this report: The following Consolidated Financial Statements are filed as part of this report under Item (2)Financial Statement Schedules. All financial statement schedules are omitted because they are not applicable or the required information is shown in the financial statements or the notes thereto. Opinion on Internal Control Because of its inherent limitations, internal control over financial reporting may not prevent or detect misstatements. Also, projections of any evaluation of effectiveness to future periods are subject to the risk that controls may become inadequate because of changes in conditions, or that the degree of compliance with the policies or procedures may deteriorate. December 31, 2021 December 25, 2020 Assets Current assets: Cash and cash equivalents $ 75,495 $ 252,899 Accounts receivable, net 142,990 100,977 Inventories 236,133 134,756 Prepaid expenses and other current assets 8,153 7,082 Total current assets 462,771 495,714 Property and equipment, net 85,204 41,811 Operating lease right-of-use assets 29,790 10,088 Other noncurrent assets 9,166 5,503 Deferred tax assets, net 8,116 6,324 Intangible assets, net 89,927 39,845 Goodwill 335,902 174,887 Total assets $ 1,020,876 $ 774,172 Liabilities and Shareholders’ Equity Current liabilities: Accounts payable $ 159,727 $ 116,664 Accrued liabilities 19,066 20,792 Other current liabilities 14,377 10,700 Current portion of long-term debt 7,500 8,750 Current portion of lease liabilities 7,633 5,128 Total current liabilities 208,303 162,034 Long-term debt, less current portion, net 285,253 191,522 Lease liabilities, less current portion 22,354 5,272 Deferred tax liabilities, net 38 109 Other non-current liabilities 4,213 3,546 Total liabilities 520,161 362,483 Shareholders’ equity: Preferred shares ($0.0001 par value; 20,000,000 shares authorized; 0 shares issued and outstanding) — — Ordinary shares ($0.0001 par value; 200,000,000 shares authorized; 28,551,160 and 27,907,077 shares outstanding, respectively; 32,988,599 and 32,344,516 shares issued, respectively) 3 3 Additional paid in capital 417,438 399,311 Treasury shares at cost (4,437,439 shares) (91,578 ) (91,578 ) Retained earnings 174,852 103,953 Total shareholders’ equity 500,715 411,689 Total liabilities and shareholders’ equity $ 1,020,876 $ 774,172 Year Ended December 31, 2021 December 25, 2020 December 27, 2019 Net sales $ 1,096,917 $ 914,236 $ 620,837 Cost of sales 919,437 789,344 534,473 Gross profit 177,480 124,892 86,364 Operating expenses: Research and development 15,691 13,361 11,102 Selling, general, and administrative 65,857 56,614 47,270 Amortization of intangible assets 14,918 13,365 13,015 Total operating expenses 96,466 83,340 71,387 Operating income 81,014 41,552 14,977 Interest expense, net 6,451 8,727 10,647 Other expense, net 807 534 55 Income before income taxes 73,756 32,291 4,275 Income tax expense (benefit) 2,857 (988 ) (6,454 ) Net income $ 70,899 $ 33,279 $ 10,729 Net income per share: Basic $ 2.51 $ 1.44 $ 0.48 Diluted $ 2.45 $ 1.42 $ 0.47 Shares used to compute net income per share: Basic 28,259,607 23,172,961 22,418,802 Diluted 28,979,352 23,460,105 22,766,903 Additional Total Ordinary Shares Paid-In Treasury Shares Retained Shareholders' Shares Amount Capital Shares Amount Earnings Equity Balance at December 28, 2018 22,234,508 $ 2 $ 228,358 4,339,529 $ (89,979 ) $ 59,945 $ 198,326 Ordinary shares issued from exercise of stock options 353,027 — 5,042 — — — 5,042 Ordinary shares issued from vesting of restricted share units 81,438 — (290 ) — — — (290 ) Ordinary shares issued from employee share purchase plan 47,645 — 671 — — — 671 Repurchase of ordinary shares (97,910 ) — — 97,910 (1,599 ) — (1,599 ) Share-based compensation expense — — 8,537 — — — 8,537 Net income — — — — — 10,729 10,729 Balance at December 27, 2019 22,618,708 2 242,318 4,437,439 (91,578 ) 70,674 221,416 Ordinary shares issued, net of transaction costs 4,600,000 1 139,371 — — — 139,372 Ordinary shares issued from exercise of stock options 514,481 — 8,849 — — — 8,849 Ordinary shares issued from vesting of restricted share units 140,700 — (1,829 ) — — — (1,829 ) Ordinary shares issued from employee share purchase plan 33,188 — 727 — — — 727 Share-based compensation expense — — 9,875 — — — 9,875 Net income — — — — — 33,279 33,279 Balance at December 25, 2020 27,907,077 3 399,311 4,437,439 (91,578 ) 103,953 411,689 Ordinary shares issued from exercise of stock options 410,558 — 8,288 — — — 8,288 Ordinary shares issued from vesting of restricted share units 164,613 — (3,616 ) — — — (3,616 ) Ordinary shares issued from employee share purchase plan 68,912 — 1,982 — — — 1,982 Share-based compensation expense — — 11,473 — — — 11,473 Net income — — — — — 70,899 70,899 Balance at December 31, 2021 28,551,160 $ 3 $ 417,438 4,437,439 $ (91,578 ) $ 174,852 $ 500,715 Year Ended December 31, 2021 December 25, 2020 December 27, 2019 Cash flows from operating activities: Net income $ 70,899 $ 33,279 $ 10,729 Adjustments to reconcile net income to net cash provided by (used in) operating activities: Depreciation and amortization 25,992 24,246 21,869 Share-based compensation 11,473 9,875 8,537 Deferred income taxes (1,863 ) (1,687 ) (7,131 ) Amortization of debt issuance costs 883 968 937 Gain on sale of asset disposal group (504 ) 3,575 — Loss on extinguishment of debt 737 — — Other 484 — — Changes in operating assets and liabilities, net of acquisitions: Accounts receivable, net (33,454 ) (16,128 ) (44,562 ) Inventories (89,249 ) (8,527 ) (5,931 ) Prepaid expenses and other assets 786 (2,076 ) 6,067 Accounts payable 38,649 (14,509 ) 67,966 Accrued liabilities (6,740 ) 7,722 3,214 Other liabilities (2,821 ) 1,521 (4,545 ) Net cash provided by operating activities 15,272 38,259 57,150 Cash flows from investing activities: Capital expenditures (20,839 ) (10,301 ) (12,343 ) Cash paid for acquisitions, net of cash acquired (268,766 ) (5,035 ) — Cash paid for intangible assets — — (8,147 ) Purchase of marketable securities (115,197 ) — — Proceeds from maturities and sales of marketable securities 114,713 — — Proceeds from sale of property and equipment 504 739 — Net cash used in investing activities (289,585 ) (14,597 ) (20,490 ) Cash flows from financing activities: Issuance of ordinary shares, net of fees — 139,372 — Issuance of ordinary shares under share-based compensation plans 9,664 9,832 5,757 Employees' taxes paid upon vesting of restricted share units (3,616 ) (1,829 ) (290 ) Repurchase of ordinary shares — — (1,599 ) Debt issuance and modification costs (1,852 ) — — Borrowings on revolving credit facility 137,591 30,000 13,000 Repayments on revolving credit facility (41,753 ) — (28,000 ) Proceeds from term loan 94,175 — Repayments on term loan (97,300 ) (8,750 ) (8,750 ) Net cash provided by (used in) financing activities 96,909 168,625 (19,882 ) Net increase (decrease) in cash (177,404 ) 192,287 16,778 Cash at beginning of period 252,899 60,612 43,834 Cash at end of period $ 75,495 $ 252,899 $ 60,612 Supplemental disclosures of cash flow information: Cash paid during the period for interest $ 7,123 $ 8,235 $ 8,424 Cash paid during the period for taxes, net of refunds $ 5,642 $ 250 $ 896 Supplemental disclosures of non-cash activities: Capital expenditures included in accounts payable $ 930 $ 369 $ 774 Right-of-use assets obtained in exchange for new operating lease liabilities, including those acquired through acquisitions $ 24,643 $ 642 $ 817 goodwill. Revenue Recognition Fair Value Measurements ▪Level 1 Inputs: Unadjusted quoted prices in active markets for identical assets or liabilities accessible to the reporting entity at the measurement date ▪Level 2 Inputs: Other than quoted prices included in Level 1 inputs that are observable for the asset or liability, either directly or indirectly, for substantially the full term of the asset or liability 30, 2022. Machinery 5-10 years Leasehold improvements 10 years Computer software, hardware, and equipment 3-5 years Office furniture, fixtures, and equipment 5-7 years Vehicles 5 years Developed technology Income Taxes Issued Preliminary Allocation November 19, 2021 Cash acquired $ 1,234 Accounts receivable 8,559 Inventories 12,128 Prepaid expenses and other current assets 579 Property and equipment 33,067 Operating lease right-of-use assets 14,509 Intangible assets 65,000 Goodwill 161,015 Accounts payable (3,853 ) Accrued expenses (5,620 ) Other current liabilities (2,109 ) Lease liabilities (14,509 ) Total acquisition consideration $ 270,000 We 2022 and 2021, respectively. Total acquisition consideration reflects a $0.5 million reduction for a working capital adjustment that was finalized in 2022, prior to the end of the measurement period. The following table is the unaudited pro forma consolidated results of Year Ended December 31, 2021 December 25, 2020 Net sales $ 1,156,619 $ 962,642 Net income $ 74,531 $ 26,048 Net income per share: Basic $ 2.64 $ 1.12 Diluted $ 2.57 $ 1.11 December 31, 2021 December 25, 2020 Raw materials $ 159,366 $ 88,015 Work in process 62,537 38,184 Finished goods 28,281 21,299 Excess and obsolete adjustment (14,051 ) (12,742 ) Total inventories $ 236,133 $ 134,756 Excess and obsolete adjustment Balance at December 28, 2018 $ (7,692 ) Charge to cost of sales (1,086 ) Disposition of inventory 961 Balance at December 27, 2019 (7,817 ) Charge to cost of sales (4,649 ) Disposition of inventory (276 ) Balance at December 25, 2020 (12,742 ) Charge to cost of sales (1,942 ) Disposition of inventory 633 Balance at December 31, 2021 $ (14,051 ) December 31, 2021 December 25, 2020 Machinery $ 80,953 $ 37,196 Leasehold improvements 36,706 29,616 Computer software, hardware, and equipment 8,031 6,501 Office furniture, fixtures and equipment 1,168 1,166 Vehicles 284 75 Construction-in-process 8,565 5,483 135,707 80,037 Less accumulated depreciation (50,503 ) (38,226 ) Total property and equipment, net $ 85,204 $ 41,811 The Capitalized cloud computing implementation costs as of December 27, 2019 $ — Costs capitalized during the period 4,366 Capitalized costs amortized during the period — Capitalized cloud computing implementation costs as of December 25, 2020 4,366 Costs capitalized during the period 3,992 Capitalized costs amortized during the period (304 ) Capitalized cloud computing implementation costs as of December 31, 2021 $ 8,054 $8.1 million as of December 29, 2023 and December 30, 2022, respectively, and is included in other assets on our consolidated balance sheets. The related amortization expense was $1.1 million, $0.9 million, and $0.3 million during 2023, 2022, and 2021, respectively, and is included in selling, general, and administrative expense on our consolidated statements of operations. December 31, 2021 Gross value Accumulated amortization Accumulated impairment charges Carrying amount Weighted average useful life Customer relationships 146,569 (65,953 ) — 80,616 8.7 years Developed technology 11,047 (3,483 ) — 7,564 10.0 years Order backlog 2,600 (853 ) — 1,747 6 months Total intangible assets $ 160,216 $ (70,289 ) $ — $ 89,927 December 25, 2020 Gross value Accumulated amortization Accumulated impairment charges Carrying amount Weighted average useful life Trademarks $ 9,690 $ (8,717 ) $ — $ 973 10.0 years Customer relationships 84,169 (53,946 ) — 30,223 7.8 years Developed technology 11,047 (2,398 ) — 8,649 10.0 years Total intangible assets $ 104,906 $ (65,061 ) $ — $ 39,845 Future amortization expense 2022 $ 17,763 2023 14,803 2024 8,435 2025 8,311 2026 7,730 Thereafter 32,885 $ 89,927 Goodwill Balance at December 28, 2018 $ 173,010 Acquisitions — Balance at December 27, 2019 173,010 Acquisitions 1,877 Balance at December 25, 2020 174,887 Acquisitions 161,015 Balance at December 31, 2021 $ 335,902 Year Ended December 31, 2021 December 25, 2020 December 27, 2019 Operating lease cost $ 5,763 $ 5,397 $ 5,420 Year Ended December 31, 2021 December 25, 2020 December 27, 2019 Cash paid for amounts included in the measurement of lease liabilities: Operating cash flows from operating leases $ 5,477 $ 5,574 $ 5,220 December 31, 2021 December 25, 2020 Weighted-average remaining lease term of operating leases 5.8 years 2.3 years Weighted-average discount rate of operating leases 2.4% 4.5% 2022 $ 7,633 2023 5,401 2024 4,550 2025 4,230 2026 3,737 Thereafter 6,292 Total future minimum lease payments 31,843 Less imputed interest (1,856 ) Total lease liabilities $ 29,987 Year Ended December 31, 2021 December 25, 2020 December 27, 2019 United States $ 13,435 $ (2,558 ) $ (20,993 ) Foreign 60,321 34,849 25,268 Income before tax $ 73,756 $ 32,291 $ 4,275 Year Ended December 31, 2021 December 25, 2020 December 27, 2019 Current: Federal $ 430 $ (1,103 ) $ (812 ) State 1,524 341 649 Foreign 2,766 1,461 868 Total current tax expense 4,720 699 705 Deferred: Federal (889 ) (1,321 ) (5,315 ) State (771 ) (196 ) (1,218 ) Foreign (203 ) (170 ) (626 ) Total deferred tax benefit (1,863 ) (1,687 ) (7,159 ) Income tax expense (benefit) $ 2,857 $ (988 ) $ (6,454 ) The reconciliation of income tax computed at the U.S. federal statutory tax rates to income tax expense (benefit) consist of the following: Year Ended December 31, 2021 December 25, 2020 December 27, 2019 Effective rate reconciliation: U.S. federal tax expense $ 15,489 $ 6,781 $ 898 State income taxes, net 577 105 (523 ) Permanent items 680 298 (75 ) Foreign rate differential (1,897 ) (1,325 ) (1,051 ) Tax holiday (9,653 ) (5,911 ) (4,582 ) Credits (1,647 ) (1,411 ) (918 ) Tax contingencies 482 80 (830 ) Share-based compensation (2,640 ) (1,002 ) (285 ) Withholding tax 1,044 819 554 Other, net 385 330 201 Valuation allowance 37 248 157 Income tax expense (benefit) $ 2,857 $ (988 ) $ (6,454 ) December 31, 2021 December 25, 2020 Deferred tax assets: Inventory $ 4,643 $ 3,836 Share-based compensation 2,551 2,266 Accrued payroll 2,140 2,370 Net operating loss carryforwards 816 873 Tax credits 5,103 7,943 Intercompany interest 1,907 1,689 Operating lease liabilities 7,450 2,616 Other assets 755 414 Deferred tax assets 25,365 22,007 Valuation allowance (556 ) (518 ) Total deferred tax assets 24,809 21,489 Deferred tax liabilities: Intangible assets (3,265 ) (7,344 ) Property, plant and equipment (5,928 ) (5,273 ) Operating lease right-of-use assets (7,409 ) (2,568 ) Other liabilities (129 ) (89 ) Total deferred tax liabilities (16,731 ) (15,274 ) Net deferred tax asset $ 8,078 $ 6,215 2028. At December 29, 2023, we had foreign tax credits of $1.3 million, which, if not utilized, will begin to expire in 2032. We were granted a tax holiday for our Singapore operations that is effective through 2026. The net impact of the tax holiday in Singapore as compared to the Singapore statutory rate was a benefit of $5.0 million, $11.7 million, and $9.7 million Unrecognized tax benefits Balance at December 28, 2018 $ 2,256 Increase related to current year tax positions 380 Increase related to prior year tax positions 8 Decrease in tax positions related to lapse of statute of limitations and settlements (784 ) Balance at December 27, 2019 1,860 Increase related to current year tax positions 378 Increase related to prior year tax positions 484 Decrease in tax positions related to lapse of statute of limitations (232 ) Balance at December 25, 2020 2,490 Increase related to current year tax positions 597 Decrease in tax positions related to lapse of statute of limitations (92 ) Balance at December 31, 2021 $ 2,995 December 31, 2021 December 25, 2020 Term loan $ 150,000 $ 153,125 Revolving credit facility 145,000 49,162 Total principal amount of long-term debt 295,000 202,287 Less unamortized debt issuance costs (2,247 ) (2,015 ) Total long-term debt, net 292,753 200,272 Less current portion (7,500 ) (8,750 ) Total long-term debt, less current portion, net $ 285,253 $ 191,522 Future maturities of long-term debt 2022 $ 7,500 2023 7,500 2024 7,500 2025 7,500 2026 265,000 Total $ 295,000 Total Number of Shares Repurchased Total Cost of Repurchase Average Price Paid per Share Amount Available Under Repurchase Program Amount available at December 28, 2018 $ 10,021 Quarter ended March 29, 2019 97,910 1,599 $ 16.33 $ 8,421 Quarter ended June 28, 2019 — — $ — $ 8,421 Quarter ended September 27, 2019 — — $ — $ 8,421 Quarter ended December 27, 2019 — — $ — $ 8,421 Year ended December 27, 2019 97,910 $ 1,599 $ 16.33 $ 8,421 Year Ended December 31, 2021 December 25, 2020 December 27, 2019 Weighted average expected term -- 5 years 5 years Risk-free interest rate -- 0.5% 2.1% Dividend yield -- 0.0% 0.0% Volatility -- 61.5% 55.3% Number of Stock Options Service condition Performance condition Weighted average exercise price per share Weighted average remaining contractual term Aggregate intrinsic value Outstanding, December 25, 2020 1,325,826 65,908 $ 22.22 Granted — — $ — Exercised (344,650 ) (65,908 ) $ 20.19 Forfeited or expired (59,707 ) — $ 21.15 Outstanding, December 31, 2021 921,469 — $ 23.20 3.8 years $ 21,035 Exercisable, December 31, 2021 608,373 — $ 22.96 3.4 years $ 14,056 Year Ended December 31, 2021 December 25, 2020 December 27, 2019 Weighted average grant-date fair value of options granted -- $ 12.10 $ 11.33 Total intrinsic value of options exercised $ 11,859 $ 7,292 $ 3,619 The following table summarizes RSU activity: Number of Restricted Share Units Service condition Performance condition Market condition Weighted average grant-date fair value per share Unvested, December 25, 2020 564,626 — — $ 24.09 Granted 286,365 9,716 14,572 $ 49.59 Vested (242,626 ) — — $ 24.20 Forfeited (49,055 ) 0 0 $ 30.76 Unvested, December 31, 2021 559,310 9,716 14,572 $ 37.05 Year Ended December 31, 2021 December 25, 2020 December 27, 2019 Weighted average grant-date fair value per share of RSUs granted $ 49.59 $ 24.50 $ 23.25 Total grant-date fair value of shares vested $ 5,871 $ 4,731 $ 2,217 At December Year Ended December 31, 2021 December 25, 2020 December 27, 2019 Weighted average expected term 0.5 years 0.5 years 0.5 years Risk-free interest rate 0.1% 0.7% 2.3% Dividend yield 0.0% 0.0% 0.0% Volatility 63.7% 60.1% 56.0% Therefore, we operate in one operating segment. Year Ended December 31, 2021 December 25, 2020 December 27, 2019 United States of America $ 544,109 $ 490,965 $ 329,037 Singapore 383,278 303,444 198,657 Europe 78,745 70,915 56,090 Other 90,785 48,912 37,053 Total net sales $ 1,096,917 $ 914,236 $ 620,837 Year Ended December 31, 2021 December 25, 2020 December 27, 2019 Lam Research $ 579,009 $ 475,933 $ 319,144 Applied Materials $ 352,077 $ 316,082 $ 207,391 Foreign long-lived assets, exclusive of deferred tax assets, were Year Ended December 31, 2021 December 25, 2020 December 27, 2019 Numerator: Net income $ 70,899 $ 33,279 $ 10,729 Denominator: Basic weighted average ordinary shares outstanding 28,259,607 23,172,961 22,418,802 Dilutive effect of options 480,790 221,565 259,337 Dilutive effect of RSUs 237,357 61,761 85,603 Dilutive effect of ESPP 1,598 3,818 3,161 Diluted weighted average ordinary shares outstanding 28,979,352 23,460,105 22,766,903 Securities excluded from the calculation of diluted weighted average ordinary shares outstanding (1) 273,000 1,430,000 1,588,000 Earnings per share: Net income: Basic $ 2.51 $ 1.44 $ 0.48 Diluted $ 2.45 $ 1.42 $ 0.47 (1) Represents potentially dilutive options and RSUs that were excluded from the calculation of net income per share, because including them would have been antidilutive under the treasury stock method. Description of Exhibit 2.1 3.1 23.1* 31.1* 31.2* 32.1* 32.2* Inline XBRL Taxonomy Extension Schema Inline XBRL Taxonomy Extension Calculation Linkbase Inline XBRL Taxonomy Extension Definition Linkbase Inline XBRL Taxonomy Extension Label Linkbase Inline XBRL Taxonomy Extension Presentation Linkbase Cover Page Interactive Data File (embedded within the Inline XBRL *Filed herewith ICHOR HOLDINGS, LTD. /s/ Jeffrey S. Andreson Jeffrey S. Andreson Name and Title Date /s/ Jeffrey S. Andreson Chief Executive Officer and Director (Principal Executive Officer) February Chief Financial Officer (Principal Accounting and Financial Officer) February Executive Chairman and Director February Lead Independent Director February Iain MacKenzie /s/ Marc Haugen February February John Kispert /s/ Laura Black February February February Sarah O’Dowd Jorge Titinger February Yuval Wassermanincreasedecrease in our net operating assets and liabilities net of acquisitions,$38.9 million was primarily due to an increase in inventories of $89.2 million and an increasea decrease in accounts receivable and inventories of $33.5$69.6 million and $37.8 million, respectively, partially offset by an increasea decrease in accounts payable and accrued and other liabilities of $38.6 million.$51.0 million and $27.7 million, respectively.Cash provided by operating activities was $31.5 million during 2022. The increase in our inventories, net of acquired inventories, is primarily drivencash provided by elevated purchasing activity pursuantoperating activities from 2022 to strong customer demand and certain supply chain component constraints. The increase in accounts receivable, net of acquired receivables,2023 was primarily due to increased revenuefavorable changes in the fourth quarterbalances of 2021accounts receivable and inventories during 2023 compared to 2022, partially offset by less aggregate net income (loss) and net non-cash charges and unfavorable changes in the fourth quarterbalance of 2020accrued and timing of customer payments. The increase in accounts payable, net of acquired payables, is primarily due to higher purchasesother liabilities during the fourth quarter of 20212023 compared to the fourth quarter of 2020 and payment timing.Cash used in investing activities during 2021 consists2023 and 2022 consisted of cash paid to acquire IMGcapital expenditures. The reduction in November 2021 of $268.8 million, net of cash acquired, capital expenditures from 2023 to 2022 was due to reduced factory capacity expansion projects.46Cash used in financing activities during 2023 consisted of net proceedspayments from the purchase and saleour credit facilities of marketable securities of $0.5$52.5 million, partially offset by net proceeds from the saleshare-based compensation activity of property and equipment of $0.5$3.8 million.2021 consists2022 consisted of net proceeds from our credit facilities of $90.9$7.5 million which includes $1.9 million in fees incurred associated with effecting an amended and restated credit agreement in October 2021, and net proceeds from share-based compensation activity of $6.0 million.Recent Accounting PronouncementsRecent Accounting Pronouncements From time to time, the Financial Accounting Standards Board (“FASB”) or other standards setting bodies issue new accounting pronouncements. Updates to the FASB Accounting Standards Codification are communicated through issuance of an Accounting Standards Update (“ASU”). Unless otherwise discussed, we believe that the impact of recently issued guidance, whether adopted or to be adopted in the future, is not expected to have a material impact on our Consolidated Financial Statements upon adoption.To understand the impact of recently issued guidance, whether adopted or to be adopted, please review the information provided in Note 1 – Organization and Summary of Significant Accounting Policies of our consolidated financial statements in Part IV, Item 15 of this report.ITEM 7A. QUANTITATIVE AND QUALITATIVE DISCLOSURES ABOUT MARKET RISKWe are exposed to financial market risks, including changes in currency exchange rates and interest rates.Foreign Currency Exchange RiskCurrently, substantiallyForeign Currency Exchange Risk Substantially all of our sales arrangement with customers, and the significant majority of our arrangements with third-party suppliers, provide for pricing and payment in U.S. dollars and, therefore, are not subject to material exchange rate fluctuations. As a result, we do not expect foreign currency exchange rate fluctuations to have a material effect on our results of operations. However, increases in the value of the U.S. dollar relative to other currencies would make our products more expensive relative to competing products priced in such other currencies, which could negatively impact our ability to compete. Conversely, decreases in the value of the U.S. dollar relative to other currencies could result in our foreign suppliers raising their prices in order to continue doing business with us.While not currently significant, we doWe have certain operating expenses that are denominated in currencies of the countries in which our operations are located, and may be subject to fluctuations due to foreign currency exchange rates, particularly the Singapore dollar, Malaysian ringgit, British pound, euro, Korean won, and euro.Mexican peso. Fluctuations in foreign currency exchange rates may cause us to recognize transaction gains and losses in our statement of operations. To date, foreign currency transaction gains and losses have not been material to our financial statements, and we have not engaged in any foreign currency hedging transactions.Interest Rate RiskInterest Rate Risk We had total indebtedness of $295.0$250.0 million as of December 31, 2021,29, 2023, exclusive of $2.2$1.3 million in debt issuance costs, of which $7.5 million is duewas payable within the next 12 months. We do not enter into investments for trading or speculative purposes and have not used any derivative financial instruments to manage our interest rate risk exposure. We have not been, exposed to, nor do we anticipate being exposed to, material risks due to changes in interest rates. As of December 31, 2021,29, 2023, the interest rate on our outstanding debt iswas based on the BSBY, plus an applicable rate depending on our leverage ratio. A hypothetical 100 basis point change in the interest rate on our outstanding debt would have resulted in a $1.9 million and $2.0$2.5 million change to interest expense during 2021 and 2020, respectively.on an annualized basis.ITEM 8. FINANCIAL STATEMENTS AND SUPPLEMENTARY DATAThe financial statements and supplementary financial information required to be filed under this Item 8 are presented beginning on page F‑1 in Part IV, Item 15 of this annual report on Form 10‑K and are incorporated herein by reference.47ITEM 9. CHANGES IN AND DISAGREEMENTS WITH ACCOUNTANTS ON ACCOUNTING AND FINANCIAL DISCLOSURENone.ITEM 9A. CONTROLS AND PROCEDURESEvaluation of Disclosure Controls and ProceduresEvaluation of Disclosure Controls and Procedures We carried out an evaluation under the supervision and with the participation of our management, including our Chief Executive Officer and Chief Financial Officer (the certifying officers), of the effectiveness of the design and operation of our disclosure controls and procedures (as defined in Rules 13a‑15(e) and 15d‑15(e) under the Securities and Exchange Act, as amended (“the Exchange Act”))Act) as of December 31, 2021.29, 2023. There are inherent limitations to the effectiveness of any system of disclosure controls and procedures, including the possibility of human error and the circumvention or overriding of the controls and procedures. Accordingly, even effective disclosure controls and procedures can only provide reasonable assurance of achieving their control objectives. Based on this evaluation, our Chief Executive Officer and Chief Financial Officercertifying officers concluded that as a result of the material weaknesses in internal control over financial reporting as described below, our disclosure controls and procedures were not effective as of December 31, 2021.Management’s Report on Internal Control Over Financial ReportingManagement’s Report on Internal Control Over Financial Reporting Our management is responsible for establishing and maintaining adequate internal control over financial reporting (as defined in Rules 13a‑15(f) and 15d‑15(f) under the Exchange Act). With the participation of our Chief Executive Officer and Chief Financial Officer,certifying officers, our management, under the oversight of our Board of Directors, evaluated the effectiveness of our internal control over financial reporting as of December 31, 202129, 2023, using the framework issued by the Committee of Sponsoring Organizations of the Treadway Commission (“COSO”) in Internal Control—Control – Integrated Framework (2013). We completed our acquisition of IMG Companies, LLC, and its subsidiaries (“IMG”) on November 19, 2021. We are continuing to integrate IMG into ourOur internal control over financial reporting is designed to provide reasonable assurance with U.S. GAAP and management’s evaluationincludes those policies and procedures that: (1) pertain to the maintenance of records that in reasonable detail accurately and fairly reflect our transactions and the dispositions of our assets; (2) provide reasonable assurance that our transactions are recorded as necessary to permit preparation of the effectivenessfinancial statements in accordance with GAAP and that our receipts and expenditures are being made in accordance with appropriate authorizations; and (3) provide reasonable assurance regarding the prevention or timely detection of unauthorized acquisition, use or disposition of our internal control overassets that could have a material effect on our financial reporting excluded IMG. IMG had total assets of approximately $293.0 million as of December 31, 2021, and included in the results of our operations for 2021 are net sales of $7.3 million from IMG.Based on that evaluation, management concluded that our internal control over financial reporting was not effective as of December 31, 2021 due to29, 2023.Remediation of Prior Years' Material Weaknesses As disclosed in Item 9A. – Controls and Procedures in our Annual Report on Form 10-K for the material weaknesses in internal control over financial reporting, described below. Afiscal year ended December 30, 2022, we identified a material weakness is a deficiency, or a combination of deficiencies, in internal control over financial reporting, such that there is a reasonable possibility that a material misstatement of our annual or interim financial statements will not be prevented or detected on a timely basis.The identified material weaknesses related to ineffective information technology general controls (“ITGCs”)ITGCs in the areas of user access and program change management over certainan information technology systemssystem (“IT”IT System”) systems that supportsupports our financial reporting processes. Theprocess. We did not have resources within the organization with sufficient levels of information technology knowledge and did not perform risk assessment surrounding the IT System to adequately understand how areas of user access and program change management function within the IT System in order to design and operate ITGCs sufficient to mitigate the identified risks.As of December 29, 2023, management has completed the implementation of our remediation efforts of the material weakness described above. During the fiscal year ended December 29, 2023, we implemented our material weakness remediation plan that included: (i) modification of business and IT user roles to restrict system change access for key setup and configurations related to the operation of automated system controls; (ii) implementation of a technology tool to approve, monitor and review changes by business users to certain setup and maintenance activities which can have a material impact on the operation of automated system controls; and (iii) enhanced our internal control deficiencies werefunction with additional resources and developed and provided training for control owners and operators including the principles and requirements of the control activities.48During the fourth quarter of 2023, we completed our testing of the operating effectiveness of the implemented controls and found them to be effective. As a result of: inadequate designwe have concluded the material weakness has been remediated as of IT control processes that were lacking sufficient documentation such that successful operation of the ITGC’s were overly dependent upon knowledge and actions of certain individuals with IT expertise; insufficient training of IT personnel on the requirements to maintain evidence of ITGC control processes and procedures; and risk-assessment processes inadequate to identify and assess changes in IT environments that could impact internal control over financial reporting. Our automated and manual business process controls that are dependent on the affected ITGCs were also deemed ineffective because they could have been adversely impacted.The material weaknesses did not result in any identified misstatements to the financial statements, and there were no changes to previously released financial results.who audited the consolidated financial statements included in this Annual Report on Form 10‑K,has issued an adverse opinionattestation report on the effectiveness of the Company’sour internal control over financial reporting. KPMG LLP’s report appears on page F‑3reporting, which is included in Item 8. - Financial Statements and Supplementary Data of this Annual Report on Form 10-K.RemediationManagement is taking steps to remediate the ITGC deficiencies and will continue to take measures designed to ensure that control deficiencies contributing to the material weaknesses are remediated, such that these controls are designed, implemented, and operating effectively. The remediation actions include:•designing and fully documenting ITGC processes and procedures specifically over user access and change management;Changes in Internal Control Over Financial Reporting •developing a training program addressing ITGCs, including educating control owners concerning the principles and requirements of each control, with a focus on maintaining evidence for user access and change-management over IT systems impacting financial reporting;•developing an IT compliance function that’s responsible for the development, training, and testing of the global ITGCs; and•developing enhanced risk assessment procedures and controls related to changes in IT environments.The material weaknesses will not be considered remediated until the applicable controls operate for a sufficient period of time and management has concluded, through testing, that the control objective is achieved and the controls are operating effectively. We expect that the remediation of these material weaknesses will be completed prior to the end of fiscal year 2022.Changes in Internal Control Over Financial Reportingweaknesses identified during the quarter,weakness remediation plan discussed above, there have been no other changes in our internal control over financial reporting (as defined in Rules 13a‑15(f) or 15d‑15(f) of the Exchange Act) that occurred during the fourth quarter of December 31, 202129, 2023 that have materially affected, or are reasonably likely to materially affect, our internal control over financial reporting.Inherent Limitations on Effectiveness of Controls and ProceduresInherent Limitations on Effectiveness of Controls and Procedures A company’s internal control over financial reporting is a process designed by, or under the supervision of, a company’s principal executive and principal financial officers, or persons performing similar functions, to provide reasonable assurance regarding the reliability of financial reporting and the preparation of financial statements in accordance with GAAP. Because of its inherent limitations, internal control over financial reporting may not prevent or detect misstatements. In addition, projections of any evaluation of effectiveness to future periods are subject to the risk that controls may become inadequate because of changes in conditions, or that the degree of compliance with policies or procedures may deteriorate. If we cannot provide reliable financial information, our business, operating results, and share price could be negatively impacted.ITEM 9B. OTHER INFORMATIONNone.During the fourth quarter of 2023, none of our directors or officers (as defined in Section 16 of the Exchange Act), adopted or terminated a "Rule 10b5-1 trading arrangement" or a "non-Rule 10b5-1 trading arrangement" (each as defined in Item 408 of Regulation S-K).ITEM 9C. DISCLOSURE REGARDING FOREIGN JURISDICTIONS THAT PREVENT INSPECTIONSNone.PART IIIITEM 10. DIRECTORS, EXECUTIVE OFFICERS, AND CORPORATE GOVERNANCEThe information required by this item is incorporated by reference to our Proxy Statement for our 20222024 General Meeting to be filed with the SEC within 120 days after the close of the year ended December 31, 2021.Code of ConductWe have adopted a code of business ethics and conduct (the “Code of Conduct”) that applies to all employees, officers, and directors, including the principal executive officer, principal financial officer, and principal accounting officer. The Code of Conduct is available on our investor relations website at ir.ichorsystems.com. We intend to post on our investor relations website all disclosures that are required by law or NASDAQ listing rules regarding any amendment to, or a waiver of, any provision of the Code of Conduct for the principal executive officer, principal financial officer, principal accounting officer or controller, or persons performing similar functions.ITEM 11. EXECUTIVE COMPENSATIONThe information required by this item is incorporated by reference to our Proxy Statement for our 20222024 General Meeting to be filed with the SEC within 120 days after the close of the year ended December 31, 2021.29, 2023.49ITEM 12. SECURITY OWNERSHIP OF CERTAIN BENEFICIAL OWNERS AND MANAGEMENT AND RELATED SHAREHOLDERSTOCKHOLDER MATTERSThe information required by this item is incorporated by reference to our Proxy Statement for our 20222024 General Meeting to be filed with the SEC within 120 days after the close of the year ended December 31, 2021.29, 2023.ITEM 13. CERTAIN RELATIONSHIPS AND RELATED TRANSACTIONS, AND DIRECTOR INDEPENDENCEThe information required by this item is incorporated by reference to our Proxy Statement for our 20222024 General Meeting to be filed with the SEC within 120 days after the close of the year ended December 31, 2021.29, 2023.ITEM 14. PRINCIPAL ACCOUNTINGACCOUNTANT FEES AND SERVICESThe information required by this item is incorporated by reference to our Proxy Statement for our 20222024 General Meeting to be filed with the SEC within 120 days after the close of the year ended December 31, 2021.PART IVITEM 15. EXHIBITSEXHIBIT AND FINANCIAL STATEMENT SCHEDULES(a)The following documents are filed as a part of this report:(1)Financial Statements.(1)Financial Statements.88. – Financial Statements and Supplementary Data.Reports of Independent Registered Public Accounting Firm (KPMG LLP, Portland, Oregon, PCAOB ID: 185)F‑F-1F‑54F‑6F-5F‑76F‑87F‑98Exhibits. Exhibits are listed on the Exhibit Index at the end of this report.(3)Exhibits. Exhibits are listed on the Exhibit Index at the end of this report.ITEM 16. FORM 10-K SUMMARYNot applicable.50Report of Independent Registered Public Accounting FirmTo the Shareholders and Board of DirectorsIchor Holdings, Ltd.:Opinion on the Consolidated Financial StatementsWe have audited the accompanying consolidated balance sheets of Ichor Holdings, Ltd. and subsidiaries (the Company) as of December 31, 2021 and December 25, 2020, the related consolidated statements of operations, shareholders’ equity, and cash flows for each of the years in the three-year period ended December 31, 2021, and the related notes (collectively, the consolidated financial statements). In our opinion, the consolidated financial statements present fairly, in all material respects, the financial position of the Company as of December 31, 2021 and December 25, 2020, and the results of its operations and its cash flows for each of the years in the three-year period ended December 31, 2021, in conformity with U.S. generally accepted accounting principles.We also have audited, in accordance with the standards of the Public Company Accounting Oversight Board (United States) (PCAOB), the Company’s internal control over financial reporting as of December 31, 2021, based on criteria established in Internal Control – Integrated Framework (2013) issued by the Committee of Sponsoring Organizations of the Treadway Commission, and our report dated February 28, 2022 expressed an adverse opinion on the effectiveness of the Company’s internal control over financial reporting.Basis for OpinionThese consolidated financial statements are the responsibility of the Company’s management. Our responsibility is to express an opinion on these consolidated financial statements based on our audits. We are a public accounting firm registered with the PCAOB and are required to be independent with respect to the Company in accordance with the U.S. federal securities laws and the applicable rules and regulations of the Securities and Exchange Commission and the PCAOB.We conducted our audits in accordance with the standards of the PCAOB. Those standards require that we plan and perform the audit to obtain reasonable assurance about whether the consolidated financial statements are free of material misstatement, whether due to error or fraud. Our audits included performing procedures to assess the risks of material misstatement of the consolidated financial statements, whether due to error or fraud, and performing procedures that respond to those risks. Such procedures included examining, on a test basis, evidence regarding the amounts and disclosures in the consolidated financial statements. Our audits also included evaluating the accounting principles used and significant estimates made by management, as well as evaluating the overall presentation of the consolidated financial statements. We believe that our audits provide a reasonable basis for our opinion.Critical Audit MattersThe critical audit matters communicated below are matters arising from the current period audit of the consolidated financial statements that were communicated or required to be communicated to the audit committee and that: (1) relate to accounts or disclosures that are material to the consolidated financial statements and (2) involved our especially challenging, subjective, or complex judgments. The communication of critical audit matters does not alter in any way our opinion on the consolidated financial statements, taken as a whole, and we are not, by communicating the critical audit matters below, providing separate opinions on the critical audit matters or on the accounts or disclosures to which they relate.Evaluation of excess and obsolete inventoryAs discussed in Notes 1 and 3 to the consolidated financial statements, the Company reported net inventories of $236.1 million as of December 31, 2021, including an adjustment for excess and obsolete inventory of $14.1 million. The Company states its inventories at the lower of cost or net realizable value. The Company records an adjustment to the cost basis of inventory when evidence exists that the net realizable value of inventory is lower than its cost, which occurs when the Company has excess and/or obsolete inventory. The Company’s model to estimate excess and/or obsolete inventory is based on an analysis of existing inventory quantities on-hand compared to estimated future consumption. Future consumption is estimated based upon assumptions about how historical consumption, recent purchases, backlog and other factors indicate future consumption.We identified the evaluation of excess and obsolete inventory as a critical audit matter. There was subjective auditor judgement in evaluating whether historical consumption and recent purchases reasonably indicate future consumption used by the Company in their determination that inventory is recorded at the lower of its cost or net realizable value.The following are the primary procedures we performed to address the critical audit matter. We evaluated the assumptions used to estimate future consumption by (1) examining historical write-down trends and (2) inspecting publicly available industry information to assess relevant changes to the overall business environment. Additionally, to evaluate whether recent purchases and historical consumption indicates future consumption we selected a sample of products within inventory and for each sample selection we calculated the rate of consumption for current quantity on hand based on (i) historical consumption and (ii) backlog.Fair value of certain acquired customer relationship intangible assetsAs discussed in Note 2 to the consolidated financial statements, on November 19, 2021, the Company acquired IMG Companies, LLC (IMG) and accounted for the transaction as a business combination. As a result of the transaction, the Company recorded intangible assets of $62.4 million for customer relationships associated with the generation of future income from IMG’s existing customers. The estimated fair value of the customer relationship intangible assets was determined using a discounted cash flow model.We identified the evaluation of the fair value of certain customer relationships acquired in the IMG transaction as a critical audit matter due to the high degree of subjectivity in evaluating discounted future cash flows used to determine the fair value. Specifically, there was a high degree of auditor judgment required to evaluate the forecasted revenue attributable to customer relationships as changes in this assumption could have a significant impact on the fair value of the customer relationships.The following are the primary procedures we performed to address the critical audit matter. We evaluated the design and tested the operating effectiveness of certain internal controls related to the Company’s acquisition-date valuation process including controls over the development of forecasted revenue attributable to customer relationships. We evaluated the forecasted revenue assumptions attributable to customer relationships by comparing these assumptions to IMG’s historical results, industry publications, as well as the revenue growth rates of guideline peer companies. In addition, we involved valuation professionals with specialized skills and knowledge who assisted in evaluating the relevance of the guideline peer companies based on financial and non-financial metrics./s/ KPMG LLPWe have served as the Company’s auditor since 2011.Portland, OregonFebruary 28, 2022Report of Independent Registered Public Accounting FirmTo the Shareholders and Board of DirectorsIchor Holdings, Ltd.:Overover Financial ReportingWe have audited Ichor Holdings, Ltd. and subsidiaries' (the Company) internal control over financial reporting as of December 31, 2021,29, 2023, based on criteria established in Internal Control – Integrated Framework (2013)issued by the Committee of Sponsoring Organizations of the Treadway Commission. In our opinion, because of the effect of the material weaknesses, described below, on the achievement of the objectives of the control criteria, the Company has not maintained, in all material respects, effective internal control over financial reporting as of December 31, 2021,29, 2023, based on criteria established in Internal Control – Integrated Framework (2013)issued by the Committee of Sponsoring Organizations of the Treadway Commission.We also have audited, in accordance with the standards of the Public Company Accounting Oversight Board (United States) (PCAOB), the consolidated balance sheets of the Company as of December 31, 202129, 2023 and December 25, 2020,30, 2022, the related consolidated statements of operations, shareholders’ equity, and cash flows for each of the years in the three-year period ended December 31, 2021,29, 2023, and the related notes (collectively, the consolidated financial statements), and our report dated February 28, 202223, 2024 expressed an unqualified opinion on those consolidated financial statements.A material weakness is a deficiency, or a combination of deficiencies, in internal control over financial reporting, such that there is a reasonable possibility that a material misstatement of the company’s annual or interim financial statements will not be prevented or detected on a timely basis. The material weaknesses relate to ineffective information technology general controls (ITGCs) in the areas of user access and program change-management over certain information technology systems that support the Company’s financial reporting processes which have been identified and included in management’s assessment. The material weaknesses were considered in determining the nature, timing, and extent of audit tests applied in our audit of the 2021 consolidated financial statements, and this report does not affect our report on those consolidated financial statements.The Company acquired IMG Companies, LLC during 2021, and management excluded from its assessment of the effectiveness of the Company’s internal control over financial reporting as of December 31, 2021, IMG Companies, LLC’s internal control over financial reporting associated with total assets of $293 million and total revenues of $7.3 million included in the consolidated financial statements of the Company as of and for the year ended December 31, 2021. Our audit of internal control over financial reporting of the Company also excluded an evaluation of the internal control over financial reporting of IMG Companies, LLC.Basis for OpinionThe Company’s management is responsible for maintaining effective internal control over financial reporting and for its assessment of the effectiveness of internal control over financial reporting, included in the accompanying Management'sManagement’s Report on Internal Control Over Financial Reporting. Our responsibility is to express an opinion on the Company’s internal control over financial reporting based on our audit. We are a public accounting firm registered with the PCAOB and are required to be independent with respect to the Company in accordance with the U.S. federal securities laws and the applicable rules and regulations of the Securities and Exchange Commission and the PCAOB.We conducted our audit in accordance with the standards of the PCAOB. Those standards require that we plan and perform the audit to obtain reasonable assurance about whether effective internal control over financial reporting was maintained in all material respects. Our audit of internal control over financial reporting included obtaining an understanding of internal control over financial reporting, assessing the risk that a material weakness exists, and testing and evaluating the design and operating effectiveness of internal control based on the assessed risk. Our audit also included performing such other procedures as we considered necessary in the circumstances. We believe that our audit provides a reasonable basis for our opinion.Definition and Limitations of Internal Control Over Financial ReportingA company’s internal control over financial reporting is a process designed to provide reasonable assurance regarding the reliability of financial reporting and the preparation of financial statements for external purposes in accordance with generally accepted accounting principles. A company’s internal control over financial reporting includes those policies and procedures that (1) pertain to the maintenance of records that, in reasonable detail, accurately and fairly reflect the transactions and dispositions of the assets of the company; (2) provide reasonable assurance that transactions are recorded as necessary to permit preparation of financial statements in accordance with generally accepted accounting principles, and that receipts and expenditures of the company are being made only in accordance with authorizations of management and directors of the company; and (3) provide reasonable assurance regarding prevention or timely detection of unauthorized acquisition, use, or disposition of the company’s assets that could have a material effect on the financial statements./s/ KPMG LLPPortland, OregonFebruary 28,23, 2024F-1Report of Independent Registered Public Accounting FirmTo the Shareholders and Board of DirectorsIchor Holdings, Ltd.:Opinion on the Consolidated Financial StatementsWe have audited the accompanying consolidated balance sheets of Ichor Holdings, Ltd. and subsidiaries (the Company) as of December 29, 2023 and December 30, 2022, the related consolidated statements of operations, shareholders’ equity, and cash flows for each of the years in the three-year period ended December 29, 2023, and the related notes (collectively, the consolidated financial statements). In our opinion, the consolidated financial statements present fairly, in all material respects, the financial position of the Company as of December 29, 2023 and December 30, 2022, and the results of its operations and its cash flows for each of the years in the three-year period ended December 29, 2023, in conformity with U.S. generally accepted accounting principles.
We also have audited, in accordance with the standards of the Public Company Accounting Oversight Board (United States) (PCAOB), the Company’s internal control over financial reporting as of December 29, 2023, based on criteria established in Internal Control – Integrated Framework (2013) issued by the Committee of Sponsoring Organizations of the Treadway Commission, and our report dated February 23, 2024 expressed an unqualified opinion on the effectiveness of the Company’s internal control over financial reporting.Basis for OpinionThese consolidated financial statements are the responsibility of the Company’s management. Our responsibility is to express an opinion on these consolidated financial statements based on our audits. We are a public accounting firm registered with the PCAOB and are required to be independent with respect to the Company in accordance with the U.S. federal securities laws and the applicable rules and regulations of the Securities and Exchange Commission and the PCAOB.We conducted our audits in accordance with the standards of the PCAOB. Those standards require that we plan and perform the audit to obtain reasonable assurance about whether the consolidated financial statements are free of material misstatement, whether due to error or fraud. Our audits included performing procedures to assess the risks of material misstatement of the consolidated financial statements, whether due to error or fraud, and performing procedures that respond to those risks. Such procedures included examining, on a test basis, evidence regarding the amounts and disclosures in the consolidated financial statements. Our audits also included evaluating the accounting principles used and significant estimates made by management, as well as evaluating the overall presentation of the consolidated financial statements. We believe that our audits provide a reasonable basis for our opinion.Critical Audit MatterThe critical audit matter communicated below is a matter arising from the current period audit of the consolidated financial statements that was communicated or required to be communicated to the audit committee and that: (1) relates to accounts or disclosures that are material to the consolidated financial statements and (2) involved our especially challenging, subjective, or complex judgments. The communication of a critical audit matter does not alter in any way our opinion on the consolidated financial statements, taken as a whole, and we are not, by communicating the critical audit matter below, providing a separate opinion on the critical audit matter or on the accounts or disclosures to which it relates.F-2Evaluation of excess and obsolete inventoryAs discussed in Notes 1 and 3 to the consolidated financial statements, the Company reported inventories of $245.9 million as of December 29, 2023, including an adjustment for excess and obsolete inventory of $28.4 million. The Company states its inventories at the lower of cost or net realizable value. The Company records an adjustment to the cost basis of inventory when evidence exists that the net realizable value of inventory is lower than its cost, which occurs when the Company has excess and/or obsolete inventory. The Company’s model to estimate excess and/or obsolete inventory is based on an analysis of existing inventory quantities on-hand compared to estimated future consumption. Future consumption is estimated based upon assumptions about how historical consumption, recent purchases, backlog and other factors indicate future consumption.We identified the evaluation of excess and obsolete inventory as a critical audit matter. There was subjective auditor judgement in evaluating whether historical consumption reasonably indicates future consumption used by the Company in their determination that inventory is recorded at the lower of its cost or net realizable value.The following are the primary procedures we performed to address the critical audit matter. We evaluated the design and tested the operating effectiveness of an internal control related to the Company’s excess and obsolete inventory process, including the determination of the assumptions used to predict future consumption of inventory. We evaluated whether historical consumption reasonably indicates future consumption by (1) examining historical write-down trends; (2) inspecting publicly available industry and market information to assess relevant changes to the overall business environment; and (3) selected a sample of inventory items and for each selection we evaluated whether the historical data accurately supported the Company’s estimate of future consumption./s/ KPMG LLPWe have served as the Company's auditor since 2011.Portland, OregonFebruary 23, 2024F-3ICHOR HOLDINGS, LTD.Consolidated Balance Sheets(dollars in thousands, except per share data)December 29,
2023December 29,
2023December 30,
2022Current assets: Current assets: Cash and cash equivalents Cash and cash equivalents Current liabilities: Current liabilities: Accounts payable Accounts payable Preferred shares ($0.0001 par value; 20,000,000 shares authorized; zero shares issued and outstanding) Preferred shares ($0.0001 par value; 20,000,000 shares authorized; zero shares issued and outstanding) Preferred shares ($0.0001 par value; 20,000,000 shares authorized; zero shares issued and outstanding) Ordinary shares ($0.0001 par value; 200,000,000 shares authorized; 29,435,398 and 28,861,949 shares outstanding, respectively; 33,872,837 and 33,299,388 shares issued, respectively) See accompanying notes to consolidated financial statements.F-4ICHOR HOLDINGS, LTD.Consolidated Statements of Operations(dollars in thousands, except per share data)Year Ended Year Ended December 29,
2023December 29,
2023December 30,
2022December 31,
2021Research and development Research and development Operating income (loss) Other expense (income), net Income (loss) before income taxes Income tax expense Net income (loss) Net income (loss) per share Basic Basic Shares used to compute Net income (loss) per share: Basic Basic 29,200,796 28,714,550 28,259,607 Diluted 29,200,796 28,963,031 28,979,352 See accompanying notes to consolidated financial statements.F-5ICHOR HOLDINGS, LTD.Consolidated Statements of Shareholders’ Equity(dollars in thousands)Ordinary Shares Ordinary Shares Additional
Paid-In
CapitalTreasury
SharesRetained
EarningsTotal
Shareholders'
EquityShares Balance at December 25, 2020 Balance at December 25, 2020 Ordinary shares issued from exercise of stock options Ordinary shares issued from vesting of restricted share units Ordinary shares issued from employee share purchase plan Share-based compensation expense Net income Balance at December 30, 2022 Ordinary shares issued from exercise of stock options Ordinary shares issued from vesting of restricted share units Ordinary shares issued from employee share purchase plan Share-based compensation expense Net loss Balance at December 29, 2023 See accompanying notes to consolidated financial statements.F-6ICHOR HOLDINGS, LTD.Consolidated Statements of Cash Flows(in thousands)Year Ended Year Ended December 29,
2023December 29,
2023 December 30,
2022 December 31,
2021Net income (loss) Net income (loss) Net income (loss) Adjustments to reconcile net income (loss) to net cash provided by operating activities: Depreciation and amortization Depreciation and amortization Loss on extinguishment of debt Accounts receivable, net Accounts receivable, net Capital expenditures Capital expenditures Issuance of ordinary shares under share-based compensation plans Issuance of ordinary shares under share-based compensation plans Cash paid during the period for interest Cash paid during the period for interest Capital expenditures included in accounts payable Capital expenditures included in accounts payable See accompanying notes to consolidated financial statements.F-7ICHOR HOLDINGS, LTD.Notes to Consolidated Financial Statements(dollar figures in tables in thousands, except per share data)Note 1 – Organization and Summary of Significant Accounting PoliciesNote 1 – Organization and Summary of Significant Accounting Policies Organization and Operations of the CompanyIchor Holdings, Ltd. and Subsidiaries (the “we”, “us”, “our”, “Company”) designs, develops, manufactures, and distributes gas and liquid delivery subsystems and components purchased by capital equipment manufacturers for use in the semiconductor markets. We also provide precision-machined components, weldments, electron beam (“e‑beam”) and laser-welded components, precision vacuum and hydrogen brazing, and surface treatment technologies, and other proprietary products. We are headquartered in Fremont, California and have operations in the United States, the United Kingdom, Singapore, Malaysia, Korea, and Mexico.On December 30, 2011, Ichor Systems Holdings, LLC consummated a sales transaction with Icicle Acquisition Holdings, LLC, a Delaware limited liability company. Shortly after consummation of the sale transaction, Icicle Acquisition Holdings, LLC changed its name to Ichor Holdings, LLC.In March 2012, Ichor Holdings, LLC completed a reorganization of its legal structure, forming Ichor Holdings, Ltd., a Cayman Islands entity. Ichor Holdings, Ltd. is now the reporting entity and the ultimate parent company of the operating entities.Basis of PresentationThese consolidated financial statements have been prepared in accordance with generally accepted accounting principles in the U.S. (“GAAP”). All intercompany balances and transactions have been eliminated upon consolidation. All dollar figures presented in tables in the notes to consolidated financial statements are in thousands, except per share amounts.Year EndWe use a 52‑ or 53‑week fiscal year ending on the last Friday in December. The years ended December 29, 2023, December 30, 2022, and December 31, 2021 December 25, 2020, and December 27, 2019 were all 5352 weeks, 52 weeks, and 5253 weeks, respectively. All references to 2021, 2020,2023, 2022, and 20192021 are references to the fiscal years then ended.Use of EstimatesThe preparation of consolidated financial statements in conformity with GAAP requires management to make estimates and assumptions that affect the reported amounts of assets and liabilities and disclosure of contingent assets and liabilities at the date of the financial statements and the reported amounts of revenue and expenses during the reporting periods presented. We base our estimates and judgments on historical experience and on various other assumptions that we believe are reasonable under the circumstances. Actual results could differ from the estimates made by management. Significant estimates include the fair value of assets and liabilities acquired in acquisitions, estimated useful lives for long‑lived assets, inventory valuation, uncertain tax positions, fair value assigned to stock options granted,including valuation allowance on deferred tax assets, and impairment analysisanalyses for both definite‑lived intangible assets and goodwill.Cash and Cash Equivalents and Marketable SecuritiesCash and cash equivalents consist of deposits and financial instruments which are readily convertible into cash and have original maturities of 90 days or less at the time of acquisition. Marketable securities consist primarily of highly liquid investments with maturities of greater than 90 days when purchased. We classify our marketable securities as available-for-sale and, accordingly, report them at fair value with the related unrealized gains and losses included in accumulated other comprehensive income (loss). Any unrealized losses which are considered to be other-than-temporary are recorded in other income (expense), net. Realized gains and losses on the sale of marketable securities are determined using the specific-identification method and recorded in other income (expense), net. Although we had marketable securities outstanding during 2021, we had 0 marketable securities outstanding asF-8Available-for-sale investments are subject to a periodic impairment review. If an available-for-sale debt security’s fair value is less than its amortized cost basis, then we evaluate whether the decline is the result of a credit loss, in which case an impairment is recorded through an allowance for credit losses. Unrealized gains and losses not attributable to credit losses are included, net of tax, in accumulated other comprehensive income (loss). We have 0tnot recorded an allowance for credit losses in 2023, 2022, or 2021.We recognize revenue when control of promised goods or services is transferred to our customers, in an amount that reflects the consideration we expect to be entitled to in exchange for those goods or services. This amount is recorded as net sales in our consolidated statements of operations.Transaction price – In most of our contracts, prices are generally determined by a customer-issued purchase order and generally remain fixed over the duration of the contract. Certain contracts contain variable consideration, including early-payment discounts and rebates. When a contract includes variable consideration, we evaluate the estimate of the variable consideration to determine whether the estimate needs to be constrained; therefore, we include the variable consideration in the transaction price only to the extent that it is probable that a significant reversal will not occur. Variable consideration estimates are updated at each reporting date. Historically, we have not incurred significant costs to obtain a contract. All amounts billed to a customer relating to shipping and handling are classified as net sales, while all costs incurred by us for shipping and handling are classified as cost of sales.Performance obligations – Substantially all of our performance obligations pertain to promised goods (“products”), which are primarily comprised of fluid delivery subsystems, weldments, and other components. Most of our contracts contain a single performance obligation and are generally completed within twelve12 months. Product sales are recognized at a point-in-time, generally upon delivery,"delivery," as such term is defined within the contract, which is generally at the time of shipment, as that is when control of the promised good has transferred. Products are covered by a standard assurance warranty, generally extended for a period of one to two years depending on the customer, which promises that delivered products conform to contract specifications. As such, we account for such warranties under ASC 460, Guarantees, and not as a separate performance obligationobligation..Contract balances – Accounts receivable represents our unconditional right to receive consideration from our customers. Accounts receivable are carried at invoice price less an estimate for doubtful accounts and estimated payment discounts. Payment terms vary by customer but are generally due within 15– to 60 days. Historically, we have not incurred significant payment issues with our customers. We had no significant contract assets or liabilities on our consolidated balance sheets in any of the periods presented.Commitments and ContingenciesWe are periodically involved in legal actions and claims that arise as a result of events that occur in the normal course of operations. The ultimate resolution of these actions is not expected to have a material adverse effect on our financial position or results of operations.ConcentrationsFinancial instruments that subject us to creditconcentration risk consist of accounts receivable, accounts payable, and long-term debt. At December 31, 202129, 2023 and December 25, 2020, 230, 2022, three customers represented, in the aggregate, approximately 60%63% and 73%70%, respectively, of the balance of accounts receivable.We establish an allowance for doubtful accounts based upon the credit risk of specific customers, historical trends, and other information. We require collateral, typically cash, in the normal course of business if customers do not meet the criteria established for offering credit. If the financial condition of our customers were to deteriorate and result in an impaired ability to make payments, additions to the allowance may be required. Accounts receivable are written off when deemed uncollectible. Recoveries of accounts receivable previously written off are recorded to income when received. Activity and balances related to our allowance for doubtful accounts was not significant during any period presented.We use qualified manufacturers to supply many components and subassemblies of our products. We obtain the majority of our components from a limited group of suppliers. A majority of the purchased components used in our products are customer specified. An interruption in the supply of a particular component would have a temporary adverse impact on our operating results.F-9We maintain cash balances at global systematically important banks ("G-SIBs") in both United States-basedStates and foreign-based commercial banks.internationally. Cash balances in the United States exceed amounts that are insured by the Federal Deposit Insurance Corporation (FDIC)("FDIC"). The majority of the cash maintained in foreign-based commercial banks is insured by the government where the foreign banking institutions are based. Cash held in foreign-based commercial banks totaled $41.5$59.7 million and $39.9$48.4 million at December 31, 202129, 2023 and December 25, 2020,30, 2022, respectively, and at times exceeds insured amounts. NaNNo losses have been incurred as of December 31, 202129, 2023 or December 25, 202030, 2022 for amounts exceeding the insured limits.We estimate the fair value of financial assets and liabilities based upon comparison of such assets and liabilities to the current market values for instruments of a similar nature and degree of risk. We utilize valuation techniques that maximize the use of observable inputs and minimize the use of unobservable inputs to the extent possible. We determine fair value based on assumptions that market participants would use in pricing an asset or liability in the principal or most advantageous market. When considering market participant assumptions in fair value measurements, the following fair value hierarchy distinguishes between observable and unobservable inputs, which are categorized in one of the following levels:▪Level 1 Inputs: Unadjusted quoted prices in active markets for identical assets or liabilities accessible to the reporting entity at the measurement date▪Level 2 Inputs: Other than quoted prices included in Level 1 inputs that are observable for the asset or liability, either directly or indirectly, for substantially the full term of the asset or liability▪Level 3 Inputs: Unobservable inputs for the asset or liability used to measure fair value to the extent that observable inputs are not available, thereby allowing for situations in which there is little, if any, market activity for the asset or liability at the measurement date▪Level 3 Inputs: Unobservable inputs for the asset or liability used to measure fair value to the extent that observable inputs are not available, thereby allowing for situations in which there is little, if any, market activity for the asset or liability at the measurement dateThere were no changes to our valuation techniques during 2021.2023. We estimate the recorded value of our financial assets and liabilities approximates fair value atas of December 31, 202129, 2023 and December 25, 2020.We estimate the value of acquired intangible assets, on a nonrecurring basis, based on an income approach utilizing discounted cash flows. Under this approach, we estimate the future cash flows from our asset groups and discount the income stream to its present value to arrive at fair value. Future cash flows are based on recently prepared operating forecasts. Operating forecasts and cash flows include, among other things, revenue growth rates that are calculated based on management’s forecasted sales projections. A discount rate is utilized to convert the forecasted cash flows to their present value equivalent. The discount rate applied to the future cash flows includes a subject-company risk premium, an equity market risk premium, a beta, and a risk-free rate. As this approach contains unobservable inputs, the measurement of fair value for intangible assets is classified as Level 3.InventoriesInventories are stated at the lower of cost or net realizable value. The majority of our inventory valuesinventories are based uponvalued on a standard costs. Oncost basis, which approximates actual costs on a quarterlyfirst-in, first-out basis. The remainder of our inventories are valued on an average cost basis, which approximates actual costs on a first-in, first-out basis. Quarterly, we analyzeassess the value of our inventory and periodically record write-downswrite it down for excess quantities or obsolescence to its estimated excess and obsolete inventory.net realizable value. This analysisassessment is based on estimated future consumption compared to inventory quantities on-hand. The estimate for future consumption is based on how assumptions of historical consumption, recency of purchases, backlog, and other factors indicate future consumption. Once the value of inventory is adjusted, the original cost of our inventory, less the write-down, represents its new cost basis. ReversalF-10Property and EquipmentProperty and equipment are stated at cost, less accumulated depreciation. Depreciation is computed using the straight-line method over the following estimated useful lives:Estimated useful lives of property & equipment Maintenance and repairs that neither add material value to the asset nor appreciably prolong its useful life are charged to expense as incurred. Gains or losses on the disposal of property and equipment are included in selling, general, and administrative expenses on the consolidated statements of operations.
LeasesLeasesWe determine if an arrangement is a lease, or contains a lease, at the inception of the arrangement. If we determine the arrangement is a lease, or contains a lease, at lease inception, we then determine whether the lease is an operating lease or a finance lease. Operating and finance leases result in recording a right-of-use (“ROU”) asset and lease liability on our consolidated balance sheets. ROU assets represent our right to use an underlying asset for the lease term and lease liabilities represent our obligation to make lease payments arising from the lease. Operating lease ROU assets and liabilities are recognized at the commencement date based on the present value of lease payments over the lease term. For purposes of calculating operating lease ROU assets and operating lease liabilities, we use the non-cancellable lease term plus options to extend that we are reasonably certain to take. Lease expense for operating lease payments is recognized on a straight-line basis over the lease term. Our leases generally do not provide an implicit rate. As such, we use our incremental borrowing rate based on the information available at commencement date in determining the present value of lease payments. This rate is generally consistent with the interest rate we pay on borrowings under our credit facilities, as this rate approximates our collateralized borrowing capabilities over a similar term of lease payments. We utilize the consolidated group incremental borrowing rate for all leases, as we have centralized treasury operations. We have elected not to recognize ROU assets and lease liabilities that arise from short-term (12 months or less) leases for any class of underlying asset. We have elected not to separate lease and non-lease components for any class of underlying asset.Long-Lived AssetsLong-lived assets are reviewed for impairment whenever events or changes in circumstances indicate, in management’s judgment, that the carrying amount of an asset (or asset group) may not be recoverable. In analyzing potential impairments, projections of future cash flows from the asset group are used to estimate fair value. If the sum of the expected future undiscounted cash flows is less than the carrying amount of the asset group, a loss is recognized for the difference between the estimated fair value and the carrying value of the asset group. The projections are based on assumptions, judgments, and estimates of revenue growth rates for the related business; anticipated future economic, regulatory, and political conditions; the assignment of discount rates relative to risk; and estimates of terminal values. During 2021, 2020,2023, 2022, and 2019,2021, we did not identify any triggering events that would indicate impairment.F-11Intangible AssetsWe account for intangible assets that have a definite life and are amortized on a basis consistent with their expected cash flows over the following estimated useful lives:Estimated useful lives of intangible assets Trademarks106-10 yearsCustomer relationships6-10 years7-1010 yearsGoodwillGoodwill represents the future economic benefits arising from other assets acquired in a business combination that are not individually identified and separately recognized. We review goodwill for impairment annually and whenever events or changes in circumstances indicate the carrying value of goodwill may not be recoverable. We first make a qualitative assessment of whether it is more likely than not that a reporting unit’s fair value is less than its carrying amount before applying a quantitative goodwill impairment test. Under the quantitative test, the fair value of the reporting unit is compared to its carrying value and an impairment loss is recognized for any excess of carrying amount over the reporting unit’s fair value. Fair value of the reporting unit is determined using a discounted cash flow analysis. For purposes of testing goodwill for impairment, we have concluded that we operate as 1one reporting unit.We performed a qualitative goodwill assessment at December 31, 202129, 2023 and December 25, 2020.30, 2022. This assessment indicated that it was more likely than not our reporting unit’s fair value exceeded its carrying value.Research and Development CostsResearch and development costs are expensed as incurred.Share-Based PaymentsWe use the Black-Scholes option-pricing model to value awards on the date of grant. We use the simplified method to estimate the expected term of share-based awards for all periods as we do not have sufficient history to estimate the weighted average expected term. The risk-free interest rate is based on the U.S. Treasury rates in effect on the corresponding date of grant. Estimated volatility is based on the historical volatility of ours and similar entities’ publicly traded shares.We recognize deferred income taxes using the asset and liability method of accounting for income taxes. Under the asset and liability method, deferred income taxes are recognized for differences between the financial reporting and tax bases of assets and liabilities at enacted statutory tax rates in effect for the years in which the differences are expected to reverse. The effect on deferred taxes of a change in tax rates is recognized in income in the period that includes the enactment date. Valuation allowances are established when necessary to reduce deferred tax assets to the amount expected to be realized. Income tax expense for the current year differs from the statutory rate primarily as a result of the impact of foreign operations and discrete tax benefits recorded in connection with our historical acquisitions and stock option exercises.When tax returns are filed, it is highly certain that some positions taken would be sustained upon examination by the taxing authorities, while others may be subject to uncertainty about the merits of the position taken or the amount of the position that would be ultimately sustained. The benefit of a tax position is recognized in the consolidated financial statements in the period during which, based on all available evidence, management believes it is more likely than not that the position will be sustained upon examination, including the resolution of appeals or litigation processes, if any. Tax positions taken are not offset or aggregated with other positions. Tax positions that meet the more-likely-than-not recognition threshold are measured as the largest amount of tax benefit that is more than 50% likely of being realized upon settlement with the applicable taxing authority. The portion of the benefits associated with tax positions taken that exceeds the amount measured as described above is reflected as a liability for unrecognized tax benefits in our consolidated balance sheets along with any associated interest and penalties that would be payable to the taxing authorities upon examination. We recognize interest and penalties as a component of income tax expense.F-12Foreign OperationsThe functional currency of our international operations is the U.S. dollar. Transactions denominated in currencies other than the functional currency generate foreign exchange gains and losses that are included in other expense (income), net on our consolidated statements of operations. Substantially all of our sales contracts, and most of our agreements with third-party suppliers, provide for pricing and payment in U.S. dollars. Accordingly, these transactions are not subject to material exchange rate fluctuations.Accounting Pronouncements Recently AdoptedIn June 2016,November 2023, the FASB issued ASU 2016‑13,2023-07, Financial Instruments–Credit LossesSegment Reporting - Improvements to Reportable Segment Disclosures (Topic 326): Measurement280). This ASU updates reportable segment disclosure requirements, primarily through enhanced disclosures about significant expenses. The ASU requires disclosures to include significant segment expenses that are regularly provided to the chief operating decision maker (CODM), a description of Credit Losses on Financial Instruments. This standard changesother segment items by reportable segment, and any additional measures of a segment's profit or loss used by the methodologyCODM when deciding how to allocate resources. The ASU also requires all annual disclosures currently required by Topic 280 to be included in interim periods. The update is effective for measuring credit losses onfiscal years beginning after December 15, 2023, and interim periods within fiscal years beginning after December 15, 2024, with early adoption permitted and requires retrospective application to all prior periods presented in the financial instruments andstatements. We are currently evaluating the timing of when such losses are recorded. We adopted the standard on the first day of 2020, andeffect that the adoption did notof this ASU may have a significant impact on our consolidated financial statements.In August 2018,December 2023, the FASB issued ASU 2018‑15,2023-09, Intangibles-Goodwill and Other-Internal-Use Software (Subtopic 350‑40): Customer’s Accounting for Implementation Costs Incurred in a Cloud Computing Arrangement That Is a Service ContractImprovements to Income Tax Disclosures (Topic 740). The new guidance clarifiesASU is intended to enhance the accounting for implementation costs in cloud computing arrangements. We adoptedtransparency, decision usefulness, and effectiveness of income tax disclosures. The ASU requires a public entity to disclose a tabular tax rate reconciliation, using both percentages and currency, with specific categories. The ASU also requires a public entity to provide a qualitative description of the standard onstates and local income tax category and the first daynet amount of 2020. During the 2020, we incurred capitalizable implementation costs of approximately $4.4 million in connection with our implementation of a new company-wide ERP system that is classified as a hosting arrangement that is a service contract. Accordingly, these costs are included in Other noncurrent assets on our consolidated balance sheet as of December 25, 2020. Additionally, our cash provided by operating activities for 2020 includes $3.3 million in cash outflows associated with these capitalized implementation costs. As the ERP system was not yet in-service as of December 25, 2020, there was 0 amortization expense recognized during 2020.In December 2019, the FASB issued ASU 2019‑12, Income Taxes (Topic 740) – Simplifying the Accounting for Income Taxes, as part of its initiative to reduce complexity in accounting standards. The amendments in the ASU include removing exceptions to incremental intraperiod tax allocation of losses and gains from different financial statement components, exceptions to the method of recognizing income taxes on interim period losses,paid, disaggregated by federal, state, and exceptions to deferred tax liability recognition related to foreign subsidiary investments. In addition, the ASU requires that entities recognize franchise tax based on an incremental method and requires an entity to evaluate the accounting for step-ups in the tax basis of goodwilltaxes as inside or outside of a business combination. We adopted the standard on the first day of 2021, and the adoption did not have a significant impact on our financial statements.Accounting Pronouncements Recently IssuedIn October 2021, the FASB issued ASU No. 2021‑08, Accounting for Contract Assets and Contract Liabilities from Contracts with Customers (Topic 805). This ASU requires an acquirer in a business combination to recognize and measure contract assets and contract liabilities (deferred revenue) from acquired contracts using the revenue recognition guidance in Topic 606. At the acquisition date, the acquirer applies the revenue modelwell as if it had originated the acquired contracts.by individual jurisdictions. The ASU is effective on a prospective basis for annual periods beginning after December 15, 2022, including interim periods within those fiscal years. Adoption2024, and early adoption and retrospective application are permitted. We are currently evaluating the effect that the adoption of thethis ASU should be applied prospectively. Early adoption is also permitted, including adoption in an interim period. If early adopted, the amendments are applied retrospectively to all business combinations for which the acquisition date occurred during the fiscal year of adoption. This ASU is currently not expected tomay have a material impact on our consolidated financial statements.Note 2 – AcquisitionsNote 2 – Acquisitions IMG Companies, LLCOn November 19, 2021 we completed the acquisition, via merger, of IMG Companies, LLC and its subsidiaries (“IMG”), a California-based precision machining, specialty joining, and plating company for an aggregate purchase price of $270.0$269.5 million. IMG provides us increased capacity and capabilities in our precision machining business and expands our served customer base with new component and service offerings.The following table presents the preliminary purchase price allocation asallocation.Cash acquired $ 1,234 Accounts receivable 8,559 Inventories 12,128 Prepaid expenses and other current assets 579 Property and equipment 33,067 Operating lease right-of-use assets 14,509 Intangible assets 65,000 Goodwill 160,515 Accounts payable (3,853) Accrued expenses (5,620) Other current liabilities (2,109) Lease liabilities (14,509) Total acquisition consideration $ 269,500 F-13 preliminarily allocated $62.4 million to IMG’s customer relationships and $2.6 million to IMG’s order backlog with weighted average amortization periods of 10 years and 6 months, respectively. Preliminary goodwillGoodwill recognized from the acquisition was primarily attributed to an assembled workforce and expected synergies. WeIn connection with the acquisition, we incurred transaction costs of approximately$0.2 million and $4.4 million in connection with the acquisition during 2021.2022 and 2021, respectively. The fair value adjustment to inventory as part of our preliminary purchase price allocation resulted in a $1.4 million chargecharges to cost of sales of $2.5 million and $1.4 million during 2021.Our consolidated statement of operations for 2021 includes approximately 6 weeks of operating activity of IMG, including sales of $7.3 million.operations assume the acquisition was completed on December 26, 2020, the beginning of the earliest period presented.operations. Pro forma adjustments are primarily comprised of preliminary estimates of amortization expense related to acquired intangible assets, incremental interest expense from increased borrowings to fund the acquisition and the elimination of IMG’s historical interest expense, elimination of IMG’s non-recurring management expenses, elimination of a gain on forgiveness of debt, acquired inventory fair value charges, the related income tax effects, and other insignificant management adjustments. The pro forma results of operations are presented for informational purposes only and are not indicative of the results of operations that would have been achieved or of results that may occur in the future.Year Ended December 31,
2021Net sales $ 1,156,619 Net income $ 74,531 Net income per share: Basic $ 2.64 Diluted $ 2.57 Nogales, Mexico Precision Machining AcquisitionOn December 1, 2020, we acquired certain operating assets and assumed the operations of a precision machining operation in Nogales, Mexico, which was considered a business combination under ASC 805 – Business Combinations, for an aggregate purchase of $5.0 million. The acquisition adds to our precision machined component manufacturing capacity. In connection with the acquisition, we recorded $2.0 million in tangible operating assets, a $1.2 million customer relationship intangible asset, which will be amortized of a period of 6 years, and $1.9 million in goodwill.Note 3 – InventoriesNote 3 – Inventories Inventories consist of the following:December 29,
2023December 29,
2023December 30,
2022F-14The following table presents changes to our excess and obsolete adjustment:Excess and obsolete adjustment Balance at December 25, 2020 $ (12,742) Charge to cost of sales (1,942) Disposition of inventory 633 Balance at December 31, 2021 (14,051) Charge to cost of sales (4,981) Disposition of inventory 1,489 Balance at December 30, 2022 (17,543) Charge to cost of sales (9,784) Disposition of inventory (1,113) Balance at December 29, 2023 $ (28,440) Note 4 – Property and EquipmentNote 4 – Property and Equipment Property and equipment consist of the following:December 29,
2023December 29,
2023December 30,
2022Office furniture, fixtures, and equipment 175,906 Depreciation expense for 2023, 2022, and 2021 2020,was $18.8 million, $17.2 million, and 2019 was $11.1 million, $10.9 million, and $8.9 million, respectively.Cloud Computing Implementation CostsPursuant to ASU 2018-15, weWe capitalize implementation costs associated with hosting arrangement that are service contracts. These costs are recorded to prepaid expenses or other noncurrent assets. To-date, these costs are those incurred to implement a new company-wide ERP system.following table summarizesbalance of capitalized cloud computing implementation costs:Note 5 – Intangible Assetscosts, net of accumulated amortization, was $8.1 million and GoodwillF-15Note 5 – Intangible Assets and Goodwill Definite-lived intangible assets consist of the following:December 29, 2023 December 29, 2023 Gross value Gross value Accumulated
amortizationAccumulated
impairment
chargesCarrying
amountWeighted
average
useful lifeCustomer relationships $ 105,542 $ $ (53,680) $ $ — $ $ 51,862 8.7 years 8.7 years Developed technology 11,047 (5,621) (5,621) — — 5,426 5,426 10.0 years 10.0 years December 30, 2022 Gross value Accumulated
amortizationAccumulated
impairment
chargesCarrying
amountWeighted
average
useful lifeCustomer relationships $ 117,022 $ (51,337) $ — $ 65,685 8.4 years Developed technology 11,047 (4,710) — 6,337 10.0 years Total intangible assets $ 128,069 $ (56,047) $ — $ 72,022 Future projected annual amortization expense consists of the following:Future
amortization
expenseFuture
amortization
expense2027 2028 $ The following tables present the changes to goodwill:Goodwill Balance at December 25, 2020 $ 174,887 Acquisitions 161,015 Balance at December 31, 2021 335,902 Acquisitions (500) Balance at December 30, 2022 335,402 Acquisitions — Balance at December 29, 2023 $ 335,402 Note 6 – LeasesNote 6 – Leases We lease facilities under various non-cancellable operating leases expiring through 2031. In addition to base rental payments, we are generally responsible for our proportionate share of operating expenses, including facility maintenance, insurance, and property taxes. As these amounts are variable, they are not included in lease liabilities. As of December 31, 2021,29, 2023, we had 1no operating leases executed for which the rental period had not yet commenced.F-16The components of lease expense are as follows:Year Ended December 29,
2023December 30,
2022December 31,
2021Operating lease cost $ 9,656 $ 8,760 $ 5,763 Supplemental cash flow information related to leases is as follows:Year Ended Year Ended December 29,
2023December 29,
2023December 30,
2022December 31,
2021Operating cash flows from operating leases Operating cash flows from operating leases Supplemental balance sheet information related to leases is as follows:December 29,
2023December 29,
2023December 30,
2022Weighted-average remaining lease term of operating leases 4.6 years 5.3 years Weighted-average discount rate of operating leases 3.4% 3.0% Future minimum lease payments under non-cancellable leases as of December 31, 202129, 2023 are as followsfollows:2027 2028 Note 7 – Income Taxes Income TaxesOn March 27, 2020 the Coronavirus Aid, Relief, and Economic Security Act (the “CARES Act”) was signed into law. The CARES Act allows net operating losses from the 2018, 2019 and 2020 tax years to be carried back up to five years. As a result, during 2020 we were able to carry back our 2019 net operating loss to tax years 2017 and 2018, resulting in a $1.0 million refund claim. The CARES Act also provided for an increased interest deduction for tax years 2019 and 2020, as well as the deferral of the employer portion of social security taxes.Income(loss) before tax was as follows:Year Ended Year Ended December 29,
2023December 29,
2023December 30,
2022December 31,
2021Income (loss) before tax F-17Significant components of income tax expense (benefit) consist of the following:Year Ended Year Ended December 29,
2023December 29,
2023December 30,
2022December 31,
2021Federal Federal Federal Federal Total deferred tax expense (benefit) Income tax expense Year Ended Year Ended December 29,
2023December 29,
2023December 30,
2022December 31,
2021U.S. federal tax expense U.S. federal tax expense Income tax expense F-18Deferred income tax assets and liabilities consist of the following:December 29,
2023December 29,
2023December 30,
2022Inventory Inventory Interest carryforwards Capitalized research expenses Intangible assets Intangible assets At December 31, 2021,29, 2023, we had federal state, and foreignstate net operating loss carryforwards of 0, $4.8$31.1 million, and $2.1$25.1 million, respectively. The federal net operating losses may be carried forward indefinitely to offset up to 80% of taxable income in any given year. The state and foreign net operating loss carryforwards, if not utilized, will begin to expire in 2032, and 2029, respectively.2032. At December 31, 2021,29, 2023, we had federal and state research and development credits of $2.9 million and 0, respectively. The federal research and development credits, if not utilized, will begin to expire in 2034. Additionally, we had foreign tax credits of $0.6$1.7 million, which, if not utilized, will begin to expire in 2027.Income tax expense for the current year differs from the statutory rate primarily as a result of the valuation allowance, impact of foreign operations and discrete tax benefits recorded in connection with our historical acquisitions and stock option exercises. We have determined the amount of our valuation allowance of $11.1 million based on our estimates of taxable income by jurisdiction in which we operate over the periods in which the related deferred tax assets will be recoverable. As of December 31, 2021,29, 2023, we believedetermined it is not more-likely-than-not that we will realize our U.S. entities will generate sufficient taxable income to offset reversing deductible timing differences and to fully utilize carryforward tax attributes. Accordingly, we have recorded a valuation allowance against U.S. federal and state deferred tax assets, net of deferred tax liabilities related to indefinite-lived intangible assets for which no future realization can be expected.In December 2017, the Tax Cuts and Jobs Act (the "2017 Tax Act") was enacted. The 2017 Tax Act included a number of changes including a provision that required capitalization and amortization of research and development costs beginning in 2022. Prior to 2022 research and development costs could be either expensed or capitalized. Beginning with the exception of certain state2022 tax year, the research and foreign net operating loss carryforwards we believe are not likelydevelopment costs have been capitalized according to be realized within the carryforward period.these provisions.$5.9 million,during 2023, 2022, and $4.6 million during 2021, 2020, and 2019, respectively. Our income tax fluctuates based on the geographic mix of earnings and is calculated quarterly based on actual results pursuant to ASC Topic 740‑270.F-19As of December 31, 2021,29, 2023, we have recognized $3.0$3.1 million of unrecognized tax benefits in other non-current liabilities in our consolidated balance sheet. If recognized, $1.5$3.1 million of this amount would impact our effective tax rate. We expect a decrease of $0.1 million to the total amount of unrecognized tax benefits within the next twelve12 months.Our ongoing practice is to recognize potential accrued interest and penalties related to unrecognized tax benefits within our statements of operations in income tax expense (benefit). Interestexpense. During 2023, we recognized a net decrease of approximately $0.2 million in potential interest and penalties associated with uncertain tax positions recognized during 2021 and 2020 were insignificant.in the statements of operations. At December 31, 2021,29, 2023, other non-current liabilities on our balance sheet included approximately 0zero and $0.5 million of interest and penalties, respectively, associated with uncertain tax positions, which are excluded from the unrecognized tax benefits table below.The following table summarizes the activity related to our unrecognized tax benefits:Unrecognized
tax benefitsBalance at December 25, 2020 $ 2,490 Increase related to current year tax positions 597 Decrease in tax positions related to lapse of statute of limitations (92) Balance at December 31, 2021 2,995 Increase related to current year tax positions 689 Decrease in tax positions related to lapse of statute of limitations (89) Balance at December 30, 2022 3,595 Increase related to current year tax positions 488 Decrease in tax positions related to lapse of statute of limitations (10) Decrease in tax positions related to settlements (916) Balance at December 29, 2023 $ 3,157 We assert indefinite reinvestment of our U.S. and Netherlands unremitted earnings. With regard to these unremitted earnings, we have not, nor do we anticipate the need to repatriate funds from the U.S. to the Netherlands or from the Netherlands to the Cayman entity to satisfy liquidity needs. Determination of the amount of unrecognized withholding tax liability related to the indefinitely reinvested earnings is not practicable.Our three major filing jurisdictions are the United States, Singapore, and Malaysia. We are no longer subject to U.S. Federal examination for tax years ending before 2017, to state examinations before 2017,2019, or to foreign examinations before 2016.2019. However, to the extent allowed by law, the tax authorities may have the right to examine prior periods where net operating losses or tax credits were generated and carried forward, and make adjustments up to the amount of the net operating losses or credit carryforward. At December 31, 2021,29, 2023, we were not under examination by a tax authority.Note 8 – Employee Benefit ProgramsNote 8 – Employee Benefit Programs 401(k) PlanWe sponsor a 401(k) plan available to employees of our U.S.‑based subsidiaries. Participants may make salary deferral contributions not to exceed 50% of a participant’s annual compensation or the maximum amount otherwise allowed by law. Eligible employees receive a discretionary matching contribution equal to 50% of a participant’s deferral, up to an annual maximum of 4% of a participant’s annual compensation. For 2021, 2020,2023, 2022, and 2019,2021, matching contributions were $2.7 million, $3.0 million, and $2.2 million, $1.9 million, and $1.5 million, respectively.F-20Note 9 – Long-Term DebtNote 9 – Long-Term Debt Long-term debt consists of the following:December 29,
2023December 29,
2023December 30,
2022Maturities of long-term debt consist of the following:The weighted average interest rate across our credit facilities was 2.74%6.80%, 3.75%3.37%, and 4.78%2.74% during 2023, 2022, and 2021, 2020, and 2019, respectively.On October 29, 2021, we entered into an amended and restated credit agreement, which includes a group of financial institutions as direct lenders underlying the agreement. The credit agreement includes a $150.0 million term loan facility and a $250.0 million revolving credit facility (“credit(together, “credit facilities”). We incurred debt issuance costs of approximately $1.9 million in connection with the amendment and restatement. We account for debt issuance costs as a reduction to the carrying value of our long-term debt, and we amortize the costs to interest expense over the term of the credit agreement. Under the debt modification literature codified in ASC 470, a portion of the amendment and restatement was treated as an extinguishment. Accordingly, $0.7 million of existing capitalized debt issuance costs were written off as a loss on extinguishment of debt, which is included in other expense (income), net on our statements of operations. Term loan payments of $1.9 million are due on a quarterly basis. The credit agreement matures on October 29, 2026.Our credit agreement is secured by our tangible and intangible assets and includes customary representations, warranties, and covenants. We are required to maintain a minimum fixed charge coverage ratio of 1.25 : 1 and a maximum leverage ratio of 3.50 : 1 to 4.00:1.Interest is charged at either the Base Rate or the Bloomberg Short-Term Bank Yield Index (“BSBY”) Rate (as such terms are defined in the credit agreement) at our option, plus an applicable margin. The Base Rate is equal to the higher of i) the Prime Rate, ii) the Federal Funds Rate plus 0.5%, or iii) the BSBY Rate plus 1.00%. The BSBY Rate is equal to BSBY for a particular tenor matching the respective interest period. The applicable margin on Base Rate and BSBY Rate loans is 0.375‑1.375% and 1.375‑2.375% per annum, respectively, depending on our leverage ratio.ratio, which is based on trailing 12‑month EBITDA, as defined in our credit agreement. We are also charged a commitment fee of 0.175%-0.350%0.175-0.350%, depending on our leverage ratio, on the unused portion of our revolving credit facility. Base Rate interest payments and commitment fees are due quarterly. BSBY rate interest payments are due on the last day of the applicable interest period, or quarterly for applicable interest periods longer than 3 months. At December 31, 2021,29, 2023, our credit facilities bore interest under the BSBY rate option of 1.81%7.58%.Note 10 – Shareholders’ EquityPublic Offering of SharesOn December 14, 2020, we completed an underwritten public offering of 4.6 million ordinary shares with net proceeds of $139.4 million, after deducting the underwriting discount of $1.35 per share and incremental offering expenses of $0.5 million.Share Repurchase ProgramNote 10 – Share-Based Compensation 2016 PlanIn February 2018, our Board of Directors authorized a share repurchase program up to $50.0 million under which we may repurchase our ordinary shares in the open market or through privately negotiated transactions, depending on market conditions and other factors. Ordinary shares repurchased are recorded as treasury shares using the cost method on a first-in, first-out basis. In August 2018, our Board of Directors authorized a $50.0 million increase to the share repurchase program.The following tables details our share repurchases for the periods indicated:Note 11 – Share-Based Compensation2016 PlanIn December 30, 2016, we adopted the 2016 Omnibus Incentive Plan (“the 2016 Plan”). The 2016 Plan provides for grants of share‑based awards to employees, directors, and consultants.consultants. Under the 2016 Plan, 1,888,000 ordinary shares were reserved for issuance. The number of shares reserved for issuance under the 2016 Plan increases annually beginning in fiscal year 2018 by the lesser of (i) 2% of the ordinary shares outstanding on the last day of the immediately preceding fiscal year or (ii) such amount determined by our Board of Directors. Awards may be in the form of stockshare call options (“options”), tandem and non‑tandem stock appreciation rights, restricted share awards or restricted share units (“RSUs”), performance awards, and other share‑based awards.awards. Forfeited or expired awards are returned to the incentive plan pool for future grants.F-21Share‑based compensation expense across all plans for options, RSUs, and employee share purchase rights was $17.3 million, $13.9 million, and $11.5 million during 2023, 2022, and 2021, respectively.Stock OptionsOptions are valued based on the Black-Scholes-Merton model on the date of grant. The risk-free interest rate is based on the U.S. Treasury rates in effect on the date of grant. Estimated volatility is based on the historical volatility of our ordinary shares. Options generally vest over 4 years, with 25% vesting on the first grant-date anniversary and the remaining vesting on a quarterly basis over the remaining 3 years. Options granted under the 2016 Plan generally have a contractual term of 7 years. VestingThe following table summarizes option activity:Number of Stock Options Service
conditionWeighted average exercise price
per shareWeighted average remaining
contractual termAggregate intrinsic value Outstanding, December 30, 2022 805,115 $ 23.35 Exercised (215,884) $ 20.69 Forfeited or expired (7,068) $ 21.84 Outstanding, December 29, 2023 582,163 $ 24.36 2.0 years $ 5,399 Exercisable, December 29, 2023 566,312 $ 24.39 2.0 years $ 5,235 Fair value information for options granted and the intrinsic value of options and exercised are as follows:Year Ended December 29,
2023December 30,
2022December 31,
2021Total intrinsic value of options exercised $ 3,041 $ 1,232 $ 11,859 At December 29, 2023, total unrecognized share-based compensation expense relating to options was $0.1 million, with a weighted average remaining service period of 0.4 years.Restricted Share UnitsRSUs are valued based on the closing market price of our ordinary shares on the date of grant. RSUs that vest pursuant to a service condition generally occursvest over 4 years, with 25% vesting on the first grant-date anniversary ofand the date of grant andremaining vesting on a quarterly thereafterbasis over the remaining 3 years. RSUs that vest pursuant to a performance condition are generally earned over 3 years, depending on the achievement of certain financial and non-financial targets, and vest on or around the third grant-date anniversary. RSUs that vest pursuant to a market condition are valued based on a Monte Carlo simulation model and generally earned over 3 years based on a relative total shareholder return model and vest on or around the third grant-date anniversary. Upon vesting of RSUs, employees may elect to have shares withheld to cover statutory minimum withholding taxes. Shares withheld are not reflected as an issuance of ordinary shares within our consolidated statements of shareholders’ equity, as the shares were never issued, and the associated tax payments are reflected as financing activities within our consolidated statements of cash flows.2012 PlanIn March 2012, we adopted the Ichor Holdings Ltd. 2012 Equity Incentive Plan (the “2012 Plan”). Under the 2012 Plan, we could grant either restricted shares, RSUs, or options to employees, directors, and consultants. Options granted under the 2012 Plan generally had a termF-22Table of 7 years. Vesting of options and RSUs generally occurred 25% on the first anniversary of the date of grant and quarterly thereafter over the remaining 3 years. There have been 0 issuances of equity-based awards under the 2012 Plan since the adoption of the 2016 Plan.Share‑based compensation expense across all plans for options, RSUs, and employee share purchase rights was $11.5 million, $9.9 million, and $8.5 million during 2021, 2010, and 2019,Contents respectively.On November 12, 2019, in connection with the transition of our former Chief Executive Officer to Executive Chairman, the Compensation Committee of the Board of Directors modified all outstanding equity awards such that the next 18 months of vesting events would be pulled forward and become immediately vested on January 6, 2020. Consequently, 98,825 options and 60,721 RSUs vested on January 6, 2020. This was accounted for as a probable-to-probable modification under ASC Topic 718, resulting in approximately $1.4 million in share-based compensation expense pulled forward into 2019.Stock OptionsThe table below sets forth the weighted average assumptions used to measure the fair value of options granted:The following table summarizes option activity:Fair value information for options granted and the intrinsic value of options exercised are as follows:At December 31, 2021, total unrecognized share-based compensation expense relating to options was $3.2 million, with a weighted average remaining service period of 1.8 years.Restricted Share UnitsNumber of Restricted Share Units Service
conditionService
conditionService
conditionPerformance
conditionMarket
conditionWeighted average grant-date fair
value per shareUnvested, December 30, 2022 Unvested, December 29, 2023 Fair value information for RSUs granted and vested is as follows:Year Ended Year Ended December 29,
2023December 29,
2023December 30,
2022December 31,
202131, 2021,29, 2023, total unrecognized share-based compensation expense relating to RSUs was $17.6$31.7 million, with a weighted average remaining service period of 2.52.7 years.2017 ESPPIn May 2017, we adopted the 2017 Employee Stock Purchase Plan (the “2017 ESPP”). The 2017 ESPP grants employees the ability to designate a portion of their base-pay to purchase ordinary shares at a price equal to 85% of the fair market value of our ordinary shares on the first or last day of each 6 month purchase period. Purchase periods begin on January 1 or July 1 and end on June 30 or December 31, or the next business day if such date is not a business day. Shares are purchased on the last day of the purchase period. As of December 31, 2021, 2.329, 2023, 2.2 million ordinary shares remained eligible for issuance under the 2017 ESPP.The table below sets forth the weighted average assumptions used to measure the fair value of 2017 ESPP rights:Year Ended Year Ended December 29,
2023December 29,
2023December 30,
2022December 31,
2021Weighted average expected term 0.5 years 0.5 years Risk-free interest rate 5.1% 1.4% 0.1% Dividend yield 0.0% 0.0% Volatility 63.4% 63.8% 63.7% We recognize share-based compensation expense associated with the 2017 ESPP over the duration of the purchase period. We recognized $0.6$0.9 million, $0.4$1.0 million, and $0.3$0.6 million of share-based compensation expense associated with the 2017 ESPP during 2021, 2020,2023, 2022, and 2019,2021, respectively. At December 25, 2020,29, 2023, there was 0no unrecognized share-based compensation expense.Note 12 – Segment InformationNote 11 – Segment Information Our Chief Operating Decision Maker, the Chief Executive Officer, reviews our results of operations on a consolidated level and executive staff is structured by function rather than by product category. Therefore, we operate in 1 operating segment. KeyAdditionally, key resources, decisions, and assessment of performance are also analyzed onat a company‑wide level.F-23Foreign operations are conducted primarily through our wholly owned subsidiaries in Singapore and Malaysia.Malaysia, and to a lesser degree, Scotland, Korea, and Mexico. Our principal markets include North America, Asia, and to a lesser degree, Europe. Sales by geographic area represent sales to unaffiliated customers.All information onThe following table sets forth sales by geographic area, iswhich represents sales to unaffiliated customers based upon the location to which the products were shipped. The following table sets forth sales by geographic area:shipped:Year Ended Year Ended December 29,
2023December 29,
2023December 30,
2022December 31,
2021The following table sets forth our two major customers with 10% or more of sales, which comprised 85%82%, 87%79%, and 85% of net sales in 2023, 2022, and 2021, 2020,respectively:Year Ended December 29,
2023December 30,
2022December 31,
2021Applied Materials $ 295,082 $ 396,261 $ 352,077 Lam Research $ 286,836 $ 616,391 $ 579,009 ASML (1) $ 85,589 -- -- (1)ASML did not represent 10% or more of sales in 2022 and 2019, respectively:2021.$38.4$48.2 million and $31.5$52.8 million at December 31, 202129, 2023 and December 25, 2020,30, 2022, respectively.F-24Note 13 – Earnings per ShareNote 12 – Earnings per Share The following table sets forth the computation of our basic and diluted net income (loss) per share and a reconciliation of the numerator and denominator used in the calculation:Year Ended Year Ended December 29,
2023December 29,
2023December 30,
2022December 31,
2021Net income (loss) Net income (loss) Net income (loss) Basic weighted average ordinary shares outstanding Basic weighted average ordinary shares outstanding 29,200,796 28,714,550 28,259,607 Dilutive effect of options 0 165,855 480,790 Dilutive effect of RSUs 0 74,853 237,357 Dilutive effect of ESPP 0 7,773 1,598 Diluted weighted average ordinary shares outstanding 29,200,796 28,963,031 28,979,352 Securities excluded from the calculation of diluted weighted average ordinary shares outstanding (1) 2,632,000 959,000 273,000 Net income (loss) per share: Net income (loss) per share: Net income (loss) per share: Basic Basic F-25EXHIBIT INDEXThe following exhibits are filed with this Form 10‑K or are incorporated herein by reference:Exhibit
NumberAmended and Restated Memorandum and Articles of Association of Ichor Holdings, Ltd., effective as of December 9, 2016May 24, 2022 (Incorporated by reference to Exhibit 3.1 to Ichor Holdings, Ltd.’s Current's Annual Report on Form 8‑K10-K filed with the Securities and Exchange Commission on December 14, 2016)February 24, 2023).4.1*10.1*10.2+10.3+10.4+10.5+10.6+10.7+10.810.8++10.9+10.10+10.10+10.11*10.11+21.1*10.13+ 10.14+ 21.1* 101.INS101.INS* Inline XBRL Instance Document – the instance document does not appear in the Interactive Data File because XBRL tags are embedded within the Inline XBRL document. 101.SCHDocument101.CALDocument101.DEFDocument101.LABDocument101.PREDocument104document)Filed herewith
** Furnished herewith+A management contract or compensatory arrangement required to be filed as an exhibit pursuant to Item 601 of Regulation S‑K+ A management contract or compensatory arrangement required to be filed as an exhibit pursuant to Item 601 of Regulation S‑KSIGNATURESPursuant to the requirements of Section 13 or 15(d) of the Securities Exchange Act of 1934, the registrant has duly caused this report to be signed on its behalf by the undersigned, thereunto duly authorized.Dated: February 28, 202223, 2024By: By:Chief Executive Officer Pursuant to the requirements of the Securities Exchange Act of 1934, this report has been signed below by the following persons on behalf of the registrant and in the capacities and on the dates indicated.Signature Jeffrey S. Andreson28, 2022Jeffrey S. Andreson /s/ Larry J. SparksLarry J. Sparks28, 2022Greg Swyt /s/ Thomas M. Rohrs Thomas M. Rohrs28, 2022Thomas M. Rohrs /s/ Iain MacKenzie 28, 2022Marc HaugenDirector Director28, 2022Marc Haugen /s/ John Kispert Director Director28, 2022Laura BlackDirector Director28, 2022Laura Black /s/ Wendy Arienzo Wendy ArienzoDirector Director28, 2022Wendy Arienzo /s/ Sarah O’Dowd Director Director28, 2022/s/ Jorge Titinger Director February 23, 2024 /s/ Yuval Wasserman Director Director28, 2022