2 | |||||
3 | |||||
Item 1. | 5 | ||||
Item 1A. |
| ||||
Item 1B. |
| ||||
Item | 37 | ||||
Item 2. |
| ||||
Item 3. |
| ||||
Item 4. |
| ||||
Item 5. |
| ||||
Item 6. |
| ||||
Item 7. | Management’s Discussion and Analysis of Financial Condition and Results of Operations |
| |||
Item 7A. |
| ||||
Item 8. |
| ||||
Item 9. | Changes in and Disagreements with Accountants on Accounting and Financial Disclosure |
| |||
Item 9A. |
| ||||
Item 9B. |
| ||||
Item 9C. | Disclosure Regarding Foreign Jurisdictions that Prevent Inspections |
| |||
Item 10. |
| ||||
Item 11. |
| ||||
Item 12. | Security Ownership of Certain Beneficial Owners and Management and Related Stockholder Matters |
| |||
Item 13. | Certain Relationships and Related Transactions and Director Independence |
| |||
Item 14. |
| ||||
Item 15. |
| ||||
Item 16. |
| ||||
| |||||
1
Special Note Regarding Forward-Looking Statements
This Annual Report on Form 10-K contains “forward-looking statements” within the meaning of the Private Securities Litigation Reform Act of 1995, Section 27A of the Securities Act of 1933 and Section 21E of the Securities Exchange Act of 1934 regarding the future financial performance, business prospects and growth of MKS.MKS Instruments, Inc. (“MKS”, the “Company”, “our”, or “we”). These statements are only predictions based on current assumptions and expectations. Any statements that are not statements of historical fact (including statements containing the words “will,” “projects,” “intends,” “believes,” “plans,” “anticipates,” “expects,” “estimates,” “forecasts,” “continues” and similar expressions) should be considered to be forward-looking statements. Actual events or results may differ materially from those in the forward-looking statements set forth herein.
Among the important factors that could cause actual events to differ materially from those in the forward-looking statements that we make are the need to generate sufficient cash flows to service and repay the substantial indebtedness we incurred in connection with our acquisition of Atotech Limited (“Atotech” and such transaction, the “Atotech Acquisition”), which we completed in August 2022; the terms of our existing credit facilities under which we incurred such debt; our entry into the chemicals technology business through the Atotech Acquisition, in which we did not have previous experience and which may expose us to significant additional liabilities; the risk that we are unable to integrate the Atotech Acquisition successfully or realize the anticipated synergies, cost savings and other benefits of the Atotech Acquisition; legal, reputational, financial and contractual risks resulting from the ransomware incident we identified in February 2023, and other risks related to cybersecurity, data privacy and intellectual property; competition from larger, more advanced or more established companies in our markets; the ability to successfully grow our business, including through growth of the Atotech business and growth of the Electro Scientific Industries, Inc. business, which we acquired in February 2019, and financial risks associated with those and potential future acquisitions, including goodwill and intangible asset impairments; manufacturing and sourcing risks, including those associated with limited and sole source suppliers and the impact and duration of supply chain disruptions, component shortages, and price increases,increases; changes in global demand; the abilityimpact of MKS to complete its acquisition of Atotech Limited (“Atotech”),a pandemic or other widespread health crisis; risks associated with doing business internationally, including geopolitical conflicts, such as the terms of MKS’ existing term loan,conflict in the termsMiddle East, trade compliance, regulatory restrictions on our products, components or markets, particularly the semiconductor market, and availability of financing for the Atotech acquisition, the substantial indebtedness MKS expects to incurunfavorable currency exchange and tax rate fluctuations, which risks become more significant as we grow our business internationally and in connection with the Atotech acquisition and the need to generate sufficient cash flows to service and repay such debt, MKS’ entry into Atotech’s chemicals technology business, in which MKS does not have experience and which may expose it to significant additional liabilities, the risk of litigation relating to the Atotech acquisition, the risk that disruption from the Atotech acquisition materially and adversely affects the respective businesses and operations of MKS and Atotech, the ability of MKS to realize the anticipated synergies, cost savings and other benefits of the Atotech acquisition, competition from larger or more established companies in MKS’ and Atotech’s respective markets, the ability of MKS to successfully grow its business and the businesses of Atotech, Photon Control Inc., which it acquired in July 2021, and Electro Scientific Industries, Inc., which it acquired in February 2019, potential adverse reactions or changes to business relationships resulting from the announcement, pendency or completion of the Atotech acquisition,China specifically; conditions affecting the markets in which MKS and Atotechwe operate, including the fluctuations in capital spending in the semiconductor, industryelectronics manufacturing and other advanced manufacturing markets,automotive industries, and fluctuations in sales to MKS’ and Atotech’sour major customers,customers; disruptions or delays from third-party service providers upon which our operations may rely; the ability to anticipate and meet customer demand,demand; the challenges, risks and costs involved with integrating theor transitioning global operations of the companies we have acquired,acquired; risks associated with the attraction and retention of key personnel; potential fluctuations in quarterly results,results; dependence on new product development,development; rapid technological and market change,change; acquisition strategy,strategy; volatility of stock price, international operations,price; risks associated with chemical manufacturing and environmental regulation compliance; risks related to defective products; financial and legal risk management,management; and the other important factors described in “Risk Factors” in Part 1,I, Item 1A of this Annual Report on Form 10-K. Additional risk factors may be identified from time to time in MKS’ future filings with the Securities and Exchange Commission. MKS isWe are under no obligation to, and expressly disclaimsdisclaim any obligation to, update or alter these forward-looking statements, whether as a result of new information, future events or otherwise, after the date of this report.even if subsequent events cause our views to change.
2
SUMMARY OF RISK FACTORS
Below is a summary of the principal factors that make an investment in MKS speculative or risky. The followingThis summary does not contain all of the information that may be important to you, and you should read the below summary in conjunction with the more detailed discussion of risks set forth under the heading “Risk Factors” in Part I, Item 1A of this Annual Report on Form 10-K.
Risks Related to Our Pending Acquisition of Atotech
|
|
|
|
Risks Related to the COVID-19 Pandemic and other Widespread Health Crises
|
|
Risks Related to Operating a Global Business
|
|
|
|
Risks Related to Our Industries and Markets
|
|
|
|
|
|
Risks Related to Our Operations
|
|
|
|
|
|
|
|
|
|
|
|
|
|
Acquisition Risks
|
|
Financial Risks
|
|
|
|
Legal, Tax, Regulatory•
|
|
|
|
|
|
|
|
|
|
Risks Related to Cybersecurity, Data Privacy and Intellectual Property Protection
|
|
|
|
Risks Related to Our Operations
3
Risks Related to Our Industries and Markets
Risks Related to Operating a Global Business
Legal, Tax, Regulatory and Compliance Risks
Risks Related to Pandemics and other Widespread Health Crises
Risks Related to Owning Our Common Stock
| • Our quarterly operating results have fluctuated, and are likely to continue to vary significantly, which may result in volatility in the market price of our common stock. • The market price of our common stock has fluctuated and may continue to fluctuate for reasons over which we have no control. 4
|
|
|
|
|
|
|
|
PART I
Item 1. Business
|
|
MKS Instruments, Inc. (“MKS”, the “Company”, “our”, or the “Company”“we”) was founded in 1961 as a Massachusetts corporation. We are a global provider ofenable technologies that transform our world. We deliver foundational technology solutions to leading edge semiconductor manufacturing, electronics and packaging, and specialty industrial applications. We apply our broad science and engineering capabilities to create instruments, systems, subsystems, andsystems, process control solutions that measure, monitor, deliver, analyze, power and control critical parameters of advanced manufacturing processes tospecialty chemicals technology that improve process performance, optimize productivity and productivityenable unique innovations for our customers.many of the world's leading technology and industrial companies. Our productssolutions are derived from our core competenciescritical to addressing the challenges of miniaturization and complexity in pressure measurementadvanced device manufacturing by enabling increased power, speed, feature enhancement, and control, flow measurement and control, gas and vapor delivery, gas composition analysis, electronic control technology, reactive gas generation and delivery, power generation and delivery, vacuum technology, temperature sensing, lasers, photonics, optics, precision motion control, vibration control and laser-based manufacturing systems solutions. Weoptimized connectivity. Our solutions are also provide services relatingcritical to the maintenance and repairaddressing ever-increasing performance requirements across a wide array of our products, installation services and training. Our primary served markets include semiconductor,specialty industrial technologies, life and health sciences and research and defense.
Recent Events
Acquisitionsapplications.
On July 15, 2021, we completed our acquisition of Photon Control Inc. (“Photon Control” and such acquisition, the “Photon Control Acquisition”), pursuant to a definitive agreement. Photon Control designs, manufactures and distributes a wide range of optical sensors and systems to measure temperature and position used in semiconductor wafer fabrication. At the effective time of the Photon Control Acquisition, each share of Photon Control’s common stock issued and outstanding as of immediately prior to the effective time of the Photon Control Acquisition was converted into the right to receive 3.60 per share in cash in Canadian dollars (“CAD”), without interest and subject to deduction for any required withholding tax. We paid to the former Photon Control securityholders aggregate consideration of CAD 379 million or $303 million, excluding related transaction fees and expenses. We funded the payment of the aggregate consideration with available cash on hand. Photon Control is included in our Light & Motion segment.
The Photon Control Acquisition has helped us deliver on one of our long-term strategic objectives, which is to broaden our portfolio of key technologies to better serve our customers. The Photon Control Acquisition further advances our strategy to enhance our Surround the Chamber® offering by adding optical sensors for temperature control for critical etch and deposition applications in semiconductor wafer fabrication.
On July 1, 2021, we entered into a definitive agreement (as amended from time to time, the “Implementation Agreement”) to acquire Atotech Limited (“Atotech”), a leading process chemicals technology company and a market leader in advanced electroplating solutions. Pursuant to the Implementation Agreement, we agreed to pay $16.20 per share in cash and 0.0552 of a share of our common stock for each outstanding common share of Atotech. At the time of the announcement of the acquisition, the total value of the aggregate cash and stock consideration was approximately $5.1 billion. The final value of the consideration will be determined at the time of the closing of the acquisition, which is expected to occur in the first quarter of 2022, subject to the satisfaction of certain closing conditions, including receipt of regulatory approval from China and approval by the Royal Court of Jersey. Our obligations to complete the acquisition are not subject to any financing condition. We intend to fund the cash portion of the transaction with a combination of available cash on hand and committed term loan debt financing. In connection with entering into the Implementation Agreement, we entered into (a) a commitment letter (the “Initial Commitment Letter”), dated as of July 1, 2021, with JPMorgan Chase Bank, N.A. and Barclays Bank PLC (collectively, the “Initial Commitment Parties”) and (b) joinders to the Initial Commitment Letter to add certain additional lender parties (the “Commitment Letter Joinders” and, together with the Initial Commitment Letter, the “Commitment Letter”) dated as of July 23, 2021, with the Initial Commitment Parties and the additional lenders party thereto (collectively, the “Supplemental Commitment Parties” and, together with the Initial Commitment Parties, the “Commitment Parties”), pursuant to which, subject to the terms and conditions set forth therein, the Commitment Parties committed to provide (i) a senior secured term loan credit facility in an aggregate principal amount of $5.3 billion (the “New Term Loan Facility”) and (ii) a senior secured revolving credit facility with aggregate total commitments of $500 million (the “New Revolving Credit Facility”). The New Term Loan Facility and New Revolving Credit Facility would refinance our existing term loan facility (the “Term Loan Facility”) and our existing asset-based revolving credit facility (the “ABL Facility”), respectively, and the New Term Loan Facility would be used to finance a portion of the acquisition and to refinance certain existing indebtedness of Atotech.
On October 22, 2021, we completed the syndication of the New Term Loan Facility, comprised of two tranches: a $4.7 billion loan at LIBOR plus 2.25%, a floor of 0.50% and 0.25% of original issue discount, and a Euro tranche of 0.5 billion
Euro (“EUR”), or approximately $0.6 billion at EURIBOR plus 2.75%, a floor of 0.00% and 0.25% of original issue discount. Subsequent to the syndication, the $4.7 billion tranche is expected to be modified to reference a term rate based on the Secured Overnight Financing Rate (plus an applicable credit spread adjustment) as the benchmark rate.
The Commitment Parties’ obligations under the Commitment Letter and the closing and initial funding under the New Term Loan Facility are subject to certain customary conditions including, without limitation, the consummation of the acquisition of Atotech in accordance with the Implementation Agreement, the accuracy of specified representations and warranties of us and other customary closing conditions.
Where You Can Find More Information
We file reports, proxy statements and other documents with the Securities and Exchange Commission (“SEC”). Our SEC filings are available to you on the SEC’s website at http://www.sec.gov.
Our website is http://www.mksinst.com.www.mks.com. We are not including the information contained in our website as part of, or incorporating it by reference into, this Annual Report on Form 10-K. We make available free of charge through our website our Annual Reports on Form 10-K, Quarterly Reports on Form 10-Q, Current Reports on Form 8-K and amendments to these reports filed or furnished pursuant to Section 13(a) or 15(d) of the Securities Exchange Act of 1934, as amended (the “Exchange Act”), as soon as reasonably practicable after we electronically file such materials with, or furnish them to, the SEC.
Atotech Acquisition
On August 17, 2022 (the “Effective Date”), we completed the acquisition of Atotech Limited (“Atotech”), through the acquisition of the entire issued share capital of Atotech by Atotech Manufacturing, Inc., a Delaware corporation and indirect wholly owned subsidiary of the Company (the “Atotech Acquisition”).
Atotech, which we operate as our Materials Solutions Division, develops leading process and manufacturing technologies for advanced surface modification, electroless and electrolytic plating, and surface finishing. Applying a comprehensive systems-and-solutions approach, Atotech’s portfolio includes chemistry, equipment, software, and services for innovative and high-technology applications in a wide variety of end markets. Atotech further broadens the Company’s capabilities by bringing leadership in critical chemistry solutions for electronics and packaging and specialty industrial applications.
Markets and Applications
Since our inception, we have focused on satisfying the needs of our customers by establishing long-term collaborative relationships. We have a diverse base of customers across our three end-markets, semiconductor, electronics and our primary served markets include semiconductor, industrial technologies, lifepackaging, and health sciences, research and defense.specialty industrial.
We have developed the following two product strategies that have been instrumental in delivering value to our customers and helping them solve their most complex problems:
|
|
• Our Surround the Workpiece® offering includes product design and development, system-level integration, research and development, system, subsystem and component selection, and maintenance, repair and calibration services in the field of laser-based guidance and control for manufacturing processes. In connection with the Atotech Acquisition, we introduced an extension of the Surround the Workpiece offering called Optimize the Interconnect®, which refers to MKS’ combined laser drilling and chemistry solutions geared towards accelerating innovation and customers’ time-to-market in printed circuit board (“PCB”) and package substrate manufacturing. 5 |
|
At ourits core, MKS is a foundational enabler of miniaturization and complexity. We believe there are three secular trends benefittingbenefiting MKS. First is the impact of a world that continues to be increasingly interconnected, driving the need for smaller, more powerful and feature-rich advanced electronic devices, which is enabled by semiconductor manufacturing, and laser processing and chemistry solutions. Second is the increasing complexity of technology transitions in semiconductor, PCB and package substrate manufacturing, which leads to inflections, such as extreme vertical structures and process engineering at the atomic level.level, as well as increased interconnect density and smaller features. These inflections provide additional growth opportunities for MKS, as we believe we are uniquely positioned to deliver the broadest and deepest portfolio of solutions. Third is the accelerating need for laser-based precision manufacturing techniques, which are enabled by lasers, photonics, optics, precision motion control, vibration control and systems solutions.
We believe our long history and deep expertise in solving critical problems position us well to address these challenges for our customers.
Semiconductor Market
A significant portion of our sales are derived from products sold toMKS is a critical solutions provider for semiconductor capital equipment manufacturers and semiconductor device manufacturers.manufacturing. Our products are used in major semiconductor processing steps, such as depositing thin films of material onto silicon wafer substrates,deposition, etching, cleaning, lithography, metrology, packaging and inspection. The semiconductor industry continually faces new challenges, as products become smaller, more powerful and highly mobile. Ultra-thin layers, smaller critical dimensions, new materials, 3D structures, and the ongoing need for higher yield and productivity
drive the need for tighter process measurement and control, all of which MKS supports. We believe we are the broadest critical subsystem provider in the wafer fabrication equipment ecosystem and address over 85%of the market. We have characterized our broad and unique offering as Surround the Wafer to reflect the technology enablement we provide across almost every major process in semiconductor manufacturing today.
The semiconductor market is subject to rapid demand shifts, which are difficult to predict. We cannot be certain as to the timing or extent of future demand or any future softness in the semiconductor capital equipment industry. For example, due in part to these demand shifts, our semiconductor market revenue sequentially decreased 28% in 2023, but it sequentially increased 12% in 2022 and 32% in 2021.
Approximately 62%41%, 59%58%, and 49%62% of our net revenues for 2021, 20202023, 2022, and 2019,2021, respectively, were from sales to our semiconductor capitalmarket. This decrease from 2022 to 2023 was primarily a result of the full-year impact of the Atotech Acquisition, as MSD only sells into our electronics and packaging and specialty industrial markets.
Electronics and Packaging Market
MKS is a foundational solutions provider for the electronics and packaging market. Our portfolio includes photonics components, laser drilling systems, electronics chemistries and plating equipment manufacturersthat are critical for the manufacturing of PCBs and semiconductor device manufacturers. As a percentage of net revenues from our top ten customers, semiconductor market revenue accounted for greater than 90% in each of these years.
Advanced Markets
In additionpackage substrates, and critical to wafer level packaging (“WLP”) applications. Similar to the semiconductor industry, the PCB, package substrate and WLP industries increasingly demand smaller features, greater density, and better performance. In addition, the electronics and packaging market also includes sales of our products are usedvacuum and photonics solutions for display manufacturing applications. We characterize our complementary offering of laser systems and chemistry solutions as Optimize the Interconnect, to reflect the unique technology enablement we provide at the interconnect level within PCBs, package substrates and WLPs.
Approximately 25%, 15%, and 12% of our net revenues for 2023, 2022, and 2021, respectively, were from sales to our electronics and packaging market.
Specialty Industrial Market
MKS’ strategy in thespecialty industrial is to leverage our domain expertise and proprietary technologies across a broad array of applications in industrial technologies, life and health sciences, and research and defense markets.
Industrial Technologies
Industrial technologies encompasses a wide range of diverse applications, including advanced electronicschemistries for functional coatings, surface finishing and wear resistance in the automobile industry, vacuum solutions for synthetic diamond manufacturing comprising flexible and rigid printed circuit board (“PCB”) processing/fabrication, electronic component manufacturing, glass coating and electronic thin films. Electronic thin films are a primary component of numerous electronic products including flat panel displays, light emitting diodes,photonics for solar cells and data storage media.manufacturing. Other applications include vacuum and photonics solutions for light emitting diode and laser marking, measurement and scribing, natural gas and oil production and environmental monitoring.diode manufacturing.
6
Life and Health Sciences
Our products for life and health sciences are used in a diverse array of applications, including bioimaging, medical instrument sterilization, medical device manufacturing, analytical, diagnostic and surgical instrumentation, consumable medical supply manufacturing and pharmaceutical production.
Research and Defense
Our products for research and defense are sold to government, university and industrial laboratories for applications involving research and development in materials science, physical chemistry, photonics, optics and electronics materials. Our products are also sold for monitoring and defense applications including surveillance, imaging and infrastructure protection.
Approximately 38%34%, 41%27%, and 51%26% of our net revenues in the yearsfor 2023, 2022, and 2021, 2020 and 2019, respectively, were from advanced markets.sales to our specialty industrial market.
International Markets
A significant portion of our net revenues areis from sales to customers in international markets. For 2021, 20202023, 2022, and 2019,2021, international net revenues accounted for approximately 66%, 58%, and 57%, 55% and 53%respectively, of our total net revenues, respectively.revenues. A significant portion of our international net revenues were from sales to customers in China, Israel,Germany, Japan and South Korea and Taiwan.Korea. We expect that international revenues will continue to account for a significant percentage of total net revenues for the foreseeable future. Long-lived assets located outside of the United States accounted for approximately 25%58% and 28%57% of our total long-lived assets in 20212023 and 2020,2022, respectively. Long-lived assets include property, plant and equipment, net, right-of-use assets, and certain other assets and exclude goodwill, intangible assets and long-term tax-related accounts.assets.
Reportable Segments, and Product and Service Offerings
We are divided into three divisions: the Vacuum Solutions Division (“VSD”), the Photonics Solutions Division (“PSD”) and the Materials Solutions Division (“MSD”). MSD represents the Atotech business and was established following the Atotech Acquisition. We group our product offerings by the followingour reportable segments: Vacuum & Analysis (“V&A”), Light & Motion (“L&M”)VSD, PSD and Equipment & Solutions (“E&S”).MSD. Global Service represents our service offerings and consists of total services fromfor all three of our reportable segments.
The V&A segment provides a broad range of instruments, componentsVSD delivers foundational technology solutions to leading edge semiconductor manufacturing, electronics and subsystems whichpackaging and specialty industrial applications. VSD products are derived from our core competencies in pressure measurement and control, flow measurement and control, gas and vapor delivery, gas composition analysis, electronic control technology, reactive gas generation and delivery, power generation and delivery and vacuum technology. Its products include:
|
|
|
|
•
• Plasma and Reactive Gas Products, whichconsist of remote plasma and ozone generators that create reactive species. A reactive gas is used to facilitate various chemical reactions in the processing of thin films, including the deposition of films, etching and cleaning of films and surface modifications. |
|
|
|
The L&M segmentPSD provides a broad range of instruments, components and subsystems whichto leading edge semiconductor manufacturing, electronics and packaging and specialty industrial applications. PSD products are derived from our core competencies in lasers, photonics, optics, temperature sensing, precision motion control and vibration control. Its products include:
|
|
|
|
The E&S segment provides a range of laser-based7
MSD develops leading process and manufacturing technologies for advanced surface modification, electroless and electrolytic plating, and surface finishing. Applying a comprehensive systems-and-solutions approach, MSD's portfolio includes chemistry, equipment, software, and services for innovative and high-technology applications in our electronics and packaging and specialty industrial markets. Its products include:
| • Advanced chemical processes, production equipment and software solutions, for the manufacturing of PCBs, package substrates and wafers used in smartphones, computers, other consumer electronics, server and data centers, automotive electronics, and the medical and industrial industries. • Advanced chemical processes and production equipment for decorative and functional surface finishing, which include decorative, corrosion-protective, and wear-resistant coatings for various end markets, such as automotive, construction, energy, household appliance and heavy machinery. • Advanced chemical processes for paint support applications, including pretreatment, stripping and overspray treatment for various end markets such as automotive, construction, aviation, heavy machinery and household appliance.
|
|
|
|
For further information on our segments, see Note 2122 to the Notes to Consolidated Financial Statements contained in Part II, Item 8 of this Annual Report on Form 10-K.
Global Service includes:
• Installation services and training for many of our products. • On-site services for maintenance and repair of equipment and critical subsystems. • Technical support offices and technology centers located near many of our customers’ facilities. • Repair and calibration services at internal service depots and authorized service providers located worldwide. • Warranties on our products that typically range from one to three years, with the majority of the warranties on our products ranging from one to two years. We typically provide warranties on our repair services for periods ranging from 90 days to up to one year, depending upon the type of repair. We also offer extended warranties on our products ranging from one to five years. Customers |
|
|
|
|
|
|
|
|
Customers
We sell our products and services to thousands of customers worldwide, in a wide range of end markets. RevenuesNet revenues from our top ten customers accounted for 47%30%, 44%42% and 33%46% of net revenues for 2023, 2022 and 2021, 2020 and 2019, respectively, with the increasing percentages attributable to increasing semiconductor market sales. As a percentagerespectively. None of net revenues from our top ten customers semiconductor market revenuein 2023 accounted for greater than 90% in each10% of these years. Lam Research Corporation and Applied Materials, Inc. were our top two customers in 2021 and together accounted for approximately 27% of our net revenues. Both of these customers are in the semiconductor market. The semiconductor market has historically experienced cyclical variations in product supply and demand. It is subject to rapid demand shifts, which are difficult to predict, and we cannot be certain as to the timing or extent of future demand or any future weakness in the semiconductor capital equipment industry. For example, our semiconductor market revenue sequentially increased 32% in 2021, sequentially increased 49% in 2020, and sequentially decreased 19% in 2019. We believe net revenues attributable to our semiconductor market customers are affected by the cyclical nature of the semiconductor market.
Sales and Marketing
Our worldwide sales and marketing organizations are also critical to our strategy of maintaining close relationships with a wide array of customers across a diverse set of advanced applications, including semiconductor capital equipment manufacturers, semiconductor device manufacturers, PCB and package substrate manufacturers, and customers across a range of advanced
specialty industrial applications. We market and sell our products and services through our global direct sales organization, an international network of independent distributors and sales representatives, our websites and product catalogs. As of December 31, 2021, we had approximately 800 sales and marketing employees worldwide. We maintain a marketing staff that identifies customer requirements, assists in product planning and specifications, and focuses on future trends in the markets we serve.
Research and Development
Our products incorporate sophisticated technologies to measure, monitor, deliver, analyze, power, control and improve complex semiconductor and advanced manufacturing processes, thereby enhancing uptime, yield and throughput for our customers. OurWith the Atotech Acquisition, we also offer a broad portfolio of specialty chemistry solutions for advanced surface modification, electroless and electrolytic plating, surface finishing, functional coating and corrosion resistance applications. MSD
8
is supported by 15 state-of-the-art global technology centers, which are used to conduct extensive research and development in order to anticipate future industry requirements.
We continue to develop our products have continuously advanced as we strive to meet our customers’ evolving needs. We have developed, and continue to develop, new products to address industry trends, such as the shrinking of integrated circuit critical dimensions and technology inflections, and, in the flat panel display and solar markets, the transition to larger substrate sizes, which require more advanced processing and process control technology, the continuing drive toward more complex and accurate components and devices within the handset, tablet and tablet market,high performance computing markets, the transition to 5G for both communications devices and infrastructure, supporting the growth in units and via counts ofin the High Density InterconnectHDI PCB drilling market,and package substrate markets, and the industry transition to electric carsbattery-powered vehicles in the automotive market. In addition, we have developed, and continue to develop, products that support the migration to new classes of materials, ultra-thin layers, and 3D structures that are used in small geometry manufacturing. In our chemistry and equipment plating businesses, a majority of our research and development investment supports existing customers' product improvement needs and their short-term research and development goals, which enables us to pioneer new high-value solutions while limiting commercial risk.
We involve our marketing, engineering, manufacturing and sales personnel in the development of new products in order to reduce the time to market for new products. Our employees also work closely with our customers’ development personnel, helping us to identify and define future technical needs on which to focus research and development efforts. We support research at academic institutions targeted at advances in materials science, semiconductor process development and photonics.
As of December 31, 2021, we had approximately 900 research and development employees located in facilities around the world. Our research and development expenses were $288 million, $241 million and $200 million $173 millionfor 2023, 2022 and $164 million for 2021, 2020 and 2019, respectively. Our research and development efforts include numerous projects, none of which are individually material, and generally have a duration of 3 to 3036 months, depending upon whether the product is an enhancement of existing technology or a new product. Our current initiatives include projects to enhance the performance characteristics of older products, to develop new products and to integrate various technologies into subsystems.
Manufacturing
Manufacturing activities include the assembly and testing of components and subassemblies, which are integrated into our products. Our manufacturing facilities are located in Austria, Brazil, Canada, China, Czech Republic, France, Germany, India, Israel, Italy, Malaysia, Mexico, Romania, Singapore, South Korea and the United States. We alsoIn addition, we rely on significant subcontracted operations in Mexico and selected contract manufacturers in Asia. Our business depends on the timely supply of products and services that meet the rapidly changing technical and volume requirements of our customers, which depends in part on the timely delivery of parts, components and subassemblies from suppliers, including contract manufacturers. We purchase a wide range of electronic, optical, mechanical and electrical components, some of which are designed to our specifications. We consider our lean manufacturing techniques and responsiveness to customers’ significantly fluctuating product demands to be a competitive advantage. As of December 31, 2021, we had approximately 4,200 manufacturing-related employees.
Backlog
We generally schedule production of our products based upon our customers’ delivery requirements. Our leadLead times for many of our products are very short, as a large portion of our orders are received and shipped within 90 days. Some of the plating equipment manufactured by MSD has longer lead times of up to 12 months. In many cases, orders may be subject to cancellation or rescheduling by the customer with limited or no penalty. Our backlog at any particular date, therefore, is not necessarily indicative of actual sales which may be generated for any succeeding period. Historically, our backlog levels have fluctuated based upon the ordering patterns of our customers and changes in our manufacturing capacity. Beginning in 2021, semiconductor market customers generally both increased order volumes and extended lead times. We believe recent ordering patterns reflect our customers’ efforts to mitigate the impact of supply chain constraints and provide us with increased visibility to schedule production and secure materials.
Competition
The market for our products is cyclical and highly competitive. Principal competitive factors include:
Productinclude product quality, performance and price;
Historicalprice, historical customer relationships;
Breadthrelationships, breadth of product line;
Easeline, ease of use;
Manufacturinguse, manufacturing capabilities and responsiveness;responsiveness, and
Customer customer service and support.
Although we believe that we compete favorably with respect to these factors, we can make no assurances that we will continue to do so.
We encounter substantial competition in most of our product lines, although no single competitor competes with us across all product lines. Certain of our competitors have greater financial and other resources than we do. In some cases, competitors are smaller than we are, but are well established in specific product niches.
For example, in VSD, Advanced Energy Industries, Inc. offers products that compete with our power solutions, plasma and reactive gas generatorand photonics products. Hitachi Ltd. and Horiba Ltd. products compete with our mass flow controllers. Inficon, Inc. offers products that compete with our pressure and vacuum measurement and gas analysis products and our vacuum gaugingcontrol solutions products. Hitachi Ltd., Horiba Ltd., Brooks Instrument and VAT, Inc. offer products that compete with our vacuum components. Sigma Koki Co., Ltd. offers products that compete with our optics and photonicsmaterials delivery solutions products. Coherent, Inc. offers products that compete with our lasers and photonics instruments. Qioptiq offers products that compete with our laser and optics products. IPG Photonics, Inc. offers products that compete with our laser products. Jenoptik AG offers products that compete with our laser, optics, and photonics products. PI miCos GmbH offers products that compete with our photonics products. Thorlabs, Inc. offers products that compete with our optics, lasers and photonics products.
9
In PSD, Trumpf Group, Lumentum Holdings Inc., EdgwaveIPG Photonics Corporation, EdgeWave GmbH and Amplitude Systemes SA Wuhan Raycus Fiber Laser Technologies Co., Ltd, Maxphotonics Co. Ltd., Photonics Industries, Advanced Optowave Corporation and Light Conversion UAB offer products that compete with our laser products. Coherent Corp., Excelitas Technologies Corp., Jenoptik AG and Thorlabs, Inc. offer products that compete with our laser and photonics products. Sigma Koki Co., Ltd. and PI miCos GmbH offer products that compete with our photonics products. Our laserlaser-based systems for PCB manufacturing primarily compete with laserlaser-based systems provided by Via Mechanics, Ltd., EO Technics Co., Ltd., LPKF Laser & Electronics AG, and Mitsubishi Electric Corporation, and Han’s Laser Technology Industry GroupCorporation.
In MSD, Element Solutions Inc., DuPont de Nemours, Inc., Uyemura, Dipsol Chemicals Co., Ltd. Our component test, JCU International, Inc. and Okuno Chemical Industries Co., Ltd. offer products primarilythat compete with Humo Laboratory Ltd.,our chemistry products. Schmid Group, Process Automation International Limited and Manz AG offer products that compete with our plating equipment products.
Sources and Availability of Materials, Parts and Components
We use various suppliers and contract manufacturers to supply materials, parts and components for manufacturing and support of our product lines. Although our intention is to establish multiple sources of supply whenever practicable, we have sole or limited source supply arrangements for certain materials, parts and components, such as well as component manufacturers that develop systems for internal use.certain metals and electronic components. Certain of our sole or limited source supply arrangements are the result of “copy exact” requirements of our customers. We may not be able to procure these materials, parts and components from alternate sources at acceptable prices and quality within a reasonable time, or at all. The risk of loss or interruption of this supply could impact our ability to deliver certain products on a timely basis. For additional information about risks related to our supply chain, please refer to our Risk Factors in Part I, Item 1A of this Annual Report.
Patents and Other Intellectual Property Rights
We rely on a combination of patent, copyright, trademark and trade secret laws and license agreements to establish and protect our proprietary rights. As of December 31, 2021,2023, we owned 682690 U.S. patents and 1,6563,121 foreign patents that expire at various dates through 2044.2042. As of December 31, 2021,2023, we had 90169 pending U.S. patent applications. Foreign counterparts of certain U.S. applications have been filed or may be filed at the appropriate time.
We require each of our employees, including our executive officers, to enter into standard agreements pursuant to which the employee agrees to keep confidential all of our proprietary information and to assign to us all inventions while they are employed by us.
Government Regulations
We are subject to various federal, state, local and international laws and regulations relating to the development, manufacture, sale and distribution of our products and services, and it is our policy to comply with the laws in every jurisdiction in which we conduct business. Regulations include, but are not limited to, those related to the environment, corruption, bribery, import and export controls, competition, product safety, workplace health and safety, employment, labor and data privacy. The following describes certain significant regulations that may have a material effect on our capital expenditures, earnings and competitive position. For additional information about risks related to government regulations, please refer to “Risk Factors – Factors–Legal, Tax, Regulatory and Compliance Risks” in Part I, Item 1A of this Annual Report on Form 10-K.
Trade Compliance
We are subject to trade compliance laws in both the United States and other jurisdictions where we operate, including export regulations such as the U.S. Export Administration Regulations, administered by the U.S. Department of Commerce’s Bureau of Industry and Security, and the International Traffic in Arms Regulation, administered by the Department of State’s Directorate of Defense Trade Controls.
Environmental Regulations
We are subject to various, federal, state, local and international laws and regulations relating to theenvironmental protection, of the environment, including those governing discharges of pollutants into the air, water and water,land, the managementreporting, generation, use, handling, storage, transportation, treatment and disposal of hazardous substances, waste and wasteother materials and the cleanup of contaminated sites. These environmental regulations include the European Union Regulation on Registration, Evaluation, Authorisation and Restriction of Chemicals and the Toxic Substances Control Act in the United States.
10
Human Capital
In order to compete and succeed in highly competitive markets and industries that are subject to rapid technological change, we believe it is critical to attract, motivate and retain a dedicated, talented and innovative team of employees. As part of these efforts, we strive to foster a diverse, equitable and inclusive community, invest in continuous learning and development, engage meaningfully with employees, offer a competitive compensation and benefits program and provide a safe and healthy workplace.
As of December 31, 2021,2023, we had a total workforce of approximately 6,40010,200 individuals, excluding contracted employees, across 1937 countries, with 26%33% located in the Asia-Pacific region, 24%33% located in Europe, and the Middle East and 50%India, and 34% located in North America.the Americas. Of our total workforce, approximately 6,00010,000 were employees and approximately 400200 were temporary workers. Of our total workforce, 14%18% work in research and development, 66%56% work in operations, manufacturing, service and quality assurance, and 20%26% work in sales, order administration, marketing, finance, human resources, legal, information technology, general management and other administrative functions.functions.
Diversity, Equity and Inclusion
At MKS, we embrace the strength found in our diversity – a diversity of perspectives, experiences, and thoughts. Our commitment is to diversity,cultivate an inclusive environment where all team members feel valued and empowered to bring their authentic selves to their work. This dedication stems from our belief that diverse viewpoints not only spur innovation but also fuel exceptional performance and sustainable progress. Diversity, equity, and inclusion (“DE&I”) is core todeeply ingrained in our culture. We believe that diversitycultural fabric.
The composition of gender, race, ethnicity, sexual orientation, culture, education, background and experience fuels innovation and results as well as enables our employees to succeed. Our executive team is comprisedreflects this commitment, with women representing 30% and people of 20% female members and 20% racially diverse members. Ourcolor representing 30%. Similarly, our Board of Directors is comprised of 38% female members,women, 25% racially diverse memberspeople of color and 13% LGBTQ+, members, and our Lead Director is a woman. We have been recognizedgarnered recognition for our commitmentefforts to advancing women’s representationadvance gender diversity on the boards of directors of public companies.company boards.
We have taken a number of steps toTo further foster DE&I at MKS:MKS, we have implemented several initiatives:
| • Since 2020, over 320 of our global leaders have completed a six-week DE&I program led by a renowned consulting firm in the field. • Throughout the year, we provide DE&I training for all employees and bias awareness sessions for our global talent acquisition and management teams. • We have bolstered our recruitment and selection procedures by introducing our MKS Hiring Guide & Toolkit, which is designed to attract top talent while mitigating bias. • Consistent with our Corporate Governance Guidelines, we actively seek diverse candidates for our Board of Director nominees. • We routinely conduct comprehensive analyses of pay practices across gender and other diversity dimensions in our major regions of operations to identify and rectify any disparities promptly and effectively. Our recent global compensation analysis, spanning several years, has resulted in equitable pay for our workforce with minimal adjustments. • We offer regional and global initiatives, such as mentoring programs, DE&I-focused book clubs, webinars, and workshops to provide opportunities for our diverse workforce to engage and thrive.
|
|
|
|
|
|
|
|
|
|
Learning and Development
MKS is committedremains steadfast in its dedication to investing infostering learning and professional development. Ourgrowth. We offer our employees have access to a wide rangediverse array of programs, classescourses, and resources to help them excel inaimed at enhancing their careerscareer trajectories and share what they learn with their colleagues.fostering knowledge-sharing among peers. Our performance management process includes performanceframework is designed to provide ongoing, actionable feedback and facilitate dynamic career development discussions that are dynamic and
actionableconversations throughout the year.
In 2021,2023, we broadly rolled out aexpanded our course offerings to develop our focus onencompass areas such as employee engagement, change management, and leadership excellence. Over the last two years,excellence, underscoring our commitment to continuous improvement. Furthermore, many of our leaders alsosuccessfully completed the DE&I course describedas part of this initiative as mentioned above. In addition, we provide
We extend financial assistance for higher education to eligible employees, including support for college and graduate education for U.S. employees and accessstudies. Additionally, we ensure accessibility to online learning for all employeesresources in local languages to help furtherfor all staff, thus bolstering the careers ofprofessional growth opportunities for our entire workforce.workforce.
11
Employee Engagement
MKS is committedremains dedicated to fostering meaningful engagementconnections with its employees. In 2021,2023, MKS conducted its firstthird annual global employee engagement survey, marking a significant milestone as it included Atotech employees for the results of whichfirst time post-acquisition. The survey findings were thoroughly assessedanalyzed and shared with our President and Chief Executive Officer, andthe executive leadership team, as well asand our Board of Directors. We planComprehensive communication of the results was extended to conduct employee engagement surveys on an annual basisall employees, supplemented with executive videos and useboth in-person and virtual focus groups to pinpoint prevailing themes. Leveraging these themes and data points, tailored action items were created to encourage meaningful change.
Additionally, our executive leadership team routinely engages in direct communication with employees worldwide, ensuring alignment with the feedback we receive to examine current practices and drive new initiatives.
Company's strategic goals. Our executive managementleadership team also conducts quarterly callsis committed to continuously enhancing MKS’ workplace environment and steering organizational growth, with employees around the world to ensure they are connected to the progress of the Company. In addition, during the COVID-19 pandemic, we have increased ourannual engagement survey serving as a pivotal component for gathering employee engagement efforts through employee surveys and regular written and video communications.insights.
Compensation and Benefits
MKS is committed to providing total compensation packages that attract, motivate and retain our employees. Additionally, MKS is committed to recognizing and rewarding each employee’semployees’ sustained performance and results. In 2020, we launchedWe run a recognition program for all U.S. employees, which allows peer-to-peer recognition and recognition by managers. We plancontinue to expand ourassess the potential expansion of this recognition program globally in 2022.globally. We also maintain a global flexible work policy that will extend beyond the ongoing COVID-19 pandemic.policy. We are committed to ensuring that our total compensation packages are externally competitive and internally equitable, while supporting our business plans and strategiesstrategies..
As employee turnover is an indicator of employee satisfaction, we monitor turnover globally. MKS has a very stable and committed workforce, as evidenced by low voluntary turnover. Our 12-month rolling average for voluntary turnover at the end of 2021in 2023 was below 7%8%. Our employee average tenure is more than 10nine years.
Health and Safety and Pandemic Response
MKS is committed to providing a safe and healthy workplace for all employees. We accomplish this through strict compliance with applicable laws and regulations regarding workplace safety, including recognition and control of workplace hazards, tracking injury and illness rates, utilizing a global travel health program and maintaining detailed emergency and disaster recoverybusiness continuity plans. We also provide mandatory environmental, health, and safety training to ensure all employees are provided with the education to perform their jobs safely and to protect the environment.
In 2022, we instituted MEHS, a formal Global MKS Management System for Environmental, Health, and Safety, to protect our employees, other stakeholders, and the environment. We continue to implement this strong foundation across our organization in a stepwise process.
In addition, we offer employees and eligible family members a full range of health and wellness programs, as well as many clinical and administrative services.services.
MKS’ top priority during the ongoing COVID-19 pandemic has been and continues to be protecting the health and safety of our employees and their families, our customers and our community. The commitment to this effort is evidenced by the extensive planning and numerous actions MKS swiftly took to respond to the pandemic, including the development and implementation of an infectious disease playbook, a work-from-home program, health check protocols and screenings for all employees working on site, new process workflows at physical sites to ensure reduced contact for employees working on site, contact tracing processes and protocols, quarantining and testing protocols for exposure and positive tests, travel guidelines and protocols to ensure employees who must travel for work can do so safely, and phased return-to-work plans and approval processes to enable non-manufacturing employees to return to work when permitted by local government regulations. MKS continues to maintain workplace flexibility such as working remotely where possible to reduce the number of people who are on site each day.
Additional information regarding MKS’ activities related to its people and sustainability can be found in our CorporateEnvironmental, Social, ResponsibilityGovernance Report, which is accessible through the CorporateEnvironmental, Social Responsibilityand Governance section of our website at https://www.mksinst.com/corporate-social-responsibility.website. Our CorporateEnvironmental, Social, ResponsibilityGovernance Report is updated periodically. This website address is intended to be an inactive textual reference only. None of the information on, or accessible through, MKS’ website is part of this Annual Report on Form 10-K or is incorporated by reference herein.herein.
Item 1A. Risk Factors
|
|
This section describes certain risks we face in our business. Additional risks that we do not yet know of or that we currently believe are immaterial may also impair our business. If any of the events or circumstances described in this section actually occurs, our business, financial condition or operating results could suffer, and the market price of our common stock could decline. In assessing these risks, investors should also refer to the other information contained in or incorporated by reference ininto this report and our other filings with the Securities and Exchange Commission.Commission (“SEC”).
12
Acquisition Risks
Risks RelatedThe Atotech Acquisition involves numerous risks, and we may not be able to Our Pending Acquisition of Atotecheffectively integrate Atotech’s business and operations or realize the expected benefits from the acquisition, which could materially harm our operating results.
We may be unable to complete our pendingThe acquisition of Atotech Limited or Atotech, or otherwise realize the benefits of the acquisition of Atotech, which could have a material adverse effect on us, and we are exposed to significant risks relating to the acquisition of Atotech.
On July 1, 2021, we announced that we had entered into a definitive agreement (as amended, the “Implementation Agreement”(“Atotech”) to acquire Atotech, a leading process chemicals technology companyin August 2022 (the “Atotech Acquisition”). Pursuant significantly increased our size, including with respect to the Implementation Agreement,revenue, product offerings, number of employees and subject to the termsfacilities, and conditions contained therein, at the closinggeographic exposure. Atotech's products and technology, and certain of the acquisition, we will acquire all of the outstanding shares of Atotech for $16.20 in cashits markets and 0.0552 of a share of MKS common stock for each Atotech common share. At the time of the announcement of the acquisition, the total value of the aggregate cash and stock consideration was approximately $5.1 billion. The final value of the consideration will be determined at the time of the closing of the acquisition, which is expected to occur in the first quarter of 2022, subject to satisfaction of certain closing conditions, including receipt of regulatory approval from China and approval from the Royal Court of Jersey. The failure to receive regulatory approval from China or the Royal Court of Jersey, or the failure to satisfy any other closing condition could delay the completion of the acquisition or prevent it from occurring. Any delay in completing the acquisition could cause us to not realize some or all of the benefits that we expect to achieve. Further, even if wecustomer base, are unable to complete the acquisition, we will still have incurred substantial expenses and diverted significant management time and resourcessignificantly different from our ongoing business. There can be no assurance that the remaining closing conditions will be satisfied or waived or that the transaction will be completed.
Until the completion of the acquisition,historical experience. In particular, we will operate independently of Atotech. It is possible that the pendency of the acquisition could result in the loss of key employees, higher than expected costs, diversion of management attention or the disruption of our ongoing businesses, which may adversely affect the combined company’s ability to maintain relationships with customers, vendors and employees or to achieve the anticipated benefits and cost savings of the acquisition.
Our obligations under the Implementation Agreement to acquire Atotech are not subject to any financing condition. In connection with the proposed acquisition, as further described under “Management’s Discussion and Analysis of Financial Condition and Results of Operations—Recent Events” contained in Part II, Item 7 of this Annual Report on Form 10-K, we entered into a debt commitment letter with JPMorgan Chase Bank, N.A. and Barclays Bank PLC (together with certain additional lenders party thereto via joinder, the “Commitment Parties”) to obtain a senior secured term loan credit facility in the aggregate principal amount of $5.3 billion to finance, in part, the acquisition and a $500 million senior secured revolving credit facility, which may be used to finance, in part, the payment of fees and expenses in connection with the acquisition, for working capital and for general corporate purposes. The obligations of the Commitment Parties under the commitment letter are subject to certain conditions. We can provide no assurance that the Commitment Parties will ultimately provide the financing as contemplated by the commitment letter or that the terms of any indebtedness we incur will not be less favorable to us than we expect.
Although we have completed the syndication of the aforementioned senior secured term loan and senior secured revolving credit facilities, the closing and initial funding thereunder is subject to certain customary conditions including, without limitation, the consummation of the acquisition of Atotech in accordance with the Implementation Agreement, the accuracy of our specified representations and warranties and other customary closing conditions.
We have incurred, and we will continue to incur, transaction fees, including legal, regulatory and other costs associated with closing the transaction, as well as expenses related to formulating and implementing integration plans, including facilities and systems consolidation costs and employment-related costs. We may be unable to offset transaction and integration-related costs with the elimination of duplicative costs or the realization of other efficiencies related to the integration of the business.
The success of the Atotech Acquisition, if completed, will depend in part on our ability to realize the anticipated business opportunities and growth prospects from combining our business with that of Atotech. We may never realize these business opportunities and growth prospects. We dodid not have previous experience in the specialty chemistry industry, which Atotech serves. The specialtyAtotech's chemistry industrybusiness is also subject to highly complex environmental regulations, across multiple jurisdictions around the globe, and may expose us to significant additional liabilities for past or future activities. There can
Integrating Atotech's business and operations with ours has been and will continue to be
no assurances we will have success in this industry. In addition, complex, challenging and time-consuming and has required and continues to require significant efforts and expenditures, and we may experience increased competition that limitsnot be able to achieve the integration in an effective, complete, timely or cost-efficient manner.
Other potential risks related to the Atotech Acquisition include our ability to:
Other potential risks related to the Atotech Acquisition include:
For example, as described in Note 13 to maintain relationships with customers, employees or suppliers. the Notes to Consolidated Financial Statements, following triggering events at each of our electronics (“EL”) and general metal finishing (“GMF”) reporting units, which together represent the Atotech business and constitute our Materials Solutions Division (“MSD”), we recorded goodwill and intangible asset impairments at MSD of $1.3 billion during the quarter ended June 30, 2023 and, following an annual impairment analysis of all our reporting units, we recorded goodwill and intangible asset impairments at MSD of $62 million during the quarter ended December 31, 2023. These impairments were in part due to softer industry demand, particularly in the personal computer and smartphone markets, that negatively affected MSD’s revenues and operating results.
If we are unable to successfully or timely integrate the operations of Atotech’sAtotech's business into our business, we may be unable to realize the revenue growth, synergies and other anticipated benefits resulting from the acquisitionAtotech Acquisition and our business could be adversely affected.
Our consolidated indebtedness will increase substantially in connection with the Atotech acquisition, which increased level of indebtedness could adversely affect us, including by decreasing our business flexibility.
In connection with the Atotech Acquisition, we expect to incur up to $5.3 billion of indebtedness, which could have the effect, among other things, of reducing our flexibility to respond to changing business, industry and economic conditions, limiting our ability to obtain financing in the future and increasing interest expense. We will also incur various costs and expenses associated with our indebtedness. The amount of cash required to pay interest on our increased indebtedness levels following completion of the acquisition, and thus the demands on our cash resources, will be greater than the amount of cash flows required to service the levels of indebtedness Additionally, we have incurred priorand will continue to the transaction. Our increased levels of indebtedness following completion of the acquisition could also reduce funds available for working capital, capital expenditures, acquisitions and other general corporate purposes and may create competitive disadvantages relative to other companies with lower debt levels. If we do not achieve the expected benefits and cost savings from the acquisition, or if the financial performance of the combined company does not meet current expectations, then our ability to service our indebtedness may be adversely impacted.
All of the indebtedness to be incurred in connection with the acquisition will bear interest at variable interest rates. If interest rates increase, variable rate debt will create higher debt service requirements, which could adversely affect our cash flows.incur transaction-related costs. Although we plan to hedge a portion of the variable rate indebtedness, any hedges are likely to carry a higher initial interest cost or require the payment of premiums to our counterparties. In addition, our credit ratings affect the cost and availability of future borrowings and, accordingly, our cost of capital. Our ratings reflect each rating organization’s opinion of our financial strength, operating performance and ability to meet our debt obligations. While we have obtained ratings of our indebtedness from nationally recognized statistical rating organizations in connection with the debt financing, there can be no assurance that we will achieve or maintain any particular rating in the future. Moreover, we may be required to raise substantial additional financing to fund working capital, capital expenditures, acquisitions or other general corporate requirements. Our ability to arrange additional financing or refinancing will depend on, among other factors, our financial position and performance, as well as prevailing market conditions and other factors beyond our control. There can be no assurance that we will be able to obtain additional financing or refinancing on terms acceptable to us or at all.
In addition, while we expect that the negative covenantselimination of duplicative costs, as well as the realization of other efficiencies related to the integration of the businesses, should allow us to offset certain transaction and integration-related costs over time, this net benefit may not be
13
achieved in the definitive agreements governingnear term, or at all. Further, we may not realize the expected benefits from the Atotech Acquisition, including the revenues and operating results we anticipate. Any of the foregoing risks could materially harm our indebtedness will not affect our ability to pay quarterly dividends in the future, consistent with past practices, the terms of such definitive agreements will restrict our ability to pay dividends in certain circumstances.
Risks Related to the COVID-19 Pandemic and other Widespread Health Crises
The COVID-19 pandemic has negatively impacted our business, and the pandemic and other widespread health crises may have a materially adverse effect on ourcombined business, financial condition and operating results.
The COVID-19 pandemic has subjected, and the evolution of the COVID-19 pandemic or the emergence of other widespread health crises may continue to subject, our business, financial condition and operating results to a number of risks, including:
|
|
|
|
|
|
|
|
These risks may be heightened in certain geographies, segments and markets, or under certain other circumstances. For example, in the first half of 2020, our research and defense market was negatively impacted by university and research lab closures caused by the COVID-19 pandemic. Since the first quarter of 2021, we have experienced significant constraints due to global supply chain disruptions, including procuring electronic components, which have negatively impacted, and continue to impact, our sales, costs and margins, and our ability to produce timely products to meet customer demand. In addition, since 2021, we believe certain of our semiconductor market customers have increased order volumes to mitigate the impact of supply chain constraints arising from the COVID-19 pandemic, which could lead to a future decrease in order volumes. In the future, we may be more likely to be affected by government mandates in China, where we and our customers and suppliers have a significant presence and where the government has taken strict measures to eliminate the spread of COVID-19. We are more likely to be affected by supply chain disruptions where we rely on sole and limited source suppliers for raw materials, components and subassemblies critical to the manufacturing of our products due to unique component designs, including customers’ “copy exact” requirements, or specialized quality and performance requirements. In addition, the effects of the COVID-19 pandemic and other widespread health crises could exacerbate the other risks described in this Annual Report on Form 10-K.
Risks Related to Operating a Global Business
We face significant risks associated with doing business internationally.
We face significant risks from our substantial operations in and sales to international markets. We maintain operations in more than 15 countries, with significant employee populations and/or facilities in Asia (especially China, Israel and South Korea), Europe (especially France and Germany) and Mexico, and we make sales to customers in approximately 90 countries, with a significant number of customers in Asia (especially China, South Korea, Japan and Taiwan) and Europe (especially Germany). Our presence in international markets, and the risks associated with doing business internationally, may change or increase as our business grows. These risks include:
|
|
|
|
|
|
|
|
|
|
|
|
|
|
|
|
|
|
|
|
|
|
|
|
|
|
|
|
|
|
|
|
|
|
|
|
|
|
|
|
|
|
If we experience any of the risks associated with doing business internationally, our business, financial condition and operating results could be significantly harmed.
We have significant facilities and operations and a considerable number of employees in Israel. A number of our products are manufactured in facilities located in Israel. The Middle East remains a volatile region, and the future of peace efforts between Israel and neighboring countries remains extremely uncertain. Any armed conflicts or significant political instability in the region is likely to negatively affect business conditions and could significantly disrupt our operations in Israel. Further, many of our employees in Israel may be called for active military duty under emergency circumstances. If a military conflict or war arises, our operations in Israel could be disrupted by the absence of one or more key employees or a significant number of other employees. Any such disruptions could adversely affect our business.
The U.S. government continues to take action against certain of our customers, particularly in Asia, including indictments for various criminal charges, and in some cases, restrictions on doing business with these customers (or restrictions on third parties from engaging designated entities), including the suspension of our ability to fill outstanding orders. These actions have caused us, and may in the future cause us, to lose anticipated revenue from product sales, the amount of which could be significant. In addition, these or other customers could elect to purchase products from unaffected non-U.S. competitors, even when trade restrictions are not in place, jeopardizing our long-term relationship with them. Further, compliance with regulatory restrictions may cause us to breach contractual obligations, which could result in costs, penalties and litigation.
Additionally, potential customers in certain countries, particularly in Asia, have a strong preference for technology and products developed by suppliers based in their home countries. The trade dispute between the U.S. government and the Chinese government has reinforced and broadened this preference, as potential and existing customers seek to avoid the uncertainty related to the trade dispute. While we have attempted to mitigate these issues by establishing a significant local presence in many of these countries, companies like us that are based elsewhere remain at a disadvantage.
Unfavorable currency exchange rate fluctuations may lead to lower operating margins or may cause us to change customer pricing, which could result in reduced sales and losses.
Although we report our financial position and operating results in U.S. dollars, a significant portion of our net revenues are from customers in international markets and we have facilities where costs are incurred in currencies other than the U.S. dollar. In addition, we carry certain assets and liabilities in currencies other than the U.S. dollar. Our expected indebtedness for the Atotech Acquisition includes a Euro tranche of EUR 0.5 billion, or approximately $0.6 billion. Currency exchange rate fluctuations could have an adverse effect on our assets, liabilities, net revenues, expenses and operating results and we could experience losses with respect to our hedging activities. Unfavorable exchange rate fluctuations could require us to increase or decrease prices to customers, which could result in lower net revenues from such customers. Alternatively, if we do not adjust the prices for our products in response to unfavorable currency fluctuations, our operating results would be adversely affected by declining net revenues or profit margins for our products. Such exchange rate fluctuations could also increase the costs and expenses of our non-U.S. operations when translated into U.S. dollars or require us to modify our current business practices. In addition, most sales made by our foreign subsidiaries are denominated in the currency of the country in which these products are sold and the currency they receive in payment for such sales could be less valuable on a U.S. dollar basis at the time of
receipt as a result of exchange rate fluctuations. We enter into foreign exchange forward contracts to reduce a portion of our currency exposure arising from intercompany sales of inventory as well as intercompany accounts receivable and intercompany loans. However, we cannot be certain that our efforts will be adequate to protect us from significant exchange rate fluctuations or that such efforts will not expose us to additional exchange rate risks.operations.
Risks Related to Our Industries and Markets
Our business depends significantly on capital spending in the semiconductor and electronics manufacturing industries, which are characterized by periodic fluctuations that may cause a reduction in demand for our products.
Our business depends upon the capital expenditures of semiconductor device manufacturers, which in turn depends upon the demand for semiconductors. Approximately 62%, 59% and 49% of our net revenues for 2021, 2020 and 2019, respectively, were from sales to semiconductor capital equipment manufacturers and semiconductor device manufacturers. We anticipate that sales to these customers will continue to account for a substantial portion of our net revenues. Although our business is not as dependent upon our industrial technologies market, capital expenditures in electronics manufacturing can also have a significant impact on our business, financial condition and operating results. The semiconductor and electronics manufacturing industries have historically experienced cyclical variations in product supply and demand. For example, our sales to semiconductor capital equipment manufacturers and semiconductor device manufacturers sequentially increased 32% in 2021, sequentially increased 49% in 2020 and sequentially decreased 19% in 2019. These sometimes sudden and severe cycles can result from many factors, including overall consumer and industrial spending and demand for electronic products that drive manufacturer production. These cycles can also result from manufacturers’ capacity utilization, timing of new product introductions, demand for customers’ products, inventory levels relative to demand, access to affordable capital, labor conditions, prices of commodities and energy costs. The timing, severity and duration of these cycles are difficult to predict, and we may not be able to respond effectively to these cycles.
During downturns in the semiconductor and electronics manufacturing industries, periods of overcapacity have resulted in rapid and significantly reduced demand for our products, which may result in lower gross margins due to reduced absorption of manufacturing overhead, as our ability to rapidly and effectively reduce our cost structure in response to such downturns is limited by the fixed nature of many of our expenses in the near term. Further, our ability to reduce our long-term expenses is constrained by our need to continue investment in next-generation product technology and to support and service our products. In addition, due to the relatively long manufacturing lead times for some of the products we sell to these industries, we may incur expenditures or purchase raw materials or components for products we are unable to sell. As a result, downturns in these industries may materially harm our business, financial condition and operating results. Conversely, during upturns in these industries, we may have difficulty rapidly and effectively increasing our manufacturing capacity to meet sudden increases in customer demand. If we fail to do so, we may lose business to our competitors and our relationships with our customers may be harmed.
Many of the markets and industries we serve are highly competitive, are subject to rapid technological advancement, and have narrow design windows, and if we fail to introduce new and innovative products or improve our existing products, or if our products or the applications we invest in do not achieve widespread adoption, our business, financial condition and operating results will be harmed.
We operate in highly competitive markets characterized by rapid technological advances, frequent product introductions and enhancements, changing customer requirements, evolving industry standards, substantial capital investment and increasing price pressure. Our success depends upon our ability to continuously develop, market and support superior products, processes and solutions. Factors that could harm our competitive position include:
|
|
|
|
|
|
|
|
|
|
|
|
|
|
|
|
|
|
|
|
|
|
|
|
|
|
|
|
|
Certain of these factors could cause customers to defer or cancel orders for our products and/or place orders for our competitors’ products. This is particularly significant to us, as our success depends on many of our products being designed into new generations of equipment and manufacturing processes. Certain markets in which we operate, such as the semiconductor capital equipment market and the mobile phone market, which is part of our industrial technologies market, experience cyclicality and unevenness in capital spending. If we are unable to introduce new products in a timely manner or are otherwise unsuccessful in making sales to customers, we may miss market upturns or fail to have our products or subsystems designed into our customers’ products. For example, new products designed by capital equipment manufacturers typically have a lifespan of five to fifteen years. We must develop products that are technologically advanced in a timely manner so that they are positioned to be chosen for use in each successive generation of capital equipment.
These factors could also prompt us to agree to pricing concessions or extended payment terms with our customers, in an effort to expand into new markets, gain volume orders or improve customer cost of ownership in highly competitive applications. In other cases, we may discontinue selling certain products if we cannot offset price erosion through shifts in operations.
Finally, these factors could render the portfolios of products or lines of business from which we generate significant net revenues obsolete. If our customers or the industries we serve shift to other technologies, our business, financial condition and operating results would be harmed.
We offer products for multiple markets and must face the challenges of supporting the distinct needs of each of the markets we serve.
We offer products for very diverse markets. Because we operate in multiple markets, we must work constantly to understand the needs, standards and technical requirements of many different applications within these markets, and must devote significant resources to developing different products for these markets. Product development is costly and time consuming. We must anticipate trends in our customers’ industries and develop products before our customers’ products and processes are commercialized. If we do not anticipate our customers’ needs and future activities, we may invest substantial resources in developing products that do not achieve broad market acceptance. Our growth prospects rely in part on successful entry into new segments, which depends on displacing competitors who are more familiar with these markets and better known to customers. In many cases, we are attempting to enter or expand our presence in these new segments with newly introduced products that are not yet proven in the industry. Our decision to continue to offer products to a given market or to penetrate new markets is based in part on our judgment of the size, growth rate, profitability and other factors that contribute to the attractiveness of a particular market. If our product offerings in any particular market are not competitive, our analyses of a market are incorrect or our sales and marketing approach for a market is ineffective, we may not achieve anticipated growth rates in this market, and our business, financial condition and operating results would be harmed.
Further, serving diverse markets requires an understanding of different sales cycles and customer types, and the development and maintenance of a complex global sales team and sales channels to support the markets’ differing needs. It also requires dynamic operations that can support both complex, customized product builds as well as quick turn-around for commercial off-the-shelf sales. If we fail to provide sales and operational support for our diverse markets, our business, financial condition and operating results would be harmed.
Risks Related to Our Operations
Supply chain disruptions or other manufacturing interruptions or delays could affect our ability to meet customer demand and lead to higher costs, while the failure to estimate customer demand accurately could result in excess or obsolete inventory.
Our business depends on the timely supply of products and services that meet the rapidly changing technical and volume requirements of our customers, which depends in part on the timely delivery of parts, components and subassemblies from suppliers, including contract manufacturers. For example, since the first quarter of 2021, we have experienced significant constraints due to global supply chain disruptions, including procuring electronic components, which have negatively impacted, and continue to impact, our sales, costs and margins, and our ability to produce timely products to meet customer demand. Cyclical industry conditions and volatility of demand for manufacturing equipment increase capital, technical, operational and other risks for us and for companies throughout our supply chain. We may also experience significant disruptions in our supply chain, interruptions of our manufacturing operations, delays in our ability to deliver products or services, increased costs or customer order cancellations as a result of:
|
|
|
|
|
|
|
|
|
|
In addition, if we need to rapidly increase our business and manufacturing capacity to meet increases in demand or expedited shipment schedules, this may exacerbate any interruptions in our manufacturing operations and supply chain and the associated effect on our working capital. Moreover, if actual demand for our products is different than expected, we may purchase more/fewer parts than necessary or incur costs for canceling, postponing or expediting delivery of parts. If we purchase inventory in anticipation of customer demand that does not materialize, or if our customers reduce or delay orders, we may incur excess inventory charges. Any of these factors could materially and adversely affect our business, financial condition and operating results.
Our dependence on sole and limited source suppliers and international suppliers could affect our ability to manufacture products and systems.
We rely on sole and limited source suppliers and international suppliers for some of our components and subassemblies that are critical to manufacturing our products and/or our testing and operations processes due to unique component designs as well as specialized quality and performance requirements. This reliance involves several risks, including:
|
|
|
|
|
|
|
|
|
|
|
|
|
|
|
|
We may not be able to obtain and qualify alternative sources of these components on favorable terms, on a timely basis, or at all, because there are a limited number of suppliers. The use of alternative sources could also require us to redesign our products, resulting in increased costs, likely shipping delays and the potential need to requalify products with customers, particularly those who have “copy exact” requirements. Any inability to redesign our products could result in further costs and shipping delays. Increased costs would decrease our profit margins if we could not pass the costs to our customers. Further, shipping delays could damage our relationships with customers and have a material adverse effect on our business and operating results.
Our failure to successfully manage the transition of certain of our products to other manufacturing locations and/or to contract manufacturers would likely harm our business, financial condition and operating results.
As part of our continuous cost-reduction efforts, we continue to relocate the manufacture of certain of our existing product lines and subassemblies to, and initiate the manufacture of certain new products in, our facilities in China, Israel, Romania and Singapore, as well as to our significant subcontracted operations in Mexico and selected contract manufacturers in Asia. In the future, we may expand the level of manufacturing, administrative and certain other operations that we move to other global locations to take advantage of cost efficiencies available to us in those locations. However, we may not achieve the significant cost savings or other benefits that we anticipate from moving manufacturing and other operations, and costs may increase as development and manufacturing expertise increase and labor, material, shipping and facility-related costs rise, as we have seen in our manufacturing locations in China. If these costs increase to the extent that we no longer realize suitable gross margins from our products manufactured in these countries, we may need to relocate the manufacture of these products to other lower-cost regions. Additionally, if we are unable to successfully manage the relocation, initiation or oversight of the manufacture of these products, our business, financial condition and operating results would be harmed.
In particular, transferring product lines to other manufacturing locations and/or to our contract manufacturers’ facilities often requires us to transplant complex manufacturing equipment and processes across a large geographical distance and to train a completely new workforce concerning the use of this equipment and these processes. In addition, certain of our customers may require the requalification of products supplied to them in connection with the relocation of manufacturing operations. If we are unable to manage these transfers and training smoothly and comprehensively, or if we are unable to requalify products in a timely manner, we could suffer manufacturing and supply chain delays, excessive product defects, harm to our operating results and our reputation with our customers, and loss of customers. Further, the utilization of overseas manufacturing locations and contract manufacturers may require additional customs tariffs or may require export licenses, which may be difficult or costly to obtain.
Additionally, qualifying contract manufacturers and commencing volume production is expensive and time-consuming, and there is no guarantee we will continue to do so successfully. Further, our reliance on contract manufacturers reduces our control over the assembly process, quality assurance, production costs and material and component supply for our products. If we fail to manage our relationships with our contract manufacturers, or if any of our contract manufacturers experience financial difficulty, or delays, disruptions, capacity constraints or quality control problems in their operations, our ability to ship products to our customers could be impaired and our competitive position and reputation could be harmed. Further, if we or our contract manufacturers are unable to negotiate with suppliers for reduced material or component costs, our operating results could be harmed.
In addition, our contract manufacturers may terminate our agreements with them upon prior notice to us or immediately for reasons such as if we become insolvent, or if we fail to perform a material obligation under the agreements. If we are required to change contract manufacturers or assume internal manufacturing operations for any reason, including the termination of one of our contract manufacturing contracts, we will likely suffer manufacturing and shipping delays, lost sales, increased costs and damage to our customer relationships, any of which would harm our business, financial condition and operating results.
Our products could contain defects, which would increase our costs and seriously harm our business, financial condition, operating results and customer relationships.
Many of our products are inherently complex in design and, in some cases, require extensive customization and/or ongoing regular maintenance. Further, the manufacture of these products often involves a highly complex and precise process and the utilization of specially qualified components that conform to stringent specifications. Many of our products also require highly skilled labor. As a result of the technical complexity of these products, design defects, skilled labor turnover, changes in our or our suppliers’ manufacturing processes or the inadvertent use of defective or nonconforming materials by us or our suppliers could adversely affect our manufacturing yields and product reliability. This could in turn harm our business, operating results, financial condition and customer relationships.
We provide warranties for our products, and we accrue allowances for estimated warranty costs at the time we recognize revenue for the sale of the products. The determination of such allowances requires us to make estimates of product return rates and expected costs to repair or replace the products under warranty. We establish warranty reserves based on historical warranty costs for our products. If actual return rates or repair and replacement costs differ significantly from our estimates, our operating results would be negatively impacted.
Our customers may discover defects in our products after the products have been fully deployed and operated under peak stress conditions. In addition, some of our products are combined with products from other suppliers, which may contain defects. Further, some of our customers use our products in ways other than their intended purpose. As a result, should problems occur, it may be difficult to identify the source of the problem. If we are unable to promptly identify and fix defects or other problems, we could experience, among other things:
|
|
|
|
|
|
|
|
|
|
|
|
|
|
The occurrence of any of these factors could seriously harm our business, financial condition and operating results.
We outsource a number of services to third-party service providers, which decreases our control over the performance of these functions. Disruptions or delays at our third-party service providers could adversely impact our operations.
We outsource a number of services, including certain information technology systems management, logistics functions, contract manufacturing and accounting functions, to third-party service providers. While outsourcing arrangements may lower our cost of operations, they also reduce our direct control over the services rendered. This diminished control may have an adverse effect on the quality or quantity of services rendered, on our ability to quickly respond to changing market conditions, or on our ability to ensure compliance with all applicable domestic and foreign laws and regulations. If we do not effectively develop and manage our outsourcing strategies, if required export and other governmental approvals are not timely obtained, if our third-party service providers do not perform as anticipated, or do not adequately protect our data from cyber-related security breaches, or if there are delays or difficulties in enhancing business processes, we may experience operational difficulties (such as limitations on our ability to pay suppliers in a timely manner), increased costs, manufacturing or service interruptions or delays, loss of intellectual property rights or other sensitive data, quality and compliance issues, and challenges in managing our product inventory or recording and reporting financial and management information, any of which could materially and adversely affect our business, financial condition and operating results.
The loss of net revenues from any one of our major customers would likely have a material adverse effect on us.
Our top ten customers accounted for approximately 47%, 44% and 33% of our net revenues for 2021, 2020 and 2019, respectively. Our top two customers, Lam Research Corporation and Applied Materials, Inc., together accounted for approximately 27%, 24% and 18% of net revenues for the years 2021, 2020 and 2019, respectively. In any one reporting period, a single customer or several customers may contribute even a larger percentage of our consolidated net revenues. Further, our Equipment & Solutions Division also depends on a few significant customers for a large portion of its revenue in any given quarter. The loss of a major customer or any significant reduction in orders by these customers, including reductions due to market or competitive conditions, would likely have a material adverse effect on our business, financial condition and operating results. None of our significant customers has entered into an agreement with us requiring it to purchase any minimum quantity of our products.
Attempts to lessen the adverse effect of any loss or reduction of net revenues through the rapid addition of new customers would be difficult because a relatively small number of companies dominate the semiconductor and electronics manufacturing industries. Further, prospective customers typically require lengthy qualification periods prior to placing volume orders with a new supplier. Our future success will continue to depend upon:
|
|
|
|
|
|
|
|
|
|
Key personnel may be difficult to attract and retain.
Our ability to maintain and grow our business is directly related to the service of our employees in each area of our business, as we consider talent to be a significant asset. Our performance is directly tied to our ability to hire, train, motivate and retain qualified personnel, including highly skilled technical, financial, managerial, and sales and marketing personnel. There is significant competition for personnel in the technology marketplace, particularly in certain geographies where we are located, including the Boston area, the Orange County, California area, the San Francisco Bay area, China, Germany and Singapore. Also, as a result of the COVID-19 pandemic, employees in our industries are increasingly able to work remotely, which could increase employee mobility and turnover, making it more difficult for us to attract and retain employees. In addition, many of our product manufacturing processes and product service require deep technical expertise, and it can be particularly challenging to identify and attract candidates and retain employees possessing such expertise. We have experienced and may continue to experience attrition in certain key positions. A related challenge is that a significant portion of our technical talent is nearing retirement age, and we may have difficulty attracting a sufficient number of employees with the necessary skills to replace them. If we are unable to hire sufficient numbers of qualified employees or retain and motivate existing employees, our business and operating results would be harmed.
Acquisition Risks
As part of our business strategy, we have entered into and may continue to pursue business combinations and acquisitions that may be difficult to identify and complete, challenging and costly to integrate, disruptive to our business and our management, and/or dilutive to stockholder value.
As a part of our business strategy, we have entered into and continue to pursue business combinations and acquisitions. In particular, the acquisitions of Newport Corporation (“Newport”) in April 2016 and Electro Scientific Industries, Inc. (“ESI”) in February 2019 significantly increased our size, including with respect to net revenues, product offerings, and/or number of employees and facilities. Our ability to successfully identify suitable acquisition targets, complete acquisitions on acceptable terms, and efficiently, effectively and effectivelyprofitably integrate and operate our acquired businesses is critical to our growth. We may not be able to identify target companies that meet our strategic objectives or successfully negotiate and complete acquisitions with companies we have identified on acceptable terms. Further, we may incur significant expense in pursuing acquisitions that cannot be completed, or are significantly delayed, due to regulatory or other restrictions. Additionally, our credit facilities only permit us to make acquisitions under certain circumstances, and also restrict our ability to incur additional indebtedness in certain circumstances. WeAs a result, our ability to pursue our acquisition strategy may be hindered by our indebtedness. Moreover, we may not realize the benefits we anticipate from these acquisitions, including our pending acquisition of Atotech, because of significant challenges, such asas::
| • The difficulty, distraction, resource requirements, cost and disruption of integrating the operations, technology and personnel of the acquired companies; • The potential disruption of our ongoing business and distraction of management; • Possible internal control or other compliance weaknesses of the acquired companies; • Significant expenses related to the acquisitions, including any resulting shareholder litigation; • The assumption of unknown or contingent liabilities associated with acquired businesses; • The potential to incur or record significant cash or non-cash charges or write down the carrying value of intangible assets and goodwill obtained in the acquisitions, which could adversely impact our cash flow or lower our earnings in the period or periods for which we incur such charges or write down such assets; • Potentially incompatible cultural differences between us and the companies we acquire; • Incorporating the acquired companies' technology and products into our current and future product lines, and successfully generating market demand for these expanded product lines; • Potential additional geographic dispersion of operations; • The difficulty in achieving anticipated synergies and efficiencies; • The difficulty in leveraging the acquired companies' and our combined technologies and capabilities across our product lines and customer base; • Burdensome requirements or conditions imposed by government regulators in connection with their review of acquisitions, including divestitures and restrictions on the conduct of our business or the business of the acquired companies; and • Our ability to retain key customers, suppliers and employees of the acquired companies.
|
|
|
|
|
|
|
|
|
|
|
|
|
|
|
|
|
|
|
|
|
|
|
|
|
|
|
|
We may also face competitive disadvantages by selling products that are new to us and/or selling products in markets and geographies that are new to us. In addition, if we are not successful in completing acquisitions or integrating acquired
businesses, we may be requiredneed to re-evaluate our growth strategy. We may incur substantial expenses and devote significant management time and resources to complete acquisitions that may not generate the financial results we planned to achieve.achieve. We may also choose to close or divest certain sectors or divisions of acquired companies, which would reduce our overall revenue and could require us to record losses and/or spend cash relating to such closures or divestitures.
In particular, weWe continue to experience some significant risks associated with the acquisition of ESI (theElectro Scientific Industries, Inc. (“ESI” and such transaction, the “ESI Merger”), includingwhich we completed in 2019. These risks include our ability to retain key personnel and to realize the anticipated growth in net revenues from the acquired business, as well as the potential to incur or record significant cash or non-cash charges or write down the carrying value of intangible assets and goodwill obtained in the ESI Merger, which could adversely impact our cash flow or lower our earnings in the period or periods for which we incur such charges or write down such assets. For example, as described in Note 13 to the Notes to Consolidated Financial Statements, following a triggering event at the Equipment Solutions Business (“ESB”) reporting unit, which represents the ESI business and is a part of our Photonics Solutions
14
Division (“PSD”), we recorded goodwill and intangible asset impairments at our ESB reporting unit of $524 million during the quarter ended June 30, 2023, and following an annual impairment analysis at all our reporting units, we recorded goodwill impairment of $13 million at our ESB reporting unit during the quarter ended December 31, 2023.
In addition, we could use substantial portions of our available cash for all or a portion of the purchase price of future acquisitions. We could also issue additional securities as consideration for or to finance these acquisitions, which could cause significant stockholder dilution, or obtain additional debt financing, which would increase our costs, reduce our future cash flow and subject us to covenants and other restrictions that may impede our ability to manage our operations, without achieving the desired accretion to our business.
As a result of our previous acquisitions, we presently have several different decentralized operating and accounting systems. We will need to continue to modify our accounting policies, internal controls, procedures and compliance programs to provide consistency across all of our operations. In order to increase efficiency and operating effectiveness and improve corporate visibility into our decentralized operations, we continue to review opportunities to integrate Enterprise Resource Planningenterprise resource planning systems where practical. Any future implementations may risk potential disruption of our operations during the conversion periods and the implementations could require significantly more management time and higher implementation costs than currently estimated.
Financial Risks
Our consolidated indebtedness has increased substantially as a result of the Atotech Acquisition. This increased level of indebtedness could adversely affect us, including by increasing our interest expense and decreasing our business flexibility.
As of December 31, 2023, we had approximately $5.0 billion of principal indebtedness outstanding under a senior secured term loan facility (the “Term Loan Facility”) comprised of three tranches: a $744 million loan (the “USD Tranche A”), a $3.6 billion loan (the “USD Tranche B”) and a €593 million loan (the “Euro Tranche B”). As of December 31, 2023, we also had $500 million of available borrowing capacity under a senior secured revolving credit facility (the “Revolving Facility” and together with the Term Loan Facility, the “Credit Facilities”). On January 22, 2024, we (i) increased our USD Tranche B by an aggregate principal amount of $490 million, (ii) increased our Euro Tranche B by an aggregate principal amount of €250 million and (iii) used a portion of the proceeds of such increases to prepay our USD Tranche A in full (the “USD Tranche A Refinancing”). On February 13, 2024, we increased the available borrowing capacity under our Revolving Facility by $175 million (the “Revolving Facility Increase”). As a result of the USD Tranche A Refinancing, as of January 22, 2024, we had approximately $5.0 billion of principal indebtedness under our Term Loan Facility comprised of a $4.1 billion USD Tranche B and a €843 million Euro Tranche B. As a result of the Revolving Facility Increase, as of February 13, 2024, we had $675 million of available borrowing capacity under our Revolving Facility. This level of indebtedness could have the effect, among other things, of reducing our flexibility to respond to changing business, industry and economic conditions, limiting our ability to obtain financing in the future and increasing interest expense.
We also have incurred and will continue to incur various costs and expenses associated with our indebtedness. The amount of cash required to pay interest on our increased indebtedness levels following completion of the Atotech Acquisition, and the demands on our cash resources that come from that debt, are significantly greater than the amount of cash flows required to service the levels of indebtedness we incurred prior to the Atotech Acquisition. Our increased levels of indebtedness following completion of the Atotech Acquisition could also reduce funds available for working capital, capital expenditures, acquisitions and other general corporate purposes and may create competitive disadvantages relative to other companies with lower debt levels. If we do not achieve the expected benefits and cost savings from the Atotech Acquisition, or if the financial performance of the combined company does not meet current expectations, then our ability to service our indebtedness may be adversely impacted.
Despite our current level of indebtedness, we and our subsidiaries may still be able to incur more indebtedness. Although our debt agreements contain restrictions on the incurrence of additional indebtedness, these restrictions are subject to certain qualifications and exceptions, and thus, additional indebtedness may be incurred in compliance with these restrictions. This could further exacerbate the risks we describe.
Moreover, we may be required to raise substantial additional financing to fund working capital, capital expenditures, acquisitions or other general corporate requirements. Our ability to arrange additional financing or refinancing will depend on, among other factors, our financial position and performance, as well as prevailing market conditions and other factors beyond our control. There can be no assurance that we will be able to obtain additional financing or refinancing on terms acceptable to us or at all.
15
The terms of our Term Loan Facility and ABLRevolving Facility impose significant financial obligations and risks upon us, limit our ability to take certain actions, and could discourage a change in control.
TheAs of December 31, 2023, the total outstanding principal balance of our Term Loan Facility,USD Tranche A was $744 million, the total principal balance of our USD Tranche B was $3.6 billion and the total principal balance of our Euro Tranche B was €593 million. As a result of the USD Tranche A Refinancing, as definedof January 22, 2024, no principal was outstanding under the USD Tranche A, the total principal balance of our USD Tranche B was $4.1 billion and as described further in Item 7the total principal balance of this Annual Report on Form 10-K, atour Euro Tranche B was €843 million. As of December 31, 2021 was $824 million. Our ABL2023, our Revolving Facility as defined and as described further in Item 7 of this Annual Report on Form 10-K, providesprovided us with a senior secured asset-based revolving credit facility of up to $100 million, subject$500 million. As a result of the Revolving Facility Increase, as of February 13, 2024, our Revolving Facility provided us with a senior secured revolving credit facility of up to a borrowing base limitation.$675 million. We have not borrowed against our ABLRevolving Facility to date.as of February 13, 2024.
A significant portion of the amountAll amounts outstanding under the Term Loan Facility bearsand the Revolving Facility bear interest at a variable interest rate. Although we hedge some of the variable interest rate exposure, ifas interest rates increase,have increased, debt service requirements on our variable rate debt have increased. Further interest rate increases, if they occur and we do not hedge such variable rates, will create higher debt service requirements, which would adversely affect our cash flows. In addition, changes in our credit ratings could affect the cost and availability of future borrowings and, accordingly, our cost of capital. OurThe ratings of our indebtedness reflect each nationally recognized statistical rating organization’s opinion of our financial strength, operating performance and ability to meet our debt obligations. We cannot make any assurances that we will achieve or maintain a particular rating in the future. Moreover, we may be required to raise substantial additional financing to fund working capital, capital expenditures, acquisitions or other general corporate requirements. Our ability to obtain additional financing or refinancing will depend on, among other factors, our financial position and performance, as well as prevailing market conditions and other factors beyond our control. We cannot make any assurances that we will be able to obtain additional financing or refinancing on terms acceptable to us or at all.
Our Term Loan Facility and ABLRevolving Facility contain several negative covenants that, among other things and subject to certain exceptions, restrict our ability and/or our subsidiaries’ ability to:
|
|
|
|
|
|
|
|
|
|
|
|
|
|
|
|
• | Engage in sale-leaseback transactions. |
In addition, our Revolving Facility requires that we meet a financial covenant based on a consolidated leverage ratio test in certain circumstances. Under our Revolving Facility, whenever the aggregate amount of loans outstanding under the Revolving Facility (net of (a) all letters of credit (whether cash collateralized or not) and (b) unrestricted cash of us and our restricted subsidiaries) exceeds 35% of the aggregate commitments under the Revolving Facility, our first lien net leverage ratio cannot exceed 6.00 to 1.00.
Our ability to comply with these provisions may be affected by events beyond our control, including prevailing economic, financial and industry conditions. These restrictions on our ability to engage in or benefit from these actions may also limit our flexibility in planning for, or reacting to, changes in and opportunities for our business, such as limiting our ability to engage in mergers and acquisitions. This could place us at a competitive disadvantage. If the matters described in our other risk factors result in a material adverse effect on our business, financial condition or operating results, we may be unable to comply with the terms of our credit facilities or experience an event of default.
Our Term Loan Facility and ABLRevolving Facility contain customary events of default, including:
| • Failure to make required payments; • Failure to comply with certain agreements or covenants; • Materially breaching any representation or warranty; • Failure to pay, or cause acceleration of, certain other indebtedness; • Certain events of bankruptcy and insolvency; • Failure to pay certain judgments; and 16 • A change in control of us.
|
|
|
|
|
|
|
|
|
|
|
|
|
|
The amount of cash available to us for repayment of amounts owed under these credit facilities will depend on our usage of our existing cash balances and our operating performance and ability to generate cash flowflows from operations, which will be subject to financial, business and other factors affecting our operations, many of which are beyond our control. We cannot provide any assurances that we will generate sufficient cash flowflows from operations to service our debt obligations. Any failure to repay these obligations as they become due would result in an event of default under the credit facilities.
If an event of default occurs, the lenders may end their obligation to make loans to us under the credit facilities and may declare any outstanding indebtedness under these credit facilities immediately due and payable. In such case, we would need to obtain additional financing or significantly deplete our available cash, or both, to repay this indebtedness. Any additional financing may not be available on reasonable terms or at all, and significant depletion of our available cash would harm our ability to fund our operations or execute our broader corporate objectives. If we were unable to repay outstanding indebtedness following an event of default, then in addition to other available rights and remedies, the lenders could initiate foreclosure proceedings on substantially all of our assets. Any such foreclosure proceedings or other rights and remedies successfully implemented by the lenders in an event of default would have a material adverse effect on our business, financial condition and operating results.
Further, because a change in control of us constitutes an event of default under these credit facilities, this may be a deterrent to some potential acquirers, as it would likely require an acquirer to repay any outstanding borrowings under these credit facilities.
In addition, each of our Term Loan Facility and ABL Facility, each as amended, uses London Interbank Offered Rate (“LIBOR”) as a reference rate, such that the interest due pursuant to such loans may be calculated using LIBOR (subject to a stated minimum value). On July 27, 2017, the United Kingdom’s Financial Conduct Authority, which regulates LIBOR, announced that it desired to phase out LIBOR by the end of 2021. On November 30, 2020, the ICE Benchmark Administration Limited, which administers LIBOR, announced that it planned to consult on ceasing publication of LIBOR on December 31, 2021 for the one week and two month LIBOR tenors (for which publication has now ceased), and on June 30, 2023 for all other LIBOR tenors, including the LIBOR tenor that we use. In light of these announcements, the future of LIBOR at this time is uncertain and any changes in the methods by which LIBOR is determined or regulatory activity related to LIBOR’s phaseout could cause LIBOR to perform differently than in the past or cease to exist. The Alternative Reference Rates Committee selected the Secured Overnight Financing Rate (“SOFR”), a new index calculated by reference to short-term repurchase agreements backed by Treasury securities as determined by the Federal Reserve System, as its preferred replacement for U.S. dollar LIBOR. Prior to the phase-out of LIBOR, we expect to reach agreement with our lenders on an amendment to our Term Loan Facility and ABL Facility to use SOFR in lieu of LIBOR. We do not expect a significant change to the effective interest rate on our borrowing as a result of any replacement reference rate. Whether SOFR attains market acceptance as a LIBOR replacement tool is uncertain. In the event we are unable to reach agreement on a replacement reference rate, the term loans outstanding under our Term Loan Facility and any revolving loans borrowed under our ABL Facility from time to time using LIBOR as a reference rate will convert to the base rate, which could result in higher interest rates on these term loans and any such revolving loans.
A material amount of our assets represents goodwill and intangible assets. We incurred a net loss as a result of impairments of these assets in 2023 and our net income wouldmay be significantly reduced if our goodwill or intangible assets become impaired.in subsequent periods by future impairments of these assets.
As of December 31, 2021,2023, our goodwill and intangible assets, net, represented approximately $1.8$5.2 billion, or 40%57% of our total assets. Goodwill is generated inas a result of our acquisitions when the cost of an acquisition exceeds the fair value of the net tangible and identifiable intangible assets we acquire. For example, as a result of the ESI Merger,Atotech Acquisition, we added approximately $474 million ofsignificant additional goodwill and intangible assets because the cost of the Atotech Acquisition significantly exceeded the fair value of Atotech’s net tangible and identifiable intangible assets. Intangible assets relate primarily to the developed technologies, customer relationships, trade names and trademarks acquired by us as part of our acquisitions of other companies. Goodwill and indefinite-lived intangible assets are subject to an impairment analysis at least annually based on the fair value of the reporting unit. Intangibleunit in which the respective goodwill and intangible assets relate primarily to the developed technologies, customer relationshipsare recorded. In addition, intangible assets and patents and trademarks acquired by us as part of our acquisitions of other companies andgoodwill are subject to an impairment analysis whenever events or changes in circumstances exist that indicate that the carrying value of the intangible asset might not be recoverable. As described in Note 13 to the Notes to Consolidated Financial Statements, following triggering events at each of our EL and GMF reporting units, which together constitute MSD, and the ESB reporting unit of PSD, we recorded goodwill and intangible asset impairments of $1.8 billion during the quarter ended June 30, 2023 and, following an annual impairment analysis of all our reporting units, we recorded goodwill and intangible asset impairments of $75 million during the quarter ended December 31, 2023. We will continue to monitor and evaluate the carrying value of goodwill and intangible assets. If market and economic conditions or business performance deteriorate, the likelihood that we would record ananother impairment charge would increase, whichincrease. Any impairment charge could materially and adversely affect our financial condition and operating results,. including by significantly reducing our net income in future periods.
Risks Related to Cybersecurity, Data Privacy and Intellectual Property Protection
We are exposed to risks related to cybersecurity and data privacy threats and incidents, such as the ransomware event we identified in February 2023, and we are subject to restrictions and changes in laws and regulations governing data privacy and data protection, any of which could have a material adverse effect on our business.
We rely on various IT networks and systems, some of which are managed by third parties, to process, transmit and store electronic information and to carry out and support a variety of business activities, including, among others, finance and accounting, order management, human resources, communications, manufacturing, research and development, intellectual property, supply chain management, sales and IT, including critical functions such as internet connectivity, network communications, and email. Many of these activities are processed via Software-as-a-Service (“SaaS”) products provided by third parties and hosted on their own networks and servers or on third-party networks and servers. The data on such IT networks and systems includes confidential information, personally identifiable information, transactional information and intellectual property belonging to us and our employees, customers, suppliers and other business partners.
We and our third-party administrators, vendors and partners are subject to ongoing cybersecurity threats, including ransomware and other malware, hacking, phishing, smishing, denial of service attacks, employee errors or malfeasance, telecommunication failures, system failures, natural disasters and other attacks and events. We cannot guarantee that these threats
17
will not have an adverse impact on our business, financial condition or results of operations. For example, as further described in “Management’s Discussion and Analysis of Financial Condition and Results of Operations—Ransomware Event” in Part II, Item 7 of this Annual Report on Form 10-K, in February 2023, we identified that we had become subject to a ransomware event. Based on our investigation, we concluded ransomware actors encrypted certain of our systems by deploying malware. This incident required us to temporarily suspend operations at certain of our facilities and had a material impact during the three months ended March 31, 2023 on our ability to process orders, ship products and provide service to our Vacuum Solutions Division (“VSD”) and PSD customers. For the year ended December 31, 2023, we incurred net costs related to the incident of approximately $15 million. We expect to continue to incur these and other costs related to the incident in the future. In addition, as a result of the incident, we were previously subject to two lawsuits, and we may be subject to future litigation, investigations, claims or actions, in addition to fines, penalties, or other obligations related to impacted data, whether or not such data is misused.
We face the challenge of supporting our older IT systems and implementing necessary upgrades. Further, as we transition to using more cloud-based solutions that are dependent on the internet or other networks to operate, we expose ourselves to additional or different cybersecurity and other data security threats, whether directly or through our third-party administrators, vendors and partners. As cybersecurity threats rapidly evolve and become increasingly difficult to detect and defend against, our current security controls and measures may not be effective in detecting vulnerabilities or preventing cybersecurity incidents. These risks may be further amplified by the increased reliance on remote access to IT systems as a result of the use of SaaS software, cloud and remote services, and employees working remotely. Additionally, we may need to update security protocols for, transition to or from, or integrate various information management systems as a result of mergers, acquisitions and divestitures. The systems that we acquire or that are used by acquired entities or businesses may pose security risks of which we are unaware or unable to mitigate, particularly during the transition of these systems.
The evolving regulatory landscape for data privacy presents a number of legal and operational challenges, and our efforts to comply with relevant regulations may be unsuccessful. For example, regulations in the European Union (the “EU”) and China prohibit the transfer of personally identifiable information from their respective countries to other countries whose laws do not adequately protect personal data. While we have utilized certain permitted approaches for transferring personally identifiable information from these countries, these approaches may be invalidated by courts or regulatory bodies and we may be required to ascertain an alternative legal basis for such transfers. Additionally, based on our investigation of the ransomware event we identified in February 2023, we became aware on February 13, 2023 that the ransomware actors may have exfiltrated personal information from our systems. We provided notifications to individuals and to regulators in accordance with applicable laws, and we may be required to provide additional notifications in the future. See “—We are exposed to various risks related to legal proceedings, including, for example, product liability claims, intellectual property infringement claims, regulatory claims, contractual claims and class action litigation, which if successful, could have a material adverse effect on our commercial relationships, business, financial condition and operating results” below for more information regarding legal risks associated with privacy-related matters.
A failure to comply with the evolving regulatory landscape, or a breach of our operational or security systems or infrastructure, or those of our customers, suppliers and other business partners, could disrupt our business, including business operations and manufacturing processes; result in the disclosure, misuse, corruption or loss of confidential or other valuable business information, including intellectual property, personally identifiable information and other critical data of ours and our employees, customers, suppliers and other business partners; result in competitive disadvantages to the extent the information is competitively sensitive; damage our reputation; negatively affect our relationships with our employees, customers, suppliers and other business partners, including loss of confidence, which could lead to loss of or reduction in orders; divert the attention of management; cause losses; result in litigation, investigations or liability under contracts; require notifications to regulatory authorities and impacted individuals; result in significant penalties and/or fines from regulatory bodies, including pursuant to privacy laws and export control laws; add to the complexity of our compliance obligations; increase our cybersecurity protection costs; and result in the incurrence of remediation costs. These adverse effects would likely be amplified in the event a breach of operational or security systems remains undetected for an extended period of time.
The costs of compliance with, and other burdens imposed by, privacy, cybersecurity, data protection and data localization laws, regulations and policies, including restrictions on marketing activities, could have a material adverse effect on our business, financial condition and operating results. For example, as a result of the ransomware event described above, we have incurred costs, and we expect to continue to incur costs, which may be significant, in connection with efforts to investigate the incident, assess the impact of the incident, recover our systems, enhance our data security and protect against unauthorized access to, or manipulation of, our systems and data. Despite incurring these costs, we may not have identified and may not be able to remediate all of the potential causes of the incident, and similar incidents may occur in the future. Further, customers and third-party providers increasingly demand rigorous contractual provisions regarding privacy, cybersecurity, data protection, confidentiality, and intellectual property, which may also increase our overall compliance burden and potential liability.
Although we maintain insurance related to cybersecurity risks, these costs, expenses, liability and other matters may not be adequately covered by insurance and may result in an increase in our costs for insurance or insurance not being available to us on
18
economically feasible terms, or at all. Insurers may also deny us coverage as to any future claim. Any of these results could harm our business, financial condition and reputation.
Our proprietary technology is important to the continued success of our business. Our failure to protect this proprietary technology may significantly impair our competitive position.
Our success and ability to compete depend in large part upon protecting our proprietary technology. We rely on a combination of patent, trademark and trade secret protection and other agreements, such as nondisclosure agreements and other contractual agreements with our employees and third parties, to protect our proprietary rights. The steps we have taken may not be sufficient to prevent the misappropriation of our intellectual property, particularly in countries and regions outside, for example, the United States and Europe, where laws may not protect our proprietary rights as fully. For example, the patent prosecution and enforcement systems within China and India, where we have a significant customer base and manufacturing presence, are less robust than these systems in certain other jurisdictions and, as a result, we may be limited in our ability to enforce our intellectual property rights there. We may also be at a disadvantage in any enforcement proceeding in China and India as a foreign entity seeking protection against a locally headquartered company. Patent and trademark laws and trade secret protection may not adequately deter third-party infringement or misappropriation of our patents, trademarks, trade secrets and similar proprietary rights. In addition, patents issued to us may be challenged, invalidated or circumvented. The loss or expiration of any of our key patents could lead to a significant loss of sales of certain of our products and could materially affect our operating results. We have in the past and may in the future be subject to or may initiate interference proceedings, validity challenges or opposition proceedings in the U.S. Patent and Trademark Office, the European Patent Office, or similar agencies, which can demand significant financial and management resources. The process of seeking patent protection can be time consuming and expensive and patents may not be issued from pending or future applications. Moreover, our existing patents or any new patents that may be issued may not be sufficient in scope or strength to provide meaningful protection or a commercial advantage to us. We may initiate claims, enforcement actions or litigation against third parties for infringement of our proprietary rights in order to determine the scope and validity of our proprietary rights or the proprietary rights of our competitors, which claims could result in costly litigation, the diversion of our technical and management personnel and the assertion of counterclaims by defendants, including counterclaims asserting invalidity of our patents. We will take such actions where we believe that they are of sufficient strategic or economic importance to us to justify the cost.
Risks Related to Our Operations
Supply chain disruptions and other manufacturing interruptions or delays have affected our ability to meet customer demand and have led to higher costs, while the failure to estimate customer demand accurately has resulted in excess or obsolete inventory, all of which has negatively impacted, and we expect will continue to impact, our business.
Our business depends on the timely supply of products and services that meet the rapidly changing technical and volume requirements of our customers, which depends in part on the timely delivery of raw materials, parts, components and subassemblies from our suppliers, including contract manufacturers. For example, from the first quarter of 2021 until the second half of 2023, we experienced significant constraints due to global supply chain disruptions, including procuring electronic components, which negatively impacted our sales, costs and margins, and our ability to timely produce products to meet customer demand. Supply constraints and the potential for shortages caused us to increase safety stock levels, which has increased the amount of inventory we hold. Cyclical industry conditions and volatility of demand for our products increase capital, technical, operational and other risks for us and for companies throughout our supply chain. We have experienced, and we expect to continue to experience, significant disruptions in our supply chain, interruptions of our manufacturing operations, delays in our ability to deliver products or services, increased costs, price volatility, and customer order cancellations, which have been, or may in the future be, as a result of:
19
For example, MSD uses certain raw materials derived from petrochemical based feedstocks, the prices of which have historically been subject to periods of rapid and significant upward and downward movement. We may not be able to pass on price increases in raw materials, or price increases by our suppliers, to our customers due to competitive pricing pressure, and, even when we are able to do so, there may be a delay between price increases in raw materials and our ability to increase the prices of our products.
In addition, if we need to rapidly increase our business and manufacturing capacity to meet increases in demand or expedited shipment schedules, this may exacerbate any interruptions in our manufacturing operations and supply chain and the associated effect on our working capital. Moreover, if actual demand for our products is different than expected, we may purchase more or fewer parts than necessary or incur costs for canceling, postponing or expediting delivery of parts. If we purchase inventory in anticipation of customer demand that does not materialize, or if our customers reduce or delay orders, we may incur excess inventory charges. Any of these factors could materially and adversely affect our business, financial condition and operating results.
Our dependence on sole and limited source suppliers and international suppliers has negatively impacted, and could continue to impact, our ability to manufacture products and systems.
We rely on sole and limited source suppliers and international suppliers for some of our raw materials, components, subassemblies and software that are critical to manufacturing our products and/or our testing and operations processes due to unique properties or component designs as well as specialized quality and performance requirements. For example, on a local basis, MSD relies on a limited number of suppliers of palladium, its most significant raw material input by value. Our reliance on sole and limited source suppliers and international suppliers involves a number of risks, including:
At times, we have not been able to, and in the future, we may not be able to, obtain and qualify alternative sources of these components on favorable terms, on a timely basis, or at all, whether because there are a limited number of suppliers or because we have entered into supply agreements with certain suppliers that contain certain minimum purchase requirements. The use of alternative sources could require us to redesign our products, which could result in increased costs, shipping delays and the need to requalify products with customers, particularly those with “copy exact” requirements. Any inability to redesign our products could result in further costs and shipping delays. Increased costs would decrease our profit margins if we could not pass these costs to our customers. Further, shipping delays damage, and may continue to damage, our relationships with customers and have a material adverse effect on our business and operating results.
Our failure to successfully manage the transition of certain of our products to other manufacturing locations, the transition of certain of our products to or from contract manufacturers, and the transition of certain functions to centralized locations would likely harm our business, financial condition and operating results.
As part of our continuous cost-reduction and business continuity efforts, we continue to relocate the manufacturing of certain of our existing product lines and subassemblies to, and initiate the manufacturing of certain new products in, our facilities in China, Israel, Mexico, Romania and Singapore, as well as to our significant subcontracted operations in Mexico and selected contract manufacturers in Asia. In addition, we have relocated certain segments of other functions to, or initiated certain segments
20
of other functions in, centralized locations, including relocating certain procurement activity to Mexico and Romania, relocating certain IT and research and development activity to India, relocating certain administrative finance, payroll, software and IT activity to Poland, and initiating engineering activity in India. In the future, we may expand the level of functions that we initiate in or move to other global locations to take advantage of cost efficiencies or for business continuity purposes. However, we may not be able to achieve significant cost savings or other benefits from these actions. For example, costs may increase as development and manufacturing expense increase and labor, material, shipping and facility-related costs rise, as we have seen in our manufacturing locations in China. If these costs increase to the extent that we no longer realize the cost savings we anticipated, we may need to relocate these operations and functions to other lower-cost regions. Additionally, if we are unable to successfully manage the relocation, initiation or oversight of these operations and functions, including identifying, training and retaining skilled labor, our business, financial condition and operating results would be harmed.
In particular, transferring product lines to other manufacturing locations and/or to or from our contract manufacturers' facilities often requires us to transplant complex manufacturing equipment and processes across a large geographical distance, train a completely new workforce concerning the use of this equipment and these processes and comply with local regulations. In addition, certain of our customers may require us to requalify products supplied to them in connection with the relocation of manufacturing operations. If we are unable to manage these transfers and training smoothly and comprehensively, or if we are unable to requalify products in a timely manner, we could suffer manufacturing and supply chain delays, excessive product defects, harm to our operating results and our reputation, and loss of customers. Further, the utilization of overseas manufacturing locations and contract manufacturers may require additional transportation and shipping providers, customs tariffs or export licenses, which may be difficult or costly to obtain.
Additionally, qualifying contract manufacturers and commencing volume production is expensive and time-consuming, and there is no guarantee we will continue to do so successfully. Further, our reliance on contract manufacturers reduces our control over compliance, assembly, quality assurance, production costs and material and component supply for our products. If we fail to manage our relationships with our contract manufacturers, or if any of our contract manufacturers violate laws or regulations or experience financial difficulty, delays, disruptions, capacity constraints or quality control problems, our ability to ship products to our customers could be impaired and our competitive position and reputation could be harmed. Further, if we or our contract manufacturers are unable to negotiate with suppliers for reduced material or component costs, our operating results could be harmed.
In addition, our contract manufacturers may terminate our agreements with them, including immediately if we become insolvent or fail to perform a material obligation under the agreements. If we are required to change contract manufacturers or assume internal manufacturing operations, including due to the termination of one of our contract manufacturing contracts, we will likely suffer manufacturing and shipping delays, lost sales, increased costs and damage to our customer relationships, any of which would harm our business, financial condition and operating results.
Our products could contain defects, which would increase our costs and seriously harm our business, financial condition, operating results and customer relationships.
Many of our products are inherently complex in design and, in some cases, require extensive customization and/or ongoing regular maintenance. Further, the manufacturing of these products often involves a highly complex and precise process and the utilization of specially qualified materials or components that conform to stringent specifications. Many of our products also require highly skilled labor. As a result of the technical complexity of these products, design defects, skilled labor turnover, changes in our or our suppliers' manufacturing processes or the inadvertent use of defective or nonconforming materials or software by us or our suppliers could adversely affect our manufacturing yields and product reliability. This could in turn harm our business, operating results, financial condition and customer relationships.
We provide warranties for our products, and we accrue allowances for estimated warranty costs at the time we recognize revenue for the sale of the products. The determination of such allowances requires us to make estimates of product return rates and expected costs to repair or replace the products under warranty. We establish warranty reserves based on historical warranty costs for our products. If actual return rates or repair and replacement costs differ significantly from our estimates, our operating results would be negatively impacted.
Our customers may discover defects in our products after the products have been fully deployed and operated under peak stress conditions. In addition, some of our products are combined with other suppliers’ products, which may contain defects. Further, some of our customers use our products in ways other than their intended purpose. As a result, should problems occur, it may be difficult to identify the source of the problem. If we are unable to promptly identify and fix defects or other problems, we could experience, among other things:
21
The occurrence of any of these factors could seriously harm our business, financial condition and operating results.
Chemical manufacturing is inherently hazardous and could result in accidents that disrupt our operations or expose us to significant losses or liabilities.
The hazards associated with chemical manufacturing and the related storage and transportation of chemical raw materials, products and waste are inherent to MSD’s operations. These hazards could lead to an interruption or suspension of operations and have a material adverse effect on the productivity and profitability of a particular manufacturing facility or on our business as a whole. Potential risks include storage tank leaks and ruptures, explosions and fires, and chemical spills and other discharges or releases of toxic or hazardous substances or gases. These risks could be caused or exacerbated by mechanical failures, unscheduled downtime, labor difficulties, transportation interruptions, inclement weather, natural disasters, cybersecurity breaches or terrorist attacks. These hazards may result in personal injury and loss of life, damage to property, and contamination of the environment, which may result in a suspension of operations and the imposition of civil or criminal fines, penalties and other sanctions, cleanup costs, and claims by our employees, governmental entities or third parties. We are dependent on the continued operation of our production facilities, and the loss or shutdown of operations at any of our major operating facilities could have a material adverse effect on our business, financial condition and operating results.
We outsource a number of services to third-party service providers, which decreases our control over the performance of these functions. Disruptions or delays at our third-party service providers could adversely impact our operations.
We outsource a number of services, including certain IT systems and systems management, logistics, contract manufacturing, payroll and tax functions, to third-party service providers. While outsourcing arrangements may lower our cost of operations, they also reduce our direct control over the services rendered. This diminished control may have an adverse effect on the quality or quantity of services rendered, on our ability to quickly respond to changing market conditions, or on our ability to ensure compliance with all applicable domestic and foreign laws and regulations. If we do not effectively develop and manage our outsourcing strategies, if required export and other governmental approvals are not timely obtained, if our third-party service providers do not comply with laws or perform as anticipated, or do not adequately protect our data, including from cybersecurity breaches, or if there are delays or difficulties in enhancing business processes, we may experience operational difficulties, increased costs, manufacturing or service interruptions or delays, loss of intellectual property rights or other sensitive data, quality and compliance issues, and challenges in managing our product inventory or recording and reporting financial and management information, any of which could materially and adversely affect our business, financial condition and operating results.
The loss of net revenues from any one of our major customers would likely have a material adverse effect on us.
Our top ten customers accounted for approximately 30%, 42% and 46% of our net revenues for 2023, 2022 and 2021, respectively. In any one reporting period, a single customer or several customers may contribute an even larger percentage of our consolidated net revenues. While the Atotech Acquisition has mitigated our reliance on these customers to some degree, the loss of any of these customers or any significant reduction in orders by these customers, including reductions due to economic, market or competitive conditions or regulatory requirements, would likely have a material adverse effect on our business, financial condition and operating results. None of our significant customers has entered into an agreement with us requiring it to purchase any minimum quantity of our products.
Attempts to lessen the adverse effect of any loss or reduction of net revenues through the rapid addition of new customers would be difficult because a relatively small number of companies dominate the semiconductor and electronics manufacturing industries. Further, prospective customers typically require lengthy qualification periods prior to placing volume orders with a new supplier. Our future success will continue to depend upon:
22
Key personnel have been, and may continue to be, difficult to attract and retain.
Our ability to maintain and grow our business is directly related to the service of our employees, who we consider to be a significant asset. Our performance is directly tied to our ability to hire, train, motivate and retain qualified personnel, including highly skilled technical, financial, managerial, and sales and marketing personnel. There is significant competition for personnel in the technology and sciences marketplace, particularly in certain geographies where we are located, including the Boston area, Orange County and the San Francisco Bay area of California, China, Germany, Japan and Singapore. Also, employees in our industries are increasingly able to work remotely, which could increase employee mobility and turnover, making it more difficult for us to attract and retain employees. In addition, many of our product manufacturing processes and product services require deep technical expertise, and it can be particularly challenging to identify and attract candidates and retain employees possessing such expertise. We have experienced, and may continue to experience, attrition in certain key positions. For example, Seth H. Bagshaw, our Executive Vice President, Chief Financial Officer and Treasurer, will retire from these positions on April 1, 2024, and as of February 27, 2024, we had yet to appoint his replacement. A related challenge is that a significant portion of our technical talent is nearing retirement age, and we may have difficulty attracting a sufficient number of employees with the necessary skills to replace them. If we are unable to hire sufficient numbers of qualified employees or retain and motivate existing employees, our business and operating results would be harmed.
Risks Related to Our Industries and Markets
The semiconductor, electronics manufacturing and automotive industries we serve are characterized by periodic fluctuations in business activity that may cause a reduction in demand for our products.
Our business depends upon capital expenditures of semiconductor device manufacturers (which in turn depends upon the demand for semiconductors), electronics manufacturers and Tier 1 and Tier 2 suppliers for the automotive industry. All of these industries have historically experienced cyclical variations in product supply and demand. For example, while our sales to semiconductor capital equipment manufacturers and semiconductor device manufacturers sequentially increased 12% in 2022, our semiconductor revenue sequentially decreased 28% in 2023, as a result of softening in the market. These sometimes sudden and severe cycles can result from many factors, including overall consumer and industrial spending and demand for electronic products that drive manufacturer production. These cycles can also result from manufacturers' capacity utilization, timing of new product introductions, demand for customers' products, inventory levels relative to demand, access to affordable capital, labor conditions, prices of commodities and energy costs. The timing, severity and duration of these cycles are difficult to predict, and we may not be able to respond effectively to these cycles.
During downturns in the semiconductor and electronics manufacturing industries, periods of overcapacity have resulted in significantly reduced demand for our products, which may result in lower gross margins due to reduced absorption of manufacturing overhead, as our ability to rapidly and effectively reduce our cost structure in response to such downturns is limited by the fixed nature of many of our expenses in the near term. During downturns in the automotive industry, we have experienced a similar effect on the gross margins of the GMF business of MSD. Further, our ability to reduce our long-term expenses is constrained by our need to continue investing in next-generation product technology and to support and service our products. In addition, due to the relatively long manufacturing lead times for some of the products we sell to these industries, we may incur expenditures or purchase raw materials or components for products we are unable to sell. As a result, downturns in these industries may materially harm our business, financial condition and operating results. Conversely, during upturns in these industries, we may have difficulty rapidly and effectively increasing our manufacturing capacity to meet sudden increases in customer demand. If we fail to do so, we may lose business to our competitors and our relationships with our customers may be harmed.
Many of the markets and industries we serve are highly competitive, are subject to rapid technological advancement, and have narrow design windows, and if we fail to introduce new and innovative products or improve our existing products, or if our products or the applications we invest in do not achieve widespread adoption, our business, financial condition and operating results will be harmed.
We operate in highly competitive markets characterized by rapid technological advances, frequent product introductions and enhancements, changing customer requirements, evolving industry standards, substantial capital investment and increasing price pressure. Our success depends upon our ability to continuously develop, market and support superior products, processes and solutions. Factors that could harm our competitive position include:
23
Certain of these factors could cause customers to defer or cancel orders for our products and/or place orders for our competitors' products. This is particularly significant to us, as our success depends on many of our products being designed into new generations of equipment and manufacturing processes. Certain markets in which we operate, such as the semiconductor capital equipment market and the mobile phone market, which is part of our electronics and packaging market, experience cyclicality and unevenness in capital spending. If we are unable to introduce new products in a timely manner or are otherwise unsuccessful in making sales to customers, we may miss market upturns or fail to have our products or subsystems designed into our customers' products. For example, new products designed by capital equipment manufacturers historically have had a lifespan of five to fifteen years. We must develop products that are technologically advanced in a timely manner so that they are positioned to be chosen for use in each successive generation of capital equipment.
These factors could also prompt us to agree to pricing concessions or extended payment terms with our customers, in an effort to expand into new markets, gain volume orders or improve customer cost of ownership in highly competitive applications. In other cases, we may discontinue selling certain products if we cannot offset price erosion through shifts in operations.
Finally, these factors could render the portfolios of products or lines of business from which we generate significant net revenues obsolete. For example, MSD has lost business to customers who identify alternative materials or processes and therefore no longer require as much or any specialty chemicals. If our customers or the industries we serve shift to other technologies, our business, financial condition and operating results would be harmed.
24
We offer products for multiple markets and must face the challenges of supporting the distinct needs of each of the markets we serve.
We offer products for very diverse markets. Because we operate in multiple markets, we must work constantly to understand the needs, standards and technical requirements of many different applications within these markets, and must devote significant resources to developing different products for these markets. Product development is costly and time consuming. We must anticipate trends in our customers' industries and develop products before our customers' products and processes are commercialized. If we do not anticipate our customers' needs and future activities, we may invest substantial resources in developing products that do not achieve broad market acceptance. Our growth prospects rely in part on successful entry into new markets, which depends on displacing competitors who are more familiar with these markets and better known to customers. In many cases, we are attempting to enter or expand our presence in these new markets with newly introduced products that are not yet proven in the industry. Our decision to continue to offer products to a given market or to penetrate new markets is based in part on our judgment of the size, growth rate, profitability and other factors that contribute to the attractiveness of a particular market. If our product offerings in any particular market are not competitive, our analyses of a market are incorrect or our sales and marketing approach for a market is ineffective, we may not achieve anticipated growth rates in this market, and our business, financial condition and operating results would be harmed.
Further, serving diverse markets requires an understanding of different sales cycles and customer types, and the development and maintenance of a complex global sales team and sales channels to support each market’s differing needs. It also requires dynamic operations that can support both complex, customized product builds as well as quick turn-around for commercial off-the-shelf sales. If we fail to provide sales and operational support for our diverse markets, our business, financial condition and operating results would be harmed.
Risks Related to Operating a Global Business
We face significant risks associated with doing business internationally.
We face significant risks from our substantial operations in, sales to, and purchases from international markets. Our presence and operations in international markets, and the risks associated with doing business internationally, may continue to change and will likely increase if our business grows. These risks, many of which we have experienced, include:
25
If we experience any of the risks associated with doing business internationally, our business, financial condition and operating results could be significantly harmed.
We have significant facilities and operations and a considerable number of employees in Israel. A number of our products are manufactured in facilities located in Israel. Following the Hamas attack on Israel in October 2023, some of our employees in Israel were called for active military duty. While, as of February 27, 2024, our facilities in Israel remain operational, the continuation, escalation or expansion of the Israel-Hamas war, including the expansion of hostilities into other parts of the Middle East, and other regional conflicts could negatively affect business conditions and significantly disrupt our operations in Israel. More broadly, the future of peace efforts between Israel and its neighboring countries remains extremely uncertain. Any other armed conflicts or further political instability in the region could similarly negatively affect our business, including if additional employees in Israel are called for active military duty. If the Israel-Hamas war continues, escalates or expands, or another military conflict or war in the region arises, our operations in Israel could be disrupted, including by the absence of one or more key employees or a significant number of other employees. Any such disruptions could adversely affect our business.
MSD has limited operations and employees in Belarus. Historically, we have made immaterial sales into Russia and Belarus. As a result of the ongoing military conflict between Russia and Ukraine, including the imposition of sanctions on Russia, Belarus and related parties, our sales into Belarus and Russia have ceased. Any additional disruptions, including the expansion of sanctions in connection with the conflict, could adversely affect our business.
The U.S. government continues to take action against certain of our customers, particularly our customers located in Asia, including indictments for various criminal charges, and in some cases, restrictions on doing business with these customers (or restrictions on third parties from engaging designated entities), including the suspension of our ability to fill outstanding orders. These actions have caused us, and will in the future cause us, to lose anticipated revenue from product sales, the amount of which could be significant. In addition, these or other customers could elect to purchase products from unaffected non-U.S. competitors, even when trade restrictions are not in place, jeopardizing our long-term relationship with them. Further, compliance with regulatory restrictions may cause us to breach contractual obligations, which could result in costs, penalties and litigation.
Additionally, potential customers in certain countries, particularly in Asia, have a strong preference for technology and products developed by suppliers based in their home countries. The trade dispute between the U.S. government and the Chinese government has reinforced and broadened this preference, as potential and existing customers seek to avoid the uncertainty related to the trade dispute. While we have attempted to mitigate these issues by establishing a significant local presence in many of these countries, companies like us that are based elsewhere remain at a disadvantage.
26
We face significant risks associated with doing increased business in China in particular.
The Atotech Acquisition significantly increased our operations and assets in, and revenues generated from, China. As a result of our presence in China, we are subject to the following significant risks:
If we experience any of the risks associated with doing business in China, our business, financial condition and operating results could be significantly harmed.
Unfavorable currency exchange rate fluctuations may lead to lower operating results or may cause us to change customer pricing, which could result in reduced sales and losses.
Although we report our financial position and operating results in U.S. dollars, a significant portion of our net revenues are from customers in international markets where we invoice in currencies other than the U.S. dollar, and we have facilities where costs are incurred in currencies other than the U.S. dollar. In addition, we carry certain assets and liabilities in currencies other than the U.S. dollar. The indebtedness we incurred in connection with the Atotech Acquisition includes a Euro tranche of €843 million as of January 22, 2024, the date of the USD Tranche A Refinancing. Currency exchange rate fluctuations could have an adverse effect on our assets, liabilities, net revenues, expenses and operating results and we could experience losses with respect to our hedging activities. Unfavorable exchange rate fluctuations could require us to increase or decrease prices to customers, which could result in lower net revenues from such customers. Alternatively, if we do not adjust the prices for our products in response to unfavorable currency fluctuations, our operating results could be adversely affected by declining net revenues or profit margins for our products. Such exchange rate fluctuations could also increase the costs and expenses of our non-U.S. operations when translated into U.S. dollars or require us to modify our current business practices. In addition, most sales made by our foreign subsidiaries are denominated in the currency of the country in which these products are sold and the currency they receive in payment for such sales could be less valuable on a U.S. dollar basis at the time of receipt as a result of exchange rate fluctuations. We enter into foreign exchange forward contracts to reduce a portion of our currency exposure arising from intercompany sales of inventory as well as intercompany accounts receivable and intercompany loans. However, we cannot be certain that our efforts will be adequate to protect us from significant exchange rate fluctuations or that such efforts will not expose us to additional exchange rate risks.
Legal, Tax, Regulatory and Compliance Risks
Wepreviously identified a material weakness in our internal control over financial reporting and may discover additional material weaknesses in the future. Our inability to remediate material weaknesses in the future, and our inability to achieve and maintain effective disclosure controls and procedures and internal control over financial reporting, could adversely affect our results of operations, our stock price and investor confidence in our Company.
Section 404 of the Sarbanes-Oxley Act of 2002 requires that companies evaluate and report on the effectiveness of their internal control over financial reporting. In addition to the Company’s evaluation, our independent registered public accounting firm provides an opinion regarding the effectiveness of our internal control over financial reporting. As disclosed in more detail in Part II, Item 9A, “Controls and Procedures” below, following the ransomware incident in February 2023, we identified a material weakness as of December 31, 2022 in our internal control over financial reporting. Our assessment was we did not maintain sufficient IT controls to prevent or detect, on a timely basis, unauthorized access to our financial reporting systems. Specifically, we did not design or maintain effective controls with respect to our financial reporting systems related to access authentication,
27
intrusion detection and response capability, and backup and restoration such that recovery from a cybersecurity incident could be performed in a more timely manner.
Internal controls related to our financial reporting systems are important to accurately reflect our financial position and results of operations in our financial reports. Due to the material weakness in our internal control over financial reporting, we also concluded our disclosure controls and procedures were not effective as of December 31, 2022.
Failure to have effective internal control over financial reporting and disclosure controls and procedures can impair our ability to produce accurate financial statements on a timely basis and could lead to a restatement of our financial statements. If, as a result of the ineffectiveness of our internal control over financial reporting and disclosure controls and procedures, we cannot provide reliable financial statements, our business decision processes may be adversely affected, our business and results of operations could be harmed, investors could lose confidence in our reported financial information and our ability to obtain additional financing, or additional financing on favorable terms, could be adversely affected.
Our management took action to remediate the material weakness, concluding that the material weakness had been fully remediated as of December 31, 2023. Additional details regarding the remediation efforts are disclosed in Part II, Item 9A, “Controls and Procedures” below. Although we remediated this material weakness, we could in the future identify additional internal control deficiencies that could rise to the level of a significant deficiency or material weakness or uncover other errors in financial reporting. There can be no assurance that future remediation efforts will be successful, that our internal control over financial reporting will be effective as a result of these efforts, or that any future significant deficiencies may not be material weaknesses that would be required to be reported in future periods. In addition, we cannot provide assurance that our independent registered public accounting firm will be able to attest that such internal controls are effective when they are required to do so.
If we fail to remediate any future material weaknesses and maintain effective disclosure controls and procedures or internal control over financial reporting, our ability to accurately record, process, and report financial information and, consequently, our ability to prepare financial statements within required time periods could be adversely affected. Failure to maintain effective internal controls could result in a failure to comply with SEC rules and regulations, stock exchange listing requirements, and the covenants under our debt agreements, subject us to litigation, investigations or enforcement actions, negatively affect investor confidence in our financial statements, and adversely impact our stock price and ability to access capital markets. The defense of any such claims, investigations or enforcement actions could cause the diversion of the Company’s attention and resources and could cause us to incur significant legal and other expenses even if the matters are resolved in our favor.
If significant tariffstrade restrictions or other trade restrictionstariffs on our products or components that are imported from or exported to China continue or are increased, our business, financial condition and operating results may be materially harmed.
Trade tensions between the United States and China have increased substantially in recent years, resulting in significant trade restrictions that have significantly harmed our business. These regulations include tariff increases, additional sanctions against specified entities, and the broadening of restrictions and license requirements for specified usesend-uses of those of our products that are subject to these restrictions, including restrictions surrounding specific product groups, applications and/or end uses. The U.S. Governmentgovernment concerns relate to, among other things, national security concerns and the concept of ‘military/“military/civil fusion’fusion” in China, - a national strategy whereinin which military technologies are developed or produced alongside commercial, non-military items, often by private or quasi-government companies. In addition to targeted comprehensive sanctions against specific firms, in recent years, “Entity List” designations and “military end-user” controls have been significantly modified, as were some rules relating to items produced outside the United States that incorporate more than de minimis levels of U.S. controlled content or derived from (i.e., the “direct product” of) U.S. origin technologies. Recently, in October 2022, the U.S. Department of Commerce’s Bureau of Industry and Security (“BIS”) implemented new and novel restrictions related to end-uses in semiconductor, semiconductor manufacturing, supercomputer, and advanced computing, along with certain equipment used to develop and produce them, as well as controls around the activities of U.S. persons in certain markets, including China. These regulations, which BIS amended in October 2023 (as amended, the “BIS Rules”), have resulted in, and may in the future result in, loss of business, both directly to China end-customers, and indirectly through our OEM customers, as well as additional export license requirements on shipments of our products, parts and supplies, loss of business and associated increased administrative burdens. For example, as a result of the BIS Rules, we estimate our net revenues were reduced by approximately $200 to $250 million in 2023. The extraordinary complexity of these rules, combined with the likelihood of further amendments from BIS, significantly increases our risk of non-compliance, which could result in fines and other penalties, and could change how these rules impact us. While we have adjustedcontinue to adjust our policies and practices to ensure continued compliance with these regulations, and we will seek to mitigate their impact, there can be no assurances that current or future regulations and tariffs will not have a material adverse effect on our business.business.
Since the beginning of 2019, the pace at which regulatory changes have been implemented has beenat an extraordinarily high pace, which increases the resources needed to monitor and comply with the regulation,regulations, while heightening the risk of non-compliance. Between May 2019 and August 2020,Such regulatory changes include the U.S. Departmentaddition by BIS of Commerce’s Bureau of Industry and Security (“BIS”) added China-based Huawei Technologies Co., Ltd. (“Huawei”) and a total of 152 of its affiliates onto its Entity List, thereby requiring an export license for the sale of U.S. items to Huawei. In May 2020, BIS also modified the Foreign Direct Product rule to further restrict Huawei’s ability to directly or indirectly source U.S. origin items, and then modified the existing “military end-use” rule, expanding the scope of products and technologies that would require licenses for military end-uses, primarily in China. BIS further named 103 specific companies as “military end users” (mostly in China). In December 2020, Hong Kong lost its favorable trade status and BIS added, Semiconductor Manufacturing International Corporation (“SMIC”), Yangtze Memory Technologies Corp (“YMTC”) and tenmany of itstheir respective affiliates along with 66 other companies to the Entity List. BIS continues to add Chinese-based companies onto
28
its Entity List. Accordingly, we have implemented additional monitoring processes and suspended orders from Huawei, SMIC, YMTC and certain other designated Chinese-based customers, where those orders are subject to U.S. jurisdiction. We have also been negatively impacted by the cancellation of orders from customers who are suppliers to these firms.firms. BIS has also modified the Foreign Direct Product and “military end-use” rules, expanded the scope of products and technologies that would require licenses for military end-uses, primarily in China, and expanded the list of “military end users,” mostly in China. Beginning in October 2022, the BIS Rules imposed new restrictions on our ability to sell, ship, service and support certain equipment and otherwise conduct business with certain counterparties, primarily China-based companies involved in semiconductor manufacturing, which has negatively impacted, and we expect will continue to negatively impact, our revenues. At the same time, BIS also added numerous China-based companies, including companies with which we do business, to its “Unverified List.” Placement on the Unverified List may be an indication of additional future restrictions by BIS, as was the case with YMTC, which was added to the Unverified List in October 2022 and was then added to the Entity List in December 2022.
In addition,Increased restrictions on China may lead to regulatory retaliation by the Chinese government and further escalate geopolitical tensions between China and Taiwan. China has adopted, and announced its intention to further adopt, new regulations, which could have an adverse effect on our operations. For example, in response to the imposition of U.S. tariffs in 2018 and 2019, China imposed its own retaliatory tariffs. In May 2019, China’s Ministry of Commerce also announced an “unreliable entity list” under which non-Chinese entities that cut off supplierssupply to Chinese companies may be subject to government action. Because many of the mechanisms for being named to the list, removed from the list, and enforcement remain ill-defined and unavailable to the public, the potential impacts of the regulation remain unknown. In September 2020, it disclosed potential enforcement mechanismsaddition, in the form of an “Unreliable Entity List.” This regulation has yet to be implemented,2023, China adopted export curbs on crucial raw materials, including gallium, germanium, and its effects are unknown at this time.graphite, that may have both direct and indirect adverse impacts on our business and supply chain.
The ongoing geopolitical tensions and economic uncertainty between the United States and China caused by recent tariffs, Entity List and “military end user” designations, and foreign-made product rules and the BIS Rules, and the unknown impact of current and future Chinese trade regulations, may continue to cause increasedincrease costs, as well as restrictions onrestrict our ability to sell, or a decreaseddecrease demand from customers to purchase, our products, directly and indirectly, which could materially harm our business, financial condition and operating results. This trade uncertainty has caused, and may continue to cause, customers to delay or cancel
orders, as they limit expenditures that could be affected by future actions and evaluate ways to mitigate their own tariffsupply chain and cost exposure by sourcing from locally-basedlocally based suppliers or suppliers based in other countries. Such delays and cancellations could have a material impact on our business, financial condition and operating results. It is possible that additional trade restrictions on trade will be imposed, and that existing tariffs will be increased on imports of our products or the components used in our products and/or that our business will be impacted by additional retaliatory tariffs or restrictions imposed and/or increased by China or other countries in response to existing or future tariffs, causingtariffs. These developments could cause us to potentially lose additional sales and customers, incur increased costs and lower margins, seek alternative suppliers, raise prices or make changes to our operations, any of which could materially harm our business, financial condition and operating results.results.
We are subject to international trade compliance regulations, and violations of those regulations could result in fines or trade restrictions, which could have a material adverse effect on us.
We are subject to trade compliance laws in both the United States and other jurisdictions where we operate. For example, exports of our products and technology developed or manufactured in the United States are subject to export controls imposed by the U.S. Governmentgovernment and administered by the U.S. Departments of Commerce and, to a lesser extent, State and Treasury. Export regulations govern exports of our products and technology developed or manufactured in other countries, including, for example, Austria, China, France, Germany, Israel, Romania and Singapore. In certain instances, these regulations may require obtaining licenses from the administering agency prior to exporting products or technology to international locations or foreign nationals, including foreign nationals employed by us in the United States and abroad. For products and technology subject to the U.S. Export Administration Regulations administered by BIS, the requirement for a license is dependent on the type and end use of the product and technology, the final destination and the identity and nationality of the end user. Virtually all exports from the United States of defense articles subject to the International Traffic in Arms Regulations, administered by the Department of State’s Directorate of Defense Trade Controls, require a license. The Israeli Ministry of Economy and the Defense Export Control Agency of the Israeli Ministry of Defense administer similar export regulations and license requirements, which apply to many of our products and technology developed or manufactured in Israel. In addition, the Romanian Ministry of Foreign Affairs and the Department for Export Controls administer similar export regulations and license requirements, which apply to many of our products and technology developed or manufactured in Romania. Obtaining export licenses can be difficult and time-consuming, and we may not be successful in obtaining them. Failure to obtain export licenses to enable product and technology exports could reduce our net revenues, harm our relationships with our customers and could adversely affect our business, financial condition and operating results. Compliance with export regulations may also subject us to additional fees and costs. The absence of comparable export restrictions on competitors,, whether due to technical specifications or the competitor’ssuch competitors’ geography, may adversely affect our competitive position.
29
In addition, if we or our international representatives or distributors fail to comply with any of these export regulations, we or they could be subject to civil and criminal and monetary and non-monetary penalties and costly consent decrees, and we could experience disruptions to our business, restrictions on our ability to export products and technology, damage to our reputation and significant harm to our business and operating results. We are engaged in a systematic, risk-based review of our compliance-related activities to identify and remediate known and suspected weakness (e.g., product export classification). In connection with that review, we identified certain activities that were non-compliant with applicable trade regulations, and have submitted appropriate voluntary disclosures to applicable authorities to report such non-compliance. While such instances of non-compliance have not had a material adverse impact on us to date, it is not yet known whether, or to what extent, this continuing review will yield additional reportable non-compliance. Additionally, while we have implemented policies and procedures to comply with these laws, we cannot be certain that our employees, contractors, suppliers or agents will not violate such laws or our policiespolicies..
Changes in tax rates or tax regulation or the termination of tax incentives could affect our operating results.
As a global company, we are subject to taxation in the United States and various other countries. Significant judgment is required to determine and estimate worldwide tax liabilities. Our future annual and quarterly effective tax rates could be materially affected by numerous factors, including changes in the following: applicable tax laws; the organizational structure of our business, including reorganizations, location of assets and outstanding indebtedness; composition of pre-tax income in countries with differing tax rates; our determinations of tax liabilities; and/or valuation of our deferred tax assets and liabilities.liabilities.
The enactment ofChanges in U.S. tax law, such as the Tax Cuts and Jobs Act, (the “TCJA”)the Inflation Reduction Act, and changes in December 2017 significantly affected U.S.regulations and tax law by changing howguidance may affect our business. Additionally, the United States imposesis considering various corporate and international income tax on multinational corporations. The U.S. Department of Treasury has broad authority under the TCJA to issue regulations and interpretive guidance. Some of the proposed and final regulations thatproposals, which, if enacted, could have been issued regarding the TCJA have been challenged in court. We have applied available guidance to estimate our tax obligations, but new guidance issued by the U.S. Treasury Department may cause us to adjust our tax estimates in future periods. The ultimatea material impact of the TCJA on our U.S.provision for income taxes and effective tax liabilities is based upon our understandingrate.
Many countries in which we operate are implementing legislation and interpretation ofother tax changes to align their tax systems with the regulatory guidance that has been issued regarding the TCJA. A new administration took office in January 2021. As a result of the new administration and the change in control of the U.S. Senate in 2021, additional tax legislation may be enacted, which could reverse provisions of the TCJA or make other changes impacting our tax liabilities.
On October 4, 2021, 136 members of the OrganizationOrganisation for Economic Co-operation and Development (“OECD”) agreed to a global minimum tax rate of 15%. On December 20, 2021, OECD published its model rules on the agreed minimum tax known as Pillar Two of the Global Anti-Base Erosion (“GloBE”) rules. The GloBE rules provide a framework for a coordinated multi-country system of taxation intended to ensure large multinational enterprise groups pay a minimum level of tax on the income
arising in each of the jurisdictions where they operate. Individual country legislation is expected in 2022 and the expected effective dateMany jurisdictions, including many EU countries, have enacted certain provisions of such legislation is in 2023.
Additionally, on November 19, 2021, the U.S. House of Representatives approved the Build Back Better Act (the “BBBA”). The BBBA contains proposed corporate and international tax reforms, including a 15% minimum tax on the adjusted financial statement income of certain large corporations, a 1% interest excise tax on certain publicly traded corporations that buy back stock from their shareholders and additional limitations on the deduction for business interest, among other tax provisions. This version of the bill has not been approved by the U.S. Senate. In the event that the GloBE rules are implemented and/or the BBBA or similar legislation is enacted, weeffective as of January 1, 2024. The GloBE rules could be subject to an increase in our effective tax rate, which would adversely impacthave a materially adverse effect on our financial condition and operating results.
We are subject to regular examination by the U.S. Internal Revenue Service and state, local and foreign tax authorities. We regularly assess the likelihood of favorable or unfavorable outcomes resulting from these examinations to determine the adequacy of our provision for income taxes. Although we believe our tax estimates are reasonable, we can make no assurances that any final determination of tax liability will not be materially different from the treatment reflected in our historical income tax provisions and accruals, which could materially and adversely affect our financial condition and operating results.
In certain foreign jurisdictions, weWe qualify for tax incentives and tax holidays based on our ability to meet, on a continuing basis, various tests relating to our employment levels, research and development expenditures and other qualification requirements in a particular foreign jurisdiction. While we intend to operate in such a manner to maintain and maximize our tax incentives, we can make no assurances that we have so qualified or that we will so qualify for any particular year or jurisdiction. If we fail to qualify or remain qualified for certain foreign tax incentives, and tax holidays, the tax incentives we previously received may be terminated and/or retroactively revoked, requiring repayment of past tax benefits, and we would be subject to an increase in our effective tax rate, which wouldcould have a materially adverse impact our financial results.
Many of our products and customers are subject to numerous laws regulating the production and use of chemical substances, and some of our products may need to be reformulated or discontinued to comply with these laws and regulations.
As MSD manufactures specialty chemicals, we are subject to chemicals approvals, registrations and regulations around the world, including European Union Regulations on Registration, Evaluation, Authorisation and Restriction of Chemicals (“ EU REACH”) in the EU, the Toxic Substances Control Act (“TSCA”) in the United States, and similar laws and regulations in certain other jurisdictions in which we and our customers operate. In recent years, changes to existing laws and regulations and the adoption of new laws and regulations have imposed new obligations, including restrictions and prohibitions on highly hazardous substances, could also force us to reformulate or discontinue certain of our products.
Governmental, regulatory, and societal demands for increasing levels of product safety and environmental protection are resulting in increased pressure for more stringent regulatory control with respect to the chemical industry, including with respect to manufacturing, importing and using chemicals. For example, EU REACH imposes comprehensive compliance obligations and establishes mechanisms to identify and restrict high-concern chemicals, and comparable regulatory requirements have now been adopted in several other countries. As another example, in the United States, the core provisions of TSCA were amended in June 2016 for the first time in nearly 40 years. Among the more significant changes, the amended TSCA mandates risk evaluation of existing “high priority” chemicals. In addition, the U.S. Environmental Protection Agency (the “EPA”) must make a no “unreasonable risk” finding before a new chemical can be fully commercialized. These laws and regulations generally create
30
uncertainty about whether existing chemicals important to our business may be designated for restriction and whether the approval process for new chemicals may become more difficult and costly. These changes could adversely impact our ability to supply certain products to our customers and could also result in compliance obligations, fines, ongoing monitoring and other future business activity restrictions, which could have a material adverse effect on our business, financial condition and operating results.
Perfluorooctanesulfonic acid and other per- and polyfluoroaklyl substances (“PFAS”) are chemical agents that have been targeted for risk assessment, restriction, regulation and high-priority remediation and are the subject of litigation and governmental investigations in the United States and other countries. While we have developed a suite of products that do not require any PFAS chemicals and, when adopted by the industry, will obviate the need for PFAS-containing mist suppressants and wetting agents, we continue to sell a limited number of products that contain permissible levels of PFAS. We have been named as a defendant in a lawsuit related to PFAS and we have received a request for information from, and responded to, a state agency.
International environmental protection requirements, including chemical regulation requirements, and enforcement of these requirements, may become more stringent in the future and could result in material costs relating to regulatory compliance, liabilities, litigation proceedings, or other impacts, such as restrictions or prohibitions on our products. Future regulatory or other developments could also restrict or eliminate the use of, or require us to make modifications to, our products, packaging, manufacturing processes, transportation methods, and technology, which could have a material adverse effect on our business, financial condition, and operating results. Our production facilities require permits, such as environmental, operating, and product-related permits and import/export permits, which are subject to renewal and, in some circumstances, revocation. We may not obtain the necessary permits. In addition, permits may be discontinued or may contain significant and costly new requirements. If a permit for a production facility is not renewed or is revoked, the facility may need to be closed temporarily or permanently, which may have a material adverse effect on our business, financial condition and operating results. Failure to obtain or maintain permits for our facilities or other failure to comply with applicable environmental regulations could result in the shutdown of, or suspension of operations at, our plants.
Many of our customers are subject to the same or similar environmental regulations. The impact of these regulations on our customers and our customers' ability to comply with these regulations is outside of our control. However, non-compliance by our customers could have an indirect negative effect on our business. We must monitor relevant chemical regulatory developments in order to limit the associated risks of new developments by triggering countermeasures, such as alternative products and phase-outs, at the right time.
We are subject to environmental regulations. If we fail to comply with these regulations, our business could be harmed.
Our operations are subject to various federal, state, local and international laws and regulations relating to environmental protection, including those governing discharges of pollutants into the air, water and water,land, the managementreporting, generation, use, handling, storage, transportation, treatment and disposal of hazardous substances, waste and wasteother materials and the cleanup of contaminated sites. In the United States, we are subject to the federal regulation and control of the Environmental Protection Agency (“EPA”),EPA, and we are subject to regulations and controls of comparable authorities in other countries. Some of our operations, including our chemical operations, require environmental permits and controls to prevent and reduce air and water pollution, and these permits are subject to modification, renewal and revocation by issuing authorities. Future developments, administrative actions or liabilities relating to environmental matters, including sanctions such as capital expenditure obligations, clean-up and removal costs, long-term monitoring and maintenance costs, costs of waste disposal, natural resource damages and payments for property damage and personal injury, could have a material adverse effect on our business, financial condition or operating results.
Although we believe that our safety procedures for using, handling, storing and disposing of such materials comply with the standards required by applicable federal, state, local and international laws and regulations, we cannot completely eliminate the risk of accidental contamination or injury from these materials.materials, including risks related to our chemical products, which are inherently hazardous. We have been, and may in the future be, subject to claims by employees or third parties alleging contamination or injury, and could be liable for damages, which liability could exceed the amount of our liability insurance coverage (if any) and the resources of our business.
Certain portions of the soil at the former facility of our Spectra-Physics lasers business, located in Mountain View, California, and certain portions of the aquifer surrounding the facility, through which contaminated groundwater flows, are part of an EPA-designated Superfund site and are subject to a cleanup and abatement order from the California Regional Water Quality Control Board. Spectra-Physics, which we acquired as part of the Newport acquisition in April 2016 and which had been acquired by Newport in 2004, along with other entities with facilities located near the Mountain View, California facility, were identified as responsible parties with respect to this Superfund site, due to releases of hazardous substances during the 1960s, 1970s and 1980s. Spectra-Physics and the other responsible parties entered into cost-sharing agreements covering the costs of remediating the off-site groundwater impact. The site is mature, and investigations, monitoring and remediation efforts by the responsible parties have been ongoing for approximately 3035 years.
We have certain ongoing costs related to investigation, monitoring and remediation of the site that have not been material to us as a whole in the recent past. However, while we benefittedbenefited from the indemnification of
31
certain costs by a third party in the past, that indemnification is now in a transition period, and we will become subject to a greater portion of costs of remediation going forward. Our ultimate costs of remediation and other potential liabilities are difficult to predict. In the event that the EPA and the California Regional Water Quality Control Board determine that the site cleanup requires additional measures to ensure that it meets current standards for environmental contamination, or if they enhance any of the applicable required standards, we will likely become subject to additional remediation obligations in the future. In addition to our investigation, monitoring and remediation obligations, we may be liable for property damage or personal injury claims relating
to this site. While we are not aware of any material claims at this time, such claims could be made against us in the future. If significant costs or other liability relating to this site arise in the future, our business, financial condition and operating results would be adversely affected.
In addition, some of MSD’s manufacturing facilities and former facilities have an extended history of chemical manufacturing operations or other industrial activities, and contaminants have been detected at some of those sites. We or our predecessors have in the past been, and are currently, required to remediate contamination at several of these current and former sites, and there remains some risk that further investigation and remediation might be necessary.
The environmental regulations that we are subject to include a variety of federal, state, local and international regulations that restrict the use and disposal of materials used in the manufacture of our products or require design changes or recycling of our products. If we fail to comply with any present or future regulations, we could be subject to future liabilities, the suspension of manufacturing or a prohibition on the sale of products we manufacture. In addition, these regulations could restrict our ability to equip our facilities or could require us to acquire costly equipment, or to incur other significant expenses to comply with environmental regulations, including expenses associated with the recall of any non-compliant product and the management of historical waste. For example, the European Union (“EU”) has enacted the Restriction on the Use of Certain Hazardous Substances in Electrical and Electronic Equipment Directive,addition to EU REACH, which regulates the use of certain hazardous substances in certain products, andthe EU has enacted the Waste Electrical and Electronic Equipment Directive, which requires the collection, reuse and recycling of waste from certain products. Compliance with such laws requires significant resources. These regulations may require us to redesign our products or source alternative components to ensure compliance with applicable requirements, for example by mandating the use of different types of materials in certain components. Any such redesign or alternative sourcing may increase the cost of our products, adversely impact the performance of our products, add greater testing lead-times for product introductions, or in some cases limit the markets for certain products. Further, such environmental laws are frequently amended, which increases the cost and complexity of compliance. For example, such amendments have in the past resulted in, and may in the future result in, certain of our products falling inwithin the scope of a directive, even if they were initially exempt. In addition, certain of our customers, particularly OEM customers whose end products may be subject to these directives, may require that the products we supply to them comply with these directives, even if not mandated by law. Because certain directives, for example, those issued from the EU, are implemented in individual member states, compliance is particularly challenging. Our failure to comply with any of such regulatory requirements or contractual obligations could result in our being directly or indirectly liable for costs, fines or penalties and third-party claims, and could jeopardize our ability to conduct business in certain countries.
We are exposed to various risks related to legal proceedings, including, for example, product liability claims, intellectual property infringement claims, regulatory claims, contractual claims and securities class action litigation, which if successful, could have a material adverse effect on our commercial relationships, business, financial condition and operating results.
From time to time, we may be involved in legal proceedings, enforcement actions or claims regarding product performance, product warranty, product certification, product liability, patent infringement, misappropriation of trade secrets, other intellectual property rights, data privacy, antitrust, environmental regulations, trade regulations, securities, contracts, unfair competition, employment, workplace safety, and other matters.matters. We can provide no assurance of the outcome of these legal proceedings, enforcement actions or claims or that the insurance we maintain will be adequate to cover them.
For example, some of our products, such as certain ultrafast lasers, are used in medical and scientific research applications where malfunctions could result in serious injury. In addition, certainCertain of our products may be hazardous if not operated properly or if defective. Other products of ours, including our chemicals products and laser systems, are inherently hazardous and must be used with particular care. We are exposed to significant risks for product liability claims in the event of a significant line down situation or if death, personal injury or property damage results from the handling, use or storage of our products.products, including our chemical products and laser systems. We may experience material product liability losses in the future. We currently maintain insurance for certain product liability claims. However, our insurance coverage may not continue to be available on acceptable terms, if at all. This insurance coverage also may not adequately cover liabilities that we incur. Further, if our products are defective, we may be required to recall or redesign these products. A successful claim against us that exceeds our insurance coverage level or that is not covered by insurance, or any product recall, could have a material adverse effect on our commercial relationships, business, financial condition and operating results.results.
In addition, securities class action lawsuits and derivative lawsuits are often brought against companies who have entered into business combinations and acquisitions. We are currentlywere previously involved in securities class action litigation in connection with the acquisitionacquisitions of Newport and previously were involved in a securities class action litigation in connection with the acquisition of ESI. In each case, the plaintiffs alleged, among other things, that the then-current directors of the
32
acquired company breached their fiduciary duties to their respective shareholders by agreeing to sell the company through an inadequate and unfair process, leading to inadequate and unfair consideration, by agreeing to unfair deal protection devices, and by omitting material information from the proxy statement. We, or the companies we acquire, may be subject to additional securities class action litigation in connection with other recently completed or future business combinations and acquisitions.acquisitions.
RegardlessWith respect to data privacy and intellectual property, as a result of the outcome, securities class actionransomware event described under “Risks Related to Cybersecurity, Data Privacy and Intellectual Property Protection” above, and under “Management’s Discussion and Analysis of Financial Condition and Results of Operations—Ransomware Event” below, we were previously subject to two lawsuits, and we may be subject to future litigation, investigations, claims or actions, in addition to fines, penalties, or other obligations related to impacted data, whether or not such as this can be time-consuming, resultdata is misused.
While we intend to vigorously defend any lawsuits, in significant expense to us and divert attention and resourceslight of our managementthe inherent uncertainties involved in such proceedings, we may incur losses associated with any such proceedings. Additionally, ongoing legal and other key employees. Costscosts related to any potential future proceedings and expenses,inquiries, may be substantial, and losses associated with any adverse judgments, settlements, penalties or an
unfavorable outcome inother resolutions of such cases,proceedings and inquiries could exceed applicable insurance coverage, if any. Any such unfavorable outcome couldbe significant and have a material adverse effectimpact on our business, reputation, financial condition, operating results and cash flows. and operating results.
With respect to our intellectual property,In addition, we have from time to time received claims from third parties alleging that we are infringing certain trademarks, patents or other intellectual property rights held by them. Such infringement claims have in the past resulted in, and may in the future result in, litigation, settlement or enforcement action. Any such action could be protracted and costly, and we could become subject to damages for infringement, or to an injunction preventing us from making, selling or using certain of our products or services, or using certain of our trademarks. Such claims could also result in the necessity of obtaining a license or paying damages relating to one or more of our products, services or current or future technologies, which may not be available on commercially reasonableacceptable terms or at all. Any intellectual property action and the failure to obtain necessary licenses or other rights or develop substitute technology may divert management’s attention from other matters and could have a material adverse effect on our business, financial condition and operating results. In addition, the terms of some of our customer contracts require us to indemnify the customer for any claim of infringement brought by a third party based on our products. Claims of this kind may have a material adverse effect on our commercial relationships, business, financial condition or operating results.results.
Although our standard commercial documentation sets forth the terms and conditions that we intend to apply to commercial transactions with our business partners, counterparties to these transactions may not explicitly agree to our terms and conditions. In situations where we engage in business with a third party without an explicit written agreement regarding the applicable terms and conditions, or where the commercial documentation applicable to the transaction is subject to interpretation, we may have disputes with those third parties regarding the applicable terms and conditions of our transaction with them. These disputes could result in deterioration of commercial relationships, costly and time-consuming litigation or additional concessions or obligations being offered by us to resolve these disputes, or could impact our net revenue or cost recognition. Any of these outcomes could materially and adversely affect our business, financial condition and operating results.results.
In addition, from time to time in the normal course of business we indemnify parties with whom we enter into contractual relationships, including customers, suppliers, consultants and lessors, with respect to certain matters. We have agreed, under certain conditions, to hold these parties harmless against specified losses, such as those arising from a breach of representations or covenants, negligence or willful misconduct, and other third-party claims that our products and/or technologies infringe intellectual property rights. We may be compelled to enter into or accrue for probable settlements of alleged indemnification obligations, or we may be subject to potential liability arising from our customers’ involvement in legal disputes. In addition, notwithstanding the provisions related to limitations on our liability that we seek to include in our business agreements, the counterparties to such agreements may dispute our interpretation or application of such provisions, and a court of law may not interpret or apply such provisions in our favor, any of which could result in an obligation for us to pay significant additional damages and engage in costly legal proceedings. It is difficult to determine the maximum potential amount of liability under any indemnification obligations, whether or not asserted, due to the unique facts and circumstances likely to be involved in any particular claim. Our business, financial condition and operating results in a reported fiscal period could be materially and adversely affected if we expend significant amounts in defending or settling any asserted claims, regardless of their merit or outcomes.
Legal proceedings, enforcement actions and claims, whether with or without merit, and associated internal investigations, may be time-consuming and expensive to prosecute, defend or conduct; divert management’s attention and other resources; inhibit our ability to sell our products or services; result in adverse judgments for damages, injunctive relief, penalties and fines; and negatively affect our business.business, including result in a material adverse effect on our financial condition, operating results and cash flows. We can make no assurances regarding the outcome of current or future legal proceedings, enforcement actions, claims or investigations or that the insurance we maintain will be adequate to cover them.
33
Risks Related to Cybersecurity, Data Privacy and Intellectual Property Protection
We are exposed to risks related to cybersecurity threats and incidents and subject to restrictions of and changes in laws and regulations governing data privacy and data protection that could have a material adverse effect on our business.
We rely on various information technology networks and systems, some of which are managed by third parties, to process, transmit and store electronic information and to carry out and support a variety of business activities, including finance and accounting, order management, human resources, communications, manufacturing, research and development, intellectual property, supply chain management, sales and IT, including critical functions such as internet connectivity, network communications, and email. Some of these activities are processed via Software-as-a-Service (“SaaS”) products provided by third parties and hosted on their own networks and servers, or third-party networks and servers. The data on such various information technology networks and systems includes confidential information, personally identifiable information, transactional information and intellectual property belonging to us and our employees, customers, suppliersPandemics and other business partners.Widespread Health Crises
LikeThe effects of the COVID-19 pandemic had, and the emergence of other companies, we are subject to ongoing cybersecurity threats, including hacking, phishing, malware, ransomware, denial of service attacks, and other attacks. These threatswidespread health crises may be related to employee error or misuse to sophisticated and targeted attempts by bad actors to gain unauthorized access to information systems. We and our third-party vendors have experienced, and expect to continue to be subject to, cybersecurity threats and incidents, including industry-wide vulnerabilities, such as Log4j, which was reported in December 2021. We cannot guarantee that these and other attacks will not have, an impact in the future.
Despite the implementation of a variety of security controls and measures, as well as those of our third-party vendors, there is no assurance that such actions will be sufficient to prevent a cybersecurity incident due to attacks by hackers, employee error or malfeasance, computer viruses, malware and ransomware, telecommunication failures, systems failures, natural disasters, or other catastrophic events. We also face the challenge of supporting our older systems and implementing necessary upgrades. Further, as we transition to using more cloud-based solutions that are dependent on the internet or other networks to operate, we may become a greater target for cyber threats. As cyber threats continue to rapidly evolve and become increasingly more difficult to detect and defend against, our current security controls and measures may not be effective in preventing cybersecurity incidents and we may not have the capabilities to detect certain vulnerabilities. These risks may be further amplified by the increased reliance on remote access to IT systems as a result of use of SaaS software and cloud services as well as employees working remotely in response to the COVID-19 pandemic. Additionally, our merger, acquisition and divestiture activity may also require transitions to or from, and the integration of, various information management systems. Those systems that we acquire or that are used by acquired entities or businesses may also pose security risks of which we are unaware or unable to mitigate, particularly during the transition of these systems.
While we continue to assess and address the implications of existing and new domestic and foreign regulations relating to data privacy, the evolving regulatory landscape presents a number of legal and operational challenges, and our efforts to comply with these regulations may be unsuccessful. For example, regulations in the EU and China have established a prohibition on the transfer of personally identifiable information from their respective countries to other countries whose laws do not protect personal data to an adequate level of privacy or security. While we have utilized certain permitted approaches for transferring personally identifiable information from these countries to the United States, these approaches may be reviewed and invalidated by courts or regulatory bodies and we may be required to ascertain an alternative legal basis for such transfers.
A failure to comply with the ever-changing regulatory landscape, or a breach of our operational or security systems or infrastructure, or those of our customers, suppliers and other business partners, could disrupt our business; result in the disclosure, misuse, corruption or loss of confidential information, including intellectual property, personally identifiable information and other critical data of ours and our employees, customers, suppliers and other business partners; result in competitive disadvantages to the extent the information is competitively sensitive; damage our reputation; affect our relationships with our, employees, customers, suppliers and other business partners, including loss of confidence which could lead to loss of or reduction in orders; decrease the value of our investment in research, development and engineering; adversely affect our business operations including disruption of manufacturing processes; cause losses; result in liability under contracts; result in litigation; result in investigations; require notifications to regulatory authorities and impacted individuals; result in significant penalties and/or fines from regulatory bodies, including privacy laws and export control laws; add to the complexity of our compliance obligations; and increase our cybersecurity protection and remediation costs.
The costs of compliance with, and other burdens imposed by, privacy, cybersecurity, data protection and data localization laws, regulations and policies, including restrictions on marketing activities, could have a material adverse effect on our business, financial condition and operating resultsresults.
. Further, customersThe COVID-19 pandemic subjected, and third-party providers increasingly demand rigorous contractual provisions regarding privacy, cybersecurity, data protection, confidentiality,the emergence of other widespread health crises may subject, our business, financial condition and intellectual property, which may also increase our overall compliance burden.operating results to a number of risks, including:
Although we maintain insurance related to cybersecurity risks, all of these costs, expenses, liability
Our proprietary technology is important to the continued success of our business. Our failure to protect this proprietary technology may significantly impair our competitive position.
Our success and ability to compete depend in large part upon protecting our proprietary technology. Weparticular where we rely on a combination of patent, trademarksole and trade secret protectionlimited source suppliers, increased employee turnover, increased health and safety measures, site closures, and other agreements, such as nondisclosure agreementsrestrictions on the movement of people, goods and other contractual agreements with our employees and third parties, to protect our proprietary rights. The steps we have taken may not be sufficient to prevent the misappropriation of our intellectual property, particularly in countries outside the United States, where the laws may not protect our proprietary rights as fully as in the United States. For example, the patent prosecution and
enforcement systems within China, where we have a significant customer base and manufacturing presence, and where we have recently transferred several important laser product lines, are less robust than these systems in other jurisdictions and as a result, we may be limited inraw materials, which could reduce our ability to enforceobtain materials from suppliers and meet customer demand, in each case on favorable terms, on a timely basis, or at all, harming our intellectual property rights there. We would also likely be at a disadvantage in any enforcement proceeding in China as a foreign entity seeking protection against a Chinese company. Patentrelationships with customers, creating opportunities for competitors and trademark lawsexposing us to contractual disputes or liability;
These risks may be heightened in certain geographies, segments and markets. For example, some of our GMF customers were negatively impacted by disruptions associated with COVID-19 in China from the fourth quarter of 2022 into the first quarter of 2023. In addition, the COVID-19 pandemic exacerbated, and the emergence of other widespread health crises could materially affectexacerbate, the other risks described here and in our future operating results. We have infilings with the past and may in the future be subject to or may initiate interference proceedings or validity challenges in the U.S. Patent and Trademark Office, or similar international agencies, which can demand significant financial and management resources. The process of seeking patent protection can be time consuming and expensive and patents may not be issued from currently pending or future applications. Moreover, our existing patents or any new patents that may be issued may not be sufficient in scope or strength to provide meaningful protection or any commercial advantage to us. We may initiate claims, enforcement actions or litigation against third parties for infringement of our proprietary rights in order to determine the scope and validity of our proprietary rights or the proprietary rights of our competitors, which claims could result in costly litigation, the diversion of our technical and management personnel and the assertion of counterclaims by defendants, including counterclaims asserting invalidity of our patents. We will take such actions where we believe that they are of sufficient strategic or economic importance to us to justify the costSEC..
Risks Related to Owning Our Common Stock
Our quarterly operating results have fluctuated, and are likely to continue to vary significantly, which may result in volatility in the market price of our common stock.
A substantial portion of our shipments occurs shortly after an order is received, and therefore we generally operate with a relatively low level of backlog. As a result, a decrease in demand for our products from one or more customers could occur with limited advance notice and could have a significant adverse effect on our operating results in any particular period. Further, we often recognize a significant portion of the revenue of certain of our business lines in the last month of eacha fiscal quarter, due in part to the tendency of some customers to wait until late in a quarter to commit to purchase our products as a result of capital expenditure approvals and budgeting constraints occurring at the end of a quarter, or the hope of obtaining more favorable pricing from a competitor. Thus, variations in timing of sales can cause significant fluctuations in our quarterly sales, gross margin and profitability. In addition, orders expected to ship in one period could shift to another period due to changes in the timing of our customers’ purchase decisions, requests for rescheduled delivery dates, material shortages, manufacturing capacity constraints or logistics delays. Our orders are generally subject to rescheduling without penalty or cancellation without penalty other than reimbursement in certain cases for certain labor and material costs. Our operating results for a particular period may be adversely affected if our customers, particularly our largest customers, cancel or reschedule orders, or if we cannot fill orders in time due to material shortages, capacity constraints or unexpected delays in manufacturing, testing, shipping, delivery or product acceptance. Also, we base our manufacturing plans on our forecasted product mix. If the actual product mix varies significantly from our forecast, we may not be able to fill some orders, which would result in delays in the shipment of our products and could shift sales to a subsequent period. Moreover, a significant percentage of our expenses are fixed and based in part on expectations of net revenues. Our inability to adjust spending quickly enough to compensate for any shortfall would magnify the adverse impact of a shortfall in net revenues on our operating results. results.
Customers of our high-value, more complex products often require substantial time to qualify our products and make purchase decisions. In addition, some of our sales to defense and security customers are under major defense programs that involve
34
lengthy competitive bidding and qualification processes. These customers often perform, or require us to perform, extensive configuration, testing and evaluation of our products before committing to purchasingpurchase them, which can require a significant upfront investment in time and resources. The sales cycle for these products from initial contact through shipment varies significantly, is difficult to predict and can last more than a year. If we fail to anticipate the likelihood of, or the costs or timing associated with, sales of these products, or the cancellation or rescheduling of orders for these products, our business and operating results would be harmed.harmed.
Our worldwide sales to customers in the research and defense markets rely to a large extent on government funding for research and defense-related programs. Any decline in government funding as a result of reduced budgets in connection with fiscal austerity measures, revised budget priorities or other causes would likely result in reduced sales of our products that are purchased either directly or indirectly with government funding, which would have an adverse impact on our operating results. Concerns regarding the global availability of credit may also make it more difficult for our customers to raise capital, whether debt or equity, to finance their projects and purchases of capital equipment, which would adversely affect sales of our products and therefore harm our business and operating results. results.
Market seasonality also causes fluctuations in our operating results. MSD has generally experienced its strongest revenue in the second half of the fiscal year, mostly driven by consumption trends during the holiday season, and its lowest revenue in the first quarter of the fiscal year, mostly driven by the slowdown in production in China as a result of the Lunar New Year. In addition, we typically experience our strongest revenue in the research market in the fourth quarter of our fiscal year as a result of government spending patterns, and our highest revenue in the electronics manufacturing market in the second half of our fiscal year as a result of consumer spending during the holiday season.
Other factors that could cause fluctuations in our financial results include:
| • A worldwide economic slowdown or disruption in the global financial markets; • Fluctuations in our customers’ capital spending, industry cyclicality (particularly in the semiconductor, electronics manufacturing and automotive industries), levels of government funding available to our customers (particularly in the life and health sciences and the research and defense markets) and other economic conditions within the markets we serve; • The timing of the receipt of orders within a given period; • Demand for our products and the products sold by our customers; • Disruption in sources of supply; • Production capacity constraints; • Regulatory and trade restrictions in the countries where we source, manufacture or sell our products; • Specific features requested by customers; • Natural disasters or other events beyond our control (such as earthquakes, floods or storms, regional economic downturns, pandemics, social unrest, political instability, terrorism, or acts of war); • IT or infrastructure failures; • The timing of product shipments and revenue recognition within a given quarter; • Changes in our pricing practices or in the pricing practices of our competitors or suppliers, including as a result of inflationary pressures; • Our and our competitors’ timing in introducing new products; • Engineering and development investments relating to new product introductions, and significant changes to our manufacturing and outsourcing operations; • Market acceptance of any new or enhanced versions of our products; • The timing and level of inventory obsolescence, scrap and warranty expenses; • The availability, quality and cost of components and raw materials we use to manufacture our products; • Changes in our effective tax rates; • Changes in our capital structure, including cash, marketable securities and debt balances, and changes in interest rates; • Changes in bad debt expense based on the collectability of our accounts receivable; 35 • The timing, type and size of acquisitions and divestitures, and related expenses and charges; • Fluctuations in currency exchange rates; • Our expense levels; • Impairment charges for goodwill, intangible assets or long-lived assets; and • Fees, expenses and settlement costs or judgments against us relating to litigation or regulatory compliance.
|
|
|
|
|
|
|
|
|
|
|
|
|
|
|
|
|
|
|
|
|
|
|
|
|
|
|
|
|
|
|
|
|
|
|
|
|
|
|
|
|
|
|
|
|
|
|
|
As a result of these factors, among others, we may experience quarterly or annual fluctuations in our operating results, and our operating results for any period may fall below our expectations or the expectations of public market analysts or investors. In any such event, the price of our common stock could fluctuate or decline significantly. Consequently, we believe that quarter-to-quarter and year-to-year comparisons of our operating results, or any other similar period-to-period comparisons, may not be reliable indicators of our future performance.performance.
The market price of our common stock has fluctuated and may continue to fluctuate for reasons over which we have no control.
The stock market has from time to time experienced, and is likely to continue to experience, extreme price and volume fluctuations. For example, the closing price of our common stock ranged from a high of $112.97 to a low of $65.32 between January 1, 2023 and December 31, 2023. Prices of securities of technology companies have been especially volatile and have often fluctuated for reasons that are unrelated to the operating performance of the companies. Historically, the market price of shares of our common stock has fluctuated greatly and could continue to fluctuate due to a variety of factors. In the past, companies that have experienced volatility in the market price of their stock have been the objectssubject of securities class action litigation. If we become the subject of securities class action litigation, it could result in substantial costs and a diversion of our management’s attention and resources.resources.
We may not pay dividends on our common stock.
Holders of our common stock are only entitled to receive dividends when and if they are declared by our Board of Directors. Our credit facilities restrict our ability to pay dividends on our capital stock under certain circumstances. Although we have declared cash dividends on our common stock since 2011, and occasionally increased the dividends from prior
quarters, we are not required to do so, and we may reduce or eliminate our cash dividend in the future. This could adversely affect the market price of our common stockstock..
Some provisions of our restated articles of organization, as amended, our amended and restated by-laws and Massachusetts law could discourage potential acquisition proposals and could delay or prevent a change in control.
Anti-takeover provisions could diminish opportunities for stockholders to participate in tender offers, including tender offers at a price above the then-current market price of our common stock. Such provisions may also inhibit increases in the market price of our common stock that could result from takeover attempts. For example, while we have no present plans to issue any preferred stock, our Board of Directors, without further stockholder approval, may issue preferred stock that could have the effect of delaying, deterring or preventing a change in control of us. The issuance of preferred stock could adversely affect the voting power of the holders of our common stock, including the loss of voting control to others. In addition, our amended and restated by-laws provide for a classified Board of Directors consisting of three classes. Our classified board could also have the effect of delaying or deterring a change in control of our CompanyCompany.
Item 1B. Unresolved Staff Comments
None.
36
Item 1C. Cybersecurity
Risk Management and Strategy
Processes for Assessing, Identifying and Managing Material Risks from Cybersecurity Threats
We primarily assess, identify and manage material risks from cybersecurity threats through our enterprise information security program, which is maintained by our Chief Information Security Officer (“CISO”) and overseen by our Executive Vice President and Chief Information Officer (“CIO”).
Our enterprise information security program, which is designed to ensure that our information systems are adequately protected, is based on frameworks established by the National Institute of Standards and Technology and other applicable industry standards. Following the ransomware incident we identified in February 2023, we made certain enhancements to our enterprise information security program, including with respect to privileged access management, security monitoring and response, and application backup and recovery. We consider our enterprise information security program to be a key component of our overall risk management system.
As part of our enterprise information security program, we regularly assess and deploy technical safeguards designed to protect our information systems from cybersecurity threats. In addition, we maintain incident response and recovery plans, the effectiveness of which is tested and evaluated on a regular basis. We also provide privacy and security training to enhance employee awareness of how to detect and respond to cybersecurity threats.
We regularly engage assessors, consultants, auditors and other third parties to support our enterprise information security program. These assessments include a variety of activities, including information security maturity assessments, audits and independent reviews of our information security control environment and operating effectiveness.
The information provided by these assessments is used to improve our enterprise information security program, including cybersecurity policies, standards, processes and practices. In addition, the results of significant assessments are reported to management and the Audit Committee of our Board of Directors (the “Board”).
We also have processes in place to oversee and identify risks from cybersecurity threats associated with the use of third-party service providers. Third-party service providers are subject to security risk assessments at the time of on-boarding, contract renewal, and upon detection of an increase in risk profile. We have similar processes in place to oversee and identify cybersecurity-related risks posed by our suppliers.
Risks from Cybersecurity Threats
As discussed above, in February 2023, we identified that we had become subject to a ransomware incident. Based on our investigation, we concluded ransomware actors encrypted certain of our systems by deploying malware. This incident required us to temporarily suspend operations at certain of our facilities and had a material impact during the three months ended March 31, 2023 on our ability to process orders, ship products and provide service to our VSD and PSD customers.
In addition, based on our investigation of the incident, we became aware that ransomware actors may have exfiltrated personal information from our systems. We provided notifications to individuals and to regulators in accordance with applicable laws, and we may be required to provide additional notifications in the future.
We and our third-party administrators, vendors and partners are also subject to ongoing cybersecurity threats. While we cannot guarantee that these threats will not have an adverse impact on us, we do not believe such threats are reasonably likely to materially affect us, including our business strategy, results of operations, or financial condition.
Governance
Board of Directors’ Oversight of Risks from Cybersecurity Threats
The Audit Committee is primarily responsible for oversight of risks from cybersecurity threats. As provided for in the Amended & Restated Audit Committee Charter, the Audit Committee oversees the steps management has taken to monitor and control our data privacy and cybersecurity risk exposure. The Board delegated this responsibility to the Audit Committee in part because it includes members with significant experience and/or expertise in cybersecurity and other technology matters.
The Audit Committee is informed of risks from cybersecurity threats through regular reports from our CIO and CISO. The Audit Committee actively engages with our CIO and CISO regarding these risks. Depending on the materiality of a risk, the Audit Committee, CIO or CISO may report on such risk to the full Board.
37 In addition, from time to time, the Board may constitute a special committee to focus on a particular cybersecurity matter or risk. As discussed above, in February 2023, we identified that we had become subject to a ransomware incident. Our Board of Directors responded quickly and constituted a special committee of the Board for cybersecurity, which included Gerald G. Colella, the Chair of our Board, Elizabeth A. Mora, the Chair of our Audit Committee, and Peter J. Cannone III and Joseph B. Donahue, each a member of our Audit Committee, to oversee the investigation, recovery, and restoration phases following the incident (the “Special Committee”). The Special Committee held 21 meetings during the first three months following the identification of the incident. At these meetings, our Chief Executive Officer, our Chief Financial Officer, our General Counsel, our Executive Vice President of Operations and Corporate Marketing, and our then-Chief Information Officer reported to the Special Committee on various aspects of the incident, including the information technology forensic investigation, business restoration and recovery activities, and the impact of the incident on our annual audit and assessment of internal controls as well as the filing of our Annual Report on Form 10-K for the year ended December 31, 2022. Management’s Role in Assessing and Managing Material Risks from Cybersecurity Threats Management is integral to assessing and managing our material risks from cybersecurity threats. While all members of management are involved in the review of these risks, our CIO has primary oversight of our cybersecurity program. Our CIO is a seasoned technology leader and change agent who has served as the top technology executive for multi-billion-dollar global organizations spanning diverse industries. With over 25 years of experience, our CIO has led business and information technology transformation, implemented global digital strategies, and optimized and integrated governance, risk, and compliance frameworks, processes and technologies in complex regulatory and industry environments. We believe our CIO’s knowledge, skills and experience provide significant value to our Company. Our CIO and CISO provide regular reports to management regarding risks from cybersecurity threats and the prevention, detection, mitigation and remediation of cybersecurity incidents. Within our information technology organization, our CISO and other key members of our information security team provide regular reports to our CIO. As discussed above, our CIO and CISO also provide regular reports regarding risks from cybersecurity threats to our Audit Committee and, depending on the materiality of a risk, the full Board. In addition, from time to time, members of management may provide reports to a special committee of the Board for cybersecurity. For example, as discussed above, management provided regular reports to the Special Committee on various aspects of the ransomware incident we identified in February 2023. 38 Item 2. Properties
|
|
None.
|
|
The following table provides information concerning MKS’ principal and certain other owned and leased facilities as of December 31, 2021:2023:
Country | City | Sq. Ft. | Activity | Reportable Segment | Owned/Leased | |||||||
China |
|
| Manufacturing, |
|
| |||||||
|
|
|
|
| ||||||||
|
|
|
|
|
| |||||||
|
|
|
|
| Owned and Leased | |||||||
|
|
| Manufacturing and Service |
| Leased | |||||||
|
|
| Manufacturing, |
|
| |||||||
|
|
|
| MSD | Owned and Leased | |||||||
Germany | Berlin | 200,000 | Manufacturing, Office, Research and Development | MSD | Leased | |||||||
Feucht | 301,000 | Manufacturing, Warehouse, Office and Research and Development | MSD | Owned | ||||||||
Neuruppin | 170,000 | Manufacturing, Warehouse, Office and Research and Development | MSD | Owned | ||||||||
India | Manesar | 189,000 | Manufacturing, and Research and Development |
| Owned | |||||||
Mexico |
|
| Manufacturing and Service | VSD and PSD | Leased | |||||||
South Korea | Hwasung | 107,000 | Manufacturing, Sales, and Office | MSD | Owned and Leased | |||||||
Yongin-si | 179,000 | Research and Development, Office, Warehouse, Service, Sales | VSD | Owned | ||||||||
United States | Andover, MA | 76,000 | Corporate Headquarters and Research and Development | VSD | Leased | |||||||
Beaverton, OR | 113,000 | Manufacturing, Office and Warehouse |
| Leased | ||||||||
Broomfield, CO | 107,000 | Manufacturing, and Research and Development |
| Leased | ||||||||
Irvine, CA |
| Manufacturing, and Research and Development |
| Leased | ||||||||
Milpitas, CA | 103,000 | Manufacturing, Sales, Customer Support, Service and Research and Development |
| Leased | ||||||||
Rochester, NY | 156,000 | Manufacturing, Sales, Customer Support, Service and Research and Development |
| Owned | ||||||||
|
| Manufacturing, Warehouse, Office and Research and Development | MSD | Owned | ||||||||
Wilmington, MA | 118,000 | Manufacturing, Customer Support, Service and Research and Development |
| Owned | ||||||||
In addition to the significant facilities listed above, MKS also provideshas manufacturing, worldwide sales and marketing, customer support and services fromoperations in various other leased and owned facilities throughout the world. See “Business–“Business—Sales and Marketing” and “Business–“Business—Reportable Segments, and Product and Service Offerings” in Part I, Item 1 of this Annual Report on Form 10-K. We believe that our current facilities are suitable and adequate to meet our needs.
|
|
For a description of our material pendingItem 3. Legal Proceedings
We are subject to various legal proceedings see Note 23 toand claims, which have arisen in the Notes toordinary course of business. In the Consolidated Financial Statements contained in Part II, opinion of management, the ultimate disposition of these matters will not have a material adverse effect on our results of operations, financial condition or cash flows.
Item 8 of this Annual Report on Form 10-K.4. Mine Safety Disclosures
Not applicable.
39
|
|
Not applicable.
PART II
Item 5. Market for the Registrant’s Common Equity, Related Stockholder Matters and Issuer Purchases of Equity Securities
|
|
Common Stock
Our common stock is traded on the Nasdaq Global Select Market under the symbol MKSI.
OnAs of February 17, 2022,20, 2024, we had 7565 stockholders of record.
Dividend Policy and Cash Dividends
Holders of our common stock are entitled to receive dividends when and if they are declared by our Board of Directors. Our Board of Directors declared a cash dividend of $0.22 per share during each quarter of 2023, which totaled $59 million or $0.88 per share. During 2021,2022, our Board of Directors declared a cash dividend of $0.20 per share during the first quarter and $0.22 per share during each quarter of the second, third and fourth quarters,year, which totaled $48$52 million or $0.86 per share. During 2020, our Board of Directors declared a cash dividend of $0.20 per share during each quarter, which totaled $44 million or $0.80$0.88 per share.
On February 7, 2022,5, 2024, our Board of Directors declared a quarterly cash dividend of $0.22 per share to be paid on March 11, 20228, 2024 to shareholders of record as of February 28, 2022.26, 2024.
Future dividend declarations, if any, as well as the record and payment dates for such dividends, are subject to the final determination of our Board of Directors.Directors. The Board of Directors intends to declare and pay cash dividends on our common stock based on our financial conditions and results of operations of the Company, although it has no obligation to do so. Our credit facilities contain covenants that restrict our ability to grant cash dividends in certain circumstances.
Share Repurchase Program
On July 25, 2011, our Board of Directors approved, and on July 27, 2011, we publicly announced a share repurchase program for the repurchase of up to an aggregate of $200 million of our outstanding common stock from time to time in open market purchases, privately negotiated transactions or through other appropriate means. The timing and quantity of any shares repurchased depends upon a variety of factors, including business conditions, stock market conditions and business development activities, including, but not limited to, merger and acquisition opportunities. These repurchases may be commenced, suspended or discontinued at any time without prior notice.
During 20212023 and 2020, the Company2022, we did not repurchase any shares of common stock. We have repurchased approximately 2.6 million shares of common stock for approximately $127 million pursuant to the program since its adoption.
Comparative Stock Performance
The following graph compares the cumulative total shareholder return (assuming reinvestment of dividends) from investing $100 on December 31, 2016,2018, and plotted at the last trading day of each of the fiscal years ended December 31, 2017, 2018, 2019, 2020, 2021, 2022 and 20212023 of MKS’ common stock; a peer group index which represents a combination ofrepresenting all companies comprising the Morningstar Global SemiconductorS&P 1500 Composite Electronic Equipment Instruments & Materials Industry GroupComponents Index and Morningstar Global Scientific & Technical Instruments Industry Group Index, with these indices weighted equally; and the Nasdaq Market Index. The stock price performance onin the graph below is not necessarily indicative of future price performance.
40
Performance Graph

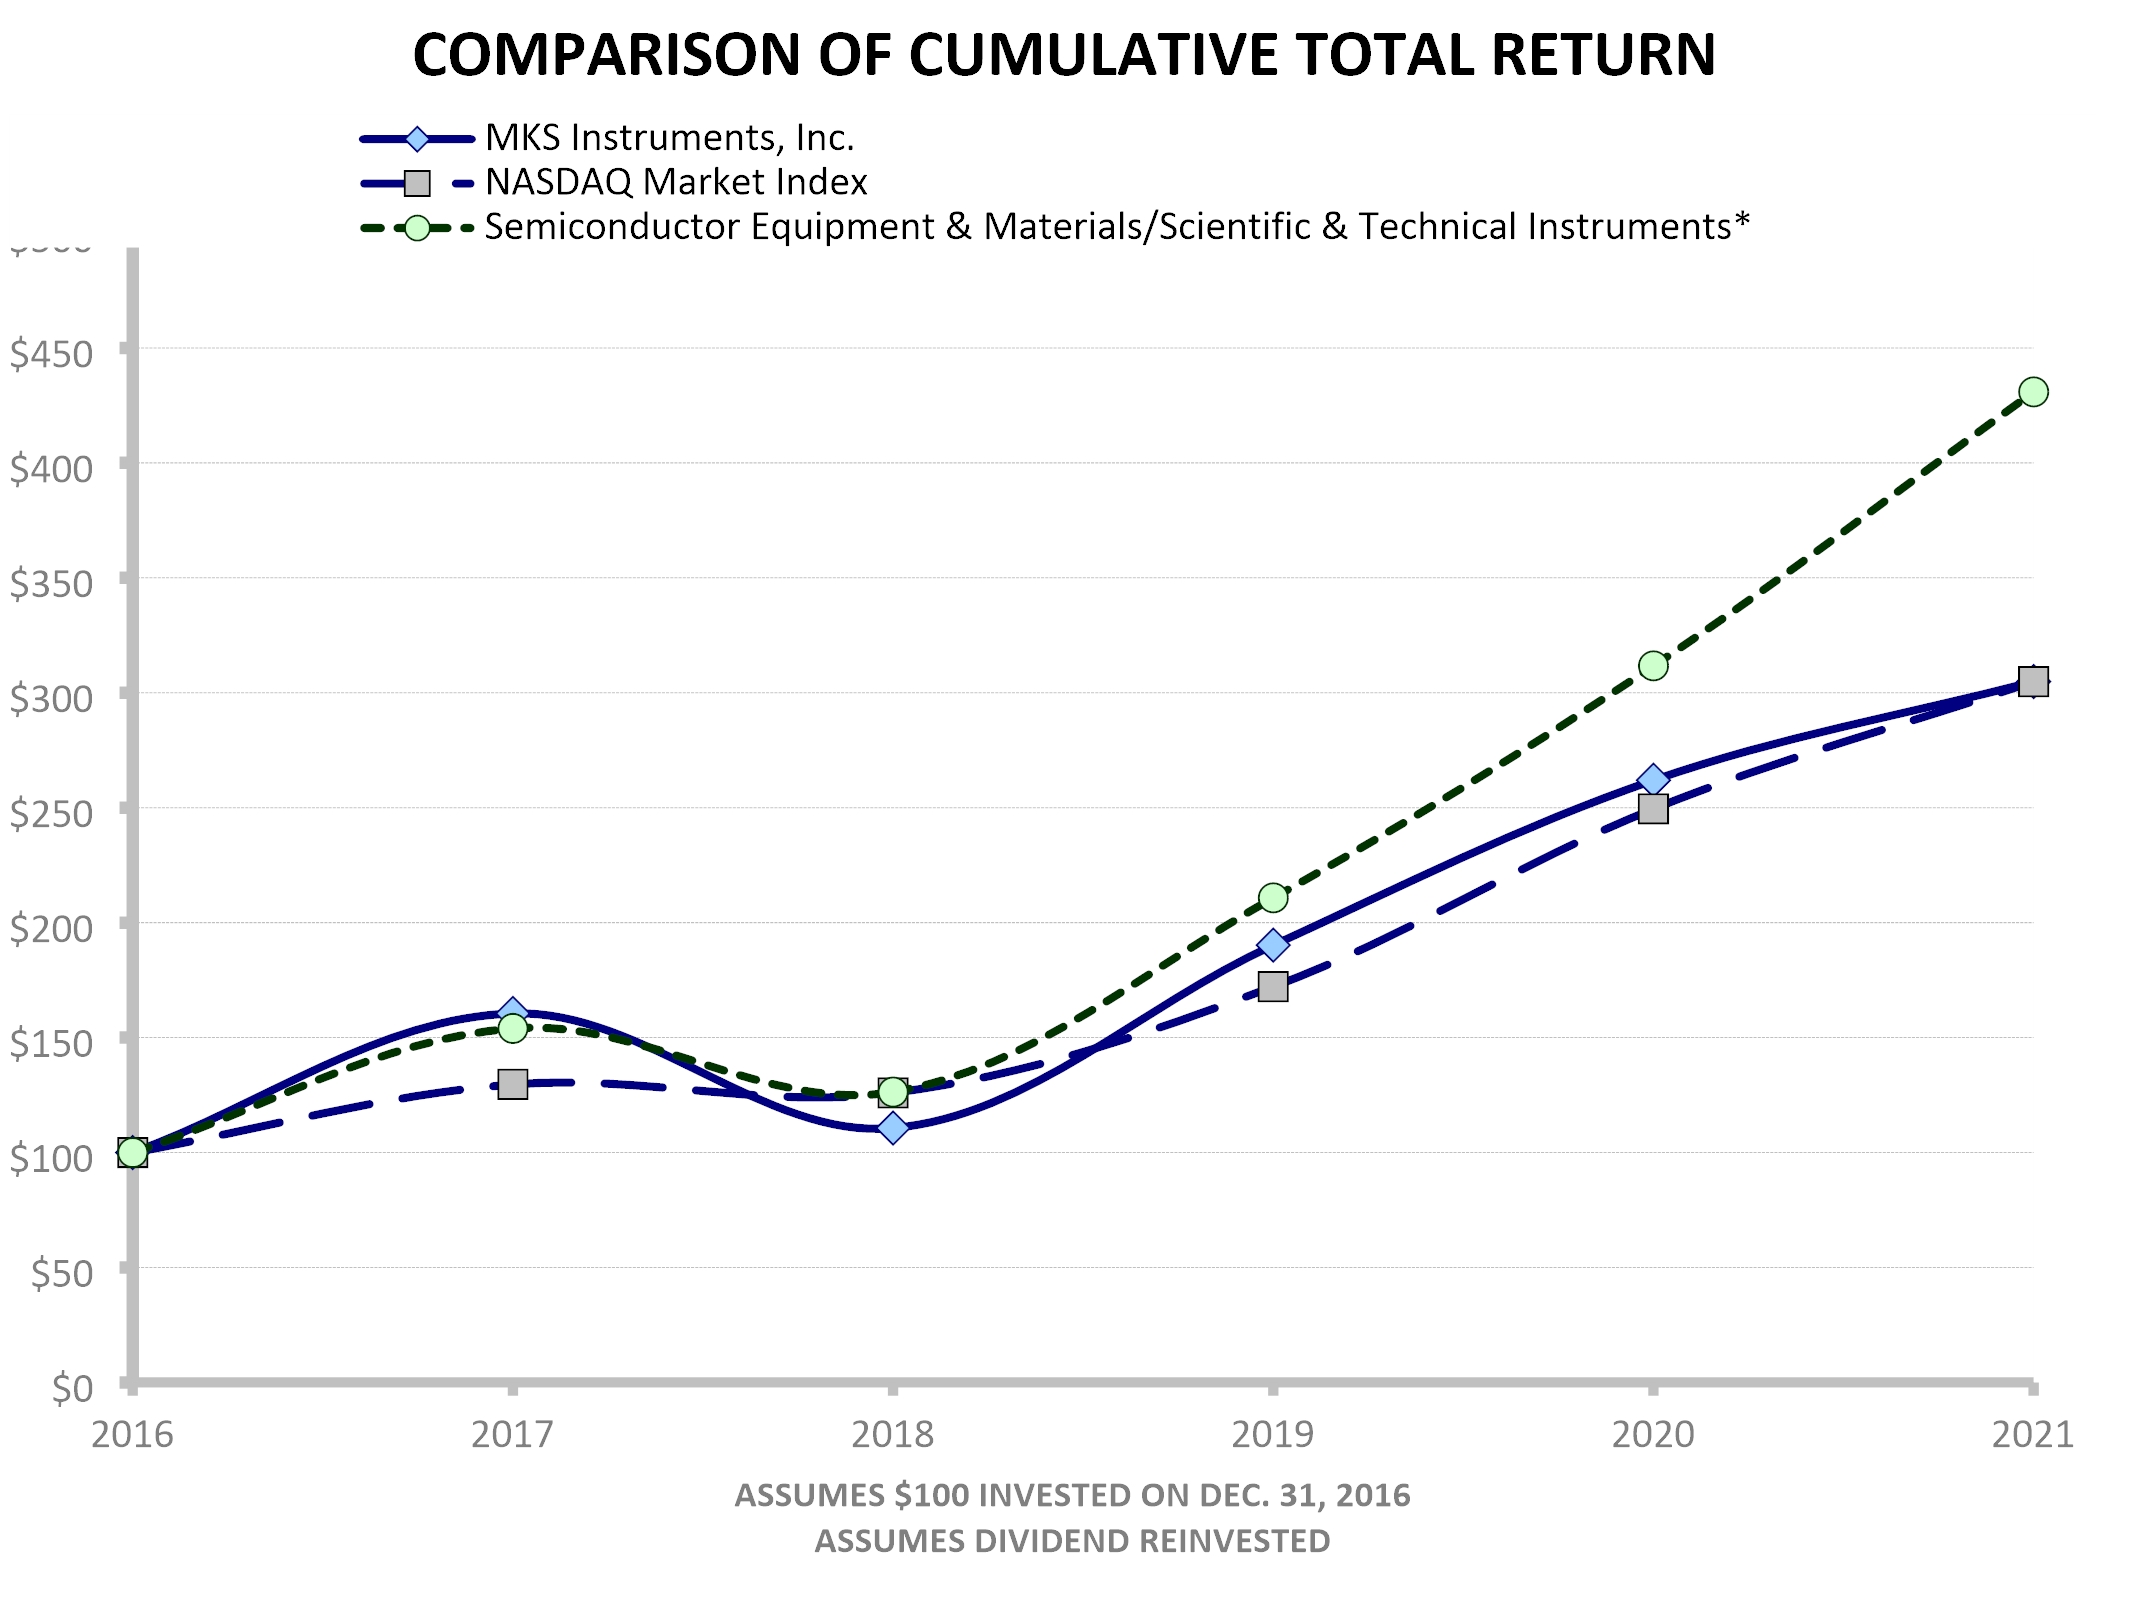
| 2018 |
| 2019 |
| 2020 |
| 2021 |
| 2022 |
| 2023 |
| ||||||
MKS Instruments, Inc. | $ | 100.00 |
| $ | 171.90 |
| $ | 236.70 |
| $ | 275.42 |
| $ | 135.02 |
| $ | 165.51 |
|
Nasdaq Market Index | $ | 100.00 |
| $ | 136.69 |
| $ | 198.10 |
| $ | 242.03 |
| $ | 163.28 |
| $ | 236.17 |
|
S&P 1500 Composite / Electronic Equipment, | $ | 100.00 |
| $ | 132.66 |
| $ | 164.30 |
| $ | 212.24 |
| $ | 166.02 |
| $ | 199.92 |
|
| 2016 |
| 2017 |
| 2018 |
| 2019 |
| 2020 |
| 2021 |
| ||||||
MKS Instruments, Inc. | $ | 100.00 |
| $ | 160.51 |
| $ | 110.65 |
| $ | 190.23 |
| $ | 261.97 |
| $ | 304.89 |
|
Nasdaq Market Index | $ | 100.00 |
| $ | 129.64 |
| $ | 125.96 |
| $ | 172.18 |
| $ | 249.51 |
| $ | 304.85 |
|
Morningstar Global Semiconductor Equipment & Materials and Morningstar Global Scientific & Technical Instruments | $ | 100.00 |
| $ | 154.00 |
| $ | 126.33 |
| $ | 210.81 |
| $ | 311.73 |
| $ | 430.90 |
|
*Morningstar Global Semiconductor Equipment & Materials and Morningstar Global Scientific & Technical Instruments indices weighted equally.Item 6. Reserved.
41 Item 7. Management’s Discussion and Analysis of Financial Condition and Results of Operations
|
|
|
|
The Management’s Discussion and Analysis of Financial Condition and Results of Operations or (“MD&A,&A”) describes principal factors affecting the results of our operations, financial condition, cash flows and liquidity, as well as our critical accounting policies and estimates that require significant judgment and thus have the most significant potential impact on our Consolidated Financial Statements, and is intended to better allow investors to view the Company from management’s perspective. This section focuses on material events and uncertainties known to management that are reasonably likely to cause reported financial information not to be necessarily indicative of our future operating results or of our future financial condition. This section provides an analysis of our financial results for the year ended December 31, 20212023 compared to the year ended December 31, 2020.2022. For the discussion and analysis covering the year ended December 31, 20202022 compared to the year ended December 31, 2019,2021, please refer to “Management’s Discussion and Analysis of Financial Condition and Results of Operations” in Part II, Item 7 of our Annual Report on Form 10-K for the year ended December 31, 2020,2022, as filed with the SEC on February 23, 2021.March 14, 2023.
Overview
We are a global provider ofenable technologies that transform our world. We deliver foundational technology solutions to leading edge semiconductor manufacturing, electronics and packaging, and specialty industrial applications. We apply our broad science and engineering capabilities to create instruments, systems, subsystems, andsystems, process control solutions that measure, monitor, deliver, analyze, power and control critical parameters of advanced manufacturing processes tospecialty chemicals technology that improve process performance, optimize productivity and productivityenable unique innovations for our customers.many of the world's leading technology and industrial companies. Our productssolutions are derived from our core competenciescritical to addressing the challenges of miniaturization and complexity in pressure measurementadvanced device manufacturing by enabling increased power, speed, feature enhancement and control, flow measurement and control, gas and vapor delivery, gas composition analysis, electronic control technology, reactive gas generation and delivery, power generation and delivery, vacuum technology, temperature sensing, lasers, photonics, optics, precision motion control, vibration control and laser-based manufacturing systems solutions. Weoptimized connectivity. Our solutions are also provide services relatingcritical to the maintenance and repairaddressing ever-increasing performance requirements across a wide array of our products, installation services and training. Our primary served markets include semiconductor,specialty industrial technologies, life and health sciences and research and defense.
Recent Eventsapplications.
AcquisitionsRansomware Event
On July 15, 2021,February 3, 2023, we completed our acquisition of Photon Control Inc. (“Photon Control” and such acquisition, the “Photon Control Acquisition”), pursuantidentified that we had become subject to a definitive agreement. Photon Control designs, manufacturesransomware event. We took immediate action to activate our incident response and distributes a wide rangebusiness continuity protocols to contain the incident, including engaging appropriate incident response professionals and notifying law enforcement authorities. We then initiated the recovery phase, contained the incident, reopened our affected manufacturing and service operations and completed restoration of optical sensors andour information technology (“IT”) systems, to measure temperature and position used in semiconductor wafer fabrication. At the effective time of the Photon Control Acquisition, each share of Photon Control’s common stock issued and outstanding as of immediately prior to the effective time of the Photon Control Acquisition was converted into the right to receive 3.60 per share in cash, in Canadian dollars (“CAD”), without interest and subject to deduction for any required withholding tax. We paid to the former Photon Control securityholders aggregate consideration of CAD 379 million or $303 million, excluding related transaction fees and expenses. We funded the payment of the aggregate consideration with available cash on hand. Photon Control is included inincluding our Light & Motion (“L&M”) segment.enterprise resource planning systems.
The Photon Control Acquisition has helped us deliverBased on oneour investigation, we concluded ransomware actors encrypted certain of our long-term strategic objectives, which issystems by deploying malware. This incident required us to broaden our portfolio of key technologies to better serve our customers. The Photon Control Acquisition further advances our strategy to enhance our Surround the Chamber® offering by adding optical sensors for temperature control for critical etch and deposition applications in semiconductor wafer fabrication.
On July 1, 2021, we entered into a definitive agreement (as amended from time to time, the “Implementation Agreement”) to acquire Atotech, a leading process chemicals technology company and a market leader in advanced electroplating solutions. Pursuant to the Implementation Agreement, we agreed to pay $16.20 per share in cash and 0.0552 of a sharetemporarily suspend operations at certain of our common stock for each outstanding common share of Atotech. At the time of the announcement of the acquisition, the total value of the aggregate cashfacilities and stock consideration was approximately $5.1 billion. The final value of the consideration will be determined at the time of the closing of the acquisition, which is expected to occurhad a material impact in the first quarter of 2022,2023 on our ability to process orders, ship products and provide service to our Vacuum Solutions Division (“VSD”) and Photonics Solutions Division (“PSD”) customers. As a result of our inability to fulfill orders, we estimated the ransomware event negatively impacted our revenue in the first quarter of 2023 by approximately $160 million. We recovered substantially all of this revenue in the second and third quarters of 2023, as we shipped orders that were delayed during the first quarter. The incident did not impact the operations of our Materials Solutions Division (“MSD”).
We engaged security specialists to assist in the review, assessment and remediation of our IT controls and strengthened access requirements and unauthorized access detection. We also implemented procedures to facilitate more timely restoration of our financial reporting systems.
As a result of the ransomware event, we incurred approximately $15 million of net costs for the twelve months ended December 31, 2023. These costs were primarily comprised of various third-party consulting services, including forensic experts, restoration experts, legal counsel, and other IT and accounting professional expenses, enhancements to our cybersecurity measures, costs to restore our systems and access our data, and employee-related expenses, including with respect to increased overtime. We expect to continue to incur these and other costs related to this incident in the future. As a result of the incident, we were previously subject to the satisfaction of certain closing conditions, including receipt of regulatory approval from Chinatwo lawsuits, and approval by the Royal Court of Jersey. Our obligations to complete the acquisition are notwe may be subject to any financing condition. We intendfuture litigation, investigations, claims or actions, in addition to fundfines, penalties, or other obligations related to impacted data, whether or not such data is misused. For additional information on the cash portionrisks we face related to this incident and other cybersecurity incidents, refer to “Risk Factors—Risks Related to Cybersecurity, Data Privacy and Intellectual Property Protection” and “Risk Factors—Legal, Tax, Regulatory and Compliance Risks” in Part I, Item 1A of the transaction with a combination of available cashthis Annual Report on hand and committed term loan debt financing. In connection with entering into the Implementation Agreement, we entered into (a) a commitment letter (the “Initial Commitment Letter”), dated as of July 1, 2021, with JPMorgan Chase Bank, N.A. and Barclays Bank PLC (collectively, the “Initial Commitment Parties”) and (b) joinders to the Initial Commitment Letter to add certain additional lender parties (the “Commitment Letter Joinders” and, together with the Initial Commitment Letter, the “Commitment Letter”) dated as of July 23, 2021, with the Initial Commitment Parties and the additional lenders party thereto (collectively, the “Supplemental Commitment Parties” and, together with the Initial Commitment Parties, the “Commitment Parties”), pursuant to which, subject to the terms and conditions set forth therein, the Commitment Parties committed to provide (i) a senior
secured term loan credit facility in an aggregate principal amount of $5.3 billion (the “New Term Loan Facility”) and (ii) a senior secured revolving credit facility with aggregate total commitments of $500 million (the “New Revolving Credit Facility”). The New Term Loan Facility and New Revolving Credit Facility would refinance our existing term loan facility (the “Term Loan Facility”) and our existing asset-based revolving credit facility (the “ABL Facility”), respectively, and the New Term Loan Facility would be used to finance a portion of the acquisition and to refinance certain existing indebtedness of Atotech. Form 10-K.
On October 22, 2021, we completed the syndication of the New Term Loan Facility, comprised of two tranches: a $4.7 billion loan at LIBOR plus 2.25%, a floor of 0.50% and 0.25% of original issue discount, and a Euro tranche of 0.5 billion Euro (“EUR”), or approximately $0.6 billion at EURIBOR plus 2.75%, a floor of 0.00% and 0.25% of original issue discount. Subsequent to the syndication, the $4.7 billion tranche is expected to be modified to reference a term rate based on SOFR (plus an applicable credit spread adjustment) as the benchmark rate.
The Commitment Parties’ obligations under the Commitment Letter and the closing and initial funding under the New Term Loan Facility are subject to certain customary conditions including, without limitation, the consummation of the acquisition of Atotech in accordance with the Implementation Agreement, the accuracy of specified representations and warranties of us and other customary closing conditions.
Segments and Markets
The Vacuum & Analysis (“V&A”) segment provides a broad range of instruments, componentsWe have three divisions, which are our reportable segments, known as VSD, PSD and subsystems whichMSD.
42
VSD delivers foundational technology solutions to leading edge semiconductor manufacturing, electronics and packaging and specialty industrial applications. VSD products are derived from our core competencies in pressure measurement and control, flow measurement and control, gas and vapor delivery, gas composition analysis, electronic control technology, reactive gas generation and delivery, power generation and delivery, and vacuum technology.
The L&M segmentPSD provides a broad range of instruments, components and subsystems whichto leading edge semiconductor manufacturing, electronics and packaging and specialty industrial applications. PSD products are derived from our core competencies in lasers, photonics, optics, temperature sensing, precision motion control and vibration control.
The Equipment & Solutions (“E&S”) segment providesMSD develops leading process and manufacturing technologies for advanced surface modification, electroless and electrolytic plating, and surface finishing. Applying a rangecomprehensive systems-and-solutions approach, MSD's portfolio includes chemistry, equipment, software, and services for innovative and high-technology applications in our electronics and packaging and specialty industrial markets.
Since our inception, we have focused on satisfying the needs of products including laser-based systems for PCB manufacturing,our customers by establishing long-term collaborative relationships. We have a diverse base of customers across our primary-served markets, which include flexible interconnect PCB processing systemssemiconductor, electronics and high-density interconnectpackaging, and specialty industrial.
|
| Years Ended December 31, |
| |||||||||||||
(dollars in millions) |
| 2023 |
|
| % Total |
|
| 2022 |
|
| % Total |
| ||||
Semiconductor |
| $ | 1,479 |
|
|
| 41 | % |
| $ | 2,041 |
|
|
| 58 | % |
Electronics and Packaging |
|
| 916 |
|
|
| 25 | % |
|
| 541 |
|
|
| 15 | % |
Specialty Industrial |
|
| 1,227 |
|
|
| 34 | % |
|
| 964 |
|
|
| 27 | % |
Total net revenues |
| $ | 3,622 |
|
|
| 100 | % |
| $ | 3,547 |
|
|
| 100 | % |
Semiconductor Market
MKS is a critical solutions provider for rigid PCB manufacturing and substrate processing and MLCC test systems.
Semiconductor Market
A significant portion of our sales is derived from products sold to semiconductor capital equipment manufacturers and semiconductor device manufacturers.manufacturing. Our products are used in major semiconductor processing steps, such as depositing thin films of material onto silicon wafer substrates,deposition, etching, cleaning, lithography, metrology, and inspection. The semiconductor industry continually faces new challenges as products become smaller, more powerful and highly mobile. Ultra-thin layers, smaller critical dimensions, new materials, 3D structures, and the ongoing need for higher yield and productivity drive the need for tighter process measurement and control, all of which MKS supports. We believe we are the broadest critical subsystem provider in the wafer fabrication equipment (“WFE”) ecosystem and address over 85% of the market. We have characterized our broad and unique offering as Surround the Wafer to reflect the technology enablement we provide across almost every major process in semiconductor manufacturing today.
Approximately 62%41% and 59%58% of our net revenues for 20212023 and 2020,2022, respectively, were from sales to semiconductor capital equipment manufacturers and semiconductor device manufacturers. We estimate global spending on WFE was approximately $80 billioncustomers in 2021 compared to approximately $56 billion in 2020, driven by increases in memory and logic and reflective of strong secular demand trends increasing semiconductor demand, such as robust data growth, 5G, Internet-Of-Things, artificial intelligence, and autonomous vehicles. We anticipate that the semiconductor market will continue to account formarket. This decrease was primarily a substantial portionresult of the full-year impact of the Atotech Acquisition, as MSD only sells into our sales.electronics and packaging and specialty industrial markets, as well as an overall decline in revenue from customers in our semiconductor market.
Net revenues from customers in our semiconductor market increaseddecreased by $439$562 million, or 32%28%, in 2021,2023, compared to 2020,2022, due primarily to increases in net revenues in V&A and L&M, offset by decreases in net revenues in E&S. V&A net revenues in our semiconductor market increased $393 million due to broad-based increases in demand for V&A products. L&M net revenues in our semiconductor market increased $73 million, driven by demand for our photonics solutions in lithography, metrology and inspection, as well as contributions from our acquisition of Photon Control. These increases were offset by a decrease of $27$541 million in net revenues in E&S, resulting fromVSD given decreased industry spending on deposition and etch equipment for memory applications, particularly NAND, where MKS is a critical solutions provider.
In general, the discontinuation of certain non-core products.
The semiconductor capital equipment industry is subject to rapid demand shifts, which are difficult to predict, and we cannot be certain as to the timing or extent of future demand or any future weaknesssoftening in the semiconductor capital equipment industry. In addition to these rapid demand shifts, the semiconductor capital equipment industry is subject to significant trade restrictions.
In 2021, we experienced supply chain disruptions, component shortagesOctober 2022, the U.S. Department of Commerce's Bureau of Industry and significant price increases forSecurity (“BIS”) implemented new and novel restrictions related to end-uses in semiconductor, semiconductor manufacturing, supercomputer, and advanced computing, along with certain components in our semiconductor market dueequipment used to global capacity constraints compounded by increasing global demanddevelop and produce them, as well as controls around the ongoing COVID-19 pandemic. We expect these disruptionsactivities of U.S. persons in certain markets, including China. These rules, which BIS amended in October 2023 (as amended, the “BIS Rules”), restrict our direct and shortagesindirect sales to continue inU.S. Arms Embargoed Countries, including China and primarily impact our semiconductor market. As a result of the near-term whileBIS Rules, we estimate our suppliers adjust to significant increases in demand and respond to the challenges posed by the COVID-19 pandemic, all of which may negatively impact net revenues from our semiconductor marketwere reduced by approximately $200 to $250 million in 2023.
Electronics and Packaging Market
MKS is a foundational solutions provider for the three months ending March 31, 2022.
Advanced Markets
In additionelectronics and packaging market. Our portfolio includes photonics components, laser drilling systems, electronics chemistries and plating equipment, that are critical for the manufacturing of PCBs and package substrates, and critical to wafer level packaging (“WLP”) applications. Similar to the semiconductor industry, the
43
PCB, package substrate and WLP industries demand smaller features, greater density, and better performance. In addition, the electronics and packaging market also includes sales of our productsvacuum and photonics solutions for display manufacturing applications. We characterize our complementary offering of laser systems and chemistry solutions as Optimize the Interconnect, to reflect the unique technology enablement we provide at the Interconnect level within PCBs, package substrates and WLPs.
Approximately 25% and 15% of our net revenues for 2023 and 2022, respectively, were from sales to customers in our electronic and packaging market. This increase was primarily a result of the full-year impact of the Atotech Acquisition, as MSD only sells into our electronics and packaging and specialty industrial markets.
Net revenues from customers in our electronics and packaging market increased by $375 million, or 69%, in 2023 compared to 2022. This increase was driven primarily by the full-year impact of the Atotech Acquisition, with MSD net revenues increasing by $403 million. This increase was primarily offset by a decrease of $26 million in PSD net revenues, in part due to decreased industry demand for flexible PCB via drilling systems as customers have temporarily slowed capacity expansion. In addition, demand for flexible PCB via drilling systems, which are useda part of PSD, and demand for chemistry solutions, which are a part of MSD, have softened due to a decline in theend market demand for consumer electronics, such as smartphones and personal computers.
Specialty Industrial Market
MKS’ strategy in specialty industrial is to leverage our domain expertise and proprietary technologies across a broad array of applications in industrial technologies, life and health sciences, and research and defense markets.
Industrial Technologies
Industrial technologies encompasses a wide range of diverse applications, including advanced electronicschemistries for functional coatings, surface finishing and wear resistance in the automobile industry, vacuum solutions for synthetic diamond manufacturing comprising flexible and rigid printed circuit board (“PCB”) processing/fabrication, electronic component manufacturing, glass coating and electronic thin films. Electronic thin films are a primary component of numerous electronic products including flat panel displays, light emitting diodes,photonics for solar cells and data storage media.manufacturing. Other applications include vacuum and photonics solutions for light emitting diode and laser marking, measurement and scribing, natural gas and oil production and environmental monitoring.diode manufacturing.
Life and Health Sciences
Our products for life and health sciences are used in a diverse array of applications, including bioimaging, medical instrument sterilization, medical device manufacturing, analytical, diagnostic and surgical instrumentation, consumable medical supply manufacturing and pharmaceutical production.
Research and Defense
Our products for research and defense are sold to government, university and industrial laboratories for applications involving research and development in materials science, physical chemistry, photonics, optics and electronics materials. Our products are also sold for monitoring and defense applications, including surveillance, imaging and infrastructure protection.
Approximately 38%34% and 41%27% of our net revenues in the years ended December 31, 2021for 2023 and 2020,2022, respectively, were from advancedcustomers in our specialty industrial market. This increase was primarily a result of the full-year impact of the Atotech Acquisition, as MSD only sells into our electronics and packaging and specialty industrial markets.
Net revenues from customers in our advanced marketsspecialty industrial market increased by $180$263 million, or 19%27%, in 2021,2023, compared to 2020,2022. This increase was driven primarily by the full-year impact of the Atotech Acquisition with E&S, V&A and L&M recordingMSD net revenue increasesrevenues increasing by $286 million offset by decreases of $67 million, $62$19 million and $51$4 million respectively. Net revenues in our industrial technologies market increased $164 million, primarily in advanced electronics manufacturing applications such as PCB processing/fabricationat VSD and electronic component manufacturing. Net revenues in our research and defense market increased $11 million, due to a rebound in demand following university and research lab closures in the first half of 2020 caused by the COVID-19 pandemic.PSD, respectively.
International Markets
A significant portion of our net revenues is from sales to customers in international markets. International net revenues accounted for approximately 57%66% and 55%58% of our total net revenues in 20212023 and 2020,2022, respectively. A significant portion of our international net revenues was from customers in China, Israel,Germany, Japan and South Korea and Taiwan.Korea. We expect that international revenues will continue to account for a significant percentage of total net revenues for the foreseeable future. Long-lived assets located outside of the United States accounted for approximately 25%58% and 28%57% of our total long-lived assets in 2021as of December 31, 2023 and 2020,2022, respectively. Long-lived assets include property, plant and equipment, net, right-of-use assets, and certain other assets and exclude goodwill, intangible assets and long-term tax-related accounts.assets.
44
Critical Accounting Policies and Estimates
The MD&A discusses our consolidated financial statements,Consolidated Financial Statements, which have been prepared in accordance with accounting principles generally accepted in the United States (“U.S. GAAP”). The preparation of these financial statements requires
management to make estimates and assumptions that affect the reported amounts of assets and liabilities and the disclosure of contingent liabilities at the date of the financial statements and the reported amounts of revenues and expenses during the reporting period. On an on-goingongoing basis, we evaluate our estimates and judgments, including those related to revenue recognition, inventory, warranty costs, pension plan valuations, stock-based compensation expense, intangible assets, goodwill and other long-lived assets and income taxes. We base our estimates and judgments on historical experience and on various other factors that are believed to be reasonable under the circumstances, the results of which form the basis for making judgments about the carrying values of assets and liabilities that are not readily apparent from other sources. Actual results may differ from these estimates under different assumptions or conditions.
We believe the following critical accounting policies affect the most significant judgments, assumptions and estimates we use in preparing our consolidated financial statements:Consolidated Financial Statements:
Revenue Recognition. We account for revenue using Accounting Standards Codification 606, “Revenue from Contracts with Customers” (“ASC Topic 606”). We apply ASC Topic 606 using the following steps:
|
|
|
|
|
|
|
|
|
|
Revenue under ASC 606 is recognized when or as obligations under the terms of a contract with our customer hashave been satisfied and control has transferred to the customer. The majority of our performance obligations, and associated revenue, are transferred to customers at a point in time, generally upon shipment of a product to the customer or receipt of the product by the customer and without significant judgments. We recognize revenue over time for contracts relating to the manufacturing, modifications and retrofits of our plating equipment, as the equipment is built to customer specification, and we have an enforceable right to payment for the performance completed to date. For these sales, we use the cost-to-cost input method to measure progress. In cases, where cost-to-cost is not proportionate to our progress in satisfying the performance obligation because of uninstalled materials, we adjust the measure of progress and recognize revenue to the extent of cost incurred to satisfy the performance obligation under the contract. Revenue from customized products with no alternative future use to us, and that have an enforceable right to payment for performance completed to date, is also recorded over time. We consider this to be a faithful depiction of the transfer to the customer of revenue over time as the work is performed or service is delivered. Adjustments for custom products were not material for 2023, 2022 or 2021.
Installation services, other than those related to our plating equipment, are not significant, and are usually completed in a short period of time (normally less than two weeks) and, therefore, are recorded at a point in time when the installation services are completed, rather than over time, as they are not material. Extended warranty, service contracts, and repair services, which are transferred to the customer over time, are recorded as revenue as the services are performed. For repair services, we make an accrual at each quarter end based upon historical repair times within our product groups to record revenue based upon the estimated number of days completed to date, which is consistent with ratable recognition. Customized products with no alternative future use to us, and that have an enforceable right to payment for performance completed to date, are also recorded over time. We consider this to be a faithful depiction of the transfer to the customer of revenue over time as the work is performed or service is delivered, ratably over time. The adjustments for custom products were not material for 2021 or 2020.
Revenue is measured as the amount of consideration we expect to receive in exchange for transferring goods or providing services. Performance obligations promised in a contract are identified based on the products or services that will be transferred to the customer that are both capable of being distinct, whereby the customer can benefit from the product or service either on its own or together with other resources that are readily available from third parties or from us, and are distinct in the context of the contract, whereby the transfer of the product or service is separately identifiable from other promises in the contract. Sales tax, value add tax, and other taxes we collect concurrent with revenue-producing activities are excluded from revenue. Our normal payment terms are 30 to 60 days but vary by the type and location of our customers and the products or services offered. The time between invoicing and when payment is due is not significant. For certain products and services and customer types, we require payment before the products or services are delivered to, or the services are performed for, the customer. None of our contracts asin each of December 31, 2021the periods presented contained a significant financing component.
We periodically enter into contracts with our customers in which a customer may purchase a combination of goods and or services, such as products with installation services or extended warranties. These contracts include multiple promisesdeliverables that we evaluate to determine if the promisesdeliverables are separate performance obligations. Once we determine the performance obligations, we then determine the transaction price, which includes estimating the amount of variable consideration to be included in the
45
transaction price, if any. To the extent the transaction price includes variable consideration, we estimate the amount of variable consideration that should be included in the transaction price utilizing either the expected value method or the most likely amount method, depending on the method we expect to better predict the amount of consideration to which itwe will be entitled. There are no constraints on the variable consideration recorded. We then allocate the transaction price to each performance obligation in the contract based on a relative stand-alone selling price charged separately to customers or using an expected cost-plus margin method. The corresponding revenues are recognized when or as the related performance obligations are satisfied, which are noted above. The impact of variable consideration has been immaterial.was immaterial in each of the periods presented.
Our standard assurance warranty is normally 12 to 24 months. We sometimes sell separately priced service contracts and extended warranty contracts related to certain of our products, especiallyin particular related to our laserplating and laser-based products. TheThese separately priced contracts generally range from 12 to 60 months. We normally receive payment at the inception of the contract or beginning of an annual period and recognize revenue over the term of the agreementcontract in proportion to the costs expected to be incurred in satisfying the obligations under the contract. We have elected to use the practical expedient related to disclosing remaining performance obligations as of December 31, 2023 and 2022, as the majority have a duration of less than one year.
We monitor and track the amount of product returns, provide for sales return allowances and reduce revenue at the time of shipment for the estimated amount of such future returns, based on historical experience. We make estimates evaluating our allowance for doubtful accounts. While product returns have historically been within our expectations and theestablished provisions, established, there is no assurance that we will continue to experience the same return rates that we have in the past. Any significant increase in product return rates could have a material adverse impact on our operating results for the period or periods in which such returns materialize.
While we maintain a credit approval process, significant judgments are made by management in connection with assessing our customers’customers' ability to pay at the time of shipment. Despite this assessment, from time to time, our customers are unable to meet their payment obligations. We continuously monitor our customers’ credit worthinesscustomers' creditworthiness and use our judgment in establishing a provision for estimated credit losses based upon our historical experience and any specific customer collection issues that we have identified. While such credit losses have historically been within our expectations and the provisions established, there is no assurance that we will continue to experience the same credit loss rates that we have in the past. A significant change in the liquidity or financial position of our customers could have a material adverse impact on the collectability of accounts receivable and our future operating results. Bad debt expense was immaterial in 20212023, 2022 and 2020.2021.
Inventory. We value our inventory at the lower of cost (first-in,or net realizable value, cost being determined using a standard costing system that approximates actual costs, based on a first-in, first-out method) or market.method. We regularly review inventory quantities on hand and record a provision to write-down excess and obsolete inventory to its estimated net realizable value, if less than cost, based primarily on our estimated forecast of product demand. Once our inventory value is written-down and a new cost basis has been established, the inventory value is not increased due to demand increases. Demand for our products can fluctuate significantly. A significant increase in the demand for our products could result in a short-term increase in the cost of inventory purchases as a result of supply shortages or a decrease in the cost of inventory purchases as a result of volume discounts, while a significant decrease in demand could result in an increase in the charges for excess inventory quantities on hand. In addition, our industry is subject to technological change, new product development and product technological obsolescence that could result in an increase in the amount of obsolete inventory quantities on hand. Therefore, any significant unanticipated changes in demand or technological developments could have a significant impact on the value of our inventory and our reported operating results. Excess and obsolete expense was $64 million, $21 million and $16 million for 2023, 2022 and $25 million for 2021, respectively. The higher excess and 2020, respectively.obsolete charge in 2023 was partially the result of an inventory write-off related to the discontinuation of a product line and partially the result of reduced forecasted usage.
Warranty Costs. We provide for the estimated costs to fulfill customer warranty obligations upon the recognition of the related revenue. We provide warranty coverage for our products for periods ranging from 12 to 36 months, with the majority of our products for periods ranging from 12 to 24 months. Short-term accrued warranty obligations, which expire within one year, are included in other current liabilities and long-term accrued warranty obligations are included in other liabilities in the consolidated balance sheets. We estimate the anticipated costs of repairing our products under such warranties based on the historical costs of the repairs and any known specific product issues. The assumptions we use to estimate warranty accruals are re-evaluated periodically in light of actual experience and, when appropriate, the accruals are adjusted. Our determination of the appropriate level of warranty accrual is based upon estimates. Should product failure rates differ from our estimates, actual costs could vary significantly from our expectations. Defective products will be either repaired or replaced, generally at our option, upon meeting certain criteria.
Pension Plans. Several of our non-U.S. subsidiaries have defined benefit pension plans covering employees of those subsidiaries. Some of the plans are unfunded, as permitted under the plans and applicable laws. For financial reporting purposes, we obtained actuarial reports supporting the calculation of net periodic pension costs that used a number of actuarial assumptions, including a discount rate for plan obligations, an assumed rate of return on pension plan assets and an assumed rate of compensation increase for employees covered by the various plans. We reviewed these actuarial assumptions and concluded they
46
were reasonable based upon our judgment, considering known trends and uncertainties. Actual results that differ from these assumptions would impact future expense recognition and the cash funding requirements of our pension plans.
Stock-Based Compensation Expense. We record compensation expense for all stock-based compensation awards to employees and directors based upon the estimated fair market value of the underlying instrument. Accordingly, stock-based compensation cost is measured at the grant date, based upon the fair value of the award.
We typically issue restricted stock units (“RSUs”) as stock-based compensation. We also provide certain employees the opportunity to purchase our shares through an Employee Stock Purchase Plan (“ESPP”). For RSUs, the fair value is the closing
market price of the stock on the date of grant. We estimate the fair value of shares issued under our ESPP using the Black-Scholes pricing model, which incorporates a number of complex and subjective variables, including expected stock price volatility over the term of the awards, expected life, risk freerisk-free interest rate and expected dividends. Management determined that blended volatility,stock-based compensation, a combination of historical and implied volatility, is more reflective of market conditions and a better indicator of expected volatility than historical or implied volatility alone.
Certain RSUs involve stock to be issued upon the achievement of performance conditions (“performance shares”) under our stock incentive plan. Such performance shares become available, subject to time-based vesting conditions if, and to the extent that, financial performance criteria for the applicable period are achieved. Accordingly, the number of performance shares earned will vary based on the level of achievement of financial performance objectives for the applicable period. UntilFor each quarter until such time that our financial performance can ultimately be determined, each quarter we estimate the number of performance shares to be earned based on an evaluation of the probability of achieving the financial performance objectives. Such estimates are revised, if necessary, in subsequent periods when the underlying factors change our evaluation of the probability of achieving the financial performance objectives. Accordingly, share-based compensation expense associated with performance shares may differ significantly from the amount recorded in the current period.
The assumptions used in calculating the fair value of share-based compensation awards represents management’s best estimates, but these estimates involve inherent uncertainties and the application of management’s judgment. As a result, if factors change and we use different assumptions, our stock-based compensation expense could be materially different in the future.
Intangible Assets, Goodwill and Other Long-Lived Assets. As a result of our acquisitions, we have identified intangible assets and generated significant goodwill. Definite-lived intangible assets are valued based on estimates of future cash flows and amortized over their estimated useful life. Determining fair value requires the exercise of significant judgment, including assumptions about appropriate discount rates as well as forecasted revenue, terminal growth rate, gross profit and operating margins.expenses.
Goodwill and indefinite-lived intangible assets are subject to annual impairment testing as well as testing upon the occurrence of any event that indicates a potential impairment. Intangible assets and other long-lived assets are also subject to an impairment test if there is an indicator of impairment. If our expectations of future results and cash flows are significantly diminished, intangible assets, goodwill and goodwillother long-lived assets may be impaired and the resulting charge to operations may be material. When we determine that the carrying value of intangiblesintangible assets or other long-lived assets may not be recoverable based upon the existence of one or more indicators of impairment, we use the projected undiscounted cash flow method to determine whether an impairment exists, and then measure the impairment using discounted cash flows. To measure impairment for goodwill, we compare the fair value of our reporting units by measuring discounted cash flows to the book value of the reporting units. Goodwill would be impaired if the resulting implied fair value was less than the recorded book value of the goodwill.
The estimation of useful lives and expected cash flows requirerequires us to make significant judgments regarding future periods that are subject to some factors outside of our control. Changes in these estimates can result in significant revisions to the carrying value of these assets and may result in material charges to the results of operations.
We have elected to perform our annual goodwill impairment test as of October 31 of each year, or more often if events or circumstances indicate that there may be impairment. Goodwill is the amount by which the cost of acquired net assets exceeded the fair value of those net assets on the date of acquisition. We allocate goodwill to reporting units at the time of acquisition or when there is a change in the reporting structure and base that allocation on which reporting units will benefit from the acquired assets and liabilities. Reporting units are defined as operating segments or one level below an operating segment, referred to as a component. The estimated fair value of our reporting units was based on discounted cash flow models derived from internal earnings and internal and external market forecasts. Determining fair value requires the exercise of significant judgment, including assumptions about appropriate discount and perpetual growth rates, as well as forecasted revenue growth rates and gross profit and operating margins.expenses. Discount rates are based on a weighted average cost of capital (“WACC”), which represents the average rate a business must pay its providers of debt and equity. The WACC used to test goodwill is derived from a group of comparable companies. Assumptions in estimating future cash flows are subject to a high degree of judgment and complexity. We make every effort to forecast these future cash flows as accurately as possible with the information available at the time the forecast is developed.
47
During the quarter ended June 30, 2023, as a result of softer industry demand, particularly in the personal computer and smartphone markets, we concluded there was a triggering event at our Electronics (“EL”) and general metal finishing (“GMF”) reporting units, which together constitute MSD, and our Equipment Solutions Business (“ESB”) reporting unit of PSD. We concluded there was no triggering event at our other reporting units within VSD and PSD.
For the EL, GMF and ESB reporting units, we performed a quantitative assessment of goodwill using a combination of a market approach and the income approach. This quantitative assessment resulted in a non-cash goodwill impairment of $826 million for the EL reporting unit, $428 million for the GMF reporting unit and $372 million for the ESB reporting unit. In addition, we recorded a $49 million impairment of in-process research and development (“IPR&D”) allocated to the EL reporting unit and a $152 million impairment related to completed technology allocated to the ESB reporting unit.
In performing our annual goodwill impairment test, we are permitted to first assess qualitative factors to determine whether it is more likely than not that the fair value of our reporting unit is less than its carrying amount, including goodwill. In performing the qualitative assessment, we consider certain events and circumstances specific to the reporting unit and to the entity as a whole, such as macroeconomic conditions, industry and market considerations, overall financial performance and cost factors when evaluating whether it is more likely than not that the fair value of thea reporting unit is less than its carrying amount. We are also permitted to bypass the qualitative assessment and proceed directly to the quantitative test.assessment. If we choose to
undertake the qualitative assessment and we conclude that it is more likely than not that the fair value of the reporting unit is less than its carrying amount, we would then proceed to the quantitative impairment test.assessment. In the quantitative assessment, we compare the fair value of the reporting unit to its carrying amount, which includes goodwill. If the fair value exceeds the carrying value, no impairment loss exists. If the fair value is less than the carrying amount, a goodwill impairment loss is measured and recorded.
As of October 31, 2021,2023, we performed our annual impairment assessment of goodwill by bypassing the qualitative assessment and using a qualitativequantitative assessment for all of our reporting units. We determined that itAs a result of higher WACC mainly caused by overall higher market interest rates, we recorded additional non-cash goodwill impairment charges of $48 million and $13 million at our EL and ESB reporting units, respectively. There was more likely than not thatno goodwill impairment at any of our other reporting units. In addition, we recorded a $14 million impairment of IPR&D allocated to the fair values were more than the carrying values for each of theEL reporting units.unit.
We will continue to monitor and evaluate the carrying value of goodwill.goodwill and intangible assets. If market and economic conditions or business performance deteriorate, this could increase the likelihood of us recording an impairment charge. Our stock price and any estimated control premium are factors affecting the assessment of the fair value of our underlying reporting units for purposes of performing any goodwill impairment assessment.
Income Taxes. We evaluate the realizability of our net deferred tax assets and assess the need for a valuation allowance on a quarterly basis. The future benefit to be derived from our deferred tax assets is dependent upon our ability to generate sufficient future taxable income in each jurisdiction of the right type to realize the assets. We record a valuation allowance to reduce our net deferred tax assets to the amount that is expected to be realized. To the extent we establish a valuation allowance, an expense is recorded within the provision for income taxes line in the consolidated statements of operations and comprehensive (loss) income.
Accounting for income taxes requires a two-step approach to recognize and measure uncertain tax positions. The first step is to evaluate the tax position for recognition by determining if, based on the technical merits, it is more likely than not that the position will be sustained upon audit, including resolutions of related appeals or litigation processes, if any. The second step is to measure the tax benefit as the largest amount that is more than 50% likely of being realized upon ultimate settlement. We re-evaluate these uncertain tax positions on a quarterly basis. This evaluation is based on factors including, but not limited to, changes in facts or circumstances, changes in tax law, effectively settled issues under audit and new audit activity. Any change in these factors could result in the recognition of a tax benefit or an additional charge to the tax provision.
Derivatives. As a result of our global operating activities and variable interest rate borrowings, we are exposed to market risks from changes in foreign currency exchange rates and interest rates, which may adversely affect our operating results and financial position. We address these risks through a risk management program that includes the use of derivative financial instruments. We operate the program pursuant to documented corporate risk management policies. We enter into derivative instruments for risk management purposes only, including derivatives designated as hedging instruments and those utilized as economic hedges. We do not enter into derivative instruments for trading or speculative purposes.
We have used derivative instruments, such as foreign exchange forward contracts and options, to manage certain foreign currency exposure, and interest rate swaps and interest rate caps to manage certain interest rate exposure. Changes in fair value of derivative instruments are recognized in the consolidated statement of operations or, if hedge accounting is applied, in Other Comprehensive (Loss) Income (“OCI”) for the effective portion of the changes in fair value. The cash flows resulting from foreign exchange forward contracts are classified in the consolidated statements of cash flows as part of cash flows from operating activities. All derivatives are stated at fair value in the consolidated balance sheets.
Accounting principles for qualifying hedges require detailed documentation that describes the relationship between the hedging instrument and the hedged item, including, but not limited to, the risk management objectives and hedging strategy and
48
the methods to assess the effectiveness of the hedging relationship. We assess the hedging relationships, both at the inception of the hedge and on an ongoing basis, using either the critical terms matching approach or a regression analysis approach to determine whether the designated hedging instrument is highly effective in offsetting changes in the value of the hedged item.
By nature, all financial instruments involve market and credit risks. We enter into derivative instruments with a diversified group of major investment grade financial institutions, for which no collateral is required. We have policies to monitor the credit risk of these counterparties. While there can be no assurance, we do not anticipate any material non-performance by any of these counterparties.
Results of Operations
The following table sets forth, for the periods indicated, the percentage of total net revenues of certain line items included in our consolidated statements of operations and comprehensive (loss) income data:
|
| Years Ended December 31, |
| |||||
|
| 2023 |
|
| 2022 |
| ||
Net revenues: |
|
|
|
|
|
| ||
Product |
|
| 88.3 | % |
|
| 87.9 | % |
Service |
|
| 11.7 |
|
|
| 12.1 |
|
Total net revenues |
|
| 100.0 |
|
|
| 100.0 |
|
Cost of revenues: |
|
|
|
|
|
| ||
Product |
|
| 48.3 |
|
|
| 50.0 |
|
Service |
|
| 6.4 |
|
|
| 6.4 |
|
Total cost of revenues (exclusive of amortization shown separately below) |
|
| 54.7 |
|
|
| 56.4 |
|
Gross profit |
|
| 45.3 |
|
|
| 43.6 |
|
Research and development |
|
| 8.0 |
|
|
| 6.8 |
|
Selling, general and administrative |
|
| 18.6 |
|
|
| 13.7 |
|
Acquisition and integration costs |
|
| 0.4 |
|
|
| 1.5 |
|
Restructuring |
|
| 0.6 |
|
|
| 0.3 |
|
Fees and expenses related to repricing of Term Loan Facility |
|
| 0.1 |
|
|
| — |
|
Amortization of intangible assets |
|
| 8.1 |
|
|
| 4.1 |
|
Goodwill and intangible asset impairments |
|
| 52.5 |
|
|
| — |
|
Gain on sale of long-lived assets |
|
| (0.1 | ) |
|
| (0.2 | ) |
(Loss) income from operations |
|
| (42.9 | ) |
|
| 17.4 |
|
Interest income |
|
| (0.5 | ) |
|
| (0.1 | ) |
Interest expense |
|
| 9.8 |
|
|
| 5.0 |
|
Loss on extinguishment of debt |
|
| 0.2 |
|
|
| — |
|
Other expense, net |
|
| 0.7 |
|
|
| 0.3 |
|
(Loss) income before income taxes |
|
| (53.2 | ) |
|
| 12.1 |
|
(Benefit) provision for income taxes |
|
| (2.4 | ) |
|
| 2.7 |
|
Net (loss) income |
|
| (50.8 | )% |
|
| 9.4 | % |
|
| Years Ended December 31, |
| |||||
|
| 2021 |
|
| 2020 |
| ||
Net revenues: |
|
|
|
|
|
|
|
|
Product |
|
| 87.4 | % |
|
| 86.5 | % |
Service |
|
| 12.6 |
|
|
| 13.5 |
|
Total net revenues |
|
| 100.0 |
|
|
| 100.0 |
|
Cost of revenues: |
|
|
|
|
|
|
|
|
Product |
|
| 46.5 |
|
|
| 47.5 |
|
Service |
|
| 6.7 |
|
|
| 7.5 |
|
Total cost of revenues (exclusive of amortization shown separately below) |
|
| 53.2 |
|
|
| 55.0 |
|
Gross profit |
|
| 46.8 |
|
|
| 45.0 |
|
Research and development |
|
| 6.8 |
|
|
| 7.4 |
|
Selling, general and administrative |
|
| 13.0 |
|
|
| 15.2 |
|
Acquisition and integration costs |
|
| 1.0 |
|
|
| 0.1 |
|
Restructuring and other |
|
| 0.4 |
|
|
| 0.4 |
|
Amortization of intangible assets |
|
| 1.9 |
|
|
| 2.4 |
|
Asset impairment |
|
| — |
|
|
| 0.1 |
|
COVID-19 related net credits |
|
| — |
|
|
| (0.1 | ) |
Income from operations |
|
| 23.7 |
|
|
| 19.5 |
|
Interest income |
|
| — |
|
|
| 0.1 |
|
Interest expense |
|
| 0.9 |
|
|
| 1.3 |
|
Other expense, net |
|
| 0.3 |
|
|
| 0.1 |
|
Income before income taxes |
|
| 22.5 |
|
|
| 18.2 |
|
Provision for income taxes |
|
| 3.8 |
|
|
| 3.1 |
|
Net income |
|
| 18.7 | % |
|
| 15.1 | % |
Year Ended December 31, 20212023 compared to 20202022
The following table sets forth our net revenues for products and services:
Net Revenues
|
| Years Ended December 31, |
| |||||
(Dollars in millions) |
| 2023 |
|
| 2022 |
| ||
Product |
| $ | 3,200 |
|
| $ | 3,119 |
|
Service |
|
| 422 |
|
|
| 428 |
|
Total net revenues |
| $ | 3,622 |
|
| $ | 3,547 |
|
|
| Years Ended December 31, |
| |||||
(Dollars in millions) |
| 2021 |
|
| 2020 |
| ||
Product |
| $ | 2,578.6 |
|
| $ | 2,014.8 |
|
Service |
|
| 371.0 |
|
|
| 315.2 |
|
Total net revenues |
| $ | 2,949.6 |
|
| $ | 2,330.0 |
|
Net product revenues increased $564$81 million in 2021,2023, compared to 2020. Net2022, primarily driven by the full-year impact of the Atotech Acquisition with MSD net product revenues fromincreasing by $668 million compared to 2022, partially offset by decreases in VSD and PSD product revenues of $533 million and $52 million, respectively. VSD and PSD net product revenues were negatively impacted by volume decreases as a result of softening demand in our semiconductor market increased $394 million due to broad-based increases in demand for semiconductor capital equipment across memory, foundry and logic manufacturing applicationselectronics and contributions from Photon Control, offset by a decrease in net revenues from E&S, due to a discontinuation of certain non-core products. Net revenues from our top ten customers accounted for 47%, 44% and 33% of net revenues for 2021, 2020 and 2019, respectively, with the increasing percentages attributable to increasing semiconductor market sales. As a percentage of net revenues from our top ten customers, semiconductor market revenue accounted for greater than 90% in each of these years. The semiconductor market has historically experienced cyclical variations in product supply and demand. It is subject to rapid demand shifts, which are difficult to predict, and we cannot be certain as to the timing or extent of future demand or any future weakness in the semiconductor capital equipment industry. For example, our semiconductor market revenue sequentially increased 32% in 2021, sequentially increased 49% in 2020, and sequentially decreased 19% in 2019. We believe net revenues attributable to our semiconductor market customers are affected by the cyclical nature of the semiconductor market.
Net product revenues in advanced markets increased $169 million due to increased net revenue from our industrial technologies markets, primarily in advanced electronics manufacturing applications such as PCB processing/fabrication andpackaging markets.
49
electronic component manufacturing. Net product revenues in our research and defense market also increased due to a rebound in demand following university and research lab closures in the first half of 2020 caused by the COVID-19 pandemic.
Net service revenues consisted mainly of fees for services related to the maintenance and repair of our products, sales of spare parts, and installation and training. Service revenues increased $56 million in 2021, compared to 2020. Net service revenues from our semiconductor customers increased $45decreased $6 million andin 2023, compared to 2022, primarily due to a decrease in VSD net service revenues from advanced marketof $28 million partially offset by the full-year impact of the Atotech Acquisition with MSD net service revenues increasing by $22 million. The decrease in VSD net service revenues was a result of decreases in sales to customers increased $11 million, both reflective of higher product revenues in both markets.our semiconductor market.
Total international net revenues, including product and service, were $1.7$2.4 billion in 2021,2023, compared to $1.3$2.1 billion in 2020.2022. The increase in 20212023 was primarily due todriven by the full-year impact of the Atotech Acquisition. The increase in international net revenues was primarily from increases in net revenues fromsales to customers in China, Japan, South KoreaIndia and Taiwan.Japan.
The following table sets forth our net revenues by reportable segment:
Net Revenues
|
| Years Ended December 31, |
| |||||
(Dollars in millions) |
| 2023 |
|
| 2022 |
| ||
Vacuum Solutions Division |
| $ | 1,404 |
|
| $ | 1,966 |
|
Photonics Solutions Division |
|
| 1,012 |
|
|
| 1,064 |
|
Materials Solutions Division |
|
| 1,206 |
|
|
| 517 |
|
Total net revenues |
| $ | 3,622 |
|
| $ | 3,547 |
|
|
| Years Ended December 31, |
| |||||
(Dollars in millions) |
| 2021 |
|
| 2020 |
| ||
Vacuum & Analysis |
| $ | 1,861.5 |
|
| $ | 1,405.9 |
|
Light & Motion |
|
| 813.4 |
|
|
| 689.6 |
|
Equipment & Solutions |
|
| 274.7 |
|
|
| 234.5 |
|
Total net revenues |
| $ | 2,949.6 |
|
| $ | 2,330.0 |
|
Net revenues for our V&AVSD segment increased $456decreased $562 million in 2021,2023, compared to 2020, due to a2022, which was largely reflective of volume increase of $393 million from ourdecreases in the semiconductor customers and an increase of $63 million from our advanced markets customers, primarily from customers in our industrial technologies market.
Net revenues for our L&MPSD segment decreased $52 million in 2023, compared to 2022, partially due to volume decreases in the semiconductor market and partially due to decreases in net revenues in the electronics and packaging market caused by decreased industry demand for flexible PCB via drilling equipment as a result of softened demand for electronics, such as personal computers, data center servers and smartphones.
Net revenues for our MSD segment increased $124$689 million in 2021,2023 compared to 2020,2022, primarily due to an increasethe full-year impact of $73 million from our semiconductor customers and an increase of $51 million from our advanced markets customers, primarily from customers in our industrial technologies market.the Atotech Acquisition.
Net revenues from our E&S segment increased $40 million in 2021, compared to 2020, due to an increase of $67 million from our advanced markets customers, primarily from customers in our industrial technologies market, partially offset by a decrease of $27 million from our semiconductor customers, resulting from the discontinuation of certain non-core products.
The following table sets forth gross profit as a percentage of net revenues by product and service:
Gross Profit Excluding Amortization
|
| Years Ended December 31, |
|
| % Points |
| ||||||
(As a percentage of net revenues) |
| 2023 |
|
| 2022 |
|
| Change |
| |||
Product |
|
| 45.4 | % |
|
| 43.1 | % |
|
| 2.3 | % |
Service |
|
| 45.0 |
|
|
| 47.4 |
|
|
| (2.4 | ) |
Total gross profit percentage |
|
| 45.3 | % |
|
| 43.6 | % |
|
| 1.7 | % |
|
| Years Ended December 31, |
|
| % Points |
| ||||||
(As a percentage of net revenues) |
| 2021 |
|
| 2020 |
|
| Change |
| |||
Product |
|
| 46.8 | % |
|
| 45.1 | % |
|
| 1.7 | % |
Service |
|
| 46.5 | % |
|
| 44.8 | % |
|
| 1.7 | % |
Total gross profit percentage |
|
| 46.8 | % |
|
| 45.0 | % |
|
| 1.8 | % |
Gross profit as a percentage of net product revenues increased by 1.72.3 percentage points in 2021,2023, compared to 2020,2022, primarily due to the full-year impact of the Atotech Acquisition, as MSD had higher revenue volumesgross margins than VSD and PSD, as well as favorable product mix.mix, including contributions from MSD and lower warranty costs. These increases in gross margin were partially offset by lower factory absorption at VSD and higher excess and obsolete inventory charges, mainly related to the discontinuation of a product line.
Gross profit as a percentage of net service revenues increaseddecreased by 1.72.4 percentage points in 2021,2023, compared to 2020,2022, primarily due to higher utilization of service technicians.unfavorable product mix and unfavorable overhead absorption partially offset by lower freight and duty costs.
The following table sets forth gross profit as a percentage of net revenues by reportable segment:
Gross Profit Excluding Amortization
|
| Years Ended December 31, | % Points |
| ||||||||
(As a percentage of net revenues) |
| 2023 |
|
| 2022 |
|
| Change |
| |||
Vacuum Solutions Division |
|
| 41.3 | % |
|
| 43.5 | % |
|
| (2.2 | )% |
Photonics Solutions Division |
|
| 43.7 |
|
|
| 46.9 |
|
|
| (3.2 | ) |
Materials Solutions Division |
|
| 51.4 |
|
|
| 37.1 |
|
|
| 14.3 |
|
Total gross profit percentage |
|
| 45.3 | % |
|
| 43.6 | % |
|
| 1.7 | % |
|
| Years Ended December 31, | % Points |
| ||||||||
(As a percentage of net revenues) |
| 2021 |
|
| 2020 |
|
| Change |
| |||
Vacuum & Analysis |
|
| 46.6 | % |
|
| 45.1 | % |
|
| 1.5 | % |
Light & Motion |
|
| 47.4 |
|
|
| 44.9 |
|
|
| 2.5 |
|
Equipment & Solutions |
|
| 46.3 |
|
|
| 45.2 |
|
|
| 1.1 |
|
Total gross profit percentage |
|
| 46.8 | % |
|
| 45.0 | % |
|
| 1.8 | % |
50
Gross profit as a percentage of net revenues for our V&A segment increasedVSD decreased in 2023, primarily due to higherlower revenue volumes and favorable product mix.unfavorable overhead absorption as a result of softening demand in our semiconductor market, and higher excess and obsolete inventory charges, partially offset by lower material costs.
Gross profit as a percentage of net revenues for our L&M segment increasedPSD decreased in 2023, primarily due to higher excess and obsolete inventory charges, mainly related to the discontinuation of a product line, lower revenue volumes and favorableunfavorable product mix partially offset by unfavorable overhead absorption.mix.
Gross profit as a percentage of net revenues for our E&S segmentMSD increased in 2023, primarily due to improved overhead absorptionthe full-year impact of the Atotech Acquisition which resulted in higher revenue volumes and favorable product mix. In addition, gross profit as a percentage was lower excess and obsolete charges.in 2022, due to $52 million of inventory step-up amortization related to the Atotech Acquisition.
Research and Development
|
| Years Ended December 31, |
| |||||
(Dollars in millions) |
| 2023 |
|
| 2022 |
| ||
Research and development |
| $ | 288 |
|
| $ | 241 |
|
|
| Years Ended December 31, |
| |||||
(Dollars in millions) |
| 2021 |
|
| 2020 |
| ||
Research and development |
| $ | 200.0 |
|
| $ | 173.1 |
|
Research and development expenses increased $27$47 million in 2021,2023, compared to 2020,2022, primarily due to increasesan increase of $19$56 million in compensation-related costs, $3resulting from the full-year impact of the Atotech Acquisition partially offset by decreases of $5 million in project materialsmaterial costs and $3$2 million in occupancy costs.professional and consulting fees.
Our research and development efforts are primarily focused on developing and improving our instruments, components, chemistry, subsystems, systems and process control and systems solutions to improve process performance and productivity.
We have thousands of products, and our research and development efforts primarily consist of a large number of projects related to these products, none of which is individually material to us. Current projectsProjects typically have durationsa duration of 3 to 3036 months depending upon whether thebut may be extended for development of new products.
We continue to make product is an enhancement of existing technology or a new product. Our products have continuously advanced as we striveadvancements to meet our customers’customers' evolving needs. We have developed, and continue to develop, new products to address industry trends, such as the shrinking of integrated circuit critical dimensions and technology inflections, and, in the flat panel display and solar markets, the transition to larger substrate sizes, which require more advanced processing and process control technology, the continuing drive toward more complex and accurate components and devices within the handset and tablet market, the transition to 5G for both devices and infrastructure, supporting the growth in units and via counts ofin the High Density Interconnecthigh-density interconnect PCB drilling market, and the industry transition to electric cars in the automotive market. In addition, we have developed, and continue to develop, products that support the migration to new classes of materials, ultra-thin layers, and 3D structures that are used in small geometry manufacturing. In our chemistry and equipment plating businesses, a majority of our research and development investment supports existing customers' product improvement needs and their short-term research and development goals, which enables us to pioneer new high-value solutions while limiting commercial risk. Research and development expenses consist primarily of salaries and related expenses for personnel engaged in research and development, fees paid to consultants, material costs for prototypes and other expenses related to the design, development, testing and enhancement of our products.
We believe that the continued investment in research and development and ongoing development of new products are essential to the expansion of our markets. We expect to continue to make significant investment in research and development activities. We are subject to risks from products not being developed in a timely manner, as well as from rapidly changing customer requirements and competitive threats from other companies and technologies. Our success primarily depends on many of our products being designed into new generations of equipment for the semiconductor, industryelectronics and advanced technologypackaging, and specialty industrial markets. We seek to develop products that are technologically advanced so that they are positioned to be chosen for use in each successive generation of semiconductor, capital equipmentelectronics and advancedpackaging, and specialty industrial markets applications. If our products are not chosen to be designed into our customers’ products, our net revenues may be reduced during the lifespan of those products.
Selling, General and Administrative
|
| Years Ended December 31, |
| |||||
(Dollars in millions) |
| 2023 |
|
| 2022 |
| ||
Selling, general and administrative |
| $ | 675 |
|
| $ | 488 |
|
|
| Years Ended December 31, |
| |||||
(Dollars in millions) |
| 2021 |
|
| 2020 |
| ||
Selling, general and administrative |
| $ | 385.1 |
|
| $ | 353.1 |
|
Selling, general and administrative expenses increased $32$187 million during 2021,2023, compared to 2020,2022, primarily due to increasesan increase of $26$173 million resulting from the full-year impact of the Atotech Acquisition and $15 million in compensation-relatednet costs $7 millionincurred in commissions and $3 million in information technology costs, partially offset by2023 as a decreaseresult of $4 million in professional fees.the ransomware event.
51
Acquisition and Integration Costs
|
| Years Ended December 31, |
| |||||
(Dollars in millions) |
| 2023 |
|
| 2022 |
| ||
Acquisition and integration costs |
| $ | 16 |
|
| $ | 52 |
|
|
| Years Ended December 31, |
| |||||
(Dollars in millions) |
| 2021 |
|
| 2020 |
| ||
Acquisition and integration costs |
| $ | 29.8 |
|
| $ | 3.8 |
|
Acquisition and integration costs incurred during 20212023 and 2022 were primarily related to consulting and professional fees in connection with our recently completed acquisition of Photon Control, our pending acquisition of Atotech and our proposed acquisition of Coherent, Inc. Acquisition and integration costs during 2020 consisted of integration costs related to the Atotech Acquisition.acquisition ofESI,consisting primarily of bonus and stock-based compensation for certain ESI executives assisting in the integration process and information technology related costs.
Restructuring and other
|
| Years Ended December 31, |
| |||||
(Dollars in millions) |
| 2021 |
|
| 2020 |
| ||
Restructuring and other |
| $ | 11.1 |
|
| $ | 9.4 |
|
|
| Years Ended December 31, |
| |||||
(Dollars in millions) |
| 2023 |
|
| 2022 |
| ||
Restructuring |
| $ | 20 |
|
| $ | 10 |
|
Restructuring and other costscharges incurred in 20212023 were related to severance costs as a result of various global cost savings initiatives implemented during the year. Restructuring charges in 2022 primarily related to duplicate facility costs attributedexecutive payments related to entering into new leases,the Atotech Acquisition, severance costs due to a global cost savingcost-saving initiative, severance costs relating to the pending closure of two facilities in Europe and the movement of certain product manufacturingproducts to low cost regionslow-cost regions..
RestructuringFees and other costs in 2020 primarily consistedexpenses related to repricing of duplicate facility costs attributed to entering into new facility leases, costsTerm Loan Facility
|
| Years Ended December 31, |
| |||||
(Dollars in millions) |
| 2023 |
|
| 2022 |
| ||
Fees and expenses related to repricing of Term Loan Facility |
| $ | 2 |
|
| $ | — |
|
In 2023, we recorded fees and expenses related to the exit of certain product groupsFirst Amendment, as defined and costs related to the pending closure of a facility in Europe. Such costs were offset by an insurance reimbursement related to a legal settlement.
described further below under “Credit Facilities.”
Amortization of Intangible Assets
|
| Years Ended December 31, |
| |||||
(Dollars in millions) |
| 2023 |
|
| 2022 |
| ||
Amortization of intangible assets |
| $ | 295 |
|
| $ | 146 |
|
|
| Years Ended December 31, |
| |||||
(Dollars in millions) |
| 2021 |
|
| 2020 |
| ||
Amortization of intangible assets |
| $ | 55.3 |
|
| $ | 55.2 |
|
Amortization of intangible assets were consistentincreased $149 million in 20212023, compared to 2020. New2022, primarily due to amortization costs in 2021 from our acquisition of Photon Control in July 2021 were offset by the decrease of certain intangible assets from the Atotech Acquisition.
Goodwill and Intangible Asset Impairments
|
| Years Ended December 31, |
| |||||
(Dollars in millions) |
| 2023 |
|
| 2022 |
| ||
Goodwill and intangible asset impairments |
| $ | 1,902 |
|
| $ | — |
|
During the quarter ended June 30, 2023, as a result of softer industry demand, particularly in the personal computer and smartphone markets, we concluded there was a triggering event at our L&M segmentEL and GMF reporting units, which together constitute MSD, and the ESB reporting unit of PSD. We concluded there was no triggering event at our other reporting units within VSD and PSD.
For the EL, GMF and ESB reporting units, we performed a quantitative assessment of goodwill using a combination of a market approach and income approach. Fair value estimates are based on complex series of judgments about future events and uncertainties and rely heavily on estimates and assumptions that became fully amortized.have been deemed reasonable by our management. There are inherent uncertainties and management judgment required in these determinations.
This quantitative assessment resulted in a non-cash goodwill impairment of $826 million for the EL reporting unit, $428 million for the GMF reporting unit and $372 million for the ESB reporting unit. In addition, we recorded a $49 million impairment of IPR&D allocated to the EL reporting unit and a $152 million impairment related to completed technology allocated to the ESB reporting unit.
On October 31, 2023, we performed our annual goodwill and intangible asset impairment assessment. As a result of higher WACC mainly caused by overall higher market interest rates, we recorded additional non-cash goodwill impairment charges of
52
$48 million and $13 million at our EL and ESB reporting units, respectively. In addition, we recorded a $14 million impairment of IPR&D allocated to the EL reporting unit. There were no impairments at any of our other reporting units.
We will continue to monitor and evaluate the carrying value of goodwill and intangible assets. If market and economic conditions or business performance deteriorate, the likelihood that we would record an impairment charge would increase, which could materially and adversely affect our financial condition and operating results.
.Gain on Sale of Long-Lived Assets
|
| Years Ended December 31, |
| |||||
(Dollars in millions) |
| 2023 |
|
| 2022 |
| ||
Gain on sale of long-lived assets |
| $ | (2 | ) |
| $ | (7 | ) |
In 2023 and 2022, we recorded gains as a result of receiving cash from the sale of a minority interest investment in a private company.
Interest Expense, Net
|
| Years Ended December 31, |
| |||||
(Dollars in millions) |
| 2023 |
|
| 2022 |
| ||
Interest expense, net |
| $ | 339 |
|
| $ | 173 |
|
|
| Years Ended December 31, |
| |||||
(Dollars in millions) |
| 2021 |
|
| 2020 |
| ||
Interest expense, net |
| $ | 24.8 |
|
| $ | 27.7 |
|
Interest expense, net, decreasedincreased by $3$166 million in 2021,2023, compared to 2020,2022, primarily due to lower interest expensethe full-year impact of borrowings under the Term Loan Facility, as described below.
Loss on extinguishment of debt
|
| Years Ended December 31, |
| |||||
(Dollars in millions) |
| 2023 |
|
| 2022 |
| ||
Loss on extinguishment of debt |
| $ | 8 |
|
| $ | — |
|
In connection with the First Amendment, as defined and described further below under “Credit Facilities,” we recorded a resultloss on extinguishment of lower interest rates and lower average debt balances as a result of principal payments made.debt.
Other Expense, Net
|
| Years Ended December 31, |
| |||||
(Dollars in millions) |
| 2023 |
|
| 2022 |
| ||
Other expense, net |
| $ | 27 |
|
| $ | 11 |
|
|
| Years Ended December 31, |
| |||||
(Dollars in millions) |
| 2021 |
|
| 2020 |
| ||
Other expense, net |
| $ | 8.6 |
|
| $ | 3.1 |
|
Other expense, net, for 20212023 and 20202022 primarily related to changes in foreign exchange rates.
(Benefit) Provision for Income Taxes
|
| Years Ended December 31, |
| |||||
(Dollars in millions) |
| 2023 |
|
| 2022 |
| ||
(Benefit) provision for income taxes |
| $ | (87 | ) |
| $ | 100 |
|
|
| Years Ended December 31, |
| |||||
(Dollars in millions) |
| 2021 |
|
| 2020 |
| ||
Provision for income taxes |
| $ | 114.1 |
|
| $ | 72.9 |
|
Our effective tax rates for 20212023 and 20202022 were 17.1%4.5% and 17.2%23.1%, respectively. Our effective tax rates wererate for 2023 was lower than the U.S. statutory tax rate, mainly due to the impairment of goodwill and intangible assets.
Our effective tax rate for 2022 was higher than the U.S. statutory tax rate, mainly due to additional withholding taxes related to the change of indefinite reinvestment assertion, the U.S. global intangible low-taxed income inclusion, offset by the U.S. deduction for foreign derived intangible income and the geographic mix of income earned by our international subsidiaries being taxed at rates lower than the U.S. statutory tax rate, the deduction for foreign derived intangible income and research credits offset by the tax effects of non-deductible executive compensation and the global intangible low taxed income inclusion.rate.
As of December 31, 2021, the2023, total gross unrecognized tax benefits, which excludes interest and penalties, was $43$86 million. As of December 31, 2020, the2022, total gross unrecognized tax benefits, which excludes interest and penalties, was $47$83 million. The net decreaseincrease was primarily attributable to the release of a reserve related to federal research tax credits, partially offset by an addition of a reserve related to foreign withholding taxes. unrecognized U.S. federal tax credits.
53
We accrue interest and, if applicable, penalties for any uncertain tax positions. Interest and penalties are classified as a component of income tax expense. As of December 31, 20212023 and 2020,2022, we accrued interest on unrecognized tax benefits of approximately $1$7 million and $1$6 million, respectively.
Over the next 12 months, it is reasonably possible that we may recognize approximately $4$12 million of previously net unrecognized tax benefits, excluding interest and penalties, related to various U.S. federal, state and foreign tax positions, primarily due to the expiration of statutes of limitations.
We are subject to examination by U.S. federal, state and foreign tax authorities. The U.S. federal statute of limitations remains open for tax years 20182020 through the present. The statute of limitations for our tax filings in other jurisdictions varies between fiscal years 20152017 through the present. We also have certain federal credit carryforwards and state tax loss and credit carryforwards that are open to examination for tax years 2002 through the present. In addition, the 2017 transition tax remains open for examination.
In 2021,2023, we recorded a net benefitcharge to income tax expense of $4$7 million, excluding interest and penalties, due to reserve releases related toadditional reserves offset by the expiration of certain statutes of limitations for previously open tax years.limitations. In 2020,2022, we recorded a net benefitcharge to income tax expense of $1$5 million, excluding interest and penalties, due to reserve releases related toadditional reserves offset by the closure of a tax audit and expiration of certain statutes of limitations for previously open tax years and the effective settlement of an Internal Revenue Service audit. limitations.
Our future effective tax rate depends on various factors, including the impact of tax legislation, further interpretations and guidance from U.S. federal and state governments on the impact of proposed regulations issued by the IRS,Internal Revenue Service, as well as the geographic composition of our pre-tax income and changes in income tax reserves for unrecognized tax benefits. A number of jurisdictions in which we operate are in the process of adopting Pillar Two Model Rules (“Pillar Two”) for a global 15% minimum tax as promulgated by the Organisation for Economic Co-operation and Development. Pillar Two could materially increase our future effective tax rate. We cannot be certain regarding the amount of the effective tax rate increase until all jurisdictions in which we operate adopt legislation and implement a version of Pillar Two. We monitor these factors and timely adjust our estimates of the effective tax rate accordingly. We expect the geographic mix of pre-tax income will continue to have a favorable impact on our effective tax rate. However, the geographic mix of pre-tax income can change based on multiple factors including the Atotech Acquisition, resulting in changes to the effective tax rate in future periods. While we believe we have adequately provided for all tax positions, amounts asserted by taxing authorities could materially differ from our accrued positions as a result of uncertain and complex application of tax lawlaws and regulations. Additionally, the recognition and measurement of certain tax benefits include estimates and judgment by management. Accordingly, we could record additional provisions or benefits for U.S. federal, state, and foreign tax matters in future periods as new information becomes available. On March 11, 2021, President Biden signed into law the American Rescue Plan Act of 2021 (“ARPA”). ARPA contains numerous income tax provisions, among other tax and non-tax provisions, to provide COVID-19 pandemic relief. We evaluated the ARPA legislation in relation to income taxes and it did not have a material impact on our financial statements in
2021. The ARPA income tax provisions that are effective in future years are being evaluated and we have not yet determined the impact on our consolidated financial statements.
Liquidity and Capital Resources
Cash, cash equivalents and short-term marketable investments totaled $1 billion at December 31, 2021, an increase of $2072023 and 2022 totaled $875 million compared to $836and $910 million, at December 31, 2020.respectively. The primary driver inof our current and anticipated future cash flows is, and we expect will continue to be, cash generated from operations, consisting primarily of our net (loss) income, excluding non-cash charges and changes in operating assets and liabilities.
Our total cash and cash equivalents and short-term marketable investments at December 31, 20212023 consisted of $619$319 million held in the United States and $419$556 million held by our foreign subsidiaries. We believe that our current cash and investments position and available borrowing capacity, together with the cash anticipated to be generated from our operations, will be sufficient to satisfy our estimated working capital, planned capital expenditure requirements, payments of debt, and any future cash dividends declared by our Board of Directors or share repurchases through at least the next 12 months and the foreseeable future.
In periods when our sales are growing, higher sales to customers will result in increased trade receivables, and inventories will generally increase as we build products for future sales. This may result in lower cash generated from operations. Conversely, in periods when our sales are declining, our trade accounts receivable and inventory balances will generally decrease, resulting in increased cash from operations.
Net cash provided by operating activities was $639$319 million for 20212023 and resulted from a net incomeloss of $551$1,841 million, which included non-cash net charges of $160$2,259 million, mainly as a result of goodwill and intangible asset impairment charges of $1,902 million, offset by ana net increase in working capital of $72$99 million. The net increase in working capital consistedwas primarily due to a decrease in accounts payable of an increase$99 million, a decrease in inventoriesincome taxes payable of $92$64 million and an increase in tradeinventory of $76 million. This net increase in working capital was partially offset by a decrease in accounts receivable of $53$114 million, both of which were theas a result of increasedlower business levels, in 2021, offset by an increase in accounts payable of $56 million from increased business levels and an increase in current and non-current accrued compensation of $17 million.
Net cash provided by operating activities was $513 million for 2020 and resulted from net income of $350 million, which included non-cash net charges of $152 million and a decrease in working capital of $11 million. The decrease in working capital consisted of a decrease in other current and non-current assets of $41$50 million, primarily as a result of a decrease in right of use assets of $31 million, and a decrease in other current and non-current assets of $19 million.
Net cash provided by operating activities was $529 million for 2022 and resulted from net income of $333 million, which included non-cash net charges of $353 million, offset by a net increase in working capital of $157 million. The net increase in working capital was primarily due to increases in inventory of $236 million, as a result of increased business levels, and a decrease of $31 million in accrued compensation, resulting from the collectionpayment of income tax receivables,variable compensation. These increases in working capital
54
were partially offset by a decrease in other current and non-current assets of $28 million, an increase in accounts payable of $61 million and an increase in income taxes payable of $22 million, an increase in accounts payable of $21 million, an increase in current and non-current accrued compensation of $19 million, primarily due to higher variable compensation, and an increase in other current and non-current liabilities of $5 million, offset by an increase in inventories of $52 million and an increase in trade accounts receivable of $45 million, both of which were the result of increased business levels in 2020.million.
Net cash used in investing activities was $205$84 million for 2021, reflecting2023, consisting primarily of $87 million in capital expenditures, offset by $3 million in proceeds from the purchasesale of Photon Controllong-lived assets.
Net cash used in investing activities was $4.6 billion for $268 million,2022, primarily due to $4.5 billion used for the Atotech Acquisition, net of cash and cash equivalents acquired, and purchases of property, plant and equipment of $87$164 million primarily for production related equipment,in capital expenditures, partially offset by the$76 million in net salesmaturities of short-term investments of $150 million. Net cash used in investing activities was $202 million for 2020, reflecting net purchases of short-term investments of $117 million and purchases of property, plant and equipment of $85 million, which included the buildout of three newly leased facilities in 2020investments..
Net cash used in financing activities was $65$259 million for 2021 and was2023, primarily due to $403 million of payments on our Term Loan Facility and $59 million of dividend payments, made to holders ofpartially offset by $216 million in proceeds from our common stock of $48 million and net payments of short and long-term borrowings of $14 million.Term Loan Facility.
Net cash used inprovided by financing activities was $121 million$4.0 billion for 2020 and was2022, primarily due to a repayment of$5.2 billion in net proceeds from our Term Loan Facility offset by $962 million of $59payments on borrowings, primarily related to payment of our prior term loan facility, a $100 million voluntary prepayment on the USD Tranche A (as defined below), a $22 million regularly scheduled payment on the Term Loan Facility, $52 million in dividend payments made to holdersand $249 million in payments of our common stock of $44 million and net payments related to tax payments for employee stock awards of $20 million, offset by net proceeds from short-term borrowings of $2 million. deferred financing costs.
For the year ended December 31, 2021,2023, we paid cash dividends of $48$59 million in the aggregate or $0.86$0.88 per share. For the year ended December 31, 2020,2022, we paid cash dividends of $44$52 million in the aggregate or $0.80$0.88 per share. Future dividend declarations, if any, as well as the record and payment dates for such dividends, are subject to the final determination of our Board of Directors. Holders of our common stock are entitled to receive dividends when and if they are declared by our Board of Directors. Under the terms of our Term Loan Facility and our ABLRevolving Facility, each as defined and described further below, we may be restricted from paying dividends under certain circumstances.
On February 7, 2022,5, 2024, our Board of Directors declared a quarterly cash dividend of $0.22 per share to be paid on March 11, 20228, 2024 to shareholders of record as of February 28, 2022.26, 2024.
Atotech Acquisition
On July 1, 2021,August 17, 2022 (the “Effective Date”), we entered intocompleted the Atotech Acquisition. The total net purchase price, including cash consideration, net of cash acquired, value of MKS shares issued, repayment of Atotech debt and settlement of share-based awards totaled $5.7 billion. We funded the payment of the aggregate cash consideration with a combination of cash on hand and the proceeds from the Term Loan Facility, as defined below. As a result of the Atotech Acquisition, we issued an Implementation Agreement to acquire Atotech, a leading process chemicals technology company and a market leader in advanced electroplating solutions. Pursuant to the Implementation Agreement, we agreed to pay $16.20 per share in cash and 0.0552aggregate of a share10.7 million shares of our common stock for each outstanding common share of Atotech. At the time of the announcement of the acquisition, the total value of the aggregate cash and stock consideration was approximately $5.1 billion. The final value of the consideration will be determined at the time of the closing of the acquisition, which is expected to occur in the first quarter of 2022, subject to the satisfaction of certain closing conditions, including receipt of regulatory approval from China and approval by the Royal Court of Jersey.former Atotech shareholders. Our obligations to complete the acquisition are not subject to any financing condition. Additional information regarding the funding of the acquisition, the New Term Loan Facility, the New Revolving Credit Facility, and the refinancing of the Term Loan Facility and ABL Facility, is discussed under “Recent Events” above.
Senior Secured Term Loan Credit FacilityFacilities
In connection with the completion of the acquisition of Newport Corporation (“Newport”) in 2016 (the “Newport Merger”),Atotech Acquisition, we entered into a term loanthe Credit Agreement, dated as of August 17, 2022, by and among us, the lenders and letter of credit agreement (as amended, the “Term Loan Credit Agreement”) with Barclaysissuers party thereto and JPMorgan Chase Bank, PLC,N.A., as administrative agent and collateral agent and the lenders(as amended from time to time, party thereto, whichthe “Credit Agreement”). The Credit Agreement provided for (i) a senior secured term loan credit facility comprised of three tranches: a $1.0 billion loan (the “USD Tranche A”), a $3.6 billion loan (the “2022 USD Tranche B” and together with the 2023 USD Tranche B (as defined below), as the context may require, the “USD Tranche B”) and a €600 million loan (the “Euro Tranche B” and together with the USD Tranche A and the USD Tranche B, the “Term Loan Facility”), each of which were borrowed in full on the original principal amountEffective Date, and (ii) a senior secured revolving credit facility of $780.0 million. We have entered into seven amendments to the Term Loan Credit Agreement since 2016, including most recently the May Term Loan Amendment (as defined below). The Term Loan Facility is subject to increase at our option$500 million (the “Revolving Facility” and, subject to receipt of lender commitments in accordancetogether with the Term Loan Credit Agreement.Facility, the “Credit Facilities”), with the commitments under each of the foregoing facilities subject to increase from time to time subject to certain conditions. The USD Tranche A was repaid in January 2024, as described below. The Revolving Facility has a maturity date ofin August 2027 while the Term Loan Facility is February 2, 2026. As of December 31, 2021, borrowingsUSD Tranche B and Euro Tranche B have a maturity date in August 2029.
Borrowings under the Term Loan FacilityCredit Facilities bear interest at a rate per annum equal to, at oneour option, any of the following, rates selected by us:plus, in each case, an applicable margin: (a) with respect to the USD Tranche A, the Revolving Facility and, prior to the effectiveness of the First Amendment (as defined below), the USD Tranche B, (x) a base rate determined by reference to the highest of (1) the federal funds effective rate plus 0.50%, (2) the “prime rate”prime rate quoted in The Wall Street Journal, or (3) a Londonforward-looking term rate based on the variable secured overnight financing rate (“Term SOFR”) (plus an applicable credit spread adjustment) for an interest period of one month, plus 1.00%; and (y) a Term SOFR rate (plus an applicable credit spread adjustment) for the interest period relevant to such borrowing, subject to a rate floor of (I) with respect to the USD Tranche B, 0.50% and (II) with respect to the USD Tranche A and the Revolving Facility, 0.0%; and (b) with respect to the Euro Tranche B, a Euro Interbank Offered Rate (“LIBOR”EURIBOR”) rate determined by reference to the costs of funds for U.S. dollar deposits for an interest period of one month adjusted for certain additional costs, plus 1.00%, and (4) a floor of 1.00%, plus, in each case, an applicable margin of 0.75%; or (b) a LIBOR rate determined by reference to the costs of funds for U.S. dollarEuro deposits for the interest period relevant to such borrowing adjusted for certain additional costs, subject to a LIBOREURIBOR rate floor of 0.0%, plus an. The USD Tranche A was issued with original issue discount of 0.25% of the principal amount thereof. The 2022 USD Tranche B and the Euro Tranche B were issued with original issue discount of 2.00% of the principal amount thereof. The applicable margin of 1.75%. We have electedfor borrowings under the interestUSD
55
Tranche A is 1.50% with respect to base rate as described in clause (b)borrowings and 2.50% with respect to Term SOFR borrowings. Prior to the effectiveness of the foregoing sentence.First Amendment, the applicable margin for borrowings under the USD Tranche B was 1.75% with respect to base rate borrowings and 2.75% with respect to Term SOFR borrowings. The applicable margin for borrowings under the Euro Tranche B is 3.00%. The applicable margin for borrowings under the Revolving Facility is 1.50% with respect to base rate borrowings and 2.50% with respect to Term LoanSOFR borrowings.
In addition to paying interest on outstanding principal under the Credit Facilities, we are required to pay a commitment fee in respect of the unutilized commitments under the Revolving Facility. The initial commitment fee is 0.375% per annum. Commencing with the delivery of financial statements with respect to the first quarter ending after the closing of the Credit Agreement, provides that, unless an alternate ratethe commitment fee is subject to downward adjustment based on our first lien net leverage ratio as of interest is agreed, all loans will be determined by reference to the base rate ifend of the LIBOR rate cannot be ascertained, if regulators impose material restrictions on the authoritypreceding quarter. We must also pay customary letter of a lender to make LIBOR rate loans, or for other reasons.credit fees and agency fees.
In May 2021,On October 3, 2023 (the “First Amendment Effective Date”), we entered into an amendmentthe First Amendment to Credit Agreement (the “May Term Loan“First Amendment”), which refinanced all of the $3.56 billion outstanding 2022 USD Tranche B (such refinanced loans, the “2023 USD Tranche B”) to (i) decrease the applicable margin for the USD Tranche B from 1.75% to 1.50% with respect to base rate borrowings and from 2.75% to 2.50% with respect to Term Loan Credit Agreement. The May Term Loan Amendment amends the Term Loan Facility to, among other things, (i) increase our ability to incur additional incremental debt facilities to (x) the greater of (1) $600 million and (2) 100% of consolidated EBITDA, plus (y) an amount equal to the sum of all voluntary prepayments of term loans under the Term Loan Facility, plus (z) an additional unlimited amount subject to pro forma compliance with a secured leverage ratio test of 3.25:1.00,SOFR borrowings and (ii) increase our flexibility under certain debt, lien, investment, restricted payment and disposition baskets.remove the credit spread adjustments applicable to borrowings of the USD Tranche B based on Term SOFR. The fees incurred, including certain customary lender consent fees, in connection2023 USD Tranche B were issued with the May Term Loan Amendment were immaterial.
We are required to make scheduled quarterly amortization payments each equal tooriginal issue discount of 0.25% of the original principal amount thereof.
On October 31, 2023, we made a voluntary prepayment of $100 million aggregate principal amount on the Term Loan Facility. As of December 31, 2021, the remaining balanceUSD Tranche A.
We incurred $242 million of deferred financefinancing fees and original issue discount and repricing fees related to the term loans under the Term Loan Facility funded on the Effective Date, which are included in long-term debt, net in the accompanying consolidated balance sheets and are being amortized to interest expense over the estimated life of the term loans using the effective interest method. A portion of the deferred financing fees and original issue discount was $8 million.
Asaccelerated in connection with the extinguishment of December 31, 2021, after giving effect to all amendments and repayments prior to such date, the outstanding principal amount ofour previously existing term loan facility concurrently with our entry into the Term Loan Facility was $824Facility.
We incurred $11 million of deferred financing fees and original issue discount related to the term loans under the 2023 USD Tranche B funded on the First Amendment Effective Date, of which $9 million is included in long-term debt, net in the accompanying consolidated balance sheets and is being amortized to interest rate was 1.8%.expense over the estimated life of the term loans using the effective interest method. We recorded an $8 million loss on extinguishment of debt in connection with the First Amendment of the 2022 USD Tranche B.
In connection with the various prepayments in 2022 and 2023, we wrote off a portion of the deferred financing costs related to the prepayments.
Under the Term Loan Credit Agreement, we are required to prepay outstanding term loans, subject to certain exceptions, with portions of our annual excess cash flow as well as with the net cash proceeds of certain of our asset sales, certain casualty and condemnation events and the incurrenceincurrences or issuanceissuances of certain debt.
If at any time the aggregate amount of outstanding loans, unreimbursed letter of credit drawings and undrawn letters of credit under the Revolving Facility exceeds the aggregate commitments under the Revolving Facility, we are required to repay outstanding loans and/or cash collateralize letters of credit, with no reduction of the commitment amount.
We may voluntarily prepay outstanding loans under the Credit Facilities from time to time, subject to certain conditions, without premium or penalty other than customary “breakage” costs with respect to Term SOFR or EURIBOR loans; provided, however, that subject to certain exceptions, (i) if on or prior to the date that was twelve months after the Effective Date, we prepaid any loans under the 2022 USD Tranche B or the Euro Tranche B in connection with a repricing transaction, we would have been required to pay a prepayment premium of 1.00% of the aggregate principal amount of the loans so prepaid and (ii) if on or prior to the date that is six months after the First Amendment Effective Date, we prepaid any loans under the 2023 USD Tranche B in connection with a repricing transaction, we must pay a prepayment premium of 1.00% of the aggregate principal amount of the loans so prepaid. Additionally, we may voluntarily reduce the unutilized portion of the commitment amount under the Revolving Facility.
We are required to make scheduled quarterly payments each equal to 1.25% of the original principal amount of the USD Tranche A (increasing to 1.875% in years 3 and 4 and 2.50% in year 5), 0.25% of the original principal amount of the Euro Tranche B and 0.25% of the original principal amount of the 2023 USD Tranche B, with the balance due thereunder on the fifth anniversary of the closing date in the case of the USD Tranche A and the seventh anniversary of the closing date in the case of the USD Tranche B and the Euro Tranche B.
There is no scheduled amortization under the Revolving Facility. Any principal amount outstanding under the Revolving Facility is due and payable in full on the fifth anniversary of the closing date.
We incurred $7 million of costs in connection with the Revolving Facility, which were capitalized and included in other assets in the accompanying consolidated balance sheets and are being amortized to interest expense over the estimated life of four
56
years. As a result of the termination of our previously existing revolving credit facility concurrently with our entry into the Revolving Facility, we wrote off an immaterial amount of previously capitalized debt issuance costs.
All obligations under the Term Loan FacilityCredit Facilities are guaranteed by certain of our wholly-owned domestic subsidiaries and are required to be guaranteed by certain of our future wholly-owned domestic subsidiaries, and are secured by substantially all of our assets and the assets of such subsidiaries, subject to certain exceptions and exclusions.
The Term LoanUnder the Credit Agreement, contains customary representations and warranties, affirmative and negative covenants and provisions relatingwe have the ability to events of default. If an event of default occurs, the lenders under the Term Loan Facility will be entitled to take various actions, including the acceleration of amounts due under the Term Loan Facility and all actions
generally permitted to be taken by a secured creditor. At December 31, 2021, we were in compliance with all covenants under the Term Loan Credit Agreement.
Senior Secured Asset-Based Revolving Credit Facility
In February 2019, in connection with the completion of the ESI Merger, we entered into an asset-based revolving credit agreement with Barclays Bank PLC, as administrative agent and collateral agent, the other borrowers from time to time party thereto, and the lenders and letters of credit issuers from time to time party thereto (the “ABL Credit Agreement”), that provides a senior secured asset-based revolving credit facility of up to $100 million, subject to a borrowing base limitation (the “ABL Facility”). We have entered into two amendments to the ABL Credit Agreement since 2019. As of December 31, 2021, after giving effect to all amendments, the borrowing base for the ABL Facility at any time equals the sum of: (a) 85% of certain eligible accounts; plus (b) prior to certain notice and field examination and appraisal requirements, the lesser of (i) 20% of net book value of eligible inventory in the United States and (ii) 30% of the borrowing base, and after the satisfaction of such requirements, the lesser of (i) the lesser of (A) 65% of the lower of cost or market value of certain eligible inventory and (B) 85% of the net orderly liquidation value of certain eligible inventory and (ii) 30% of the borrowing base; minus (c) reserves established by the administrative agent, in each case, subject toincur additional limitations and examination requirements for eligible accounts and eligible inventory acquired in an acquisition after February 1, 2019. The ABL Facility includes borrowing capacity in the form of letters of credit up to $25 million. We have not borrowed against the ABL Facility to date.
As of December 31, 2021, any borrowings under the ABL Facility bear interest at a rate per annum equal to, at our option, any of the following, plus, in each case, an applicable margin: (a) a base rate determined by reference to the highest of (1) the federal funds effective rate plus 0.50%, (2) the “prime rate” quoted in The Wall Street Journal, (3) a LIBOR rate determined by reference to the costs of funds for U.S. dollar deposits for an interest period of one month adjusted for certain additional costs, plus 1.00% and (4) a floor of 0.00%, plus, in each case, an applicable margin ranging from 0.25% to 0.50%; and (b) a LIBOR rate determined by reference to the costs of funds for U.S. dollar deposits for the interest period relevant to such borrowing adjusted for certain additional costs, with a floor of 0.00%, plus, in each case, an applicable margin ranging from 1.25% to 1.50%. The applicable margin for borrowings thereunder is subject to upward or downward adjustment each fiscal quarter, based on the average historical excess availability during the preceding quarter.
In addition to paying interest on any outstanding principal under the ABL Facility, we are required to pay a commitment fee in respect of the unutilized commitments thereunder equal to 0.25% per annum. We must also pay customary letter of credit fees and agency fees.
Under the ABL Facility, we are required to prepay amounts outstanding under the ABL Facility (1) if amounts outstanding under the ABL Facility exceed the lesser of (a) the commitment amount and (b) the borrowing base,incremental debt facilities in an amount requiredup to reduce such shortfall, (2) if amounts outstanding under the ABL Facility in any currency other than U.S. dollars exceed the sublimit for such currency, in an amount required to reduce such shortfall, and (3) during any period in which we have excess availability less than(x) the greater of (a) 10.0%(1) $1.01 billion and (2) 75% of the lesser of (x) the commitmentconsolidated EBITDA, plus (y) an amount and (y) the borrowing base (the “Line Cap”) and (b) $9 million for 3 consecutive business days, until the time when we have excess availability equal to or greater than the greatersum of (A) 10.0%all voluntary prepayments of the Line Cap and (B) $9 million for 30 consecutive days, or during the continuance of an event of default, with immediately available funds in our blocked accounts.
There is no scheduled amortization under the ABL Facility. Any principal amount outstanding under the ABL Facility is due and payable in full on the fifth anniversary of the closing date, subject to a springing maturity in the event that term loans under the Term Loan Facility, plus (z) an additional unlimited amount subject to pro forma compliance with certain leverage ratio tests (based on the security and priority of such incremental debt).
Under the USD Tranche A and the Revolving Facility, so long as any USD Tranche A loans (or commitments in respect thereof) are outstanding as of the end of any fiscal quarter, we may not allow our total net leverage ratio as of the end of such fiscal quarter to be greater than 5.25 to 1.00 for the fiscal quarters ending December 31, 2023 through September 30, 2024, with an annual step-down of 0.25:1.00 and subject to a step-up of 0.50:1.00 for the four full fiscal quarter period following any material acquisition, not to exceed 5.50 to 1.00.
In addition, in the event there are no loans outstanding under the USD Tranche A, as of the end of any fiscal quarter of ours when the aggregate amount of at least $100 million have an earlier maturity date than the ABL Facility.
All obligationsloans outstanding under the ABLRevolving Facility are guaranteed by certain(net of (a) all letters of credit (whether cash collateralized or not) and (b) unrestricted cash of ours and our domestic subsidiaries and are secured by substantiallyrestricted subsidiaries) exceeds 35% of the aggregate amount of all commitments under the Revolving Facility in effect as of our assetssuch date, we may not allow its first lien net leverage ratio as of the end of each such fiscal quarter to be greater than 6.00 to 1.00.
The USD Tranche B and the assetsEuro Tranche B are not subject to financial maintenance covenants.
The Credit Agreement contains a number of such subsidiaries,negative covenants that, among other things and subject to certain exceptions, restrict our ability and exclusions.
From the time when we have excess availability less than the greatereach of (a) 10.0% of the Line Capour subsidiaries to: incur additional indebtedness; pay dividends on its capital stock or redeem, repurchase or retire its capital stock or its subordinated indebtedness; make investments, loans and (b) $9 million until the time when we have excess availability equal to or greater than the greater of (a) 10.0% of the Line Cap and (b) $9 million for 30 consecutive days, or during the continuance of an event of default, the ABL Credit Agreement requires that we maintain a fixed charge coverage ratio, testedacquisitions; create restrictions on the last daypayment of each fiscal quarter,dividends or other amounts to ourselves from our restricted subsidiaries or restrictions on the ability of at least 1.0our restricted subsidiaries to 1.0.incur liens; engage in transactions with its affiliates; sell assets, including capital stock of its subsidiaries; materially alter the business it conducts; consolidate or merge; incur liens; and engage in sale-leaseback transactions.
The ABL Credit Agreement also contains customary representations and warranties, affirmative covenants and provisions relating to events of default. If an event of default occurs, the lenders under the ABL FacilityCredit Facilities will be entitled to take various actions, including the acceleration of amounts due under the ABL FacilityCredit Facilities and all actions permitted to be taken by a secured creditor. As of December 31, 2023, we were in compliance with all covenants under the Credit Agreement.
The proceeds of the Term Loan Facility were used on the Effective Date, among other things, to fund a portion of the consideration payable in connection with the Atotech Acquisition and to refinance the existing term loan and revolving credit facilities of ours and certain indebtedness of Atotech. We also paid certain customary fees to and expenses of JPMorgan Chase Bank, N.A., Barclays Bank PLC, BofA Securities, Inc., Citibank, N.A., HSBC Securities (USA) Inc. and Mizuho Bank, Ltd. in their respective capacities as lead arrangers and bookrunners in connection with the Credit Facilities. The proceeds of the 2023 USD Tranche B were used on the First Amendment Effective Date to refinance the 2022 USD Tranche B. We also paid certain customary fees to and expenses of JPMorgan Chase Bank, N.A. in its capacity as lead arranger in connection with the 2023 USD Tranche B.
As of December 31, 2023, after total principal prepayments of $200 million and regularly scheduled principal payments of $109 million, the aggregate outstanding principal amount of the Term Loan Facility was $4.95 billion and the weighted average interest rate was 7.7%. As of December 31, 2023, there were no borrowings under the Revolving Facility.
2024 Amendments and Prepayment of Credit Facilities
On January 22, 2024 (the “Second Amendment Effective Date”), we entered into the Second Amendment to Credit Agreement (the “Second Amendment”), which amended the Credit Agreement. Pursuant to the Second Amendment, we (i) borrowed additional USD Tranche B (as defined below) loans (the “Incremental USD Tranche B Loans”) in an aggregate principal amount of $490 million, (ii) borrowed additional Euro Tranche B (as defined below) loans (the “Incremental Euro Tranche B Loans” and together with the Incremental USD Tranche B Loans, the “Incremental Tranche B Loans”) in an aggregate principal amount of €250 million and (iii) used a portion of the proceeds of the Incremental Tranche B Loans to prepay our USD Tranche A (as defined below) in full in an aggregate principal amount of $744 million. Remaining proceeds of the Incremental Tranche B Loans were used to pay fees and expenses in connection with the Second Amendment and will be used for working capital and general corporate purposes. The Incremental USD Tranche B Loans and the Incremental Euro Tranche B Loans have identical terms to our existing USD Tranche B and Euro Tranche B loans (collectively, together with the Incremental Tranche B
57
Loans, the “Tranche B Loans”), respectively, under the Credit Agreement. Additionally, pursuant to the Second Amendment, the 1.00% prepayment premium applicable to any Tranche B Loans prepaid in connection with certain repricing transactions was extended for a period of six months following the Second Amendment Effective Date. The Incremental Tranche B Loans were issued with original issue discount of 0.25%. In connection with the execution of the Second Amendment, we paid customary fees and expenses to JPMorgan Chase Bank, N.A.
On February 5, 2024, we made a voluntary prepayment of $50 million aggregate principal amount on the USD Tranche B.
On February 13, 2024, we entered into the Third Amendment to Credit Agreement (the “Third Amendment”). Pursuant to the Third Amendment, we increased the available borrowing capacity under our Revolving Facility by $175 million (the “Incremental Revolving Commitments”), from $500 million to $675 million. In connection with the execution of the Third Amendment, we paid customary fees and expenses to the lenders providing the Incremental Revolving Commitments and to JPMorgan Chase Bank, N.A.
Lines of Credit and Short-Term Borrowing Arrangements
OurCertain of our Japanese subsidiaries have lines of credit and a financing facility with various financial institutions, many of which generally expire and are renewed at three-month intervals, with the remaining having no expiration date. The lines of credit and financing facility provided for aggregate borrowings as of December 31, 20212023 and December 31, 2022 of up to an equivalent of $29$14 million U.S. dollars.and $27 million, respectively. There were no borrowings outstanding under these arrangements at December 31, 2021. Total borrowings outstanding under these arrangements were $6 million at2023 or December 31, 2020.
Contractual Obligations2022.
As of December 31, 2021, we are a party to purchase commitments for certain inventory components and other equipment and services used in our normal operations totaling approximately $389 million. The majority of these purchase commitments covered by these arrangements are for periods of less than one year.
In addition, we have various operating leases for real estate and non-real estate items. The non-real estate leases are mainly comprised of automobiles but also include office equipment and other lower-valued items. Future payments related to operating leases are as follows:
Year Ending December 31, |
| Operating Leases |
| |
2022 |
| $ | 24.0 |
|
2023 |
|
| 22.6 |
|
2024 |
|
| 21.0 |
|
2025 |
|
| 18.8 |
|
2026 |
|
| 16.7 |
|
Thereafter |
|
| 158.1 |
|
Total lease payments |
|
| 261.2 |
|
Less: imputed interest |
|
| 50.6 |
|
Total lease liabilities |
| $ | 210.6 |
|
Contractual maturities of our debt obligations as of December 31, 2021 are as follows:
Year Ending December 31, |
| Amount |
| |
2022 |
| $ | 9.0 |
|
2023 |
|
| 9.0 |
|
2024 |
|
| 9.0 |
|
2025 |
|
| 9.0 |
|
2026 |
|
| 788.4 |
|
We have a number of defined benefit pension plans, which cover substantially all of our full-time employees in France, Germany, Israel, Japan and Taiwan. In addition, we have certain pension assets and liabilities relating to our former employees in the United Kingdom. As of December 31, 2021, our estimated benefit payments over the next 10 years amount to $15 million. The majority of the benefit payments covered by these arrangements occurs after 2026.
Derivatives
We enter into derivative instruments for risk management purposes only, including derivatives designated as hedging instruments and those utilized as economic hedges. We operate internationally, and in the normal course of business, are exposed to fluctuations in interest rates and foreign exchange rates. These fluctuations can increase the costs of financing, investing and operating theour business. We have used derivative instruments, such as foreign exchange forward contracts and options, to manage certain foreign currency exposure, and interest rate swaps and caps to manage certain interest rate exposure.
By nature, all financial instruments involve market and credit risks. We enter into derivative instruments with a diversified group of major investment grade financial institutions and no collateral is required. We have policies to monitor the credit risk of these counterparties. While there can be no assurance, we do not anticipate any material non-performance by any of these counterparties.
Interest Rate Swap and Interest Rate Cap Agreements
We entered intohave various interest rate swap agreements as described further in Note 9 to the Notes to Consolidated Financial Statements that exchange the variable LIBOR interesta forward-looking term rate to a fixed rate in order to manage the exposure to interest rate fluctuations associated with the variable LIBOR interest ratebased on Term SOFR paid on the outstanding balance of our Term Loan Facility, to a fixed rate. We acquired USD London Interbank Offered Rate (“USD LIBOR”) based interest rate cap agreements as a result of the Atotech Acquisition and had utilized these agreements to offset Term SOFR on our Term Loan Facility. We expect to enter intoEffective June 30, 2023, our USD LIBOR based interest rate swap agreements in ordercaps were converted to manage the exposureTerm SOFR. We also had two USD LIBOR based swaps that were converted to Term SOFR, effective June 30, 2023. The conversions from USD LIBOR to Term SOFR did not have a material impact on our results of operations.
58
The table below summarizes interest rate fluctuations associated with the variable SOFRswaps and interest rate of the New Term Loan Facility.caps outstanding at December 31, 2023 and December 31, 2022:
| (Dollars in millions) |
|
|
|
|
|
|
|
|
|
|
|
| Years Ended December 31, |
| ||||||||
|
|
|
|
|
|
|
|
|
|
|
|
|
| 2023 |
|
| 2022 |
| |||||
| Effective Date |
| Maturity |
| Fixed |
|
| Notional |
|
| Notional Amount at December 31, 2023 |
|
| Fair |
|
| Fair |
| |||||
| Interest Rate Swaps |
|
|
|
|
|
|
|
|
|
|
|
|
|
|
|
|
| |||||
| April 5, 2019 |
| March 31, 2023 |
|
| 2.309 | % |
| $ | 300 |
|
| $ | — |
|
| $ | — |
|
| $ | 1 |
|
| June 30, 2023 |
| February 28, 2025 |
|
| 0.391 | % |
|
| 200 |
|
|
| 200 |
|
|
| 9 |
|
|
| 16 |
|
| June 30, 2023 |
| February 28, 2025 |
|
| 0.543 | % |
|
| 300 |
|
|
| 300 |
|
|
| 14 |
|
|
| 22 |
|
| September 30, 2022 |
| September 30, 2026 |
|
| 3.156 | % |
|
| 350 |
|
|
| 350 |
|
|
| 5 |
|
|
| 8 |
|
| January 2, 2024 |
| January 31, 2028 |
|
| 2.841 | % |
|
| 250 |
|
|
| — |
|
|
| 7 |
|
|
| 5 |
|
| September 30, 2022 |
| September 30, 2027 |
|
| 3.198 | % |
|
| 350 |
|
|
| 350 |
|
|
| 5 |
|
|
| 8 |
|
| January 2, 2024 |
| January 31, 2029 |
|
| 2.986 | % |
|
| 250 |
|
|
| — |
|
|
| 6 |
|
|
| 4 |
|
| September 30, 2022 |
| September 30, 2026 |
|
| 3.358 | % |
|
| 600 |
|
|
| 600 |
|
|
| 5 |
|
|
| 10 |
|
| December 28, 2023 |
| December 31, 2027 |
|
| 4.550 | % |
|
| 500 |
|
|
| 500 |
|
|
| (10 | ) |
|
| — |
|
|
|
|
|
|
|
|
|
| 3,100 |
|
|
| 2,300 |
|
|
| 41 |
|
|
| 74 |
| |
Interest Rate Caps |
|
|
|
|
|
|
|
|
|
|
|
|
|
|
| ||||||||
| June 30, 2023 |
| January 31, 2024 |
|
| 0.805 | % |
|
| 350 |
|
|
| 350 |
|
|
| 1 |
|
|
| 15 |
|
| June 30, 2023 |
| January 31, 2024 |
|
| 0.805 | % |
|
| 350 |
|
|
| 350 |
|
|
| 2 |
|
|
| 15 |
|
|
|
|
|
|
|
|
|
| 700 |
|
|
| 700 |
|
|
| 3 |
|
|
| 30 |
| |
|
|
|
|
|
|
|
| $ | 3,800 |
|
| $ | 3,000 |
|
| $ | 44 |
|
| $ | 104 |
| |
|
|
|
|
|
|
|
|
|
|
|
|
|
|
|
|
|
|
|
| Years Ended December 31, |
| |||||
|
|
|
|
|
|
|
|
|
|
|
|
|
|
|
|
|
|
|
| 2021 |
|
| 2020 |
| ||
Swap |
| Trade Date |
| Effective Date |
| Maturity |
| Fixed Rate |
|
| Notional Amount at Effective Date |
|
| Notional Amount |
|
| Fair Value Asset (Liability) |
|
| Fair Value (Liability) |
| |||||
1 |
| April 3, 2019 |
| April 5, 2019 |
| March 31, 2023 |
|
| 2.309 | % |
| $ | 300 |
|
| $ | 300 |
|
| $ | (5 | ) |
| $ | (12 | ) |
2 |
| October 29, 2020 |
| October 26, 2021 |
| February 28, 2025 |
|
| 0.485 | % |
| $ | 200 |
|
| $ | 200 |
|
|
| 4 |
|
|
| (1 | ) |
3 |
| October 29, 2020 |
| March 31, 2022 |
| February 28, 2025 |
|
| 0.623 | % |
| $ | 100 |
|
| $ | 100 |
|
|
| 5 |
|
|
| (1 | ) |
|
|
|
|
|
|
|
|
|
|
|
|
|
|
|
| Total |
|
| $ | 4 |
|
| $ | (14 | ) | |
The interest rate swaps are recorded at fair value on the consolidated balance sheetsheets and changes in the fair value are recognized in Accumulated Other Comprehensive Income.accumulated OCI. To the extent that these arrangements are no longer an effective hedge, any ineffectiveness measured inhedges, the hedging relationships is recorded immediately in earnings in the period it occurs. The fair value of the interest rate swaps is classified in other assets or non-current liabilities, accordingly, in the consolidated balance sheet.
Currency Option Agreements
In conjunction with financing the proposed acquisition of Atotech, we expect to issue EUR 500 million term loan debt. At the expected close, a portion of those proceeds will settle Atotech’s existing EUR 200 million term loan, and the EUR 300 million balancerelationship will be converted into USD in support of the USD purchase price. We purchased foreign currency option contracts to fix the conversion of EUR 300 million into USD as noted below:
|
|
|
|
|
|
|
|
|
|
|
|
|
|
|
|
|
|
|
|
|
|
|
|
|
|
|
|
|
|
|
|
|
|
|
|
|
|
|
|
|
|
Trade Date |
| Effective Date |
| Maturity |
| Fixed Rate |
|
| Notional Amount in EUR |
|
| Notional Amount in USD |
|
| Year Ended December 31, 2021 Fair Value Asset |
| ||||
October 26, 2021 |
| October 26, 2021 |
| January 31, 2022 |
| $ | 1.1615 |
|
| $ | 300 |
|
| $ | 348 |
|
| $ | 3 |
|
The currency swaps are recorded at fair value on the balance sheetdiscontinued and changes in the fair value are recognizedof the hedging instruments from the last assessment period that were effective up to the current period will be recorded immediately in earnings. TheAmounts previously recorded in OCI will remain in OCI and will be reclassified to earnings when the interest payments impact consolidated earnings. If we determine that the interest payments are unlikely to occur, amounts previously recorded in OCI will be reclassified to earnings immediately. Changes in the fair value asset is classifiedof interest rate caps are recorded immediately in other current assets in the consolidated balance sheet. We recorded an unrealized gain of $3 million in 2021, net of premiums, which is included in other expense, net.
In conjunction with the Photon Control Acquisition,earnings, as we entered into a foreign currency contract tohave not designated these instruments as hedges and therefore these instruments do not qualify for hedge the Canadian dollar purchase price. In 2021, we recorded a fair value realized loss of $10 million, which is included in other expense, net.accounting.
Foreign Exchange Contracts and Net Investment Hedge
We hedge a portion of our forecasted foreign currency denominated intercompany sales of inventory, over a maximum period of eighteen months, using foreign exchange forward contracts accounted for as cash-flow hedges related to British, Euro, Japanese, South Korean and Taiwanese currencies.hedges. To the extent these derivatives are effective in offsetting the variability of the hedged cash flows, and otherwise meet the hedge accounting criteria, changes in the derivatives’ fair value are not included in current earnings but are included in accumulated other comprehensive incomeOCI in stockholders’ equity. These changes in fair value will subsequently be reclassified into earnings, as applicable, when the forecasted transaction occurs. To the extent that a previously designated hedging transaction is no longer an effective hedge, any ineffectiveness measured in the hedging relationship is recorded immediately in earnings in the period it occurs. The cash flows resulting from foreign exchange forward exchange contracts are classified in the consolidated statements of cash flows as part of cash flows from operating activities. We do not enter into derivative instruments for trading or speculative purposes.
We also enter into foreign exchange forward contracts to hedge certain balance sheet amounts. To the extent the hedge accounting criteria is not met, the related foreign currency forward contracts are considered as economic hedges andagainst changes in the fair valueconsolidated balance sheets for certain subsidiaries to mitigate the risk associated with certain foreign currency transactions in the ordinary course of business. These derivatives are not designated as cash flow hedging instruments and gains or losses from these contractsderivatives are recorded immediately in earnings in the period in which they occur. These include hedges that are used to reduce exchange rate risks arising from the change in fair value of certain foreign currency-denominated assets and liabilities (i.e., payables, receivables) and other economic hedges where the hedge accounting criteria were not met.expense, net.
We had foreign exchange forward contracts with notional amounts totaling $240$266 million outstanding at December 31, 2021, of2023, which $108included $71 million wasoutstanding to exchange U.S. dollars to Euro, $70 million outstanding to exchange South Korean won to U.S. dollars and $60$65 million was outstanding to exchange Japanese yen to U.S. dollars.dollar. We had foreign exchange forward exchange contracts with notional amounts totaling $176$702 million outstanding at December 31, 2020, of2022, which $62included $485 million wasoutstanding to exchange U.S. dollars to Euro and $75 million outstanding to exchange South Korean won to U.S. dollars and $62 million was outstanding to exchange Japanese yen to U.S. dollars.
As of December 31, 2021,2023, the unrealized loss that will be reclassified from accumulated other comprehensive incomeOCI to earnings over the next twelve months is immaterial. Gains and losses on foreign exchange forward exchange contracts that qualify for hedge accounting are classified in cost of products in 20212023 and 2020,2022 and totaled a (loss) gaingains of $(2)$7 million and $2$18 million, respectively. There were no ineffective portions of the derivatives recorded in 20212023 and 2020.2022.
We hedge certain intercompany accounts receivable and intercompany loans with foreign exchange forward exchange contracts. Typically, as these derivatives hedge existing amounts that are denominated in foreign currencies, the derivatives do not qualify for hedge accounting. Realized and unrealized gains and losses on foreign exchange forward exchange contracts that do not qualify for
59
hedge accounting are recognized immediately in earnings. The net foreign exchange gains or losses on these derivatives were immaterial$31 million and $8 million in each of 20212023 and 2020.2022, respectively. Foreign currency gains or losses are classified in other expense, net. The cash flows resulting from foreign exchange forward exchange contracts are classified in our consolidated statements of cash flows as part of cash flows from operating activities. We do not hold or issue derivative financial instruments for trading purposes.
Recently IssuedOn January 1, 2023, we designated certain Euro-denominated debt as a net investment hedge to hedge a portion of our net investments in certain of our entities with functional currencies denominated in the Euro. As of December 31, 2023, we designated as a net investment hedge €593 million in aggregate principal amount of our Euro Tranche B issued in August 2022. For these nonderivative instruments, we defer recognition of the foreign currency remeasurement gains and losses within the foreign currency translation adjustment component of OCI. There was no net investment hedge designated in 2022 and all remeasurement gains and losses went directly to the statement of operations.
Contractual Obligations
As of December 31, 2023, we are a party to purchase commitments for certain inventory components and other equipment and services used in our normal operations totaling approximately $562 million. The majority of these purchase commitments covered by these arrangements are for periods of less than one year.
In addition, we have various operating leases for real estate and non-real estate items. The non-real estate leases are mainly comprised of automobiles but also include office equipment and other lower-valued items. We also have a small number of finance leases for real estate.
Future payments related to operating and finance leases are as follows:
(Dollars in millions) |
| Operating |
|
| Finance |
| ||
Year Ending December 31, |
| Leases |
|
| Leases |
| ||
2024 |
| $ | 32 |
|
| $ | 6 |
|
2025 |
|
| 25 |
|
|
| 6 |
|
2026 |
|
| 21 |
|
|
| 6 |
|
2027 |
|
| 18 |
|
|
| 3 |
|
2028 |
|
| 14 |
|
|
| 3 |
|
Thereafter |
|
| 135 |
|
|
| 21 |
|
Total lease payments |
|
| 245 |
|
|
| 45 |
|
Less: imputed interest |
|
| 44 |
|
|
| 11 |
|
Total lease liabilities |
| $ | 201 |
|
| $ | 34 |
|
Contractual maturities of our debt obligations as of December 31, 2023 are as follows:
(Dollars in millions) |
|
|
| |
Year |
| Amount |
| |
2024 |
| $ | 93 |
|
2025 |
|
| 110 |
|
2026 |
|
| 116 |
|
2027 |
|
| 586 |
|
2028 |
|
| 43 |
|
Thereafter |
|
| 4,005 |
|
We have a number of defined benefit pension plans, which cover some of our employees outside the United States. In addition, we have certain pension assets and liabilities relating to our former employees in the United Kingdom. As of December 31, 2023, our estimated benefit payments over the next 10 years amount to $101 million. The majority of the benefit payments covered by these arrangements occurs after 2028.
Recent Accounting Pronouncements
Segment Reporting (Topic 280): Improvements to Reportable Segment Disclosures
In March 2020,November 2023, the Financial Accounting Standards Board (“FASB”) issued Accounting StandardsStandard Update (“ASU”) No. 2020-04, “Reference Rate Reform2023-07, Segment Reporting (Topic 848)280): FacilitationImprovements to Reportable Segment Disclosures, which requires a public entity to disclose significant segment expenses and other segment items on an annual and interim basis and provide in interim periods all disclosures about a reportable segment’s profit or loss and assets that are currently required annually. Additionally, it requires a public entity to disclose the title and position of the EffectsChief Operating Decision Maker. The ASU does not change how a public entity identifies its operating segments, aggregates them, or applies the quantitative thresholds to determine its reportable
60
segments. The new standard is effective for fiscal years beginning after December 15, 2023, and interim periods within fiscal years beginning after December 15, 2024, with early adoption permitted. A public entity should apply the amendments in this ASU retrospectively to all prior periods presented in the financial statements. We are currently evaluating the impact of Reference Rate Reformthis ASU on Financial Reporting.” This standard provides temporary optional expedients and exceptionsour disclosures within the consolidated financial statements.
Income Taxes (Topic 740): Improvements to accounting guidance on contract modifications and hedge accounting to ease entities’ financial reporting burdens as the market transitions from the London Interbank Offered Rate (“LIBOR”) and other interbank offered rates to alternative reference rates. The standard was effective upon issuance and generally can be applied throughIncome Tax Disclosures
In December 31, 2022. In January 2021,2023, the FASB issued ASU 2021-01, “Reference Rate ReformNo. 2023-09, Income Taxes (Topic 848)740): Scope.” TheImprovements to Income Tax Disclosures, which focuses on the rate reconciliation and income taxes paid. ASU No. 2023-09 requires a public business entity (“PBE”) to disclose, on an annual basis, a tabular rate reconciliation using both percentages and currency amounts, broken out into specified categories with certain reconciling items further broken out by nature and jurisdiction to the extent those items exceed a specified threshold. In addition, all entities are required to disclose income taxes paid, net of refunds received disaggregated by federal, state/local, and foreign and by jurisdiction if the amount is at least 5% of total income tax payments, net of refunds received. For PBEs, the new standard is effective for annual periods beginning after December 15, 2024, with early adoption permitted. An entity may apply the amendments in this update clarify that certain optional expedients and exceptions in Topic 848ASU prospectively by providing the revised disclosures for contract modifications and hedge accounting apply to derivative instruments that use an interest rate for margining, discounting, or contract price alignment that is modified as a result of reference rate reform. Amendments in this update to the expedients and exceptions in Topic 848 capture the incremental consequences of the scope clarification and tailor the existing guidance to derivative instruments affected by the discounting transition. The amendments in this update do not apply to contract modifications made afterperiod ending December 31, 2022, new hedging relationships entered into after December 31, 2022,2025 and existing hedging relationships evaluatedcontinuing to provide the pre-ASU disclosures for effectiveness inthe prior periods, after December 31, 2022, exceptor may apply the amendments retrospectively by providing the revised disclosures for hedging relationships existing asall period presented. We are currently evaluating the impact of December 31, 2022, that apply certain optional expedients in which the accounting effects are recorded through the end of the hedging relationship (including periods after December 31, 2022). The adoption of the requirements of these standards has not resulted in a material impactthis ASU on our consolidated financial position, results of operationsstatements and cash flows, but the adoption of the requirements may impact us in the futurerelated disclosures.
.61
Item 7A. Quantitative and Qualitative Disclosures about Market Risk
|
|
Market Risk and Sensitivity Analysis
Our primary exposures to market risks include fluctuations in interest rates on our Term Loan Facility, as defined and as described further in Item 7 of this Annual Report on Form 10-K, and investment portfolio, as well as fluctuations in foreign currency exchange rates.
Foreign Exchange Rate Risk
Our currency risk consists primarily of foreign currency denominated firm commitments, forecasted foreign currency denominated intercompany and third-party transactions, and net investments in certain subsidiaries. We use both nonderivative and derivative instruments to manage our earnings and cash flow exposure to changes in currency exchange rates.
We mainly enter into foreign exchange forward exchange contracts to reduce currency exposure arising from intercompany sales of inventory. We also enter into foreign exchange forward exchange contracts to reduce foreign exchange risks arising from the change in fair value of certain foreign currency denominated assets and liabilities.
We had foreign exchange forward exchange contracts with notional amounts totaling $240 million outstanding and a net fair value asset of $3 million at December 31, 2021. We had forward exchange contracts with notional amounts totaling $176$266 million outstanding and a net fair value liability of $7$3 million at December 31, 2020.2023. We had foreign exchange forward contracts with notional amounts totaling $702 million outstanding and a net fair value liability of $1 million at December 31, 2022. The potential fair value loss for a hypothetical 10% adverse change in the currency exchange rate on our foreign exchange forward exchange contracts at December 31, 20212023 and 20202022 would be immaterial.
On January 1, 2023, we designated certain Euro-denominated debt as a net investment hedge to hedge a portion of our net investments in certain of our entities with functional currencies denominated in the Euro. As of December 31, 2023, we designated as a net investment hedge €593 million in aggregate principal amount of our Euro Tranche B issued in August 2022. For these nonderivative instruments, we defer recognition of the foreign currency remeasurement gains and losses within the foreign currency translation adjustment component of OCI. There was no net investment hedge designated in 2022 and all remeasurement gains and losses went directly to the statement of operations.
Interest Rate Risk
We hold our cash, cash equivalents and short-term investments for working capital purposes. Some of the securities we invest in are subject to market risk. This means that a change in prevailing interest rates may cause the principal amount of such investments to fluctuate. To minimize this risk, we maintain our portfolio of cash, cash equivalents and short-term investments in a variety of securities, including money market funds and government debt securities. Due to the short-term nature of these instruments, we believe that we do not have any material exposure to changes in the fair value of our investment portfolio as a result of changes in interest rates. Declines in interest rates, however, would reduce future interest income. The effect of a hypothetical 10% increase or decrease in overall interest rates would not have had a material impact on our operating results or the total fair value of our portfolio.
We enter intohave various interest rate swap and cap agreements as described further in “Management’s“Management's Discussion and Analysis of Financial Condition and Results of Operations – Operations—Critical Accounting Policies and Estimates—Derivatives” that exchange the variable LIBORTerm SOFR interest rate to a fixed rate in order to manage the exposure to interest rate fluctuations associated with the variable LIBORTerm SOFR interest rate paid on the outstanding balance of the Term Loan Facility. We acquired USD LIBOR interest rate cap agreements as a result of the Atotech Acquisition and had utilized these agreements to offset the variable Term SOFR rate on our Term Loan Facility. Effective June 30, 2023, our USD LIBOR based interest rate caps were converted to Term SOFR. We also had two USD LIBOR based swaps that were converted to Term SOFR, effective June 30, 2023. The conversions from USD LIBOR to Term SOFR did not have a material impact on our results of operations.
We are exposed to market risks related to fluctuations in interest rates related to our Term Loan Facility. As of December 31, 2021, we owed $824 million, with $524 million2023, the principal outstanding on our Term Loan Facility was $4.95 billion, at a variableweighted average interest rate of 1.75% plus LIBOR, and $300 million at a fixed7.7%. A 10% increase or decrease in the weighted average interest rate of 2.309%, plus the applicable credit spread, which was 1.75% at December 31, 2021. We performed a sensitivity analysis on the outstanding portion of our debt obligations as of December 31, 2021. Should the current average interest rate2023 would increase or decrease annual interest expense by 10%,approximately $26 million, excluding the effect of our interest rate hedges. Because the notional amount of our interest rate hedges as of December 31, 2023 equals approximately 61% of the principal outstanding on our Term Loan Facility, the resulting annual increase or decreasenet impact to interest expense at December 31, 2021 would be immaterial.
Currency Option Agreements
In conjunction with financing the proposed acquisition of Atotech, we expect to issue EUR 500 million term loan debt. At the expected close, a portion of those proceeds will refinance Atotech’s existing EUR 200 million term loan, the balance to be converted into USD in support of the USD purchase price. We purchased foreign currency option contracts to hedge the conversion of EUR 300 million into USD. We had foreign currency option contracts with notional amounts totaling EUR 300 million outstanding and a net fair value asset of $3 million at December 31, 2021. The potential fair value loss for a hypothetical 10% adverse change in the currency exchange rate on our forward currency option contracts at December 31, 2021 would be immaterial.approximately $13 million.
62
Item 8. Financial Statements and Supplementary Data
Report of Independent Registered Public Accounting Firm
To the Board of Directors and Stockholders of MKS Instruments, Inc.
Opinions on the Financial Statements and Internal Control over Financial Reporting
We have audited the accompanying consolidated balance sheets of MKS Instruments, Inc. and its subsidiaries (the “Company”) as of December 31, 20212023 and 2020,2022, and the related consolidated statements of operations and comprehensive (loss) income, of stockholders’ equity and of cash flows for each of the three years in the period ended December 31, 2021,2023, including the related notes and schedule of valuation and qualifying accounts for each of the three years in the period ended December 31, 20212023 appearing underafter Item 15(a)(2)16 (collectively referred to as the “consolidated financial statements”). We also have audited the Company's internal control over financial reporting as of December 31, 2021,2023, based on criteria established in Internal Control - Integrated Framework (2013) issued by the Committee of Sponsoring Organizations of the Treadway Commission (COSO).
In our opinion, the consolidated financial statements referred to above present fairly, in all material respects, the financial position of the Company as of December 31, 20212023 and 2020,2022, and the results of its operations and its cash flows for each of the three years in the period ended December 31, 20212023 in conformity with accounting principles generally accepted in the United States of America. Also in our opinion, the Company maintained, in all material respects, effective internal control over financial reporting as of December 31, 2021,2023, based on criteria established in Internal Control - Integrated Framework (2013) issued by the COSO.
Basis for Opinions
The Company's management is responsible for these consolidated financial statements, for maintaining effective internal control over financial reporting, and for its assessment of the effectiveness of internal control over financial reporting, included in Management’s Report on Internal Control over Financial Reporting appearing under Item 9A. Our responsibility is to express opinions on the Company’s consolidated financial statements and on the Company's internal control over financial reporting based on our audits. We are a public accounting firm registered with the Public Company Accounting Oversight Board (United States) (PCAOB) and are required to be independent with respect to the Company in accordance with the U.S. federal securities laws and the applicable rules and regulations of the Securities and Exchange Commission and the PCAOB.
We conducted our audits in accordance with the standards of the PCAOB. Those standards require that we plan and perform the audits to obtain reasonable assurance about whether the consolidated financial statements are free of material misstatement, whether due to error or fraud, and whether effective internal control over financial reporting was maintained in all material respects.
Our audits of the consolidated financial statements included performing procedures to assess the risks of material misstatement of the consolidated financial statements, whether due to error or fraud, and performing procedures that respond to those risks. Such procedures included examining, on a test basis, evidence regarding the amounts and disclosures in the consolidated financial statements. Our audits also included evaluating the accounting principles used and significant estimates made by management, as well as evaluating the overall presentation of the consolidated financial statements. Our audit of internal control over financial reporting included obtaining an understanding of internal control over financial reporting, assessing the risk that a material weakness exists, and testing and evaluating the design and operating effectiveness of internal control based on the assessed risk. Our audits also included performing such other procedures as we considered necessary in the circumstances. We believe that our audits provide a reasonable basis for our opinions.
As described in Management’s Report on Internal Control over Financial Reporting, management has excluded Photon Control Inc. (“Photon Control”) from its assessment of internal control over financial reporting as of December 31, 2021 because it was acquired by the Company in a purchase business combination during 2021. We have also excluded Photon Control from our audit of internal control over financial reporting. Photon Control is a wholly-owned subsidiary whose total assets and total revenues excluded from management’s assessment and our audit of internal control over financial reporting represent approximately 1% of the related consolidated financial statement amounts as of and for the year ended December 31, 2021.
Definition and Limitations of Internal Control over Financial Reporting
A company’s internal control over financial reporting is a process designed to provide reasonable assurance regarding the reliability of financial reporting and the preparation of financial statements for external purposes in accordance with generally accepted accounting principles. A company’s internal control over financial reporting includes those policies and procedures that (i) pertain to the maintenance of records that, in reasonable detail, accurately and fairly reflect the transactions and dispositions of the assets of the company; (ii) provide reasonable assurance that transactions are recorded as necessary to permit preparation of financial statements in accordance with generally accepted accounting principles, and that receipts and expenditures of the company are being made only in accordance with authorizations of management and directors of the company; and (iii) provide reasonable assurance regarding prevention or timely detection of unauthorized acquisition, use, or disposition of the company’s assets that could have a material effect on the financial statements.
Because of its inherent limitations, internal control over financial reporting may not prevent or detect misstatements. Also, projections of any evaluation of effectiveness to future periods are subject to the risk that controls may become inadequate because of changes in conditions, or that the degree of compliance with the policies or procedures may deteriorate.
63
Critical Audit Matters
The critical audit matter communicated below is a matter arising from the current period audit of the consolidated financial statements that was communicated or required to be communicated to the audit committee and that (i) relaterelates to accounts or disclosures that are material to the consolidated financial statements and (ii) involved our especially challenging, subjective, or complex judgments. The communication of critical audit matters does not alter in any way our opinion on the consolidated financial statements, taken as a whole, and we are not, by communicating the critical audit matter below, providing a separate opinion on the critical audit matter or on the accounts or disclosures to which it relates.
Acquisition of Photon Control Inc. (“Photon Control”)Interim and Annual Goodwill Impairment Assessments – Valuation of Completed Technology Intangible AssetEquipment Solutions (ESB), Electronics (EL) and General Metal Finishing (GMF) Reporting Units
As described in Note 5Notes 3 and 13 to the consolidated financial statements, the Company completedCompany’s net goodwill balance was $2,554 million as of December 31, 2023, and the goodwill associated with the ESB, EL and GMF reporting units was $87 million, $1,401 million and $318 million, respectively. Management assesses goodwill for impairment on an annual basis as of October 31 or more frequently when events and circumstances occur indicating that the recorded goodwill may be impaired. During the quarter ended June 30, 2023, management concluded there was a triggering event at each of its acquisitionESB, EL and GMF reporting units. The interim goodwill impairment test as of Photon Control for a total net purchase price of $268.4 million, whichJune 30, 2023 resulted in recording a $110impairment charges of $372 million, completed technology intangible asset.$826 million and $428 million at the ESB, EL and GMF reporting units, respectively. The annual goodwill impairment test resulted in impairment charges of $13 million and $48 million at the ESB and EL reporting units, respectively. In the quantitative assessment, management compares the fair value of the acquired completed technology intangible assetreporting unit to its carrying amount, which includes goodwill. If the fair value exceeds the carrying value, no impairment loss exists. If the fair value is less than the carrying amount, a goodwill impairment loss is measured and recorded. For each of the three reporting units, management performed a quantitative assessment of goodwill using a weighting of an income approach and market approach. The income approach was determined using the income approach. In performing the valuation for the intangible asset, thebased upon projected future cash flows that were discounted to present value and an assumed terminal growth rate. The key underlying assumptions used included the appropriate discountforecasted revenues, which incorporated external market data, terminal growth rate, as well as forecasted revenue growth rates, gross profit and operating margins. expenses, as well as an applicable discount rate for each reporting unit. The market approach for each of the three reporting units incorporated observed multiples of guideline public companies. The market approach for the EL and GMF reporting units also incorporated multiples from guideline transactions.
The principal considerations for our determination that performing procedures relating to the acquisitioninterim and annual goodwill impairment assessments of Photon Control - valuation of completed technology intangible assetthe ESB, EL and GMF reporting units is a critical audit matter are (i) the significant judgment by management when developing the fair value estimate of the acquired completed technology intangible asset, which in turn led toESB, EL and GMF reporting units; (ii) a high degree of auditor judgment, subjectivity, and effort in performing procedures and evaluating management’s significant assumptions related to the forecasted revenuerevenues, gross profits, operating expenses, terminal growth rates, discount rates, and the discount rate. In addition,multiples of guideline public companies for ESB, EL and GMF, and multiples from guideline transactions for EL and GMF; and (iii) the audit effort involved the use of professionals with specialized skill and knowledge.
Addressing the matter involved performing procedures and evaluating audit evidence in connection with forming our overall opinion on the consolidated financial statements. These procedures included testing the effectiveness of controls relating to the acquisition accounting,management’s goodwill impairment assessments, including controls over management’sthe valuation of the acquired completed technology intangible assetCompany’s ESB, EL and controls over the development of significant assumptions related to the forecasted revenue growth rates and the discount rate.GMF reporting units. These procedures also included, among others, (i) reading the purchase agreement and (ii) testing management’s process for estimatingdeveloping the fair value estimate of the acquired completed technology intangible asset. Testing management’s process includedESB, EL and GMF reporting units; (ii) evaluating the appropriateness of the income approach,and market approaches used by management; (iii) testing the completeness and accuracy of underlying data provided by management,used in the income and market approaches; and (iv) evaluating the reasonableness of the significant assumptions used by management related to forecasted revenues, gross profits, operating expenses, terminal growth rates, discount rates, and multiples as applicable to the valuation approach and reporting units described above. Evaluating management’s assumptions related to the forecasted revenue growth ratesrevenues, gross profits, operating expenses, and the discount rate for the completed technology intangible asset. Evaluating the reasonableness of the forecasted revenueterminal growth rates involved evaluating whether the assumptions used by management were reasonable considering (i) the current and past performance of the acquired businessESB, EL and GMF reporting units, (ii) the consistency with external market and industry forecasts.data, and (iii) whether these assumptions were consistent with evidence obtained in other areas of the audit. Professionals with specialized skill and knowledge were used to assist in evaluating (i) the evaluationappropriateness of the Company’s income approach and market approaches and (ii) the reasonableness of the discount rate assumption.rates and multiples assumptions.
/s/
/s/ PricewaterhouseCoopers LLP
Boston, Massachusetts
February 28, 202227, 2024
We have served as the Company’s auditor since 1981.
64
MKS Instruments, Inc.
Consolidated Balance Sheets
(in millions, except per share data)
|
| December 31, |
|
| December 31, |
| ||||||||||
|
| 2021 |
|
| 2020 |
|
| 2023 |
|
| 2022 |
| ||||
ASSETS |
|
|
|
|
|
|
|
|
|
|
|
|
|
| ||
Current assets: |
|
|
|
|
|
|
|
|
|
|
|
|
|
| ||
Cash and cash equivalents |
| $ | 966.3 |
|
| $ | 608.3 |
|
| $ | 875 |
|
| $ | 909 |
|
Short-term investments |
|
| 76.4 |
|
|
| 227.7 |
|
|
| — |
|
|
| 1 |
|
Trade accounts receivable, net of allowance for doubtful accounts of $3.6 and $2.0 at December 31, 2021 and 2020, respectively |
|
| 442.6 |
|
|
| 392.7 |
| ||||||||
Trade accounts receivable, net of allowance for doubtful accounts of |
|
| 603 |
|
|
| 720 |
| ||||||||
Inventories |
|
| 576.7 |
|
|
| 501.4 |
|
|
| 991 |
|
|
| 977 |
|
Other current assets |
|
| 85.3 |
|
|
| 74.3 |
|
|
| 227 |
|
|
| 187 |
|
Total current assets |
|
| 2,147.3 |
|
|
| 1,804.4 |
|
|
| 2,696 |
|
|
| 2,794 |
|
|
|
|
|
|
|
|
|
|
|
|
|
|
|
| ||
Property, plant and equipment, net |
|
| 325.3 |
|
|
| 284.3 |
|
|
| 784 |
|
|
| 800 |
|
Right-of-use assets |
|
| 184.3 |
|
|
| 184.4 |
|
|
| 225 |
|
|
| 234 |
|
Goodwill |
|
| 1,228.2 |
|
|
| 1,066.4 |
|
|
| 2,554 |
|
|
| 4,308 |
|
Intangible assets, net |
|
| 576.0 |
|
|
| 512.2 |
|
|
| 2,619 |
|
|
| 3,173 |
|
Long-term investments |
|
| 6.2 |
|
|
| 6.5 |
| ||||||||
Other assets |
|
| 73.0 |
|
|
| 45.6 |
|
|
| 240 |
|
|
| 186 |
|
Total assets |
| $ | 4,540.3 |
|
| $ | 3,903.8 |
|
| $ | 9,118 |
|
| $ | 11,495 |
|
|
|
|
|
|
|
|
|
|
|
|
|
|
|
| ||
LIABILITIES AND STOCKHOLDERS’ EQUITY |
|
|
|
|
|
|
|
|
|
|
|
|
|
| ||
Current liabilities: |
|
|
|
|
|
|
|
|
|
|
|
|
|
| ||
Short-term debt |
| $ | 9.0 |
|
| $ | 14.5 |
|
| $ | 93 |
|
| $ | 93 |
|
Accounts payable |
|
| 168.1 |
|
|
| 110.6 |
|
|
| 327 |
|
|
| 426 |
|
Accrued compensation |
|
| 131.9 |
|
|
| 117.9 |
| ||||||||
Income taxes payable |
|
| 25.1 |
|
|
| 18.3 |
| ||||||||
Lease liabilities |
|
| 18.0 |
|
|
| 15.8 |
| ||||||||
Deferred revenue and customer advances |
|
| 37.5 |
|
|
| 31.2 |
| ||||||||
Other current liabilities |
|
| 71.2 |
|
|
| 65.6 |
|
|
| 428 |
|
|
| 433 |
|
Total current liabilities |
|
| 460.8 |
|
|
| 373.9 |
|
|
| 848 |
|
|
| 952 |
|
|
|
|
|
|
|
|
|
|
|
|
|
|
|
| ||
Long-term debt, net |
|
| 807.9 |
|
|
| 815.0 |
|
|
| 4,696 |
|
|
| 4,834 |
|
Non-current deferred taxes |
|
| 99.1 |
|
|
| 59.2 |
|
|
| 640 |
|
|
| 783 |
|
Non-current accrued compensation |
|
| 49.3 |
|
|
| 49.5 |
|
|
| 151 |
|
|
| 138 |
|
Non-current lease liability |
|
| 192.6 |
|
|
| 187.4 |
|
|
| 205 |
|
|
| 215 |
|
Other non-current liabilities |
|
| 44.0 |
|
|
| 57.9 |
|
|
| 106 |
|
|
| 90 |
|
Total liabilities |
|
| 1,653.7 |
|
|
| 1,542.9 |
|
|
| 6,646 |
|
|
| 7,012 |
|
Commitments and contingencies (Note 23) |
|
|
|
|
|
|
|
| ||||||||
Commitments and contingencies (Note 24) |
|
|
|
|
|
| ||||||||||
Stockholders’ equity: |
|
|
|
|
|
|
|
|
|
|
|
|
|
| ||
Preferred stock, $0.01 par value, 2 shares authorized; NaN issued and outstanding |
|
| — |
|
|
| — |
| ||||||||
Common stock, no par value, 200 shares authorized; 55.5 and 55.2 shares issued and outstanding at December 31, 2021 and 2020, respectively |
|
| 0.1 |
|
|
| 0.1 |
| ||||||||
Preferred stock, $0.01 par value, 2 shares authorized; none issued |
|
| — |
|
|
| — |
| ||||||||
Common stock, no par value, 200 shares authorized; 66.9 |
|
| — |
|
|
| — |
| ||||||||
Additional paid-in capital |
|
| 906.7 |
|
|
| 873.2 |
|
|
| 2,195 |
|
|
| 2,142 |
|
Retained earnings |
|
| 1,991.0 |
|
|
| 1,487.3 |
|
|
| 373 |
|
|
| 2,272 |
|
Accumulated other comprehensive (loss) income |
|
| (11.2 | ) |
|
| 0.3 |
|
|
| (96 | ) |
|
| 69 |
|
Total stockholders’ equity |
|
| 2,886.6 |
|
|
| 2,360.9 |
|
|
| 2,472 |
|
|
| 4,483 |
|
Total liabilities and stockholders' equity |
| $ | 4,540.3 |
|
| $ | 3,903.8 |
|
| $ | 9,118 |
|
| $ | 11,495 |
|
The accompanying notes are an integral part of the consolidated financial statements.Consolidated Financial Statements.
65
MKS Instruments, Inc.
Consolidated Statements of Operations and Comprehensive (Loss) Income
(in millions, except per share data)
|
| Years Ended December 31, |
|
| Years Ended December 31, |
| ||||||||||||||||||
|
| 2021 |
|
| 2020 |
|
| 2019 |
|
| 2023 |
|
| 2022 |
|
| 2021 |
| ||||||
Net revenues: |
|
|
|
|
|
|
|
|
|
|
|
|
|
|
|
|
|
|
|
| ||||
Products |
| $ | 2,578.6 |
|
| $ | 2,014.8 |
|
| $ | 1,611.3 |
|
| $ | 3,200 |
|
| $ | 3,119 |
|
| $ | 2,579 |
|
Services |
|
| 371.0 |
|
|
| 315.2 |
|
|
| 288.5 |
|
|
| 422 |
|
|
| 428 |
|
|
| 371 |
|
Total net revenues |
|
| 2,949.6 |
|
|
| 2,330.0 |
|
|
| 1,899.8 |
|
|
| 3,622 |
|
|
| 3,547 |
|
|
| 2,950 |
|
Cost of revenues: |
|
|
|
|
|
|
|
|
|
|
|
|
|
|
|
|
|
|
|
| ||||
Products |
|
| 1,370.9 |
|
|
| 1,106.4 |
|
|
| 913.5 |
|
|
| 1,748 |
|
|
| 1,774 |
|
|
| 1,371 |
|
Services |
|
| 198.5 |
|
|
| 174.1 |
|
|
| 155.9 |
|
|
| 232 |
|
|
| 226 |
|
|
| 199 |
|
Total cost of revenues (exclusive of amortization shown separately below) |
|
| 1,569.4 |
|
|
| 1,280.5 |
|
|
| 1,069.4 |
|
|
| 1,980 |
|
|
| 2,000 |
|
|
| 1,570 |
|
Gross profit |
|
| 1,380.2 |
|
|
| 1,049.5 |
|
|
| 830.4 |
|
|
| 1,642 |
|
|
| 1,547 |
|
|
| 1,380 |
|
Research and development |
|
| 200.0 |
|
|
| 173.1 |
|
|
| 164.1 |
|
|
| 288 |
|
|
| 241 |
|
|
| 200 |
|
Selling, general and administrative |
|
| 385.1 |
|
|
| 353.1 |
|
|
| 330.3 |
|
|
| 675 |
|
|
| 488 |
|
|
| 385 |
|
Acquisition and integration costs |
|
| 29.8 |
|
|
| 3.8 |
|
|
| 37.3 |
|
|
| 16 |
|
|
| 52 |
|
|
| 30 |
|
Restructuring and other |
|
| 11.1 |
|
|
| 9.4 |
|
|
| 7.0 |
| ||||||||||||
Restructuring |
|
| 20 |
|
|
| 10 |
|
|
| 11 |
| ||||||||||||
Fees and expenses related to repricing of Term Loan Facility |
|
| 2 |
|
|
| — |
|
|
| — |
| ||||||||||||
Amortization of intangible assets |
|
| 55.3 |
|
|
| 55.2 |
|
|
| 67.4 |
|
|
| 295 |
|
|
| 146 |
|
|
| 55 |
|
Asset impairment |
|
| — |
|
|
| 2.3 |
|
|
| 4.7 |
| ||||||||||||
COVID-19 related net credits |
|
| — |
|
|
| (1.2 | ) |
|
| — |
| ||||||||||||
Fees and expenses related to repricing of Term Loan Facility |
|
| — |
|
|
| — |
|
|
| 6.6 |
| ||||||||||||
Goodwill and intangible asset impairments |
|
| 1,902 |
|
|
| — |
|
|
| — |
| ||||||||||||
Gain on sale of long-lived assets |
|
| — |
|
|
| — |
|
|
| (6.8 | ) |
|
| (2 | ) |
|
| (7 | ) |
|
| — |
|
Income from operations |
|
| 698.9 |
|
|
| 453.8 |
|
|
| 219.8 |
| ||||||||||||
(Loss) income from operations |
|
| (1,554 | ) |
|
| 617 |
|
|
| 699 |
| ||||||||||||
Interest income |
|
| 0.6 |
|
|
| 1.4 |
|
|
| 5.4 |
|
|
| (17 | ) |
|
| (4 | ) |
|
| — |
|
Interest expense |
|
| 25.4 |
|
|
| 29.1 |
|
|
| 44.1 |
|
|
| 356 |
|
|
| 177 |
|
|
| 25 |
|
Loss on extinguishment of debt |
|
| 8 |
|
|
| — |
|
|
| — |
| ||||||||||||
Other expense, net |
|
| 8.6 |
|
|
| 3.1 |
|
|
| 3.3 |
|
|
| 27 |
|
|
| 11 |
|
|
| 9 |
|
Income before income taxes |
|
| 665.5 |
|
|
| 423.0 |
|
|
| 177.8 |
| ||||||||||||
Provision for income taxes |
|
| 114.1 |
|
|
| 72.9 |
|
|
| 37.4 |
| ||||||||||||
Net income |
| $ | 551.4 |
|
| $ | 350.1 |
|
| $ | 140.4 |
| ||||||||||||
Other comprehensive income, net of tax: |
|
|
|
|
|
|
|
|
|
|
|
| ||||||||||||
(Loss) income before income taxes |
|
| (1,928 | ) |
|
| 433 |
|
|
| 665 |
| ||||||||||||
(Benefit) provision for income taxes |
|
| (87 | ) |
|
| 100 |
|
|
| 114 |
| ||||||||||||
Net (loss) income |
| $ | (1,841 | ) |
| $ | 333 |
|
| $ | 551 |
| ||||||||||||
Other comprehensive (loss) income, net of tax: |
|
|
|
|
|
|
| |||||||||||||||||
Changes in value of financial instruments designated as cash flow hedges |
| $ | 20.0 |
|
| $ | (10.6 | ) |
| $ | (10.0 | ) |
| $ | (24 | ) |
| $ | 50 |
|
| $ | 20 |
|
Foreign currency translation adjustments |
|
| (31.5 | ) |
|
| 34.7 |
|
|
| (6.2 | ) |
|
| (83 | ) |
|
| 18 |
|
|
| (31 | ) |
Unrecognized pension loss |
|
| — |
|
|
| (1.7 | ) |
|
| (0.5 | ) | ||||||||||||
Unrealized gain on investments |
|
| — |
|
|
| 0.2 |
|
|
| — |
| ||||||||||||
Total comprehensive income |
| $ | 539.9 |
|
| $ | 372.7 |
|
| $ | 123.7 |
| ||||||||||||
Net income per share: |
|
|
|
|
|
|
|
|
|
|
|
| ||||||||||||
Change in net investment hedge |
|
| (25 | ) |
|
| — |
|
|
| — |
| ||||||||||||
Unrecognized pension (loss) gain |
|
| (9 | ) |
|
| 12 |
|
|
| — |
| ||||||||||||
Unrealized loss on investments |
|
| (23 | ) |
|
| — |
|
|
| — |
| ||||||||||||
Total comprehensive (loss) income |
| $ | (2,005 | ) |
| $ | 413 |
|
| $ | 540 |
| ||||||||||||
Net (loss) income per share: |
|
|
|
|
|
|
|
| ||||||||||||||||
Basic |
| $ | 9.95 |
|
| $ | 6.36 |
|
| $ | 2.57 |
|
| $ | (27.54 | ) |
| $ | 5.57 |
|
| $ | 9.95 |
|
Diluted |
| $ | 9.90 |
|
| $ | 6.33 |
|
| $ | 2.55 |
|
| $ | (27.54 | ) |
| $ | 5.56 |
|
| $ | 9.90 |
|
Weighted average common shares outstanding: |
|
|
|
|
|
|
|
|
|
|
|
|
|
|
|
|
|
|
|
| ||||
Basic |
|
| 55.4 |
|
|
| 55.1 |
|
|
| 54.7 |
|
|
| 66.8 |
|
|
| 59.7 |
|
|
| 55.4 |
|
Diluted |
|
| 55.7 |
|
|
| 55.3 |
|
|
| 55.1 |
|
|
| 66.8 |
|
|
| 59.9 |
|
|
| 55.7 |
|
The accompanying notes are an integral part of the consolidated financial statements.Consolidated Financial Statements.
66
MKS Instruments, Inc.
Consolidated Statements of Stockholders’ Equity
(in millions, except per share data)
|
|
|
|
|
|
|
|
|
|
|
|
| Accumulated |
|
|
| ||||||||||||||||||||||||||||||||||||||||||
|
|
|
|
|
|
|
|
| Additional |
|
|
| Other |
| Total |
|
|
|
|
|
|
|
|
|
|
|
| Accumulated |
|
|
|
| ||||||||||||||||||||||||||
|
| Common Stock |
|
| Paid-In |
|
|
| Retained |
| Comprehensive |
| Stockholders' |
|
|
|
|
|
|
| Additional |
|
|
|
|
| Other |
|
| Total |
| |||||||||||||||||||||||||||
|
| Shares |
|
|
| Amount |
|
| Capital |
| Earnings |
| (Loss) Income |
| Equity |
|
| Common Stock |
|
| Paid-In |
|
| Retained |
|
| Comprehensive |
|
| Stockholders' |
| |||||||||||||||||||||||||||
Balance at December 31, 2018 |
|
| 54.0 |
|
|
| $ | 0.1 |
|
|
| $ | 793.9 |
|
|
| $ | 1,084.8 |
|
|
| $ | (5.6 | ) |
|
|
| $ | 1,873.2 |
| ||||||||||||||||||||||||||||
Net issuance under stock-based plans |
|
| 0.6 |
|
|
| (11.0 | ) |
|
|
|
|
| (11.0 | ) | |||||||||||||||||||||||||||||||||||||||||||
Settlement of share-based compensation awards(1) |
|
|
|
|
|
| 30.6 |
|
|
|
|
| 30.6 |
| ||||||||||||||||||||||||||||||||||||||||||||
Stock-based compensation |
|
|
|
|
|
| 50.3 |
|
|
|
|
| 50.3 |
| ||||||||||||||||||||||||||||||||||||||||||||
Cash dividend ($0.80 per common share) |
|
|
|
|
|
|
|
| (43.5 | ) |
|
|
| (43.5 | ) | |||||||||||||||||||||||||||||||||||||||||||
Stock dividends accrued |
|
|
|
|
|
| 0.5 |
| (0.5 | ) |
|
|
| — |
| |||||||||||||||||||||||||||||||||||||||||||
Comprehensive income (net of tax): |
|
|
|
|
|
|
|
|
|
|
|
|
|
| ||||||||||||||||||||||||||||||||||||||||||||
Net income |
|
|
|
|
|
|
|
| 140.4 |
|
|
| 140.4 |
| ||||||||||||||||||||||||||||||||||||||||||||
Other comprehensive loss |
|
|
|
|
|
|
|
|
|
| (16.7 | ) |
| (16.7 | ) | |||||||||||||||||||||||||||||||||||||||||||
Balance at December 31, 2019 |
|
| 54.6 |
|
|
| 0.1 |
|
|
| 864.3 |
|
|
| 1,181.2 |
|
|
| (22.3 | ) |
|
|
| 2,023.3 |
| |||||||||||||||||||||||||||||||||
Net issuance under stock-based plans |
|
| 0.6 |
|
|
| (20.7 | ) |
|
|
|
|
| (20.7 | ) | |||||||||||||||||||||||||||||||||||||||||||
Stock-based compensation |
|
|
|
|
|
| 29.6 |
|
|
|
|
| 29.6 |
| ||||||||||||||||||||||||||||||||||||||||||||
Cash dividend ($0.80 per common share) |
|
|
|
|
|
|
|
| (44.0 | ) |
|
|
| (44.0 | ) | |||||||||||||||||||||||||||||||||||||||||||
Comprehensive income (net of tax): |
|
|
|
|
|
|
|
|
|
|
|
|
|
| ||||||||||||||||||||||||||||||||||||||||||||
Net income |
|
|
|
|
|
|
|
| 350.1 |
|
|
| 350.1 |
| ||||||||||||||||||||||||||||||||||||||||||||
Other comprehensive income |
|
|
|
|
|
|
|
|
|
| 22.6 |
| 22.6 |
| ||||||||||||||||||||||||||||||||||||||||||||
|
| Shares |
|
| Amount |
|
| Capital |
|
| Earnings |
|
| (Loss) Income |
|
| Equity |
| ||||||||||||||||||||||||||||||||||||||||
Balance at December 31, 2020 |
|
| 55.2 |
| 0.1 |
| 873.2 |
| 1,487.3 |
| 0.3 |
| 2,360.9 |
|
|
| 55.2 |
|
| $ | 0.1 |
|
| $ | 873 |
|
| $ | 1,487 |
|
| $ | — |
|
| $ | 2,360 |
| ||||||||||||||||||||
Net issuance under stock-based plans |
|
| 0.3 |
|
|
| (3.3 | ) |
|
|
|
|
| (3.3 | ) |
|
| 0.3 |
|
|
|
|
|
| (4 | ) |
|
|
|
|
|
|
|
| (4 | ) | ||||||||||||||||||||||
Stock-based compensation |
|
|
|
|
|
| 36.7 |
|
|
|
|
| 36.7 |
|
|
|
|
|
|
|
|
| 37 |
|
|
|
|
|
|
|
|
| 37 |
| ||||||||||||||||||||||||
Cash dividend ($0.86 per common share) |
|
|
|
|
|
|
|
| (47.6 | ) |
|
|
| (47.6 | ) | |||||||||||||||||||||||||||||||||||||||||||
Stock dividends accrued |
|
|
|
|
|
| 0.1 |
| (0.1 | ) |
|
|
| — |
| |||||||||||||||||||||||||||||||||||||||||||
Cash dividend ($0.86 per common share) |
|
|
|
|
|
|
|
|
|
|
| (47 | ) |
|
|
|
| (47 | ) | |||||||||||||||||||||||||||||||||||||||
Comprehensive income (net of tax): |
|
|
|
|
|
|
|
|
|
|
|
|
|
|
|
|
|
|
|
|
|
|
|
|
|
|
|
|
|
| ||||||||||||||||||||||||||||
Net income |
|
|
|
|
|
|
|
| 551.4 |
|
|
| 551.4 |
|
|
|
|
|
|
|
|
|
|
|
| 551 |
|
|
|
|
| 551 |
| |||||||||||||||||||||||||
Other comprehensive loss |
|
|
|
|
|
|
|
|
|
| (11.5 | ) |
| (11.5 | ) |
|
|
|
|
|
|
|
|
|
|
|
|
|
| (11 | ) |
|
| (11 | ) | |||||||||||||||||||||||
Balance at December 31, 2021 |
|
| 55.5 |
| $ | 0.1 |
| $ | 906.7 |
| $ | 1,991.0 |
| $ | (11.2 | ) |
| $ | 2,886.6 |
|
|
| 55.5 |
|
|
| 0.1 |
|
|
| 907 |
|
|
| 1,991 |
|
|
| (11 | ) |
|
| 2,887 |
| ||||||||||||||
Net issuance under stock-based plans |
|
| 0.4 |
|
|
|
|
|
| 5 |
|
|
|
|
|
|
|
|
| 5 |
| |||||||||||||||||||||||||||||||||||||
Shares issued for Atotech Acquisition |
|
| 10.7 |
|
|
|
|
|
| 1,186 |
|
|
|
|
|
|
|
|
| 1,186 |
| |||||||||||||||||||||||||||||||||||||
Stock-based compensation |
|
|
|
|
|
|
|
| 45 |
|
|
|
|
|
|
|
|
| 45 |
| ||||||||||||||||||||||||||||||||||||||
Cash dividend ($0.88 per common share) |
|
|
|
|
|
|
|
|
|
|
| (52 | ) |
|
|
|
| (52 | ) | |||||||||||||||||||||||||||||||||||||||
Comprehensive income (net of tax): |
|
|
|
|
|
|
|
|
|
|
|
|
|
|
|
| ||||||||||||||||||||||||||||||||||||||||||
Net income |
|
|
|
|
|
|
|
|
|
|
| 333 |
|
|
|
|
| 333 |
| |||||||||||||||||||||||||||||||||||||||
Other comprehensive income |
|
|
|
|
|
|
|
|
|
|
|
|
|
| 80 |
|
|
| 80 |
| ||||||||||||||||||||||||||||||||||||||
Balance at December 31, 2022 |
|
| 66.6 |
|
|
| 0.1 |
|
|
| 2,142 |
|
|
| 2,272 |
|
|
| 69 |
|
|
| 4,483 |
| ||||||||||||||||||||||||||||||||||
Net issuance under stock-based plans |
|
| 0.3 |
|
|
|
|
|
| (1 | ) |
|
|
|
|
|
|
|
| (1 | ) | |||||||||||||||||||||||||||||||||||||
Stock-based compensation |
|
|
|
|
|
|
|
| 54 |
|
|
|
|
|
|
|
|
| 54 |
| ||||||||||||||||||||||||||||||||||||||
Cash dividend ($0.88 per common share) |
|
|
|
|
|
|
|
|
|
|
| (59 | ) |
|
|
|
| (59 | ) | |||||||||||||||||||||||||||||||||||||||
Comprehensive loss (net of tax): |
|
|
|
|
|
|
|
|
|
|
|
|
|
|
|
| ||||||||||||||||||||||||||||||||||||||||||
Net loss |
|
|
|
|
|
|
|
|
|
|
| (1,841 | ) |
|
|
|
| (1,841 | ) | |||||||||||||||||||||||||||||||||||||||
Other comprehensive loss |
|
|
|
|
|
|
|
|
|
|
|
|
|
| (164 | ) |
|
| (164 | ) | ||||||||||||||||||||||||||||||||||||||
Balance at December 31, 2023 |
|
| 66.9 |
|
| $ | 0.1 |
|
| $ | 2,195 |
|
| $ | 373 |
|
| $ | (96 | ) |
| $ | 2,472 |
| ||||||||||||||||||||||||||||||||||
|
|
The accompanying notes are an integral part of the consolidated financial statements.Consolidated Financial Statements.
67
MKS Instruments, Inc.
Consolidated Statements of Cash Flows
(in millions)
|
| Years Ended December 31, |
| |||||||||
|
| 2023 |
|
| 2022 |
|
| 2021 |
| |||
Cash flows from operating activities: |
|
|
|
|
|
|
|
|
| |||
Net (loss) income |
| $ | (1,841 | ) |
| $ | 333 |
|
| $ | 551 |
|
Adjustments to reconcile net (loss) income to net cash provided by operating activities: |
|
|
|
|
|
|
|
|
| |||
Depreciation and amortization |
|
| 397 |
|
|
| 216 |
|
|
| 104 |
|
Amortization of inventory step-up to fair value |
|
| — |
|
|
| 52 |
|
|
| — |
|
Goodwill and intangible asset impairments |
|
| 1,902 |
|
|
| — |
|
|
| — |
|
Unrealized loss (gain) on derivatives not designated as hedging instruments |
|
| 32 |
|
|
| 13 |
|
|
| (4 | ) |
Amortization of debt issuance costs and original issue discount |
|
| 33 |
|
|
| 56 |
|
|
| 2 |
|
Loss on extinguishment of debt |
|
| 8 |
|
|
| — |
|
|
| — |
|
Gain on sale of long-lived assets |
|
| (2 | ) |
|
| (7 | ) |
|
| — |
|
Stock-based compensation |
|
| 54 |
|
|
| 45 |
|
|
| 37 |
|
Provision for excess and obsolete inventory |
|
| 64 |
|
|
| 21 |
|
|
| 16 |
|
Deferred income taxes |
|
| (234 | ) |
|
| (46 | ) |
|
| 2 |
|
Other |
|
| 5 |
|
|
| 3 |
|
|
| 4 |
|
Changes in operating assets and liabilities, net of acquired assets and liabilities: |
|
|
|
|
|
|
|
|
| |||
Trade accounts receivable |
|
| 114 |
|
|
| (4 | ) |
|
| (53 | ) |
Inventories |
|
| (76 | ) |
|
| (236 | ) |
|
| (92 | ) |
Other current and non-current assets |
|
| 50 |
|
|
| 28 |
|
|
| — |
|
Accounts payable |
|
| (99 | ) |
|
| 61 |
|
|
| 56 |
|
Current and non-current accrued compensation |
|
| (5 | ) |
|
| (31 | ) |
|
| 17 |
|
Income taxes payable |
|
| (64 | ) |
|
| 19 |
|
|
| 1 |
|
Other current and non-current liabilities |
|
| (19 | ) |
|
| 6 |
|
|
| (1 | ) |
Net cash provided by operating activities |
|
| 319 |
|
|
| 529 |
|
|
| 640 |
|
Cash flows from investing activities: |
|
|
|
|
|
|
|
|
| |||
Acquisitions of businesses, net of cash acquired |
|
| — |
|
|
| (4,473 | ) |
|
| (268 | ) |
Purchases of investments |
|
| — |
|
|
| (1 | ) |
|
| (497 | ) |
Maturities of investments |
|
| — |
|
|
| 77 |
|
|
| 478 |
|
Sales of investments |
|
| — |
|
|
| — |
|
|
| 169 |
|
Proceeds from sale of long-lived assets |
|
| 3 |
|
|
| 9 |
|
|
| — |
|
Purchases of property, plant and equipment |
|
| (87 | ) |
|
| (164 | ) |
|
| (87 | ) |
Net cash used in investing activities |
|
| (84 | ) |
|
| (4,552 | ) |
|
| (205 | ) |
Cash flows from financing activities: |
|
|
|
|
|
|
|
|
| |||
Proceeds from borrowing |
|
| 216 |
|
|
| 5,237 |
|
|
| 1 |
|
Payments of borrowings |
|
| (403 | ) |
|
| (962 | ) |
|
| (15 | ) |
Payments of deferred financing fees |
|
| (9 | ) |
|
| (249 | ) |
|
| — |
|
Dividend payments |
|
| (59 | ) |
|
| (52 | ) |
|
| (47 | ) |
Net payments related to employee stock awards |
|
| (1 | ) |
|
| (1 | ) |
|
| (4 | ) |
Other financing activities |
|
| (3 | ) |
|
| (2 | ) |
|
| — |
|
Net cash (used in) provided by financing activities |
|
| (259 | ) |
|
| 3,971 |
|
|
| (65 | ) |
Effect of exchange rate changes on cash and cash equivalents |
|
| (10 | ) |
|
| (5 | ) |
|
| (12 | ) |
(Decrease) increase in cash and cash equivalents |
|
| (34 | ) |
|
| (57 | ) |
| 358 |
| |
Cash and cash equivalents at beginning of period |
|
| 909 |
|
|
| 966 |
|
| 608 |
| |
Cash and cash equivalents at end of period |
| $ | 875 |
|
| $ | 909 |
| $ | 966 |
| |
Supplemental disclosure of cash flow information: |
|
|
|
|
|
|
|
|
| |||
Cash paid during the period for: |
|
|
|
|
|
|
|
|
| |||
Interest |
| $ | 305 |
|
| $ | 110 |
|
| $ | 23 |
|
Income taxes |
| $ | 180 |
|
| $ | 133 |
|
| $ | 110 |
|
|
| Years Ended December 31, |
| |||||||||
|
| 2021 |
|
| 2020 |
|
| 2019 |
| |||
Cash flows from operating activities: |
|
|
|
|
|
|
|
|
|
|
|
|
Net income |
| $ | 551.4 |
|
| $ | 350.1 |
|
| $ | 140.4 |
|
Adjustments to reconcile net income to net cash provided by operating activities: |
|
|
|
|
|
|
|
|
|
|
|
|
Depreciation and amortization |
|
| 104.1 |
|
|
| 99.2 |
|
|
| 110.0 |
|
Unrealized (gain) loss on derivatives not designated as hedging instruments |
|
| (4.2 | ) |
|
| (0.4 | ) |
|
| 0.1 |
|
Amortization of inventory step-up adjustment to fair value |
|
| — |
|
|
| — |
|
|
| 7.6 |
|
Amortization of debt issuance costs and original issue discount |
|
| 2.3 |
|
|
| 2.7 |
|
|
| 7.1 |
|
Stock-based compensation |
|
| 36.7 |
|
|
| 29.5 |
|
|
| 49.2 |
|
Provision for excess and obsolete inventory |
|
| 16.2 |
|
|
| 24.8 |
|
|
| 24.7 |
|
Deferred income taxes |
|
| 1.2 |
|
|
| (7.1 | ) |
|
| (4.2 | ) |
Asset impairment |
|
| — |
|
|
| 2.3 |
|
|
| 4.7 |
|
Other |
|
| 3.3 |
|
|
| 0.7 |
|
|
| (6.6 | ) |
Changes in operating assets and liabilities, net of businesses acquired: |
|
|
|
|
|
|
|
|
|
|
|
|
Trade accounts receivable |
|
| (52.7 | ) |
|
| (44.8 | ) |
|
| (0.1 | ) |
Inventories |
|
| (91.7 | ) |
|
| (52.2 | ) |
|
| (29.3 | ) |
Income taxes payable |
|
| 1.3 |
|
|
| 21.6 |
|
|
| (12.4 | ) |
Other current and non-current assets |
|
| (0.3 | ) |
|
| 40.9 |
|
|
| (9.8 | ) |
Current and non-current accrued compensation |
|
| 17.0 |
|
|
| 19.4 |
|
|
| (4.2 | ) |
Other current and non-current liabilities |
|
| (0.6 | ) |
|
| 5.5 |
|
|
| (8.5 | ) |
Accounts payable |
|
| 55.5 |
|
|
| 21.0 |
|
|
| (24.2 | ) |
Net cash provided by operating activities |
|
| 639.5 |
|
|
| 513.2 |
|
|
| 244.5 |
|
Cash flows from investing activities: |
|
|
|
|
|
|
|
|
|
|
|
|
Acquisitions of businesses, net of cash acquired |
|
| (268.4 | ) |
|
| — |
|
|
| (988.6 | ) |
Purchases of investments |
|
| (497.0 | ) |
|
| (522.4 | ) |
|
| (246.3 | ) |
Maturities of investments |
|
| 478.3 |
|
|
| 332.4 |
|
|
| 142.6 |
|
Sales of investments |
|
| 169.2 |
|
|
| 72.5 |
|
|
| 166.9 |
|
Proceeds from sale of assets |
|
| — |
|
|
| — |
|
|
| 42.1 |
|
Purchases of property, plant and equipment |
|
| (86.7 | ) |
|
| (84.9 | ) |
|
| (63.9 | ) |
Net cash used in investing activities |
|
| (204.6 | ) |
|
| (202.4 | ) |
|
| (947.2 | ) |
Cash flows from financing activities: |
|
|
|
|
|
|
|
|
|
|
|
|
Net proceeds from short and long-term borrowings |
|
| 1.0 |
|
|
| 27.0 |
|
|
| 642.2 |
|
Payments of short and long-term borrowings |
|
| (15.2 | ) |
|
| (83.8 | ) |
|
| (111.5 | ) |
Net payments related to employee stock awards |
|
| (3.3 | ) |
|
| (20.7 | ) |
|
| (11.0 | ) |
Dividend payments |
|
| (47.6 | ) |
|
| (44.0 | ) |
|
| (43.5 | ) |
Net cash (used in) provided by financing activities |
|
| (65.1 | ) |
|
| (121.5 | ) |
|
| 476.2 |
|
Effect of exchange rate changes on cash and cash equivalents |
|
| (11.8 | ) |
|
| 4.4 |
|
|
| (3.2 | ) |
Increase (decrease) in cash and cash equivalents |
|
| 358.0 |
|
|
| 193.7 |
|
|
| (229.7 | ) |
Cash and cash equivalents at beginning of period |
|
| 608.3 |
|
|
| 414.6 |
|
|
| 644.3 |
|
Cash and cash equivalents at end of period |
| $ | 966.3 |
|
| $ | 608.3 |
|
| $ | 414.6 |
|
Supplemental disclosure of cash flow information: |
|
|
|
|
|
|
|
|
|
|
|
|
Cash paid during the period for: |
|
|
|
|
|
|
|
|
|
|
|
|
Interest |
| $ | 23.0 |
|
| $ | 26.3 |
|
| $ | 39.9 |
|
Income taxes |
| $ | 109.9 |
|
| $ | 65.6 |
|
| $ | 35.5 |
|
The accompanying notes are an integral part of the consolidated financial statements.Consolidated Financial Statements.
68
61
MKS INSTRUMENTS, INC.
NOTES TO CONSOLIDATED FINANCIAL STATEMENTS
(in millions, except per share data)
(1) Business Description
|
|
MKS Instruments, Inc. (“MKS” or the “Company”) was founded in 1961 and is a global provider ofenables technologies that transform the world. The Company delivers foundational technology solutions to leading edge semiconductor manufacturing, electronics and packaging, and specialty industrial applications. The Company applies its broad science and engineering capabilities to create instruments, systems, subsystems, andsystems, process control solutions that measure, monitor, deliver, analyze, power and control critical parameters of advanced manufacturing processes tospecialty chemicals technology that improve process performance, optimize productivity and productivityenable unique innovations for its customers.many of the world’s leading technology and industrial companies. The Company’s productssolutions are derived from its core competenciescritical to addressing the challenges of miniaturization and complexity in pressure measurementadvanced device manufacturing by enabling increased power, speed, feature enhancement and control, flow measurement and control, gas and vapor delivery, gas composition analysis, electronic control technology, reactive gas generation and delivery, power generation and delivery, vacuum technology, temperature sensing, lasers, photonics, optics, precision motion control, vibration control and laser-based manufacturing systems solutions. optimized connectivity. These solutions are also critical to addressing ever-increasing performance requirements across a wide array of specialty industrial applications.