Page | |||
1 | |||
2 | |||
2 | |||
Item 1. |
| ||
Item 1A. |
| ||
Item 1B. |
| ||
Item 1C. | 37 | ||
Item 2. |
| ||
Item 3. |
| ||
Item 4. |
| ||
| |||
Item 5. |
| ||
Item 6. |
| ||
Item 7. | Management’s Discussion and Analysis of Financial Condition and Results of Operations |
| |
Item 7A. |
| ||
Item 8. |
| ||
Item 9. | Changes in and Disagreements With Accountants on Accounting and Financial Disclosure |
| |
Item 9A. |
| ||
Item 9B. |
| ||
Item 9C. | Disclosure Regarding Foreign Jurisdictions that Prevent Inspections |
| |
Item 10. |
| ||
Item 11. |
| ||
Item 12. | Security Ownership of Certain Beneficial Owners and Management and Related Shareholder Matters |
| |
Item 13. | Certain Relationships and Related Transactions, and Director Independence |
| |
Item 14. |
| ||
Item 15. |
| ||
Item 16. |
|
i
PART I
i
BASIS OF PRESENTATION
WW International, Inc., formerly known as Weight Watchers International, Inc., is a Virginia corporation with its principal executive offices in New York, New York. In this Annual Report on Form 10-K unless the context indicates otherwise: “we,” “us,” “our,” the “Company”“Company,” “Weight Watchers” and “WW” refer to WW International, Inc. and all of its operations consolidated for purposes of its financial statements; “North America” refers to our North American Company-owned operations; “Continental Europe”operations and franchise revenues and related costs; and “International” refers to our Continental Europe Company-owned operations; “United Kingdom” refers to ouroperations, United Kingdom Company-owned operations;operations, and “Other” refers to Australia, New Zealand and emerging markets operations and franchise revenues and related costs. Eachoperations. See “Item 1. Business—Business Organization—Changes in Segment Reporting” of North America, Continental Europe, United Kingdom and Other is also a reportable segment.this Annual Report on Form 10-K for information on recent segment changes.
Our fiscal year ends on the Saturday closest to December 31st and consists of either 52- or 53-week periods. In this Annual Report on Form 10-K:
• “fiscal 2015” refers to our fiscal year ended January 2, 2016; • “fiscal 2017” refers to our fiscal year ended December 30, 2017; • “fiscal 2018” refers to our fiscal year ended December 29, 2018; • “fiscal 2019” refers to our fiscal year ended December 28, 2019; • “fiscal 2020” refers to our fiscal year ended January 2, 2021 (included a 53rd week); • “fiscal 2021” refers to our fiscal year ended January 1, 2022; • “fiscal 2022” refers to our fiscal year ended December 31, 2022; • “fiscal 2023” refers to our fiscal year ended December 30, 2023; • “fiscal 2024” refers to our fiscal year ended December 28, 2024; • “fiscal 2025” refers to our fiscal year ended January 3, 2026 (includes a 53rd week); • “fiscal 2026” refers to our fiscal year ended January 2, 2027; • “fiscal 2027” refers to our fiscal year ended January 1, 2028; and • “fiscal 2028” refers to our fiscal year ended December 30, 2028. |
|
|
|
|
|
|
|
|
|
|
|
|
|
|
|
|
|
|
|
|
|
|
|
|
|
|
|
|
|
|
The following terms used in this Annual Report on Form 10-K are our trademarks: ConnectTM, Digital 360®, myWW®, PersonalPointsTM, Points®, Weight Watchers®, ZeroPoint®, Weekend HealthTM and the WW logo.
1
CAUTIONARY NOTICE REGARDING FORWARD-LOOKING STATEMENTS
Except for historical information contained herein, this Annual Report on Form 10-K includes “forward-looking statements,” within the meaning of Section 27A of the Securities Act of 1933, as amended, and Section 21E of the Securities Exchange Act of 1934, as amended (the “Exchange Act”), including, in particular, the statements about our plans, strategies, objectives and prospects under the headings “Business” and “Management’s Discussion and Analysis of Financial Condition and Results of Operations.” We have generally used the words “may,” “will,” “could,” “expect,” “anticipate,” “believe,” “estimate,” “plan,” “intend,” “aim”and similar expressions in this Annual Report on Form 10-K and the documents incorporated by reference herein to identify forward-looking statements. We have based these forward-looking statements on our current views with respect to future events and financial performance. Actual results could differ materially from those projected in these forward-looking statements.
ii
You should not put undue reliance on any forward-looking statements. You should understand that many important factors, including those identified below and discussed under the headings “Risk Factors” and “Management’s Discussion and Analysis of Financial Condition and Results of Operations,” could cause our results to differ materially from those expressed or suggested in any forward-looking statement. Except as required by law, we do not undertake any obligation to update or revise these forward-looking statements to reflect new information or events or circumstances that occur after the date of this Annual Report on Form 10-K or to reflect the occurrence of unanticipated events or otherwise.
PART ISUMMARY OF MATERIAL RISKS
A summary of the principal factors that create risk in investing in our securities and might cause actual results to differ from expectations is set forth below:
| • competition from other weight management and health and wellness industry participants or the development of more effective or more favorably perceived weight management methods; • our failure to continue to retain and grow our subscriber base; • our ability to be a leader in the rapidly evolving and increasingly competitive clinical weight management and weight loss market; • our ability to continue to develop new, innovative services and products and enhance our existing services and products or the failure of our services, products or brands to continue to appeal to the market, or our ability to successfully expand into new channels of distribution or respond to consumer trends or sentiment; • our ability to successfully implement strategic initiatives; • our ability to evolve our community offerings to meet the evolving tastes and preferences of our members; • the effectiveness and efficiency of our advertising and marketing programs, including the strength of our social media presence; • the impact on our reputation of actions taken by our franchisees, licensees, suppliers, affiliated provider entities, PCs’ healthcare professionals, and other partners, including as a result of our acquisition of Weekend Health, Inc., doing business as Sequence (“Sequence”) (the “Acquisition”); • the recognition of asset impairment charges; • the loss of key personnel, strategic partners or consultants or failure to effectively manage and motivate our workforce; • our ability to successfully make acquisitions or enter into collaborations or joint ventures, including our ability to successfully integrate, operate or realize the anticipated benefits of such businesses, including with respect to Sequence; 2 • uncertainties related to a downturn in general economic conditions or consumer confidence, including as a result of the existing inflationary environment, rising interest rates, the potential impact of political and social unrest and increased volatility in the credit and capital markets; • the seasonal nature of our business; • our failure to maintain effective internal control over financial reporting; • the impact of events that impede accessing resources or discourage or impede people from gathering with others; • the early termination by us of leases; • the inability to renew certain of our licenses, or the inability to do so on terms that are favorable to us; • the impact of our substantial amount of debt, debt service obligations and debt covenants, and our exposure to variable rate indebtedness; • the ability to generate sufficient cash to service our debt and satisfy our other liquidity requirements; • uncertainties regarding the satisfactory operation of our technology or systems; • the impact of data security breaches and other malicious acts or privacy concerns, including the costs of compliance with evolving privacy laws and regulations; • our ability to successfully integrate and use artificial intelligence in our business; • our ability to enforce our intellectual property rights both domestically and internationally, as well as the impact of our involvement in any claims related to intellectual property rights; • risks and uncertainties associated with our international operations, including regulatory, economic, political, social, intellectual property, and foreign currency risks, which risks may be exacerbated as a result of war and terrorism; • the outcomes of litigation or regulatory actions; • the impact of existing and future laws and regulations; • risks related to the Acquisition, including risks that the Acquisition may not achieve its intended results; • risks related to our exposure to extensive and complex healthcare laws and regulations as a result of the Acquisition; and • other risks and uncertainties, including those detailed from time to time in our periodic reports filed with the Securities and Exchange Commission (the “SEC”). 3 Item 1. Business Overview
|
|
Overview
We are a global wellnesstechnology company at the forefront of weight health, grounded in nutritional and behavior change science. We are powered by the world’s leading commercialour weight loss and weight management program programs, our award-winning appand an award-winning digital subscription platform. We are focused on inspiringour commitment to tailoring solutions for our members to improve their weight health, including providing medical weight management treatment via access to clinician-prescribed weight management medications and related support through the WeightWatchers Clinic affiliated practices. Our portfolio of solutions empowers people to adopt healthy habits for real life and aim to democratize and deliver wellness for all.help achieve lasting weight health. With nearly six decades of weight management experience, expertise and know-how, we are one of the most recognized and trusted brand names among weight-conscious consumers. We educate our members and provide them with guidance, digital tools, and an inspiring community communities – via ourexclusive social network,Connect,and our workshops -- to enable them to develop healthy habits and focus on their overallpersonal weight health and wellness. WW-branded services and products include digital offerings provided throughjourneys. We also offer our apps and websites, workshops, consumer products, and various events and experiences.science-backed behavior change GLP-1 Program. Our business has gone through a significant shift to a digital subscription model over the past several years and our primary sources of revenue are subscriptions for our digital, productsworkshop, and for our workshops.clinical offerings. Our “Digital” business refers to providing subscriptions to our digital product offerings, including Digital 360 and Personal Coaching + Digital.offerings. Our “Workshops + Digital” (formerly known as “Studio + Digital”) business refers to providing unlimited access to our workshops combined with our digital subscription product offerings. Our “Clinical” business refers to providing subscriptions to our clinical product offerings provided by WeightWatchers Clinic (formally referred to commitment plan subscribers. It also includes the provisionas Sequence). For additional details on certain of access to workshops for members who do not subscribe to commitment plans, including our “pay-as-you-go” members.historic offerings, see “Item 7. Management’s Discussion and Analysis of Financial Condition and Results of Operations—Overview” in Part II of this Annual Report on Form 10-K.
We believe that the power of our communities -- via ourConnect platform, workshops and Digital 360 offering -- increases accountability and provides our members with inspiration, human connection, and support. This inspires them and enables them to build healthier and more fulfilling food, activity, mindset and sleep habits. Our brands enjoy high awareness and credibility among all types of consumers—womenconsumers. Over 160 scientific, peer reviewed studies (including from over 55 randomized controlled trials) have been published on WeightWatchers. This body of research showcases the breadth of WeightWatchers scientific evaluation and men, consumers onlineimplementation across clinical and offline, the support-inclinedcommunity settings, diverse participant populations, and the self-help-inclined. We believe that our program conveys an image of healthy, livable, sustainable and effective weight management in a supportive environment. The efficacy of our commercialcomparisons to other weight management programs has been clinically proven in numerous studies and trials.or standards of care. As the number of people with overweight and obese peopleobesity worldwide grows,continues to grow, the need for an effective, scalable and consumer-friendly weight management program increases.programs and access to weight-loss medication continues to increase. We believe our global presence and brand awareness uniquely position us in the global weight management market, and thereby provide us a unique platform to impact the wellnessweight health market.
We have built our business by helping millions of people around the world lose weight and build healthy habits through a sensible, sustainable and livable approach to food, activityweight loss and mindset. We believe we are the leading global provider of paid digital subscription weight management products.management. As of the end of fiscal 2021,2023, we had a total of approximately 4.23.8 million subscribers, of which approximately 3.43.1 million were Digital subscribers, and approximately 0.7 million were Workshops + Digital subscribers, and approximately 67 thousand were Clinical subscribers. Our strong brands, together with the effectiveness of our program,programs, loyal customer base, strong digital offeringsinnovations, community, and unparalleled network of workshopsongoing evolution alongside scientific and coaches,medical advancements, enable us to attract new and returning customers.
Business Organization
For fiscal 2022 and Global Operations
We havefor several years prior, we had four reportable segments based on an integrated geographical structure as follows: North America, Continental Europe (CE), United Kingdom and Other. Each reportable segment providesprovided similar services and products. We operate in numerous countries around the world. Our “North America” reportable segment consistsconsisted of our United States and Canada Company-owned operations; our “Continental Europe” reportable segment consistsconsisted of our Germany, Switzerland, France, Belgium, Netherlands and Sweden Company-owned operations; our “United Kingdom” reportable segment consistsconsisted of our United Kingdom Company-owned operations; and our “Other” reportable segment consistsconsisted of our Australia, New Zealand, and Brazil Company-owned operations, as well as revenues and costs from our franchises in the United States and certain other countries.
1
Our Services and Products4
Changes in Segment Reporting
Our ProgramAs previously disclosed, effective the first day of fiscal 2023 (i.e., January 1, 2023), we realigned our organizational structure and Food Plans
We offerresources to more closely align with our strategic priorities and centralized the global management of certain functions and systems. As a result of the change in our organizational structure, in fiscal 2023, we had two reportable segments, consisting of North America and International, for the purpose of making operational and resource decisions and assessing financial performance. “North America” refers to our North American Company-owned operations and franchise revenues and related costs; and “International” refers to our Continental Europe Company-owned operations, United Kingdom Company-owned operations, and Australia, New Zealand and emerging markets operations. These reportable segments continued to provide similar services and products that areproducts.
Effective the first day of fiscal 2024 (i.e., December 31, 2023), as a result of the continued evolution of the Company’s centralized organizational structure in fiscal 2023, and management’s 2024 strategic planning process, the Company’s reporting segments changed to one segment based on our new, personalized, weight management and wellness program, known as PersonalPoints. Theprogram is founded on a holistic approachtotal revenue for the bodypurpose of making operational and mind. It provides a personalized path towards a healthier, more active, more fulfilling life with an individualized food planresource decisions and assessing financial performance. The segment information presented in this Annual Report on Form 10-K does not reflect this change in reportable segments as the flexibility to make healthy lifestyle choiceschange did not take effect internally until our first quarter of fiscal 2024. We will begin reporting segment information based on the member’s preferences. The program isnew segment in our Quarterly Report on Form 10-Q for the first quarter of fiscal 2024. For details on our reportable segments in fiscal 2023, see “Item 7. Management’s Discussion and Analysis of Financial Condition and Results of Operations” in Part II of this Annual Report on Form 10-K.
Our Offerings
Our Programs and App
Our weight loss and weight management programs are rooted in nutritional and behavior change science. They are comprised of a range of science-based nutritional, activity, behavioral and lifestyle tools and approaches that members can select tobe tailored for individual weight goals and, if needed, support theirthe unique journey, based on the understanding that everyone’s needs and eating patterns are different. Itdelivers targeted content and experiences, powered by our smart personalization platform that understands and acts on the needs of members.people taking GLP-1 medications or living with diabetes. Our new program brings together three innovations: (i) a personalized list of ZeroPoint foods (which do not needPoints Program continues to be weighed, measured, or tracked and form the foundation ofgrounded in our scientific Points system, which uses a healthy eating pattern), (ii) an updated proprietary nutritional algorithm that assigns to assign each food a value based on the food’sits calorie, saturated fat, unsaturated fat, added sugar, protein and fiber content and (iii) the ability to add Points for healthy behaviors, such as exercising and reaching a daily water goal. There is no one way to follow the program. An individualized food plan and activity target, based oncontent. After a proprietary, personal assessment which takes into account a member’s food and activity preferences, is developed for each member and grounded in our scientific Points system. A member is givenmetabolic rate, members receive a uniquetailored daily and weekly budget to stay withinPoints Budget to guide them towards healthy foods and activity.appropriate portion sizes, forming the foundation of a healthy eating pattern. Members can also take advantage of over 200 ZeroPoint foods (nutritious foods which do not need to be weighed, measured, or tracked). Our new programDiabetes Program also takes into account the dietary needs of those living with diabetes by tracking blood sugar levels and tailoring their plans towards those foods that are less likely to impact blood sugarsuch levels. Prior to theOur new program’s launch in November 2021, we offered a program known as myWW+ in the majority of our markets,GLP-1 Program, which launched in November 2020.
In additionthe U.S., U.K. and Germany in December 2023, is our first-ever nutrition and activity program to complement a weight loss journey for those who are taking GLP-1 medications, whether provided through WeightWatchers Clinic (as described below) or prescribed by their medical provider. This program supports these members by helping them to prioritize nutritious foods while appetite is significantly reduced by the medication and to maintain muscle mass while losing weight on the medication by focusing on healthy eating habitsprotein dense food and promoting activity.
Our app supplements our programs by providing tools to help our members on their weight health journey. These include trackers for food, water, activity and in furtherance ofweight (and, for members on our mission to focus on overalldiabetes-tailored plan, a tracker for blood sugar) as well as progress against personal weight health goals and wellness, our program also addresses other aspects of acontent regarding behavioral techniques for building healthy and fulfilled life, such as mindset, sleep, community and hydration. We carefully select partners in the wellness and activity spaces who offer services that can aid our members. For example, members can typically access meditation and/or mindfulness content to assist them in developing and maintaining a helpful mindset on their wellness journeys. They also typically are able to access a variety of guided workouts ranging from low intensity stretching to cardio.habits. WW’s Connect Groups,platform, a part ofmembers-only social network accessed through our digital community, fosterapp, fosters meaningful relationships that inspire healthy habits by helping people find communities based on shared interests including food preferences, identity cohorts, wellness journey, activity, mindset, hobbies, locations, events and workshops. Finally,
5
WeightWatchers Clinic
WeightWatchers Clinic is our new clinical offering in the United States which provides members who medically qualify access to further inspireclinicians who can prescribe weight management medications when clinically appropriate. This can include a prescription for the latest U.S. Food and reinforce healthy habits, WellnessWins, our rewards program, inspires members to build, and recognizes membersDrug Administration (“FDA”)-approved GLP-1 medications for building, healthy habits. Members can earn “Wins” and redeem them for products and experiences.
Our Subscription Businesses
Our members mainly participate in our program either by solely using our digital products or by using our digital products supplemented by group workshops. Within these two channels, we offer a variety of services and products to meet each member’s preferences. Additionally, our wellness coaches educate members on our program and provide inspiration and support to members in developing healthy habits.
The primary payment structure for our services globally is through subscription plans. Pursuant to these plans, a member typically commits to a minimum term and is automatically charged on a monthly basis until the member elects to cancel.
2
Digital Business
In our Digital business, we offer digital subscription products based on the WW approach to wellness andchronic weight management. These products provide interactiveWeightWatchers Clinic is the complete product integration of our recently acquired Sequence subscription telehealth platform offering and personalized resources that allow usersany of our behavior change programs, including our new GLP-1 Program, which was scientifically designed to follow ourhelp support the unique behavioral and nutritional needs of individuals taking GLP-1 medications. For information about the recent acquisition of Sequence, see “History—Acquisition of Clinical Business”. If deemed eligible following completion of a medical eligibility questionnaire, a licensed clinician may prescribe weight management program via our appmedications for Clinical members. They are guided by a multidisciplinary care team comprised of a care coordinator to facilitate the insurance process, registered dietitians, fitness specialists, and web-based products. They help subscribers adopt a healthier and more active lifestyle, a helpful mindset, and healthy habits, with a view toward long-term behavior modification — a key aspect of the WW approach toward healthy and sustainable weight loss. These products provide subscribers with content, functionality, access to coaches and resources and interactive weight management plans and wellness tools. We believe our personalized and interactive Digital subscription products give subscribers an engaging experience. Our Connect online community, which can be accessed via our app and our web-based platform, gives our subscribers a way to stay virtually connected and support and inspire each other. We continually innovate our Digital offerings, most recently updating the design, usability, features and capabilities of our app to support our new weight management and wellness program. Weboard-certified clinician. Clinical members also expanded our Digital offerings by introducing Digital 360, a digitally-enabled, community-focused and coach-led membership plan in limited markets. This premium-priced Digital offering is designed to give members next-level support, motivation and accountability with expert coaches through live and on-demand exclusive content and events. As of the end of fiscal 2021, we had approximately 3.4 million Digital subscribers.
Workshops + Digital Business
In our Workshops + Digital business, we present our program in workshops of 30 to 45 minutes in duration, conveniently scheduled throughout the day. In March 2020, we introduced virtual workshops in immediate response to the impact of COVID-19, and we continue to innovate this offering to address the shift in consumer sentiment towards digitally-enabled offerings. For more information on the impact of COVID-19, see “Item 7. Management’s Discussion and Analysis of Financial Condition and Results of Operations—Material Trends—COVID-19 Pandemic” of this Annual Report on Form 10-K. Workshops + Digital members can attend unlimited workshops both virtually and, where available, in-person. Our face-to-face, interactive community remains the cornerstone of our workshops. Wellness coaches facilitate interactive workshops that encourage learning and inspire members to make positive changes towards their individual goals. Members provide each other inspiration and support by sharing their experiences with, and by providing encouragement and empathy to, other people on weight management and wellness journeys. In addition, our members have access to our digital toolsmedication management, from dosage, to assist them onrefilling prescriptions, to tracking weight loss and mitigating any potential side-effects, with the assistance of their journeys. As of the end of fiscal 2021, we had approximately 0.7 million Workshops + Digital subscribers.clinician.
We have franchisees in a limited number of territories. In fiscal 2021, revenues from our franchisees were immaterial.Pursuant to long-standing agreements, weLicensing and our franchisees typically pay each other royalties and other fees. We have enjoyed a mutually beneficial relationship with our franchisees over many years. Mostfranchise agreements are perpetual and can be terminated only upon a material breach or bankruptcy of the franchisee.
Our Consumer Product Sales
We sell a range of consumer products, including WW-branded, co-branded, and curated products. These products complement our weight management program and help our customers in their weight management and wellness efforts. Our products are designedcontinue to be high quality and offer benefits related to the WW program.
We primarily sell consumer products online through our e-commerce platforms, at our studios, and through our trusted partners. In fiscal 2021, sales of consumer products represented approximately 10.1% of our total revenues.We seek to optimize our product offerings by updating existing products, introducing new products and sharing best practices across geographies.
Our WW-branded products include bars, snacks, cookbooks and kitchen tools. We also license our trademarks and other intellectual property in certain categories of food, beverages and other relevantweight health-relevant consumer products and services. We alsoAdditionally, we co-brand with or endorse with carefully selected branded consumer products and services. By partnering with carefully selected companies in categories relevant and helpful to weight- and health-conscious consumers, we have a high margin licensing business that gives us access to these consumers and also increases the awareness of our brands. In connection with our acquisition from The Kraft Heinz Company (successor to H.J. Heinz Company), or Heinz, in September 1999, Heinz received a perpetual royalty-free license to continue using our brand in certain food categories.
We believepreviously sold a range of consumer products that complemented our programs and helped our customers in their weight management efforts. Our WW-branded products included bars, snacks, cookbooks and kitchen tools. We primarily sold consumer products online through our e-commerce platforms, at our studios, and through our trusted partners. In fiscal 2023, sales of consumer products represented approximately 6.2% of our total revenues. We made a strategic decision to wind down this lower-margin consumer products business, which we completed at the strengthend of fiscal 2023.
Our Subscription Businesses
The payment structure for our weight health and weight management programs and WeightWatchers Clinic is through subscription plans and in some cases, includes a one-time initiation fee. Pursuant to these plans, a member typically selects the program which best meets them on their personal weight health journey, commits to a minimum term and is then automatically charged on a monthly basis until the member elects to cancel. With any subscription, members are granted access to one of our programs and our app with its functionality and tools. Members may then elect to supplement their membership with access to our group workshops. WeightWatchers Clinic members receive the benefits of our behavior change programs and virtual workshops along with our app as part of their subscription. Within the three channels of membership subscription described below, members can find services and tools that best meet their preferences and needs.
Digital Business
In our Digital business, we offer a digital subscription product based on the WW approach to weight loss and weight management. Our app provides interactive and personalized resources that allow subscribers to follow one of our three weight health and weight management programs. These resources also help subscribers adopt a healthier and more active lifestyle, a helpful mindset, and healthy habits, with a view toward long-term behavior modification — a key aspect of the WW brands will create new long-term licensingapproach toward achieving lasting weight health. Our app provides subscribers with content, functionality, and partnership opportunitiesnutrition and wellness resources. We believe our personalized and interactive Digital subscription product gives subscribers an engaging experience. Our Connect online community, which can be accessed via our app, gives our subscribers a way to stay virtually connected and support and inspire each other. We continually innovate our Digital offerings to maximize the design, usability, features and capabilities of our app to support our weight loss and weight management programs and community. As of the end of fiscal 2023, we had approximately 3.1 million Digital subscribers.
6
Workshops + Digital Business
In our Workshops + Digital business, we offer a subscription for us.
3
Health Solutionsunlimited access to our workshops in addition to our digital subscription product described above. As part of this offering, we present our program in workshops of 30 to 45 minutes in duration, conveniently scheduled throughout the day, offered virtually and, where available, in person. Our interactive communities remain the cornerstone of our workshops. Coaches facilitate interactive workshops that encourage learning and inspire members to make positive changes towards their individual goals. Members provide each other inspiration and support by sharing their experiences with, and by providing encouragement and empathy to, other people on weight health journeys. As of the end of fiscal 2023, we had approximately 0.7 million Workshops + Digital subscribers.
We have franchisees in a limited number of territories. In fiscal 2023, revenues from our franchisees were immaterial. Pursuant to long-standing agreements, we and our franchisees typically pay each other royalties and other fees. We have enjoyed a mutually beneficial relationship with our franchisees over many years. Most franchise agreements are perpetual and can be terminated only upon a material breach or bankruptcy of the franchisee.
Clinical Business
In our Clinical business, which we launched in 2023 following the acquisition of Sequence, we offer a subscription for medically-qualified members to access a clinician who can prescribe weight management medications when clinically appropriate, as well as access to any of our behavior change programs, including our GLP-1 Program, via our digital subscription product (which is discussed in more detail above). As part of this offering, each Clinical member has a care team to assist them in their weight health journey. The care team not only offers support but also guidance on how to meet these challenges, including those related to insurance coordination. Clinical members have access to check-ins with their respective clinicians to assist them with their medication as needed. Clinical members are also able to attend dedicated virtual workshops to connect with other members who are also on a clinical weight health journey. Members provide each other inspiration and support by sharing their experiences, and by providing encouragement and empathy to, other people on clinical weight health journeys. As of the end of fiscal 2023, we had approximately 67 thousand Clinical subscribers.
WeightWatchers for Business Offering
Via our WeightWatchers for Business offering, we are leveraging our organizational capability to serve employers, payers and health plans with the offerings of our Digital, Workshops + Digital and Clinical businesses. As healthcare costs continue to be a significant concern on the minds of employers and their employees,for these stakeholders, we believe that our broad range of services and productsofferings uniquely positions us to serve the market and help employersthem reduce their healthcare costs and improve the overall well-beingweight health of their employees. Our strategy is focused on leveraging our organizational capability to serve employers, both directly and through aggregators,constituents.with both our Digital and Workshops + Digital offerings.
We believe the healthcare market, including the diabetes segment, represents an important channel to reach new consumers. We continue to explore different approaches to, and strategies for, this market.
Our Clinical Efficacy and Reputation in the Marketplace
Throughout the years our science-backed programs have evolved alongside nutritional and behavior change science, resulting in WW isbeing one of the most clinically-studied commercial weight management programs, including by way of more than 130 published, scientific, peer reviewed clinical studies (including 35 randomized trials) over more than four decades. programs. For example, in 2019,2022, a randomized controlled trial conducted by research teams at the University of North Carolina - Chapel Hill, University of British Columbia, and University of Leeds and funded by us was published in JAMA Network Open and found that study participants assigned to WW for 12 months had over two times more weight loss compared to participants who were assigned to a do-it-yourself weight loss approach. In 2017, a randomized controlled trial conducted by research teams at the University of Cambridge, the University of Liverpool and the University of Oxford and partially funded by us was published in The Lancet and found that adults with obesity referredaddition, those assigned to WW for one year lost significantlywere more weight and were ablelikely to keep it off for longer compared to those who either received brief advice and self-help materials, or who were referred to a 12-week WW program. In addition, compared to adults receiving brief advice and self-help, adults who followed either the 12- or 52-week WW program achieved greater reductions in body fat; those who followed 52 weeks of WW also achieved greater blood sugar control.Research has shown that WW has impact that reaches beyond our members. In 2018, a 6-month randomized controlled trial conducted by researchers at the University of Connecticut funded by us and published in Obesity showed a “ripple effect” of WW –achieve clinically significant weight loss among untreated spouses of WW members.five percent at three and twelve months.
In 2021, a six-month clinical trial of our new program conducted by the University of Connecticut and funded by us found that participants on the programWW experienced clinically significant benefits, including weight loss. Study participants reported a 40% increase in their healthy habits as well as a 15%13% decrease in hunger.
WW also has demonstrated efficacy among individuals with diabetes and prediabetes.diabetes. In 2016,2023, results from a randomized controlledmultisite, single arm trial conducted byof the Indiana University School of Medicine and funded by us was publishedWW Diabetes Program in the American Journal of Public Health and found that adultspeople with prediabetes following our Diabetes Prevention Program, or DPP, lost significantly more weight and experienced better blood sugar control than those following a self-initiatedtype II diabetes prevention program using supplemental counseling materials. A continuation study published in 2018 showed that these outcomes were maintained at 18 and 24 months and that our DPP was highly cost-effective. Another randomized controlled trial conducted by the Medical University of South Carolina, funded by us and published in Obesity in 2016, found that adults with Type 2 diabetes who followed our diabetes program lost significantly more weight and experienced better blood sugar control than those in a standard diabetes care program. In 2021, a clinical trial conducted at Pennington Biomedical Research Center, University of Florida and Virginia Commonwealth University and funded by us found that the WW program, modified for adults with Type 2 diabetes, had favorable and clinically meaningful effects on glycemic control, bodyshowed statistically significant improvements in weight loss, blood sugar, and diabetes distress at 12 and 24 weeks. In 2020, a review published in Endocrinology and Metabolism Clinics of North America highlighted the potential for physicians to refer patients with obesity to commercial weight loss programs. It noted that WW is one of only four commercial weight loss programs meeting guideline-recommended standards with demonstrated safety and efficacy at 12 months and one of only two commercial weight loss programs with demonstrated effects on reducing HbA1c levels in participants with Type 2 diabetes. Authors of the review concluded physicians might consider referral to WW for patients with obesity and those with obesity and Type 2 diabetes.six months.
OurThe efficacy and the value of our offerings are also well-acknowledged in the marketplace. For instance, in 2022,2024, we again were recognized by U.S. News & World Report in the “Best Diets” rankings, including tying forranking #1 for “Best Weight-Loss Diets” for the twelfthfourteenth consecutive year and again ranking #1 for “Best Diet Programs.”
47
Marketing and Promotion
Our communications with consumers and other promotional efforts enhance our brand image and awareness, and motivate both former and potential new customers to join WW. We utilize a data-driven approach to our media placements, promotional offers, and website and app store presence to enhance marketing efficiency, drive conversion, and maximize subscription value. Our advertising campaigns are supported across multiple platforms (e.g., television, YouTube, social media, programmatic, audio, search, affiliate, branded content, electronic customer relationship marketing (eCRM), direct mail, and public relations). We develop and maintain a high level of engagement with current and potential customers on various social media platforms including Facebook, Instagram and TikTok. Also, at times, we utilize brand ambassadors, spokespersons and social media influencers, including celebrities, as part of our advertising and marketing.
In addition to the above advertising channels, we take advantage of other channels for which we are uniquely positioned given our long history and network of WW coaches and members. The word of mouth generated by our current and former members, combined with our strong brand and knownreputation for effectiveness, enable us to attract new and returning members. We also carry out many of our key public relations initiatives through the efforts of current and former WW coachesmembers, social media influencers, and, members, andfrom time to time, celebrity brand ambassadors.
In October 2015, we entered into a Strategic Collaboration Agreement with Oprah Winfrey, pursuant to which, among other things, Ms. Winfrey provides us with services in her discretion to promoteand the Company collaborate with each other towards the mutual objective of advancing and ourpromoting the WW programs products and services, including in advertisements and promotions, and making personal appearances on our behalf. For example, in fiscal 2020, as part of our collaboration with Ms. Winfrey, in addition to appearing in our advertising campaign in the United States and other select markets, she embarked on a wellness-focused, national arena tour called WW Presents: Oprah’s 2020 Vision: Your Life in Focus, and hosted Oprah's Your Life in Focus: A Vision Forward, a live, free, interactive, four-week wellness-focused virtual experience. In fiscal 2021, in addition to being featured in our U.S. winter advertising campaign, Ms. Winfrey hosted a live, free, interactive virtual series inspired by her 2020 arena tour and virtual experience.Company. Further information on this agreement and our partnership with Ms. Winfrey can be found below under “—History—Winfrey Transaction.”
Seasonality
Our business is seasonal due to the importance of the winter season to our overall member recruitment environment. Historically, we experience our highest level of recruitment during the first quarter of the year, which is supported with the highest concentration of advertising spending. Therefore, our number of End of Period Subscribers (as defined below) in the first quarter of the year ishas been typically higher than the number in other quarters of the year, historically reflecting a decline over the course of the year.
Competition
We compete in the global weight management and health and wellness market. The weight management and health and wellness industries include commercial weight management programs; the pharmaceutical industry and prescription and over the counter weight management and weight loss injectables, pills and appetite suppressants as well as compounded drug formulations; online and clinical prescription services; weight loss and wellness apps;apps and monitoring solutions, such as wearable trackers; surgical procedures; the pharmaceutical industry; the genetics and biotechnology industry; self-help weight management regimens and other self-help weight management products, services and publications, such as books, magazines, websites, and social media influencers and groups; dietary supplements and meal replacement products; healthy living services, coaching, products, content and publications; weight management services administered in-person or virtually by doctors, nutritionists, dieticians and dieticians;other clinicians; government agencies and non-profit groups that offer weight management services; fitness centers; and national drug store chains. These competitive programs, products, services and publications are offered at various price points, and in some cases for free or at a low cost to consumers, such as free apps.
Competition among commercial weight management programs is largely based on program recognition and reputation; the effectiveness, ease of use, safety, personalization and price of the program; and the related digital platform, content and user experience. We compete with several other companies in the commercial weight management industry, although we believe that in certain cases their businesses are not comparable to ours. For example, we believe our prominence as one of the most clinically-studied commercial weight management programs differentiates us from many of our competitors. Additionally, certain of these competitors’ businesses are based on the sale of pre-packaged meals and meal replacements. In conjunction with aour flexible, customizedhealthy food plan that allows customers the freedom to choose what they eat basedand emphasis on their personal preferences,behavior change education, we believe that the power of our communities -- via our online social network, Connect, platform,and workshops and Digital 360 offering -- increases accountability and provides our members with inspiration, human connection, and support, which motivates them and enables them to build healthier and more fulfilling food, activity and lifestyle habits.
58
Our Clinical business is part of the emerging market for healthcare and technology, which is increasingly competitive, subject to rapid change, and significantly affected by new product and technological introductions and other market activities of industry participants. The increased popularity and acceptance of medication as a weight loss tool has introduced new competitors in the weight management and health and wellness market and increased competition from certain of our existing competitors. We compete directly not only with telehealth providers but also traditional healthcare providers, pharmacies and other technology companies entering into the health and wellness industry. Conversely, increased attention by consumers and the media to recent developments, innovations, and approvals of chronic weight management drug therapies, the evolving use of compounded drug formulations, and the perception of their safety, effectiveness and ease of use, may also delay or prevent consumer engagement in our non-Clinical businesses.
We believe that food manufacturers that produce meal replacement products are not comparable competition because these businesses’ meal replacement products do not engender behavior modification through education in conjunction with a flexible, customized healthy food plan.
We also compete with various self-help diets, products, services and publications, such as apps, activity monitors and other free or low-cost alternatives.
Trademarks, Patents and Other Proprietary Rights
We own numerous domestic and international trademarks, patents, domain names and other proprietary rights that are valuable assets and are important to our business. Depending upon the jurisdiction, trademarks are valid as long as they are used in the regular course of trade and/or their registrations are properly maintained. Patent protection extends for varying periods according to the date of patent filing or grant and the legal term of patents in the jurisdiction in which the patent is granted. The actual protection afforded by a patent may vary from country to country depending upon the type of patent, the scope of its coverage and the availability of legal remedies in the country. We believe the protection of our trademarks, copyrights, patents, domain names, trade dress and trade secrets is important to our success. We aggressively protect our intellectual property rights by relying on a combination of trademark, copyright, patent, trade dress, trade secret and other intellectual property laws, and through domain name dispute resolution systems.
History
Early Development
In 1961, Jean Nidetch, our founder, attended a New York City obesity clinic and took what she learned from her personal experience at the obesity clinic and began weight-loss meetings with a group of her overweight friends in the basement of a New York apartment building. Under Ms. Nidetch’s leadership, the group members supported each other in their weight-loss efforts, and word of the group’s success quickly spread. Ms. Nidetch and Al and Felice Lippert, who all successfully lost weight through these efforts, formally launched our business in 1963. WW International, Inc. (formerly known as Weight Watchers International, Inc.) was incorporated as a Virginia corporation in 1974 and succeeded to the business started in New York in 1963.Heinz acquired us in 1978.
Artal Ownership
In September 1999, Artal Luxembourg S.A., or Artal Luxembourg, acquired us from Heinz. Artal Luxembourg is an indirect subsidiary of Artal Group S.A., or Artal Group, which together withHeinz in 1999, and fully sold its parents and its subsidiaries is referred to in this Annual Report on Form 10-K as Artal. Currently, Artal Luxembourg is the record holder of all our shares owned by Artal. As a result of Artal selling a portion of itsremaining shares of our common stock in fiscal 2018, we are no longer a “controlled company” under the rules of The Nasdaq Global Select Market, or Nasdaq.2023.
9
Winfrey Transaction
On October 18, 2015, we entered into a Strategic Collaboration Agreement with Ms. Winfrey or, as(as amended, the Strategic“Strategic Collaboration Agreement,Agreement”), pursuant to which Ms. Winfrey granted us the right to use, subject to her approval, her name, image, likeness and endorsement for and in connection with the Company and its programs, products and services (including in advertising, promotion, materials and content), and we granted Ms. Winfrey the right to use our trademarks and service marks to collaborate with and promote the Company and its programs, products and services. The Strategic Collaboration Agreement had an initial term of five years or the Initial Term,(the “Initial Term”), with additional successive one year renewal terms. On December 15, 2019, we entered into an amendment of the Strategic Collaboration Agreement or the Strategic(the “Strategic Collaboration Amendment,Amendment”) with Ms. Winfrey, pursuant to which, among other things, the Initial Term was extended until April 17, 2023 (with no additional successive renewal terms) after which a second term commenced and will commence and continue through the earlier of the date of the Company’s 2025 annual meeting of shareholders or May 31, 2025 or the Second Term(the “Second Term” and together with the Initial Term, the Strategic Term. “Strategic Term”). During the remainder of the Initial Term, Ms. Winfrey will consultconsulted with us and participateparticipated in developing, planning, executing and enhancing the WW programprograms and related initiatives, and provideprovided us with services in her discretion to promote the Company and its programs, products and services, including in advertisements and promotions, and makingmade personal appearances on our behalf. Subsequently, duringDuring the Second Term, Ms. Winfrey and the Company will collaborate with each other towards the mutual objective of advancing and promoting the WW programs and the Company, and in connection therewith, Ms. Winfrey will consult with the
6
Company and participate in developing, planning, executing and enhancing the WW programs and related initiatives. In connection therewith, Ms. Winfrey will make available to the Company her knowledge, expertise, and abilities in the areas of corporate management, consumer insights, advertising and marketing, consumer motivation, and community activation and consult and participate in the design and planning of creative strategy and the related execution of the consumer experience in connection with the WW programs. In addition, throughout the Second Term, except as otherwise prohibited by applicable law, the Company willintended to cause Ms. Winfrey to be nominated as a director of the Company. However, Ms. Winfrey has informed us she is not seeking to be re-nominated as a director of the Company at the Company’s upcoming 2024 annual meeting of shareholders. Ms. Winfrey will not grant anyone but the Company the right to use her name, image, likeness or endorsement for or in connection with any other weight loss or weight management programs during the Strategic Term, and she will not engage in any other weight loss or weight management business, program, products, or services during the Strategic Term and for one year thereafter. The Strategic Collaboration Amendment became operative on May 6, 2020 when our shareholders approved the Winfrey Amendment Option (as defined below).
On October 18, 2015, we also entered into a Share Purchase Agreement with Ms. Winfrey or, as(as amended, the Winfrey“Winfrey Purchase Agreement,Agreement”), pursuant to which we issued and sold to Ms. Winfrey an aggregate of 6,362,103 shares of our common stock for an aggregate cash purchase price of $43,198,679. The purchased shares arewere previously subject to a right of first offer and right of first refusal held by the Company.Company, as discussed further below. Under the Winfrey Purchase Agreement, Ms. Winfrey has certain demand registration rights and piggyback rights with respect to these purchased shares. On December 15, 2019, the Company entered into an amendment to the Winfrey Purchase Agreement with Ms. Winfrey. Initially, the Winfrey Purchase Agreement provided Ms. Winfrey with the right to be nominated as a director of the Company for so long as she and certain permitted transferees own at least 3% of our issued and outstanding common stock. The amendment to the Winfrey Purchase Agreement provides Ms. Winfrey with the right to be nominated as a director of the Company through and until January 1, 2023. Ms. Winfrey will not be required to resign as a director at such time. The amendment to the Winfrey Purchase Agreement became operative on May 6, 2020 when our shareholders approved the Winfrey Amendment Option.
In consideration of Ms. Winfrey entering into the Strategic Collaboration Agreement and the performance of her obligations thereunder, on October 18, 2015, we granted Ms. Winfrey a fully vested option to purchase 3,513,468 shares of our common stock or the Winfrey Option.(the “Winfrey Option”). The term sheet for the Winfrey Option, which includes the terms and conditions appended thereto, relating to the grant of the Winfrey Option is referred to herein as the Winfrey“Winfrey Option Agreement.Agreement”. The Winfrey Option is exercisable at a price of $6.97 per share, in whole or in part, at any time prior to October 18, 2025, subject to earlier termination under certain circumstances, including if (i) the Strategic Collaboration Agreement expires as a result of Ms. Winfrey’s decision not to renew the term of such agreement and (ii) a change in control (as defined in the Winfrey Option Agreement) of the Company occurs. The shares issuable upon exercise of the Winfrey Option arewere previously subject to a right of first offer and right of first refusal held by the Company.Company, as discussed further below.
In consideration of Ms. Winfrey entering into the Strategic Collaboration Amendment and the performance of her obligations thereunder, on December 15, 2019, the Company and Ms. Winfrey entered into a term sheet relating to the grant of a fully vested option to purchase 3,276,484 shares of our common stock or the Winfrey(the “Winfrey Amendment Option.Option”). The term sheet for the Winfrey Amendment Option, which includes the terms and conditions appended thereto, is referred to herein as the Winfrey“Winfrey Amendment Option Agreement.Agreement”. Upon our shareholders approving the Winfrey Amendment Option on May 6, 2020, it became exercisable at a price of $38.84 per share, in whole or in part, at any time prior to November 30, 2025, subject to earlier termination under certain circumstances, including if a change in control (as defined in the Winfrey Amendment Option Agreement) of the Company occurs. The shares issuable upon exercise of the Winfrey Amendment Option arewere previously subject to certain transfer restrictions and a right of first offer and right of first refusal held by the Company.Company, as discussed further below.
10
In fiscal 2020, as permitted under the Winfrey Purchase Agreement and the Winfrey Option Agreement transfer provisions, Ms. Winfrey sold 2,782,476 of the purchased shares discussed above and exercised a portion of the Winfrey Option resulting in the sale of 1,118,036 shares issuable under such option, respectively.Similarly, in fiscal 2021, Ms. Winfrey sold 1,541,564 of the purchased shares discussed above and exercised a portion of the Winfrey Option resulting in the sale of 581,348 shares issuable under such option. Ms. Winfrey has announced her intention to donate all shares of common stock that she currently owns, as well as the net proceeds from any exercise and sale of the Winfrey Option and the Winfrey Amendment Option, to the National Museum of African American History and Culture (the “Museum”). In connection with Ms. Winfrey’s proposed charitable donation, the Company declined to exercise its rights of first offer and first refusal discussed above and waived any remaining transfer restrictions applicable to the shares proposed to be donated and, to the extent the net proceeds of the sale of such shares are donated to the Museum, the shares issuable under either of the Winfrey Option or the Winfrey Amendment Option.
The transactions contemplated by the Strategic Collaboration Agreement, Winfrey Purchase Agreement, Winfrey Option Agreement and Winfrey Amendment Option Agreement are collectively referred to herein as the Winfrey Transaction. For additional information on risks arising from a potential loss of Ms. Winfrey’s services or a change in the nature of our partnership with her, please see “Item 1A. Risk Factors—Loss of key personnel, strategic partners or consultants or failure to effectively manage and motivate our workforce could negatively impact our sales of services and products, business, financial condition and results of operations.” of this Annual Report on Form 10-K.
7Acquisition of Clinical Business
As previously disclosed, on April 10, 2023, we completed our acquisition of the subscription telehealth platform offering of Weekend Health, Inc., doing business as Sequence, a Delaware corporation (“Sequence”), pursuant to an agreement and plan of merger, under which Sequence continued as a wholly-owned subsidiary of the Company. The acquisition of Sequence expanded our offerings for members to include clinical interventions and allowed us to build a new weight health pathway which leverages the advancements in chronic weight management medications and meets the increasing consumer demand for solutions which include GLP-1 medications. For additional information on this acquisition, see Note 6 “Acquisitions” of the notes to the audited consolidated financial statements contained in this Annual Report on Form 10-K.
Regulation
A number of laws and regulations govern our advertising and marketing, services, products, operations and PCs and Affiliated Professionals (both as defined below) and relations with consumers, licensees, franchisees, strategic and other contractual partners, coaches, guides, employees and government authorities in the countries in which we operate. Certain federal, state and foreign agencies, such as the U.S. Federal Trade Commission or FTC,(the “FTC”) and the U.S. Food and Drug Administration, or FDA regulate and enforce such laws and regulations relating to advertising and marketing, promotions, packaging, labeling, privacy, consumer pricing and billing arrangements and other consumer protection matters. We are subject to many distinct employment, labor, commercial, benefits and tax laws and regulations in each country in which we operate, including regulations affecting our employment and wage and hour practices and our relations with our coaches, guides and employees. Laws and regulations directly applicable to data protection and communications, operations or commerce over the Internet, such as those governing consumer protection,, intellectual property, privacy and taxation, continue to evolve. Our operations are subject to these laws and regulations and we continue to monitor their development and our compliance. In addition, we are subject to other laws and regulations in the United States and internationally.
During the mid-1990s, the FTC filed complaints against a number of commercial weight management providers alleging violations of federal law in connection with the use of advertisements that featured testimonials, claims for program success and program costs. In 1997, we entered into a consent order with the FTC settling all contested issues raised in the complaint filed against us. The consent order required us to comply with certain procedures and disclosures in connection with our advertisements of services and products and expired by its terms in 2017. From time to time, we have been in discussions with the FTC regarding such matters. Subsequent to our 2018 acquisition of Kurbo Health, Inc., or Kurbo,(“Kurbo”), we have beenengaged in discussions with the FTC regarding online privacy obligations associated with that program. In February 2022, the FTC filed a complaint and proposed settlement order to resolve allegations that Kurbo violated the Children’s Online Privacy Protection Act. For additional information, see Note 16We entered into a consent order with the FTC in March 2022 settling all contested issues raised in the complaint filed against us, and determined in the second quarter of fiscal 2022 to exit the Kurbo business in the third quarter of fiscal 2022 as part of our audited consolidated financial statements, containedstrategic plan.
11
In addition, we, our PCs, and Affiliated Professionals are subject to other laws and regulations in Part IV, Item 15the United States and internationally, as applicable. For example, the practice of this Annual Reportmedicine is subject to various federal, state, and local certification and licensing laws, regulations, and approvals, which relate to topics including the adequacy of medical care, the practice of medicine (including the provision of remote care), personnel, operating policies and procedures, and the prerequisites for the prescription of medication. Failure to comply with these or other laws and regulations or changes in laws, regulations, policies, and related interpretations and enforcement practices could give rise to civil or criminal penalties, affect our cost of doing business, alter the landscape in which we do business, and require operational changes. Our contractual relationships with our PCs and Affiliated Professionals are also subject to various state laws that prohibit fee splitting, the sharing of professional services income with nonprofessional or business interests, and the corporate practice of medicine (“CPOM”) and laws, regulations, and administrative interpretations intended to prevent unlicensed persons from interfering with or influencing the physician’s professional judgment. CPOM and fee splitting laws vary from state to state and are subject to interpretation and enforcement by state regulators, and the failure to comply could lead to adverse judicial or administrative actions against us, our PCs or Affiliated Professionals, civil or criminal penalties, cease-and-desist orders, loss of healthcare provider licenses, changes to contractual arrangements, and other materially adverse consequences. A determination of liability under, or noncompliance with, broadly applicable fraud and abuse laws and regulations, such as state healthcare fraud and abuse laws that apply to items or services reimbursed by any third-party payor, including funds paid out of pocket by patients, may also subject us, our PCs, or our Affiliated Professionals to fines, penalties, other adverse consequences, and restrictions on Form 10-K.our business, our PCs or Affiliated Providers. The scope of these laws and interpretations of them vary by jurisdiction and are enforced by courts and governmental and regulatory authorities, each with broad discretion. See “Risk Factors—Risks Related to Our Acquisition of Weekend Health, Inc. (d/b/a Sequence)—We may be subject to extensive fraud, waste, and abuse laws that may give rise to federal and state audits and investigations, including actions for false and other improper claims.”
Human Capital Management
At WW our core missionvision is to inspire“Be the global leader in Weight Health—a worldwide community connected by healthy habits for real life - for people, families, communities and the world.habits.” We believe that our workforce plays an integral role in achieving our mission.vision. As of December 31, 2021,2023, we had approximately 7,7004,850 employees, a majority of whom were part-time employees. In addition, in certain of our international markets, our coaches and guides are self-employed and are not included in this total.
Diversity and Inclusion
We believe that a diverse and inclusive workforce helps us to explore and realize the many different paths to health and wellness for our members, which leads to better execution of our strategic initiatives. For example, over 50% of the members75% of our Executive Committee,executive officers, including our Chief Executive Officer and our Chief Financial Officer, are women. To further our commitment to create an inclusive and diverse culture, we have a Head ofour Diversity, Equity & Inclusion & Diversity whofunction reports directly to our Chief People Officer. Additionally, weWe offer forums and formal training programs for our employees to enable them to continue their education and share best practices and experiences, which creates an ongoing evolution and community with respect to diversity and inclusion and belonging in the workplace.
Training and Development
Wedevelop our personnel by offering in-house learning and development resources. These include online and in-person training programs on a variety of topics in order to foster career growth both long term and short term. For example, we offer leadership training to help ensure our future business leaders have the necessary skill sets to manage and lead our organization.
Wellness, Health and Safety
We are focused on promoting the total wellness of our employees, and offer resources, programs and services to support our employees’ physical, mental, financial and social wellness. For example, employees receive an annual wellness allowance, offeringin 2023 we continued to improve and expand on global paid parental leave policy for all parents (both full-time and part-time eligible employees), making us a flexibleleader in providing equitable and personalized waymeaningful parental leave. We believe this investment not only contributes to support their wellness goals.gender balance and equity in care-taking, but is also linked to improved health and economic outcomes of women, children, and families.
812
As a wellness company, we believe that flexibility is important in creating a work environment that supports our employees’ wellbeing, while still maintaining our commitment to our members. We have introduced a flexibleOur work model, called Work from Wherever (WfW), is designed to enhance productivity and foster innovation by allowing our corporate employees as much flexibility as possibleand their leaders to determinework together in determining when, where and how they work to achieve the best possible results. To facilitate this flexibility and promote virtual collaboration, we offer forums and formal training programs for our employees to provide them with the tools and skills to be successful in this new virtual workplace. We believe this approach strikes an appropriate balance between our purpose-driven culture of helping our members develop healthy habits while respecting the wellness, health and safety of our employees. To facilitate virtual and in-person collaboration, we offer forums and formal training programs to provide our employees with the tools and skills to be successful in a hybrid workplace. WfW continues to positively contribute to employee engagement and gives WW a competitive advantage in the external talent market.
As always, protecting the privacy and security of our data is one of our top priorities, and we have adoptedcontinue to enhance an advanced industry standard Zero-Trust software-defined network, coupled with multi-factor authentication, to secure our environment from unauthorized access. Since the rollout of WfW, our employees have overwhelmingly indicated that WfW positively contributes to their engagement and gives WW a competitive advantage in the external talent market.
Total Rewards
We provide competitive compensation and benefits programs for our employees. In addition to salaries, these programs (which vary by employee level and by the country where the employees are located) include, among other items, bonuses, stock awards, retirement benefits including 401(k) (or local market equivalent) and profit-sharing plan or participation in a non-qualified deferred compensation plan,, healthcare and insurance benefits, health savings and flexible spending accounts, paid time off, paid parental leave, advocacy resources, flexible work schedules and employee assistance programs.
Available Information
Corporate information and our press releases, Annual Reports on Form 10-K, Quarterly Reports on Form 10-Q and Current Reports on Form 8-K, and amendments thereto, are available free of charge on our corporate website at corporate.ww.com as soon as reasonably practicable after such material is electronically filed with or furnished to the Securities and Exchange Commission (i.e., generally the same day as the filing), or the SEC. Moreover, weWe also make available at that site the Section 16 reports filed electronically by our officers, directors and 10 percent shareholders.
We use our corporate website at corporate.ww.com and certain social media channels such as our Instagram account (Instagram.com/weightwatchers), corporate Facebook page (www.facebook.com/WW)weightwatchers), Instagram account (Instagram.com/WW) and TwitterX (formerly Twitter) account (@ww_us) and LinkedIn page (www.linkedin.com/company/weightwatchers) as channels of distribution of Company information. The information we post through these channels may be deemed material. Accordingly, investors should monitor these channels, in addition to following our press releases, SEC filings and public conference calls and webcasts. The contents of our website and social media channels shall not be deemed to be incorporated herein by reference.
Our Amended and Restated Code of Business Conduct and Ethics or the Code(the “Code of Business Conduct and Ethics,Ethics”) and our Corporate Governance Guidelines as amended are also available on our corporate website at corporate.ww.com.
9
CAUTIONARY NOTICE REGARDING FORWARD-LOOKING STATEMENTS
Except for historical information contained herein, this Annual Report on Form 10-K includes “forward-looking statements,” within the meaning of Section 27A of the Securities Act of 1933, as amended, or the Securities Act, and Section 21E of the Securities Exchange Act of 1934, as amended, or the Exchange Act, including, in particular, the statements about our plans, strategies, objectives and prospects under the headings “Business” and “Management’s Discussion and Analysis of Financial Condition and Results of Operations.” We have generally used the words “may,” “will,” “could,” “expect,” “anticipate,” “believe,” “estimate,” “plan,” “intend,” “aim” and similar expressions in this Annual Report on Form 10-K and the documents incorporated by reference herein to identify forward-looking statements. We have based these forward-looking statements on our current views with respect to future events and financial performance. Actual results could differ materially from those projected in these forward-looking statements. These forward-looking statements are subject to risks, uncertainties and assumptions, including, among other things:
13 Item 1A. Risk Factors |
|
|
|
|
|
|
|
|
|
|
|
|
|
|
|
|
|
|
|
|
|
|
|
|
|
|
|
|
|
|
|
|
|
|
|
|
|
|
|
|
|
|
10
|
|
|
|
|
|
|
|
|
|
|
|
|
|
You should not put undue reliance on any forward-looking statements. You should understand that many important factors, including those discussed under the headings “Risk Factors” and “Management’s Discussion and Analysis of Financial Condition and Results of Operations,” could cause our results to differ materially from those expressed or suggested in any forward-looking statement. Except as required by law, we do not undertake any obligation to update or revise these forward-looking statements to reflect new information or events or circumstances that occur after the date of this Annual Report on Form 10-K or to reflect the occurrence of unanticipated events or otherwise.
11
|
|
You should consider carefully, in addition to the other information contained in this Annual Report on Form 10-K and the exhibits hereto, the following risk factors in evaluating our business. Our business, financial condition or results of operations could be materially adversely affected by any of these risks. The following discussion of risks is not all inclusive but is designed to highlight what we believe are the most significantmaterial risks that we face. Additional risks and uncertainties, not presently known to us or that we currently deem immaterial, may also have a material adverse effect on our business, financial condition or results of operations.
Risks Related to Our Business and Operations
The ongoing global outbreak of the COVID-19 virus is adversely impacting, and will continue to adversely impact, our business and may adversely impact our liquidity.
The ongoing global outbreak of the coronavirus (including its variants, COVID-19) has had and will continue to have a significant adverse impact on our business as well as on the business environment and the markets in which we operate. This global health crisis has also had a significant adverse effect on overall economic conditions and the consumer environment, and we expect consumer demand to continue to be negatively impacted due to changes in consumer sentiment towards our products and services, behavior and confidence and health concerns. The situation remains dynamic and subject to rapid and possibly significant change. New developments, including the severity of any variant or surges in COVID-19 cases, new information about health implications, vaccine availability and hesitancy, and actions by government authorities to contain the outbreak or treat its impact, may negatively impact our business. This dynamic situation is driving uncertainty at the macroeconomic, local and consumer levels. While we continue to actively monitor the ongoing COVID-19 pandemic, the full extent of the magnitude and duration of its negative impact to our business cannot be predicted with certainty.
We have taken steps to address the risks and impact of the COVID-19 pandemic, but we have experienced significant disruption to our business and seen significant shifts in consumer sentiment with respect to the weight loss and wellness marketplace as the pandemic evolves. While Digital recruitments were strong in the beginning of the COVID-19 pandemic, a subsequent turn in consumer sentiment has driven a decline in Digital recruitments, and recruitment projections for our Digital business are unpredictable. Our Workshops + Digital recruitments were dramatically impacted during the first year of the pandemic, and mix shifted toward our Digital business. This change in our mix, especially when amplified by the nature of our subscription business, has negatively impacted revenue and may continue to impact it in the future. While the number of End of Period Subscribers at the end of fiscal 2021 was essentially flat compared to the pre-pandemic number at the end of fiscal 2019, it decreased 5.8% versus the end of fiscal 2020. Over the longer term, it remains uncertain how the COVID-19 pandemic will impact consumer sentiment for our products and services and consumer preferences and behavior generally. Our member retention in both our Digital and Workshops + Digital businesses may also be significantly negatively impacted by the pandemic.
Following the suspension of our in-person workshops in March 2020, we rapidly transitioned these workshops to an entirely virtual experience. In June 2020, we began a phased re-opening with reduced operations of a limited number of our studio locations. During fiscal 2021, we selectively resumed in-person workshops where profitable and consistent with promoting the health and safety of our employees and members. However, we had to close some of these studios which were re-opened in response to shifting requirements in local jurisdictions as new variants emerged and COVID-19 cases surged. During these uncertain times, we will continue to adhere to the requirements in local jurisdictions to close re-opened studios as necessary. We continue to evolve our workshop strategy as we evaluate our cost structure and respond to shifting consumer sentiments, and accordingly we may need to further reduce operations. We continue to offer virtual workshops, which may not be successful in meeting the needs or preferences of many of our members, employees and the communities in which we operate. This may result in further decreases in our recruitment as well as a significant decrease in our retention of members. Our reduced studio operations have and will continue to adversely impact our in-studio product sales. The decision to resume in-person workshops or close certain workshops has been and will continue to be influenced by a number of factors, including applicable legal restrictions, consumer confidence, sentiment and preferences, cost efficiencies, our evolving workshop strategies and the protection of the health and safety of our employees and members.
12
Changes in consumer sentiment and behavior, including willingness to meet in groups, prioritization of discretionary spending, and health concerns, may impact consumer demand for our products and services and recruitment and retention of members in our Digital and Workshops + Digital businesses. We may also find it more difficult to staff our business operations. The perceived risk of infection or health risk may adversely affect attendance at our workshops. These risks may also adversely affect our business, liquidity, financial condition and results of operations, particularly if any self-imposed or government-imposed restrictions are in place for a significant amount of time or repeatedly reinstated. As part of our focus on best meeting our members’ and consumers’ needs, we consolidated certain of our studios and continue to close certain other branded studio locations. As a result, we have incurred, and we expect to continue to incur, significant costs associated with our real estate realignment. The decision to re-open a studio location, if at all, or further consolidate studio locations, will be influenced by a number of factors, including applicable legal restrictions, consumer confidence and preferences, changes in consumer sentiment and behavior, and the protection of the health and safety of our employees and members, and will be dependent on cost efficiencies and alignment with our digital and brand strategy. We may not be able to successfully control our studio environments and realize the intended business advantages of maintaining a select group of studio locations, which could adversely affect our Workshops + Digital business and results of operations.
Our business depends on a number of third parties including vendors, landlords, lenders, marketing partners, third-party technology providers, and supply chain partners. COVID-19 may have a material adverse impact on these parties and their ability to meet their obligations to us. Any such failure by our third-party partners could negatively impact our ability to provide our products and services to customers. One or more of these third parties may experience financial distress, increased supply or other operational costs, staffing shortages or liquidity challenges, file for bankruptcy protection, go out of business, or suffer disruptions in their business due to the COVID-19 outbreak. For example, the failure of any third-party technology provider to provide continuous and uninterrupted service could result in disruptions in our websites, services and products or network systems. The negative impact of COVID-19 on these third-party partners may result in increased costs of doing business with them which may have a negative impact on our business or results of operations. The full extent of the impact of COVID-19 on these third-party partners continues to evolve and is uncertain.
If a significant percentage of our workforce, or the workforces of our third-party partners (and their suppliers), is unable to work, whether because of illness, quarantine, limitations on travel or other government restrictions in connection with COVID-19, our operations may be negatively impacted by labor shortages and supply chain disruptions, among other things. Additionally, the cost of our workforce may increase as we seek to staff in the challenging labor environment. We also depend on senior management and other key personnel and consultants, and the illness of certain personnel or consultants could result in the loss of expertise and negatively affect our operations, brand image and goodwill.
The widespread health crisis also could adversely affect the economies and financial markets of countries in which we operate, resulting in an economic downturn, including rising inflation, that could affect consumer demand for our products and services. Our customer purchasing patterns can be influenced by economic factors. The precise impact, and extent thereof, on our business from the disruption of financial markets and the weakening of overall economic conditions cannot be predicted with certainty. Uncertainties regarding the economic impact of COVID-19 have resulted in, and are likely to continue to result in, sustained impact on the economy. Our business is particularly sensitive to reductions in discretionary consumer spending, which may be adversely impacted by a recession or fears of a recession, volatility and declines in the stock market and increasingly pessimistic consumer sentiment due to perceived or actual economic and/or health risks. Consumers may shift purchases to lower-priced or other perceived value offerings during economic downturns. Prolonged unfavorable economic conditions, including as a result of COVID-19, and any resulting recession or slowed economic growth, may have an adverse effect on our financial condition and results of operations.
While we have been able to sufficiently address our liquidity needs during the COVID pandemic, the evolving and uncertain economic impact of COVID-19 may impact our liquidity going forward. To the extent that we do not successfully manage our costs, our liquidity and financial results, as well as our ability to access our New Revolving Credit Facility, may be adversely affected.
13
If we are unable to generate sufficient cash or to access liquidity at the time and on terms we may require, we may encounter difficulty funding our business requirements including debt repayments when due. We may not be able to access liquidity, including our New Revolving Credit Facility, or the terms and conditions of available credit may be substantially more expensive than previously expected due to changes in our operating results and general financial conditions and credit markets. We may require waivers or amendments to our existing long-term debt and these requirements may trigger pricing increases from lenders for available credit. Reductions in our liquidity position and the need to use capital for other day to day requirements of our business may affect a number of our business initiatives and long-term investments and as a result we may be required to curtail and/or postpone business investments as well as other initiatives that require capital investment.
Due to the negative COVID-19 environment and the uncertainty of the magnitude and duration of its impact on our business and the economies and financial markets in which we operate, we have previously implemented a number of measures impacting our workforce, including temporary compensation reductions for certain employees, restructurings, and temporary closures of office facilities, and we may need to do so again in the future. These actions, and any actions required in the future, may materially affect our ability to recruit or retain talent.
The COVID-19 pandemic (including governmental responses, shifting consumer sentiment and behavior, broad economic impacts and market disruptions) has heightened the risks related to the other risk factors described herein.
Competition from other weight management and health and wellness industry participants or the development of more effective or more favorably perceived weight management methods could result in decreased demand for our services and products.
The weight management and health and wellness marketplace, which includes clinical solutions, is highly competitive. We compete against a wide range of providers of weight management services and products. Our competitors include: commercial weight management programs; the pharmaceutical industry and prescription and over the counter weight management and weight loss injectables, pills and appetite suppressants as well as compounded drug formulations; online and clinical prescription services; weight loss and wellness apps;apps and monitoring solutions, such as wearable trackers; surgical procedures; the pharmaceutical industry; the genetics and biotechnology industry; self-help weight management regimens and other self-help weight management products, services and publications, such as books, magazines, websites, and social media influencers and groups; dietary supplements and meal replacement products; healthy living services, coaching, products, content and publications; weight management services administered in-person or virtually by doctors, nutritionists, dieticians and dieticians;other clinicians; government agencies and non-profit groups that offer weight management services; fitness centers; and national drug store chains. As we or others develop new or different weight management services, products, methods or technologies, additional competitors may emerge. Furthermore, existing competitors may enter new markets or channels of distribution or expand their offerings or advertising and marketing programs, and future competitors may do the same. More effective or more favorably perceived, or easier to use, diet and weight and healthy living management methods, including pharmaceutical treatments, fat and sugar substitutes or other technological and scientific advancements in weight management methods, also may be developed. Some of our competitors are also significantly larger than we are and have substantially greater resources. This competition may reduce demand for our services and products.
Our Clinical business is part of the emerging market for healthcare and technology, which is increasingly competitive, subject to rapid change, and significantly affected by new product and technological introductions and other market activities of industry participants. The increased popularity and acceptance of medication as a weight loss tool has introduced new competitors in the weight management and health and wellness market and increased competition from certain of our existing competitors. We compete directly not only with telehealth providers but also traditional healthcare providers, pharmacies and other technology companies entering into the health and wellness industry. Many of our current and potential competitors may have greater name and brand recognition in the larger healthcare market, longer operating histories, or significantly greater resources than we do, or may be able to offer products and services similar to those offered by WeightWatchers Clinic at more attractive prices than we can. Conversely, increased attention by consumers and the media to recent developments, innovations, and approvals of chronic weight management drug therapies, the evolving use of compounded drug formulations, and the perception of their safety, effectiveness and ease of use, may also delay or prevent consumer engagement in our non-Clinical businesses.
The purchasing decisions of weight management and healthy livinghealth and wellness consumers are highly subjective and can be influenced by many factors, such as perception of the ease of use and efficacy of the service and product offerings as well as brand image or reputation, marketing programs, cost, social media presence and sentiment, consumer trends, personalization, the digital platform, content and user experience, and perception of the efficacy of the service and product offerings.experience. Moreover, consumers can, and frequently do, change approaches easily and at little cost.easily. For example, fad diets and weight loss trends, such as low-carbohydrate diets, have adversely affected our revenues from time to time. Also, our revenue from our non-Clinical businesses has been and may continue to be adversely affected by the popularity and expanding availability of pharmacotherapy treatments (offered either in-person by medical providers or through other telehealth platforms), as well as apps, activity monitors and other free or low-cost “do-it-yourself” alternatives. Any decrease in demand for our services and products may adversely affect our business, financial condition or results of operations.
14
A failure to continue to retain and grow our subscriber base could adversely affect our results of operations and business.
Subscriptions to our businesses generate the predominant portion of our revenue, and our future growth depends upon our ability to retain and grow our subscriber base and audience. To do so will require us to continue to evolve our subscription model, user experience and digital platforms; address changing consumer demands and developments in science and technology; and improve our services and products while continuing to provide our members with guidance, compelling content, personalization and an inspiring community to enable them to develop healthy habits.habits. We have invested and will continue to invest significant resources in these efforts, but there is no assurance that we will be able to successfully maintain and increase our subscriber base or that we will be able to do so without taking steps such as reducing pricing or incurring subscription acquisition costs that would affect our subscription revenues, margin and/or profitability.
14We may not be able to successfully execute our business plan to be a leader in the rapidly evolving and increasingly competitive clinical weight management and weight loss market, which could adversely affect our business, financial condition or results of operations.
The clinical weight management and weight loss market is rapidly evolving and increasingly competitive. The potential growth and scope of, and future investments in, this market is unknown and it may not reach the market size or generate the related revenues that we anticipate. Additionally, insurance and employer cost coverage for weight management medications may not be expanded or may contract further, and prices for weight management medications may rise or may not decline, making them unaffordable to certain consumers. Our future financial performance depends in part on growth in this market, our ability to market effectively and in a cost-efficient manner to customers who are seeking a clinical weight management solution, and our ability to adapt to emerging demands of existing and potential customers and the evolving regulatory landscape. Our new virtual care Clinical offering, WeightWatchers Clinic, may be unable to achieve and sustain high levels of demand, consumer acceptance, and market adoption. Negative publicity concerning telehealth generally or weight management medications specifically, such as information regarding side effects or adverse events associated with such medications, or our Clinical offerings and related customer experiences, could limit market acceptance of our business model and services within this larger market. Similarly, negative publicity regarding customer confidentiality and privacy in the context of telehealth could limit market acceptance of our business model and services. If our Clinical offerings are unable to drive recruitment and retention, our Clinical subscriber base may not grow, or may grow more slowly than we expect. The COVID-19 pandemic increased utilization of virtual care services, but it is uncertain whether such increase in demand will continue. Our success will depend to a substantial extent on the willingness of our members to access our Clinical offering virtually via our telehealth platform, as well as on our ability to continue to demonstrate the value of virtual care to employers, health plans, government agencies, and other purchasers of healthcare for beneficiaries. The success and satisfaction of our Clinical members depends in part on their being able to access the weight management medications that they have been prescribed by WeightWatchers Clinic clinicians. Due to supply chain constraints and shortages for weight management medications, these members have experienced, and may continue to experience, stock issues at mail order and local pharmacies that fill prescriptions for such therapies. If we fail to successfully compete in the clinical weight management and weight loss market with our virtual care Clinical offering, our business, financial condition or results of operations could be adversely affected.
15
If we do not continue to develop new, innovative services and products or if our services, products or brands do not continue to appeal to the market, or if we are unable to successfully expand into new channels of distribution or respond to consumer trends or sentiment, our business may suffer.
The weight management and health and wellness marketplace is subject to changing consumer demands and sentiment based, in large part, on the efficacy, ease of use and popular appeal of weight management and healthy living programs.wellness programs and the evolving science with respect to weight loss. The popularity of weight management and healthy livingwellness programs is dependent, in part, on their ease of use, cost and channels of distribution as well as consumer trends or sentiment.sentiment and medical advancements. For example, consumerspublic opinion on the use of weight management medications is significantly shifting as the popularity of clinical solutions grows, more medications are increasingly focusingapproved by regulatory authorities in the U.S. and elsewhere, and the availability of weight management drugs continues to expand. Although beneficial for our Clinical business, the growing acceptance of the use of medication to manage weight could negatively impact the popular appeal of our Digital and Workshops + Digital businesses. Our businesses and the portfolio of corresponding services and products we offer are intended to address the weight health needs of all members – whether they are taking prescription weight management medications, living with diabetes or looking to otherwise lose weight – but the perception that our company caters to, or is focused on, more integrated lifestyleany of those groups to the exclusion of the others could potentially alienate current and fitness approachesfuture members, and our businesses may associatesuffer. The successes or challenges of our program with just food, nutrition and diet, which could adversely impact its popularity.Clinical business may come at the respective expense of, or advantage to, our other businesses. Additionally, developments in public opinion on the types of products and services we provide could negatively impact the popular appeal of our services and products. Our future success depends on our ability to continue to develop and market new, innovative services and products and to enhance our existing services and products, each on a timely basis, to respond to new and evolving consumer demands and sentiment, achieve market acceptance and keep pace with new medical, nutritional, weight management, healthy living, technological and other developments. We may not be successful in developing, introducing on a timely basis or marketing any new or enhanced services and products. Additionally, new or enhanced services or products may not appeal to the market or the market’s perception of us. As we announce new brands, sub-brands or articulations of our brands, such as our evolution from Weight Watchers to WW in 2018,and we adopt new trademarks, the marketplace may not embrace or accept them and it may take time to build their reputation and goodwill, both with consumers and with our partners. Our future success also will depend, in part, on our ability to successfully distribute our services and products through appealing channels of distribution, such as social media.distribution. Our failure to develop new, innovative services and products and to enhance our existing services and products, the failure of our services, products or brands to continue to appeal to the market or respond to consumer trends or sentiment, or the failure to expand into appealing new channels of distribution could have an adverse impact on our ability to attract and retain members and subscribers and thus adversely affect our business, financial condition or results of operations.
We may not be able to successfully implement our strategic initiatives, which could adversely impact our business, financial conditions or results of operations.
We are continually evaluating the changing consumer environment and the competitive environment of the weight management and healthy living marketplacehealth and wellness marketplaces and seeking out opportunities to improve our performance through the implementation of selected strategic initiatives. The goal of these efforts is to develop and implement a comprehensive and competitive business strategy that addresses those changes. Over the past several years, we have increasedexpanded our focus on overallofferings in health and wellness.wellness, including, most recently, introducing our Clinical offering. We may not be able to successfully implement our strategic initiatives and realize the intended business opportunities, growth prospects, including new business channels, and competitive advantages. Our efforts to capitalize on business opportunities may not bring the intended results. Assumptions underlying expected financial results or consumer demand and receptivity may not be met or economic or consumer conditions may deteriorate. We also may be unable to attract and retain highly qualified and skilled personnel, or engage with partners of choice, to implement our strategic initiatives. If these or other factors limit our ability to successfully execute our strategic initiatives, our business activities, financial condition or results of operations may be adversely affected.
16
We continually innovate our digital offerings and experiences forto best serve our members. For example, in November 2021,the Company’s continued pursuit to evolve alongside advancements in science, in fiscal 2023, we acquired Sequence, a subscription telehealth platform, which is now known as WeightWatchers Clinic, to meet the increasing consumer demand for prescription weight management medications. Later that year, we launched oura new weight management and wellness program with corresponding design, usability, features and capabilities updates to our app. In December 2020,provide tailored behavioral support for individuals on GLP-1 medications. As we expandedcontinue to embrace an “always on” innovation strategy across multiple areas of our offerings, programs and introduced Digital 360, a digitally-enabled, community-focused and coach-led membership plan. Suchnew offerings may not have the same success, or gain traction as quickly, as our past offerings. This increased focus on more personalized and digitally-enabled offeringstechnological capabilities, these innovations may not be successful in meeting the needs or preferences of many of our current or potential members. As a result, we may experience decreases in our recruitment and retention of members, or increased member cancellations. We may not be able to successfully launch our new virtual or other digital offerings and realize the intended business opportunities, growth prospects, including new business channels, and competitive advantages of our digitalinnovation strategy. Assumptions underlying expected financial results or consumer demand and receptivity may not be met or economic or consumer conditions may deteriorate including as a result of the impact of COVID-19, and may adversely impact our ability to continue to successfully implement this digital strategy.our strategies. If these or other factors limit our ability to successfully execute thisour strategic initiative,initiatives, our business, financial conditionscondition or results of operations may be adversely impacted. For additional information on certain of the risks associated with our strategic entry into the telehealth market, see “—We may not be able to successfully execute our business plan to be a leader in the rapidly evolving and increasingly competitive clinical weight management and weight loss market, which could adversely affect our business, financial condition or results of operations.” above. Additionally, as we continue to innovate our workshop and clinical experiences and explore new in-person formats, we may not be successful in meeting the needs of many of our current or potential members.
15We may not be successful in evolving our in-person or virtual community offerings, including our workshop offering, which could adversely affect our business, brand, or financial results.
We believe that the power of our community is one of the factors that enables us to attract new and returning customers. However, we have continued to observe significant recruitment declines in our Workshops + Digital business. Our mix shift toward our Digital business in recent years negatively impacted revenue and continues to do so. Additionally, our Workshops + Digital members may choose our new Clinical offering, which could further decrease the demand for our workshop offering and negatively impact revenues for our Workshops + Digital business. These revenue declines may be accelerated by evolving consumer tastes and preferences regarding in-person or virtual communities. The evolution of our traditional in-person formats, or the introduction of new formats, may dilute the competitive advantage of our community or discourage current or potential Workshops + Digital and other members from subscribing to our offerings. New iterations of our workshop format may not develop as rapidly alongside the evolving science of weight management to provide the latest in science-backed community support initiatives, or alongside evolving consumer tastes and preferences, which could negatively impact our business, brand, or financial results.
17
Our business depends on the effectiveness and efficiency of our advertising and marketing programs across multiple platforms, including the strength of our social media presence, to attract and retain members and subscribers.
Our business success depends on our ability to attract and retain members and subscribers. Our ability to attract and retain members and subscribers depends significantly on the effectiveness and efficiency of our advertising and marketing practices across multiple platforms. For example, if our advertising and marketing programs are not effective and fail to attract sufficient recruitments during the first quarter of the fiscal year, our most important period for recruitments, it historically has had an outsized negative impact on our performance for the remainder of the year. Our competitors may create more compelling marketing campaigns or marketing campaigns that appeal to more diverse audiences, or may devote greater financial and other resources to marketing and advertising, which could drive our current and potential members and subscribers to our competitors. Additionally, our marketing initiatives may become increasingly expensive and generating a meaningful return on those initiatives may be difficult. In addition, from time-to-time, we use the success stories of our members and subscribers, and utilize brand ambassadors, spokespersons and social media influencers, including in some cases celebrities, in our advertising and marketing programs to communicate on a personal level with consumers. Actions taken by these individuals that harm their personal reputation or image, or include the cessation of using our services and products, could have an adverse impact on the advertising and marketing campaigns in which they are featured. We and our brand ambassadors, spokespersons and social media influencers also use social media channels as a means of communicating with consumers. Unauthorized or inappropriate use of, or content on, these channels could result in harmful publicity or negative consumer experiences, which could have an adverse impact on the effectiveness of our marketing in these channels.channels, our reputation and our ability to attract and retain members, subscribers and strategic partners. In addition, any resulting substantial negative commentary by others, whether on traditional or social media platforms, could have an adverse impact on our reputation and ability to attract and retain members, subscribers and subscribers.strategic partners. If our advertising and marketing campaigns do not generate a sufficient number of members and subscribers, or fail to develop a high level of engagement with current and potential members and subscribers on various platforms, our business, financial condition and results of operations will be adversely affected.
Our reputation could be impaired due to actions taken by our franchisees, licensees, suppliers, affiliated provider entities, PCs’ healthcare professionals, and other partners.
We believe that our brands, including their widespread recognition and strong reputation and goodwill in the market, are one of our most valuable assets and they provide us with a competitive advantage. Our franchisees operate their businesses under our brands. WeAlthough we completed the wind down of our consumer products business at the end of fiscal 2023, we continue to license our trademarks to third parties for the manufacture and sale in retail stores by such parties of a variety of goods, including food products, and also co-brand or endorse third-party branded consumer services and products. We also sell through a variety of channels, including online through our e-commerce platforms, at our studios, and through our trusted partners, food and non-food products manufactured by third-party suppliers. In addition, we integrate our services and products with those of other third parties, including through bundled and joint offerings, and integrate data from trusted third-party partners into our offerings. Our third-party partnerships also extend to event sponsorships and co-promotions. Our franchisees, licensees, suppliers and other partners are independent third parties with their own financial objectives, third-party relationships and brand associations. Actions taken by them, including violations of generally accepted ethical business practices or breaches of law, regulations or contractual obligations, such as not following our program or not maintaining our quality and safety standards, could harm our reputation. Also, our products and services, or the third-party products or services with which we integrate our own services and products, may be subject to product recalls, brand confusion, litigation, regulatory action or other deficiencies, as the case may be, which could harm our brands. Any negative publicity associated with these actions or these third parties would adversely affect our reputation and may result in decreased recruitment, Digital product subscriptions, workshop attendance and third party product sales and, as a result, lower revenues and profits.
18
Through our Clinical business, we are now associated with, and may in the future become associated with, managed professional corporations, professional associations or equivalent entities, which are legal entities organized under state laws that employ or contract with healthcare professionals in one or more states to provide telehealth services (collectively, “PCs”). We are dependent on our relationships with the PCs, which we do not own, and our business would be adversely affected if those relationships were disrupted. We and the PCs may suffer losses or reputational harm from medical malpractice liability, professional liability or other claims against the healthcare professionals employed by, or contracting with, us, the PCs or a clinical staffing agency engaged by the PCs (the “Affiliated Professionals”). Affiliated Professionals may provide inappropriate medical treatment, fail to follow procedures or guidelines, submit insurance claims without required and appropriate documentation, engage in services outside the scope of their practice, or engage in unprofessional conduct or other activities that could lead to claims, significant defense costs, reputational harm, negative publicity, increased scrutiny by regulators and payors, or other risks, which may adversely affect our business. We and/or the PCs may be unable to obtain or maintain adequate insurance against these claims. Healthcare professionals providing telehealth services have become subject to a number of lawsuits alleging malpractice and some of these lawsuits may involve large claims and significant defense costs. It is possible that these claims could also be asserted against us and potential litigation may include us as an additional defendant. Any suits against us, the PCs or the Affiliated Professionals, if successful, could result in substantial damage awards to the claimants that may exceed the limits of any applicable insurance coverage. Although we do not control the practice of telehealth by the PCs and the Affiliated Professionals, it could be asserted that we should be held liable for malpractice of a healthcare professional employed or contracted by a PC.
In addition, we and the PCs could incur reputational harm or negative publicity in relation to a material malpractice or care-related event involving an Affiliated Professional. Malpractice lawsuits and claims can also lead to increased scrutiny by state regulators. In addition, some plaintiffs have asserted allegations of corporate practice of medicine in connection with malpractice lawsuits. There can be no assurance that a future claim or claims will not be successful. Malpractice insurance, moreover, can be expensive and varies from state to state and there can be no assurance that malpractice insurance will be available to us or the PCs or the Affiliated Professionals at an acceptable cost or at all.
Successful malpractice claims asserted against us or the PCs or the Affiliated Professionals could have a material adverse effect on our business, financial condition and results of operations. Additionally, our inability to obtain adequate insurance may also have a material adverse effect on our business and financial results.
Additionally, a number of laws and regulations govern the business of advertising, promoting, dispensing, and marketing services and products, including generic and branded pharmaceuticals. These regulatory regimes are overseen by governmental bodies, including the FDA, the U.S. Department of Health and Human Services (“HHS”), the FTC and several state and local government agencies in the United States. Failure to comply with the laws and regulations of these governmental agencies may result in legal or other enforcement actions, including orders to cease non-compliant activities. We depend on pharmacies, laboratories and other contractors to provide certain products and services for members. These third parties may be subject to inspections and audits by federal, state or local health authorities, health insurers, and pharmacy benefit managers. If these third parties do not maintain appropriate licenses or comply with legal and regulatory requirements or are subject to enforcement actions, our business may be adversely affected.
Any inquiry into the safety, efficacy or regulatory status of the products prescribed by the Affiliated Professionals and any related interruption in the marketing and sale of these products could damage our reputation and image in the marketplace. For example, the use of such products may cause adverse events or other undesirable side effects, which could cause regulatory authorities to issue warnings about the products or could lead to recalls, withdrawals of approvals for such products or other regulatory or other enforcement actions. Additionally, the FDA has received adverse event reports associated with compounded versions of the products prescribed by the Affiliated Professionals and warned consumers not to use counterfeit versions of such products, which have been marketed in the U.S.; adverse events associated with compounded or counterfeit versions could adversely affect our business. The FDA has also issued warning letters to companies alleging improper claims regarding their pharmaceutical products. If the FDA or any other regulatory authorities determine that we have made inappropriate drug claims, we could receive a warning or untitled letter, be required to modify our claims or take other actions to satisfy the FDA or any other regulatory authorities. There can be no assurance that we will not be subject to state, federal or foreign government actions or class action lawsuits, which could harm our business, financial condition and results of operations.
19
We have in the past and may in the future be required to recognize asset impairment charges for indefinite- and definite-lived assets.
In accordance with GAAP (as defined hereafter), we perform impairment reviews of our indefinite-lived assets, which include franchise rights acquired and goodwill, on at least an annual basis or more often if events so require. We also continually evaluate whether current factors or indicators, such as a decline in our financial performance, an increased competitive environment, the deterioration in relevant, country macroeconomic conditions, an increased competitive environment, a decline in our financial performance, and/or other prevailing conditions in the capital markets, require the performance of an interim impairment assessment of those assets. The process of testing franchise rights acquired, goodwill and other indefinite-lived assets for impairment involves numerous judgments, assumptions and estimates made by management, which inherently reflect a high degree of uncertainty. Certain factors, including the future profitability of our businesses, the price of our common stock, the market value of our debt and macroeconomic conditions (both at the global and local levels), might have a negative impact on the fair value of these assets. InFor example, in fiscal 2020,2022, we recorded a $3.7$393.6 million of impairment chargecharges for goodwillour franchise rights acquired related to our Brazil reporting unit.United States, Canada, United Kingdom, New Zealand and Australia units of account. We may incur additional impairment
16
charges in the future, which would have an adverse impact on our results of operations. See “Item 7. Management’s Discussion and Analysis of Financial Condition and Results of Operations—Critical Accounting Estimates” in Part II of this Annual Report on Form 10-K for additional information.
Additionally, we evaluate definite-lived assets, both tangible, which includes our physical plant and equipment, and intangible, which includes both internally developed and purchased software, for impairment by comparing the net realizable value of the asset to the carrying value of the capitalized cost. If the value of those assets is not deemed to be recoverable, an assessment of the fair value of those assets is performed and, to the extent the carrying value exceeds the fair value, an impairment charge is recognized. Should our investment in capitalized definite-lived assets become impaired, there would also be an adverse impact on our results of operations.
Loss of key personnel, strategic partners or consultants or failure to effectively manage and motivate our workforce could negatively impact our sales of services and products, business, financial condition and results of operations.
We depend on senior management and other key personnel and consultants, and thetheir loss of certain personnel or consultants could result in the loss of management continuity and institutional knowledge and negatively affect our operations, brand image and goodwill. We have made, and may continue to make, significant strategic and organizational changes, such as changing the composition of our leadership team and centralizing the global management of certain functions and systems. Such changes could be disruptive to our daily operations or relationships with customers, partners, suppliers, and employees, make it more difficult to hire and retain key employees, impact our public or market perception or result in a loss of institutional knowledge, any of which could have a negative impact on our business or stock price.
In October 2015, Ms. Winfrey and the Company began a long-term, strategic partnership, which included her making a substantial equity investment in the Company, joining our Board of Directors, providing certain consulting services and granting us the right to use her name and marks. For additional details on these consulting services and rights and the applicable term during which we may benefit, see “Item 1. Business—History—Winfrey Transaction” of this Annual Report on Form 10-K. Our ability to maintain our brand image and leverage the goodwill associated with Ms. Winfrey’s name may be damaged if we were to lose her services or if the nature of our partnership changes. The loss of Ms. Winfrey’s services or partnership with us for any reason (including as a result of her death or disability), any negative market or industry perception with respect to her or her participation in the Company’s programs, or the failure by Ms. Winfrey to provide services in her discretion to promote the Company, our programs, services and products or to consult with us and participate in developing, planning, executing and enhancing our programs and related initiatives, all in accordance with our strategic partnership arrangements with her, could have an adverse effect on our business, financial condition and results of operations. In addition to the aforementioned services, pursuant to the terms of the Strategic Collaboration Agreement as amended, the Company intended to cause Ms. Winfrey to be nominated as a director of the Company. However, on February 26, 2024, Ms. Winfrey notified us that she would not be standing for re-election as a member of our Board of Directors at our 2024 annual meeting of shareholders.
20
We also depend heavily upon our coaches, guides and guidesmembers of our customer service teams to support our customers in their weight management efforts. If we fail to appropriately manage and motivate our coaches, guides and guides,customer service team members, we may not be able to adequately service our customers which could negatively impact our sales of services and products. Changes in factors such as overall unemployment levels, local competition for qualified personnel, prevailing wage rates and employment law, as well as rising employee benefits costs, including insurance in the areas in which we operate, could increase our labor costs and interfere with our ability to adequately retain qualified individuals to provide support to customers. Additionally, our inability to attract and retain qualified coaches, guides and guidescustomer service team members could delay or hinder our successfully executing our strategic initiatives.
We are undergoingmay not successfully make acquisitions or enter into collaborations or joint ventures and we may not successfully integrate, operate or realize the anticipated benefits of such businesses.
As part of our strategic initiatives, we may pursue selected acquisitions, collaborations or joint ventures, such as our 2023 acquisition of Weekend Health, Inc., doing business as Sequence (the “Acquisition”). We may not be able to effect other transactions or partnerships on commercially reasonable terms or at all. Additionally, if the market negatively perceives our business or financial condition, we may not be a chief executive officer transition,partner of choice for such transactions or partnerships, which could adversely affect our ability to enter into such transactions or partnerships and the terms thereof. Any future acquisitions or joint ventures may require access to additional capital, and we may not have access to such capital on commercially reasonable terms or at all. Even if we enter into these transactions, we may not realize the benefits we anticipate or we may experience difficulties in integrating any acquired companies, technologies and products into our existing business, operating a business in a new sector, or in providing our services and products in newly acquired markets; attrition of key personnel and loss of expertise from acquired businesses and difficulties accessing necessary expertise; significant charges or expenses; higher costs of integration and compliance than we anticipated; or unforeseen operating difficulties that require significant financial and managerial resources that would otherwise be available for the ongoing development of our services and products or the expansion of our existing operations. The market may also negatively perceive these transactions or partnerships and our allocation of financial and other resources in connection therewith.
We also may be limited by contract or otherwise with respect to, or have no control over, the resources that any third party partner may devote to the research, development and commercialization of services and products under our collaborations. Any of our collaborators may not perform their obligations as expected. Our collaborators may breach or terminate their agreements with us or otherwise fail to conduct research, development or commercialization activities successfully, in a timely manner or in compliance with legal requirements. Additionally, disputes may arise with respect to the ownership of rights to technology developed with our collaboration partners. The failure of our collaboration partners to meet their obligations, comply with legal requirements, adequately deploy resources or to satisfactorily resolve disputes with us could have an adverse effect on our business, financial condition or results of operations. The ability to achieve our strategic objectives and success in our Clinical business may depend, among other things, on the willingness of our current partners to continue their existing relationships with us, our ability to demonstrate the value of our Clinical business to potential partners, and our ability to navigate the complex healthcare regulatory requirements that may be implicated by our current and future partnerships.
Our ability to influence the control of, or distributions from, our joint ventures may be limited by contract or otherwise. If any of the other investors in one of our joint ventures fails to observe its commitments, or its interests are different than ours, the joint venture may not be able to operate according to its business plan, we may be required to increase our level of commitment, or such entities may take actions which are not in our best interest. If we are unable to maintain our relationships with our joint venture partners, we could lose our ability to operate in the geographies and/or markets in which they operate, which could have an adverse effect on our business, financial condition or results of operations.
Consummating these transactions and partnerships could also result in the incurrence of additional debt and related interest expense, as well as unforeseen contingent liabilities, all of which could have an adverse effect on our business, financial condition or results of operations. We may also issue additional equity in connection with these transactions and partnerships, which would dilute our existing shareholders.
21
Our business may decline as a result of, or uncertainties related to, a downturn in general economic conditions or consumer confidence, including as a result of the existing inflationary environment, rising interest rates, the potential impact of political and social unrest and increased volatility in the credit and capital markets.
Our business is highly dependent on our subscription model. A downturn in general economic conditions, including inflationary environments, or consumer confidence in any of our markets could result in people curtailing or reallocating their discretionary spending which, in turn, could reduce subscriptions. Macroeconomic factors have adversely affected, and could continue to adversely affect, the economies and financial markets of countries in which we operate, resulting in an economic downturn, including rising inflation and interest rates, that could affect consumer demand for our products and services. Our customer purchasing patterns can be influenced by economic factors. The precise impact, and extent thereof, on our business from the disruption of financial markets and the weakening of overall economic conditions cannot be predicted with certainty. Uncertainties regarding the global economic environment, political and social stability, and increased volatility in the credit and capital markets have resulted in, and are likely to continue to result in, sustained impact on the economy at the macro and local levels. Our business is particularly sensitive to reductions in discretionary consumer spending, which may be adversely impacted by a recession or fears of a recession, volatility and declines in the stock market and increasingly pessimistic consumer sentiment due to perceived or actual economic risks. Consumers may shift purchases to lower-priced or other perceived value offerings during economic downturns. Prolonged unfavorable economic conditions and any resulting recession or slowed economic growth may have an adverse effect on our financial condition and results of operations.
The seasonal nature of our business could cause disruptionour operating results to fluctuate.
We have experienced and expect to continue to experience fluctuations in our quarterly results of operations due to the seasonal nature of our business. Historically, the first quarter of the fiscal year, known as our winter season, is the most important quarter for recruitments. Given the subscription nature of our products, failure to realize recruitments during the winter season could negatively impact our performance for the remainder of the year. Seasonality also impacts relative revenue and profitability of each quarter of the year, both on a quarter-to-quarter and year-over-year basis. This seasonality could cause our share price to fluctuate as the results of an interim financial period may not be indicative of our full year results.
If we do not maintain effective internal control over financial reporting, we could fail to report our financial results accurately.
Effective internal control over financial reporting is necessary for us to provide reliable financial reports. In the past we have discovered, and in the future we may discover, areas of our internal control over financial reporting that need improvement. In the future, if we identify a control deficiency that rises to the level of a material weakness in our internal controls over financial reporting, this material weakness may adversely affect our ability to record, process, summarize and report financial information timely and accurately and, as a result, our financial statements may contain material misstatements or omissions. A material weakness is defined as a deficiency, or a combination of deficiencies, in internal control over financial reporting, such that there is a reasonable possibility that a material misstatement of the annual or interim financial statements will not be prevented or detected on a timely basis.
Any event that impedes accessing resources or discourages or impedes people from gathering with others, whether at a gathering place, work or otherwise, could adversely affect our business.
Our business is subject to conditions beyond our control, including health epidemics (such as the COVID-19 pandemic), extreme weather and climate conditions (which may become more frequent and more severe with the increasing effects of climate change), war, terrorism, loss of resources such as electricity and internet connections, national disasters and other extraordinary events, that may prevent or impede access to our Digital or Clinical products or in-person or virtual workshop attendance. These conditions could also impact the ability of our suppliers and other third party partners to meet their obligations to us and negatively impact our ability to provide our products and services to customers. Additionally, these conditions could also impact the ability of our Clinical members to access the weight management medications prescribed by our clinicians. The occurrence of any event that discourages people from gathering with others or impedes their ability to access our services and products could adversely affect our business, financial condition or results of operations.
22
Early termination by us of leases could have an adverse impact on our financial results.
Our operations, including certain corporate offices, are located in leased office space and business strategy as well as the public or market perceptioncertain of our business.
In September 2021, Mindy Grossman resigned as President and Chief Executive Officerworkshops are held in leased space in retail centers. As we decide to relocate or close studios, or relocate or close corporate offices, before the expiration of the Company, effective onapplicable lease term, we may incur payments to landlords to terminate or “buy out” the earlierremaining term of (i) the commencementlease or costs associated with subleasing certain office space, as applicable. For example, in fiscal 2023, we recorded an aggregate of employment$12.7 million of any successor Chief Executive Officer (or interim replacement) and (ii) April 15, 2022. On February 23, 2022, we appointed Sima Sistani as Chief Executive Officer, effective March 21, 2022,charges in connection with Ms. Grossman resigning as President and Chief Executive Officer asthe closure of March 18, 2022.certain studios. Any significant leadership change or executive management transition involves inherent risk and can be inherently difficult to manage. It may involve a diversion of resources and management attention, be disruptive to our daily operations or relationships with customers, suppliers, and employees, make it more difficult to hire and retain key employees, the above events could adversely impact our public or market perception or hinder progress on key strategic initiatives,financial results. any of which could have a negative impact on our business or stock price.
17
The inability to renew certain of our licenses, or the inability to do so on terms that are favorable to us, could have an adverse effect on our financial results.
We have entered into licensing, co-branding and endorsement relationships with numerous partners for the distribution and sale of certain products and services that are relevant and helpful to weight- and health-conscious consumers. These arrangements are typically for fixed terms, following which the parties decide whether to extend the term of the arrangement. There is no guarantee that we will reach mutually agreeable terms with our partners for extending an arrangement. Similarly, in those instances where a licensee enjoys the option to extend the term of a license as a result of having achieved certain conditions, there is no guarantee that the licensee will avail itself of such option. Our financial results could be adversely affected if we are unable to extend a licensing, co-branding or endorsement arrangement, if we are unable to do so on terms favorable to us, or if we cannot locate a suitable alternative to an incumbent licensee who has decided not to renew its arrangement.
Expiration or early termination by us of leases could have an adverse impact on our financial results.
Our operations, including corporate offices, are located in leased office space and many of our workshops are held in leased space in retail centers. As leases expire, we may not be able to renew them on acceptable terms or secure suitable replacement locations. As we decide to relocate or close studios before the expiration of the applicable lease term, we may incur payments to landlords to terminate or “buy out” the remaining term of the lease. For example, in fiscal 2021 we recorded a $12.2 million charge in connection with the closure of certain studios. Any of the above events could adversely impact our financial results.
Our business may decline as a result of a downturn in general economic conditions or consumer confidence.
Our business is highly dependent on product subscriptions, workshop fees and product sales. A downturn in general economic conditions, including inflationary environments, or consumer confidence in any of our markets could result in people curtailing or reallocating their discretionary spending which, in turn, could reduce product subscriptions, attendance at our workshops and product sales. Any reduction in consumer spending may adversely affect our business, financial condition or results of operations.
We may not successfully make acquisitions or enter into joint ventures or collaborations and we may not successfully integrate, operate or realize the anticipated benefits of such businesses.
As part of our strategic initiatives, we may pursue selected acquisitions, joint ventures or collaborations. We may not be able to effect these transactions or partnerships on commercially reasonable terms or at all. Additionally, if the market negatively perceives our business or financial condition, we may not be a partner of choice for such transactions or partnerships, which could adversely affect our ability to enter into such transactions or partnerships and the terms thereof. Any future acquisitions or joint ventures may require access to additional capital, and we may not have access to such capital on commercially reasonable terms or at all. Even if we enter into these transactions, we may not realize the benefits we anticipate or we may experience difficulties in integrating any acquired companies, technologies and products into our existing business or in providing our services and products in newly acquired markets; attrition of key personnel from acquired businesses; significant charges or expenses; higher costs of integration than we anticipated; or unforeseen operating difficulties that require significant financial and managerial resources that would otherwise be available for the ongoing development of our services and products or the expansion of our existing operations.
Our ability to influence the control of, or distributions from, our joint ventures may be limited by contract or otherwise. If any of the other investors in one of our joint ventures fails to observe its commitments, or its interests are different than ours, the joint venture may not be able to operate according to its business plan, we may be required to increase our level of commitment, or such entities may take actions which are not in our best interest. If we are unable to maintain our relationships with our joint venture partners, we could lose our ability to operate in the geographies and/or markets in which they operate, which could have an adverse effect on our business, financial condition or results of operations.
18
We also may be limited by contract or otherwise with respect to, or have no control over, the resources that any third party partner may devote to the research, development and commercialization of services and products under our collaborations. Any of our collaborators may not perform their obligations as expected. Our collaborators may breach or terminate their agreements with us or otherwise fail to conduct research, development or commercialization activities successfully, in a timely manner or in compliance with legal requirements. Additionally, disputes may arise with respect to the ownership of rights to technology developed with our collaboration partners. The failure of our collaboration partners to meet their obligations, adequately deploy resources or to satisfactorily resolve disputes with us could have an adverse effect on our business, financial condition or results of operations.
Consummating these transactions and partnerships could also result in the incurrence of additional debt and related interest expense, as well as unforeseen contingent liabilities, all of which could have an adverse effect on our business, financial condition or results of operations. We may also issue additional equity in connection with these transactions and partnerships, which would dilute our existing shareholders.
The seasonal nature of our business could cause our operating results to fluctuate.
We have experienced and expect to continue to experience fluctuations in our quarterly results of operations due to the seasonal nature of our business. Historically, the first quarter of the fiscal year, known as our winter season, is the most important quarter for recruitments.Given the subscription nature of our products, failure to realize recruitments during the winter season could negatively impact our performance for the remainder of the year. Seasonality also impacts relative revenue and profitability of each quarter of the year, both on a quarter-to-quarter and year-over-year basis. This seasonality could cause our share price to fluctuate as the results of an interim financial period may not be indicative of our full year results.
Any event that discourages or impedes people from gathering with others, whether at a gathering place, work or otherwise, or impedes accessing resources could adversely affect our business.
Our business is subject to conditions beyond our control, including health epidemics (such as the COVID-19 pandemic), extreme weather and climate conditions (which may become more frequent and more severe with the increasing effects of climate change), war, terrorism, loss of resources such as electricity and internet connections, national disasters and other extraordinary events, that may prevent or impede in-person or virtual workshop attendance or accessing our Digital products. These conditions could also impact the ability of our suppliers and other third party partners to meet their obligations to us and negatively impact our ability to provide our products and services to customers. The occurrence of any event that discourages people from gathering with others or impedes their ability to access our services and products could adversely affect our business, financial condition or results of operations.
If we do not maintain effective internal control over financial reporting, we could fail to report our financial results accurately.
Effective internal control over financial reporting is necessary for us to provide reliable financial reports. In the past we have discovered, and in the future we may discover, areas of our internal control over financial reporting that need improvement. In the future, if we identify a control deficiency that rises to the level of a material weakness in our internal controls over financial reporting, this material weakness may adversely affect our ability to record, process, summarize and report financial information timely and accurately and, as a result, our financial statements may contain material misstatements or omissions. A material weakness is defined as a deficiency, or a combination of deficiencies, in internal control over financial reporting, such that there is a reasonable possibility that a material misstatement of the annual or interim financial statements will not be prevented or detected on a timely basis.
19
Risks Related to Our Liquidity
Our substantial amount of debt and our debt service obligations, as well as our exposure to variable rate indebtedness, could adversely affect our financial condition, and the restrictions of our debt covenants could impede our operations and flexibility.
As of January 1, 2022,December 30, 2023, our total debt was $1,445.0 million. In addition, at January 1, 2022,December 30, 2023, we had $173.9$173.8 million available under our revolving credit facility.facility subject to its terms and conditions as discussed in Note 9 of our audited consolidated financial statements, contained in Part IV, Item 15 of this Annual Report on Form 10-K. $945.0 million of our debt consists of variable-rate instruments so we are subject to the risk of higher interest rates. We currently, and may in the future, seek to manage our exposure to interest rates through interest rate swaps. At the end of fiscal 2021,2023, we had in effect interest rate swaps with an aggregate notional amount of $500.0 million.
Our high degree of debt leverage could have significant consequences, including the following:
| • requiring a substantial portion of our cash flow from operations to be dedicated to the payment of principal and interest on our indebtedness, therefore reducing our ability to use our cash flow to fund our operations, capital expenditures and future business opportunities; • exposing us to the risk of increased interest rates because certain of our borrowings, including the borrowings under our credit facilities, are at variable rates of interest; • making it more difficult for us to make payments and otherwise satisfy our obligations with respect to our indebtedness, and any failure to comply with the obligations of any of our debt instruments, including restrictive covenants and borrowing conditions, could result in an event of default; • restricting our ability and flexibility to make strategic acquisitions and to take advantage of other strategic opportunities to grow our business funded by significant additional indebtedness or causing us to make non-strategic divestitures; • limiting our ability to obtain additional financing for working capital, capital expenditures, product development, debt service requirements, acquisitions and other general corporate purposes; • limiting our ability to adjust to changing market conditions and placing us at a competitive disadvantage compared to our competitors who may be less leveraged or may have greater financial resources than us; • increasing our vulnerability to general adverse economic and industry conditions; and • limiting, along with the financial and other restrictive covenants in our indebtedness, among other things, our ability to borrow additional funds on commercially reasonable terms, if at all. 23
|
|
|
|
|
|
|
|
|
|
|
|
|
|
|
|
Our credit facilities and the indenture governing our notes permit us to incur additional indebtedness in the future. If we incur additional indebtedness, the risks we face as a result of our leverage could intensify.
While there is no net debt to EBITDA (earnings before interest, taxes, depreciation and amortization) leverage ratio maintenance requirement on the debt outstanding under our credit facilities (other than when the aggregate principal amount of our outstanding revolving loans plus non-cash collateralized letters of credit exceeds 35% of the amount of the lenders’ revolving commitments, as further discussed below), our credit facilities and the indenture governing our notes contain customary covenants for a non-investment grade company, including covenants that in certain circumstances restrict our ability to incur additional indebtedness and liens, pay dividends on and redeem capital stock, make investments, sell our assets and enter into acquisitions, mergers and transfers of all or substantially all of our assets, prepay subordinated debt and enter into transactions with affiliates, in each case subject to baskets, thresholds and other exceptions. Under the terms of our credit facilities, depending on our leverage ratio, we are obligated to offer to prepay our term loan facilities in an aggregate amount determined by our excess cash flow. In addition, our revolving credit facility includes a maintenance covenant that requires compliance with certaina first lien secured net leverage ratiosratio when the aggregate principal amount of all revolving loans plus available, undrawn letters of credit and unreimbursed letters of credit (subject to customary exceptions and thresholds) as of the end of a fiscal quarter exceeds 35% of the amount of the lenders’ revolving commitments. We were not in compliance with such ratio as of December 30, 2023, and, as a result, we are limited to borrowing no more than 35%, or $61.3 million, of the revolving commitments as of each fiscal quarter end until we comply with the applicable ratio.
20
Our failure to comply with these covenants could result in an acceleration of our debt, cause cross-defaults under our other debt, lead to the foreclosure on assets collateralizing secured debt (and the lenders and holders of that secured debt would rank ahead of the holders of unsecured debt in the proceeds of those assets) and result in our lenders terminating all commitments to extend further credit. If our indebtedness is accelerated, we may not be able to repay our indebtedness, and we may not be able to borrow sufficient funds to refinance such indebtedness. Any such prepayment or refinancing could adversely affect our financial condition and liquidity. In addition, if we incur additional debt in the future, we may be subject to additional covenants, which may be more restrictive than those to which we are currently subject.
Additionally, borrowings under our credit facilities are at variable rates of interest and expose us to interest rate risk. If interest rates increase, our debt service obligations on the variable rate indebtedness may increase even though the amount borrowed remains the same, if our then-effective swaps, if any, do not reduce our exposure. In addition,LIBOR was previously the benchmark rate used for certain of our variable rate indebtedness, usesincluding our Credit Facilities. LIBOR as a benchmark for establishing the rate of interest. LIBOR ishas been the subject of recent national, international and other regulatory guidance and proposals for reform. On March 5, 2021,reform, which culminated with the United Kingdom's Financial Conduct Authority, or the FCA, which regulatesregulated LIBOR, announced that all LIBOR settings will either cease to be provided or no longer be representative (i) immediately after December 31, 2021, in the case of the one-week and two-month U.S. dollar settings, and (ii) immediately after June 30, 2023, in the caseceasing publication of all remaining U.S. dollar settings. Additionally, the Federal Reserve Board, Federal Deposit Insurance Corporation, Office of the Comptroller of Currency, and other interagency regulatory bodies advised U.S. banks to stop entering into new U.S. dollar LIBOR based contracts by December 31, 2021.rates as of June 30, 2023. The Federal Reserve, in conjunction with the Alternative Reference Rate Committee, or the ARRC, a steering committee convened by the Federal Reserve that includes major market participants, hascomprised of large U.S. financial institutions, identified the Secured Overnight Financing Rate, or SOFR, a newan index calculated by short-term repurchase agreements, backed by U.S. Treasury securities, as its preferred alternative rate for LIBOR. There are significant differences betweenIn connection with the phase-out of LIBOR, andwe amended our Credit Facilities in June 2023 to replace LIBOR with SOFR as the benchmark rate under the Credit Agreement. At this time, it is not possible to predict the full effect that the discontinuance of LIBOR, or the establishment of alternative reference rates such as LIBOR being an unsecured lending rate whileSOFR, will have on us or our borrowing costs. SOFR is a secured lendingrelatively new reference rate and its composition and characteristics are not the same as LIBOR. Given the limited history of SOFR is an overnight rate while LIBOR reflects termand potential volatility as compared to other benchmark or market rates, at different maturities. Althoughthe future performance of SOFR iscannot be predicted based on historical performance. The consequences of the ARRC’s recommended replacement rate, it is also possible that lenders may instead choose alternative replacement rates that may differtransition from LIBOR in ways similar to SOFR orcould include an increase in other ways that would result in higher interest costs for us.
In the event that LIBOR is phased out as is currently expected,cost of our New Credit Agreement (defined hereafter) provides that the Company and the administrative agent may amend the New Credit Agreement to replace the LIBOR definition therein with a successorvariable rate subject to notifying the lending syndicate of such change and not receiving within five business days of such notification objections to such replacement rate from lenders holding at least a majority of the aggregate principal amount of loans and commitments then outstanding under the New Credit Agreement; provided that such lending syndicate may not object to a SOFR-based successor rate contained in any such amendment. If we fail to do so, our borrowings will be based off of the alternative base rate plus a marginindebtedness..
24
We may not be able to generate sufficient cash to service all of our debt and satisfy our other liquidity requirements.
Our ability to make scheduled payments on or to refinance our debt obligations and to fund our planned capital expenditures and other ongoing liquidity needs depends on our future performance, which may be affected by financial, business, economic, demographic and other factors, such as the increased popularity and acceptance of weight management medications, attitudes toward weight management and wellness programs and pressure from our competitors. As of the end of fiscal 2021,2023, we have a term loan facility with an outstanding aggregate principal amount of $945.0 million due in April 2028, a revolving credit facility with availability of $173.9$173.8 million (subject to its terms and conditions as discussed in Note 9 of our audited consolidated financial statements, contained in Part IV, Item 15 of this Annual Report on Form 10-K) maturing in April 2026, and $500.0 million in aggregate principal amount of outstanding 4.500% senior secured notes due in April 2029. We expect to pay the principal and interest due on the term loan facility and our notes from a combination of our cash flows provided by operating activities and by opportunistically using other means to repay or refinance our obligations as we determine appropriate. There can be no assurance that we will maintain a level of cash flows provided by operating activities in an amount sufficient to permit us to pay the principal and interest on all of our outstanding debt.
21
If our cash flows and capital resources are insufficient to fund our debt service obligations, we may be forced to reduce or delay investments and capital expenditures, or to sell assets, seek additional capital or restructure or refinance our indebtedness. Our ability, if any, to restructure or refinance our debt will depend on the condition of the capital markets and our financial condition at such time. Any refinancing of our debt, if available on acceptable terms or at all, could be at higher interest rates and may require us to comply with more onerous covenants, which could further restrict our business operations. The terms of existing or future debt instruments may restrict us from adopting some of these alternatives. In addition, any deterioration in our performance may result in a reduction of our credit rating, which could harm our ability to incur additional indebtedness or our ability to refinance our debt obligations on favorable terms or at all.
RiskAdditionally, our liquidity is impacted by our cash usage, including cash payments related to strategic initiatives and acquisitions. For example, to complete our acquisition of Sequence, we made a significant purchase price cash payment in fiscal 2023, and will be required to make additional payments in each of fiscal 2024 and fiscal 2025. For additional details on the cash consideration payable in connection with the acquisition of Sequence, see Note 6 of our audited consolidated financial statements, contained in Part IV, Item 15 of this Annual Report on Form 10-K .These material payments may negatively impact our short- and long-term liquidity in the future, which could harm our ability to satisfy our liquidity requirements.
25
Risks Related to Technology, Security and Intellectual Property
Any failure of our technology or systems to perform satisfactorily could result in an adverse impact on our business.
We rely on software, hardware, network systems and similar technology, including cloud-based technology, that is either developed by us or licensed from or maintained by third parties to operate our websites and platforms, Digital subscription product offerings, and other services and products such as the recurring billing system associated with certain of our commitment plans, and to support our business operations. As much of this technology is complex, there may be future errors, defects or performance problems, including when we update our technology or integrate new technology to expand and enhance our capabilities. Our technology may malfunction or suffer from defects that become apparent only after extended use. The integrity of our technology may also be compromised as a result of third-party cyber-attacks, such as hacking, spear phishing campaigns and denial of service (DOS) attacks, which are increasingly negatively impacting companies. Cyber threats and the techniques used in cyber-attacks are becoming more sophisticated and change, develop and evolve rapidly, including from emerging technologies, such as advanced forms of artificial intelligence (“AI”) and quantum computing. Cyber-attacks can originate from a variety of sources, including third-parties affiliated with foreign governments, organized crime or terrorist organizations, and malicious individuals both outside and inside a targeted company. In addition, our operations depend on our ability to protect our information technology systems against damage from third-party cyber-attacks, fire, power loss, water, earthquakes, telecommunications failures and similar unexpected adverse events. Disruptions in our websites, apps, services and products or network systems could result from a number of factors, including unknown technical defects, insufficient capacity, the failure of our third-party providers to provide continuous and uninterrupted service and unusual volume in traffic for our platforms. Such disruptions would be most impactful if they occurred during peak activity periods and may impact accessibility to our services and products. While we maintain disaster recovery capabilities to return to normal operation in a timely manner, and we deploy multiple parallel instances of our applications across multiple computer resources, we do not have a fully redundant system that includes an instantaneous recovery capability. In the event we experience significant disruptions, we may be unable to repair our systems in an efficient and timely manner, which could have an adverse impact on our business.
As a result of such possible defects, failures, interruptions or other problems, our services and products could be rendered unreliable or be perceived as unreliable by customers, which could result in harm to our reputation and brands. Any failure of our technology or systems could result in an adverse impact on our business.
Our reputation and the appeal of our services and products may be harmed by data security breaches and other malicious acts or privacy concerns.
Breaches of data security, website defacements and other malicious acts, which are increasingly negatively impacting companies, could result in unauthorized access to proprietary or customer information or data, including credit card transaction data personal data, protected health information, and consumer health information, or cause interruptions to our services and products. Such unauthorized access or interruptions could harm our reputation and brands and expose us to liability and regulatory claims, and may result in the loss of existing or potential customers. We rely upon sophisticated information technology systems to operate our business. In the ordinary course of business, we provide proprietary content and we collect, store and utilizeuse confidential information (including, but not limited to, personal customer information and data), in connection with providing our products and engaging our employees and contractors, and it is critical that we do so in a secure manner to maintainprotect the confidentiality and integrity of such confidential information and maintain the trust and confidence of our members, business partners, employees, contractors and shareholders, as well as comply with applicable regulatory requirements and contractual obligations.
22
We also have outsourced significant elements of our information technology infrastructure and, as a result, we are managing many independent vendor relationships with third parties who may or could have access to our confidential information and website content. The size and complexity of our information technology and information security systems, and those of our third-party vendors with whom we contract, make such systems potentially vulnerable to security breaches. While we have invested, including by maintaining cybersecurity insurance coverage, and developed systems and processes designed to protect such proprietary or customercontent and confidential information, or data and our website content, these measures are costly, and there can be no assurance that our efforts will prevent service interruptions or security breaches and other malicious acts.
26
Existing, proposed or new data privacy legislation and regulations, including interpretations thereof, could also significantly affect our business. For example, the European General Data Protection Regulation (GDPR)(“GDPR”) includes increased privacy and security requirements for companies that receive or process personal data of residents of Europe. As a result, we have implemented measures to comply with these requirements, including, among other things, documenting our data processing activities and informing users about how we use their personal data. We also obtain consent and/or offer new controls to existing and new users in Europe before processing data for certain aspects of our services and products. In addition, the GDPR requires submission of personal data breach notifications to our designated European privacy regulator. The GDPR also includes significant penalties for non-compliance with any of several requirements of the regulation. Data protection and privacy laws have also been enacted by the U.S. federal and state governments, including the California Consumer Privacy Act (CCPA)(“CCPA”) as amended by the California Privacy Rights Act (“CPRA”), which became effective on January 1, 2020, the Health Insurance Portability and Accountability Act, (HIPAA)as amended, and implementing privacy, security, and breach regulations (collectively, “HIPAA”), state laws on sensitive health information, and other relevant statutes. and regulations. The FTC also has authority to initiate enforcement actions against entities where such companies’ failure to keep personal information secure may constitute unfair and/or deceptive acts or practices in violation of Section 5(a) of the Federal Trade Commission Act. The FTC may also impose penalties for violations of the Health Breach Notification Rule. These laws also typically include notification obligations and impose significant penalties and potential liability for non-compliance. The data privacy and security regulatory regime continues to evolve and is increasingly demanding. Recently, several states enacted broadly applicable laws to protect the privacy of personal health information. These laws generally require consent for the collection, use, or sharing of any “consumer health data”, which is defined as personal information that is linked or reasonably linkable to a consumer and that identifies a consumer’s past, present, or future physical or mental health. Many states are considering privacy and security legislation and there are ongoing discussions regarding a national privacy law. Variations in requirements across jurisdictions could presentresult in increased compliance challenges and costs, and any failures to comply with such requirements may have an adverse effect on our business or results of operations.
Further, many jurisdictions require that customers be notified if a security breach results in the disclosure of their personal financial account or other information, and additional jurisdictions and governmental entities are considering such laws. In addition, other public disclosure laws may require that material security breaches be reported.reported timely. If we experience, or in certain cases suspect, a security breach and such notice or public disclosure is required in the future, our reputation, brands and business may be harmed. Prospective and existing customers and clients may have concerns regarding our use, or the use by third parties, of private information or data collected on our apps and websites or through our services and products, such as weight management information, health information, financial data, email addresses and home addresses. These privacy concerns could keep customers and clients from using our apps and websites or purchasing our services or products, and third parties from partnering with us.
Other companies have experienced cybersecurity incidents that implicate confidential and proprietary company data and/or the personal data of end users of AI applications integrated into their software offerings or used in their operations. If we were to experience a cybersecurity incident, whether related to the integration of AI capabilities into our product offerings or our use of AI applications in our operations, our business and results of operations could be adversely affected.
While nowe are not aware of any cybersecurity breach or attack to date that has had, or is reasonably likely to have, a material impact on our business orstrategy, results of operations, or financial condition, there can be no assurance that our efforts to maintain the security and integrity of our information technology networks and related systems will be effective or that attempted security breaches or disruptions would not be successful or damaging. In addition, the transmission of computer viruses, or similar malware, could adversely affect our information technology systems and harm our business operations. As a result, it may become necessary to expend significant additional amounts of capital and other resources to protect against, or to alleviate, problems caused by security breaches. These expenditures, however, may not prove to be a sufficient protection or remedy.
27
Integration of artificial intelligence into our offerings and our use of artificial intelligence in our operations could adversely affect our business or results of operations.
We have integrated, and plan to further integrate, AI capabilities into certain components of our product offerings, and we have begun to use AI in our operations. Such integration and use of AI may become more material to our product offerings and operations over time and developing, testing, and deploying resource-intensive AI systems may require additional investment. There are significant risks involved in the development and deployment of AI and there can be no assurance that the usage of AI will enhance our products or services or be beneficial to our business, including our efficiency or profitability. These AI-related initiatives, whether successful or not, could cause us to incur substantial costs. Our competitors or other third parties may incorporate AI into their products or operations more quickly or more successfully than we do, which could impair our ability to compete effectively. The development, adoption, and use for generative AI technologies are still in their early stages and ineffective or inadequate AI development or deployment practices by us or third-party developers or vendors could result in unintended consequences. For example, AI algorithms that we use may be flawed or may be based on datasets that are biased or insufficient. If the AI tools integrated into our products or that we use in our operations produce analyses or recommendations that are or are alleged to be deficient, inaccurate, or biased, our reputation, business, financial condition, and results of operations may be adversely affected.
AI also presents various emerging legal, regulatory and ethical issues. For example, on October 30, 2023, the Biden administration issued an Executive Order to, among other things, establish extensive new standards for AI safety and security. Other jurisdictions may decide to adopt similar or more restrictive legislation that may render the use of such technologies challenging. These restrictions may make it harder for us to conduct our business using AI, lead to regulatory fines or penalties, require us to change our product offerings or business practices, or prevent or limit our use of AI. In addition, our AI-related efforts may give rise to risks related to harmful content, accuracy, bias, discrimination, toxicity, intellectual property infringement or misappropriation, defamation, data leakage, data privacy, and cybersecurity, among others. In addition, these risks include the possibility of new or enhanced governmental or regulatory scrutiny, litigation, or other legal liability, ethical concerns, negative consumer perceptions as to automation and AI, or other complications that could adversely affect our business, reputation, or financial results.
Third parties may infringe on our brands and other intellectual property rights, which may have an adverse impact on our business.
We currently rely on a combination of trademark, copyright, trade dress, trade secret, patent and other intellectual property laws and domain name dispute resolution systems to establish and protect our proprietary rights, including our brands and technology. If we fail to successfully enforce our intellectual property rights, the value of our brands, services and products could be diminished and our business may suffer. Our precautions may not prevent misappropriation of our intellectual property, including reverse engineering of technology, particularly in foreign countries where laws or law enforcement practices may not protect our proprietary rights as fully as in the United States. Any legal action that we may bring to protect our brands and other intellectual property could be unsuccessful and expensive and could divert management’s attention from other business concerns. In addition, legal standards relating to the validity, enforceability and scope of protection of intellectual property, especially in Internet-related businesses, are uncertain and evolving. These evolving legal standards may not sufficiently protect our intellectual property rights in the future.
23
We may be subject to intellectual property rights claims.
Third parties may make claims against us alleging infringement of their intellectual property rights. Any intellectual property claims, regardless of merit, could be time-consuming and expensive to litigate or settle and could significantly divert management’s attention from other business concerns. In addition, if we were unable to successfully defend against such claims, we may have to pay damages, stop selling the service or product or stop using the software, technology or content found to be in violation of a third party’s rights, seek a license for the infringing service, product, software, technology or content or develop alternative non-infringing services, products, software, technology or content. If we cannot license on reasonable terms, develop alternatives or stop using the service, product, software, technology or content for any infringing aspects of our business, we may be forced to limit our service and product offerings. Any of these results could reduce our revenues or our ability to compete effectively, increase our costs or harm our business.
28
Risks Related to Our International Operations, Litigation, Laws and Regulations
Our international operations expose us to regulatory, economic, political, social and intellectual property risks in the countries in which we operate.operate, which risks may be exacerbated as a result of war and terrorism.
The international nature of our operations involves a number of risks, including changes in U.S. and foreign regulations, tariffs, taxes and exchange controls; economic downturns; inflation, rising interest rates and political and social instability in the countries in which we operate; changes in exchange rates; weakening or loss of the protection of intellectual property rights in some countries and limitations on our ability to enforce our intellectual property rights under some local laws; and our dependence on foreign personnel. For example, during the second quarterongoing war in Ukraine has had a broad range of fiscal 2016,adverse impacts on global economic conditions, including consumer confidence and sentiment in certain markets, some of which have had and are likely to continue to have adverse impacts on our business. These include reductions in consumer discretionary spending in certain markets. If the United Kingdom voted by referendum to exit the European Union (the “EU”), commonly referred to as “Brexit.” On January 31, 2020, the United Kingdom ceased to be part of the EU and the transition period ended on December 31, 2020. The EU and the UK agreed to an EU-UK Trade and Cooperation Agreement (“TCA”) that governs the trading relationship between the UK and the member states of the EU from January 1, 2021. Broadly, the TCA provides for zero tariffs and zero quotas on all goods that comply with the appropriate rules of origin, but is subject to both parties maintaining a level playing field in areas such as environmental protection, social and labor rights, investment, competition, state aid, and tax transparency. Brexit has andwar continues to create general economic uncertainty innegatively impact consumer discretionary spending and sentiment towards the UKweight loss and EU. The effects of Brexit couldwellness marketplace, it may have an adverse impacteffect on our business, results of operations and financial condition, and/or cash flows, particularly with respect to our United Kingdom reportable segment.condition.
A number of foreign laws and regulations govern the business of advertising, promoting, dispensing, and marketing services and products, including generic and branded pharmaceuticals. These regulatory regimes are overseen by governmental bodies. Foreign regulations may also restrict our ability to operate in some countries, including providing our Clinical offering consistent with our U.S. business model or at all, acquire new businesses, recur bill our customers or repatriate cash from foreign subsidiaries back to the United States. If we expand our operations into additional foreign countries, we may be subject to additional risks, including the ability to successfully adapt to local culture and navigate regulatory, economic, political, social and intellectual property risks. We also may face limited brand recognition in certain parts of the world that could lead to non-acceptance or delayed acceptance of our products and services by consumers in new markets. We cannot be certain that we will be able to enter and successfully compete in additional foreign markets or that we will be able to continue to compete in the foreign markets in which we currently operate.
We are exposed to foreign currency risks from our international operations that could adversely affect our financial results.
A significant portion of our revenues and operating costs are denominated in foreign currencies. We are therefore exposed to fluctuations in the exchange rates between the U.S. dollar and the currencies in which our foreign operations receive revenues and pay expenses. We do not currently hedge, and have not historically hedged, our exposure to foreign currency fluctuations.Our consolidated financial results are presented in U.S. dollars and therefore, during times of a strengthening U.S. dollar, our reported international revenues and earnings will be reduced because the local currency will translate into fewer U.S. dollars. In addition, the assets and liabilities of our non-U.S. subsidiaries are translated into U.S. dollars at the exchange rates in effect at the balance sheet date. Revenues and expenses are translated into U.S. dollars at the average exchange rate for the period. Translation adjustments arising from the use of differing exchange rates from period to period are recorded in shareholders’ equity as accumulated other comprehensive income (loss). Translation adjustments arising from intercompany receivables and payables with our foreign subsidiaries are generally recorded as a component of other expense (income). Accordingly, changes in currency exchange rates will cause our revenues, operating costs, net income and shareholders’ equity to fluctuate. For example, these changes had a positive impact on our fiscal 2023 financial results, increasing our revenues for fiscal 2023 by $0.7 million.
2429
Outcomes of litigation or regulatory actions could adversely impact our financial condition.
From time to time, we may be a party to lawsuits and regulatory actions relating to our business operations. Due to the inherent uncertainties of legal actions and regulatory proceedings, we cannot predict their outcomes with certainty. Therefore, it is possible that our results of operations, financial condition or cash flows could be adversely affected by the unfavorable resolution of one or more legal or regulatory actions. For example, the previously disclosed adverse UK tax ruling relating to our self-employment model in the United Kingdom resulted in an aggregate adverse charge of approximately $37.0 million in fiscal 2009. As we build our Clinical business and further expand our wellness offerings,into the telehealth space, consumers may misconstrue our programnon-Clinical businesses as providing medical advice. As we clearly state in our consumer communications, most of our coaches and guides do not have extensive training or certification in nutrition, diet or health fields beyond the training they receive from us. Despite our disclaimers, as more customers come to us seeking a healthy lifestyle,to improve their weight health, they may misperceive that our coaches and guides are providing medical advice.We may also be subject to claims that our coaches and guides have provided inappropriate advice or have inappropriately referred or failed to refer customers to health carehealthcare providers when needed. Member access to clinicians and other care team providers through WeightWatchers Clinic may expose us to other types of claims and litigation or regulatory actions. For additional information regarding these types of claims or actions, see “—Risks Related to Our Acquisition of Weekend Health, Inc. (d/b/a Sequence)”. Regardless of the outcome of any legal action or regulatory proceeding, such actions and proceedings could result in substantial costs and may require that our management devote substantial time and resources to defend us.
Our business is subject to legislative and regulatory restrictions.
A number of laws and regulations govern our advertising and marketing, services, products, operations and relations with consumers, licensees, franchisees, coaches, guides, employees and government authorities in the countries in which we operate.
Certain federal, state and foreign agencies, such as the FTC and FDA, regulate and enforce such laws and regulations relating to advertising and marketing, promotions, packaging, labeling, privacy, consumer pricing and billing arrangements, and other consumer protection matters. A determination by a federal, state or foreign agency, or a court in connection with a governmental enforcement action or private litigation, that any of our practices do not meet existing or new laws or regulations could result in liability, adverse publicity, and restrictions on our business operations. For example, during the mid-1990s, the FTC filed complaints against a number of commercial weight management providers alleging violations of federal law in connection with the use of advertisements that featured testimonials, claims for program success and program costs. In 1997, we entered into a consent order with the FTC settling all contested issues raised in the complaint filed against us. The consent order required us to comply with certain procedures and disclosures in connection with our advertisements of services and products and expired by its terms in 2017. Subsequent to our 2018 acquisition of Kurbo, we became subject to additional obligations under the Children’s Online Privacy Protection Act (COPPA) and other applicable laws and regulations enforced by the FTC and other agencies. In February 2022, the FTC filed a complaint and proposed settlement order to resolve allegations that Kurbo violated COPPA. For additional information, see Note 16 of our audited consolidated financial statements, contained in Part IV, Item 15 of this Annual Report on Form 10-K.
We are subject to many distinct employment, labor, commercial, benefits and tax laws and regulations in each country in which we operate, including regulations affecting our employment and wage and hour practices and our relations with our employees, coaches and guides. If we are required to comply with new laws or regulations or interpretations of existing laws and regulations that differ from our interpretations, are unable to comply with these laws, regulations or interpretations, or are subject to litigation with respect to these laws, regulations or interpretations, our business and results of operations could be adversely affected.
Laws and regulations directly applicable to communications, operations (including the use and treatment of personal data) or commerce over the Internet, such as those governing consumer protection, intellectual property, privacy and taxation, continue to evolve. Recent examples include the enactment of the GDPR, the CCPA and the CCPA.CPRA. If we are required to comply with new laws or regulations or interpretations of existing laws or regulations that differ from our interpretations, or if we are unable to comply with these laws, regulations or interpretations, our business and results of operations could be adversely affected.
Future laws or regulations, including laws or regulations affecting our advertising and marketing practices, consumer pricing and billing arrangements, use and treatment of personal data, relations with consumers, employees, coaches, guides, brand ambassadors, spokespersons, social media influencers, licensees or franchisees, or our services and products, may have an adverse impact on us.
25For additional information regarding the legislative and regulatory restrictions applicable to our Clinical business, see “—Risks Related to Our Acquisition of Weekend Health, Inc. (d/b/a Sequence)”.
30
Risks Related to Our Acquisition of Weekend Health, Inc. (d/b/a Sequence)
The Acquisition may not achieve its intended results.
On April 10, 2023, we completed our previously announced acquisition of Sequence (the “ Acquisition”), with the expectation that the Acquisition would result in various benefits, including, among other things, revenue synergies with our existing business and operating efficiencies. Achieving the anticipated benefits of the Acquisition is subject to a number of uncertainties, including whether our business and the Sequence business are integrated in an efficient and effective manner. Failure to achieve these anticipated benefits could result in increased costs, decreases in the amount of expected revenues generated by the combined company and diversion of management’s attention and energy away from ongoing business concerns, any of which could have a material adverse effect on our business, financial results and prospects.
Additional risks relating to integration of Sequence into our business, include, among others, the following:
These potential difficulties, some of which are outside of our control, could adversely affect our ability to achieve the anticipated benefits of the Acquisition. In addition, the market price of our common stock may decline if our assumptions regarding the anticipated benefits of the Acquisition are not accurate or we do not achieve the anticipated benefits of the Acquisition as rapidly or to the extent anticipated by financial or industry analysts or at all.
The Acquisition may not be accretive, and may continue to be dilutive, to our earnings per share, which may negatively affect the market price of shares of our common stock.
The Acquisition has been dilutive to our earnings per share, largely driven by the costs associated with the Acquisition itself. In the long term, the Acquisition may be less accretive than expected, or may continue to be dilutive, to our earnings per share. Estimates of our earnings per share in the future are based on assumptions that may materially change. In addition, future events and conditions could decrease or delay the accretion that is currently projected or could result in further dilution, including adverse changes in market conditions, additional transaction and integration-related costs and other factors such as the failure to realize some or all of the anticipated benefits of the Acquisition. Any dilution of, decrease in or delay of any accretion to, our earnings per share could cause the price of shares of our common stock to decline or grow at a reduced rate.
31
We have limited experience in the telehealth industry, which may hinder our ability to achieve the anticipated benefits of the Acquisition.
Due to the fact that the healthcare industry is highly regulated, we are required to adhere to new laws and regulations, including those related to telehealth, pharmacy, the corporate practice of medicine, health and consumer privacy, false claims, and the prescribing, distributing, and marketing of pharmaceutical products. We have limited experience operating a telehealth business and expect to rely in large part on the existing management of Sequence to continue to manage the Sequence business. The management teams will work together to comply with applicable laws and regulations and stay abreast of the frequent legislative and regulatory changes specific to telehealth.
In addition, the telehealth industry has incumbent and established competitors with substantial market share and new competitors will likely enter the market in the future. These companies may have greater financial, marketing and other resources than we have and may have existing cost and operational advantages that we lack. Our limited experience in this industry could negatively affect our ability to appeal to potential customers in the market, including our existing customers, develop expertise and new technologies, attract talent, manage risks, and compete with larger and more experienced competitors.
If we fail to retain the existing management of Sequence, or we fail to successfully compete in the telehealth industry, our ability to realize the anticipated benefits of the Acquisition may be adversely affected.
Notwithstanding the due diligence investigation that we performed in connection with our entry into the Merger Agreement, Sequence may have liabilities, losses, or other exposures for which we do not have adequate insurance coverage, indemnification, or other protection.
While we performed due diligence on Sequence prior to our entry into the Merger Agreement, we are dependent on the accuracy and completeness of statements and disclosures made or actions taken by Sequence and its representatives during due diligence and during our evaluation of the results of such due diligence. We did not control Sequence and may be unaware of certain activities of Sequence before the completion of the Acquisition, including intellectual property and other litigation claims or disputes, information security vulnerabilities, violations of laws, policies, rules and regulations, commercial disputes, tax liabilities and other known and unknown liabilities.
Following the consummation of the Acquisition, the liabilities of Sequence, including contingent liabilities, were consolidated with the Company’s. If Sequence’s liabilities are greater than expected, or if Sequence has obligations of which we are not aware, our business could be materially and adversely affected. We do not have indemnification rights from the prior owners of Sequence and instead rely on a limited amount of representation and warranty insurance. Such insurance is subject to exclusions, policy limits and certain other customary terms and conditions. Sequence may also have other unknown liabilities. If we are responsible for liabilities not covered by insurance, we could suffer severe consequences that could have a material adverse effect on our financial condition and results of operations.
We, the PCs and the Affiliated Professionals are subject to extensive and complex healthcare laws and regulations. If we, the PCs or the Affiliated Professionals fail to comply with existing or new laws or regulations that apply to us, we or they could suffer civil or criminal penalties or be subject to other enforcement actions.
The healthcare industry and services provided via telehealth are highly regulated. Following the consummation of the Acquisition, various aspects of our operations are subject to federal, state or local laws, rules and regulations, any of which may change from time to time. Regulatory oversight includes, but is not limited to, considerations of corporate practice of medicine, licensure and scope of practice limitations for physicians and other healthcare professionals, establishment of a physician-patient relationship, prohibitions on fraud, waste and abuse, including laws prohibiting the submission of false claims, anti-kickback and all-payor fraud laws, restrictions on referrals and self-referrals, advertising and promotional restrictions, privacy protections, including patient information, and complex prior authorization and other requirements. Federal and state laws permit private parties to bring “qui tam” or whistleblower lawsuits on behalf of the federal government against companies for violations of fraud and abuse laws.
Although we and the PCs strive to comply with all applicable laws and regulations, our operations and the operations of the PCs may not be in compliance with certain laws or regulations as they may be interpreted by governmental, judicial, law enforcement or regulatory authorities or their agents. Failure to comply with laws and regulations may subject us, the PCs or the Affiliated Professionals to civil or criminal penalties, licensing or other sanctions, that limit our ability to operate our business or their ability to provide telehealth services.
32
Changes to laws and regulations pose additional risks. The failure to comply with such changes to laws and regulations may subject us, the PCs and/or the Affiliated Professionals to civil or criminal penalties or other sanctions that will limit our ability to operate our business or the ability of the PCs and the Affiliated Professionals to provide telehealth services. Changes to laws or regulations might have the effect of imposing additional costs or rendering invalid or illegal, in whole or in part, certain aspects of the expected agreements between us, the PCs and healthcare professionals. Any or all of the issues above could adversely affect our ability to attract new members or retain existing members, or subject us to governmental or third-party lawsuits, investigations, regulatory fines or other actions or liability, resulting in a material adverse effect to our business, financial condition, cash flows and results of operation.
The healthcare laws and regulations to which we are subject are constantly evolving and may change significantly in the future.
The laws and regulations applicable to our business, to telehealth services, and to the healthcare industry generally are constantly evolving. While we believe that Sequence has structured its agreements and operations in material compliance with applicable healthcare laws and regulations, there can be no assurance that we will be able to successfully address changes in the current regulatory environment. Some of the healthcare laws and regulations that are applicable to us are subject to limited or evolving interpretations, and a review of our business or operations by a governmental, judicial, law enforcement or regulatory authority might result in a determination that could have a material adverse effect on us. Furthermore, the healthcare laws and regulations applicable to us may be amended or interpreted in a manner that could have a material adverse effect on our business.
Recent and frequent legislative and regulatory changes specific to telehealth may present us with additional requirements and compliance costs, with potential operational impacts in certain jurisdictions. Our business could be adversely affected by challenges to our business model or by state actions restricting the ability of the PCs and the Affiliated Professionals to provide or prescribe products and services via telehealth in certain states.
Healthcare professionals who provide professional services to a patient via telehealth must, in most instances, hold a valid license to practice or provide treatment in the state in which the patient is located. Certain states require healthcare professionals providing telehealth services to be physically located in the same state as the patient. If regulations change to restrict healthcare professionals from delivering care through telehealth modalities or such healthcare professionals fail to comply with telehealth laws, including licensure and scope of practice requirements and laws related to prescribing, claims, appropriate medical treatment, and unprofessional conduct, the PCs and the Affiliated Professionals could be subject to civil or criminal penalties, and our financial condition and results of operations may be adversely affected.
Federal and state laws and regulations specific to telehealth vary and may set forth informed consent, modality, medical records, licensing, follow-up care, and other requirements. The ability of the PCs and the Affiliated Professionals to conduct business via telehealth is dependent, in part, upon that particular state’s treatment of remote healthcare and that state medical or other board’s regulation of the practice of medicine and telehealth services, each of which is subject to changing political, regulatory, and other influences. Where new laws and regulations apply to telehealth services, we may incur costs to monitor, evaluate, and modify operational processes for compliance. All such activities may increase our costs and could, in certain circumstances, impact the ability of the PCs and the Affiliated Professionals to make telehealth available in a particular state. Additionally, patients may be reluctant to accept services delivered via telehealth or may not find it preferable to traditional treatment. It is possible that the laws, rules, and regulations governing the practice of telehealth in one or more states may change or be interpreted in a manner unfavorable to our business. If adverse laws or regulations are adopted, if patients prove unwilling to adopt the telehealth services offered by the PCs and the Affiliated Professionals as rapidly or in the numbers that we anticipate, or if any claims challenging the provision of services via telehealth are successful, and we were unable to adapt our business model accordingly, our operations in such states would be disrupted or negatively impacted, which could have a material adverse effect on our business, financial condition, cash flows and results of operations.
We may also be subject to changes in laws, regulations, and enforcement trends governing the marketing and prescribing of pharmaceutical products. Such products are subject to regulation by the FDA, FTC, and other governmental agencies, and over time, the regulatory landscape for pharmaceutical products approved for weight management may become more complex with increasingly strict requirements. To the extent federal or other requirements regarding safety, prescribing, and claims change in the future, such changes could result in increased costs, recalls, increased cancelations of member subscriptions, decreased interest from potential members or other adverse impacts or additional risks.
33
We may be subject to extensive fraud, waste, and abuse laws that may give rise to federal and state audits and investigations, including actions for false and other improper claims.
The U.S. healthcare industry is heavily regulated and closely scrutinized by federal, state and local governments. Comprehensive statutes and regulations govern our contractual relationships and arrangements with healthcare professionals and vendors, our marketing activities, and other aspects of our operations and the operations of PCs and vendors. Such laws include, without limitation, federal and state anti-kickback, fraud and abuse, and false claims laws, and may authorize the imposition of criminal, civil and administrative penalties for submitting false or fraudulent claims for reimbursement to federal and state healthcare programs.
The federal anti-kickback statute (the “Anti-Kickback Statute”) makes it a criminal offense to knowingly and willingly offer, pay, solicit or receive any remuneration to induce or reward referrals of items, including prescription medications, or services reimbursable by federal healthcare programs. The Anti-Kickback Statute defines “remuneration” to include the transfer of anything of value, in cash or in kind and directly or indirectly. The statute has been interpreted to cover any arrangement where at least one purpose of the arrangement is to obtain remuneration for the referral of services or to induce the purchase, lease, order, recommendation or arrangement of items or services reimbursable under a federal healthcare program. A person or entity does not need to have actual knowledge of the statute or specific intent to violate it in order to have committed a violation. Many states have similar anti-kickback and consumer protection laws, and in some cases these laws have expanded to apply to commercial insurers. If any governmental, judicial, law enforcement or regulatory authority determines that we are not in compliance with any such laws, any such authority could bring an action against us and/or our supported offices for violations of such laws, which could have a material adverse effect on our business.
The Federal Civil False Claims Act (the “FCA”) prohibits the knowing submission of any false or fraudulent claim for payment to the federal government or to its agents or contractors or any recipient if the federal government provides any payment for the claim. The FCA also prohibits knowingly presenting, or causing to be presented, false claims to government health care programs, including Medicare, Medicaid, TRICARE, and the Federal Employees Health Benefits Program. It also prohibits the use of any false record or statement material to a claim made in order to have a false or fraudulent claim paid in whole or in part by the federal government. It further prohibits the knowing concealment or improper avoidance of an obligation to pay money or property to the federal government. The FCA requires no proof of specific intent to defraud to create liability. In addition, a violation of the Anti-Kickback Statute can result in liability under the FCA. Actions under the FCA may be brought by the Attorney General, the United States Department of Justice (the “DOJ”), the United States Attorney Offices, or as a qui tam action by a private individual in the name of the government. These private parties, often referred to as relators, are entitled to share in any amounts recovered by the government through trial or settlement. These “qui tam” cases are sealed by the court at the time of filing. The only parties privy to the information contained in the complaint are the relator, the federal government and the presiding court. It is possible that “qui tam” lawsuits will be filed against us and that we will be unaware of such filings. Violations of the FCA can result in significant monetary penalties. The federal government continues to use the FCA, and the accompanying threat of significant liability, in its investigations and prosecutions of telehealth companies and healthcare professionals that provide telehealth services. The government has obtained multi-million and multi-billion dollar settlements under the FCA in addition to individual criminal convictions under applicable criminal statutes. Given the significant size of actual and potential settlements, it is expected that the federal government will continue to devote substantial resources to investigating telehealth companies and healthcare professionals that provide telehealth services for compliance with the FCA and other applicable fraud and abuse laws. Collateral consequences of a violation of the FCA include administrative penalties and the imposition of settlement, monitoring, integrity or other agreements. Many states have similar FCA laws to which we may be subject. A determination that we have violated these laws could have a material adverse effect on our business.
HIPAA also created new federal criminal statutes that prohibit among other actions, knowingly and willfully executing, or attempting to execute, a scheme to defraud any healthcare benefit program, including private third-party payors, knowingly and willfully embezzling or stealing from a healthcare benefit program, willfully obstructing a criminal investigation of a healthcare offense, and knowingly and willfully falsifying, concealing or covering up a material fact or making any materially false, fictitious or fraudulent statement in connection with the delivery of or payment for healthcare benefits, items or services. Similar to the Anti-Kickback Statute, a person or entity does not need to have actual knowledge of the statute or specific intent to violate it in order to have committed a violation.
34
In addition, federal healthcare laws prohibit the offer or transfer to a federal healthcare program beneficiary, of any remuneration, including free services, and waivers of beneficiary cost sharing that the offeror knows or should know is likely to influence the beneficiary’s selection of a particular provider, practitioner or supplier of federal healthcare program items or services unless there has been a good faith determination of the beneficiary’s financial need. Violations may result in the imposition of civil monetary penalties. Moreover, the routine waivers of copayments and deductibles offered to patients covered by commercial payors may also implicate applicable state laws related to, among other things, unlawful schemes to defraud, insurance fraud, excessive fees for services, tortious interference with patient contracts and statutory or common law fraud. If arrangements are found to be inconsistent with applicable federal and state fraud, waste and abuse, state advertising, insurance or other applicable laws, we may be required to restructure or discontinue certain programs, or be subject to other significant penalties, enforcement actions or investigations, which could have a material adverse effect on our business.
To enforce compliance with the federal laws such as the FCA, the Office of the Inspector General of the HHS (the “OIG”) and the DOJ recently have increased their scrutiny of interactions between healthcare companies and healthcare professionals, which has resulted in investigations, prosecutions, convictions and settlements in the healthcare industry. Other government regulators, such as state boards of medicine, and third-party payors may also investigate or take enforcement actions or subject certain medical and prescribing practices, claims, and medical records to increased scrutiny. Dealing with investigations can be time and resource consuming and can divert management’s attention from the business. Any such future investigation or settlement could increase our costs or otherwise have an adverse effect on our business.
Additionally, federal and state government agencies, including state boards of medicine and pharmacy and departments of public health, as well as commercial payors, have increased their auditing and administrative, civil and criminal enforcement efforts as part of an effort to identify and to stem healthcare fraud and abuse and to address complaints or allegations involving PCs and Affiliated Professionals. These audits and investigations relate to a wide variety of topics, including but not limited to the following: ordering and referral practices, technical compliance with coverage and payment rules, the offering of prohibited remuneration, providing inappropriate medical treatment, submitting false insurance claims, prescribing medications outside the scope of FDA-approved labeling, engaging in unprofessional conduct or other activities, patient privacy and data security rules and financial reporting. In addition, the OIG and the DOJ have, from time to time, undertaken national enforcement initiatives that focus on specific practices or other suspected areas of abuse. For example, the OIG announced a special fraud alert informing healthcare professionals that they should exercise caution when entering into arrangements with certain telemedicine companies. Federal and state governments also are authorized to impose criminal, civil and administrative penalties on any person or entity that files a false claim for payment for items or services reimbursed under a federal or state healthcare program. While the criminal statutes are generally reserved for instances of fraudulent intent, the federal government is applying its enforcement powers in an ever-expanding range of circumstances. If we or any of the PCs or Affiliated Professionals are found to be in violation of federal or state laws or regulations, we and they could be forced to discontinue the violative practice and may be subject to actions, fines and criminal penalties, which could have a material adverse effect on our business.
Similar to federal and state governmental agencies, commercial payors have increased their auditing and recovery efforts. Claims filed with private insurers can lead to criminal and civil penalties, including, but not limited to, penalties relating to violations of federal mail and wire fraud statutes, as well as penalties under the healthcare fraud provisions of HIPAA.
35
Risks Related to Ownership of Our Common Stock
Artal has significant influence over us and may have conflicts of interest with us or the holders of our common stock.
Artal owns approximately 21%of our outstanding common stock and has the ability to exercise significant influence over the election and removal of our directors and our corporate and management policies, including potential mergers or acquisitions, payment of dividends, asset sales, the amendment of our articles of incorporation or bylaws and other significant corporate transactions. This concentration of our ownership may delay or deter possible changes in control of our company, which may reduce the value of an investment in our common stock. So long as Artal owns 10% or more of our common stock, Artal will have the right pursuant to an agreement with us to nominate directors to our Board of Directors in proportion to its stock ownership. The interests of Artal may not coincide with our interests or the interests of other holders of our common stock.
If our existing large shareholders sell a substantial amount of shares of our common stock, the market price of our common stock could decline.
The sale of substantial amounts of shares of our common stock by existing large shareholders, or the perception that such sales could occur, including sales by Artal or Ms. Winfrey, could harm the prevailing market price of shares of our common stock. In fiscal 2018, Artal sold 14,625,000shares of our common stock and Ms. Winfrey sold 2,359,702 shares of our common stock (including shares transferred by Ms. Winfrey as a gift to The Oprah Winfrey Charitable Foundation that were subsequently sold by such foundation).Sales such as these, and the possibility that additional sales may occur in the future, also might make it more difficult for us to sell equity securities in the future at a time and at a price that we deem appropriate. Substantially all of our outstanding shares of common stock are freely tradable without restriction or further registration under the Securities Act, except that any shares held by our affiliates, as that term is defined under Rule 144 of the Securities Act and including Artal and Ms. Winfrey, may be sold only in compliance with certain limitations applicable to affiliates.
Our articles of incorporation and bylaws and Virginia corporate law contain provisions that may discourage a takeover attempt.
Provisions contained in our articles of incorporation and bylaws and the laws of Virginia, the state in which we are incorporated, could make it more difficult for a third party to acquire us, even if doing so might be beneficial to our shareholders. Provisions of our articles of incorporation and bylaws impose various procedural and other requirements, which could make it more difficult for shareholders to effect certain corporate actions. For example, our articles of incorporation authorize our Board of Directors to determine the rights, preferences, privileges and restrictions of unissued series of preferred stock, without any vote or action by our shareholders. Thus, our Board of Directors can authorize and issue shares of preferred stock with voting or conversion rights that could adversely affect the voting or other rights of holders of our common stock. These rights may have the effect of delaying or deterring a change of control of our company. In addition, a change of control of our company may be delayed or deterred as a result of our having three classes of directors. These provisions could limit the price that certain investors might be willing to pay in the future for shares of our common stock.
36
Item 1B. Unresolved Staff Comments
26None.
Item 1C. Cybersecurity
In the ordinary course of business, we provide proprietary content and we collect, store and use confidential information (including, but not limited to, personal customer information and data) in connection with providing our products and engaging our employees and contractors. We have developed systems and processes designed to protect such content and information and we maintain cybersecurity insurance coverage. Our Board of Directors (the “Board”) and management recognize the critical importance of protecting the confidentiality and integrity of such information and data and maintaining the trust and confidence of our members, business partners, employees, contractors and shareholders, as well as complying with applicable regulatory requirements and contractual obligations.
The Board and its committees actively oversee the Company’s risk management program. Cybersecurity threats and related risks are an important component of the Company’s overall approach to enterprise risk management (“ERM”). We annually examine our cybersecurity program with third parties, evaluating its effectiveness in part by considering industry standards and established frameworks, such as the National Institute of Standards and Technology (NIST), as guidelines. Cybersecurity risk management is a Company-wide initiative. In general, the Company seeks to address cybersecurity risks through a comprehensive, multi-disciplinary approach that is focused on preserving the confidentiality, security, and availability of the information that the Company collects and stores by identifying, preventing, and mitigating cybersecurity threats and effectively responding to cybersecurity incidents when they occur.
Risk Management and Strategy
As one of the elements of the Company’s overall ERM program, the Company’s cybersecurity program includes the following key areas:
37 The Company engages in the regular evaluations of the Company’s policies, standards, processes, and practices that are designed to address cybersecurity threats and incidents. These efforts include a wide range of activities, including tabletop exercises and vulnerability testing, focused on evaluating the effectiveness of our cybersecurity measures and planning. The Company regularly engages third parties to perform assessments on certain of our cybersecurity measures, including audits and penetration testing. For example, we annually engage qualified third-party auditors to independently assess and attest to and/or provide certifications of compliance with the HIPAA Security and Privacy Rule, SOC2 Type 2, the Payment Card Industry Data Security Standard (PCI-DSS), and UK CyberEssentials. The results of such assessments, audits and reviews are presented to the Audit Committee and members of the Board, as appropriate, and the Company adjusts its cybersecurity policies, standards, processes, and practices as necessary based on such assessments, audits and reviews. Governance The Board, in coordination with the Audit Committee, oversees the Company’s ERM process. The Audit Committee oversees our cybersecurity program, as well as the steps management has taken to monitor and control cybersecurity threats and related risks. This oversight includes receiving reports on the regular assessments of the Company’s disclosure controls and procedures to ensure that current practices account for material cybersecurity risks facing the Company. The Audit Committee receives presentations on the cybersecurity program and related risks on at least a quarterly basis. These presentations address a wide range of topics including recent developments, evolving standards, vulnerability assessments, third-party and independent reviews, the threat environment, technological trends, and information security considerations arising with respect to the Company’s peers and third parties. The Audit Committee, and the full Board as necessary, also receive prompt and timely information regarding any cybersecurity incident that meets recognized established reporting thresholds, as well as ongoing updates regarding any such incident until it has been addressed. The Audit Committee routinely meets with our Chief Technology Officer (“CTO”) and CISO as well as outside experts as appropriate to assess cybersecurity risks and to evaluate the status of the Company’s cybersecurity efforts, which include a broad range of tools and training initiatives that work together to protect the data and systems used in our businesses. Our cybersecurity management team includes our CISO and Director of Security Operations, Data Privacy Officer, CTO, Chief Financial Officer, General Counsel, and Head of Internal Audit. The CISO, in coordination with the team, works collaboratively across the Company to implement a program designed to protect the Company’s information systems from cybersecurity threats and to promptly respond to any cybersecurity incidents in accordance with the Company’s incident response and recovery plans. The cybersecurity management team meets regularly to review cybersecurity and data privacy strategy, receive updates, and consider the Company’s current risk posture. The team meetings also build leadership consensus on cybersecurity risk management and tolerance. In the event they become aware of a cybersecurity threat or incident, employees are expected to follow established lines of communication to notify the relevant members of the cybersecurity management team and allow the relevant team members to coordinate the evaluation and response to such threats and incidents as necessary. To facilitate the Company’s cybersecurity risk management program, multidisciplinary teams throughout the Company are deployed to address cybersecurity threats and to respond to cybersecurity incidents. Through ongoing communications with these teams, the CISO and the rest of the cybersecurity management team monitor the prevention, detection, mitigation and remediation of cybersecurity threats and incidents in real time and report such threats and incidents to other members of senior management and the Audit Committee when appropriate. Such plans also dictate notification responses to Company management based on the severity of the incident. The CISO and Director of Security Operations has worked in the information security field for over 15 years and holds an undergraduate degree in computer systems management and master’s degrees in both cybersecurity and technology management. He has also attained multiple cybersecurity-related professional certifications and licenses, including Certified Information Systems Security Professional, and is an adjunct professor of cybersecurity at New York University and Fordham University. The CTO holds a master’s degree in microengineering and has served in various leadership roles in computer engineering for more than 20 years. 38 While we have experienced cybersecurity incidents in the past, we are not aware of any cybersecurity incidents that have materially affected or are reasonably likely to materially affect the Company, including its business strategy, results of operations, financial condition, cash flows or reputation. However, cybersecurity threats and/or incidents could have a material effect on the Company. While we maintain cybersecurity insurance, the costs related to cybersecurity threats or disruptions may not be fully insured. For additional information regarding the cybersecurity risks we face, see “Item 1A. Risk Factors— Risks Related to Technology, Security and Intellectual Property” of this Annual Report on Form 10-K. Item 2. Properties |
|
None.
|
|
We are currently headquartered in New York, New York in a leased office space, with additional corporate, customer support, technology and certain other operations located in leased or co-working office spaces elsewhere in the United States and Canada. Each of our foreign country operations generally also has leased or sharedco-working office space to support its operations. Our in-person workshops are typically held in third-party locations (usually on flexible month to month arrangements) or in space leased in retail centers or in third-party locations (usually meeting rooms in well-located hotels).centers.
Item 3. Legal Proceedings |
|
The information called for by this item is incorporated herein by reference to the legal proceedings disclosure under Note 16 “Commitments and Contingencies” of the notes to the audited consolidated financial statements contained in this Annual Report on Form 10-K.
Item 4. Mine Safety Disclosures
|
|
Not applicable.
2739
INFORMATION ABOUT OUR EXECUTIVE OFFICERS AND DIRECTORS
Pursuant to General Instruction G(3) to Form 10-K, certain of the information regarding our directors and executive officers required by Items 401(a), (b) and (e) of Regulation S-K is hereby included in Part I of this Annual Report on Form 10-K.
Set forth below are the names, ages as of January 1, 2022December 30, 2023 and current positions of our executive officers and directors. Directors are elected at the annual meeting of shareholders.Executive officers are appointed by, and hold office at, the discretion of our Board of Directors.
Name | Age | Position | ||
|
|
| ||
|
| Chief Financial Officer | ||
|
| Chief | ||
|
|
| ||
|
|
| ||
|
| Chairman of the Board of Directors | ||
Steven M. Altschuler, M.D. |
| Director | ||
Julie Bornstein(2) |
| Director | ||
|
| Director | ||
| 49 | Director | ||
Denis F. Kelly |
| Director | ||
Julie Rice |
|
| ||
|
|
| ||
|
|
| ||
|
|
|
(1) |
|
|
|
|
| Director | ||
William H. Shrank, M.D. | 52 | Director | ||
Oprah Winfrey | 69 | Director |
Mindy Grossman.Sima Sistani. Ms. GrossmanSistani has served as a director and our President and Chief Executive Officer since July 2017. Prior to joining us,March 2022. Until February 2022, she worked at Epic Games, Inc., a video game and software developer and publisher, where she served as Chief Executive Officer of HSN, Inc., an interactive, multichannel retailerHouseparty, a face-to-face synchronous social network, and also was the senior executive leading social gameplay and feature development for Epic’s gaming products, including Fortnite. Prior to Epic’s acquisition of fashion, householdHouseparty in June 2019, Ms. Sistani was the Chief Executive Officer at Houseparty and lifestyle products, and a member ofserved on its Board of Directors, having been one of its original co-founders prior to its February 2016 launch. She previously led mobile growth operations at Yahoo! Inc., a technology company, from August 2008November 2011 to May 2017. Prior to joining HSN,2015, and from the time Yahoo! acquired Tumblr she served as Chief Executive OfficerTumblr’s first Head of IAC Retailing,Media. Prior to that time, Ms. Sistani held positions at Goldman Sachs and Creative Artists Agency. Ms. Sistani received a business segmentB.A. from Duke University and an M.B.A. from the Kellogg School of HSN’s former parent company, IAC/InterActiveCorp, a media and Internet company, from April 2006 to August 2008, and Global Vice President of Nike, Inc.’s apparel business from October 2000 to March 2006. Earlier in her career,Management at Northwestern University. Ms. Grossman held various other executive positions in the retail industry, including President and CEO of Polo Jeans Company, Vice President of New Business Development at Polo Ralph Lauren Corporation, President of Chaps Ralph Lauren, and Senior Vice President of Menswear for Warnaco, Inc. Ms. GrossmanSistani is a director of Fanatics, Inc. and was previously a director of Bloomin’ Brands, Inc. She also serves as a director of UNICEF USA and Vault Health,Best Buy Co., Inc.
28
Amy O’Keefe. 40
Heather Stark.Ms. O’KeefeStark has served as our Chief Financial Officer since October 2020.May 2023. Ms. Stark previously served as our Interim Principal Financial Officer from December 2022 to May 2023 and Head of Finance, North America from April 2022 to December 2022. Prior to that time, she served as Vice President Finance & Commercial Development from July 2018 to April 2022, Vice President Finance from May 2015 to July 2018 and Director Finance from December 2010 to May 2015, all for our Canadian business. Prior to joining us, Ms. O’KeefeStark was with Bacardi Limited, the world’s largest privately held spirits business, where she served as Chief Financial OfficerController of Drive DeVilbiss Healthcare Limited, a global manufacturer and distributor of medical products,the Canadian business from March 2017September 2005 to June 2020.November 2010. She also previously served as Chief Financial Officerthe Corporate Controller of Savant Systems, LLC, a global designer and developer of home automation and control systems, from April 2015 to December 2016, and Chief Financial Officer of D&M HoldingsOpta Minerals Inc., a global designerCanadian publicly traded processor, distributor and manufacturerseller of audio products,industrial minerals, from January 20112004 to July 2014. Prior to that time,2005. Ms. O’Keefe held several corporate finance positions with The Black & Decker Corporation, including as Divisional Chief Financial Officer for certain divisions, andStark was a certified public accountantChartered Accountant for Ernst & Young LLP.PricewaterhouseCoopers LLP from 1999 through 2004. Ms. O’Keefe received a B.B.A. in Accounting from Loyola College.
Nicholas P. Hotchkin.Mr. Hotchkin has served as our Chief Operating Officer since October 2020. In addition to serving as our Chief Financial Officer from August 2012 to September 2020, he served as our Operating Officer, North America from March 2019 to September 2020 and our President, Emerging Markets from March 2018 to September 2020. He also served as a member of our former Interim Office of the Chief Executive Officer from September 2016 to July 2017. Prior to joining us, Mr. Hotchkin had spent several years at Staples, Inc., a global leader in the office supply industry. Most recently, Mr. Hotchkin served as Senior Vice President of Finance for the U.S. Retail division of Staples based in Massachusetts, a position he held from May 2010 to August 2012. Before assuming that position, he had been Senior Vice President of Finance and Treasurer of Staples, a position he held from November 2006 to April 2010. Prior to joining Staples, Mr. Hotchkin held several corporate finance positions with Delphi Corporation and General Motors Corporation including assignments in the United States, Asia and Europe. Mr. HotchkinStark received a B.A. in Economics from Harvard College and an M.B.A.Canadian Studies from the Harvard Business School.
Michael F. Colosi.Mr. Colosi has served as our General Counsel and Secretary since May 2014. Prior to joining us, Mr. Colosi most recently served as Senior Vice President, General Counsel and Corporate Secretary of Kenneth Cole Productions, Inc. (KCP), a multi-brand retail, wholesale and licensing company, from March 2007 to February 2014. His service as General Counsel and Secretary of KCP commenced in July 2000 and July 2004, respectively. He also served as Corporate Vice President of KCP from July 2000 to February 2007. Prior to joining KCP, Mr. Colosi was Associate General Counsel and Assistant Secretary for The Warnaco Group, Inc., an international apparel company, from 1996 to 2000. Mr. Colosi received a B.A. in Economics and English from Cornell University and a J.D. from The University of Michigan Law School.Toronto and her Chartered Accountant and Chartered Professional Accountant designation from CPA Ontario.
Michael Lysaght. Pierre-Olivier Latour.Mr. LysaghtLatour hasserved as our Chief Digital Officer since August 2019. He previously served as our Chief Technology Officer from September 2016 to July 2019,since June 2023, after serving as our Senior Vice PresidentHead of Digital Product Engineering from September 2014April 2023 to September 2016 and as Interim Chief Technology Officer from April 2016 to September 2016.June 2023. Prior to joining us, Mr. Lysaght workedLatour was an Engineering Executive at SecondMarket,Epic Games, Inc. (now Nasdaq Private Market), a platform providing liquidity solutions for privatevideo game and software developer and publisher, having served in several senior engineering management roles from September 2019 to April 2023. Beginning in November 2016, he served as the Chief Technology Officer at Houseparty, a face-to-face synchronous social network, prior to its acquisition by Epic Games in 2019. Previously, Mr. Latour held various engineering leadership positions with mid-stage Silicon Valley startup companies and sold several companies and technologies, including one to Apple in 2003. Mr. Latour received a master’s degree in Microengineering from EPFL (École polytechnique fédérale de Lausanne).
Amanda Tolleson. Ms. Tolleson has served as our Chief Marketing Officer since August 2022. Prior to joining us, Ms. Tolleson served as Chief Customer Officer at Maisonette, a curated baby and kid’s marketplace, from March 20092020 to September 2014, where heAugust 2022. She previously held several roles at Birchbox, a subscription beauty service, most recently serving as Chief Customer Officer from March 2018 to March 2020 and Chief Marketing Officer from March 2016 to March 2018, after joining the company in January 2014. Prior to that, Ms. Tolleson held the role of Vice President of Engineering/Head of Technology. He previously wasseveral positions at various brand and marketing strategy consultancies. Ms. Tolleson received a B.A. in Psychology from Stanford University and an Independent Consultant working for a variety of startups, telecommunication companies and financial institutions. Mr. Lysaght has a B. Sc. in Computer ScienceM.B.A. from University College Cork, Ireland.Harvard Business School.
Raymond Debbane.Thilo Semmelbauer. Mr. Debbane Semmelbauer has been the Chairman of our Board of Directors since our acquisition by Artal Luxembourg in September 1999. Mr. Debbane is a co-founderMay 2023 and the Chief Executive Officer of The Invus Group, LLC. Prior to forming The Invus Group, LLC in 1985, Mr. Debbane was a manager and consultant for The Boston Consulting Group in Paris, France. He holds an M.B.A. from Stanford Graduate School of Business, an M.S. in Food Science and Technology from the University of California, Davis and a B.S. in Agricultural Sciences and Agricultural Engineering from American University of Beirut. Mr. Debbane is the Chairman of the Board of Directors of Lexicon Pharmaceuticals, Inc. He is also the Chief Executive Officer and a director of Artal Group S.A., and the Chairman of the Board of Directors of a number of private companies of which Artal or Invus, L.P. are shareholders. Mr. Debbane was previously a director of Blue Buffalo Pet Products, Inc.
29
Steven M. Altschuler, M.D. Dr. Altschuler has been a director since September 2012. Since May 2018, Dr. Altschuler has served as a Managing Director, Healthcare Ventures, of Ziff Capital Partners, a private investment firm. He previously served as a consultant to the University of Miami Health Care System from September 2017 through December 2017, the Chief Executive Officer of University of Miami Health Care System and Executive Vice President for Healthcare at the University of Miami from January 2016 to September 2017, and the Chief Executive Officer of The Children’s Hospital of Philadelphia (CHOP) from April 2000 until June 2015. Prior to assuming the role of Chief Executive Officer, Dr. Altschuler held several positions at CHOP and the Perelman School of Medicine at the University of Pennsylvania, including Physician-in-Chief/Chair of Pediatrics and chief of the Division of Gastroenterology, Hepatology and Nutrition. Dr. Altschuler received a B.A. in mathematics and an M.D. from Case Western Reserve University. Dr. Altschuler is Chairman of the Board of Directors of 89bio, Inc. and a director of Orchard Therapeutics plc. He previously served as Chair of the Board of Directors of Spark Therapeutics, Inc. and a director of Adtalem Global Education Inc.
Julie Bornstein. Ms. Bornstein has been a director since February 2019. Since February 2018, Ms. Bornstein has served as Chief Executive Officer of The Yes Platform, Inc., an AI-powered online shopping platform she co-founded. From March 2015 to September 2017, Ms. Bornstein served as Chief Operating Officer at Stitch Fix, Inc., an online styling services company. Prior to that, Ms. Bornstein served as Chief Digital Officer at Sephora, a cosmetic retail company and subsidiary of LVMH Moët Hennessy Louis Vuitton SE, from August 2007 to March 2015. Ms. Bornstein received a B.A. in Government from Harvard College and an M.B.A. from Harvard Business School. Ms. Bornstein is a director of Redfin Corporation and Sweetgreen, Inc.
Jennifer Dulski. Ms. Dulski has been a director since February 2020. In April 2020, Ms. Dulski founded and began serving as Chief Executive Officer of Rising Team, a SaaS company that provides tools for leadership and team development. She previously served as Head of Groups & Community for Facebook, Inc., a social networking service, from September 2017 to May 2019 and as President & Chief Operating Officer of Change.org, a social change platform, from January 2013 to June 2017. Until January 2013, Ms. Dulski served as Global Head of Product Management, Shopping & Product Ads at Google Inc., which she joined in 2011 when it acquired The Dealmap, a company she co-founded and for which she served as Chief Executive Officer from 2007 until its acquisition. Prior to that, Ms. Dulski served in multiple roles at Yahoo! Inc. from 1999 until 2007. Ms. Dulski received a B.A. in Psychology and an M.B.A. from Cornell University. She was previously a director of TEGNA Inc. and Social Capital Hedosophia Holdings Corp. V.
Jonas M. Fajgenbaum. Mr. Fajgenbaum has been a director since our acquisition by Artal Luxembourg in September 1999. Mr. Fajgenbaum is a Managing Director of The Invus Group, LLC, which he joined in 1996. Prior to joining The Invus Group, LLC, Mr. Fajgenbaum was a consultant for McKinsey & Company in New York from 1994 to 1996. He graduated with a B.S. in Economics with a concentration in Finance from The Wharton School of the University of Pennsylvania and a B.A. in Economics from the University of Pennsylvania. Mr. Fajgenbaum is a director of a number of private companies of which Artal or Invus, L.P. are shareholders.
Denis F. Kelly. Mr. Kelly has been a director since May 2015. Mr. Kelly is affiliated with, and has served as a Managing Partner of, Scura Partners Securities LLC, a private investment banking firm which he co-founded, since 2001. In addition, Mr. Kelly is a Hearing Officer for National Arbitration and Mediation (NAM), one of the leading dispute resolution institutions in the United States. From 1993 to 2001, he was a Managing Director of Prudential Securities Incorporated. Previously, he served as the President and Chief Executive Officer of Denbrook Capital Corporation, a merchant banking firm, from 1991 to 1993. From 1980 to 1991, Mr. Kelly held various positions at Merrill Lynch, including Managing Director of Mergers and Acquisitions and Managing Director of Merchant Banking. Mr. Kelly began his investment banking career at Lehman Brothers in 1974. Mr. Kelly received a B.A. from Amherst College and an M.B.A. from the Wharton School of Business of the University of Pennsylvania. He was previously a director of MSC Industrial Direct Co., Inc.
Julie Rice. Ms. Rice has been a director since August 2018. Since February 2021, she has served as the Co-Founder and Co-Chief Executive Officer of Peoplehood LLC, a connection and wellness company, and since June 2016, she has served as the Co-Founder of LifeShop LLC, an advising and investing company. From November 2017 to March 2019, Ms. Rice served as a Partner at WeWork, a shared workspace company. After co-founding SoulCycle Inc., a fitness company, in 2006, Ms. Rice served as Co-Chief Executive Officer from 2006 to 2015, Chief Talent and Creative Officer from 2015 to 2016 and a member of the board of directors from 2010 to 2018. Previously, Ms. Rice was a Talent Manager at Handprint Entertainment from 1997 to 2004. Ms. Rice received a B.A. in English and Theater from the State University of New York at Binghamton.
30
Thilo Semmelbauer. Mr. Semmelbauer has been a director since September 2016. He served as a member of our former Interim Office of the Chief Executive Officer from September 2016 to July 2017. Since May 2019, Mr. Semmelbauer has served as Managing Director of Insight Partners, a global private equity and venture capital firm, where he previously served as a Senior Advisor from 2017 to 2019 and a Venture Partner from 2015 to 2017. From 2010 to 2015, he served as President and Chief Operating Officer of Shutterstock, Inc., a global marketplace for licensing images, videos, and music to businesses worldwide. From 2009 to 2010, he served as Executive Vice President, Consumer Business, of TheLadders.com, a career management company. Mr. Semmelbauer was also Weight Watchers International, Inc.’s Global Chief Operating Officer from 2006 to 2008 and Chief Operating Officer for North America from 2004 to 2006, after serving as President and Chief Operating Officer of WeightWatchers.com from 2000 to 2004 where he was part of the founding team. He holds an A.B. in Electrical Engineering and Computer Science from Dartmouth College and a dual M.S. in Management and Electrical Engineering from the Massachusetts Institute of Technology.
Christopher J. Sobecki.Steven M. Altschuler, M.D. Mr. SobeckiDr. Altschuler has been a director since September 2012. Since May 2018, Dr. Altschuler has served as a Managing Director, Healthcare Ventures, of Ziff Capital Partners, a private investment firm. He previously served as a consultant to the University of Miami Health Care System from September 2017 through December 2017, the Chief Executive Officer of University of Miami Health Care System and Executive Vice President for Healthcare at the University of Miami from January 2016 to September 2017, and the Chief Executive Officer of The Children’s Hospital of Philadelphia (CHOP) from April 2000 until June 2015. Prior to assuming the role of Chief Executive Officer, Dr. Altschuler held several positions at CHOP and the Perelman School of Medicine at the University of Pennsylvania, including Physician-in-Chief/Chair of Pediatrics and chief of the Division of Gastroenterology, Hepatology and Nutrition. Dr. Altschuler received a B.A. in mathematics and an M.D. from Case Western Reserve University. Dr. Altschuler is Chairman of the Board of Directors of 89bio, Inc. and Lexeo Therapeutics, Inc. and a director of Orchard Therapeutics plc. He previously served as Chair of the Board of Directors of Spark Therapeutics, Inc. and a director of Adtalem Global Education Inc.
41
Julie Bornstein. Ms. Bornstein has been a director since February 2019. Until January 2023, Ms. Bornstein served as Senior Vice President and Chief Shopping Officer of Pinterest, Inc., a digital visual inspiration platform. Ms. Bornstein joined Pinterest when it acquired The Yes Platform, Inc., an AI-powered online shopping platform she co-founded and for which she served as Chief Executive Officer from February 2018 until its acquisition in June 2022. From March 2015 to September 2017, Ms. Bornstein served as Chief Operating Officer at Stitch Fix, Inc., an online styling services company. Prior to that, Ms. Bornstein served as Chief Digital Officer at Sephora, a cosmetic retail company and subsidiary of LVMH Moët Hennessy Louis Vuitton SE, from August 2007 to March 2015. Ms. Bornstein received a B.A. in Government from Harvard College and an M.B.A. from Harvard Business School. Ms. Bornstein is a director of Redfin Corporation and Sweetgreen, Inc.
Tracey D. Brown. Ms. Brown has been a director since May 2023. Since March 2023, Ms. Brown has served as Executive Vice President and President of Walgreens Retail and U.S. Chief Customer Officer of Walgreens, a portfolio brand of Walgreens Boots Alliance, Inc., an integrated healthcare, pharmacy and retail company, after serving as President Retail Products and Chief Customer Officer of Walgreens from November 2021 to February 2023. From June 2018 to November 2021, Ms. Brown served as Chief Executive Officer of the American Diabetes Association, the largest voluntary health organization in the United States. Previously, Ms. Brown was with Sam’s Club, a membership retail warehouse club and division of Walmart Inc., where she served as Senior Vice President of Operations and Chief Experience Officer from February 2017 to June 2018, Chief Member and Marketing Officer from January 2015 to February 2017, and Vice President from October 2014 to January 2015. Prior to joining Sam’s Club, Ms. Brown held various roles at RAPP Dallas (a part of the Omnicom Group), Direct Impact, Advanced Micro Devices, Peppers & Rogers Group, Dell, American Express, Exxon and Procter & Gamble. Ms. Brown earned a Bachelor of Chemical Engineering from the University of Delaware and an M.B.A. from Columbia Business School. Ms. Brown is a director of YETI Holdings, Inc. and was previously a director of our acquisition by Artal LuxembourgCompany from February 2019 to January 2022.
Tara Comonte. Ms. Comonte has been a director since June 2023. Ms. Comonte served as Chief Executive Officer of TMRW Life Sciences, Inc., a life sciences technology company focused on the in September 1999. He servedvitro fertilization (IVF) sector, from May 2021 to July 2023, and as a member of our former Interim Officeits board of directors from December 2018 to September 2023. She previously worked at Shake Shack Inc., a publicly-traded restaurant chain, as President and Chief Financial Officer from October 2019 to May 2021 and Chief Financial Officer from June 2017. Prior to that, Ms. Comonte was with Getty Images Holdings, Inc., a global digital media company, where she served as Chief Financial & Business Affairs Officer and Executive Vice President from October 2016 to June 2017 and Chief Financial Officer and Senior Vice President from April 2013 to October 2016. She previously served as Chief Financial Officer at McCann Worldgroup, the world's largest marketing communications business, from October 2010 to April 2010. Earlier in her career, she was a founding member and Global Chief Financial Officer & Chief Operating Officer of Mediabrands, part of Interpublic Group, and held various roles at publicly-traded companies and Ernst & Young where she qualified as a Chartered Accountant. Ms. Comonte earned a B.A. in Accounting and Finance from Heriot-Watt University.
Denis F. Kelly. Mr. Kelly has been a director since May 2015. Mr. Kelly is affiliated with, and has served as a Managing Partner of, Scura Partners Securities LLC, a private investment banking firm which he co-founded, since 2001. Mr. Kelly has served as a Senior Advisor to TM Capital Corp., a private investment banking firm, since 2022. In addition, Mr. Kelly is a Hearing Officer for National Arbitration and Mediation (NAM), one of the Chief Executive Officer from September 2016leading dispute resolution institutions in the United States. From 1993 to July 2017. Mr. Sobecki is2001, he was a Managing Director of The Invus Group, LLC, whichPrudential Securities Incorporated. Previously, he joinedserved as the President and Chief Executive Officer of Denbrook Capital Corporation, a merchant banking firm, from 1991 to 1993. From 1980 to 1991, Mr. Kelly held various positions at Merrill Lynch, including Managing Director of Mergers and Acquisitions and Managing Director of Merchant Banking. Mr. Kelly began his investment banking career at Lehman Brothers in 1989. He1974. Mr. Kelly received a B.A. from Amherst College and an M.B.A. from the HarvardWharton School of Business School.of the University of Pennsylvania. He also obtained a B.S. in Industrial Engineering from Purdue University. Mr. Sobecki iswas previously a director of Lexicon Pharmaceuticals,MSC Industrial Direct Co., Inc.
Julie Rice. Ms. Rice has been a director since August 2018. Since February 2021, she has served as the Co-Founder and Co-Chief Executive Officer of Peoplehood LLC, a connection and wellness company, and since June 2016, she has served as the Co-Founder of LifeShop LLC, an advising and investing company. From November 2017 to March 2019, Ms. Rice served as a Partner at WeWork, a shared workspace company. After co-founding SoulCycle Inc., a fitness company, in 2006, Ms. Rice served as Co-Chief Executive Officer from 2006 to 2015, Chief Talent and Creative Officer from 2015 to 2016 and a numbermember of the board of directors from 2010 to 2018. Previously, Ms. Rice was a Talent Manager at Handprint Entertainment from 1997 to 2004. Ms. Rice received a B.A. in English and Theater from the State University of New York at Binghamton.
42
William H. Shrank, M.D. Dr. Shrank has been a director since August 2023. Since January 2023, Dr. Shrank has been a venture partner to the Bio + Health team of Andreessen Horowitz, a private companiesventure capital firm. He previously served as Chief Medical Officer of Humana Inc. (Humana), a leading care delivery and health plan administration company, from April 2019 to August 2022. He also served as Humana’s Chief Medical and Corporate Affairs Officer from July 2019 to July 2021 during which Artal or Invus, L.P. are shareholders.time he oversaw its government affairs function. Prior to joining Humana, Dr. Shrank served as Chief Medical Officer, Insurance Services Division, of the University of Pittsburgh Medical Center (UPMC) from April 2016 to February 2019. From 2013 to 2016, Dr. Shrank held several positions with CVS Health Corporation (CVS Health), a health solutions company, including Senior Vice President, Chief Scientific Officer, and Chief Medical Officer of Provider Innovation. Prior to joining CVS Health, Dr. Shrank served as Director, Research and Rapid-Cycle Evaluation Group, for the Center for Medicare and Medicaid Innovation, part of the Centers for Medicare and Medicaid Services (CMS). Dr. Shrank began his career as a practicing physician with Brigham and Women’s Hospital in Boston, Massachusetts and as an assistant professor at Harvard Medical School. Dr. Shrank received a B.A. in Psychology from Brown University and an M.D. from Cornell University Medical College. He also holds a M.S. in Health Services from the University of California, Los Angeles.
Oprah Winfrey.Ms. Winfrey has been a director since October 2015. Since January 2009,Most recently, Ms. Winfrey has served as the Chairman and Chief Executive Officer of her cable network, OWN: Oprah Winfrey Network, taking on the role of Chief Executive Officer in July 2011.Network. Previously, she founded Harpo, Inc. in 1986, under which she has launched numerous media and entertainment businesses, including OWN: Oprah Winfrey Network, Oprah Daily, O, The Oprah Magazine, and Harpo Films, in addition to hosting and producing the award-winning talk show ‘The Oprah Winfrey Show’ for 25 years. Ms. Winfrey is a global media leader, philanthropist, producer, actress and actress.author. She also has been serving as a member of the Smithsonian’s advisory council since 2004.
43
PART II
31
Item 5. Market for Registrant’s Common Equity, Related Shareholder Matters and Issuer Purchases of Equity Securities
PART II
|
|
Our common stock is listed on Nasdaq.Nasdaq. Our common stock has traded on Nasdaq under the symbol “WW” since April 22, 2019, prior to which it traded under the symbol “WTW.”
On October 9, 2003, our Board of Directors authorized, and we announced, a program to repurchase up to $250.0 million of our outstanding common stock. On each of June 13, 2005, May 25, 2006 and October 21, 2010, our Board of Directors authorized, and we announced, the addition of $250.0 million to this program. The repurchase program allows for shares to be purchased from time to time in the open market or through privately negotiated transactions. No shares will be purchased from Artal Holdings Sp. z o.o., Succursale de Luxembourg and its parents and subsidiaries under this program. The repurchase program currently has no expiration date. During fiscal 20212023 and fiscal 2020,2022, we repurchased no shares of our common stock under this program. As of the end of fiscal 2021,2023, $208.9 million remained available to purchase shares of our common stock under the repurchase program.
Holders
The approximate number of holders of record of our common stock as of February 1, 20222024 was 225.269. This number does not include beneficial owners of our securities held in the name of nominees.
Dividends
We do not currently pay a dividend and we have no current plans to pay dividends in the foreseeable future.
32
Stock Performance Graph
The following graph sets forth the cumulative return on our common stock from December 30, 2016,28, 2018, the last trading day of our 20162018 fiscal year, through December 31, 2021,29, 2023, the last trading day of our 20212023 fiscal year, as compared to the cumulative return of each of the Standard & Poor’s 500 Index or the S(the “S&P 500 Index,Index”) and the cumulative return of the Standard & Poor’s MidCap 400 Index, or the S&P MidCap 400Russell 2000 Index. We selected the S&P 500 Index because it is a broad index of equity markets. We selected the S&P MidCap 400Russell 2000 Index, which is generally comprised of issuers having a similar market capitalization with the Company at the times presented and of which we are currently a member, because we believe that there are no other lines of business or published industry indices or peer groups that provide a more meaningful comparison of the cumulative return of our stock. The graph assumes that $100 was invested on December 30, 201628, 2018 in each of (1) our common stock, (2) the S&P 500 Index, and (3) the S&P MidCap 400Russell 2000 Index, and that all dividends, as applicable, were reinvested.
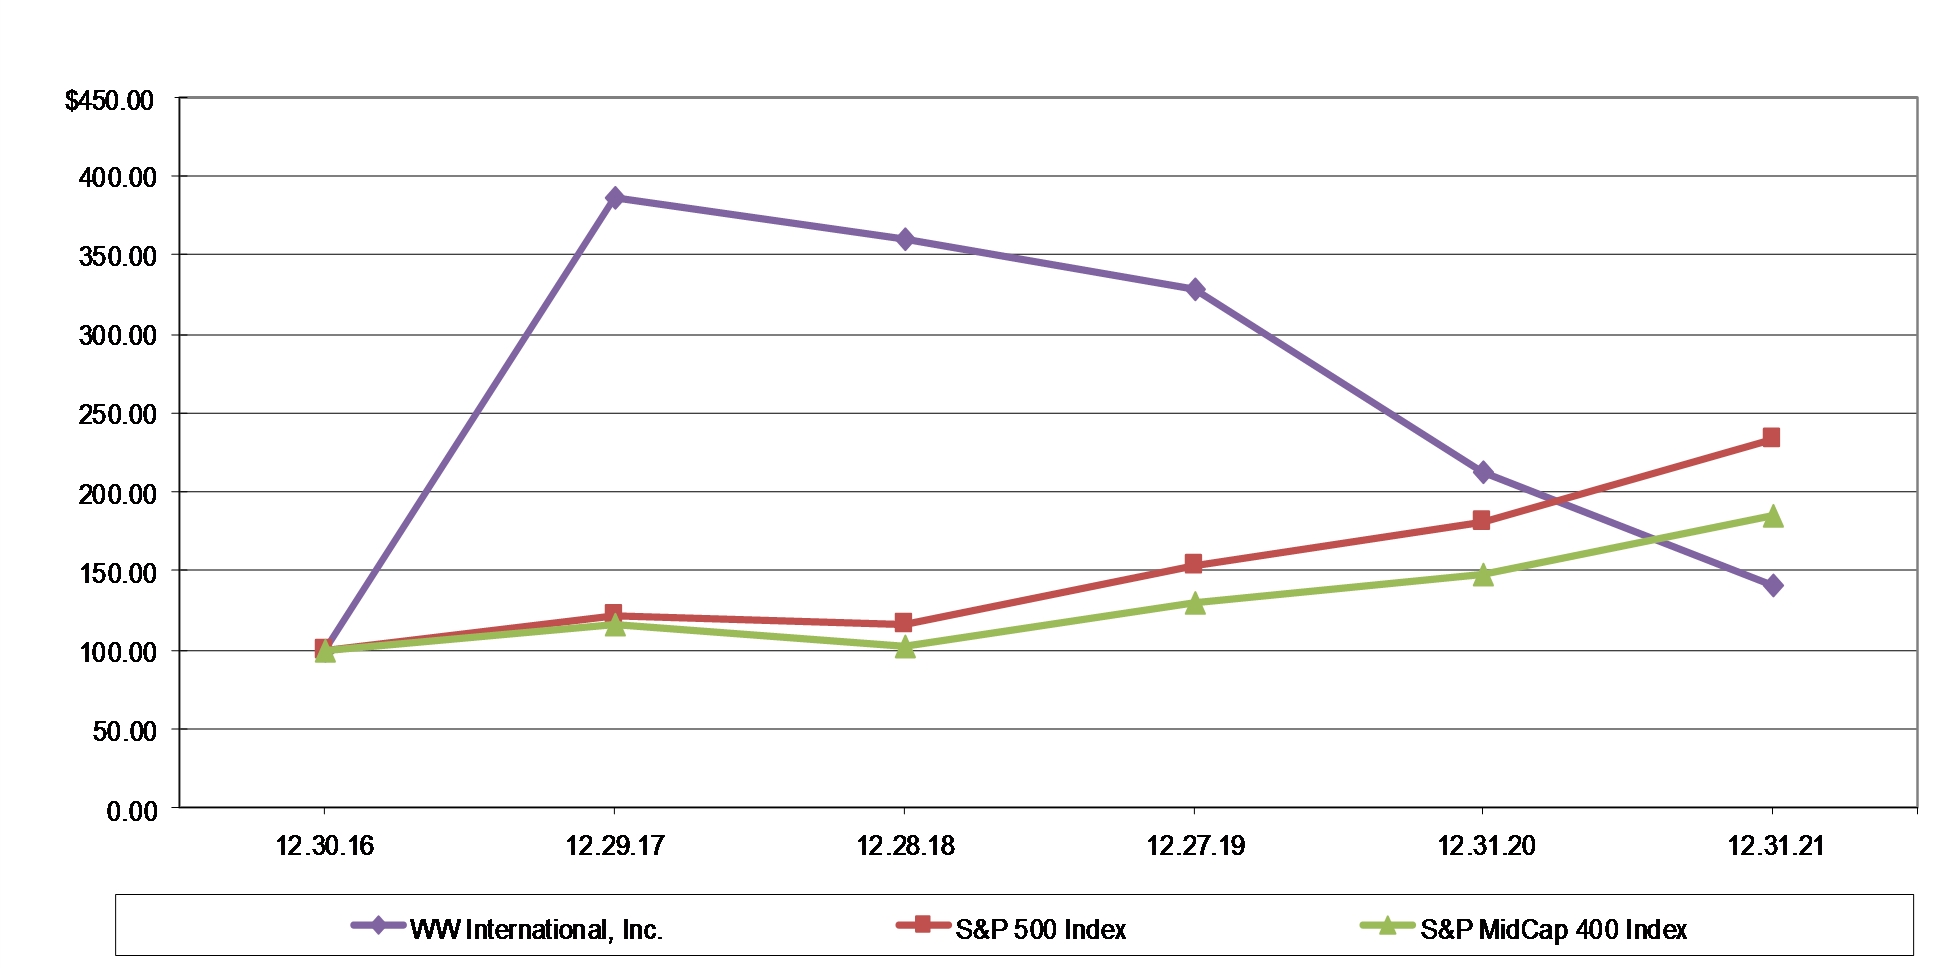
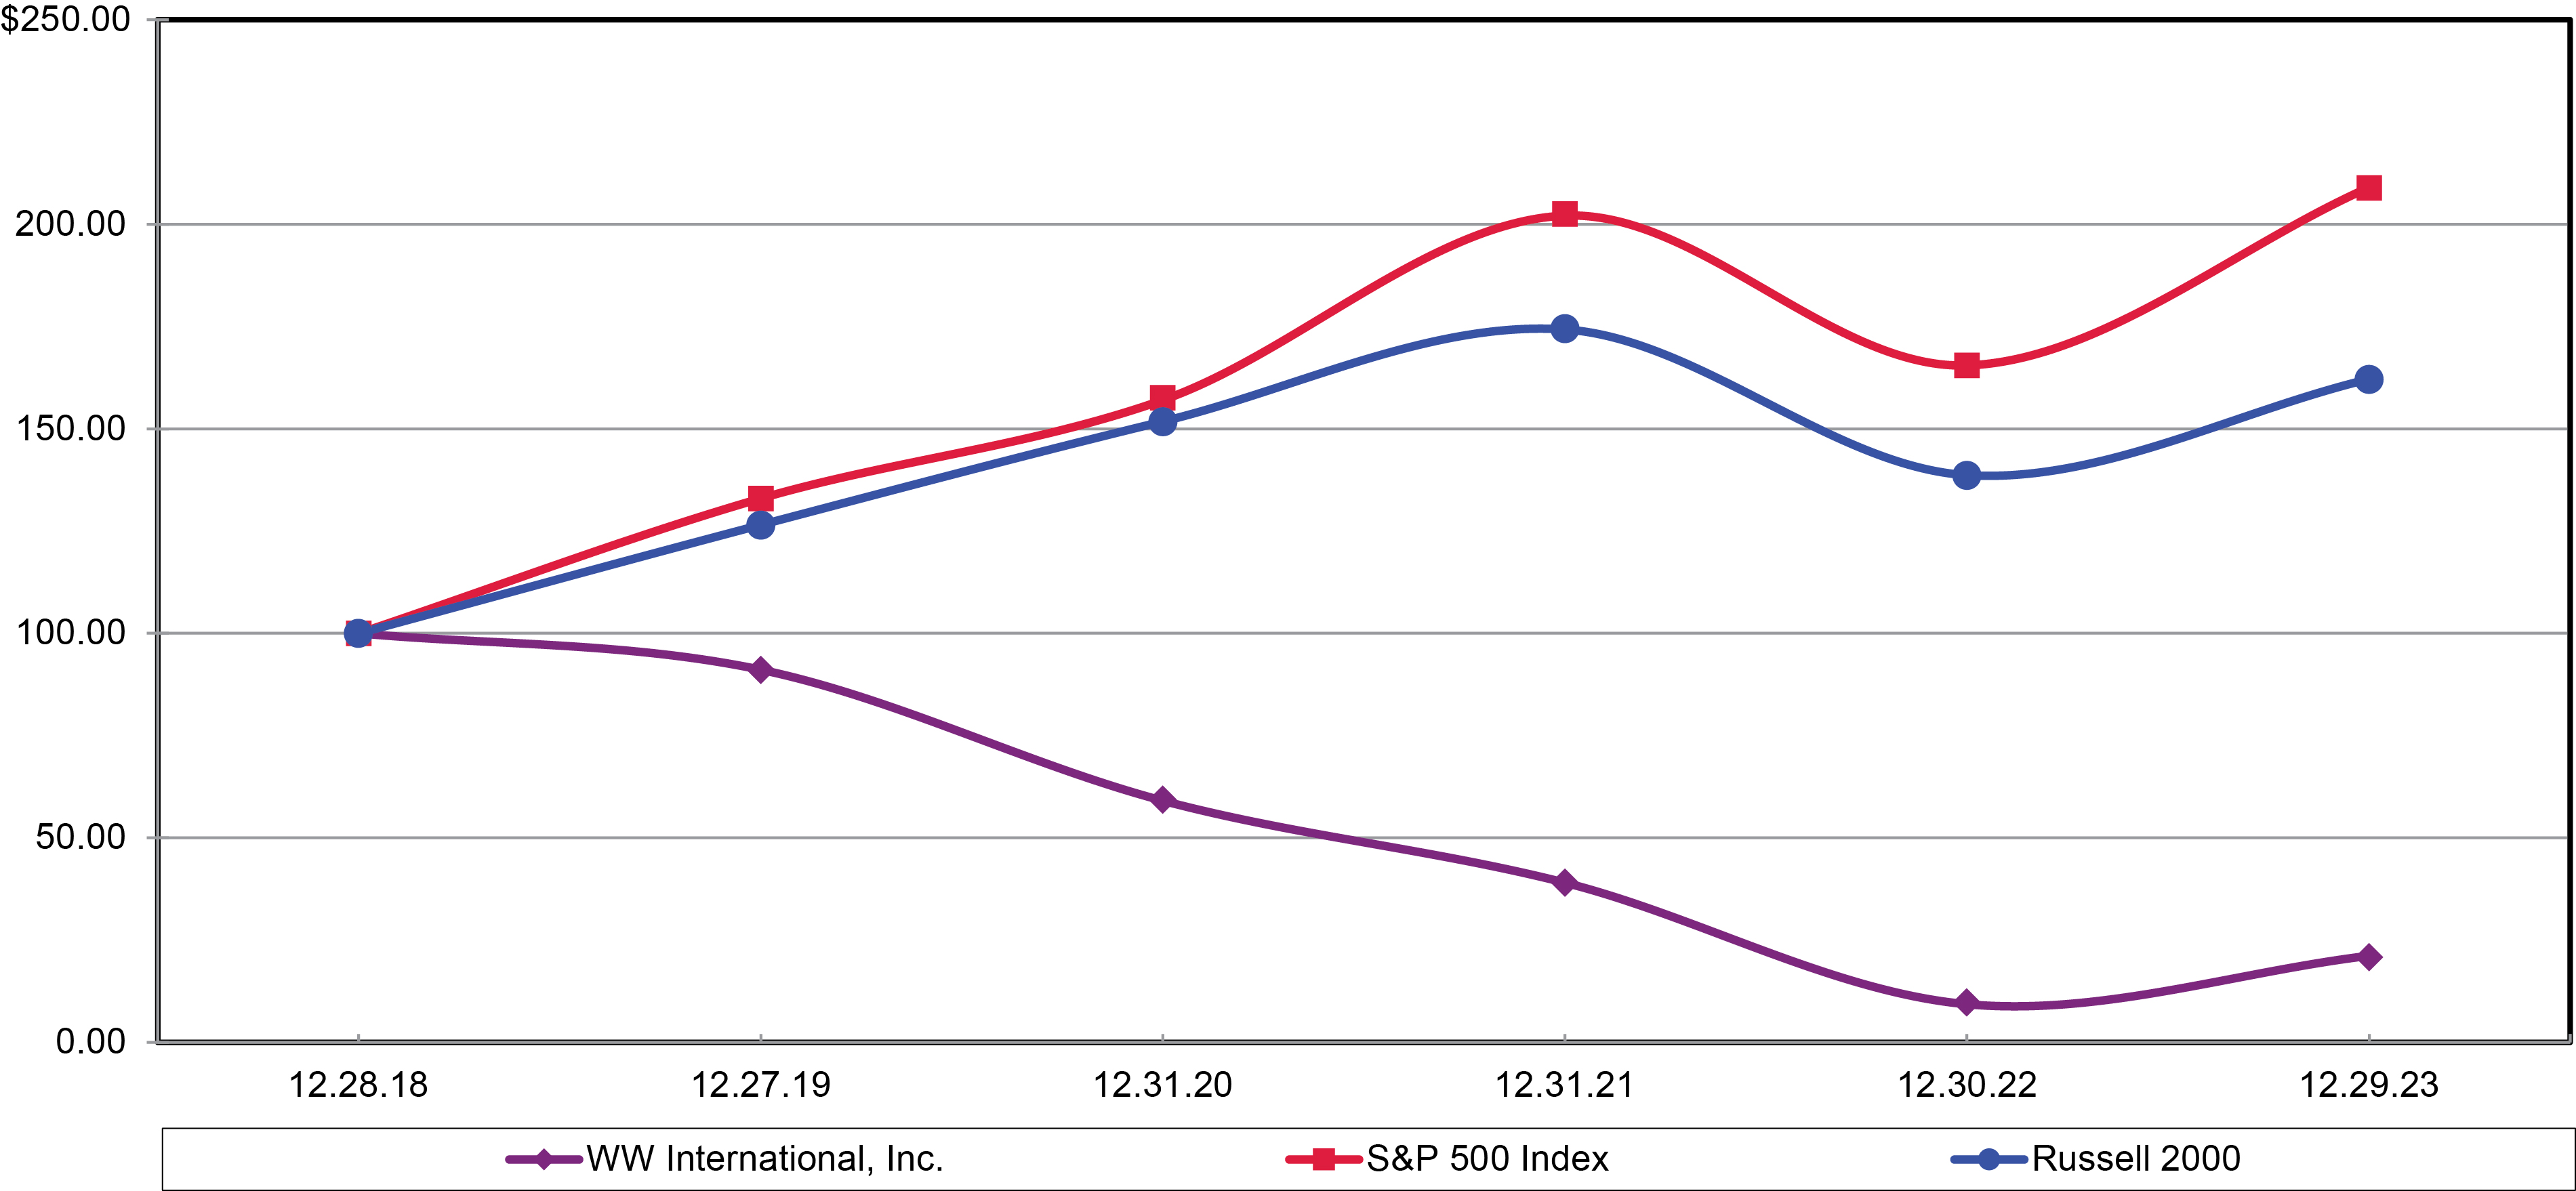
44
|
| Cumulative Total Return ($) |
| |||||||||||||||||||||
Company/Index |
| 12.28.18 |
|
| 12.27.19 |
|
| 12.31.20 |
|
| 12.31.21 |
|
| 12.30.22 |
|
| 12.29.23 |
| ||||||
WW International, Inc. |
|
| 100.00 |
|
|
| 91.10 |
|
|
| 59.08 |
|
|
| 39.05 |
|
|
| 9.34 |
|
|
| 21.18 |
|
S&P 500 Index |
|
| 100.00 |
|
|
| 132.97 |
|
|
| 157.02 |
|
|
| 202.09 |
|
|
| 165.49 |
|
|
| 209.00 |
|
Russell 2000 Index |
|
| 100.00 |
|
|
| 126.50 |
|
|
| 151.79 |
|
|
| 174.28 |
|
|
| 138.66 |
|
|
| 162.14 |
|
Item 6. [Reserved]
|
| Cumulative Total Return ($) |
| |||||||||||||||||||||
Company/Index |
| 12.30.16 |
|
| 12.29.17 |
|
| 12.28.18 |
|
| 12.27.19 |
|
| 12.31.20 |
|
| 12.31.21 |
| ||||||
WW International, Inc. |
|
| 100.00 |
|
|
| 386.72 |
|
|
| 360.61 |
|
|
| 328.55 |
|
|
| 213.10 |
|
|
| 140.87 |
|
S&P 500 Index |
|
| 100.00 |
|
|
| 121.83 |
|
|
| 115.49 |
|
|
| 153.57 |
|
|
| 181.35 |
|
|
| 233.40 |
|
S&P MidCap 400 Index |
|
| 100.00 |
|
|
| 116.24 |
|
|
| 102.31 |
|
|
| 130.36 |
|
|
| 148.25 |
|
|
| 184.96 |
|
|
|
Not applicable.
3345
Item 7.Management’s Discussion and Analysis of Financial Condition and Results of Operations
You should read the following discussion in conjunction with our consolidated financial statements and related notes included in Item 15 of this Annual Report on Form 10-K. This discussion contains forward-looking statements that involve risks and uncertainties, such as statements of our plans, strategies, prospects, objectives, expectations and intentions. The cautionary statements discussed in “Cautionary Notice Regarding Forward-Looking Statements” and elsewhere in this Annual Report on Form 10-K should be read as applying to all forward-looking statements wherever they appear in this Annual Report on Form 10-K. Our actual results could differ materially from those discussed here. Factors that could cause or contribute to these differences include, without limitation, those discussed in “Risk Factors” included in Item 1A of this Annual Report on Form 10-K. For the discussion of the financial condition and results of operations for the year ended January 2, 2021December 31, 2022 compared to the year ended December 28, 2019,January 1, 2022, refer to "Part II—Item 7. Management's Discussion and Analysis of Financial Condition and Results of Operations" in our Annual Report on Form 10-K for the fiscal year ended January 2, 2021December 31, 2022 filed with the SEC on February 25, 2021,March 6, 2023, which discussion is incorporated herein by reference.
Overview
We are a global wellnesstechnology company at the forefront of weight health, grounded in nutritional and behavior change science. We are powered by the world’s leading commercialour weight loss and weight management programprograms, our award-winning app and an award-winning digital subscription platform. We are focused on inspiringour commitment to tailoring solutions for our members to improve their weight health, including providing medical weight management treatment via access to clinician-prescribed weight management medications and related support through the WeightWatchers Clinic affiliated practices. Our portfolio of solutions empowers people to adopt healthy habits for real life and aim to democratize and deliver wellness for all.help achieve lasting weight health. With nearly six decades of weight management experience, expertise and know-how, we are one of the most recognized and trusted brand names among weight-conscious consumers. We educate our members and provide them with guidance, digital tools, and an inspiring communitycommunities – via our exclusive social network, Connect, and our workshops -- to enable them to develop healthy habits and focus on their overallpersonal weight health and wellness. WW-branded services and products include digital offerings provided throughjourneys. We also offer our apps and websites, workshops, consumer products, and various events and experiences.science-backed behavior change GLP-1 Program. Our business has gone through a significant shift to a digital subscription model over the past several years and our primary sources of revenue are subscriptions for our digital, productsworkshop, and for our workshops.clinical offerings. Our “Digital” business refers to providing subscriptions to our digital product offerings, includingwhich formerly included Digital 360 and Personal Coaching + Digital.(as applicable). Our “Workshops + Digital” (formerly known as “Studio + Digital”) business refers to providing unlimited access to our workshops combined with our digital subscription product offerings to commitment plan subscribers.subscribers, including former Digital 360 members (as applicable). It also includesformerly included the provision of access to workshops for members who dodid not subscribe to commitment plans, includingwhich included our “pay-as-you-go” members. Our “Clinical” business refers to providing subscriptions to our clinical product offerings provided by WeightWatchers Clinic (formally referred to as Sequence). In the second quarter of fiscal 2022, we ceased offering our Digital 360 product. More than a majority of associated members were transitioned from our Digital business to our Workshops + Digital business during the second quarter of fiscal 2022, with a de minimis number transitioning during the beginning of the third quarter of fiscal 2022. For additional details on the cessation of this product offering and how these transitions of former Digital 360 members at the then-current pricing for such product impacted the fiscal 2022 second quarter and first half number of End of Period Subscribers in each business as well as the associated Paid Weeks and Revenues for each business, see our Quarterly Report on Form 10-Q for the second quarter of fiscal 2022.
We operate in numerous countries around the world, including throughworld. As previously disclosed, effective the first day of fiscal 2023 (i.e., January 1, 2023), we realigned our franchise operations. We have fourorganizational structure and resources to more closely align with our strategic priorities and centralized the global management of certain functions and systems. As a result of the change in our organizational structure, in fiscal 2023, we had two reportable segments, based on an integrated geographical structure as follows:consisting of North America Continental Europe (CE), United Kingdom and Other.International, for the purpose of making operational and resource decisions and assessing financial performance. See the section entitledtitled “Business—Business Organization and Global Operations”Organization” in Item 1 of this Annual Report on Form 10-K for further information on these reportable segments and the countries in which we operate.
ComponentsEffective the first day of our Resultsfiscal 2024 (i.e., December 31, 2023), as a result of Operations
Revenues
We derive our revenues principally from:
|
|
|
|
|
|
34
The following table sets forth our revenues by categorythe continued evolution of the Company’s centralized organizational structure in fiscal 2023, and management’s 2024 strategic planning process, the Company’s reporting segments changed to one segment based on total revenue for the past twopurpose of making operational and resource decisions and assessing financial performance. The segment information presented in this Annual Report on Form 10-K does not reflect this change in reportable segments as the change did not take effect internally until our first quarter of fiscal years.
Revenue Sources
(in millions)
|
| Fiscal 2021 |
|
| Fiscal 2020 |
| ||
|
| (52 weeks) |
|
| (53 weeks) |
| ||
Subscription Revenues |
| $ | 1,063.0 |
|
| $ | 1,186.5 |
|
In-studio product sales |
|
| 21.9 |
|
|
| 40.4 |
|
E-commerce, licensing, franchise royalties and other |
|
| 127.5 |
|
|
| 151.3 |
|
Total |
| $ | 1,212.5 |
|
| $ | 1,378.1 |
|
Note: Totals may not sum due to rounding.
Total revenues for fiscal 2021 decreased 12.0% versus fiscal 2020 driven primarily by a decrease in Subscription Revenues. Additional revenue details are as follows:
|
|
|
|
|
|
Cost of Revenues
Total cost of revenues primarily consists of expenses to operate our studios and workshops, costs to sell consumer products and costs to develop and operate our digital products. Operating costs primarily consist of salary expense paid to operations management, commissions and expenses paid to our employees, coaches and guides, studio room rent, customer service costs (both in-house and third-party), program material expenses, depreciation and amortization associated with field automation, credit card and fulfillment fees and training and other expenses. Cost to sell products includes costs of products purchased from our third-party suppliers, inventory reserves, royalties, and inbound and outbound shipping and related costs incurred in making our products available for sale or use. Costs to operate our digital products include salaries and related benefits, depreciation and amortization of website development, credit card processing fees and other costs incurred in developing our digital offerings.
Marketing Expenses
Marketing expenses primarily consist of costs to produce advertising and marketing materials as well as media costs to advertise our brand and products across multiple platforms (e.g., television, YouTube, social media, programmatic, audio, search, affiliate, branded content, electronic customer relationship marketing (eCRM), direct mail and public relations), costs paid to third-party agencies who help us develop our marketing campaigns and strategy, expenses in support of market research, as well as costs incurred in connection with local marketing and promotions.
35
Selling, General and Administrative Expenses
Selling, general and administrative expenses consist of compensation, benefits and other related costs, including stock-based compensation, third-party consulting, temporary help, audit, legal and litigation expenses as well as facility costs and depreciation and amortization of systems in support of the business infrastructure and offices globally. Selling, general and administrative expenses also include amortization expense of certain of our intangible assets and certain one-time transaction expenses.
Gross Margin
The following table sets forth our gross profit and gross margin for the past two fiscal years, as adjusted for fiscal 2021 to exclude the impact of the 2021 plan restructuring charges and the reversal of 2020 plan restructuring charges, and as adjusted for fiscal 2020 to exclude the impact of the 2020 plan restructuring charges. See “Non-GAAP Financial Measures” for additional information.
(in millions except percentages) |
| Fiscal 2021 |
|
| Fiscal 2020 |
| ||
Gross Profit |
| $ | 726.4 |
|
| $ | 777.8 |
|
Gross Margin |
|
| 59.9 | % |
|
| 56.4 | % |
Adjustments to Reported Amounts (1) |
|
|
|
|
|
|
|
|
2021 plan restructuring charges |
|
| 16.7 |
|
|
| — |
|
2020 plan restructuring charges |
|
| (1.3 | ) |
|
| 23.3 |
|
Gross Profit, as adjusted (1) |
| $ | 741.8 |
|
| $ | 801.1 |
|
Gross Margin impact from above adjustments (1) |
|
| (1.3 | %) |
|
| (1.7 | %) |
Gross Margin, as adjusted (1) |
|
| 61.2 | % |
|
| 58.1 | % |
Note: Totals may not sum due to rounding.
|
|
In fiscal 2021, excluding the impact of the 2021 plan restructuring charges and the reversal of 2020 plan restructuring charges, the gross margin increase from fiscal 2020, excluding the impact of the 2020 plan restructuring charges, was driven primarily by a revenue mix shift to our higher margin Digital business and cycling against the lower margin revenues from the WW Presents: Oprah’s 2020 Vision tour, partially offset by an increase in fixed costs2024. We will begin reporting segment information based on these new segments in our Digital business primarily related to Digital 360.
36
Operating Income Margin
The following table sets forth our operating incomeQuarterly Report on Form 10-Q for the past two fiscal years, as adjusted for fiscal 2021 to exclude the impact of the 2021 plan restructuring charges and the reversal of 2020 plan restructuring charges, and as adjusted for fiscal 2020 to exclude the impact of the 2020 plan restructuring charges, the Winfrey Stock Compensation expense and the impairment charge for our goodwill related to our Brazil reporting unit:
(in millions except percentages) |
| Fiscal 2021 |
|
| Fiscal 2020 |
| ||
Operating Income |
| $ | 196.3 |
|
| $ | 216.2 |
|
Operating Income Margin |
|
| 16.2 | % |
|
| 15.7 | % |
Adjustments to Reported Amounts (1) |
|
|
|
|
|
|
|
|
2021 plan restructuring charges |
|
| 21.5 |
|
|
| — |
|
2020 plan restructuring charges |
|
| (1.6 | ) |
|
| 33.1 |
|
Winfrey Stock Compensation expense |
|
| — |
|
|
| 32.7 |
|
Goodwill impairment |
|
| — |
|
|
| 3.7 |
|
Operating Income, as adjusted (1) |
| $ | 216.2 |
|
| $ | 285.6 |
|
Operating Income Margin impact from above adjustments (1) |
|
| (1.6 | %) |
|
| (5.0 | %) |
Operating Income Margin, as adjusted (1) |
|
| 17.8 | % |
|
| 20.7 | % |
Note: Totals may not sum due to rounding.
|
|
In fiscal 2021, excluding the impact of the 2021 plan restructuring charges and the reversal of 2020 plan restructuring charges, the decrease in operating income margin from fiscal 2020, excluding the impact of the 2020 restructuring charges, the Winfrey Stock Compensation expense and the goodwill impairment charge, was driven primarily by an increase in selling, general and administrative expenses as a percentage of revenue and an increase in marketing expenses as a percentage of revenue, partially offset by an increase in gross margin.
Material Trends
Performance Indicators
Our management team regularly reviews and analyzes a number of financial and operating metrics, including the key performance indicators listed below, in order to manage our business, measure our performance, identify trends affecting our business, determine the allocation of resources, make decisions regarding corporate strategies and assess the quality and potential variability of our cash flows and earnings. We also believe that these key performance indicators are useful to both management and investors for forecasting purposes and to facilitate comparisons to our historical operating results. These metrics are supplemental to our GAAP results and include operational measures.
|
|
37
|
|
|
|
|
|
|
|
COVID-19 Pandemic
The novel coronavirus (including its variants, COVID-19) pandemic continues to impact our business operations and the markets in which we operate. Additionally, we have seen significant shifts in consumer sentiment with respect to the weight loss and wellness marketplace as the pandemic evolves. COVID-19 had a significant effect on our reported results for fiscal 2020 and fiscal 2021. While the number of End of Period Subscribers at the end of fiscal 2021 was essentially flat compared to the pre-pandemic number at the end of fiscal 2019, it decreased 5.8% versus the end of fiscal 2020. While Digital recruitments were strong in the beginning of the COVID-19 pandemic, a subsequent turn in consumer sentiment has driven a decline in Digital recruitments, and recruitment projections for our Digital business are unpredictable. Our Workshops + Digital recruitments were dramatically impacted during the first year of the pandemic, and mix shifted toward our Digital business. This change in our mix, especially when amplified by the nature of our subscription business, has negatively impacted revenue and may continue to impact it in the future. The negative impact of COVID-19, including its impact on consumer sentiment, is expected to continue to impact the business in the first quarter of fiscal 2022. 2024.
Over46
The following discussion has been adjusted to reflect our revision of previously issued consolidated financial statements to correct for prior period misstatements, which we concluded did not, either individually or in the longer term, it remains uncertain howaggregate, result in a material misstatement of our previously issued consolidated financial statements. Further information regarding the COVID-19 pandemic will impact consumer demand for our productsrevision is included in Note 1 “Basis of Presentation” and services and consumer preferences and behavior generally.
The extent to which our operations and business trends will continue in future periods to be impacted by, and any unforeseen costs will result from,Note 24 “Revision of Previously Issued Financial Statements” of the ongoing outbreak of COVID-19 will depend largely on future developments, which are highly uncertain and cannot be accurately predicted. These developments include, among other things, the severity of any variant or surges in COVID-19 cases, new information about health implications, vaccine availability and hesitancy, and actions by government authorities to contain the outbreak or treat its impact. This dynamic situation is driving uncertainly at the macroeconomic, local and consumer levels. We continue to actively monitor the ongoing global outbreak of COVID-19 and its impact and related developments.
38
In responsenotes to the public health crisis posed by COVID-19,audited consolidated financial statements contained in March 2020, we suspended our in-person workshops and moved quickly to transition these workshops to an entirely virtual experience. In June 2020, we began a phased re-opening with reduced operations of a limited number of our studio locations. During fiscal 2021, we selectively resumed in-person workshops where profitable and consistent with promoting the health and safety of our employees and members. However, during these uncertain times, we will continue to adhere to the requirements in local jurisdictions to close re-opened studios as necessary. We continue to evolve our workshop strategy as we evaluate our cost structure and respond to shifting consumer sentiment. This evolution may lead to further reduced operations. We continue to serve our members virtually, both via our Digital business and through virtual workshops. However, our Workshops + Digital business, including its business operations, number of subscribers and in-studio product sales, remain substantially affected by the evolving COVID-19 environment.
As we continue to address the impact of the pandemic, and the related evolving legal and consumer landscape, we are focused on how to best meet our members’ and consumers’ needs. We consolidated certain of our studios and continue to close certain other branded studio locations. The decision to re-open a studio location, if at all, or further consolidate studio locations, will be influenced by a number of factors, including applicable legal restrictions, consumer confidence and preferences, changes in consumer sentiment and behavior, and the protection of the health and safety of our employees and members, and will be dependent on cost efficiencies and alignment with our digital and brand strategy. The current number of our studio locations is significantly lower than that prior to the pandemic, and we expect it to remain below pre-COVID-19 levels. As a result, we have incurred, and we expect to continue to incur, significant costs associated with our real estate realignment.
While we expect the effects of the pandemic and the related responses to negatively impact our results of operations, cash flows and financial position, the uncertainty of the full extent of the duration and severity of the economic and operational impacts of COVID-19 means we cannot reasonably estimate the related financial impact at this time. For more information, see “Item 1A. Risk Factors” in Part I of this Annual Report on Form 10-K. We continue to believe that our powerful communities and our ability to inspire people to adopt healthy habits will be invaluable to people across the globe as they continue to acclimate to new social and economic environments, and that they uniquely position us in the markets in which we operate.
Market Trends
We believe that our revenues and profitability can be sensitive to major trends in the wellness and weight management industries. In particular, we believe that our business could be adversely impacted by:
|
|
|
|
|
|
|
|
|
|
|
|
|
|
|
|
|
|
|
|
39
North America Metrics and Business Trends
In fiscal 2021, North America Total Paid Weeks decreased 4.2% versus the prior year. The decrease in North America Total Paid Weeks was driven primarily by lower recruitments versus the prior year due to the COVID-19 environment and cycling against the successful launch of the myWW program in fiscal 2020.
Continental Europe Metrics and Business Trends
In fiscal 2021, Continental Europe Total Paid Weeks increased 0.3% versus the prior year, driven primarily by the higher number of Incoming Digital Subscribers at the beginning of fiscal 2021 versus the beginning of fiscal 2020, offset by lower recruitments versus the prior year due to the COVID-19 environment.
United Kingdom Metrics and Business Trends
In fiscal 2021, UK TotalPaid Weeks decreased 19.0% versus the prior year.The decrease in UK Total Paid Weeks was driven primarily by lower recruitments versus the prior year due to the COVID-19 environment and cycling against the successful launch of the myWW program in fiscal 2020.
Non-GAAP Financial Measures
To supplement our consolidated results presented in accordance with accounting principles generally accepted in the United States or GAAP,(“GAAP”), we have disclosed non-GAAP financial measures of operating results that exclude or adjust certain items. Gross profit, gross profit margin, operating income and (loss), operating income (loss) margin and components thereof are discussed in this Annual Report on Form 10-K both as reported (on a GAAP basis) and as adjusted (on a non-GAAP basis), as applicable, with respect to (i) fiscal 20212023 to exclude (a) the net impact of (w) charges associated with our previously disclosed 2023 restructuring plan (the “2023 plan”), (x) charges associated with our previously disclosed 2022 restructuring plan (the “2022 plan”) or the reversal of certain of the charges associated with the 2022 plan, as applicable, (y) charges associated with our previously disclosed 2021 organizational restructuring plan (the “2021 plan”) or the reversal of certain of the charges associated with the 2021 plan, as applicable, and (y)(z) the reversal of certain of the charges associated with our previously disclosed 2020 organizational restructuring plan and (ii) fiscal 2020 to exclude(the “2020 plan”), (b) the impact of (x) charges associated with our previously disclosed 2020 organizational restructuring plan, (y) the one-time stock compensation expense associated with the previously disclosed option granted to Ms. Oprah Winfreycertain non-recurring transaction costs in connection with the Company extending its partnership with Ms. Winfrey (the “Winfrey Stock Compensation expense”)acquisition of Sequence, and (z)(c) the impact of the impairment chargecharges for our goodwill related to our BrazilRepublic of Ireland and Northern Ireland reporting unit.units and the impairment charge for our franchise rights acquired related to our Northern Ireland unit of account; and (ii) fiscal 2022 to exclude (a) the impact of impairment charges for our franchise rights acquired related to our United States, Canada, United Kingdom, New Zealand and Australia units of account and impairment charges for our goodwill related to our Republic of Ireland reporting unit and our wholly-owned subsidiary Kurbo, Inc. (“Kurbo”) and (b) the net impact of (w) charges associated with the 2023 plan, (x) charges associated with the 2022 plan, (y) charges associated with the 2021 plan or the reversal of certain of the charges associated with the 2021 plan, as applicable, and (z) the reversal of certain of the charges associated with the 2020 plan. We generally refer to such non-GAAP measures as follows: (i) with respect to the adjustments for fiscal 2021,2023, as excluding or adjusting for the net impact of restructuring charges;charges, the impact of acquisition transaction costs, and the impact of franchise rights acquired and goodwill impairments; and (ii) with respect to the adjustments for fiscal 2020,2022, as excluding or adjusting for the impact of the restructuring charges, the Winfrey Stock Compensation expensefranchise rights acquired and goodwill impairments and the goodwill impairment charge.net impact of restructuring charges. We also present within this Annual Report on Form 10-K the non-GAAP financial measures: earnings before interest, taxes, depreciation, amortization and stock-based compensation (“EBITDAS”); earnings before interest, taxes, depreciation, amortization, stock-based compensation, early extinguishment of debt, restructuring charges (including the net impact where applicable)franchise rights acquired and goodwill impairmentimpairments, net restructuring charges, and certain non-recurring transaction costs in connection with the acquisition of Sequence (“Adjusted EBITDAS”); total debt less unamortized deferred financing costs, unamortized debt discount and cash on hand (i.e., net debt); and a net debt/Adjusted EBITDAS ratio. See “—Liquidity and Capital Resources—EBITDAS, Adjusted EBITDAS and Net Debt” for the reconciliations of these non-GAAP financial measures to the most comparable GAAP financial measure in each case. Our management believes these non-GAAP financial measures provide useful supplemental information to investors regarding the performance of our business and are useful for period-over-period comparisons of the performance of our business. While we believe that these non-GAAP financial measures are useful in evaluating our business, this information should be considered as supplemental in nature and is not meant to be considered in isolation or as a substitute for the related financial information prepared in accordance with GAAP. In addition, these non-GAAP financial measures may not be the same as similarly entitledtitled measures reported by other companies.
4047
Use of Constant Currency
As exchange rates are an important factor in understanding period-to-period comparisons, we believe in certain cases the presentation of results on a constant currency basis in addition to reported results helps improve investors’ ability to understand our operating results and evaluate our performance in comparison to prior periods. Constant currency information compares results between periods as if exchange rates had remained constant period-over-period. We use results on a constant currency basis as one measure to evaluate our performance. In this Annual Report on Form 10-K, we calculate constant currency by calculating current-year results using prior-year foreign currency exchange rates. We generally refer to such amounts calculated on a constant currency basis as excluding or adjusting for the impact of foreign currency or being on a constant currency basis. These results should be considered in addition to, not as a substitute for, results reported in accordance with GAAP and are not meant to be considered in isolation. Results on a constant currency basis, as we present them, may not be comparable to similarly titled measures used by other companies and are not measures of performance presented in accordance with GAAP.
Components of our Results of Operations
Revenues
We derive our revenues principally from:
The following table sets forth our revenues by category for the past two fiscal years.
Revenue Sources
(in millions)
|
| Fiscal 2023 |
|
| Fiscal 2022 |
| ||
Subscription Revenues |
| $ | 822.8 |
|
| $ | 919.1 |
|
Consumer product sales, licensing, franchise royalties and other |
|
| 66.8 |
|
|
| 120.8 |
|
Total |
| $ | 889.6 |
|
| $ | 1,039.8 |
|
Note: Totals may not sum due to rounding.
48
Total revenues for fiscal 2023 decreased 14.5% versus fiscal 2022 driven by a decrease in Subscription Revenues and, to a lesser extent, a decrease in consumer product sales, licensing, franchise royalties and other. Additional revenue details are as follows:
Cost of Revenues
Total cost of revenues primarily consists of expenses to operate our studios and workshops, costs to sell consumer products and costs to develop and operate our digital and clinical products. Operating costs primarily consist of salary expense paid to operations management, commissions and expenses paid to our employees, coaches and guides, studio room rent, customer service costs (both in-house and third-party), program material expenses, depreciation and amortization associated with field automation, credit card and fulfillment fees and training and other expenses. Cost to sell products includes costs of products purchased from our third-party suppliers, inventory reserves, royalties, and inbound and outbound shipping and related costs incurred in making our products available for sale or use. Costs to operate our digital products include salaries and related benefits, depreciation and amortization of capitalized software and website development, credit card processing fees and other costs incurred in developing our digital offerings.
Marketing Expenses
Marketing expenses primarily consist of costs to produce advertising and marketing materials as well as media costs to advertise our brand and products across multiple platforms (e.g., television, YouTube, social media, programmatic, audio, search, affiliate, branded content, electronic customer relationship marketing (eCRM), direct mail and public relations), costs paid to third-party agencies who help us develop our marketing campaigns and strategy, expenses associated with brand ambassadors, expenses in support of market research, as well as costs incurred in connection with local marketing and promotions.
Selling, General and Administrative Expenses
Selling, general and administrative expenses consist of compensation, benefits and other related costs, including stock-based compensation, third-party consulting, temporary help, audit, legal and litigation expenses as well as facility costs and depreciation and amortization of systems in support of the business infrastructure and offices globally. Selling, general and administrative expenses also include amortization expense of certain of our intangible assets and certain one-time transaction expenses.
49
Gross Margin
The following table sets forth our gross profit and gross margin for the past two fiscal years, as adjusted for fiscal 2023 and fiscal 2022 to exclude the net impact of restructuring charges. See “Non-GAAP Financial Measures” for additional information.
(in millions except percentages) |
| Fiscal 2023 |
|
| Fiscal 2022 |
| ||
Gross Profit |
| $ | 529.3 |
|
| $ | 621.4 |
|
Gross Margin |
|
| 59.5 | % |
|
| 59.8 | % |
Adjustments to Reported Amounts (1) |
|
|
|
|
|
| ||
2023 plan restructuring charges |
|
| 21.1 |
|
|
| 1.8 |
|
2022 plan restructuring charges |
|
| (0.0 | ) |
|
| 6.5 |
|
2021 plan restructuring charges |
|
| 0.1 |
|
|
| (0.6 | ) |
2020 plan restructuring charges |
|
| (0.0 | ) |
|
| (0.7 | ) |
Gross Profit, as adjusted (1) |
| $ | 550.5 |
|
| $ | 628.4 |
|
Gross Margin impact from above adjustments (1) |
|
| (2.4 | %) |
|
| (0.7 | %) |
Gross Margin, as adjusted (1) |
|
| 61.9 | % |
|
| 60.4 | % |
Note: Totals may not sum due to rounding.
Operating Income (Loss) Margin
The following table sets forth our operating income (loss) and operating income (loss) margin for the past two fiscal years, as adjusted for fiscal 2023 and fiscal 2022 to exclude the net impact of restructuring charges, the impact of the acquisition transaction costs, and the impact of franchise rights acquired and goodwill impairments, as applicable. See “Non-GAAP Financial Measures” for additional information.
(in millions except percentages) |
| Fiscal 2023 |
|
| Fiscal 2022 |
| ||
Operating Income (Loss) |
| $ | 22.3 |
|
| $ | (284.0 | ) |
Operating Income (Loss) Margin |
|
| 2.5 | % |
|
| (27.3 | %) |
Adjustments to Reported Amounts (1) |
|
|
|
|
|
| ||
2023 plan restructuring charges |
|
| 53.7 |
|
|
| 13.6 |
|
2022 plan restructuring charges |
|
| 1.1 |
|
|
| 27.2 |
|
2021 plan restructuring charges |
|
| 0.1 |
|
|
| (0.3 | ) |
2020 plan restructuring charges |
|
| (0.0 | ) |
|
| (0.7 | ) |
Acquisition transaction costs |
|
| 8.6 |
|
|
| — |
|
Franchise rights acquired and goodwill impairments |
|
| 3.6 |
|
|
| 396.7 |
|
Operating Income, as adjusted (1) |
| $ | 89.5 |
|
| $ | 152.5 |
|
Operating Income Margin impact from above adjustments (1) |
|
| (7.5 | %) |
|
| (42.0 | %) |
Operating Income Margin, as adjusted (1) |
|
| 10.1 | % |
|
| 14.7 | % |
Note: Totals may not sum due to rounding.
50
Material Trends
Performance Indicators
Our management team regularly reviews and analyzes a number of financial and operating metrics, including the key performance indicators listed below, in order to manage our business, measure our performance, identify trends affecting our business, determine the allocation of resources, make decisions regarding corporate strategies and assess the quality and potential variability of our cash flows and earnings. We also believe that these key performance indicators are useful to both management and investors for forecasting purposes and to facilitate comparisons to our historical operating results. These metrics are supplemental to our GAAP results and include operational measures.
Market Trends
We believe that our revenues and profitability can be sensitive to major trends in the weight management and health and wellness industries. In particular, we believe that our business could be adversely impacted by:
51
North America Metrics and Business Trends
In fiscal 2023, North America Total Paid Weeks decreased 2.7% versus the prior year, driven primarily by the lower number of Total Incoming Subscribers at the beginning of fiscal 2023 versus the beginning of fiscal 2022.
International Metrics and Business Trends
In fiscal 2023, International Total Paid Weeks decreased 6.2% versus the prior year, driven primarily by the lower number of Total Incoming Subscribers at the beginning of fiscal 2023 versus the beginning of fiscal 2022.
Critical Accounting Estimates
“Management’s Discussion and Analysis of Financial Condition and Results of Operations” is based upon our consolidated financial statements, which have been prepared in accordance with GAAP. The preparation of these financial statements requires us to make estimates and judgments that affect the reported amounts of assets, liabilities, revenues and expenses, and related disclosure of contingent assets and liabilities. On an ongoing basis, we evaluate our estimates and judgments, including those related to the impairment analysis for goodwill and other indefinite-lived intangible assets. We base our estimates on historical experience and on various other factors and assumptions that we believe to be reasonable under the circumstances, the results of which form the basis for making judgments about the carrying values of assets and liabilities that are not readily apparent from other sources. Actual results may differ from these estimates.
We consider an accounting estimate to be critical if: (1) the accounting estimate requires us to make assumptions about matters that were highly uncertain at the time the accounting estimate was made, and (2) changes in the estimate that are reasonably likely to occur from period to period, or use of different estimates that we reasonably could have used in the current period, would have a material impact on our financial condition or results of operations. Based on this criteria, we believe the following accounting policies are most important to the portrayal of our financial condition and results of operations and require our most significant judgments and estimates. In addition, there are other items within our financial statements that require estimation, but are not deemed critical as defined above. Changes in estimates used in these and other items could have a material impact on our financial statements.
Franchise Rights Acquired
Finite-lived franchise rights acquired are amortized over the remaining contractual period, which is generally less than one year. Indefinite-lived franchise rights acquired are tested for potential impairment on at least an annual basis for impairment.or more often if events so require.
52
In performing the impairment analysis for our indefinite-lived franchise rights acquired, the fair value for our franchise rights acquired is estimated using a discounted cash flow approach referred to as the hypothetical start-up approach for our franchise rights related to our Workshops + Digital business and a relief from royalty methodology for our franchise rights related to our Digital business. The aggregate estimated fair value for these franchise rights is then compared to the carrying value of the unit of account for those franchisethese rights. We have determined the appropriate unit of account for purposes of assessing impairment to be the combination of the rights in both the Workshops + Digital business and the Digital business in the country in which the applicable acquisition occurred. The net book values of these franchise rights in the United States, Canada,Australia, United Kingdom Australia and New Zealand as of the January 1, 2022December 30, 2023 balance sheet date were $698.4$374.4 million, $60.1$4.2 million, $12.2 million, $6.5$2.8 million and $4.8$2.4 million, respectively.respectively, which represented 97.6%, 1.1%, 0.7% and 0.6%, respectively, of total franchise rights acquired as of December 30, 2023.
In our hypothetical start-up approach analysis for fiscal 2021,2023, we assumed that the year of maturity was reached after 7 years. Subsequent to the year of maturity, we estimated future cash flows for the Workshops + Digital business in each country based on assumptions regarding revenue growth and operating income margins. In our relief from royalty approach analysis for fiscal 2021,2023, the cash flows associated with the Digital business in each country were based on the expected Digital revenue for such country and the application of a royalty rate based on current market terms. The cash flows for the Workshops + Digital and the Digital businesses were discounted utilizing rates which were calculated using the weighted-averageweighted average cost of capital, which included the cost of equity and the cost of debt.
41
Goodwill
In performing the impairment analysis for goodwill, the fair value for our reporting units is estimated using a discounted cash flow approach. This approach involves projecting future cash flows attributable to the reporting unit and discounting those estimated cash flows using an appropriate discount rate. The estimated fair value is then compared to the carrying value of the reporting unit. WeExcluding the goodwill associated with the acquisition of Sequence, we have determined the appropriate reporting unit for purposes of assessing annual impairment to be the country for all reporting units. The net book values of goodwill, excluding the $89.7 million of goodwill associated with the acquisition of Sequence, in the United States, Canada and other countries as of the January 1, 2022December 30, 2023 balance sheet date were $105.1$104.0 million, $42.4$40.5 million and $9.9$9.2 million, respectively.respectively, which represented 42.7%, 16.6% and 3.8%, respectively, of total goodwill as of December 30, 2023.
ForIn performing the impairment analysis for goodwill, for all of our reporting units, tested as of May 9, 2021, we estimated future cash flows by utilizing the historical debt-free cash flows (cash flows provided by operations less capital expenditures) attributable to that country and then applied expected future operating income growth rates for such country. We utilized operating income as the basis for measuring our potential growth because we believe it is the best indicator of the performance of our business. We then discounted the estimated future cash flows utilizing a discount rate which was calculated using the weighted-averageweighted average cost of capital, which included the cost of equity and the cost of debt.
Indefinite-Lived Franchise Rights Acquired and Goodwill Annual Impairment TestTests
We review indefinite-lived intangible assets, including franchise rights acquired with indefinite lives, and goodwill for potential impairment on at least an annual basis or more often if events so require. We performed our annual fair value impairment testing as of May 9, 20217, 2023 and May 3, 2020,8, 2022, each the first day of fiscal May, on our indefinite-lived intangible assets and goodwill.
In performing our annualaddition, based on triggering events, we performed an interim impairment analysistest as of May 9, 2021 and May 3, 2020, we determined that the carrying amountsOctober 1, 2022 on certain of our franchise rights acquired with indefinite lives unitsindefinite-lived intangible assets for the third quarter of accountfiscal 2022 and an interim impairment test as of December 31, 2022 on our indefinite-lived intangible assets and goodwill for our Republic of Ireland reporting units did not exceed their respective fair values and, therefore, no impairment existed.unit for the fourth quarter of fiscal 2022.
When determining fair value, we utilize various assumptions, including projections of future cash flows, revenue growth rates, operating income margins and discount rates. A change in these underlying assumptions could cause a change in the results of the impairment assessments and, as such, could cause fair value to be less than the carrying amounts and result in an impairment of those assets. In the event such a result occurred, we would be required to record a corresponding charge, which would impact earnings. We would also be required to reduce the carrying amounts of the related assets on our balance sheet. We continue to evaluate these assumptions and believe that these assumptions are appropriate.
53
In performing our annual impairment analysis,analyses, we also considered the trading value of both our equity and debt. If the trading values of both our equity and debt were to significantly decline from their current levels at the time of testing, we may have to take an impairment charge at the appropriate time, which could be material. For additional information on risks associated with our recognizing asset impairment charges, see “Item 1A. Risk Factors” of this Annual Report on Form 10-K.
Based onAs a result of the results ofinherent uncertainty associated with forming the estimates within our May 9, 2021 annualgoodwill and franchise rights acquired impairment tests, actual results could differ from those estimates. Future events and changing market conditions may impact our assumptions as to future revenue and operating margin growth, weighted average cost of capital, and other factors that may result in changes in our estimates of fair value. Although we believe the assumptions used in testing for impairment are reasonable, a lack of recovery or further deterioration in market conditions or financial performance, a lack of recovery or further decline in our share price from current levels for a sustained period, or an increase in the market-based weighted average cost of capital, among other factors, could significantly impact our impairment analysis performed for all of our units of account, all units, except for New Zealand, had an estimated fair value at least 45% higher than the respective unit’s carrying amount. Collectively, these units of account represent 99.4% of our totaland may result in future franchise rights acquired as of the January 1, 2022 balance sheet date. Basedor goodwill impairment charges that, if incurred, could have a material adverse effect on theour financial condition and results of our annual franchise rights acquired impairment test performed for our New Zealand unit of account, which holds 0.6%operations.
For further information regarding the results of our franchise rights acquired as of the January 1, 2022 balance sheet date, the estimated fair value of this unit of account exceeded its carrying value by approximately 10%. Accordingly, a change in the underlying assumptions for New Zealand may change the results of theand goodwill annual impairment assessment and, as such, could result in an impairment oftests, the franchise rights acquired related to New Zealand, for which the net book value was $4.8 million as of January 1, 2022.
In performing thisinterim impairment analysis for fiscal 2021, in our hypothetical start-up approach analysis,test for the yearthird quarter of maturity, we assumed Workshops + Digital revenue (comprised of Workshops + Digital Feesfiscal 2022 and revenues from products sold to members in studios) growth of (41.5%) to 5.6% in the year of maturity from fiscal 2020, in each case, earned in the applicable country and assumed cumulative annual revenue growth rates for the years beyond the year of maturity of 1.8%. For the year of maturity and beyond, we assumed operating income margin rates of 7.1% to 11.7%. In our relief from royalty approach, we assumed Digital revenue growth in each country of 17.9% to 28.3% in fiscal 2021 and of 4.7% to 26.8% in fiscal 2022.
Based on the results of our May 9, 2021 annual goodwill impairment test performed for all of our reporting units, there was significant headroom in the goodwill impairment analysis for those units, with the difference between the carrying value and the fair value exceeding 100%.
42
The following are the more significant assumptions utilized in our annual impairment analyses for fiscal 2021 and fiscal 2020:
|
| Fiscal 2021 |
|
| Fiscal 2020 |
|
Debt-Free Cumulative Annual Cash Flow Growth Rate |
| 0.2% to 2.6% |
|
| 4.0% to 13.9% |
|
Discount Rate |
| 8.5% |
|
| 9.5% |
|
Canada Indefinite-Lived Franchise Rights Acquired Interim Impairment Test
Our Canada unit of account had a net book value of $60.1 million, 7.7% of our franchise rights acquired as of the January 1, 2022 balance sheet date. Given the lower headroom in the May 9, 2021 annual franchise rights acquired impairment test for this unit relative to the other units of account and the decline in business performance through fiscal 2021 (which may continue into fiscal 2022), we performed angoodwill interim impairment analysis as of January 1, 2022. In this test, the estimated fair value of this unit of account exceeded its carrying value by approximately 3%. Therefore, we did not record an impairmenttests for the Canada unit of account.
Any impairment test is highly dependent on the assumptions used. The most significant assumptions at issue are the discount rate applied and the Digital revenue growth rate used. In the interim impairment analysis, we applied a discount rate of 9.0% based on our actual weighted-average cost of capital, which included the cost of equity and the cost of debt. We projected Digital revenues based upon our current and past performance. Changes in these assumptions would have a significant impact on the valuation model. Holding all other assumptions constant, a hypothetical 50 basis point increase in our discount rate assumption would decrease the fair value by approximately 8%, which would result in an impairment. Holding all other assumptions constant, a hypothetical 1% reduction in projected Digital revenues for each year in the analysis would decrease the fair value by approximately 5%, which would also result in an impairment.
Brazil Goodwill Impairment
With respect to our Brazil reporting unit, during the firstfourth quarter of fiscal 2020, we made a strategic decision2022, see Note 7 “Franchise Rights Acquired, Goodwill and Other Intangible Assets” of the notes to shift to an exclusively Digital business in that country. We determined that this decision, together with the negative impact of COVID-19, the ongoing challenging economic environment in Brazil and our reduced expectations regarding the reporting unit’s future operating cash flows, required us to perform an interim goodwill impairment analysis. In performing this discounted cash flow analysis, we determined that the carrying amount of this reporting unit exceeded its fair value and as a result recorded an impairment charge of $3.7 million, which comprised the remaining balance of goodwill for this reporting unit.
As it related to our goodwill impairment analysis for Brazil, we estimated future debt-free cash flows in contemplation of our growth strategies for that market. In developing these projections, we considered the growth strategies under the current market conditions in Brazil. We then discounted the estimated future cash flows utilizing a discount rate which was calculated using the weighted-average cost of capital, which included the cost of equity and the cost of debt.
Critical Accounting Policies
Information concerning our critical accounting policies is set forth in Note 2 of our audited consolidated financial statements, contained in Part IV, Item 15 of this Annual Report on Form 10-K.
43Critical Accounting Policies
Information concerning our critical accounting policies is set forth in Note 2 “Summary of Significant Accounting Policies” of the notes to the audited consolidated financial statements, contained in Part IV, Item 15 of this Annual Report on Form 10-K.
54
RESULTS OF OPERATIONS FOR FISCAL 20212023 (52 weeks) COMPARED TO FISCAL 2020 (532022 (52 weeks)
The Company’s fiscal year ends on the Saturday closest to December 31st and consists of either 52- or 53-week periods. Fiscal 2021 contained 52 weeks, while fiscal 2020 contained 53 weeks. The first week of fiscal 2020, which began on December 29, 2019 and ended on January 4, 2020, contributed an additional $25.5 million in fiscal 2020 net revenues. Due to the timing of the first week of fiscal 2020, additional marketing expense drove a decline of $7.5 million in fiscal 2020 operating income. The first week of fiscal 2020 also contributed 3.2 million of additional Digital Paid Weeks, 1.3 million of additional Workshops + Digital Paid Weeks and 4.5 million of additional Total Paid Weeks to fiscal 2020. The additional week in fiscal 2020 also resulted in an additional week of interest expense for that year.
The table below sets forth selected financial information for fiscal 20212023 from our consolidated statements of net incomeoperations for fiscal 20212023 versus selected financial information for fiscal 20202022 from our consolidated statements of net incomeoperations for fiscal 2020.2022.
Summary of Selected Financial Data
|
| (In millions, except per share amounts) |
|
|
|
|
|
|
|
|
|
| |||||||||
|
| Fiscal 2021 |
|
| Fiscal 2020 |
|
| Increase/ (Decrease) |
|
| % Change |
|
| % Change Constant Currency |
|
| |||||
Revenues, net |
| $ | 1,212.5 |
|
| $ | 1,378.1 |
|
| $ | (165.7 | ) |
|
| (12.0 | %) |
|
| (13.7 | %) |
|
Cost of revenues |
|
| 486.1 |
|
|
| 600.3 |
|
|
| (114.2 | ) |
|
| (19.0 | %) |
|
| (20.2 | %) |
|
Gross profit |
|
| 726.4 |
|
|
| 777.8 |
|
|
| (51.5 | ) |
|
| (6.6 | %) |
|
| (8.7 | %) |
|
Gross Margin % |
|
| 59.9 | % |
|
| 56.4 | % |
|
|
|
|
|
|
|
|
|
|
|
|
|
|
|
|
|
|
|
|
|
|
|
|
|
|
|
|
|
|
|
|
|
|
|
Marketing expenses |
|
| 261.5 |
|
|
| 260.7 |
|
|
| 0.7 |
|
|
| 0.3 | % |
|
| (2.0 | %) |
|
Selling, general & administrative expenses |
|
| 268.6 |
|
|
| 297.3 |
|
|
| (28.7 | ) |
|
| (9.6 | %) |
|
| (10.7 | %) |
|
Goodwill impairment |
|
| — |
|
|
| 3.7 |
|
|
| (3.7 | ) |
|
| (100.0 | %) |
|
| (100.0 | %) |
|
Operating income |
|
| 196.3 |
|
|
| 216.2 |
|
|
| (19.9 | ) |
|
| (9.2 | %) |
|
| (12.3 | %) |
|
Operating Income Margin % |
|
| 16.2 | % |
|
| 15.7 | % |
|
|
|
|
|
|
|
|
|
|
|
|
|
|
|
|
|
|
|
|
|
|
|
|
|
|
|
|
|
|
|
|
|
|
|
Interest expense |
|
| 87.9 |
|
|
| 123.3 |
|
|
| (35.4 | ) |
|
| (28.7 | %) |
|
| (28.7 | %) |
|
Other expense, net |
|
| 1.4 |
|
|
| 0.3 |
|
|
| 1.0 |
|
| 100.0 | % | * | 100.0 | % | * | ||
Early extinguishment of debt |
|
| 30.4 |
|
|
| 0.0 |
|
|
| 30.4 |
|
|
| 100.0 | % |
|
| 100.0 | % |
|
Income before income taxes |
|
| 76.7 |
|
|
| 92.5 |
|
|
| (15.8 | ) |
|
| (17.1 | %) |
|
| (24.5 | %) |
|
|
|
|
|
|
|
|
|
|
|
|
|
|
|
|
|
|
|
|
|
|
|
Provision for income taxes |
|
| 9.8 |
|
|
| 17.5 |
|
|
| (7.7 | ) |
|
| (44.0 | %) |
|
| (55.0 | %) |
|
Net income |
|
| 66.9 |
|
|
| 75.0 |
|
|
| (8.1 | ) |
|
| (10.9 | %) |
|
| (17.4 | %) |
|
Net loss attributable to the noncontrolling interest |
|
| — |
|
|
| 0.0 |
|
|
| (0.0 | ) |
|
| (100.0 | %) |
|
| (100.0 | %) |
|
|
|
|
|
|
|
|
|
|
|
|
|
|
|
|
|
|
|
|
|
|
|
Net income attributable to WW International, Inc. |
| $ | 66.9 |
|
| $ | 75.1 |
|
| $ | (8.2 | ) |
|
| (10.9 | %) |
|
| (17.4 | %) |
|
|
|
|
|
|
|
|
|
|
|
|
|
|
|
|
|
|
|
|
|
|
|
Weighted average diluted shares outstanding |
|
| 70.7 |
|
|
| 70.0 |
|
|
| 0.7 |
|
|
| 1.0 | % |
|
| 1.0 | % |
|
Diluted earnings per share |
| $ | 0.95 |
|
| $ | 1.07 |
|
| $ | (0.13 | ) |
|
| (11.8 | %) |
|
| (18.2 | %) |
|
|
| (In millions, except per share amounts) |
|
|
|
|
|
|
|
| |||||||||||
|
| Fiscal 2023 |
|
| Fiscal 2022 |
|
| Increase/ |
|
| % |
|
| % Change |
|
| |||||
Revenues, net |
| $ | 889.6 |
|
| $ | 1,039.8 |
|
| $ | (150.3 | ) |
|
| (14.5 | %) |
|
| (14.5 | %) |
|
Cost of revenues |
|
| 360.2 |
|
|
| 418.5 |
|
|
| (58.2 | ) |
|
| (13.9 | %) |
|
| (13.8 | %) |
|
Gross profit |
|
| 529.3 |
|
|
| 621.4 |
|
|
| (92.1 | ) |
|
| (14.8 | %) |
|
| (15.0 | %) | |
Gross Margin % |
|
| 59.5 | % |
|
| 59.8 | % |
|
|
|
|
|
|
|
|
| ||||
|
|
|
|
|
|
|
|
|
|
|
|
|
|
|
|
| |||||
Marketing expenses |
|
| 238.4 |
|
|
| 244.8 |
|
|
| (6.4 | ) |
|
| (2.6 | %) |
|
| (2.3 | %) | |
Selling, general & administrative expenses |
|
| 264.9 |
|
|
| 263.8 |
|
|
| 1.1 |
|
|
| 0.4 | % |
|
| 0.4 | % |
|
Franchise rights acquired and goodwill impairments |
|
| 3.6 |
|
|
| 396.7 |
|
|
| (393.1 | ) |
|
| (99.1 | %) |
|
| (99.1 | %) |
|
Operating income (loss) |
|
| 22.3 |
|
|
| (284.0 | ) |
|
| 306.3 |
|
|
| 100.0 | % | * |
| 100.0 | % | * |
Operating Income (Loss) Margin % |
|
| 2.5 | % |
|
| (27.3 | %) |
|
|
|
|
|
|
|
|
|
| |||
|
|
|
|
|
|
|
|
|
|
|
|
|
|
|
|
| |||||
Interest expense |
|
| 95.9 |
|
|
| 81.1 |
|
|
| 14.8 |
|
|
| 18.2 | % |
|
| 18.2 | % |
|
Other expense, net |
|
| 0.1 |
|
|
| 1.7 |
|
|
| (1.6 | ) |
|
| (95.7 | %) |
|
| (95.7 | %) |
|
Loss before income taxes |
|
| (73.6 | ) |
|
| (366.8 | ) |
|
| (293.2 | ) |
|
| (79.9 | %) |
|
| (79.4 | %) |
|
|
|
|
|
|
|
|
|
|
|
|
|
|
|
|
|
| |||||
Provision for (benefit from) income taxes |
|
| 38.6 |
|
|
| (109.9 | ) |
|
| 148.6 |
|
|
| 100.0 | % | * |
| 100.0 | % | * |
Net loss |
| $ | (112.3 | ) |
| $ | (256.9 | ) |
| $ | (144.6 | ) |
|
| (56.3 | %) |
|
| (55.8 | %) |
|
|
|
|
|
|
|
|
|
|
|
|
|
|
|
|
|
| |||||
Weighted average diluted shares outstanding |
|
| 76.7 |
|
|
| 70.3 |
|
|
| 6.4 |
|
|
| 9.0 | % |
|
| 9.0 | % |
|
Diluted net loss per share |
| $ | (1.46 | ) |
| $ | (3.65 | ) |
| $ | (2.19 | ) |
|
| (59.9 | %) |
|
| (59.4 | %) |
|
Note: Totals may not sum due to rounding.
*Note: Percentage in excess of 100.0%. and not meaningful.
44
55
Certain results for fiscal 20212023 are adjusted to exclude the net impact of restructuring charges, the impact of acquisition transaction costs, and the impact of franchise rights acquired and goodwill impairments. See “Non-GAAP Financial Measures” above. The table below sets forth a reconciliation of certain of those components of our selected financial data for the fiscal year ended December 30, 2023 which have been adjusted.
|
|
|
|
|
|
|
|
|
|
| Operating |
| ||||
|
| Gross |
|
| Gross |
|
| Operating |
|
| Income |
| ||||
(in millions except percentages) |
| Profit |
|
| Margin |
|
| Income |
|
| Margin |
| ||||
Fiscal 2023 |
| $ | 529.3 |
|
|
| 59.5 | % |
| $ | 22.3 |
|
|
| 2.5 | % |
Adjustments to reported amounts (1) |
|
|
|
|
|
|
|
|
|
|
|
| ||||
2023 plan restructuring charges |
|
| 21.1 |
|
|
|
|
|
| 53.7 |
|
|
|
| ||
2022 plan restructuring charges |
|
| (0.0 | ) |
|
|
|
|
| 1.1 |
|
|
|
| ||
2021 plan restructuring charges |
|
| 0.1 |
|
|
|
|
|
| 0.1 |
|
|
|
| ||
2020 plan restructuring charges |
|
| (0.0 | ) |
|
|
|
|
| (0.0 | ) |
|
|
| ||
Acquisition transaction costs |
|
| — |
|
|
|
|
|
| 8.6 |
|
|
|
| ||
Franchise rights acquired and goodwill impairments |
|
| — |
|
|
|
|
|
| 3.6 |
|
|
|
| ||
Total adjustments (1) |
|
| 21.2 |
|
|
|
|
|
| 67.2 |
|
|
|
| ||
Fiscal 2023, as adjusted (1) |
| $ | 550.5 |
|
|
| 61.9 | % |
| $ | 89.5 |
|
|
| 10.1 | % |
Note: Totals may not sum due to rounding.
Certain results for fiscal 2022 are adjusted to exclude the impact of franchise rights acquired and goodwill impairments and the net impact of restructuring charges. See “Non-GAAP Financial Measures” above. The table below sets forth a reconciliation of certain of those components of our selected financial data for the fiscal year ended January 1,December 31, 2022 which have been adjusted.
|
|
|
|
|
|
|
|
| Operating |
| ||||||||||||||||||||||
|
|
|
|
|
| Gross |
|
|
|
|
|
| Operating |
|
|
|
|
|
| Operating |
| (Loss) |
| |||||||||
|
| Gross |
|
| Profit |
|
| Operating |
|
| Income |
|
| Gross |
| Gross |
| (Loss) |
| Income |
| |||||||||||
(in millions except percentages) |
| Profit |
|
| Margin |
|
| Income |
|
| Margin |
|
| Profit |
|
| Margin |
|
| Income |
|
| Margin |
| ||||||||
Fiscal 2021 |
| $ | 726.4 |
|
|
| 59.9 | % |
| $ | 196.3 |
|
|
| 16.2 | % | ||||||||||||||||
Fiscal 2022 |
| $ | 621.4 |
|
|
| 59.8 | % |
| $ | (284.0 | ) |
|
| (27.3 | %) | ||||||||||||||||
Adjustments to reported amounts (1) |
|
|
|
|
|
|
|
|
|
|
|
|
|
|
|
|
|
|
|
|
|
|
|
|
|
| ||||||
Franchise rights acquired and goodwill impairments |
|
| — |
|
|
|
|
|
| 396.7 |
|
|
|
| ||||||||||||||||||
2023 plan restructuring charges |
|
| 1.8 |
|
|
|
|
|
| 13.6 |
|
|
|
| ||||||||||||||||||
2022 plan restructuring charges |
|
| 6.5 |
|
|
|
|
|
| 27.2 |
|
|
|
| ||||||||||||||||||
2021 plan restructuring charges |
|
| 16.7 |
|
|
|
|
|
|
| 21.5 |
|
|
|
|
|
|
| (0.6 | ) |
|
|
|
|
| (0.3 | ) |
|
|
| ||
2020 plan restructuring charges |
|
| (1.3 | ) |
|
|
|
|
|
| (1.6 | ) |
|
|
|
|
|
| (0.7 | ) |
|
|
|
| (0.7 | ) |
|
|
| |||
Total adjustments (1) |
|
| 15.4 |
|
|
|
|
|
|
| 19.9 |
|
|
|
|
|
|
| 7.0 |
|
|
|
|
| 436.4 |
|
|
|
| |||
Fiscal 2021, as adjusted (1) |
| $ | 741.8 |
|
|
| 61.2 | % |
| $ | 216.2 |
|
|
| 17.8 | % | ||||||||||||||||
Fiscal 2022, as adjusted (1) |
| $ | 628.4 |
|
|
| 60.4 | % |
| $ | 152.5 |
|
|
| 14.7 | % | ||||||||||||||||
Note: Totals may not sum due to rounding.
|
|
Certain results(1)
56
|
|
|
|
|
| Gross |
|
|
|
|
|
| Operating |
| ||
|
| Gross |
|
| Profit |
|
| Operating |
|
| Income |
| ||||
(in millions except percentages) |
| Profit |
|
| Margin |
|
| Income |
|
| Margin |
| ||||
Fiscal 2020 |
| $ | 777.8 |
|
|
| 56.4 | % |
| $ | 216.2 |
|
|
| 15.7 | % |
Adjustments to reported amounts (1) |
|
|
|
|
|
|
|
|
|
|
|
|
|
|
|
|
2020 plan restructuring charges |
|
| 23.3 |
|
|
|
|
|
|
| 33.1 |
|
|
|
|
|
Winfrey Stock Compensation expense |
|
| — |
|
|
|
|
|
|
| 32.7 |
|
|
|
|
|
Goodwill impairment |
|
| — |
|
|
|
|
|
|
| 3.7 |
|
|
|
|
|
Total adjustments (1) |
|
| 23.3 |
|
|
|
|
|
|
| 69.4 |
|
|
|
|
|
Fiscal 2020, as adjusted (1) |
| $ | 801.1 |
|
|
| 58.1 | % |
| $ | 285.6 |
|
|
| 20.7 | % |
Note: Totals may not sum due to rounding.
|
|
Consolidated Results
Revenues
Revenues for fiscal 20212023 were $1,212.5$889.6 million, a decrease of $165.7$150.3 million, or 12.0%14.5%, versus fiscal 2020.2022. Excluding the impact of foreign currency, which positively impacted our revenues in fiscal 20212023 by $23.2$0.7 million, revenues for fiscal 20212023 would have decreased 13.7%14.5% versus the prior year. This decrease was driven primarily by lower revenues related to Workshops + Digital FeesSubscription Revenues as a result of the lower number of subscribersIncoming Digital Subscribers at the beginning of fiscal 20212023 versus the beginning of fiscal 2022 and, throughoutto a lesser extent, by the decline in consumer product sales in fiscal year as2023 compared to the prior year period due to the COVID-19 pandemic.wind down of our consumer products business. Subscription Revenues included $30.5 million of Clinical Subscription Revenues for fiscal 2023. See “—Segment Results” for additional details on revenues.
45
Cost of Revenues
TotalCost of revenues for fiscal 2023 decreased $58.2 million, or 13.9%, versus fiscal 2022. Excluding the impact of foreign currency, which decreased cost of revenues in fiscal 2023 by $0.6 million, cost of revenues for fiscal 20212023 would have decreased $114.2 million, or 19.0%,13.8% versus the prior year. Excluding the net impact of the $15.4$21.2 million of restructuring charges in fiscal 20212023 and the net impact of the $23.3$7.0 million of restructuring charges in fiscal 2020, total2022, cost of revenues for fiscal 20212023 would have decreased by 18.4%17.6%, or 19.7%17.4% on a constant currency basis, versus the prior year.
Gross Profit
Gross profit for fiscal 2023 decreased $51.5$92.1 million, or 6.6%14.8%, inversus fiscal 2021 compared to fiscal 2020.2022. Excluding the impact of foreign currency, which positively impacted gross profit in fiscal 20212023 by $15.9$1.4 million, gross profit for fiscal 20212023 would have decreased 8.7%15.0% versus the prior year. Excluding the net impact of the $15.4$21.2 million of restructuring charges in fiscal 20212023 and the net impact of the $23.3$7.0 million of restructuring charges in fiscal 2020,2022, gross profit for fiscal 20212023 would have decreased by 7.4%12.4%, or 9.4%12.6% on a constant currency basis, versus the prior year primarily due to the decrease in revenues. Gross margin for fiscal 2021 increased 3.5%2023 decreased to 59.9%59.5% versus 56.4%59.8% for fiscal 2020.2022. Excluding the impact of foreign currency, gross margin for fiscal 20212023 would have increased 3.3%decreased 0.4% to 59.7%59.4% versus the prior year. Excluding the net impact of restructuring charges in fiscal 20212023 and the net impact of restructuring charges in fiscal 2020,2022, gross margin for fiscal 20212023 would have increased 3.0%1.5% to 61.2%61.9% versus the prior year. Excluding the impact of foreign currency, the net impact of restructuring charges in fiscal 20212023 and the net impact of restructuring charges in fiscal 2020,2022, gross margin for fiscal 20212023 would have increased 2.9%1.4% to 61.0%61.8% versus the prior year. TheThis gross margin increase was driven primarily by a revenue mix shiftactions to reduce the fixed cost base within our higher marginWorkshops + Digital business and cycling against the lower margin revenues from the WW Presents: Oprah’s 2020 Visionbusiness. tour, partially offset by an increase in fixed costs in our Digital business primarily related to Digital 360.
Marketing
Marketing expenses for fiscal 2021 increased $0.72023 decreased $6.4 million, or 0.3%2.6%, versus fiscal 2020.2022. Excluding the impact of foreign currency, which increaseddecreased marketing expenses in fiscal 20212023 by $5.9$0.8 million, marketing expenses for fiscal 20212023 would have decreased 2.0%2.3% versus fiscal 2020.the prior year. This decrease in marketing expenses was primarily due to lower spend on TV advertising and production, celebrity fees, and other related costs, partially offset by higher spend for Online advertising. Marketing expenses as a percentage of revenue for fiscal 2023 increased to 21.6% in26.8% from 23.5% for fiscal 2021 as compared to 18.9% in fiscal 2020.2022.
Selling, General and Administrative
Selling, general and administrative expenses for fiscal 2021 decreased $28.72023 increased $1.1 million, or 9.6%0.4%, versus fiscal 2020. Excluding the2022. Foreign currency had a de minimis impact of foreign currency, which increased selling, general and administrative expenses in fiscal 2021 by $3.2 million,on selling, general and administrative expenses for fiscal 2021 would have decreased 10.7% versus the prior year.2023. Excluding the net impact of the $4.5$33.7 million of restructuring charges in fiscal 2021 and2023, the impact of boththe $8.6 million of acquisition transaction costs in fiscal 2023 and the net impact of the $32.7 million Winfrey Stock Compensation expense and the $9.8 million of restructuring charges in fiscal 2020,2022, selling, general and administrative expenses for fiscal 2021 would have increased by 3.7%, or 2.4% on a constant currency basis, versus the prior year. This increase in selling, general and administrative expenses was driven primarily by higher employee compensation and related expenses. Selling, general and administrative expenses as a percentage of revenue increased to 22.2% in fiscal 2021 as compared to 21.6% in fiscal 2020.
Impairment
In performing our interim impairment analysis for our Brazil reporting unit during the first quarter of fiscal 2020, we determined that, based on the fair values calculated, the carrying amount of goodwill related to our Brazil reporting unit exceeded our fair value and recorded an impairment charge of $3.7 million in fiscal 2020.
46
Operating Income
Operating income for fiscal 2021 decreased $19.9 million, or 9.2%, versus fiscal 2020. Excluding the impact of foreign currency, which positively impacted operating income in fiscal 2021 by $6.8 million, operating income for fiscal 2021 would have decreased 12.3% versus the prior year. Excluding the net impact of the $19.9 million of restructuring charges in fiscal 2021 and the impact of the $33.1 million of restructuring charges, the $32.7 million Winfrey Stock Compensation expense and the $3.7 million goodwill impairment charge related to our Brazil reporting unit in fiscal 2020, operating income for fiscal 20212023 would have decreased by 24.3%3.7%, or 26.7%both as adjusted and as adjusted on a constant currency basis, versus the prior year. This decrease in operating incomeselling, general and administrative expenses was driven primarily due to lower compensation expense and related costs as a result of the 2022 and 2023 restructuring plans, partially offset by non-transaction related costs associated with the acquisition of Sequence. Selling, general and administrative expenses as a decrease in gross profit as compared to the prior year. Operating income marginpercentage of revenue for fiscal 20212023 increased 0.5% to 16.2%29.8% from 15.7%25.4% for fiscal 2020.2022. Excluding the net impact of restructuring charges in fiscal 20212023, the impact of acquisition transaction costs in fiscal 2023 and the net impact of restructuring charges the Winfrey Stock Compensation expense and the goodwill impairment charge in fiscal 2020, operating income margin for fiscal 2021 would have decreased by 2.9%, or 3.1% on a constant currency basis, versus the prior year. This decrease in operating income margin was driven primarily by an increase in2022, selling, general and administrative expenses as a percentage of revenue for fiscal 2023 would have increased by 2.8%, both as adjusted and as adjusted on a constant currency basis, versus the prior year.
57
Impairments
During the fourth quarter of fiscal 2023, we had a shift in future strategic priorities and as a result, a triggering event occurred which required us to impair the remaining (i) goodwill balances for our Republic of Ireland and Northern Ireland reporting units, resulting in goodwill impairment charges of $2.4 million and $1.2 million, respectively, and (ii) franchise rights acquired balance for our Northern Ireland unit of account, resulting in a franchise rights acquired impairment charge of $47 thousand.
In performing our interim impairment analysis as of December 31, 2022, we determined that the carrying amounts of our United States, Canada, United Kingdom and Australia franchise rights acquired with indefinite-lived units of account exceeded their respective fair values and, as a result, we recorded impairment charges for our United States, Canada, United Kingdom and Australia units of account of $25.7 million, $19.7 million (which comprised the remaining balance of franchise rights acquired for this unit of account), $8.3 million and $1.9 million, respectively, in the fourth quarter of fiscal 2022. In addition, with respect to our Republic of Ireland reporting unit, during the fourth quarter of fiscal 2022, we made a strategic decision to delay the launch of the Digital business in that country. As a result of this decision, a triggering event occurred which required us to perform an interim goodwill impairment analysis. In performing our discounted cash flow analysis, we determined that the carrying amount of this reporting unit exceeded its fair value and, as a result, we recorded an impairment charge of $2.0 million.
In performing our interim impairment analysis as of October 1, 2022, we determined that the carrying amounts of our United States, Canada and New Zealand franchise rights acquired with indefinite-lived units of account exceeded their respective fair values and, as a result, we recorded impairment charges for our United States, Canada and New Zealand units of account of $298.3 million, $13.3 million and $1.1 million, respectively, in the third quarter of fiscal 2022.
In performing our annual impairment analysis as of May 8, 2022, we determined that the carrying amounts of our Canada and New Zealand franchise rights acquired with indefinite-lived units of account exceeded their respective fair values and, as a result, we recorded impairment charges for our Canada and New Zealand units of account of $24.5 million and $0.8 million, respectively, in the second quarter of fiscal 2022. In addition, we determined in the second quarter of fiscal 2022 to exit the Kurbo business in the third quarter of fiscal 2022 as part of our strategic plan. As a result of this determination, we recorded an impairment charge of $1.1 million in the second quarter of fiscal 2022, which comprised the entire goodwill balance for Kurbo.
Operating Income (Loss)
Operating income for fiscal 2023 was $22.3 million compared to operating loss for fiscal 2022 of $284.0 million. Operating income for fiscal 2023 was positively impacted by $2.0 million of foreign currency. Excluding the net impact of the $54.9 million of restructuring charges in fiscal 2023, the impact of the $8.6 million of acquisition transaction costs in fiscal 2023, the impact of the $3.6 million of franchise rights acquired and goodwill impairments in fiscal 2023, the impact of the $396.7 million of franchise rights acquired and goodwill impairments in fiscal 2022 and the net impact of the $39.7 million of restructuring charges in fiscal 2022, operating income would have been $89.5 million for fiscal 2023 versus operating income of $152.5 million for fiscal 2022, a decrease of 41.3%, or 42.7% on a constant currency basis. Operating income margin for fiscal 2023 was 2.5% compared to operating loss margin for fiscal 2022 of 27.3%. Excluding the net impact of restructuring charges in fiscal 2023, the impact of acquisition transaction costs in fiscal 2023, the impact of the franchise rights acquired and goodwill impairments in fiscal 2023, the impact of the franchise rights acquired and goodwill impairments in fiscal 2022 and the net impact of restructuring charges in fiscal 2022, operating income margin would have been 10.1% for fiscal 2023 versus operating income margin of 14.7% for fiscal 2022, a decrease of 4.6%, or 4.8% on a constant currency basis. This decrease in operating income margin was driven by an increase in marketing expenses as a percentage of revenue and an increase in marketingselling, general and administrative expenses as a percentage of revenue, partially offset by an increase in gross margin, versus the prior year.
58
Interest Expense
Interest expense for fiscal 2021 decreased $35.42023 increased $14.8 million, or 28.7%18.2%,versus fiscal 2020.2022. The decreaseincrease in interest expense was driven primarily by lower interest rates underan increase in the base rate of our New Term Loan Facility (as defined below) and on our Senior Secured Notes (as defined below) as a result of our April 2021 debt refinancing (as defined below). The effective interest rate on our debt, based on interest incurred (which includes amortization of our deferred financing costs and debt discount) and our average borrowings during fiscal 20212023 and fiscal 20202022 and excluding the impact of our interest rate swaps then in effect, decreasedincreased to 5.15%7.64% per annum at the end of fiscal 20212023 from 6.94%5.45% per annum at the end of fiscal 2020.2022. Including the impact of our interest rate swaps then in effect, the effective interest rate on our debt, based on interest incurred (which includes amortization of our deferred financing costs and debt discount) and our average borrowings during fiscal 20212023 and fiscal 2020, decreased2022, increased to 5.85%6.73% per annum at the end of fiscal 20212023 from 7.72%5.67% per annum at the end of fiscal 2020.2022. See “—Liquidity and Capital Resources—Long-Term Debt” for additional details regarding our debt, including interest rates and payments thereon. For additional details on our interest rate swaps, see “Item 7A. Quantitative and Qualitative Disclosures about Market Risk” in this Annual Report on Form 10-K.
Other Expense, Net
Other expense, net, which consists primarily of the impact of foreign currency on intercompany transactions, increaseddecreased by $1.0$1.6 million infor fiscal 20212023 to $1.4$0.1 million of expense as compared to $0.3$1.7 millionof expense in the prior year.for fiscal 2022.
Early Extinguishment of DebtTax
In fiscal 2021, we recorded $30.4 million in an aggregate amount of early extinguishment of debt charges, comprised of (1) $29.2 million recorded in the second quarter of fiscal 2021 resulting from fees in connection with the April 2021 debt refinancing, consisting of $12.9 million of a prepayment penalty on the Discharged Senior Notes (as defined below), $9.0 million of financing fees and the write-off of $7.2 million of pre-existing deferred financing fees and debt discount and (2) $1.2 million recorded in the fourth quarter of fiscal 2021 resulting from the write-off of a debt discount and deferred financing fees in connection with the voluntary debt prepayments of our outstanding term loans under the New Term Loan Facility. For additional details, see “—Liquidity and Capital Resources—Long-Term Debt”.
Tax
Our effective tax rate for fiscal 20212023 was 12.7% as(52.5%) compared to 18.9%30.0% for fiscal 2020.2022. The tax expense for fiscal 20212023 was impacted by a tax benefit related to a decrease in the applicable state tax rate on certain deferred income, a tax benefit related to tax windfalls from stock compensation and a tax benefitexpense due to the reversal of a valuation allowance related to certain non-U.S. net operating losses that are now expected to be realized, partially offset byand a tax expense related to income earned in foreign jurisdictions at rates higher than the U.S.
47
The tax expense for fiscal 2020 was impacted, partially offset by a tax benefit related to the reversal of thestate tax impact of global intangible low-taxed income, or GILTI, a tax benefit related to tax windfalls from stock compensation and a tax benefit related to foreign-derived intangible income (“FDII”).
We continue to evaluate the realizability of our deferred tax assets and based on the weight of the available evidence, we provided a full valuation allowance against the U.S. deferred tax assets.
The tax benefit for fiscal 2022 was impacted by a tax benefit from a legal entity restructuring in connection with an organizational realignment to simplify the Company’s corporate structure and reduce associated costs (the “Organizational Realignment”), which resulted in a reversal of certain deferred tax liabilities, and a tax benefit related to FDII. These benefits were partially offset by a tax expense from a valuation allowance established to offset certain deferred tax assets due to the uncertainty of realizing future tax benefits from its interest expense carryforwards, a tax expense related to income earned in foreign jurisdictions at rates higher than the U.S., and out-of-period incomea tax adjustments.
On March 27, 2020, the Coronavirus Aid, Relief and Economic Security Act, or the CARES Act, was signed into law. The CARES Act includes provisions relating to modifications to the net interest deduction limitation, net operating loss carryforward rules, refundable payroll tax credits and deferment of the employer portion of certain payroll taxes.
On July 20, 2020, the U.S. Treasury Department released final regulations under Internal Revenue Code Section 951A (TD 9902) permitting a taxpayer to elect to exclude from its GILTI inclusion items of income subject to a high effective rate of foreign tax. As a result of the final regulations, we recorded a $7.6 million tax benefit in fiscal 2020expense related to the fiscal 2018 and fiscal 2019 taxes previously accrued attributable to GILTI.
Net Income Attributable to the Company and Earnings Per Sharetax shortfalls from stock compensation.
Net income attributable to the CompanyLoss and Diluted Net Loss Per Share
Net loss for fiscal 20212023 was $66.9$112.3 million, which reflected a $8.2decrease of $144.6 million, or 56.3%, or 10.9%, decrease fromcompared to net loss for fiscal 2020. 2022 of $256.9 million. Excluding the impact of foreign currency, which positively impacted net income attributable to the Companyloss in fiscal 20212023 by $4.9$1.4 million, net income attributable to the Companyloss for fiscal 20212023 would have decreased by 17.4%55.8% versus the prior year. Net income attributable to the Companyloss for fiscal 20212023 included a $22.7$41.2 million net impact from restructuring charges, a $7.5 million impact from the write-off of fees related to our aggregate early extinguishment of debt chargesacquisition transaction costs, and a $14.9$3.6 million impact from franchise rights acquired and goodwill impairments. Additionally, net loss for fiscal 2023 included a $50.6 million tax expense from the increase in the partial valuation allowance established in fiscal 2022 to a full valuation allowance in fiscal 2023 to offset all U.S. deferred tax assets due to the uncertainty of realizing future tax benefits of the assets. Net loss for fiscal 2022 included a $301.3 million impact from franchise rights acquired and goodwill impairments and a $29.8 million net impact from restructuring charges. Additionally, net income attributable to the Companyloss for fiscal 20212022 included a $6.3$48.3 million tax benefit related tofrom a decreaselegal entity restructuring in connection with the applicable state tax rate onOrganizational Realignment which resulted in a reversal of certain deferred incometax liabilities and a $1.6$27.1 million tax benefitexpense from a valuation allowance established to offset certain deferred tax assets due to the reversaluncertainty of a valuation allowance related to certain non-U.S.realizing future tax benefits from its interest expense carryforwards.
59
Diluted net operating losses that are now expected to be realized. Net income attributable to the Companyloss per share for fiscal 20202023 was $1.46 compared to diluted net loss per share for fiscal 2022 of $3.65. Diluted net loss per share for fiscal 2023 included a $24.8 million$0.54 net impact from restructuring charges, a $24.5 million$0.10 impact from the Winfrey Stock Compensation expenseacquisition transaction costs, and a $2.7 million$0.05 impact from franchise rights acquired and goodwill impairments. Additionally, diluted net loss per share for fiscal 2023 included a $0.66 tax expense from the goodwill impairment charge relatedincrease in the partial valuation allowance established in fiscal 2022 to our Brazil reporting unit. Additionally, net income attributablea full valuation allowance in fiscal 2023 to offset all U.S. deferred tax assets due to the Companyuncertainty of realizing future tax benefits of the assets. Diluted net loss per share for fiscal 20202022 included a $7.6 million tax benefit related to the reversal of the fiscal 2018 and fiscal 2019 tax impact of GILTI.
Earnings per fully diluted share, or EPS, for fiscal 2021 was $0.95 compared to $1.07 for fiscal 2020. EPS for fiscal 2021 included a $0.32$4.28 impact from the write-off of fees related to our aggregate early extinguishment of debt chargesfranchise rights acquired and goodwill impairments and a $0.21$0.42 net impact from restructuring charges. Additionally, EPSdiluted net loss per share for fiscal 20212022 included a $0.09$0.69 tax benefit related tofrom a decreaselegal entity restructuring in connection with the applicable state tax rate onOrganizational Realignment which resulted in a reversal of certain deferred incometax liabilities and a $0.02$0.39 tax benefitexpense from a valuation allowance established to offset certain deferred tax assets due to the reversaluncertainty of a valuation allowance related to certain non-U.S. net operating losses that are now expected to be realized. EPS for fiscal 2020 included a $0.35 impactrealizing future tax benefits from restructuring charges, a $0.35 impact from the Winfrey Stock Compensationits interest expense and a $0.04 impact from the goodwill impairment charge related to our Brazil reporting unit. Additionally, EPS for fiscal 2020 included an $0.11 tax benefit related to the reversal of the fiscal 2018 and fiscal 2019 tax impact of GILTI. carryforwards.
48
Segment Results
Metrics and Business Trends
The following tables set forth key metrics by reportable segment for fiscal 20212023 and the percentage change in those metrics versus the prior year:year, as applicable:
(in millions except percentages and as noted)
|
| Fiscal 2021 |
| |||||||||||||||||||||||||||||||||
|
| GAAP |
|
| Constant Currency |
|
|
|
|
|
|
|
|
|
|
|
|
| ||||||||||||||||||
|
|
|
|
|
| Product |
|
|
|
|
|
|
|
|
|
| Product |
|
|
|
|
|
| Total |
|
|
|
|
|
|
|
|
| |||
|
| Subscription |
|
| Sales & |
|
| Total |
|
| Subscription |
|
| Sales & |
|
| Total |
|
| Paid |
|
| Incoming |
|
| EOP |
| |||||||||
|
| Revenues |
|
| Other |
|
| Revenues |
|
| Revenues |
|
| Other |
|
| Revenues |
|
| Weeks |
|
| Subscribers |
|
| Subscribers |
| |||||||||
|
|
|
|
|
|
|
|
|
|
|
|
|
|
|
|
|
|
|
|
|
|
|
|
|
|
|
|
|
| (in thousands) |
| |||||
North America |
| $ | 714.2 |
|
| $ | 100.6 |
|
| $ | 814.8 |
|
| $ | 711.1 |
|
| $ | 100.0 |
|
| $ | 811.2 |
|
|
| 157.0 |
|
|
| 2,822.3 |
|
|
| 2,734.9 |
|
CE |
|
| 265.0 |
|
|
| 32.9 |
|
|
| 297.9 |
|
|
| 254.1 |
|
|
| 31.3 |
|
|
| 285.3 |
|
|
| 64.8 |
|
|
| 1,179.6 |
|
|
| 1,094.1 |
|
UK |
|
| 55.1 |
|
|
| 10.8 |
|
|
| 65.8 |
|
|
| 51.3 |
|
|
| 10.0 |
|
|
| 61.3 |
|
|
| 16.4 |
|
|
| 323.5 |
|
|
| 245.0 |
|
Other (1) |
|
| 28.8 |
|
|
| 5.2 |
|
|
| 33.9 |
|
|
| 26.6 |
|
|
| 4.9 |
|
|
| 31.5 |
|
|
| 5.2 |
|
|
| 97.7 |
|
|
| 94.5 |
|
Total |
| $ | 1,063.0 |
|
| $ | 149.4 |
|
| $ | 1,212.5 |
|
| $ | 1,043.1 |
|
| $ | 146.2 |
|
| $ | 1,189.2 |
|
|
| 243.4 |
|
|
| 4,423.0 |
|
|
| 4,168.6 |
|
|
|
|
|
|
|
|
|
|
|
|
|
|
|
|
|
|
|
|
|
|
|
|
|
|
|
|
|
|
|
|
|
|
|
|
|
|
|
| % Change Fiscal 2021 vs. Fiscal 2020 |
| |||||||||||||||||||||||||||||||||
North America |
|
| (12.3 | %) |
|
| (21.3 | %) |
|
| (13.5 | %) |
|
| (12.7 | %) |
|
| (21.7 | %) |
|
| (13.9 | %) |
|
| (4.2 | %) |
|
| 3.7 | % |
|
| (3.1 | %) |
CE |
|
| (3.7 | %) |
|
| (13.9 | %) |
|
| (4.9 | %) |
|
| (7.7 | %) |
|
| (18.2 | %) |
|
| (8.9 | %) |
|
| 0.3 | % |
|
| 11.3 | % |
|
| (7.2 | %) |
UK |
|
| (18.1 | %) |
|
| (37.4 | %) |
|
| (22.0 | %) |
|
| (23.7 | %) |
|
| (41.8 | %) |
|
| (27.4 | %) |
|
| (19.0 | %) |
|
| (10.5 | %) |
|
| (24.3 | %) |
Other (1) |
|
| (3.4 | %) |
|
| (39.1 | %) |
|
| (11.3 | %) |
|
| (10.6 | %) |
|
| (42.8 | %) |
|
| (17.7 | %) |
|
| (4.6 | %) |
|
| (4.3 | %) |
|
| (3.2 | %) |
Total |
|
| (10.4 | %) |
|
| (22.0 | %) |
|
| (12.0 | %) |
|
| (12.1 | %) |
|
| (23.7 | %) |
|
| (13.7 | %) |
|
| (4.3 | %) |
|
| 4.2 | % |
|
| (5.8 | %) |
|
| Fiscal 2023 |
| |||||||||||||||||||||||||||||||||
|
| GAAP |
|
| Constant Currency |
|
|
|
|
|
|
|
|
|
| |||||||||||||||||||||
|
| Subscription |
|
| Product |
|
| Total |
|
| Subscription |
|
| Product |
|
| Total |
|
| Total |
|
| Incoming |
|
| EOP |
| |||||||||
|
|
|
|
|
|
|
|
|
|
|
|
|
|
|
|
|
|
|
|
|
|
| (in thousands) |
| ||||||||||||
North America |
| $ | 583.6 |
|
| $ | 54.6 |
|
| $ | 638.2 |
|
| $ | 584.8 |
|
| $ | 54.7 |
|
| $ | 639.5 |
|
|
| 137.5 |
|
|
| 2,337.0 |
|
|
| 2,498.7 |
|
International |
|
| 239.2 |
|
|
| 12.2 |
|
|
| 251.4 |
|
|
| 236.8 |
|
|
| 12.5 |
|
|
| 249.3 |
|
|
| 69.7 |
|
|
| 1,209.2 |
|
|
| 1,298.9 |
|
Total |
| $ | 822.8 |
|
| $ | 66.8 |
|
| $ | 889.6 |
|
| $ | 821.6 |
|
| $ | 67.2 |
|
| $ | 888.8 |
|
|
| 207.2 |
|
|
| 3,546.1 |
|
|
| 3,797.5 |
|
|
|
|
|
|
|
|
|
|
|
|
|
|
|
|
|
|
|
|
|
|
|
|
|
|
|
|
| |||||||||
|
| % Change Fiscal 2023 vs. Fiscal 2022 |
| |||||||||||||||||||||||||||||||||
North America |
|
| (8.8 | %) |
|
| (37.3 | %) |
|
| (12.3 | %) |
|
| (8.7 | %) |
|
| (37.2 | %) |
|
| (12.1 | %) |
|
| (2.7 | %) |
|
| (14.6 | %) |
|
| 6.9 | % |
International |
|
| (14.2 | %) |
|
| (63.8 | %) |
|
| (19.6 | %) |
|
| (15.1 | %) |
|
| (62.9 | %) |
|
| (20.2 | %) |
|
| (6.2 | %) |
|
| (15.7 | %) |
|
| 7.4 | % |
Total |
|
| (10.5 | %) |
|
| (44.7 | %) |
|
| (14.5 | %) |
|
| (10.6 | %) |
|
| (44.3 | %) |
|
| (14.5 | %) |
|
| (3.9 | %) |
|
| (14.9 | %) |
|
| 7.1 | % |
Note: Totals may not sum due to rounding.
|
|
(in millions except percentages and as noted)
|
| Fiscal 2021 |
| |||||||||||||||||||||||||||||||||||||
|
| Digital Subscription Revenues |
|
| Digital |
|
| Incoming |
|
| EOP |
|
| Workshops + Digital Fees |
|
| Workshops + Digital |
|
| Incoming Workshops |
|
| EOP Workshops |
| ||||||||||||||||
|
|
|
|
|
| Constant |
|
| Paid |
|
| Digital |
|
| Digital |
|
|
|
|
|
| Constant |
|
| Paid |
|
| + Digital |
|
| + Digital |
| ||||||||
|
| GAAP |
|
| Currency |
|
| Weeks |
|
| Subscribers |
|
| Subscribers |
|
| GAAP |
|
| Currency |
|
| Weeks |
|
| Subscribers |
|
| Subscribers |
| ||||||||||
|
|
|
|
|
|
|
|
|
|
|
|
|
| (in thousands) |
|
|
|
|
|
|
|
|
|
|
|
|
|
| (in thousands) |
| ||||||||||
North America |
| $ | 504.2 |
|
| $ | 501.7 |
|
|
| 128.3 |
|
|
| 2,334.1 |
|
|
| 2,186.9 |
|
| $ | 210.1 |
|
| $ | 209.4 |
|
|
| 28.7 |
|
|
| 488.2 |
|
|
| 548.0 |
|
CE |
|
| 228.3 |
|
|
| 218.9 |
|
|
| 59.3 |
|
|
| 1,059.9 |
|
|
| 998.5 |
|
|
| 36.7 |
|
|
| 35.2 |
|
|
| 5.5 |
|
|
| 119.7 |
|
|
| 95.7 |
|
UK |
|
| 36.3 |
|
|
| 33.8 |
|
|
| 12.4 |
|
|
| 235.0 |
|
|
| 179.7 |
|
|
| 18.7 |
|
|
| 17.4 |
|
|
| 4.0 |
|
|
| 88.5 |
|
|
| 65.3 |
|
Other (1) |
|
| 19.4 |
|
|
| 17.9 |
|
|
| 4.1 |
|
|
| 74.0 |
|
|
| 76.0 |
|
|
| 9.4 |
|
|
| 8.7 |
|
|
| 1.2 |
|
|
| 23.7 |
|
|
| 18.5 |
|
Total |
| $ | 788.2 |
|
| $ | 772.4 |
|
|
| 204.1 |
|
|
| 3,703.0 |
|
|
| 3,441.1 |
|
| $ | 274.9 |
|
| $ | 270.7 |
|
|
| 39.3 |
|
|
| 720.0 |
|
|
| 727.4 |
|
|
|
|
|
|
|
|
|
|
|
|
|
|
|
|
|
|
|
|
|
|
|
|
|
|
|
|
|
|
|
|
|
|
|
|
|
|
|
|
|
|
|
| % Change Fiscal 2021 vs. Fiscal 2020 |
| |||||||||||||||||||||||||||||||||||||
North America |
|
| 4.1 | % |
|
| 3.6 | % |
|
| 3.0 | % |
|
| 24.8 | % |
|
| (6.3 | %) |
|
| (36.3 | %) |
|
| (36.5 | %) |
|
| (27.1 | %) |
|
| (42.7 | %) |
|
| 12.3 | % |
CE |
|
| 9.8 | % |
|
| 5.3 | % |
|
| 7.4 | % |
|
| 22.8 | % |
|
| (5.8 | %) |
|
| (45.4 | %) |
|
| (47.7 | %) |
|
| (41.6 | %) |
|
| (39.1 | %) |
|
| (20.1 | %) |
UK |
|
| 7.2 | % |
|
| (0.3 | %) |
|
| (1.8 | %) |
|
| 23.9 | % |
|
| (23.5 | %) |
|
| (43.8 | %) |
|
| (47.6 | %) |
|
| (47.6 | %) |
|
| (48.5 | %) |
|
| (26.2 | %) |
Other (1) |
|
| 16.1 | % |
|
| 7.5 | % |
|
| 7.0 | % |
|
| 20.1 | % |
|
| 2.8 | % |
|
| (28.2 | %) |
|
| (33.6 | %) |
|
| (30.6 | %) |
|
| (41.5 | %) |
|
| (21.9 | %) |
Total |
|
| 6.1 | % |
|
| 3.9 | % |
|
| 4.0 | % |
|
| 24.0 | % |
|
| (7.1 | %) |
|
| (38.0 | %) |
|
| (39.0 | %) |
|
| (32.3 | %) |
|
| (42.9 | %) |
|
| 1.0 | % |
|
| Fiscal 2023 |
| |||||||||||||||||||||||||||||||||||||
|
| Digital Subscription Revenues |
|
|
|
|
|
|
|
|
|
|
| Workshops + Digital Fees |
|
|
|
|
|
|
|
|
|
| ||||||||||||||||
|
| GAAP |
|
| Constant |
|
| Digital |
|
| Incoming |
|
| EOP |
|
| GAAP |
|
| Constant |
|
| Workshops |
|
| Incoming |
|
| EOP |
| ||||||||||
|
|
|
|
|
|
|
|
|
|
| (in thousands) |
|
|
|
|
|
|
|
|
|
|
| (in thousands) |
| ||||||||||||||||
North America |
| $ | 374.0 |
|
| $ | 374.9 |
|
|
| 107.5 |
|
|
| 1,802.5 |
|
|
| 1,948.0 |
|
| $ | 179.1 |
|
| $ | 179.4 |
|
|
| 28.4 |
|
|
| 534.5 |
|
|
| 484.0 |
|
International |
|
| 197.1 |
|
|
| 194.8 |
|
|
| 60.4 |
|
|
| 1,033.1 |
|
|
| 1,131.4 |
|
|
| 42.1 |
|
|
| 42.0 |
|
|
| 9.3 |
|
|
| 176.0 |
|
|
| 167.5 |
|
Total |
| $ | 571.1 |
|
| $ | 569.7 |
|
|
| 167.9 |
|
|
| 2,835.6 |
|
|
| 3,079.4 |
|
| $ | 221.1 |
|
| $ | 221.3 |
|
|
| 37.7 |
|
|
| 710.5 |
|
|
| 651.5 |
|
|
|
|
|
|
|
|
|
|
|
|
|
|
|
|
|
|
|
|
|
|
|
|
|
|
|
|
|
|
|
| ||||||||||
|
| % Change Fiscal 2023 vs. Fiscal 2022 |
| |||||||||||||||||||||||||||||||||||||
North America |
|
| (14.2 | %) |
|
| (14.0 | %) |
|
| (3.5 | %) |
|
| (17.6 | %) |
|
| 8.1 | % |
|
| (12.3 | %) |
|
| (12.1 | %) |
|
| (5.0 | %) |
|
| (2.5 | %) |
|
| (9.4 | %) |
International |
|
| (13.0 | %) |
|
| (14.0 | %) |
|
| (6.2 | %) |
|
| (17.6 | %) |
|
| 9.5 | % |
|
| (19.5 | %) |
|
| (19.7 | %) |
|
| (6.1 | %) |
|
| (1.9 | %) |
|
| (4.9 | %) |
Total |
|
| (13.8 | %) |
|
| (14.0 | %) |
|
| (4.5 | %) |
|
| (17.6 | %) |
|
| 8.6 | % |
|
| (13.7 | %) |
|
| (13.7 | %) |
|
| (5.3 | %) |
|
| (2.3 | %) |
|
| (8.3 | %) |
Note: Totals may not sum due to rounding.
60 (in millions except as noted)
|
| ||||||||||||||||||||||||||||||||||||||||||||||||||||||||||||||||||||||||||||||||||||||||||||||||||||||||
49
North America Performance
The decrease in North America revenues for fiscal 2021 versus the prior year was driven primarily by a decrease in Subscription Revenues. The decrease in Subscription Revenues for fiscal 2021 versus the prior year was driven primarily by a decrease in Workshops + Digital Fees. Workshops + Digital Fees were negatively impacted by both the lower number of Incoming Workshops + Digital Subscribers at the beginning of fiscal 2021 versus the beginning of fiscal 2020 and the significant recruitment decline in fiscal 2021 as compared to the prior year driven by the closure of certain of our studios and the limited reopening of others primarily related to the COVID-19 environment. The decrease in North America Total Paid Weeks for fiscal 2021 was driven primarily by lower recruitments versus the prior year due to the COVID-19 environment and cycling against the successful launch of the myWW program in fiscal 2020.
The decrease in North America product sales and other for fiscal 2021 versus the prior year was driven primarily by cycling against the revenue received in connection with the WW Presents: Oprah’s 2020 Vision tour in fiscal 2020 and a decrease in in-studio product sales.
Continental Europe Performance
The decrease in Continental Europe revenues for fiscal 20212023 versus the prior year was driven by both a decrease in Subscription Revenues and, to a lesser extent, a decrease in product sales and other. The decrease in Subscription Revenues for fiscal 2021 versus the prior year was driven by a decrease in Workshops + Digital Fees, partially offset by an increase in Digital Subscription Revenues. Workshops + Digital Fees were negatively impacted by both the lower number of Incoming Workshops + Digital Subscribers at the beginning of fiscal 2021 versus the beginning of fiscal 2020 and the significant recruitment decline in fiscal 2021 as compared to the prior year driven by the closure of certain of our studios and the limited reopening of others primarily related to the COVID-19 environment. The slight increase in Continental Europe Total Paid Weeks for fiscal 2021 versus the prior year was driven primarily by the higher number of Incoming Digital Subscribers at the beginning of fiscal 2021 versus the beginning of fiscal 2020, offset by lower recruitments versus the prior year due to the COVID-19 environment.
The decrease in Continental Europe product sales and other for fiscal 20212023 versus the prior year was driven primarily by a decrease in product sales.
United Kingdom Performance
Digital Subscription Revenues and, to a lesser extent, a decrease in Workshops + Digital Fees. Digital Subscription Revenues and Workshops + Digital Fees were both negatively impacted by the lower number of respective Incoming Subscribers at the beginning of fiscal 2023 versus the beginning of fiscal 2022. Subscription Revenues for fiscal 2023 benefited from Clinical Subscription Revenues following our acquisition of Sequence. The decrease in UKNorth America Total Paid Weeks for fiscal 2023 versus the prior year was driven primarily by the lower number of Total Incoming Subscribers at the beginning of fiscal 2023 versus the beginning of fiscal 2022.
The decrease in North America product sales and other for fiscal 2023 versus the prior year was driven primarily by a decline in consumer product sales due to the wind down of our consumer products business.
International Performance
The decrease in International revenues for fiscal 20212023 versus the prior year was driven by both a decrease in Subscription Revenues and, to a lesser extent, by a decrease in product sales and other. The decrease in Subscription Revenues for fiscal 2021 versus the prior year was driven primarily by a decrease in Workshops + Digital Fees. Workshops + Digital Fees were negatively impacted by both the lower number of Incoming Workshops + Digital Subscribers at the beginning of fiscal 2021 versus the beginning of fiscal 2020 and the significant recruitment decline in fiscal 2021 as compared to the prior year driven by the closure of certain of our studios and the limited reopening of others primarily related to the COVID-19 environment. The decrease in UK Total Paid Weeks for fiscal 2021 was driven primarily by lower recruitments versus the prior year due to the COVID-19 environment and cycling against the successful launch of the myWW program in fiscal 2020.
The decrease in UK product sales and other for fiscal 2021 versus the prior year was driven primarily by a decrease in product sales.
Other Performance
The decrease in Other revenues for fiscal 2021 versus the prior year was driven by both a decrease in product sales and other and a decrease in Subscription Revenues. The decrease in Subscription Revenues for fiscal 20212023 versus the prior year was driven by a decrease in Digital Subscription Revenues and, to a lesser extent, a decrease in Workshops + Digital Fees, partially offset by an increase inFees. Digital Subscription Revenues.Revenues and Workshops + Digital Fees were both negatively impacted by both the lower number of respective Incoming Workshops + Digital Subscribers at the beginning of fiscal 20212023 versus the beginning of fiscal 2020 and the recruitment decline2022. The decrease in International Total Paid Weeks for fiscal 2021 as compared to2023 versus the prior year was driven primarily by the closurelower number of certainTotal Incoming Subscribers at the beginning of our studios andfiscal 2023 versus the limited reopeningbeginning of others primarily related to the COVID-19 environment.fiscal 2022.
The decrease in OtherInternational product sales and other for fiscal 20212023 versus the prior year was driven primarily by a decreasedecline in franchise commissions andconsumer product sales.sales due to the wind down of our consumer products business.
50
Liquidity and Capital Resources
Cash flows provided by operating activities have historically supplied and are expected to continue to supply, us with our primary source of liquidity. We usehave used these cash flows, supplemented with long-term debt and short-term borrowings, to fund our operations and global strategic initiatives, pay down debt and engage in selective acquisitions. Upon the completion of our acquisition of Sequence (the “Acquisition”), in the second quarter of fiscal 2023, we had a net cash outlay of $40.3 million on April 10, 2023 with respect to the payment of the purchase price and certain transaction costs. For additional details on the purchase price consideration for the Acquisition and related terms, see Note 6 “Acquisitions” of the notes to the audited consolidated financial statements contained in this Annual Report on Form 10-K. This cash outlay has reduced the liquidity available to us in the future. See “Risk Factors—Risks Related to Our Acquisition of Weekend Health, Inc. (d/b/a Sequence)—The Acquisition may not achieve its intended results.” and “Risk Factors—Risks Related to Our Liquidity—We may not be able to generate sufficient cash to service all of our debt and satisfy our other liquidity requirements.” for additional details. We currently believe that cash generated by operations, our cash on hand of approximately $153.8 $109.4 million at January 1, 2022, December 30, 2023, our $173.9 million of availability under our New Revolving Credit Facility (as defined and described below) at January 1, 2022 December 30, 2023 and our continued cost focus will provide us with sufficient liquidity to meet our obligations for the short- and long-term.In addition, if necessary, we have the flexibility to delay investments or reduce marketing spend.
61
We continue to proactively manage our liquidity so we can maintain flexibility to fund investments in our business, honor our long-term debt obligations, and respond to evolving business and consumer conditions arising from the COVID-19 pandemic.conditions. To increase our flexibility and reduce our cash interest payments, we refinanced our then-existing credit facilities and then-existing senior notes in April 2021. See “—Long-Term Debt” for additional details on this refinancing. Additionally, we instituted a number of measures throughout our operations to mitigate expenses and reduce costs as well as ensure liquidity liquidity. For example, we instituted restructuring plans in recent fiscal years which have resulted in aggregate cash outlays of approximately $44.6 million in fiscal 2023 and are expected to result in aggregate cash outlays of approximately $18.5 million in fiscal 2024. For additional details, see Note 23 “Restructuring” of the availability of our New Revolving Credit Facility.notes to the audited consolidated financial statements contained in this Annual Report on Form 10-K. The evolving nature, and uncertain economic impact, of COVID-19the current demand environment may impact our liquidity going forward. To the extent that we do not successfully manage our costs, our liquidity and financial results, as well as our ability to fully access our New Revolving Credit Facility, may be adversely affected.
As market conditions warrant, we may, from time to time, seek to purchase our outstanding debt securities or loans, including the Senior Secured Notes and borrowings under the New Credit Facilities (each as defined below). Such transactions could be privately negotiated or open market transactions, pursuant to tender offers or otherwise. Subject to any applicable limitations contained in the agreements governing, or terms of, our indebtedness, any such purchases made by us may be funded by the use of cash on our balance sheet, the incurrence of new secured or unsecured debt, the issuance of our equity or the sale of assets. The amounts involved in any such purchase transactions, individually or in the aggregate, may be material. Any such purchases may equate to a substantial amount of a particular class or series of debt, which may reduce the trading liquidity of such class or series.
Balance Sheet Working Capital
The following table sets forth certain relevant measures of our balance sheet working capital deficit, excluding cash and cash equivalents and current portion of long-term debt at:
|
| December 30, |
|
| December 31, |
|
| Increase/ |
| |||
|
| 2023 |
|
| 2022 |
|
| (Decrease) |
| |||
|
| (in millions) |
| |||||||||
Total current assets |
| $ | 179.5 |
|
| $ | 281.3 |
|
| $ | (101.9 | ) |
Total current liabilities |
|
| 205.5 |
|
|
| 196.6 |
|
|
| 8.9 |
|
Working capital (deficit) surplus |
|
| (26.0 | ) |
|
| 84.8 |
|
|
| 110.8 |
|
Cash and cash equivalents |
|
| 109.4 |
|
|
| 178.3 |
|
|
| (69.0 | ) |
Working capital deficit, excluding cash and cash equivalents |
| $ | (135.4 | ) |
| $ | (93.6 | ) |
| $ | 41.8 |
|
|
| January 1, |
|
| January 2, |
|
| Increase/ |
| |||
|
| 2022 |
|
| 2021 |
|
| (Decrease) |
| |||
|
| (in millions) |
| |||||||||
Total current assets |
| $ | 271.2 |
|
| $ | 299.2 |
|
| $ | (28.0 | ) |
Total current liabilities |
|
| 229.1 |
|
|
| 340.1 |
|
|
| (111.0 | ) |
Working capital surplus (deficit) |
|
| 42.0 |
|
|
| (40.9 | ) |
|
| (82.9 | ) |
Cash and cash equivalents |
|
| 153.8 |
|
|
| 165.9 |
|
|
| (12.1 | ) |
Current portion of long-term debt |
|
| — |
|
|
| 77.0 |
|
|
| (77.0 | ) |
Working capital deficit, excluding cash and cash equivalents and current portion of long-term debt |
| $ | (111.8 | ) |
| $ | (129.8 | ) |
| $ | (18.0 | ) |
Note: Totals may not sum due to rounding.
51
62
The following table sets forth a summary of the primary factors contributing to the $18.0$41.8 million decreaseincrease in our working capital deficit, excluding cash and cash equivalents and current portion of long-term debt:equivalents:
|
|
|
|
|
|
|
|
|
|
| Impact to |
| ||||
|
| December 30, |
|
| December 31, |
|
| Increase/ |
|
| Working |
| ||||
|
| 2023 |
|
| 2022 |
|
| (Decrease) |
|
| Capital Deficit |
| ||||
|
| (in millions) |
| |||||||||||||
Portion of operating lease liabilities due within one year |
| $ | 9.6 |
|
| $ | 18.0 |
|
| $ | (8.3 | ) |
| $ | (8.3 | ) |
Prepaid income taxes |
| $ | 25.4 |
|
| $ | 19.4 |
|
| $ | 5.9 |
|
| $ | (5.9 | ) |
Income taxes payable |
| $ | 1.6 |
|
| $ | 1.6 |
|
| $ | — |
|
| $ | — |
|
Accrued interest |
| $ | 5.3 |
|
| $ | 5.3 |
|
| $ | 0.1 |
|
| $ | 0.1 |
|
Deferred revenue |
| $ | 34.0 |
|
| $ | 32.2 |
|
| $ | 1.8 |
|
| $ | 1.8 |
|
Derivative receivable |
| $ | 3.6 |
|
| $ | 11.7 |
|
| $ | (8.2 | ) |
| $ | 8.2 |
|
Operational liabilities and other, net of assets |
| $ | 113.7 |
|
| $ | 67.8 |
|
| $ | 45.9 |
|
| $ | 45.9 |
|
Working capital deficit change, excluding cash and cash equivalents |
|
|
|
|
|
|
|
|
|
| $ | 41.8 |
| |||
|
|
|
|
|
|
|
|
|
|
|
|
|
| Impact to |
| |
|
| January 1, |
|
| January 2, |
|
| Increase/ |
|
| Working |
| ||||
|
| 2022 |
|
| 2021 |
|
| (Decrease) |
|
| Capital Deficit |
| ||||
|
| (in millions) |
| |||||||||||||
Derivative payable |
| $ | 14.7 |
|
| $ | 28.3 |
|
| $ | (13.6 | ) |
| $ | (13.6 | ) |
Prepaid income taxes |
| $ | 30.5 |
|
| $ | 20.0 |
|
| $ | 10.5 |
|
| $ | (10.5 | ) |
Portion of operating lease liabilities due within one year |
| $ | 20.3 |
|
| $ | 28.6 |
|
| $ | (8.3 | ) |
| $ | (8.3 | ) |
Income taxes payable |
| $ | 1.7 |
|
| $ | 7.8 |
|
| $ | (6.1 | ) |
| $ | (6.1 | ) |
Deferred revenue |
| $ | 45.9 |
|
| $ | 50.5 |
|
| $ | (4.6 | ) |
| $ | (4.6 | ) |
Accrued interest |
| $ | 5.1 |
|
| $ | 2.7 |
|
| $ | 2.4 |
|
| $ | 2.4 |
|
Operational liabilities and other, net of assets |
| $ | 54.7 |
|
| $ | 32.0 |
|
| $ | 22.7 |
|
| $ | 22.7 |
|
Working capital deficit change, excluding cash and cash equivalents and current portion of long-term debt |
|
|
|
|
|
|
|
|
|
|
|
|
| $ | (18.0 | ) |
Note: Totals may not sum due to rounding.
The decrease in derivative payable was due to a change in fair value driven by the change in interest rates. The increase in prepaid income taxes was primarily due to the timing of tax payments, partially offset by tax accruals. The decrease in the portion of operating lease liabilities due within one year was due to the increase in lease terminations. The decrease in income taxes payable was primarily due to operating lease terminations resulting from the continued rationalization of our real estate portfolio. The increase in prepaid income taxes was driven primarily by the timing of tax payments, partially offsetpayments. The decrease in derivative receivable was driven primarily by tax accruals.the continuing maturity of our swaps. The increase in operational liabilities and other, net of assets, which includes accrued salaries and wages, was driven primarily by a declinean increase in inventory balances and a declineaccrued liabilities related to the Acquisition in prepaid advertisingregard to cash to be paid on April 10, 2024, lower inventory due to the timingwind down of payments.our consumer products business, and a decrease in receivables due to changes in promotional activities.
Cash Flows
The following table sets forth a summary of our cash flows for the fiscal years ended:
|
| December 30, |
|
| December 31, |
| ||
|
| 2023 |
|
| 2022 |
| ||
|
| (in millions) |
| |||||
Net cash provided by operating activities |
| $ | 6.7 |
|
| $ | 76.6 |
|
Net cash used for investing activities |
| $ | (74.7 | ) |
| $ | (42.6 | ) |
Net cash used for financing activities |
| $ | (2.7 | ) |
| $ | (4.7 | ) |
|
| January 1, |
|
| January 2, |
| ||
|
| 2022 |
|
| 2021 |
| ||
|
| (in millions) |
| |||||
Net cash provided by operating activities |
| $ | 157.3 |
|
| $ | 135.9 |
|
Net cash used for investing activities |
| $ | (52.8 | ) |
| $ | (65.6 | ) |
Net cash used for financing activities |
| $ | (111.5 | ) |
| $ | (95.5 | ) |
Operating Activities
Fiscal 2021
Cash flows provided by operating activities of $157.3$6.7 million infor fiscal 20212023 reflected an increasea decrease of $21.3$70.0 million from $135.9$76.6 million of cash flows provided by operating activities infor fiscal 2020. The increase2022. This decrease in cash provided byflows from operating activities was primarily the result of an increaseattributable to a decrease in cash provided by operating assets and liabilities,non-cash add-back adjustments, partially offset by a decrease in non-cash add-backsnet loss, in fiscal 20212023 as compared to the prior year.
Fiscal 2020
Cash flows provided by operating activities of $135.9 million in fiscal 2020 reflected a decrease of $46.5 million from $182.4 million of cash flows provided by operating activities in fiscal 2019. The decrease in cash provided by operating activities was primarily the result of a decrease in net income attributable to the Company of $44.5 million in fiscal 2020 as compared to the prior year.
52
Investing Activities
Fiscal 2021
Net cash used for investing activities totaled $52.8$74.7 million infor fiscal 2021, a decrease2023, an increase of $12.8$32.1 million as compared to fiscal 2020. This decrease was primarily attributable to lower capital expenditures in fiscal 2021 as compared to the prior year.
Fiscal 2020
Net cash used for investing activities totaled $65.6 million in fiscal 2020, an increase of $13.0 million as compared to fiscal 2019.2022. This increase was primarily attributable to an increase in cash paid for acquisitions, net of cash acquired, in fiscal 2020. In fiscal 2020, we entered into a strategic collaboration agreement with ClassPass Inc. (“ClassPass”) and also invested $5.0 million in ClassPass’ $285.0 million Series E Preferred Stock funding round.2023 as compared to the prior year.
Financing Activities
Fiscal 2021
Net cash used for financing activities totaled $111.5$2.7 million for fiscal 2023, a decrease of $2.0 million as compared to fiscal 2022. This decrease was primarily attributable to a decrease in cash paid for acquisitions and an increase in proceeds from stock options exercised in fiscal 2021 primarily due2023 as compared to the April 13, 2021 payment in full of approximately $1.2 billion of borrowings under our then-existing credit facilities and redemption of all of the $300.0 million aggregate principal amount of our then-existing senior notes, as well as the payment in aggregate of $37.9 million of prepayment penalties, financing costs and debt discount in connection with the April 2021 debt refinancing. In addition, there was $52.5 million used in an aggregate amount for voluntary debt prepayments under our New Term Loan Facility (as defined below) in the fourth quarter of fiscal 2021, $2.5 million used for scheduled debt repayments under our New Term Loan Facility in the third quarter of fiscal 2021 and $19.3 million used for scheduled debt repayments under our then-existing term loan facility in the first quarter of fiscal 2021. These payments were partially offset by the proceeds received of $1,000.0 million in an aggregate principal amount of borrowings under our New Term Loan Facility and proceeds received from the issuance of $500.0 million in aggregate principal amount of our Senior Secured Notes (as defined below) in connection with our April 2021 debt refinancing. See “—Long-Term Debt” for additional details on debt.prior year.
Fiscal 2020
Net cash used for financing activities totaled $95.5 million in fiscal 2020 primarily due to $96.3 million used for scheduled debt repayments under our then-existing term loan facility. See “—Long-Term Debt” for additional details on debt.
Long-Term Debt
We currently plan to meet our long-term debt obligations by using cash flows provided by operating activities and opportunistically using other means to repay or refinance our obligations as we determine appropriate.
63
The following schedule sets forth our long-term debt obligations at January 1, 2022:December 30, 2023:
Long-Term Debt
At January 1, 2022December 30, 2023
(Balances in millions)
|
| January 1, 2022 |
|
| December 30, 2023 |
| ||
Term Loan Facility due April 13, 2028 |
| $ | 945.0 |
|
| $ | 945.0 |
|
Senior Secured Notes due April 15, 2029 |
|
| 500.0 |
|
|
| 500.0 |
|
Total |
|
| 1,445.0 |
|
|
| 1,445.0 |
|
Less: Current portion |
|
| — |
|
|
| — |
|
Unamortized deferred financing costs |
|
| 12.5 |
|
|
| 8.8 |
|
Unamortized debt discount |
|
| 14.4 |
|
|
| 9.8 |
|
Total long-term debt |
| $ | 1,418.1 |
|
| $ | 1,426.5 |
|
Note: Totals may not sum due to rounding.
53
On April 13, 2021, we (1) repaid in full approximately $1.2 billion in aggregate principal amount of senior secured tranche B term loans due in 2024 under our then-existing credit facilities and (2) redeemed all of the $300.0 million in aggregate principal amount of our then-outstanding 8.625% Senior Notes due in 2025 or the Discharged(the “Discharged Senior NotesNotes”). On April 13, 2021, our then-existing credit facilities included a senior secured revolving credit facility (which included borrowing capacity available for letters of credit) due in 2022 with $175.0 million in an aggregate principal amount of commitments. There were no outstanding borrowings under such revolving credit facility on that date. We funded such repayment of loans and redemption of notes with cash on hand as well as with proceeds received from approximately $1,000.0 million in an aggregate principal amount of borrowings under our new credit facilities (as amended from time to time, the “Credit Facilities”) and proceeds received from the issuance of $500.0 million in aggregate principal amount of 4.500% Senior Secured Notes due 2029 or the Senior(the “Senior Secured Notes.Notes”), each as described below. These transactions are collectively referred to herein as the April“April 2021 debt refinancing. Our new credit facilities consist of a $1,000.0 million term loan facility and a $175.0 million revolving credit facility (which includes borrowing capacity available for letters of credit) (collectively, as amended from time to time, referred to herein as the New Credit Facilities)refinancing”. During the second quarter of fiscal 2021, we incurred fees of $37.9 million (which included $12.9$12.9 million of a prepayment penalty on the Discharged Senior Notes and $5.0 million of a debt discount on our New Term Loan Facility (as(as defined below)below)) in connection with our April 2021 debt refinancing. In addition, we recorded a loss on early extinguishment of debt of $29.2 million in connection thereto. This early extinguishment of debt charge was comprised of $12.9$12.9 million of a prepayment penalty on the Discharged Senior Notes,, $9.0 $9.0 million of financing fees paid in connection with our April 2021 debt refinancing and the write-off of $7.2 million of pre-existing deferred financing fees and debt discount.
New Credit Facilities
The New Credit Facilities were issued under a credit agreement, dated April 13, 2021 or, as(as amended from time to time, the New Credit Agreement,“Credit Agreement”), among the Company, as borrower, the lenders party thereto, and Bank of America, N.A., or (“Bank of America,America”), as administrative agent and an issuing bank. The New Credit Facilities consist of (1) $1,000.0 million in aggregate principal amount of senior secured tranche B term loans due in 2028 or the New Term(the “Term Loan Facility,Facility”) and (2) $175.0 million in an aggregate principal amount of commitments under a senior secured revolving credit facility (which includes borrowing capacity available for letters of credit) due in 2026 or the New Revolving(the “Revolving Credit Facility.Facility”).
In December 2021, we made voluntary prepayments at par in an aggregate amount of $52.5 million in respect of our outstanding term loans under the New Term Loan Facility. As a result of these prepayments, we wrote off a debt discount and deferred financing fees of $1.2 million in the aggregate in the fourth quarter of fiscal 2021.
As of January 1, 2022,December 30, 2023, we had $945.0 million in an aggregate principal amount of loans outstanding under our New Credit Facilities, with $173.9$173.8 million of availability and $1.1$1.2 million in issued but undrawn letters of credit outstanding under the New Revolving Credit Facility.Facility subject to its terms and conditions as discussed below. There were no outstanding borrowings under the New Revolving Credit Facility as of January 1, 2022.December 30, 2023.
64
All obligations under the New Credit Agreement are guaranteed by, subject to certain exceptions, each of our current and future wholly-owned material domestic restricted subsidiaries. All obligations under the New Credit Agreement, and the guarantees of those obligations, are secured by substantially all of the assets of the Company and each guarantor, subject to customary exceptions, including:
|
|
|
|
The New Credit Facilities require the Company to prepay outstanding term loans, subject to certain exceptions, with:
| • 50% (which percentage will be reduced to 25% and 0% if the Company attains certain first lien secured net leverage ratios) of the Company’s annual excess cash flow; • 100% of the net cash proceeds of certain non-ordinary course asset sales by the Company and its restricted subsidiaries (including casualty and condemnation events, subject to de minimis thresholds), and subject to the right to reinvest 100% of such proceeds, subject to certain qualifications; and • 100% of the net proceeds of any issuance or incurrence of debt by the Company or any of its restricted subsidiaries, other than certain debt permitted under the Credit Agreement.
|
|
|
|
54
|
|
The foregoing mandatory prepayments will be used to reduce the installments of principal on the New Term Loan Facility. We may voluntarily repay outstanding loans under the New Credit Facilities at any time without penalty, except for customary “breakage” costs with respect to LIBORTerm SOFR loans under the New Credit Facilities.
In June 2023, in connection with the planned phase-out of LIBOR, we amended our Credit Facilities to replace LIBOR with Term SOFR as the benchmark rate under the Credit Agreement, which will be calculated to include a credit spread adjustment of 0.11448%, 0.26161%, 0.42826%, or 0.71513% for 1, 3, 6, or 12 months period, respectively, in addition to the Term SOFR Screen Rate (as defined in the Credit Agreement) and the margin (which was not amended).
Borrowings under the New Term Loan Facility bear interest at a rate per annum equal to, at our option, either (1) an applicable margin plus a base rate determined by reference to the highest of (a) 0.50% per annum plus the Federal Funds Effective Rate as determined by the Federal Reserve Bank of New York, (b) the prime rate of Bank of America and (c) the LIBORTerm SOFR rate determined by reference to the cost of funds for U.S. dollar deposits for an interest period of one month adjusted for certain additional costs, plus 1.00%; provided that such rate is not lower than a floor of 1.50% or (2) an applicable margin plus a LIBORTerm SOFR rate determined by reference to the cost of funds for U.S. dollar deposits for the interest period relevant to such borrowing adjusted for certain additional costs, provided that LIBORTerm SOFR is not lower than a floor of 0.50%. Borrowings under the New Revolving Credit Facility bear interest at a rate per annum equal to an applicable margin based upon a leverage-based pricing grid, plus, at our option, either (1) a base rate determined by reference to the highest of (a) 0.50% per annum plus the Federal Funds Effective Rate as determined by the Federal Reserve Bank of New York, (b) the prime rate of Bank of America and (c) the LIBORTerm SOFR rate determined by reference to the cost of funds for U.S. dollar deposits for an interest period of one month adjusted for certain additional costs, plus 1.00%; provided that such rate is not lower than a floor of 1.00% or (2) a LIBORTerm SOFR rate determined by reference to the cost of funds for U.S. dollar deposits for the interest period relevant to such borrowing adjusted for certain additional costs, provided such rate is not lower than a floor of zero. As of January 1, 2022,December 30, 2023, the applicable margins for the LIBORTerm SOFR rate borrowings under the New Term Loan Facility and the New Revolving Credit Facility were 3.50% and 2.75%, respectively. In the event that LIBOR is phased out as is currently expected, the New Credit Agreement provides that we and the administrative agent may amend the New Credit Agreement to replace the LIBOR definition therein with a successor rate subject to notifying the lending syndicate of such change and not receiving within five business days of such notification objections to such replacement rate from lenders holding at least a majority of the aggregate principal amount of loans and commitments then outstanding under the New Credit Agreement; provided that such lending syndicate may not object to a SOFR-based successor rate contained in any such amendment. If we fail to do so, our borrowings will be based off of the alternative base rate plus a margin.
On a quarterly basis, we pay a commitment fee to the lenders under the New Revolving Credit Facility in respect of unutilized commitments thereunder, which commitment fee fluctuates depending upon our Consolidated First Lien Leverage Ratio (as defined in the New Credit Agreement).
65
The New Credit Agreement contains other customary terms, including (1) representations, warranties and affirmative covenants, (2) negative covenants, including limitations on indebtedness, liens, mergers, acquisitions, asset sales, investments, distributions, prepayments of subordinated debt, amendments of material agreements governing subordinated indebtedness, changes to lines of business and transactions with affiliates, in each case subject to baskets, thresholds and other exceptions, and (3) customary events of default. As of December 30, 2023, we were in compliance with the covenants under the Credit Agreement that were in effect on such date.
The availability of certain baskets and the ability to enter into certain transactions are also subject to compliance with certain financial ratios. In addition, if the aggregate principal amount of extensions of credit outstanding under the New Revolving Credit Facility as of any fiscal quarter end exceeds 35% of the amount of the aggregate commitments under the New Revolving Credit Facility in effect on such date, we must be in compliance with a Consolidated First Lien Leverage Ratio of on or prior to the end of the first fiscal quarter of 2022, 6.00:1.00, with a step down to 5.75:1.00 for the period ending after the first fiscal quarter of 2022 through and including with first fiscal quarter of 2023, with an additional step down to 5.50:1.00 for the period ending after the first fiscal quarter of 2023 through and including withthe first fiscal quarter of 2024, with a step down to 5.25:1.00 for the period ending after the first fiscal quarter of 2024 through and including withthe first fiscal quarter of 2025, and againan additional step down to 5.00:1.00 for the period following the first fiscal quarter of 2025. As of December 30, 2023, our actual Consolidated First Lien Leverage Ratio was 8.49:1.00 and there were no borrowings under our Revolving Credit Facility and total letters of credit issued were $1.2 million. We were not in compliance with the Consolidated First Lien Leverage Ratio as of December 30, 2023, and as a result, we are limited to borrowing no more than 35%, or $61.3 million, of the amount of the aggregate commitments under the Revolving Credit Facility as of each fiscal quarter end until we comply with the applicable ratio.
Senior Secured Notes
The Senior Secured Notes were issued pursuant to an Indenture, dated as of April 13, 2021 or, as(as amended, supplemented or modified from time to time, the New Indenture,“Indenture”), among the Company, the guarantors named therein and The Bank of New York Mellon, as trustee and notes collateral agent. The New Indenture contains customary terms, events of default and covenants for an issuer of non-investment grade debt securities. These covenants include limitations on indebtedness, liens, mergers, acquisitions, asset sales, investments, distributions, prepayments of subordinated debt and transactions with affiliates, in each case subject to baskets, thresholds and other exceptions. As of December 30, 2023, we were in compliance with the covenants under the Indenture that were in effect on such date.
55
The Senior Secured Notes accrue interest at a rate per annum equal to 4.500% and will mature on April 15, 2029. Interest on the Senior Secured Notes is payable semi-annually on April 15 and October 15 of each year, beginning on October 15, 2021. On or after April 15, 2024, we may on any one or more occasions redeem some or all of the Senior Secured Notes at a purchase price equal to 102.250% of the principal amount of the Senior Secured Notes, plus accrued and unpaid interest, if any, to, but not including, the redemption date, such optional redemption price decreasing to 101.125% on or after April 15, 2025 and to 100.000% on or after April 15, 2026. Prior to April 15, 2024, we may on any one or more occasions redeem up to 40% of the aggregate principal amount of the Senior Secured Notes with an amount not to exceed the net proceeds of certain equity offerings at 104.500% of the aggregate principal amount thereof, plus accrued and unpaid interest, if any, to, but not including, the redemption date. Prior to April 15, 2024, we may redeem some or all of the Senior Secured Notes at a make-whole price plus accrued and unpaid interest, if any, to, but not including, the redemption date. In addition, during any twelve-month period ending prior to April 15, 2024, we may redeem up to 10% of the aggregate principal amount of the Senior Secured Notes at a purchase price equal to 103.000% of the principal amount of the Senior Secured Notes to be redeemed, plus accrued and unpaid interest, if any, to, but excluding, the redemption date. If a change of control occurs, we must offer to purchase for cash the Senior Secured Notes at a purchase price equal to 101% of the principal amount of the Senior Secured Notes, plus accrued and unpaid interest, if any, to, but not including, the purchase date. Following the sale of certain assets and subject to certain conditions, we must offer to purchase for cash the Senior Secured Notes at a purchase price equal to 100% of the principal amount of the Senior Secured Notes, plus accrued and unpaid interest, if any, to, but not including, the purchase date.
The Senior Secured Notes are guaranteed on a senior secured basis by our subsidiaries that guarantee the New Credit Facilities. The Senior Secured Notes and the note guarantees are secured by a first-priority lien on all the collateral that secures the New Credit Facilities, subject to a shared lien of equal priority with the Company’s and each guarantor’s obligations under the New Credit Facilities and subject to certain thresholds, exceptions and permitted liens.
66
Outstanding Debt
At January 1, 2022,December 30, 2023, we had $1,445.0 million outstanding under the New Credit Facilities and the Senior Secured Notes, consisting of borrowings under the New Term Loan Facility of $945.0 million, $0.0 drawn down on the New Revolving Credit Facility and $500.0 million in aggregate principal amount of Senior Secured Notes issued and outstanding.
At the end of fiscal 20212023 and fiscal 2020,2022, our debt consisted of both fixed and variable-rate instruments. Interest rate swaps were entered into to hedge a portion of the cash flow exposure associated with our variable-rate borrowings. Further information regarding our interest rate swaps can be found in Part IV, Item 15 of this Annual Report on Form 10-K under Note 19 “Derivative Instruments and Hedging” inof the Notesnotes to the Consolidated Financial Statements.audited consolidated financial statements. The weighted average interest rate (which includes amortization of deferred financing costs and debt discount) on our outstanding debt, exclusive of the impact of the swaps then in effect,, was approximately 5.11%7.64% and 7.03%5.45% per annum at January 1,December 30, 2023 and December 31, 2022, and January 2, 2021, respectively, based on interest rates on these dates. The weighted average interest rate (which includes amortization of deferred financing costs and debt discount) on our outstanding debt, including the impact of the swaps then in effect, was approximately 5.62%6.53% and 7.41%5.50% per annum at January 1,December 30, 2023 and December 31, 2022, and January 2, 2021, respectively, based on interest rates on these dates.
Dividends
We do not currently pay a dividend and we have no current plans to pay dividends in the foreseeable future. Any future determination to declare and pay dividends will be made at the sole discretion of our Board of Directors, after taking into account our financial condition and results of operations, capital requirements, contractual, legal, tax and regulatory restrictions, the provisions of Virginia law affecting the payment of distributions to shareholders and such other factors our Board of Directors may deem relevant. In addition, our ability to pay dividends may be limited by covenants in our existing indebtedness, including the New Credit Agreement governing the New Credit Facilities and the New Indenture governing the Senior Secured Notes, and may be limited by the agreements governing other indebtedness we or our subsidiaries incur in the future.
56
EBITDAS, Adjusted EBITDAS and Net Debt
We define EBITDAS, a non-GAAP financial measure, as earnings before interest, taxes, depreciation, amortization and stock-based compensation and Adjusted EBITDAS, a non-GAAP financial measure, as earnings before interest, taxes, depreciation, amortization, stock-based compensation, early extinguishment of debt,franchise rights acquired and goodwill impairments, net restructuring charges (includingand certain non-recurring transaction costs in connection with the net impact where applicable) and goodwill impairment.Acquisition.
The table below sets forth the reconciliations for EBITDAS and Adjusted EBITDAS, each a non-GAAP financial measure, to net income,loss, the most comparable GAAP financial measure, for the fiscal years ended:
(in millions)
|
| December 30, 2023 |
|
| December 31, 2022 |
| ||
Net loss |
| $ | (112.3 | ) |
| $ | (256.9 | ) |
Interest |
|
| 95.9 |
|
|
| 81.1 |
|
Taxes |
|
| 38.6 |
|
|
| (109.9 | ) |
Depreciation and amortization |
|
| 45.6 |
|
|
| 42.3 |
|
Stock-based compensation |
|
| 11.3 |
|
|
| 13.0 |
|
EBITDAS |
| $ | 79.2 |
|
| $ | (230.4 | ) |
2023 plan restructuring charges |
|
| 53.7 |
|
|
| 13.6 |
|
2022 plan restructuring charges |
|
| 1.1 |
|
|
| 27.2 |
|
2021 plan restructuring charges |
|
| 0.1 |
|
|
| (0.3 | ) |
2020 plan restructuring charges |
|
| (0.0 | ) |
|
| (0.7 | ) |
Acquisition transaction costs |
|
| 8.6 |
| (1) |
| — |
|
Franchise rights acquired and goodwill impairments |
|
| 3.6 |
|
|
| 396.7 |
|
Adjusted EBITDAS (2) |
| $ | 146.4 |
|
| $ | 206.1 |
|
|
| January 1, 2022 |
|
| January 2, 2021 |
| ||
Net Income |
| $ | 66.9 |
|
| $ | 75.1 |
|
Interest |
|
| 87.9 |
|
|
| 123.3 |
|
Taxes |
|
| 9.8 |
|
|
| 17.5 |
|
Depreciation and amortization |
|
| 45.5 |
|
|
| 50.0 |
|
Stock-based compensation |
|
| 21.3 |
|
|
| 55.0 |
|
EBITDAS |
| $ | 231.4 |
|
| $ | 320.9 |
|
Early extinguishment of debt |
| $ | 30.4 |
|
|
| — |
|
2021 plan restructuring charges |
|
| 21.5 |
|
|
| — |
|
2020 plan restructuring charges |
|
| (1.6 | ) |
|
| 33.1 |
|
Goodwill impairment |
|
| — |
|
|
| 3.7 |
|
Adjusted EBITDAS (1) |
| $ | 281.7 |
|
| $ | 357.6 |
|
67
Note: Totals may not sum due to rounding.
| (1) Includes stock-based compensation expense attributable to post-combination vesting of $3.9 million. (2) The “Adjusted EBITDAS” measure is a non-GAAP financial measure that (i) adjusts the consolidated statements of operations for fiscal 2023 to exclude the net impact of the $53.7 million of 2023 plan restructuring charges, the $1.1 million of 2022 plan restructuring charges, the $0.1 million of 2021 plan restructuring charges and the reversal of $21 thousand of 2020 plan restructuring charges, the impact of $8.6 million of acquisition transaction costs, and the impact of $3.6 million of franchise rights acquired and goodwill impairments; and (ii) adjusts the consolidated statements of operations for fiscal 2022 to exclude the impact of the $396.7 million of franchise rights acquired and goodwill impairments and the net impact of the $13.6 million of 2023 plan restructuring charges, the $27.2 million of 2022 plan restructuring charges, the reversal of $0.3 million of 2021 plan restructuring charges and the reversal of $0.7 million of 2020 plan restructuring charges. See “Non-GAAP Financial Measures” above for an explanation of our use of non-GAAP financial measures.
|
|
Reducing leverage is a capital structure priority for the Company. As of January 1, 2022,December 30, 2023, our total debt less unamortized deferred financing costs and unamortized debt discount/net loss ratio was (12.7)x. As of December 30, 2023, our net debt/Adjusted EBITDAS ratio was 4.5x.9.0x.
The table below sets forth the reconciliation for net debt, a non-GAAP financial measure, to total debt, the most comparable GAAP financial measure, for the fiscal year ended:
(in millions)
|
| December 30, 2023 |
| |
Total debt |
| $ | 1,445.0 |
|
Less: Unamortized deferred financing costs |
|
| 8.8 |
|
Less: Unamortized debt discount |
|
| 9.8 |
|
Less: Cash on hand |
|
| 109.4 |
|
Net debt |
| $ | 1,317.1 |
|
|
| January 1, 2022 |
| |
Total debt |
| $ | 1,445.0 |
|
Less: Unamortized deferred financing costs |
|
| 12.5 |
|
Less: Unamortized debt discount |
|
| 14.4 |
|
Less: Cash on hand |
|
| 153.8 |
|
Net debt |
| $ | 1,264.3 |
|
Note: Totals may not sum due to rounding.
We present EBITDAS, Adjusted EBITDAS and net debt/Adjusted EBITDAS because we consider them to be useful supplemental measures of our performance. In addition, we believe EBITDAS, Adjusted EBITDAS and net debt/Adjusted EBITDAS are useful to investors, analysts and rating agencies in measuring the ability of a company to meet its debt service obligations. See “—Non-GAAP Financial Measures” herein for an explanation of our use of these non-GAAP financial measures.
57
Contractual Obligations
We are obligated under non-cancelable agreements primarily for office and rent facilities operating leases. Consolidated rent expense charged to operations under all our leases for fiscal 20212023 was approximately $46.4$34.1 million.
The following table summarizes our future contractual obligations as of the end of fiscal 2021:2023:
|
|
|
|
| Payment Due by Period |
| ||||||||||||||
|
|
|
|
| Less than |
|
|
|
|
|
|
|
| More than |
| |||||
|
| Total |
|
| 1 Year |
|
| 1-3 Years |
|
| 3-5 Years |
|
| 5 Years |
| |||||
|
| (in millions) |
| |||||||||||||||||
Long-Term Debt (1) |
|
|
|
|
|
|
|
|
|
|
|
|
|
|
| |||||
Principal |
| $ | 1,445.0 |
|
| $ | — |
|
| $ | — |
|
| $ | 945.0 |
|
| $ | 500.0 |
|
Interest |
|
| 488.5 |
|
|
| 91.1 |
|
|
| 231.3 |
|
|
| 154.8 |
|
|
| 11.3 |
|
Operating leases, finance leases and non-cancelable agreements |
|
| 108.9 |
|
|
| 26.9 |
|
|
| 34.5 |
|
|
| 20.7 |
|
|
| 26.8 |
|
Total (2) |
| $ | 2,042.4 |
|
| $ | 118.0 |
|
| $ | 265.8 |
|
| $ | 1,120.5 |
|
| $ | 538.1 |
|
|
|
|
|
|
| Payment Due by Period |
| |||||||||||||
|
|
|
|
|
| Less than |
|
|
|
|
|
|
|
|
|
| More than |
| ||
|
| Total |
|
| 1 Year |
|
| 1-3 Years |
|
| 3-5 Years |
|
| 5 Years |
| |||||
|
| (in millions) |
| |||||||||||||||||
Long-Term Debt (1) |
|
|
|
|
|
|
|
|
|
|
|
|
|
|
|
|
|
|
|
|
Principal |
| $ | 1,445.0 |
|
| $ | — |
|
| $ | — |
|
| $ | — |
|
| $ | 1,445.0 |
|
Interest |
|
| 429.4 |
|
|
| 69.6 |
|
|
| 126.5 |
|
|
| 128.1 |
|
|
| 105.2 |
|
Operating leases, finance leases and non-cancelable agreements |
|
| 147.9 |
|
|
| 36.1 |
|
|
| 45.8 |
|
|
| 20.7 |
|
|
| 45.3 |
|
Total (2) |
| $ | 2,022.3 |
|
| $ | 105.7 |
|
| $ | 172.3 |
|
| $ | 148.8 |
|
| $ | 1,595.5 |
|
Note: Totals may not sum due to rounding.
| (1) Due to the fact that a portion of our debt is variable rate based, we have assumed for purposes of this table that the interest rate on all of our debt as of the end of fiscal 2023 remains constant for all periods presented. (2) The provision for income tax contingencies included in other long-term liabilities on the consolidated balance sheet is not included in the table above due to the fact that the Company is unable to estimate the timing of payment for this liability. 68
|
|
|
|
We currently plan to meet our long-term debt obligations by using cash flows provided by operating activities and opportunistically using other means to repay or refinance our obligations as we determine appropriate. We believe that cash flows from operating activities, together with cash on hand, will provide sufficient liquidity for the short-term to fund currently anticipated capital expenditure and working capital requirements, as well as debt service requirements.
Franchisee AcquisitionsAcquisition of Sequence
On August 16, 2021,April 10, 2023, we acquired substantially all ofcompleted the assets of our franchisee for certain territories in Maine, Weight Watchers of Maine, Inc., for a purchase price of $2.3 million.
On March 22, 2021, we acquired substantially all of the assets of our franchisee for certain territories in Michigan, The WW Group, Inc.,Acquisition for an aggregate purchase price of $17.5$132.0 million.
Franchisee Acquisitions
On March 22, 2021,February 18, 2022, we acquired substantially all of the assetsentire issued share capital of our Republic of Ireland franchisee, Denross Limited, and our Northern Ireland franchisee, Checkweight Limited, for certain territories in Ontario, Canada, The WW Group Co., for an aggregatea purchase price of $3.1 million.$4.5 million and $1.5 million, respectively.
On October 26, 2020, we acquired substantially all of the assets of our franchisees for certain territories in Arizona and California, Weight Watchers of Arizona, Inc. and Weight Watchers of Imperial County, Inc., respectively, for an aggregate purchase price of $10.0 million.
Factors Affecting Future Liquidity
Any future acquisitions, joint ventures or other similar transactions could require additional capital and we cannot be certain that any additional capital will be available on acceptable terms or at all. Our ability to fund our capital expenditure requirements, interest, principal and dividend payment obligations and working capital requirements depends on our future operations, performance and cash flow. These are subject to prevailing economic conditions and to financial, business and other factors, some of which are beyond our control.
Off-Balance Sheet Arrangements
As part of our ongoing business, we do not participate in arrangements that generate relationships with unconsolidated entities or financial partnerships established for the purpose of facilitating off-balance sheet arrangements or other contractually narrow or limited purposes, such as entities often referred to as structured finance or special purpose entities.
58
Related Parties
For a discussion of related party transactions affecting us, see “Item 13. Certain Relationships and Related Transactions, and Director Independence” in Part III of this Annual Report on Form 10-K.
Seasonality
Our business is seasonal due to the importance of the winter season to our overall member recruitment environment. Historically, we experience our highest level of recruitment during the first quarter of the year, which is supported with the highest concentration of advertising spending. Therefore, our number of End of Period Subscribers in the first quarter of the year ishas been typically higher than the number in other quarters of the year, historically reflecting a decline over the course of the year.
Item 7A. Quantitative and Qualitative Disclosures about Market Risk
|
|
We are exposed to market risks relating to interest rate changes and foreign currency fluctuations. All of our market risk sensitive instruments were entered into for purposes other than trading. The Company’s exposure to market risk as of the end of fiscal 20212023 is described below.
Interest Rate Risk
During the second quarter of fiscal 2023, in connection with the previously announced planned phase-out of LIBOR, we amended our Credit Facilities to replace LIBOR with Term SOFR as the benchmark rate under the Credit Agreement and modified our interest rate swap agreements to transition from LIBOR-indexed to Term SOFR-indexed periodic swap payments to align with interest payments in connection with our Term SOFR-indexed debt. Other than this transition during the second quarter of fiscal 2023, there have been no material changes to our exposure to market risk from the end of fiscal 2022 as compared to the end of fiscal 2023.
69
Our exposure to market risk for changes in interest rates relates to interest expense of variable rate debt, in particular changes in LIBORTerm SOFR or the base rates which are used to determine the applicable interest rates for borrowings under the New Credit Facilities.
On July 26, 2013, in order to hedge a portion of our variable rate debt, we entered into a forward-starting interest rate swap with an effective date of March 31, 2014 and a termination date of April 2, 2020. The initial notional amount of this swap was $1.5 billion. During the term of this swap, the notional amount decreased from $1.5 billion effective March 31, 2014 to $1.25 billion on April 3, 2017 and to $1.0 billion on April 1, 2019. This interest rate swap effectively fixed the variable interest rate on the notional amount of this swap at 2.41%. This swap qualified for hedge accounting and, therefore, changes in the fair value of this swap were recorded in accumulated other comprehensive loss.
On June 11, 2018, in order to hedge a portion of our variable rate debt, we entered into a forward-starting interest rate swap or the 2018 swap,(the “2018 swap”) with an effective date of April 2, 2020 and a termination date of March 31, 2024. The initial notional amount of this swap was $500.0 million. During the term of this swap, the notional amount decreased from $500.0 million effective April 2, 2020 to $250.0 million on March 31, 2021. ThisFollowing the transition from LIBOR to Term SOFR, this interest rate swap effectively fixed the variable interest rate on the notional amount of this swap at 3.1005%3.1513%. On June 7, 2019, in order to hedge a portion of our variable rate debt, we entered into a forward-starting interest rate swap (together(the “2019 swap”, and together with the 2018 swap, known as the current swaps)“current swaps”) with an effective date of April 2, 2020 and a termination date of March 31, 2024. The notional amount of this swap is $250.0 million. ThisFollowing the transition from LIBOR to Term SOFR, this interest rate swap effectively fixed the variable interest rate on the notional amount of this swap at 1.901%1.9645%. The current swaps qualify for hedge accounting and, therefore, changes in the fair value of the current swaps have been recorded in accumulated other comprehensive loss. As of the end of fiscal 2021,2023, we had $945.0 million of variable rate debt, of which $445.0 million remained unhedged.
As of January 1, 2022,December 30, 2023, borrowings under the New Credit Facilities bore interest at LIBORTerm SOFR plus an applicable margin of 3.50%. For the New Term Loan Facility, the minimum interest rate for LIBORTerm SOFR applicable to such facility pursuant to the terms of the New Credit Agreement iswas set at 0.50%, referred to herein as the LIBORTerm SOFR Floor. In addition, as of January 1, 2022,December 30, 2023, our interest rate swaps in effect had an aggregate notional amount of $500.0 million. Accordingly, as of January 1, 2022,December 30, 2023, based on the amount of variable rate debt outstanding and the then-current LIBORTerm SOFR rate, after giving consideration to the impact of the interest rate swaps and the LIBORTerm SOFR Floor, a hypothetical 90125 basis point increase in interest rates would have increased annual interest expense by approximately $4.0$5.6 million and a hypothetical 125 basis point decrease in interest rates would have decreased annual interest expense by approximately $5.6 million. This increase and decrease would have been driven primarily by the interest rate applicable to our New Term Loan Facility. A hypothetical 90 basis point decrease in interest rates would have resulted in no change to annual interest expense, driven primarily by the LIBOR Floor.
There have been no material changes to our exposure to market risk from the end of fiscal 2020 as compared to the end of fiscal 2021.
59
Foreign Currency Risk
Other than inter-company transactions between our domestic and foreign entities, we generally do not have significant transactions that are denominated in a currency other than the functional currency applicable to each entity. As a result, substantially all of our revenues and expenses in each jurisdiction in which we operate are in the same functional currency. In general, we are a net receiver of currencies other than the U.S. dollar. Accordingly, changes in exchange rates may negatively affect our revenues and gross margins as expressed in U.S. dollars. In the future, we may enter into forward and swap contracts to hedge transactions denominated in foreign currencies to reduce the currency risk associated with fluctuating exchange rates. Realized and unrealized gains and losses from any of these transactions may be included in net income for the period.
Fluctuations in currency exchange rates, particularly with respect to the euro, canadian dollar and pound sterling, may impact our shareholders’ equity. The assets and liabilities of our non-U.S. subsidiaries are translated into U.S. dollars at the exchange rates in effect at the balance sheet date. Revenues and expenses are translated into U.S. dollars at the average exchange rate for the period. The resulting translation adjustments are recorded in shareholders’ equity as a component of accumulated other comprehensive loss. In addition, exchange rate fluctuations will cause the U.S. dollar translated amounts to change in comparison to prior periods.
Item 8. Financial Statements and Supplementary Data
|
|
This information is incorporated by reference to our consolidated financial statements on pages F-1 through F-42F-52 and our financial statement schedule on page S-1, including the report thereon of PricewaterhouseCoopers LLP on pages F-2 to F-4.
Item 9. Changes in and Disagreements with Accountants on Accounting and Financial Disclosure
None.
70 Item 9A. Controls and Procedures
|
|
None.
|
|
Disclosure Controls and Procedures
We maintain disclosure controls and procedures that are designed to ensure that information required to be disclosed in our reports under the Exchange Act is recorded, processed, summarized and reported within the time periods specified in the SEC’s rules and forms, and that such information is accumulated and communicated to our management, including our principal executive officer and our principal financial officer, as appropriate, to allow timely decisions regarding required disclosures. Any controls and procedures, no matter how well designed and operated, can provide only reasonable assurance of achieving the desired control objectives. Our management, with the participation of our principal executive officer and our principal financial officer, has evaluated the effectiveness of the design and operation of our disclosure controls and procedures as of January 1, 2022,December 30, 2023, the end of fiscal 2021.2023. Based upon that evaluation and subject to the foregoing, our principal executive officer and our principal financial officer concluded that, as of the end of fiscal 2021,2023, the design and operation of our disclosure controls and procedures were effective at the reasonable assurance level.
Internal Control Over Financial Reporting
Management’s Annual Report on Internal Control Over Financial Reporting
Our management is responsible for establishing and maintaining adequate internal control over financial reporting. Internal control over financial reporting is a process designed under the supervision and with the participation of our management, including our principal executive officer and our principal financial officer, to provide reasonable assurance regarding the reliability of financial reporting and the preparation of financial statements for external purposes in accordance with GAAP.
Our management assessed the effectiveness of our internal control over financial reporting as of January 1, 2022,December 30, 2023, the end of fiscal 2021.2023. In making this assessment, our management used the criteria set forth by the Committee of Sponsoring Organizations of the Treadway Commission (COSO) in Internal Control — Integrated Framework (2013). Based on this assessment, our management, under the supervision and with the participation of our principal executive officer and our principal financial officer, concluded that, as of January 1, 2022,December 30, 2023, our internal control over financial reporting was effective based on those criteria.
60
The effectiveness of our internal control over financial reporting as of January 1, 2022December 30, 2023 has been audited by PricewaterhouseCoopers LLP, an independent registered public accounting firm, as stated in their report which appears on pages F-2 to F-4 to our consolidated financial statements.
Changes in Internal Control Over Financial Reporting
There was no change in our internal control over financial reporting that occurred during our most recent fiscal quarter that has materially affected, or is reasonably likely to materially affect, our internal control over financial reporting.
Item 9B. Other Information
From time to time, our directors and officers may engage in open-market transactions with respect to their Company equity holdings for diversification or other personal reasons. All such transactions by directors and officers must comply with the Company’s Amended and Restated Securities Trading Policy, which requires that such transactions be in accordance with applicable U.S. federal securities laws that prohibit trading while in possession of material nonpublic information. Rule 10b5-1 under the Exchange Act provides an affirmative defense that enables directors and officers to prearrange transactions in the Company’s securities in a manner that avoids concerns about initiating transactions while in possession of material nonpublic information.
No contracts, instructions or written plans for the purchase or sale of Company securities were adopted or terminated by our directors or officers (as defined in Rule 16a-1(f) under the Exchange Act) during the quarter ended December 30, 2023, that were intended to satisfy the affirmative defense conditions of Rule 10b5-1(c). No “non-Rule 10b5–1 trading arrangements” (as defined by Item 408(c) of Regulation S-K) or other Rule 10b5-1 trading arrangements were entered into or terminated, nor were any such arrangements modified, by our directors or officers during such period.
71
Item 9C. Disclosure Regarding Foreign Jurisdictions that Prevent Inspections
Not applicable.
72
PART III
|
|