Item 1. |
| ||||
Item 1A. |
| ||||
Item 1B. | 18 | ||||
Item | 18 | ||||
Item 2. |
| ||||
Item 3. |
| ||||
Item 4. |
| ||||
Item 5. |
| ||||
Item 6. |
| ||||
Item 7. | Management’s Discussion and Analysis of Financial Condition and Results of Operations |
| |||
Item 7A. |
| ||||
Item 8. |
| ||||
Item 9. | Changes in and Disagreements with Accountants on Accounting and Financial Disclosure | 67 | |||
Item 9A. | 67 | ||||
Item 9B. | 70 | ||||
Item 9C. | Disclosure Regarding Foreign Jurisdictions that Prevent Inspections | 70 | |||
Item 10. | 71 | ||||
Item 11. | 71 | ||||
Item 12. | Security Ownership of Certain Beneficial Owners and Management and Related Stockholder Matters | 71 | |||
Item 13. | Certain Relationships and Related Transactions, and Director Independence | 71 | |||
Item 14. | 71 | ||||
Item 15. | 72 | ||||
Item 16. |
| 73 | |||
| |||||
EX-4.2 Description of Capital Stock | |||||
EX-21.1 List of Subsidiaries | |||||
EX-23.1 Consent of Grant Thornton LLP | |||||
| |||||
EX-31.1 Section 302 CEO Certification | |||||
EX-31.2 Section 302 CFO Certification | |||||
EX-32.1 Section 906 CEO and CFO Certification | |||||
EX-101.INS Inline XBRL Instance Document | |||||
EX-101.SCH Inline XBRL Taxonomy Extension Schema | |||||
| |||||
| |||||
| |||||
| |||||
DISCLOSURE REGARDING FORWARD-LOOKING STATEMENTS
This Annual Report on Form 10-K (“Form 10-K”) contains forward-looking statements, within the meaning of the Private Securities Litigation Reform Act of 1995, that involve risks and uncertainties. Many of the forward-looking statements are located in Part II, Item 7 of this Form 10-K under the heading “Management’s Discussion and Analysis of Financial Condition and Results of Operations.” Forward-looking statements provide current expectations of future events based on certain assumptions and include any statement that does not directly relate to any historical or current fact. Forward-looking statements can also be identified by words such as “future,” “anticipates,” “believes,” “targets,” “estimates,” “expects,” “intends,” “will,” “would,” “could,” “can,” “may,” and similar terms. Forward-looking statements are not a guarantee of future performance, and the Company’s actual results may differ significantly from the results discussed in the forward-looking statements. Factors that might cause such differences include, but are not limited to, those discussed in Part I, Item 1A of this Form 10-K under the heading “Risk Factors,” which are incorporated herein by reference. All information presented herein is based on the Company’s fiscal calendar. Unless otherwise stated, references to particular years, quarters, months, or periods refer to the Company’s fiscal years ended December 31 and the associated quarters, months, and periods of those fiscal years. Each of the terms “Universal,” the “Company,” “we,” “us” and “our” as used herein refers collectively to Universal Logistics Holdings, Inc., and its subsidiaries, unless otherwise stated. The Company assumes no obligation to revise or update any forward-looking statements for any reason, except as required by law.
PART I
ITEM 1:BUSINESS
|
|
Company Background
We areUniversal Logistics Holdings, Inc. is a leading asset-light providerholding company whose subsidiaries provide a variety of customized transportation and logistics solutions throughout the United States and in Mexico, Canada and Colombia. We offer ourOur operating subsidiaries provide customers with a broad arrayscope of services across their entire supply chain, including truckload, brokerage, intermodal, dedicated and value-added services.
WeOur operating subsidiaries provide a comprehensive suite of transportation and logistics solutions that allow our customers to reduce costs and manage their global supply chains more efficiently. We market and deliver our services in several ways:
| • Through a direct sales and marketing network focused on selling our portfolio of services to large customers in specific industry sectors; • Through company-managed facilities; and • Through a network of agents who solicit freight business directly from shippers.
|
|
|
|
|
|
At December 31, 2021,2023, we operated 5150 company-managed terminal locations, and serviced 6371 value-added programs at locations throughout the United States and in Mexico, Canada and Colombia, and we had an agent network totaling approximately 257230 agents.
We were incorporated in Michigan on December 11, 2001. We have been a publicly held company since February 11, 2005, the date of our initial public offering.
Our principal executive offices are located at 12755 E. Nine Mile Road, Warren, Michigan 48089.
Operations
We broadly group our revenues into the following service categories: truckload, brokerage, intermodal, dedicated, and value-added services.
Truckload. Our truckload services include dry van, flatbed, heavy-haul and refrigerated operations. Truckload services represented approximately $248.9$213.9 million, or 14.2%12.9%, of our operating revenues in 2021.2023. We transport a wide variety of general commodities, including automotive parts, machinery, building materials, paper, food, consumer goods, furniture, steel and other metals on behalf of customers in various industries. Truckload services also include our final mile and ground expedited services. Our transportation services are provided through a network of owner-operators and employee drivers.
Brokerage. We provide customers with freight brokerage services by utilizing third-party transportation providers to transport goods. Brokerage services also include full service domestic and international freight forwarding, and customs brokerage. In 2021,2023, brokerage services represented approximately $401.8$244.0 million, or 22.9%14.7%, of our operating revenues.
4
3
Intermodal. Intermodal operations include steamship-truck, rail-truck, and support services. Intermodal support services represented $473.1$374.7 million, or 27.0%22.5%, of our operating revenues in 2021.2023. Our intermodal support services are primarily short-to-medium distanceshort- to medium-distance delivery of both international and domestic containers between the portrailhead or railheadport and the customer and drayage services.customer.
Dedicated. Our dedicated services are primarily provided in support of automotive customers using van equipment. In 2021,2023, dedicated services represented approximately $204.1$343.5 million, or 11.7%20.7%, of our operating revenues. Our dedicated services are primarily short run or round-trip moves within a defined geographic area provided through a network of union and non-union employee drivers, owner-operators, and contract drivers.
Value-Added. Our value-added services, which are typically dedicatedtailored to individual customer requirements, include material handling, consolidation, sequencing, sub-assembly, cross-dock services, kitting, repacking, warehousing and returnable container management. Value-added services represented approximately $423.1$486.0 million, or 24.2%29.2%, of our operating revenues in 2021.2023. Our facilities and services are often directly integrated into the production processes of our customers and represent a critical piece of their supply chains.
Segments
We report our financial results in four distinct reportable segments: contract logistics, intermodal, trucking, and company-managed brokerage.
Operations aggregatedThe operations that we aggregate in our contract logistics segment deliver value-added and/orand dedicated transportation services to support in-bound logistics to original equipment manufacturers (OEMs) and major retailers on a contractual basis, generally pursuant to terms of one year or longer. Our intermodal segment is associated with local and regional drayage moves predominately coordinated by company-managed terminals using a mix of owner-operators, company equipment and third-party capacity providers (broker carriers). Operations aggregatedthat are commonly referred to as broker carriers. The operations that we group in our trucking segment are associated with individual freight shipments coordinated primarily by our agents and company-managed terminals using a mix of owner-operators, company equipment and broker carriers. Our company-managed brokerage segment provides for the pick-up and delivery of individual freight shipments using broker carriers, coordinated by our company-managed operations.
For additional information on segments, seesee Item 8, Note 1817 to the Consolidated Financial Statements.
COVID-19 Pandemic
The Company remains committed to doing its part to protect its employees, customers, vendors and the general public from the spread of the coronavirus outbreak (COVID-19). Our operational and financial performance were negatively impacted by COVID-19 during the latter part of the first and most of the second quarter of 2020. To mitigate the impact on our business, we implemented numerous cost reduction measures including furloughing a large portion of our direct labor force, requiring personnel to take unpaid time-off, restricting travel, and reducing discretionary spending. During the third quarter 2020, we experienced a rebound in demand for transportation and manufacturing support services and experienced a more normalized level of business activity. Although we estimate COVID-19 had the largest impact on our business during the second quarter 2020, we are unable to predict with any certainty the future impact COVID-19 may have on our operational and financial performance. The ultimate magnitude of COVID-19, including the extent of its impact on the Company’s financial and operating results, which could be material, will be determined by the length of time the pandemic continues, its severity, government regulations imposed in response to the pandemic, and to its general effect on the economy and transportation demand.
Business and Growth Strategy
The key elements of our strategy are as follows:
Make strategic acquisitions. The transportation and logistics industry is highly fragmented, with hundredsthousands of small and mid-sized competitors that are either specialized in specific vertical markets, specific service offerings, or limited to local and regional coverage. We expect to selectively evaluate and pursue acquisitions that will enhance our service capabilities, expand our geographic network and/or diversify our customer base.
Continue to capitalize on strong industry fundamentals and outsourcing trends. We believe long-term industry growth will be supported by manufacturers seeking to outsource non-core logistics functions to cost-effective third-party providers that can efficiently manage increasingly complex global supply chains. We intend to leverage our integrated suite of transportation and logistics services, our network of facilities, our long-term customer relationships, and our reputation for operational excellence to capitalize on favorable industry fundamentals and growth expectations.
Target further penetration of key customers in the North American automotive industry. The automotive industry is one of the largest users of global outsourced logistics services, providing us growth opportunities with both existing and new customers. Of our customers generating revenues greater than $100,000 per year,In 2023, this sector comprised approximately 31%43% of our total operating revenuesrevenues. The vast majority of hourly employees in 2021.our automotive customers’ manufacturing operations are represented by unions and covered by collective bargaining agreements. These agreements provide guaranteed wage and benefit levels throughout the contract term. With the ratification of new contracts in 2023, we expect our customers to experience significant increases in their labor costs through the life of the contracts. These cost increases may cause certain of our customers to evaluate the outsourcing of certain value-added operations where we possess demonstrated experience and expertise. We intend to capitalize on anticipated continued growth opportunities in outsourcing of higher valuethose outsourced, higher-value logistics services, in the automotive sector such as sub-assembly and sequencing, which link directly into production lines and require specialized capabilities, technological expertise, and strict quality controls.
45
Continue to expand penetration in other vertical markets. We have a history of providing highly complex value-added logistics services to automotive and other industrial customers. We have developed standardized, modular systems for material handling processes and have extensive experience in rapid implementation and workforce training. These capabilities and our broad portfolio of logistics services are transferable across vertical markets. We believe we can leverage the expertise we initially developed in the automotive sector. In addition to automotive, our targeted industries include aerospace, energy, government services, healthcare, industrial retail, consumer goods, and steel and metals.
Expand our network of agents and owner-operators. Increasing the number of agents and owner-operators has been a driver of our historical growth in transactional transportation services. We intend to continue to recruit qualified agents and owner-operators in order to penetrate new markets and expand our operations in existing markets. Our agents typically focus on a small number of shippers in a particular market and are attuned to the specific transportation needs of that core group of shippers, while remaining alert to growth opportunities.
Competition and Industry
The transportation and logistics service industry is highly competitive and extremely fragmented. We compete based on quality and reliability of service, price, breadth of logistics solutions, and IT capabilities. We compete with asset and non-asset based truckload and less-than-truckload carriers, intermodal transportation, logistics providers and, in some aspects of our business, railroads. We also compete with other motor carriers for owner-operators and agents.
Our customers may choose not to outsource their logistics operations and, rather, to retain or restore such activities as their own internal operations. In our largest vertical market, the automotive industry, we compete more frequently with a relatively small number of privately-owned firms or with subsidiaries of large public companies. These vendors have the scope and capabilities to provide the breadth of services required by the large and complex supply chains of automotive original equipment manufacturers (OEMs).
We also encounter competition from regional and local third-party logistics providers, integrated transportation companies that operate their own aircraft, cargo sales agents and brokers, surface freight forwarders and carriers, airlines, associations of shippers organized to consolidate their members’ shipments to obtain lower freight rates, and internet-based freight exchanges.
The transportation industry is continuously impacted by new rules and regulations intended to improve the overall safety of the industry. Compliance with such increasingly complex rules continues to constrain the supply of qualified drivers. We believe that our industry will continue to be hindered by an insufficient quantity of qualified drivers which creates significant competition for this declining pool.
Customers
Revenue is generated from customers throughout the United States, and in Mexico, Canada and Colombia. Our customers are largely concentrated in the automotive, retail and consumer goods, steel oil and gas, alternativeother metals, energy and manufacturing industries.
A significant percentage of our revenues isare derived from the domestic autoautomotive industry. Of our customers generating revenues greater than $100,000 per year,Our aggregate sales in the automotive industry totaled 31%43%, 29%36% and 27%31% of our revenues during the fiscal years ended December 31, 2021, 20202023, 2022 and 2019,2021, respectively. During 2021, 20202023, 2022 and 2019,2021, General Motors accounted for approximately 13%20%, 14%16% and 12%13% of our total operating revenues, respectively. Sales to our top 10 customers, including General Motors, totaled 38%48% in 2021.2023. A significant percentage of our revenue also results from our providing capacity to other transportation companies that aggregate loads from a variety of shippers in these and other industries.
Human Capital Resources
Overview. As of December 31, 2021,2023, we had 8,0049,311 employees. During the year ended December 31, 2021,2023, we also engaged, on average, the full-time equivalency of 1,448450 individuals on a contract basis. As of December 31, 2021,2023, approximately 37%33% of our employees in the United States, Canada, and Colombia and 91% of our employees in Mexico were members of unions and subject to collective bargaining agreements. We believe our union and employee relationships are good.
Diversity and Inclusion. We believe diversity and inclusion are critical to our ability to win in the marketplace and enable our workforce and communities to succeed. Specifically, having a diverse and inclusive workplace allows us to attract and retain the best employees to deliver results for our shareholders. A qualified, diverse, and inclusive workforce also helps us represent the broad cross-section of ideas, values, and beliefs of our employees, customers, and communities. Our commitment to diversity and inclusion means that we will continue to strive to establish and improve an inclusive workplace environment where employees from all backgrounds can succeed and be heard.
6
5
Employee Health and Safety. We are committed to being an industry leader in health and safety standards. The physical health, wellbeing, and mental health of our employees is crucial to our success. Most recently, our primary concern during the COVID-19 pandemic has been to do our part to protect our employees, customers, vendors, and the general public from the spread of the virus while continuing to serve the vital role of supplying essential goods to the nation. For essential functions, including our plant workers and driving professionals, we have distributed cleaning and protective supplies to various plants and terminals so that they are available to those that need them, increased cleaning frequency and coverage, and provided employees direction on precautionary measures, such as sanitizing truck interiors, personal hygiene, and social distancing. We will continue to adapt our operations as required to ensure safety while continuing to provide a high level of service to our customers.
Talent Acquisition, Retention and Development. We continually strive to hire, develop, and retain the top talent in our industry. Critical to attracting and retaining top talent is employee satisfaction, and we regularly implement programs to increase employee satisfaction. We reward our employees by providing competitive compensation, benefits, and incentives throughout all levels in our organization. Intense competition in the transportation and logistics services industry for qualified workers and drivers has resulted in additional expense to recruit and retain an adequate supply of employees and has had a negative impact on the industry. Our operations have also been impacted, we have periodically experienced under-utilization and increased expenses due to a shortage of qualified workers and drivers. We place a high priority on the recruitment and retention of an adequate supply of qualified workers and drivers.
Independent Contractor Network
We utilize a network of agents and owner-operators located throughout the United States and in Ontario, Canada. These agents and owner-operators are independent contractors.
A significant percentage of the interaction with our shippers is provided by our agents. Our agents solicited and controlled approximately 30% of the freight we hauled in 2021,2023, with the balance of the freight being generated by company-managed terminals. Our top 100 agents in 20212023 generated approximately 20% of our annual operating revenues. Our agents typically focus on three or four shippers within a particular market and solicit most of their freight business from this core group. By focusing on a relatively small number of shippers, each agent is acutely aware of the specific transportation needs of that core group of shippers, while remaining alert to growth opportunities.
We also contract with owner-operators to provide greater flexibility in responding to fluctuations in customer demand. Owner-operators provide their own trucks and are contractually responsible for all associated expenses, including but not limited to financing costs, fuel, maintenance, insurance, and taxes, among other things. They are also responsible for maintaining compliance with Federal Motor Carrier Safety Administration regulations.
Revenue Equipment
The following table represents our equipment used to provide transportation services as of December 31, 2021:2023:
Type of Equipment |
| Company- owned or Leased |
|
| Owner- Operator Provided |
|
| Total |
|
| Company- |
|
| Owner- |
|
| Total |
| ||||||
Tractors |
|
| 1,487 |
|
|
| 2,421 |
|
|
| 3,908 |
|
|
| 1,945 |
|
|
| 1,766 |
|
|
| 3,711 |
|
Yard Tractors |
|
| 262 |
|
|
| - |
|
|
| 262 |
|
|
| 339 |
|
|
| — |
|
|
| 339 |
|
Trailers |
|
| 3,838 |
|
|
| 977 |
|
|
| 4,815 |
|
|
| 4,434 |
|
|
| 950 |
|
|
| 5,384 |
|
Chassis |
|
| 2,830 |
|
|
| 1 |
|
|
| 2,831 |
|
|
| 3,494 |
|
|
| — |
|
|
| 3,494 |
|
Containers |
|
| 176 |
|
|
| - |
|
|
| 176 |
|
|
| 108 |
|
|
| — |
|
|
| 108 |
|
Risk Management and Insurance
Our customers and federal regulations generally require that we provide insurance for auto liability and general liability claims up to $1.0 million per occurrence. Accordingly, in the United States, we purchase such insurance from a licensed casualty insurance carrier, which is a related party, providing a minimum $1.0 million of coverage for individual auto liability and general liability claims. We are generally self-insured for auto and general liability claims above $1.0 million unless riders are sought to satisfy individual customer or vendor contract requirements. In certain of our businesses, we have secured additional auto liability coverage where we are self-insured for claims above $4.0 million. In Mexico, our operations and investment in equipment are insured through an internationally recognized, third-party insurance underwriter.
We typically self-insure for the risk of motor cargo liability claims and material handling claims. Accordingly, we establish financial reserves for anticipated losses and expenses related to motor cargo liability and material handling claims, and we periodically evaluate and adjust those reserves to reflect our experience. Any such adjustments could have a materially adverse effect on our operations and financial results.
67
To reduce our exposure to claims incurred while a vehicle is being operated without a trailer attached or is being operated with an attached trailer which does not contain or carry any cargo, we require our owner-operators to maintain non-trucking use liability coverage (which the industry refers to as deadhead bobtail coverage) of $2.0 million per occurrence.
Technology
In brokerage arrangements, our exposure to liability associated with accidents incurred by other third-party carriers who haul freight on our behalf is reduced by various factors, including the extent to which the third party providers maintain their own insurance coverage.
Technology
We use multifaceted software tools and hardware platforms that support seamless integration with the IT networks of our customers and vendors through electronic data exchange systems. These tools enhance our relationships and ability to effectively communicate with customers and vendors. Our tools and platforms provide real-time, web-based visibility into the supply chains of our customers.
In our contract logistics segment, we customize our proprietary Warehouse Management System (WMS)warehouse management and sequencing systems to meet the needs of individual customers. Our WMSsystems allows us to send our customers an advance shipping notice through a simple, web-based interface that can be used by a variety of vendors. It also enables us to clearly identify and communicate to the customer any vendor-related problems that may cause delays in production. We also use cross-dock and container-return-management applications that automate the cycle of material receipt and empty container return.
Our proprietary and third-party transportation management system allows full operational control and visibility from dispatch to delivery, and from invoicing to receivables collections. For our employee drivers, the system provides automated dispatch to hand-held devices, satellite tracking for quality control and electronic status broadcasts to customers when requested. Our international and domestic air freight and ocean forwarding services use similar systems with added functionalities for managing air and ocean freight transportation requirements. All of these systems have customer-oriented web interfaces that allow for full shipment tracking and visibility, as well as for customer shipment input. We also provide systems that allow agents to list pending freight shipments and owner-operators with available capacity and track particular shipments at various points in the shipping route.
We believe that these tools improve our services and quality controls, strengthen our relationships with our customers, and enhance our value proposition. Any significant disruption or failure of these systems could have a materially adverse effect on our operations and financial results.
Government Regulation
Our operations are regulated and licensed by various U.S. federal and state agencies, as well as comparable agencies in Mexico, Canada, and Colombia. Interstate motor carrier operations are subject to the broad regulatory powers, to include drug and alcohol testing, safety and insurance requirements, prescribed by the Federal Motor Carrier Safety Administration (FMCSA), which is an agency of the U.S. Department of Transportation (DOT). Matters such as weight and equipment dimensions also are subject to United States federal and state regulation. We operate in the United States under operating authority granted by the DOT. We are also subject to regulations relating to testing and specifications of transportation equipment and product handling requirements. In addition, our drivers and owner-operators must have a commercial driver’s license and comply with safety and fitness regulations promulgated by the FMCSA, including those relating to drug and alcohol testing.
Our international operations, which include not only facilities in Mexico, Canada and Colombia but also transportation shipments managed by our specialized service operations, are impacted by a wide variety of U.S. government regulations and applicable international treaties. These include regulations of the U.S. Department of State, U.S. Department of Commerce, and the U.S. Department of Treasury. Regulations also cover specific commodities, destinations and end-users. Part of our specialized services operations is engaged in the arrangement of imported and exported freight. As such, we are subject to the regulations of the U.S. Customs and Border Protection, which include significant notice and registration requirements. In various Canadian provinces, we operate transportation services under authority granted by the Ministries of Transportation and Communications.
Transportation-related regulations are greatly affected by U.S. national security legislation and related regulations. We believe we comply with applicable material regulations and that the costs of regulatory compliance are an ordinary operating cost of our business that we may not be able to recoup from rates charged to customers.
7
Environmental Regulation
We are subject to various federal, state and local environmental laws and regulations that focus on, among other things: the emission and discharge of hazardous materials into the environment or their presence at our properties or in our vehicles; fuel storage tanks; transportation of certain materials; and the discharge or retention of storm water. Under specific environmental laws, we could also be held responsible for any costs relating to contamination at our past or present facilities and at third-party waste disposal sites, as well as costs associated with cleanup of accidents involving our vehicles.
8
As climate change issues become more prevalent, federal, state and local governments, as well as some of our customers, have made efforts to respond to these issues. This increased focus on sustainability may result in new legislation or regulations and customer requirements that could negatively affect us as we may incur additional costs or be required to make changes to our operations in order to comply with any new regulations or customer requirements. Legislation or regulations that potentially impose restrictions, caps, taxes, or other controls on emissions of greenhouse gases such as carbon dioxide, a by-product of burning fossil fuels such as those used in the Company’s trucks, could adversely affect our operations and financial results. More specifically, legislative or regulatory actions relating to climate change could adversely impact the Company by increasing our fuel costs and reducing fuel efficiency and could result in the creation of substantial additional capital expenditures and operating costs in the form of taxes, emissions allowances, or required equipment upgrades.
We do not believe we are currently in material compliance with applicable laws and regulations and that the cost of future compliance with current environmental laws or regulations will have a material adverse effect on our operations, financial condition, competitive position or capital expenditures for fiscal year 2022.has not materially affected results of operations. However, future changes to laws or regulations may adversely affect our operations and could result in unforeseen costs to our business.
Seasonality
Generally, demand for our value-added services delivered to existing customers increases during the second calendar quarter of each year as a result of the automotive industry’s spring selling season. Conversely, such demand generally decreases during the third quarter of each year due to the impact of scheduled OEM customer plant shutdowns in July for vacations and changeovers in production lines for new model years.
Our value-added services business is also impacted in the fourth quarter by plant shutdowns during the December holiday period. However, due to the COVID-19 pandemic and its impact on North American automotive manufacturing, we may not experience normal seasonal demand for our services supporting the automotive production and selling cycles during the current year.
Our transportation services business is generally impacted by decreased activity during the post-holiday winter season and, in certain states, during hurricane season. At these times, some shippers reduce their shipments, and inclement weather impedes trucking operations or underlying customer demand.
Prolonged adverse weather conditions, particularly in winter months, can also adversely impact margins due to productivity declines and related challenges meeting customer service requirements.
Additionally, our transportation services business, excluding dedicated transportation tied to specific customer supply chains, is generally impacted by decreased activity during the post-holiday winter season and, in certain states during hurricane season, because some shippers reduce their shipments and inclement weather impedes trucking operations or underlying customer demand.
Available Information
We make available free of charge on or through our website, www.universallogistics.com, our annual reports on Form 10-K, quarterly reports on Form 10-Q, current reports on Form 8-K and all amendments to those reports as soon as reasonably practicable after such material is electronically filed with or furnished to the Securities and Exchange Commission (SEC). The contents of our website are not incorporated into this filing.
ITEM 1A:RISK FACTORS
|
|
Set forth below, and elsewhere in this Report and in other documents we file with the SEC, are risks and uncertainties that could cause our actual results to differ materially from the results contemplated by the forward-looking statements contained in this Report.Report or our other filings with the SEC or in oral presentations such as telephone conferences open to the public. You should carefully consider the following factors in conjunction with “Management’s Discussion and Analysis of Financial Condition and Results of Operations” in Item 7 and our Consolidated Financial Statements and related Notes in Item 8.
Risks Related to Our Industry
Our business is subject to general economic and business factors that are largely beyond our control, any of which could have a material adverse effect on our operating results.
Our business is dependent upon a number of general economic and business factors that may adversely affect our results of operations. These factors include significant increases or rapid fluctuations in fuel prices, excess capacity in the transportation and logistics industry, surpluses in the market for used equipment, interest rates, fuel taxes, license and registration fees, insurance premiums, self-insurance levels, and difficulty in attracting and retaining qualified drivers and independent contractors.
We operate in a highly competitive and fragmented industry, and our business may suffer if we are unable to adequately address any downward pricing pressures or other factors that may adversely affect our ability to compete with other carriers.
Further, we are affected by recessionary economic cycles and downturns in customers’ business cycles, particularly in market segments and industries, such as the automotive industry, where we have a significant concentration of customers. Economic conditions may also adversely affect our customers and their ability to pay for our services.
Deterioration in the United States and world economies could exacerbate any difficulties experienced by our customers and suppliers in obtaining financing, which, in turn, could materially and adversely impact our business, financial condition, results of operations and cash flows.
89
We operate in the highly competitive and fragmented transportation and logistics industry, and our business may suffer if we are unable to adequately address factors that may adversely affect our revenue and costs relative to our competitors.
Numerous competitive factors could impair our ability to maintain our current profitability. These factors include the following:
| • we compete with many other truckload carriers and logistics companies of varying sizes, some of which have more equipment, a broader coverage network, a wider range of services and greater capital resources than we do; • some of our competitors periodically reduce their rates to gain business, especially during times of reduced growth rates in the economy, which may limit our ability to maintain or increase rates, maintain our operating margins, or maintain significant growth in our business; • many customers reduce the number of carriers they use by selecting so-called “core carriers” as approved service providers and, in some instances, we may not be selected; • some companies hire lead logistics providers to manage their logistics operations, and these lead logistics providers may hire logistics providers on a non-neutral basis which may reduce the number of business opportunities available to us; • many customers periodically accept bids from multiple carriers and providers for their shipping and logistic service needs, and this process may result in the loss of some of our business to competitors and/or price reductions; • the trend toward consolidation in the trucking and third-party logistics industries may create other large providers with greater financial resources and other competitive advantages relating to their size and with whom we may have difficulty competing; • advances in technology require increased investments to remain competitive, and our customers may not be willing to accept higher rates to cover the cost of these investments; • competition from Internet-based and other brokerage companies may adversely affect our relationships with our customers and freight rates; • economies of scale that may be passed on to smaller providers by procurement aggregation providers may improve the ability of smaller providers to compete with us; • some areas of our service coverage require trucks with engines no older than 2011 in order to comply with environmental rules; and • an inability to continue to access capital markets to finance equipment acquisition could put us at a competitive disadvantage.
|
|
|
|
|
|
|
|
|
|
|
|
|
|
|
|
|
|
|
|
|
|
We may be adversely impacted by fluctuations in the price and availability of diesel fuel.
Diesel fuel represents a significant operating expense for the Company, and we do not currently hedge against the risk of diesel fuel price increases. An increase in diesel fuel prices or diesel fuel taxes, or any change in federal or state regulations that results in such an increase, could have a material adverse effect on our operating results to the extent we are unable to recoup such increases from customers in the form of increased freight rates or through fuel surcharges. Historically, we have been able to offset, to a certain extent, diesel fuel price increases through fuel surcharges to our customers, but we cannot be certain that we will be able to do so in the future. We continuously monitor the components of our pricing, including base freight rates and fuel surcharges, and address individual account profitability issues with our customers when necessary. While we have historically been able to adjust our pricing to help offset changes to the cost of diesel fuel through changes to base rates and/or fuel surcharges, we cannot be certain that we will be able to do so in the future.
Difficulty in attracting drivers could affect our profitability and ability to grow.
The transportation industry routinely experiences difficulty in attracting and retaining qualified drivers, including independent contractors, resulting in intense competition for drivers. We have from time to time experienced under-utilization and increased expenses due to a shortage of qualified drivers. If we are unable to attract drivers when needed or contract with independent contractors when needed, we could be required to further adjust our driver compensation packages, increase driver recruiting efforts, or let trucks sit idle, any of which could adversely affect our growth and profitability.
910
Purchase price increases for new revenue equipment and/or decreases in the value of used revenue equipment could have an adverse effect on our results of operations, cash flows and financial condition.
During the last decade, the purchase price of new revenue equipment has increased significantly as equipment manufacturers recover increased materials costs and engine design costs resulting from compliance with increasingly stringent EPA engine emission standards. Additional EPA emission mandates in the future could result in higher purchase prices of revenue equipment which could result in higher than anticipated depreciation expenses. If we were unable to offset any such increase in expenses with freight rate increases, our cash flows and results of operations could be adversely affected. If the market price for used equipment continues to decline, then we could incur substantial losses upon disposition of our revenue equipment which could adversely affect our results of operations and financial condition.
We have significant ongoing capital requirements that could affect our liquidity and profitability if we are unable to generate sufficient cash from operations or obtain sufficient financing on favorable terms.
The transportation and logistics industry is capital intensive. If we are unable to generate sufficient cash from operations in the future, we may have to limit our growth, enter into unfavorable financing arrangements, or operate our revenue equipment for longer periods, any of which could have a material adverse effect on our profitability.
We operate in a highly regulated industry and increased costs of compliance with, or liability for violation of, existing or future regulations could have a material adverse effect on our business.
The U.S. Federal Motor Carrier Safety Administration, or FMCSA and various state and local agencies exercise broad powers over our business, generally governing such activities as authorization to engage in motor carrier operations, drug and alcohol testing, safety and insurance requirements. Our owner-operators must comply with the safety and fitness regulations promulgated by the FMCSA, including those relating to drug and alcohol testing and hours-of-service. There also are regulations specifically relating to the trucking industry, including testing and specifications of equipment and product handling requirements. These measures could disrupt or impede the timing of our deliveries and we may fail to meet the needs of our customers. The cost of complying with these regulatory measures, or any future measures, could have a materially adverse effect on our business or results of operations.
A determination that independent contractors are employees could expose us to various liabilities and additional costs.
Federal and state legislators and other regulatory authorities, as well as independent contractors themselves, have increasingly assertedoften seek to assert that independent contractors in the transportation services industry are employees rather than independent contractors. Federal and stateAn example of such legislation has been introduced in the past that would make it easier for tax and other authorities to reclassify independent contractors as employees, including legislation designed to increase the recordkeeping requirements for those that engage independent contractor drivers and to increase the penalties for companies who misclassify their employees and are found to have violated employees’ overtime and/or wage requirements.
In September 2019, California enacted a new law, A.B. 5 (“AB5”), that made it more difficult for workers to be classified as independent contractors. AB5 provides that the three-pronged “ABC Test” must be used to determine worker classifications in wage order claims. Under the ABC Test, a worker is presumed to be an employee and the burden to demonstrate their independent contractor status is on the hiring company through satisfying all three of the following criteria: (a) the worker is free from control and direction in the performance of services; (b) the worker is performing work outside the usual course of the business of the hiring company; and (c) the worker is customarily engaged in an independently established trade, occupation, or business. How AB5 will be enforced is still to be determined. Although it was set to enter into effect in January 2020, a federal judge in California issued a preliminary injunction staying enforcement of AB5 on theis now enforceable against trucking industry while the California Trucking Association (“CTA”) moved forward with its suit seeking to invalidate AB5. The U.S. Court of Appeals for the Ninth Circuit, however, reversed the judicial stay on April 28, 2021. Shortly thereafter, the CTA announced it would petition the U.S. Supreme Court to review the decision of the Ninth Circuit, and on June 28, 2021, the Ninth Circuit granted a motion to stay enforcement of AB5 pending the U.S. Supreme Court’s decision on CTA’s petition.
While the U.S. Supreme Court may decide to conduct a judicial review of the Ninth Circuit’s decision, therecompanies. There can be no assurance that AB5 will not be enforceable against trucking companies in the near future,interpretations that interpretations supportingsupport the independent contractor status will not change, that other federal or state legislation will not be enacted or that various authorities will not successfully assert a position that re-classifies independent contractors to be employees. If our independent contractors are determined to be our employees, that determination could materially increase our exposure under a variety of federal and state tax, workers’ compensation, unemployment benefits, labor, employment and tort laws, as well as our potential liability for employee benefits. In addition, such changes may be applied retroactively, and if so, we may be required to pay additional amounts to compensate for prior periods. Any of the above increased costs would adversely affect our business and operating results.
10
We may incur additional operating expenses or liabilities as a result of potential future requirements to address climate change issues.
Federal, state, and local governments, as well as some of our customers, are beginning to respond to global warming issues. This increased focus on sustainability may result in new legislation or regulations and customer requirements that could negatively affect us as we may incur additional costs or be required to make changes to our operations in order to comply with any new regulations or customer requirements. Legislation or regulations that potentially impose restrictions, caps, taxes, or other controls on emissions of greenhouse gases such as carbon dioxide, a by-product of burning fossil fuels such as those used in the Company’s trucks, could adversely affect our operations and financial results. More specifically, legislative, or regulatory actions related to climate change could adversely impact the Company by increasing our fuel costs and reducing fuel efficiency and could result in the creation of substantial additional capital expenditures and operating costs in the form of taxes, emissions allowances, or required equipment upgrades. Any of these factors could impair our operating efficiency and productivity and result in higher operating costs. In addition, revenues could decrease if we are unable to meet regulatory or customer sustainability requirements. These additional costs, changes in operations, or loss of revenues could have a material adverse effect on our business, financial condition, and results of operations.
11
Risks Related to Our Business
The coronavirus outbreak or other similar outbreaks could negatively impact our financial condition, liquidity, results of operations, and cash flows.
The outbreak of the novel coronavirus (COVID-19), and any other outbreaks of contagious diseases or other adverse public health developments, could have a materially adverse effect on our financial condition, liquidity, results of operations, and cash flows. The rapid spread of COVID-19 has resulted in governmental authorities implementing numerous measures to try to contain the virus, such as travel bans and restrictions, quarantines, stay-at-home orders, increased border security and closures. These measures and the public health concerns resulting from the outbreak have severely disrupted economic and commercial activity. The resulting impact on domestic and global supply chains has caused slowdowns and reduced freight demand for transportation companies such as ours. Because we have a significant concentration of customers within the automotive industry, our revenues have been significantly affected by the closure of North American automotive and heavy-truck manufacturing facilities beginning in late March and throughout the second quarter of 2020. Although most automotive and heavy-truck operations have resumed production, additional closures and other consumer activity affecting our customers and any future wave of the virus or other similar outbreaks could further adversely affect our business. A significant portion of our revenue is also provided by a network of agents and owner-operators located throughout the United States and in Ontario, Canada. As the COVID-19 virus continues to spread in areas we service, a significant impact to our network due to illness or government restrictions could have a material adverse effect on our ability to service our customers and on our business and results of operations. In addition, the implementation of measures to protect the health and safety of our employees, customers, vendors, and the general public may disrupt our ability to efficiently manage personnel and operations and to recruit and retain driver and non-driver personnel, which could have a materially adverse effect on our operating results. Further, negative financial results, an economic downturn or uncertainty, or a tightening of credit markets caused by COVID-19 or other similar outbreaks could have a material adverse effect on our liquidity and our ability to effectively meet our short- and long-term financial obligations.
Our revenue is largely dependent on North American automotive industry production volume and may be negatively affected by future downturns in North American automobile production.
A significant portion of our larger customers are concentrated in the North American automotive industry. For customers generating annual revenues over $100,000, 31%During 2023, 43% of our revenues were derived from customers in the North American automotive industry during 2021.industry. Our business and growth largely depend on continued demand for its services from customers in this industry. Any future downturns in North American automobile production, which also impacts our steel and other metals customers, could similarly affect our revenues in future periods.
Our business derives a large portion of revenue from a few major customers, and the loss of any one or more of them as customers, or a reduction in their operations, could have a material adverse effect on our business.
A large portion of our revenue is generated from a limited number of major customers concentrated in the automotive, retail and consumer goods, steel and other metals, energy and energymanufacturing industries. Our top 10 customers accounted for approximately 38%48% of our operating revenues during 2021.2023. Our contracts with customers generally contain cancellation clauses, and there can be no assurance that these customers will continue to utilize our services or that they will continue at the same levels. Further, there can be no assurance that these customers will not be affected by a future downturn in demand, which would result in a reduction in their operations and corresponding need for our services. Moreover, our customers may individually lose market share, apart from general economic trends. If our major customers lose U.S. market share, they may have less need for services. A reduction in or termination of services by one or more of our major customers could have a material adverse effect on our business and results of operations.
11
If we are unable to retain our key employees, our business, financial condition, and results of operations could be harmed.
We are highly dependent upon the services of our key employees and executive officers. The loss of any of their services could have a material adverse effect on our operations and future profitability. We must continue to develop and retain a core group of managers if we are to realize our goal of expanding our operations and continuing our growth. We cannot assure that we will be able to do so.
A significant labor dispute involving us orthat involves one or more of our customers or that could otherwise affect our operations could reduce our revenues and harm our profitability.
AOur largest customers employ a substantial number of our employees and of the employees of our largest customersworkers who are members of industrial trade unions, and are employed undertheir employment is subject to the terms of collective bargaining agreements. Each of our unionized facilities has a separate agreement with the union that represents the workers at only that facility. During 2019, a labor strike byIn 2023, the United Auto Workers of its employees at the facilities of our largest customer,conducted a trilateral strike against Ford, General Motors, caused an extended shutdown of General Motors’ manufacturing operations and in turn, materially and adversely impacted our operating results during the third and fourth quarters of 2019. Any future labor disputes involving either us or our customers could similarly affect our operations. IfStellantis. Although the UAW reached agreements with Ford, General Motors, and our automotive customers and their suppliers are unable to negotiate new contracts Stellantis, similar such actions in the future and our customers’ plants experience slowdowns or closures as a result,could negatively impact our revenue and profitability could be negatively impacted.profitability. A labor dispute involving another supplier to our customers that results in a slowdown or closure of our customers’ plants to whichwhere we provide services could also have a material adverse effect on our business.
Significant increases in labor costs as a result of the renegotiation of our collective bargaining agreements could also be harmful to our business and our profitability.
As of December 31, 2021,2023, approximately 37%33% of our employees in the United States, Canada, and Colombia, and 91% of our employees in Mexico were members of unions and subject to collective bargaining agreements.
In addition, strikes, Subject to a few exceptions, each of our unionized facilities has a separate agreement with the union that generally represents the workers at only that facility. Any work stoppages andor slowdowns by our employees maycould affect our ability to meet our customers’ needs, and customers may do more business with our competitors if they believe that such actions may adversely affect our ability to provide service.our services. We may face the permanent loss of customers if we are unable to provide uninterrupted service.services. The terms of our future collective bargaining agreements may also may affect our competitive position and results of operations.
The conflict in the Middle East, or expansion of the conflict to other areas or countries, or similar conflicts in the region could adversely impact our business and financial results.
We do not have any direct operations in Israel, Egypt, Jordan, Lebanon, Syria, the West Bank or Gaza, but we may be affected by the broader consequences of the conflict in the Middle East. The potential implications include increased inflation, supply chain disruption, reduced access to parts for our revenue equipment, embargoes, geopolitical shifts, reduced access to diesel fuel, higher energy prices, and other effects on the global economy. The magnitude of these risks cannot be predicted, including the extent to which the conflicts may heighten other risk factors. Ultimately, these factors could materially and adversely affect the results of our operations.
12
Ongoing insurance and claims expenses could significantly reduce our earnings and cash flows.
Our future insurance and claims expenses might exceed historical levels, which could reduce our earnings and cash flows. The Company isWe are self-insured for health and workers’ compensation insurance coverage up to certain limits. If medical costs continue to increase, or if the severity or number of claims increase, and if we are unable to offset the resulting increases in expenses with higher freight rates, our earnings could be materially and adversely affected.
We face litigation risks that could have a material adverse effect on the operation of our business.
We face litigation risks regarding a variety of issues, including without limitation, accidents involving our trucks and employees, alleged violations of federal and state labor and employment laws, securities laws, environmental liability, and other matters. These proceedings may be time-consuming, expensive, and disruptive to normal business operations. The defense of such lawsuits could result in significant expense and the diversion of our management’s time and attention from the operation of our business. In recent years, several insurance companies have stopped offering coverage to trucking companies as a result of increases in the severity of automobile liability claims and higher costs of settlements and verdicts. Recent jury awards in the trucking industry have reached into the tens and even hundreds of millions of dollars. Trends in such awards, commonly referred to as nuclear verdicts, could adversely affect our ability to obtain suitable insurance coverage or could significantly increase our cost for obtaining such coverage, which would adversely affect our financial condition, results of operations, liquidity, and cash flows. Costs we incur to defend or to satisfy a judgment or settlement of these claims may not be covered by insurance or could exceed the amount of that coverage or increase our insurance costs and could have a material adverse effect on our financial condition, results of operations, liquidity, and cash flows.
We have substantial fixed costs and, as a result, our operating income fluctuates disproportionately with changes in our net sales.
A significant portion of our expenses are fixed costs that neither increase nor decrease proportionately with our sales. There can be no assurance that we would be able to reduce our fixed costs proportionately in response to a decline in our sales; therefore, our competitiveness could be significantly impacted. As a result, a decline in our sales would result in a higher percentage decline in our income from operations and net income.
12Our existing and future indebtedness could limit our flexibility in operating our business or adversely affect our business and our liquidity position.
We have outstanding indebtedness, and our debt may fluctuate from time to time in the future for various reasons, including changes in the results of our operations, capital expenditures, and potential acquisitions. Our current indebtedness, as well as any future indebtedness, could, among other things:
Our significant debt levels could have important consequences such as the following:
|
|
|
|
|
|
|
|
|
|
|
|
Our ability to make scheduled payments on, or to refinance, our debt and other obligations will depend on our financial and operating performance, which, in turn, is subject to our ability to implement our strategic initiatives, prevailing economic conditions and certain financial, business, and other factors beyond our control. If our cash flow and capital resources are insufficient to fund our debt service and other obligations, we may be forced to reduce or delay expansion plans and capital expenditures, sell material assets or operations, obtain additional capital, or restructure our debt. We cannot provide any assurance that our operating performance, cash flow and capital resources will be sufficient to pay our debt obligations when they become due. We also cannot provide assurance that we would be able to dispose of material assets or operations or restructure our debt or other obligations if necessary or, even if we were able to take such actions, that we could do so on terms that are acceptable to us.
13
Disruptions in the credit markets may adversely affect our business, including the availability and cost of short-term funds for liquidity requirements and our ability to meet long-term commitments, which could adversely affect our results of operations, cash flows and financial condition.
If cash from operations is not sufficient, we may be required to rely on the capital and credit markets to meet our financial commitments and short-term liquidity needs. Disruptions in the capital and credit markets, as have been experienced during recent years, could adversely affect our ability to draw on our revolving credit facilities. Our access to funds under the credit facilities is dependent on the ability of banks to meet their funding commitments. A bank may not be able to meet their funding commitments if they experience shortages of capital and liquidity or if they experience excessive volumes of borrowing requests from other borrowers within a short period of time.
Longer term disruptions in the capital and credit markets as a result of uncertainty, changing or increased regulation, reduced alternatives, or failures of significant financial institutions could adversely affect our access to liquidity needed for our business. Any disruption could require us to take measures to conserve cash until the markets stabilize or until alternative credit arrangements or other funding for our business needs can be arranged, which could adversely affect our growth and profitability.
Further changes in U.S. tax laws and regulations may impact our effective tax rate and may adversely affect our business, financial condition, and operating results.
The Tax Cuts and Jobs Act had a favorable impact on our effective tax rate and our net income for 2018. We also have benefited from certain other tax provisions, such as those relating to capital expenditure deductions. However, future changes in the U.S. tax laws, including any changes related to capital expenditure deductions or any significant changes to federal tax rates, interest expense deductions, or the taxation of business entities, could have a materially adverse effect on our growth opportunities, business, and results of operations.
13
Our results of operations may be affected by seasonal factors.
Our productivity may decrease during the winter season when severe winter weather impedes operations. Also, some shippers may reduce their shipments after the winter holiday season. At the same time, operating expenses may increase, and fuel efficiency may decline due to engine idling during periods of inclement weather. Harsh weather conditions generally also result in higher accident frequency, increased freight claims, and higher equipment repair expenditures. Generally, demand for our value-added services delivered to existing customers increases during the second calendar quarter of each year as a result of the automotive industry’s spring selling season and decreases during the third quarter of each year due to the impact of scheduled OEM customer plant shutdowns in July for vacations and changeovers in production lines for new model years. Our value-added services business is also impacted in the fourth quarter by plant shutdowns during the December holiday period.
Our operations are subject to various environmental laws and regulations, the violation of which could result in substantial fines or penalties.
We are subject to various environmental laws and regulations dealing with the handling of hazardous materials, underground fuel storage tanks, and discharge and retention of storm-water.storm water. We operate in industrial areas, where truck terminals and other industrial activities are located, and where groundwater or other forms of environmental contamination could occur. In prior years, we also maintained bulk fuel storage and fuel islands at two of our facilities. Our operations may involve the risks of fuel spillage or seepage, environmental damage, and hazardous waste disposal, among others. If we are involved in a spill or other accident involving hazardous substances, or if we are found to be in violation of applicable laws or regulations, it could have a materially adverse effect on our business and operating results. If we should fail to comply with applicable environmental regulations, we could be subject to substantial fines or penalties and to civil and criminal liability.
Our business may be disrupted by natural disasters and severe weather conditions causing supply chain disruptions.
Natural disasters such as earthquakes, tsunamis, hurricanes, tornadoes, floods or other adverse weather and climate conditions, whether occurring in the United States or abroad, could disrupt our operations or the operations of our customers or could damage or destroy infrastructure necessary to transport products as part of the supply chain. Specifically, these events may damage or destroy or assets, disrupt fuel supplies, increase fuel costs, disrupt freight shipments or routes, and affect regional economies. As a result, these events could make it difficult or impossible for us to provide logistics and transportation services; disrupt or prevent our ability to perform functions at the corporate level; and/or otherwise impede our ability to continue business operations in a continuous manner consistent with the level and extent of business activities prior to the occurrence of the unexpected event, which could adversely affect our business and results of operations or make our results more volatile.
14
Our business may be harmed by public health crises, terrorist attacks, future war, or anti-terrorism measures.
The rapid or unrestricted spread of a contagious illness such as COVID-19, or the fear of such an event, could significantly disrupt global and domestic supply chains for our customers or result in various travel restrictions, any of which could have a material adverse effect on our business and results of operations. The duration of the current disruption in supply chains, and whether the magnitude of the disruption will change, are currently unknown. In addition, in order to prevent terrorist attacks, federal, state, and municipal authorities have implemented and continue to follow various security measures, including checkpoints and travel restrictions on large trucks. Our international operations in Canada and Mexico may be affected significantly if there are any disruptions or closures of border traffic due to security measures. Such measures may have costs associated with them, which, in connection with the transportation services we provide, we or our owner-operators could be forced to bear. Further, a public health crisis, terrorist attack, war, or risk of such an event also may have an adverse effect on the economy. A decline in economic activity could adversely affect our revenue or restrict our future growth. Instability in the financial markets as a result of a health pandemic, terrorism or war also could affect our ability to raise capital. In addition, the insurance premiums charged for some or all of the coverage currently maintained by us could increase dramatically or such coverage could be unavailable in the future.
We may be unable to successfully integrate the businesses we acquire into our operations.
Integrating businesses we acquireacquired companies may involve unanticipated delays, costs or other operational or financial problems. Successful integration of the businesses we acquire depends on a number of factors, including our ability to transition acquired companies to our management information systems. In integrating acquired businesses, we may not achieve expected economies of scale or profitability or realize sufficient revenues to justify our investment. We also face the risk that an unexpected problem at one of the acquired companies we acquire will require substantial time and attention from senior management, diverting management’s attention from other aspects of our business. We cannot be certain that our management and operational controls will be able to support us as we grow.
14
Our information technology systems are subject to certain cyber risks and disasters that are beyond our control.
We depend heavily on the proper functioning and availability of our information, communications, and data processing systems, including operating and financial reporting systems, in operating our business. Our systems and those of our technology and communications providers are vulnerable to interruptions caused by natural disasters, power loss, telecommunication and internet failures, cyber-attack, and other events beyond our control. Accordingly, information security and the continued development and enhancement of the controls and processes designed to protect our systems, computers, software, data and networks from attack, damage or unauthorized access remain a priority for us.
We have been, and in the future may be, subject to cybersecurity and malware attacks and other intentional hacking. Any failure to identify and address or to prevent a cyber- or malware-attack could result in service interruptions, operational difficulties, loss of revenues or market share, liability to our customers or others, the diversion of corporate resources, injury to our reputation and increased service and maintenance costs. For example, in June 2020, we experienced a previously disclosed ransomware cyber-attack affecting certain of our network systems. During the attack, we experienced limited disruption and rapidly deployed back-up systems or implemented temporary procedures to maintain operations. Based on our assessment and on information currently known, we do not believe the attack had or will have a material adverse impact on our business or results of operations.
Although our information systems are protected through physical and software security as well as redundant backup systems, they remain susceptible to cyber security risks. Some of our software systems are utilized by third parties who provide outsourced processing services which may increase the risk of a cyber-security incident. We have invested and continue to invest in technology security initiatives, employee training, information technology risk management and disaster recovery plans. The development and maintenance of these measures is costly and requires ongoing monitoring and updating as technologies change and efforts to overcome security measures become increasingly more sophisticated. Despite our efforts, we are not fully insulated from data breaches, technology disruptions or data loss, which could adversely impact our competitiveness and results of operations.
Any future successful cyber-attack or catastrophic natural disaster could significantly affect our operating and financial systems and could temporarily disrupt our ability to provide required services to our customers, impact our ability to manage our operations and perform vital financial processes, any of which could have a materially adverse effect on our business.
15
We are subject to certain risks arising from doing business in Mexico.
As we continue to grow our business in Mexico, we are subject to greater risks of doing business internationally. Those risks include but are not limited to the following:
| • Fluctuations in foreign currencies; • changes in the economic strength of Mexico; • difficulties in enforcing contractual obligations and intellectual property rights; • burdens of complying with a wide variety of international and U.S. export and import laws; and • social, political, and economic instability.
|
|
|
|
|
|
|
|
|
|
We also face additional risks associated with our business in Mexico, including but not limited to the following:
| • The adoption and enforcement of restrictive trade policies; • the imposition of any import or export tariffs, taxes, duties, or fees; • the safety and security of our employees and independent contractors, and the potential theft or vandalism of our revenue equipment; and • potential disruptions or delays at border crossings due to immigration-related issues or other factors.
|
|
|
|
|
|
|
|
|
|
If we are unable to address business concerns related to our Mexican operations in a timely and cost-efficient manner, our financial position, results of operations, or cash flows could be adversely affected.
15
Discontinuation, reform, or replacement of LIBOR may adversely affect our variable rate debt.
Borrowings under our credit facilities are at variable rates of interest, primarily based on London Interbank Offered Rate (“LIBOR”). LIBOR tends to fluctuate based on general interest rates, rates set by the U.S. Federal Reserve Board and other central banks, the supply of and demand for credit in the London interbank market, and general economic conditions. In July 2017, the Financial Conduct Authority in the U.K. announced a desire to phase out LIBOR as a benchmark by the end of 2021. However, for U.S. dollar-denominated (“USD”) LIBOR, only one-week and two-month USD LIBOR will cease to be published after 2021, and all remaining USD LIBOR tenors will continue being published until June 2023. Financial industry working groups are developing replacement rates and methodologies to transition existing agreements that depend on LIBOR as a reference rate; however, we can provide no assurance that market-accepted rates and transition methodologies will be available and finalized at the time of LIBOR cessation. If clear market standards and transition methodologies have not been developed by the time LIBOR becomes unavailable, we may have difficulty reaching agreement on acceptable replacement rates under our credit facilities. If we are unable to negotiate replacement rates on favorable terms, it could have a material adverse effect on our earnings and cash flows.
Risks Related to Our Common Stock
Our public shareholders may have limited influence over our significant corporate actions.
We are controlled by Matthew T. Moroun, the Chairman of our Board of Directors. The influenceDirectors, is the trustee of our public shareholders over significant corporate actions is limited, and Mr. Moroun’s interests may conflict with our interests and the interests of other shareholders.
Matthew T. Moroun owns directly and indirectly approximately 72%certain family trusts that collectively own greater than 50% of our outstanding common stock. As a result,shares. In this capacity, Mr. Moroun controlsholds investment power over the shares in the family trusts. Frederick P. Calderone, a member of our Board of Directors, is the special trustee of the family trusts and, in that capacity, he exercises voting authority over the shares in the family trusts. The special trustee serves at the discretion of the trustee of the trusts, and members of the Moroun family are the beneficiaries of the trusts. Votes cast on behalf of the family trusts control any action requiring the general approval of our shareholders, including the election of our board of directors, the adoption of amendments to our articles of incorporation and bylaws, and the approval of any merger or sale of substantially all of our assets. So long as Mr. Moroun continues to own a significant amount of our equity, even if such amount is less than a majority of the outstanding shares of our common stock, he will be capable substantially influencing the outcome of votes on all matters requiring approval by the shareholders, including our ability to enter into certain corporate transactions. This concentration of ownership could also limit the price that some investors might be willing to pay for shares of our common stock.
The interests of Mr.our controlling shareholders may conflict with those of the Company and our other shareholders.
The interests of the Moroun family trusts could conflict with or differ from our interests or the interests of Universal or our other shareholders. For example, the concentration of ownership he holdsin the trusts could delay, defer, or prevent a change of control of ourthe Company or impede a merger, takeover or other business combination that may otherwise be favorable for us. Accordingly, Mr. Morounto the Company and our other shareholders. The votes cast on behalf of the family trusts could cause us to enteralso result in our entry into transactions or agreements of whichthat our other shareholders woulddo not approve or make decisions with which they may disagree. Mr. Moroun may continue to retain controlapprove. Our controlling shareholders might also refrain from voting in favor of us for the foreseeable future and may decide not to enter into a transaction that would result in whichour other shareholders would receivereceiving consideration for our common stock that is much higher than theits then-current market price ofprice. Any such decisions that may be made in the future by our common stock. In addition, he could elect to sell a controlling interest in us to a third-party and our other shareholders may not be able to participate in such transaction or, if they are able to participate in such a transaction, such shareholders may receive less than the then current fair market value of their shares. Any decision regarding their ownership of us that Mr. Moroun may make at some future time will be in histheir absolute discretion, subject to applicable laws and fiduciary duties.
Because Matthew T. Moroun ownswe are a controlling interest in us,“controlled company” under NASDAQ rules, we are not subject to certain corporate governance standards that apply to other publicly traded companies.
Mr. Moroun controls a majority of our outstanding common stock. As a result, we are a controlled company under the rules of the NASDAQ Stock Market. The NASDAQ rules state that a controlled company ofis one in which more than 50% of the voting power is held by another person or group of persons acting together is atogether. A controlled company and may elect not to comply with certain corporate governance requirements, includingincluding:
|
|
|
|
• the compensation committee be composed entirely of independent directors with a written charter addressing the committee’s purpose and responsibilities. 16 |
|
TheseWe are a controlled company under these rules, and these requirements will not apply to us as long as we remain a controlled company.retain that status. Accordingly, you may not have the same protections afforded to shareholders of companies that are subject to all of the corporate governance requirements of NASDAQ.
16
Our stock trading volume may not provide adequate liquidity for investors.
Although shares of our common stock are traded on the NASDAQ Global Market, the average daily trading volume in our common stock is less than that of other larger transportation and logistics companies. A public trading market having the desired characteristics of depth, liquidity and orderliness depends on the presence in the marketplace of a sufficient number of willing buyers and sellers of the common stock at any given time. This presence depends on the individual decisions of investors and general economic and market conditions over which we have no control. Given the daily average trading volume of our common stock, significant sales of the common stock in a brief period of time, or the expectation of these sales, could cause a decline in the price of our common stock. Additionally, low trading volumes may limit a shareholder’s ability to sell shares of our common stock.
Our ability to pay regular dividends on our common stock is subject to the discretion of our Board of Directors and will depend on, among other things, our financial condition, results of operations, capital requirements, any covenants included in our credit facilities any legal or contractual restrictions on the payment of dividends and other factors the Board of Directors deems relevant.
We have adopted a cash dividend policy which anticipates a total annual dividend of $0.42 per share of common stock. However, the payment of future dividends will be at the discretion of our Board of Directors and will depend, among other things, on our financial condition, results of operations, capital requirements, any covenants included in our credit facilities, any legal or contractual restrictions on the payment of dividends and other factors the Board of Directors deem relevant. As a consequence of these limitations and restrictions, we may not be able to make, or may have to reduce or eliminate, the payment of dividends on our common stock. For example, due to the uncertainty caused by the COVID-19 pandemic, our Board of Directors temporarily suspended the Company’s cash dividend policy. We suspended the policy during the first half of 2020, but it has since been reinstated. Any change in the level of our dividends or the suspension of the payment thereof could adversely affect the market price of our common stock.
Our articles of incorporation and bylaws have, and under Michigan law are subject to, provisions that could deter or prevent a change of control.
Our articles of incorporation and bylaws contain provisions that might enable our management to resist a proposed takeover of our Company. These provisions could discourage, delay, or prevent a change of control of our Company or an acquisition of our Company at a price that our shareholders may find attractive. These provisions also may discourage proxy contests and make it more difficult for our shareholders to elect directors and take other corporate actions. The existence of these provisions could limit the price that investors might be willing to pay in the future for shares of our common stock. These provisions include:
• a requirement that special meetings of our shareholders may be called only by our Board of Directors, the Chairman of our Board of Directors, our Chief Executive Officer, or the holders of a majority of our outstanding common stock; • advance notice requirements for shareholder proposals and nominations; • the authority of our Board of Directors to issue, without shareholder approval, preferred stock with such terms as the Board of Directors may determine, including in connection with our implementation of any shareholders rights plan; and • an exclusive forum bylaw provision requiring that any derivative action brought on behalf of the corporation, any action asserting a claim of breach of a legal or fiduciary duty and any similar claim under the Michigan Business Corporation Act or our articles of incorporation must be brought exclusively in the Circuit Court of the County of Macomb in the State of Michigan or the United States District Court for the Eastern District of Michigan, Southern Division. |
|
|
|
|
|
|
|
|
In addition, certain provisions of Michigan law that apply to us could discourage or prevent a change of control or acquisition of our Company.
17
Ineffective internal control over financial reporting could result in errors in our financial statements, reduce investor confidence, and adversely impact our stock price.
17
As discussed in Part II, Item 9A “Management’s Report on Internal Control Over Financial Reporting” later in this report, in the fourth quarter of 2023, we identified a material weakness in controls in place to identify potential data-entry errors related to our contracted rates and quantities and their associated invoices and amounts recorded as unbilled revenue. We are in the process of remediating the material weakness, but our efforts may not be successful. To remediate the material weakness, we plan to modify our policies and procedures for the timely review and approval of those contracted rates that are entered into the system, add a monitoring control that requires a secondary review of all contracted rates entered into the system to ensure they are being reviewed timely and entered accurately, and enhance the controls associated with invoices to ensure they reflect contracted rates. If we are unable to remediate the material weakness in an appropriate and timely manner, or if we identify additional control deficiencies that individually or together constitute significant deficiencies or material weaknesses, our ability to accurately record, process, and report financial information and consequently, our ability to prepare financial statements within required time periods, could be adversely affected. Failure to maintain effective internal control over financial reporting could result in violations of applicable securities laws, stock exchange listing requirements, and the covenants under our debt agreements, subject us to litigation and investigations, negatively affect investor confidence in our financial statements, and adversely impact our stock price and ability to access capital markets.
ITEM 1B:UNRESOLVED STAFF COMMENTS
None.
ITEM 1C: CYBERSECURITY
Cybersecurity Risk Management and Strategy
We have developed and implemented a cybersecurity risk management program intended to protect the confidentiality, integrity, and availability of our critical systems and information.
We design and assess our program based on the National Institute of Standards and Technology Cybersecurity Framework (NIST CSF and AI Risk Management Framework). This does not mean that we meet any particular technical standards, specifications, or requirements, but only that we use the NIST CSF as a guide to help us identify, assess, and manage cybersecurity risks relevant to our business.
Information about cybersecurity risks and our risk management processes is collected, analyzed and considered as part of our overall enterprise risk management program.
Key components of our cybersecurity risk management program include:
At this time, we have not identified risks from known cybersecurity threats, including as a result of any prior cybersecurity incidents, that have materially affected us, including our operations, business strategy, results of operations, or financial condition. We face certain ongoing risks from cybersecurity threats that, if realized, are reasonably likely to materially affect us, including our operations, business strategy, results of operations, or financial condition. For an additional discussion of certain risks associated with cybersecurity see Item 1A, “Risk Factors” above.
Cybersecurity Governance
Our Board considers cybersecurity risk as part of its risk oversight function and has delegated to the Audit Committee oversight of cybersecurity and other information technology risks. The Audit Committee oversees management’s implementation of our cybersecurity risk management program. The Audit Committee receives quarterly reports from management on our cybersecurity risks. In addition, management updates the Audit Committee, as necessary, regarding any significant cybersecurity incidents. The Audit Committee reports to the full Board regarding its activities, including those related to cybersecurity, and the full Board also receives a periodic briefing from management on our cyber risk management program.
18
Our Cybersecurity team, led by our Manager of Information Security, is responsible for assessing and managing our material risks from cybersecurity threats. The team is led by individuals who, on a combined basis, have more than 20 years of IT and cybersecurity related experience across multiple industries. Our Manager of Information Security has primary responsibility for our overall cybersecurity risk management program and supervises both our internal cybersecurity personnel and any retained external cybersecurity consultants. Our Cybersecurity team is informed about and monitors the prevention, detection, mitigation, and remediation of cybersecurity risks and incidents through various means, which may include, among other things, briefings with internal security personnel, threat intelligence and other information obtained from governmental, public or private sources, including external consultants engaged by us, and alerts and reports produced by security tools deployed in our IT environment. |
|
None.
ITEM 2: PROPERTIES
|
|
We are headquartered and maintain our corporate administrative offices in Warren, Michigan. We own our corporate administrative offices, as well as 23 terminal yards and other properties in the following locations: Dearborn, Michigan; Romulus, Michigan; Compton, California; Riverside, California; Jacksonville, Florida; Garden City, Georgia; Savannah, Georgia; Harvey, Illinois; Gary, Indiana; Louisville, Kentucky; Albany, Missouri; Rural Hall, North Carolina; South Kearny, New Jersey; Cleveland, Ohio; Columbus, Ohio; Reading, Ohio; Latty, Ohio; York County, Pennsylvania; Wall, Pennsylvania; Mount Pleasant, South Carolina; Memphis, Tennessee; Dallas, Texas; Houston, Texas; Millwood, West VirginiaCloverdale, Virginia; and Clearfield, Utah.
As of December 31, 2021,2023, we also leased 9187 operating, terminal and yard, and administrative facilities in various U.S. cities located in 2422 states, in Windsor, Ontario; and in Monterrey, Mexico; Saltillo, Mexico; and San Luis Potosí, Mexico. Generally, our facilities are utilized by our operating segments for various administrative, transportation-related or value-added services. We also deliver value-added services under our contract logistics segment inside or linked to 3738 facilities provided by customers. Certain of our leased facilities are leased from entities controlled by our majority shareholders. These facilities are leased on either a month-to-month basis or extended terms. For more information on our lease arrangements, see Part II, Item 8: Notes 11, 1310, 12 and 1615 to the Consolidated Financial Statements.
ITEM 3:LEGAL PROCEEDINGS
|
|
On March 17, 2021, the Company received a complaint from the National Labor Relations Board (the “NLRB”) based on charges alleged by the International Brotherhood of Teamsters against four of the Company’s operating subsidiaries. The charges stem from the Company’s decision to close underperforming operations in California in December 2019. In April 2021, the Company answered the complaint by denying it engaged in any unfair labor practices and maintaining that the Company closed the underperforming California terminal due to financial reasons. In October 2021, the Company received an adverse ruling requiring the Company to, among other things, reinstate the terminated drivers and compensate them for back pay. The Company is appealing the decision. The calculation of the amount owed to the drivers will take into consideration any offsetting earnings made by terminated individuals since their separation from the Company. The Company currently estimates the possible range of financial exposure in the matter to be between $4.3 million and $7.2 million. Based on the Company’s best estimate of the liability at this time, the Company has recorded an accrued liability for this matter of $5.8 million. While the outcome of these claims cannot be predicted with any certainty, management does not believe the outcome of any of these matters will have a material adverse effect on our business, financial position, results of operations or cash flows.
The Company is involved in certain other claims and pending litigation arising from the ordinary conduct of business. We also provide accruals for claims within our self-insured retention amounts. Based on the knowledge of the facts, and in certain cases, opinions of outside counsel, in the Company’s opinion the resolution of these claims and pending litigation will not have a material effect on our financial position, results of operations or cash flows. However, if we experience claims that are not covered by our insurance or that exceed our estimated claim reserve, it could increase the volatility of our earnings and have a materially adverse effect on our financial condition, results of operations or cash flows.
ITEM 4:MINE SAFETY DISCLOSURES
|
|
Not applicable.
1819
PART II
ITEM 5:MARKET FOR THE REGISTRANT’S COMMON EQUITY, RELATED STOCKHOLDER MATTERS AND ISSUER PURCHASES OF EQUITY SECURITIES
|
|
Market Information
Our common stock is traded on The NASDAQ Global Market under the symbol ULH.
As of March 7, 2022,4, 2024, there were approximately 3050 record holders of our common stock, based upon data available to us from our transfer agent. We believe, however, that we have a significantly greater number of shareholders because a substantial number of our common shares are held at Thethe Depository Trust & Clearing Corporation on behalf of our shareholders.
Dividends
We have a cash dividend policy that anticipates a regular dividend of $0.42 per share of common stock, payable in quarterly increments of $0.105 per share of common stock. In addition, under our current dividend policy, after considering the regular quarterly dividends made during the year, the Board of Directors also evaluates the potential declaration of an annual special dividend payable in the first quarter of each year. The Board of Directors did not declare a special dividend in the first quarter of 2022. 2024.
Currently, we anticipate continuing to pay cash dividends on a quarterly basis, but we cannot guarantee that such dividends will be paid in the future. Future dividend policy and the payment of dividends, if any, will be determined by the Board of Directors in light of circumstances then existing, including our earnings, financial condition and other factors deemed relevant by the Board of Directors.
Limitations on our ability to pay dividends are described under the section captioned “Liquidity and Capital Resources – Revolving Credit, Promissory Notes and Term Loan Agreements” in Item 7 of this Form 10-K.
Securities Authorized for Issuance under Equity Compensation Plans
See Part III, Item 12, “Security Ownership of Certain Beneficial Owners and Management and Related Shareholder Matters” of this Annual Report for a presentation of compensation plans under which equity securities of the Company are authorized for issuance.
Purchases of Equity Securities by the Issuer
On July 29, 2021, the Company announced that it had been authorized to purchase up to 1,000,000 shares of its common stock from time to time in the open market. As of December 31, 2021, 1,000,0002023, 513,251 shares remain available under this authorization. No specific expiration date has been assigned to the authorization.
There were no purchases of our equity securities by or on behalf of us or any affiliated purchaser within the fourth quarter of 2021.2023.
1920
Performance Graph
The graph below matches Universal Logistics Holdings, Inc.'s cumulative 5-year total shareholder return on common stock with the cumulative total returns of the NASDAQ Composite index and the NASDAQ Transportation index. The graph tracks the performance of a $100 investment in our common stock and in each index (with the reinvestment of all dividends) from December 31, 20162018 to December 31, 2021.2023.
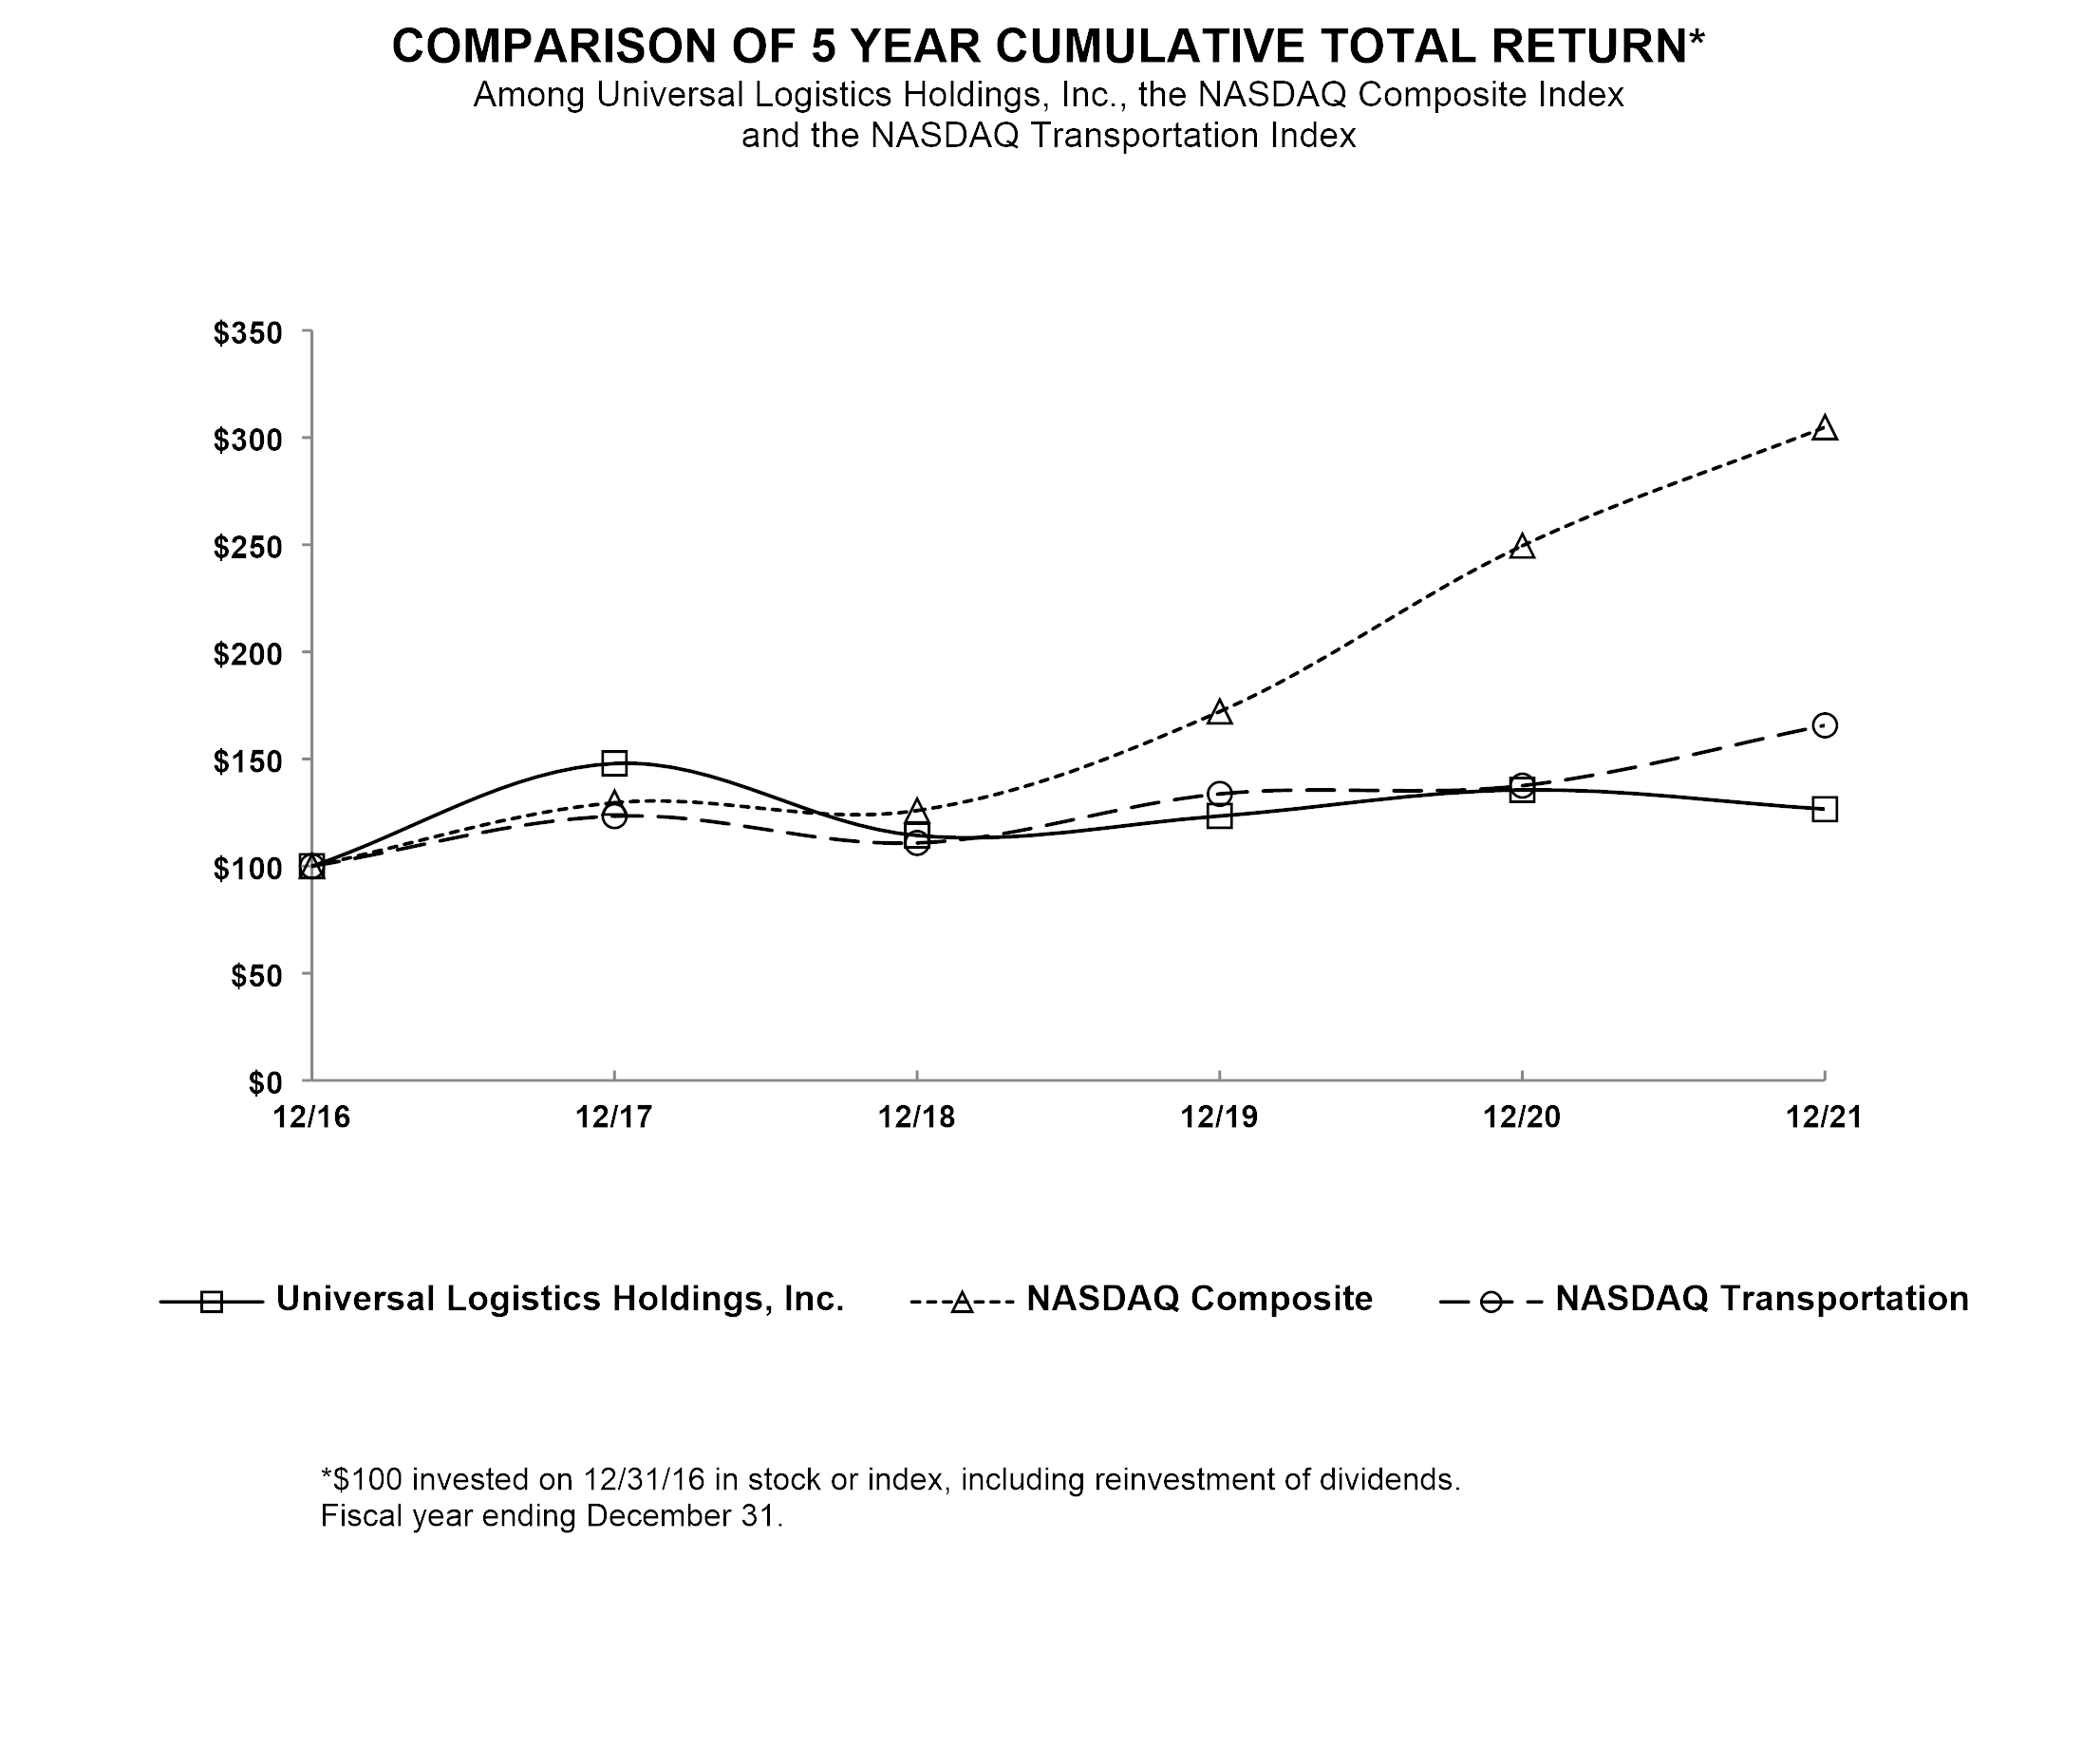
|
| 12/31/2016 |
|
| 12/31/2017 |
|
| 12/31/2018 |
|
| 12/31/2019 |
|
| 12/31/2020 |
|
| 12/31/2021 |
| ||||||
Universal Logistics Holdings, Inc. |
|
| 100.00 |
|
|
| 147.90 |
|
|
| 114.32 |
|
|
| 123.42 |
|
|
| 135.60 |
|
|
| 126.61 |
|
NASDAQ Composite |
|
| 100.00 |
|
|
| 129.64 |
|
|
| 125.96 |
|
|
| 172.17 |
|
|
| 249.51 |
|
|
| 304.85 |
|
NASDAQ Transportation |
|
| 100.00 |
|
|
| 123.35 |
|
|
| 110.84 |
|
|
| 133.75 |
|
|
| 137.58 |
|
|
| 165.72 |
|

|
| 12/31/2018 |
|
| 12/31/2019 |
|
| 12/31/2020 |
|
| 12/31/2021 |
|
| 12/31/2022 |
|
| 12/31/2023 |
| ||||||
Universal Logistics Holdings, Inc. |
|
| 100.00 |
|
|
| 107.96 |
|
|
| 118.61 |
|
|
| 110.74 |
|
|
| 199.29 |
|
|
| 169.50 |
|
NASDAQ Composite |
|
| 100.00 |
|
|
| 136.69 |
|
|
| 198.10 |
|
|
| 242.03 |
|
|
| 163.28 |
|
|
| 236.17 |
|
NASDAQ Transportation |
|
| 100.00 |
|
|
| 123.21 |
|
|
| 130.96 |
|
|
| 148.36 |
|
|
| 120.19 |
|
|
| 161.24 |
|
The stock price performance included in this graph is not necessarily indicative of future stock price performance.
21
20
ITEM 6:RESERVED |
|
ITEM 7:MANAGEMENT’S DISCUSSION AND ANALYSIS OF FINANCIAL CONDITION AND RESULTS OF OPERATIONS |
|
Overview
We areOverview
Universal Logistics Holdings, Inc. is a leading asset-light providerholding company whose subsidiaries provide a variety of customized transportation and logistics solutions throughout the United States and in Mexico, Canada and Colombia. WeOur operating subsidiaries provide a comprehensive suite of transportation and logistics solutions that allow our customers to reduce costs and manage their global supply chains more efficiently. We market our services through a direct sales and marketing network focused on selling our portfolio of services to large customers in specific industry sectors, through company-managed facilities and full-service freight forwarding and customs house brokerage offices, and through a contract network of agents who solicit freight business directly from shippers.
We operate, manage or provide services at 114121 logistics locations in the United States, Mexico, Canada and Colombia and through our network of agents and owner-operators located throughout the United States and in Ontario, Canada. Thirty-sevenThirty-eight of our value-added service operations are located inside customer plants or distribution operations; the other facilities are generally located close to our customers’ plants to optimize the efficiency of their component supply chains and production processes. Our facilities and services are often directly integrated into the production processes of our customers and represent a critical piece of their supply chains. To support our asset-lightflexible business model, we generally coordinate the duration of real estate leases associated with our value-added services with the end date of the related customer contract associated with such facility, or use month-to-month leases, in order to mitigate exposure to unrecovered lease costs.
We offer our customers a wide range of transportation services by utilizing a diverse fleet of tractors and trailing equipment provided by us, our owner-operators and third-party transportation companies. Our owner-operators provided us with 2,4211,766 tractors and 977950 trailers. We own 1,7492,284 tractors, 3,8384,434 trailers, 2,8303,494 chassis and 176108 containers. Our agents and owner-operators are independent contractors who earn a fixed commission calculated as a percentage of the revenue or gross profit they generate for us and who bring an entrepreneurial spirit to our business. Our transportation services are provided through a network of both union and non-union employee drivers, owner-operators, contract drivers, and third-party transportation companies.
As of December 31, 2021,2023, we employed 8,0049,311 people in the United States, Mexico, Canada, and Colombia, including 3,1423,038 employees subject to collective bargaining agreements. We also engaged contract staffing vendors to supply an average of 1,448450 additional personnel on a full-time-equivalent basis.
Our use of agents owner-operators, third-party providers and contract staffing vendorsowner-operators allows us to maintain both a highly flexible cost structure and a scalable business operation, while reducing investment requirements. These benefits are passed on to our customers in the form of cost savings and increased operating efficiency, while enhancing our cash generation and the returns on our invested capital and assets.
We believe that our flexible business model also offers us substantial opportunities to grow through a mixture of organic growth and acquisitions. We intend to continue our organic growth by recruiting new agents and owner-operators, expanding into new industry verticals and targeting further penetration of our key customers. We believe our integrated suite of transportation and logistics services, our network of facilities in the United States, Mexico, Canada, and Colombia, our long-term customer relationships and our reputation for operational excellence will allow us to capitalize on these growth opportunities. We also expect to continue to make strategic acquisitions of companies that complement our asset light business model, as well as companies that derive a portion of their revenues from asset based operations.
We report our financial results in four distinct reportable segments, contract logistics, intermodal, trucking, and company-managed brokerage. Operations aggregated in our contract logistics segment deliver value-added and/or dedicated transportation services to support in-bound logistics to original equipment manufacturers (OEMs) and major retailers on a contractual basis, generally pursuant to terms of one year or longer. Our intermodal segment is associated with local and regional drayage moves predominately coordinated by company-managed terminals using a mix of owner-operators, company equipment and third-party capacity providers (broker carriers). Operations aggregated in our trucking segment are associated with individual freight shipments coordinated by our agents and company-managed terminals using a mix of owner-operators, company equipment and broker carriers. Our company-managed brokerage segment provides for the pick-up and delivery of individual freight shipments using broker carriers, coordinated by our company-managed operations.
21
COVID-19 Pandemic22
Current Economic Conditions
As a leading provider of customized freight transportation and logistics solutions, our business can be impacted to varying degrees by factors beyond our control. The Company remains committedCOVID-19 virus that emerged in 2020 affected economic activity broadly and customer sectors served by our industry. Labor and equipment shortages continue to doing its partpresent challenges to protect its employees, customers, vendorsmany transportation-related industries. Disruptions in supply chains for industrial materials and the general public from the spreadsupplies have impacted some of the coronavirus outbreak (COVID-19).end-market activities that create demand for our services, and a significant labor dispute involving one or more of our customers could reduce our revenues and harm our profitability. We cannot predict how long these dynamics will last, or whether future challenges, if any, will adversely affect our results of operations.
Additionally, economic inflation can have distributed cleaning and protective supplies to our workforce, increased cleaning frequency and coverage, and provided employees direction on precautionary measures, such as sanitizing truck interiors, personal hygiene, and social distancing. We will continue to adapt our operations as required to ensure safety while continuing to provide a high level of service to our customers.
The spread of COVID-19 resulted in governmental authorities enforcing measures to try to contain the virus, which severely disrupted economic and commercial activity during the latter part of the first and most of the second quarter of 2020. To mitigate thenegative impact on our business, we implemented numerous cost reduction measures including furloughing a large portionoperating costs, and any economic recession could depress activity levels and adversely affect our results of operations. A prolonged period of inflationary pressures could cause interest rates, equipment, maintenance, labor and other operating costs to continue to increase. If the Company is unable to offset rising costs through corresponding customer rate increases, such increases could adversely affect our direct labor force, requiring personnelresults of operations. However, the pricing environment generally becomes more competitive during economic downturns, which may, as it has in the past, affect our ability to take unpaid time-off, restricting travel,obtain price increases from customers both during and reducing discretionary spending. During the third quarter 2020, we experienced a rebound infollowing such periods. Also, an economic recession could depress customer demand for transportation and manufacturing support services and experienced a more normalized level of business activity. Although we estimate COVID-19 had the largest impact on our business during the second quarter 2020, we are unable to predict with any certainty the future impact COVID-19 may have on our operational and financial performance. The ultimate magnitude of COVID-19, including the extent of its impact on the Company’s financial and operating results, which could be material, will be determined by the length of time the pandemic continues, its severity, government regulations imposed in response to the pandemic, and to its general effect on the economy and transportation demand.services.
While operating cash flows may be negatively impacted by the pandemic, the Company believes we will be able to finance our near term needs for working capital over the next twelve months, as well as any planned capital expenditures during such period, with cash balances, cash flows from operations, and loans and extensions of credit under our credit facilities and on margin against our marketable securities. Should the impact of the COVID-19 pandemic last longer than anticipated, and/or our cash flow from operations decline more than expected, we may need to obtain additional financing. The Company’s ability to fund future operating expenses and capital expenditures, as well as its ability to meet future debt service obligations or refinance indebtedness will depend on future operating performance, which will be affected by general economic, financial, and other factors beyond our control.
Factors Affecting Our Revenues
Operating Revenues. We generate substantially all of our revenues through fees charged to customers for the transportation of freight and for the customized logistics services we provide. We also derive revenue from fuel surcharges, where separately identifiable, loading and unloading activities, equipment detention, container management and storage and other related services. Operations in our intermodal, trucking and company-managed brokerage segments are associated with individual freight shipments coordinated by our agents and company-managed terminals. In contrast, our contract logistics segment delivers value-added services and/or transportation services to specific customers on a dedicated basis, generally pursuant to contract terms of one year or longer. Our segments are further distinguished by the amount of forward visibility we have into pricing and volumes, and also by the extent to which we dedicate resources and company-owned equipment. Fees charged to customers by our full service international freight forwarding and customs house brokerage are based on the specific means of forwarding or delivering freight on a shipment-by-shipment basis.
Our truckload, intermodal and brokerage revenues are primarily influenced by fluctuations in freight volumes and shipping rates. The main factors that affect these are competition, available truck capacity, and economic market conditions. Our value-added and dedicated transportation business is substantially driven by the level of demand for outsourced logistics services. Major factors that affect our revenues include changes in manufacturing supply chain requirements, production levels in specific industries, pricing trends due to levels of competition and resource costs in logistics and transportation, and economic market conditions.
We recognize revenue as control of the promised goods or services is transferred to our customers, in an amount that reflects the consideration the Company expects to receive in exchange for its services. For our transportation services businesses, which include truckload, brokerage, intermodal and dedicated services, revenue is recognized over time as the performance obligations on the in-transit services are completed. For the Company’s value-added service businesses, we have elected to use the “right to invoice” practical expedient, reflecting that a customer obtains the benefit associated with value-added services as they are provided. For additional information on revenue recognition, seesee Item 8, Note 3 to the Consolidated Financial Statements.
22
Factors Affecting Our Expenses
Purchased transportation and equipment rent. Purchased transportation and equipment rent represents the amounts we pay to our owner-operators or other third party equipment providers to haul freight and, to the extent required to deliver certain logistics services, the cost of equipment leased under short-term contracts from third parties. The amount of the purchased transportation we pay to our owner-operators is primarily based on a contractually agreed-upon rates for each load hauled, net of any rental income we receive by leasing our trailers to owner-operators. The expense also includes the amount of fuel surcharges, where separately identifiable, that we receive from our customers and pass through to our owner-operators. Our strategy is to maintain a highly flexible business model that employs a cost structure that is mostly variable in nature. As a result, purchased transportation and equipment rent is the largest component of our costs and increases or decreases proportionately with changes in the amount of revenue generated by our owner-operators and other third party providers and with the production volumes of our customers. We recognize purchased transportation and equipment rent as the services are provided.
23
Direct personnel and related benefits. Direct personnel and related benefits include the salaries, wages and fringe benefits of our employees, as well as costs related to contract labor utilized in selling and operating activities. These costs are a significant component of our cost structure and increase or decrease proportionately with the expansion, addition or closing of operating facilities. As of December 31, 2021,2023, approximately 37%33% of our employees in the United States, Canada and Colombia, and 91% of our employees in Mexico were subject to collective bargaining agreements. Any changes in union agreements will affect our personnel and related benefits cost. The operations in the United States, Mexico and Canada that are subject to collective bargaining agreements have separate, individualized agreements with several different unions that represent employees in these operations. While there are some facilities with multiple unions, each collective bargaining agreement with each union covers a single facility for that union. Such agreements have expiration dates that are generally independent of other collective bargaining agreements and include economics and operating terms tailored to the specific operational requirements of a customer. Our operation in Mexico provides competitive compensation within the Mexican statutory framework for managerial and supervisory personnel.
Operating supplies and expenses. These expenses include items such as fuel, tires and parts repair items primarily related to the maintenance of company owned and leased tractors, trailers and lift equipment, as well as licenses, dock supplies, communication, utilities, operating taxes and other general operating expenses. Because we maintain a flexible business model, our operating expenses generally relate to equipment utilization, fluctuations in customer demand and the related impact on our operating capacity. Our transportation services provided by company owned equipment depend on the availability and pricing of diesel fuel. Although we often include fuel surcharges in our billing to customers to offset increases in fuel costs, other operating costs have been, and may continue to be, impacted by fluctuating fuel prices. We recognize these expenses as they are incurred and the related income as it is earned.
Commission expense. Commission expense represents the amount we pay our agents for generating shipments on our behalf. The commissions we pay to our agents are generally established through informal oral agreements and are based on a percentage of revenue or gross profit generated by each load hauled. Traditionally, commission expense increases or decreases in proportion to the revenues generated through our agents. We recognize commission expense at the time we recognize the associated revenue.
Occupancy expense. Occupancy expense includes all costs related to the lease and tenancy of terminals and operating facilities, except utilities, unless such costs are otherwise covered by our customers. Although occupancy expense is generally related to fluctuations in overall customer demand, our contracting and pricing strategies help mitigate the cost impact of changing production volumes. To minimize potential exposure to inactive or underutilized facilities that are dedicated to a single customer, we strive where possible to enter into lease agreements that are coterminous with individual customer contracts, and we seek contract pricing terms that recover fixed occupancy costs, regardless of production volume. Occupancy expense may also include certain lease termination and related occupancy costs that are accelerated for accounting purposes into the fiscal year in which such a decision was implemented.
General and administrative expense. General and administrative expense includes the salaries, wages and benefits of administrative personnel, related support costs, taxes (other than income and property taxes), adjustments due to foreign currency transactions, bad debt expense, and other general expenses, including gains or losses on the sale or disposal of assets. These expenses are generally not directly related to levels of operating activity and may contain other expenses related to general business operations. We recognize general and administrative expense when it is incurred.
23
Insurance and claims. Insurance and claims expense represents our insurance premiums and the accruals we make for claims within our self-insured retention amounts. Our insurance premiums are generally calculated based on a mixture of a percentage of line-haul revenue and the size of our fleet. Our accruals have primarily related to cargo and property damage claims. We may also make accruals for personal injuries and property damage to third parties, physical damage to our equipment, general liability and workers' compensation claims if we experience a claim in excess of our insurance coverage. To reduce our exposure to non-trucking use liability claims (claims incurred while the vehicle is being operated without a trailer attached or is being operated with an attached trailer which does not contain or carry any cargo), we require our owner-operators to maintain non-trucking use liability coverage, which the industry refers to as deadhead bobtail coverage, of $2.0 million per occurrence. Our exposure to liability associated with accidents incurred by other third party providers who haul freight on our behalf is reduced by various factors including the extent to which they maintain their own insurance coverage. Our insurance expense varies primarily based upon the frequency and severity of our accident experience, insurance rates, our coverage limits and our self-insured retention amounts.
Depreciation and amortization. Depreciation and amortization expense relates primarily to the depreciation of owned tractors, trailers, computer and operating equipment, and buildings as well as the amortization of the intangible assets recorded for our acquired customer contracts and customer and agent relationships. We estimate the salvage value and useful lives of depreciable assets based on current market conditions and experience with past dispositions.
24
Operating Revenues
WeFor financial reporting, we broadly group our services into the following categories: truckload services, brokerage services, intermodal services, dedicated services and value-added services. Our truckload, brokerage and intermodal services are associated with individual freight shipments coordinated by our agents and company-managed terminals, while our dedicated and value-added services are provided to specific customers on a contractual basis, generally pursuant to contract terms of one year or longer.longer. The following table sets forth operating revenues resulting from each of these service categories for the years ended December 31, 2021, 20202023, 2022 and 2019,2021, presented as a percentage of total operating revenues:
|
| Years ended December 31, |
|
| Years ended December 31, |
| ||||||||||||||||||
|
| 2021 |
|
| 2020 |
|
| 2019 |
|
| 2023 |
|
| 2022 |
|
| 2021 |
| ||||||
Operating revenues: |
|
|
|
|
|
|
|
|
|
|
|
|
|
|
|
|
|
|
|
|
| |||
Truckload services |
|
| 14.2 | % |
|
| 14.5 | % |
|
| 16.6 | % |
|
| 12.9 | % |
|
| 11.4 | % |
|
| 14.2 | % |
Brokerage services |
|
| 22.9 |
|
|
| 24.2 |
|
|
| 23.5 |
|
|
| 14.7 |
|
|
| 18.3 |
|
|
| 22.9 |
|
Intermodal services |
|
| 27.0 |
|
|
| 28.3 |
|
|
| 25.8 |
|
|
| 22.5 |
|
|
| 29.4 |
|
|
| 27.0 |
|
Dedicated services |
|
| 11.7 |
|
|
| 9.2 |
|
|
| 9.2 |
|
|
| 20.7 |
|
|
| 16.1 |
|
|
| 11.7 |
|
Value-added services |
|
| 24.2 |
|
|
| 23.8 |
|
|
| 24.9 |
|
|
| 29.2 |
|
|
| 24.8 |
|
|
| 24.2 |
|
Total operating revenues |
|
| 100.0 | % |
|
| 100.0 | % |
|
| 100.0 | % |
|
| 100.0 | % |
|
| 100.0 | % |
|
| 100.0 | % |
Results of Operations
2023 Compared to 2022
The following table sets forth items derived from our Consolidated Statements of Income for the years ended December 31, 2021, 20202023 and 2019, presented as a percentage of operating revenues:2022:
|
| Years ended December 31, |
| |||||||||||||||||||||||||||||
|
| 2021 |
|
| 2020 |
|
| 2019 |
|
| 2023 |
|
| 2022 |
|
| Percent Change in Dollar Amount |
| ||||||||||||||
(Dollars in millions) |
| $ |
|
| % |
|
| $ |
|
| % |
|
| % |
| |||||||||||||||||
Operating revenues |
|
| 100.0 | % |
|
| 100.0 | % |
|
| 100.0 | % |
| $ | 1,662,139 |
|
|
| 100.0 | % |
| $ | 2,015,456 |
|
|
| 100.0 | % |
|
| (17.5 | )% |
Operating expenses: |
|
|
|
|
|
|
|
|
|
|
|
|
|
|
|
|
|
|
|
|
|
|
|
|
| |||||||
Purchased transportation and equipment rent |
|
| 47.1 |
|
|
| 48.5 |
|
|
| 47.8 |
|
|
| 571,213 |
|
|
| 34.4 |
|
|
| 847,414 |
|
|
| 42.0 |
|
|
| (32.6 | ) |
Direct personnel and related benefits |
|
| 26.1 |
|
|
| 24.3 |
|
|
| 24.4 |
|
|
| 542,779 |
|
|
| 32.7 |
|
|
| 520,263 |
|
|
| 25.8 |
|
|
| 4.3 |
|
Operating supplies and expenses |
|
| 8.5 |
|
|
| 8.0 |
|
|
| 8.0 |
|
|
| 170,994 |
|
|
| 10.3 |
|
|
| 177,440 |
|
|
| 8.8 |
|
|
| (3.6 | ) |
Commission expense |
|
| 1.9 |
|
|
| 1.9 |
|
|
| 2.1 |
|
|
| 31,370 |
|
|
| 1.9 |
|
|
| 40,288 |
|
|
| 2.0 |
|
|
| (22.1 | ) |
Occupancy expense |
|
| 2.1 |
|
|
| 2.5 |
|
|
| 2.4 |
|
|
| 44,301 |
|
|
| 2.7 |
|
|
| 41,286 |
|
|
| 2.0 |
|
|
| 7.3 |
|
General and administrative |
|
| 2.3 |
|
|
| 2.4 |
|
|
| 2.9 |
|
|
| 51,839 |
|
|
| 3.1 |
|
|
| 48,924 |
|
|
| 2.4 |
|
|
| 6.0 |
|
Insurance and claims |
|
| 2.2 |
|
|
| 1.4 |
|
|
| 3.1 |
|
|
| 27,163 |
|
|
| 1.6 |
|
|
| 22,749 |
|
|
| 1.1 |
|
|
| 19.4 |
|
Depreciation and amortization |
|
| 3.9 |
|
|
| 5.3 |
|
|
| 4.9 |
|
|
| 77,036 |
|
|
| 4.6 |
|
|
| 76,657 |
|
|
| 3.8 |
|
|
| 0.5 |
|
Total operating expenses |
|
| 94.1 |
|
|
| 94.2 |
|
|
| 95.7 |
|
|
| 1,516,695 |
|
|
| 91.2 |
|
|
| 1,775,021 |
|
|
| 88.1 |
|
|
| (14.6 | ) |
Income from operations |
|
| 5.9 |
|
|
| 5.8 |
|
|
| 4.3 |
|
|
| 145,444 |
|
|
| 8.8 |
|
|
| 240,435 |
|
|
| 11.9 |
|
|
| (39.5 | ) |
Interest and other non-operating income (expense), net |
|
| (0.3 | ) |
|
| (1.2 | ) |
|
| (0.9 | ) | ||||||||||||||||||||
Income before for income taxes |
|
| 5.6 |
|
|
| 4.6 |
|
|
| 3.3 |
| ||||||||||||||||||||
Income tax (benefit) expense |
|
| 1.4 |
|
|
| 1.1 |
|
|
| 0.7 |
| ||||||||||||||||||||
Interest (expense), net |
|
| (22,753 | ) |
|
| (1.4 | ) |
|
| (16,156 | ) |
|
| (0.8 | ) |
|
| 40.8 |
| ||||||||||||
Other non-operating income |
|
| 1,608 |
|
|
| 0.1 |
|
|
| 1,143 |
|
|
| 0.1 |
|
|
| 40.7 |
| ||||||||||||
Income before income taxes |
|
| 124,299 |
|
|
| 7.5 |
|
|
| 225,422 |
|
|
| 11.2 |
|
|
| (44.9 | ) | ||||||||||||
Income tax expense |
|
| 31,398 |
|
|
| 1.9 |
|
|
| 56,790 |
|
|
| 2.8 |
|
|
| (44.7 | ) | ||||||||||||
Net income |
|
| 4.2 | % |
|
| 3.5 | % |
|
| 2.5 | % |
| $ | 92,901 |
|
|
| 5.6 | % |
| $ | 168,632 |
|
|
| 8.4 | % |
|
| (44.9 | )% |
24
2021 Compared to 2020
Operating revenues. Operating revenues for 2021 increased $359.9 million, or 25.9%, to $1,751.0 million from $1,391.1 million in 2020. IncludedThe decrease in operating revenues are separately-identified fuel surcharges of $96.9 million for 2021 comparedwas primarily due to $67.9 milliondecreased rates and volumes in 2020. Consolidated income from operations increased $22.6 million, or 28.1%, to $103.0 million for 2021 compared to $80.4 million during the same period last year. Overall results for 2020 were negatively impacted by the COVID-19 pandemic which resulted in a substantial portion of our customers being shuttered. Results for 2021 include a favorable legal settlement which resulted in a $5.7 million pre-tax gain recorded in other non-operating income, as well as $6.0 million in charges for auto liability claims expected to settle in excess of policy limits, $5.8 million in charges for on-going legal matters, and $18.9 million of losses incurred in connection with a recent contract logistics program launch.
In the contract logistics segment,transactional transportation-related services, which includes value-addedtruckload, brokerage, and dedicated services, operatingintermodal services. Operating revenues increased $167.6 million, or 36.5%, to $627.2 million in 2021 compared to $459.7 million in the previous year. Income from operations in the contract logistics segment increased $8.8 million, or 24.6%, to $44.8 million for 2021 compared to $36.0 million in the same period last year. In 2021, Universal managed 63 value-added programs compared to 58 in the prior year period. During 2021, dedicated transportation load count increased 20.5% to 594,748 from 493,733 in 2020. Results for 2021 in the contract logistics segment include approximately $18.9 million of losses incurred in connection with a recent program launch. Results in the contract logistics segment for 2020 were negatively impacted by the COVID-19 pandemic, which caused a substantial portion of our customers to temporarily suspend operations. As a percentage of revenue, operating margin for the contract logistics segment for 2021 was 7.1% compared to 7.8% during the same period last year. The launch losses recorded in 2021 adversely impacted this segment’s operating margin by 310 basis points.
In the intermodal segment, operating revenues increased $79.4 million, or 20.2%, to $473.1 million in 2021 compared to $393.6 million in the previous year. Intermodal revenues for 2021 included $51.2 million in separately identified fuel surcharges of $118.3 million in 2023, compared to $40.1$168.6 million in the same period last year. During 2021, Universal moved 665,088 intermodal loads compared to 719,9472022. Also included in 2020, a decrease of 7.6%, while its average operating revenue per load, excluding fuel surcharges increased 13.2% to $522 from $461. In 2021,revenues were other accessorial charges such as detention, demurrage and storage, increased $45.0which totaled $58.1 million to $84.9 millionduring 2023 compared to $39.9$123.6 million one year earlier. Income from operations in the intermodal segment was unchanged at $30.4 million in both 2021 and 2020. Included in intermodal segment results were litigation related charges totaling $5.8 million in 2021. As a percentage of revenue, operating margin in the intermodal segment was 6.4% in 2021 compared to 7.7% in the prior year period. The litigation related charges recorded in 2021 adversely impacted this segment’s operating margin by 120 basis points.
In the trucking segment, which includes agent-based and company-managed trucking operations, operating revenues increased $84.9 million to $403.3 million in 2021 compared to $318.4 million in the prior year. Included in trucking segment revenues for 2021 were $24.4 million in separately identified fuel surcharges compared to $16.1 million during 2020. Income from operations in the trucking segment increased $3.2 million to $19.6 million for 2021 compared to $16.4 million in the same period last year. During 2021, load volumes increased 12.0% to 288,378 loads compared to 257,562 in 2020. Average operating revenue per load, excluding fuel surcharges, also increased 11.3% to $1,356 from $1,218 in the prior year period. 2021 trucking segment results also included a $6.0 million charge for auto liability claims expected to settle in excess of policy limits. As a percentage of revenue, operating margin in the trucking segment was 4.9% in 2021 compared to 5.2% in the same period last year. The claim charges recorded in 2021 adversely impacted the trucking segment’s operating margin by 140 basis points.
In the company-managed brokerage segment, operating revenues increased $24.7 million, or 11.3%, to $242.8 million in 2021 compared to $218.1 million in 2020. Company-managed brokerage load volumes decreased 16.3% to 121,944 in 2021 from 145,655 during the same period last year. However, average operating revenue per load, excluding fuel surcharges, increased 31.5% to $1,845 in 2021 from $1,403 in 2020. As a percentage of revenue, operating margin for the company-managed brokerage segment was 2.9% for 2021 compared to a negative 1.2% in the same period last year.
Purchased transportation and equipment rent. Purchased transportation and equipment rental costs for 2021 increased $150.6 million, or 22.3%, to $824.8 million from $674.1 million during the same period last year. Purchased transportation and equipment rent generally increases or decreases in proportion to the revenues generated through owner-operators and other third party providers and isproviders. These fluctuations are generally correlated with changes in demand for transactional transportation-related services, which includes truckload, brokerage, intermodal and to a lesser extent, dedicated services, which uses a higher mix of company-drivers compared to owner-operators.services. The absolute increasedecrease in purchased transportation and equipment rental costs was primarily the result of an increaseoverall decrease in transactional transportation-related service revenues.services. In 2021,2023, transactional transportation-related service revenues increased 25.4% over the same period last year. As a percentage of operating revenues, purchased transportation and equipment rent expense decreased to 47.1%30.1% compared to 48.5% during the same period last year. The decrease was due to a decrease in the mix of brokerage services revenue, where the cost of transportation is typically higher than our other transportation businesses. As a percentage of total revenues, brokerage services revenue decreased to 22.9% for 2021 compared to 24.2% in the same period lastprior year.
25
25
Direct personnel and related benefits. DirectTrends in direct personnel and related benefits for 2021 increased by $119.0 million, or 35.3%, to $456.6 million compared to $337.6 million during the same period last year. Trends in these expensesbenefit costs are generally correlated with changes in operating facilities and headcount requirements and, therefore, increase and decreasefluctuate correspondingly with the level of demand for our staffing needs in our contract logistics segment, which includes value-added services and staffing needsdedicated transportation, as well as the use of employee drivers in certain of our intermodal operations. The increase was due to the launch of new business wins and robust volumes inexperienced at our contract logistics segment in 2021, as well as the impact of temporary layoffs and furloughs in 2020 in response to the COVID-19 pandemic. As a percentage of operating revenues, personnel and related benefits increased to 26.1% for 2021, compared to 24.3% in 2020. The percentage is derived on an aggregate basis from both existing and new programs, and from customer operations at various stages in their lifecycles. Individual operations may be impacted by additional production shifts or by overtime at selected operations.during 2023. While generalizations about the impact of personnel and related benefits costs as a percentage of total revenue are difficult, we manage compensation and staffing levels, including the use of contract labor, to maintain target economics based on near-term projections of demand for our services.
Operating supplies and expenses. Operating supplies and expenses increased by $38.3 million, or 34.5%, to $149.4 million for 2021 compared to $111.1 million for 2020. These expenses include items such as fuel, maintenance, cost of materials, communications, utilities and other operating expenses, and generally relate to fluctuations in customer demand. The main elements ofelement driving the increase included increases of $16.5 millionchange was a decrease in fuel expense, $5.3 million in legal charges andother operating expenses including professional fees $8.2 millionand bad debt expense. This was partially offset by an increase in vehicle and other maintenance, $4.0 million in travel and entertainment, and $3.3 million in other operating expenses.maintenance.
Commission expense. Commission expense for 2021 increased by $7.2 million, or 27.1%, to $33.9 million from $26.7 million in 2020. Commission expense increaseddecreased due to increaseddecreased revenue in the agency basedour agency-based truckload business. As a percentage of operating revenues, commission expense was unchanged at 1.9% for both 2021business and 2020.decreased revenue from our intermodal agents.
Occupancy expense. Occupancy expenses increased by $2.7 million, or 7.8%, to $37.3 million for 2021. This compares to $34.6 million in 2020. The increase in occupancy expense was primarily attributable to an increase in building rents and property taxes.
General and administrative. General and administrative expense for 2021 increased by $6.4 million to $39.6 million from $33.3 million in 2020. The increase was attributable to a $4.1 million increase in salaries, wages, and benefits and a $2.5 million increase in professional fees. As a percentage of operating revenues, general and administrative expense was 2.3%primarily due to an increase in 2021 compared to 2.4% for 2020.salaries and wages as well as professional fees.
Insurance and claims. Insurance and claims expense for 2021 increased by $19.6 million to $38.8 million from $19.3 million in 2020. The increase was attributable to increases of $11.1 million in cargo and service failure claims and $8.5 million in auto liability premiums and claims. Included in insurance and claims expense were $6.0 millionwas primarily due to a decrease in charges forowner operator insurance deductions primarily related to the conversion of drivers in California to employees and an increase in auto liability claims expected to settle in excess of policy limits. As a percentage of operating revenues, insurance and claims increasedexpense. This was partially offset by a decrease in cargo claims. 2022 also included a $3.0 million credit to 2.2% for 2021 compared to 1.4% in 2020.insurance and claims expense resulting from the favorable settlement of certain auto liability claims.
Depreciation and amortization. DepreciationThe increase in depreciation and amortization expense for 2021 decreased by $6.6resulted from a $2.1 million or 8.9%, to $67.5 million from $74.1 million for 2020. Depreciation expense decreased $5.3 million and amortization expense decreased $1.3 million. The decreaseincrease in depreciation expense is attributable toand was partially offset by a $1.7 million decrease in amortization expense. During 2022, Universal revised the limited availabilityestimated useful life and salvage value of transportationcertain equipment, for purchaseand these adjustments resulted in 2021. If equipment manufacturers implement solutions to overcome production issues,additional depreciation expense is expected to increase as capital expenditures return to normalized levels.of $9.7 million in 2022.
Interest expense, net. Net interest expense was $11.6 million for 2021 compared to $14.6 million for 2020. The decreaseincrease in net interest expense reflects a decreasean increase in our outstanding borrowings and a decreaseas well as an increase in interest rates on our debt.outstanding borrowings. As of December 31, 2021,2023, our outstanding borrowings totaled $428.4were $386.4 million compared to $461.7$382.9 million at the same time last year.December 31, 2022.
Other non-operating income (expense). Other non-operating income increased by $0.5 million in 2023 and included $0.2 million in realized gain on sales of marketable securities during the year.
Income tax expense. Our effective income tax rate was $7.2 million for 202125.3% in 2023 compared to $1.9 million of other non-operating expense for 2020. Other non-operating income for 2021 includes a $5.7 million pre-tax gain from a favorable legal settlement. Other non-operating income in 2021 also includes a $1.5 million pre-tax holding gain on marketable securities due to changes in fair value recognized25.2% last year. The decrease in income comparedtaxes is primarily the result of a decrease in taxable income.
26
2022 Compared to a pre-tax holding loss2021
The following table sets forth items derived from our Consolidated Statements of $1.6 million in 2020.Income for the years ended December 31, 2022 and 2021:
|
| 2022 |
|
| 2021 |
|
| Percent Change in Dollar Amount |
| |||||||||||
(Dollars in millions) |
| $ |
|
| % |
|
| $ |
|
| % |
|
| % |
| |||||
Operating revenues |
| $ | 2,015,456 |
|
|
| 100.0 | % |
| $ | 1,750,980 |
|
|
| 100.0 | % |
|
| 15.1 | % |
Operating expenses: |
|
|
|
|
|
|
|
|
|
|
|
|
|
|
| |||||
Purchased transportation and equipment rent |
|
| 847,414 |
|
|
| 42.0 |
|
|
| 824,789 |
|
|
| 47.1 |
|
|
| 2.7 |
|
Direct personnel and related benefits |
|
| 520,263 |
|
|
| 25.8 |
|
|
| 454,256 |
|
|
| 25.9 |
|
|
| 14.5 |
|
Operating supplies and expenses |
|
| 177,440 |
|
|
| 8.8 |
|
|
| 149,394 |
|
|
| 8.5 |
|
|
| 18.8 |
|
Commission expense |
|
| 40,288 |
|
|
| 2.0 |
|
|
| 33,894 |
|
|
| 1.9 |
|
|
| 18.9 |
|
Occupancy expense |
|
| 41,286 |
|
|
| 2.0 |
|
|
| 37,286 |
|
|
| 2.1 |
|
|
| 10.7 |
|
General and administrative |
|
| 48,924 |
|
|
| 2.4 |
|
|
| 42,035 |
|
|
| 2.4 |
|
|
| 16.4 |
|
Insurance and claims |
|
| 22,749 |
|
|
| 1.1 |
|
|
| 38,829 |
|
|
| 2.2 |
|
|
| (41.4 | ) |
Depreciation and amortization |
|
| 76,657 |
|
|
| 3.8 |
|
|
| 67,537 |
|
|
| 3.9 |
|
|
| 13.5 |
|
Total operating expenses |
|
| 1,775,021 |
|
|
| 88.1 |
|
|
| 1,648,020 |
|
|
| 94.1 |
|
|
| 7.7 |
|
Income from operations |
|
| 240,435 |
|
|
| 11.9 |
|
|
| 102,960 |
|
|
| 5.9 |
|
|
| 133.5 |
|
Interest (expense), net |
|
| (16,156 | ) |
|
| (0.8 | ) |
|
| (11,599 | ) |
|
| (0.7 | ) |
|
| 39.3 |
|
Other non-operating income |
|
| 1,143 |
|
|
| 0.1 |
|
|
| 7,220 |
|
|
| 0.4 |
|
|
| (84.2 | ) |
Income before income taxes |
|
| 225,422 |
|
|
| 11.2 |
|
|
| 98,581 |
|
|
| 5.6 |
|
|
| 128.7 |
|
Income tax expense |
|
| 56,790 |
|
|
| 2.8 |
|
|
| 24,848 |
|
|
| 1.4 |
|
|
| 128.5 |
|
Net income |
| $ | 168,632 |
|
|
| 8.4 | % |
| $ | 73,733 |
|
|
| 4.2 | % |
|
| 128.7 | % |
Income tax expenseOperating revenues. Income tax expense for 2021 was $24.8 million, compared to $15.8 million for 2020, based on an effective tax rate of 25.2% and 24.7% respectively. The increase in income taxes in 2021 is the result of an increase in taxable income and our effective tax rate for 2021 compared to 2020.
26
2020 Compared to 2019
Operating revenues. Operating revenues for 2020 decreased $120.9 million, or 8.0%, to $1,391.1 million from $1,512.0 million in 2019. Included in operating revenues are separately-identified fuel surcharges of $67.9 millionwas primarily due to robust volumes in 2020 compared to $89.6 million in 2019. Excluding intermodal, the Company experienced decreases in each of its service lines in 2020 compared to the prior year. Consolidated income from operations increased $15.0 million, or 22.9%, to $80.4 million for 2020 compared to $65.4 million during the same period last year. Included in 2019 income from operations were $30.0 million in litigation related charges related to previously disclosed legal matters.
In theour contract logistics segment and increased rates in our transactional transportation-related services, which includes value-addedtruckload, brokerage, and dedicated services, operatingintermodal services. Operating revenues decreased $55.5 million to $459.7 million in 2020 compared to $515.2 million in the previous year. Income from operations in the contract logistics segment decreased $12.4 million, or 25.7%, to $36.0 million for 2020 compared to $48.4 million in 2019. The decrease in operating revenues and income is primarily attributable to the shutdown of North American automotive and heavy-truck manufacturing in the first half of 2020 due to the COVID-19 pandemic.
In the intermodal segment, operating revenues increased $3.3 million to $393.6 million in 2020 compared to $390.3 million in the previous year. Intermodal revenues for 2020 included $40.1 million in separately identified fuel surcharges of $168.6 million in 2022, compared to $47.1$96.9 million in the same period last year. Income from operations2021. Also included in the intermodal segment decreased $8.8operating revenues were other accessorial charges such as detention, demurrage and storage, which totaled $123.6 million to $30.4 million for 2020during 2022 compared to $39.2$84.9 million in 2019. As a percentage of revenue, operating margin decreased to 7.7% in 2020 compared to 10.0% in 2019. During 2020, Universal’s intermodal segment increased the number of loads hauled by 7.3%, however its average operating revenue per load, excluding fuel surcharges, more than offset this increase falling 11.0% compared to the same period last year.one year earlier.
In the trucking segment, which includes agent-based and company-managed trucking operations, operating revenues decreased $71.2 million to $318.4 million in 2020 compared to $389.6 million in the previous year. Income from operations in the trucking segment increased $37.9 million to $16.4 million for 2020 compared to an operating loss of $21.5 million in 2019, which included the settlement of a previously disclosed legal matter. In 2020, the trucking segment experienced a 5.6% increase in its average operating revenue per load, excluding fuel surcharges, however, the number of loads hauled fell 19.8% compared to the same period last year.
Operating revenues in the company-managed brokerage segment, increased $2.4 million to $218.1 million in 2020 compared to $215.8 million in the previous year. As a percentage of revenue, operating margin decreased to a negative 1.2% in 2020 compared to 0.8% in 2019. Although 2020 underperformed 2019, the fourth quarter of 2020 was an improvement sequentially as the Company continues to rationalize both lanes and customers. The company-managed brokerage segment’s average operating revenue per load increased 1.6% in 2020 while the loads moved decreased 0.7% compared to the same period last year.
Purchased transportation and equipment rent. Purchased transportation and equipment rental costs for 2020 decreased by $48.9 million, or 6.8%, to $674.1 million from $723.1 million during the same period last year. Purchased transportation and equipment rent generally increases or decreases in proportion to the revenues generated through owner-operators and other third party capacity providers and isproviders. These fluctuations are generally correlated with changes in demand for transactional transportation-related services, which includes truckload, brokerage, intermodal and dedicated services. The absolute decreaseincrease in purchased transportation and equipment rental costs was primarily the result of a decreasean overall increase in transactional transportation-related service revenues.services. In 2020,2022, transactional transportation-related service revenues decreased 6.7%increased 14.2% compared to 2019. As a percentage of operating revenues, purchased transportation and equipment rent expense increased to 48.5% compared to 47.8% during the same period last year. The increase was due to an increase in the mix of transportation-related service revenue. As a percentage of total revenues, transportation-related service revenue increased to 76.1% for 2020 compared to 75.1% in the same period last year.2021.
Direct personnel and related benefits. DirectTrends in direct personnel and related benefits for 2020 decreased by $30.6 million, or 8.3%, to $337.6 million compared to $368.2 million during the same period last year. Trends in these expensesbenefit costs are generally correlated with changes in operating facilities and headcount requirements and, therefore, increase and decreasefluctuate correspondingly with the level of demand for our staffing needs in our contract logistics segment, which includes value-added services and staffing needsdedicated transportation, as well as the use of employee drivers in certain of our intermodal operations. The decreaseincrease was due to layoffsthe launch of new business wins and temporary furloughs to right-size staffing as a cost cutting measure in response to the economic slowdown as a result of the COVID-19 pandemic. As a percentage of operating revenues, personnel and related benefits slightly decreased to 24.3% for 2020, compared to 24.4% for 2019. The percentage is derived on an aggregate basis from both existing and new programs, and from customerrobust volumes experienced at our contract logistics operations at various stages in their lifecycles. Individual operations may be impacted by additional production shifts or by overtime at selected operations.during 2022. While generalizations about the impact of personnel and related benefits costs as a percentage of total revenue are difficult, we manage compensation and staffing levels, including the use of contract labor, to maintain target economics based on near-term projections of demand for our services.
27
Operating supplies and expenses. Operating supplies and expenses decreased by $9.7 million, or 8.0%, to $111.1 million for 2020 compared to $120.8 million for 2019. These expenses include items such as fuel, maintenance, cost of materials, communications, utilities and other operating expenses, and generally relate to fluctuations in customer demand. The main elements ofdriving the decrease included decreases of $7.3 millionchange were increases in fuel expense on company tractors, $2.9 million in operating supplies and material costs in operations supporting heavy-truck programs, $2.4 million in vehicle and other maintenance, and $1.9 million in travel and entertainment.bad debt expense. These decreases were partially offset by increases of $3.3 milliondecreases in other operating expenses including professional fees and $2.0travel and entertainment expense. Other operating expenses included $5.8 million of previously disclosed legal matters in bad debt expense.2021.
Commission expense. Commission expense for 2020 decreased by $4.5 million, or 14.6%, to $26.7 million from $31.2 million for 2019. Commission expense decreasedincreased due to decreasedincreased revenue in thefrom both our agency based truckload business. As a percentage of operating revenues, commission expense decreased to 1.9% for 2020, compared to 2.1% one year earlier.business and our intermodal agents.
Occupancy expense. Occupancy expenses decreased by $2.1 million, or 5.6%, to $34.6 million for 2020. This compares to $36.6 million for 2019. The decreaseincrease in occupancy expense was primarily attributable to a decreasean increase in building rents and property taxes as we consolidated facilities for certain value-added programs.taxes.
General and administrative. General and administrative expense for 2020 decreased by $11.2 million to $33.3 million from $44.5 millionThe increase in 2019. The decrease was attributable to a $6.6 million decrease in salaries, wages, and benefits and a $6.0 million decrease in professional fees. Included in professional fees for 2019 was a $5.1 million charge for a previously disclosed legal matter. As a percentage of operating revenues, general and administrative expense was 2.4% for 2020 comparedprimarily attributable to 2.9% for 2019.an increase in salaries, wages, and benefits.
27
Insurance and claims. InsuranceThe decrease in insurance and claims was attributable to decreases in auto liability insurance premiums and claims expense for 2020 decreased by $28.2 million to $19.3 million from $47.4 million in 2019. As a percentage of operating revenues, insurance and claims decreased to 1.4% for 2020 compared to 3.1% for 2019. The decrease was primarily attributable to a $24.8 million charge for a legal settlement in the third quarter of 2019 as well as a decrease in our auto liability premiums and contractor insurance. This was partially offset by an increase in cargo and service failure claims. Our 2022 insurance and claims including $0.5included a $3.0 million credit resulting from the favorable settlement of certain auto liability claims during the period. Included in serviceinsurance and claims expense in 2021 were $6.0 million related to the June 2020 cyber-attack.previously disclosed items.
Depreciation and amortization. DepreciationThe increase in depreciation and amortization expense for 2020 decreased by $0.6resulted from an $8.6 million or 0.8%, to $74.1increase in depreciation expense and a $0.5 million from $74.8increase in amortization expense. During 2022, Universal revised the estimated useful life and salvage value of certain equipment, and these adjustments resulted in additional depreciation expense of $9.7 million for 2019. Depreciation expense decreased $0.1 million in 2020 and amortization expense decreased $0.5 million. during the period.
Interest expense, net. Net interest expense was $14.6 million for 2020 compared to $17.0 million for 2019. The decreaseincrease in net interest expense reflects an increase in interest rates partially offset by a decrease in the average interest rate on our outstanding borrowings. As of December 31, 2021,2022, our outstanding borrowings totaled $461.7$382.9 million compared to $459.7$428.4 million at the same time last year.in 2021.
Other non-operating (expense) income. Other non-operating expense was $1.9income for 2022 includes a $1.0 million for 2020 compared to other non-operating income of $1.8 million in 2019. Included in other non-operating expense during 2020 was $1.6 million in lossespre-tax holding gain on marketable securities compareddue to changes in fair value recognized in income. Other non-operating income for 2021 includes a $5.7 million pre-tax gain from a favorable legal settlement and a $1.5 million pre-tax holding gain on marketable securities due to changes in gainsfair value recognized in 2019.income.
Income tax expense. Income tax expense for 2020 was $15.8 million, compared to $12.6 million for 2019, based on anOur effective tax rate of 24.7%was 25.2% in both 2022 and 25.1% respectively.2021. The increase in income taxes in 20202022 is the result of an increase in taxable incomeincome.
Segment Financial Results
We report our financial results in four distinct reportable segments: contract logistics, intermodal, trucking, and company-managed brokerage, which are based primarily on the services each segment provides. This presentation reflects the manner in which management evaluates our operating segments, including an evaluation of economic characteristics and applicable aggregation criteria.
The following tables summarize information about our reportable segments for 2020the years ended December 31, 2023, 2022 and 2021 (in thousands):
|
| Operating Revenues |
| |||||||||
|
| December 31, |
| |||||||||
|
| 2023 |
|
| 2022 |
|
| 2021 |
| |||
Contract logistics |
| $ | 829,574 |
|
| $ | 823,934 |
|
| $ | 627,220 |
|
Intermodal |
|
| 374,667 |
|
|
| 591,946 |
|
|
| 473,059 |
|
Trucking |
|
| 333,211 |
|
|
| 392,639 |
|
|
| 403,312 |
|
Company-managed brokerage |
|
| 119,741 |
|
|
| 200,536 |
|
|
| 242,794 |
|
Other |
|
| 4,946 |
|
|
| 6,401 |
|
|
| 4,595 |
|
Total operating revenues |
| $ | 1,662,139 |
|
| $ | 2,015,456 |
|
| $ | 1,750,980 |
|
|
| Income from Operations |
| |||||||||
|
| December 31, |
| |||||||||
|
| 2023 |
|
| 2022 |
|
| 2021 |
| |||
Contract logistics |
| $ | 127,752 |
|
| $ | 118,437 |
|
| $ | 44,809 |
|
Intermodal |
|
| 1,297 |
|
|
| 83,640 |
|
|
| 30,379 |
|
Trucking |
|
| 17,258 |
|
|
| 27,564 |
|
|
| 19,607 |
|
Company-managed brokerage |
|
| (2,221 | ) |
|
| 9,993 |
|
|
| 7,122 |
|
Other |
|
| 1,358 |
|
|
| 801 |
|
|
| 1,043 |
|
Total income from operations |
| $ | 145,444 |
|
| $ | 240,435 |
|
| $ | 102,960 |
|
2023 Compared to 2022
In the contract logistics segment, which includes our value-added and dedicated services, operating revenues increased 0.7%. At the end of 2023, we managed 71 value-added programs compared to 2019. 63 at the end of 2022. Included in our contract logistics segment revenues for 2023 were $36.3 million in separately identified fuel surcharges from dedicated transportation services, compared to $41.7 million last year. Income from operations increased $9.3 million and operating margin, as a percentage of revenue was 15.4% for 2023, compared to 14.4% last year.
28
Operating revenues in the intermodal segment decreased 36.7% primarily due to decreases in the average revenue per load, excluding fuel surcharges and in the number of loads hauled. Included in intermodal segment revenues for 2023 were $56.5 million in separately identified fuel surcharges, compared to $92.3 million last year. Intermodal segment revenues also include other accessorial charges such as detention, demurrage and storage, which totaled $58.1 million during 2023 compared to $123.6 million one year earlier. The average operating revenue per load, excluding fuel surcharges, decreased 19.8% and load volumes fell an additional 14.3% on a year-over-year basis. As a percentage of revenue, operating margin in the intermodal segment for 2023 was 0.3%, compared to 14.1% one year earlier.
In the trucking segment, operating revenues decreased 15.1% primarily due to decreases in the average revenue per load, excluding fuel surcharges and in the number of loads hauled. Trucking segment revenues included $124.3 million of brokerage services compared to $168.3 million during the same period last year. Also included in our trucking segment revenues were $25.5 million in separately identified fuel surcharges during 2023 compared to $34.7 million in fuel surcharges last year. On a year-over-year basis, the average operating revenue per load, excluding fuel surcharges, decreased 3.8% while load volumes declined 10.9%. As a percentage of revenue, operating margin in the trucking segment for 2023 was 5.2% compared to 7.0% last year.
Operating revenues in the company-managed brokerage segment decreased 40.3% primarily due to decreases in the average operating revenue per load and in the number of loads moved. On a year-over-year basis, average operating revenue per load and load volumes in the company-managed brokerage segment decreased 21.0% and 16.9%, respectively. As a percentage of revenue, operating margin for 2023 was (1.9)% compared to 5.0% during the same period last year.
2022 Compared to 2021
In the contract logistics segment, which includes our value-added and dedicated services, operating revenues increased 31.4% due to robust volumes. At the end of 2022, Universal managed 63 value-added programs, unchanged from the prior year period. Included in our contract logistics segment revenues for 2022 were $41.7 million in separately identified fuel surcharges from dedicated transportation services, compared to $21.2 million in 2021. Income from operations increased $73.6 million and operating margin, as a percentage of revenue was 14.4% for 2022, compared to 7.1% in 2021. Included in 2021 were also $18.9 million of losses incurred in connection with previously disclosed contract logistics program launches.
Operating revenues in the intermodal segment increased 25.1% primarily due to an increase in the average revenue per load, excluding fuel surcharges. Included in intermodal segment revenues for 2022 were $92.3 million in separately identified fuel surcharges, compared to $51.2 million in 2021. Intermodal segment revenues also include other accessorial charges such as detention, demurrage and storage, which totaled $123.6 million during 2022 compared to $84.9 million one year earlier. The average operating revenue per load, excluding fuel surcharges, increased 34.5% while load volumes fell 16.9% on a year-over-year basis. As a percentage of revenue, operating margin in the intermodal segment for 2022 was 14.1%, compared to 6.4% one year earlier.
In the trucking segment, operating revenues decreased 2.6% due to a decrease in the number of loads hauled. Trucking segment revenues included $168.3 million of brokerage services compared to $159.0 million during the same period in the prior year. Also included in our trucking segment revenues were $34.7 million in separately identified fuel surcharges during 2022 compared to $24.4 million in fuel surcharges in 2021. Trucking segment results also included $6.0 million in previously disclosed pre-tax charges in 2021. On a year-over-year basis, the average operating revenue per load, excluding fuel surcharges, increased 33.3% while load volumes declined 30.7%. As a percentage of revenue, operating margin in the trucking segment for 2022 was 7.0% compared to 4.9% for 2021.
Operating revenues in the company-managed brokerage segment decreased 17.4% primarily due to a decrease in the number of loads moved. On a year-over-year basis, load volumes in the company-managed brokerage segment decreased 25.8% while average operating revenue per load increased 2.6%. As a percentage of revenue, operating margin for 2022 was 5.0% compared to 2.9% for 2021.
Liquidity and Capital Resources
Our primary sources of liquidity are funds generated by operations, loans and extensions of credit under our credit facilities, on margin against our marketable securities fundsand from installment notes, and proceeds from the sales of marketable securities. We use secured asset lending to fund a substantial portion of purchases of tractors, trailers and material handling equipment.
We employ an asset-lighta flexible operating strategy which we believe lowers our capital expenditure requirements. In general, our facilities used in our value-added services are leased on terms that are either substantially matched to our customer’s contracts, are month-to-month or are provided to us by our customers. We also utilize owner-operators and third-party carriers to provide a significant portion of our transportation and specialized services. A significant portion of the tractors and trailers used in our business are provided by our owner-operators. In addition, our use of agents reduces our overall need for large terminals. As a result, our capital expenditure requirements are limited in comparison to most large transportation and logistics service providers, which maintain significant properties and sizable fleets of owned tractors and trailers.
2829
In 2021,2023, our capital expenditures totaled $38.8$240.6 million. These expenditures primarily consisted of transportation equipment, and investments in support of our value-added service operations. Due to widespread shortages, production backlogs,operations, and limited availabilitythe expansion of transportation equipmentour terminal network including the $80.0 million purchase of a terminal in 2021, our expenditures were somewhat lower than our customary capital expenditures.Compton, Los Angeles County, California. Our asset-lightflexible business model depends largelysomewhat on the customized solutions we implement for specific customers. As a result, our capital expenditures will also depend on specific new contracts and the overall age and condition of our owned transportation equipment. Due to shortages, production backlogs, and limited availability of transportation equipment in recent years, as well as the acquisition of strategic real estate and customer specific programs, our expenditures are somewhat higher than the customary range of 4% to 5% of our operating revenues. In 2022, exclusive of acquisitions of businesses,2024, we expect our capital expenditures to be in the range of 4%$480 million to 5% of operating revenues.$500 million. We expect to make these capital expenditures for the acquisition of transportation equipment, to support our new and existing value-added service operations, to expand our owned terminal network, and for improvements to our existing terminal yard and container facilities. If equipment manufacturers identify and implement solutions enabling them to overcome these supply-side constraints, then we would expect to return to a normalized level of capital expenditures in future periods.
We have a cash dividend policy that anticipates a regular dividend of $0.42 per share of common stock, payable in quarterly increments of $0.105 per share of common stock. After considering the regular quarterly dividends made during the year, the Board of Directors also evaluates the potential declaration of an annual special dividend payable in the first quarter of each year. The Board of Directors did not declare a special dividend in the first quarter of 2022.2024. During the year ended December 31, 2021,2023, we paid a total of $0.42 per common share, or $11.3$11.0 million. Future dividend policy and the payment of dividends, if any, will be determined by the Board of Directors in light of circumstances then existing, including our earnings, financial condition and other factors deemed relevant by the Board of Directors.
WhileWe continually evaluate our liquidity requirements and capital structure in light of our operating cash flowsneeds, growth initiatives and capital resources. The availability of financing or equity capital will depend upon our financial condition and results of operations as well as prevailing market conditions. If such additional borrowing, lease financing, or equity capital is not available at the time we need it, then we may need to borrow more under the Revolving Credit Facility (if not then fully drawn), extend the maturity of then-outstanding debt, or rely on alternative financing arrangements. There can be negatively impacted by a prolonged pandemic, the Company believesno assurance that we will be able to financeobtain additional debt under our near term needs for workingexisting financial arrangements to satisfy our ongoing capital requirements. However, we believe that our existing liquidity and sources of capital are sufficient to support our operations over the next twelve months, as well as any planned capital expenditures during such period, with cash balances, cash flows from operations, and loans and extensions of credit under our credit facilities and on margin against our marketable securities. Should the impact of the COVID-19 pandemic last longer than anticipated, and/or our cash flow from operations decline more than expected, we may need to obtain additional financing. The Company’s ability to fund future operating expenses and capital expenditures, as well as its ability to meet future debt service obligations or refinance indebtedness will depend on future operating performance, which will be affected by general economic, financial, and other factors beyond our control.12 months.
We continue toalso continually evaluate business development opportunities, including potential acquisitions that fit our strategic plans. There can be no assurance that we will identify any opportunities that fit our strategic plans or will be able to execute any such opportunities on terms acceptable to us. Depending on prospective consideration to be paid for an acquisition, any such opportunities would be financed first from available cash and cash equivalents and availability of borrowings under our credit facilities.
Revolving Credit, Promissory Notes and Term Loan Agreements
Our securedrevolving credit facility (the “Revolving Credit Facility”) provides for maximum borrowings of $350 million in the form of a $150 million term loan and a $200$400 million revolver at a variable rate of interest based on LIBORindex-adjusted SOFR or a base rate and matures on November 26, 2023.September 30, 2027. The credit facility,Revolving Credit Facility, which is secured by cash, deposits, accounts receivable, and selected other assets of the applicable borrowers, includes customary affirmative and negative covenants and events of default, as well as financial covenants requiring minimum fixed charge coverage and leverage ratios, and customary mandatory prepayments provisions. Our credit facilityRevolving Credit Facility includes an accordion feature which allows us to increase availability by up to $100$200 million upon our request. At December 31, 2021,2023, we were in compliance with all its covenants, under the credit facility, and $36.7$378.1 million was available for borrowing.
Our UACL Credit and Security Agreement (the “UACL Credit Agreement”) provides for maximum borrowings of $90 million in the form of an $80 million term loan and a $10 million revolver at a variable rate of interest based on index-adjusted SOFR or a base rate and matures on September 30, 2027. The UACL Credit Agreement, which is secured by cash, deposits, accounts receivable, and selected other assets of the applicable borrowers, includes customary affirmative and negative covenants and events of default, as well as financial covenants requiring minimum fixed charge coverage and leverage ratios, and customary mandatory prepayments provisions. Our UACL Credit Agreement includes an accordion feature which allows us to increase availability by up to $30 million upon our request. At December 31, 2023, we were in compliance with all its covenants, and $10.0 million was available for borrowing.
A wholly-ownedwholly owned subsidiary issued a series of promissory notes in order to finance transportation equipment.equipment (the “Equipment Financing”). The notes issued in connection with this equipment financing,the Equipment Financing, which are secured by liens on selectedspecific titled vehicles, include certain affirmative and negative covenants, are generally payable in 60 monthly installments and bear interest at fixed rates ranging from 2.25% to 5.13%7.27%.
A wholly-owned subsidiary issued30
Certain wholly owned subsidiaries entered into a series of promissory$165.4 million term loan facility to repay outstanding balances under a then-existing term loan and certain other real estate notes in order to finance certain purchases of real property.(the “Real Estate Facility”). The promissory notes, which areReal Estate Facility matures on April 29, 2032 and is secured by firstfirst-priority mortgages and assignment of leases on specific parcels of real estate owned by the Company, including all land and real property improvements, include certainand first-priority assignments of rents and related leases of the loan parties. The Real Estate Facility includes customary affirmative and negative covenants, and are generallyprincipal and interest is payable in 120on the facility on a monthly installments. Eachbasis, based on an annual amortization of the notes10%. The facility bears interest at a variable rate ranging from LIBORTerm SOFR, plus 1.85%an applicable margin equal to LIBOR plus 2.25%2.12%. At December 31, 2021,2023, we were in compliance with all covenants. covenants under the facility.
We also maintain a short-term line of credit secured by our portfolio of marketable securities. It bears interest at LIBORTerm SOFR plus 1.10%. The amount available under the margin facility is based on a percentage of the market value of the underlying securities. We did not have any amounts advanced against the line as of December 31, 2021,2023, and the maximum available borrowings were $4.3$5.3 million.
29
Discussion of Cash Flows
At December 31, 2021,2023, we had cash and cash equivalents of $13.9$12.5 million compared to $8.8$47.2 million at December 31, 2020.2022. Operating activities provided $83.3$210.2 million in net cash, and we used $33.2$236.8 million in investing activities and $44.6$8.6 million in financing activities.
The $83.3$210.2 million in net cash provided by operations was primarily attributed to $73.7$92.9 million of net income, which reflects non-cash depreciation and amortization, noncash lease expense, amortization of debt issuance costs, gains on marketable equity securities and equipment sales, stock-based compensation, provisions for doubtful accountscredit losses and a change in deferred income taxes totaling $94.7$119.7 million, net. Net cash provided by operating activities also reflects an aggregate increase in net working capital totaling $85.1$2.4 million. The primary drivers behind the increase in working capital were principal reductions in operating lease liabilities during the period, an increase in trade and other accounts receivable, an increaseincreases in prepaid expenses and other assets, and a decreasedecreases in trade accounts payable, accruals for insurance and claims, income taxes payable.payable and other long-term liabilities. These were partially offset by increasesdecreases in accruals for insurance and claims, trade accounts payable, and accrued expenses and other current liabilities.accounts receivable, and other assets. Affiliate transactions increased net cash provided by operating activities by $1.2$0.4 million. The decreaseincrease in net cash resulted from an increase in accounts payable to affiliates of $0.8$0.1 million and a decrease in accounts receivable from affiliates of $0.4$0.2 million.
The $33.2$236.8 million in net cash used in investing activities consisted of $38.8$240.6 million in capital expenditures, and $0.1 million in marketable securities purchases. These uses werewhich was partially offset by $5.6$3.5 million in proceeds from the sale of equipment and $0.1$0.3 million in proceeds from the sale of marketable securities.
We used $44.6$8.6 million in financing activities. During the periodyear, we paid cash dividends of $11.3 million.$11.0 million, $0.9 million in capitalized financing costs and $0.1 million for purchases of common stock. We had outstanding borrowings totaling $428.4$386.4 million at December 31, 20212023 compared to $461.7$382.9 million at December 31, 2020.2022. During the period, we made payments on term loan and equipment and real estate notes totaling $74.6 million, borrowed $56.2 million for new equipment and had net borrowings on our revolving lines of credit totaling $11.9 million and borrowed an additional $16.0 million for new equipment. We also made term loan, and equipment and real estate note payments totaling $61.2 million during the period.$21.9 million.
Contractual Obligations
As of December 31, 2021,2023, we had contractual obligations related to our long-term debt of $366.1$314.8 million and $8.8$58.2 million for principal borrowings and interest, respectively, which become due through 2030.2032. See Item 8, Note 98 to the Consolidated Financial Statements for additional information regarding our debt obligations. We also have contractual obligations for operating leases commitments and purchase commitments related to agreements to purchase equipment.equipment, construct terminal and warehouse projects, and purchase strategic real estate. See Item 8, Note 1312 and Note 16,15, respectively, to the Consolidated Financial Statements for additional information regarding lease obligations and purchase commitments.
Off-Balance Sheet Arrangements
None.
Legal Matters
We are subject to various legal proceedings and other contingencies, the outcomes of which are subject to significant uncertainty. We accrue for estimated losses if it is probable that an asset has been impaired or a liability has been incurred and the amount of the loss can be reasonably estimated. We use judgment and evaluate, with the assistance of legal counsel, whether a loss contingency arising from litigation should be disclosed or recorded. The outcome of legal proceedings is inherently uncertain, so typically a loss cannot be precisely estimated. Accordingly, if the outcome of legal proceedings is different than is anticipated by us, we would have to record the matter at the actual amount at which it was resolved, in the period resolved, impacting our results of operations and financial position for the period. See Item 8, Note 1615 to the Consolidated Financial Statements.
31
Critical Accounting Policies
Our financial statements have been prepared in accordance with U.S. generally accepted accounting principles. The preparation of these financial statements requires us to make estimates and judgments that affect the reported amounts of assets, liabilities, operating revenues and operating expenses.
Critical accounting policies are those that are both (1) important to the portrayal of our financial condition and results of operations and (2) require management's most difficult, subjective or complex judgments, often as a result of the need to make estimates about the effect of matters that are inherently uncertain. As the number of variables and assumptions affecting the possible future resolution of the uncertainties increase, those judgments become even more subjective and complex. In order to provide an understanding about how our management forms its judgments about future events, including the variables and assumptions underlying the estimates, and the sensitivity of those judgments to different circumstances, we have identified our critical accounting policies below.
30
Insurance and Claim Costs
We maintain auto liability, workers compensation and general liability insurance with licensed insurance carriers. We are self-insured for all cargo and equipment damage claims. Insurance and claims expense represents premiums paid by us and the accruals made for claims within our self-insured retention amounts. A liability is recognized for the estimated cost of all self-insured claims including an estimate of incurred but not reported claims based on historical experience and for claims expected to exceed our policy limits. In addition, legal expenses related to auto liability claims are covered under our policy. We are responsible for all other legal expenses related to claims.
We establish reserves for anticipated losses and expenses related to cargo and equipment damage claims and auto liability claims. The reserves consist of specific reserves for all known claims and an estimate for claims incurred but not reported, and losses arising from known claims ultimately settling in excess of insurance coverage using loss development factors based upon industry data and past experience. In determining the reserves, we specifically review all known claims and record a liability based upon our best estimate of the amount to be paid. In making our estimate, we consider the amount and validity of the claim, as well as our past experience with similar claims. In establishing the reserve for claims incurred but not reported, we consider our past claims history, including the length of time it takes for claims to be reported to us. Based on our past experience, the time between when a claim occurs and when it is reported to us is short. As a result, we believe that the number of incurred but not reported claims at any given point in time is small. These reserves are periodically reviewed and adjusted to reflect our experience and updated information relating to specific claims. As of December 31, 20212023 and 2020,2022, we had accruals of $23.0$11.2 million and $9.2$14.3 million, respectively, for estimated claims net of insurance receivables. If we experience claims that are not covered by our insurance or that exceed our estimated claim reserve, it could increase the volatility of our earnings and have a materially adverse effect on our financial condition, results of operations or cash flows. Based on our 20212023 reserve for claims incurred but not reported, a 10% increase in claims incurred but not reported would increase our insurance and claims expense by approximately $0.5 million.
Valuation of Long-Lived Assets, including Goodwill and Intangible Assets
At both December 31, 20212023 and 2020,2022, our goodwill balance was $170.7 million. We are required to test goodwill for impairment annually or more frequently, whenever events occur or circumstances change that would more likely than not reduce the fair value of a reporting unit with goodwill below its carrying amount. We annually test goodwill impairment during the third quarter. Goodwill represents the excess purchase price over the fair value of assets acquired in connection with our acquisitions. We continually assess whether any indicators of impairment exist, which requires a significant amount of judgment. Such indicators may include a sustained significant decline in our share price and market capitalization; a decline in our expected future cash flows; a significant adverse change in legal factors or in the business climate; unanticipated competition; overall weaknesses in our industry; and slower growth rates. Adverse changes in these factors could have a significant impact on the recoverability of goodwill and could have a material impact on our consolidated financial statements. The Company has the option to first assess qualitative factors such as current performance and overall economic conditions to determine whether or not it is necessary to perform a quantitative goodwill impairment test. If we choose that option, then we would not be required to perform a quantitative goodwill impairment test unless we determine that, based on a qualitative assessment, it is more likely than not that the fair value of a reporting unit is less than its carrying value. If we determine that it is more likely than not, or if we choose not to perform a qualitative assessment, we then proceed with the quantitative assessment. Under the quantitative test, ifif the fair value of a reporting unit exceeds its carrying amount, then goodwill of the reporting unit is considered to not be impaired. If the carrying amount of the reporting unit exceeds its fair value, then an impairment loss is recognized in an amount equal to the excess, up to the value of the goodwillgoodwill..
During each of the third quarters of 20212023 and 2020,2022, we completed our goodwill impairment testing by performing a quantitative assessment using the income approach for each of our reporting units with goodwill. The determination of the fair value of the reporting units requires us to make estimates and assumptions related to future revenue, operating income and discount rates. Based on the results of this test, no impairment loss was recognized. There were no triggering events identified from the date of our assessment through December 31, 20212023 that would require an update to our annual impairment test.
32
We evaluate the carrying value of long-lived assets, other than goodwill, for impairment by analyzing the operating performance and anticipated future cash flows for those assets, whenever events or changes in circumstances indicate that the carrying amounts of such assets may not be recoverable. We evaluate the need to adjust the carrying value of the underlying assets if the sum of the expected cash flows is less than the carrying value. Our projection of future cash flows, the level of actual cash flows, the methods of estimation used for determining fair values and salvage values can impact impairment. Any changes in management's judgments could result in greater or lesser annual depreciation and amortization expense or impairment charges in the future. Depreciation and amortization of long-lived assets is calculated using the straight-line method over the estimated useful lives of the assets.
Recently Issued Accounting Pronouncements Not Currently Effective
See Item 8: Note 2 to the Consolidated Financial Statements for discussion of new accounting pronouncements.
31
ITEM 7A: QUANTITATIVE AND QUALITATIVE DISCLOSURES ABOUT MARKET RISK
|
|
Interest Rate Risk
Our principal exposure to interest rate risk relates to outstanding borrowing under our revolving credit facility,and term loan agreements, our real estate financingfacility, and margin facility, all of which charge interest at floating rates. Borrowings under the credit agreements with each of the banks bear interest at LIBORTerm SOFR or a base rate, plus an applicable margin. Our margin facility bears interest at a floating rate equal to LIBORTerm SOFR plus 1.10%. As of December 31, 2021,2023, we had total variable interest rate borrowings of $325.1$230.1 million. Assuming variable rate debt levels remain at $325.1$230.1 million for a full year, a 100 basis point increase in interest rates on our variable rate debt would increase interest expense approximately $3.3$2.3 million annually.
In connection with the real estate financing,Real Estate Facility, we entered into interest rate swap agreements to fix a portion of the interest ratesrate on our variable rate debt that has a combined notional amount of $10.8 million at December 31, 2021.debt. Under the swap agreements,agreement, the Company receives interest at the one-month LIBOR rate plus 2.25%Term SOFR and pays a fixed rate. The first swap became effective in October 2016, has a rate of 4.16% (amortizing2.88%. The swap agreement has an effective date of April 29, 2022, a maturity date of April 30, 2027, and an amortizing notional amount of $10.0 million) and expires in July 2026. The second swap became effective in October 2016, has a rate of 3.83% (amortizing notional amount of $0.8 million) and expires in May 2022.$83.3 million. At December 31, 2021,2023, the fair value of the swap agreementsagreement was a liabilityan asset of $0.2$1.8 million. Since thesethe swap agreements qualifyqualifies for hedge accounting, the changes in fair value are recorded in other comprehensive income (loss), net of tax.
Included in cash and cash equivalents is approximately $10,000$0.2 million in short-term investment grade instruments. The interest rates on these instruments are adjusted to market rates at least monthly. In addition, we have the ability to put these instruments back to the issuer at any time. Accordingly, any future interest rate risk on these short-term investments would not be material.
Commodity Price Risk
Fluctuations in fuel prices can affect our profitability by affecting our ability to retain or recruit owner-operators. Our owner-operators bear the costs of operating their tractors, including the cost of fuel. The tractors operated by our owner-operators consume large amounts of diesel fuel. Diesel fuel prices fluctuate greatly due to economic, political and other factors beyond our control. To address fluctuations in fuel prices, we seek to impose fuel surcharges on our customers and pass these surcharges on to our owner-operators. Historically, these arrangements have not fully protected our owner-operators from fuel price increases. If costs for fuel escalate significantly it could make it more difficult to attract additional qualified owner-operators and retain our current owner-operators. If we lose the services of a significant number of owner-operators or are unable to attract additional owner-operators, it could have a materially adverse effect on our financial condition, results of operations and cash flows.
Exposure to market risk for fluctuations in fuel prices also relates to a small portion of our transportation service contracts for which the cost of fuel is integral to service delivery and the service contract does not have a mechanism to adjust for increases in fuel prices. Increases and decreases in the price of fuel are generally passed on to our customers for which we realize minimal changes in profitability during periods of steady market fuel prices. However, profitability may be positively or negatively impacted by sudden increases or decreases in market fuel prices during a short period of time as customer pricing for fuel services is established based on market fuel costs. We believe the exposure to fuel price fluctuations would not materially impact our results of operations, cash flows or financial position. Based upon our 20212023 fuel consumption, a 10% increase in the average annual price per gallon of diesel fuel would increase our annual fuel expense on company owned tractors by approximately $3.0$5.5 million.
Equity Securities Risk
We hold certain actively traded marketable equity securities, which subjects the Company to fluctuations in the fair market value of its investment portfolio based on current market price. The recorded value of marketable equity securities increased to $8.0$10.8 million at December 31, 20212023 from $6.5$10.0 million at December 31, 2020.2022. The increase resulted from an increase in the market value of the portfolio of approximately $1.5$0.8 million. During 2023, we also sold $0.3 million and purchases of marketable securities totaling approximately $0.1 million. These increases were partially offset by sales of marketable equity, securities totaling approximately $0.1 million, with realized gains on sales of $25,000.totaling approximately $0.2 million. A 10% decrease in the market price of our marketable equity securities would cause a corresponding 10% decrease in the carrying amounts of these securities, or approximately $0.8$1.1 million. For additional information with respect to the marketable equity securities, see Item 8, Note 54 to the Consolidated Financial Statements.
3233
Foreign Exchange Risk
In the years ended December 31, 20212023 and 2020, 1.7%2022, 2.4% and 2.2%1.9%, respectively, of our revenues were derived from services provided outside the United States, principally in Mexico, Canada and Colombia. Exposure to market risk for changes in foreign currency exchange rates relates primarily to selling services and incurring costs in currencies other than the local currency and to the carrying value of net investments in foreign subsidiaries. As a result, we are exposed to foreign currency exchange rate risk due primarily due to translation of the accounts of our Mexican, Canadian and Colombian operations from their local currencies into U.S. dollars and also to the extent we engage in cross-border transactions. The majority of our exposure to fluctuations in the Mexican peso, Canadian dollar, and Colombian peso is naturally hedged since a substantial portion of our revenues and operating costs are denominated in each country’s local currency. Based on 20212023 expenditures denominated in foreign currencies, a 10% decrease in the exchange rates would increase our annual operating expenses by approximately $2.5$3.0 million. Historically, we have not entered into financial instruments for trading or speculative purposes. Short-term exposuresexposure to fluctuating foreign currency exchange rates are related primarily to intercompany transactions. The duration of these exposures is minimized by ongoing settlement of intercompany trading obligations.
The net investments in our Mexican, Canadian and Colombian operations are exposed to foreign currency translation gains and losses, which are included as a component of accumulated other comprehensive income in our statement of shareholders’ equity. Adjustments from the translation of the net investment in these operations decreasedincreased equity by approximately $0.3$4.1 million for the year ended December 31, 2021.2023.
3334
ITEM 8: FINANCIAL STATEMENTS AND SUPPLEMENTARY DATA
|
|
Report of Independent Registered Public Accounting Firm
Board of Directors and Shareholders
Universal Logistics Holdings, Inc.
Opinion on the Consolidated Financial Statements
We have audited the accompanying consolidated balance sheetsheets of Universal Logistics Holdings, Inc. (a, a Michigan corporation)corporation, and subsidiaries (the(collectively, the “Company”) as of December 31, 2021,2023 and 2022, the related consolidated statements of income, comprehensive income, shareholders’ equity, and cash flows for each of the yearthree years in the period ended December 31, 2021,2023, and the related notes (collectively, referred to as the “financial statements”). In our opinion, the financial statements present fairly, in all material respects, the financial position of the Company as of December 31, 2021,2023 and 2022, and the results of its operations and its cash flows for each of the yearthree years in the period ended December 31, 2021,2023, in conformity with accounting principles generally accepted in the United States of America.
We also have audited, in accordance with the standards of the Public Company Accounting Oversight Board (United States) (“PCAOB”), the Company’s internal control over financial reporting as of December 31, 2021,2023, based on criteria established in the 2013 Internal Control—Integrated Framework issued by the Committee of Sponsoring Organizations of the Treadway Commission (“COSO”), and our report dated March 16, 202215, 2024 expressed an unqualifiedadverse opinion.
Basis for Opinion
These financial statements are the responsibility of the Company’s management. Our responsibility is to express an opinion on the Company’s financial statements based on our audit.audits. We are a public accounting firm registered with the PCAOB and are required to be independent with respect to the Company in accordance with the U.S. federal securities laws and the applicable rules and regulations of the Securities and Exchange Commission and the PCAOB.
We conducted our auditaudits in accordance with the standards of the PCAOB. Those standards require that we plan and perform the audit to obtain reasonable assurance about whether the financial statements are free of material misstatement, whether due to error or fraud. Our auditaudits included performing procedures to assess the risks of material misstatement of the financial statements, whether due to error or fraud, and performing procedures that respond to those risks. Such procedures included examining, on a test basis, evidence regarding the amounts and disclosures in the financial statements. Our auditaudits also included evaluating the accounting principles used and significant estimates made by management, as well as evaluating the overall presentation of the financial statements. We believe that our audit providesaudits provide a reasonable basis for our opinion.
Critical Audit Matter
The critical audit matter communicated below is a matter arising from the current period audit of the financial statements that was communicated or required to be communicated to the audit committee and that: (1) relates to accounts or disclosures that are material to the financial statements and (2) involved our especially challenging, subjective, or complex judgments. The communication of a critical audit mattermatters does not alter in any way our opinion on the financial statements, taken as a whole, and we are not, by communicating the critical audit matter below, providing a separate opinion on the critical audit matter or on the accounts or disclosures to which it relates.
Goodwill Impairment Analysis – Contract Logistics and Intermodal Reporting Units
As described further in Note 1 to the consolidated financial statements, the Company tests goodwill is tested for impairment at least annually (in the third fiscal quarter) or more frequently, whenever events occur, or circumstances change that would more likely than not reduce the fair value of a reporting unit with goodwill below its carrying amount. The Company completed its goodwill impairment test by performing a quantitative assessment using the income approach for each of its reporting units with goodwill. The determination of the fair value of the reporting units requires managementthe Company to make estimates and assumptions related to forecasts of future revenue, operating income and discount ratesrates. The Company’s consolidated goodwill balance was $170.7 million as of December 31, 2023, which is allocated to the Company’s four reporting units. As of December 31, 2023, $56.3 million of goodwill was recorded in the discounted cash flow analyses.Contract Logistics reporting unit and $101.1 million in the Intermodal reporting unit. We identified the annual goodwill impairment analysisassessment of the Contract Logistics and Intermodal reporting units as a critical audit matter.
The principal consideration for our determination that the annual goodwill impairment analysisassessment of the Contract Logistics and Intermodal reporting units is a critical audit matter is thea high degree of auditor judgmentjudgement necessary in evaluating the reasonableness of certainthe fair value of the reporting units. The fair value estimate is sensitive to significant assumptions made by management in the discounted cash flow analyses used to determine fair valuespecifically, forecasts of the reporting units, including forecastedfuture revenue, operating income and discount rate.rates.
3435
Our audit procedures related to the goodwill impairment analysesassessment of the Contract Logistics and Intermodal reporting units included the following, among others.
|
|
|
|
|
|
/s/ GRANT THORNTON LLP
We have served as the Company’s auditor since 2021.
Southfield, Michigan
March 16, 202215, 2024
3536
Report of Independent Registered Public Accounting Firm
Shareholders and Board of Directors
Universal Logistics Holdings, Inc.
Warren, Michigan
Opinion on the Consolidated Financial Statements
We have audited the accompanying consolidated balance sheets of Universal Logistics Holdings, Inc. (the “Company”) as of December 31, 2020, the related consolidated statements of income, comprehensive income, cash flows and shareholders’ equity for each of the two years in the period ended December 31, 2020, and the related notes (collectively referred to as the “consolidated financial statements”). In our opinion, the consolidated financial statements present fairly, in all material respects, the financial position of the Company at December 31, 2020, and the results of its operations and its cash flows for each of the two years in the period ended December 31, 2020, in conformity with accounting principles generally accepted in the United States of America.
Basis for Opinion
These consolidated financial statements are the responsibility of the Company’s management. Our responsibility is to express an opinion on the Company’s consolidated financial statements based on our audits. We are a public accounting firm registered with the Public Company Accounting Oversight Board (United States) (“PCAOB”) and are required to be independent with respect to the Company in accordance with the U.S. federal securities laws and the applicable rules and regulations of the Securities and Exchange Commission and the PCAOB.
We conducted our audits in accordance with the standards of the PCAOB. Those standards require that we plan and perform the audit to obtain reasonable assurance about whether the consolidated financial statements are free of material misstatement, whether due to error or fraud.
Our audits included performing procedures to assess the risks of material misstatement of the consolidated financial statements, whether due to error or fraud, and performing procedures that respond to those risks. Such procedures included examining, on a test basis, evidence regarding the amounts and disclosures in the consolidated financial statements. Our audits also included evaluating the accounting principles used and significant estimates made by management, as well as evaluating the overall presentation of the consolidated financial statements. We believe that our audits provide a reasonable basis for our opinion.
/s/ BDO USA, LLP
We served as the Company’s auditor from 2013 to 2020.
Troy, Michigan
March 16, 2021
36
UNIVERSAL LOGISTICS HOLDINGS, INC.
Consolidated Balance Sheets
December 31, 20212023 and 20202022
(In thousands, except share data)
Assets |
| 2021 |
|
| 2020 |
|
| 2023 |
|
| 2022 |
| ||||
Current assets: |
|
|
|
|
|
|
|
|
|
|
|
|
| |||
Cash and cash equivalents |
| $ | 13,932 |
|
| $ | 8,763 |
|
| $ | 12,511 |
|
| $ | 47,181 |
|
Marketable securities |
|
| 8,031 |
|
|
| 6,534 |
|
|
| 10,772 |
|
|
| 10,000 |
|
Accounts receivable – net of allowance for doubtful accounts of $7,841 and $5,140, respectively |
|
| 341,398 |
|
|
| 259,154 |
| ||||||||
Accounts receivable – net of allowance for credit losses of $11,229 and $14,308, |
|
| 287,946 |
|
|
| 350,720 |
| ||||||||
Other receivables |
|
| 26,318 |
|
|
| 22,422 |
|
|
| 22,633 |
|
|
| 25,146 |
|
Prepaid expenses and other |
|
| 30,209 |
|
|
| 23,427 |
|
|
| 26,509 |
|
|
| 25,629 |
|
Due from affiliates |
|
| 807 |
|
|
| 1,224 |
|
|
| 710 |
|
|
| 976 |
|
Total current assets |
|
| 420,695 |
|
|
| 321,524 |
|
|
| 361,081 |
|
|
| 459,652 |
|
Property and equipment, net |
|
| 345,583 |
|
|
| 364,795 |
|
|
| 565,480 |
|
|
| 391,154 |
|
Operating lease right-of-use asset |
|
| 105,859 |
|
|
| 97,820 |
|
|
| 87,208 |
|
|
| 99,731 |
|
Goodwill |
|
| 170,730 |
|
|
| 170,730 |
|
|
| 170,730 |
|
|
| 170,730 |
|
Intangible assets – net of accumulated amortization of $107,461 and $93,574, respectively |
|
| 88,349 |
|
|
| 102,236 |
| ||||||||
Intangible assets – net of accumulated amortization of $134,514 and $121,843, |
|
| 61,296 |
|
|
| 73,967 |
| ||||||||
Deferred income taxes |
|
| 2,060 |
|
|
| 2,159 |
|
|
| 1,225 |
|
|
| 1,394 |
|
Other assets |
|
| 4,215 |
|
|
| 3,785 |
|
|
| 6,503 |
|
|
| 7,050 |
|
Total assets |
| $ | 1,137,491 |
|
| $ | 1,063,049 |
|
| $ | 1,253,523 |
|
| $ | 1,203,678 |
|
Liabilities and Shareholders’ Equity |
|
|
|
|
|
|
|
|
|
|
|
|
| |||
Current liabilities: |
|
|
|
|
|
|
|
|
|
|
|
|
| |||
Accounts payable |
| $ | 117,837 |
|
| $ | 97,916 |
|
| $ | 64,102 |
|
| $ | 87,138 |
|
Current portion of long-term debt |
|
| 61,160 |
|
|
| 59,713 |
|
|
| 70,689 |
|
|
| 65,303 |
|
Current portion of operating lease liabilities |
|
| 24,566 |
|
|
| 21,920 |
|
|
| 29,998 |
|
|
| 28,227 |
|
Accrued expenses and other current liabilities |
|
| 43,627 |
|
|
| 39,588 |
|
|
| 43,062 |
|
|
| 43,106 |
|
Insurance and claims |
|
| 43,357 |
|
|
| 25,022 |
|
|
| 25,464 |
|
|
| 30,574 |
|
Due to affiliates |
|
| 17,839 |
|
|
| 17,093 |
|
|
| 20,737 |
|
|
| 20,627 |
|
Income taxes payable |
|
| 4,323 |
|
|
| 11,555 |
|
|
| 6,364 |
|
|
| 11,926 |
|
Total current liabilities |
|
| 312,709 |
|
|
| 272,807 |
|
|
| 260,416 |
|
|
| 286,901 |
|
Long-term liabilities: |
|
|
|
|
|
|
|
|
|
|
|
|
| |||
Long-term debt, net of current portion |
|
| 366,188 |
|
|
| 400,407 |
|
|
| 311,235 |
|
|
| 313,197 |
|
Operating lease liability, net of current portion |
|
| 85,984 |
|
|
| 78,093 |
|
|
| 63,620 |
|
|
| 77,600 |
|
Deferred income taxes |
|
| 61,250 |
|
|
| 64,426 |
|
|
| 79,567 |
|
|
| 69,585 |
|
Other long-term liabilities |
|
| 9,150 |
|
|
| 7,743 |
|
|
| 6,487 |
|
|
| 9,465 |
|
Total long-term liabilities |
|
| 522,572 |
|
|
| 550,669 |
|
|
| 460,909 |
|
|
| 469,847 |
|
Shareholders' equity: |
|
|
|
|
|
|
|
|
|
|
|
|
| |||
Common stock, no par value. Authorized 100,000,000 shares; 30,986,702 and 30,979,827 shares issued; 26,919,455 and 26,912,580 shares outstanding, respectively |
|
| 30,988 |
|
|
| 30,981 |
| ||||||||
Common stock, no par value. Authorized 100,000,000 shares; 31,007,100 and |
|
| 31,008 |
|
|
| 30,997 |
| ||||||||
Paid-in capital |
|
| 4,639 |
|
|
| 4,484 |
|
|
| 5,103 |
|
|
| 4,852 |
|
Treasury stock, at cost; 4,067,247 shares |
|
| (82,385 | ) |
|
| (82,385 | ) | ||||||||
Treasury stock, at cost; 4,722,877 and 4,718,656 shares |
|
| (96,840 | ) |
|
| (96,706 | ) | ||||||||
Retained earnings |
|
| 356,071 |
|
|
| 293,643 |
|
|
| 595,450 |
|
|
| 513,589 |
|
Accumulated other comprehensive income (loss): |
|
|
|
|
|
|
|
|
|
|
|
|
| |||
Interest rate swaps, net of income taxes of $(60) and $(142), respectively |
|
| (178 | ) |
|
| (476 | ) | ||||||||
Interest rate swaps, net of income taxes of $457 and $726, respectively |
|
| 1,350 |
|
|
| 2,156 |
| ||||||||
Foreign currency translation adjustments |
|
| (6,925 | ) |
|
| (6,674 | ) |
|
| (3,873 | ) |
|
| (7,958 | ) |
Total shareholders’ equity |
|
| 302,210 |
|
|
| 239,573 |
|
|
| 532,198 |
|
|
| 446,930 |
|
Total liabilities and shareholders’ equity |
| $ | 1,137,491 |
|
| $ | 1,063,049 |
|
| $ | 1,253,523 |
|
| $ | 1,203,678 |
|
See accompanying notes to consolidated financial statements.
37
UNIVERSAL LOGISTICS HOLDINGS, INC.
Consolidated Statements of Income
Years ended December 31, 2021, 20202023, 2022 and 20192021
(In thousands, except per share data)
|
| 2021 |
|
| 2020 |
|
| 2019 |
|
| 2023 |
|
| 2022 |
|
| 2021 |
| ||||||
Operating revenues: |
|
|
|
|
|
|
|
|
|
|
|
|
|
|
|
|
|
|
|
|
| |||
Truckload services, including related party amounts of $660, $947 and $1,636, respectively |
| $ | 248,878 |
|
| $ | 201,419 |
|
| $ | 251,574 |
| ||||||||||||
Truckload services, including related party amounts of $6,682, $903 |
| $ | 213,874 |
|
| $ | 230,696 |
|
| $ | 248,878 |
| ||||||||||||
Brokerage services |
|
| 401,823 |
|
|
| 336,365 |
|
|
| 354,940 |
|
|
| 244,024 |
|
|
| 368,880 |
|
|
| 401,823 |
|
Intermodal services |
|
| 473,059 |
|
|
| 393,633 |
|
|
| 390,299 |
|
|
| 374,667 |
|
|
| 591,946 |
|
|
| 473,059 |
|
Dedicated services |
|
| 204,102 |
|
|
| 127,510 |
|
|
| 138,664 |
|
|
| 343,543 |
|
|
| 324,589 |
|
|
| 204,102 |
|
Value-added services |
|
| 423,118 |
|
|
| 332,156 |
|
|
| 376,521 |
|
|
| 486,031 |
|
|
| 499,345 |
|
|
| 423,118 |
|
Total operating revenues |
|
| 1,750,980 |
|
|
| 1,391,083 |
|
|
| 1,511,998 |
|
|
| 1,662,139 |
|
|
| 2,015,456 |
|
|
| 1,750,980 |
|
Operating expenses: |
|
|
|
|
|
|
|
|
|
|
|
|
|
|
|
|
|
|
| |||||
Purchased transportation and equipment rent, including related party amounts of $1,695, $22 and $65, respectively |
|
| 824,789 |
|
|
| 674,143 |
|
|
| 723,079 |
| ||||||||||||
Direct personnel and related benefits, including related party amounts of $42,371, $27,532 and $31,932, respectively |
|
| 456,643 |
|
|
| 337,618 |
|
|
| 368,243 |
| ||||||||||||
Operating supplies and expenses, including related party amounts of $3,887, $826 and $895, respectively |
|
| 149,394 |
|
|
| 111,056 |
|
|
| 120,767 |
| ||||||||||||
Purchased transportation and equipment rent, including related party |
|
| 571,213 |
|
|
| 847,414 |
|
|
| 824,789 |
| ||||||||||||
Direct personnel and related benefits, including related party amounts of |
|
| 542,779 |
|
|
| 520,263 |
|
|
| 454,256 |
| ||||||||||||
Operating supplies and expenses, including related party amounts of |
|
| 170,994 |
|
|
| 177,440 |
|
|
| 149,394 |
| ||||||||||||
Commission expense |
|
| 33,894 |
|
|
| 26,661 |
|
|
| 31,204 |
|
|
| 31,370 |
|
|
| 40,288 |
|
|
| 33,894 |
|
Occupancy expense, including related party amounts of $12,384, $12,925 and $11,794, respectively |
|
| 37,286 |
|
|
| 34,586 |
|
|
| 36,645 |
| ||||||||||||
General and administrative, including related party amounts of $8,923, $5,688 and $7,633, respectively |
|
| 39,648 |
|
|
| 33,267 |
|
|
| 44,497 |
| ||||||||||||
Insurance and claims, including related party amounts of $17,997, $16,542 and $17,570, respectively |
|
| 38,829 |
|
|
| 19,252 |
|
|
| 47,418 |
| ||||||||||||
Occupancy expense, including related party amounts of $13,649, $12,220 |
|
| 44,301 |
|
|
| 41,286 |
|
|
| 37,286 |
| ||||||||||||
General and administrative, including related party amounts of |
|
| 51,839 |
|
|
| 48,924 |
|
|
| 42,035 |
| ||||||||||||
Insurance and claims, including related party amounts of $16,739, |
|
| 27,163 |
|
|
| 22,749 |
|
|
| 38,829 |
| ||||||||||||
Depreciation and amortization |
|
| 67,537 |
|
|
| 74,141 |
|
|
| 74,765 |
|
|
| 77,036 |
|
|
| 76,657 |
|
|
| 67,537 |
|
Total operating expenses |
|
| 1,648,020 |
|
|
| 1,310,724 |
|
|
| 1,446,618 |
|
|
| 1,516,695 |
|
|
| 1,775,021 |
|
|
| 1,648,020 |
|
Income from operations |
|
| 102,960 |
|
|
| 80,359 |
|
|
| 65,380 |
|
|
| 145,444 |
|
|
| 240,435 |
|
|
| 102,960 |
|
Interest income |
|
| 43 |
|
|
| 47 |
|
|
| 73 |
|
|
| 1,454 |
|
|
| 132 |
|
|
| 43 |
|
Interest expense |
|
| (11,642 | ) |
|
| (14,626 | ) |
|
| (17,085 | ) |
|
| (24,207 | ) |
|
| (16,288 | ) |
|
| (11,642 | ) |
Other non-operating (expense) income |
|
| 7,220 |
|
|
| (1,870 | ) |
|
| 1,818 |
| ||||||||||||
Other non-operating income |
|
| 1,608 |
|
|
| 1,143 |
|
|
| 7,220 |
| ||||||||||||
Income before income taxes |
|
| 98,581 |
|
|
| 63,910 |
|
|
| 50,186 |
|
|
| 124,299 |
|
|
| 225,422 |
|
|
| 98,581 |
|
Income tax expense |
|
| 24,848 |
|
|
| 15,778 |
|
|
| 12,600 |
|
|
| 31,398 |
|
|
| 56,790 |
|
|
| 24,848 |
|
Net income |
| $ | 73,733 |
|
| $ | 48,132 |
|
| $ | 37,586 |
|
| $ | 92,901 |
|
| $ | 168,632 |
|
| $ | 73,733 |
|
Earnings per common share: |
|
|
|
|
|
|
|
|
|
|
|
|
|
|
|
|
|
|
| |||||
Basic |
| $ | 2.74 |
|
| $ | 1.78 |
|
| $ | 1.34 |
|
| $ | 3.53 |
|
| $ | 6.37 |
|
| $ | 2.74 |
|
Diluted |
| $ | 2.74 |
|
| $ | 1.78 |
|
| $ | 1.34 |
|
| $ | 3.53 |
|
| $ | 6.37 |
|
| $ | 2.74 |
|
Weighted average number of common shares outstanding: |
|
|
|
|
|
|
|
|
|
|
|
|
|
|
|
|
|
|
| |||||
Basic |
|
| 26,919 |
|
|
| 26,997 |
|
|
| 28,069 |
|
|
| 26,284 |
|
|
| 26,469 |
|
|
| 26,919 |
|
Diluted |
|
| 26,929 |
|
|
| 27,000 |
|
|
| 28,070 |
|
|
| 26,308 |
|
|
| 26,489 |
|
|
| 26,929 |
|
Dividends declared per common share |
| $ | 0.42 |
|
| $ | 0.21 |
|
| $ | 0.42 |
|
| $ | 0.42 |
|
| $ | 0.42 |
|
| $ | 0.42 |
|
See accompanying notes to consolidated financial statements.
38
UNIVERSAL LOGISTICS HOLDINGS, INC.
Consolidated Statements of Comprehensive Income
Years ended December 31, 2021, 20202023, 2022 and 20192021
(In thousands, except per share data)thousands)
|
| 2021 |
|
| 2020 |
|
| 2019 |
|
| 2023 |
|
| 2022 |
|
| 2021 |
| ||||||
Net Income |
| $ | 73,733 |
|
| $ | 48,132 |
|
| $ | 37,586 |
|
| $ | 92,901 |
|
| $ | 168,632 |
|
| $ | 73,733 |
|
Other comprehensive income (loss): |
|
|
|
|
|
|
|
|
|
|
|
|
|
|
|
|
|
|
|
|
| |||
Unrealized changes in fair value of interest rate swaps, net of income taxes of $82, $(110) and $(126), respectively |
|
| 298 |
|
|
| (371 | ) |
|
| (403 | ) | ||||||||||||
Unrealized changes in fair value of interest rate swaps, net of |
|
| (806 | ) |
|
| 2,334 |
|
|
| 298 |
| ||||||||||||
Foreign currency translation adjustments |
|
| (251 | ) |
|
| (2,769 | ) |
|
| 1,354 |
|
|
| 4,085 |
|
|
| (1,033 | ) |
|
| (251 | ) |
Total other comprehensive income (loss) |
|
| 47 |
|
|
| (3,140 | ) |
|
| 951 |
| ||||||||||||
Total other comprehensive income |
|
| 3,279 |
|
|
| 1,301 |
|
|
| 47 |
| ||||||||||||
Total comprehensive income |
| $ | 73,780 |
|
| $ | 44,992 |
|
| $ | 38,537 |
|
| $ | 96,180 |
|
| $ | 169,933 |
|
| $ | 73,780 |
|
|
|
|
|
|
|
|
|
|
|
|
|
|
|
|
|
|
|
|
|
|
| |||
See accompanying notes to consolidated financial statements.
39
UNIVERSAL LOGISTICS HOLDINGS, INC.
Consolidated Statements of Cash Flows
Years ended December 31, 2021, 20202023, 2022 and 20192021
(In thousands)
|
| 2021 |
|
| 2020 |
|
| 2019 |
|
| 2023 |
|
| 2022 |
|
| 2021 |
| ||||||
Cash flows from operating activities: |
|
|
|
|
|
|
|
|
|
|
|
|
|
|
|
|
|
|
| |||||
Net income |
| $ | 73,733 |
|
| $ | 48,132 |
|
| $ | 37,586 |
|
| $ | 92,901 |
|
| $ | 168,632 |
|
| $ | 73,733 |
|
Adjustments to reconcile net income to net cash provided by operating activities: |
|
|
|
|
|
|
|
|
|
|
|
|
|
|
|
|
|
|
|
|
| |||
Depreciation and amortization |
|
| 67,537 |
|
|
| 74,141 |
|
|
| 74,765 |
|
|
| 77,036 |
|
|
| 76,657 |
|
|
| 67,537 |
|
Noncash lease expense |
|
| 26,058 |
|
|
| 27,827 |
|
|
| 29,904 |
|
|
| 30,376 |
|
|
| 29,406 |
|
|
| 26,058 |
|
Amortization of debt issuance costs |
|
| 480 |
|
|
| 589 |
|
|
| 586 |
|
|
| 808 |
|
|
| 545 |
|
|
| 480 |
|
Loss (gain) on marketable equity securities |
|
| (1,500 | ) |
|
| 1,574 |
|
|
| (1,540 | ) | ||||||||||||
Gain on marketable equity securities |
|
| (1,041 | ) |
|
| (1,044 | ) |
|
| (1,500 | ) | ||||||||||||
Gain on disposal of property and equipment |
|
| (1,202 | ) |
|
| (734 | ) |
|
| (1,245 | ) |
|
| (1,650 | ) |
|
| (5,442 | ) |
|
| (1,202 | ) |
Write-off of debt issuance costs |
|
| — |
|
|
| 583 |
|
|
| — |
| ||||||||||||
Stock-based compensation |
|
| 162 |
|
|
| 195 |
|
|
| 73 |
|
|
| 262 |
|
|
| 222 |
|
|
| 162 |
|
Provision for doubtful accounts |
|
| 6,315 |
|
|
| 5,165 |
|
|
| 3,133 |
| ||||||||||||
Provision for credit losses |
|
| 3,773 |
|
|
| 9,775 |
|
|
| 6,315 |
| ||||||||||||
Deferred income taxes |
|
| (3,197 | ) |
|
| (3,278 | ) |
|
| 7,161 |
|
|
| 10,151 |
|
|
| 8,215 |
|
|
| (3,197 | ) |
Change in assets and liabilities: |
|
|
|
|
|
|
|
|
|
|
|
|
|
|
|
|
|
|
|
|
| |||
Trade and other accounts receivable |
|
| (92,968 | ) |
|
| (58,090 | ) |
|
| 21,798 |
|
|
| 62,503 |
|
|
| (16,266 | ) |
|
| (92,968 | ) |
Prepaid income taxes, prepaid expenses and other assets |
|
| (7,074 | ) |
|
| (542 | ) |
|
| (2,230 | ) | ||||||||||||
Prepaid expenses and other assets |
|
| (1,810 | ) |
|
| 4,702 |
|
|
| (7,074 | ) | ||||||||||||
Accounts payable, accrued expenses, income taxes payable, insurance and claims and other current liabilities |
|
| 36,635 |
|
|
| 26,729 |
|
|
| (13,791 | ) |
|
| (29,827 | ) |
|
| (37,524 | ) |
|
| 36,635 |
|
Principal reduction in operating lease liabilities |
|
| (24,650 | ) |
|
| (26,654 | ) |
|
| (29,061 | ) |
|
| (30,633 | ) |
|
| (27,991 | ) |
|
| (24,650 | ) |
Due to/from affiliates, net |
|
| 1,163 |
|
|
| 2,728 |
|
|
| 623 |
|
|
| 376 |
|
|
| 2,619 |
|
|
| 1,163 |
|
Other long-term liabilities |
|
| 1,788 |
|
|
| 1,554 |
|
|
| 274 |
|
|
| (2,979 | ) |
|
| 316 |
|
|
| 1,788 |
|
Net cash provided by operating activities |
|
| 83,280 |
|
|
| 99,336 |
|
|
| 128,036 |
|
|
| 210,246 |
|
|
| 213,405 |
|
|
| 83,280 |
|
Cash flows from investing activities: |
|
|
|
|
|
|
|
|
|
|
|
|
|
|
|
|
|
|
|
|
| |||
Capital expenditures |
|
| (38,841 | ) |
|
| (90,710 | ) |
|
| (79,753 | ) |
|
| (240,554 | ) |
|
| (117,099 | ) |
|
| (38,841 | ) |
Proceeds from the sale of property and equipment |
|
| 5,605 |
|
|
| 4,189 |
|
|
| 11,152 |
|
|
| 3,513 |
|
|
| 14,281 |
|
|
| 5,605 |
|
Purchases of marketable securities |
|
| (114 | ) |
|
| (361 | ) |
|
| (92 | ) |
|
| — |
|
|
| (925 | ) |
|
| (114 | ) |
Proceeds from sale of marketable securities |
|
| 117 |
|
|
| 1,622 |
|
|
| 1,596 |
|
|
| 269 |
|
|
| — |
|
|
| 117 |
|
Acquisitions of businesses |
|
| — |
|
|
| (1,295 | ) |
|
| (75,963 | ) | ||||||||||||
Net cash used in investing activities |
|
| (33,233 | ) |
|
| (86,555 | ) |
|
| (143,060 | ) |
|
| (236,772 | ) |
|
| (103,743 | ) |
|
| (33,233 | ) |
Cash flows from financing activities: |
|
|
|
|
|
|
|
|
|
|
|
|
|
|
|
|
|
|
|
|
| |||
Proceeds from borrowing - revolving debt |
|
| 408,478 |
|
|
| 395,717 |
|
|
| 379,458 |
|
|
| 202,283 |
|
|
| 443,987 |
|
|
| 408,478 |
|
Repayments of debt - revolving debt |
|
| (396,547 | ) |
|
| (395,616 | ) |
|
| (308,821 | ) |
|
| (180,349 | ) |
|
| (607,244 | ) |
|
| (396,547 | ) |
Proceeds from borrowing - term debt |
|
| 15,967 |
|
|
| 63,902 |
|
|
| 56,494 |
|
|
| 56,186 |
|
|
| 339,641 |
|
|
| 15,967 |
|
Repayments of debt - term debt |
|
| (61,151 | ) |
|
| (62,038 | ) |
|
| (70,016 | ) |
|
| (74,557 | ) |
|
| (221,944 | ) |
|
| (61,151 | ) |
Borrowing under margin account |
|
| — |
|
|
| 256 |
|
|
| — |
| ||||||||||||
Repayments under margin account |
|
| — |
|
|
| (256 | ) |
|
| (541 | ) | ||||||||||||
Dividends paid |
|
| (11,305 | ) |
|
| (5,731 | ) |
|
| (15,042 | ) |
|
| (11,040 | ) |
|
| (13,941 | ) |
|
| (11,305 | ) |
Purchases of treasury stock |
|
| — |
|
|
| (5,138 | ) |
|
| (24,785 | ) |
|
| (134 | ) |
|
| (14,321 | ) |
|
| — |
|
Capitalized financing costs |
|
| — |
|
|
| (46 | ) |
|
| — |
|
|
| (947 | ) |
|
| (4,417 | ) |
|
| — |
|
Net cash (used in) provided by financing activities |
|
| (44,558 | ) |
|
| (8,950 | ) |
|
| 16,747 |
| ||||||||||||
Net cash used in financing activities |
|
| (8,558 | ) |
|
| (78,239 | ) |
|
| (44,558 | ) | ||||||||||||
Effect of exchange rate changes on cash and cash equivalents |
|
| (320 | ) |
|
| (2,794 | ) |
|
| 276 |
|
|
| 414 |
|
|
| 1,826 |
|
|
| (320 | ) |
Net increase in cash |
|
| 5,169 |
|
|
| 1,037 |
|
|
| 1,999 |
| ||||||||||||
Net (decrease) increase in cash |
|
| (34,670 | ) |
|
| 33,249 |
|
|
| 5,169 |
| ||||||||||||
Cash and cash equivalents – January 1 |
|
| 8,763 |
|
|
| 7,726 |
|
|
| 5,727 |
|
|
| 47,181 |
|
|
| 13,932 |
|
|
| 8,763 |
|
Cash and cash equivalents – December 31 |
| $ | 13,932 |
|
| $ | 8,763 |
|
| $ | 7,726 |
|
| $ | 12,511 |
|
| $ | 47,181 |
|
| $ | 13,932 |
|
See accompanying notes to consolidated financial statements.
40
UNIVERSAL LOGISTICS HOLDINGS, INC.
Consolidated Statements of Cash Flows - Continued
Years ended December 31, 2021, 20202023, 2022 and 20192021
(In thousands)
|
| 2021 |
|
| 2020 |
|
| 2019 |
|
| 2023 |
|
| 2022 |
|
| 2021 |
| ||||||
Supplemental cash flow information: |
|
|
|
|
|
|
|
|
|
|
|
|
|
|
|
|
|
|
| |||||
Cash paid for interest |
| $ | 11,223 |
|
| $ | 14,039 |
|
| $ | 16,349 |
|
| $ | 23,399 |
|
| $ | 14,331 |
|
| $ | 11,223 |
|
Cash paid for income taxes |
| $ | 36,173 |
|
| $ | 3,784 |
|
| $ | 12,459 |
|
| $ | 25,412 |
|
| $ | 40,886 |
|
| $ | 36,173 |
|
|
|
|
|
|
|
|
|
|
|
|
|
|
|
|
|
|
|
|
|
| ||||
Non-cash operating and financing activities: |
|
|
|
|
|
|
|
|
|
|
|
| ||||||||||||
During each of the years ended December 31, 2021 and 2020, the Company had non-cash activities resulting from $2.8 million of declared dividends that were unpaid as of the end of each year. |
| |||||||||||||||||||||||
Non-cash financing activities: |
|
|
|
|
|
|
|
| ||||||||||||||||
During the year ended December 31, 2021, the Company had non-cash activities resulting from $2.8 million of declared dividends that were unpaid as of the end the year. | During the year ended December 31, 2021, the Company had non-cash activities resulting from $2.8 million of declared dividends that were unpaid as of the end the year. |
| ||||||||||||||||||||||
See accompanying notes to consolidated financial statements.
41
UNIVERSAL LOGISTICS HOLDINGS, INC.
Years ended December 31, 2021, 20202023, 2022 and 20192021
(In thousands)thousands, except per share data)
|
| Common stock |
|
| Paid-in capital |
|
| Treasury stock |
|
| Retained earnings |
|
| Accumulated other comprehensive income (loss) |
|
| Total |
| ||||||||||||||||||||||||||||||||
Balances – December 31, 2018 |
| $ | 30,967 |
|
| $ | 4,230 |
|
| $ | (52,462 | ) |
| $ | 231,525 |
|
| $ | (4,961 | ) |
| $ | 209,299 |
| ||||||||||||||||||||||||||
Net income |
|
| — |
|
|
| — |
|
|
| — |
|
|
| 37,586 |
|
|
| — |
|
|
| 37,586 |
| ||||||||||||||||||||||||||
Other comprehensive income |
|
| — |
|
|
| — |
|
|
| — |
|
|
| — |
|
|
| 951 |
|
|
| 951 |
| ||||||||||||||||||||||||||
Dividends paid ($0.530 per share) |
|
| — |
|
|
| — |
|
|
| — |
|
|
| (15,042 | ) |
|
| — |
|
|
| (15,042 | ) | ||||||||||||||||||||||||||
Dividends payable ($0.105 per share) |
|
| — |
|
|
| — |
|
|
| — |
|
|
| (2,865 | ) |
|
| — |
|
|
| (2,865 | ) | ||||||||||||||||||||||||||
Stock based compensation |
|
| 5 |
|
|
| 68 |
|
|
| — |
|
|
| — |
|
|
| — |
|
|
| 73 |
| ||||||||||||||||||||||||||
Purchases of treasury stock |
|
| — |
|
|
| — |
|
|
| (24,785 | ) |
|
| — |
|
|
| — |
|
|
| (24,785 | ) | ||||||||||||||||||||||||||
Balances – December 31, 2019 |
| $ | 30,972 |
|
| $ | 4,298 |
|
| $ | (77,247 | ) |
| $ | 251,204 |
|
| $ | (4,010 | ) |
| $ | 205,217 |
| ||||||||||||||||||||||||||
Net income |
|
| — |
|
|
| — |
|
|
| — |
|
|
| 48,132 |
|
|
| — |
|
|
| 48,132 |
| ||||||||||||||||||||||||||
Other comprehensive loss |
|
| — |
|
|
| — |
|
|
| — |
|
|
| — |
|
|
| (3,140 | ) |
|
| (3,140 | ) | ||||||||||||||||||||||||||
Dividends paid ($0.105 per share) |
|
| — |
|
|
| — |
|
|
| — |
|
|
| (2,866 | ) |
|
| — |
|
|
| (2,866 | ) | ||||||||||||||||||||||||||
Dividends payable ($0.105 per share) |
|
| — |
|
|
| — |
|
|
| — |
|
|
| (2,827 | ) |
|
| — |
|
|
| (2,827 | ) | ||||||||||||||||||||||||||
Stock based compensation |
|
| 9 |
|
|
| 186 |
|
|
| — |
|
|
| — |
|
|
| — |
|
|
| 195 |
| ||||||||||||||||||||||||||
Purchases of treasury stock |
|
| — |
|
|
| — |
|
|
| (5,138 | ) |
|
| — |
|
|
| — |
|
|
| (5,138 | ) | ||||||||||||||||||||||||||
|
| Common |
|
| Paid-in |
|
| Treasury |
|
| Retained |
|
| Accumulated other comprehensive income (loss) |
|
|
| Total |
| |||||||||||||||||||||||||||||||
Balances – December 31, 2020 |
| $ | 30,981 |
|
| $ | 4,484 |
|
| $ | (82,385 | ) |
| $ | 293,643 |
|
| $ | (7,150 | ) |
| $ | 239,573 |
|
| $ | 30,981 |
|
| $ | 4,484 |
|
| $ | (82,385 | ) |
| $ | 293,643 |
|
| $ | (7,150 | ) |
|
| $ | 239,573 |
| |
Net income |
|
| — |
|
|
| — |
|
|
| — |
|
|
| 73,733 |
|
|
| — |
|
|
| 73,733 |
|
|
| — |
|
|
| — |
|
|
| — |
|
|
| 73,733 |
|
|
| — |
|
|
|
| 73,733 |
| |
Other comprehensive income |
|
| — |
|
|
| — |
|
|
| — |
|
|
| — |
|
|
| 47 |
|
|
| 47 |
|
|
| — |
|
|
| — |
|
|
| — |
|
|
| — |
|
|
| 47 |
|
|
|
| 47 |
| |
Dividends paid ($0.315 per share) |
|
| — |
|
|
| — |
|
|
| — |
|
|
| (8,479 | ) |
|
| — |
|
|
| (8,479 | ) |
|
| — |
|
|
| — |
|
|
| — |
|
|
| (8,479 | ) |
|
| — |
|
|
|
| (8,479 | ) | |
Dividends payable ($0.105 per share) |
|
| — |
|
|
| — |
|
|
| — |
|
|
| (2,826 | ) |
|
| — |
|
|
| (2,826 | ) |
|
| — |
|
|
| — |
|
|
| — |
|
|
| (2,826 | ) |
|
| — |
|
|
|
| (2,826 | ) | |
Stock based compensation |
|
| 7 |
|
|
| 155 |
|
|
| — |
|
|
| — |
|
|
| — |
|
|
| 162 |
|
|
| 7 |
|
|
| 155 |
|
|
| — |
|
|
| — |
|
|
| — |
|
|
|
| 162 |
| |
Balances – December 31, 2021 |
| $ | 30,988 |
|
| $ | 4,639 |
|
| $ | (82,385 | ) |
| $ | 356,071 |
|
| $ | (7,103 | ) |
| $ | 302,210 |
|
| $ | 30,988 |
|
| $ | 4,639 |
|
| $ | (82,385 | ) |
| $ | 356,071 |
|
| $ | (7,103 | ) |
|
| $ | 302,210 |
| |
Net income |
|
| — |
|
|
| — |
|
|
| — |
|
|
| 168,632 |
|
|
| — |
|
|
|
| 168,632 |
| |||||||||||||||||||||||||
Other comprehensive loss |
|
| — |
|
|
| — |
|
|
| — |
|
|
| — |
|
|
| 1,301 |
|
|
|
| 1,301 |
| |||||||||||||||||||||||||
Dividends paid ($0.42 per share) |
|
| — |
|
|
| — |
|
|
| — |
|
|
| (11,114 | ) |
|
| — |
|
|
|
| (11,114 | ) | |||||||||||||||||||||||||
Stock based compensation |
|
| 9 |
|
|
| 213 |
|
|
| — |
|
|
| — |
|
|
| — |
|
|
|
| 222 |
| |||||||||||||||||||||||||
Purchases of treasury stock |
|
| — |
|
|
| — |
|
|
| (14,321 | ) |
|
| — |
|
|
| — |
|
|
|
| (14,321 | ) | |||||||||||||||||||||||||
Balances – December 31, 2022 |
| $ | 30,997 |
|
| $ | 4,852 |
|
| $ | (96,706 | ) |
| $ | 513,589 |
|
| $ | (5,802 | ) | $ | - |
| $ | 446,930 |
| ||||||||||||||||||||||||
Net income |
|
| — |
|
|
| — |
|
|
| — |
|
|
| 92,901 |
|
|
| — |
|
|
|
| 92,901 |
| |||||||||||||||||||||||||
Other comprehensive income |
|
| — |
|
|
| — |
|
|
| — |
|
|
| — |
|
|
| 3,279 |
|
|
|
| 3,279 |
| |||||||||||||||||||||||||
Dividends paid ($0.42 per share) |
|
| — |
|
|
| — |
|
|
| — |
|
|
| (11,040 | ) |
|
| — |
|
|
|
| (11,040 | ) | |||||||||||||||||||||||||
Stock based compensation |
|
| 11 |
|
|
| 251 |
|
|
| — |
|
|
| — |
|
|
| — |
|
|
|
| 262 |
| |||||||||||||||||||||||||
Purchases of treasury stock |
|
| — |
|
|
| — |
|
|
| (134 | ) |
|
| — |
|
|
| — |
|
|
|
| (134 | ) | |||||||||||||||||||||||||
Balances – December 31, 2023 |
| $ | 31,008 |
|
| $ | 5,103 |
|
| $ | (96,840 | ) |
| $ | 595,450 |
|
| $ | (2,523 | ) |
|
| $ | 532,198 |
| |||||||||||||||||||||||||
See accompanying notes to consolidated financial statements.
42
42
UNIVERSAL LOGISTICS HOLDINGS, INC.
Notes to Consolidated Financial Statements
December 31, 2021, 20202023, 2022 and 20192021
(1) Summary of Significant Accounting Policies (a) Business
|
|
|
|
Universal Logistics Holdings, Inc. (“Universal” or the “Company”), through its subsidiaries, is a leading asset-light providerholding company whose subsidiaries provide a variety of customized transportation and logistics solutions throughout the United States and in Mexico, Canada and Colombia. WeOur operating subsidiaries provide our customers with supply chain solutions that can be scaled to meet their changing demands. We offer our customers a broad array of services across their entire supply chain, including truckload, brokerage, intermodal, dedicated and value-added services. Our customized solutions and flexible business model are designed to provide us with a highly variable cost model.
(b) Basis of Presentation
|
|
The consolidated financial statements include the accounts of the Company and its wholly owned subsidiaries. All significant intercompany accounts and transactions relating to these entities have been eliminated.
Our fiscal year consists of four quarters, each with thirteen weeks.
COVID-19
In March of 2020, the World Health Organization declared the coronavirus outbreak (COVID-19) a pandemic. The Company remains committedmade certain immaterial reclassifications to doingitems in its part to protect its employees, customers, vendors andprior financial statements so that their presentation is consistent with the general public from the spread of COVID-19. We will continue to adapt our operations as required to ensure safety while continuing to provide a high level of service to our customers.
To mitigate the impact to our business, we implemented numerous cost reduction efforts beginningformat in the second quarter 2020 including furloughingfinancial statements for the period ended December 31, 2023. These reclassifications, however, had no effect on reported consolidated net income, comprehensive income, earnings per common share, cash flows, total assets or shareholders’ equity as previously reported.
In June 2022, the Company made a portionchange in an accounting estimate to revise the estimated useful life and salvage values of the direct labor force, requiring employees to take unpaid time-off, restricting travel, reducing discretionary spending, and various other measures. Alsocertain equipment. The change resulted in additional depreciation expense of $9.7 million recorded during the second quarter 2020 we began taking advantageended July 2, 2022 ($7.2 million net of the cash deferral programs available for payment of employer social security taxestax, or $0.27 per basic and federal and state income taxes under the Coronavirus Aid, Relief, anddiluted share).
Current Economic Security Act (“CARES” Act). Conditions
The Company makes estimates and assumptions that affect reported amounts and disclosures included in its financial statements and accompanying notes and assesses certain accounting matters that require consideration of forecasted financial information. The Company's assumptions about future conditions important to these estimates and assumptions are subject to uncertainty, including the impacts of the COVID-19 pandemic.
Although we estimate COVID-19 had the largestnegative impact on our business during the second quarter 2020, we are unable to predict with any certainty the future impact COVID-19 mayinflationary pressures can have on our operationaloperating costs. Prolonged periods of inflation could cause interest rates, equipment, maintenance, labor and financial performance. The Company willother operating costs to continue to monitor these conditions in future periods as new information becomes available and will update its analyses accordingly. increase.
43
UNIVERSAL LOGISTICS HOLDINGS, INC.
Notes to Consolidated Financial Statements – (Continued)
December 31, 2021, 2020 and 2019