
STATES
| x | ANNUAL REPORT PURSUANT TO SECTION 13 OR 15(d) OF THE SECURITIES EXCHANGE ACT OF 1934 | ||||
February 3, 2024
| o | TRANSITION REPORT PURSUANT TO SECTION 13 OR 15(d) OF THE SECURITIES EXCHANGE ACT OF 1934 | ||||
Commissionfilenumber:1-13536

Macy's,Inc.
(Exactnameofregistrantasspecifiedinitscharter)
| Delaware | 13-3324058 | ||||
(State or other jurisdiction of incorporation or organization) | (I.R.S.EmployerIdentificationNo.) | ||||
151 West 34th Street, New York, New York 10001 |
| ||||
(Address of Principal Executive Offices, including Zip Code) | (Registrant's telephone number, including area code) | ||||
Securities
| Title of Each Class | Trading Symbol(s) | NameofEachExchangeonWhichRegistered | ||||||||||||||
Common Stock, $.01 par value per share | M | NewYork Stock Exchange | ||||||||||||||
None
Indicate by check mark if the registrant is a well-known seasoned issuer, as defined in Rule 405 of the Securities Act. Yes ☒x No ☐o
| Large Accelerated Filer | x | Accelerated Filer |
| |||||||||||||||||||||
Non-Accelerated Filer | o | Emerging Growth Company |
| Smaller Reporting Company |
| |||||||||||||||||||
$4,452,028,613.
| Class | Outstandingat | |||||||
Common Stock, $.01 par value per share |
| |||||||
| Document | Parts Into Which Incorporated | |||||||
Proxy Statement for the Annual Meeting of Stockholders to be held | Part III | |||||||
|
|
|
|
|
|
Unlessthecontextrequiresotherwise,referencesto“Macy’s”orthe“Company”arereferencestoMacy’sanditssubsidiaries andreferencesto“2021,”“2020,” and“2019” arereferencestotheCompany’sfiscalyearsended January 29, 2022, January 30, 2021 and February 1, 2020,respectively. Fiscal years 2021, 2020, and 2019 included52weeks.
Forward-LookingStatements
Thisreportandotherreports,statementsandinformationpreviouslyorsubsequentlyfiledbytheCompanywiththeSecuritiesandExchangeCommission(the“SEC”)containormaycontainforward-lookingstatements.Suchstatementsare baseduponthebeliefsandassumptionsof,andoninformationavailableto,themanagementoftheCompanyatthetimesuchstatementsare made.Thefollowingare ormayconstituteforward-lookingstatementswithinthemeaningofthePrivateSecuritiesLitigationReformActof1995:(i)statementsprecededby, followedbyorthatincludethewords“may,”“will,”“could,”“should,”“believe,”“expect,”“future,”“potential,”“anticipate,”“intend,”“plan,”“think,”“estimate”or“continue”orthenegativeorothervariationsthereof,and(ii)statementsregardingmattersthatarenothistoricalfacts.Suchforward-lookingstatementsaresubjecttovariousrisksanduncertainties,includingrisksanduncertaintiesrelatingto:
|
|
| Auditor Firm ID: |
| Auditor Name: | KPMG, LLP | Cincinnati, OH | ||||||||||||||||
| Page | |||||
|
|
|
|
|
|
|
|
|
|
|
|
|
|
|
|
|
|
|
|
|
|
|
|
|
|
2
|
|
|
|
|
|
|
|
|
|
|
|
|
|
|
|
Inadditiontoanyrisksanduncertaintiesspecificallyidentifiedinthetextsurroundingsuchforward-lookingstatements,thestatementsintheimmediatelyprecedingsentenceandthestatementsundercaptionssuchas“RiskFactors”inreports,statementsandinformationfiledbytheCompanywiththeSECfromtimetotimeconstitutecautionarystatementsidentifyingimportantfactorsthatcouldcauseactualamounts,results,eventsandcircumstancestodiffermateriallyfromthoseexpressedinorimpliedbysuchforward-lookingstatements.
3
|
|
General
2021 2020 2019 Women’s Accessories, Intimate Apparel, Shoes, Cosmetics and Fragrances $ 10,119 $ 7,206 $ 9,454 Women’s Apparel 4,433 2,909 5,411 Men’s and Kids’ 5,252 3,486 5,628 Home/Other (a) 4,656 3,745 4,067 Total $ 24,460 $ 17,346 $ 24,560 The Company's private label brands are owned by the Company. TheCompanymakesitsannualreportonForm10-K,quarterlyreportsonForm10-Q,currentreportsonForm8-K andamendmentstothosereportsfiledorfurnishedpursuanttoSection13(a)or15(d)oftheSecuritiesExchangeActof 1934 •Charters of the Audit Committee, Compensation and Management Development Committee, Finance Committee, and Nominating and Corporate Governance Committee, •Corporate Governance Principles, •Lead Independent Director Policy, •Non-Employee Director Code of Business Conduct and Ethics, •Code of Conduct, •Standards for Director Independence, •Related Person Transactions Policy, •Method to Facilitate Receipt, Retention and Treatment of Communications, and teams and to facilitate action planning to improve the colleague experience. •Recognized by Women's Enterprise National Council (WBENC) with America's Top Corporations Award, which has been received since 2012, for our commitment to create opportunities for women-owned businesses within the Macy's supply chain. •Recognized by the National Minority Supplier Development Council (NMSDC) with the National Corporation of the Year Award (Category 2 winner). Also recognized as part of NMSDC's The Forefront 25: Top Corporations for Minority Businesses for ensuring access and equity for systemically excluded entrepreneurs of color. Learning & Development the series, the Company featured 18 workshops, panel discussions and career-planning sessions that gave colleagues a better sense of the many career opportunities that exist at Macy's, Inc. and how colleagues can enhance their skills within their current role or enable them to take the next step in their career. Total Rewards Number of Employees •managing the environmental impact of its business; •promoting positive social impact; and factories with RISE: Reimagining Industry to Support Equality. chain transparency. Position with the Company Chief Executive Officer Adrian V. Mitchell Danielle L. Kirgan Paul Griscom Senior Vice President and Controller for home furnishings. Strategic, Operational and Competitive Risks suffer. shortage. growth. occur. performance. program. suffer. business. remotely. •cause us to incur substantial costs, including costs associated with remediation of information technology systems, customer protection costs and incentive payments for the maintenance of business relationships, litigation costs, lost revenues resulting from negative changes in consumer shopping patterns, unauthorized use of proprietary information or the failure to retain or attract customers following an attack. While we maintain insurance coverage that may, subject to policy terms and conditions, cover certain aspects of cyber risks, such insurance coverage may be unavailable or insufficient to cover all losses or all types of claims that may arise in the continually evolving area of cyber risk. Supply Chain and Third-Party Risks to a lesser extent, from factories in Vietnam, India, Indonesia, Jordan and other countries. Since 2017, the U.S. and China have been engaged in a trade dispute that has involved a number of actions against China including the imposition of tariffs on Chinese imports; sanctions on Chinese military-industrial complex companies; stricter reviews of direct investments in the U.S. by Chinese companies; and detention by U.S. Customs of products made in Xinjiang involving alleged human rights violations, which have or may prompt countersanctions or other retaliatory actions from the Chinese government. In addition, differing policies on China–Taiwan and the Russia–Ukraine war have further strained relations between the countries. These geopolitical, trade and investment tensions have created additional uncertainty and increased risk in doing business in China, including potential supply disruptions and higher costs of our products sourced or imported from China. business. confidence, spending and tourism could negatively affect our business and results of operations. Unstable political conditions, civil unrest, terrorist activities, armed conflicts or events of extreme violence, including any escalation of the conflict between Russia and Ukraine and the Israel-Hamas war, may disrupt commerce and could negatively affect our business and results of operations. cash flows. The Inflation Reduction Act was enacted on August 16, 2022 and includes a number of provisions that may impact the Company, including a corporate alternative minimum tax on certain large corporations, incentives to address climate change mitigation and other non-income tax provisions, including an excise tax on the repurchase of our stock. We are assessing these impacts on our consolidated financial statements. results of operations. The burdens imposed by these and other laws and regulations that may be enacted, or new interpretations of existing laws and regulations, may also require us to incur substantial costs to reach compliance or change the manner in which we use data. •Regulatory Risks. Unfavorable global, domestic or regional economic or political conditions and other developments and risks could negatively affect our business and results of operations. For example, energy or carbon policies (both existing and emerging) that apply to our energy suppliers have the ability to impact indirect costs to our operations through shifts in energy prices. Recent and future developments in regional cap-and-trade programs such as the Regional Greenhouse Gas Initiative (RGGI), which sets a declining limit on emissions from regulated power plants within the RGGI states, could increase our energy costs and affect the profitability of operations. The RGGI program spans 11 states and includes Connecticut, Delaware, Maine, Maryland, Massachusetts, New Hampshire, New Jersey, New York, Rhode Island, Vermont, and Virginia. In 2020, Macy's, Inc. reported energy data for 217 locations across these states and could experience increases in the cost of energy in these regions as a result of the RGGI program. From 2021 to 2022, Macy's, Inc. experienced a 22% electricity cost increase across its sites located in RGGI states. Current environmental and climate-related regulation, both at the state and federal levels, are monitored as part of our enterprise risk management process. •make it more difficult for us to satisfy our debt obligations; •increase our vulnerability to general adverse economic and external conditions; •impair our ability to obtain additional debt or equity financing in the future for working capital, capital expenditures, acquisitions or general corporate or other purposes; •require us to dedicate a material portion of our cash flows from operations to the payment of principal and interest on our indebtedness, thereby reducing the availability of our cash flows to fund working capital needs, capital expenditures, acquisitions and other general corporate purposes; •expose us to the risk of increased interest rates to the extent we make borrowings under our asset-based credit facility, which bears interest at a variable rate; •limit our flexibility in planning for, or reacting to, changes in our business and the industry in which we operate; 2021 Boxes Locations Macy's 570 510 Bloomingdale's 57 55 bluemercury 160 160 787 725 2021 Boxes Locations Store count at beginning of fiscal year 789 727 Stores opened 9 9 Stores closed, consolidated into or relocated from existing centers (11 ) (11 ) Store count at end of fiscal year 787 725 By Brand Total Owned Leased Subject to a Ground Lease Partly Owned and Partly Leased Macy's 570 309 160 97 4 Bloomingdale's 57 14 36 7 — bluemercury 160 — 160 — — 787 323 356 104 4 Item Total Number of Shares Purchased Average Price Paid per Share ($) Number of Shares Purchased as Part of Publicly Announced Plans or Programs (1) Maximum Number (or Approximate Dollar Value) of Shares that May Yet be Purchased Under the Plans or Programs ($)(1) (thousands) (thousands) (millions) October 31, 2021 - November 27, 2021 — — — 200 November 28, 2021 - January 1, 2022 7,463 26.82 7,463 — January 2, 2022 - January 29, 2022 — — — — 7,463 26.82 7,463 The following graph compares the cumulative total stockholder return on the Company's common stock withthe Standard&Poor's500CompositeIndexandtheCompany'speergroupsfortheperiodfrom The peer group comprised of companies within the S&P Retail Select Index is used by the CompensationandManagementDevelopmentCommitteeoftheBoardofDirectors for evaluating compensation related to the " A Bold New Chapter, detailed further below. In evaluating •Comparable sales, on a 52-week basis, decreased 6.9% on an owned basis and 6.0% on an owned-plus-licensed basis. •Other revenue, consisting of net credit card revenue and Macy's Media Network revenue, decreased $233 million to $774 million. •The gross margin rate was 38.8%, an increase of 140 basis points from 37.4%. •Selling, general & administrative (SG&A) expenses decreased $86 million to $8,375 million, or 35.1% of net sales, an increase of 190 basis points. •Net income was $105 million, a decrease from net income of $1,177 million. Net income adjusted for impairment, restructuring and other costs, settlement charges, and losses on early retirement of debt (Adjusted net income) declined from $1,259 million to adjusted net income of $973 million. •Earnings before interest, taxes, depreciation and amortization excluding restructuring, impairment, store closings and other costs and settlement charges (Adjusted EBITDA) were $2,317 million, a decline from $2,648 million. •Diluted earnings per share were $0.38, compared to diluted earnings per share of $4.19. On an adjusted basis, diluted earnings per share were $3.50, compared to adjusted diluted earnings per share of $4.48. •Merchandise inventories were up 2% and inventory turnover decreased 2%. with 120 brands and over 2,300 brands, respectively, at each nameplate. •Luxury: In 2023, Bloomingdale's celebrated 50 years of its iconic Big Brown Bag, added several exciting brands and launched key collaborations with engaging in-store and digital activations, including Barbie- and Wonka-themed takeovers of The Carousel @ Bloomingdale's. The fourth quarter of 2023 marked Bluemercury's 12th consecutive quarter of comparable sales growth. It also unveiled two remodeled luxury stores in 2023 with elevated spa offerings and high-touch customer service, which serve as the foundation for future locations. •Personalized offers and communication: The digital and technology teams tested and learned throughout 2023, including the recent launch of several multi-touch communications. The Company anticipates moving from testing in 2023 to scaling in 2024. •.Strengthen the Macy's nameplate 2021 2020 2019 Amount % to Sales Amount % to Sales Amount % to Sales (dollars in millions, except per share figures) Net sales $ 24,460 $ 17,346 $ 24,560 Increase (decrease) in comparable sales 43.0 % (27.9 )% (0.8 )% Credit card revenues, net 832 3.4 % 751 4.3 % 771 3.1 % Cost of sales (14,956 ) (61.1 )% (12,286 ) (70.8 )% (15,171 ) (61.8 )% Selling, general and administrative expenses (8,047 ) (32.9 )% (6,767 ) (39.0 )% (8,998 ) (36.6 )% Gains on sale of real estate 91 0.4 % 60 0.3 % 162 0.6 % Impairment, restructuring and other costs (30 ) (0.1 )% (3,579 ) (20.6 )% (354 ) (1.4 )% Operating income (loss) 2,350 9.6 % (4,475 ) (25.8 )% 970 3.9 % Diluted earnings (loss) per share $ 4.55 $ (12.68 ) $ 1.81 Supplemental Financial Measure Gross margin $ 9,504 38.9 % $ 5,060 29.2 % $ 9,389 38.2 % Digital sales as a percent of net sales 35.0 % 44.3 % 25.3 % Supplemental Non-GAAP Financial Measures Increase (decrease) in comparable sales on an owned plus licensed basis 42.9 % (27.9 )% (0.7 )% Adjusted diluted earnings (loss) per share $ 5.31 $ (2.21 ) $ 2.91 EBITDA $ 3,194 $ (3,546 ) $ 1,924 Adjusted EBITDA $ 3,320 $ 117 $ 2,336 ROIC 27.2 % 3.0 % 17.1 % 2021 2020 Net sales $ 24,460 $ 17,346 Increase (decrease) in comparable sales 43.0 % (27.9 )% Increase (decrease) in comparable sales on an owned plus licensed basis 42.9 % (27.9 )% Digital sales as a percent of net sales 35.0 % 44.3 % 2021 2020 Credit card revenues, net $ 832 $ 751 Proprietary credit card sales penetration 41.6 % 43.0 % cost saving initiatives. The increase in 2021 2020 Cost of sales $ (14,956 ) $ (12,286 ) As a percent to net sales 61.1 % 70.8 % Gross margin $ 9,504 $ 5,060 As a percent to net sales 38.9 % 29.2 % 2021 2020 SG&A expenses $ (8,047 ) $ (6,767 ) As a percent to net sales 32.9 % 39.0 % SG&A 2021 2020 Gains on sale of real estate $ 91 $ 60 2021 2020 Impairment, restructuring and other costs $ (30 ) $ (3,579 ) 2021 2020 Benefit plan income, net $ 66 $ 54 2021 2020 Settlement charges $ (96 ) $ (84 ) 2021 2020 Net interest expense $ (255 ) $ (280 ) The 17% decrease in net interest expense, excluding losses on early retirement of debt, was 2021 2020 Losses on early retirement of debt $ (199 ) $ — 2021 2020 Effective tax rate 23.4 % 17.7 % Federal income statutory rate 21 % 21 % The Company's principal sources of liquidity are cash from operations, cash on hand and the asset-based credit facility described below. Material contractual obligations arising in the normal course of business primarily consist of long-term debt and related interest payments, lease obligations, merchandise purchase obligations, retirement plan benefits, and self-insurance reserves. See Notes 4, 6 and 9 to the consolidated financial statements included in Item 8 of this Report for amounts outstanding on Merchandise purchase obligations represent future merchandise payables for inventory purchased from various suppliers through contractual arrangements and are expected to be funded through cash from operations. 2021 2020 2019 Net cash provided by operating activities $ 2,712 $ 649 $ 1,608 Net cash used by investing activities (370 ) (325 ) (1,002 ) Net cash provided (used) by financing activities (2,381 ) 699 (1,123 ) fiscal 2022. Standard & Stable January 29, 2022 (in millions) ASSETS Current Assets $ 1,517 Noncurrent Assets 6,784 LIABILITIES Current Liabilities $ 2,243 Noncurrent Liabilities (a) 10,407 $ 2021 (in millions) Net Sales $ 867 Consignment commission income (a) 3,793 Cost of sales (460 ) Operating loss (746 ) Loss before income taxes (b) (203 ) Net income 277 962 Macy's, Inc. Comparable Sales vs. 52 Weeks Ended January 30, 2021 Comparable Sales vs. 52 Weeks Ended February 1, 2020 Increase in comparable sales on an owned basis (Note 1) 43.0 % 3.1 % Impact of growth in comparable sales of departments licensed to third parties (Note 2) (0.1 )% (0.1 )% Increase in comparable sales on an owned plus licensed basis 42.9 % 3.0 % 2021 2020 2019 Net Income Diluted Earnings Per Share Net Income (Loss) Diluted Earnings (Loss) Per Share Net Income Diluted Earnings Per Share As reported $ 1,430 $ 4.55 $ (3,944 ) $ (12.68 ) $ 564 $ 1.81 Impairment, restructuring and other costs 30 0.10 3,579 11.50 354 1.13 Settlement charges 96 0.31 84 0.27 58 0.19 Losses on early retirement of debt 199 0.63 — — 30 0.10 Financing costs — — 5 0.02 — — Income tax impact of certain items identified above (87 ) (0.28 ) (412 ) (1.32 ) (100 ) (0.32 ) As adjusted $ 1,668 $ 5.31 $ (688 ) $ (2.21 ) $ 906 $ 2.91 2021 2020 2019 (millions) Net income (loss) $ 1,430 $ (3,944 ) $ 564 Interest expense - net 255 280 185 Losses on early retirement of debt 199 — 30 Financing costs — 5 — Federal, state and local income tax expense (benefit) 436 (846 ) 164 Depreciation and amortization 874 959 981 EBITDA $ 3,194 $ (3,546 ) $ 1,924 Impairment, restructuring and other costs 30 3,579 354 Settlement charges 96 84 58 Adjusted EBITDA $ 3,320 $ 117 $ 2,336 2021 2020 2019 (millions, except percentages) Net income (loss) $ 1,430 $ (3,944 ) $ 564 Property and equipment - net $ 5,665 $ 5,940 $ 6,633 Net income (loss) as a percent to property and equipment - net 25.2 % (66.4 )% 8.5 % Net income (loss) $ 1,430 $ (3,944 ) $ 564 Add back interest expense, net 255 280 185 Add back financing cost — 5 — Add back losses on early retirement of debt 199 — 30 Add back (deduct) federal, state and local tax expense (benefit) 436 (846 ) 164 Add back impairment, restructuring and other costs 30 3,579 354 Add back settlement charges 96 84 58 Add back depreciation and amortization 874 959 981 Deduct benefit plan income, net (66 ) (54 ) (31 ) Add back rent expense Real estate 326 334 335 Personal property 7 7 8 Adjusted EBITDA, excluding benefit plan income, net and lease expense $ 3,587 $ 404 $ 2,648 Property and equipment - net $ 5,802 $ 6,092 $ 6,628 Add back accumulated depreciation and amortization 4,474 4,590 4,438 Add back capitalized value of variable rent 83 16 114 Add back lease right of use assets 2,462 2,378 2,241 Add (deduct) other selected assets and liabilities: Receivables 234 204 265 Merchandise inventories 4,763 4,356 5,743 Prepaid expenses and other current assets 376 442 551 Other assets 534 589 675 Merchandise accounts payable (2,760 ) (2,213 ) (2,183 ) Accounts payable and accrued liabilities (2,431 ) (2,508 ) (2,609 ) Other long-term liabilities (313 ) (348 ) (371 ) Total average invested capital $ 13,224 $ 13,598 $ 15,492 ROIC 27.1 % 3.0 % 17.1 % charge. Taxes 2024. Name Age Director Since Principal Occupation Francis S. Blake 71 2015 Former Chairman and Chief Executive Officer of The Home Depot, Inc., a multinational home improvement retailer. Torrence N. Boone 51 2019 Vice President, Global Client Partnerships, Alphabet Inc. since 2010. John A. Bryant 55 2015 Former Chairman, President and Chief Executive Officer of Kellogg Company, a multinational cereal and snack food producer. Ashley Buchanan 48 2021 Chief Executive Officer of The Michaels Companies, Inc., an arts and crafts specialty retailer, since 2020. Deirdre P. Connelly 60 2008 Former President, North American Pharmaceuticals of GlaxoSmithKline, a global pharmaceutical company. Leslie D. Hale 48 2015 President and Chief Executive Officer of RLJ Lodging Trust, a publicly-traded lodging real estate investment trust, since 2018. William H. Lenehan 44 2016 President and Chief Executive Officer of Four Corners Property Trust, Inc., a real estate investment trust, since 2015. Sara Levinson 70 1997 Co-Founder and Director of Katapult, a digital entertainment company making products for today's creative generation, since 2013. Paul C. Varga 57 2012 Former Chairman and Chief Executive Officer of Brown- Forman Corporation, a spirits and wine company. Marna C. Whittington 73 1993 Former Chief Executive Officer of Allianz Global Investors Capital, a diversified global investment firm. Tracey Zhen 45 2021 President of Zipcar, a car sharing service and a subsidiary of Avis Budget Group, Inc., since 2017. Changes in Shareholders Matters certain long-lived assets associated with corporate and other assets. key assumptions required specialized skills and knowledge. cumulative results of the audit procedures. 2021 2020 2019 Net sales $ 24,460 $ 17,346 $ 24,560 Credit card revenues, net 832 751 771 Cost of sales (14,956 ) (12,286 ) (15,171 ) Selling, general and administrative expenses (8,047 ) (6,767 ) (8,998 ) Gains on sale of real estate 91 60 162 Restructuring, impairment, store closing and other costs (30 ) (3,579 ) (354 ) Operating income (loss) 2,350 (4,475 ) 970 Benefit plan income, net 66 54 31 Settlement charges (96 ) (84 ) (58 ) Interest expense (256 ) (284 ) (205 ) Financing costs 0 (5 ) 0 Losses on early retirement of debt (199 ) 0 (30 ) Interest income 1 4 20 Income (loss) before income taxes 1,866 (4,790 ) 728 Federal, state and local income tax benefit (expense) (436 ) 846 (164 ) Net income (loss) $ 1,430 $ (3,944 ) $ 564 Basic earnings (loss) per share $ 4.66 $ (12.68 ) $ 1.82 Diluted earnings (loss) per share $ 4.55 $ (12.68 ) $ 1.81 2021 2020 2019 Net income (loss) $ 1,430 $ (3,944 ) $ 564 Other comprehensive income (loss), net of taxes: Net actuarial gain (loss) and prior service credit on post employment and postretirement benefit plans, net of tax effect of $23 million, $37 million and $36 million 69 107 (107 ) Reclassifications to net income (loss): Net actuarial loss and prior service cost on post employment and postretirement benefit plans, net of tax effect of $9 million, $12 million and $8 million 25 35 23 Settlement charges, net of tax effect of $24 million, $22 million and $14 million 72 62 44 Total other comprehensive income (loss) 166 204 (40 ) Comprehensive income (loss) $ 1,596 $ (3,740 ) $ 524 January 29, 2022 January 30, 2021 ASSETS Current Assets: Cash and cash equivalents $ 1,712 $ 1,679 Receivables 297 276 Merchandise inventories 4,383 3,774 Prepaid expenses and other current assets 366 455 Total Current Assets 6,758 6,184 Property and Equipment – net 5,665 5,940 Right of Use Assets 2,808 2,878 Goodwill 828 828 Other Intangible Assets – net 435 437 Other Assets 1,096 1,439 Total Assets $ 17,590 $ 17,706 LIABILITIES AND SHAREHOLDERS’ EQUITY Current Liabilities: Short-term debt $ 0 $ 452 Merchandise accounts payable 2,222 1,978 Accounts payable and accrued liabilities 3,086 2,927 Income taxes 108 0 Total Current Liabilities 5,416 5,357 Long-Term Debt 3,295 4,407 Long-Term Lease Liabilities 3,098 3,185 Deferred Income Taxes 983 908 Other Liabilities 1,177 1,296 Shareholders’ Equity: Common stock (292.4 and 310.5 shares outstanding) 3 3 Additional paid-in capital 517 571 Accumulated equity 5,268 3,928 Treasury stock (1,545 ) (1,161 ) Accumulated other comprehensive loss (622 ) (788 ) Total Shareholders' Equity 3,621 2,553 Total Liabilities and Shareholders’ Equity $ 17,590 $ 17,706 Accumulated Additional Other Total Common Paid-In Accumulated Treasury Comprehensive Shareholders’ Stock Capital Equity Stock Income (Loss) Equity Balance at February 2, 2019 $ 3 $ 652 $ 8,050 $ (1,318 ) $ (951 ) $ 6,436 Cumulative-effect adjustment (a) (158 ) (158 ) Net income 564 564 Other comprehensive loss (40 ) (40 ) Common stock dividends ($1.51 per share) (470 ) (470 ) Stock repurchases (1 ) (1 ) Stock-based compensation expense 38 38 Stock issued under stock plans (69 ) 78 9 Other 3 (4 ) (1 ) Balance at February 1, 2020 3 621 7,989 (1,241 ) (995 ) 6,377 Net loss (3,944 ) (3,944 ) Other comprehensive income 204 204 Common stock dividends ($0.3775 per share) (117 ) (117 ) Stock-based compensation expense 31 31 Stock issued under stock plans (81 ) 80 (1 ) Other 3 3 Balance at January 30, 2021 3 571 3,928 (1,161 ) (788 ) 2,553 Net income 1,430 1,430 Other comprehensive income 166 166 Common stock dividends ($0.30 per share) (90 ) (90 ) Stock repurchases (500 ) (500 ) Stock-based compensation expense 55 55 Stock issued under stock plans (109 ) 116 7 Balance at January 29, 2022 $ 3 $ 517 $ 5,268 $ (1,545 ) $ (622 ) $ 3,621 2021 2020 2019 Cash flows from operating activities: Net income (loss) $ 1,430 $ (3,944 ) $ 564 Adjustments to reconcile net income (loss) to net cash provided by operating activities: Impairment, restructuring and other costs 30 3,579 354 Settlement charges 96 84 58 Depreciation and amortization 874 959 981 Benefit plans 34 47 31 Stock-based compensation expense 55 31 38 Gains on sale of real estate (91 ) (60 ) (162 ) Deferred income taxes 19 (327 ) (6 ) Amortization of financing costs and premium on acquired debt 70 18 4 Changes in assets and liabilities: (Increase) decrease in receivables (21 ) 132 (9 ) (Increase) decrease in merchandise inventories (610 ) 1,406 75 (Increase) decrease in prepaid expenses and other current assets (39 ) 51 89 Increase in merchandise accounts payable 218 237 40 Increase (decrease) in accounts payable and accrued liabilities 245 (759 ) (257 ) Increase (decrease) in current income taxes 588 (617 ) (60 ) Change in other assets and liabilities (186 ) (188 ) (132 ) Net cash provided by operating activities 2,712 649 1,608 Cash flows from investing activities: Purchase of property and equipment (354 ) (338 ) (902 ) Capitalized software (243 ) (128 ) (255 ) Disposition of property and equipment 164 113 185 Other, net 63 28 (30 ) Net cash used by investing activities (370 ) (325 ) (1,002 ) Cash flows from financing activities: Debt issued 1,085 2,780 0 Debt issuance costs (9 ) (95 ) (3 ) Debt repaid (2,699 ) (2,042 ) (569 ) Debt repurchase premium and expenses (152 ) (7 ) (28 ) Dividends paid (90 ) (117 ) (466 ) Increase (decrease) in outstanding checks (23 ) 181 (62 ) Acquisition of treasury stock (500 ) (1 ) (1 ) Issuance of common stock 7 0 6 Net cash provided (used) by financing activities (2,381 ) 699 (1,123 ) Net increase (decrease) in cash, cash equivalents and restricted cash (39 ) 1,023 (517 ) Cash, cash equivalents and restricted cash beginning of period 1,754 731 1,248 Cash, cash equivalents and restricted cash end of period $ 1,715 $ 1,754 $ 731 Supplemental cash flow information: Interest paid $ 442 $ 257 $ 242 Interest received 1 5 20 Income taxes paid (received), net (171 ) 98 229 Restricted cash, end of period 3 75 46 Year 2021 2020 2019 (millions) Gross advertising and promotional costs $ 1,267 $ 907 $ 1,330 Cooperative advertising allowances 90 89 188 Advertising and promotional costs, net of cooperative advertising allowances $ 1,177 $ 818 $ 1,142 Net sales $ 24,460 $ 17,346 $ 24,560 Advertising and promotional costs, net of cooperative advertising allowances, as a percent to net sales 4.8 % 4.7 % 4.6 % Depreciationofownedpropertiesisprovidedprimarilyonastraight-linebasisovertheestimatedassetlives,which range from fifteen Income. the fiscal year ending February 1, 2025. The Company 2021 2020 2019 Women’s Accessories, Intimate Apparel, Shoes, Cosmetics and Fragrances $ 10,119 $ 7,206 $ 9,454 Women’s Apparel 4,433 2,909 5,411 Men’s and Kids’ 5,252 3,486 5,628 Home/Other (a) 4,656 3,745 4,067 Total $ 24,460 $ 17,346 $ 24,560 2021 2020 2019 (millions) Balance, beginning of year $ 616 $ 839 $ 856 Liabilities issued but not redeemed (a) 394 262 554 Revenue recognized from beginning liability (529 ) (485 ) (571 ) Balance, end of year $ 481 $ 616 $ 839 (a) accounts, credit card funding costs and bad debt reserves and are a component of other revenue on the consolidated statements of income. 2021 2020 2019 (millions) Asset Impairments $ 6 $ 3,280 $ 197 Restructuring 3 224 123 Other 21 75 34 $ 30 $ 3,579 $ 354 Professional fees and Severance and other related other benefits charges Total (millions) Balance at February 2, 2019 $ 0 $ 0 $ 0 Additions charged to expense 121 36 157 Cash payments (6 ) (27 ) (33 ) Balance at February 1, 2020 115 9 124 Additions charged to expense 55 17 72 Cash payments (156 ) (24 ) (180 ) Balance at January 30, 2021 14 2 16 Additions charged to expense 5 0 5 Cash payments (18 ) (2 ) (20 ) Balance at January 29, 2022 $ 1 $ 0 $ 1 January 29, January 30, 2022 2021 (millions) Land $ 1,353 $ 1,390 Buildings on owned land 3,635 3,650 Buildings on leased land and leasehold improvements 1,303 1,268 Fixtures and equipment 3,922 4,032 10,213 10,340 Less accumulated depreciation and amortization 4,548 4,400 $ 5,665 $ 5,940 January 29, January 30, 2022 2021 Classification (millions) Assets Finance lease assets (a) Right of Use Assets $ 10 $ 12 Operating lease assets (b) Right of Use Assets 2,798 2,866 Total lease assets $ 2,808 $ 2,878 Liabilities Current Finance (a) Accounts payable and accrued liabilities $ 2 $ 2 Operating (b) Accounts payable and accrued liabilities 328 198 Noncurrent Finance (a) Long-Term Lease Liabilities 17 19 Operating (b) Long-Term Lease Liabilities 3,081 3,166 Total lease liabilities $ 3,428 $ 3,385 (a) Financeleaseassetsarerecordednetofaccumulatedamortizationof 2021 2020 2019 (millions) Real estate Operating leases (c) – Minimum rents $ 359 $ 376 $ 364 Variable rents 48 45 54 407 421 418 Less income from subleases – Operating leases (1 ) (1 ) (2 ) Operating leases Operating leases $ 406 $ 420 $ 416 Personal property – Operating leases $ 7 $ 7 $ 8 Certain supply chain operating lease expense amounts are included in cost of sales. Operating Finance Leases Leases (d and e) Total (millions) Fiscal year 2022 $ 3 $ 358 $ 361 2023 3 352 355 2024 3 346 349 2025 3 342 345 2026 2 326 328 After 2026 13 5,181 5,194 Total undiscounted lease payments 27 6,905 6,932 Less amount representing interest 8 3,496 3,504 Total lease liabilities $ 19 $ 3,409 $ 3,428 (d) Operatingleasepaymentsinclude January 29, January 30, Lease Term and Discount Rate 2022 2021 Weighted-average remaining lease term (years) Finance leases 11.9 12.1 Operating leases 21.7 22.4 Weighted-average discount rate Finance leases 6.73 % 6.70 % Operating leases 6.54 % 6.32 % 52 Weeks Ended 52 Weeks Ended Other Information January 29, 2022 January 30, 2021 (millions) Cash paid for amounts included in the measurement of lease liabilities: Operating cash flows used from operating leases $ 322 $ 521 Financing cash flows used from financing leases 3 4 Leased assets obtained in exchange for new operating lease liabilities 15 430 January 29, January 30, 2022 2021 (millions) Non-amortizing intangible assets Goodwill $ 9,290 $ 9,290 Accumulated impairment losses (8,462 ) (8,462 ) 828 828 Tradenames 403 403 $ 1,231 $ 1,231 Amortizing intangible assets Favorable leases and other contractual assets $ 5 $ 5 Tradenames 43 43 48 48 Accumulated amortization Favorable leases and other contractual assets (1 ) (1 ) Tradenames (15 ) (13 ) (16 ) (14 ) $ 32 $ 34 Capitalized software Gross balance $ 1,010 $ 1,136 Accumulated amortization (499 ) (645 ) $ 511 $ 491 For the Company's annual impairment assessment as of the end of fiscal May Amortizing Capitalized intangible assets Software (millions) Fiscal year 2022 $ 2 $ 180 2023 2 111 2024 2 65 2025 2 25 2026 2 0 January 29, January 30, 2022 2021 (millions) Short-term debt: 3.875% Senior notes due 2022 $ 0 $ 450 Current portion of other long-term obligations 0 2 $ 0 $ 452 Long-term debt: 8.375% Senior secured notes due 2025 $ 0 $ 1,300 2.875% Senior notes due 2023 504 640 5.875% Senior notes due 2029 500 0 4.5% Senior notes due 2034 367 367 3.625% Senior notes due 2024 350 500 5.125% Senior notes due 2042 250 250 4.3% Senior notes due 2043 250 250 6.375% Senior notes due 2037 192 192 6.7% Senior secured debentures due 2034 183 183 4.375% Senior notes due 2023 161 210 7.0% Senior debentures due 2028 105 105 6.65% Senior secured debentures due 2024 81 81 6.9% Senior debentures due 2029 79 79 6.7% Senior secured debentures due 2028 74 74 6.79% Senior debentures due 2027 71 71 6.65% Senior debentures due 2024 36 41 6.7% Senior debentures due 2028 29 29 8.75% Senior secured debentures due 2029 13 13 6.7% Senior debentures due 2034 18 18 6.9% Senior debentures due 2032 12 12 7.6% Senior debentures due 2025 6 24 7.875% Senior secured debentures due 2030 5 5 6.9% Senior secured debentures due 2032 5 5 7.875% Senior debentures due 2030 5 5 Unamortized debt issue costs and discount (22 ) (77 ) Premium on acquired debt, using an effective interest yield of 5.760% to 6.021% 21 30 $ 3,295 $ 4,407 NOTESTO CONSOLIDATEDFINANCIALSTATEMENTS— (Continued) 2021 2020 2019 (millions) Interest on debt $ 246 $ 273 $ 211 Amortization of debt premium (3 ) (4 ) (5 ) Amortization of financing costs and debt discount 26 23 6 Interest on finance leases 1 1 2 270 293 214 Less interest capitalized on construction 14 9 9 Interest expense $ 256 $ 284 $ 205 Losses on early retirement of debt $ 199 $ 0 $ 30 (millions) Fiscal year 2023 $ 665 2024 467 2025 6 2026 0 2027 71 After 2027 2,086 2021 2020 2019 (millions) 8.375% Senior secured notes due 2025 $ 1,300 $ 0 $ 0 Revolving credit facility 585 1,500 0 3.875% Senior notes due 2022 450 0 100 3.625% Senior notes due 2024 150 0 0 2.875% Senior notes due 2023 136 0 110 4.375% Senior notes due 2023 49 0 190 7.6% Senior debentures due 2025 18 0 0 6.65% Senior debentures due 2024 5 0 0 3.45% Senior notes due 2021 0 500 0 10.25% Senior debentures due 2021 0 33 0 6.9% Senior debentures due 2029 0 0 113 7.0% Senior debentures due 2028 0 0 12 8.5% Senior debentures due 2019 0 0 36 9.5% amortizing debentures due 2021 2 4 4 9.75% amortizing debentures due 2021 1 2 2 $ 2,696 $ 2,039 $ 567 On March 3, 2022, the subject to up to two one-year extensions that could be requested by the Company and agreed to by the lenders. The agreement provides for revolving credit borrowings and letters of credit in an aggregate amount not to exceed $1 million. The unsecured revolving credit facility contains covenants that provide for, among other things, limitations on fundamental changes, use of proceeds, and maintenance of property, as well as customary representations and warranties and events of default. As of February 3, 2024 and January 28, 2023, there were no revolving credit loans outstanding under the credit agreement. released. January 29, January 30, 2022 2021 (millions) Accounts payable $ 1,058 $ 878 Gift cards and customer rewards 481 616 Lease related liabilities 433 285 Accrued wages and vacation 290 201 Allowance for future sales returns 198 159 Current portion of post employment and postretirement benefits 148 142 Taxes other than income taxes 141 265 Current portion of workers’ compensation and general liability reserves 92 97 Accrued interest 44 54 Restructuring accruals, including severance 5 27 Other 196 203 $ 3,086 $ 2,927 2021 2020 2019 (millions) Balance, beginning of year $ 416 $ 462 $ 487 Charged to costs and expenses 108 88 120 Payments, net of recoveries (137 ) (134 ) (145 ) Balance, end of year $ 387 $ 416 $ 462 2021 2020 2019 Current Deferred Total Current Deferred Total Current Deferred Total (millions) Federal $ 369 $ (21 ) $ 348 $ (520 ) $ (179 ) $ (699 ) $ 137 $ 4 $ 141 State and local 48 40 88 1 (148 ) (147 ) 33 (10 ) 23 $ 417 $ 19 $ 436 $ (519 ) $ (327 ) $ (846 ) $ 170 $ (6 ) $ 164 benefits in income tax expense. The 2021 2020 2019 (millions) Expected tax $ 392 $ (1,006 ) $ 153 State and local income taxes, net of federal income taxes 84 (140 ) 13 CARES Act carryback benefit (29 ) (205 ) 0 Goodwill impact 0 492 0 Tax impact of equity awards 0 8 1 Federal tax credits (3 ) (5 ) (3 ) Change in valuation allowance (15 ) 24 5 Other 7 (14 ) (5 ) $ 436 $ (846 ) $ 164 January 29, January 30, 2022 2021 (millions) Deferred tax assets Post employment and postretirement benefits $ 48 $ 126 Accrued liabilities accounted for on a cash basis for tax purposes 100 103 Lease liabilities 917 937 Unrecognized state tax benefits and accrued interest 38 39 State operating loss and credit carryforwards 152 194 Other 95 95 Valuation allowance (89 ) (104 ) Total deferred tax assets 1,261 1,390 Deferred tax liabilities Excess of book basis over tax basis of property and equipment (914 ) (937 ) Right of use assets (751 ) (766 ) Merchandise inventories (300 ) (300 ) Intangible assets (116 ) (115 ) Other (163 ) (180 ) Total deferred tax liabilities (2,244 ) (2,298 ) Net deferred tax liability $ (983 ) $ (908 ) January 29, January 30, February 1, 2022 2021 2020 (millions) Balance, beginning of year $ 113 $ 133 $ 149 Additions based on tax positions related to the current year 12 9 18 Additions for tax positions of prior years 0 0 11 Reductions for tax positions of prior years (11 ) (13 ) (20 ) Settlements (2 ) (4 ) (16 ) Statute expirations (10 ) (12 ) (9 ) Balance, end of year $ 102 $ 113 $ 133 Amounts recognized in the Consolidated Balance Sheets Current income taxes $ 14 $ 6 $ 12 Deferred income taxes 3 3 4 Other liabilities (a) 85 104 117 $ 102 $ 113 $ 133 January 29, January 30, 2022 2021 (millions) Amount of unrecognized tax benefits, net of deferred tax assets, that if recognized would affect the effective tax rate $ 81 $ 90 Accrued federal, state and local interest and penalties 65 60 Amounts recognized in the Consolidated Balance Sheets Current income taxes 32 3 Other liabilities 33 57 2021 2020 2019 (millions) 401(k) Qualified Defined Contribution Plan $ 76 $ 68 $ 96 Non-Qualified Defined Contribution Plan 1 1 2 Pension Plan (85 ) (73 ) (54 ) Supplementary Retirement Plan 24 26 30 $ 16 $ 22 $ 74 Pension Plan SERP 2021 2020 2021 2020 (millions) Change in projected benefit obligation Projected benefit obligation, beginning of year $ 3,030 $ 3,321 $ 673 $ 681 Service cost 1 4 0 0 Interest cost 49 66 11 14 Actuarial (gain) loss (172 ) 12 (32 ) 42 Benefits paid (502 ) (373 ) (46 ) (64 ) Projected benefit obligation, end of year 2,406 3,030 606 673 Changes in plan assets Fair value of plan assets, beginning of year 3,359 3,359 0 0 Actual return on plan assets 43 373 0 0 Company contributions 0 0 46 64 Benefits paid (502 ) (373 ) (46 ) (64 ) Fair value of plan assets, end of year 2,900 3,359 0 0 Funded status at end of year $ 494 $ 329 $ (606 ) $ (673 ) Amounts recognized in the Consolidated Balance Sheets at January 29, 2022 and January 30, 2021 Other assets $ 494 $ 329 $ 0 $ 0 Accounts payable and accrued liabilities 0 0 (47 ) (49 ) Other liabilities 0 0 (559 ) (624 ) $ 494 $ 329 $ (606 ) $ (673 ) Amounts recognized in accumulated other comprehensive loss at January 29, 2022 and January 30, 2021 Net actuarial loss $ 617 $ 794 $ 257 $ 301 Prior service cost 0 0 5 6 $ 617 $ 794 $ 262 $ 307 NOTESTO CONSOLIDATEDFINANCIALSTATEMENTS— (Continued) Pension Plan SERP 2021 2020 2019 2021 2020 2019 (millions) Net Periodic Pension Cost Service cost $ 1 $ 4 $ 5 $ 0 $ 0 $ 0 Interest cost 49 66 103 11 14 21 Expected return on assets (161 ) (183 ) (191 ) 0 0 0 Amortization of net actuarial loss 26 40 29 13 12 9 (85 ) (73 ) (54 ) 24 26 30 Settlement charges 96 74 45 0 10 13 Other Changes in Plan Assets and Projected Benefit Obligation Recognized in Other Comprehensive Loss Net actuarial (gain) loss (55 ) (178 ) 51 (32 ) 40 87 Amortization of net actuarial loss (26 ) (40 ) (29 ) (13 ) (12 ) (9 ) Settlement charges (96 ) (74 ) (45 ) 0 (10 ) (13 ) (177 ) (292 ) (23 ) (45 ) 18 65 Total recognized $ (166 ) $ (291 ) $ (32 ) $ (21 ) $ 54 $ 108 Pension Plan SERP 2021 2020 2021 2020 Discount rate 3.06 % 2.43 % 3.10 % 2.51 % Rate of compensation increases 3.50 % 3.45 % 0 0 Cash balance plan interest crediting rate 5.00 % 5.00 % 0 0 Pension Plan SERP 2021 2020 2019 2021 2020 2019 Discount rate used to measure service cost 2.69% - 3.07% 2.35% - 2.96% 4.09 % 0 0 0 Discount rate used to measure interest cost 1.76% - 2.07% 1.65% - 2.46% 3.67 % 1.74 % 1.65% - 2.44% 2.65% - 3.69% Expected long-term return on plan assets 5.75 % 6.25 % 6.50 % 0 0 0 Rate of compensation increases 3.45 % 3.25 % 4.00 % 0 0 0 Cash balance plan interest crediting rate 5.00 % 5.00 % 5.00 % 0 0 0 The Fair Value Category 2021 2020 (millions) Short term investments Level 2 $ 10 $ 3 Money market funds Level 1 206 136 Equity securities: U.S. pooled funds Level 1 77 356 International pooled funds Level 1 31 37 Fixed income securities: U.S. Treasury bonds Level 2 121 270 Other Government bonds Level 2 74 63 Corporate bonds Level 2 1,877 1,609 Mortgage-backed securities Level 2 10 11 Asset-backed securities Level 2 1 1 Pooled funds Level 1 72 271 Other types of investments: Derivatives in a positive position Level 2 12 8 Derivatives in a negative position Level 1 0 (4 ) Derivatives in a negative position Level 2 (1 ) 0 Pooled funds (a) 164 296 Real estate (a) 32 31 Private equity (a) 186 160 Total $ 2,872 $ 3,248 Pension Plan SERP (millions) Fiscal year 2022 $ 224 $ 47 2023 206 47 2024 193 45 2025 188 44 2026 180 48 2027-2031 768 190 2021 2020 2019 (millions) Stock options $ 4 $ 8 $ 15 Restricted stock units 51 23 23 $ 55 $ 31 $ 38 Income. There were 2019 Weighted average grant date fair value of stock options granted during the period $ 5.11 Dividend yield 6.3 % Expected volatility 40.6 % Risk-free interest rate 2.4 % Expected life 5.5 years Shares Weighted Average Exercise Price Weighted Average Remaining Contractual Life Aggregate Intrinsic Value (thousands) (years) (millions) Outstanding, beginning of period 16,345 $ 40.69 Granted 0 0 Canceled or forfeited (1,914 ) 27.40 Exercised (267 ) 26.51 Outstanding, end of period 14,164 $ 42.75 Exercisable, end of period 13,281 $ 43.92 3.1 $ 2 Options expected to vest 588 $ 25.26 6.9 $ 1 2021 2020 2019 (millions) Intrinsic value of options exercised $ 9 $ 0 $ 10 Cash received from stock options exercised 7 0 6 2021 2020 2019 Restricted stock units (performance-based) $ 15.80 $ 6.24 $ 24.28 Restricted stock units (time-based) 17.88 6.96 17.81 NOTESTO CONSOLIDATEDFINANCIALSTATEMENTS— (Continued) units, which is expected to be recognized over a weighted average period of approximately 2.5 years. Weighted Average Grant Date Shares Fair Value (thousands) Nonvested, beginning of period 9,752 $ 9.95 Granted – performance-based 841 15.80 Performance adjustment (34 ) 24.09 Granted – time-based 2,096 17.88 Forfeited (782 ) 10.65 Vested (2,773 ) 14.33 Nonvested, end of period 9,100 $ 10.87 Treasury Stock Common Stock Issued Deferred Compensation Plans Other Total Common Stock Outstanding (thousands) Balance at February 2, 2019 333,606 (941 ) (25,145 ) (26,086 ) 307,520 Stock issued under stock plans (130 ) 1,510 1,380 1,380 Stock repurchases (38 ) (38 ) (38 ) Deferred compensation plan distributions 169 169 169 Balance at February 1, 2020 333,606 (902 ) (23,673 ) (24,575 ) 309,031 Stock issued under stock plans (127 ) 1,577 1,450 1,450 Stock repurchases (79 ) (79 ) (79 ) Deferred compensation plan distributions 98 98 98 Balance at January 30, 2021 333,606 (931 ) (22,175 ) (23,106 ) 310,500 Stock issued under stock plans (277 ) 2,454 2,177 2,177 Stock repurchases (20,511 ) (20,511 ) (20,511 ) Deferred compensation plan distributions 193 193 193 Balance at January 29, 2022 333,606 (1,015 ) (40,232 ) (41,247 ) 292,359 January 29, 2022 January 30, 2021 Fair Value Measurements Fair Value Measurements Quoted Prices Quoted Prices Total in Active Markets for Identical Assets (Level 1) Significant Observable Inputs (Level 2) Significant Unobservable Inputs (Level 3) Total in Active Markets for Identical Assets (Level 1) Significant Observable Inputs (Level 2) Significant Unobservable Inputs (Level 3) (millions) Marketable equity and debt securities $ 39 $ 39 $ 0 $ 0 $ 100 $ 37 $ 63 $ 0 January 29, 2022 January 30, 2021 Notional Amount Carrying Amount Fair Value Notional Amount Carrying Amount Fair Value (millions) Long-term debt $ 3,295 $ 3,295 $ 3,254 $ 4,454 $ 4,407 $ 4,320 2021 2020 2019 Net Income Shares Net Loss Shares Net Income Shares (millions, except per share data) Net income (loss) and average number of shares outstanding $ 1,430 305.8 $ (3,944 ) 310.2 $ 564 308.8 Shares to be issued under deferred compensation and other plans 1.0 1.0 0.9 $ 1,430 306.8 $ (3,944 ) 311.1 $ 564 309.7 Basic earnings (loss) per share $ 4.66 $ (12.68 ) $ 1.82 Effect of dilutive securities: Stock options and restricted stock units 7.2 — 1.7 $ 1,430 314.0 $ (3,944 ) 311.1 $ 564 311.4 Diluted earnings (loss) per share $ 4.55 $ (12.68 ) $ 1.81 NOTESTO CONSOLIDATEDFINANCIALSTATEMENTS— (Continued) TheCompanyisacorporationorganizedunderthelawsoftheStateofDelawarein1985.TheCompanyanditspredecessorshavebeenoperatingdepartmentstoressince1830. As of January 29, 2022, respectively. Fiscal year 2023 included 53 weeks and fiscal years 2022 and 2021 each included 52 weeks.Forward-Looking StatementsThis Annual Report on Form 10-K and other reports, statements and information previously or subsequently filed by the Company with the Securities and Exchange Commission (the SEC) contain or may contain forward-looking statements. Such forward-looking statements are based upon the beliefs and assumptions of, and on information available to, the management of the Company at the time such statements are made. The following are or may constitute forward-looking statements within the meaning of the Private Securities Litigation Reform Act of 1995: (i) statements preceded by, followed by or that include the words “may,” “will,” “could,” “should,” “believe,” “expect,” “future,” “potential,” “anticipate,” “intend,” “plan,” “think,” “estimate” or “continue” or the negative or other variations thereof and (ii) statements regarding matters that are not historical facts. Such forward-looking statements are subject to various risks and uncertainties, including risks and uncertainties relating to:•the possible invalidity of the underlying beliefs and assumptions;•the Company's ability to successfully implement A Bold New Chapter strategy, including the ability to realize the anticipated benefits within the expected time frame or at all;•the success of the Company's operational decisions, including product sourcing, merchandise mix and pricing, and marketing and strategic initiatives, such as growing its digital channels, expanding the Company's off-mall store presence and modernizing its technology and supply chain infrastructures;•general consumer shopping behaviors and spending levels, including the shift of consumer spending to digital channels, the impact of changes in general economic conditions, consumer disposable income levels, consumer confidence levels, the availability, cost and level of consumer debt, and the costs of basic necessities and other goods;•competitive pressures from department stores, specialty stores, general merchandise stores, manufacturers' outlets and websites, off-price and discount stores, and all other retail channels, including digitally-native retailers, social media and catalogs;•the Company's ability to remain competitive and relevant as consumers' shopping behaviors continue to migrate to digital shopping channels and other shopping channels;•the Company's ability to maintain its brand image and reputation;•possible systems failures and/or security breaches or other types of cybercrimes or cybersecurity attacks, including any security breach that results in the theft, transfer or unauthorized disclosure of customer, employee or company information, or the failure to comply with various laws applicable to the Company in the event of such a breach;•the cost of colleagues, inclusive of inflation and cost of benefits as well as attracting and retaining quality colleagues;•transactions and strategy involving the Company's real estate portfolio;•the seasonal nature of the Company's business;•declines in the Company's credit card revenues;•the effects of weather and natural disasters, including the impact of climate change and health pandemics, on the Company's business, including the ability to open stores, customer demand and its supply chain, as well as our consolidated results of operations, financial position and cash flows;•conditions to, or changes in the timing of, proposed transactions and changes in expected synergies, cost savings and non-recurring charges;•the potential for the incurrence of charges in connection with the impairment of tangible and intangible assets, including goodwill;•possible changes or developments in social, economic, business, industry, market, legal and regulatory circumstances and conditions, including supply chain disruptions, inventory shortage, labor shortages, wage pressures and rising inflation, and their related impact on costs;•possible actions taken or omitted to be taken by third parties, including customers, suppliers, business partners, competitors, banks and other financial institutions, and legislative, regulatory, judicial and other governmental authorities and officials;•changes in relationships with vendors and other product and service providers;1•our level of indebtedness;•currency, interest and exchange rates and other capital market, economic and geo-political conditions;•unstable political conditions, civil unrest, terrorist activities and armed conflicts, including the ongoing conflict between Russia and Ukraine and the Israel-Hamas war;•the possible inability of the Company's manufacturers or transporters to deliver products in a timely manner or meet the Company's quality standards;•the Company's reliance on foreign sources of production, including risks related to the disruption of imports by labor disputes, regional and global health pandemics, and regional political and economic conditions;•duties, taxes, other charges and quotas on imports;•labor shortages;•the Company's ability to declare and pay future dividends and continue its share repurchases; and•the Company's ability to execute on its strategies or achieve expectations related to environmental, social, and governance matters.In addition to any risks and uncertainties specifically identified in the text surrounding such forward-looking statements, the statements in the immediately preceding sentence and the statements under captions such as “Risk Factors” in reports, statements and information filed by the Company with the SEC from time to time constitute cautionary statements identifying important factors that could cause actual amounts, results, events and circumstances to differ materially from those expressed in or implied by such forward-looking statements.2PART IItem 1. Business.GeneralThe Company is a corporation organized under the laws of the State of Delaware in 1985. The Company and its predecessors have been operating department stores since 1830. As of February 3, 2024, the Company operated725 718 storelocationsin43states,the DistrictofColumbia,PuertoRicoandGuam. TheCompany'soperationsare conductedthrough Macy's, Macy’s Macy's Backstage, MarketMacy's small format, Bloomingdale's, Bloomingdale's The Outlet, Bloomie's, and Bluemercury. In addition, Bloomingdale's in Dubai, United Arab Emirates, and Al Zahra, Kuwait are operated under license agreements with Al Tayer Insignia, a company of Al Tayer Group, LLC.The Company sells a wide range of merchandise, including apparel and accessories (men's, women's and kids'), cosmetics, home furnishings and other consumer goods. The specific assortments vary by Macy’s, Bloomingdale's,Bloomingdale’sTheOutlet, Bloomies, andbluemercury.Inaddition,Bloomingdale'sinDubai,UnitedArabEmirates,andAlZahra,KuwaitareoperatedunderlicenseagreementswithAlTayerInsignia,acompanysize ofAlTayer Group,LLC.TheCompanysellsawiderangeofmerchandise,includingapparelandaccessories(men’s,women’sandkids'),cosmetics,homefurnishingsandotherconsumergoods.Thespecificassortmentsvarybysizeofstore,merchandising assortmentsandcharacterofcustomersinthetradeareas.Moststoresarelocatedaturbanorsuburbansites,principallyin densely populated areas across the United States.Disaggregation of the Company's net sales by family of business for 2023, 2022 and 2021 was as follows:2023 2022 2021 Women's Accessories, Shoes, Cosmetics and Fragrances $ 9,520 $ 9,597 $ 9,385 Women's Apparel 4,861 5,349 5,174 Men's and Kids' 4,918 5,297 5,247 Home/Other (a) 3,793 4,199 4,654 Total $ 23,092 $ 24,442 $ 24,460 populatedareasacrosstheUnitedStates.DisaggregationoftheCompany'snetsalesbyfamilyofbusinessfor 2021, 2020(a)Other primarily includes restaurant sales, allowance for merchandise returns adjustments and breakage income from unredeemed gift cards.andIn 2023, the Company's subsidiaries provided various support functions to the Company's retail operations on an integrated, company-wide basis. 2019 wereasfollows:(a)Other primarily includes restaurant sales, allowance for merchandise returns adjustments, breakage income from unredeemed gift cards and certain loyalty program income.In 2021,the•Company’sThe Company's wholly-owned bank subsidiary, FDS Bank, provides certain collections, customer service and credit marketing services in respect of all credit card accounts that are owned either by Citibank, N.A. or FDS Bank and that constitute a part of the credit programs of the Company's retail operations.•Macy's Systems and Technology, Inc., a wholly-owned indirect subsidiary of the Company, provides operational electronic data processing and management information services to all of the Company's operations other than Bluemercury.subsidiariesprovidedvarioussupportfunctionstothe•Company’sMacy's Merchandising Group, Inc. (MMG), a wholly-owned direct subsidiary of the Company, and its subsidiaries Macy's Merchandising Group International, LLC and Macy's Merchandising Group Procurement, LLC, are responsible for the design and development of Macy's private label brands and certain licensed brands. Bloomingdale's uses MMG for a small portion of its private label merchandise. The Company believes that its private label merchandise differentiates its merchandise assortments from those of its competitors. MMG also offers its services, either directly or indirectly, to unrelated third parties.•Macy's Logistics and Operations, a division of a wholly-owned indirect subsidiary of the Company, provides warehousing and merchandise distribution services for the Company's operations and digital customer fulfillment.retailoperationsonanintegrated,company-widebasis.•TheCompany’swholly-ownedbanksubsidiary,FDSBank,providescertaincollections,customerserviceandcreditmarketingservicesinrespectofallcreditcardaccountsthatareownedeitherbyDepartment StoresNationalBank,asubsidiaryofCitibank,N.A.,orFDSBankandthatconstituteapartof thecreditprogramsoftheCompany’sretailoperations.•Macy’sSystemsandTechnology,Inc.,awholly-ownedindirectsubsidiaryoftheCompany,providesoperationalelectronicdataprocessingandmanagementinformationservicestoallofthe Company’soperationsotherthanbluemercury.•Macy’sMerchandisingGroup,Inc.(“MMG”),awholly-owneddirectsubsidiaryoftheCompany,anditssubsidiaryMacy'sMerchandisingGroupInternational,LLC,areresponsibleforthedesign anddevelopmentofMacy’sprivatelabelbrandsandcertainlicensedbrands.Bloomingdale’susesMMGfora smallportionofitsprivatelabelmerchandise.TheCompanybelievesthatitsprivatelabelmerchandise differentiatesitsmerchandiseassortmentsfromthoseofitscompetitors. MMGalsooffersitsservices,eitherdirectlyorindirectly,tounrelatedthirdparties.•Macy’sLogisticsandOperations,adivisionofawholly-ownedindirectsubsidiaryoftheCompany,provideswarehousingandmerchandisedistributionservicesfortheCompany’soperationsanddigitalcustomerfulfillment.Company’s Company's principalexecutiveofficeislocatedat151West34th 34th Street,NewYork,NewYork10001,telephonenumber:(212) 494-1621.SeasonalityTheretailbusinessisseasonalinnaturewithahighproportionofsalesandoperatingincomegeneratedinthemonths ofNovemberandDecember.Workingcapitalrequirementsfluctuateduringtheyear,increasinginmid-summerinanticipationofthefallmerchandisingseasonandincreasingsubstantiallypriortothemonths of November and DecemberwhentheCompany carriessignificantlyhigherinventorylevels.4PurchasingTheCompanypurchasesmerchandisefrommanysuppliers,noneofwhichaccountedformorethan5%ofthe Company’sCompany's purchasesduring 2021. 2023. TheCompanyhasnomateriallong-termpurchasecommitmentswithanyofits suppliers and believes that it is not dependent on any one supplier. The Company considers its relations with its suppliers to be good.3Private Label Brands and Related TrademarksThe principal private label brands offered by the Companyconsidersitsrelationswithitssupplierstobegood.PrivateLabelBrandsandRelatedTrademarksTheprincipalprivatelabelbrandscurrentlyofferedbytheCompany as of February 3, 2024 includeAlfani, And Now This, Aqua,BarIII,Belgique, Cerulean 6, CharterClub,ClubRoom,EpicThreads, Family PJ’s, PJ's, firstimpressions,GianiBernini,HolidayLane,HomeDesign,HotelCollection,HudsonPark,Ideology,I-N-C,jenni,JMCollection,KarenScott,lune+aster,M-61,MaisonJules,MarthaStewartCollection, Morgan Taylor, Oake, On 34th, Sky,Style&Co.,Sun+Stone,SuttonStudio,TassoElba,TheCellar,ToolsoftheTradeandWildPair.ThetrademarksassociatedwiththeCompany'sprivatelabelbrands,otherthanMarthaStewartCollection,areownedbytheCompany.TheMarthaStewartCollection isownedby a thirdparty,whichlicenses thetrademarkassociatedwiththebrandtoCompany pursuantbegan to an agreement. exit its Women's Alfani and Karen Scott brands during fiscal 2023.Theagreement for trademarks associated with the MarthaStewart Collection extendsthrough 2022.CompetitionTheretailindustryishighlycompetitive.TheCompany’s Company's operationscompetewithmanyretailformatsonthenationalandlocallevel,includingdepartmentstores,specialtystores,generalmerchandisestores,manufacturers'outlets and websites, off-priceanddiscountstores,onlineretailers andcatalogs,amongothers.TheCompanyseekstoattractcustomersbyofferingcompelling,high-qualityproducts,greatpricesandtrustedserviceacrossallchannels, including its digital platforms.Otherretailers maycompeteforcustomersonsomeorallofthesebases,oronotherbases,andmaybeperceivedbysomepotential customers as being better aligned with their particular preferences.Government RegulationWe are subject to extensive and varied laws and regulations in the jurisdictions in which we operate in connection with both our core business operations and our credit card and other ancillary operations, including those relating to anti-bribery, customs, child labor, truth-in-advertising, consumer protection, zoning, occupancy, anti‑corruption and trade, anti-money laundering, import and export compliance, antitrust, data privacy and data protection, employment, workplace safety, public health and safety, environmental compliance, intellectual property, transportation, and fire codes. Our policies mandate compliance with all applicable laws and regulations, and we operate our business in accordance with standards and procedures designed to comply with these laws and regulations. We believe that we are in compliance with such laws and regulations in all material respects and do not expect that continued compliance with such regulations will have a material effect upon capital expenditures, earnings, or our competitive position.Available Informationasbeingbetteralignedwiththeirparticularpreferences.AvailableInformation(the" (the ExchangeAct") Act) availablefreeofchargethroughitsinternetwebsiteat https://www.macysinc.comassoonasreasonablypracticableafteritelectronicallyfilessuchmaterialwith,orfurnishesitto,theSEC.TheSECalsomaintainsan internetsitethatcontainsreports,proxyandinformationstatements,andotherinformationregardingissuersthatfile electronicallywith In addition, theSEC.Inaddition, Company has made theCompanyhasmadethefollowingavailablefreeofchargethroughitswebsiteat https://www.macysinc.com:•ChartersoftheAuditCommittee,CompensationandManagementDevelopmentCommittee,Finance Committee,andNominatingandCorporateGovernanceCommittee,CorporateGovernancePrinciples,LeadIndependentDirectorPolicy,Non-EmployeeDirectorCodeofBusinessConductandEthics,CodeofConduct,StandardsforDirectorIndependence,RelatedPersonTransactionsPolicy,MethodtoFacilitateReceipt,RetentionandTreatmentofCommunications,andProxyAccess By-Laws.•Proxy Access By-Laws.Anyoftheseitemsarealsoavailableinprinttoanyshareholderwhorequeststhem.Requestsshouldbesenttothe CorporateSecretaryof Macy’s, Macy's, Inc.at151West34th 34th Street,NewYork,NewYork10001.5Human Capital ResourcesCulture & EngagementAt Macy’s, culture is howMacy's Inc., we strive to be the Company servespreferred employer across our brands through an unwavering passion and supports itscommitment to our customers, communities and employees (called colleagues). The Company’sCompany's workplace is rooted in equity and guided by its valuessocial purpose, called Mission Every One, to create a brighter future with bold representation for all.4The Company gathers colleague feedback at key times throughout the colleague lifecycle from onboarding to offboarding and provides regular venues for colleagues to ask questions and share their opinions, such as Ask Me Anything sessions, town halls and colleague resource groups. The Company formally solicits feedback from all colleagues twice a year through an enterprise-widecompany-wide Culture Pulse Survey. The results are shared across the organization to provide visibility to both managers (called people leaders) and colleagues, andto help create an opportunityopportunities for open and constructive discussions among teams. Diversity, Equity & Inclusion (DE&I)Macy’sThe Company's commitment to diversity, equity and inclusion is guided by its values and starts from within by working to build a workforce that represents the communities it serves atenhance diversity and inclusion across all levels of our organization to enable us to more closely and making structural changes to implement practices and processes designed to be equitableeffectively engage with all of our customers and cultivate a culture of belonging. The Company seeks to empower colleagues to harness and unleash the power of their individuality to help drive better business decisions for customers and shareholders.The Company actively promotes an inclusive and welcoming environment for all customers and is also focused on supporting and developing underrepresented suppliers; investing in economic and workforce development; contributing to organizations fighting for social justice; and awarding scholarships to cultivate future leaders.One of the Company’s measures to advance the diversity of its leadership is the MOSAIC program, a one-year professional development program with continued support available as participants progress through their careers, launched in 2019 for its top talent at the manager and director levels who self-identify as ethnically diverse. From 2020 to 2021, approximately 74% of program participants were promoted or moved into a new role, with approximately 18% promoted to senior director level. The Company achieved 27.5% ethnic diversity representation at the director level and above, with a goal to reach 28.3% in 2022 and 30% by 2025.Macy’s believes people leaders play an important role in driving performance and an inclusive culture. In 2020, the Company incorporated People Leader Commitments (which were launched in 2019) and DE&I into the performance review process. In 2021, the Company included standardized DE&I goals into annual reviews at the director level and above. Starting in 2022, the Company has included the ethnic representation goal at the director level and above as part of annual incentive goals for the Company.Company-sponsored, employee-ledcolleague-led resource groups (ERGs)(CRGs) provide an opportunity for colleagues to experience connection, achieve belonging and develop leadership skills. In 2023, the Company completed its first phase of the CRG refresh, which included further expansion of chapters resulting in 100% of Macy's and Bloomingdale's colleagues now having access to a CRG.Since 2015, the Company has achieved a score of 100 every year on the Human Rights Campaign Foundation's Corporate Equality Index, earning the designation as “Best Place to Work for LGBTQ+ Equality.” This index is the national benchmarking tool measuring corporate policies, practices and benefits pertinent to LGBTQ+ workplace equality. In 2023, the Company received the Equality 100 Award marking the ninth consecutive year that the Company has received a score of 100. Additionally, the Company broadened the Week of Understanding programming in 2023 to encompass two additional topics, Disability Inclusion and Religion, as part of the Company's efforts to foster a more inclusive culture. Other enterprise-wide events included our CEO-led "Can We Talk?" discussion series featuring external keynote speakers designed to further build community. In 2021, ERGs expanded beyond our corporate offices to all supply chain locations and 124 stores and continue to be a resource for attracting and retaining talent. We also launched the Interfaith ERG across Macy’s and Bloomingdales, based on colleague feedback that there is a need to incorporate dialogue and education about religion and non-religious beliefs in the workplace.Macy’scritical DE&I skills.The Company's DE&I focus areas extend beyond its colleagues and include community, customers, marketing and suppliers. We have achievedBelow are a scorefew additional highlights from the past year:•Hosted second Vendor Pitch Competition and awarded $250,000 in business grants to graduates of 100 every year since 2015 onThe Workshop at Macy's 2023 program.•Deployed $6.2 million in capital to historically underfunded businesses and businesses serving underserved communities through S.P.U.R. Pathways: Shared Purpose, Unlimited Reach to accelerate growth and create new jobs in these communities.•Expanded our portfolio of diverse suppliers, onboarding over 130 new diverse-owned businesses online and in-store.•Donated $1 million to advance social justice and racial equity causes; added three new partners, supporting the Human Rights Campaign Foundation’s Corporate Equity Index, earningHispanic/Latino, People with Disabilities and Environmental Justice communities for greater balance across diversity dimensions.•Continued to leverage best in class partners, such as Seven Elements Group and Publicis Once & For All Coalition, to advance the designation as “Best Place to Work for LGBTQ+ Equity.” This index is the nation’s foremost benchmarking surveycultural fluency of our marketing and report measuring corporate policies and practices related to LGBTQ+ workplace equality. In November 2021, Macy’s was recognized by the NBIC, a coalition of the nation’s leading business organizations representing diverse communities,media.•Recognized as one of the Top 50 Best-of-the-Best Corporations for Inclusion. For example, here areInclusion for the third consecutive year by the National Business Inclusion Consortium (NBIC), a few highlights fromcoalition of the past year:•nation's leading business organizations representing diverse communities.Two Macy’s colleagues continued their second year as fellows, solely dedicated to the work of CEO Action for Racial Equity Taskforce—the mission of the taskforce is to identify, develop and promote scalable and sustainable public policies and corporate engagement strategies that will address systemic racism, social justice and improve societal well-being.6•Added pronouns to colleague name badges and email signatures to foster a more inclusive environment for customers and colleagues.Advanced diverse representation in advertising to reflect customers and expanded media to reach more ethnically diverse audiences. Launched a new partnership with a strategic marketing and creative agency, JOY Collective, to integrate deeper cultural fluency across marketing activities including heritage and history month campaigns.•Celebrated a decade of The Workshop at Macy’s with expanded class size and month-long e-commerce activation.Macy’sMacy's, Inc. believes that learning goes hand in hand with career growth, personal satisfaction and outstanding results. The Company aspires to create a learning culture where colleagues actively learn,can build their skills, apply what they have learnedtheir learning to address business challenges and share their knowledge, including their mistakes,experiences, to help others grow. Learning is accessible through Ignite (powered by Degreed), the Company’sCompany's self-directed learning experience platform as well as through technology, social learning and meaningful experiences and exposures with colleagues. We have also partnered with Guild a leading education and upskilling platform,Education to provide “Fully Funded Education for Everyone,”eligible colleagues with a fully-funded education benefit, including over 50more than 100 programs that lead range from foundational learning–such as high school completion and English language–to college degrees.5The Company makes investments in its people leaders and future leaders. Macy’s and Bloomingdale’sMacy's Executive Development ProgramsProgram and Bloomingdale's Leadership Development Program offer immersive, hands-on learning experiences for recent college graduates from top universities across the U.S. to jump startjump-start a career in retail, with specialization in technology, digital, stores, merchandising, and supply chain. Macy’sMacy's and Bloomingdale’sBloomingdale's offer internships for college students and Bloomingdale’sBloomingdale's offers an early immersion program focused on providing experiential learning and career exposure to those who identify with underrepresented groups. Bluemercury’sfoster inclusivity. Bluemercury's Shooting Stars is a six-month mentorship program that empowers mentees to own their journey by creating a development plan, becoming an inclusive leader and leveraging resources to support their career aspirations. In 2019, Macy’s partnered with Parsons School2022, the Company launched a multi-year career development initiative. This initiative included the launch of Design to launch Macy’s Fashion Academy – a custom executive education program designedCareer Hub on the Company intranet to offer best-in-class development across all disciplinesuser-friendly tools to assist colleagues at any part of its merchant talent. Astheir career journey; a resultvirtual Career Expo that featured workshops, panel discussions, external speakers and functional showcases; and people leader support with learning plans focused on career coaching and development. In 2023, the Company expanded the Career Expo from two weeks to a three-month-long series of this partnership, we have been ablesmall-group interactive sessions, which enabled colleagues to offer our Merchants custom experiences alignedinteract directly with key pillarsexperts and leaders to learn about career resources and build skills. Over the course of our Polaris Strategy.People leaders participate annually in required leadership development training and have access to robust on-demand development resources. Professional colleagues participate in a 90-day onboarding experience with performance milestones, support resources and role-specific trainingData AnalyticsDuring 2021, Macy’s continued to make progress in embedding data and analytics in Human Capital strategies and program measurements. Taking advantage of cloud-based HR technology has enabled real-time access to information and driven more colleague and people leader self-service.
training.•Career & leadership development: Online learning platform enables the development of targeted learning driven by Company-desired skill sets and/or colleague-driven skill development •Culture: Through the analysis of culture surveys, the Company can gauge progress over time and identify areas where enhancements need to be introduced•Human resources: Leveraging technology to automate responses for common colleague questions related to pay and benefits•Talent recruitment and retention: Leveraging recruiting data from previous years enables the forecasting of talent needs and leads to more improved onboarding, leadership spans of control and marketing investments•Workplace structure: Through customer analysis, the Company has identified opportunities for sales growth, which in turn have led to the launch and build-out of specialized teams targeted on delivering these opportunities 7Macy’sMacy's, Inc. offers comprehensive benefits and an awards strategy that is designed to recognize performance and talent development. Eligible colleagues have varied medical plan options to meet individual needs. The Company provides paid time-off, parental leave and holiday pay, as well as a company 401(k) plan and match, dependent care flexible spending account and a colleague merchandise discount for eligible colleagues.The Company believes that pay equity is fundamental to its culture and DE&I strategy. Compensation is based on job, position, responsibilities, experience and performance with incentive opportunities that allow colleagues to share in the Company’sCompany's success.In 2021, the Company achieved greater than 99% pay equity across gender and race. In termsAs part of both base pay and total compensation, the Company expectsour commitment to pay femaletransparency, all colleagues at greater than 99% of what it pays malehave access to view their role's pay zone and salary range to ensure colleagues understand their earnings potential. In addition, pay ranges are viewable on all job postings nationwide. People leaders and it expects that minorities will be paid at greater than 99% of what it pays non-minorities in the U.S.In 2021, we continuedsalaried colleagues have access to on-demand Compensation Education webinars to learn how pay is determined and to deep dive into our path to clear and competitive compensation programs by making the following investments:
incentive programs.•Introduced long-term incentive opportunities for our director-level colleagues effective in 2022.•Provided our colleagues with access to view earned wages on a daily basis.•Committed to raising our hourly colleagues’ pay rate to $15/hour minimum nationwide in 2022.•Added a flexible paid holiday to support our colleagues’ well-being and provide further flexibility to take a day off on a holiday that is important to them.•Partnered with Guild to provide “Fully Funded Education for Everyone,” including over 50 programs that lead to college degrees. As of January 29, 2022, excluding seasonal employees, Macy’sFebruary 3, 2024 Macy's, Inc. had 88,857approximately 85,581 full-time and part-time employees.U.S. employees, on a combined basis. Macy's and Bloomingdale's workforce, on a combined basis, is comprised of approximately 65% ethnically diverse colleagues (with 30% at the Director+ levels) and 76% female colleagues. Because of the seasonal nature of the retail business, the number of employees peaks during the holiday season. Approximately 8% of employees are represented by unions.SustainabilityMacy’sEnvironmental, Social, and Governance (ESG)The Company's relationships with its customers, colleagues and the communities it serves drivesdrive a deep sense of stewardship in how the Company interacts with its stakeholders and underpins its commitment to promoting sustainability.stakeholders. The guiding principles of the Company’s sustainabilityCompany's ESG strategy are:•Managing the environmental impact of its businessPromoting positive social impact, andContinuing to ensure strong governance that holds Macy’s accountable.•implementing strong governance practices that hold Macy's, Inc. accountable.The Company proactively and continually engages with its stakeholders on sustainabilityESG issues that span the breadth of its operations. This includes transparency, product responsibility and supply chain and energy management. Macy’sMacy's, Inc. is guided in its actions and reporting by its stakeholders and by third-party frameworks, including Sustainability Accounting Standards Board’sBoard's multiline and specialty retailers and distributors standard and the Task Force on Climate-Related Financial Disclosures.The Company continues to advance its sustainabilityESG strategy as it responds to evolving stakeholder expectations. Certain highlights of recent sustainabilityESG accomplishments include earning a B score on its 20212023 CDP Climate Change Report covering fiscal year 2022, joining US Cotton Trust Protocol, partnering with World Wildlife Fund to publish Water Stewardship policy, publishing Animal Welfare Policy, Exotic Skins Policy, an updated Fur Policy, a Preferred Materials Policy, and launching a sustainable products retail sitelet and Oake, a sustainableHuman Rights Policy. We continued our investment in our female factory workers by rolling out 14 Worker Well Being programs in private brand textiles brand.6The Company’sCompany's management is responsible for the development and implementation of its sustainabilityESG strategies and programs. Ultimate oversight by the Company’sCompany's Board of Directors is included in its committee charters and practices. The Chief Operating Officer (COO) and Chief Financial Officer (CFO), along with the Disclosure Committee, engages with stakeholders on sustainability and climate-relatedESG-related issues (including climate) and provides feedback to management and the Board. The Chief Supply Chain OfficerSustainability Team, which sits within the COO and CFO's office, reports directly to the Chief Executive OfficerSenior Vice President of Private Brand Sourcing, Product Development & Production, and is responsible for the teams that manage sustainabilityESG initiatives and supply8TheManagement committees, including the Sustainability Executive Steering Committee, Disclosure Committee and Corporate Strategy Group, also approve the sustainabilityESG strategy and priorities, guide risk management and link to growth opportunities.Macy’s is committed to minimizing the environmental impacts across its operations and supply chain and seeks to responsibly manage the resources it consumes and the waste it produces across its stores and logistics network. The Environmental Services team is responsible for the development of the Company’sCompany's environmental programs for all facilities across the organization. These programs include policies and procedures designed to ensure compliance with federal, state and local environmental laws.InformationaboutourExecutiveOfficersThefollowingtablesetsforthcertaininformationasofMarch 24,2022 21, 2024 regardingtheExecutiveOfficersoftheCompany:Name Age AgeJeff GennetteTony Spring 59 60Chairmanand Chairman-Elect of the Board and Director50 48Executive Vice PresidentChief Operating Officer and Chief Financial OfficerElisa D. Garcia57 64Executive Vice President, Chief Legal Officer and Corporate Secretary48 46Executive Vice President and Chief Transformation and Human Resources Officer43 41ExecutiveOfficerBiographiesTony Spring was appointed Chief Executive Officer of the Company in February 2024 and is expected to succeed JeffGennettehasbeen as Chairman of the Board upon conclusion of the 2024 Annual Meeting. Prior thereto he served as President and ChiefExecutive Officer-Elect of the Company from 2023 to 2024, Executive Vice President of the Company from 2021 to 2023 and Chairman and Chief Executive Officerof Bloomingdale's from 2014 to 2023, President and Chief Operating Officer of Bloomingdale's from 2008 to 2014, Executive Vice President of Bloomingdale's from 2004 to 2008, Executive Vice President of Marketing at Bloomingdale's from 1998 to 2004 and held various other roles within theCompanysinceMarch2017andChairman Bloomingdale's organization from 1987 to 1998 where he assumed positions of increasing responsibility in theBoardsinceJanuary2018;priortheretohewas home furnishings area before being promoted to Senior Vice PresidentfromMarch2014toAugust2017,ChiefMerchandisingOfficerfromFebruary2009toMarch2014,ChairmanandChiefExecutiveOfficerofMacy’sWestinSanFranciscofromFebruary2008toFebruary2009andChairmanandChiefExecutiveOfficerofSeattle-basedMacy’sNorthwestfromFebruary2006throughFebruary2008.Adrian V. Mitchell served as Chief Operating Officer of the Company starting in March 2023 and has been Executive Vice President and Chief Financial Officer of the Company since November 2020; prior thereto he served as a Managing Director and Partner in the Digital BCG and Consumer Practices of Boston Consulting Group, a global management consulting firm, from July 2017 to October 2020, Chief Executive Officer of Arhaus LLC, a retail chain that designs and sells home furnishings, from January 2016 to March 2017, in various executive positions at Crate and Barrel Holdings, Inc. from October 2010 to October 2015 including interim CEO, Chief Operating & Chief Financial Officer and Chief Financial Officer, and in management positions at Target Corporation from March 2007 to October 2010 including Director of Strategy & Interactive Design for target.com and Director of Innovation & Productivity leading enterprise-widecompany-wide projects for Target Corporation.ElisaD.GarciaCorporation.Tracy M. Preston hasbeen Chief Legal Officer and Corporate Secretary of the Company since January 2024; prior thereto she served as Chief Compliance Officer, Chief Legal Officer and Corporate Secretary of HanesBrands Inc., an apparel company, from 2021 to 2023, Chief Compliance Officer, Chief Legal Officer and Corporate Secretary of Neiman Marcus Group, Inc., a retail company, from 2013 to 2021, ExecutiveVicePresident, General Counsel and Secretary of Levi Strauss & Co. from 2002 to 2013, Partner at Orrick, Herrington & Sutcliffe LLP, a law firm, from 1997 to 2002, and held various positions at several law firms from 1991 to 1997.Danielle L. Kirgan has been Executive Vice President and ChiefLegalOfficerandSecretaryoftheCompanysinceSeptember2016;priortheretosheservedasChiefLegalOfficerofOfficeDepot,Inc.fromDecember2013toSeptember2016,ExecutiveVicePresidentandSecretaryfromJuly2007toSeptember2016andGeneralCounselfromJuly2007toDecember2013.DanielleL.KirganhasbeenExecutiveVicePresidentandChiefTransformation and Human Resources OfficeroftheCompanysinceFebruary2020andChiefHumanResourcesOfficersinceOctober2017;priortheretosheservedasSeniorVicePresident,PeopleatAmericanAirlinesGroup,Inc., an airline holding company,fromOctober2016toOctober2017,ChiefHumanResourcesOfficeratDardenRestaurants,Inc.fromJanuary2015toOctober2016andSeniorVicePresidentfromMay2010,VicePresident,GlobalHumanResourcesatACIWorldwide,Inc. in 2009, and Vice President, Human Resources at Conagra Foods, Inc. fromJanuary2009 2004 toDecember2009,andVicePresident,HumanResourcesatConagraFoods,Inc.from2004to2008.Paul Griscom has been Senior Vice President and Controller of the Company since August 2020; prior thereto he served as Vice President and interim Principal Accounting Officer from June to Augustin 2020, Vice President, Financial Reporting and Accounting Services from May 2019 to August 2020, Vice President, Financial Reporting from June 2017 to April 2019, Director of Financial Reporting from July 2016 to May 2017, Director, Training & Products, GAAP Dynamics from January 2012 to July 2016 and held various positions at KPMG LLP from November 2000 to January 2012.97Item 1A.Risk Factors.Item 1A. Risk Factors.In evaluating the Company, the risks described below and the matters described under “Forward-Looking Statements” should be considered carefully. Such risks and matters are numerous and diverse, may be experienced continuously or intermittently, and may vary in intensity and effect. Although the risks are organized by heading, and each risk is described separately, many of the risks are interrelated. Any of such risks and matters, individually or in combination, could have a material adverse effect on our business, financial condition, results of operations and cash flows, as well as on the attractiveness and value of an investment in the Company’sCompany's securities. You should not interpret the disclosure of any risk factor to imply that the risk has not already materialized. While we believe we have identified and discussed below the key risk factors affecting our business, there may be additional risks and uncertainties that are not presently known or that are not currently believed to be significant that may adversely affect our business, financial condition, results of operations or cash flows in the future.COVID-19 Pandemic RisksThe COVID-19 pandemic has had and could continue to have a significant negative impact on the Company’s business, financial condition, results of operations and cash flows.Since the first quarter of fiscal 2020, the COVID-19 pandemic has had a significant impact on the retail industry, including our business. Although the Company has experienced a strong recovery in operating results during fiscal 2021 as compared to fiscal 2020, the Company continues to monitor the impacts of COVID-19 on the macro economy as well as on the Company’s and its vendor partners’ operations. The full impact of the COVID-19 pandemic is uncertain at this time, but we expect that it could continue to have adverse impacts on the Company’s business, financial condition and results of operations, including, but not limited to:•On March 18, 2020, the Company temporarily closed all of its stores and subsequently furloughed the majority of its workforce. As states and localities began to ease the regulations imposed to slow the spread of COVID-19, the Company began to reopen its stores and by the end of the second quarter of 2020, substantially all of the Company’s stores had reopened. The store closures resulted in a temporary material decline in revenue and operating cash flow. The Company has seen significant improvement in its operations in 2021. However, pockets of resurgence and variant strains of COVID-19 continue to emerge in parts of the world and the U.S., which could negatively impact future store performance if consumer shopping behaviors are impacted, the health of our customers and colleagues is compromised or government officials reinstate restrictions that impact our operations. As a result, there can be no assurance as to whether store closures may again be required.•As a result of the COVID-19 pandemic, and particularly since the reopening of stores in 2020, the Company implemented safety measures and health and wellness precautions across its stores and facilities to mitigate risk to its customers and Company colleagues. These efforts to protect the health and well-being of customers and Company colleagues have resulted in, and will continue to result in, additional selling, general and administrative (“SG&A”) expenses. Further efforts to mitigate the impact of the COVID-19 pandemic, such as governmental requirements for employers to implement workforce vaccination-or-testing mandates, could require additional management time and focus and, possibly, significant SG&A expenses.•During fiscal 2020, the COVID-19 pandemic had a significant impact on economic conditions and discretionary consumer spending and consumer shopping behaviors in North America. In response to the disruption caused by the COVID-19 pandemic, the Company reconfigured its cost base through colleague reductions, reduced discretionary spending and made investments to adapt to the changes in consumer behavior. An increased percentage of sales are now originating through digital channels. If digital sales penetration continues to increase and we are unable to offset the increased costs of fulfilling digital orders with margin expansion, delivery expense savings or other efficiencies, our results of operations could be adversely impacted.•The Company has experienced and may continue to experience delays in inventory receipts and temporary or long-term disruptions in its supply chain, as the outbreak has impacted manufacturing and distribution throughout the world. The receipt of products or raw material sourced from impacted areas has been and may continue to be slowed or disrupted, which could impact the Company’s private brands or the fulfillment of merchandise orders from the Company’s brand partners. Furthermore, transportation delays, worker shortages and cost increases have impacted and may continue to impact the Company, its suppliers’ operations and its customers.10•The Company’s liquidity was negatively impacted by closures of its stores in fiscal 2020. In response, the Company took several actions to increase liquidity and financial flexibility, including entering into a new $2.9 billion asset-based credit facility and issuing $1.3 billion in aggregate principal amount of 8.375% senior secured notes due 2025 (the “2025 Notes”). Although the Company redeemed the entire outstanding $1.3 billion aggregate principal amount of the 2025 Notes in 2021, had no borrowings outstanding under the asset-based credit facility at the end of fiscal 2021, and repaid $280 million of debt prior to maturity in fiscal 2022, further resurgences of COVID-19 in the future may require the Company to incur additional debt to improve its cash position.The duration and extent of the impact from the COVID-19 pandemic depends on future developments that cannot be accurately predicted at this time, such as the severity and transmission rate of the virus, the emergence and spread of variants, infection rates in areas where the Company operates, the extent and effectiveness of containment actions, including the continued availability and effectiveness of vaccines in the markets where the Company operates, and the impact of these and other factors on the Company’s employees, customers, suppliers, distributors, and manufacturers. As such, the Company will continue to assess the highly uncertain financial impacts of the COVID-19 pandemic. Further disruption of the global economy and related impacts on the Company’s business may lead to triggering events that may indicate that the carrying value of certain assets, including inventories, long-lived assets, intangibles, and goodwill, may not be recoverable.The impact of COVID-19 may also exacerbate other risks included in in this section, any of which could be material. The situation is continually changing, and future impacts may materialize that are not yet known.Our strategic plans and initiatives may not be successful, which could negatively affect our profitability and growth.In 2020,2024 we announced the PolarisA Bold New Chapter, a strategy a multi-year plan designed to stabilize profitability and positionenhance the Company forcustomer experience, deliver sustainable, profitable growth. Overgrowth and unlock shareholder value over the coursenext three years. The strategy builds on the five growth factors and focuses on three strategic priorities:•Strengthen Macy's through revitalizing merchandise assortment, modernizing the shopping environment and closing approximately 150 underperforming stores and prioritizing investment in approximately 350 go-forward stores and continued expansion of small format stores;•Accelerate luxury growth by expanding Bloomingdale's and Bluemercury within the COVID-19 pandemic, we have refinedMacy's, Inc. nameplate portfolio; and•Simplify and modernize end-to-end operations through rationalizing and monetizing the components of the Polaris strategy to focus where we believe we can create differentiation and drive competitive advantage, including a focus on winning with fashion and style, delivering clear value, excelling in digital shopping, enhancing store experience, modernizing supply chain asset portfolio, streamlining fulfillment, improving inventory planning and enabling transformation. Our digitally-led omni-channel strategy is committed to creatingallocation, and delivering a seamless integration between physical stores and digital shopping. modern, scalable technology platform.We plan to continue our focusmake value-enhancing investments to support these initiatives primarily focused on strengthening our omni-channel capabilities with investments in digital shopping experiences,and technology, data and analytics, technology infrastructuresupply chain modernization and more efficient fulfillmentomni-channel capabilities. These initiatives have required and will continue to require our management, colleagues, and contractors to make transformational changes in our business operations and to improve productivity. These initiativesproductivity and profitability, and are also subject to the ability to attract and retain skilled personnel to support the initiatives. We face challenges in executing A Bold New Chapter strategy and initiatives in the current environment of heightened inflation, increased interest rates, economic uncertainty, geopolitical disruption and other macroeconomic conditions that may impact discretionary spending. Our ability to achieve sustainable, profitable growth is subject to the successful implementation of our strategic plans including the Polaris strategy, and realization of anticipated benefits and savings. If we are unable to successfully execute our strategic plans and initiatives to achieve the intended results or these investments or initiatives do not perform as expected or create implementation or operational challenges, our profitability and growth could suffer.We may not timely identify or effectively respond to consumer needs, expectations, or trends, which could adversely affect our relationship with customers, the demand for our products and services, and our market share.The success of our business depends in part on our ability to identify and respond to evolving trends in demographics, shifts in consumer preferences, expectations and needs, unexpected weather conditions, public health issues or natural disasters, while also managing appropriate inventory levels in our stores and distribution or fulfillment centers and maintaining an excellent customer experience. It is difficult to successfully predict the products and services our customers will demand. As customers expect a more personalized experience, our ability to collect, use and protect relevant customer data is important to our ability to effectively meet their expectations, but is subject to the impact of legislation or regulations governing data privacy, security and other external factors. Customer preferences and expectations related to sustainability of products and operations are also increasing. If we do not successfully differentiate the shopping experience to meet the individual needs and expectations of or within a customer group, we may lose market share with respect to those customers.Our sales and operating results depend on our ability to anticipate and respond to consumer preferences and manage our inventory, merchandise selection and merchandise selection.The fashion and retail industries are subject to sudden shifts in consumer trends and consumer spending. Our sales and operating results depend in part on our ability to predict or respond to changes in fashion trends and consumer preferences in a timely manner. We develop new retail concepts and continuously adjust ourprotect against inventory position in certain major and private-label brands and product categories in an effort to attract and retain customers. Any sustained failure to anticipate, identify and respond to emerging trends in lifestyle and consumer preferences could negatively affect our business and results of operations.Our profitability depends on our ability to manage inventory levels and merchandise selection. Overestimating customer demand for merchandise will likelycan result in the need to record unplanned and incremental inventory markdowns and sell excess inventory at clearance prices, which would negatively impact our gross margins and operating results. Underestimating customer demand for merchandise can lead to insufficient inventory shortages,to meet demands, missed sales opportunities and negative customer experiences.118The Company faces significant competition and challenges as consumers continue to migrate to onlinedigital shopping channels and depends on its ability to differentiate itself in retail'sretail's ever-changing environment.We conduct our retail merchandising business under highly competitive conditions. Although Macy's, Inc. is one of the nation’snation's largest retailers, we have numerous and varied competitors at the national and local levels and digital competitors at the global level, including department stores, specialty stores, general merchandise stores, manufacturers’manufacturers' outlets and websites, off-price and discount stores, online retailers and catalogs, among others. Competition is characterized by many factors, including assortment, advertising, price, quality, service, location, reputation and credit availability. Any failure by us to compete effectively could negatively affect our business and results of operations.As consumers continue to migrate online, a trend that has accelerated with the COVID-19 pandemic,to digital shopping channels, we face pressures to not only compete from a price perspective with our competitors, some of whom sell the same products, but also to differentiate Macy's, Inc’s.Inc.'s merchandise offerings, services and shopping experiences to stay relevant as a modern department store in retail's ever-changing environment. Macy's launched On 34th and State of Day, new private brands, in 2023 and February 2024, respectively, and expects to refresh or replace all existing brands in its private brands portfolio through 2025. Macy's digital marketplace offers over 2,300 brands from third party sellers and the Company launched a Bloomingdale's marketplace in 2023 to introduce customers to new merchandise options. We continue to significantly invest in our omnichannelomni-channel capabilities, seeking to improve the profitability of our digital business through delivery expense reduction, gross margin expansion and other initiatives to support digital sales growth. We also are seekingcontinue to seek to improve the delivery experience of our customers with strategic investments to fulfill digital sales demand and elevated delivery speed expectations. Insufficient, untimely or misguided investments in these areas could significantly impact our profitability and growth.In addition, a continuedsignificant decline of customer store traffic andor migration of sales from brick-and-mortar stores to digital platforms could lead to additional store closures, restructuring and other costs that could adversely impact our results of operations and cash flows.Our ability to grow depends in part on our stores remaining relevant and attractive to customers.We have invested in facilities and fixtures upgrades, merchandise assortment and customer service in selected stores to improve customer retention rates and overall customer satisfaction. We have also opened new off-mall smaller store formats – Market by Macy’sMacy's small format and Bloomie’sBloomie's – in selected markets to promoteact as fill-in locations in existing markets to gain foot traffic and a new customer acquisition, testbase, replacement expansion orlocations in markets where an underperforming full-line location closure would result in a market entry locations,exit, and support our omni-market capabilities.to enter new markets. In 2022, we introduced permanent Toys “R” Us shops within all Macy's locations. While these store investments, and off-mall store formats, and in-store shops are intended to improve the customer store experience and drive traffic, realization of these benefits may not occur. Because we rely on the ability of our physical retail locations to attract customers, provide full or curated merchandise selections, drive traffic to digital channels and assist in fulfillment, returns and other omni-channel functions, providing a desirable and sought-out shopping experience is important to our financial success. Changes in consumer shopping habits, an over-malled/over-retailed environment,a decline in mall shopping environments, financial difficulties at other anchor tenants, significant mall vacancy issues, mall violence and new on- and off-mall developments could each adversely impact the traffic at current retail locations and lead to a decline in our financial condition or performance.We may not be able to successfully execute our real estate strategy.We may continue to explore opportunities to monetize our real estate portfolio, including sales of stores as well as non-store real estate, such as warehouses, outparcels and parking garages. We also continue to evaluate our real estate portfolio to identify opportunities where the redevelopment value of our real estate exceeds the value of non-strategic operating locations. This strategy is multi-pronged and may include transactions, strategic alliances or other arrangements with mall developers or other unrelated third-parties. Where feasible, we may subdivide an existing parcel, continue to operate a store and redevelop any excess parcel for mixed-use, or close the store and redevelop an entire parcel into a mixed-use development, in either event selling the parcel once the site development plan is approved by governmental authorities. Due to the cyclical nature of real estate markets and the risks of real estate development, the performance of our real estate strategy is inherently volatile and could have a significant impact on our results of operations or financial condition.Our revenues and cash requirements are affected by the seasonal nature of our business.Our business is seasonal, with a high proportion of revenues and operating cash flows generated during the second half of the year, which includes the fall and the months of November and December. A disproportionate amount of our revenues is realized in the fourth quarter due to this seasonality. Should sales during this period fall below our expectations, a disproportionately negative impact on our annual results of operations could occur.We generally incur significant additional expenses in the period leading up to the months of November and December in anticipation of higher sales volume in those periods, including costs for additional inventory, advertising and employees. If we are not successful in executing our sales strategy during this period, we may have to sell the inventory at significantly reduced prices or may not be able to sell the inventory at all, which could have a material adverse effect on our results of operations and cash flows.129We depend on our ability to attract, train, develop and retain quality colleagues.Our business is dependent upon attracting, training, developing and retaining quality employees at all levels of the organization, and management personnel to develop and effectively execute successful business strategies. Macy's, Inc. has a large number of employees, many of whom are in entry level or part-time positions with historically high rates of turnover. Our ability to meet labor needs while controlling costs associated with hiring and training new employees is subject to external factors such as unemployment levels, prevailing wage rates, minimum wage legislation and changing demographics. In recent years, low unemployment, labor shortages, intense competition for talent and a competitive wage environment have impacted our ability to attract, recruit and retain talent. In addition, the continued uncertainties surrounding the COVID-19 pandemic, including changing national and local regulations related to protective measures to mitigate the spread of the virus, couldcause us to incur additional unexpected labor costs and other expenses and impact our ability to attract, recruit or retain employees needed for our operations.Increases in labor costs and the cost of employee benefits could impact our financial results and cash flow.Minimum wage increases by states and wage and benefit increases to attract and retain workers in a tight labor market have increased labor costs in the retail sector. These increased costs pressure our margins and could have a negative impact on our financial results.Our expenses relating to employee health benefits are significant. Recent medical plan cost increases have been driven by pandemic-related business impacts, increasesa rise in participationhigh-cost claimants, high-cost conditions, high utilization of outpatient facilities, physicians and claims under continued health insurance coverage after leaving employment,in-hospital stays, and pharmacy claims increases.demographic shifts to an older enrollment population. Unfavorable changes in the cost of employee health benefits could negatively affect our financial results and cash flow. Healthcare costs have risen significantly in recent years, and legislative and private sector initiatives regarding healthcare reform have resulted and could continue to result in significant changes to the U.S. healthcare system. Due to uncertainty regarding legislative or regulatory changes, we are not able to fully determine the impact that future healthcare reform could have on our company-sponsored medical plans.If cash flowsrevenue from our private label and co-branded credit cards decrease,decline, our financial and operational results may be negatively impacted.In 2005, in connection with the sale of most of the Company's credit card accounts and related receivable balances to Citibank, N.A. (“Citibank”)(Citibank), the Company and Citibank entered into a long-term marketing and servicing alliance pursuant to the terms of a Credit Card Program Agreement ("Credit(Credit Card Program")Program). Subsequent to this initial arrangement and associated amendments, on December 13, 2021, the Company entered into the sixth amendment to the amended and restated Credit Card Program with Citibank (the “Program Agreement”)Program Agreement), pursuant to which Citibank issues, maintains and services Macy’sMacy's and Bloomingdale’sBloomingdale's private label and co-branded credit cards. Under the Program Agreement, which extends until March 31, 2030, Citibank owns the credit card receivables generated from sales through the credit cards and Macy’sMacy's receives fees and shares in profits based on a tiered return on the receivables portfolio net of program expenses. Credit card revenues, net were $832$619 million, or approximately 3.4%2.7% of net sales, for 2021.2023. Deterioration in economic conditions could adversely affect the volume of new credit accounts, the amount of credit card program balances and the ability of credit card holders to pay their balances. These conditions could result in the Company receiving lower payments under the credit card program.In addition, recent shifts from sales through our proprietary credit cards to debit products and alternative buy-now-pay-later payment methods may result in increased costs and could have a negative impact to credit card revenues due to potentially reduced credit card receivable balances.Credit card operations are subject to many federal and state laws that may impose certain requirements and limitations on credit card providers. Citibank and our subsidiary bank, FDS Bank, may be required to comply with regulations that may negatively impact the operation of our proprietary credit card. This negative impact may affect our revenue streams derived from the credit cards receivables portfolio and our financial results.In March 2024, the Consumer Financial Protection Bureau finalized a rule to amend Regulation Z to lower the safe harbor dollar amount credit card companies can charge for late fees from up to $41 to $8 for a missed payment. A decrease in late fees assessed would reduce credit card revenue. The Company is closely monitoring developments on this matter.Our defined benefit plan funding requirements or plan settlement expense could impact our financial results and cash flow.Significant changes in interest rates, decreases in the fair value of plan assets and timing and amount of benefit payments could affect the funded status of our plans and could increase future funding requirements of the plans. A significant increase in future funding requirements could have a negative impact on our cash flows, financial condition or results of operations.13These plans allow eligible retiring employees to receive lump sum distributions of benefits earned. Under applicable accounting rules, if annual lump sum distributions exceed an actuarially determined threshold of the total of the annual service and interest costs, we would be required to recognize in the current period of operations a settlement expense of a portion of the unrecognized actuarial loss, which could have a negative impact on our results of operations.10If our Company’sCompany's reputation and brand image are not maintained at a high level, our operations and financial results may suffer.We believe our reputation and brand image are partially based on the perception that we act equitably and honestly in dealing with our customers, employees, business partners and shareholders. Our reputation and brand image may be deteriorated by any incident that erodes the trust or confidence of our customers or the general public, particularly if the incident results in significant adverse publicity or governmental inquiry. Information about us, whether or not true, may be instantly posted on social media platforms at any time, which could adversely impact our reputation or brand image. The harm could be immediate without affording us an opportunity for redress or correction. Other brand risks include an active shooter incident at a location or injury or death at a parade or other branded event. If our reputation or brand image is damaged, our customers may refuse to continue shopping with us, potential employees may be unwilling to work for us, business partners may be discouraged from seeking future business dealings with us and, as a result, our business and results of operations may suffer.If we are unable to protect our intellectual property, our brands and business could be damaged.We believe that our copyrights, trademarks, trade dress, trade secrets and similar intellectual property are important assets and key elements of our strategy, including those related to our private brand merchandise. We rely on copyright and trademark law, trade secret protection and confidentiality agreements with our employees, consultants, vendors and others to protect our proprietary rights. If the steps we take to protect our proprietary rights are inadequate, or if we are unable to protect or preserve the value of our copyrights, trademarks, trade secrets and other proprietary rights for any reason, our merchandise brands and business could be negatively affected.Infrastructure RisksUnforeseen disruptions in our distribution and fulfillment centers could have an adverse impact on our business and operations.Our business depends on the orderly receipt and distribution of merchandise and effective management of our distribution and fulfillment centers. Unforeseen disruptions in operations due to fire, severe weather conditions (including(including those that may be caused by climate change), natural disasters, health pandemics or other catastrophic events, labor disagreements, or other shipping problems may result in the loss or unavailability of inventory and/or delays in the delivery of merchandise to our stores, fulfillment centers and customers.A material disruption in ourFailure of a key information technology systemssystem or process could adversely affect our business or results of operations.We rely extensively on our information technology systems and related personnel to collect, analyze, process, store, manage, transmit and protect transactions summarize results and managedata. Some of these systems are managed or provided by third-party service providers, including certain cloud platform providers. In managing our business. Ourbusiness, we also rely heavily on the integrity and security of, and consistent access to, this operational and financial data for information such as sales, customer data, employee data, demand forecasting, merchandise ordering, inventory replenishment, supply chain management, payment processing, order fulfillment, customer service, and post-purchase matters. For these information technology systems, applications and processes to operate effectively, we or our service providers must maintain and update them. Delays in the maintenance, updates, upgrading or patching of these systems, applications or processes could impair, and on occasion have impaired, their effectiveness or expose us to security risks.Our systems and the third-party systems with which we interact are subject to, and on occasion have experienced, damage or interruption from a number of causes, including power and other critical infrastructure outages, computer and telecommunications failures, computer viruses, cyber-attacksecurity breaches, internal or other security breaches,external data theft or misuse, cyberattacks, responsive containment measures by us that may involve voluntarily taking systems off line, natural disasters and catastrophic events such as fires, floods, earthquakes, tornadoes, hurricanes or other extreme weather events, public health concerns such as pandemics, military conflicts, acts of war, terrorism or terrorism,civil unrest, other systems outages, inadequate or ineffective redundancy, and design or usage errors or malfeasance by our employees. Ifemployees, contractors or third-party service providers. Although we and our third-party service providers seek to maintain our respective systems effectively and to successfully address the risk of compromise of the integrity, security and consistent operations of these systems, these efforts are not always successful. As a result, we or our service providers could experience errors, interruptions, delays or cessations of service in key portions of our information technology systems are materially damagedinfrastructure, which could significantly disrupt our operations or cease to function properly, including a material disruption inimpair data security, impact our ability to authorizeoperate or access communications, financial or banking systems, be costly, time consuming and process transactions atresource-intensive to remedy and adversely impact our storesreputation and relationship with customers, suppliers, shareholders or on our online systems, we may haveregulators.We are making, and expect to continue to make, a significant investment to fix or replace them, and we may suffer loss of critical data and interruptions or delays in our operations. Any material interruptionsubstantial investments in our information technology systems, infrastructure and personnel, in some cases with the assistance of strategic partners and other third-party service providers. These investments involve replacing existing systems, some of which are older, legacy systems, outsourcing certain technology and business processes to third-party service providers, including the adoption of Generative AI in certain processes, making changes to existing systems including the migration of applications to the cloud, maintaining or enhancing legacy systems, or designing or acquiring new systems. These efforts can result in significant potential risks, including failure of the systems to operate as designed, potential loss or corruption of data, changes in security processes and internal controls, cost overruns, implementation delays or errors and disruption of operations.11Disruptions in our customer-facing technology systems could impair our digital retail strategy and give rise to negative customer experiences.Through our information technology systems, we are able to provide an improved overall shopping experience that empowers our customers to shop and interact with us from a variety of electronic devices and digital platforms. We use our digital platforms as sales channels for our products and services, as methods of providing inspiration and advertising through Macy's Media Network, and as sources of product and other relevant information to our customers to help drive sales. We also have multiple online communities, digital platforms and knowledge centers that allow us to inform, assist and interact with our customers. The retail industry is continually evolving and expanding, with a significant increase in sales initiated online and via mobile applications. We must effectively respond to new developments and changing customer preferences with respect to a digital and interconnected experience. We continually seek to enhance our online and digital properties to provide an attractive, user-friendly interface for our customers. Disruptions, delays, failures or other performance issues with these customer-facing technology systems, or a failure of these systems to meet our or our customers' expectations, could impair the benefits they provide to our business and negatively affect our businessrelationship with our customers and, as a result, our financial performance and results of operations.If our technology-based e-commerce systems do not function properly, our operating results could be negatively affected.Customers are increasingly shopping online. We strive to anticipate and meet our customers’ changing expectations and are focused on building a seamless shopping experience across our omnichannel business. Any failure to provide user-friendly, secure e-commerce platforms that offer merchandise, delivery options and shopping experiences that resonate with customers could place us at a competitive disadvantage, result in the loss of online and other sales, harm our reputation with customers and have a material adverse impact on the growth of our business and our operating results.14Information Security, Cybersecurity, Privacy and Data Management RisksA breach of our information technology systems could adversely affect our reputation, business partner and customer relationships and operations, and result in highhigher costs.Through our sales, marketing activities, and use of third-party information, we collect and store certain non-public personal information that customers provide to purchase products or services, enroll in promotional programs, register on websites, or otherwise communicate to us. This may include phone numbers, driver license numbers, contact preferences, personal information stored on electronic devices, and payment information, including credit and debit card data. We gather and retain information about employees in the normal course of business. We may share information about such personssensitive Company data with vendors that assist with certain aspects of our business.business, such as social media and data analytics firms. In addition, our onlinedigital operations depend upon the transmission of confidential information over the Internet,internet, such as information permitting cashless payments.We employ safeguards for the protection of this information and have made significant investments to secure access to our information technology network, the importance of which has increased due to many of our colleagues working remotely as a result of the COVID-19 pandemic.remotely. For instance, we have implemented authentication protocols, installed firewalls and anti-virus/anti-malware software, established data security breach preparedness and response plans,, and conduct continuous risk assessments,. and mitigate software vulnerability with security patches. We also employ encryption and other methods to protect our data, promote security awareness with our employees and work with business partners in an effort to create secure and compliant systems.Protections we have in place to safeguard this information may be compromised as a result of third-party security breaches, theft, cyberattacks, including the use of malicious codes, worms, phishing, spyware, denial of service attacks and ransomware errors by employees or employees of third-party vendors, or contractors, misappropriation of data by employees, vendors or unaffiliated third-parties, or other irregularities that may result in persons obtaining unauthorized access to companyCompany data.Retail data frequently targeted by cybercriminals includes consumer credit card data, personally identifiable information, including social security numbers, and health care information. For retailers, point of sale and e-commerce websites are often attacked through compromised credentials, including those obtained through phishing, vishing and credential stuffing. Other methods of attack include advanced malware, the exploitation of software and operating vulnerabilities, and physical device tampering/skimming at card reader units. We believe these attack methods will continue to evolve. In addition, the risk of cyber-based attacks is heightened with many of our employees working and accessing our technology infrastructure remotely as a result of the COVID-19 pandemic.Cyber threats are increasing in scope, sophistication and frequency and bad actors are exploiting vulnerabilities to gain access to networks for the purpose of implementing ransomware, which is used to encrypt and steal data both from main and backup systems and causes public facingpublic-facing business interruptions. Our ability to react, mitigate and restore services from an interruption of our systems and processes is key to avoiding adverse financial impacts resulting from loss of sales, services and the cost of paying a ransom.12Remote work due to the COVID-19 pandemic has also created additional challenges to our ability to protect remote workers, corporate networks and cloud environments. We are identifying, tracking and mitigating advanced phishing, malware and attempted credential compromises daily. These attacks are typically occurring on home networks and migrate to the corporate network. However, despite instituting controls for the protection of information, the techniques used to obtain unauthorized access, disable or degrade service change frequently and our systems and networks may nevertheless remain vulnerable to threats and attacks. To date, no cybersecurity incident or attack has had a material impact on our business or results of operations. Unauthorized parties may attempt to gain access to our systems or facilities, or those of third parties with whom we do business, through fraud, trickery, or other forms of deception to employees, contractors, vendors and temporary staff. During the normal course of business, we have experienced and expect to continue to experience attempts to compromise our information systems. We may be unable to protect the integrity of our systems or company data. An alleged or actual unauthorized access or unauthorized disclosure of non-public personal information couldcould::•materially damage our reputation and brand, negatively affect customer satisfaction and loyalty, expose us to individual claims or consumer class actions, administrative, civil or criminal investigations or actions, and infringe on proprietary information; andmaterially damage our reputation and brand, negatively affect customer satisfaction and loyalty, expose us to individual claims or consumer class actions, administrative, civil or criminal investigations or actions, and infringe on proprietary information; and15•cause us to incur substantial costs, including costs associated with remediation of information technology systems, customer protection costs and incentive payments for the maintenance of business relationships, litigation costs, lost revenues resulting from negative changes in consumer shopping patterns, unauthorized use of proprietary information or the failure to retain or attract customers following an attack. While we maintain insurance coverage that may, subject to policy terms and conditions, cover certain aspects of cyber risks, such insurance coverage may be unavailable or insufficient to cover all losses or all types of claims that may arise in the continually evolving area of cyber risk.Our private brand products subject us to certain increased risks, including regulatory, product liability, intellectual property, supplier relations and reputational risks.As we expand our private brand offerings, we may become subject to increased risks due to our greater role in the design, manufacture, marketing and sale of those products. Risks include greater responsibility to administer and comply with applicable regulatory requirements, increased potential product liability and recall exposure, and increased potential reputational risks related to the responsible sourcing of those products. To effectively execute on our private brand strategy, we must also be able to successfully protect our proprietary rights and navigate and avoid claims related to the proprietary rights of third parties. An increase in sales of our private brand products may adversely affect sales of our vendors' products and, in turn, our relationships with certain of our vendors. Any failure to appropriately address these risks could damage our reputation and have an adverse effect on our business and results of operations.We depend on vendors and other sources of merchandise, goods and services outside the U.S. Our business has been and could in the future continue to be affected by disruptions in, or other legal, regulatory, political, economic or public health issues associated with, our supply network.We depend on vendors for timely and efficient access to products we sell. We source the majority of our merchandise from manufacturers located outside the U.S., primarily Asia. In the normal course of business, we provide credit enhancement to our vendors to support accounts receivable factoring and financing with third parties. Current economic conditions may adversely impact our vendors and they may be unable to access financing or become insolvent and unable to supply us with products, or we may be required to increase cash collateral levels or provide guarantees to support our vendors’vendors' financing arrangements. Any major changes in tax policy, such as the disallowance of tax deductions for imported merchandise could have a material adverse effect on our business, results of operations and liquidity.In recent months, weliquidity.We have experienced delays in merchandise inventory receipts and product delivery due to a continuing global shortage of vessels and air freight, port congestion, a global worker shortage impacting shipping and ports, truck driver shortages, rail congestion at major freight hubs and increasingincreased demand for consumer goods. Although these delays have not materially impacted our operations to date, they could potentially have a material adverse impact on future product availability, product mix and sales if the delays do not improve.escalate. We arehave also experiencingexperienced increases in shipping rates from Trans-Pacific ocean carriers due to increases in spot market rates and to shortage of shipping capacity from China and other parts of Asia and increases in trucking costs due to truck driver shortages and fuel costs.The procurement of all our goods and services is subject to the effects of price increases, which we may or may not be able to pass through to our customers. In addition, ourOur procurement of goods and services from outside the U.S. is subject to risks associated with political or financial instability, trade restrictions, tariffs, currency exchange rates, transport capacity and costs, health pandemics, armed conflicts and other factors relating to foreign trade. All of these factors may affect our ability to access suitable merchandise on acceptable terms, are beyond our control and could negatively affect our business and results of operationsoperations.13We source a significant amount of our private label products from factories in China and, liquidity.In recent years, the U.S. has been engaged in extended trade negotiations with China, which has resulted in the implementation of tariffs on a significant number of products manufactured in China and imported into the U.S. While recent tariffs and modifications to trade agreements have not resulted in a material impact on our business, results of operations, and liquidity to date, any additional actions, if ultimately enacted, could negatively impact our ability and the ability of our third-party vendors and suppliers to source products from foreign jurisdictions, which could lead to an increase in the cost of goods and adversely affect the Company’sCompany's profitability.We continue to evaluate the impact of currently effective tariffs, including potential future retaliatory tariffs, as well as other recent changes in foreign trade policy and the U.S. Administration on our supply chain, costs, sales and profitability, and are working through strategies to mitigate such impact, including reviewing sourcing options and working with our vendors and merchants. At this time, it is unknown how long U.S. tariffs on Chinese goods will remain in effect or whether additional tariffs will be imposed. Depending upon their duration and implementation, as well as our ability to mitigate their impact, these changes in foreign trade policy and any recently enacted, proposed and future tariffs on products imported by us from China could negatively impact our business, results of operations and liquidity if they seriously disrupt the movement of products through our supply chain or increase their cost. In addition, while we may be able to shift our sourcing options, executing such a shift would be time consuming and would be difficult or impracticable for many products and may result in an increase in our manufacturing costs. The adoption and expansion of trade restrictions, retaliatory tariffs, or other governmental action related to tariffs or international trade agreements or policies has the potential to adversely impact demand for our products, our costs, our customers, our suppliers, and/or the U.S. economy, which in turn could adversely impact our business and results of operations.16If our vendors, or any raw material vendors on which our vendors or our private label business relies, suffer prolonged manufacturing or transportation disruptions due to public health conditions or other unforeseen events, such as the COVID-19 pandemic, our ability to source product could be adversely impacted which would adversely affect our results of operations.Disruption of global sourcing activities and quality and other concerns over our own brands could negatively impact brand reputation and earnings.Economic and civil unrest in areas of the world where we source products, as well as shipping and dockage issues, could adversely impact the availability or cost of our products, or both. Most of the Company’sCompany's goods imported to the U.S. arrive from Asia through ports located on the U.S. west coast and are subject to potential disruption due to labor unrest or shortages, security issues or natural disasters affecting any or all of these ports. In addition, in recent years, we have substantially increased the number and types of merchandise that are sold under the Company’sCompany's proprietary brands. While we have focused on the quality of our proprietary branded products, we rely on third-parties to manufacture these products. Such third-party manufacturers may prove to be unreliable, the quality of our globally sourced products may vary from expectations and standards, the products may not meet applicable regulatory requirements which may require us to recall these products, or the products may infringe upon the intellectual property rights of third-parties. We face challenges in seeking indemnities from manufacturers of these products, including the uncertainty of recovering on such indemnity and the lack of understanding by manufacturers of U.S. product liability laws in certain foreign jurisdictions.We also face concerns relating to human rights, working conditions and other labor rights, and conditions and environmental impact in factories or countries where merchandise that we sell is produced, as well as concerns about transparent sourcing and supply chains. Although we have implemented policies and procedures designed to facilitate compliance with laws and regulations relating to production of merchandise, doing business in foreign countries and importing merchandise, and to screen, train and monitor our private label vendors to ensureconfirm safe and ethical treatment of workers in our supply chain, there can be no assurance that our vendors and other third parties with whom we do business will not violate such laws and regulations or our policies, which could subject us to liability and could adversely impact our reputation, results of operations and business.Material disruptions in relationships with third-parties with whom the Company does business could adversely affect its operations.The Company is a party to contracts, transactions and business relationships with various third parties, including suppliers, service providers, lenders and participants in joint ventures, strategic alliances and other commercial relationships. In some cases, we depend upon such third parties to provide products, services, advertising, technology infrastructure, development and support, data analytics, logistics, other goods and services to operate our business in the ordinary course, extensions of credit, credit card accounts and related receivables, and other matters. Furthermore, third-party vendors may sell products directly to consumers in addition to, or in some cases in lieu of, traditional wholesale channels such as independent stores and retail chains. As our business model depends on offering quality and relevant merchandise brands from third-party vendors in addition to our own private label products, any material disruption in our relationship with such vendors, or material disruption in the products or services provided by other third parties, could adversely affect our revenues, expense structure, earnings and operations.14Economic, Global, Legal and External RisksThe Company’sCompany's business is subject to discretionary consumer spending, unfavorable economic and political conditions, and other related risks.Our sales are significantly affected by changes in discretionary spending by consumers. Consumer spending may be affected by many factors outside of our control, including general economic conditions, consumer disposable income levels, consumer confidence levels, the availability, cost and level of consumer debt, consumer behaviors towards incurring and paying debt, the cost of basic necessities and other goods, the strength of the U.S. Dollar relative to foreign currencies and the effects of the weather, natural disasters or health pandemics. These factors can have psychological or economic impacts on consumers that affect their discretionary spending habits. Any decline in discretionary spending by consumers could negatively affect our business and results of operations.Unfavorable global, domestic or regional economic or political conditions and other developments and risks could negatively affect our business and results of operations. For example, unfavorable changes related to interest rates, rates of economic growth, fiscal and monetary policies of governments, inflation, deflation, tax rates and policy, unemployment trends, energy prices, and other matters that influence the availability and cost of merchandise, consumer17We regularly maintain cash balances at third-party financial institutions in excess of the Federal Deposit Insurance Corporation (the “FDIC”) insurance limit. The FDIC took control and was appointed receiver of Silicon Valley Bank and New York Signature Bank on March 10, 2023 and March 12, 2023, respectively, and JPMorgan Chase Bank assumed all deposits and substantially all assets of First Republic Bank on May 1, 2023. The Company did not have any direct exposure to Silicon Valley Bank, New York Signature Bank or First Republic Bank. However, if other banks and financial institutions enter receivership or become insolvent in the future in response to financial conditions affecting the banking system and financial markets, our ability to access our existing cash, cash equivalents and investments, or to draw on our existing lines of credit, may be threatened and could have a material adverse effect on our business and financial condition.Our business could be materially adversely affected by extreme weather conditions, natural disasters or regional or global health pandemics.Extreme weather conditions,, including those that may be caused by climate change, in the areas in which our stores are located could negatively affect our business and results of operations. For example, frequent or unusually heavy snowfall, ice storms, rainstorms or other extreme weather conditions over a prolonged period could make it difficult for our customers to travel to our stores and thereby reduce our sales and profitability. Our business is also susceptible to unseasonable weather conditions. For example, extended periods of unseasonably warm temperatures during the winter season or cool weather during the summer season could reduce demand for a portion of our inventory and thereby reduce our sales and profitability. In addition, extreme weather conditions could result in disruption or delay of production and delivery of materials and products in our supply chain and cause staffing shortages in our stores.Natural disasters such as hurricanes, tornadoes and earthquakes, or a combination of these or other factors, could damage or destroy our facilities or make it difficult for customers to travel to our stores, thereby negatively affecting our business and results of operations.Public concern regardingThe COVID-19 pandemic had a significant impact on the risk of contractingretail industry, including our business. Should we experience a regional or global pandemic or other public health crisis, including from a COVID-19 and any related variantsvariant, influenza, Respiratory Syncytial Virus, other microorganism, infectious disease or other cause, it could have a materialsignificant negative impact on the Company's business, financial condition, results of operations and adverse effect on our business. The continued development of the COVID-19 pandemic could also impact future economic activity, which could lead to increased unemployment and significantly impact consumer confidence and discretionary spending.Litigation, legislation, regulatory developments or non-compliance could adversely affect our business and results of operations.We are subject to various federal, state and local laws, rules, regulations, inquiries and initiatives in connection with both our core business operations and our credit card and other ancillary operations (including the Credit Card Act of 2009 and the Home Owners’Owners' Loan Act of 1933). Recent and future developments relating to such matters could increase our compliance costs and adversely affect the profitability of our credit card and other operations. Our effective tax rate is impacted by a number of factors, including changes in federal or state tax law, interpretation of existing laws and the ability to defend and support the tax positions taken on historical tax returns. Certain changes in any of these factors could materially impact the Company’sCompany's effective tax rate and net income.15We are also subject to anti-bribery, customs, child labor, truth-in-advertising and other laws, including consumer protection regulations and zoning and occupancy ordinances that regulate retailers generally and/or govern the importation, promotion and sale of merchandise and the operation of retail stores and warehouse facilities. Although we undertake to monitor changes in these laws, if these laws change without our knowledge, or are violated by importers, designers, manufacturers, distributors or agents, we could experience delays in shipments and receipt of goods or be subject to fines or other penalties under the controlling regulations, any of which could negatively affect our business and results of operations. In addition, we are regularly involved in various litigation matters that arise in the ordinary course of our business. Adverse outcomes in current or future litigation could negatively affect our financial condition, results of operations and cash flows.Changes in applicable environmental regulations, including increased or additional regulations to limit carbon emissions or other greenhouse gases may result in increased compliance costs, capital expenditures and other financial obligations which could affect our profitability.In addition, our business is subject to complex and rapidly evolving laws addressing data privacy and data protection and companies are under increased regulatory scrutiny with respect to these matters. The Federal Trade Commission and many state attorneys general are interpreting federal and state consumer protection laws to impose standards for the online collection, use, dissemination and security of data. The interpretation and application of existing laws regarding data privacy and data protection are in flux and many states are considering new regulations in this area. TheData privacy laws enacted in California, Consumer Privacy Act (CCPA), California Privacy Rights Act (CPRA)Virginia, Colorado, Utah, Connecticut, Iowa, Indiana, Tennessee, Montana, Texas, Oregon, New Jersey, Delaware and New Hampshire (as of February 1, 2024) and other applicable U.S. privacy laws or new state or federal laws may limit our ability to collect and use data, require us to modify our data processing practices or result in the possibility of fines, litigation or orders which may have an adverse effect on our business and18Our sales and operating results could be adversely affected by product safety concerns.If our merchandise offerings do not meet applicable safety standards or consumers' expectations regarding safety, we could experience decreased sales, increased costs and/or be exposed to legal and reputational risk. Events that give rise to actual, potential or perceived product safety concerns could expose us to government enforcement action and/or private litigation. Reputational damage caused by real or perceived product safety concerns could negatively affect our business and results of operations.Climate Change-Related RisksClimate change, or legal, regulatory, or market measures to address climate change, could adversely affect our business and results of operations.We have identified certain climate change-related risks that may impact our business over the short-, medium- and long-term. The nature of these risks depends on both the physical aspects of climate change as well as legal, regulatory, and market requirements, pressure to reduce our carbon footprint and our ability to understand and respond to rapidly evolving developments. Climate change and related measures could have adverse impacts on the Company’sCompany's business, financial condition and results of operations, including, but not limited to:•Regulatory Risks. Unfavorable global, domestic or regional economic or political conditions and other developments and risks could negatively affect our business and results of operations. For example, energy or carbon policies (both existing and emerging) that apply to our energy suppliers have the ability to impact indirect costs to our operations through shifts in energy prices. Current environmental and climate-related regulation, both at the state and federal levels, are monitored as part of our enterprise risk management process.Reputational Risk. Maintaining our Company’s reputation and brand image at a high level is critical to our operations and financial results. We believe our reputation and brand image are partially based on the perception that we act equitably and honestly in dealing with customers, employees, business partners and shareholders. Reputational risk in relation to climate-related issues encompasses both supply chain issues (e.g., supply disruption caused by weather events) and our position and progress toward cleaner energy production and consumption.•Risk Related to Resource Use. There is increasing scrutiny on the use of resources, particularly energy sources and energy use. Pressure from regulators, consumers and other stakeholders to find alternatives and/or green solutions to sharply reduce our use of natural resources are escalating. We continue to look for ways to address these issues and continue to explore developing best practices within the industry. Through memberships in industry groups such as the Sustainable Apparel Coalition (SAC), we are working to reduce the environmental and social impact of apparel and footwear products around the world. The use of recycled material textiles emits fewer greenhouse gas (GHG) emissions and conserves water and energy as compared to making virgin fiber. Additionally, we have rolled out a framework to measure the social and environmental performance of over 500 facilities, benchmarking by facility type to allow comparison of performance against that of peers.
New and emerging regulatory initiatives in the U.S. related to climate change and ESG could adversely affect our business. On March 6, 2024, the SEC adopted a final rule that will require registrants to disclose certain climate-related information in annual reports. The final rule will be effective for certain parts of our annual reports for fiscal 2025 and 2026 and could lead to increased costs and complexities associated with our SEC reporting.•Extreme Weather Events and Natural Disasters. The risk of extreme weather events is integrated into our climate change–related enterprise risk management assessment. Our business could be affected by extreme weather conditions, regional or global health pandemics or natural disasters. Extreme weather conditions, such as frequent or unusually heavy snowfall, ice storms, rainstorms or natural disasters such as wildfire over a prolonged period could make it difficult for our customers to travel to our stores and thereby reduce our sales and profitability. Our business is also susceptible to unseasonable weather conditions, which could reduce demand for a portion of our inventory and reduce sales and profitability or could result in disruption or delay of materials in our supply chain or impact staffing in our stores.19•Reputational Risk. Maintaining our Company's reputation and brand image at a high level is critical to our operations and financial results. Reputational risk in relation to climate-related issues encompasses both supply chain issues and our position and progress toward cleaner energy production and consumption. We rely upon a diverse, global network of suppliers and vendors within our supply chain that may expose us to risks from a reputational and brand perspective. We utilize the Sustainable Apparel Coalition's Higg Index, a suite of tools for the standardized measurement of value chain sustainability. Data is collected from multiple tiers in our Macy's private brand apparel and home textile supply chains as part of our continued efforts to identify brand risk and advocate for sustainability improvements, including energy/greenhouse gas efficiency. Macy's private brands supply chain is and will continue to be impacted by climate change related weather events that may cause supply disruptions. We also use the Higg Index to collect data about the likely resiliency of our supply chains and as an engagement tool to strengthen relationships and make continuous improvement.16We face increasing pressure to demonstrate our products are environmentally-friendly. Our efforts to mitigate that risk include using materials or processes that are third-party certified for environmentally-friendly attributes like OEKO-TEX® as well as trademarked fibers like TENCEL™ and REPREVE®. Macy's and Bloomingdale's have curated sitelets online to help strengthen Macy's, Inc.'s position of being identified as a responsible retailer, committed to climate-related and broader environmental topics. These mitigation efforts may not be successful.•Technology Risk. We monitor developments in technology associated with climate change to determine the potential risks involved with maintaining a business-as-usual scenario or to evaluate opportunities for technological advancements or innovation. While the adoption of new technology to combat climate change has the potential to be a business opportunity, the resources associated with implementing this technology introduce financial risk to our organization. For example, upfront costs associated with efficiency projects such as LED lighting retrofits could negatively affect our business results if projected returns on investments are not met. Before adopting new technology, we evaluate the immediate costs and balance them with how long it will take to recoup the investment as well as how likely it is for that return to be realized.•Risk Related to Resource Use. There is increasing scrutiny on the use of resources, particularly energy sources and energy use. Pressure from regulators, consumers and other stakeholders to find alternatives and/or energy-efficient solutions to sharply reduce our use of natural resources is escalating. We continue to look for ways to address these issues and continue to explore developing best practices within the industry. Through memberships in industry groups such as the Sustainable Apparel Coalition, we are working to reduce the environmental and social impact of apparel and footwear products around the world. The use of recycled material textiles emits fewer greenhouse gas emissions and conserves water and energy as compared to making virgin fiber. Additionally, we have rolled out a framework to measure the social and environmental performance of more than 500 facilities, benchmarking by facility type to allow comparison of performance against that of peers.Macy's, Inc.'s greatest opportunity for energy reduction continues to be through our lighting. Since 2010, across Macy's and Bloomingdale's store locations, total energy consumption has been reduced by more than 19.7% through LED lighting retrofits.•Extreme Weather Events and Natural Disasters. The risk of extreme weather events is integrated into our climate change–related enterprise risk management assessment. Our business could be affected by extreme weather conditions, regional or global health pandemics or natural disasters. Extreme weather conditions, such as frequent or unusually heavy snowfall, ice storms, rainstorms or natural disasters such as wildfire over a prolonged period could make it difficult for our customers to travel to our stores and thereby reduce our sales and profitability. Natural disasters such as hurricanes, tornadoes and earthquakes could damage or destroy our facilities, thereby negatively affecting our business and results of operations. Our business is also susceptible to unseasonable weather conditions, which could reduce demand for a portion of our inventory and reduce sales and profitability. In addition, extreme weather conditions could result in disruption or delay of production and delivery of materials and products in our supply chain or impact staffing in our stores.Financial RisksInability to access capital markets could adversely affect our business or financial condition.Changes in the credit and capital markets, including market disruptions, limited liquidity and interest rate fluctuations, may increase the cost of financing or restrict our access to this potential source of future liquidity. A downgrade in the ratings that rating agencies assign to the Company’sCompany's short- and long-term debt has and may continue to negatively impact our access to the debt capital markets and increase our cost of borrowing. In addition, our asset-based credit facility requires us to maintain a specified fixed charge coverage ratio. Our ability to comply with the ratio may be affected by events beyond our control, including prevailing economic, financial and industry conditions. If our results of operations deteriorate to a point where we are not in compliance with our debt covenants, and we are unable to obtain a waiver, much of our debt would be in default and could become due and payable immediately. Our assets may not be sufficient to repay in full this indebtedness, resulting in a need for an alternate source of funding. We cannot make any assurances that we would be able to obtain such an alternate source of funding on satisfactory terms, if at all, and our inability to do so could cause the holders of our securities to experience a partial or total loss of their investments in the Company.Our level of indebtedness may adversely affect our ability to operate our business, remain in compliance with debt covenants, react to changes in our business or the industry in which we operate, or prevent us from making payments on our indebtedness.As of January 29, 2022,February 3, 2024, the aggregate principal amount of our total outstanding indebtedness was $3,295$2,998 million. Our level of indebtedness could have important consequences for the holders of our debt and equity securities. For example, it could:•make it more difficult for us to satisfy our debt obligations;increase our vulnerability to general adverse economic and external conditions, including the COVID-19 pandemic;impair our ability to obtain additional debt or equity financing in the future for working capital, capital expenditures, acquisitions or general corporate or other purposes;•require us to dedicate a material portion of our cash flows from operations to the payment of principal and interest on our indebtedness, thereby reducing the availability of our cash flows to fund working capital needs, capital expenditures, acquisitions and other general corporate purposes;17expose us to the risk of increased interest rates to the extent we make borrowings under our asset-based credit facility, which bears interest at a variable rate;limit our flexibility in planning for, or reacting to, changes in our business and the industry in which we operate;place us at a disadvantage compared to our competitors that have less indebtedness; andlimit our ability to adjust to changing market conditions.•place us at a disadvantage compared to our competitors that have less indebtedness; and•limit our ability to adjust to changing market conditions.Any of these risks could materially impact our ability to fund our operations or limit our ability to expand our business, which could have a material adverse effect on our business, financial condition and results of operations.Item1B.UnresolvedStaffComments.None.Item 2.Properties.ThepropertiesoftheCompanyconsistprimarilyofstoresandrelatedfacilities,includingalogisticsnetwork.The Companyalsoownsorleasesotherproperties,includingcorporateofficespaceinNewYorkandotherfacilitiesatwhichcentralizedoperationalsupportfunctionsareconducted.Asof January 29, 2022,theoperationsoftheCompanyincluded 725 storelocationsin43states,theDistrictof Columbia,PuertoRicoandGuam,comprisingatotalofapproximately112millionsquarefeet.Attheselocations,store boxesconsistedof 323 ownedboxes, 356 leasedboxes, 104boxesoperatedunderarrangementswheretheCompany ownedthebuildingandleasedthelandandfourboxesofpartlyownedandpartlyleasedbuildings.Allownedproperties areheldfreeandclearofmortgages. As of January 29, 2022, certain properties secured certain senior notes, as disclosed20further in Item 7.Pursuanttovariousshoppingcenteragreements,theCompanyisobligatedtooperate certainstoresforperiodsofupto15years.Someoftheseagreementsrequirethatthestoresbeoperatedunderaparticular name.MostleasesrequiretheCompanytopayrealestatetaxes,maintenanceandothercosts;somealsorequireadditional paymentsbasedonpercentagesofsalesandsomecontainpurchaseoptions.CertainoftheCompany’srealestateleaseshavetermsthatextendforasignificantnumberofyearsandprovideforrentalratesthatincreaseordecreaseovertime.TheCompany'soperationswereconductedthroughthefollowingbrandedstorelocations:Storecountactivitywasasfollows:AdditionalinformationabouttheCompany’sstoreboxesasof January 29, 2022isasfollows:21AdditionalinformationabouttheCompany’slogisticsnetworkasof January 29, 2022 isasfollows:LocationPrimaryFunctionOwned orLeasedSquareFootage(thousands)Cheshire, CTDirect to customerOwned719Chicago, ILStoresOwned862Columbus, OHStoresLeased673Dayton, OHStoresLeased107Denver, COStoresLeased20Goodyear, AZDirect to customerOwned1,560Hayward, CAStoresOwned310Houston, TXStoresLeased872Joppa, MDStoresOwned850Kapolei, HIStoresLeased260Los Angeles, CAStoresOwned1,529Martinsburg, WVDirect to customerOwned2,200Miami, FLStoresLeased535Portland, TNDirect to customerOwned1,455Raritan, NJStoresOwned980Sacramento, CADirect to customerLeased385Secaucus, NJStoresLeased675South Windsor, CTStoresOwned595Stone Mountain, GAStoresOwned920Tulsa, OKDirect to customerOwned2,195Tukwila, WAStoresLeased500Union City, CAStoresLeased165Youngstown, OHStoresOwned6103.LegalProceedings.TheCompanyanditssubsidiariesareinvolvedinvariousproceedingsthatareincidentaltothenormalcourseoftheir businesses.Asofthedateofthisreport,theCompanydoesnotexpectthatanyofsuchproceedingswillhaveamaterial adverseeffectontheCompany’sfinancialpositionorresultsofoperations.RetailHazardous Waste Matter. As previously reported, the District Attorneys for ten counties in California and the City of Los Angeles are investigating alleged non-compliance with laws and regulations enacted or adopted regulating the storage, transportation and disposal of hazardous waste in California at Macy’s stores and distribution centers. The Company is cooperating with the offices and agencies involved, which are focused on disposal and return of cosmetic products, and1C. CybersecurityMacy's, Inc. is committed to adoptingprotecting information that is valuable to our customers and critical to business operations from unauthorized access and disclosure.Risk Management and StrategyMacy's, Inc. operates a security operations program that employs a defense-in-depth strategy to provide layers of safeguards against cybersecurity threats. We apply a hybrid security framework model using the National Institute of Standards and Technologies (NIST), International Organization for Standardization (ISO) 27001, Control Objectives for Information and Related Technologies (COBIT) and Payment Card Industry Data Security Standard (PCI DSS) frameworks as a guide to help us identify, assess, and manage cybersecurity risks relevant to our business.We conduct ongoing risk assessments, as well as internal and external vulnerability scanning and penetration testing of select systems and platforms. We work with our cloud platform providers to implement a consistent security and control environment through a combination of internal, front-end and additional controls, such as access, firewall and authentication controls.We undertake other activities to manage risks from cybersecurity threats, including: managing access to Company data; use of encryption; procedures to manage information security incidents, both actual and suspected; establishing security standards and procedures for day-to-day operations to promote optimal system performance and maintain the integrity of operational systems; implementing detection, prevention and recovery controls to protect information technology assets; backup procedures to prevent the loss of critical data; and restrictions on software installations, among other practices.We have an enterprise risk management program that identifies and prioritizes enterprise risks. At committee and Board meetings periodically throughout the year, management discusses the risk exposures identified as being most significant to the Company and the related actions that management may take to monitor such exposures. The program utilizes a network of functional experts with managerial responsibility for various aspects of enterprise risk management. Our oversight of risks from cybersecurity threats have been implemented into our enterprise risk management program.We have established data security breach preparedness and response plans that are tested and practiced regularly and address a range of scenarios that include data breaches and ransomware attacks. We are subject to regular information technology and security audits by internal audit staff.Our policy is to vet and train colleagues and relevant contractors and to protect Company data. A pre-employment screening process is conducted for candidates, including contractors and third parties, with background verification checks on some candidates for employment. Colleagues, including relevant contractors, must receive appropriate security training and be made aware of organizational policies and procedures relevant for their job function.In the event we experience an actual or threatened cybersecurity incident, our Security team will consult with a third-party security firm when appropriate, perform a root cause analysis and determine both how to address the threat and whether we could take additional steps to improve our security posture. In this regard prior cybersecurity incidents have informed changes to our processes to minimize vulnerabilities. As of the filing of this Annual Report on Form 10-K, we are not aware of any cybersecurity incidents that have occurred that have materially affected, or are reasonably likely to materially affect us, including our business strategy, results of operations or financial condition. However, if as a result of any future attacks our information technology systems are significantly damaged, cease to function properly or are subject to a significant cybersecurity breach, we may suffer an interruption in our ability to manage and operate the business, and our business strategy, results of operations or financial condition could be adversely affected. For additional information about risks18related to actual or threatened cybersecurity incidents, see “Information Security, Cybersecurity, Privacy and Data Management Risks” in the “Risk Factors” section of this Annual Report on Form 10-K.GovernanceThe Audit Committee of our Board of Directors is responsible for addressing policies with respect to the Company's risk assessment and risk management, including risks related to data privacy, computerized information controls and cybersecurity, and to consider any recommendations for improvement of such controls. The chairperson of the Audit Committee updates the full Board of Directors on these discussions.The Audit Committee, and the full Board of Directors when appropriate, receive regular updates from management on IT security, internal and external security reviews, data protection, risk assessments, breach preparedness, systems disruption risk, threat assessments, response plans and consumer privacy compliance.The Macy's, Inc. Security team is responsible for assessing and managing material risks from cybersecurity threats, including the prevention, mitigation, detection and remediation of cybersecurity incidents. The Macy's, Inc. Security team is comprised of security professionals with diverse backgrounds, including former law enforcement, government and military.Users with access to Company data and information technology assets are required to promptly report known or suspected security incidents. Our incident response process escalates reporting of cybersecurity incidents to senior management and disclosure controls and procedures are in place to review impact on the Company.Our Chief Information Security Officer (CISO) leads our data protection programs. Our CISO is head of information security, privacy, IT risk, identity and access management and has 33 years with the Company in various roles of increasing responsibilities including Audit Assurance, Computer Operations, Networking and System platforms. The CISO provides cybersecurity updates at least three times per year to the Audit Committee and an annual review with the full Board of Directors.Item 2. Properties.The properties of the Company consist primarily of stores and related facilities, including a logistics network. The Company also owns or leases other properties, including corporate office space in New York and other facilities at which centralized operational support functions are conducted.As of February 3, 2024, the operations of the Company included 718 store locations in 43 states, the District of Columbia, Puerto Rico and Guam, comprising a total of approximately 110 million square feet. These locations consisted of 286 owned locations, 339 leased locations, 90 locations operated under arrangements where the Company owned the building and leased the land and three locations of partly owned and partly leased buildings. All owned properties are held free and clear of mortgages. Pursuant to various shopping center agreements, the Company is obligated to operate certain stores for periods of up to 15 years. Some of these agreements require that the stores be operated under a particular name. Most leases require the Company to pay real estate taxes, maintenance and other costs; some also require additional payments based on percentages of sales and some contain purchase options. Certain of the Company's real estate leases have terms that extend for a significant number of years and provide for rental rates that increase or decrease over time.The Company's operations were conducted through the following branded store locations as of February 3, 2024:Macy's 502 Bloomingdale's 57 Bluemercury 159 718 Store count activity for the 53 weeks ended February 3, 2024 was as follows:Store count at beginning of fiscal year 722 Stores opened 9 Stores closed, consolidated into or relocated from existing centers (13) Store count at end of fiscal year 718 19Additional information about the Company's store locations as of February 3, 2024 is as follows:By Brand Total Owned Leased Subject to
a Ground
LeasePartly
Owned
and Partly
LeasedMacy's 502 273 142 84 3 Bloomingdale's 57 13 38 6 — Bluemercury 159 — 159 — — 718 286 339 90 3 Additional information about the Company's logistics network as of February 3, 2024 is as follows:Location Primary
FunctionOwned or
LeasedSquare
Footage
(thousands)Bridgeton, MO Stores Leased 43 Cheshire, CT Direct to customer Leased 719 Chicago, IL Stores Owned 862 Columbus, OH Stores Leased 673 Dayton, OH Stores Leased 107 Denver, CO Stores Leased 20 Goodyear, AZ Direct to customer Owned 1,560 Hayward, CA Stores Owned 310 Joppa, MD Stores Owned 850 Kapolei, HI Stores Leased 260 Los Angeles, CA Stores Owned 1,529 Martinsburg, WV Direct to customer Owned 2,200 Miami, FL Stores Leased 535 Portland, TN Direct to customer Owned 1,455 Raritan, NJ Stores Owned 980 Sacramento, CA Direct to customer Leased 385 Secaucus, NJ Stores Leased 675 South Windsor, CT Stores Owned 595 Stone Mountain, GA Stores Owned 920 Tomball, TX Stores Leased 902 Tukwila, WA Stores Leased 500 Tulsa, OK Direct to customer Owned 2,195 Union City, CA Stores Leased 165 Youngstown, OH Direct to customer Owned 610 Item 3. Legal Proceedings.The Company and its subsidiaries are involved in various proceedings that are incidental to the normal course of their businesses. As of the date of this report, the Company does not expect that any of such proceedings will have a material adverse effect on the Company's financial position or results of operations.Item 4. Mine Safety Disclosures.Not applicable.Item 5. Market for Registrant's Common Equity, Related Stockholder Matters and Issuer Purchases of Equity Securities.The Company's common stock is listed on the New York Stock Exchange under the trading symbol “M.” As of February 3, 2024, the Company had approximately 12,000 stockholders of record.20The declaration and payment of future dividends will be at the discretion of the Company's Board of Directors, are subject to restrictions under the Company's debt instruments and may be appropriate depending onaffected by various other factors, including the outcome of the investigation into this matter. No administrativeCompany's earnings, financial condition and legal or judicial proceedings have been initiated. In October 2020, the District Attorneys made an initial settlement demand tocontractual restrictions.On February 22, 2022, the Company announced that includedits Board of Directors authorized a monetary penalty, reimbursement of investigation costs and injunctive relief.$2.0 billion share repurchase program, which does not have an expiration date. The Company expects to pay $1,925,000 to resolve this matter and is in the process of finalizing settlement documentation. The reserve, included within accounts payable and accrued liabilities on the Consolidated Balance Sheet as of January 29, 2022, reflects the expected loss.Item 4.MineSafetyDisclosures.Notapplicable.22PARTIIItem 5.MarketforRegistrant’sCommonEquity,RelatedStockholderMattersandIssuerPurchasesofEquitySecurities.TheCompany'scommonstockislistedontheNewYorkStockExchangeunderthetradingsymbol“M.”Asof January 29, 2022,theCompanyhadapproximately13,037stockholdersofrecord.ThedeclarationandpaymentoffuturedividendswillbeatthediscretionoftheCompany’sBoardofDirectors,aresubjecttorestrictionsundertheCompany’sdebt instrumentsandmaybeaffectedbyvariousotherfactors,includingtheCompany’searnings,financialconditionandlegal continue, discontinue orcontractualrestrictions.The following table provides information regarding the Company’s resume purchases of common stock duringunder this or possible future authorizations in the fourth quarteropen market, in privately negotiated transactions or otherwise at any time and from time to time without prior notice. As of 2021.(1)On August 19, 2021, the Company announced that its Board of Directors authorized a new $500 million share repurchase program. As of January 29, 2022, zero dollars remained available for repurchase under this authorization. On February 22, 2022, the Company announced that its Board of Directors authorized a new $2.0 billion share repurchase program, which does not have an expiration date. The Company may continue, discontinue or resume purchases of common stock under these or possible future authorizations in the open market, in privately negotiated transactions or otherwise at any time and from time to time without prior notice.23January28,2017 February 2, 2019 through January 29, 2022,February 3, 2024, assuming an initial investment of $100 and the reinvestment of all dividends, if any.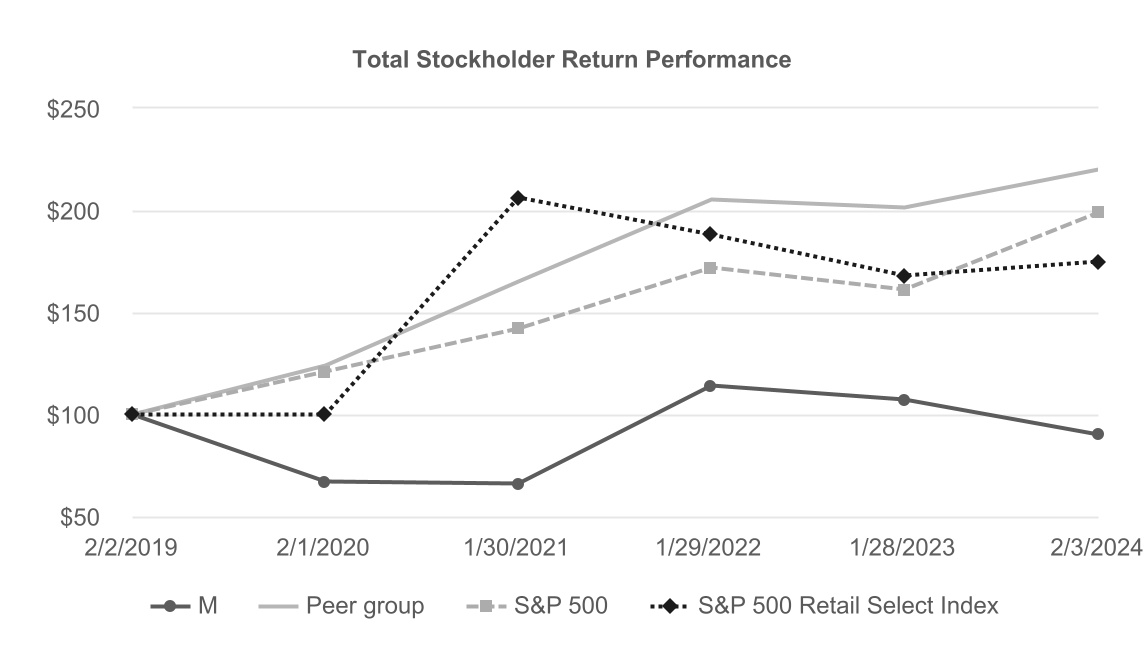
assuminganinitialinvestmentof$100andthereinvestmentofalldividends,ifany.
Company’sCompany's performance-based restricted stock units. The CompensationandManagement DevelopmentCommitteeoftheBoardofDirectors also uses peer group comparisons and benchmarking and to assess and evaluate compensation for the Company’sCompany's executive officers. The companies included in the peer group are Best Buy Co., Inc., Burlington Stores Inc., Dicks Sporting Goods, Inc., Dillard's, Inc., Dollar Tree, Inc., Foot Locker, Inc., Gap Inc., Kohl's Corporation, Lowes Companies, Inc., Nordstrom, Inc., Ross Stores, Inc., Target Corporation, TJX Companies, Inc., Ulta Beauty, Inc., and Williams-Sonoma, Inc. In 2023, Bed, Bath & Beyond Best Buy, Dillard’s, Dollar Tree, Gap, Kohl’s, Lowe’s, Nordstrom, Ross Stores, Target, TJX Companies, Burlington Stores, Dicks Sporting Goods, Foot Locker and Williams-Sonoma. L BrandsInc. was removed from the peer group as compared to 2020 due to the spin-offbecause it was no longer publicly traded.21PART IIItem 6.[Reserved]24Item 7.Management’sDiscussionandAnalysisofFinancialConditionandResultsofOperations.Item 7. Management's Discussion and Analysis of Financial Condition and Results of Operations.The following Management's Discussion and Analysis of Financial Condition and Results of Operations (“MD&A”)(MD&A) is intended to promote understanding of the results of operations and financial condition of the Company. MD&A is provided as a supplement to, and should be read in conjunction with, our consolidated financial statements and the accompanying Notes to Financial Statements (Part II, Item 8 of this Form 10-K). This section generally discusses the results of operations for 20212023 compared to 20202022 and 2019.2021. The discussion that follows includes a comparison of our results of operations and liquidity and capital resources for the fiscal years ended February 3, 2024 to January 28, 2023 and January 29, 2022 to January 30, 2021 and February 1, 2020.2022. For a full discussion of changes from the fiscal year ended January 30, 202128, 2023 to the fiscal year ended February 1, 2020,January 29, 2022, refer to Management's Discussion and Analysis of Financial Condition and Results of Operations in Part II, Item 7 of the Company's Annual Report on Form 10-K for the fiscal year ended January 30, 202128, 2023 (filed March 29, 2021)24, 2023). This section also contains forward-looking statements that reflect the Company's plans, estimates and beliefs. The Company's actual results could materially differ from those discussed in these forward-looking statements. Factors that could cause or contribute to those differences include, but are not limited to, those discussed below and elsewhere in this report, particularly in “Risk Factors”"Risk Factors" and “Forward-Looking"Forward-Looking Statements.”Fiscal 2023 OverviewTheOver the past several years, the Companyisanomnichannelretailorganizationoperatingstores,websitesandmobileapplicationsunderthreebrands (Macy's, Bloomingdale's has taken proactive actions to fortify its operations, including strengthening our balance sheet, managing expenses and bluemercury) that sellimproving inventory productivity. The dedicated work of our teams delivered a wide range of merchandise, including apparelsolid close to 2023 and accessories (men's,women'sandkids'),cosmetics,homefurnishingsandotherconsumergoods.Asof January 29, 2022,the Company'soperationswereconductedthroughMacy's, Market by Macy’s, Macy’sBackstage, Bloomingdale’s, Bloomingdale’sTheOutlet, Bloomiesandbluemercury,whichareaggregatedintoonereportingsegmentinaccordancewiththeFASBAccountingStandardsCodification(“ASC”)Topic280,SegmentReporting.Bloomingdale'sinDubai,UnitedArabEmiratesandAlZahra,KuwaitareoperatedunderalicenseagreementwithAl TayerInsignia,acompanyoftheAlTayer Group,LLC.In March 2020, the World Health Organization declared the outbreak of COVID-19 asprovides a global pandemic, which continues to spread throughout the United States. The COVID-19 pandemic had a negative impact on the Company's 2020 operations and financial results, and the full financial impact of the pandemic cannot be reasonably estimated at this time due to uncertainty as to the severity and duration of the pandemic. 2020 was a year of unprecedented challenges and requiredstrong foundation for the Company to adaptexecute its business to address the disruption caused by the COVID-19 pandemic. Faced with the temporary closure of stores and changes in consumer shopping behaviors, the Company had to right-size its cost base and operating model, offer new fulfillment options to customers, focus on product categories with higher consumer demand, and accelerate its focus on digital shopping and underlying investments to support these trends. Financial results in the first and second quarter of 2020 were significantly impacted by the COVID-19 pandemic but the Company saw sequential improvement in its operating results during the third and fourth quarters of 2020. Although uncertainty surrounds the continued impact of the COVID-19 pandemic, the Company positioned itself to focus on the recovery of its business in 2021 and execute on its corporate strategy, for profitable growth in the future.Although the Company has experienced strong recovery in operating results during 2021 as compared to 2020, the Company continues to monitor the impact of COVID-19 on the macro economy as well as on the Company’s and its vendor partners’ operations. The full impact of the pandemic will continue to depend on future developments, including the continued spread and duration of the pandemic, the emergence of future variant strains of COVID-19, the availability and distribution of effective medical treatments or vaccines as well as any related federal, state or local governmental orders or restrictions, or mandates. In addition, numerous uncertainties continue to surround the pandemic and its ultimate impact on the Company, including the timing and extent of any recovery in consumer traffic and spending, potential delays, interruptions and disruptions in the Company’s supply chain, maintenance of temporary government stimulus programs, labor shortages and intense competition for talent, all of which are highly uncertain and cannot be predicted. Modifications to work environment policies could also impact the use of certain corporate assets, and as such could lead to additional long-lived tangible and right of use corporate asset impairment.the2023 performance, of 2021, the Company considered its results against 2020 as well as 2019 given the impact of the pandemic and the closure of the Company’s stores during 2020.2022. Certain financial highlights are as follows:•Comparable sales increased 43.0% on an owned basis and 42.9% on an owned-plus-licensed basis versus 2020; up 3.1% and up 3.0%, respectively, versus 2019.25•The continued change in consumer shopping behaviors, driven in part by the COVID-19 pandemic, resulted in a 13% and 39% increase in digital sales compared to 2020 and 2019, respectively.•Net credit card revenue increased $81 million and $61 million from 2020 and 2019, respectively, to $832 million.•The gross margin rate for 2021 was 38.9%, an increase from 29.2% in 2020 and up 70 basis points from 2019.•SG&A expenses increased $1,280 million from 2020 and decreased $951 million from 2019. SG&A expenses as a percent of sales improved by approximately 610 basis points from 2020 and 370 basis points from 2019.•Net income was $1,430 million in 2021, compared to a net loss of $(3,944) million in 2020 and net income of $564 million in 2019. Net income adjusted for impairment, restructuring and other costs, settlement charges, losses on early retirement of debt and financing costs improved from a loss of $(688) million in 2020 to adjusted net income of $1,668 million in 2021. This also compares to adjusted net income of $906 million in 2019.•Earnings before interest, taxes, depreciation and amortization excluding restructuring, impairment, store closings and other costs and settlement charges ("Adjusted EBITDA") were $3,320 million in 2021, as compared to $117 million in 2020 and $2,336 million in 2019.•Diluted earnings per share were $4.55 in 2021, compared to diluted loss per share of $(12.68) in 2020 and diluted earnings per share of $1.81 in 2019. On an adjusted basis, diluted earnings per share were $5.31 in 2021, compared to adjusted diluted loss per share of $(2.21) in 2020 and adjusted diluted earnings per share of $2.91 in 2019.•Merchandise inventories were up 16% at the end of 2021 compared to the end of 2020, and down 16% compared to the end of 2019. Inventory turnover increased 21% and 22% over 2020 and 2019, respectively.•During 2021, the Company repaid early approximately $1.6 billion of debt, reinstated its regular quarterly dividend and paid $90 million in cash dividends, and repurchased approximately 20.5 million shares of its common stock at an average cost of $24.40 per share for a total cost of $500 million.Seepages34 31 to36 33 forreconciliationsofthenon-GAAPfinancialmeasurespresentedabovetothemostcomparable U.S. generally accepted accounting principles ("GAAP")(GAAP) financial measures and other important information.Polaris22Company StrategyDuring 2021,2023, the Company focused on its five growth vectors, introduced at the start of the fiscal year and representing strategic investments designed to target future long-term profitable sales growth. Items actioned under each growth vector in 2023 include, but are not limited to, the following:•Macy's private brand reimagination: In August 2023, Macy's launched On 34th, its first new private brand under the reimagination, with a strong customer response. Throughout 2023, Macy's refreshed I.N.C. in phases to further elevate the design strategy and fashion offering, and exited several heritage women's brands, including Alfani and Karen Scott.•Macy's and Bloomie's small formats: In 2023, the Company opened four additional Macy's small format locations and one additional Bloomie's location.•Digital marketplace: The Company launched Bloomingdale's marketplace in the second quarter of 2023 and continued to execute its Polaris strategy and these actions impacted its operating results forgrow Macy's marketplace, ending the year notably:•Win With Fashion and Style: By offering a wide assortment of categories, products and brands from off-price to luxury, the Company was able to reach a broad and diverse range of customers during 2021. In merchandise, strengths continued in pandemic-driven products such as home, fragrance, jewelry, watches and sleepwear and the Company also saw recovery in occasion-based categories such as dresses, men’s tailored and luggage. In addition to enhancing the shopping experience of its core customers, the Company also focused on new offerings to attract the under-40 shopper. In the fall season, the Company added a curated selection of brands, products and categories to 160 Macy’s stores that appeal specifically to this younger, more diverse customer. These brands include COTTON ON, Steve Madden, Michael Kors and Levi’s as well as the Company’s new private brands, And Now This and Oak. The Company also entered into an exclusive26omnichannel partnership with Toys ‘R’ Us to expand its toy business and added Fanatics and Pandora as new brand partners. •Deliver Clear ValueThe Company has leveraged data analytics and pricing tools to efficiently plan, place and price inventory, including location level pricing and point-of -sale pricing work. With these actions, the Company has lowered its volume of markdowns and improved inventory placement and assortment allocations among its distribution centers and stores. These collective activities have resulted in higher average unit retail prices and gross margin performance. In addition, inventory turn for the trailing 12 months improved by 21% over 2020 and 22% over 2019.•Excel in Digital Shopping: The Company continued to improve its digital offerings and launched several initiatives, including upgraded digital search functions, a refreshed mobile app, live shopping functionality, fragrance finder, expanded 3D room planning, new contemporary merchandise and sustainable merchandise sitelets and added Venmo and PayPal as additional payment options. As a result of these and other investments, digital conversion for the year was 4.24%, up 9% and 13% compared to 2020 and 2019, respectively. In addition, in November 2021, the Company announced its plan to launch a curated, digital marketplace in the second half of 2022.
On February 27, 2024, the Company announced its new strategy, A Bold New Chapter, which is designed to return the Company to enterprise growth, unlock shareholder value, and better serve its customers. This new strategy builds on the five growth vectors, adds newly identified and stress-tested areas of opportunities, and is supported by the Company's financial disciplines. Over the next three years, the Company plans to:•Enhance Store Experience: The Company continues to invest in physical stores to support its digitally-led omnichannel business model and launched a contemporary boutique in 160 stores, specifically targeted at the under-40 demographic, to continue a physical expression of its contemporary sitelet. The Company also added eight off-mall, smaller format stores (Market by Macy’s, freestanding Macy’s Backstage locations, and Bloomingdale’s new off-mall, smaller store format concept, Bloomies, and Bloomingdale’s the Outlets) primarily across Dallas, Atlanta and Washington D.C. markets during 2021. Although early, these new store formats saw strong sales and solid Net Promotor Scores. In addition to being a place for discovery and shopping, the Company’s stores are now also serving as fulfillment hubs supporting its digital operations through buy-online-pickup-in-store, curbside pickup, and same-day delivery. Given this, the Company has delayed most of the remaining store closures announced with its Polaris strategy in 2020 in order to maintain a physical presence in the markets it operates in. Keeping these cash-positive stores open also helps to fund the investments the Company is making to reposition its store fleet over the next several years.•Modernize Supply Chain: The Company has continued to update its supply chain infrastructure and network, while leveraging improved data and analytics capabilities in fulfillment strategies to meet customers' desire for speed and convenience and improving inventory placement. The Company is navigating supply chain disruptions by adjusting freight strategies, diversifying ports and working closely with international carriers and brand partners to prioritize product.•Enable Transformation: The Company has continued to modernize its technology foundations to increase agility in reacting to customers and the market regardless of the channel in which customers interact. These activities are coupled with others to build out data science and analytics capabilities with a focus on areas to provide competitive differentiation. As part of the Company’s ongoing commitment to attract and retain talent, in November 2021, the Company announced significant new investments in its colleagues’ benefit programs. These investments include launching a tuition benefit program, raising the company-wide minimum rate to $15 per hour and increasing compensation and benefits for colleagues across Macy’s Inc.As a result◦Rationalize store base: The Company identified approximately 150 underproductive Macy's locations for closure over the next three years (collectively, the "non-go-forward" locations), which will allow for monetization of assets at the non-go-forward locations and prioritization of investments in the approximately 350 remaining Macy's locations (collectively, the "go-forward" locations) where the Company believes it has the most opportunity to improve square footage productivity. In 2023, the 150 non-go-forward locations represented approximately 25% of the executionCompany's gross square footage but less than 10% of net sales.◦Rollout small format: The Company operated 12 Macy's small format stores at the end of the year and plans to add up to 30 locations in the next two years.◦Revitalize assortment: The Company recently shifted its Polaris strategy,merchant colleague responsibilities to a full category approach rather than separate teams for owned and licensed business. This new approach allows the merchant organization to better focus on the nuances that make each category thrive, provides higher visibility and awareness across entire categories, strengthens relationships with partners, allows for diversification of product across price points, and better positions the Company to grow market share. The Company also recognized improvementexpects to continue its private brand reimagination by capitalizing on white space opportunities that complement market brands and provide customers with more reasons to shop Macy's. The private brands generate higher merchandise margins and profit contribution relative to market brands.◦Launch First 50 Doors: In 2023, the Company tested a small number of incubator locations with new ideas, including but not limited to elevated assortments, improved visual presentations and additional staffing in certain departments. These ideas were based on customer feedback and prioritized conversion. The comparable sales at these incubator locations outperformed the broader Macy's fleet by over 350 basis points. Given the results, the Company recently expanded the pilot to 50 locations, which will be referred to as the First 50. Learnings from the First 50 are expected to be applied to a broader set of locations beginning in fiscal 2025.◦Grow digital: The Company plans to reevaluate its foundation to develop better search and navigation tools and offer personalized communications and recommendations that have a definitive Macy's point of view, culminating in an efficient and speedy checkout. Also, the Company plans to expand Marketplace and Macy's Media Network to improve profitability and increase customer engagement.23•.Accelerate luxury growth◦Accelerate Bloomingdale's growth: The Company saw Platinum, Goldplans to open a combined 15 Bloomie's and Silver Star Rewards customers continue to engageBloomingdale's The Outlet locations over the next three years in new and existing markets, with the Macy’s brand during 2021,intent of leveraging the new markets to expand digital presence.◦Accelerate Bluemercy growth: The Company will launch "The New Blue," Bluemercury's total omni-channel evolution inclusive of updated branding and store models. The Company plans to open at least 30 Bluemercury locations and remodel approximately 30 locations over the next three years with an expanded assortment, elevated aesthetics, centralized customer service hubs, integrated spa facilities and technology to support relationship building.•.Simplify and modernize end-to-end operations◦Rationalize and monetize the average customer spend up 12% comparedCompany's supply chain portfolio, streamline fulfillment, improve inventory planning and allocation, and deliver a scalable technology platform: The benefits and cost savings from these activities are expected to 2019. During 2021, Macy’s brand active customer count increased 18% over 2020fund the investments necessary to support the Company's strategy, offset inflationary cost pressures, and 1% over 2019 to 44 million. For 2021, after eliminating repeat visits between quarters, the Company’s new customers increased 40% over 2020constrain fulfillment expense and 26% over 2019 to 19.4 million.SG&A dollar growth.27The Company considers fiscal 2024 a transition and investment year as it implements A Bold New Chapter.24Analysis of ResultsofOperations2023 2023 2022 2021 Amount Amount % to Net Sales % to Total Revenue Amount % to Net Sales % to Total Revenue Amount % to Net Sales % to Total Revenue (dollars in millions, except per share figures) (dollars in millions, except per share figures) Other revenue Other revenue Other revenue Total revenue Total revenue Total revenue Cost of sales Cost of sales Selling, general and administrative expenses Selling, general and administrative expenses (8,375) (35.1) (35.1) % (8,461) (33.2) (33.2) % (8,154) (32.1) (32.1) % Gains on sale of real estate 61 0.3 0.3 % 89 0.3 0.3 % 91 0.4 0.4 % Impairment, restructuring and other costs (1,027) (4.3) (4.3) % (41) (0.2) (0.2) % (30) (0.1) (0.1) % Operating income Operating income $ 382 1.6 % $ 1,730 6.8 % $ 2,350 9.3 % Diluted earnings per share Diluted earnings per share Diluted earnings per share Supplemental Financial Measure Supplemental Financial Measure Gross margin Gross margin Digital sales as a percent of net sales Digital sales as a percent of net sales Increase (decrease) in comparable sales Increase (decrease) in comparable sales Increase (decrease) in comparable sales Supplemental Non-GAAP Financial Measures Supplemental Non-GAAP Financial Measures Increase (decrease) in comparable sales on an owned plus licensed basis Increase (decrease) in comparable sales on an owned plus licensed basis Adjusted diluted earnings per share Adjusted diluted earnings per share Adjusted diluted earnings per share EBITDA EBITDA Adjusted EBITDA Adjusted EBITDA Seepages 34 31 to 36 33 forareconciliation reconciliations ofthesenon-GAAPfinancialmeasurestotheirmostcomparableGAAPfinancial measure and for other important information.25Comparison of 2023 and 202020222023 2023 2022 Change in comparable sales Change in comparable sales (6.9) % 0.3 % Change in comparable sales on an owned plus licensed basis Change in comparable sales on an owned plus licensed basis (6.0) % 0.6 % Digital sales as a percent of net sales 33 % 33 % Netsalesfor 2020 the Company in 2023, which included $252 million of net sales recognized in the 53rd week, were significantlydown 5.5% from 2022. Comparable sales on an owned plus licensed basis decreased 6.0%, adjusted for the 53rd week in fiscal 2023. Net sales decreased for Macy's and Bloomingdale's, but grew for Bluemercury, and were impacted by a volatile macroeconomic environment as consumer spending in discretionary categories continued to be under pressure. Macy's experienced strength in beauty, particularly fragrances and prestige cosmetics, women's career sportswear, and men's tailored. Women's casual sportswear, active, and big ticket underperformed from the pandemicprior year. Owned average unit retail ("AUR") increased 5.1% from 2022, primarily driven by changes in product and the temporary closurecategory mix.2023 2022 $ % to Net Sales $ % to Net Sales Credit card revenues, net $ 619 2.7 % $ 863 3.5 % Macy's Media Network, net 155 0.7 % 144 0.6 % Other revenue $ 774 3.4 % $ 1,007 4.1 % Proprietary credit card sales penetration 42.9 % 42.9 % The decrease in other revenues from 2022 to 2023 was driven by a $244 million, or 28% decrease, in credit card revenues. This decrease was primarily driven by increased portfolio funding costs and higher credit losses, partially offset by higher finance charge income. Macy Media Network grew $11 million, or 8% from 2022.2023 2022 Cost of sales $ (14,143) $ (15,306) As a percent to net sales 61.2 % 62.6 % Gross margin $ 8,949 $ 9,136 As a percent to net sales 38.8 % 37.4 % Gross margin rate and merchandise margin rate increased 140 basis points and 80 basis points, respectively, from 2022 to 2023. The increase in merchandise margin was driven by lower permanent markdowns and improved inbound freight costs. Partially offsetting these benefits were anticipated changes in category mix and an increase in inventory shortage. Delivery expense, which is not a component of stores during the first and second quarters. The Company’s 2021merchandise margin, as a percent of net sales showed recovery across all three brands – Macy’s, Bloomingdale’sdecreased 60 basis points primarily due to improved carrier rates from contract renegotiation and bluemercury. improvements in inventory allocation.2023 2022 SG&A expenses $ (8,375) $ (8,461) As a percent to total revenue 35.1 % 33.2 % The Company experienced strength across nearly allSG&A expenses decreased $86 million, or 1%, from 2022 to 2023 due to ongoing expense discipline and effective implementation of its major merchandise categories, most significantly in home, jewelry and fragrances, driven by continued customer strength, the continued recovery of its stores as well as continued growth in its digital channel.28net credit card revenues was driven by higher credit sales and the continuation of the strong credit health of the credit card portfolio's customers leading to lower levels of bad debt, partially offset by a decrease in proprietary credit card sales penetration.The increase in the gross margin rate was driven primarily by continued recovery of the Company’s stores, inventory productivity, lower markdowns and the execution of the Polaris strategy. Inventory turnover improved 21% over 2020 mainly due to further evolving and scaling the Company’s data science in terms of pricing and promotional initiatives as well as maintaining disciplined buying behavior.expenses increased in 2021 but decreasedexpense as a percent to net sales. The increase in SG&A expense dollars corresponds with higher net sales but the improvement in the SG&A expense rate reflects the expense management strategies implementedtotal revenue was driven by the Companydecline in responsetotal revenue.2023 2022 Gains on sale of real estate $ 61 $ 89 2023 asset sale gains primarily relate to the COVID-19 pandemic as partsale of the Polaris strategy and the number of open job positions during the year.eight properties, while 20220212 asset sale gains mainly consist of gains from the sale of 18 properties, an increase from approximately 12 properties sold at a gain in 2020, duesix properties.262023 2022 Impairment, restructuring and other costs $ (1,027) $ (41) On February 27, 2024, the Company announced its new strategy, A Bold New Chapter, which is designed to return the recovery in the macroeconomic environment.Impairment,Company to enterprise growth, unlock shareholder value, and better serve its customers. The $1.0 billion of impairment, restructuring and other costs recognized in 20212023 primarily relates to actions that align with A Bold New Chapter. The $957 million non-cash asset impairment charge recognized in 2023 primarily related to the approximately 150 locations planned for closure over the next three years, and the remaining non-cash impairment charge is associated with corporate and other assets. The $55 million of cash restructuring charges recognized in 2023 consisted primarily of cash expenditures related to employee termination and severance charges. The charges recognized in 2022 primarily related to the write-off of capitalized software assets. For 2020, these costs included goodwill and asset impairment charges, severanceandotherhumanresource related costs associated with organizational changes and store closures, driven by the impacts of the COVID-19 pandemic.2023 2022 Benefit plan income, net $ 11 $ 20 The Company recordsrecorded non-cashnetbenefitplanincomerelatingtotheCompany'sdefinedbenefitplans.Thisincomeincludesthenet amount ofinterestcost,expectedreturnonplanassetsand amortizationofpriorservicecostsorcreditsandactuarialgainsandlosses. The increase in benefit plan income from 2020related to 2021 was mainly driven by a reduction inthe Company's defined benefit plans. This income includes the net amount of interest cost, expected return on plan assets and amortization of prior service costs offsetor credits and actuarial gains and losses. The decrease in benefit plan income from 2022 to 2023 was mainly driven by a decrease in the expected return on assets.plan asset returns and higher discount rates as a result of market conditions. 2023 2022 Settlement charges $ (134) $ (39) The settlement Settlement charges in 2023 in 2021 were higher than 2022 as they primarily driven byrelated to the transfer of fully funded pension obligations for certain retirees and beneficiaries through the purchase of a group annuity contract with an insurance company.company. The settlement charges in 20202022 were primarily relatedtothepro-ratarecognitionofnetactuariallossesassociatedwiththeCompany’s Company's definedbenefitretirementplansas the result of lump sum distributions associated with retiree distribution elections.2023 2022 Net interest expense $ (135) $ (162) resultoflumpsumdistributionsassociatedwithretireedistributionelectionsandrestructuringactivity.29 primarily driven by an increase in interest income and interest savings associated with the redemptionfinancing activities completed in the first quarter of $1.3 billion 2025 Notes2022 as well as lower Asset Based Lending (ABL) Credit Facility borrowings in August 20212023 compared to 2022..2023 2022 Losses on early retirement of debt $ — $ (31) In2021, 2022, losses on early retirement of debt were recognized primarily due to the redemptionearly payment of the entire outstanding $1.3$1.1 billion aggregate principal amount of the 2025 Notessenior notes and debentures in the third quarter as well asMarch 2022.2023 2022 Effective tax rate 15.3 % 22.5 % Federal income statutory rate 21 % 21 % In 2023, income tax expense of $19 million, or 15.3% of pretax income reflects a $500 million tender offer executed in the first quarter.Thedifferent effective tax rate varies fromas compared to the Company’sCompany's federal income tax statutory rate of 21% in both periods.due to reduced pretax income as a result of the aforementioned impairment charges, which amplified the impact of net tax credits on the effective rate. In 2021,2022, income tax expense of $341 million, or 22.5% of pretax income, reflects a different effective tax rate as compared to the company's federal income tax statutory rate differential was driven primarily byof 21% due to the impact of state and local taxes. In 2020, the rate differential was driven primarily by the non-tax deductible component of the Company’s goodwill impairment charge, which was largelytaxes, partially offset by the benefit associated with the carryback of net operating losses permitted under the CARES Act.state tax settlements.27GuidanceOn February 22, 2022, the Company disclosed in its releaseTable of preliminary earnings its performance expectations for 2022, while acknowledging the significant uncertainty surrounding consumer behaviorContentsLiquidity and economic conditions in the current environment, as well as the continued uncertainty of the COVID-19 pandemic. For a more complete discussion of the COVID-19 pandemic related risks facing the Company's business, refer to Item 1A, “Risk Factors.”
Capital Resources•Net sales between $24.46 billion to $24.70 billion, flat to an increase of 1.0% versus 2021. Digital sales are expected to approximate 37% of net sales.•Comparable owned-plus-licensed sales three-year compound annual growth rate (CAGR) versus 2019 of approximately 1.1% to 1.4%•Credit card revenues, net, approximately 2.9% of net sales•Gross margin rate between 38.1% and 38.3%•SG&A expenses as a percentage of net sales between 33.7% and 33.9%•Gains on sale of real estate between $60 million and $90 million•Benefit plan income of approximately $28 million•Depreciation and amortization expense of approximately $865 million•Adjusted EBITDA between 11.0% and 11.5% of net sales•Net interest expense of approximately $190 million•An adjusted tax rate of approximately 24%•Diluted shares outstanding of approximately 300 million (assumes no share repurchase during 2022)•Adjusted diluted earnings per share between $4.13 and $4.52•Capital expenditures of approximately $1 billionLiquidityandCapitalResourcesJanuary 29, 2022,February 3, 2024, related to leases, debt, and retirement plans, respectively.30We believe that our available cash, together with expected future cash generated from operations, the amount available under our credit facility, and credit available in the market will be sufficient to satisfy our anticipated needs for working capital, capital expenditures, and cash dividends for at least the next 12 months and the foreseeable future thereafter.Capital AllocationThe Company’sCompany's capital allocation goals include maintaining a healthy balance sheet and investment-grade credit metrics to be best-positioned for access to bank and capital market funding under all economic scenarios, followed by investing in the business through initiatives to drive long-term profitable growth initiatives and returning capital to shareholders through modest yet predictable dividends and meaningful share repurchases.In 2020, in response to COVID-19, the Company suspended its share repurchase program and its quarterly dividend. In August 2021, as the Company recovered with strong performance throughout the year, it redeemed $1.3 billion of secured notes and announced that its Board of Directors authorized a new $500 million share repurchase program and that it reinstated its regular quarterly dividend.The Company ended the year with a cash and cash equivalents balance of $1,712$1,034 million, an increase from $1,679$862 million in 2020.2022. Also, the Company is party to the ABL Credit Facility with certain financial institutions providing for a $2,941$3,000 million Revolving ABL Facility. As of January 29, 2022, availableFebruary 3, 2024, borrowing capacity of the ABL Credit Facility was $2,536$2,852 million, which considers a $116$148 million reduction due to standby letters of credit outstanding.outstanding and borrowing availability was $2,582 million, which considers a further $270 million reduction due to inventory levels and its impact on the ABL borrowing base.2023 2023 2022 2021 Net cash used by financing activities OperatingActivitiesNet cash provided by operating activities was $2,712$1,305 million in 20212023 compared to $649$1,615 million in 2020.2022. The increasedecrease was primarily drivenbyhigher lower adjusted EBITDA and a $582 million income tax refund as a result of the CARES Act. This wasworking capital changes, partially offset by higherlower interest payments net of interest received and lower cash interesttax payments. The 2023 fiscal year ended in the beginning of calendar February compared to the end of calendar January in fiscal 2022, resulting in a larger reduction in accounts payable and a net decreaseaccrued liabilities in working capital, mainly driven by an increase in merchandise inventories. Merchandise inventory increased from $3,774 million in 2020fiscal 2023 compared to $4,383 million in 2021 as sales recovered from 2020.The Company’sCompany's future material contractual obligations and commitments as it relates to operating activities as of January 29, 2022February 3, 2024 are approximately $6.8$6.5 billion of operating lease obligations primarily due after 20262027 and $3.2$2.8 billion of other obligations, primarilythe majority consisting of merchandise purchase obligations due in less than one year. Note 4 and Note 14 to the Financial Statements provide additional information on operating leases and other obligations, respectively.InvestingActivitiesThe Company’s 2021Company's 2023 capital expenditures were $597$993 million, mainly driven by its technology-based initiatives, including those that support the digital business,and technology investments, data science initiatives and the simplification of its technology structure.analytics, supply chain modernization and enhanced omni-channel capabilities. The Company also opened nine new stores in 20212023 across nameplates and formats, and continued to invest in its current stores.The Company expects capital expenditures to be approximately $1 billion$875 million during 2022.2024. The Company’sCompany's spend will be primarily allocated towardsfocused on initiatives that will support A Bold New Chapter, including digital and technology architecture, data science applications for retail operations, digital platform enhancements, fulfilment capabilitiesinvestments, investments in our remaining go-forward locations, small format store openings and further upstream, and personalization efforts.omni-channel capabilities. These expenditures are expected to be financed with cash from operations and existing cash and cash equivalents. There can be no assurance that current expectations will be realized and plans are subject to change upon further review of capital expenditure needs or based on the current economic environment.Financing ActivitiesDividendsThe Company paid dividends totaling $90 million 2021 and $117$181 million in 2020.2023 and $173 million in 2022. The Board of Directors declared regular quarterly dividenddividends of 1516.54 cents per share on the Company’sCompany's common stock, paid on April 3, 2023, July 3, 2023, October 1, 20212, 2023 and January 3, 2022,2, 2024, to Macy’sMacy's, Inc. shareholders of record at the close of business on March 15, 2023, June 15, 2023, September 15, 20212023 and December 15, 2021,2023, respectively.3128OnFebruary 22, 2022,23, 2024, the Company's Board of Directors declared a regular quarterly dividend of 15.7517.37 cents per share on its common stock, payable April 1, 2022,2024, to shareholders of record at the close of business on March 15, 2022. 2024. Subsequent dividends will be subject to approval of the Board of Directors, which will depend on market and other conditions.Stock RepurchasesThe Company completed its 2021 $500 million share repurchase program by January 29, 2022. During 2021, the Company repurchased 20.5 million shares of its common stock, which represents more than 6.5% of shares outstanding, at an average cost of $24.40 per share.On February 22, 2022, the Company’sCompany announced that its Board of Directors authorized a new $2.0 billion share repurchase program, which does not have an expiration date. During 2023, the Company repurchased approximately 1.4 million shares of its common stock at an average cost of $17.57 per share for $25 million. During 2022, the Company repurchased 24.0 million shares of its common stock at an average cost of $24.98 per share for $600 million. As of February 3, 2024, $1.4 billion remains available under the authorization. Repurchases may be made from time to time in the open market or through privately negotiated transactions in accordance with applicable securities laws, including Rule 10b-18 under the Securities Exchange Act of 1934, on terms determined by the Company.Debt TransactionsThe Company completedborrowed and repaid $961 million under the followingABL Credit Facility in 2023. The Company had no outstanding borrowings under the ABL Credit Facility as of February 3, 2024.At February 3, 2024, no notes or debentures contained provisions requiring acceleration of payment upon a debt transactionsrating downgrade. However, the terms of approximately $2,409 million in 2021:•On March 17, 2021, the Company issued $500 million of senior unsecured notes due 2029 in a private offering and used the net proceeds, together with cash on hand, to fund a tender offer in which $500 million of senior notes and debentures with maturities ranging from 2022-2025 were tendered for early settlement.•On August 17, 2021, the Company redeemed the entire outstanding $1.3 billion aggregate principal amount of the 2025 Notes, subject to losses on early retirement of debt of $185 million.•On October 15, 2021, the Company redeemed the entire outstanding $294 million aggregate principal amount of the 2022 Notes.•The Company borrowed and repaid $585 million under the ABL Credit Facility in 2021. The Company had no outstanding borrowings under the ABL Credit Facility as of January 29, 2022.Subsequent to 2021 and prior to the issuance of this report,Company's senior notes outstanding at that date require the Company completedto offer to purchase such notes at a price equal to 101% of their principal amount plus accrued and unpaid interest if there is both a change of control (as defined in the following debt transactions:•On March 3, 2022, the Company entered into a third amendment to the ABL Credit Facility which provides for a new Revolving Credit Facility of $3.0 billion. Borrowings under the New ABL Credit Facility are subject to reduced interest at a rate.•On March 8, 2022, the Company completed a tender offer in which $8 million of certain senior secured notes were tendered for early settlement and the collateral that secured the remaining $352 million of the Company’s senior secured notes was automatically released. •On March 10, 2022, the Company issued $425 million of senior notes due 2030 and $425 million of senior notes due 2032 in a private offering. Proceeds from the issuance, together with cash on hand, were used to redeem certain of its outstanding senior notes and pay fees and expenses in connection with the offering.At January 29, 2022, no notesordebenturescontainedprovisionsrequiringaccelerationofpaymentuponadebt ratingdowngrade.However,thetermsofapproximately$2,574 millioninaggregateprincipalamountoftheCompany'sseniornotesoutstandingatthatdaterequiretheCompanytooffertopurchasesuchnotesatapriceequalto101%oftheirprincipalamountplusaccruedandunpaidinterestifthereisbothachangeofcontrol(asdefinedintheapplicable indenture)oftheCompanyandthenotesareratedbyspecifiedratingagenciesatalevelbelowinvestmentgrade.The Company’sCompany's future contractual obligations and commitments as it relates to financing activities as of January 29, 2022February 3, 2024 are $3.3$3.0 billion of long-term debt obligations and $1.6 billion of related interest, $116$148 million of standby letters of credit and $27$21 million of finance lease obligations. Note 6 and Note 4 to the Financial Statements provide additional information on debt and finance leases, respectively.As a result of February 3, 2024, the subsequent event financing activities noted above, interest obligationsCompany's credit rating and outlook were increased to $1.9 billion.32AsofJanuary29,2022,as described in theCompany'screditratingandoutlookwereasdescribedinthetable below.Moody's
Poor'sFitch Long-term debt Ba1 Moody'sBB+ Poor'sFitchLong-term debtStable Ba2Stable BB-BB+OutlookPositiveStableSubsequent to January 29, 2022, Moody’s upgraded the Company’s long-term debt rating to Ba1, Standard & Poor’s upgraded the Company’s long-term debt rating to BB, and Fitch upgraded the Company’s long-term debt rating to BBB-.Guarantor Summarized Financial InformationThe Company has senior unsecured notes and senior unsecured debentures (collectively the “Unsecured Notes”)Unsecured Notes) outstanding with an aggregate principal amount of $2,935$3,007 million outstanding as of January 29, 2022,February 3, 2024, with maturities ranging from 20222025 to 2043. The Unsecured Notes constitute debt obligations of MRH ("Macy's Retail Holdings, LLC (MRH, or Subsidiary Issuer")Issuer), a 100%-owned subsidiary of Macy's, Inc. ("Parent"(Parent together with the "Subsidiary Issuer"Subsidiary Issuer are the "Obligor Group")Obligor Group), and are fully and unconditionally guaranteed on a senior unsecured basis by Parent. The Unsecured Notes rank equally in right of payment with all of the Company’sCompany's existing and future senior unsecured obligations, senior to any of the Company’sCompany's future subordinated indebtedness, and are structurally subordinated to all existing and future obligations of each of the Company’sCompany's subsidiaries that do not guarantee the Unsecured Notes. Holders of the Company’sCompany's secured indebtedness, including the Notes and any borrowings under the ABL Credit Facility, will have a priority claim on the assets that secure such secured indebtedness; therefore, the Unsecured Notes and the related guarantee are effectively subordinated to all of the Subsidiary Issuer’sIssuer's and Parent and their subsidiaries’subsidiaries' existing and future secured indebtedness to the extent of the value of the collateral securing such indebtedness.The following tables include combined financial information of the Obligor Group. Investments in subsidiaries of $7,975$9,423 million as of January 29, 2022February 3, 2024 have been excluded from the Summarized Balance Sheets. Equity in the earnings of non-Guarantor subsidiaries of $2,208$2,291 million have been excluded from the Summarized Statement of Operations. The combined financial information of the Obligor Group is presented on a combined basis with intercompany balances and transactions within the Obligor Group eliminated.29Summarized Balance SheetFebruary 3, 2024 (in millions) ASSETS a)Current AssetsIncludes net amounts due to non-Guarantor subsidiaries of $4,337 million1,028 Noncurrent Assets 6,145 LIABILITIES Current Liabilities $ 1,800 Noncurrent Liabilities (a) 10,654 a)Includes net amounts due to non-Guarantor subsidiaries of $5,645 millionSummarized Statement of Operations2023 (in millions) Net Sales a)$Income pertains to transactions with ABL Borrower, a non-Guarantor subsidiaryConsignment commission income (a)3,584 Other revenue 159 Cost of sales (457) Operating loss (1,837) Loss before income taxes (b) (1,325) Net loss (1,313) b)a)Income pertains to transactions with ABL Borrower, a non-Guarantor subsidiaryIncludes $1,055 million of dividend income from non-Guarantor subsidiaries33b)Includes $874 million of dividend income from non-Guarantor subsidiariesImportantInformationRegardingNon-GAAPFinancialMeasuresTheCompanyreportsitsfinancialresultsinaccordancewith GAAP. However,managementbelievesthatcertainnon-GAAPfinancialmeasuresprovideusersoftheCompany'sfinancialinformationwithadditionalusefulinformationin evaluatingoperatingperformance.Managementbelievesthatprovidingsupplementalchangesincomparablesalesonan ownedpluslicensedbasis,whichincludestheimpactofgrowthincomparablesalesofdepartmentslicensedtothird parties,assistsinevaluatingtheCompany'sabilitytogeneratesalesgrowth,whetherthroughownedbusinessesor departmentslicensedtothirdparties,onacomparablebasis,andinevaluatingtheimpactofchangesinthemannerin whichcertaindepartmentsareoperated. Earnings (loss) before interest, taxes, depreciation and amortization (EBITDA) is a non-GAAP financial measure whichthat the company believes provides meaningful information about its operational efficiency by excluding the impact of changes in tax law and structure, debt levels and capital investment. Inaddition,managementbelievesthatexcludingcertainitemsthatarenot associatedwiththeCompany'scoreoperationsandthatmayvarysubstantiallyinfrequencyandmagnitudeperiod-to-periodfrom net income, (loss), dilutedearnings (loss) pershareattributable and EBITDA provide useful supplemental measures that assist in evaluating the Company's ability toMacy's,Inc.shareholders andEBITDAprovideusefulsupplementalmeasuresthatassistinevaluatingtheCompany'sabilitytogenerateearningsand leveragesales,respectively,andtomorereadilycomparethesemetricsbetweenpastandfutureperiods.ManagementalsobelievesthatEBITDAandAdjustedEBITDAarefrequentlyusedbyinvestorsandsecurities analystsintheirevaluationsofcompanies,andthatsuchsupplementalmeasuresfacilitatecomparisonsbetweencompanies thathavedifferentcapitalandfinancingstructuresand/ortaxrates.Inaddition,managementbelievesthat return on invested capital (ROIC)isausefulsupplementalmeasureinevaluatinghowefficientlythe The Companyemploysitscapital.TheCompanyusescertain non-GAAPfinancialmeasuresasperformancemeasuresforcomponentsofexecutivecompensation.The Company does not provide reconciliations of the forward-looking non-GAAP measures of comparable owned plus licensed sales change, adjusted EBITDA, adjusted tax rate and adjusted diluted earnings per share comparable owned-plus-licensed sales three-year CAGR, and adjusted tax rate to the most directly comparable forward-looking GAAP measures because the timing and amount of excluded items are unreasonably difficult to fully and accurately estimate. For the same reasons, the Company is unable to address the probable significance of the unavailable information, which could be material to future results.30Non-GAAPfinancialmeasuresshouldbeviewedassupplementing,andnotasanalternativeorsubstitutefor,theCompany'sfinancialresultspreparedinaccordancewithGAAP.Certainoftheitemsthatmaybeexcludedorincludedinnon-GAAPfinancialmeasuresmaybesignificantitemsthatcouldimpacttheCompany'sfinancialposition,resultsof operationsorcashflowsandshouldthereforebeconsideredinassessingtheCompany'sactualandfuturefinancial conditionandperformance.Additionally,theamountsreceivedbytheCompanyonaccountofsalesofdepartmentslicensedtothirdpartiesarelimitedtocommissionsreceivedonsuchsales.ThemethodsusedbytheCompanytocalculate itsnon-GAAPfinancialmeasuresmaydiffersignificantlyfrommethodsusedbyothercompaniestocomputesimilarmeasures.Asaresult,anynon-GAAPfinancialmeasurespresentedhereinmaynotbecomparabletosimilarmeasures providedbyothercompanies.ChangesinComparableSalesThefollowingisatabularreconciliationofthenon-GAAPfinancialmeasureofchangesincomparablesalesonan ownedpluslicensedbasis,toGAAPcomparablesales(i.e. (i.e.,onanownedbasis),whichtheCompanybelievestobethe most directly comparable GAAP financial measure.Macy's, Inc. 53 Weeks Ended February 3, 2024vs.52 Weeks EndedJanuary 28, 202352 Weeks Ended January 28, 2023vs.52 Weeks EndedJanuary 29, 202252 Weeks Ended January 29, 2022vs.52 Weeks EndedJanuary 30, 2021Increase (decrease) in comparable sales on an owned basis (Note 1) (6.9) % 0.3 % 43.0 % Impact of growth in comparable sales of departments licensed to third parties (Note 2) 0.9 % 0.3 % (0.1) % Increase (decrease) in comparable sales on an owned plus licensed basis (6.0) % 0.6 % 42.9 % (1)directlyRepresents the period-to-period percentage change in net sales from stores in operation throughout the year presented and the immediately preceding year, adjusting for the 53rd week in fiscal 2023. Such calculation includes all digital sales and excludes commissions from departments licensed to third parties or Marketplace. Stores impacted by a natural disaster or undergoing significant expansion or shrinkage remain in the comparable sales calculation unless the store, or a material portion of the store, is closed for a significant period of time. Definitions and calculations of comparable sales differ among companies in the retail industry.(2)Represents the impact of including the sales of departments licensed to third parties occurring in stores in operation throughout the year presented and the immediately preceding year, including Marketplace sales, adjusting for the 53rd week in fiscal 2023 in the calculation of comparable sales. Macy's and Bloomingdale's license third parties to operate certain departments in its stores and online and receives commissions from these third parties based on a percentage of their net sales, while Bluemercury does not participate in licensed or Marketplace businesses. In its financial statements prepared in conformity with GAAP, the Company includes these commissions (rather than sales of the departments licensed to third parties) in its net sales. The Company does not, however, include any amounts in respect of licensed department or Marketplace sales (or any commissions earned on such sales) in its comparable sales in accordance with GAAP (i.e., on an owned basis). The amounts of commissions earned on sales of departments licensed to third parties and from the digital Marketplace are not material to its net sales for the periods presented.GAAPfinancialmeasure.31(1)Representstheperiod-to-periodpercentagechangeinnetsalesfromstoresinoperationthroughouttheyearpresented andtheimmediatelyprecedingyearandallonlinesales,excludingcommissions fromdepartmentslicensedtothirdparties.Storesimpactedbyanaturaldisasterorundergoingsignificantexpansionorshrinkageremaininthecomparablesalescalculationunlessthestore,oramaterialportionofthestore,isclosedfora significantperiodoftime. No stores have been excluded as a result of the COVID-19 pandemic. Definitionsandcalculationsofcomparablesalesdifferamongcompaniesintheretailindustry.34(2)Representstheimpactofincludingthesalesofdepartmentslicensedtothirdpartiesoccurringinstoresinoperation throughouttheyearpresentedandtheimmediatelyprecedingyearandallonlinesales inthecalculationofcomparablesales.TheCompanylicensesthirdpartiestooperatecertaindepartmentsinits storesandonlineandreceivescommissionsfromthesethirdpartiesbasedonapercentageoftheirnetsales.Inits financialstatementspreparedinconformitywithGAAP,theCompanyincludesthesecommissions(ratherthansalesofthedepartmentslicensedtothirdparties)initsnetsales.TheCompanydoesnot,however,includeanyamountsinrespectoflicenseddepartmentsales(oranycommissionsearnedonsuchsales)initscomparablesalesinaccordance withGAAP(i.e.,onanownedbasis).Theamountsofcommissionsearnedonsalesofdepartmentslicensedtothird partiesarenotmaterialtoitsnetsalesfortheperiodspresented.Adjusted Net Income (Loss) and Adjusted DilutedEarnings (Loss) PerShareThefollowingisatabularreconciliationofthenon-GAAPfinancialmeasures adjusted net income (loss) to GAAP net income (loss) and adjusteddilutedearnings (loss) persharetoGAAPdilutedearnings (loss) pershare,whichtheCompanybelievestobethemostdirectlycomparableGAAPmeasures.2023 2022 2021 Net Income Diluted
Earnings
Per ShareNet Income Diluted
Earnings
Per ShareNet Income Diluted
Earnings
Per Share(millions, except per share data) As reported $ 105 $ 0.38 $ 1,177 $ 4.19 $ 1,430 $ 4.55 Impairment, restructuring and other costs 1,027 3.69 41 0.15 30 0.10 Settlement charges 134 0.48 39 0.14 96 0.31 Losses on early retirement of debt — — 31 0.11 199 0.63 Income tax impact of certain items identified above (293) (1.05) (29) (0.11) (87) (0.28) As adjusted $ 973 $ 3.50 $ 1,259 $ 4.48 $ 1,668 $ 5.31 EBITDA and AdjustedEBITDAThefollowingisatabularreconciliationofthenon-GAAPfinancialmeasure EBITDA and Adjusted EBITDA to GAAP net income, which the Company believes to be the most comparable GAAP measure.2023 2023 2022 2021 (millions) (millions) Net income Federal, state and local income tax expense Federal, state and local income tax expense Federal, state and local income tax expense ROICHistorically,theCompanydefinedROICasadjustedEBITDA,excludingnetleaseexpense,asapercenttoaverageinvestedcapital.Averageinvestedcapitaliscomprisedofanannualtwo-point(i.e.,endoftheyearpresentedandtheimmediatelyprecedingyear)averageofgrosspropertyandequipment, totallease right of use (“ROU”)assets,excludingvariablerentwhichisstillmultipliedbyafactorofeight,andafour-point(i.e.,endofeachquarterwithintheperiodpresented)averageofotherselectedassetsandliabilities.Thecalculationofthecapitalizedvalueofnon-capitalizedleasesisconsistentwithindustryandcreditratingagencypracticeandthespecifiedassetsaresubjecttoafour-pointaveragetocompensateforseasonalfluctuations.35The following is a tabular reconciliation of the non-GAAP financial measure of ROIC to net income as a percent to propertyandequipment-net,whichtheCompanybelievestobethemostdirectlycomparableGAAPfinancialmeasure.36CriticalAccountingEstimatesThe preparation of our consolidated financial statements in accordance with U.S. generally accepted accounting principles (U.S. GAAP) requires that we make estimates and assumptions that affect the reported amounts of assets and liabilities and the disclosure of contingent assets and liabilities at the date of the financial statements and the reported amounts of revenues and expenses during the reporting period. We base our estimates on historical experience and on assumptions that we believe to be reasonable, and we continue to review and evaluate these estimates. For further information on significant accounting policies, see discussion in Note 1 to the consolidated financial statements included in Item 8 of this Report.MerchandiseInventoriesMerchandiseinventoriesarevaluedatthelowerofcostormarketusingthelast-in,first-out("LIFO") (LIFO) retailinventory method.Undertheretailinventorymethod,inventoryissegregatedintodepartmentsofmerchandisehavingsimilar characteristics and its cost value isstatedatits derived from the currentretailsellingvalue.Theretailinventorymethodinherentlyrequires operational management judgmentsandestimates,suchastheamountandtimingofpermanentmarkdownstoclearunproductiveorslow-moving inventory,whichmayimpacttheendinginventoryvaluationaswellasgrossmargins.Permanentmarkdownsdesignatedforclearanceactivityarerecordedwhentheutilityoftheinventoryhas diminished.Factors Operational factors consideredinthedeterminationofpermanentmarkdowns determining to permanently markdown inventory includecurrentandanticipateddemand, customerpreferences,ageofthemerchandiseandfashiontrends.Whenadecisionismadetopermanentlymarkdown merchandise, the resulting gross margin reduction is recognized in the period the markdown is recorded.32Long-LivedAssetImpairmentandRestructuringChargesThecarryingvaluesoflong-livedassets,inclusiveof right of use (ROU) (ROU) assets,areperiodicallyreviewedbytheCompany whenevereventsorchangesincircumstancesindicatethatthecarryingvaluemaynotberecoverable,suchashistorical operatinglossesorplanstoclosestoresbeforetheendoftheirpreviouslyestimatedusefullives.Additionally,onanannualbasis,therecoverabilityofthecarryingvaluesofindividualstoresisevaluated.Apotentialimpairmenthasoccurredif projectedfutureundiscountedcashflowsarelessthanthecarryingvalueoftheassets.Theestimateofcashflowsincludes management'sassumptionsofcashinflowsandoutflowsdirectlyresultingfromtheuseofthoseassetsinoperations.When apotentialimpairmenthasoccurred,animpairmentwrite-downisrecordedifthecarryingvalueofthelong-livedasset exceedsitsfairvalue.TheCompanybelievesitsestimatedcashflowsaresufficienttosupportthecarryingvalueofitslong-livedassets.Ifestimatedcashflowssignificantlydifferinthefuture,theCompanymayberequiredtorecordassetimpairmentwrite-downs.During fiscal 2023, the Company recognized impairment charges of $957 million primarily related to the approximately 150 locations planned for closure over the next three years as part of A Bold New Chapter strategy, and the remaining associated with corporate and other assetsIftheCompanycommitstoaplantodisposeofalong-livedassetbeforetheendofitspreviouslyestimateduseful life or changes its use of corporate assets,estimatedcashflowsarerevisedaccordingly,andtheCompanymayberequiredtorecordanassetimpairmentcharge.Additionally,relatedliabilitiesarisesuchasseverance,contractualobligationsandotheraccrualsassociatedwithstoreclosingsfromdecisionstodisposeofassets.TheCompanyestimatestheseliabilitiesbasedonthefactsand circumstancesinexistenceforeachrestructuringdecision.TheamountstheCompanywillultimatelyrealizeordisburse coulddifferfromtheamountsassumedinarrivingattheassetimpairmentandrestructuringchargerecorded.GoodwillandIntangibleAssetsTheCompanyreviewsthecarryingvalueofitsgoodwillandotherintangibleassetswithindefinitelivesatleast annually,asoftheendoffiscal May,ormorefrequentlyifaneventoccursorcircumstanceschange,forpossibleimpairmentinaccordancewithASCTopic350,Intangibles-GoodwillandOther.Forimpairmenttesting,goodwillhasbeenassignedtoreportingunitswhichconsistoftheCompany'sretailoperatingdivisions.Macy'sandbluemercuryarethe onlyreportingunitswithgoodwillasof January 29, 2022,amounts assumed in arriving at the asset impairment and98%of restructuring charge recorded.Goodwill and Intangible AssetsThe Company reviews theCompany'sgoodwillisallocatedtotheMacy's reportingunit.TheCompanymayelecttoevaluatequalitativefactorstodetermineifitismorelikelythannotthatthefairvalueofa reportingunitorfairvalueofindefinitelivedintangibleassetsislessthanitscarryingvalue.Ifthequalitativeevaluation indicatesthatitismorelikelythannotthatthefairvalueofareportingunitorindefinitelivedintangibleassetislessthanits carryingamount,aquantitativeimpairmenttestisrequired.Alternatively,theCompanymaybypassthequalitativeassessmentforareportingunitorindefinitelivedintangibleassetanddirectlyperformthequantitativeassessment.This determinationcanbemadeonanindividualreportingunitorassetbasis,andperformanceofthequalitativeassessmentmay resumeinasubsequentperiod.37Thequantitativeimpairmenttestinvolvesestimatingthefairvalueofeachreportingunitandindefinitelived intangibleassetandcomparingtheseestimatedfairvalueswiththerespectivereportingunitorindefinitelivedintangible assetcarryingvalue.Ifthecarryingvalueofareportingunitexceedsitsfairvalue,animpairmentlosswillberecognized inanamountequaltosuchexcess,limitedtothetotalamountofgoodwillallocatedtothereportingunit.Ifthecarrying valueofanindividualindefinitelivedintangibleassetexceedsitsfairvalue,suchindividualindefinitelived goodwill and other intangible assetiswrittendownbyanamountequaltosuchexcess.Estimatingthefairvaluesofreportingunitsandassets with indefinitelivedintangibleassetsinvolvestheuseofsignificant assumptions,estimatesandjudgmentswithrespecttoavarietyoffactors,includingsales,grossmarginandSG&A expense rates,capitalexpenditures,cashflowsandtheselectionanduseofanappropriatediscountrateandmarketvaluesandmultiples ofearningsandrevenuesofsimilarpubliccompanies.Projectedsales,grossmarginandSG&AexpenserateassumptionsandcapitalexpendituresarebasedontheCompany'sannualbusinessplanorotherforecastedresults.Discountratesreflect market-basedestimatesoftherisksassociatedwiththeprojectedcashflowsofthereportingunitorindefinitelived intangibleasset.Theuseofdifferentassumptions,estimatesorjudgmentsinthegoodwillimpairmenttestingprocess,includingwithrespecttotheestimatedfuturecashflowsoftheCompany'sreportingunits,thediscountrateusedtodiscountsuch estimatedcashflowstotheirnetpresentvalue,andthereasonablenessoftheresultantimpliedcontrolpremiumrelativeto theCompany'smarketcapitalization,couldmateriallyincreaseordecreasethefairvalueofthereportingunitand/oritsnet assetsand,accordingly,couldmateriallyincreaseordecreaseanyrelatedimpairmentcharge.During the first quarter of 2020, lives at least annually, as a result of the sustained declineend of fiscal May, or more frequently if an event occurs or circumstances change, for possible impairment in accordance with ASC Topic 350, Intangibles - Goodwill and Other. For impairment testing, goodwill has been assigned to reporting units which consist of the Company's market capitalizationretail operating divisions. Macy's and changes inBluemercury are the only reporting units with goodwill as of February 3, 2024, and 98% of the Company's long-term projections driven largely bygoodwill is allocated to the impactsMacy's reporting unit.The Company may elect to evaluate qualitative factors to determine if it is more likely than not that the fair value of a reporting unit or fair value of indefinite lived intangible assets is less than its carrying value. If the qualitative evaluation indicates that it is more likely than not that the fair value of a reporting unit or indefinite lived intangible asset is less than its carrying amount, a quantitative impairment test is required. Alternatively, the Company may bypass the qualitative assessment for a reporting unit or indefinite lived intangible asset and directly perform the quantitative assessment. This determination can be made on an individual reporting unit or asset basis, and performance of the COVID-19 pandemic,qualitative assessment may resume in a subsequent period.The quantitative impairment test involves estimating the Company determinedfair value of each reporting unit and indefinite lived intangible asset and comparing these estimated fair values with the respective reporting unit or indefinite lived intangible asset carrying value. If the carrying value of a triggering event had occurred that requiredreporting unit exceeds its fair value, an interim impairment assessment for allloss will be recognized in an amount equal to such excess, limited to the total amount of goodwill allocated to the reporting unit. If the carrying value of an individual indefinite lived intangible asset exceeds its fair value, such individual indefinite lived intangible asset is written down by an amount equal to such excess.Estimating the fair values of reporting units and indefinite lived intangible assets. assets involves the use of significant assumptions, estimates and judgments with respect to a variety of factors, including projected sales, gross margin and SG&A expense rates, capital expenditures, cash flows and the selection and use of an appropriate discount rate and market values and multiples of earnings and revenues of similar public companies. Projected sales, gross margin and SG&A expense rate assumptions and capital expenditures are based on the Company's annual business plan or other forecasted results. Discount rates reflect market-based estimates of the risks associated with the projected cash flows of the reporting unit or indefinite lived intangible asset.The Company determineduse of different assumptions, estimates or judgments in the goodwill impairment testing process, including with respect to the estimated future cash flows of the Company's reporting units, the discount rate used to discount such estimated cash flows to their net present value, and the reasonableness of the resultant implied control premium relative to the Company's market capitalization, could materially increase or decrease the fair value of each of its reporting units using a market approach or a combination of a market approach and income approach, as appropriate. Relative to the prior assessment, as part of this interim 2020 assessment, it was determined that an increase in the discount rate applied in the valuation was required to align with market-based assumptions and company-specific risk. The revised long-term projections, in conjunction with this higher discount rate, resulted in lower fair values of the reporting units. As a result, the Company recognized $2,982 millionunit and/or its net assets and, $98 million of goodwillaccordingly, could materially increase or decrease any related impairment for the Macy's and bluemercury reporting units, respectively, during 2020, the majority of which was recognized during the first quarter of 2020.For the Company's annual impairment assessment as of the end of fiscal May 20202023 and 2021,2022, the Company elected to perform a qualitative impairment test on its goodwill and intangible assets with indefinite lives and concluded that it is more likely than not that the fair values exceeded the carrying values and goodwill and intangible assets with indefinite lives were not impaired.33During the third quarter of fiscal 2023, the Company observed a general decline in the market valuation of the Company’s common shares and performed an interim qualitative impairment test on its reporting units. As a result of this test, the Company concluded that it is more likely than not that the fair values of its reporting units exceeded the carrying values and goodwill is not impaired.The Company continues to monitor the key inputs to the fair values of its reporting units. A decline in market capitalization or future declines in macroeconomic factors or business conditions may result in additional impairment charges in future periods.IncomeTaxesIncometaxesareestimatedbasedonthetaxstatutes,regulationsandcaselawofthevariousjurisdictionsinwhichthe Companyoperates.Deferredincometaxassetsandliabilitiesarerecognizedforthefuturetaxconsequencesattributable todifferencesbetweenthefinancialstatementcarryingamountsofexistingassetsandliabilitiesandtheirrespective taxbases,andnetoperatinglossandtaxcreditcarryforwards.Deferredincometaxassetsandliabilitiesaremeasured usingenactedtaxratesexpectedtoapplytotaxableincomeintheyearsinwhichthosetemporarydifferencesareexpectedtoberecoveredorsettled.Deferredincometaxassetsareevaluatedforrecoverabilitybasedonallavailableevidence, includingpastoperatingresults,estimatesoffuturetaxableincome,andthefeasibilityoftaxplanningstrategies.Deferred incometaxassetsarereducedbyavaluationallowancewhenitismorelikelythannotthatsomeportionofthedeferred incometaxassetswillnotberealized.Uncertaintaxpositionsarerecognizediftheweightofavailableevidenceindicatesthatitismorelikelythannotthat thetaxpositionwillbesustainedonexamination,includingresolutionofanyrelatedappealsorlitigationprocesses,based onthetechnicalmeritsoftheposition.Uncertaintaxpositionsmeetingthemore-likely-than-notrecognitionthresholdare thenmeasuredtodeterminetheamountofbenefiteligibleforrecognitioninthefinancialstatements.Eachuncertaintax positionismeasuredatthelargestamountofbenefitthatismorelikelythanassets will nottoberealizeduponultimatesettlement.38Uncertaintaxpositionsareevaluatedandadjustedasappropriate,whiletakingintoaccounttheprogressofauditsof varioustaxingjurisdictions.ResolutionofthesematterscouldhaveamaterialimpactontheCompany'sconsolidated financialposition,resultsofoperationsorcashflows.SignificantjudgmentisrequiredinevaluatingtheCompany'suncertaintaxpositions,provisionforincometaxes, realized.Pension and anyvaluationallowancerecordedagainstdeferredtaxassets.AlthoughtheSupplementary Retirement PlansThe Companybelievesthatitsjudgmentsare reasonable,noassurancecanbegiventhatthefinaltaxoutcomeofthesematterswillnotbedifferentfromthatwhichisreflectedintheCompany'shistoricalincomeprovisions has a funded defined benefit pension plan (the Pension Plan) andaccruals.PensionandSupplementaryRetirementPlansTheCompanyhasafunded an unfunded definedbenefitpensionplan(the“PensionPlan”)andanunfundeddefinedbenefit supplementaryretirementplan( (the SERP). The Company accounts for these plans in accordance with ASC Topic 715, Compensation - Retirement Benefits. Under ASC Topic 715, an employer recognizes the“SERP”).TheCompanyaccountsfortheseplans funded status of a defined benefit postretirement plan as an asset or liability on the balance sheet and recognizes changes inaccordancewithASCTopic715,Compensation-RetirementBenefits.UnderASCTopic715,anemployerrecognizes that funded status in thefundedstatusofadefinedbenefitpostretirementplanasanassetorliabilityonthebalancesheetandrecognizeschangesinthatfundedstatusintheyearin whichthechangesoccurthroughcomprehensiveincome (loss).Additionally,pensionexpenseisgenerallyrecognizedonanaccrualbasisovertheaverageremaininglifetimeofparticipants.Thepensionexpensecalculationisgenerallyindependent offundingdecisionsorrequirements.ThePensionProtectionActof2006providesthefundingrequirementsforthePensionPlanwhicharedifferentfromtheemployer'saccountingfortheplanasoutlinedinASCTopic715.Nofundingcontributionswererequired,andtheCompanymadenofundingcontributionstothePensionPlanin2021 2023 and2020. 2022. Asofthedateofthisreport,theCompany doesnotanticipatemakingfundingcontributionstothePensionPlanin2022.Thecalculationofpensionexpenseandpensionliabilitiesrequirestheuseofanumberofassumptions.Changesin theseassumptionscanresultindifferentexpenseandliabilityamounts,andfutureactualexperiencemaydiffersignificantlyfromcurrentexpectations.TheCompanybelievesthatthemostcriticalassumptionsrelatetothelong-term rateofreturnonplanassets(in (in thecaseofthePensionPlan)andthediscountrateusedtodeterminethepresentvalueof projectedbenefitobligations.The Company's assumed annual long-term rate of return for the Pension Plan's assets was 5.30% for 2023, 4.60% for 2022 and 5.75% for 2021 6.25% for 2020 and 6.50% for 2019 based on expected future returns on the portfolio of assets. As of January 29, 2022,February 3, 2024, the Company loweredheld flat the assumed annual long-term rate of return for the Pension Plan's assets from 5.75% to 4.60%at 5.30% based on expected future returns on the portfolio of assets, which considers a shift in the Company’s investment strategy to invest more heavily in fixed income securities.assets. The Company develops its expected long-term rate of return assumption by evaluating input from several professional advisors taking into account the asset allocation of the portfolio and long-term asset class return expectations, as well as long-term inflation assumptions.PensionexpenseincreasesordecreasesastheexpectedrateofreturnontheassetsofthePension Plandecreasesorincreases,respectively.Loweringorraisingtheexpectedlong-termrateofreturnassumptiononthePensionPlan'sassetsby0.25%wouldincreaseordecreasetheestimated2022 2024 pensionexpensebyapproximately$7 $5 million.TheCompanydiscounteditsfuturepensionobligationsusingaweighted-averagerateof 3.06% 5.06% at February 3, 2024 and 4.73% at January 29, 202228, 2023 for the Pension Plan and 2.43%5.08% at January 30, 2021 forthePensionPlan February 3, 2024 and3.10%at January 29, 2022 and2.51%at January 30, 2021 forthe SERP.ThediscountrateusedtodeterminethepresentvalueoftheCompany'sPensionPlanandSERPobligationsisbasedonayieldcurveconstructedfromaportfolioofhighqualitycorporatedebtsecuritieswithvariousmaturities.Eachyear's expectedfuturebenefitpaymentsarediscountedtotheirpresentvalueattheappropriateyieldcurverate,therebygenerating theoveralldiscountrateforPensionPlanandSERPobligations.Asthediscountrateisreducedorincreased,the pensionliabilitywouldincreaseordecrease,respectively,andfuturepensionexpensewoulddecreaseorincrease,respectively.Loweringthediscountratesby0.25%wouldincreasetheprojectedbenefitobligationsat January 29, 2022 byapproximately$67millionandwoulddecreaseestimated2022pensionexpensebyapproximately$3million.Increasing thediscountratesby0.25%woulddecreasetheprojectedbenefitobligationsat January 29, 2022byapproximately$64 millionandwouldincreaseestimated2022pensionexpensebyapproximately$3million.TheCompanyestimatestheserviceandinterestcostcomponentsofnetperiodicbenefitcostsforthePensionPlan andSERP.Thismethodusesafullyieldcurveapproachintheestimationofthesecomponentsofnetperiodicbenefitcosts.Underthisapproach,theCompanyappliesdiscountingusingindividualspotratesfromtheyieldcurvecomposedof theratesofreturnfromaportfolioofhighqualitycorporatedebtsecuritiesavailableatthemeasurementdate.Thesespot ratesaligntoeachoftheprojectedbenefitobligationandservicecostcashflows.39Item 7A.QuantitativeandQualitativeDisclosuresAboutMarketRisk.TheCompanyisexposedtomarketriskfromchangesininterestratesthatmayadverselyaffectitsfinancialposition,resultsofoperationsandcashflows.Inseekingtominimizetherisksfrominterestratefluctuations,theCompanymanages exposuresthroughitsregularoperatingandfinancingactivitiesand,whendeemedappropriate,throughtheuseof derivativefinancialinstruments.TheCompanydoesnotusefinancialinstrumentsfortradingorotherspeculativepurposes andisnotapartytoanyleveragedfinancialinstruments.TheCompanyisexposedtointerestrateriskthroughitsborrowingactivities,whicharedescribedinNote 6, Financing,totheConsolidatedFinancialStatements.AlloftheCompany’sborrowingsareunderfixedrateinstruments.However,theCompany,fromtimetotime,mayuseinterestrateswapandinterestratecapagreementstohelpmanageitsexposuretointerestratemovementsandreduceborrowingcosts.At January 29, 2022,theCompanywasnotapartytoany material derivativefinancialinstrumentsandbasedontheCompany’slackofmarketrisksensitiveinstrumentsoutstanding 4.74% at January 29, 2022,28, 2023 for theCompanyhasdeterminedthattherewasnomaterialmarketriskexposure SERP. The discount rate used to determine theCompany’sconsolidatedfinancialposition,results present value ofoperations the Company's Pension Plan and SERP obligations is based on a yield curve constructed from a portfolio of high quality corporate debt securities with various maturities. Each year's expected future benefit payments are discounted to their present value at the appropriate yield curve rate, thereby generating the overall discount rate for Pension Plan and SERP obligations. As the discount rate is reduced orcashflowsasofsuchdate.4034Item 8.FinancialStatementsandSupplementaryData.InformationcalledforbythisitemissetforthinThe Company estimates theCompany’sConsolidatedFinancialStatementsandsupplementarydatacontainedinthisreportandisincorporatedhereinbythisreference.Specificfinancialstatements service and supplementarydatacanbefoundinterest cost components of net periodic benefit costs for the Pension Plan and SERP. This method uses a full yield curve approach in the estimation of these components of net periodic benefit costs. Under this approach, the Company applies discounting using individual spot rates from the yield curve composed of the rates of return from a portfolio of high quality corporate debt securities available atthepageslistedin measurement date. These spot rates align to each of thefollowingindex:INDEXPageF-2F-3F-5F-6ConsolidatedBalanceSheetsasof January 29, 2022 and January 30, 2021F-7F-8F-9F-1041Item 9.ChangesinandDisagreementswithAccountantsonAccountingandFinancial Disclosure.None.
projected benefit obligation and service cost cash flows.Item 9A.ControlsandProcedures.a.Disclosure Controls and ProceduresItem 7A. Quantitative and Qualitative Disclosures About Market Risk.TheCompany’sChiefExecutiveOfficer Company is exposed to market risk from changes in interest rates that may adversely affect its financial position, results of operations andChiefFinancialOfficerhavecarriedout,asof January 29, 2022,withtheparticipationoftheCompany’smanagement,anevaluationoftheeffectivenessoftheCompany’sdisclosurecontrolsandprocedures,asdefinedinRule13a-15(e)undertheExchangeAct.Baseduponthisevaluation,theChiefExecutive OfficerandChiefFinancialOfficerhaveconcludedthatasof January 29, 2022 theCompany’sdisclosurecontrolsandprocedureswereeffective cash flows. In seeking toprovidereasonableassurancethatinformationrequiredtobedisclosedbytheCompanyinreportstheCompanyfilesundertheExchangeActisrecorded,processed,summarizedandreported,withinthetime periodsspecifiedintheSECrulesandforms,andthatinformationrequiredtobedisclosedbytheCompanyinthereports theCompanyfilesorsubmitsundertheExchangeActisaccumulatedandcommunicatedtotheCompany’smanagement,includingitsChiefExecutiveOfficerandChiefFinancialOfficer,asappropriatetoallowtimelydecisionsregardingrequireddisclosure.b.Management’s Annual ReportonInternalControloverFinancialReportingTheCompany’smanagementisresponsibleforestablishingandmaintainingadequateinternalcontroloverfinancialreporting,asdefinedinExchangeActRule13a-15(f).TheCompany’smanagementconductedanassessmentoftheCompany’sinternalcontroloverfinancialreportingbasedontheframeworkestablishedbytheCommitteeofSponsoringOrganizationsoftheTreadwayCommissioninInternalControl–IntegratedFramework(2013).Basedonthisassessment,theCompany’smanagementhasconcludedthat,asof January 29, 2022,theCompany’sinternalcontroloverfinancialreportingwaseffective.TheCompany’sindependentregisteredpublicaccountingfirm,KPMGLLP,hasaudited minimize the Company’srisks from interest rate fluctuations, the Company manages exposures through its regular operating and financing activities and, when deemed appropriate, through the use of derivative financial instruments. The Company does not use financial instruments for trading or other speculative purposes and is not a party to any leveraged financial instruments.The Company is exposed to interest rate risk through its borrowing activities, which are described in Note 6, Financing, to the Consolidated Financial Statements includedand funding activities of its credit card portfolio, which are described in Note 2, Revenue, to the Consolidated Financial Statements. All of the Company's borrowings are under fixed rate instruments. However, the Company, from time to time, may use interest rate swap and interest rate cap agreements to help manage its exposure to interest rate movements and reduce borrowing costs. At February 3, 2024, the Company was not a party to any derivative financial instruments and based on the Company's lack of market risk sensitive instruments outstanding at February 3, 2024, the Company has determined that there was no material market risk exposure to the Company's consolidated financial position, results of operations or cash flows as of such date.Item 8. Financial Statements and Supplementary Data.Information called for by this item is set forth in the Company's Consolidated Financial Statements and supplementary data contained in this Annual Report on Form 10-Kreport and theeffectivenessoftheCompany’sinternalcontroloveris incorporated herein by this reference. Specific financialreportingasof January 29, 2022 andhasissuedanattestationreportexpressinganunqualifiedopinionontheeffectivenessoftheCompany’sinternalcontroloverfinancialreporting,asstatedintheirreportlocatedonpageF-3.c.ChangesinInternalControloverFinancialReportingFromtimetotimeadoptionofnewaccountingpronouncements,majororganizationalrestructuringandrealignmentoccursforwhichtheCompanyreviewsitsinternalcontroloverfinancialreporting.Asaresultofthisreview,therewere nochangesintheCompany’sinternalcontroloverfinancialreportingthatoccurredduringtheCompany’smostrecentlycompletedquarterthatmateriallyaffected,orarereasonablylikelytomateriallyaffect,theCompany’sinternalcontroloverfinancialreporting.Item9B.OtherInformation.None.Item9C.Disclosure Regarding Foreign Jurisdictions that Prevent Inspections.Not applicable.42PARTIIIItem 10.Directors,ExecutiveOfficersandCorporateGovernance.Theinformationrequiredbythisitemforexecutiveofficersissetforthunder“Item1.Business-InformationaboutourExecutiveOfficers”inthisreport.Theotherinformationcalledforbythisitemissetforthunder“Item1.ElectionofDirectors”and“FurtherInformationConcerningtheBoardofDirectors-CommitteesoftheBoard”intheProxyStatement tobedeliveredtostockholdersinconnectionwiththe 2022AnnualMeetingofShareholders(the“ProxyStatement”), statements and incorporatedhereinbyreference.TheCompany’sCodeofConductisincompliancewiththeapplicablerulesoftheSECthatapplytotheprincipalexecutiveofficer,principalfinancialofficerandprincipalaccountingofficerorcontroller,orpersonsperformingsimilarfunctions.AcopyoftheCodeofConductisavailable,freeofcharge,throughtheCompany’swebsitesupplementary data can be found athttps://www.macysinc.com. WeintendtosatisfyanydisclosurerequirementunderItem5.05ofForm8-Kregardinganamendmentto,orwaiverfrom,aprovisionoftheCodeofConductbypostingsuchinformationtotheCompany’swebsiteattheaddressandlocationspecifiedabove.Setforthbelowarethenames,agesandprincipaloccupationsoftheCompany'snon-employeedirectorsasofMarch 24, 2022.Item 11.ExecutiveCompensation.Informationcalledforbythisitemissetforthunder“CompensationDiscussion&Analysis,”“Compensationofthe NamedExecutivesfor 2021,”“CompensationCommitteeReport,”“CompensationCommitteeInterlocksandInsider Participation”and"FurtherInformationConcerningpages listed in theBoardofDirectors–RiskOversight"intheProxyStatementand incorporatedhereinbyreference.Item 12.SecurityOwnershipofCertainBeneficialOwnersandManagementandRelatedStockholder Matters.Informationcalledforbythisitemissetforthunder“StockOwnership–CertainBeneficialOwners,”“Stock Ownership–SecuritiesAuthorizedforIssuanceUnderEquityCompensationPlans,”and“StockOwnership–Stock OwnershipofDirectorsandExecutiveOfficers”intheProxyStatementandincorporatedhereinbyreference.43Item 13.CertainRelationshipsandRelatedTransactions,andDirectorIndependence.Informationcalledforbythisitemissetforthunder“FurtherInformationConcerningtheBoardofDirectors– DirectorIndependence”and“PolicyonRelatedPersonTransactions”intheProxyStatementandincorporatedhereinbyreference.Item 14.PrincipalAccountantFeesandServices.Informationcalledforbythisitemissetforthunder“Item2.RatificationoftheAppointmentofIndependent RegisteredPublicAccountingFirm”intheProxyStatementandincorporatedhereinbyreference.44PART IV
INDEXItem 15.ExhibitandFinancialStatementSchedules.(a)Thefollowingdocumentsarefiledaspartofthisreport:1.PageFinancialStatements:ThelistoffinancialstatementsrequiredbythisitemissetforthinItem8“FinancialStatementsand SupplementaryData”andisincorporatedhereinbyreference.2.FinancialStatementSchedules:Allschedulesareomittedbecausetheyareinapplicable,notrequired,ortheinformationisincludedelsewherein theConsolidatedFinancialStatementsorthenotesthereto.3.Exhibits:ExhibitNumberDescriptionDocumentifIncorporatedbyReference3.1Amended and Restated Certificate of Incorporation3.1.1CertificateExhibit 3.1.1 to the Company's Annual Report on Form 10-K (File No. 1-13536)Income for the fiscal yearyears ended February 3, 2024, January 28, 19952023 and January 29, 20223.1.2Article Seventh of the Amended and Restated Certificate of Incorporation3.2Amended and Restated By-LawsExhibit 3.1 to the Company's Current Report on Form 8-K filed March 25, 20214.1Indenture, dated as of January 15, 1991, among the Company (as successor to The May Department Stores Company (“May Delaware”)), Macy's Retail Holdings, Inc. (“Macy's Retail”) (f/k/a The May Department Stores Company (NY) or “May New York”) and The Bank of New York Mellon Trust Company, N.A. (“BNY Mellon”, successor to J.P. Morgan Trust Company and as successor to The First National Bank of Chicago), as Trustee (“1991 Indenture”)Exhibit 4(2) to May New York’s Current Report on Form 8-K filed January 15, 19914.1.1Guarantee of Securities, dated as of August 30, 2005, by the Company relating to 1991 Indenture4.1.2First Supplemental Indenture to 1991 Indenture dated as of May 28, 2020 among Macy’s Retail Holdings, Inc., a Delaware corporation (as successor to Macy’s Retail Holdings, Inc., a New York corporation), Macy’s, Inc. and The Bank of New York Mellon Trust Company, N.A., as Trustee4.1.3Second Supplemental Indenture to 1991 Indenture dated as of June 3, 2020 among Macy’s Retail Holdings, LLC, a Delaware limited liability company (as successor to Macy’s Retail Holdings, Inc., a Delaware corporation), Macy’s, Inc. and The Bank of New York Mellon Trust Company, N.A., as Trustee4.1.4Third Supplemental Indenture to 1991 Indenture dated as of June 26, 2020 among Macy’s Retail Holdings, LLC, an Ohio limited liability company (as successor to Macy’s Retail Holdings, LLC, a Delaware limited liability company), Macy’s, Inc. and The Bank of New York Mellon Trust Company, N.A., as Trustee45ExhibitNumberDescriptionDocumentifIncorporatedbyReference4.1.5Fourth Supplemental Indenture to 1991 Indenture dated as of June 30, 2021 by and among Macy’s Retail Holdings, LLC, Macy’s, Inc. and The Bank of New York Mellon Trust Company, N.A., as Trustee4.2Indenture, dated as of December 15, 1994, between the Company and U.S. Bank National Association (successor to State Street Bank and Trust Company and The First National Bank of Boston), as Trustee (“1994 Indenture”)Exhibit 4.1 to the Company's Registration Statement on Form S-3 (Registration No. 33-88328) filed January 9, 19954.2.1Ninth Supplemental Indenture to 1994 Indenture, dated as of July 14, 1997, between the Company and U.S. Bank National Association (successor to State Street Bank and Trust Company and The First National Bank of Boston), as TrusteeExhibit 3 to the Company's Current Report on Form 8-K filed July 15, 19974.2.2Tenth Supplemental Indenture to 1994 Indenture, dated as of August 30, 2005, among the Company, Macy's Retail and U.S. Bank National Association (as successor to State Street Bank and Trust Company and as successor to The First National Bank of Boston), as Trustee4.2.3Guarantee of Securities, dated as of August 30, 2005, by the Company relating to 1994 Indenture4.2.4Eleventh Supplemental Indenture to 1994 Indenture dated as of May 28, 2020 among Macy’s Retail Holdings, Inc., a Delaware corporation (as successor to Macy’s Retail Holdings, Inc., a New York corporation), Macy’s, Inc. and U.S. Bank National Association, as Trustee4.2.5Twelfth Supplemental Indenture to 1994 Indenture dated as of June 3, 2020 among Macy’s Retail Holdings, LLC, a Delaware limited liability company (as successor to Macy’s Retail Holdings, Inc., a Delaware corporation), Macy’s, Inc. and U.S. Bank National Association, as Trustee4.2.6Thirteenth Supplemental Indenture to 1994 Indenture dated as of June 24, 2020 among Macy’s Retail Holdings, LLC, an Ohio limited liability company (as successor to Macy’s Retail Holdings, LLC, a Delaware limited liability company), Macy’s, Inc. and U.S. Bank National Association, as Trustee4.3Indenture, dated as of June 17, 1996, among the Company (as successor to May Delaware), Macy's Retail (f/k/a May New York) and The Bank of New York Mellon Trust Company, N.A. (“BNY Mellon”, successor to J.P. Morgan Trust Company), as Trustee (“1996 Indenture”)4.3.1First Supplemental Indenture to 1996 Indenture, dated as of August 30, 2005, by and among the Company (as successor to May Delaware), Macy's Retail (f/k/a May New York) and BNY Mellon (successor to J.P. Morgan Trust Company, National Association), as Trustee46ExhibitNumberDescriptionDocumentifIncorporatedbyReference4.3.2Second Supplemental Indenture to 1996 Indenture dated as of May 28, 2020 among Macy’s Retail Holdings, Inc., a Delaware corporation (as successor to Macy’s Retail Holdings, Inc., a New York corporation), Macy’s, Inc. and The Bank of New York Mellon Trust Company, N.A., as Trustee4.3.3Third Supplemental Indenture to 1996 Indenture dated as of June 3, 2020 among Macy’s Retail Holdings, LLC, a Delaware limited liability company (as successor to Macy’s Retail Holdings, Inc., a Delaware corporation), Macy’s, Inc. and The Bank of New York Mellon Trust Company, N.A., as Trustee4.3.4Fourth Supplemental Indenture to 1996 Indenture dated as of June 26, 2020 among Macy’s Retail Holdings, LLC, an Ohio limited liability company (as successor to Macy’s Retail Holdings, LLC, a Delaware limited liability company), Macy’s, Inc. and The Bank of New York Mellon Trust Company, N.A., as Trustee4.4Indenture, dated as of September 10, 1997, between the Company and U.S. Bank National Association (successor to Citibank, N.A.), as Trustee (“1997 Indenture”)4.4.1First Supplemental Indenture to 1997 Indenture, datedConsolidated Balance Sheets as of February 6, 1998, between the Company3, 2024 and U.S. Bank National Association (successor to Citibank, N.A.), as Trustee4.4.2Third Supplemental Indenture to 1997 Indenture, dated asExhibit 4.2 to the Company's Registration Statement on Form S-4 (Registration No. 333-76795) filed April 22, 1999'4.4.3Seventh Supplemental Indenture to 1997 Indenture, dated as of August 30, 2005 among the Company, Macy's Retail and U.S. Bank National Association (successor to Citibank, N.A.), as Trustee4.4.4Guarantee of Securities, dated as of August 30, 2005, by the Company relating to 1997 Indenture4.4.5Eighth Supplemental Indenture to 1997 Indenture dated as of May 28, 2020 among Macy’s Retail Holdings, Inc., a Delaware corporation (as successor to Macy’s Retail Holdings, Inc., a New York corporation), Macy’s, Inc. and U.S. Bank National Association, as Trustee4.4.6Ninth Supplemental Indenture to 1997 Indenture dated as of June 3, 2020 among Macy’s Retail Holdings, LLC, a Delaware limited liability company (as successor to Macy’s Retail Holdings, Inc., a Delaware corporation), Macy’s, Inc. and U.S. Bank National Association, as Trustee47ExhibitNumberDescriptionDocumentifIncorporatedbyReference4.4.7Tenth Supplemental Indenture to 1997 Indenture dated as of June 24, 2020 among Macy’s Retail Holdings, LLC, an Ohio limited liability company (as successor to Macy’s Retail Holdings, LLC, a Delaware limited liability company), Macy’s, Inc. and U.S. Bank National Association, as Trustee4.5Indenture, dated as of July 20, 2004, among the Company (as successor to May Delaware), Macy's Retail (f/k/a May New York) and BNY Mellon, as Trustee (“2004 Indenture”)Exhibit 4.1 to Current Report on Form 8-K (File No. 001-00079) filed July 22, 2004 by May Delaware4.5.1First Supplemental Indenture to 2004 Indenture, dated as of August 30, 2005 among the Company (as successor to May Delaware), Macy's Retail and BNY Mellon (successor to J.P. Morgan Trust Company, National Association), as Trustee4.6Indenture, dated as of November 2, 2006, by and among Macy's Retail, the Company and U.S. Bank National Association, as Trustee (“2006 Indenture”)4.6.1Third Supplemental Indenture to 2006 Indenture, dated March 12, 2007, among Macy's Retail, the Company and U.S. Bank National Association, as TrusteeExhibit 4.2 to the Company's Current Report on Form 8-K filed March 12, 20074.6.2Seventh Supplement Indenture to 2006 Indenture dated as of May 28, 2020 among Macy's Retail Holdings, Inc., a Delaware corporation (as successor to Macy's Retail Holdings, Inc., a New York corporation), Macy's, Inc. and U.S. Bank National Association, as Trustee4.6.3Eighth Supplemental Indenture to 2006 Indenture dated as of June 3, 2020 among Macy’s Retail Holdings, LLC, a Delaware limited liability company (as successor to Macy’s Retail Holdings, Inc., a Delaware corporation), Macy’s, Inc. and U.S. Bank National Association, as Trustee4.6.4Ninth Supplemental Indenture to 2006 Indenture dated as of June 24, 2020 among Macy’s Retail Holdings, LLC, an Ohio limited liability company (as successor to Macy’s Retail Holdings, LLC, a Delaware limited liability company), Macy’s, Inc. and U.S. Bank National Association, as Trustee4.7Indenture, dated as of January 13, 2012, among Macy's Retail, the Company and BNY Mellon, as Trustee ("2012 Indenture")4.7.1Second Supplemental Trust Indenture to 2012 Indenture, dated as of January 13, 2012, among Macy's Retail, as issuer, the Company, as guarantor, and BNY Mellon, as trustee4.7.2Third Supplemental Trust Indenture, dated as of November 20, 2012, among Macy's Retail, as issuer, the Company, as guarantor, and BNY Mellon, as trustee4.7.3Fourth Supplemental Trust Indenture, dated as of November 20, 2012, among Macy's Retail, as issuer, the Company, as guarantor, and BNY Mellon, as trustee48ExhibitNumberDescriptionDocumentifIncorporatedbyReference4.7.4Fifth Supplemental Trust Indenture, dated as of September 6, 2013, among Macy's Retail, as issuer, the Company, as guarantor, and BNY Mellon, as trusteeExhibit 4.2 to the Company's Current Report on Form 8-K filed September 6, 20134.7.5Sixth Supplemental Trust Indenture, dated as of May 23, 2014, among Macy's Retail, as issuer, the Company, as guarantor, and BNY Mellon, as trusteeExhibit 4.2 to the Company's Current Report on Form 8-K filed May 23, 20144.7.6Seventh Supplemental Trust Indenture, dated as of November 18, 2014, among Macy's Retail, as issuer, the Company, as guarantor, and BNY Mellon, as trusteeExhibit 4.2 to the Company's Current Report on Form 8-K filed November 18, 20144.7.7Eighth Supplemental Indenture to 2012 Indenture dated as of May 28, 2020 among Macy’s Retail Holdings, Inc., a Delaware corporation (as successor to Macy’s Retail Holdings, Inc., a New York corporation), Macy’s, Inc. and The Bank of New York Mellon Trust Company, N.A., as Trustee4.7.8Ninth Supplemental Indenture to 2012 Indenture dated as of June 3, 2020 among Macy’s Retail Holdings, LLC, a Delaware limited liability company (as successor to Macy’s Retail Holdings, Inc., a Delaware corporation), Macy’s, Inc. and The Bank of New York Mellon Trust Company, N.A., as Trustee4.7.9Tenth Supplemental Indenture to 2012 Indenture dated as of June 26, 2020 among Macy’s Retail Holdings, LLC, an Ohio limited liability company (as successor to Macy’s Retail Holdings, LLC, a Delaware limited liability company), Macy’s, Inc. and The Bank of New York Mellon Trust Company, N.A., as Trustee4.8Indenture, dated as of July 28, 2020, among Macy’s Retail Holdings, LLC, as issuer, Macy’s, Inc., as guarantor, and U.S. Bank National Association, as trustee and collateral trustee, relating to Macy’s Retail Holdings, LLC’s 6.65% Senior Secured Debentures due 2024, 6.7% Senior Secured Debentures due 2028, 8.75% Senior Secured Debentures due 2029, 7.875% Senior Secured Debentures due 2030, 6.9% Senior Secured Debentures due 2032 and 6.7% Senior Secured Debentures due 20344.8.1Form of 6.65% Senior Secured Debentures due 2024, 6.7% Senior Secured Debentures due 2028, 8.75% Senior Secured Debentures due 2029, 7.875% Senior Secured Debentures due 2030, 6.9% Senior Secured Debentures due 2032 and 6.7% Senior Secured Debentures due 20344.8.2Fifth Supplemental Trust Indenture to 1996 Indenture, dated as of July 10, 2020, among Macy’s Retail Holdings, LLC, as issuer, Macy’s, Inc. as guarantor, and The Bank of New York Mellon Trust Company, N.A., as trustee, relating to Macy’s Retail Holdings, LLC’s 6.65% Senior Debentures due 2024, 6.7% Senior Debentures due 2028, 8.75% Senior Debentures due 2029, 7.875% Senior Debentures due 2030, 6.9% Senior Debentures due 2032 and 6.7% Senior Debentures due 203449ExhibitNumberDescriptionDocumentifIncorporatedbyReference4.9Indenture dated as of March 17, 2021 by and among Macy’s Retail Holdings, LLC as issuer, Macy’s, Inc. as guarantor and U.S. Bank National Association as trustee, relating to Macy’s Retail Holdings, LLC’s 5.875% Senior Notes due 2029Exhibit 4.1 to the Company’s Current Report on Form 8-K filed March 17, 20214.10Indenture dated as of March 10, 2022 by and among Macy’s Retail Holdings, LLC as issuer, Macy’s, Inc. as guarantor and U.S. Bank Trust Company, National Association as trustee, relating to Macy’s Retail Holdings, LLC’s 5.875% Senior Notes due 2030Exhibit 4.1 to the Company’s Current Report on Form 8-K filed March 10, 20224.11Indenture dated as of March 10, 2022 by and among Macy’s Retail Holdings, LLC as issuer, Macy’s, Inc. as guarantor and U.S. Bank Trust Company, National Association as trustee, relating to Macy’s Retail Holdings, LLC’s 6.125% Senior Notes due 2032Exhibit 4.2 to the Company’s Current Report on Form 8-K filed March 10, 20224.12DescriptionoftheCompany'sSecuritiesRegistered underSection12oftheSecuritiesExchangeActof 193410.1Credit Agreement, dated as10.1.1Third Amendment to Credit Agreement, dated as of March 3, 2022, by and among Macy’s Inventory Funding LLC, Macy’s Inventory Holdings LLC, the lenders party thereto and Bank of America, N.A., as agent, l/c issuer and swing line lenderExhibit 10.1 to the Company’s Current Report on Form 8-K filed March 3, 202210.2Credit Agreement, dated as of May 9, 2019, among the Company, Macy's Retail and Bank of America, N.A., as administrative agent10.3Guarantee Agreement, dated as of May 9, 2019, among the Company, Macy's Retail and Bank of America, N.A., as administrative agent10.4Amendment No. 1 to Credit Agreement dated as of June 8, 2020 among Macy’s Retail Holdings, LLC, a Delaware limited liability company (f/k/a Macy’s Retail Holdings, Inc.), as Borrower, Macy’s, Inc., a Delaware corporation, as Parent, the Lenders party thereto, and Bank of America, N.A., as Administrative Agent50ExhibitNumberDescriptionDocumentifIncorporatedbyReference10.5Tax Sharing Agreement, dated as of October 31, 2014, among Macy's, Inc. and members of the Affiliated Group10.6+Amended and Restated Credit Card Program Agreement, dated November 10, 2014, among the Company, FDS Bank, Macy's Credit and Customer Services, Inc. (“MCCS”), Macy's West Stores, Inc., Bloomingdales, Inc., Department Stores National Bank ("DSNB") and Citibank, N.A.Exhibit 10.1 to the Company's Quarterly Report on Form 10-Q filed December 8, 201410.6.1+Sixth Amendment to Amended and Restated Credit Card Program Agreement dated as of December 13, 2021, by and among Macy’s, Inc., FDS Bank, Macy’s Credit and Consumer Services, Inc., Bloomingdales, LLC, and solely with respect to Section 2.1(a) FDS Thrift Holding Co., Inc., Department Stores National Bank and Citibank, N.A.Exhibit 10.1 to the Company’s Current Report on Form 8-K filed December 13, 202110.7Senior Executive Incentive Compensation Plan, as amended March 26, 2020 *10.8Form of Indemnification Agreement *Exhibit 10.14 to the Registration Statement on Form 10 (File No. 1-10951), filed November 27, 199110.9Executive Severance Plan, effective November 1, 2009, as revised and restated January 1, 2014 *10.9.1Senior Executive Severance Plan effective as of April 1, 2018 *10.10Form of Nonqualified Stock Option Agreement under the 2009 Omnibus Incentive Compensation Plan (for Executives and Key Employees) *10.10.1Form of Nonqualified Stock Option Agreement under the Amended and Restated 2009 Omnibus Incentive Compensation Plan (for Executives and Key Employees) *10.10.2Form of Nonqualified Stock Option Agreement under the Amended and Restated 2009 Omnibus Incentive Compensation Plan (for Executives and Key Employees), as amended *10.10.3Form of Stock Option Terms and Conditions under the 2018 Equity and Incentive Compensation Plan *10.11Form of Time-Based Restricted Stock Agreement under the 2009 Omnibus Incentive Compensation Plan *Exhibit 10.3 to the Company's Current Report on Form 8-K filed March 25, 201010.122019-2021 Performance-Based Restricted Stock Unit Terms and Conditions under the 2018 Equity and Incentive Compensation Plan *51ExhibitNumberDescriptionDocumentifIncorporatedbyReference10.12.12021-2023 Performance-Based Restricted Stock Unit Terms and Conditions under the 2018 Equity and Incentive Compensation Plan*10.13Form of Time-Based Restricted Stock Unit Agreement under the 2009 Omnibus Incentive Compensation Plan*10.13.1Form of Time-Based Restricted Stock Unit Agreement under the Amended and Restated 2009 Omnibus Incentive Compensation Plan *10.13.2Form of Time-Based Restricted Stock Unit Agreement under the Amended and Restated 2009 Omnibus Incentive Compensation Plan (with dividend equivalents) *10.13.3Form of Time-Based Restricted Stock Unit Agreement under the Amended and Restated 2009 Omnibus Incentive Compensation Plan, as amended *10.13.4Form of Time-Based Restricted Stock Unit Terms and Conditions under the 2018 Equity and Incentive Compensation Plan *10.14Supplementary Executive Retirement Plan *10.14.1First Amendment to the Supplementary Executive Retirement Plan effective January 1, 2012 *10.14.2Second Amendment to Supplementary Executive Retirement Plan effective January 1, 2012 *10.14.3Third Amendment to Supplementary Executive Retirement Plan effective December 31, 2013 *10.15Executive Deferred Compensation Plan *10.15.1First Amendment to Executive Deferred Compensation Plan effective December 31, 2013 *10.16Macy's, Inc. 401(k) Retirement Investment Plan (the "Plan") (amending and restating the Macy's, Inc. 401(k) Retirement Investment Plan) effective as of January 1, 2014 *10.16.1First Amendment to the Plan regarding matching contributions with respect to the Plan’s plan years beginning on and after January 1, 2014, effective January 1, 2014 *10.16.2Second Amendment to the Plan regarding marriage status, effective January 1, 2014 *10.16.3Third Amendment to the Plan regarding matching contributions with respect to the Plan’s plan years beginning on and after January 1, 2014 *10.16.4Fourth Amendment to the Plan regarding rules applicable to Puerto Rico participants effective January 1, 2011 (and for the Plan's plan years beginning on and after that date)*52ExhibitNumberDescriptionDocumentifIncorporatedbyReference10.16.5Fifth Amendment to the Plan regarding eligible associates to participate (pre-tax deferrals only, no match) immediately upon hire effective as of January 1, 2014*10.17Director Deferred Compensation Plan *10.18Macy's, Inc. Amended and Restated 2009 Omnibus Incentive Compensation Plan *Appendix B to the Company's Proxy Statement dated April 2, 201410.19Macy's, Inc. 2018 Equity and Incentive Compensation Plan *Appendix B to the Company's Proxy Statement dated April 4, 201810.20Macy’s, Inc. 2021 Equity and Incentive Compensation Plan*Appendix A to the Company’s Definitive Proxy Statement on Schedule 14A filed April 6, 202110.21Macy's,Inc.DeferredCompensationPlan(Amended andrestatedeffectiveasofAugust1,2018)*10.22Change in Control Plan, effective November 1, 2009, as revised and restated effective April 1, 2018 *10.23Time Sharing Agreement between Macy's, Inc. and Jeff Gennette, dated June 14, 2017 *2122232431.131.232.1CertificationbyChiefExecutiveOfficerunderSection906oftheSarbanes-OxleyAct32.2CertificationbyChiefFinancialOfficerunderSection906oftheSarbanes-OxleyAct101ThefollowingfinancialstatementsfromMacy's,Inc.’sAnnualReportonForm10-Kfortheyearended January 29,2022,filedMarch25,2022,formattedin iXBRL(InlineeXtensibleBusinessReporting Language):(i)ConsolidatedStatementsofOperations,(ii) ConsolidatedStatementsofComprehensiveIncome (Loss), (iii)ConsolidatedBalanceSheets,(iv)Consolidated StatementsofChangesinShareholders’Equity,(v)ConsolidatedStatementsofCashFlows,and(vi)the NotestoConsolidatedFinancialStatements,taggedas blockoftextandindetail.104CoverPageInteractiveDataFile(formattedasiXBRLandcontainedinExhibit101)53+Portionsoftheexhibithavebeenomittedpursuanttoarequestforconfidentialtreatment or because it is both not material and is of the type the registrant treats as confidential.*Constitutesacompensatoryplanorarrangement.3554SIGNATURESPursuantREPORT OF MANAGEMENTTo therequirements Shareholders ofSection13or15(d)oftheSecuritiesExchangeActof1934,theRegistranthasduly causedthisreporttobesignedonitsbehalfbytheundersigned,thereuntodulyauthorized.MACY’S, INC.By:/s/ ELISAD. GARCIAElisaD.GarciaExecutiveVicePresident,ChiefLegalOfficerandSecretaryDate:March25,2022Pursuanttothe requirementsoftheSecuritiesExchangeActof1934,thisreport hasbeensignedbelowbythefollowingpersonsonbehalfoftheRegistrantandinthecapacitiesindicatedonMarch25,2022.***JeffGennetteAdrian V.MitchellPaul GriscomChiefExecutiveOfficer(principalexecutiveofficer),ChairmanoftheBoardandDirectorExecutiveVicePresidentandChiefFinancialOfficer(principalfinancialofficer)SeniorVicePresident andController(principalaccountingofficer)***FrancisS.BlakeTorrenceN.BooneJohnA. BryantDirectorDirectorDirector***Ashley BuchananDeirdreP.ConnellyLeslieD.HaleDirectorDirectorDirector***WilliamH.LenehanSara LevinsonPaulC.VargaDirectorDirectorDirector**MarnaC.WhittingtonTracey ZhenDirectorDirector*Theundersigned,bysigninghernamehereto,doessignandexecutethisAnnualReportonForm10-Kpursuantto thePowersofAttorneyexecutedbytheabove-namedofficersanddirectorsandfiledherewith.By:/s/ ELISAD. GARCIAElisaD.GarciaAttorney-in-Fact55INDEXTOCONSOLIDATEDFINANCIALSTATEMENTSPageF-2F-3F-5F-6ConsolidatedBalanceSheetsasof January 29, 2022 and January 30, 2021F-7F-8F-9F-10F-1REPORTOFMANAGEMENTTotheShareholdersofMacy’s, Macy's, Inc.:TheintegrityandconsistencyoftheConsolidatedFinancialStatementsofMacy’s, Macy's, Inc.andsubsidiaries,whichwerepreparedinaccordancewithaccountingprinciplesgenerallyacceptedintheUnitedStatesofAmerica,arethe responsibilityofmanagementandproperlyincludesomeamountsthatarebaseduponestimatesandjudgments.TheCompanymaintainsasystemofinternalaccountingcontrols,whichissupportedbyaprogramofinternalaudits withappropriatemanagementfollow-upaction,toprovidereasonableassurance,atappropriatecost,thattheCompany’s Company's assetsareprotectedandtransactionsareproperlyrecorded.Additionally,theintegrityofthefinancialaccountingsystemisbasedoncarefulselectionandtrainingofqualifiedpersonnel,organizationalarrangementswhichprovideforappropriatedivisionofresponsibilitiesandcommunicationofestablishedwrittenpoliciesandprocedures.TheCompany’s Company's managementisresponsibleforestablishingandmaintainingadequateinternalcontroloverfinancialreporting,asdefinedinExchangeActRule13a-15(f)andhasissuedManagement’s Management's ReportonInternalControloverFinancialReporting.TheConsolidatedFinancialStatementsoftheCompanyhavebeenauditedbyKPMGLLP. LLP. Theirreportexpressestheiropinionastothefairpresentation,inallmaterialrespects,ofthefinancialstatementsandisbasedupontheir independentaudits.TheAuditCommittee,composedsolelyofoutsidedirectors,meetsperiodicallywithKPMGLLP, LLP, theinternalauditorsandrepresentativesofmanagementtodiscussauditingandfinancialreportingmatters.Inaddition,KPMGLLP andtheCompany’s Company's internalauditorsmeetperiodicallywiththeAuditCommitteewithoutmanagementrepresentativespresentandhavefreeaccesstotheAuditCommitteeatanytime.TheAuditCommitteeisresponsibleforrecommendingto the Audit Committee at any time. The Audit Committee is responsible for recommending to the BoardofDirectorstheengagementoftheindependentregisteredpublicaccountingfirmandthegeneraloversight reviewofmanagement’s management's dischargeofitsresponsibilitieswithrespecttothemattersreferredtoabove.JeffGennetteTony SpringChiefExecutiveOfficerChairmanoftheBoardandDirectorAdrian V. MitchellExecutiveVicePresidentChief Operating Officer andChiefFinancialOfficerPaul GriscomSenior Vice President, Controller36ReportofIndependentRegisteredPublicAccountingFirmTo the Shareholders and Board of DirectorsMacy's, Inc.:Opinions on the Consolidated Financial Statements and Internal Control Over Financial ReportingWe have audited the accompanying consolidated balance sheets of Macy's, Inc. and subsidiaries (the Company) as of January 29, 2022February 3, 2024 and January 30, 2021,28, 2023, the related consolidated statements of operations,income, comprehensive income, (loss),changes in shareholders’ equity, and cash flows for each of the years in the three-year period ended January 29, 2022,February 3, 2024, and the related notes (collectively, the consolidated financial statements). We also have audited the Company’s internal control over financial reporting as of January 29, 2022,February 3, 2024, based on criteria established in Internal Control – Integrated Framework (2013) issued by the Committee of Sponsoring Organizations of the Treadway Commission.In our opinion, the consolidated financial statements referred to above present fairly, in all material respects, the financial position of the Company as of January 29, 2022February 3, 2024 and January 30, 2021,28, 2023, and the results of its operations and its cash flows for each of the years in the three-year period ended January 29, 2022,February 3, 2024, in conformity with U.S. generally accepted accounting principles. Also in our opinion, the Company maintained, in all material respects, effective internal control over financial reporting as of January 29, 2022February 3, 2024 based on criteria established in Internal Control – Integrated Framework (2013) issued by the Committee of Sponsoring Organizations of the Treadway Commission.Basis for OpinionsThe Company’s management is responsible for these consolidated financial statements, for maintaining effective internal control over financial reporting, and for its assessment of the effectiveness of internal control over financial reporting, included in the accompanying Management's Annual Report on Internal Control over Financial Reporting. Our responsibility is to express an opinion on the Company’s consolidated financial statements and an opinion on the Company’s internal control over financial reporting based on our audits. We are a public accounting firm registered with the Public Company Accounting Oversight Board (United States) (PCAOB) and are required to be independent with respect to the Company in accordance with the U.S. federal securities laws and the applicable rules and regulations of the Securities and Exchange Commission and the PCAOB.We conducted our audits in accordance with the standards of the PCAOB. Those standards require that we plan and perform the audits to obtain reasonable assurance about whether the consolidated financial statements are free of material misstatement, whether due to error or fraud, and whether effective internal control over financial reporting was maintained in all material respects.Our audits of the consolidated financial statements included performing procedures to assess the risks of material misstatement of the consolidated financial statements, whether due to error or fraud, and performing procedures that respond to those risks. Such procedures included examining, on a test basis, evidence regarding the amounts and disclosures in the consolidated financial statements. Our audits also included evaluating the accounting principles used and significant estimates made by management, as well as evaluating the overall presentation of the consolidated financial statements. Our audit of internal control over financial reporting included obtaining an understanding of internal control over financial reporting, assessing the risk that a material weakness exists, and testing and evaluating the design and operating effectiveness of internal control based on the assessed risk. Our audits also included performing such other procedures as we considered necessary in the circumstances. We believe that our audits provide a reasonable basis for our opinions.Definition and Limitations of Internal Control Over Financial ReportingA company’s internal control over financial reporting is a process designed to provide reasonable assurance regarding the reliability of financial reporting and the preparation of financial statements for external purposes in accordance with generally accepted accounting principles. A company’s internal control over financial reporting includes those policies and procedures that (1) pertain to the maintenance of records that, in reasonable detail, accurately and fairly reflect the transactions and dispositions of the assets of the company; (2) provide reasonable assurance that transactions are recorded as necessary to permit preparation of financial statements in accordance with generally accepted accounting principles, and that receipts and expenditures of the company are being made only in accordance with authorizations of management and directors of the company; and (3) provide reasonable assurance regarding prevention or timely detection of unauthorized acquisition, use, or disposition of the company’s assets that could have a material effect on the financial statements.F-3Because of its inherent limitations, internal control over financial reporting may not prevent or detect misstatements. Also, projections of any evaluation of effectiveness to future periods are subject to the risk that controls may become inadequate because of changes in conditions, or that the degree of compliance with the policies or procedures may deteriorate.37Critical Audit MatterThe critical audit mattermatters communicated below is a matterare matters arising from the current period audit of the consolidated financial statements that waswere communicated or required to be communicated to the audit committee and that: (1) relatesrelate to accounts or disclosures that are material to the consolidated financial statements and (2) involved our especially challenging, subjective, or complex judgments. The communication of a critical audit matter doesmatters do not alter in any way our opinion on the consolidated financial statements, taken as a whole, and we are not, by communicating thethese critical audit mattermatters below, providing a separate opinion on the critical audit mattermatters or on the accounts or disclosures to which it relates.Assessmentthey relate.Fair value of the liability for unrecognized tax benefitsAs discussed in Note 81 to the consolidated financial statements, the carrying value of long-lived assets, inclusive of right-of-use assets, is periodically reviewed by the Company whenever events or changes in circumstances indicate that a potential impairment has occurred. When a potential impairment has occurred, an impairment write-down is recorded gross unrecognized tax benefits, including interest and penalties, of $167 million as of January 29, 2022. The Company recognizes tax positions when it is more likely than not thatif the tax position will be sustained on examination based on the technical meritscarrying value of the position. Uncertain tax positions meetingasset exceeds its fair value. As discussed in Note 3, the recognition threshold are then measured atCompany recognized a $957 million of pre-tax impairment charge primarily related to locations planned for closure over the largestnext three years, which is inclusive of both leased and owned locations, and the remaining amount of benefit that is more likely than not to be realized upon ultimate settlement.We identified the assessmentevaluation of the liability for unrecognized tax benefitsfair value of certain long-lived assets, specifically properties and right-of-use assets, as a critical audit matter. ComplexSubjective and challenging auditor judgment was required in evaluatingto assess certain key assumptions, specifically identification of comparable transactions and adjustments to the Company’s interpretation of tax law and its estimatecomparable market data based on the specific characteristics of the ultimate resolutionproperty. Changes in these key assumptions could have a significant impact on the fair value of certain properties and right-of-use assets. Additionally, the evaluation of the tax positions.The following are the primary procedures we performed to address this critical audit matter. We evaluated the design and tested the operating effectiveness of certain internal controls related to the Company’s unrecognized tax benefitsimpairment assessment process includingfor long-lived assets. This included a control related to the interpretation of tax law and the estimatedetermination of the ultimate resolutionkey assumptions used to estimate the fair value of the tax positions. Since tax law is complexproperties and often subject to interpretation, weright-of-use assets. We involved taxvaluation professionals with specialized skills and knowledge. Theyknowledge, who assisted us in evaluatingassessing the estimatereasonableness of the ultimate resolutionfair value for a sample of long-lived assets by:•evaluating management’s assumptions and methodology for the sampled right-of-use assets with a zero fair value•developing independent fair value ranges for the sampled properties and right-of-use assets using the market approach or income approach based on the operations and specific characteristics of each asset•comparing the independent fair value estimate ranges for the sampled properties and right-of-use assets to the Company’s fair value estimates that were ultimately used to identify and record impairment, if applicable.Merchandise inventoriesAs discussed in Note 1, merchandise inventories are valued at the lower of cost or market using the last-in, first-out retail inventory method. Under the retail inventory method, inventory is segregated into departments of merchandise having similar characteristics. Inventory retail values are converted to cost basis by applying specific average cost factors for each merchandise department. The calculation includes a number of inputs including the retail value of inventory and adjustments to inventory costs such as mark down allowances, shrinkage and permanent markdowns. The Company’s merchandise inventories were $4,361 million as of February 3, 2024.We identified the sufficiency of audit evidence over the information technology (IT) elements of merchandise inventories as a critical audit matter. Complex auditor judgment was required to evaluate the sufficiency of audit evidence obtained due to the highly automated nature of the tax positions takenprocess to record merchandise inventories that involves interfacing significant volumes of data across multiple IT systems. IT professionals with specialized skills and knowledge were required to assess the Company’s IT systems used in the merchandise inventories process.38The following are the primary procedures we performed to address this critical audit matter. We evaluated the design and tested the operating effectiveness of certain internal controls related to the merchandise inventories process. This included IT dependent controls, application controls, general IT controls, and interface controls over the data transfers between systems. We involved IT professionals with specialized skills and knowledge, who assisted in the identification and testing of certain IT systems used by the Company for calculating merchandise inventories and reconciling information produced by various systems to the impact on unrecognized tax benefitsCompany’s general ledger. On a sample basis, we tested certain inputs used in the calculation of merchandise inventories, including comparing to vendor invoices, cash receipts, and vendor confirmations, and observed inventory, including comparing prices to the inventory records. We assessed the sufficiency of audit evidence obtained related to merchandise inventories by assessing tax examination activity and evaluating the tax positions based on tax law, regulations, and other authoritative guidance with respect to statute expirations and reserve additions./s/ KPMG LLPWe have served as the Company’sCompany's auditor since 1988.Cincinnati, OhioMarch 25, 2022F-439MACY’S, INC.CONSOLIDATEDTable of ContentsSTATEMENTSOF OPERATIONS(millions,exceptpersharedata)TheaccompanyingnotesareanintegralpartoftheseConsolidatedFinancialStatements.F-5MACY’S, INC.CONSOLIDATEDSTATEMENTSOFCOMPREHENSIVE INCOME (LOSS)(millions)TheaccompanyingnotesareanintegralpartoftheseConsolidatedFinancialStatements.F-6MACY’S, INC.CONSOLIDATED BALANCE SHEETS(millions)TheaccompanyingnotesareanintegralpartoftheseConsolidatedFinancialStatements.F-7MACY’S, INC.CONSOLIDATEDSTATEMENTS OFCHANGES INSHAREHOLDERS’EQUITY(millions)(a)Representsthecumulative-effectadjustmenttoretainedearningsfortheadoptionofAccountingStandardsUpdate2016-02(ASU-2016-02),LeasesMACY'S, INC.CONSOLIDATED STATEMENTS OF INCOME(Topic842),onFebruary3,2019.millions, except per share data)2023 2022 2021 Net sales $ 23,092 $ 24,442 $ 24,460 Other revenue 774 1,007 939 Total revenue 23,866 25,449 25,399 Cost of sales (14,143) (15,306) (14,956) Selling, general and administrative expenses (8,375) (8,461) (8,154) Gains on sale of real estate 61 89 91 Impairment, restructuring and other costs (1,027) (41) (30) Operating income 382 1,730 2,350 Benefit plan income, net 11 20 66 Settlement charges (134) (39) (96) Interest expense, net (135) (162) (255) Losses on early retirement of debt — (31) (199) Income before income taxes 124 1,518 1,866 Federal, state and local income tax expense (19) (341) (436) Net income $ 105 $ 1,177 $ 1,430 Basic earnings per share $ 0.38 $ 4.28 $ 4.66 Diluted earnings per share $ 0.38 $ 4.19 $ 4.55 The accompanying notes are an integral part of these Consolidated Financial Statements.40Table of ContentsaccompanyingnotesareanintegralpartoftheseConsolidatedFinancialStatements.F-8MACY’S, INC.CONSOLIDATED STATEMENTS OF CASH FLOWS(millions)TheaccompanyingnotesareanintegralpartoftheseConsolidatedFinancialStatements.F-9MACY’S, INC.NOTESTOCONSOLIDATEDFINANCIALSTATEMENTS1.OrganizationandSummaryofSignificantAccountingPoliciesMACY'S, INC.CONSOLIDATED STATEMENTS OF COMPREHENSIVE INCOME(millions)2023 2022 2021 Net income $ 105 $ 1,177 $ 1,430 Other comprehensive income, net of taxes: Net actuarial gain (loss) and prior service credit on post employment and postretirement benefit plans, net of tax effect of $7 million, $(12) million and $23 million 19 (38) 69 Reclassifications to net income: Net actuarial loss and prior service cost on post employment and postretirement benefit plans, net of tax effect of $1 million, $4 million and $9 million 3 13 25 Settlement charges, net of tax effect of $34 million,$10 million and $24 million100 29 72 Total other comprehensive income 122 4 166 Comprehensive income $ 227 $ 1,181 $ 1,596 The accompanying notes are an integral part of these Consolidated Financial Statements.41MACY'S, INC.CONSOLIDATED BALANCE SHEETS(millions)February 3, 2024 January 28, 2023 ASSETS Current Assets: Cash and cash equivalents $ 1,034 $ 862 Receivables 293 300 Merchandise inventories 4,361 4,267 Prepaid expenses and other current assets 401 424 Total Current Assets 6,089 5,853 Property and Equipment – net 5,308 5,913 Right of Use Assets 2,305 2,683 Goodwill 828 828 Other Intangible Assets – net 430 432 Other Assets 1,286 1,157 Total Assets $ 16,246 $ 16,866 LIABILITIES AND SHAREHOLDERS’ EQUITY Current Liabilities: Merchandise accounts payable $ 1,913 $ 2,053 Accounts payable and accrued liabilities 2,434 2,750 Income taxes 83 58 Total Current Liabilities 4,430 4,861 Long-Term Debt 2,998 2,996 Long-Term Lease Liabilities 2,986 2,963 Deferred Income Taxes 745 947 Other Liabilities 950 1,017 Shareholders’ Equity: Common stock (274.2 and 271.3 shares outstanding) 3 3 Additional paid-in capital 352 467 Accumulated equity 6,190 6,268 Treasury stock (1,912) (2,038) Accumulated other comprehensive loss (496) (618) Total Shareholders' Equity 4,137 4,082 Total Liabilities and Shareholders’ Equity $ 16,246 $ 16,866 The accompanying notes are an integral part of these Consolidated Financial Statements.42MACY'S, INC.CONSOLIDATED STATEMENTS OF CHANGES IN SHAREHOLDERS' EQUITY(millions)Common
StockAdditional
Paid-In
CapitalAccumulated
EquityTreasury
StockAccumulated
Other
Comprehensive
Income (Loss)Total
Shareholders’
EquityBalance at January 30, 2021 $ 3 $ 571 $ 3,928 $ (1,161) $ (788) $ 2,553 Net income 1,430 1,430 Other comprehensive income 166 166 Common stock dividends($0.30 per share) (90) (90) Stock repurchases (500) (500) Stock-based compensation expense 55 55 Stock issued under stock plans (109) 116 7 Balance at January 29, 2022 3 517 5,268 (1,545) (622) 3,621 Net income 1,177 1,177 Other comprehensive income 4 4 Common stock dividends($0.63 per share) 4 (177) (173) Stock repurchases (601) (601) Stock-based compensation expense 54 54 Stock issued under stock plans (108) 108 — Balance at January 28, 2023 3 467 6,268 (2,038) (618) 4,082 Net income 105 105 Other comprehensive income 122 122 Common stock dividends($0.66 per share) 2 (183) (181) Stock repurchases (38) (38) Stock-based compensation expense 47 47 Stock issued under stock plans (164) 164 — Balance at February 3, 2024 $ 3 $ 352 $ 6,190 $ (1,912) $ (496) $ 4,137 The accompanying notes are an integral part of these Consolidated Financial Statements.43MACY'S, INC.CONSOLIDATED STATEMENTS OF CASH FLOWS(millions)2023 2022 2021 Cash flows from operating activities: Net income $ 105 $ 1,177 $ 1,430 Adjustments to reconcile net income to net cash provided by operating activities: Impairment, restructuring and other costs 1,027 41 30 Settlement charges 134 39 96 Depreciation and amortization 897 857 874 Benefit plans 4 17 34 Stock-based compensation expense 47 54 55 Gains on sale of real estate (61) (89) (91) Deferred income taxes (244) (38) 19 Amortization of financing costs and premium on acquired debt 10 11 70 Changes in assets and liabilities: (Increase) decrease in receivables 7 (3) (21) (Increase) decrease in merchandise inventories (99) 116 (610) (Increase) decrease in prepaid expenses and other current assets 18 (66) (39) Increase (decrease) in merchandise accounts payable (113) (129) 218 Increase (decrease) in accounts payable and accrued liabilities (347) (174) 245 Increase (decrease) in current income taxes 24 (75) 588 Change in other assets and liabilities (104) (123) (186) Net cash provided by operating activities 1,305 1,615 2,712 Cash flows from investing activities: Purchase of property and equipment (631) (888) (354) Capitalized software (362) (407) (243) Disposition of property and equipment 86 137 164 Other, net (6) (11) 63 Net cash used by investing activities (913) (1,169) (370) Cash flows from financing activities: Debt issued 961 2,809 1,085 Debt issuance costs (1) (21) (9) Debt repaid (963) (3,100) (2,699) Debt repurchase premium and expenses — (29) (152) Dividends paid (181) (173) (90) Increase (decrease) in outstanding checks 2 (181) (23) Acquisition of treasury stock (38) (601) (500) Issuance of common stock — — 7 Net cash used by financing activities (220) (1,296) (2,381) Net increase (decrease) in cash, cash equivalents and restricted cash 172 (850) (39) Cash, cash equivalents and restricted cash beginning of period 865 1,715 1,754 Cash, cash equivalents and restricted cash end of period $ 1,037 $ 865 $ 1,715 Supplemental cash flow information: Interest paid $ 157 $ 188 $ 442 Interest received 38 9 1 Income taxes paid (received), net 240 455 (171) Restricted cash, end of period 3 3 3 The accompanying notes are an integral part of these Consolidated Financial Statements.44Table of ContentsMACY’S, INC.NOTES TO CONSOLIDATED FINANCIAL STATEMENTS1. Organization and Summary of Significant Accounting PoliciesNature of OperationsMacy’s,Macy's, Inc.,togetherwithitssubsidiaries(the“Company”) (the Company),isanomnichannel omni-channel retailorganizationoperatingstores,websitesandmobileapplicationsunderthreebrands(Macy’s,Bloomingdale’s (Macy's, Bloomingdale's andbluemercury) Bluemercury) thatsellawiderangeofmerchandise,includingapparelandaccessories(men's, (men's, women'sandkids'),cosmetics,homefurnishingsandother consumergoods.TheCompanyhasstoresin43states,theDistrictofColumbia,PuertoRicoandGuam.Asof January 29, 2022, February 3, 2024, theCompany’s Company's operationsandoperatingsegmentswereconductedthroughMacy’s, Market Macy's, Macy's Backstage, Macy's small format, Bloomingdale's, Bloomingdale's The Outlet, Bloomie's, and Bluemercury, which are aggregated into one reporting segment. The metrics used by Macy’s, Macy'sBackstage,Bloomingdale’s,Bloomingdale’smanagement to assess the performance of the Company's operating divisions include sales trends, gross margin rates, expense rates, and rates of earnings before interest and taxes (EBIT) and earnings before interest, taxes, depreciation and amortization (EBITDA). TheOutlet, Bloomies, Company's operating divisions have historically had similar economic characteristics andbluemercury,whichareaggregatedinto1reportingsegmentinaccordancewiththeFinancialAccountingStandardsBoard(“FASB”)AccountingStandardsCodification(“ASC”)Topic280,SegmentReporting.Themetricsusedbymanagement expected toassesstheperformanceoftheCompany’soperatingdivisionsincludesalestrends,grossmarginrates,expenserates, have similar economic characteristics andratesofearningsbeforeinterestandtaxes(“EBIT”)andearningsbeforeinterest,taxes,depreciationandamortization(“EBITDA”).TheCompany’soperatingdivisionshavehistoricallyhadsimilareconomiccharacteristicsandareexpectedtohavesimilareconomiccharacteristicsandlong-termfinancialperformance infutureperiods.Bloomingdale's in Dubai, United Arab Emirates and Al Zahra, Kuwait are operated under a license agreement with Al Tayer Insignia, a company of Al Tayer Group, LLC.FiscalYearTheCompany’s Company's fiscalyearendsontheSaturdayclosesttoJanuary31.Fiscalyears 2021, 2020 and 2019 endedonJanuary 29,31. Fiscal years 2023, 2022, and 2021 ended on February 3, 2024, January 30, 2021 28, 2023 and February 1, 2020,respectively, andincluded52weeks.ReferencestoyearsintheConsolidatedFinancialStatementsrelatetofiscalyears ratherthancalendaryears.BasisofPresentationTheConsolidatedFinancialStatementsincludetheaccountsofMacy's,Inc.andits100%-owned subsidiaries.UseofEstimatesThepreparationoffinancialstatementsinconformitywithaccountingprinciplesgenerallyacceptedintheUnited StatesofAmericarequiresmanagementtomakeestimatesandassumptionsthataffectthereportedamountsofassetsandliabilitiesanddisclosureofcontingentassetsandliabilitiesatthedateofthefinancialstatementsandthereportedamounts ofrevenuesandexpensesduringthereportingperiod.Suchestimatesandassumptionsaresubjecttoinherentuncertainties whichmayresultinactualamountsdifferingfromreportedamounts.NetSalesRevenueisrecognizedwhencustomersobtaincontrolofgoodsandservicespromisedbytheCompany.Theamountofrevenuerecognizedisbasedontheamountthatreflectstheconsiderationthatisexpectedtobereceivedinexchangefor thoserespectivegoodsandservices.SeeNote 2,Revenue,forfurtherdiscussionoftheCompany'saccountingpoliciesfor revenuefromcontractswithcustomers.CostofSalesCostofsalesconsistsofthecostofmerchandise,includinginboundfreight,shippingandhandlingcosts,and depreciation.Anestimatedallowanceforfuturesalesreturnsisrecordedandcostofsalesisadjustedaccordingly.CashandCashEquivalentsCashandcashequivalentsincludecashandliquidinvestmentswithoriginalmaturitiesofthreemonthsorless.Cash andcashequivalentsincludesamountsdueinrespectofcreditcardsalestransactionsthataresettledearlyinthefollowing periodintheamountof $102 millionat January 29, 2022, respectively. Fiscal year 2023 included 53 weeks and $92 fiscal years 2022 and 2021 included 52 weeks. References to years in the Consolidated Financial Statements relate to fiscal years rather than calendar years.Basis of PresentationThe Consolidated Financial Statements include the accounts of Macy's, Inc. and its 100%-owned subsidiaries.Use of EstimatesThe preparation of financial statements in conformity with accounting principles generally accepted in the United States of America requires management to make estimates and assumptions that affect the reported amounts of assets and liabilities and disclosure of contingent assets and liabilities at the date of the financial statements and the reported amounts of revenues and expenses during the reporting period. Such estimates and assumptions are subject to inherent uncertainties that may result in actual amounts differing from reported amounts.ReclassificationsCertain reclassifications were made to prior years' amounts to conform with the classifications of such amounts in the most recent years.Net SalesRevenue is recognized when customers obtain control of goods and services promised by the Company. The amount of revenue recognized is based on the amount that reflects the consideration that is expected to be received in exchange for those respective goods and services. See Note 2, Revenue, for further discussion of the Company's accounting policies for revenue from contracts with customers.Cost of SalesCost of sales consists of the cost of merchandise, including inbound freight, shipping and handling costs, and certain depreciation. An estimated allowance for future sales returns is recorded and cost of sales is adjusted accordingly.Cash and Cash EquivalentsCash and cash equivalents include cash and liquid investments with original maturities of three months or less. Cash and cash equivalents includes amounts due in respect of credit card sales transactions that are settled early in the following period in the amount of $102 million at February 3, 2024 and $112 million at January 30, 202128, 2023.45NOTESTO CONSOLIDATEDFINANCIALSTATEMENTS— (Continued)InvestmentsTheCompanyfromtimetotimeinvestsindebtandequitysecurities,includingcompaniesengagedincomplementary businesses.Alldebt Debt and equity securitiesheldbytheCompanyareaccountedforunderASCTopic320,Investments– DebtSecurities,whileallmarketable at fair value if classified as trading or available-for-sale. Unrealized holding gains and losses on trading securitiesheldbytheCompanyareaccountedforunderASCTopic321,Investments – EquitySecurities.Unrealizedholdinggainsandlossesontrading equity securitiesandequitysecuritieswithareadily determinablefairvaluearerecognizedintheConsolidatedStatementsofOperations.Equitysecuritieswithoutareadily determinablefairvaluearegenerallyrecordedatcostandsubsequentlyadjusted,innetincome,forobservableprice changes(i.e. (i.e.,pricesinorderlytransactionsfortheidenticalinvestmentorsimilarinvestmentofthesameissuer).ReceivablesReceivableswere $297 $293 million atas of February 3, 2024, compared to $300 million as of January 29, 2022,compared28, 2023.The Company and Citibank, the owner of most of the Company's credit assets, are party to $276 million at January 30, 2021.TheCompanyandCitibank,theownerofmostoftheCompany'screditassets,arepartytoalong-termmarketing andservicingalliancepursuanttothetermsoftheProgramAgreement.Income earnedundertheProgramAgreementistreatedas a component of other revenue on the Consolidated Statements of Income. Under the Program Agreement, Citibank offers proprietary and non-proprietary creditcardrevenues,neton cards to theConsolidatedStatements Company's customers.Merchandise InventoriesMerchandise inventories are valued at lower ofOperations. Under cost or market using theProgramAgreement,Citibankoffersproprietaryandnon-proprietarycreditcardstotheCompany’scustomers.MerchandiseInventoriesMerchandiseinventoriesarevaluedatlowerofcostormarketusingthelast-in,first-out("LIFO") (LIFO) retailinventory method.Undertheretailinventorymethod,inventoryissegregatedintodepartmentsofmerchandisehavingsimilar characteristics,and its cost value isstatedatits derived from the currentretailsellingvalue.Inventoryretailvaluesareconvertedtoacostbasisby applyingspecificaveragecostfactorsforeachmerchandisedepartment.Costfactorsrepresenttheaveragecost-to-retail ratioforeachmerchandisedepartmentbasedonbeginninginventoryandtheannualpurchaseactivity.At February 3, 2024 and January 29, 2022and January 30, 2021,28, 2023, merchandiseinventoriesvaluedatLIFO,includingadjustmentsasnecessarytorecordinventoryat thelowerofcostormarket,approximatedthecostofsuchinventoriesusingthefirst-in,first-out("FIFO") (FIFO) retailinventory method.TheapplicationoftheLIFOretailinventorymethoddidnotresultintherecognitionofanyLIFOchargesorcreditsaffectingcostofsalesfor 2021, 2020 2023, 2022 or 2019.Theretail 2021.Permanent markdowns designated for clearance activity are recorded when the utility of the inventorymethodinherentlyrequiresmanagementjudgmentsandestimates,suchastheamountandtimingofpermanentmarkdownstoclearunproductiveorslow-moving inventory,whichmayimpacttheendinginventoryvaluationaswellasgrossmargins.Permanentmarkdownsdesignatedforclearanceactivityarerecordedwhentheutilityoftheinventoryhas diminished.Factors Operational factors consideredinthedeterminationofpermanentmarkdownsincludecurrentandanticipateddemand, customerpreferences,ageofthemerchandiseandfashiontrends.Whenadecisionismadetopermanentlymarkdown merchandise,theresultinggrossmarginreductionisrecognizedintheperiodthemarkdownisrecorded.Physicalinventoriesaregenerallytakenwithineachmerchandisedepartmentannually,andinventoryrecordsareadjustedaccordingly,resultingintherecordingofactualshrinkage.Physicalinventoriesaretakenatallstorelocationsforsubstantiallyall the majority of merchandisecategoriesapproximatelythreeweeksbeforetheendoftheyear. Physical inventories for the remaining categories are taken mid-year. Shrinkageisestimatedasapercentageofsalesatinterimperiodsandforthisapproximatethree-weekperiod, from the last physical inventory date to the end of the year, basedonhistoricalshrinkagerates. Whileitisnotpossibletoquantifytheimpactfromeachcauseofshrinkage,theCompanyhaslosspreventionprograms andpoliciesthatareintendedtominimizeshrinkage,includingtheuseofradiofrequencyidentificationcyclecountsand interiminventoriestokeeptheCompany'smerchandisefilesaccurate.Vendor inventories.Vendor AllowancesTheCompanyreceivescertainallowancesasreimbursementformarkdownstakenand/ortosupportthegross marginsearnedinconnectionwiththesalesofmerchandise.Theseallowancesarerecognizedwhenearned.TheCompanyalsoreceivesadvertisingallowancesfromapproximately 309 260 ofitsmerchandisevendorspursuanttocooperative advertisingprograms,withsomevendorsparticipatinginmultipleprograms.Theseallowancesrepresentreimbursements byvendorsofcostsincurredbytheCompanytopromotethevendors’ vendors' merchandiseandarenettedagainstadvertisingand promotionalcostswhentherelatedcostsareincurred.Advertisingallowancesinexcessofcostsincurredarerecordedasa reductionofmerchandisecostsand,ultimately,throughcostofsaleswhenthemerchandiseissold.ThearrangementspursuanttowhichtheCompany’s Company's vendorsprovideallowances,whilebinding,aregenerallyinformal one year or less innature duration. The terms andoneyearorlessinduration.Thetermsandconditionsofthesearrangementsvarysignificantlyfrom vendortovendorandareinfluencedby, among other things, the type of merchandise to be supported.46NOTESTO CONSOLIDATEDFINANCIALSTATEMENTS— (Continued)AdvertisingAdvertisingandpromotionalcostsaregenerallyexpensedatfirstshowing.Advertisingandpromotionalcostsand cooperative advertising allowances were as follows:2023 2022 2021 (millions) Gross advertising and promotional costs $ 1,210 $ 1,265 $ 1,267 Cooperative advertising allowances 103 102 90 Advertising and promotional costs, net of cooperative advertising allowances $ 1,107 $ 1,163 $ 1,177 Net sales $ 23,092 $ 24,442 $ 24,460 Advertising and promotional costs, net of cooperative advertising allowances, as a percent to net sales 4.8 % 4.8 % 4.8 % Property and Equipmentadvertisingallowanceswereasfollows:PropertyandEquipmentfromfifteen to fifty years for buildings and building equipment and threeforbuildingsandbuildingequipmentandthree to fifteen yearsforfixturesandequipment. Realestatetaxesandinterestonconstructioninprogressandlandunderdevelopmentarecapitalized.Amountscapitalized areamortizedovertheestimatedlivesoftherelateddepreciableassets.TheCompanyreceivescontributionsfrom developersandmerchandisevendorstofundbuildingimprovement improvements andtheconstructionofvendorshops.Such contributions are generally netted against the capital expenditures.Buildings on leased land and leasehold improvements aregenerallynettedagainst amortized over thecapitalexpenditures.Buildingsonleasedlandandleaseholdimprovementsareamortizedovertheshorteroftheireconomiclivesorthe leaseterm,beginningonthedatetheassetisputintouse.Thecarryingvalueoflong-livedassets,inclusiveofROUassets,isperiodicallyreviewedbytheCompanywhenever eventsorchangesincircumstancesindicatethatapotentialimpairmenthasoccurred.Forlong-livedassetsheldforuse,a potentialimpairmenthas occurred. Refer to Note 3 herein for further detail. For long-lived assets held for use, a potential impairment has occurredifprojectedfutureundiscountedcashflowsarelessthanthecarryingvalueoftheassets. Theestimateofcashflowsincludesmanagement’s management's assumptionsofcashinflowsandoutflowsdirectlyresultingfromtheuseofthoseassetsinoperations.Whenapotentialimpairmenthasoccurred,animpairmentwrite-downisrecordedifthe carryingvalueofthelong-livedassetexceedsitsfairvalue.TheCompanybelievesitsestimatedcashflowsaresufficienttosupportthecarryingvalueofitslong-livedassets.Ifestimatedcashflowssignificantlydifferinthefuture,theCompanymayberequiredtorecordassetimpairmentwrite-downs.IftheCompanycommitstoaplantodisposeofalong-livedassetbeforetheendofitspreviouslyestimateduseful life,estimatedcashflows and useful life arerevisedaccordingly,andtheCompanymayberequiredtorecordanassetimpairmentwrite-down.Additionally,relatedliabilitiesarisesuchasseverance,contractualobligationsandotheraccrualsassociatedwithstoreclosingsfromdecisionstodisposeofassets.TheCompanyestimatestheseliabilitiesbasedonthefactsand circumstancesinexistenceforeachrestructuringdecision.TheamountstheCompanywillultimatelyrealizeordisburse coulddifferfromtheamountsassumedinarrivingattheassetimpairmentandrestructuringchargerecorded.TheCompanyclassifiescertainlong-livedassetsasheldfordisposalbysaleandceasesdepreciationwhenthe particularcriteriaforsuchclassificationaremet,includingtheprobablesalewithinoneyear.Forlong-livedassetstobedisposedofbysale,animpairmentchargeisrecordedifthecarryingamountoftheassetexceedsitsfairvaluelesscoststosell.Suchvaluationsincludeestimationsoffairvaluesandincrementaldirectcoststotransactasale.LeasesOperatingleaseliabilitiesarerecognizedattheleasecommencementdatebasedonthepresentvalueofthefixed leasepaymentsusingtheCompany'sincrementalborrowingratesforitspopulationofleases.RelatedoperatingROU assetsarerecognizedbasedontheinitialpresentvalueofthefixedleasepayments,reducedbycontributionsfrom landlords,plusanyprepaidrentanddirectcostsfromexecutingtheleases.ROUassetsaretestedforimpairmentinthe samemanneraslong-livedassets.CertainoftheCompany’s Company's realestateleaseshavetermsthatextendforasignificantnumberofyearsandprovideforrentalratesthatincreaseordecreaseovertime.Lease Lease termsincludethenoncancellable portionoftheunderlyingleasesalongwithanyreasonablycertainleaseperiodsassociatedwithavailablerenewalperiods, terminationoptionsandpurchaseoptions.Leaseagreementswithleaseandnon-leasecomponentsarecombinedasa single lease component for all classes of underlying assets.47NOTESTO CONSOLIDATEDFINANCIALSTATEMENTS— (Continued)Leaseswithaninitialtermof12 monthsorlessarenotrecordedonthebalancesheet;theCompanyrecognizeslease expensefortheseleasesonastraight-linebasisovertheleaseterm.Variableleasepaymentsarerecognizedasleaseexpenseastheyareincurred.ASU2016-02,Leases (Topic 842),asamended,wasadoptedbyGoodwill and Other Intangible AssetsThe carrying value of goodwill and other intangible assets with indefinite lives are reviewed at least annually for possible impairment. Goodwill and other intangible assets with indefinite lives have been assigned to reporting units for purposes of impairment testing. The reporting units are the Company's retail operating divisions. Goodwill and other intangible assets with indefinite lives are tested for impairment annually at the end of the fiscal month of May.The Company evaluates qualitative factors to determine if it is more likely than not that the fair value of a reporting unit or other intangible assets with indefinite lives is less than its carrying value and whether it is necessary to perform the quantitative impairment test. If required, the CompanyonFebruary3,2019,utilizing performs amodifiedretrospectiveapproachthatallowedfortransitionintheperiod quantitative impairment test which involves a comparison of adoption.TheCompanyadoptedthepackageofpracticalexpedientsavailableattransitionthatretainedthelease classificationandinitialdirectcostsforanyleasesthatexistedpriortoadoptionofthestandard.Contractsenteredinto priortoadoptionwerenotreassessedforleaseseach reporting unit's orembeddedleases.Uponadoption,theCompanyusedhindsightin determiningleasetermandimpairment.Forleaseandnon-leasecomponents,theCompanyhaselectedtoaccountforboth asasingleleasecomponent.GoodwillandOtherIntangibleAssetsThecarryingvalueofgoodwillandotherintangibleassetswithindefinitelivesarereviewedatleastannuallyfor possibleimpairmentinaccordancewithASCSubtopic350-20,Goodwill.Goodwillandotherintangibleassetswith indefiniteliveshavebeenassigned lives' fair values toreportingunitsforpurposesofimpairmenttesting.Thereportingunitsarethe Company’sretailoperatingdivisions.GoodwillandotherintangibleassetswithindefinitelivesaretestedforimpairmentannuallyattheendofthefiscalmonthofMay.TheCompanyevaluatesqualitativefactorstodetermineifitismorelikelythannotthatthefairvalueofareporting unitorotherintangibleassetswithindefinitelivesislessthanitscarryingvalueandwhetheritisnecessarytoperformthe quantitativeimpairmenttest.Ifrequired,theCompanyperformsaquantitativeimpairmenttestwhichinvolvesa comparisonofeachreportingunit'sorotherintangibleassetswithindefinitelives’fairvaluestoitscarryingvalue. Estimatingthefairvaluesofthereportingunitsorotherintangibleassetswithindefinitelivesinvolvestheuseof significantassumptions,estimatesandjudgmentswithrespecttoavarietyoffactors,includingsales,grossmarginandSG&A expense rates,capitalexpenditures,cashflowsandtheselectionanduseofanappropriatediscountrateandmarketvalues andmultiplesofearningsandrevenuesofsimilarpubliccompanies.Theprojectedsales,grossmarginandSG&AexpenserateassumptionsandcapitalexpendituresarebasedontheCompany’s Company's annualbusinessplanorotherforecastedresults. Discountratesreflectmarket-basedestimatesoftherisksassociatedwiththeprojectedcashflowsofthereportingunitor indefinitelivedintangibleasset.Theestimatesoffairvalueofreportingunitsorotherintangibleassetswithindefinitelivesarebasedonthebest informationavailableasofthedateoftheassessment.Ifthecarryingvalueofareportingunitexceedsitsfairvalue,an impairmentlosswillberecognizedinanamountequaltosuchexcess,limitedtothetotalamountofgoodwillallocatedto the total amount of goodwill allocated to the reportingunit.Ifthecarryingvalueofanindividualindefinite-livedintangibleassetexceedsitsfairvalue,such individual indefinite-lived intangible asset is written down by an amount equal to such excess.Capitalized Softwareindefinite-livedintangibleassetiswrittendownbyanamountequalThe Company capitalizes purchased and internally-developed software as well as implementation costs associated with cloud computing arrangements and amortizes such costs tosuchexcess.CapitalizedSoftwareTheCompanycapitalizespurchasedandinternallydevelopedsoftwareandamortizessuchcoststoexpenseona straight-line basis generally over fourbasisgenerallyoverfour to five years.CapitalizedsoftwareisincludedinotherassetsontheConsolidated Balance Sheets.Sheets.GiftCardsTheCompanyonlyoffersno-fee,non-expiringgiftcardstoitscustomers.Atthetimegiftcardsaresoldorissued,norevenueisrecognized;rather,theCompanyrecordsanaccruedliabilitytocustomers.Theliabilityisrelievedandrevenueisrecognizedequaltotheamountredeemedformerchandise.TheCompanyrecordsrevenuefromunredeemedgiftcards (breakage)innetsalesonapro-ratabasisoverthetimeperiodgiftcardsareactuallyredeemed.Atleastthreeyearsof historicaldata,updatedannually,isusedtodetermineactualredemptionpatterns.TheCompanyrecordsbreakageincomewithinnetsalesontheConsolidatedStatementsofOperations.LoyaltyProgramsTheCompanymaintainscustomerloyaltyprogramsinwhichcustomersearnpointsbasedontheirpurchases.Under theMacy’s Macy's StarRewardsloyaltyprogram,pointsareearnedbasedoncustomers’ customers' spendingonMacy’s Macy's privatelabelandco-brandedcreditcardsaswellasnon-proprietarycards and other forms of tender.The Company’s Bloomingdale’sCompany's Bloomingdale's Loyallist and bluemercuryBluemercury BlueRewards programs provide tender neutral points-based programs to their customers.TheCompanyrecognizestheestimatednetamountoftherewardsthatwillbeearnedandredeemedasareductiontonetsalesatthetimeoftheinitialtransactionandastenderwhenthe pointsaresubsequentlyredeemedbyacustomer.F-13NOTESTO CONSOLIDATEDFINANCIALSTATEMENTS— (Continued)Self-InsuranceReservesTheCompany,throughitsinsurancesubsidiary,isself-insuredforworkerscompensationandgeneralliabilityclaimsuptocertainmaximumliabilityamounts.Althoughtheamountsaccruedareactuariallydeterminedbasedonanalysisof historicaltrendsoflosses,settlements,litigationcostsandotherfactors,theamountstheCompanywillultimatelydisburse coulddifferfromsuchaccruedamounts.PostEmploymentObligationsTheCompany,throughitsactuaries,utilizesassumptionswhenestimatingtheliabilitiesforpensionandotheremployeebenefitplans.Theseassumptions,whereapplicable,includethediscountratesusedtodeterminetheactuarial presentvalueofprojectedbenefitobligations,therateofincreaseinfuturecompensationlevels,mortalityrates andthelong-termrateofreturnonassets.TheCompanymeasurespostemploymentassetsandobligationsusingthemonth-endthatisclosesttotheCompany'sfiscalyear-endoraninterimperiodquarter-endifaplanisdeterminedtoqualifyforaremeasurement.ThebenefitexpenseisgenerallyrecognizedintheConsolidatedFinancialStatementsonanaccrualbasisovertheaverageremaininglifetimeofparticipants,andthe accruedbenefitsarereportedinotherassets,accountspayableandaccruedliabilitiesandotherliabilitiesonthe ConsolidatedBalanceSheets,asappropriate.IncomeTaxesIncometaxesareaccountedforundertheassetandliabilitymethod.Deferredincometaxassetsandliabilitiesare recognizedforthefuturetaxconsequencesattributabletodifferencesbetweenthefinancialstatementcarryingamountsofexistingassetsandliabilitiesandtheirrespectivetaxbases,andestimated netoperatinglossandtaxcreditcarryforwards.Deferred incometaxassetsandliabilitiesaremeasuredusingenactedtaxratesexpectedtoapplytotaxableincomeintheyearsin whichthosetemporarydifferencesareexpectedtoberecoveredorsettled.TheeffectondeferredincometaxassetsandliabilitiesofachangeintaxratesisrecognizedintheConsolidatedStatementsofOperationsintheperiodthatincludesthe enactmentdate.Deferredincometaxassetsarereducedbyavaluationallowancewhenitismorelikelythannotthatsome portionofthedeferredincometaxassetswillnotberealized.StockBasedCompensationTheCompanyrecordsstock-basedcompensationexpenseaccordingtotheprovisionsofASCTopic718,Compensation–StockCompensation.ASCTopic718requiresallshare-basedpaymentstoemployees,includinggrantsofemployeestockoptions,toberecognizedinthefinancialstatementsbasedontheirfairvalues.UndertheprovisionsofASCTopic718,theCompanydeterminestheappropriatefairvaluemodeltobeusedforvaluingshare-basedpaymentsandtheamortizationmethodforcompensationcost.ComprehensiveIncome (Loss)Totalcomprehensiveincome (loss)representsthechangeinequityduringaperiodfromsourcesotherthantransactionswithshareholdersand,assuch,includesnetincome (loss).FortheCompany,theonlyothercomponentsoftotalcomprehensiveincome (loss) for 2021, 2020 and 2019relatetopostemploymentandpostretirementplanitems.SettlementchargesincurredareincludedasaseparatecomponentofincomebeforeincometaxesintheConsolidatedStatementsofOperations.Amortization reclassificationsoutofaccumulatedothercomprehensivelossareincludedinthecomputationofnetperiodicbenefitcost (income)andareincludedinbenefitplanincome,netontheConsolidatedStatementsofOperations.RecentAccountingPronouncementsIn March 2020, the SEC issued a final rule, Financial Disclosures About Guarantors and Issuers of Guaranteed Securities and Affiliates Whose Securities Collateralize a Registrant’s Securities, that simplifies the disclosure requirements related to registered securities under Rule 3-10 of Regulation S-X. The rule replaces the requirement to provide condensed consolidating financial information with a requirement to present summarized financial information amount of the issuersrewards that will be earned and guarantors. It also requires qualitative disclosures with respectredeemed as a reduction to information about guarantors,net sales at the termstime of the initial transaction and conditionsas tender when the points are subsequently redeemed by a customer.Self-Insurance ReservesThe Company, through its insurance subsidiary, is self-insured for workers compensation and general liability claims up to certain maximum liability amounts. Although the amounts accrued are actuarially determined based on analysis of guaranteeshistorical trends of losses, settlements, litigation costs and other factors, the amounts the Company will ultimately disburse could differ from such accrued amounts.48NOTES TO CONSOLIDATED FINANCIAL STATEMENTS — (Continued)Post-Employment ObligationsThe Company, through its actuaries, utilizes assumptions when estimating the liabilities for pension and other employee benefit plans. These assumptions, where applicable, include the discount rates used to determine the actuarial present value of projected benefit obligations, the rate of increase in future compensation levels, mortality rates and the factorslong-term rate of return on assets. The Company measures post-employment assets and obligations using the month-end that may affect payment. These disclosures may be provided outside the footnotesis closest to the Company’sCompany's fiscal year-end or an interim period quarter-end if a plan is determined to qualify for a remeasurement. The benefit expense is generally recognized in the Consolidated Financial Statements on an accrual basis over the average remaining lifetime of participants, and the accrued benefits are reported in other assets, accounts payable and accrued liabilities and other liabilities on the Consolidated Balance Sheets, as appropriate.Income TaxesIncome taxes are accounted for under the asset and liability method. Deferred income tax assets and liabilities are recognized for the future tax consequences attributable to differences between the financial statement carrying amounts of existing assets and liabilities and their respective tax bases, and net operating loss and tax credit carryforwards. Deferred income tax assets and liabilities are measured using enacted tax rates expected to apply to taxable income in the years in which those temporary differences are expected to be recovered or settled. The effect on deferred income tax assets and liabilities of a change in tax rates is recognized in the Consolidated Statements of Income in the period that includes the enactment date. Deferred income tax assets are reduced by a valuation allowance when it is more likely than not that some portion of the deferred income tax assets will not be realized.Stock Based CompensationThe Company records stock-based compensation expense for awards that include share-based payments to employees, including grants of employee stock options and restricted stock units, in accordance with their fair values. The Company determines the appropriate fair value model to be used for valuing share-based payments and the amortization method for compensation cost based on nature of the award.Comprehensive IncomeTotal comprehensive income represents the change in equity during a period from sources other than transactions with shareholders and, as such, includes net income. For the Company, the only other components of total comprehensive income for 2023, 2022 and 2021 relate to post employment and postretirement plan items. Settlement charges incurred are included as a separate component of income before income taxes in the Consolidated Statements of Operations. Amortization reclassifications out of accumulated other comprehensive loss are included in the computation of net periodic benefit cost (income) and are included in benefit plan income, net on the Consolidated Statements of Operations.Recent Accounting PronouncementsIn September 2022, the Financial Accounting Standards Board ("FASB") issued Accounting Standards Update ("ASU") 2022-04, Liabilities - Supplier Finance Programs (Subtopic 405-50): Disclosure of Supplier Finance Program Obligations (ASU 2022-04), which requires entities to disclose the key terms of supplier finance programs they use in connection with the purchase of goods and services, along with the amount of obligations outstanding at the end of each period and an annual rollforward of such obligations. ASU 2022-04 became effective for the Company beginning in 2023. The Company adopted ASU 2022-04 in the first quarter of 2023, with the exception of the rollforward information, which is required only for annual periods and is reflected in Note 15 herein. The adoption did not have an impact on the consolidated financial statements.In applyingNovember 2023, the FASB issued ASU 2023-07, "Segment Reporting (Topic 280): Improvements to Reportable Segment Disclosures. The amendments in this rule,update enhance segment reporting by expanding the breadth and frequency of segment disclosures required by public entities. Most notable, registrants will be required to disclose: (1) significant segment expenses regularly provided to the Chief Operating Decisions Maker ("CODM") and included within the reported measure(s) of a segment's profit or loss, (2) the amount and composition of other segment items, (3) how the CODM uses the reported measure(s) of a segment's profit or loss to assess segment performance and decide how to allocate resources, (4) on an interim basis, all segment profit or loss and asset disclosures currently required annually by Topic 280, as well as those introduced by the ASU, and (5) the CODM's title and position. ASU 2023-07 is effective for the Company has elected to provide these disclosuresbeginning in Item 7. Management’s Discussion & Analysis of Financial Conditions and Results of Operations.does not expect that any recentlyis currently evaluating the impacts of the adoption of ASU 2023-09.49NOTES TO CONSOLIDATED FINANCIAL STATEMENTS — (Continued)In December 2023, the FASB issued accounting pronouncements will haveASU 2023-09, "Income Taxes (Topic 740): Improvements to Income Tax Disclosures" (ASU 2023-09). The amendments in this update enhance the transparency and decision usefulness of income tax disclosures, primarily through improvements to the rate reconciliation and income taxes paid information, specifically requiring (1) consistent categories and greater disaggregation of information in the rate reconciliation, and (2) income taxes paid disaggregation by jurisdiction. These amendments allow investors to better assess how an entity's operations and related tax risks and tax planning and operational opportunities affects its income tax rate and prospects for future cash flows. ASU 2023-09 is effective for the Company beginning in the fiscal year ending January 31, 2026. The Company is currently evaluating the impacts of the adoption of ASU 2023-09.2. RevenueNet salesNet sales, which mainly consists of retail sales but also includes merchandise returns, gift cards and loyalty programs, represented 97% of total revenue for 2023, and 96% of total revenue for both 2022 and 2021. Other revenue generating activities consist of credit card revenues as well as Macy's Media Network.Net sales by family of business 2023 2022 2021 (millions) Women’s Accessories, Shoes, Cosmetics and Fragrances $ 9,520 $ 9,597 $ 9,385 Women’s Apparel 4,861 5,349 5,174 Men’s and Kids’ 4,918 5,297 5,247 Home/Other (a) 3,793 4,199 4,654 Total Net Sales 23,092 24,442 24,460 Credit card revenues, net 619 863 832 Macy's Media Network revenue, net (b) 155 144 107 Other Revenue 774 1,007 939 Total Revenue $ 23,866 $ 25,449 $ 25,399 (a)Other primarily includes restaurant sales, allowance for merchandise returns adjustments and breakage income from unredeemed gift cards.(b)Macy's Media Network ("MMN") is an in-house media platform supporting both Macy's and Bloomingdale's customers through a material effectbroad variety of advertising formats running both on its consolidated financial statements. F-14NOTESowned and operated platforms as well as offsite.TO CONSOLIDATEDFINANCIALSTATEMENTS— (Continued)2.RevenueNetsalesRevenueisrecognizedwhencustomersobtaincontrolofgoodsandservicespromisedbytheCompany.TheamountofrevenuerecognizedisbasedontheamountthatreflectstheconsiderationthatisexpectedtobereceivedinexchangeMacy's accounted for thoserespectivegoodsandservices.Macy'saccountedforapproximately 88%86%, 89%87%, and 88% oftheCompany'snetsalesfor 2021, 20202023, 2022 and 2019,2021, respectively. In addition, digital sales accounted for approximately 35%, 44% and 25%33% of net sales in 2021, 2020both 2023 and 2019, respectively.Disaggregation2022, and 35% oftheCompany'snetsalesbyfamily in 2021.Retail SalesRetail sales include merchandise sales, inclusive ofbusiness for 2021, 2020 and 2019 wereasfollows:(a)Otherprimarilyincludesrestaurantsales,allowanceformerchandisereturnsadjustments,breakageincomefrom unredeemedgiftcards and certain loyalty program income.TheCompany'srevenuegeneratingactivitiesincludethefollowing:RetailSalesRetail delivery income, licensed department income, Marketplace income, salesincludemerchandisesales,inclusiveofdeliveryincome,licenseddepartmentincome,salesofprivate brandgoodsdirectlytothirdpartyretailersandsalesofexcessinventorytothirdparties.Salesofmerchandisearerecorded at point of sale for in-store purchases or at thetimeofshipmenttothecustomer for digital purchases andarereportednetofestimatedmerchandisereturnsandcertaincustomer incentives.Commissionsearnedonsalesgeneratedbylicenseddepartmentsareincludedasacomponentoftotalnetsales andarerecognizedasrevenueatthetimemerchandiseissoldtocustomers.Servicerevenues(e.g. (e.g.,alterationandcosmetic services)arerecordedatthetimethecustomerreceivesthebenefitoftheservice.TheCompanyhaselectedtopresentsales taxesonanetbasisand,assuch,salestaxesareincludedinaccountspayableandaccruedliabilitiesuntilremittedtothe taxing authorities.50Table of Contentsauthorities.NOTES TO CONSOLIDATED FINANCIAL STATEMENTS — (Continued)MerchandiseReturnsTheCompanyestimatesmerchandisereturnsusinghistoricaldataandrecognizesanallowancethatreducesnetsales andcostofsales.Theliabilityformerchandisereturnsisincludedinaccountspayableandaccruedliabilitiesonthe Company'sConsolidatedBalanceSheetsandwas $198 $136 million asof February 3, 2024 and $236 million as of January 29, 202228, 2023. Included in prepaid expenses and $159 other current assets is an asset totaling $83 million asof February 3, 2024 and $152 million as of January 30, 2021.Includedinprepaidexpensesandothercurrentassetsisanassettotaling $120 million as28, 2023, for the recoverable cost of January 29, 2022 merchandise estimated to be returned by customers.Gift Cards and $103 millionasof January 30, 2021,Customer Loyalty ProgramsThe liability fortherecoverablecostofmerchandiseestimatedtobereturnedbycustomers.Gift Cards unredeemed gift cards andCustomerLoyaltyProgramsTheliabilityforunredeemedgiftcards customer loyalty programs is included in accounts payable andcustomerloyaltyprogramsisincludedinaccountspayableandaccrued liabilitiesontheCompany'sConsolidatedBalanceSheetsandwas $481 $384 million asof February 3, 2024, and $399 million as of January 29,28, 2023. During 2022,,and $616 the Company recognized approximately $15 million as of January 30, 2021.During 2021 and 2020,theCompanyrecognizedapproximately $26 million and $30 million, respectively,inbreakageincomerelatedto changesinbreakagerateestimates. The Company did not make any changes to their breakage rate estimates in 2023. Changesintheliabilityforunredeemedgiftcardsandcustomerloyaltyprogramsareas follows:2023 2023 2022 2021 (millions) (millions) Netofestimatedbreakageincome.F-15NOTESTO CONSOLIDATEDNet of estimated breakage income.FINANCIALSTATEMENTS— (Continued)CreditCardRevenues,netIn 2005, in connection with the sale of most of the Company's credit card accounts and related receivable balances to Citibank, the Company and Citibank entered into a long-term marketing and servicing alliance pursuant to the terms of a Credit Card Program Agreement ("Credit(Credit Card Program")Program). Subsequent to this initial arrangement and associated amendments, on December 13, 2021, the Company entered into the sixth amendment to the amended and restated Credit Card Program with Citibank (the “Program Agreement”)Program Agreement). The changes to the Credit Card Program’sProgram's financial structure are not materially different from its previous terms. As part of the Program Agreement, the Company receives payments for providing a combination of interrelated services and intellectual property to Citibank in support of the underlying Credit Card Program. Revenue based on the spending activity of the underlying accounts is recognized as the respective card purchases occur and the Company’sCompany's profit share is recognized based on the performance of the underlying portfolio. Revenue associated with the establishment of new credit accounts and assisting in the receipt of payments for existing accounts is recognized as such activities occur. Credit card revenues include finance charges, late fees and other revenue generated by the Company’sCompany's Credit Card Program, net of fraud losses and expenses associated with establishing new accounts.TheProgramAgreementexpiresMarch 31,2030,subjecttoanadditionalrenewaltermofthree years.TheProgramAgreementprovidesfor,amongotherthings, (i)theownershipbyCitibankoftheaccountspurchasedbyCitibank,(ii)theownershipbyCitibankofnewaccounts openedbytheCompany’s Company's customers,(iii)theprovisionofcreditbyCitibanktotheholdersofthecreditcardsassociatedwiththeforegoingaccounts,(iv)theservicingoftheforegoingaccounts,and(v)theallocationbetweenCitibankandthe Companyoftheeconomicbenefitsandburdensassociatedwiththeforegoingandotheraspectsofthealliance. PursuanttotheProgramAgreement,theCompanycontinuestoprovidecertainservicingfunctionsrelatedtothe accountsandrelatedreceivablesownedbyCitibankandreceivescompensationfromCitibankfortheseservices.The amountsearnedundertheProgramAgreementrelatedtotheservicingfunctionsaredeemedadequatecompensationand, accordingly,noservicingassetorliabilityhasbeenrecordedontheConsolidatedBalanceSheets.TheCompany’s Company's creditcardrevenues,netwere $619 million, $863 million, and $832 million $751for 2023, 2022 and 2021, respectively. Amounts received under the Program Agreement were $722 million, $978 million, and $771 $950 million for 2023, 2022 and 2021, 2020respectively.51NOTES TO CONSOLIDATED FINANCIAL STATEMENTS — (Continued)3. Impairment, Restructuring and 2019, respectively.AmountsreceivedundertheProgramAgreementwere $950 million, $882 million, and $985 millionfor 2021, 2020Other CostsImpairment, restructuring and 2019, respectively.3.Impairment, Restructuring andOtherCostsImpairment, restructuring andothercostsconsistofthefollowing:During 2020, primarily as a result of the COVID-19 pandemic,following:2023 2022 2021 (millions) Asset Impairments $ 957 $ 15 $ 6 Restructuring 55 5 3 Other 15 21 21 $ 1,027 $ 41 $ 30 On February 27, 2024, the Company incurredannounced its new strategy - A Bold New Chapter, which is designed to return the Company to enterprise growth, unlock shareholder value, and better serve its customers. The $1.0 billion of impairment, restructuring and other costs recognized in fiscal 2023 primarily relates to actions that align with A Bold New Chapter. The $957 million non-cash asset impairment charge recognized in fiscal 2023 primarily related to approximately 150 locations planned for closure over the next three years, which is inclusive of both leased and owned locations, and the remaining amount is associated with corporate and other assets. The $55 million of restructuring charges totaling $3,280recognized in fiscal 2023 consisted primarily of cash expenditures related to employee termination and severance charges, $9 million the majority of which was recognized duringfunded in fiscal 2023 and the remainder is expected to be funded in the first quarterhalf fiscal 2024.The charges recognized in 2022 and 2021 primarily related to the write-off of 2020 and consisted of:capitalized software assets.•$3,080 million of goodwill impairments, with $2,982 million attributable to the Macy’s reporting unit and $98 million attributable to the bluemercury reporting unit. See discussion at Note 5, “Goodwill and Other Intangible Assets.”•$200 million of impairments primarily related to long-lived tangible and right of use assets to adjust the carrying value of certain store locations to their estimated fair value.In JuneOn February 4, 2020, the Company announced a restructuring to align its cost base with anticipated near-term sales as the business recovered from the impact of the COVID-19 pandemic. The Company reduced corporate and management headcount by approximately 3,900. Additionally, the Company reduced staffing across its store portfolio, supply chain and customer support network,Polaris strategy, which it has since adjusted as sales recoveredwas developed in early 2021. During the second quarter of 2020, the Company recognized $154 million of expense for severance related to this reduction in force, of which substantially all of this severance was paid as of January 29, 2022.F-16NOTESTO CONSOLIDATEDFINANCIALSTATEMENTS— (Continued) OnFebruary4,2020,theCompany announceditsPolarisstrategy,amulti-yearplandesignedtostabilizeprofitabilityandpositiontheCompanyforsustainable,profitablegrowth.Thestrategy,developedin2019 and refined in 2020,includesinitiativesfocusedongrowing the Company’s digital channels, expanding the Company’s off-mall store presence2020. Certain restructuring and modernizing the Company’s technology and supply chain infrastructures.Inconjunctionwiththeseinitiatives, in 2020 theCompanyannouncedplanstocloseapproximately125ofitsleast productivestores,including 8, 37, and 30 store closures that were announcedin 2021, 2020, and 2019, respectively. However, in November 2021, the Company announced the deferral of the closure of the remaining locations previously identified for closureother cash charges incurred as part of this strategy were funded in 2021 and early 2022.A summary of the 125 locationsrestructuring and other cash activity from the Polaris strategy in 2022 and 2021, which are included within accounts payable and accrued liabilities, is as follows:Severance and
other benefitsProfessional
fees and other related chargesTotal (millions) Balance at January 30, 2021 $ 14 $ 2 $ 16 Additions charged to expense 5 — 5 Cash payments (18) (2) (20) Balance at January 29, 2022 1 — 1 Additions charged to expense — — — Cash payments (1) — (1) Balance at January 28, 2023 — — — 52NOTES TO CONSOLIDATED FINANCIAL STATEMENTS — (Continued)4. Properties and LeasesProperty and Equipment, netThe major classes of property and equipment, net as of February 2020. 3, 2024 and January 28, 2023 are as follows:February 3,
2024January 28,
2023(millions) Land $ 1,262 $ 1,334 Buildings on owned land 3,205 3,691 Buildings on leased land and leasehold improvements 1,332 1,368 Fixtures and equipment 3,785 4,153 9,584 10,546 Less accumulated depreciation and amortization 4,276 4,633 $ 5,308 $ 5,913 In connection with various shopping center agreements, the Company is obligated to operate certain stores within the centers for periods of up to fifteen years. Some of these agreements require that the stores be operated under a particular name.LeasesThe Company is currentlyleases a portion of the real estate and personal property used in its operations. Most leases require the processCompany to pay real estate taxes, maintenance, insurance, and other similar costs; some also require additional payments based on percentages of repositioningsales and some contain purchase options. Certain of the Company's leases contain covenants that restrict the ability of the tenant (typically a subsidiary of the Company) to take specified actions (including the payment of dividends or other amounts on account of its store portfolio in order to optimize its omnichannel ecosystem.Asummaryofcapital stock) unless therestructuringandothercashactivityfor 2021, 2020, tenant satisfies certain financial tests.ROU assets and 2019relatedtothePolarisstrategy,whichareincludedwithinaccountspayableandaccruedlease liabilitiesisasfollows: consist of:Classification February 3,
2024January 28,
2023(millions) Assets Finance lease assets (a) Right of Use Assets $ 8 $ 9 Operating lease assets (b) Right of Use Assets 2,297 2,674 Total lease assets $ 2,305 $ 2,683 Liabilities Current Finance (a) Accounts payable and accrued liabilities $ 2 $ 2 Operating (b) Accounts payable and accrued liabilities 356 333 Noncurrent Finance (a) Long-Term Lease Liabilities 12 15 Operating (b) Long-Term Lease Liabilities 2,974 2,948 Total lease liabilities $ 3,344 $ 3,298 4.PropertiesandLeasesPropertyandEquipment,netThemajorclassesofpropertyandequipment,netasof January 29, 2022 and January 30, 2021 areasfollows:Inconnectionwithvariousshoppingcenteragreements,theCompanyisobligatedtooperatecertainstoreswithinthe centersforperiodsofuptofifteen years.Someoftheseagreementsrequirethatthestoresbeoperatedunderaparticular name.LeasesTheCompanyleasesaportionoftherealestateandpersonalpropertyusedinitsoperations.Mostleasesrequirethe Companytopayrealestatetaxes,maintenance,insurance,andothersimilarcosts;somealsorequireadditionalpayments basedonpercentagesofsalesandsomecontainpurchaseoptions.CertainoftheCompany'sleasescontaincovenantsthat restricttheabilityofthetenant(typicallyasubsidiaryoftheCompany)totakespecifiedactions(includingthepaymentof dividendsorotheramountsonaccountofitscapitalstock)unlessthetenantsatisfiescertainfinancialtests.F-17NOTESTO CONSOLIDATEDFINANCIALSTATEMENTS— (Continued)ROUassetsandleaseliabilitiesconsistof:$13 $14 millionasof January 29, 2022 February 3, 2024 and January 30, 2021.28, 2023. Asof January 29, 2022 both February 3, 2024 and January 30, 2021,28, 2023, financeleaseassets included $1 million, and $2noncurrent lease liabilities included $1 million of non-lease components.(b) As of February 3, 2024, operating lease assets included $322 million of non-lease components and current and noncurrent lease liabilities included $36 million and $356 million, respectively, andnoncurrentof non-lease components. As of January 28, 2023, operating leaseliabilitieseach assets included $2$370 millionofnon-lease components and current and noncurrent lease liabilities included $36 million and $384 million, respectively, of non-lease components.(b)Asof January 29, 2022,operatingleaseassetsincluded$377millionofnon-leasecomponentsandcurrentandnoncurrentleaseliabilitiesincluded$36 millionand$386million,respectively,ofnon-leasecomponents. Asof January 30, 2021,operatingleaseassetsincluded$383millionofnon-leasecomponentsandcurrentandnoncurrentleaseliabilitiesincluded$35 millionand$384million,respectively,ofnon-leasecomponents.53NOTES TO CONSOLIDATED FINANCIAL STATEMENTS — (Continued)Thecomponentsofnetleaseexpense,recognizedprimarilywithinselling,generalandadministrativeexpensesare disclosedbelow.For 2023, 2022 and 2021, 2020lease expense included $84 million, $79 million and 2019,leaseexpenseincluded $80 million, $87million and $83 million, respectively,relatedtonon-leasecomponents.2023 2023 2022 2021 (millions) Operating leases (c) – Operating leases (c) – Minimum rents Minimum rents 427 (d)(d)(d)$ Personal property – Operating leases Personal property – Operating leases (c) Certainsupplychainoperatingleaseexpenseamountsareincludedincostofsales.F-18NOTESTO CONSOLIDATEDFINANCIALSTATEMENTS— (Continued)Asof January 29, 2022,thematurityofleaseliabilitiesisasfollows:OperatingRepresents sublease income from certain corporate office locations.leasepaymentsinclude$2,959millionrelatedtooptionstoextendleasetermsthatarereasonablycertainofbeingexercisedandexclude $63millionoflegallybindingminimumleasepaymentsforleasessignedbutnotyetcommenced.As of February 3, 2024, the maturity of lease liabilities is as follows:Finance
LeasesOperating
Leases
(e and f)Total (millions) Fiscal year 2024 $ 3 $ 357 $ 360 2025 3 385 388 2026 2 368 370 2027 2 350 352 2028 1 328 329 After 2027 10 4,737 4,747 Total undiscounted lease payments 21 6,525 6,546 Less amount representing interest 7 3,195 3,202 Total lease liabilities $ 14 $ 3,330 $ 3,344 (e) $1,114 $2,750 millionrelatedtonon-leasecomponentpayments,with$829millionofsuchpaymentsrelatedtooptionsto extend lease terms that are reasonably certain of being exercised and exclude $77 million of legally binding minimum lease payments for leases signed but not yet commenced.(f) Operating lease payments include $978 million related to non-lease component payments, with $740 million of such payments related to options to extend lease termsthatarereasonablycertainofbeingexercised. 54NOTES TO CONSOLIDATED FINANCIAL STATEMENTS — (Continued)Additionalsupplementalinformationregardingassumptionsandcashflowsforoperatingandfinanceleasesisas follows:Lease Term and Discount Rate February 3,
2024January 28,
2023Finance leases Finance leases 11.2 11.5 Operating leases 20.4 21.3 Finance leases Finance leases 6.75 % 6.74 % Operating leases 6.71 % 6.58 % Other Information 53 Weeks Ended February 3, 2024 52 Weeks Ended
January 28, 2023(millions) (millions) Operating cash flows used from operating leases Operating cash flows used from operating leases F-19The Company is a guarantor with respect to certain lease obligations associated with The May Department Stores Company and previously disposed subsidiaries or businesses. The leases have future minimum lease payments aggregating approximately $169 million and are offset by payments from existing tenants and subtenants. In addition, the Company is contingently liable for other expenses related to the above leases, such as property taxes and common area maintenance, which are also payable by existing tenants and subtenants. Potential liabilities related to these guarantees are subject to certain defenses by the Company. The Company believes that the risk of significant loss from the guarantees of these lease obligations is remote.55NOTESTO CONSOLIDATEDFINANCIALSTATEMENTS— (Continued)5. Goodwill and Other Intangible AssetsTheCompanyisaguarantorwithrespecttocertainleaseobligationsassociatedwithTheMayDepartmentStores Company following summarizes the Company's goodwill andpreviouslydisposedsubsidiariesorbusinesses.Theleases,oneofwhichincludespotentialextensionsto 2070,havefutureminimumleasepaymentsaggregating$197millionandareoffsetbypaymentsfromexistingtenantsandsubtenants.Inaddition,theCompanyiscontingentlyliableforotherexpensesrelatedtotheaboveleases,suchasproperty taxesandcommonareamaintenance,whicharealsopayablebyexistingtenantsandsubtenants.Potentialliabilitiesrelated totheseguaranteesaresubjecttocertaindefensesby theCompany.TheCompanybelievesthattheriskofsignificantlossfromtheguaranteesoftheseleaseobligationsisremote. intangible assets:5.GoodwillandOtherIntangibleAssetsFebruary 3,
2024January 28,
2023(millions) Non-amortizing intangible assets Goodwill $ 9,290 $ 9,290 Accumulated impairment losses (8,462) (8,462) 828 828 Tradenames 376 403 $ 1,204 $ 1,231 Amortizing intangible assets Favorable leases and other contractual assets $ 5 $ 5 Tradenames 70 43 75 48 Accumulated amortization Favorable leases and other contractual assets (1) (1) Tradenames (20) (18) (21) (19) $ 54 $ 29 Capitalized software Gross balance $ 1,203 $ 1,095 Accumulated amortization (447) (429) $ 757 $ 666 ThefollowingsummarizestheCompany’sgoodwillandotherintangibleassets:2021,2023 and 2022, the Company elected to perform a qualitative impairment test on its goodwill and intangible assets with indefinite lives and concluded that it is more likely than not that the fair values exceeded the carrying values and goodwill and intangible assets with indefinite lives were not impaired.During the firstthird quarter of 2020, asfiscal 2023, the Company observed a result of the sustainedgeneral decline in the Company's market capitalization and changes in the Company's long-term projections driven largely by the impactsvaluation of the COVID-19 pandemic, the Company determined a triggering event had occurred that requiredCompany’s common shares and performed an interim qualitative impairment assessment for all oftest on its reporting units and indefinite lived intangible assets. The Company determined the fair value of each of its reporting units using a market approach or a combination of a market approach and income approach, as appropriate. Relative to the Company’s 2019 assessment, as part of this 2020 assessment, it was determined that an increase in the discount rate applied in the valuation was required to align with market-based assumptions and company-specific risk. This higher discount rate, in conjunction with revised long-term projections, resulted in lower fair values of the reporting units. As a result of this test, the Company recognized $2,982 million and $98 million of goodwill impairment for the Macy's and bluemercury reporting units, respectively, primarily during the first quarter of 2020.At the end of fiscal May 2020, the Company elected to perform a qualitative impairment test on its intangible assets with indefinite lives and concluded that it is more likely than not that the fair values of its reporting units exceeded the carrying values and goodwill is not impaired.At the end of 2022, the Company was in the early stages of reimagining its private brand portfolio and as such the intended future use of certain private brands has evolved. At the end of fiscal year 2023, the Company determined that its Karen Scott tradename had a finite life and began amortizing over the expected useful life. The Company will continue to monitor the evolution of its private brands and the related impact to its intangible assets.Finite lived tradenames are being amortized over their respective useful lives ranging from 10 years to 20 years. Favorable lease intangible assets with indefinite lives were not impaired.Finitelivedand other contractual assets are being amortized over their respective lease or contract terms.Other contractual assets and tradenamesarebeingamortizedovertheirrespectiveusefullivesof20 years.Favorableleaseintangible assetsarebeingamortizedovertheirrespectiveleaseterms.Othercontractualassetsandtradenamesamortizationexpenseamountedto $2 million $2 millionfor each of 2023, 2022, and $32021. Capitalized software amortization expense amounted to $269 million for 2021, 2020,2023, $235 million for 2022 and2019, respectively. Capitalizedsoftwareamortizationexpenseamountedto $238 million for 2021, 2021.56NOTESTO CONSOLIDATEDFINANCIALSTATEMENTS— (Continued)Futureestimatedamortizationexpenseforassets,excludingin-processcapitalizedsoftwareof$129 $57 millionnotyet placed in service as of February 3, 2024, is shown below:Amortizing
intangible assetsCapitalized
Software(millions) Fiscal year 2024 $ 5 $ 271 2025 5 230 2026 5 150 2027 5 48 2028 5 1 6. FinancingThe Company's debt is as follows:February 3,
2024January 28,
2023(millions) Long-term debt: 5.875% Senior notes due 2029 $ 500 $ 500 5.875% Senior notes due 2030 425 425 6.125% Senior notes due 2032 425 425 4.5% Senior notes due 2034 367 367 5.125% Senior notes due 2042 250 250 4.3% Senior notes due 2043 250 250 6.375% Senior notes due 2037 192 192 6.7% Senior exchanged debentures due 2034 181 181 7.0% Senior debentures due 2028 105 105 6.9% Senior debentures due 2029 79 79 6.7% Senior exchanged debentures due 2028 73 73 6.79% Senior debentures due 2027 71 71 6.7% Senior debentures due 2028 29 29 6.7% Senior debentures due 2034 18 18 8.75% Senior exchanged debentures due 2029 13 13 6.9% Senior debentures due 2032 12 12 7.6% Senior debentures due 2025 6 6 7.875% Senior exchanged debentures due 2030 5 5 7.875% Senior debentures due 2030 5 5 6.9% Senior exchanged debentures due 2032 1 1 Unamortized debt issue costs and discount (25) (28) Premium on acquired debt, using an effective interest yield of 5.76% to 6.021% 16 17 $ 2,998 $ 2,996 576.FinancingTheCompany’sdebtisasfollows:F-21Interestexpenseandlossesonearlyretirementofdebtareasfollows:2021 Financing ActivitiesOn October 15, 2021, the Company redeemed the entire outstanding $294 million aggregate principal amount of its 3.875% senior notes due 2022 (the “2022 Notes”). The redemption price was equal to 100% of the outstanding principal amount of the 2022 Notes ($294 million), plus accrued and unpaid interest of $3 million.On August 17, 2021, the Company redeemed the entire outstanding $1.3 billion aggregate principal amount of its 8.375% senior secured notes due 2025 (the “2025 Notes”). The redemption price was equal to 100% of the outstanding principal amount of the 2025 Notes ($1.3 billion), plus accrued and unpaid interest of $19 million, plus the applicable premium due to holders of the 2025 Notes in connection with the early redemption of $138 million, plus unamortized deferred debt costs of $47 million. The Company recognized the redemption premium and unamortized deferred debt costs of $185 million as losses on early retirement of debt during the third quarter of 2021.On March 17, 2021, Macy’s Retail Holdings, LLC (“MRH”), a direct, wholly owned subsidiary of Macy’s, Inc., issued $500 million in aggregate principal amount of 5.875% senior notes due 2029 (the “2029 Notes”) in a private offering (the “Notes Offering”). The 2029 Notes mature on April 1, 2029. The 2029 Notes are senior unsecured obligations of MRH and are unconditionally guaranteed on a senior unsecured basis by Macy’s, Inc. MRH used the net proceeds from the Notes Offering, together with cash on hand, to fund the tender offer discussed below.On March 17, 2021, the Company completed a tender offer in which $500 million of senior notes and debentures were tendered for early settlement and purchased by MRH. The total cash cost for the tender offer was $17 million with the remainder funded through the net proceeds from the Notes Offering discussed above. The Company recognized $11 million of losses on early retirement of debt during the first quarter of 2021.2020 Financing ActivitiesSecured as follows:2023 2022 2021 (millions) Interest on debt $ 187 $ 185 $ 246 Amortization of debt premium (2) (2) (3) Amortization of financing costs and debt discount 12 13 26 Interest on finance leases 1 1 1 198 197 270 Less interest capitalized on construction 28 22 14 Interest expense $ 170 $ 175 $ 256 Losses on early retirement of debt $ — $ 31 $ 199 Debt IssuanceOn June 8, 2020, the Company issued $1.3 billion aggregate principal amount of 8.375% senior secured notes due 2025. The 2025 Notes bore interest at a rate of 8.375% per annum, which accrued from June 8, 2020 and was payable in arrears on June 15 and December 15 of each year, commencing on December 15, 2020. The 2025 Notes mature on June 15, 2025, unless earlier redeemed or repurchased, and were subject to the terms and conditions set forth in the related indenture. The 2025 Notes were issued by Macy’s, Inc. and were secured on a first-priority basis by (i) a first mortgage/deed of trust in certain real property of subsidiaries of Macy’s, Inc. that was transferred to subsidiaries of PropCo, a newly created direct, wholly owned subsidiary of Macy’s, Inc., and (ii) a pledge by Propco of the equity interests in its subsidiaries that own such transferred real property. The 2025 Notes were, jointly and severally, unconditionally guaranteed on a secured basis by Propco and its subsidiaries and unconditionally guaranteed on an unsecured basis by MRH, a direct, wholly owned subsidiary of Macy’s, Inc. In fiscal 2021, the Company redeemed the entire outstanding $1.3 billion aggregate principal amount. F-22NOTESTO CONSOLIDATEDFINANCIALSTATEMENTS— (Continued)Asset-Based Credit FacilityOn June 8, 2020, the ABL Borrower, an indirect wholly owned subsidiary of the Company, and its parent, the ABL Parent, entered into the ObligationsABL Credit Facility with Bank of America, N.A., as administrative agent and collateral agent, and the lenders party thereto. The ABL Credit Facility provides the ABL Borrower with a $2,941 million revolving credit facility (the “Revolving ABL Facility”), including a swingline sub-facility and a letter of credit sub-facility. The ABL Borrower may request increases in the size of the Revolving ABL Facility up to an additional aggregate principal amount of $750 million. As of January 29, 2022, the Company had $116 million of standby letters of credit outstanding under the ABL Credit Facility, which reduces the available borrowing capacity. There were $585 million of borrowings and repayments under the ABL Credit Facility in fiscal 2021 and therefore 0 borrowings outstanding as of January 29, 2022. There were 0 borrowings under the ABL Credit Facility in 2020.Additionally, on June 8, 2020 and concurrently with closing the ABL Credit Facility, the ABL Borrower purchased all presently existing inventory, and assumed the liabilities in respect of all presently existing and outstanding trade payables owed to vendors in respect of such inventory, from MRH and certain wholly owned subsidiaries of MRH. The ABL Credit Facility is secured on a first priority basis (subject to customary exceptions) by (i) all assets of the ABL Borrower including all such inventory and the proceeds thereof and (ii) the equity of the ABL Borrower. The ABL Parent guaranteed the ABL Borrower’s obligations under the ABL Credit Facility. The Revolving ABL Facility matures on May 9, 2024.The ABL Credit Facility contains customary borrowing conditions including a borrowing base equal to the sum of (a) 80% (which automatically increased to 90% during fiscal 2021 upon the satisfaction of certain conditions, including the delivery of an initial appraisal of the inventory) of the net orderly liquidation percentage of eligible inventory, minus (b) customary reserves. Amounts borrowed under the ABL Credit Facility are subject to interest at a rate per annum equal to (i) prior to the Step Down Date (as defined in the ABL Credit Facility), at the ABL Borrower’s option, either (a) adjusted LIBOR plus a margin of 2.75% to 3.00% or (b) a base rate plus a margin of 1.75% to 2.00%, in each case depending on revolving line utilization and (ii) after the Step Down Date, at the ABL Borrower’s option, either (a) adjusted LIBOR plus a margin of 2.25% to 2.50% or (b) a base rate plus a margin of 1.25% to 1.50%, in each case depending on revolving line utilization. The ABL Credit Facility also contains customary covenants that provide for, among other things, limitations on indebtedness, liens, fundamental changes, restricted payments, cash hoarding, and prepayment of certain indebtedness as well as customary representations and warranties and events of default typical for credit facilities of this type.The ABL Credit Facility also requires (1) the Company and its restricted subsidiaries to maintain a fixed charge coverage ratio of at least 1.00 to 1.00 as of the end of any fiscal quarter on or after April 30, 2021, if (a) certain events of default have occurred and are continuing or (b) Availability plus Suppressed Availability (each as defined in the ABL Credit Facility) is less than the greater of (x) 10% of the Loan Cap (as defined in the ABL Credit Facility) and (y) $250 million, in each case, as of the end of such fiscal quarter and (2) prior to April 30, 2021, that the ABL Borrower not permit Availability plus Suppressed Availability to be lower than the greater of (x) 10% of the Loan Cap and (y) $250 million.Amendment to Existing Credit AgreementOn June 8, 2020, the Company substantially reduced the credit commitments of its existing $1,500 million unsecured credit agreement, which as of both January 29, 2022 and January 30, 2021 provided the Company with unsecured revolving credit of up to $1 million.Exchange Offers and Consent Solicitations for Certain Outstanding Debt Securities of MRHDuring the second quarter of 2020, MRH completed exchange offers (each, an “Exchange Offer” and, collectively, the “Exchange Offers”) with eligible holders and received related consents in consent solicitations for each series of notes as follows:(i) $81 million aggregate principal amount of 6.65% Senior Secured Debentures due 2024 (“New 2024 Notes”) issued by MRH for validly tendered (and not validly withdrawn) outstanding 6.65% Senior Debentures due 2024 issued by MRH (“Old 2024 Notes”);(ii) $74 million aggregate principal amount of 6.7% Senior Secured Debentures due 2028 (“New 2028 Notes”) issued by MRH for validly tendered (and not validly withdrawn) outstanding 6.7% Senior Debentures due 2028 issued by MRH (“Old 2028 Notes”);F-23NOTESTO CONSOLIDATEDFINANCIALSTATEMENTS— (Continued)(iii) $13 million aggregate principal amount of 8.75% Senior Secured Debentures due 2029 (“New 2029 Notes”) issued by MRH for validly tendered (and not validly withdrawn) outstanding 8.75% Senior Debentures due 2029 issued by MRH (“Old 2029 Notes”);(iv) $5 million aggregate principal amount of 7.875% Senior Secured Debentures due 2030 (“New 2030 Notes”) issued by MRH for validly tendered (and not validly withdrawn) outstanding 7.875% Senior Debentures due 2030 issued by MRH (“Old 2030 Notes”);(v) $5 million aggregate principal amount of 6.9% Senior Secured Debentures due 2032 (“New 2032 Notes”) issued by MRH for validly tendered (and not validly withdrawn) outstanding 6.9% Senior Debentures due 2032 issued by MRH (“Old 2032 Notes”); and(vi) $183 million aggregate principal amount of 6.7% Senior Secured Debentures due 2034 (“New 2034 Notes” and, together with the New 2024 Notes, New 2028 Notes, New 2029 Notes, New 2030 Notes and New 2032 Notes, the “New Notes” and each series, a “series of New Notes”) issued by MRH for validly tendered (and not validly withdrawn) outstanding 6.7% Senior Debentures due 2034 issued by MRH (“Old 2034 Notes” and, together with the Old 2024 Notes, Old 2028 Notes, Old 2029 Notes, Old 2030 Notes and Old 2032 Notes, the “Old Notes” and each series, a “series of Old Notes”).Each New Note issued in the Exchange Offers for a validly tendered Old Note has an interest rate and maturity date that is identical to the interest rate and maturity date of the tendered Old Note, as well as identical interest payment dates and optional redemption prices. The New Notes are MRH’s and Macy’s general, senior obligations and are secured by a second-priority lien on the same collateral securing the Notes. Following the settlement, the aggregate principal amounts of each series of Old Notes outstanding are: (i) $41 million Old 2024 Notes, (ii) $29 million Old 2028 Notes, (iii) $5 million Old 2030 Notes, (iv) $12 million Old 2032 Notes and (v) $18 million Old 2034 Notes.In addition, MRH solicited and received consents from holders of each series of Old Notes (each, a “Consent Solicitation” and, collectively, the “Consent Solicitations”) pursuant to a separate Consent Solicitation Statement to adopt certain proposed amendments to the indenture governing the Old Notes (the “Existing Indenture”) to conform certain provisions in the negative pledge covenant in the Existing Indenture to the provisions of the negative pledge covenant in MRH’s most recent indenture (the “Proposed Amendments”). MRH received consents from holders of (i) $85 million aggregate principal amount of outstanding Old 2024 Notes, (ii) $77 million aggregate principal amount of outstanding Old 2028 Notes, (iii) $13 million aggregate principal amount of outstanding Old 2029 Notes, (iv) $5 million aggregate principal amount of outstanding Old 2030 Notes, (v) $6 million aggregate principal amount of outstanding Old 2032 Notes and (vi) $185 million aggregate principal amount of outstanding Old 2034 Notes.2019 Financing ActivitiesDuringDecember2019,theCompanycompletedatenderofferandpurchased$525millioninaggregateprincipalamountofcertainseniorunsecurednotesanddebentures.Thepurchasedseniorunsecurednotesanddebenturesincluded $190millionof4.375%seniornotesdue2023,$113 millionof6.9%seniordebenturesdue2029, $110 millionof2.875%seniornotesdue2023,$100millionof3.875%seniornotesdue2022,and$12millionof7.0%seniordebenturesdue 2028.Thetotalcashcostforthetenderofferwas$553million.TheCompanyrecognized$30millionofexpenserelatedtotherecognitionofthetenderpremiumandothercostsincludingdeferreddebtdiscountamortization.Thisexpenseis presentedaslossesonearlyretirementofdebtontheConsolidatedStatementsofOperationsduring2019.Long-Term Debt MaturitiesFuturematuritiesoflong-termdebtareshownbelow:F-24NOTESTO CONSOLIDATEDFINANCIALSTATEMENTS— (Continued)Debt RepaymentsThe following table shows the detail of debt repayments:Other Debt ObligationsThefollowingsummarizescertaincomponentsoftheCompany’s other debt obligations:BankCreditAgreementOnMay9,2019,theCompanyenteredintoanewcreditagreementwithcertainfinancialinstitutionsthatreplacedthe previouscreditagreementwhichwassettoexpireonMay 6, 2021.Similartothepreviousagreement,thenewcredit agreementprovidedforrevolvingcreditborrowingsandlettersofcreditinanaggregateamountnottoexceed$1,500 million(whichcould increaseto$1,750millionattheoptionoftheCompany,subjecttothewillingnessofexistingornewlenderstoprovidecommitmentsforsuchadditionalfinancing).Thenewcreditagreementisscheduledtoexpireon May 9, 2024,subjecttouptotwoone-yearextensionsthatcouldberequestedbytheCompanyandagreedtobythelenders. The unsecured revolving credit facility contains covenants that provide for, among other things, limitations on fundamental changes, use of proceeds, and maintenance of property, as well as customary representations and warranties and events of default. As of January 29, 2022 and January 30, 2021, there were 0 revolving credit loans outstanding under the credit agreement.Senior Notes and DebenturesTheseniornotesandtheseniordebenturesareunsecuredobligationsofa100%-ownedsubsidiaryofMacy’s,Inc.andParenthasfullyandunconditionallyguaranteedtheseobligations.OtherFinancingArrangementsTherewere$116millionand$142million,respectively,ofotherstandbylettersofcreditoutstandingat January 29, 2022 and January 30, 2021. F-25NOTESTO CONSOLIDATEDFINANCIALSTATEMENTS— (Continued)Subsequent Event 2022 Financing Activities ABL BorrowerCompany entered into a third amendment to the ABL Credit Facility which provides for a new revolving credit facilityRevolving Credit Facility of $3.0 billion including a swingline sub-facility and a letter of credit sub-facility (the “NewNew ABL Credit Facility). The New ABL Credit Facility replaces the ABL Credit Facility, with consistent collateral support, but reduced interest and unused facility fees. Amounts borrowed under the New ABL Credit Facility are subject to interest at a rate per annum equal to, at the ABL Borrower’sBorrower's option, either (i) adjusted SOFR (calculated to include a 0.10% credit adjustment spread) plus a margin of 1.25% to 1.50% or (ii) a base rate plus a margin of 0.25% to 0.50%, in each case depending on revolving line utilization. The New ABL Credit Facility matures in March 2027. The Company borrowed and repaid $961 million and $1,959 million of debt under its revolving credit facility during 2023 and 2022, respectively. As of February 3, 2024 and January 28, 2023, there were no outstanding borrowings under the agreement.Bank Credit AgreementOn March 22, 2023, the Company amended its existing credit agreement, which extended the term of the credit agreement to expire in March 2027,.Senior Notes and DebenturesThe senior notes and the senior debentures are unsecured obligations of a 100%-owned subsidiary of Macy's, Inc. and Macy's Inc. has fully and unconditionally guaranteed these obligations.Other Financing ArrangementsThere were $148 million and $65 million of other standby letters of credit outstanding as of February 3, 2024 and January 28, 2023, respectively.2023 Debt Financing ActivitiesOther than borrowings under the ABL Credit Facility, the Company did not engage in other material debt financing activities during fiscal 2023.2022 Debt Financing ActivitiesSenior Secured and Unsecured NotesOn March 8, 2022, MRHthe Company completed a tender offer in which $8 million of certain senior secured notes (“Second Lien Notes”) were tendered for early settlement and purchased by MRH in an amount equal to 100% of the aggregate principal amount. Pursuant to the indenture governing the Second Lien Notes, the collateral that secured the remaining $352 million of Second Lien Notesthe Company's senior secured notes was automatically released on March 8, 2022.58NOTES TO CONSOLIDATED FINANCIAL STATEMENTS — (Continued)On March 10, 2022, MRHthe Company issued $850 million in aggregate principal amount of senior notes in two separate tranches, one representing $425 million in aggregate principal amount of 5.875% senior notes due 2030 (the “2030 Notes”)2030 Notes) and the other representing $425 million in aggregate principal amount of 6.125% senior notes due 2032 (the “2032 Notes”),2032 Notes) in a private offering. Proceeds from the issuance, together with cash on hand, were used to redeem $1.1 billion of certain of its outstanding senior notes and pay fees and expenses in connection with the offering. The 2030 Notes matureCompany recognized $31 million of losses related to the early retirement of debt on March 15, 2030 and the 2032 Notes mature on March 15, 2032.Consolidated Statement of Income. Each of the 2030 Notes and 2032 Notes are senior unsecured obligations of MRH and are unconditionally guaranteed on an unsecured basis by Macy’s,Macy's, Inc. ProceedsLong-Term Debt MaturitiesFuture maturities of long-term debt are shown below:(millions) Fiscal year 2025 $ 6 2026 — 2027 71 2028 207 2029 592 After 2029 2,131 Debt RepaymentsThe following table shows the detail of debt repayments:2023 2022 2021 (millions) Revolving credit facility $ 961 $ 1,959 $ 585 2.875% Senior notes due 2023 — 504 136 3.625% Senior notes due 2024 — 350 150 4.375% Senior notes due 2023 — 161 49 6.65% Senior debentures due 2024 — 81 5 6.65% Debentures due 2024 — 36 — 6.9% Senior debentures due 2032 — 4 — 6.7% Senior debentures due 2034 — 2 — 6.7% Senior debentures due 2028 — 1 — 8.375% Senior secured notes due 2025 — — 1,300 3.875% Senior notes due 2022 — — 450 7.6% Senior debentures due 2025 — — 18 9.5% amortizing debentures due 2021 — — 2 9.75% amortizing debentures due 2021 — — 1 $ 961 $ 3,098 $ 2,696 59NOTES TO CONSOLIDATED FINANCIAL STATEMENTS — (Continued)7. Accounts Payable and Accrued LiabilitiesFebruary 3,
2024January 28,
2023(millions) Accounts payable $ 610 $ 821 Gift cards and customer rewards 384 399 Property related liabilities 424 438 Accrued wages and vacation 177 199 Allowance for future sales returns 136 236 Current portion of post employment and postretirement benefits 163 159 Taxes other than income taxes 136 121 Current portion of workers' compensation and general liability reserves 85 86 Accrued interest 53 51 Restructuring accruals, including severance 47 4 Other 219 236 $ 2,434 $ 2,750 Changes in workers' compensation and general liability reserves, including the non-current portion, are as follows:2023 2022 2021 (millions) Balance, beginning of year $ 378 $ 387 $ 416 Charged to costs and expenses 148 123 108 Payments, net of recoveries (151) (132) (137) Balance, end of year $ 375 $ 378 $ 387 The non-current portion of workers' compensation and general liability reserves is included in other liabilities on the Consolidated Balance Sheets. At February 3, 2024 and January 28, 2023, workers' compensation and general liability reserves of $106 million and $102 million, respectively, are covered by deposits and receivables included in current assets on the Consolidated Balance Sheets.8. TaxesIncome tax expense (benefit) is as follows:2023 2022 2021 Current Deferred Total Current Deferred Total Current Deferred Total (millions) Federal $ 205 $ (193) $ 12 $ 361 $ (56) $ 305 $ 369 $ (21) $ 348 State and local 58 (51) 7 18 18 36 48 40 88 $ 263 $ (244) $ 19 $ 379 $ (38) $ 341 $ 417 $ 19 $ 436 60NOTES TO CONSOLIDATED FINANCIAL STATEMENTS — (Continued)The income tax expense reported differs from the issuance, together with cash on hand, were usedexpected tax computed by applying the federal income tax statutory rate of 21% to redeem certain of its outstanding senior notesincome before income taxes. The reasons for this difference and pay fees and expenses in connection with the offering.their tax effects are as follows:2023 2022 2021 (millions) Expected tax $ 26 $ 319 $ 392 State and local income taxes, net of federal income taxes (a) — 23 84 CARES Act carryback benefit — — (29) Tax impact of equity awards (1) — — Federal tax credits (13) (4) (3) Change in valuation allowance 5 5 (15) Other 2 (2) 7 $ 19 $ 341 $ 436 (a) 7.2022 includes an income tax benefit from the favorable resolution of state income tax litigation.AccountsPayableandAccruedLiabilitiesChangesThe Company participates inworkers’compensationandgeneralliabilityreserves,includingthenon-current portion,areasfollows:Thenon-currentportionofworkers’compensationandgeneralliabilityreservesisincludedinotherliabilitiesonthe ConsolidatedBalanceSheets.AtInternal Revenue Service (IRS) Compliance Assurance Program (CAP). As part of the CAP, tax years are audited on a contemporaneous basis so that all or most issues are resolved prior to the filing of the tax return. The IRS has completed examinations of 2022 and all prior tax years.The tax effects of temporary differences that give rise to significant portions of the deferred tax assets and deferred tax liabilities are as follows:February 3,
2024January 28,
2023(millions) Deferred tax assets Post employment and postretirement benefits $ 25 $ 50 Accrued liabilities accounted for on a cash basis for tax purposes 109 112 Lease liabilities 897 881 Unrecognized state tax benefits and accrued interest 22 22 State operating loss and credit carryforwards 122 132 Other 102 112 Valuation allowance (100) (94) Total deferred tax assets 1,177 1,215 Deferred tax liabilities Excess of book basis over tax basis of property and equipment (784) (872) Right of use assets (619) (717) Merchandise inventories (335) (351) Intangible assets (115) (116) Other (69) (106) Total deferred tax liabilities (1,922) (2,162) Net deferred tax liability $ (745) $ (947) The valuation allowance at February 3, 2024 and January 29,28, 2023 relates to net deferred tax assets for state net operating loss and credit carryforwards. The net change in the valuation allowance amounted to an increase of $6 million and $5 million in 2023 and 2022, respectively.As of February 3, 2024, the Company had no federal net operating loss carryforwards, state net operating loss carryforwards, net of valuation allowances, of $499 million, which will expire between 2024 and 2042, and no state credit carryforwards, net of valuation allowances.61Table of Contentsand January 30, 2021,workers’compensationandgeneralliability reservesincluded$102millionand$106million,respectively,whicharecoveredbydepositsandreceivablesincludedincurrentassetsontheConsolidatedBalanceSheets.F-26NOTESTO CONSOLIDATEDFINANCIALSTATEMENTS— (Continued)A reconciliation of the beginning and ending amount of unrecognized tax benefits is as follows:February 3,
2024January 28,
2023January 29,
2022(millions) Balance, beginning of year $ 80 $ 102 $ 113 Additions based on tax positions related to the current year 10 13 12 Reductions for tax positions of prior years (2) (20) (11) Settlements — (4) (2) Statute expirations (12) (11) (10) Balance, end of year $ 76 $ 80 $ 102 Amounts recognized in the Consolidated Balance Sheets Current income taxes $ 4 $ 4 $ 14 Deferred income taxes 1 1 3 Other liabilities (b) 71 75 85 $ 76 $ 80 $ 102 (b) 8.Unrecognized tax benefits not expected to be settled within one year are included within other liabilities on the Consolidated Balance Sheets.TaxesIncomeAdditional information regarding unrecognized benefits and related interest and penalties is as follow:February 3,
2024January 28,
2023(millions) Amount of unrecognized tax benefits, net of deferred tax assets, that if recognized would affect the effective tax rate $ 59 $ 63 Accrued federal, state and local interest and penalties 26 23 Amounts recognized in the Consolidated Balance Sheets Current income taxes 6 4 Other liabilities 20 19 The Company classifies federal, state and local interest and penalties not expected to be settled within one year as other liabilities on the Consolidated Balance Sheets and follows a policy of recognizing all interest and penalties related to unrecognized taxexpense(benefit)isasfollows:income accrued federal, state and local interest and penalties primarily relate to state taxexpense(benefit)reporteddiffersfrom issues and theexpectedtaxcomputedbyapplying amount of penalties paid in prior periods, and thefederalincometaxstatutoryrate amounts of21%toincomebeforeincometaxesnetofnoncontrolling interest.Thereasonsforthisdifference penalties accrued at February 3, 2024 andtheirtaxeffectsareasfollows:TheCompanyparticipatesintheInternalRevenueService(“IRS”)ComplianceAssuranceProgram("CAP").As partoftheCAP,taxyearsareauditedonacontemporaneousbasissothatallormostissuesareresolvedpriortothefilingofthetaxreturn.TheIRShascompletedexaminationsof2020andallpriortaxyears.Thetaxeffectsoftemporarydifferencesthatgiverisetosignificantportionsofthedeferredtaxassetsanddeferredtaxliabilitiesareasfollows:F-27NOTESTO CONSOLIDATEDFINANCIALSTATEMENTS— (Continued)Thevaluationallowanceat January 29, 202228, 2023, are insignificant. Federal, state and January 30, 2021relates local interest and penalties amounted tonetdeferredtaxassetsforstatenet operatinglossandcreditcarryforwards.Thenetchangeinthevaluationallowanceamountedtoadecrease expense of$15 $3 million for 2021.In 2020,thenetchangeinthevaluationallowanceamountedtoanincrease 2023, income of$24million.Asof January 29, $38 million for 2022,,theCompanyhad0federalnetoperatinglosscarryforwards,statenetoperatingloss carryforwards,netofvaluationallowances,of$1,044million,whichwillexpirebetween2022and2041, and 0statecreditcarryforwards,netofvaluationallowances.Areconciliationofthebeginningandendingamountofunrecognizedtaxbenefitsisasfollows:(a)UnrecognizedtaxbenefitsnotexpectedtobesettledwithinoneyearareincludedwithinotherliabilitiesontheConsolidatedBalanceSheets.Additionalinformationregardingunrecognizedbenefitsandrelatedinterestandpenaltiesisasfollow:TheCompanyclassifiesfederal,stateandlocalinterestandpenaltiesnotexpectedtobesettledwithinoneyearas otherliabilitiesontheConsolidatedBalanceSheetsandfollowsapolicyofrecognizingallinterestandpenaltiesrelatedto unrecognizedtaxbenefitsinincometaxexpense.Theaccruedfederal,stateandlocalinterestandpenaltiesprimarilyrelate tostatetaxissuesandtheamountofpenaltiespaidinpriorperiods,andtheamountsofpenaltiesaccruedat January 29, 2022and January 30, 2021,areinsignificant.Federal,stateandlocalinterestandpenaltiesamountedto an expense of $5 million $1 million,for 2021.The Company or one of its subsidiaries files income tax returns in the U.S. federal jurisdiction and$6millionfor 2021, 2020, and 2019, respectively.TheCompanyoroneofitssubsidiariesfilesincometaxreturnsintheU.S.federaljurisdictionandvariousstateand localjurisdictions.TheCompanyisnolongersubjecttoU.S.federalincometaxexaminationsbytaxauthoritiesforyears before2018. 2020. Withrespecttostateandlocaljurisdictions,withlimitedexceptions,theCompanyanditssubsidiariesarenolongersubjecttoincometaxauditsforyearsbefore2011.Althoughtheoutcomeoftaxauditsisalwaysuncertain,the Companybelievesthatadequateamountsoftax,interestandpenaltieshavebeenaccruedforanyadjustmentsthatare expectedtoresultfromtheyearsstillsubjecttoexamination.F-28NOTESTO CONSOLIDATEDFINANCIALSTATEMENTS— (Continued)Asof January 29, 2022,theCompanybelievesitisreasonablypossiblethatcertainunrecognizedtaxbenefitsranging from0to$60millionmayberecognizedbytheendof2022.Itisreasonablypossiblethattherecouldbeothermaterial changestotheamountofuncertaintaxpositionsduetoactivitiesofthetaxingauthorities,settlementofauditissuesorthe reassessmentofexistinguncertaintaxpositions;however,theCompanyisnotabletoestimatetheimpactoftheseitemsatthistime.In January 2022, the Company received $582 millionand its subsidiaries are no longer subject to income tax audits for years before 2014. Although the outcome of tax audits is always uncertain, the Company believes that adequate amounts of tax, interest and penalties have been accrued for any adjustments that are expected to result from the years still subject to examination.9. Retirement PlansThe Company has defined contribution plans that cover substantially all employees who work 1,000 hours or more in tax refunds associateda year. In addition, the Company has a funded defined benefit plan (Pension Plan) and an unfunded defined benefit supplementary retirement plan (SERP), which provides benefits, for certain employees, in excess of qualified plan limitations. Effective January 1, 2012, the Pension Plan was closed to new participants, with limited exceptions, and effective January 2, 2012, the SERP was closed to new participants.In February 2013, the Company announced changes to the Pension Plan and SERP whereby eligible employees no longer earn future pension service credits after December 31, 2013, with limited exceptions. All retirement benefits attributable to service in subsequent periods are provided through defined contribution plans.62NOTES TO CONSOLIDATED FINANCIAL STATEMENTS — (Continued)Retirement expenses, excluding settlement charges, included the following components:2023 2022 2021 (millions) 401(k) Qualified Defined Contribution Plan $ 85 $ 86 $ 76 Non-Qualified Defined Contribution Plan 1 1 1 Pension Plan (38) (42) (85) Supplementary Retirement Plan 30 26 24 Postretirement Obligations (3) (4) (4) $ 75 $ 67 $ 12 The Company estimates the service and interest cost components of net operating loss carrybackperiodic benefit as partcosts for the Pension Plan and SERP. This method uses a full yield curve approach in the estimation of these components of net periodic benefit costs. Under this approach, the Company applies discounting using individual spot rates from the yield curve composed of the CARES Act.9.RetirementPlansTheCompanyhasdefinedcontributionplanswhichcoversubstantiallyallemployeeswhowork1,000hoursormore inrates of return from ayear.Inaddition, portfolio of high quality corporate debt securities available at theCompanyhasafundeddefinedbenefitplan(“PensionPlan”)andanunfundeddefinedbenefitsupplementaryretirementplan(“SERP”),whichprovidesbenefits,forcertainemployees,inexcessofqualifiedplan limitations.EffectiveJanuary1,2012,thePensionPlanwasclosed measurement date. These spot rates align tonewparticipants,withlimitedexceptions,andeffectiveJanuary2,2012,theSERPwasclosedtonewparticipants.InFebruary2013,theCompanyannouncedchangestothePensionPlanandSERPwherebyeligibleemployeesno longerearnfuturepensionservicecreditsafterDecember31,2013,withlimitedexceptions.Allretirementbenefits attributabletoserviceinsubsequentperiodsareprovidedthroughdefinedcontributionplans.Retirementexpenses,excludingsettlementcharges,includedthefollowingcomponents:TheCompanyestimatestheserviceandinterestcostcomponentsofnetperiodicbenefitcostsforthePensionPlan andSERP.Thismethodusesafullyieldcurveapproachintheestimationofthesecomponentsofnetperiodicbenefitcosts.Underthisapproach,theCompanyappliesdiscountingusingindividualspotratesfromtheyieldcurvecomposed each of theratesofreturnfrom projected benefit obligation and service cost cash flows.Defined Contribution PlansThe Company has aportfolioofhighqualitycorporatedebtsecuritiesavailableatthemeasurementdate.Thesespot ratesalign qualified plan that permits participating associates toeachoftheprojectedbenefitobligationandservicecostcashflows.DefinedContributionPlansTheCompanyhasaqualifiedplanthatpermitsparticipatingassociates defer eligible compensation up todefereligiblecompensationuptothe maximumlimitsallowableundertheInternalRevenueCode.BeginningJanuary1,2014,theCompanyhasanon-qualified planwhich that permitsparticipatingassociatestodefereligiblecompensationabovethelimitsofthequalifiedplan.The Companycontributesamatchingpercentageofemployeecontributionsunderboththequalifiedandnon-qualifiedplans. EffectiveJanuary1,2014,theCompany'smatchingcontributiontothequalifiedplanwasenhancedforallparticipatingemployees,withlimitedexceptions.PriortoJanuary1,2014,thematchingcontributionrateunderthequalifiedplanwas higherforthoseemployeesnoteligibleforthePensionPlanthanforemployeeseligibleforthePensionPlan.Theliabilityrelatedtothequalifiedplanmatchingcontribution,whichisreflectedinaccountspayableandaccrued liabilitiesontheConsolidatedBalanceSheets,was$83 $94 millionat both February 3, 2024 and January 29,28, 2023. Expense related to matching contributions for the qualified plan amounted to $85 million for 2023, $86 million for 2022and$74millionat January 30, 2021. Expenserelatedtomatchingcontributionsforthequalifiedplanamountedto $76 million for 2021, $68millionfor 20202021.At February 3, 2024 and $96January 28, 2023, the liability under the non-qualified plan, which is reflected in other liabilities on the Consolidated Balance Sheets, was $42 million and $35 million, respectively. The liability related to the non-qualified plan matching contribution, which is reflected in accounts payable and accrued liabilities on the Consolidated Balance Sheets, was $1 million at both February 3, 2024 and January 28, 2023. Expense related to matching contributions for the non-qualified plan amounted to $1 million in each of 2023, 2022 and 2021. In connection with the non-qualified plan, the Company had mutual fund investments at February 3, 2024 and January 28, 2023 of $42 million and $35 million, respectively, which are included in prepaid expenses and other current assets on the Consolidated Balance Sheets.63NOTESTO CONSOLIDATEDFINANCIALSTATEMENTS— (Continued)At January 29, 2022and January 30, 2021,theliabilityunderthenon-qualifiedThe following provides a reconciliation of benefit obligations, planwhichisreflectedinother liabilitiesontheConsolidatedBalanceSheets,was$39millionand$36million,respectively.Theliabilityrelatedtothenon-qualifiedplanmatchingcontribution,whichisreflectedinaccountspayableandaccruedliabilitiesontheConsolidated BalanceSheets,was$1millionat January 29, 2022 andJanuary 30, 2021.Expenserelatedtomatchingcontributionsfor thenon-qualifiedplanamountedto $1millionfor 2021 assets, and 2020 and$2millionfor 2019.Inconnectionwithfunded status of thenon-qualifiedplan,theCompanyhadmutualfundinvestmentsat January 29, 2022and January 30, 2021of$39million Pension Plan and $36million,respectively,whichareincludedinprepaidexpensesandothercurrentassetsontheConsolidatedBalanceSheets.Thefollowingprovidesareconciliationofbenefitobligations,planassets,andfundedstatusofthePensionPlan and SERP as of February 3, 2024 and January 29, 2022 28, 2023:Pension Plan SERP 2023 2022 2023 2022 (millions) Change in projected benefit obligation Projected benefit obligation, beginning of year $ 1,979 $ 2,406 $ 508 $ 606 Interest cost 83 68 23 15 Actuarial gain (65) (301) (19) (71) Benefits paid (441) (194) (45) (42) Projected benefit obligation, end of year 1,556 1,979 467 508 Changes in plan assets Fair value of plan assets, beginning of year 2,389 2,900 — — Actual return (loss) on plan assets 63 (317) — — Company contributions — — 45 42 Benefits paid (441) (194) (45) (42) Fair value of plan assets, end of year 2,011 2,389 — — Funded status at end of year $ 455 $ 410 $ (467) $ (508) Amounts recognized in the Consolidated Balance Sheets at February 3, 2024 and January 28, 2023 Other assets $ 455 $ 410 $ — $ — Accounts payable and accrued liabilities — — (53) (48) Other liabilities — — (414) (460) $ 455 $ 410 $ (467) $ (508) Amounts recognized in accumulated other comprehensive loss at February 3, 2024 and January 28, 2023 Net actuarial loss $ 563 $ 704 $ 149 $ 175 Prior service cost — — 4 5 $ 563 $ 704 $ 153 $ 180 64F-30Netpensioncosts,settlementchargesandotheramountsrecognizedinothercomprehensivelossforthePensionPlan and SERP includedthefollowingactuariallydeterminedcomponents:Pension Plan Pension Plan SERP 2023 2023 2022 2021 2023 2022 2021 (millions) (millions) Service cost Service cost (38) Other Changes in Plan Assets and Projected Benefit Obligation Recognized in Other Comprehensive Income (Loss) Other Changes in Plan Assets and Projected Benefit Obligation Recognized in Other Comprehensive Income (Loss) Other Changes in Plan Assets and Projected Benefit Obligation Recognized in Other Comprehensive Income (Loss) (141) In 20202023 and 2021, 2022, the Company incurred non-cash settlement charges of $84$134 million and $96$39 million, respectively. For 2020, these charges related to the pro-rata recognition of net actuarial losses associated with the Company’s defined benefit retirement plans and were the result of lump sum distributions associated with retiree distribution elections and restructuring activity. For 2021,2023, these charges relate to the pro-rata recognition of net actuarial losses associated with the Company’sCompany's Pension Plan and isare the result of the transfer of pension obligations for certain retirees and beneficiaries under the Pension Plan through the purchase of a group annuity contract with an insurance company. The Company transferred $256$294 million of Pension Plan assets to the insurance company in the second quarter of 2021,2023, thereby reducing its Pension Plan benefit obligations.Thefollowingweightedaverageassumptionswereused For 2022, these charges related todeterminetheprojectedbenefitobligationsforthe PensionPlan and SERP at January 29, 2022 and January 30, 2021:Thefollowingweightedaverageassumptionswereusedtodeterminepro-rata recognition of net actuarial losses associated with thenetperiodicpensioncostforthe Company's Pension Plan and SERP:F-31NOTESTO CONSOLIDATEDFINANCIALSTATEMENTS— (Continued)PensionPlan and SERP’s following weighted average assumptionsareevaluatedannually,andatinterimre-measurementsifrequired,andupdatedasnecessary.Due were used tosettlementaccountingandre-measurementsduring 2021 and 2020, determine the projected benefit obligations for the Pension Plan and during 2020SERP at February 3, 2024 and 2019January 28, 2023:Pension Plan SERP 2023 2022 2023 2022 Discount rate 5.06 % 4.73 % 5.08 % 4.74 % Rate of compensation increases 3.50 % 3.50 % — — Cash balance plan interest crediting rate 5.00 % 5.00 % — — 65NOTES TO CONSOLIDATED FINANCIAL STATEMENTS — (Continued)The following weighted average assumptions were used to determine the net periodic pension cost for the SERP,Pension Plan and SERP:Pension Plan SERP 2023 2022 2021 2023 2022 2021 Discount rate used to measure service cost 4.88% - 6.27% 3.35% - 5.76% 2.69% - 3.07% — — — Discount rate used to measure interest cost 4.72% - 5.96% 2.55% - 5.49% 1.76% - 2.07% 4.71 % 2.53 % 1.74 % Expected long-term return on plan assets 5.30 % 4.60 % 5.75 % — — — Rate of compensation increases 3.50 % 3.50 % 3.45 % — — — Cash balance plan interest crediting rate 5.00 % 5.00 % 5.00 % — — — The Pension Plan and SERP's assumptions are evaluated annually, and at interim re-measurements if required, and updated as necessary. Due to settlement accounting and re-measurements during 2023, 2022 and 2021 for the Pension Plan, the discountrateusedtomeasureservicecostandthediscountrateusedtomeasureinterestcostvariedbetweenperiods.Thetableaboveshowstherangeof ratesusedtodeterminenetperiodicexpensefortheplans.ThediscountratesusedtodeterminethepresentvalueoftheprojectedbenefitobligationforthePensionPlan and SERP arebased onayieldcurveconstructedfromaportfolioofhighqualitycorporatedebtsecuritieswithvariousmaturities.Eachyear’s year's expectedfuturebenefitpaymentsarediscountedtotheirpresentvalueattheappropriateyieldcurverate,therebygenerating theoveralldiscountratefortheprojectedbenefitobligation.TheCompanydevelopsitsexpectedlong-termrateofreturnonplanassetassumptionbyevaluatinginputfrom severalprofessionaladvisorstakingintoaccounttheassetallocationoftheportfolioandlong-termassetclassreturn expectations,aswellaslong-terminflationassumptions.Expectedreturnsforeachmajorassetclassareconsideredalong withtheirvolatilityandtheexpectedcorrelationsamongthem.Theseexpectationsarebaseduponhistoricalrelationships aswellasforecastsofhowfuturereturnsmayvaryfromhistoricalreturns.Returnsbyassetclassandcorrelationsamong assetclassesarecombinedusingthetargetassetallocationtoderiveanexpectedreturnfortheportfolioasawhole.Long-termhistoricalreturnsoftheportfolioarealsoconsidered.Portfolioreturnsarecalculatednetofallexpenses,therefore,the Companyalsoanalyzesexpectedcostsandexpenses,includinginvestmentmanagementfees,administrativeexpenses, PensionBenefitGuarantyCorporationpremiumsandothercostsandexpenses.Asof January 29, 2022,February 3, 2024, theCompany loweredheld flat theassumedannuallong-termrateofreturnforthePensionPlan'sassetsfrom5.75%to 4.60% at 5.30% basedonexpected futurereturnsontheportfolioofassets.TheassetsofthePensionPlanaremanagedbyinvestmentspecialistswiththeprimaryobjectivesofpaymentof benefitobligationstoPlanparticipantsandanultimaterealizationofinvestmentreturnsoverlongerperiodsinexcessof inflation.investment returns over longer periods consistent with available market opportunities, a quality standard of investment, and moderate levels of risk. TheCompanyemploysatotalreturninvestmentapproachwherebyamixofdomesticandforeignequity securities,fixedincomesecuritiesandotherinvestmentsisusedtomaximizethelong-termreturnontheassetsofthe PensionPlanforaprudentlevelofrisk.Risksaremitigatedthroughassetdiversificationandtheuseofmultipleinvestment managers.Thetargetallocationforplanassetsiscurrently5%equitysecurities,88%debtsecurities,1%realestateand6%privateequities.TheCompanygenerallyemploysinvestmentmanagerstospecializeinaspecificassetclass.Thesemanagersare chosen and monitored with the assistance of professional advisors, using criteria that include organizational structure, investment philosophy, investment process, performance compared to market benchmarks and peer groups.The Company periodically conducts an analysis of the behavior of the Pension Plan's assets and liabilities under various economic and interest rate scenarios to ensure that the long-term target asset allocation is appropriate given the liabilities.66Table of Contentsandmonitoredwiththeassistanceofprofessionaladvisors,usingcriteriathatincludeorganizationalstructure,investmentphilosophy,investmentprocess,performancecomparedtomarketbenchmarksandpeergroups.TheCompanyperiodicallyconductsananalysisofthebehaviorofthePensionPlan’sassetsandliabilitiesundervariouseconomicandinterestratescenariostoensurethatthelong-termtargetassetallocationisappropriategiventheliabilities.F-32NOTESTO CONSOLIDATEDFINANCIALSTATEMENTS— (Continued)The fairvaluesofthePensionPlanassetsasof January 29, 2022 February 3, 2024 and January 30, 2021,28, 2023, excludinginterestanddividendreceivablesand pendinginvestmentpurchasesandsales,byassetcategoryareasfollows:(a)Certain investments that are measured at fair value using the net asset value per share as a practical expedient have not been classified in the fair value hierarchy. The fair value amounts presented in these tables are intended to permit reconciliation of the fair value hierarchy to the amounts presented in the fair value of plan assets.Fair Value Category 2023 2022 (millions) Money market funds Level 1 82 78 Equity securities: U.S. pooled funds Level 1 62 69 International pooled funds Level 1 27 26 Fixed income securities: U.S. Treasury bonds Level 2 20 41 Other Government bonds Level 2 58 60 Corporate bonds Level 2 1,270 1,592 Mortgage-backed securities Level 2 33 14 Pooled funds Level 1 37 48 Other types of investments: Derivatives in a positive position Level 2 9 11 Derivatives in a negative position Level 2 (2) (3) Pooled funds (a) 274 271 Real estate (a) 15 19 Private equity (a) 114 133 Total $ 2,000 $ 2,359 (a)Certain investments that are measured at fair value using the net asset value per share as a practical expedient have not been classified in the fair value hierarchy. The fair value amounts presented in these tables are intended to permit reconciliation of the fair value hierarchy to the amounts presented in the fair value of plan assets.CorporatebondsconsistprimarilyofinvestmentgradebondsofU.S.issuersfromdiverseindustries.Thefairvalueofcertainpooledfundsincludingequitysecurities,realestateandprivateequityinvestments representsthereportednetassetvalueofsharesorunderlyingassetsoftheinvestmentasapracticalexpedienttoestimate fairvalue.Internationalequitypooledfundsseektoprovidelong-termcapitalgrowthandincomebyinvestinginequity securitiesofnon-U.S.companieslocatedbothindevelopedandemergingmarkets.Therearegenerallynoredemptionrestrictionsorunfundedcommitmentsrelatedtotheseequitysecurities.Realestateinvestmentsincludeseveralfundswhich that seekrisk-adjustedreturnbyprovidingastable,income-driven rateofreturnoverthelongtermwithhighpotentialforgrowthofnetinvestmentincomeandappreciationofvalue.The realestateinvestmentsarediversifiedacrosspropertytypesandgeographicalareasprimarilyintheUnitedStatesof America.Privateequityinvestmentshaveanobjectiveofrealizingaggregatelong-termreturnsinexcessofthoseavailable frominvestmentsinthepublicequitymarkets.Privateequityinvestmentsgenerallyconsistoflimitedpartnershipsinthe UnitedStatesofAmerica,EuropeandAsia.Privateequityandrealestateinvestmentsarevaluedusingfairvaluesperthe most recent financial reports provided by the investment sponsor, adjusted as appropriate for any lag between the date of the financial reports and the Company's reporting date.Due to the nature of the underlying assets of the real estate and private equity investments, changes in market conditions and the economic environment may significantly impact the net asset value of these investments and, consequently, the fair value of the Pension Plan's investments. These investments are redeemable at net asset value to the extent provided in the documentation governing the investments. However, these redemption rights may be restricted in accordance with the governing documents. Redemption of these investments is subject to restrictions including lock-up periods where no redemptions are allowed, restrictions on redemption frequency and advance notice periods for redemptions.The Company does not anticipate making funding contributions to the Pension Plan in 2024.67Table of Contentsrecentfinancialreportsprovidedbytheinvestmentsponsor,adjustedasappropriateforanylagbetweenthedateofthefinancialreportsandtheCompany’sreportingdate.F-33NOTESTO CONSOLIDATEDFINANCIALSTATEMENTS— (Continued)DueThe following benefit payments are estimated to be paid from thenatureoftheunderlyingassetsoftherealestateandprivateequityinvestments,changesinmarket conditionsandtheeconomicenvironmentmaysignificantlyimpactthenetassetvalueoftheseinvestmentsand, consequently,thefairvalueofthePensionPlan’sinvestments.Theseinvestmentsareredeemableatnetassetvaluetotheextentprovidedinthedocumentationgoverningtheinvestments.However,theseredemptionrightsmayberestrictedinaccordancewiththegoverningdocuments.Redemptionoftheseinvestmentsissubjecttorestrictionsincludinglock-up periodswherenoredemptionsareallowed,restrictionsonredemptionfrequencyandadvancenoticeperiodsfor redemptions.As January 29, 2022 and January 30, 2021,certainoftheseinvestmentsaregenerallysubjecttolock-up periods,rangingfromonetoeight years,certainoftheseinvestmentsaresubjecttorestrictionsonredemptionfrequency,rangingfromdailytoweekly,andcertainoftheseinvestmentsaresubjecttoadvancenoticerequirements.Asof January 29, 2022and January 30, 2021,thePensionPlanhadunfundedcommitmentsrelatedtocertainofthese investmentstotaling$37millionand$39million,respectively.TheCompanydoesnotanticipatemakingfundingcontributionstothePensionPlanin2022.ThefollowingbenefitpaymentsareestimatedtobepaidfromthePensionPlan and fromtheSERP:Pension Plan Pension Plan SERP (millions) (millions) 2024 2024 2027 2028 2029-2033 10.Stock-Based Compensation10. Stock-Based CompensationThefollowingdisclosurespresenttheCompany’s Company's equityplansonacombinedbasis.TheequityplansareadministeredbytheCompensationandManagementDevelopmentCommitteeoftheBoardofDirectors(the“ (the CMD Committee”)Committee).TheCMDCommitteeisauthorizedtograntoptions,stockappreciationrights,restrictedstockandrestricted stock and restricted stock units to officers and key employees of the Company and its subsidiaries and to non-employee directors. The equity plans are intended to help the Company attract and retain directors, officers, other key executives and employees and is also intended to provide incentives and rewards relating to the Company's business plans to encourage such persons to devote themselves to the business of the Company. There have been no grants of stock appreciation rights under the equity plans.unitsStock option grants have an exercise price at least equal toofficersandkeyemployees the market value oftheCompanyanditssubsidiariesandtonon-employeedirectors.TheequityplansareintendedtohelptheCompanyattractandretaindirectors,officers,otherkeyexecutivesandemployeesandisalsointendedtoprovideincentivesandrewardsrelatingtotheCompany’sbusinessplanstoencouragesuchpersonstodevotethemselvestothebusinessoftheCompany.Therehavebeennograntsof underlying common stockappreciationrightsundertheequityplans.Stockoptiongrantshaveanexercisepriceatleastequaltothemarketvalueoftheunderlyingcommonstockonthe dateofgrant,haveten-yeartermsandtypicallyvestratablyoverfour yearsofcontinuedemployment.Restrictedstockand time-based restricted stock unit awards generally vest onerestrictedstockunitawardsgenerallyvestone to four yearsfromthedateofgrant.Performance-basedrestricted stock units generally are earned based on the attainment of specified goals achieved over the performance period.unitsgenerallyareearnedbasedontheattainmentAs ofspecifiedgoalsachievedovertheperformanceperiod.As February 3, 2024, approximately 16.6 million shares of January 29, 2022,approximately 25.3 millionsharesofcommonstockwereavailableforadditionalgrants pursuanttotheCompany’s Company's equityplans.SharesawardedaregenerallyissuedfromtheCompany'streasurystock.Stock-basedcompensationexpenseincludedthefollowingcomponents:2023 2023 2022 2021 (millions) (millions) $ Allstock-basedcompensationexpenseisrecordedinSG&AexpenseintheConsolidatedStatementsofOperations.F-34NOTESTO CONSOLIDATEDFINANCIALSTATEMENTS— (Continued)StockOptions0no grants of stock options during 20212023, 2022 or 2020. 2021.Restricted Stock UnitsThe weighted average grant date fairvalue values ofstockoptionsgrantedduring 2019 andtheweightedaverageassumptionsusedto estimatethefairvalueareasfollows:ThefairvalueofeachstockoptiongrantisestimatedonthedateofgrantusingtheBlack-Scholesoption-pricing model.TheCompanyestimatestheexpectedvolatilityandexpectedoptionlifeassumptionconsistentwithASCTopic718,Compensation–StockCompensation.TheexpectedvolatilityoftheCompany’scommonstockatthedateofgrantisestimatedbasedonahistoricvolatilityrateandtheexpectedoptionlifeiscalculatedbasedonhistoricalstockoption experienceasthebestestimateoffutureexercisepatterns.Thedividendyieldassumptionisbasedonhistorical performance-based and anticipateddividendpayouts.Therisk-freeinterestrateassumptionisbasedonobservedinterestratesconsistentwiththe expectedlifeofeachtime-based restricted stockoptiongrant.TheCompanyuseshistoricaldatatoestimatepre-vestingoptionforfeituresand recordsstock-basedcompensationexpenseonlyforthoseawardsthatareexpectedtovest.Compensationexpenseis recordedforallstockoptionsexpectedtovestbasedontheamortizationofthefairvalueatthedateofgrantonastraight- linebasisprimarilyoverthevestingperiodoftheoptions.Activityrelatedtostockoptionsfor 2021isasfollows:Additionalinformationrelatingtostockoptionsisasfollows:Asof January 29, 2022,theCompanyhad$1.9millionofunrecognizedcompensationcostsrelatedtononvested stockoptions,whichisexpectedtoberecognizedoveraweightedaverageperiodofapproximately1 year.RestrictedStockUnitsTheweightedaveragegrantdatefairvaluesofperformance-basedandtime-basedrestrictedstockunitsgranted during 2023, 2022 and 2021 are as follows:2023 2022 2021 Restricted stock units (performance-based) $ 16.16 $ 25.32 $ 15.80 Restricted stock units (time-based) 15.93 24.01 17.88 68F-35During 2023, 2022 and 2021,, 2020and 2019,theCMDCommitteeapprovedawardsofperformance-basedrestrictedstockunitsto certainseniorexecutivesoftheCompany.Eachawardreflectsatargetnumberofshares(“TargetShares”) (Target Shares) thatmaybeissuedtotheawardrecipient.Theseawardsmaybeearneduponthecompletionof approximatethree-yearperformanceperiodsending January 31, 2026, February 1, 2025 and February 3, 2024, January 28,respectively. Whether units are earned at the end of the performance period will be determined based on the achievement of certain performance objectives over the performance period. The performance objectives for the 2023, 2022 and January29,2021 awards include achieving a relative total shareholder return (TSR) external metric. The 2023, 2022respectively.Whetherunitsareearnedattheendoftheperformanceperiodwillbedeterminedbasedontheachievementofcertainperformanceobjectivesovertheperformance period.Theperformanceobjectivesincludeachievinganownedpluslicensed comparablesalesgrowth, areturnoninvestedcapitalratio, and an owned plus licensed2021 awards also include internal metrics of adjusted EBITDA margin, digital sales penetration rate.Theperformance-basedrestrictedstockunitsalsoincludea performanceobjectiverelatingtorelativetotalshareholderreturn(“TSR”).and comparable store sales, and digital sales, respectively. RelativeTSRreflectsthechangeinthevalue oftheCompany’s Company's commonstockovertheperformanceperiodinrelationtothechangeinthevalueofthecommonstockofapeergroup index overtheperformanceperiod,assumingthereinvestmentofdividends.Depending ontheresultsachievedduringthe approximatethree-yearperformanceperiods,theactualnumberofsharesthatagrantrecipientreceives attheendoftheperiodmayrangefrom 0% to 200% of the Target Shares granted for the 2023 performance-based restricted stock units, 0% to 200% of the Target Shares granted for 2022 performance-based restricted stock units, and 0% to 170% of the Target Shares granted for the 2021 performance-based restricted stock units, 0% to 150%units.The fair value of the Target Shares grantedand restricted stock awards are based on the fair value of the underlying shares on the date of grant. The fair value of the portion of the Target Shares that relate to a relative TSR performance objective was determined using a Monte Carlo simulation analysis to estimate the total shareholder return ranking of the Company among a peer group over the remaining performance periods. The expected volatility of the Company's common stock at the date of grant was estimated based on a historical average volatility rate for 2020the approximate three-year performance period. The dividend yield assumption was based on historical and anticipated dividend payouts. The risk-free interest rate assumption was based on observed interest rates consistent with the approximate three-year performance measurement period.The fair value of a restricted stock unit award at the grant date is equal to the market price of the Company's common stock on the grant date. Compensation expense is recorded for all restricted stock unit awards based on the amortization of the fair market value at the date of grant over the period the restrictions lapse or over the performance period of the performance-based restricted stock units, and 0%to 200%units. As oftheTarget Sharesgranted for February 3, 2024, the 2019 performance-basedCompany had $50.0 million of unrecognized compensation costs related to nonvested restricted stock units.Activity related to restricted stock units for 2023 is as follows:Shares Weighted Average Grant Date
Fair Value(thousands) Nonvested, beginning of period 7,606 $ 16.49 Granted – performance-based 1,081 16.16 Performance adjustment 109 15.31 Granted – time-based 4,421 15.93 Forfeited (1,362) 16.50 Vested (3,208) 13.66 Nonvested, end of period 8,647 $ 17.19 11. Shareholders' EquityThefairvalue authorized shares oftheTargetSharesandrestrictedstockawardsarebasedonthefairvalueoftheunderlyingsharesonthedateofgrant.ThefairvalueoftheportionoftheTargetSharesthatrelatetoarelativeTSRperformanceobjectivewasdeterminedusingaMonteCarlosimulationanalysistoestimatethetotalshareholderreturnrankingoftheCompany amongapeergroupovertheremainingperformanceperiods.Theexpectedvolatilityconsist ofthe Company’scommonstockatthedate 125 million shares ofgrantwasestimatedbasedonahistoricalaveragevolatilityratefortheapproximatethree-yearperformanceperiod.Thedividendyieldassumptionwasbasedonhistorical Preferred Stock, par value of $0.01 per share, with no shares issued, andanticipated dividendpayouts.Therisk-freeinterestrateassumptionwasbasedonobservedinterestratesconsistentwiththe approximatethree-yearperformancemeasurementperiod.Thefairvalue 1,000 million shares ofarestrictedstockunitawardatthegrantdateisequaltothemarketpriceoftheCompany'scommon stock,onthegrantdate.Compensationexpenseisrecordedforallrestrictedstockunitawardsbasedontheamortizationof thefairmarketvalueatthedateofgrantovertheperiodtherestrictionslapseorovertheperformanceperiodofthe performance-basedrestrictedstockunits.Asof January 29, 2022,theCompanyhad$42.7millionofunrecognized compensationcostsrelatedtononvestedrestrictedstockunits,whichisexpectedtoberecognizedoveraweightedaverage periodofapproximately2.4 years.Activityrelatedtorestrictedstockunitsfor 2021isasfollows:11.Shareholders’EquityTheauthorizedsharesoftheCompanyconsistof125millionsharesofpreferredstock(“PreferredStock”),parvalue of$0.01 $0.01 pershare,with0sharesissued,and1,000millionsharesofcommonstock,parvalueof$0.01pershare,with 333.6 million shares of common stock issued and 292.4274.2 million shares of common stock outstanding at February 3, 2024, and with 333.6 million shares of common stock issued and 271.3 million shares of common stock outstanding at January 29,28, 2023 (with shares held in the Company's treasury being treated as issued, but not outstanding).Common StockThe holders of the common stock are entitled to one vote for each share held of record on all matters submitted to a vote of shareholders. Subject to preferential rights that may be applicable to any Preferred Stock, holders of common stock are entitled to receive ratably such dividends as may be declared by the Board of Directors in its discretion, out of funds legally available. No shares of common stock were retired during 2023, 2022 and with 333.62021.69Table of Contentsmillionsharesofcommonstockissuedand310.5millionsharesofcommonstockoutstandingat January 30, 2021 (withsharesheldintheCompany’streasurybeingtreatedasissued,butnotoutstanding).Nosharesofcommonstockwereretiredduring 2021, 2020and 2019. F-36NOTESTO CONSOLIDATEDFINANCIALSTATEMENTS— (Continued)Treasury StockTreasury stock contains shares repurchased under the share repurchase program, shares repurchased to cover employee tax liabilities related to stock plan activity and shares maintained in a trust related to deferred compensation plans. Under the deferred compensation plans, shares are maintained in a trust to cover the number estimated to be needed for distribution on account of stock credits currently outstanding.On August 19, 2021, the Company announced that its Board of Directors authorized a new $500 million share repurchase program, and as of January 29, 2022, the Company has completed the share repurchase under this authorization with the purchase of 20.5 million shares. On February 22, 2022, the Company announced that its Board of Directors authorized a new $2$2.0 billion share repurchase program, which does not have an expiration date.Common Share repurchase activity during 2023, 2022 and 2021 under the share repurchase program are as follows:2023 2022 2021 (millions, except per share data) Total number of shares purchased 1.4 24.0 20.5 Average price paid per share $ 17.57 $ 24.98 $ 24.40 Total investment $ 25 $ 600 $ 500 StockTheholdersofChanges in the Company's commonstockareentitledtoonevoteforeachshareheldofrecordonallmatterssubmittedtoa voteofshareholders.SubjecttopreferentialrightsthatmaybeapplicabletoanyPreferredStock,holdersofcommonstock issued and outstanding, including shares held by the Company's treasury, areentitled as follows:Treasury Stock Common
Stock
IssuedDeferred
Compensation
PlansOther Total Common
Stock
Outstanding(thousands) Balance at January 30, 2021 333,606 (931) (22,175) (23,106) 310,500 Stock issued under stock plans (277) 2,454 2,177 2,177 Stock repurchases (20,511) (20,511) (20,511) Deferred compensation plan distributions 193 193 193 Balance at January 29, 2022 333,606 (1,015) (40,232) (41,247) 292,359 Stock issued under stock plans (117) 3,001 2,884 2,884 Stock repurchases (24,058) (24,058) (24,058) Deferred compensation plan distributions 165 165 165 Balance at January 28, 2023 333,606 (967) (61,289) (62,256) 271,350 Stock issued under stock plans (163) 4,965 4,802 4,802 Stock repurchases (2,160) (2,160) (2,160) Deferred compensation plan distributions 235 235 235 Balance at February 3, 2024 333,606 (895) (58,484) (59,379) 274,227 Accumulated Other Comprehensive LossFor the Company, the only component of accumulated other comprehensive loss for 2023, 2022 and 2021 relates toreceiveratablysuchdividendsasmaybedeclaredbytheBoardofDirectorsinitsdiscretion,outoffunds legallyavailable.TreasuryStockTreasurystockcontainssharesrepurchasedunderthesharerepurchaseprogram,sharesrepurchasedtocoveremployeetaxliabilitiesrelatedtostock post employment and postretirement planactivity items. The net actuarial gains andsharesmaintainedinatrustrelatedtodeferredcompensation plans.Underthedeferredcompensationplans,sharesaremaintainedinatrusttocoverthenumberestimatedtobeneeded fordistributiononaccountofstockcreditscurrentlyoutstanding.ChangesintheCompany’scommonstockissued losses andoutstanding,includingsharesheldbytheCompany’streasury,areasfollows:AccumulatedOtherComprehensiveLossFortheCompany,theonlycomponentofaccumulatedothercomprehensivelossfor 2021, 2020 prior service costs and 2019relatestopostemploymentandpostretirementplanitems.Thenetactuarialgainsandlossesandpriorservicecostsandcredits relatedtopostemploymentandpostretirementbenefitplansarereclassifiedoutofaccumulatedothercomprehensiveloss andincludedinthecomputationofnetperiodicbenefitcost(income)andareincludedinbenefitplanincome,netinthe ConsolidatedStatementsofOperations. Income. Inaddition,theCompanyincurredthepro-ratarecognitionofnetactuariallosses associated with an increase in lump sum distributions associated with store closings, organizational restructuring, and periodic distribution activity as settlement charges in the Consolidated Statements of Income. See Note 9, Retirement Plans, for further information.70Table of Contentswithanincreaseinlumpsumdistributionsassociatedwithstoreclosings,organizationalrestructuring,andperiodicdistributionactivityassettlementchargesintheConsolidatedStatementsofOperations.SeeNote9,RetirementPlans,forfurtherinformation.F-37NOTESTO CONSOLIDATEDFINANCIALSTATEMENTS— (Continued)12.FairValueMeasurementsandConcentrationsof12. Fair Value Measurements and Concentrations of Credit RiskThefollowingtableshowstheCompany’s Company's financialassetsthatarerequiredtobemeasuredatfairvalueonarecurringbasis,bylevelwithinthehierarchyasdefinedbyapplicableaccountingstandards:February 3, 2024 January 28, 2023 Fair Value Measurements Fair Value Measurements Total Quoted
Prices
in Active
Markets for
Identical
Assets
(Level 1)Significant
Observable
Inputs
(Level 2)Significant
Unobservable
Inputs
(Level 3)Total Quoted
Prices
in Active
Markets for
Identical
Assets
(Level 1)Significant
Observable
Inputs
(Level 2)Significant
Unobservable
Inputs
(Level 3)(millions) Marketableequity anddebt securities$ 42 $ 42 $ — $ — $ 35 $ 35 $ — $ — Otherfinancialinstrumentsnotmeasuredatfairvalueonarecurringbasisincludecashandcashequivalents, receivables,certain-shortterminvestmentsandotherassets,short-termdebt,merchandiseaccountspayable,accounts payable, accounts payable andaccruedliabilitiesandlong-termdebt.Withtheexceptionoflong-termdebt,thecarryingamountapproximatesfairvaluebecauseoftheshortmaturityoftheseinstruments.Thefairvaluesoflong-termdebt, the carrying amount approximates fair value because of the short maturity of these instruments. The fair values of long-term debt, excluding capitalized leases, aregenerallyestimatedbasedonquotedmarketpricesforidenticalorsimilarinstruments,andareclassifiedas Level2measurementswithinthehierarchyasdefinedbyapplicableaccountingstandards.ThefollowingtableshowstheestimatedfairvalueoftheCompany’s Company's long-termdebt,excludingotherobligations:February 3, 2024 January 28, 2023 Notional
AmountCarrying
AmountFair
ValueNotional
AmountCarrying
AmountFair
Value(millions) Long-term debt $ 3,007 $ 2,998 $ 2,706 $ 3,007 $ 2,996 $ 2,555 FinancialinstrumentsthatpotentiallysubjecttheCompanytoconcentrationsofcreditriskconsistprincipallyof temporarycashinvestments.TheCompanyplacesitstemporarycashinvestmentsinwhatitbelievestobehighcredit quality financial instruments.7113.Earnings (Loss)PerShareThefollowingtablesetsforththecomputationofbasicanddilutedearnings (loss) pershare:F-3813. Earnings Per ShareThe following table sets forth the computation of basic and diluted earnings per share:2023 2022 2021 Net
IncomeShares Net
IncomeShares Net
IncomeShares (millions, except per share data) Net income and average number of shares outstanding $ 105 273.2 $ 1,177 273.7 $ 1,430 305.8 Shares to be issued under deferred compensation and other plans 1.0 1.0 1.0 $ 105 274.2 $ 1,177 274.7 $ 1,430 306.8 Basic earnings per share $ 0.38 $ 4.28 $ 4.66 Effect of dilutive securities: Stock options and restricted stock units 4.0 6.4 7.2 $ 105 278.2 $ 1,177 281.1 $ 1,430 314.0 Diluted earnings per share $ 0.38 $ 4.19 $ 4.55 In addition to the stock options and restricted stock units in the foregoing table,stockoptionstopurchase 12.49.9 millionsharesofcommonstockandrestrictedstockunitsrelatingto1.0millionsharesofcommonstockwere outstandingat January 29, 2022, and stockoptionstopurchase 18.5millionofsharesofcommonstockandrestrictedstock unitsrelatingto1.7millionsharesofcommonstockwereoutstandingat February 1, 2020,butwerenotincludedinthecomputationofdilutedearningspersharefor 2021or 2019,respectively,becausetheirinclusionwouldhavebeenantidilutiveortheyweresubjecttoperformanceconditionsthathadnotbeenmet.For 2020, as a result of the net loss, all optionscommon stock and restricted stock units have been excluded from the calculation of diluted earnings per share and, therefore, there was no difference in the weighted average numberrelating to 1.6 million shares of common stock were outstanding at February 3, 2024, stock options to purchase 12.1 million of shares for basicof common stock and diluted loss per share as the effectrestricted stock units relating to 0.7 million shares of all potentially dilutivecommon stock were outstanding at January 28, 2023, and stock options to purchase 12.4 million of shares of common stock and restricted stock units relating to 1.0 million shares of common stock were outstanding was anti-dilutive. Stockoptionstopurchase 16.3 millionsharesofcommonstockandrestrictedstockunitsrelatingto10.3 millionsharesofcommonstockoutstandingat January 30, 202129, 2022, but were excluded fromnot included in the computation of diluted earnings per share.14.Commitments 14. CommitmentsOur estimated total purchase obligations, which primarily consist of merchandise purchase obligations and obligations under outsourcing arrangements, software license and other service commitments, energy and other supply agreements identified by the Company, and construction contracts, were approximately $3.2 billion$2,800 million and $2.8 billion$2,600 million as of January 29, 2022February 3, 2024 and January 30, 2021,28, 2023, respectively. These purchase obligations are primarily due within 1 year and recorded as liabilities when goods are received or services rendered. The Company's merchandise purchase obligations fluctuate on a seasonal basis, typically being higher in the summer and early fall and being lower in the late winter and early spring. The Company purchases a substantial portion of its merchandise inventories and other goods and services in ways other than through binding contracts.F-3915. Supplier Finance ProgramsThe Company has agreements with third-party financial institutions to facilitate supply chain finance ("SCF") programs. The programs allow qualifying suppliers to sell their receivables, on an invoice level at the selection of the supplier, from the Company to the financial institution and negotiate their outstanding receivable arrangements and associated fees directly with the financial institution. Macy's, Inc. is not party to the agreements between the supplier and the financial institution. The supplier invoices that have been confirmed as valid under the SCF programs require payment in full by the financial institution to the supplier by the original maturity date of the invoice, or discounted payment at an earlier date as agreed upon with the supplier. The Company's obligations to its suppliers, including amounts due and scheduled payment terms, are not impacted by a supplier's participation in the SCF programs.All outstanding amounts related to suppliers participating in the SCF programs are recorded upon confirmation with the third-party institutions in merchandise accounts payable in the Consolidated Balance Sheets, and associated payments are included in operating activities in the Consolidated Statements of Cash Flows.72NOTES TO CONSOLIDATED FINANCIAL STATEMENTS — (Continued)The following table sets forth the changes in the outstanding obligations under the SCF programs:February 3, 2024 January 28, 2023 (millions) Confirmed obligations outstanding at the beginning of the year $ 63 $ 88 Invoices confirmed during the year 809 697 Confirmed invoices paid during the year (760) (722) Confirmed obligations outstanding at the end of the year $ 112 $ 63 73Item 9. Changes in and Disagreements with Accountants on Accounting and Financial Disclosure.None.Item 9A. Controls and Procedures.a.Disclosure Controls and ProceduresThe Company's Chief Executive Officer and Chief Financial Officer have carried out, as of February 3, 2024, with the participation of the Company's management, an evaluation of the effectiveness of the Company's disclosure controls and procedures, as defined in Rule 13a-15(e) under the Exchange Act. Based upon this evaluation, the Chief Executive Officer and Chief Financial Officer have concluded that as of February 3, 2024 the Company's disclosure controls and procedures were effective to provide reasonable assurance that information required to be disclosed by the Company in reports the Company files under the Exchange Act is recorded, processed, summarized and reported, within the time periods specified in the SEC rules and forms, and that information required to be disclosed by the Company in the reports the Company files or submits under the Exchange Act is accumulated and communicated to the Company's management, including its Chief Executive Officer and Chief Financial Officer, as appropriate to allow timely decisions regarding required disclosure.b.Management's Annual Report on Internal Control over Financial ReportingThe Company's management is responsible for establishing and maintaining adequate internal control over financial reporting, as defined in Exchange Act Rule 13a-15(f). The Company's management conducted an assessment of the Company's internal control over financial reporting based on the framework established by the Committee of Sponsoring Organizations of the Treadway Commission in Internal Control – Integrated Framework (2013). Based on this assessment, the Company's management has concluded that, as of February 3, 2024, the Company's internal control over financial reporting was effective.The Company's independent registered public accounting firm, KPMG LLP, has audited the Company's Consolidated Financial Statements included in this Annual Report on Form 10-K and the effectiveness of the Company's internal control over financial reporting as of February 3, 2024 and has issued an attestation report expressing an unqualified opinion on the effectiveness of the Company's internal control over financial reporting, as stated in their report located on page 37.c.Changes in Internal Control over Financial ReportingFrom time to time adoption of new accounting pronouncements, major organizational restructuring and realignment occurs for which the Company reviews its internal control over financial reporting. As a result of this review, there were no changes in the Company's internal control over financial reporting that occurred during the Company's most recently completed quarter that materially affected, or are reasonably likely to materially affect, the Company's internal control over financial reporting.Item 9B. Other Information.Trading ArrangementsNone of the Company's directors or "officers" (as defined in Rule 16a-1(f) promulgated under the Exchange Act) adopted, modified, or terminated a "Rule 10b5-1 trading arrangement" or a "non-Rule 10b5-1 trading arrangement," as each term is defined in Item 408 of Regulation S-K, during the Company's fiscal quarter ended February 3, 2024.Item 9C. Disclosure Regarding Foreign Jurisdictions that Prevent Inspections.Not applicable.74PART IIIItem 10. Directors, Executive Officers and Corporate Governance.The information required by this item for executive officers is set forth under “Item 1. Business - Information about our Executive Officers” in this report. The other information called for by this item is set forth under “Item 1. Election of Directors” and “Further Information Concerning the Board of Directors - Committees of the Board” in the Proxy Statement to be delivered to stockholders in connection with the 2024 Annual Meeting of Shareholders (the Proxy Statement) and incorporated herein by reference.The Company's Code of Conduct is in compliance with the applicable rules of the SEC and applies to the principal executive officer, principal financial officer and principal accounting officer or controller, or persons performing similar functions. A copy of the Code of Conduct is available, free of charge, through the Company's website at https://www.macysinc.com. We intend to satisfy any disclosure requirement under Item 5.05 of Form 8-K regarding an amendment to, or waiver from, a provision of the Code of Conduct by posting such information to the Company's website at the address and location specified above.Set forth below are the names, ages and principal occupations of the Company's non-employee directors as of March 21, 2024.Name Age Director
SincePrincipal Occupation Emilie Arel 46 2022 Former President and Chief Executive Officer, Casper Sleep, Inc. Francis S. Blake 74 2015 Former Chairman and Chief Executive Officer of The Home Depot, Inc. Torrence N. Boone 54 2019 Vice President, Global Client Partnerships, Alphabet Inc. Ashley Buchanan 50 2021 Chief Executive Officer of The Michaels Companies, Inc. Marie Chandoha 62 2022 Former President and Chief Executive Officer of Charles Schwab Investment Management, Inc. Naveen K. Chopra 50 2023 Executive Vice President and Chief Financial Officer of Paramount Global Deirdre P. Connelly 63 2008 Former President, North American Pharmaceuticals of GlaxoSmithKline Jeff Gennette 62 2016 Non-Executive Chairman and Former Chief Executive Officer of Macy's, Inc. Jill Granoff 61 2022 Senior Adviser, Eurazeo Brands William H. Lenehan 47 2016 President and Chief Executive Officer of Four Corners Property Trust, Inc. Sara Levinson 73 1997 Co-Founder and Director of Katapult Paul C. Varga 60 2012 Former Chairman and Chief Executive Officer of Brown- Forman Corporation Tracey Zhen 47 2021 Former President of Zipcar, a subsidiary of Avis Budget Group, Inc. Item 11. Executive Compensation.Information called for by this item is set forth under “Compensation Discussion & Analysis,” “Compensation of the Named Executive Officers for 2023,” “Compensation Committee Report,” and "Further Information Concerning the Board of Directors" in the Proxy Statement and incorporated herein by reference.Item 12. Security Ownership of Certain Beneficial Owners and Management and Related Stockholder Matters.Information called for by this item is set forth under “Stock Ownership – Certain Beneficial Owners,” “Stock Ownership – Stock Ownership of Directors and Executive Officers,” and “Stock Ownership – Securities Authorized for Issuance Under Equity Compensation Plans” in the Proxy Statement and incorporated herein by reference.Item 13. Certain Relationships and Related Transactions, and Director Independence.Information called for by this item is set forth under “Further Information Concerning the Board of Directors – Director Independence” and “Policy on Related Person Transactions” in the Proxy Statement and incorporated herein by reference.75Item 14. Principal Accountant Fees and Services.Information called for by this item is set forth under “Ratification of the Appointment of Independent Registered Public Accounting Firm” in the Proxy Statement and incorporated herein by reference.76PART IVItem 15. Exhibits and Financial Statement Schedules.(a)The following documents are filed as part of this report:1.Financial Statements:The list of financial statements required by this item is set forth in Item 8 “Financial Statements and Supplementary Data” and is incorporated herein by reference.2.Financial Statement Schedules:All schedules are omitted because they are inapplicable, not required, or the information is included elsewhere in the Consolidated Financial Statements or the notes thereto.3.Exhibits:Exhibit
NumberDescription Document if Incorporated by Reference 3.1 Amended and Restated Certificate of Incorporation 3.1.1 Certificate of Designations of Series A Junior Participating Preferred Stock 3.1.2 Article Seventh of the Amended and Restated Certificate of Incorporation 3.2 Amended and Restated By-Laws 4.1 Indenture, dated as of January 15, 1991, among the Company (as successor to The May Department Stores Company (“May Delaware”)), Macy's Retail Holdings, Inc. (“Macy's Retail”) (f/k/a The May Department Stores Company (NY) or “May New York”) and The Bank of New York Mellon Trust Company, N.A. (“BNY Mellon”, successor to J.P. Morgan Trust Company and as successor to The First National Bank of Chicago), as Trustee (“1991 Indenture”) Exhibit 4(2) to May New York's Current Report on Form 8-K filed January 15, 1991 4.1.1 Guarantee of Securities, dated as of August 30, 2005, by the Company relating to 1991 Indenture 4.1.2 First Supplemental Indenture to 1991 Indenture dated as of May 28, 2020 among Macy's Retail Holdings, Inc., a Delaware corporation (as successor to Macy's Retail Holdings, Inc., a New York corporation), Macy's, Inc. and The Bank of New York Mellon Trust Company, N.A., as Trustee 4.1.3 Second Supplemental Indenture to 1991 Indenture dated as of June 3, 2020 among Macy's Retail Holdings, LLC, a Delaware limited liability company (as successor to Macy's Retail Holdings, Inc., a Delaware corporation), Macy's, Inc. and The Bank of New York Mellon Trust Company, N.A., as Trustee 4.1.4 Third Supplemental Indenture to 1991 Indenture dated as of June 26, 2020 among Macy's Retail Holdings, LLC, an Ohio limited liability company (as successor to Macy's Retail Holdings, LLC, a Delaware limited liability company), Macy's, Inc. and The Bank of New York Mellon Trust Company, N.A., as Trustee 77Exhibit
NumberDescription Document if Incorporated by Reference 4.1.5 Fourth Supplemental Indenture to 1991 Indenture dated as of June 30, 2021 by and among Macy's Retail Holdings, LLC, Macy's, Inc. and The Bank of New York Mellon Trust Company, N.A., as Trustee 4.2 Indenture, dated as of December 15, 1994, between the Company and U.S. Bank National Association (successor to State Street Bank and Trust Company and The First National Bank of Boston), as Trustee (“1994 Indenture”) Exhibit 4.1 to the Company's Registration Statement on Form S-3 (Registration No. 33-88328) filed January 9, 1995 4.2.1 Ninth Supplemental Indenture to 1994 Indenture, dated as of July 14, 1997, between the Company and U.S. Bank National Association (successor to State Street Bank and Trust Company and The First National Bank of Boston), as Trustee 4.2.2 Tenth Supplemental Indenture to 1994 Indenture, dated as of August 30, 2005, among the Company, Macy's Retail and U.S. Bank National Association (as successor to State Street Bank and Trust Company and as successor to The First National Bank of Boston), as Trustee 4.2.3 Guarantee of Securities, dated as of August 30, 2005, by the Company relating to 1994 Indenture 4.2.4 Eleventh Supplemental Indenture to 1994 Indenture dated as of May 28, 2020 among Macy's Retail Holdings, Inc., a Delaware corporation (as successor to Macy's Retail Holdings, Inc., a New York corporation), Macy's, Inc. and U.S. Bank National Association, as Trustee 4.2.5 Twelfth Supplemental Indenture to 1994 Indenture dated as of June 3, 2020 among Macy's Retail Holdings, LLC, a Delaware limited liability company (as successor to Macy's Retail Holdings, Inc., a Delaware corporation), Macy's, Inc. and U.S. Bank National Association, as Trustee 4.2.6 Thirteenth Supplemental Indenture to 1994 Indenture dated as of June 24, 2020 among Macy's Retail Holdings, LLC, an Ohio limited liability company (as successor to Macy's Retail Holdings, LLC, a Delaware limited liability company), Macy's, Inc. and U.S. Bank National Association, as Trustee 4.3 Indenture, dated as of June 17, 1996, among the Company (as successor to May Delaware), Macy's Retail (f/k/a May New York) and The Bank of New York Mellon Trust Company, N.A. (“BNY Mellon”, successor to J.P. Morgan Trust Company), as Trustee (“1996 Indenture”) 4.3.1 First Supplemental Indenture to 1996 Indenture, dated as of August 30, 2005, by and among the Company (as successor to May Delaware), Macy's Retail (f/k/a May New York) and BNY Mellon (successor to J.P. Morgan Trust Company, National Association), as Trustee 4.3.2 Second Supplemental Indenture to 1996 Indenture dated as of May 28, 2020 among Macy's Retail Holdings, Inc., a Delaware corporation (as successor to Macy's Retail Holdings, Inc., a New York corporation), Macy's, Inc. and The Bank of New York Mellon Trust Company, N.A., as Trustee 78Exhibit
NumberDescription Document if Incorporated by Reference 4.3.3 Third Supplemental Indenture to 1996 Indenture dated as of June 3, 2020 among Macy's Retail Holdings, LLC, a Delaware limited liability company (as successor to Macy's Retail Holdings, Inc., a Delaware corporation), Macy's, Inc. and The Bank of New York Mellon Trust Company, N.A., as Trustee 4.3.4 Fourth Supplemental Indenture to 1996 Indenture dated as of June 26, 2020 among Macy's Retail Holdings, LLC, an Ohio limited liability company (as successor to Macy's Retail Holdings, LLC, a Delaware limited liability company), Macy's, Inc. and The Bank of New York Mellon Trust Company, N.A., as Trustee 4.4 Indenture, dated as of September 10, 1997, between the Company and U.S. Bank National Association (successor to Citibank, N.A.), as Trustee (“1997 Indenture”) 4.4.1 First Supplemental Indenture to 1997 Indenture, dated as of February 6, 1998, between the Company and U.S. Bank National Association (successor to Citibank, N.A.), as Trustee 4.4.2 Third Supplemental Indenture to 1997 Indenture, dated as of March 24, 1999, between the Company and U.S. Bank National Association (successor to Citibank, N.A.), as Trustee 4.4.3 Seventh Supplemental Indenture to 1997 Indenture, dated as of August 30, 2005 among the Company, Macy's Retail and U.S. Bank National Association (successor to Citibank, N.A.), as Trustee 4.4.4 Guarantee of Securities, dated as of August 30, 2005, by the Company relating to 1997 Indenture 4.4.5 Eighth Supplemental Indenture to 1997 Indenture dated as of May 28, 2020 among Macy's Retail Holdings, Inc., a Delaware corporation (as successor to Macy's Retail Holdings, Inc., a New York corporation), Macy's, Inc. and U.S. Bank National Association, as Trustee 4.4.6 Ninth Supplemental Indenture to 1997 Indenture dated as of June 3, 2020 among Macy's Retail Holdings, LLC, a Delaware limited liability company (as successor to Macy's Retail Holdings, Inc., a Delaware corporation), Macy's, Inc. and U.S. Bank National Association, as Trustee 4.4.7 Tenth Supplemental Indenture to 1997 Indenture dated as of June 24, 2020 among Macy's Retail Holdings, LLC, an Ohio limited liability company (as successor to Macy's Retail Holdings, LLC, a Delaware limited liability company), Macy's, Inc. and U.S. Bank National Association, as Trustee 4.5 Indenture, dated as of July 20, 2004, among the Company (as successor to May Delaware), Macy's Retail (f/k/a May New York) and BNY Mellon, as Trustee (“2004 Indenture”) 4.5.1 First Supplemental Indenture to 2004 Indenture, dated as of August 30, 2005 among the Company (as successor to May Delaware), Macy's Retail and BNY Mellon (successor to J.P. Morgan Trust Company, National Association), as Trustee 79Exhibit
NumberDescription Document if Incorporated by Reference 4.6 Indenture, dated as of November 2, 2006, by and among Macy's Retail, the Company and U.S. Bank National Association, as Trustee (“2006 Indenture”) 4.6.1 Third Supplemental Indenture to 2006 Indenture, dated March 12, 2007, among Macy's Retail, the Company and U.S. Bank National Association, as Trustee 4.6.2 Seventh Supplemental Indenture to 2006 Indenture dated as of May 28, 2020 among Macy's Retail Holdings, Inc., a Delaware corporation (as successor to Macy's Retail Holdings, Inc., a New York corporation), Macy's, Inc. and U.S. Bank National Association, as Trustee 4.6.3 Eighth Supplemental Indenture to 2006 Indenture dated as of June 3, 2020 among Macy's Retail Holdings, LLC, a Delaware limited liability company (as successor to Macy's Retail Holdings, Inc., a Delaware corporation), Macy's, Inc. and U.S. Bank National Association, as Trustee 4.6.4 Ninth Supplemental Indenture to 2006 Indenture dated as of June 24, 2020 among Macy's Retail Holdings, LLC, an Ohio limited liability company (as successor to Macy's Retail Holdings, LLC, a Delaware limited liability company), Macy's, Inc. and U.S. Bank National Association, as Trustee 4.7 Indenture, dated as of January 13, 2012, among Macy's Retail, the Company and BNY Mellon, as Trustee ("2012 Indenture") 4.7.1 Second Supplemental Trust Indenture to 2012 Indenture, dated as of January 13, 2012, among Macy's Retail, as issuer, the Company, as guarantor, and BNY Mellon, as trustee 4.7.2 Fourth Supplemental Trust Indenture, dated as of November 20, 2012, among Macy's Retail, as issuer, the Company, as guarantor, and BNY Mellon, as trustee 4.7.3 Seventh Supplemental Trust Indenture, dated as of November 18, 2014, among Macy's Retail, as issuer, the Company, as guarantor, and BNY Mellon, as trustee 4.7.4 Eighth Supplemental Indenture to 2012 Indenture dated as of May 28, 2020 among Macy's Retail Holdings, Inc., a Delaware corporation (as successor to Macy's Retail Holdings, Inc., a New York corporation), Macy's, Inc. and The Bank of New York Mellon Trust Company, N.A., as Trustee 4.7.5 Ninth Supplemental Indenture to 2012 Indenture dated as of June 3, 2020 among Macy's Retail Holdings, LLC, a Delaware limited liability company (as successor to Macy's Retail Holdings, Inc., a Delaware corporation), Macy's, Inc. and The Bank of New York Mellon Trust Company, N.A., as Trustee 4.7.6 Tenth Supplemental Indenture to 2012 Indenture dated as of June 26, 2020 among Macy's Retail Holdings, LLC, an Ohio limited liability company (as successor to Macy's Retail Holdings, LLC, a Delaware limited liability company), Macy's, Inc. and The Bank of New York Mellon Trust Company, N.A., as Trustee 80Exhibit
NumberDescription Document if Incorporated by Reference 4.8 Indenture, dated as of July 28, 2020, among Macy's Retail Holdings, LLC, as issuer, Macy's, Inc., as guarantor, and U.S. Bank National Association, as trustee and collateral trustee, relating to Macy's Retail Holdings, LLC's 6.65% Senior Secured Debentures due 2024, 6.7% Senior Secured Debentures due 2028, 8.75% Senior Secured Debentures due 2029, 7.875% Senior Secured Debentures due 2030, 6.9% Senior Secured Debentures due 2032 and 6.7% Senior Secured Debentures due 2034 4.8.1 Form of 6.65% Senior Secured Debentures due 2024, 6.7% Senior Secured Debentures due 2028, 8.75% Senior Secured Debentures due 2029, 7.875% Senior Secured Debentures due 2030, 6.9% Senior Secured Debentures due 2032 and 6.7% Senior Secured Debentures due 2034 4.8.2 Fifth Supplemental Trust Indenture to 1996 Indenture, dated as of July 10, 2020, among Macy's Retail Holdings, LLC, as issuer, Macy's, Inc. as guarantor, and The Bank of New York Mellon Trust Company, N.A., as trustee, relating to Macy's Retail Holdings, LLC's 6.65% Senior Debentures due 2024, 6.7% Senior Debentures due 2028, 8.75% Senior Debentures due 2029, 7.875% Senior Debentures due 2030, 6.9% Senior Debentures due 2032 and 6.7% Senior Debentures due 2034 4.9 Indenture, dated as of March 17, 2021, by and among Macy's Retail Holdings, LLC, as issuer, Macy's, Inc., as guarantor and U.S. Bank National Association, as trustee, relating to Macy's Retail Holdings, LLC's 5.875% Senior Notes due 2029 4.10 Indenture, dated as of March 10, 2022, by and among Macy's Retail Holdings, LLC, as issuer, Macy's, Inc., as guarantor, and U.S. Bank Trust Company, National Association, as trustee, relating to Macy's Retail Holdings, LLC's 5.875% Senior Notes due 2030 4.11 Indenture, dated as of March 10, 2022, by and among Macy's Retail Holdings, LLC, as issuer, Macy's, Inc., as guarantor, and U.S. Bank Trust Company, National Association, as trustee, relating to Macy's Retail Holdings, LLC's 6.125% Senior Notes due 2032 4.12 Description of the Company's Securities Registered under Section 12 of the Securities Exchange Act of 1934 10.1 Credit Agreement, dated as of June 8, 2020, among Macy's Inventory Funding LLC, as the Borrower, Macy's Inventory Holdings LLC, as Parent, Bank of America, N.A., as Agent, L/C Issuer and Swing Line Lender, the other lenders party thereto, BofA Securities, Inc., Credit Suisse Loan Funding LLC, JPMorgan Chase Bank, N.A., Fifth Third Bank, National Association, MUFG Union Bank, N.A., PNC Capital Markets LLC and Wells Fargo Bank, National Association, as Joint Lead Arrangers and Joint Bookrunners, Credit Suisse Loan Funding LLC and JPMorgan Chase Bank, N.A., as Co-Syndication Agents and Fifth Third Bank, National Association, MUFG Union Bank, N.A., PNC Bank, National Association and Wells Fargo Bank, National Association, as Co-Documentation Agents 81Exhibit
NumberDescription Document if Incorporated by Reference 10.1.1 Third Amendment to Credit Agreement, dated as of March 3, 2022, by and among Macy's Inventory Funding LLC, Macy's Inventory Holdings LLC, the lenders party thereto and Bank of America, N.A., as agent, l/c issuer and swing line lender 10.2 Credit Agreement, dated as of May 9, 2019, among the Company, Macy's Retail and Bank of America, N.A., as administrative agent 10.2.1 Amendment No. 1 to Credit Agreement dated as of June 8, 2020 among Macy's Retail Holdings, LLC, a Delaware limited liability company (f/k/a Macy's Retail Holdings, Inc.), as Borrower, Macy's, Inc., a Delaware corporation, as Parent, the Lenders party thereto, and Bank of America, N.A., as Administrative Agent 10.4 Guarantee Agreement, dated as of May 9, 2019, among the Company, Macy's Retail and Bank of America, N.A., as administrative agent 10.5 Tax Sharing Agreement, dated as of October 31, 2014, among Macy's, Inc. and members of the Affiliated Group 10.6+ Amended and Restated Credit Card Program Agreement, dated November 10, 2014, among the Company, FDS Bank, Macy's Credit and Customer Services, Inc., Macy's West Stores, Inc., Bloomingdale's, Inc., Department Stores National Bank and Citibank, N.A. 10.6.1+ Sixth Amendment to Amended and Restated Credit Card Program Agreement, dated as of December 13, 2021, by and among Macy's, Inc., FDS Bank, Macy's Credit and Consumer Services, Inc., Bloomingdale's, LLC, and solely with respect to Section 2.1(a) FDS Thrift Holding Co., Inc., Department Stores National Bank and Citibank, N.A. 10.7 Senior Executive Incentive Compensation Plan, as amended March 26, 2020 * 10.8 Form of Indemnification Agreement * Exhibit 10.14 to the Registration Statement on Form 10 (File No. 1-10951), filed November 27, 1991 10.9 Executive Severance Plan, effective November 1, 2009, as revised and restated January 1, 2014 * 10.9.1 Senior Executive Severance Plan, effective as of April 1, 2018, as revised and restated March 29, 2023 * 10.10 Form of Nonqualified Stock Option Agreement under the 2009 Omnibus Incentive Compensation Plan (for Executives and Key Employees) * 10.10.1 Form of Nonqualified Stock Option Agreement under the Amended and Restated 2009 Omnibus Incentive Compensation Plan (for Executives and Key Employees) * 10.10.2 Form of Nonqualified Stock Option Agreement under the Amended and Restated 2009 Omnibus Incentive Compensation Plan (for Executives and Key Employees), as amended * 82Exhibit
NumberDescription Document if Incorporated by Reference 10.10.3 Form of Stock Option Terms and Conditions under the 2018 Equity and Incentive Compensation Plan * 10.11 Form of Time-Based Restricted Stock Agreement under the 2009 Omnibus Incentive Compensation Plan * 10.12 2021-2023 Performance-Based Restricted Stock Unit Terms and Conditions under the 2018 Equity and Incentive Compensation Plan* 10.12.1 2022-2024 Performance-Based Restricted Stock Unit Terms and Conditions under the 2021 Equity and Incentive Compensation Plan* 10.12.2 2023-2025 Performance-Based Restricted Stock Unit Terms and Conditions under the 2021 Equity and Incentive Compensation Plan* 10.13 Form of Time-Based Restricted Stock Unit Agreement under the 2009 Omnibus Incentive Compensation Plan* 10.13.1 Form of Time-Based Restricted Stock Unit Agreement under the Amended and Restated 2009 Omnibus Incentive Compensation Plan * 10.13.2 Form of Time-Based Restricted Stock Unit Agreement under the Amended and Restated 2009 Omnibus Incentive Compensation Plan (with dividend equivalents) * 10.13.3 Form of Time-Based Restricted Stock Unit Agreement under the Amended and Restated 2009 Omnibus Incentive Compensation Plan, as amended * 10.13.4 Form of Time-Based Restricted Stock Unit Terms and Conditions under the 2018 Equity and Incentive Compensation Plan * 10.13.5 Form of Time-Based Restricted Stock Unit Terms and Conditions under the 2021 Equity and Incentive Compensation Plan* 10.14 Supplementary Executive Retirement Plan * 10.14.1 First Amendment to the Supplementary Executive Retirement Plan effective January 1, 2012 * 10.14.2 Second Amendment to Supplementary Executive Retirement Plan effective January 1, 2012 * 10.14.3 Third Amendment to Supplementary Executive Retirement Plan effective December 31, 2013 * 10.15 Executive Deferred Compensation Plan * 10.15.1 First Amendment to Executive Deferred Compensation Plan effective December 31, 2013 * 10.16 Macy's, Inc. 401(k) Retirement Investment Plan (the "Plan") (amending and restating the Macy's, Inc. 401(k) Retirement Investment Plan) effective as of January 1, 2014 * 83Exhibit
NumberDescription Document if Incorporated by Reference 10.16.1 First Amendment to the Plan regarding matching contributions with respect to the Plan's plan years beginning on and after January 1, 2014, effective January 1, 2014 * 10.16.2 Second Amendment to the Plan regarding marriage status, effective January 1, 2014 * 10.16.3 Third Amendment to the Plan regarding matching contributions with respect to the Plan's plan years beginning on and after January 1, 2014 * 10.16.4 Fourth Amendment to the Plan regarding rules applicable to Puerto Rico participants effective January 1, 2011 (and for the Plan's plan years beginning on and after that date)* 10.16.5 Fifth Amendment to the Plan regarding eligible associates to participate (pre-tax deferrals only, no match) immediately upon hire effective as of January 1, 2014* 10.17 Director Deferred Compensation Plan * 10.18 Macy's, Inc. Amended and Restated 2009 Omnibus Incentive Compensation Plan * 10.19 Macy's, Inc. 2018 Equity and Incentive Compensation Plan * 10.20 Macy's, Inc. 2021 Equity and Incentive Compensation Plan* 10.21 Macy's, Inc. Deferred Compensation Plan (Amended and restated effective as of August 1, 2018) * 10.22 Change in Control Plan, effective November 1, 2009, as revised and restated effective April 1, 2018 * 10.23 Time Sharing Agreement between Macy's, Inc. and Jeff Gennette, dated June 14, 2017 * 10.24 10.25 Macy's, Inc. Employee Stock Purchase Plan* 21 22 List of Subsidiary Guarantors 23 24 31.1 31.2 84Exhibit
NumberDescription Document if Incorporated by Reference 32.1 32.2 97 101 The following financial statements from Macy's, Inc.'s Annual Report on Form 10-K for the year ended February 3, 2024, filed March 22, 2024, formatted in iXBRL (Inline eXtensible Business Reporting Language): (i) Consolidated Statements of Income, (ii) Consolidated Statements of Comprehensive Income, (iii) Consolidated Balance Sheets, (iv) Consolidated Statements of Changes in Shareholders’ Equity, (v) Consolidated Statements of Cash Flows, and (vi) the Notes to Consolidated Financial Statements, tagged as block of text and in detail. 104 Cover Page Interactive Data File (formatted as iXBRL and contained in Exhibit 101) _________________________+ Portions of the exhibit have been omitted pursuant to a request for confidential treatment or because it is both not material and is of the type the registrant treats as confidential.*Constitutes a compensatory plan or arrangement.Item 16. Form 10-K Summary.Not applicable.85SIGNATURESPursuant to the requirements of Section 13 or 15(d) of the Securities Exchange Act of 1934, the Registrant has duly caused this report to be signed on its behalf by the undersigned, thereunto duly authorized.MACY'S, INC. By: /s/ TRACY M. PRESTON Tracy M. Preston Chief Legal Officer and Corporate Secretary Date: March 22, 2024Pursuant to the requirements of the Securities Exchange Act of 1934, this report has been signed below by the following persons on behalf of the Registrant and in the capacities indicated on March 22, 2024.* * * Tony Spring Adrian V. Mitchell Paul Griscom Chief Executive Officer and Chairman-Elect of the Board of Directors (principal executive officer) Chief Operating Officer and Chief Financial Officer (principal financial officer) Senior Vice President and Controller (principal accounting officer) * * * Emilie Arel Francis S. Blake Torrence N. Boone Director Director Director * * * Ashley Buchanan Marie Chandoha Naveen Chopra Director Director Director * * * Deirdre P. Connelly Jeff Gennette Jill Granoff Director Chairman of the Board and Director Director * * * William H. Lenehan Sara Levinson Paul C. Varga Director Director Director * Tracey Zhen Director _________________________*The undersigned, by signing her name hereto, does sign and execute this Annual Report on Form 10-K pursuant to the Powers of Attorney executed by the above-named officers and directors and filed herewith.By: /s/ TRACY M. PRESTON Tracy M. Preston Attorney-in-Fact 86