SECURITIES AND EXCHANGE COMMISSION
Washington, D.C. 20549
FORM 10-K
(Mark One)
| ☒
| | | | |
| x | ANNUAL REPORT PURSUANT TO SECTION 13 OR 15(d) OF THE SECURITIES EXCHANGE ACT OF 1934 |
For the fiscal year ended December 31,
20222023
OR
| ☐
| | | | |
| o | TRANSITION REPORT PURSUANT TO SECTION 13 OR 15(d) OF THE SECURITIES EXCHANGE ACT OF 1934 |
For the transition period from
to______________ to______________
(Commission File Number)
(Exact name of registrant as specified in its charter)
| | | | | |
| Delaware | 51-0278097 |
(State or Other Jurisdiction of Incorporation
or Organization) | (I.R.S. Employer Identification No.) |
or Organization)
| |
(Address of principal executive offices)
Registrant’s telephone number: (212) 632-6000
Securities Registered Pursuant to Section 12(b) of the Act:
| | | | | | | | |
| Title of each class | Trading Symbol(s) | Name of each exchange on which registered |
None | None | None |
Securities Registered Pursuant to Section 12(g) of the Act: None
Indicate by check mark if the Registrant is a well-known seasoned issuer, as defined in Rule 405 of the Securities Act. Yes ☒x No ☐o Indicate by check mark if the Registrant is not required to file reports pursuant to Section 13 or 15(d) of the Act. Yes ☐o No ☒x Indicate by check mark whether the Registrant (1) has filed all reports required to be filed by Section 13 or 15(d) of the Securities Exchange Act of 1934 during the preceding 12 months (or for such shorter period that the Registrant was required to file such reports), and (2) has been subject to such filing requirements for the past 90 days. Yes ☒x No ☐o Indicate by check mark whether the registrant has submitted electronically every Interactive Data File required to be submitted pursuant to Rule 405 of Regulation S-T (§232.405 of this chapter) during the preceding 12 months (or for such shorter period that the registrant was required to submit such files). Yes ☒x No ☐o Indicate by check mark whether the Registrant is a large accelerated filer, an accelerated filer, a non-accelerated filer, a smaller reporting company, or an emerging growth company. See the definitions of “large accelerated filer,” “accelerated filer,” “smaller reporting company,” and “emerging growth company” in Rule 12b-2 of the Exchange Act.
| | | | | | | | | | | |
| Large accelerated filer | ☐
o | Accelerated filer | ☐
o |
Non-accelerated filer | ☒
x | Smaller reporting company | ☐
o |
| | Emerging growth company | ☐
o |
If the Registrant is an emerging growth company, indicate by check mark if the Registrant has elected not to use the extended transition period for complying with any new or revised financial accounting standards provided pursuant to Section 13(a) of the Exchange Act. ☐o Indicate by check mark whether the registrant has filed a report on and attestation to its management’s assessment of the effectiveness of its internal control over financial reporting under Section 404(b) of the Sarbanes-Oxley Act (15 U.S.C. 7262(b)) by the registered public accounting firm that prepared or issued its audit report. ☒x If securities are registered pursuant to Section 12(b) of the Act, indicate by check mark whether the financial statements of the registrant included in the filing reflect the correction of an error to previously issued financial statements. o
Indicate by check mark whether any of those error corrections are restatements that required a recovery analysis of incentive-based compensation received by any of the registrant’s executive officers during the relevant recovery period pursuant to §240.10D-1(b). o
Indicate by check mark whether the Registrant is a shell company (as defined in Rule 12b-2 of the Exchange Act). Yes ☐o No ☒x As of June 30,
20222023 none of the Registrant’s common membership interests were held by non-affiliates.
As of January 31,
2023,2024, in addition to profit participation interests, there were two managing member interests outstanding.
The Registrant meets the conditions set forth in General Instructions (I)(1)(a) and (b) of Form 10-K and is therefore filing this Form with the reduced disclosure format by omitting the information called for by the following items of Form 10-K: Item 10, Directors, Executive Officers and Corporate Governance; Item 11, Executive Compensation; Item 12, Security Ownership of Certain Beneficial Owners and Management and Related Stockholder Matters; and Item 13, Certain Relationships and Related Transactions, and Director Independence.
DOCUMENTS INCORPORATED BY REFERENCE
| | | | | | | | |
| Auditor Firm Id: 34 | Auditor Name: Deloitte & Touche LLP | Auditor Location: New York, New York USA |
Auditor Name: Deloitte & Touche LLP
Auditor Location: New York, New York USA
ANNUAL REPORT ON FORM 10-K
FOR THE FISCAL YEAR ENDED DECEMBER 31,
20222023
When we use the terms “Lazard Group”, “Lazard”, “we”, “us”, “our” and “the Company”, we mean Lazard Group LLC, a Delaware limited liability company, that is the current holding company for the subsidiaries that conduct our businesses. Lazard Ltd
iscompleted its conversion on January 1, 2024 (the “Conversion”) from an exempted company incorporated under the laws of Bermuda named Lazard Ltd to a
Bermuda exemptU.S. C-Corporation named Lazard, Inc., a company
whose sharesincorporated under the laws of
Class Athe state of Delaware, whose common stock (“common stock”)
, the only class of common stock of Lazard outstanding, are is publicly traded on the New York Stock Exchange under the symbol “LAZ”. Lazard,
Ltd’sInc.’s subsidiaries include Lazard Group and their respective subsidiaries. Lazard,
Ltd’sInc.’s primary operating asset is its indirect ownership as of December 31,
20222023 of all of the common membership interests in Lazard Group. Lazard,
LtdInc. controls Lazard Group through two of its indirect wholly-owned subsidiaries that are co-managing members of Lazard Group.
Lazard Group has granted profit participation interests in Lazard Group to certain of its managing directors. The profit participation interests are discretionary profits interests that are intended to enable Lazard Group to compensate its managing directors in a manner consistent with historical practices. Lazard Group has also granted profits interest participation rights to certain of its managing directors. See Note 1516 of Notes to Consolidated Financial Statements.
Item 1. Business
Lazard, one of the world’s preeminent financial advisory and asset management firms, operates
from 43 cities across 26 countries in North and South America, Europe,
the Middle East, Asia and Australia. With origins dating to 1848, we have long specialized in crafting solutions to the complex financial and strategic challenges of a diverse set of clients around the world, including corporations, governments, institutions, partnerships and individuals.
We focus primarily on two business segments: Financial Advisory and Asset Management. We believe that the mix of our activities across business segments, geographic regions, industries and investment strategies helps to diversify and stabilize our revenue stream.
Our Financial Advisory business offers corporate, partnership, institutional, government, sovereign and individual clients across the globe a wide array of financial advisory services regarding strategic and mergers and acquisitions (“M&A”) advisory, capital markets advisory, shareholder advisory, restructuring and
capital solutions,liability management, sovereign advisory, geopolitical advisory
capital raising and placement, and other strategic advisory
matters.matters and capital raising and placement. We focus on solving our clients’ most complex issues, providing advice to key decision-makers, senior management, boards of directors and business owners, as well as governments and governmental agencies, in transactions that typically are of significant strategic and financial importance to them.
We continue to build our Financial Advisory business by fostering long-term, senior-level relationships with existing and new clients as their independent advisor on strategic transactions and other matters. We seek to build and sustain long-term relationships with our clients rather than focusing simply on individual transactions, a practice that we believe enhances our access to senior management of major corporations and institutions around the world. We emphasize providing clients with senior-level focus during all phases of transaction analysis and execution.
While we strive to earn repeat business from our clients, we operate in a highly competitive environment in which there are no long-term contracted sources of revenue. Each revenue-generating engagement is separately negotiated and awarded. To develop new client relationships, and to develop new engagements from historical client relationships, we maintain an active dialogue with a large number of clients and potential clients, as well as with their financial and legal advisors, on an ongoing basis. We have gained a significant number of new clients each year through our business development initiatives, through recruiting additional senior investment banking professionals who bring with them client relationships and through referrals from directors, attorneys and other third parties with whom we have relationships. At the same time, we lose clients each year as a result of the sale,
merger or
mergerrestructuring of a client, a change in a client’s senior management, competition from other investment banks and other causes.
We earned $1 million or more from
304299 clients for the year ended December 31,
2022.2023. For the year ended December 31,
2022,2023, the ten largest fee paying clients constituted approximately 19% of our Financial Advisory segment net revenue, with no client individually contributing more than 10% of segment net revenue.
We believe that we have been pioneers in offering
financial advisoryinternational Financial Advisory services,
on an international basis, with the establishment of our New York, Paris and London offices dating back to the nineteenth century. We maintain a major local presence in the United States (the “U.S.”), the United Kingdom (the “U.K.”) and France,
including a network of regional branchwith offices
inacross the
U.S., as wellworld as a
presence in Argentina, Belgium, Brazil, Chile, China, Colombia, Germany, Hong Kong, Italy, Japan, Mexico, the Netherlands, Panama, Singapore, Spain, Sweden and the Middle East region.part of our global network. For a full list of our current locations, visit www.lazard.com.
In addition to seeking business centered in the regions described above, we historically have focused in particular on advising clients with respect to cross-border transactions. We believe that we are particularly well known for our legacy of offering broad teams of professionals who are indigenous to their respective regions, who have long-term client relationships, capabilities and know-how in their respective regions and who will coordinate with our professionals who have global sector expertise. We also believe that this positioning affords us insight around the globe into key industry, economic, governmental and regulatory issues and developments, which we can bring to bear on behalf of our clients.
We advise clients on a wide range of strategic and financial issues. When we advise clients on the potential acquisition of another company, business or certain assets, our services include evaluating potential acquisition targets, providing valuation analyses, evaluating and proposing financial and structural alternatives and rendering, if appropriate, fairness opinions. We also may advise as to the timing, financing and pricing of a proposed acquisition and assist in negotiating and closing the acquisition.
In addition, we may assist in executing an acquisition by acting as a dealer-manager in transactions structured as a tender or exchange offer.When we advise clients that are contemplating the sale of
certain businesses, assets or an entire company, our services include advising on the sale process, providing valuation analyses, assisting in preparing an information memorandum or other appropriate sale materials and rendering, if appropriate, fairness opinions. We also identify and contact selected qualified potential acquirors and assist in negotiating and closing the proposed sale. As appropriate, we also advise our clients regarding potential financial and strategic alternatives to a sale, including recapitalizations, spin-offs, carve-outs and split-offs. We frequently provide advice with respect to the structure, timing and pricing of these alternatives.
With respect to companies in financial distress, we provide services to the company, creditors or other interested parties, which
services may include reviewing and analyzing the business, operations, properties, financial condition and prospects of the company, evaluating debt capacity, assisting in the determination of an appropriate capital structure, assisting in structuring and effecting the financial aspects of
amendments to debt documents or exchange offers
or refinancings, evaluating financial and strategic alternatives and assisting and participating in negotiations with affected entities or groups. If appropriate, we may provide financial advice and assistance in developing and seeking approval of a restructuring or reorganization plan, which may include a plan of reorganization under Chapter 11 of the U.S. Bankruptcy Code or other similar court administered processes in non-U.S. jurisdictions. In such cases, we may assist in certain aspects of the implementation of such a plan, including advising and assisting in structuring and effecting the financial aspects of a sale or recapitalization, structuring new securities, other consideration or other inducements to be offered or issued, as well as assisting and participating in negotiations with affected entities or groups.
When we assist clients in connection with shareholder advisory and corporate preparedness matters, our services may include reviewing and analyzing the business,
andoperations, properties, financial condition
and prospects of the company, providing insights on the company’s shareholders
assisting in the evaluation of environmental, social and governance (“ESG”) matters, and advising on defense measures and strategic alternatives potentially available to the company. Our advice may relate to a broad range of matters including M&A and capital markets transactions and activist situations.
2
When we assist clients in connection with their capital structure, we typically review and analyze structural alternatives, assist in long-term capital planning and advise and assist with respect to rating agency discussions and relationships, among other things.
When we assist clients in raising private or public market financing or capital, our services
may include assisting clients in connection with securing, refinancing or restructuring bank loans or other debt, securing venture capital
and other financial investor funding, originating and executing, or participating in, public underwritings and private placements of securities, and originating and executing private placements of partnership and similar interests in alternative investment funds such as leveraged buyout, mezzanine or real estate focused
funds and single or multi-asset continuation funds.
We are at the forefront of providing independent advice to governments and governmental agencies in connection with economic developments. Lazard’s Sovereign Advisory Group has advised a number of countries and institutions with respect to sovereign debt and other financial matters.
We staff each of our assignments with a team of quality professionals who have appropriate product, industry and geographic expertise. We pride ourselves on, and we believe we differentiate ourselves from our competitors by, being able to offer a high level of attention from senior personnel to our clients and organizing ourselves in such a way that managing directors who are responsible for securing and maintaining client relationships also actively participate in providing related advice and services. Our managing directors have significant experience, and many of them are able to use this experience to advise on M&A, financings, restructurings, capital structure, shareholder advisory and other transactions or financial matters, depending on our clients’ needs. Many of our managing directors and senior employees come from diverse backgrounds, such as senior leadership positions in corporations, government, law and strategic consulting, which we believe enhances our ability to offer sophisticated advice and customized solutions to our clients. As of December 31,
2022,2023, our Financial Advisory segment had
211210 managing directors and
1,4521,392 other professionals and support staff.
Industries Served
and Practice Areas
We seek to offer our services across most major industry groups, including, in many cases, sub-industry specialties. Managing directors and professionals in our M&A practice are organized to provide advice in the following major industry practice areas:
| •consumer;• | financial institutions;
|
| •financial institutions;• | health care and life sciences;
|
| •health care and life sciences;• | industrials;
|
| •industrials;• | power and energy/infrastructure;
|
| •power and energy/infrastructure;• | real estate;
|
| •real estate;• | technology; and
|
| •technology; and• | telecommunications, media and entertainment.
|
•telecommunications, media and entertainment.
These groups are managed locally in each relevant geographic region and are coordinated globally, which allows us to bring local industry-specific knowledge to bear on behalf of our clients on a global basis. We believe that this enhances the scope and the quality of the advice that we can offer, which improves our ability to market our capabilities to clients.
In addition to our M&A and Restructuring and
Capital SolutionsLiability Management practices, we also maintain specialties in the following distinct practice areas within our Financial Advisory business:
| •
| government and sovereign advisory;
|
| •
| capital structure debt and equity•government and sovereign advisory;
|
•capital structure debt and equity advisory;
| • | shareholder and corporate preparedness advisory; |
| • | fundraising and arranging liquidity for third-party alternative investment funds; |
| • | corporate finance and other services, including private placements, underwritten offerings related to our Financial Advisory business and transactions involving the exchange or issuance of securities; and |
We endeavor to coordinate the activities of the professionals in these areas with our M&A industry specialists in order to offer clients customized teams of cross-functional expertise spanning both industry and practice area expertise.
Our focus in our Financial Advisory business is on:
| •
| investing in our intellectual capital through senior professionals who we believe have strong client relationships and industry expertise;
|
| •investing in our intellectual capital through senior professionals who we believe have strong client relationships and industry expertise;• | increasing our contacts with existing clients to further enhance our long-term relationships and our efforts in developing new client relationships;
|
| • | increasing our contacts with existing clients to further enhance our long-term relationships and our efforts in developing new client relationships; |
| •developing new client relationships;• | expanding the breadth and depth of our industry expertise and selectively adding or reinforcing practice areas, such as our Capital Markets Advisory, Shareholder Advisory, Sovereign Advisory and Geopolitical Advisory groups;
|
| •expanding the breadth and depth of our industry expertise and selectively adding or reinforcing practice areas, such as our Capital Markets Advisory, Shareholder Advisory, Sovereign Advisory and Geopolitical Advisory groups;• | coordinating our industry specialty activities on a global basis and increasing the integration of our industry experts in M&A with our other professionals;
|
| •coordinating our industry specialty activities on a global basis and increasing the integration of our industry experts in M&A with our other professionals;• | selectively bolstering our existing presence in certain local markets;
|
| •selectively bolstering our existing presence in certain local markets;• | broadening our geographic presence by adding new offices where opportunities arise;
|
| •broadening our geographic presence by adding new offices where opportunities arise;• | investing in our technology infrastructure and data science capabilities to enhance our business; and
|
| •investing in our technology infrastructure and data science capabilities to enhance our business; and• | deploying our intellectual capital, strong client relationships and other assets to generate new revenue streams.
|
•deploying our intellectual capital, strong client relationships and other assets to generate new revenue streams.
In addition to the investments made as part of this strategy, we believe that our Financial Advisory business may benefit from external market factors, including:
| •
| demand for independent, sophisticated financial advice;
|
| •demand for independent, sophisticated financial advice;• | recapitalization and related activities in developed and emerging markets;
|
| •recapitalization and related activities in developed and emerging markets;• | high corporate cash balances;
|
| •high corporate cash balances;• | attractive equity valuations, favorable credit conditions and generally positive market sentiment;
|
| •attractive equity valuations, stable credit conditions and generally positive market sentiment;• | favorable levels of cross-border M&A and large capitalization M&A, two of our areas of historical specialization;
|
| •favorable levels of cross-border M&A and large capitalization M&A, two of our areas of historical specialization;• | strategic market and industry catalysts, including energy transition, technology disruption, and infrastructure investment; and
|
| •strategic market and industry catalysts, including energy transition, technology disruption, life sciences evolution and infrastructure investment; and• | possible M&A activity that may result from tax, regulatory and similar reform.
|
•favorable tax, regulatory and similar reform.
Going forward, our strategic emphasis in our Financial Advisory business is to leverage the investments we have made to grow our business and drive our productivity. We continue to seek to opportunistically attract
4
outstanding individuals to our business.business, and expect the number of Financial Advisory managing directors to increase in the future as part of our initiative to grow revenues. Net hiring may also increase compensation expenses. We routinely reassess our strategic position and may in the future seek opportunities to further enhance our competitive position.
Our Asset Management business offers a broad range of global investment solutions and investment and wealth management services in equity and fixed income strategies, asset allocation strategies, alternative investments and private equity funds to corporations, public funds, sovereign entities, endowments and foundations, labor funds, financial intermediaries and private clients. Our goal in our Asset Management business is to produce superior risk-adjusted investment returns and provide customized investment solutions for our clients through the active management of their
portfolios.assets. Our investment teams construct and manage portfolios using various techniques and investment philosophies, including traditional fundamental research and analysis and quantitative tools.
Our top ten clients accounted for 27%29% of our total assets under management (“AUM”) for the year endedas of December 31, 2022,2023, with no client individually contributing more than 10% of our Asset Management segment net revenue. Approximately 85% of our AUM as of December 31, 20222023 was managed on behalf of institutional and intermediary clients, including corporations, labor unions, public pension funds, insurance companies and banks, and through sub-advisory relationships,
mutual fund sponsors, broker-dealers and registered advisors, and approximately 15% of our AUM was managed on behalf of individual client relationships, which are principally with family offices and high-net worth individuals.
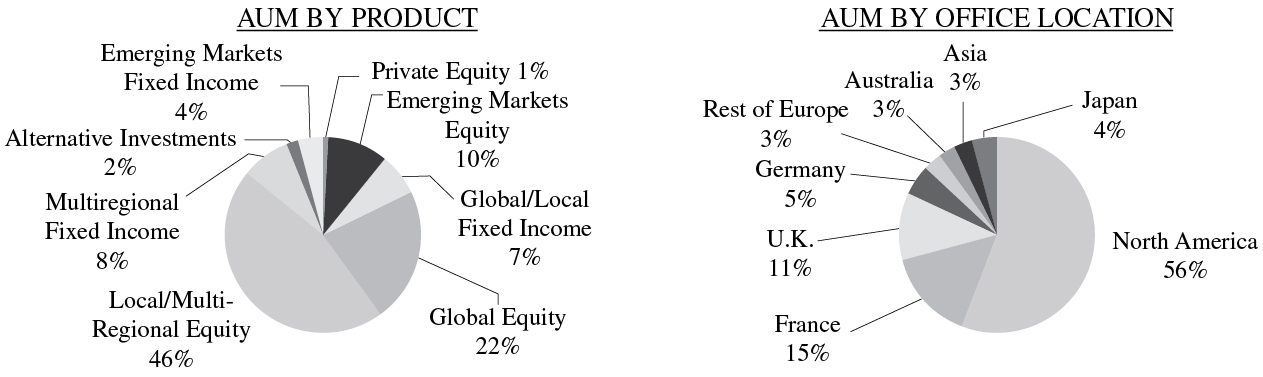
The charts below illustrate the mix of our AUM as of December 31,
2022,2023, measured by broad product strategy and by office location.
Our Asset Management business maintains offices in New York, Amsterdam, Bordeaux, Boston, Brussels, Chicago, Dubai, Dublin, Frankfurt, Geneva, Hamburg, Hong Kong, London, Luxembourg, Lyon, Madrid, Melbourne, Milan, Montreal, Nantes, Paris,
Riyadh, San Francisco, Seoul, Singapore, Sydney, Tokyo, Toronto,
Vienna and Zurich. These operations, with
120114 managing directors and
1,1051,107 other professionals and support staff as of December 31,
2022,2023, provide our Asset Management business with both a global presence and a local identity.
Primary distinguishing features of these operations include:
| •
| a global footprint with global research, global mandates and global clients;
|
| •a global footprint with global research, global mandates and global clients;• | a broad-based team of investment professionals, including focused, in-house investment analysts across all products and platforms, many of whom have substantial industry or sector specific expertise; and
|
| •a broad-based team of investment professionals, including focused, in-house investment analysts across all products and platforms, many of whom have substantial industry or sector specific expertise; and •world-wide brand recognition and multi-channel distribution capabilities. •
| world-wide brand recognition and multi-channel distribution capabilities.
|
Our Investment Philosophy, Process and Research
Our investment philosophy is generally based upon a fundamental security selection approach to investing. Across many of our products, we apply three key principles to investment portfolios:
| •
| select securities, not markets;
|
•select securities, not markets;
| • | evaluate a company’s financial position, outlook, opportunities and risks, together with its valuation; and |
In searching for investment opportunities, many of our investment professionals follow an investment process that incorporates several interconnected components that may include:
| •
| quantitative•fundamental analysis;
|
| •
| accounting•quantitative analysis;
|
| •accounting analysis;• | security selection and portfolio construction;
|
| •security selection and portfolio construction;• | risk management; and
|
| •risk management; and• | ESG factors.
|
•environmental, social and governance (“ESG”) factors.
In our Asset Management business, we conduct investment research on a global basis to develop market, industry and company-specific insights and evaluate investment opportunities. Many of our global equity analysts, located in our worldwide offices, are organized around global industry sectors.
Our Asset Management business provides equity, fixed income, cash management and alternative investment strategies to our clients, paying close attention to our clients’ varying and expanding investment needs. We offer the following product platform of investment strategies:
| | | | | | | | | | | | | | | | | | | | | | | |
| Global | | Global
Multi-Regional | | Local | | Multi-Regional
| Local
| | Emerging Markets |
Equity | Sustainable Agriculture Global Ex Global Ex-U.K.
Global Ex-Japan
Global Ex-Emerging Markets Circular Economy | | Multi-Capitalization Value Thematic Eurozone Euro-Trend (Thematic)
Europe, Australasia and Far East Sustainable | | Large Capitalization Small/Mid
Quantitative Small Capitalization U.K. (Large Capitalization) U.K. Quantitative
France France (Large Capitalization)
France (Small Capitalization)
Large Capitalization Small Capitalization | | Small Capitalization Frontier Equities
Managed Volatility Sustainable
Middle East North Africa |
| | | | | | | |
Fixed Income and Cash Management | Total Return Short Duration Convertibles | | Pan-European Core High Yield Short Duration
Convertibles
| | Pan-European
Core
High Yield
Total Return Eurozone Fixed Income
Cash Management
Corporate Bonds
Scandinavian
Short Duration
| | U.S.
Cash Management Corporate Bonds Nordic Scandinavian Short Duration | | U.S. Core/Core Plus High Yield | | Emerging DebtEmerging Debt-
Core/Local/Blend/Corporate |
| | | | | | | |
Alternative | Sustainable Private Infrastructure | | | | Quantitative Long/Short Equity Long/Short Credit
Japan Long/Short Equity | | Emerging Debt Total Return Emerging Income Emerging Debt
|
In addition to the primary investment strategies listed above, we also provide other asset management services to our clients, including asset allocation and other investment advisory services, as well as locally customized investment solutions. In many cases, we also offer both diversified and more concentrated versions of our products. These products are generally offered on a separate account basis, as well as through pooled vehicles.
Distribution. We distribute our products through a broad array of marketing channels on a global basis. Marketing, sales and client service efforts are organized through a global market delivery and service network, with distribution professionals located in cities including New York, Amsterdam, Bordeaux, Boston, Brussels, Chicago, Dubai, Frankfurt, Geneva, Hamburg, Hong Kong, London, Luxembourg, Lyon, Madrid, Melbourne, Milan, Montreal, Nantes, Paris, Riyadh, San Francisco, Seoul, Singapore, Sydney, Tokyo, Toronto, Vienna and Zurich. We have developed a well-established presence in the institutional asset management arena, managing assets for corporations, labor unions, sovereign wealth funds and public pension funds around the world. In addition, we manage assets for insurance companies, savings and trust banks, endowments, foundations and charities. We
also have becomeare a leading firm in managing mutual funds, sub-advisory funds and separately managed accounts for many of the world’s largest broker-dealers, insurance companies, registered advisors and other financial intermediaries.
Our strategic plan in our Asset Management business is to focus on delivering superior investment performance and client service and broadening our product offerings and distribution in selected areas in order to continue to drive improved business results. Over the past several years, in an effort to improve our Asset Management business’ operations and expand our Asset Management business, we have:
| •
| focused on enhancing our investment performance;
|
| •focused on enhancing our investment performance;• | improved our investment management platform by adding a number of senior investment professionals, including portfolio managers and analysts;
|
| •improved our investment management platform by adding a number of senior investment professionals, including portfolio managers and analysts;• | continued to strengthen our marketing and consultant relations capabilities, including by optimizing our distribution capabilities across client channels in North America;
|
| •continued to strengthen our marketing and consultant relations capabilities, including by optimizing our distribution globally;• | expanded our product platform, including through the addition of long/short equity strategies, sustainable strategies, quantitative equity strategies, long/short credit capabilities and thematically oriented strategies;
|
| •expanded our product platform, including through the addition of long/short equity strategies, sustainable strategies, quantitative equity strategies and thematically oriented strategies;• | invested in our technology infrastructure and data science capabilities to enhance our business; and
|
| •invested in our technology infrastructure and data science capabilities to enhance our business; and• | continued to expand the geographic reach of our Asset Management business.
|
•continued to expand our geographic reach where opportunities arise.
We believe that our Asset Management business has long maintained an outstanding team of portfolio managers and global research analysts. We intend to maintain and supplement our intellectual capital to achieve our goals. We routinely reassess our strategic position and
may in the future seekaim to add capabilities potentially through acquisitions or other transactions, including the opportunistic hiring of new employees, in order to further enhance our competitive position.
We also believe that our specific investment strategies, global reach, unique brand identity and access to multiple distribution channels may allow us to expand into new investment products, strategies and geographic locations. In addition, we may expand our participation in alternative investment activities through investments in new and successor funds, and through organic growth, acquisitions or otherwise. We may also continue to expand our geographic reach where opportunities arise.We engage in selected alternative investments and private equity activities. In 2009, we established a private equity business with The Edgewater Funds (“Edgewater”), a Chicago-based private equity firm, through the acquisition of Edgewater’s management vehicles. As of December 31,
2022,2023, Edgewater had approximately
$1.0$1.6 billion of AUM and unfunded fee-earning commitments.
Historically, Lazard also has made selected investments with its We have historically, and may in the future, invest our own capital often alongside capitalthat of qualified institutional and individualother investors, in connection with Lazard’s selectedcertain of our activities in managing alternative investmentsasset and private equity activities. These investments typically have been organized in funds that make substantial or
8
controlling investments in private or public companies, generally through privately negotiated transactions. While potentially risky and frequently illiquid, such investments, when successful, can yield investors substantial returns on capital and generate attractive management and performance-based incentive fees for the sponsor of such funds.
investment vehicles.
We believe that our people are our most important asset. Their talent, integrity and engagement have shaped our success in the past, and they are instrumental to our ability to achieve sustainable growth and deliver value for our shareholders in the future. We strive to create a culture that fosters excellence, collaboration, innovation, empowerment, inclusion and engagement.
Our human capital efforts are overseen by Lazard Ltd’sour Board of Directors, with a focus on enhancing our workplace environment which in turn, attracts a diversity of perspectives and exceptional talent. In February 2018, Lazard Ltd’sour Board of Directors formally established its Workplace and Culture Committee to assist and advise management on cultivating and
reinforcing a workplace culture that helps attract, motivate and retain talented people; fosters productivity, professional and personal development; values diversity, equity and inclusion; and encourages its people to engage with each other and their communities. The Company has several areas of focus to support these objectives:
Attracting and Retaining Talent. We offer competitive compensation packages to recruit and retain exceptional talent. We offer a variety of employee benefits, including comprehensive health insurance coverage, flexible retirement and health carehealthcare savings account plans as well as family planning and support services. We also invest in wellness programs that are broadly inclusive and support varied lifestyles. We further believe that the equity-based portion of our compensation program fosters a greater sense of ownership among our senior employees and aligns their interests with those of our shareholders. Talent Development. We seek to hire talented and motivated individuals and prioritize their continued education and training. The Company works to support the success and growth of its employees through a collaborative and dynamic 360-degree performance management and review cycle. Furthermore, through investments in technology, we have enhanced knowledge management and collaboration tools across our businesses. Inclusion, Diversity, Equity and Allyship.Allyship (“IDEA”). We strive to cultivate a workforce comprised of people with different backgrounds and experiences, which we believe creates an environment of cognitive diversity that promotes new ideas and innovation. Our IDEA strategy fosters diversity through hiring, development, promotion and retention while contributing to an equitable and inclusive culture by calling on everyone at the firm to take personal responsibility in ensuring the strategy’s success. Additionally, we support the creation of a variety of employee resource groups, which build community across the firm, contribute to our inclusive culture, and provide opportunities for individuals to give back to their communities through volunteering and educational outreach. Personal Well-Being. The Company invests in the well-being of our employees by offering benefits intended to meet the varied and evolving needs of our diverse workforce across businesses and geographies. The Company addresses this through its Work to Wellness program, a global initiative that educates, motivates and empowers employees to maintain a healthy lifestyle in and out of the workplace. We offer a wide range of resources to support employees and their families’ emotional and financial well-being. We have also made investments in technology that enable remote and hybrid working options. Community. The Company promotes community engagement through our Work for Good initiative, which supports employee initiatives to volunteer with a variety of local charities. Volunteering through our Work for Good program allows employees to make a positive impact in their communities and share experiences with their colleagues outside of the workplace. In addition to Work for Good, the Company encourages participation in, among others, the Lazard Foundation in the U.S. and Give as You Earn in the U.K., which host additional volunteer opportunities and charitable fundraising events. Employees. As of December 31, 2022,2023, we employed approximately 3,3893,289 full-time people based in 43 cities across 26 countries.people. We operate through two business segments: our Financial Advisory business included 211210 managing directors and 1,4521,392 professionals and support staff, and our Asset Management business included 1209
114 managing directors and 1,1051,107 professionals and support staff. Our Corporate segment included 2526 managing directors and 476440 professionals and support staff. Generally, our employees are not subject to collective bargaining agreements, except that our employees in some offices, including France and Italy, are covered by national, industry-wide collective bargaining agreements. We believe that we have good relations with our employees.
The financial services industry, and all of the businesses in which we compete, are intensely competitive, and we expect them to remain so. Our competitors are other investment banking and financial advisory firms, broker-dealers, commercial and “universal” banks, insurance companies,
investmenttraditional asset management firms, hedge fund management firms, alternative investment firms, private banks and other financial institutions. We compete with some of them globally and with others on a regional, product or niche basis. We compete on the basis of a number of factors, including industry and product expertise, innovative insights of our people, transaction execution skills, investment track record, quality of client service, individual and institutional client relationships, absence of conflicts, range and price of products and services, innovation, brand recognition and business reputation.
While we believe our independent advisory perspective and global footprint offersoffer a uniquely competitive position, many of our competitors are large, consolidated financial institutions that have the ability to offer a wider range of
products, including loans, insurance, foreign exchange, hedging, research, brokerage and underwriting services, which may enhance their competitive position. They also may have the ability to support clients with other financial services in an effort to gain market share, which could result in pricing pressure in our business or loss of opportunities for us. At the same time, demand for independent financial advice has created opportunities for
new entrants, including a number of boutique financial advisory firms. These boutique firms frequently compete, among other factors, on the basis of their independent financial advice, and their activities also could result in pricing and other competitive pressure in our businesses. In some circumstances, our competitors may offer financial products or services that we do not offer, such as low-cost passive or private investment vehicles. We compete based on the quality and breadth of our products and innovative solutions we offer, which
isare derived from our objectivity, differentiated insights and fundamental research orientation.
Competition is also intense in each of our businesses for the attraction and retention of qualified employees, and we compete, among other factors, on the level and nature of compensation and long-term incentives, workplace culture and opportunities for professional and personal development for our employees. Our ability to continue to compete effectively in our businesses will depend upon our ability to attract new employees and retain and motivate our existing employees, in each case, at appropriate compensation levels.
See Item 1A, “Risk Factors—The financial services industry, and all of the businesses in which we compete, are intensely competitive” below.
Our businesses are subject to extensive regulation throughout the world. As a matter of public policy, regulatory bodies are generally charged with safeguarding the integrity of the securities and other financial markets and with protecting the interests of customers participating in those markets, not with protecting the interests of our stockholders or creditors. Many of our affiliates that participate in securities markets are subject to comprehensive regulations that include some form of minimum capital retention requirements and customer protection rules. In the U.S., certain of our subsidiaries are subject to such regulations promulgated by the United States Securities and Exchange Commission (the “SEC”) and/or the Financial Industry Regulatory Authority (“FINRA”). Standards, requirements and rules implemented throughout the European Union are broadly comparable in scope and purpose to the regulatory capital and customer protection requirements imposed under the SEC and FINRA rules. European Union directives also permit local regulation in each jurisdiction, including those in which we operate, to be more restrictive than the requirements of such European Union-wide directives. These local requirements can result in certain competitive disadvantages to us.
In the U.S., the SEC is the federal agency responsible for the administration of the federal securities laws. FINRA is a voluntary, self-regulatory body composed of members, such as our broker-dealer subsidiaries, that have agreed to abide by FINRA’s rules and regulations.
The SEC, FINRA and other U.S. and non-U.S. regulatory
10
organizations may examine the activities of, and may expel, fine and otherwise discipline us and our employees. The laws, rules and regulations comprising this framework of regulation and the interpretation and enforcement of existing laws, rules and regulations are continually changing. The effect of any such changes cannot be predicted and may impact the manner of operation and profitability of our businesses.
Our principal U.S. broker-dealer subsidiary, Lazard Frères & Co. LLC (“LFNY”), through which we conduct most of our U.S. Financial Advisory business, is currently registered as a broker-dealer with the SEC and FINRA, and as a broker-dealer in all 50 U.S. states, the District of Columbia and Puerto Rico. As such, LFNY is subject to regulations governing most aspects of the securities business, including regulations regarding minimum capital retention requirements, record-keeping and reporting procedures, relationships with customers, experience and training requirements for certain employees and business procedures with firms that are not members of certain regulatory bodies. Lazard Asset Management Securities LLC (“LAM Securities”), a subsidiary of Lazard Asset Management LLC (“LAM LLC”), is registered as a broker-dealer with the SEC and FINRA and in all 50 U.S. states, the District of Columbia and Puerto Rico.
Lazard Middle Market LLC is registered as a broker-dealer with the SEC and FINRA and as a broker-dealer in various U.S. states and territories.Our U.S. broker-dealer subsidiaries, including LFNY, are subject to the SEC’s uniform net capital rule, Rule 15c3-1 under the Securities Exchange Act of 1934, as amended (the “Exchange Act”), and the net capital rules of FINRA, which may limit our ability to make withdrawals of capital from our broker-dealer subsidiaries. The uniform net capital rule sets the minimum level of net capital a broker-dealer must maintain and also requires that a portion of its assets be relatively liquid. FINRA may prohibit a member firm from expanding its business or paying cash dividends if it would result in net capital falling below FINRA’s requirements. In addition, our broker-dealer subsidiaries are subject to certain notification requirements related to withdrawals of excess net capital. Our broker-dealer subsidiaries are also subject to regulations, including the USA PATRIOT Act of 2001, which impose obligations regarding the prevention and detection of money-laundering activities, including the establishment of customer due diligence and other compliance policies and procedures. Failure to comply with these requirements may result in monetary, regulatory and, in certain cases, criminal penalties.
Certain U.K. subsidiaries of Lazard Group, including Lazard & Co., Limited (“LCL”), Lazard Fund Managers Limited and Lazard Asset Management Limited, which we refer to in this Annual Report on Form 10-K (this “Form 10-K”) as the “U.K. subsidiaries,” are authorized and regulated by the Financial Conduct Authority (the “FCA”), and are subject to various rules and regulations made by the FCA under the authorities conferred upon it by the Financial Services and Markets Act 2000, as amended by the Financial Services Act 2012.
Certain of our Asset Management subsidiaries are registered as investment advisors with the SEC. As a registered investment advisor, each is subject to the requirements of the Investment Advisers Act of 1940, as amended (the “Investment Advisers Act”), and the SEC’s regulations thereunder. Such requirements relate to, among other things, the relationship between an advisor and its advisory clients, as well as general anti-fraud prohibitions. LAM LLC serves as an investment advisor to several U.S. mutual funds which are registered under the Investment Company Act of 1940, as amended (the “Investment Company Act”). The Investment Company Act regulates, among other things, the relationship between a mutual fund and its investment advisor (and other service providers) and prohibits or severely restricts principal transactions between an advisor and its advisory clients, imposes record-keeping and reporting requirements, disclosure requirements, limitations on trades where a single broker acts as the agent for both the buyer and seller, and limitations on affiliated transactions and joint transactions. LAM Securities serves as an underwriter or distributor for mutual funds and private funds managed by LAM LLC and its subsidiaries (collectively, “LAM”), and as an introducing broker to Pershing LLC for unmanaged accounts of certain of LAM LLC’s private clients.
As a result of certain changes effected by the Dodd-Frank Wall Street Reform and Consumer Protection Act (the “Dodd-Frank Act”) related to the regulation of over-the-counter swaps and other derivative instruments, LAM and certain of its subsidiaries have registered with the U.S. Commodity Futures Trading Commission (the “CFTC”) and the National Futures Association (the “NFA”), and are subject to certain aspects of the U.S. Commodity Exchange Act and the regulations thereunder and to the rules of the NFA. The CFTC and the NFA have authority over the laws, rules and regulations related to commodities (including the over-the-counter swaps and derivatives markets), and regulate our relationship with clients who trade in these instruments. The U.S. Commodity Exchange Act and the regulations thereunder also impose additional record-keeping and reporting requirements and disclosure requirements on LAM and its subsidiaries.
Compagnie Financière Lazard Frères SAS (“CFLF”), our French subsidiary under which asset management and commercial banking activities are carried out in France, is subject to regulation by the Autorité de Contrôle Prudentiel et de Résolution (“ACPR”) for its banking activities conducted through our Paris-based banking subsidiary, Lazard Frères Banque SA (“LFB”). The investment services activities of the Paris group, exercised through LFB and other subsidiaries of CFLF, primarily Lazard Frères Gestion SAS (“LFG”), also are subject to regulation and supervision by the Autorité des Marchés Financiers. In addition, pursuant to the consolidated supervision rules in the European Union, LFB, in particular, as a French credit institution, is required to be supervised by a regulatory body, either in the U.S. or in the European Union. In 2013, the Company and the ACPR
11
agreed on terms for the consolidated supervision of LFB and certain other non-Financial Advisory European subsidiaries of the Company (referred to herein, on a combined basis, as the “combined European regulated group”) under such rules. Under this supervision, the combined European regulated group is required to comply with minimum requirements for regulatory net capital to be reported on a quarterly basis and satisfy periodic financial and other reporting obligations.capital. Additionally, the combined European regulated group, together with certain of our European Financial Advisory entities, is required to perform an annual risk assessment and provide certain other information on a periodic basis, including financial reports and information relating to financial performance, balance sheet data and capital structure.
As a result of certain changes effected by the Dodd-Frank Wall Street Reform and Consumer Protection Act (the “Dodd-Frank Act”) related to the regulation of over-the-counter swaps and other derivative instruments, LAM and certain of its subsidiaries have registered with the U.S. Commodity Futures Trading Commission (the “CFTC”) and the National Futures Association (the “NFA”), and are subject to certain aspects of the U.S. Commodity Exchange Act and the regulations thereunder, and to the rules of the NFA. The CFTC and the NFA have authority over the laws, rules and regulations related to commodities (including the over-the-counter swaps and derivatives markets), and regulate our relationship with clients who trade in these instruments. The U.S. Commodity Exchange Act and the regulations thereunder also impose additional record-keeping and reporting requirements and disclosure requirements on LAM and its subsidiaries.
basis.
In addition, the Central Bank of Ireland, the Japanese Ministry of Finance and Financial Services Agency, the Korean Financial Supervisory Commission, the Securities and Futures Commission of Hong Kong, the Monetary Authority of Singapore, the Australian Securities & Investments Commission, the Dubai Financial Services Authority, the Italian Companies and Stock Exchange Commission and the German Federal Financial Supervisory Authority, among others, regulate relevant operating subsidiaries of the Company and also have capital standards and other requirements broadly comparable to the rules of the SEC. Our business is also subject to regulation by other non-U.S. governmental and regulatory bodies and self-regulatory authorities in other countries in which we operate.
Regulators are empowered to conduct periodic examinations and initiate administrative proceedings that can result, among other things, in censure, fine, the issuance of cease-and-desist orders or the suspension or expulsion or other disciplining of a regulated entity or its directors, officers or employees.
We are also subject to various anti-bribery, anti-money laundering and counter-terrorist financing laws, rules and regulations in the jurisdictions in which we operate. The U.S. Foreign Corrupt Practices Act, for example, generally prohibits offering, promising or giving, or authorizing others to give, anything of value, either directly or indirectly, to a
non-U.S. government official in order to influence official action or otherwise gain an unfair business advantage, such as to obtain or retain business. Similar rules and regulations exist in other jurisdictions in which we operate. In addition, we are required to comply with economic sanctions and embargo programs administered by the U.S. Treasury’s Office of Foreign Assets Control and by similar governmental agencies and other authorities worldwide. Violations of any of these laws, rules, regulations and programs can give rise to administrative, civil or criminal penalties.
The U.S. and other governments and institutions have taken actions, and may continue to take further actions, that affect the global financial markets. Such further actions could include expanding current or enacting new standards, requirements and rules that may be applicable to us and our subsidiaries. The effect of any such expanded or new standards, requirements and rules is uncertain and could have adverse consequences to our business and results of operations. See Item 1A, “Risk Factors—Other Business Risks—Extensive regulation of our businesses limits our activities and results in ongoing exposure to the potential for significant penalties, including fines or limitations on our ability to conduct our
businesses.”businesses”.
Executive Officers of the Registrant
Set forth below are the name, age, present title, principal occupation and certain biographical information for each of our executive officers as of February
14, 2023,13, 2024, all of whom have been appointed by, and serve at the discretion of, our board of directors.
Mr. Jacobs
has servedbecame Executive Chairman at Lazard, Inc. and Lazard Group in October 2023 after previously serving as Chairman of the Board of Directors and Chief Executive Officer of Lazard,
LtdInc. and Lazard Group
sincefrom November
2009.2009 through September 2023. Mr. Jacobs has served as a Managing Director of Lazard,
Inc. since 1991 and had been a Deputy Chairman of Lazard from January 2002 until November 2009. Mr. Jacobs also served as Chief Executive Officer of Lazard North America from January 2002 until November 2009. Mr. Jacobs initially joined Lazard in 1988. Mr. Jacobs is a member of the
BoardBoards of Trustees of the University of Chicago and the Brookings Institution.
Mary Ann Betsch, 44
Ms. Betsch became Chief Financial Officer of Lazard Ltd and Lazard Group in October 2022. Prior to joining Lazard, Ms. Betsch worked at Citadel, where she helped lead the finance and accounting function since 2018. Ms. Betsch was previously He is also a partner at PwC, where she spent 17 years in a variety of audit and advisory roles serving global investment banks and other financial institutions. She also completed a two-year fellowship program supported by the Federal Reserve Board’s Chief Accountant.
Scott D. Hoffman, 60
Mr. Hoffman has served as Chief Administrative Officer of Lazard Ltd and Lazard Group since July 2017 and as General Counsel of Lazard Ltd since May 2005. Mr. Hoffman has served as a Managing Director of Lazard since January 1999 and General Counsel of Lazard Group since January 2001. Mr. Hoffman previously served as Vice President and Assistant General Counsel from February 1994 to December 1997 and as a Director from January 1998 to December 1998. Prior to joining Lazard, Mr. Hoffman was an attorney at Cravath, Swaine & Moore LLP. Mr. Hoffman is a member of the Board of Trustees of thePartnership for New York University School of LawCity, and a member of the Board of Directors of Film at Lincoln Center.
Council on Foreign Relations.
Mr. Orszag became Chief Executive Officer of
Lazard, Inc. and Lazard Group in October 2023. He previously served as Chief Executive Officer of Financial Advisory
infrom June
2019.2019 until September 2023. Prior to that he was Lazard’s Head of North American Mergers & Acquisitions since July 2018 and Global Co-Head of Healthcare since November 2016. Mr. Orszag joined Lazard in May 2016 as a Vice Chairman of Investment Banking from Citigroup, where he was Vice Chairman of Corporate and Investment Banking and Chairman of the Financial Strategy and Solutions Group from January 2011 to February 2016. Mr. Orszag served as the Director of the Office of Management and Budget in the Obama Administration from January 2009 to July 2010, and was the Director of the Congressional Budget Office from January 2007 to December 2008. Mr. Orszag is a member of the Board of Directors of the Peterson Institute for International Economics, the Mt. Sinai Medical Center and New Visions for Public Schools in New York, and is a member of the National Academy of Medicine.
Mary Ann Betsch, 45
Ms. Betsch became Chief Financial Officer of Lazard, Inc. and Lazard Group in October 2022. Prior to joining Lazard, Ms. Betsch worked at Citadel, where she helped lead the finance and accounting function since 2018. Ms. Betsch was previously a partner at PwC, where she spent 17 years in a variety of audit and advisory roles serving global investment banks and other financial institutions. She also completed a two-year fellowship program supported by the Federal Reserve Board’s Chief Accountant. She holds a CPA license in the State of New York and is a CFA charterholder.
Mr. Russo became Chief Executive Officer of Lazard’s Asset Management business in June 2022. He previously served as Chief Financial Officer of Lazard,
LtdInc. and Lazard Group from October 2017 until October 2022. Mr. Russo has served as Managing Director of Lazard since 2009, and prior to becoming Chief Financial Officer was Co-Head of Lazard’s Capital Markets and Capital Structure Advisory practice. Mr. Russo joined Lazard as a Director in 2007. Prior to joining Lazard, Mr. Russo worked for Goldman, Sachs & Co. in the Investment Banking Division, and prior to that, for Barclays Capital. Mr. Russo began his career as an attorney at Milbank, Tweed, Hadley & McCloy.
13
Ms. Soto became Chief Operating Officer of Lazard, Inc. and Lazard Group in October 2023. She previously served as Group Executive, Human Capital and Workplace Innovation, of Lazard, LtdInc. and Lazard Group in June 2019. She became the Global Chief Operating Officer of Financial Advisory in July 2018 and has served as a Managing Director of Lazard since January 2001. Ms. Soto was previously Chief Operating Officer of Lazard Europe Financial Advisory from January 2006 to July 2018, and Chief Operating Officer of Lazard Paris Financial Advisory from October 2009 to August 2013. Prior to joining Lazard in June 1993, Ms. Soto worked for Morgan Stanley. She is a member of the Supervisory Board of Metro AG.
Christian A. Weideman, 48
Mr. Weideman became General Counsel of Lazard, Inc. and Lazard Group in October 2023. Prior to joining Lazard, Mr. Weideman was global General Counsel and a partner at Apollo Global Management, where he led and managed Apollo's legal, tax, and compliance team. Mr. Weideman also served in senior roles at the United States Department of the Treasury including as Deputy General Counsel and then Chief of Staff. Prior to the Department of Treasury, Mr. Weidemanserved as Associate Counsel to the President at the White House and as a litigator at Williams & Connolly.
Where You Can Find Additional Information
Lazard Group files current, annual and quarterly reports and other information required by the Exchange Act with the SEC. The Company’s SEC filings are available to the public from the SEC’s internet site at http://www.sec.gov. Our public website is http://www.lazard.com and the investor relations section thereof hosts our SEC filings. We will make available free of charge, on or through the investor relations section of our website, our annual reports on Form 10-K, quarterly reports on Form 10-Q, current reports on Form 8-K and any amendments to those reports filed or furnished pursuant to the Exchange Act as soon as reasonably practicable after we electronically file such material with, or furnish it to, the SEC. Also posted on our website, and available in print upon request of any Lazard, LtdInc. shareholder to the Investor Relations Department, are charters for Lazard, Ltd’sInc.’s Audit Committee, Compensation Committee, Nominating & Governance Committee and Workplace and Culture Committee. Copies of these charters and Lazard, Ltd’sInc.’s Corporate Governance Guidelines and Code of Business Conduct and Ethics governing our directors, officers and employees are also posted on the investor relations section of our website in the corporate governance subsection. ITEM 1A. RISK FACTORS
You should carefully consider the following risks and all of the other information set forth in this Form 10-K, including our consolidated financial statements and related notes. The following risks comprise the material risks of which we are aware. If any of the events or developments described below actually occurred, our business, financial condition or results of operations would likely suffer.
The following is a summary of certain material risks of which we are aware. You should carefully consider this summary, together with the more detailed description of each risk factor contained below.
•• | Difficult market conditions can adversely affect our business in many ways, including by reducing the volume of transactions involving our Financial Advisory business and reducing the value or performance of the assets we manage in our Asset Management business.
|
•
| Fluctuations in foreign currency exchange rates could reduce our members’ equity and net income or negatively impact the portfolios of our Asset Management clients and may affect the levels of our AUM.
|
•
| Our results of operations may be affected by fluctuations in the fair value of positions held in our investment portfolios.
|
•
| Our business, financial condition and results of operations could be materially adversely affected by pandemics, including the ongoing COVID-19 pandemic.
|
•
| Due to the nature of our business, financial results could differ significantly from period to period, which may make it difficult for us to achieve steady earnings growth on a quarterly basis.
|
•
| Our ability to retain our managing directors and other key professional employees, including maintaining compensation levels at an appropriate level, is critical to the success of our business and failure to do so may materially adversely affect our results of operations and financial position.
|
•
| The financial services industry, and all of the businesses in which we compete, are intensely competitive.
|
•
| A substantial portion of our revenue is derived from Financial Advisory fees, which are not long-term contracted sources of revenue and are subject to intense competition.
|
•
| If the number of debt defaults, bankruptcies or other factors affecting demand for our Restructuring services declines, our Restructuring revenue could suffer.
|
•
| Certain of our services are dependent on the availability of private capital for deployment in illiquid asset classes.
|
15
•
| Potential underwriting activities or advisory roles on capital raises may expose us to risk.
|
•
| Our investment style in our Asset Management business, including the mix of asset classes and investment strategies comprising our AUM, may underperform or generate less demand than other investment approaches, which may result in significant client or asset departures or a reduction in AUM.
|
•
| We could lose clients and suffer a decline in our Asset Management revenue and earnings if the investments we choose in our Asset Management business perform poorly, regardless of overall trends in the prices of securities.
|
•
| Because many of our Asset Management clients can remove the assets we manage on short notice, we may experience unexpected declines in revenue and profitability.
|
•
| Access to clients through intermediaries and consultants is important to our Asset Management business, and reductions in referrals from such intermediaries or consultants or poor reviews of our products or our organization by such intermediaries or consultants could materially reduce our revenue and impair our ability to attract new clients.
|
•
| Our Asset Management business relies on non-affiliated third-party service providers.
|
•
| Certain of our investments are in relatively high-risk, illiquid assets, and we may lose some or all of the principal amount of these investments or fail to realize any profits from these investments for a considerable period of time.
|
•
| We may pursue new business lines, acquisitions, joint ventures, cooperation agreements or other growth or geographic expansion strategies that may result in additional risks and uncertainties in our business and could present unforeseen integration obstacles or costs.
|
•
| An inability to access the debt and equity capital markets as a result of our debt obligations, credit ratings or other factors could impair our liquidity, increase our borrowing costs or otherwise adversely affect our financial position or results of operations.
|
•
| The soundness of third parties, including our clients, as well as financial, governmental and other institutions, could adversely affect us.
|
•
| Other operational risks may disrupt our businesses, result in regulatory action against us or limit our growth.
|
•
| Extensive regulation of our businesses limits our activities and results in ongoing exposure to the potential for significant penalties, including fines or limitations on our ability to conduct our businesses.
|
•
| The financial services industry faces substantial litigation and regulatory risks, and we may face damage to our professional reputation and legal liability if our services are not regarded as satisfactory or if conflicts of interest should arise.
|
•
| Expectations relating to ESG considerations expose us to potential liabilities, increased costs, reputational harm, and other adverse effects on our business.
|
•
| Employee misconduct, which is difficult to detect and deter, could harm us by impairing our ability to attract and retain clients and subjecting us to significant legal liability and reputational harm.
|
•
| A failure in or breach of our information systems or infrastructure, or those of third parties with which we do business, including as a result of cyber attacks, could disrupt our businesses, lead to reputational harm and legal liability or otherwise impact our ability to operate our business.
|
•
| Failure to maintain effective internal controls in accordance with Section 404 of the Sarbanes-Oxley Act could materially adversely affect our business.
|
•
| Uncertainty regarding the outcome of future arrangements between the European Union and the United Kingdom may adversely affect our business.
|
16
•
| In the event of a change or adverse interpretation of relevant income tax law, regulation or treaty, or a failure to qualify for treaty benefits, our overall tax rate may be substantially higher than the rate used for purposes of our consolidated financial statements.
|
•
| Tax authorities may challenge our tax computations and classifications, our transfer pricing methods and our application of related policies and methods.
|
•
| Lazard Group is a holding company and, accordingly, depends on its subsidiaries to make distributions to Lazard Group to enable it to service its obligations under its indebtedness.
|
Risks Related to Economic and Current Conditions Impacting Us and our Business
Difficult market conditions can adversely affect our business in many ways, including by reducing the volume of transactions involving our Financial Advisory business and reducing the value or performance of the assets we manage in our Asset Management business.
•Consequences of geopolitical conditions, military conflicts, wars and acts of terrorism could adversely affect our business, financial condition and results of operations.
•Fluctuations in foreign currency exchange rates could reduce our members’ equity and net income or negatively impact the portfolios of our Asset Management clients and may affect the levels of our AUM.
•Our results of operations may be affected by fluctuations in the fair value of positions held in our investment portfolios.
•Our business, financial condition and results of operations could be materially adversely affected by pandemics.
•Due to the nature of our business, financial results could differ significantly from period to period, which may make it difficult for us to achieve steady earnings growth on a quarterly basis.
•Our ability to retain and attract managing directors and other key professional employees, including maintaining compensation levels at an appropriate level, is critical to the success of our business and failure to do so may materially adversely affect our results of operations and financial position.
•The financial services industry, and all of the businesses in which we compete, are intensely competitive.
•A substantial portion of our revenue is derived from Financial Advisory fees, which are not long-term contracted sources of revenue and are subject to intense competition.
•If the number of debt defaults, bankruptcies or other factors affecting demand for our Restructuring services declines, our Restructuring revenue could suffer.
•Certain of our services are dependent on the availability of private capital for deployment in illiquid asset classes.
•Potential underwriting or deal manager activities or advisory roles on capital raises or exchange transactions may expose us to risk.
•Our investment style in our Asset Management business, including the mix of asset classes and investment strategies comprising our AUM, may underperform or generate less demand than other investment approaches, which may result in significant client or asset departures or a reduction in AUM.
•We could lose clients and suffer a decline in our Asset Management revenue and earnings if the investments we choose in our Asset Management business perform poorly, regardless of overall trends in the prices of securities.
•Because many of our Asset Management clients can remove the assets we manage on short notice, we may experience unexpected declines in revenue and profitability.
•Access to clients through intermediaries and consultants is important to our Asset Management business, and reductions in referrals from such intermediaries or consultants or poor reviews of our products or our organization by such intermediaries or consultants could materially reduce our revenue and impair our ability to attract new clients.
•Our Asset Management business relies on non-affiliated third-party service providers.
•Certain of our investments are in relatively high-risk, illiquid assets, and we may lose some or all of the principal amount of these investments or fail to realize any profits from these investments for a considerable period of time.
•We may pursue new business lines, acquisitions, joint ventures, cooperation agreements or other growth or geographic expansion strategies that may result in additional risks and uncertainties in our business and could present unforeseen integration obstacles or costs.
•An inability to access the debt and equity capital markets as a result of our debt obligations, credit ratings or other factors could impair our liquidity, increase our borrowing costs or otherwise adversely affect our financial position or results of operations.
•The soundness of third parties, including our clients, as well as financial, governmental and other institutions, could adversely affect us.
•Other operational risks may disrupt our businesses, result in regulatory action against us or limit our growth.
•Extensive regulation of our businesses limits our activities and results in ongoing exposure to the potential for significant penalties, including fines or limitations on our ability to conduct our businesses.
•The financial services industry faces substantial litigation and regulatory risks, and we may face damage to our professional reputation and legal liability if our services are not regarded as satisfactory or if conflicts of interest should arise.
•Expectations relating to ESG considerations expose us to potential liabilities, increased costs, reputational harm, and other adverse effects on our business.
•Employee misconduct, which is difficult to detect and deter, could harm us by impairing our ability to attract and retain clients and subjecting us to significant legal liability and reputational harm.
•A failure in or breach of our information systems or infrastructure, or those of third parties with which we do business, including as a result of cybersecurity incidents or threats, could disrupt our businesses, lead to reputational harm and legal liability or otherwise impact our ability to operate our business.
•Failure to maintain effective internal controls in accordance with Section 404 of the Sarbanes-Oxley Act could materially adversely affect our business.
•Uncertainty regarding the outcome of future arrangements between the European Union and the United Kingdom may adversely affect our business.
•Changes in relevant tax laws, regulations or treaties or an adverse interpretation of these items by tax authorities could negatively impact our effective tax rate.
•Tax authorities may challenge our tax computations and transfer pricing methods and our application of related policies and methods.
•Lazard Group is a holding company and, accordingly, depends on its subsidiaries to make distributions to Lazard Group to enable it to service its obligations under its indebtedness.
Risks Related to Economic and Current Conditions Impacting Us and our Business
Difficult market conditions can adversely affect our business in many ways, including by reducing the volume of transactions involving our Financial Advisory business and reducing the value or performance of the
assets we manage in our Asset Management business, which, in each case, could materially reduce our revenue or income and adversely affect our financial position.
As a financial services firm, our businesses are materially affected by conditions in the global financial markets and economic conditions throughout the world. Unfavorable economic and market conditions can adversely affect our financial performance in both the Financial Advisory and Asset Management businesses. The future market and economic climate may deteriorate because of many factors, such as a general slowing of economic growth globally or regionally, periods of disruption or volatility in securities markets, volatility and tightening of liquidity in credit markets, volatility or significant realignments in currency markets, increases in interest rates, inflation, corporate or sovereign defaults, natural disasters, pandemics, terrorism or political uncertainty or instability.
For example, revenue generated by our Financial Advisory business is directly related to the volume and value of the transactions in which we are involved. During periods of unfavorable or uncertain market or economic conditions, the volume and value of M&A transactions may decrease, thereby reducing the demand for our Financial Advisory services and increasing price competition among financial services companies seeking such engagements. Our results of operations would be adversely affected by any such reduction in the volume or value of M&A transactions. In addition, our profitability would be adversely affected due to our fixed costs and the possibility that we would be unable to reduce our variable costs without reducing revenue or within a timeframe sufficient to offset any decreases in revenue relating to changes in market and economic conditions.
Within our Financial Advisory business, we have typically seen that, during periods of economic strength and growth, our Mergers and Acquisitions practice historically has been more active and our Restructuring practice has been less active. Conversely, during periods of economic weakness and contraction, we typically have seen that our Restructuring practice has been more active and our Mergers and Acquisitions practice has been less active. As a result, revenue from our Restructuring practice has tended to correlate negatively to our revenue from our Mergers and Acquisitions practice over the course of business cycles. These trends are cyclical in nature and subject to periodic reversal. However, these trends do not cancel out the impact of economic conditions in our Financial Advisory business, which may be adversely affected by a downturn in economic conditions, leading to decreased Mergers and Acquisitions practice activity, notwithstanding improvements in our Restructuring practice.
Moreover, revenue improvements in our Mergers and Acquisitions practice in strong economic conditions could be offset in whole or in part by any related revenue declines in our Restructuring practice. While we generally have experienced a counter-cyclical relationship between our Mergers and Acquisitions practice and our Restructuring practice, this relationship may not continue in the future, and there is no certainty that strength in one practice will offset, or partially offset, weakness in the other.
17
Our Asset Management business also would be expected to generate lower revenue in a market or general economic downturn. Under our Asset Management business’s arrangements, investment advisoryasset management fees we receive typically are based on the market value of AUM. Accordingly, a decline in the prices of securities, or in specific geographic markets or sectors that constitute a significant portion of our AUM (e.g., our emerging markets strategies), would be expected to cause our revenue and income to decline by causing: | •
| the value of our AUM to decrease, which would result in lower investment advisory•the value of our AUM to decrease, which would result in lower asset management fees;
|
| •
| some of our clients to withdraw funds from our Asset Management business due to the uncertainty or volatility in the market, or in favor of investments they perceive as offering greater opportunity or lower risk, which would also result in lower investment•some of our clients to withdraw funds from our Asset Management business due to the uncertainty or volatility in the market, or in favor of investments they perceive as offering greater opportunity or lower risk, which would also result in lower asset management advisory fees;
|
| •
| some of our clients or prospective clients to hesitate in allocating assets to our Asset Management business due to the uncertainty or volatility in the market, which would also result in lower investment advisory•some of our clients or prospective clients to hesitate in allocating new assets to our Asset Management business due to the uncertainty or volatility in the market, which would also result in lower asset management fees; or
|
| • | negative absolute performance returns for some accounts that have performance-based incentive fees, which would result in a reduction of revenue from such fees. |
Our AUM declines from time to time. If our Asset Management revenue declines without a commensurate reduction in our expenses, our net income would be reduced. In addition, in the event of a market or general economic downturn, our alternative investment and private equity practices also may be impacted by a difficult fund raising environment and reduced exit opportunities in which to realize the value of their investments. Fluctuations in foreign currency exchange rates may also affect the levels of our AUM and our
investment advisoryasset management fees. See “Fluctuations in foreign currency exchange rates could reduce our members’ equity and net income or negatively impact the portfolios of our Asset Management clients and may affect the levels of our AUM” below.
Consequences of geopolitical conditions, military conflicts, wars and acts of terrorism could adversely affect our business, financial condition and results of operations.
Global financial markets and economic conditions have experienced, and may continue to experience, volatility and disruptions due to geopolitical conditions, military conflicts, wars and acts of terrorism globally, including as a result of the events themselves and the responses, such as the imposition of sanctions, by the U.S., the European Union and other countries. Geopolitical instability, conflicts and related sanctions that have been or may be imposed may have further global economic and other consequences, including reduced consumer confidence, decreased economic growth, increased inflation and higher interest rates, each of which could adversely affect our performance in both our Financial Advisory and Asset Management businesses resulting from, among other things, decreased M&A activity and downward pressure on assets under management. In addition, businesses have seen, and expect to continue to see, increased risks of cyberattacks related to geopolitical and military conflicts, including in retaliation for sanctions imposed by the United States and other countries. Such impacts could intensify other risks to our businesses and industry described herein and could otherwise have an adverse effect on our business, financial condition and results of operations.
Fluctuations in foreign currency exchange rates could reduce our members’ equity and net income or negatively impact the portfolios of our Asset Management clients and may affect the levels of our AUM.
We are exposed to fluctuations in foreign currencies, including through advisory fees paid to our Financial Advisory business and management fees paid to our Asset Management business. Our financial statements are denominated in U.S. Dollars and, for the year ended December 31,
2022,2023, we received a portion of our consolidated net revenue in other currencies, predominantly in Euros and British Pounds. In addition, we pay a portion of our expenses in such other currencies. The exchange rates of these currencies versus the U.S. Dollar affect the carrying value of our assets and liabilities as well as our revenues, expenses and net income. We do not generally hedge such foreign currency exchange rate exposure arising in our subsidiaries outside of the U.S. Fluctuations in foreign currency exchange rates may also make period to period comparisons of our results of operations difficult.
Fluctuations in foreign currency exchange rates also can impact the portfolios of our Asset Management clients. Client portfolios are invested in securities across the globe, although most portfolios are funded in a single base currency. Foreign currency exchange rate fluctuations can adversely impact investment performance for a client’s portfolio and also may affect the levels of our AUM. As our AUM include significant assets that are denominated in currencies other than U.S. Dollars, an increase in the value of the U.S. Dollar relative to non-U.S. currencies, with all other factors held constant, generally would result in a decrease in the dollar value of our AUM, which, in turn, would result in lower U.S. Dollar-denominated revenue in our Asset Management business. As of December 31,
2022,2023, AUM with foreign currency exposure represented approximately
65%64% of our total AUM.
See Note 14 of Notes to Consolidated Financial Statements for additional information regarding the impact on members’ equity from currency translation adjustments and Note 2 of Notes to Consolidated Financial Statements for additional information regarding the impact on operating results from currency transaction adjustments.
18
Our results of operations may be affected by fluctuations in the fair value of positions held in our investment portfolios.
We invest capital in various types of equity and debt securities in order to seed equity, debt and alternative investment funds and for general corporate purposes. Such investments are subject to market fluctuations due to changes in the market prices of securities, interest rates or other market factors, such as liquidity. While we may seek to hedge the market risk for some of these investments, an effective hedge may not be available and, if available, may not be fully effective. These investments are adjusted for accounting purposes to fair value at the end of each quarter, regardless of our intended holding period, with any related gains or losses reflected in our results of operations and therefore may increase the volatility of our earnings, even though such gains or losses may not be realized.
Our business, financial condition and results of operations could be materially adversely affected by
pandemics, including the ongoing COVID-19 pandemic.pandemics.
Pandemics
such as the ongoing coronavirus (“COVID-19”) pandemic, have affected, and may continue to affect, the global community and our business, financial condition and results of
operations. The nature and severity ofoperations, by affecting the
impact will continue to depend largely on future developments, including the emergence of new variants of COVID-19, availability of effective treatments and the extent to which actions have been or may be taken to contain or address its impact globally. These actions, such as restrictions on in-person meetings and travel, vaccine mandates or other similar restrictions and limitations, may be, or have been, relaxed or suspended, but may also be reinstated if other pandemics occur in the future or if the COVID-19 pandemic worsens again. The timing and impact of any such actions or reinstatements remains difficult to predict.Moreover, pandemics may adversely affect the economies in countries and regions in which our businesses operate and the global financial markets, including the global debt and equity capital markets. These economies and markets have experienced, and may continue to experience, significant volatility due to pandemics such as COVID-19.in which we operate. For example, disruptions to, and volatility in, the global financial markets as a result of a pandemic such as COVID-19 may result in a decrease in the volume and value of M&A transactions, thereby reducing the demand for our Financial Advisory services and increasing price competition among financial services companies seeking such engagements. Those same market disruptions may result in a decrease in our AUM resulting in lower investment advisoryasset management fees for our Asset Management business, may affect our ability to effect transactions for our Asset Management clients and may negatively impact the liquidity of the assets held in our client portfolios. Furthermore, any such disruptions may affect our ability to incur debt or issue equity on acceptable terms, or at all, to fund our working capital requirements, refinance existing indebtedness or make acquisitions and other investments. Counterparty and client defaults to which we may be exposed, may also become more frequent due to pandemic risks.
Our efforts to mitigate the impact of the COVID-19 pandemic have required, and future pandemics may require significant investments of time and resources across our
businesses.
For example, protective and preventative actions, including in response to recommendations or orders by governmental institutions limiting certain business or commercial activities in jurisdictions in which we operate around the world, have resulted in, and may in the future result in, reduced productivity and limit the ability of our personnel to effectively communicate with each other or clients, which may adversely impact our business, financial condition and results of operations. Furthermore, as
many employees continue to perform all or a portion of their job functions remotely on a regular basis, there can be no assurance that our measures implemented to protect the confidentiality of our and our clients’ confidential information will be adequate. Any unauthorized disclosure of such information could result in legal action, regulatory sanctions and reputational or financial harm.
See “A failure in or breach of our information systems or infrastructure, or those of third parties with which we do business, including as a result of cyber attacks, could disrupt our businesses, lead to reputational harm and legal liability or otherwise impact our ability to operate our business”.
Risks Related to Our Business and Operations
Due to the nature of our business, financial results could differ significantly from period to period, which may make it difficult for us to achieve steady earnings growth on a quarterly basis.
19
We experience significant fluctuations in quarterly revenue and profits. These fluctuations generally can be attributed to the fact that we earn a substantial portion of our Financial Advisory revenue upon the successful completion of a transaction or a restructuring, the timing of which is uncertain and is not subject to our control. As a result, our Financial Advisory business is highly dependent on market conditions and the decisions and actions of our clients, interested third parties and governmental authorities. For example, a client or counterparty could delay or terminate an acquisition transaction because of a failure to agree upon final terms, failure to obtain necessary regulatory consents or board of directors,
or acquirer’s or
stockholderstockholders’ approval, failure to secure necessary financing, adverse market conditions or because the seller’s business is experiencing unexpected operating or financial problems. Anticipated bidders for assets of a client during a restructuring transaction may not materialize or our client may not be able to restructure its operations or indebtedness, for example, due to a failure to reach agreement with its principal creditors. In addition, a bankruptcy court may deny our right to collect a success or completion fee. In these circumstances, other than in engagements where we receive retainers, we often do not receive any advisory fees other than the reimbursement of certain expenses, despite the fact that we devote resources to these transactions. Accordingly, the failure of one or more transactions to close either as anticipated or at all could cause significant fluctuations in quarterly revenue and profits and could materially adversely affect our business, financial condition and results of operations. For more information, see “Management’s Discussion and Analysis of Financial Condition and Results of Operations”.
In addition, our Asset Management revenue is particularly sensitive to fluctuations in our AUM. Asset Management fees are predominantly based on the daily, monthly or quarterly
average AUM. As a result, a reduction in AUM at the end of a day, month or quarter (as a result of market depreciation, withdrawals, fluctuations in foreign currency exchange rates or otherwise) will result in a decrease in management fees. Similarly, the timing of flows, contributions and withdrawals are often out of our control and may be inconsistent from quarter to quarter. Incentive fees are driven by investment performance (either absolute performance or relative to an established benchmark), which is directly impacted by market movements, and may therefore fluctuate from period to period.
As a result of such fluctuations, it may be difficult for us to achieve steady revenue and earnings growth on a quarterly basis.
Our ability to retain
ourand attract managing directors and other key professional employees, including maintaining compensation levels at an appropriate level, is critical to the success of our business and failure to do so may materially adversely affect our results of operations and financial position.
Our people are our most important asset. We must retain the services of our managing directors and other key professional employees, and strategically recruit and hire new talented employees, to obtain and successfully execute the Financial Advisory and Asset Management engagements that generate substantially all of our revenue.
In general, our industry continues to experience change and be subject to significant competitive pressures with respect to the retention of top talent, which makes it more difficult for us to retain professionals. Loss of key employees may occur due to perceived opportunity for promotion, compensation levels or composition of compensation, work environment, retirement or the pursuit of philanthropic, civic or similar service opportunities or other individual reasons, some of which may be beyond our control. If managing directors and other key professional employees were to retire, join an existing competitor, form a competing company or otherwise leave us, we could need to replace them, and some of our clients could eventually choose to use the services of that competitor or some other competitor instead of our services. In any such event, our financial advisory fees, asset management fees or AUM could decline. The employment arrangements, non-competition agreements and retention agreements we have or will enter into with our managing directors and other key professional employees may not sufficiently prevent our managing directors and other key professional employees from resigning from practice or competing against us. In addition, these arrangements and agreements may face enforceability challenges and have a limited duration and expire after a certain period of time. We continue to be subject to intense
competition in the financial services industry regarding the recruitment and retention of key professionals, and have experienced departures from and added to our professional ranks as a result.
Furthermore, we seek to align the interests of our managing directors and other key professional employees with that of our shareholders by awarding deferred compensation in the form of equity, and any change in our ability to grant such awards, including as a result of a shareholder vote against any of our equity incentive plans, could have
20
a negative impact on our ability to promote such alignment. Certain changes to our employee compensation arrangements may result in increased compensation and benefits expense. In addition, any changes to the mix of cash and deferred incentive compensation granted to our employees may affect certain financial measures applicable to our business, including ratios of compensation and benefits expense to revenue, and may result in the issuance of increased levels of Lazard Ltd’s common stock par value $0.01 per share, to our employees upon vesting of restricted stock units (“RSUs”), performance-based restricted stock units (“PRSUs”), restricted stock awards (“RSAs”), profits interest participation rights (“PIPRs”) or other equity-based awards in a particular year. Our compensation levels, results of operations and financial position may be significantly affected by many factors, including general economic and market conditions, our operating and financial performance, staffing levels and competitive pay conditions.
The financial services industry, and all of the businesses in which we compete, are intensely competitive.
The financial services industry is intensely competitive, and we expect it to remain so. We compete on the basis of a number of factors, including the quality of our advice, our employees and transaction execution, the range and price of our products and services, our innovation and our reputation. We have experienced intense fee competition in some of our businesses in recent years, and we believe that we may experience pricing pressures in these and other areas in the future as some of our competitors seek to obtain increased market share by reducing fees. A number of factors increase the competitive risks of our Financial Advisory and Asset Management businesses:
| • | there are relatively few barriers to entry impeding the launch of new asset management and financial advisory firms, including a relatively low cost of entering these businesses, and the successful efforts of new entrants, including major banks and other financial institutions, into our lines of business have resulted in increased competition; |
| • | other industry participants will from time to time seek to recruit our employees away from us in order to compete in our lines of business; and |
| • | certain of our practices and products are newly established and relatively small. |
In addition, many of our competitors have the ability to offer a wide range of products, from loans, deposit-taking and insurance to brokerage, asset management and investment banking services, including products and services which we do not currently offer, which may enhance their competitive position. They may also have the ability to support investment banking, including financial advisory services, with commercial banking, insurance and other financial services in an effort to gain market share, which could result in pricing pressure in our businesses.
Competitive pressure could adversely affect our ability to attract new or retain existing clients, make successful investments, retain our people or maintain AUM, any of which would adversely affect our results of operations and financial condition.
A substantial portion of our revenue is derived from Financial Advisory fees, which are not long-term contracted sources of revenue and are subject to intense competition, and declines in our Financial Advisory engagements could have a material adverse effect on our business, financial condition and results of operations.
We historically have earned a substantial portion of our revenue from advisory fees paid to us by our Financial Advisory clients, which usually are payable upon the successful completion of a particular transaction or restructuring. For example, for the year ended December 31,
2022,2023, Financial Advisory services accounted for approximately
60%55% of our consolidated net revenue. We expect that we will continue to rely on Financial Advisory fees for a substantial portion of our revenue for the foreseeable future, and a decline in our Financial Advisory engagements or the market for financial advisory services would adversely affect our business, financial condition and results of operations.
In addition, we operate in a highly competitive environment where
typically there are
typically no long-term contracted sources of revenue. Each revenue-generating engagement typically is separately awarded and negotiated.
21
Furthermore, many businesses do not routinely engage in transactions requiring our services, and as a consequence, our fee paying engagements with many clients are not likely to be predictable. We may also lose clients from time-to-time as a result of, among other reasons, the sale, merger or mergerrestructuring of a client, a change in a client’s senior management or competition
from other financial advisors and financial institutions. As a result, our engagements with clients are constantly changing, and our Financial Advisory fees could decline quickly due to the factors discussed above.
If the number of debt defaults, bankruptcies or other factors affecting demand for our Restructuring services declines, our Restructuring revenue could suffer.
We provide various restructuring and restructuring-related advice to companies in financial distress or to their creditors or other stakeholders. Historically, the fees from restructuring-related services have been a significant part of our Financial Advisory revenue. A number of factors could affect demand for these advisory services, including general economic conditions, the availability and cost of debt and equity financing and changes to laws, rules and regulations, including those that protect creditors, and the deregulation or privatization of particular industries. In such periods, our revenues from restructuring services may decline.
Certain of our services are dependent on the availability of private capital for deployment in illiquid asset classes.
We provide private fund advisory and fundraising services for alternative investment strategies, including private equity and real estate. Additionally, we may provide financial advice in connection with private placements for private companies. Our ability to find suitable engagements and earn fees in these businesses depends on the availability of private and public capital for investments in illiquid assets. The availability of such capital depends on a number of factors, including many that are outside our control, such as the general macroeconomic environment, changes in the weight investors give to alternative asset investments as part of their overall investment portfolio among asset classes, and market liquidity and volatility. Further, certain investors, such as public pension plans, may have policies prohibiting the use of placement agents by fund sponsors or managers in connection with a limited partner’s investment. To the extent private and public capital focused on illiquid investment opportunities
for our clients is limited by the foregoing or other circumstances, our fees generated by these services and, therefore, our results may be adversely affected.
Potential underwriting
or deal manager activities or advisory roles on capital raises
or exchange transactions may expose us to risk.
As part of our Financial Advisory business, we sometimes act as an underwriter in public offerings and other distributions of securities or as a financial advisor in connection with a capital raise. While not an ordinary part of our business, if we act as an underwriter, we may incur losses and be subject to reputational harm to the extent that, for any reason, the underwriting syndicate in any given transaction is unable to sell the relevant securities at the anticipated price levels. Similarly, we may incur losses and be subject to reputational harm to the extent that, for any reason, we are unable to assist a client in raising capital at anticipated price levels when we act as financial advisor. In addition, if we act as an underwriter,
deal manager or financial advisor, we may also be subject to liability for material misstatements or omissions in prospectuses and other offering documents relating to the applicable transactions. In such cases, any indemnification provisions in the applicable underwriting,
deal manager or financial advisory agreement may not be available to us or may not be sufficient to protect us against losses arising from such liability. Operational risk in connection with any offering or capital raise we participate in could arise in the form of errors, deficiencies or noncompliance and also could expose us to risk. We seek to manage the risks associated with underwriting,
deal manager and financial advisory activities through screening, internal review and diligence, but such efforts may not be effective in all cases.
Our investment style in our Asset Management business, including the mix of asset classes and investment strategies comprising our AUM, may underperform or generate less demand than other investment approaches, which may result in significant client or asset departures or a reduction in AUM.
Even when securities prices are rising generally, performance can be affected by investment style and mix of asset classes. For example, many of the equity investment strategies in our Asset Management business share a common investment orientation towards relative value investing. We believe this style tends to outperform the market in some market environments and underperform it in others. In particular, a prolonged growth environment, as we have seen over the last several years, may cause some of our investment strategies to go out of favor with some clients, advisors, consultants or third-party intermediaries. In addition, all of our investment strategies are
22
actively managed strategies which seek to outperform relative to a benchmark or generate an absolute return. Management fees for actively managed strategies tend to be higher than those charged for passively managed strategies. The perception that actively managed strategies have, on average, underperformed relative to passively managed strategies over time, combined with greater pressure on clients to acquire asset management services at lower costs, has contributed to increased trends toward passively managed investment strategies. This, in turn, may adversely affect demand for our strategies or result in fee pressure on our business overall. In combination with poor performance relative to peers, changes in personnel, challenging
market environments or other difficulties, the underperformance of our investment style may result in significant client or asset departures or a reduction in AUM.
We could lose clients and suffer a decline in our Asset Management revenue and earnings if the investments we choose in our Asset Management business perform poorly, regardless of overall trends in the prices of securities.
Investment performance affects our AUM relating to existing clients and is one of the most important factors in retaining clients and competing for new Asset Management business. Poor investment performance could impair our revenue and growth because:
| •
| existing clients might withdraw funds from our Asset Management business in favor of better performing products, which would result in lower investment advisory•existing clients might withdraw funds from our Asset Management business in favor of better performing products, which would result in lower asset management fees;
|
| • | our incentive fees, which provide us with a set percentage of returns on some alternative investment and private equity funds and other accounts, would decline; |
| • | third-party financial intermediaries, rating services, advisors or consultants may rate our products poorly, which may result in client withdrawals and reduced asset flows; or |
| • | firms with which we have strategic alliances may terminate such relationships with us, and future strategic alliances may be unavailable. |
Over certain time periods, we may have a higher concentration of assets in certain strategies. To the extent that this is the case,
underperformance, changes in investment personnel or other changes in these strategies
as well as changes in a variety of macroeconomic and other factors, may result in
a withdrawalsignificant withdrawals of
assets. If a significant amount of clients withdraw from these strategies for any reason,assets and related declines in our revenues
would decline and
our operating
results would be adversely affected.results.
Because many of our Asset Management clients can remove the assets we manage on short notice, we may experience unexpected declines in revenue and profitability.
Our investment advisory contracts are generally terminable upon very short notice. Institutional and individual clients, and firms with which we have strategic alliances, can terminate their relationship with us, reduce the aggregate amount of AUM or shift their funds to other types of accounts with different rate structures or to other
investmentasset management firms for a number of reasons, including investment performance relative to the market, prior years or other
investmentasset management firms, departures from or changes to the teams that manage our investment products, changes in prevailing interest rates and financial market performance or for no stated reason. In addition, the ability to terminate relationships may allow clients to renegotiate
for lowerreduced fees paid for asset management services.
In addition, in the U.S., as required by the Investment Company Act, each of our investment advisory contracts with the mutual funds we advise or sub-advise automatically terminates upon its “assignment.” Each of our other investment advisory contracts subject to the provisions of the Investment Advisers Act provide, as required by the Investment Advisers Act, that the contract may not be “assigned” without the consent of the customer. A sale of a sufficiently large block of shares of our voting securities or other transactions could be deemed an “assignment” in certain circumstances. An assignment, actual or constructive, would trigger these termination provisions and could adversely affect our ability to continue managing client accounts.
23
Access to clients through intermediaries and consultants is important to our Asset Management business, and reductions in referrals from such intermediaries or consultants or poor reviews of our products or our organization by such intermediaries or consultants could materially reduce our revenue and impair our ability to attract new clients.
Our ability to market our Asset Management services relies in part on receiving mandates from the client base of national and regional securities firms, banks, insurance companies, defined contribution plan administrators, investment consultants and other intermediaries. To an increasing extent, our Asset Management business uses referrals from accountants, lawyers, financial planners and other professional advisors. The inability to have this access could materially adversely affect our Asset Management business. In addition, many of these intermediaries and consultants review and evaluate our products and our organization. Poor reviews or evaluations of either the particular product or of us may result in client withdrawals or an inability to attract new clients through such intermediaries or consultants.
Our Asset Management business relies on non-affiliated third-party service providers.
Our Asset Management business has entered into service agreements with third-party service providers for client order management and the execution and settlement of client securities transactions. This business faces the risk of
operational failure of any of our clearing agents, the exchanges, clearing houses or other intermediaries we use to facilitate our securities transactions. We oversee and manage these relationships. Poor oversight and control or inferior performance or service on the part of the service provider could result in our loss of customers and violations of applicable rules and regulations. Any such failure could
also adversely affect our ability to effect transactions and to manage our exposure to risk, and thereby adversely affect our results of operations.
Certain of our investments are in relatively high-risk, illiquid assets, and we may lose some or all of the principal amount of these investments or fail to realize any profits from these investments for a considerable period of time.
We have made, and in the future may make, principal investments in public or private companies or in alternative investments (including private equity funds) established by us, and we continue to hold principal investments directly or through funds managed by certain affiliates of Lazard, including Edgewater, as well as third parties. Making principal investments is risky, and we may lose some or all of the principal amount of our investments. Certain of these types of investments may be in relatively high-risk, illiquid assets. Because it may take several years before attractive alternative investment opportunities are identified, some or all of the capital committed by us to these funds is likely to be invested in government securities, other short-term, highly-rated debt securities and money market funds that traditionally have offered investors relatively lower returns. In addition, these investments may be adjusted for accounting purposes to fair value at the end of each quarter, and any related gains or losses would affect our results of operations and could increase the volatility of our earnings, even though such fair value fluctuations may have no cash impact. It takes a substantial period of time to identify attractive alternative investment opportunities, to raise all the funds needed to make an investment and then to realize the cash value of an investment through resale. Even if an alternative investment proves to be profitable, it may be several years or longer before any profits can be realized in cash or other proceeds.
Our revenue from our private equity business is derived in part from management fees, which are calculated as a percentage of committed capital or invested capital depending on the stage of each respective fund. Transaction and advisory fees are also earned. Incentive fees are earned if investments are profitable over a specified threshold. Our ability to form new alternative investment funds is subject to a number of uncertainties, including past performance of our funds, market or economic conditions, competition from other fund managers and the ability to negotiate terms with major investors.
We may pursue new business lines, acquisitions, joint ventures, cooperation agreements or other growth or geographic expansion strategies that may result in additional risks and uncertainties in our business and could present unforeseen integration obstacles or costs.
We routinely assess our strategic position and may in the future pursue new business lines or seek acquisitions or other transactions or growth strategies to further enhance our competitive position. We have in the past pursued joint ventures and other transactions aimed at expanding the geography and scope of our operations. We expect to
24
continue to explore new business lines, acquisitions, growth strategies and partnership or strategic alliance opportunities that we believe to be attractive.
Acquisitions, growth strategies, joint ventures and new business lines involve a number of risks and present financial, managerial and operational challenges. These risks and challenges include potential disruption of our ongoing business and distraction of management, difficulty integrating personnel and financial and other systems, difficulty hiring additional management and other critical personnel and other challenges arising from the increased scope, geographic diversity and complexity of our operations.
To the extent that we pursue business opportunities outside of the U.S. and our other principal business locations, including through acquisitions, joint ventures or other geographic expansion of our existing businesses, we may become subject to political, economic, legal, operational, regulatory and other risks that are inherent in operating in a foreign country, including risks of potential price, capital and currency exchange controls, licensing requirements and other regulatory restrictions, as well as the risk of hostile actions against or affecting our business or people. Our ability to remain in compliance with local laws in a particular foreign jurisdiction could adversely affect our businesses and our reputation.
In addition, our clients and other stakeholders may react unfavorably to our acquisition, growth and joint venture strategies or new business lines; we may not realize any anticipated benefits from such actions, we may be exposed to additional liabilities of any new business line, acquired business or joint venture; we may be exposed to litigation in connection with a new business line, acquisition, growth or joint venture transaction; and we may not be able to renew on
similar terms (or at all) previously successful joint ventures or similar arrangements, any of which could materially adversely affect our business, financial position and results of operations.
An inability to access the debt and equity capital markets as a result of our debt obligations, credit ratings or other factors could impair our liquidity, increase our borrowing costs or otherwise adversely affect our financial position or results of operations.
As of December 31,
2022,2023, Lazard Group and its subsidiaries had approximately $1.7 billion in debt outstanding, of which $400 million, $300 million, $500 million and $500 million relate to Lazard Group senior notes that mature in 2025, 2027, 2028 and 2029, respectively. This debt has certain mandated payment obligations, which may constrain our ability to operate our business. If we decide to redeem or retire this debt before maturity, we may be required to pay a significant premium to do so, which may adversely impact our earnings and affect our financial position. In addition, in the future we may need to incur debt or issue equity in order to fund our working capital requirements or refinance existing indebtedness, as well as to make acquisitions and other investments. The amount of our debt obligations may impair our ability to raise debt or issue equity for financing purposes. Our access to funds also may be impaired if regulatory or governmental authorities take significant action against us or for a variety of other possible reasons. In addition, our borrowing costs and our access to the debt capital markets depend significantly on
market factors, including benchmark interest rates, and our credit ratings. These ratings are assigned by rating agencies, which may reduce or withdraw their ratings or place us on “credit watch” with negative implications at any time.
The soundness of third parties, including our clients, as well as financial, governmental and other institutions, could adversely affect us.
We have exposure to many different industries, institutions, products, counterparties and clients, and we routinely execute transactions with counterparties in the financial services industry, including brokers and dealers, commercial banks, investment banks, mutual and hedge funds and other institutions. Many of these transactions expose us to credit risk in the event of default of our counterparty or client. In addition, our credit and settlement risk may be exacerbated when the collateral held by us, if any, cannot be fully realized or is liquidated at prices not sufficient to recover the full amount of the loan, credit balance or derivative exposure due to us.
LFG and LFB offer wealth management and banking services to high net worth individuals and families. In order to support this business, LFB may extend lines of credit to such clients. These loans are fully collateralized, but collateral values could fluctuate over time. In the event that the clients are unable to repay their loans and we are unable to realize the collateral for sums that exceed the underlying amount of the loan, we may lose some or all of these amounts.
25
In addition, we have and may continue to enter into joint ventures, partnerships and invest in entities in which we share ownership or management with unaffiliated third parties. In certain circumstances, we may not have complete control over governance, financial reporting, operations, legal and regulatory compliance or other matters relating to such joint ventures, partnerships or entities. As a result, we may face certain operating, financial, legal, regulatory compliance, reputational and other risks relating to these joint ventures, partnerships and entities, including risks related to the financial strength of such third parties; the willingness of such third parties to provide adequate funding for the joint venture, partnership or entity; differing goals, strategies, priorities or objectives between us and such third parties; our inability to unilaterally implement actions, policies or procedures with respect to the joint venture, partnership or entity that we believe are favorable; legal and regulatory compliance risks relating to actions of the joint venture, partnership, entity or such third parties; the risk that the actions of such third parties could damage our brand image and reputation; and the risk that we will be unable to resolve disputes with such third parties.
Other operational risks may disrupt our businesses, result in regulatory action against us or limit our growth.
Our business is highly dependent on communications and information systems, including those of our vendors. Any failure or interruption of these systems, whether caused by fire, other natural disaster, power or telecommunications failure, geopolitical instability, act of terrorism or war, system modification or upgrade or a delay of any modification or upgrade or otherwise, could materially adversely affect our business. Although back-up systems are in place, our back-up procedures and capabilities in the event of a failure or interruption may not be adequate.
Particularly in
Aspects of our business, including our Asset Management business, we rely heavily on our financial, accounting, trading, compliance and other data processing systems and those of our third partythird-party vendors or service providers who support these functions. We expect that we will need to review whether to continue to upgrade and expand the capabilities of these systems, including legacy systems, in the future to avoid disruption of, or constraints on, our operations, and any
such system upgrades or expansions could result in significant costs to us. We may need to hire additional staff in order to continue to upgrade or expand the capabilities of our systems,
including with respect to quickly advancing technologies like generative artificial intelligence, and failure to attract and retain staff with the proper skillset could disrupt or constrain our operations. Certain investment teams within our Asset Management business,
for example, employ proprietary systems, including quantitative models, in connection with their investment processes. These systems and models are often designed and, with assistance from technology personnel, maintained by employees who are members of those investment teams. If any of the foregoing systems
failfails to operate properly or
areis disabled, including for reasons beyond our control, we could suffer
material financial loss, a disruption of our businesses, liability to clients, regulatory intervention
orand reputational damage. The inability of our systems (or those of our vendors or service providers) to accommodate an increasing volume of transactions also could constrain our ability to expand our businesses. In addition, errors resulting from these issues or from human error when conducting a trade or other transaction could expose us to significant risk.
In addition, if we were to experience a local or regional disaster or other business continuity problem, such as a pandemic or
other man-made or natural disaster, our continued success
willwould depend, in part, on the availability of our personnel and office facilities and the proper functioning of and remote accessibility to our
computer,computers, telecommunications, transaction processing and other information systems and operations, as well as those of third parties on whom we rely. Such events could lead us to experience operational challenges, and our inability to successfully recover could materially disrupt our businesses and cause material financial loss, regulatory actions, reputational harm
orand legal liability.
For additional information regarding operational risks with respect to our businesses, see “Management’s Discussion and Analysis of Financial Condition and Results of Operations—Operational Risk” below.
26
Risks Related to Legal or Regulatory Factors and Taxation
Extensive regulation of our businesses limits our activities and results in ongoing exposure to the potential for significant penalties, including fines or limitations on our ability to conduct our businesses.
The financial services industry is subject to extensive regulation. We are subject to regulation by governmental and self-regulatory organizations in the jurisdictions in which we operate around the world. Many of these regulators, including U.S. and non-U.S. government agencies and self-regulatory organizations, as well as state securities commissions in the U.S., are empowered to conduct administrative proceedings that can result in censure, fine, the issuance of cease-and-desist orders or the suspension or expulsion of a regulated entity from registration or membership. The requirements imposed by our regulators are generally designed to ensure the integrity of the financial markets and to protect customers and other third parties who deal with us and not to protect our stockholders. Consequently, these regulations often serve to limit our activities, including through net capital, customer protection and market conduct requirements.
We face the risk of significant intervention by regulatory and governmental authorities, including extended investigation and surveillance activity, adoption of costly or restrictive new regulations and judicial or administrative proceedings that may result in substantial penalties. Among other things, we could be fined or be prohibited from engaging in some of our business activities. In addition, the regulatory environment in which we operate is subject to modification and further regulation. Such changes may increase the expenses that we incur without necessarily leading to commensurate increases in revenue and income. Certain laws and regulations within the U.S. and externally include extraterritorial application that may lead to overlapping or conflicting legal and regulatory burdens with additional risks and implementation expenses. New laws or regulations or changes in the enforcement of existing laws or regulations applicable to us and our clients also may adversely affect our business, and our ability to function in this environment will depend on our ability to continually monitor and react to these changes.
The U.S. and other governments and institutions have taken actions, and may in the future take further actions, in response to geopolitical events and disruption and volatility in the global financial
markets, including actions such as the institution of sanctions against Russia and others by the U.S. and other governments and institutions as a result of the Russian invasion of Ukraine.markets. Such further actions could include expanding current or enacting new standards, requirements and rules that may be applicable to us and our subsidiaries. The effect, complexity and scope of any such expanded or new standards, requirements and rules is uncertain and could increase costs of compliance, monitoring and reporting and result in increased potential for litigation, sanctions and other liabilities, all of which could have adverse consequences to our business, financial condition and results of operations. While we continue to examine the requirements of new regulations that may become applicable to us in the U.S. and in the European Union (see “Business—Regulation” above), and previously announced actual or potential regulations that may be modified, we are not able to predict the ultimate effect on us.
The regulatory environment in which our clients operate may also impact our business. For example, changes in antitrust laws or the enforcement of antitrust laws could affect the level of M&A activity, and changes in state laws may limit investment activities of state pension plans. In addition, many tax laws and regulations have been modified, or are otherwise under review, in the U.S. and in many other jurisdictions in which we and our clients operate. Actual and proposed changes to these laws and regulations may affect the level of M&A activity, including cross-border M&A activity.
For
the asset management businesses in general, there have been a number of highly publicized cases involving fraud or other misconduct by employees of asset management firms, as well as industry-wide regulatory inquiries. These cases and inquiries have resulted in increased scrutiny from regulators, governments and investors and may result in new rules and regulations for mutual funds, hedge funds, private equity funds and their investment managers. This regulatory scrutiny and these rulemaking initiatives may result in an increase in operational and compliance costs or the risk of assessment of significant fines or penalties against our Asset Management business and may otherwise limit our ability to engage in certain activities.
Specific regulatory changes also may have a direct impact on the revenue of our Asset Management business. In addition to regulatory scrutiny and potential fines and sanctions, regulators continue to examine different aspects
27
of the asset management industry. For example, the use of “soft dollars,” where a portion of commissions paid to broker-dealers in connection with the execution of client trades also pays for research and other eligible services that are used by investment advisors, has in the last several years been reexamined by different regulatory bodies and industry participants. Although a substantial portion of the research relied on by our Asset Management business in its investment decision-making processes is generated internally by our investment personnel, external research, including external research and other eligible services traditionally paid for with soft dollars, is also important to the process. This external research includes materials provided by broker-dealers and research firms, as well as eligible data and analytics services from various sources. In connection with the implementation of the EU Markets in Financial Instruments Directive II (“MiFID II”) in 2018, our Asset Management affiliates in France, Germany and the U.K. decided to pay for broker research services from their own resources. This has reduced our ability to utilize commissions to pay for research services and other soft dollar services in certain European jurisdictions. Similar pressures may come from future changes within the asset management industry itself, which may further increase our costs related to external research services. For the year ended December 31, 2022,2023, our Asset Management business obtained research and other eligible services through third-party soft dollar arrangements, the total value of which we estimate to be approximately $24 million.
In addition, new regulations affecting the asset management business, including those regarding the management of U.S. mutual funds, hedge funds, Undertakings for the Collective Investment in Transferable Securities (“UCITS”) funds and the use of certain investment products may impact our Asset Management business and result in increased costs. For example, the European Union has adopted updated directives on the coordination of laws, regulations and administrative provisions relating to undertakings for collective investment in transferable securities (“UCITS V”) with respect to various subjects. Among other things, UCITS V establishes remunerations policies that impact the structure of compensation for certain portfolio managers and other personnel within the Company. UCITS V also establishes certain regulations governing oversight and independence of depository functions. While these rules have already been implemented, they could further impact our personnel or result in changes to our operations, resulting in increased costs to the business. In addition, many regulators around the world, including those in the U.S., continue to adopt disclosure requirements impacting the asset management business, as well as changes to the laws, rules and regulations relating to recordkeeping and reporting obligations.
Legislators and regulators around the world continue to explore changes to, and additional oversight of, the financial industry generally. The impact of the potential changes on us are uncertain and may result in an increase in costs or a reduction of revenue associated with our businesses.
See “Business—Regulation” above for a further discussion of the regulatory environment in which we conduct our businesses.
The financial services industry faces substantial litigation and regulatory risks, and we may face damage to our professional reputation and legal liability if our services are not regarded as satisfactory or if conflicts of interest should arise.
In recent years, the volume of claims and amount of damages claimed in litigation and regulatory proceedings against financial advisors has increased. The activities of our Financial Advisory business may subject us to the risk of significant legal actions by our clients and third parties, including our clients’ stockholders, under securities or other laws.
Such legal actions may include allegations relating to aiding and abetting breaches of fiduciary duties and to materially false or misleading statements or misrepresentations made in connection with securities and other transactions, including private placements. We may also be exposed to potential liability for the fairness opinions and other advice provided to participants in
corporate transactions. In our Asset Management business, we make investment decisions on behalf of our clients, which could result in substantial losses. Many of our business activities may subject us to the risk of legal actions alleging negligence, misconduct, breach of fiduciary duty or breach of contract.
In addition, we have, and may in the future continue to, sponsor or otherwise make investments in special purpose acquisition companies, or SPACs. There are potential litigation risks associated with transactions involving SPACs and uncertainty whether regulatory, tax or other authorities will implement additional or adverse policies relating to SPACs and SPAC sponsorship and investing.We increasingly confront actual and potential conflicts of interest relating to our Financial Advisory business, as well as to the fact that we have both a Financial Advisory business and an Asset Management business.
28
Additionally, our pursuit of new business lines or other growth opportunities including our sponsoring of SPACs, could result in additional actual or potential conflicts of interest. It is possible that actual, potential or perceived conflicts of interest, including with respect to the use or disclosure of confidential information, could give rise to client dissatisfaction, litigation or regulatory or governmental enforcement actions, which could have the effect of limiting our business opportunities. Appropriately identifying and managing actual or perceived conflicts of interest is complex and difficult, and our reputation could be damaged if we fail, or appear to fail, to deal appropriately with one or more potential or actual conflicts of interest. We have adopted various policies, controls and procedures to address or limit actual or perceived conflicts of interest. However, these policies, controls and procedures may not be adhered to by our employees or be effective in reducing the applicable risks. Any failure of, or failure to adhere to, these policies, controls and procedures may result in regulatory or governmental sanctions or client litigation. We may also face competition from time to time from other financial services firms that do not operate under similar policies, controls and procedures.
Our Financial Advisory engagements typically include broad indemnities from our clients and provisions designed to limit our exposure to legal claims relating to our services, but these provisions may not protect us or may not be available or adhered to in all cases. We also are subject to claims arising from disputes with employees for alleged wrongful termination, discrimination or harassment, among other things. These risks often may be difficult to assess or quantify, and their existence and magnitude often remain unknown for substantial periods of time.
We may incur significant legal expenses in defending ourselves against litigation or regulatory or governmental action. Substantial legal liability or significant regulatory or governmental action against us could materially adversely affect our business, financial condition or results of operations and cause significant reputational harm to us, which could seriously harm our business.
Expectations relating to ESG considerations expose us to potential liabilities, increased costs, reputational harm, and other adverse effects on our business.
As a financial services firm, we depend to a large extent on our relationships with our clients and our reputation for integrity and high-caliber professional services to attract and retain clients. Companies across all industries are facing increasing scrutiny from customers, clients, regulators, investors, and other stakeholders related to their ESG practices and disclosures. In addition to governments and regulators, the investment community and society at large is increasingly focused on these practices, especially as they relate to the environment and climate change, health and safety, diversity, equity, inclusion, labor conditions and human and civil rights. As a result, there is heightened demand for information related to ESG factors, such as climate change, natural resources, waste reduction, energy, human capital, and risk oversight, including with respect to our supply chain, which expands the nature, scope, and complexity of matters that we are expected to manage, assess, and report.
We also make statements about our ESG goals and initiatives through our ESG Corporate Sustainability reporting and our Asset Management Sustainable Investing perspectives, which is available on our public websites. We may not achieve our ESG goals and initiatives. In addition, some stakeholders may disagree with our goals and initiatives. Any failure, or perceived failure, to achieve our goals, further our initiatives, adhere to our public statements, comply with federal, state or international ESG laws and regulations, or meet evolving and varied stakeholder expectations and standards could result in legal and regulatory proceedings against us or client dissatisfaction and materially adversely affect our business, reputation, results of operations, financial condition and stock price.
Employee misconduct, which is difficult to detect and deter, could harm us by impairing our ability to attract and retain clients and subjecting us to significant legal liability and reputational harm.
There have been a number of highly publicized cases involving fraud or other misconduct by employees in the financial services industry generally, and we run the risk that employee misconduct could occur in our business as well. For example, misconduct by employees could involve the improper use or disclosure of confidential information, which could
result in legal action, regulatory sanctions and reputational or financial harm. Our Financial Advisory business often requires that we deal with confidences of great significance to our clients or their counterparties, improper use of which may harm our clients or our relationships with our clients. Any breach of
29
confidences as a result of employee misconduct may adversely affect our reputation, impair our ability to attract and retain Financial Advisory clients and subject us to liability. Similarly, in our Asset Management business, we have authority over client assets, and we may, from time to time, have custody of such assets. In addition, we often have discretion to trade client assets on the client’s behalf and must do so acting in the best interests of the client. As a result, we are subject to a number of obligations and standards, and the violation of those obligations or standards may adversely affect our clients and us. It is difficult to detect and deter employee misconduct, and the precautions we take to detect and prevent this activity may not be effective in all cases.
In recent years, the U.S. Department of Justice and the SEC have also devoted greater resources to the enforcement of the Foreign Corrupt Practices Act. In addition, the U.K., France and other jurisdictions have expanded the reach of their anti-bribery laws. While we have developed and implemented policies and procedures designed to ensure compliance with anti-bribery and other laws, such policies and procedures may not be effective in all instances to prevent violations. Any determination that we have violated these laws could subject us to, among other things, civil and criminal penalties, material fines, profit disgorgement, injunction against future conduct, securities litigation and reputational damage, any one of which could adversely affect our business, financial condition and results of operations.
A failure in or breach of our information systems or infrastructure, or those of third parties with which we do business, including as a result of
cyber attacks,cybersecurity incidents or threats, could disrupt our businesses, lead to reputational harm and legal liability or otherwise impact our ability to operate our business.
Our operations rely on
electronic information systems that we use for the
securecollection, processing,
storagemaintenance, use, sharing, dissemination or disposition of our and
transmission of confidential and otherour clients’ information,
involvingwhich we refer to as “information systems”, including our computer systems, hardware, software and networks
which we refer to as information systems, and
involving the information systemsthose of
third parties with which we do business.our third-party vendors and service providers. Such information systems, which frequently include “cloud”
-based- based networks and services,
have in the past and may
in the future be subject to unauthorized or fraudulent access, computer viruses or other malicious code or other threats, including “phishing”
and social engineering attempts, that are constantly evolving and that could have a
material security impact on us. There can be no assurance that we will not suffer material losses relating to
cybersecurity incidents or threats, including cyber attacks
on,that exploit vulnerabilities, or other security breaches involving our information
and payment systems, or the information systems of third parties with which we do business, despite taking protective measures to prevent such breaches. The increased use of mobile technologies and remote working technologies can heighten these and other operational risks, as can the advancing sophistication and increased frequency and severity of
cyber-security attackscybersecurity incidents and threats globally. In addition, attacks against us, our customers and our third-party vendors
canhave in the past and may in the future increase during periods of
severeheightened diplomatic or armed conflict.
If a
A successful cyber attack or other
security breach were to occurcybersecurity incident or threat against us, our customers or other third parties with which we do business, our confidential or proprietary information, or the confidential or proprietary information of our clients or their counterparties, that is stored in, or transmitted through, such information systems could
be compromisedresult in compromise or
misappropriated.misappropriation of such information. Any such cyber attack or other
security breach,cybersecurity incident or threat, or any disruption of or failure in the physical or logical infrastructure or operating systems that support such information systems or our businesses, could significantly impact our ability to operate our businesses and could result in reputational damage, legal liability, the loss of clients or business opportunities and financial losses that are either not insured against or not fully covered through any insurance maintained by us. Additionally, as geopolitical tensions rise, cyber retaliation between nation states can impact the business of those countries, which could adversely affect our business. As
cyber threats continue to multiply, become more sophisticated, frequent and severe and threaten additional aspects of our businesses, we may also be required to expend additional resources on information security and compliance costs in order to continue to modify or enhance our protective measures or to investigate and remediate any
information securitycybersecurity vulnerabilities or other exposures.
Additionally, certain of our third partythird-party vendors or service providers, which may process or otherwise have access to confidential or sensitive data, may take, have taken or may take further preventative or protective actions in connection with the COVID-19 pandemic, including institutinginstituted policies requiringallowing their respective employees who are capable of performing their functions remotely to do so and implementing or expanding back-up procedures and capabilities, and may be experiencing a growing demand for their services. As such, such vendors and service providers may be more susceptible to interruptions or confidentiality or security breaches than in prior periods. Any failure of or interruption to their systems or any back-up procedures and capabilities as a result of such actions or such growth in demand could materially adversely affect our business, financial condition and results of operations. See “Other operational risks may disrupt our businesses, result in regulatory action against us or limit our growth.””30
Similarly, due to the
unprecedentedsignificant number of employees frequently deploying the remote working capabilities of our information systems, including on home networks or through increased use of mobile technologies, we face a heightened risk of operational interruptions and security breaches involving such systems. Additionally, such home and mobile technology resources could be more susceptible to interruptions and security breaches than our dedicated business resources. There can be no assurance that protective measures and policies we have instituted in an effort to reduce the likelihood and severity of such interruptions and breaches, including as a result of
cyber attacks,cybersecurity incidents or threats, will be adequate.
Failure to maintain effective internal controls in accordance with Section 404 of the Sarbanes-Oxley Act could materially adversely affect our business.
We have documented and tested our internal control procedures in order to satisfy the requirements of Section 404 of the Sarbanes-Oxley Act, which requires annual management assessments of the effectiveness of our internal controls over financial reporting and a report by our independent auditors regarding our internal control over financial reporting. We are in compliance with Section 404 of the Sarbanes-Oxley Act as of December 31,
2022.2023. However, if we fail to maintain the adequacy of our internal controls, as such standards are modified, supplemented or amended from time to time, we may not be able to ensure that we can conclude on an ongoing basis that we have effective internal controls over financial reporting in accordance with Section 404 of the Sarbanes-Oxley Act. Failure to maintain an effective internal control environment could materially adversely affect our business.
Uncertainty regarding the outcome of future arrangements between the European Union and the U. K. may adversely affect our business.
The Company has a significant presence in the U.K. and many European Union countries. The U.K. left the European Union on January 31, 2020. Prior to that date, the U.K. adopted numerous European Union laws and regulations into U.K. domestic legislation in order to ensure continuity. The “Retained EU
Law” bill announced by the U.K. GovernmentLaw (Revocation and Reform) Act 2023”, which came into force on
September 22, 2022, to the extent passed into U.K. law by the U.K. Parliament, will result in the disapplication ofJanuary 1, 2024, revoked certain European Union legacy laws
by the end of 2023 unless(“retained EU laws”) and gave the U.K. Government
has legislatedthe power to
retainamend, repeal or
replace them.restate the remaining retained EU laws. There is currently no certainty on which
European Union legacyretained EU laws and regulations will be changed going forward and the U.K. may diverge from these laws and regulations and may decide not to adopt rules that correspond to future European Union legislation. To the extent that different regulatory systems impose overlapping or inconsistent requirements on the conduct of the Company’s business, the Company may face additional complexity and costs in its compliance efforts, as well as potential increased costs to the extent the Company is required to make further adjustments to how the Company operates its business in the U.K. and/or the European Union.
In the event of a change
Changes in relevant tax laws, regulations or
treaties or an adverse interpretation of
relevant incomethese items could negatively impact our effective tax
law, regulation or treaty, or a failure to qualify for treaty benefits, our overall tax rate may be substantially higher than the rate used for purposes of our consolidated financial statements.rate.
We are a multinational company subject to tax in multiple U.S. and foreign jurisdictions. Our effective tax rate is based upon the application of currently
applicableenacted income tax laws, regulations and treaties, and current judicial and administrative interpretations of those income tax laws, regulations and
treaties and upon our non U.S. subsidiaries’ ability to qualify for benefits under those treaties. Those income tax laws, regulations and treaties, and the administrative and judicial interpretations of them, are subject to change at any time, and any such change may be retroactive.
In the United States,addition, recent or future changes to tax laws, regulations and tax treaties may have an adverse impact on us. For example, the Tax Cuts and Jobs Act of 2017 includes several international provisions applicable to us. Theseus and the recently enacted Inflation Reduction Act imposes, among other items, an alternative minimum “book” tax on certain large corporations and a new 1% excise tax on net stock repurchases made by certain publicly traded corporations after December 31, 2022. Some guidance has been issued on the application of the alternative minimum book tax and the excise tax but several aspects of the Tax Cuts and Jobs Act and the Inflation Reduction Act remain uncertain and the Treasury regulations implementing the provisions are forthcoming. All of these provisions are complex and could adversely impact our effective tax rate in future years.Enacted on August 16, 2022, the Inflation Reduction Act imposes two new types of tax, effective January 1, 2023: a 15% corporate alternative minimum tax (“CAMT”) on adjusted financial statement income (“AFSI”) of applicable corporations with three-year average AFSIs above specified thresholds and a 1% excise tax on corporate stock repurchases. Interim guidance on the application of the CAMT and the excise tax was issued on December 27, 2022, but several aspects of the Inflation Reduction Act remain uncertain and the Treasury regulations implementing its provisions are forthcoming.
31
Multiple levels of government, foreign legislatures and international organizations, such as the Organization for Economic Co-operationCooperation and Development (“OECD”) and the European Union, are increasingly focused on tax reform and have proposed and implemented tax legislation and regulations that could affect the taxation of multinational companies. For example, the enactment of all or part of the recommendations set forth or that may be introduced in the OECD project on Base Erosion and Profit Shifting by tax authorities in the countries in which we operate could unfavorably impact our overall tax rate. Any implementationAdditionally, the OECD continues to advance proposals for modernizing international tax rules, including the introduction of or changes to, any such laws, regulationsa 15% global minimum tax and treaties thatits Base Erosion and Profit Shifting project, which is focused on several
issues, including the shifting of profits among affiliated entities in different tax jurisdictions. Each, if implemented, could unfavorably impact
us could materially adversely affect our
business, financial condition or results of operations.overall tax rate.
Tax authorities may challenge our tax computations and classifications, our transfer pricing methods and our application of related policies and methods.
Our tax returns are subject to audit by
U.S. federal,
state, local and foreign tax authorities. These authorities may successfully challenge certain tax positions or deductions taken by our subsidiaries. For example, tax authorities may contest intercompany allocations of fee income, management charges or interest charges among affiliates in different tax jurisdictions. While we believe that we have provided the appropriate required reserves,
(see Note 2 of Notes to Consolidated Financial Statements), it is possible that a tax authority may disagree with all, or a portion, of the tax benefits claimed. If a tax authority were to successfully challenge our positions, it could result in significant additional tax costs.
In addition, there are additional transfer pricing and standardized country-by-country reporting requirements being implemented. Additional information from country-by-country reporting, certain local information-sharing arrangements and other documentation held by tax authorities is expected to be subject to greater information-sharing arrangements, and any challenges from tax authorities reviewing such information could adversely impact our overall tax obligations or our business, financial condition or results of operations.
Risks Relating to Our Capital Structure
Lazard Group is a holding company and therefore depends on its subsidiaries to make distributions to Lazard Group to enable it to service its obligations under its indebtedness.
Lazard Group depends on its subsidiaries, which conduct the operations of its businesses, for distributions, dividends and other payments to generate the funds necessary to meet its financial obligations, including payments of principal and interest on its indebtedness. However, none of Lazard Group’s subsidiaries is obligated to make funds available to it for servicing such financial obligations, and the group of entities that constitute Lazard Group’s subsidiaries may change over time. The earnings from, or other available assets of, Lazard Group’s subsidiaries may not be sufficient to pay dividends or make distributions or loans to enable Lazard Group to make payments with respect to its financial obligations when such payments are due. In addition, even if such earnings were sufficient, the agreements governing the current and future obligations of Lazard Group’s subsidiaries, regulatory requirements, including regulatory capital requirements, with respect to our broker-dealer and other regulated subsidiaries, foreign exchange controls and a variety of other factors may impede our subsidiaries’ ability to provide Lazard Group with sufficient dividends, distributions or loans to fund its financial obligations, when due.
SPECIAL NOTE REGARDING FORWARD-LOOKING STATEMENTS
We have made statements under the captions “Business,” “Risk Factors,” “Management’s Discussion and Analysis of Financial Condition and Results of Operations” and in other sections of this Form 10-K that are forward-looking statements. In some cases, you can identify these statements by forward-looking words such as “may,” “might,” “will,” “should,” “could,” “would,” “expect,” “plan,” “anticipate,” “believe,” “estimate,” “predict,” “potential,” “target,” “goal” or “continue,” and the negative of these terms and other comparable terminology. These forward-looking statements, which are subject to known and unknown risks, uncertainties and assumptions about us, may include projections of our future financial performance based on our growth strategies, business plans and initiatives and anticipated trends in our business. These statements are only predictions based on our current expectations and projections about future events. There are important factors that could cause our actual results, level of activity, performance or achievements to differ materially from the results, level of activity, performance or achievements expressed or implied by the forward-looking statements. These factors include, but are not limited to, the numerous risks and uncertainties outlined in “Risk Factors,” including the following:
| •
| a decline in general economic conditions or the global or regional financial markets;
|
| •a decline in general economic conditions or the global or regional financial markets;• | a decline in our revenues, for example due to a decline in overall M&A activity, our share of the M&A market or our AUM;
|
| •a decline in our revenues, for example due to a decline in overall M&A activity, our share of the M&A market or our AUM;• | losses caused by financial or other problems experienced by third parties;
|
| •losses caused by financial or other problems experienced by third parties;• | losses due to unidentified or unanticipated risks;
|
| •losses due to unidentified or unanticipated risks;• | a lack of liquidity, i.e., ready access to funds, for use in our businesses; and
|
| •a lack of liquidity, i.e., ready access to funds, for use in our businesses;• | competitive pressure on our businesses and on our ability to retain and attract employees at current compensation levels.
|
•competitive pressure on our businesses and on our ability to retain and attract employees at current compensation levels; and
•changes in relevant tax laws, regulations or treaties or an adverse interpretation of these items.
These risks and uncertainties are not exhaustive. Other sections of this Form 10-K describe additional factors that could adversely affect our business and financial performance. Moreover, we operate in a very competitive and rapidly changing environment. New risks and uncertainties emerge from time to time, and it is not possible for our management to predict all risks and uncertainties, nor can management assess the impact of all factors on our business or the extent to which any factor, or combination of factors, may cause actual results to differ materially from those contained in any forward-looking statements.
Although we believe the
expectationsstatements reflected in the forward-looking statements are reasonable, we cannot guarantee future results, level of activity, performance,
achievements or
achievements.events. Moreover, neither we nor any other person assumes responsibility for the accuracy or completeness of any of these forward-looking statements. You should not rely upon forward-looking statements as predictions of future events. We are under no duty to update any of these forward-looking statements after the date of this Form 10-K to conform our prior statements to actual results or revised expectations and we do not intend to do so.
Forward-looking statements include, but are not limited to, statements about:
| •
| financial goals, including ratios of compensation and benefits expense to operating revenue;
|
| •financial goals, including ratios of compensation and benefits expense to operating revenue;• | ability to deploy surplus cash through distributions to members, purchases of common stock and debt repurchases;
|
| •ability to deploy surplus cash through distributions to members, purchases of common stock and debt repurchases;• | possible or assumed future results of operations and operating cash flows;
|
| •possible or assumed future results of operations and operating cash flows;• | strategies and investment policies;
|
| •strategies and investment policies;• | financing plans and the availability of short-term borrowing;
|
| •financing plans and the availability of short-term borrowing;• | competitive position;
|
| •competitive position;• | future acquisitions, including the consideration to be paid and the timing of consummation;
|
| •future acquisitions, including the consideration to be paid and the timing of consummation;• | potential growth opportunities available to our businesses;
|
•potential growth opportunities available to our businesses;
| • | potential impact of investments in our technology infrastructure and data science capabilities; |
| • | recruitment and retention of our managing directors and employees; |
| •
| potential levels of compensation expense, including awarded compensation and benefits expense and adjusted compensation and benefits expense, and non-compensation expense;
|
| •potential levels of compensation expense, including adjusted compensation and benefits expense, and non-compensation expense;• | potential operating performance, achievements, productivity improvements, efficiency and cost reduction efforts;
|
| •potential operating performance, achievements, productivity improvements, efficiency and cost reduction efforts;• | statements regarding ESG goals and initiatives;
|
| •statements regarding ESG goals and initiatives;• | likelihood of success and impact of litigation;
|
| •likelihood of success and impact of litigation;• | expected tax rates, including effective tax rates;
|
| •
| changes in interest and•expected tax rates, including effective tax rates;
|
| •changes in interest and tax rates;• | availability of certain tax benefits, including certain potential deductions;
|
| •availability of certain tax benefits, including certain potential deductions;• | potential impact of certain events or circumstances on our financial statements and operations;
|
| •potential impact of certain events or circumstances on our financial statements and operations;• | changes in foreign currency exchange rates;
|
| •changes in foreign currency exchange rates;• | expectations with respect to the economy, the securities markets, the market for mergers, acquisitions, restructuring and other financial advisory activity, the market for asset management activity and other macroeconomic, regional and industry trends;
|
| •expectations with respect to the economy, the securities markets, the market for mergers, acquisitions, restructuring and other financial advisory activity, the market for asset management activity and other macroeconomic, regional and industry trends;• | effects of competition on our business; and
|
| •effects of competition on our business; and •impact of new or future legislation and regulation, including tax laws and regulations, on our business. •
| impact of new or future legislation and regulation, including tax laws and regulations, on our business.
|
The Company is committed to providing timely and accurate information to the investing public, consistent with our legal and regulatory obligations. To that end, the Company usesLazard and its website, its twitter account (twitter.com/Lazard)operating companies use their websites, and other social media sites to convey information about ourtheir businesses, including the anticipated release of quarterly financial results, quarterly financial, statistical and business-related information, and the posting of updates of AUM in our Asset Management business.various mutual funds, hedge funds and other investment products managed by LAM LLC and LFG. Investors can link to Lazard, Ltd,Inc., Lazard Group and their operating company websites through http://www.lazard.com. Our websites and social media sites and the information contained therein or connected thereto shall not be deemed to be incorporated into this Form 10-K.
Item 1B.
Unresolved Unresolved Staff Comments
There are no unresolved written comments that were received from the SEC staff 180 days or more before December 31,
20222023 relating to our periodic or current reports under the Exchange Act.
Item 1C. Cybersecurity
Our business is highly dependent on electronic information resources used for the collection, processing, maintenance, use, sharing, dissemination, or disposition of our and our clients’ information, which we refer to as “information systems”, including our computer systems, hardware, software and networks and those of our third-party vendors and service providers. Our operations rely on the secure processing, storage and transmission of confidential and other information by our information systems and those of third parties.
Lazard maintains a formal, robust cybersecurity and information security program that is aligned with the National Institute of Standards and Technology Cybersecurity Framework (“CSF”) and integrated into our overall risk management process.Our Information Security Program, Policies and Standards are also designed to comply with the financial regulations and cybersecurity laws in the jurisdictions in which we operate. By focusing on the following four interconnected pillars, we aim to reduce the impact of cybersecurity incidents, safeguard our digital assets and foster a proactive and comprehensive approach to cybersecurity within our organization.
•Risk assessments and mitigation strategies
◦Conduct regular risk assessments to identify and prioritize critical assets and vulnerabilities, both internally and with respect to third-party risks.
◦Develop and implement appropriate mitigation strategies based on risk assessments.
◦Monitor and evaluate the effectiveness of risk mitigation measures.
•Professional cybersecurity staff
◦Retain and recruit skilled cybersecurity professionals.
◦Provide regular training and development opportunities.
◦Foster collaboration and knowledge sharing among cybersecurity team members.
•Security-aware organizational culture
◦Maintain policies and procedures for reporting and responding to cybersecurity incidents.
◦Empower employees to take ownership of their cybersecurity responsibilities.
◦Promote a security-aware culture throughout the organization through regular training and awareness programs.
•Security technology
◦Implement and maintain robust cybersecurity technologies, including advanced threat detection, prevention and response tools.
◦Regularly evaluate and update our suite of cybersecurity technology to address emerging threats and vulnerabilities.
◦Integrate cybersecurity technologies with other systems and processes.
Third-Party Monitoring and External Reviews
As noted above, our business regularly uses and relies on third-party information systems and services to process, store and transmit confidential and other information. To support our cybersecurity oversight of third-party information technology providers, we have integrated automated processes to manage third-party cloud security. We also use an enterprise-wide third-party technology provider to assist in our identification and assessment of cybersecurity risks to the Company presented by third parties, and our contracts are vetted by our internal legal and compliance departments as part of a process designed to ensure that we are provided the right to audit and test the security and quality of each of our vendors. As part of our screening and evaluation processes, we conduct due diligence on our potential vendors, as well as regular assessments of current vendors, regarding compliance with law (including financial regulations, sanctions regimes and data privacy regulations) and cybersecurity standards, including background checks and system tests.
Our Chief Information Security Officer (“CISO”) regularly engages independent third parties to assess the performance of our cybersecurity risk management systems and procedures and to help test and identify cybersecurity risks to the Company. Annually, we engage an independent third-party to perform a comprehensive review of our cybersecurity programs, with the aim of ensuring alignment with the current version of the CSF. In addition, we engage several other third parties at regular intervals for targeted assessments of specific cybersecurity risk management systems, tools, vendors and processes. Among other things, tests include simulations of communications shared with affected stakeholders on security events and identification of vulnerabilities. These third-party audits and assessments are used by management to review, update and improve our cybersecurity risk management systems and identify vulnerabilities. Results and recommendations are reported to our CISO, who reports to our General Counsel. Material findings are presented to the Global Risk Committee (“GRC”), Audit Committee and the full Board as discussed below.
Cybersecurity Management Team and Board Oversight
Lazard’s cybersecurity program, which includes information security, is the primary responsibility of our CISO, who oversees our global information security strategy and program and is supported by our Information Technology and Information Security departments. The Company’s current CISO has held the position since 2015 and has been working in technology risk management since 1991. The CISO holds a bachelor’s degree from New York Institute of Technology and is an accredited Certified Information Systems Security Professional. Our CISO leads our Cybersecurity Incident Handling Team (“CSIHT”), to which cybersecurity threats and cybersecurity incidents are reported.The CSIHT manages the Company’s response to cybersecurity threats and cybersecurity incidents, including the prevention, detection, analysis, containment, eradication and recovery thereof.
The CISO reports monthly to the GRC, which includes our Chief Executive Officer (“CEO”), Chief Financial Officer (“CFO”) and General Counsel, among other members of senior management, regarding cybersecurity incidents from the preceding month.
Our Internal Audit department regularly assesses and reports to the Audit Committee on the effectiveness of our cybersecurity and information technology controls. Our Audit Committee reviews the Company’s cybersecurity risk profile and risk management strategies at regular intervals. Our CFO reviews with the Audit Committee categories of risk the Company faces, including cybersecurity risks, as well as the likelihood of the occurrence of cybersecurity risks, the potential impact of those risks and the steps management has taken to monitor, mitigate and control such risks. In addition, our CISO reports at least annually to the Board, and at least quarterly to the Board’s Audit Committee, with respect to cybersecurity risks, including those identified through review of our business, of rising threats in the industry, and of the current state of Lazard’s cybersecurity program. Updates on cybersecurity risks are reviewed at regular meetings of the Audit Committee and reported to the full Board.
Incident Response and Assessment Policies and Procedures
Lazard has implemented policies and procedures to protect the firm from any interruptions to the availability of our data and our systems and to protect the firm’s and our clients’ data from intentional and unintentional disclosure, including disclosure arising from a range of cybersecurity threats. These policies and procedures outline actions to be taken after identifying suspected cybersecurity threats and cybersecurity incidents and designate the persons responsible for managing those actions.
Our disclosure controls and procedures provide for the CSIHT to report high severity cybersecurity incidents to an Assessment Committee, consisting of our CFO, CISO and General Counsel, among others, for an assessment of materiality. The Assessment Committee in consultation with third-party experts, as warranted, makes the incident materiality determination consistent with SEC guidance and by considering relevant quantitative and qualitative factors, including without limitation:
•the probability of an adverse outcome;
•the potential impact on financial results;
•the likelihood of litigation or regulatory investigations; and
•the potential impact on the Company’s reputation and competitiveness.
A determination that a cybersecurity incident has, or is reasonably likely to have, a material impact on the Company is reported by the Assessment Committee to the CEO and the Board’s Audit Committee without delay. The Assessment Committee also provides a summary of all incidents that are determined to be immaterial to the Board’s Audit Committee at the next scheduled meeting.
For additional information regarding how cybersecurity threats or incidents are reasonably likely to materially affect our business strategy, results of operations or financial condition, see “Risk Factors—A failure in or breach of our information systems or infrastructure, or those of third parties with which we do business, including as a result of cybersecurity incidents or threats, could disrupt our businesses, lead to reputational harm and legal liability or otherwise impact our ability to operate our business” and “Risk Factors—Other operational risks may disrupt our businesses, result in regulatory action against us or limit our growth.”
Item 2. Properties
Lazard has offices located around the world. The following table lists the principal properties used for the Lazard organization as of December 31,
2022.2023. As a general matter, one or both of our Financial Advisory and Asset Management segments (as well as our Corporate segment) uses the following properties.
| | | | | | | | |
| Location | | Square Footage
| | Offices |
New York City | | 438,870 square feet of
leased space
| | Principal office located at 30 Rockefeller Plaza |
Paris | | 187,499 square feet of
leased space
| | Principal offices located at 175 Boulevard Haussmann and 25 Rue de Courcelles |
London | | 70,889 square feet of
leased space
| | Principal office located at 50 Stratton Street |
Item 3. Legal Proceedings
The Company is involved from time to time in judicial, governmental, regulatory and arbitration proceedings and inquiries concerning matters arising in connection with the conduct of our businesses, including proceedings initiated by former employees alleging wrongful termination. The Company reviews such matters on a case-by-case basis and establishes any required accrual if a loss is probable and the amount of such loss can be reasonably estimated. The Company may experience significant variation in its revenue and earnings on an annual basis. Accordingly, the results of any pending matter or matters could be significant when compared to the Company’s earnings in any particular year. The Company believes, however, based on currently available information, that the results of any pending matters, in the aggregate, will not have a material effect on its business or financial condition.
Item 4.
| Mine Safety Disclosures
|
Item 4. Mine Safety Disclosures
Not
applicable.applicable
Part II
Item 5.
| Market for Registrant’s Common Equity, Related Stockholder Matters and Issuer Purchases of Equity Securities
|
Item 5. Market for Registrant’s Common Equity, Related Stockholder Matters and Issuer Purchases of Equity Securities
As of December 31,
2022,2023, all of our common membership interests are held by indirect wholly-owned subsidiaries of Lazard,
Ltd.Inc. Our co-managing member interests are held by two indirect wholly-owned subsidiaries of Lazard,
Ltd,Inc., and our profit participation interests are held by various managing directors. There are no public trading markets for any of these interests.
As of December 31,
2022,2023, pursuant to provisions of its Amended and Restated Operating Agreement, Lazard Group allocates and distributes to its members a substantial portion of its distributable profits in installments as soon as practicable after the end of each fiscal year. Such installment distributions usually begin in February. Such distributions primarily represent amounts necessary to fund (i) any dividends Lazard,
LtdInc. may declare on its
Class A common stock and (ii) tax distributions in respect of income taxes that Lazard,
Ltd’sInc.’s subsidiaries incur. During the years ended December 31,
2023, 2022
2021 and
2020,2021, Lazard Group distributed approximately
$162.0 million, $228.0 million,
$233.2 million, and
$201.0$233.2 million, respectively, to the subsidiaries of Lazard,
Ltd.
Inc.
Item 7.
| Management’s Discussion and Analysis of Financial Condition and Results of Operations
|
Item 6. [Reserved]
Item 7. Management’s Discussion and Analysis of Financial Condition and Results of Operations
The following discussion should be read in conjunction with Lazard Group’s consolidated financial statements and the related notes included elsewhere in this Annual Report on Form 10-K (this “Form 10-K”). This discussion contains forward-looking statements that are subject to known and unknown risks and uncertainties. Actual results and the timing of events may differ significantly from those expressed or implied in such forward-looking statements due to a number of factors, including those set forth in the sections entitled “Risk Factors” and “Special Note Regarding Forward-Looking Statements” and elsewhere in this Form 10-K.
Lazard, one of the world’s preeminent financial advisory and asset management firms, operates
from 43 cities across 26 countries in North and South America, Europe,
the Middle East, Asia and Australia. With origins dating to 1848, we have long specialized in crafting solutions to the complex financial and strategic challenges of a diverse set of clients around the world, including corporations, governments, institutions, partnerships and individuals.
Our primary business purpose is to serve our clients. Our deep roots in business centers around the world form a global network of relationships with key decision-makers in corporations, governments and investing institutions. This network is both a competitive strength and a powerful resource for Lazard and our clients. As a firm that competes on the quality of our advice, we have two fundamental assets: our people and our reputation.
We operate in cyclical businesses across multiple geographies, industries and asset classes. In recent years, we have expanded our geographic reach, bolstered our industry expertise and continued to build in growth areas. Companies, government bodies and investors seek independent advice with a geographic perspective, deep understanding of capital structure, informed research and knowledge of global, regional and local economic conditions. We believe that our business model as an independent advisor will continue to create opportunities for us to attract new clients and key personnel.
Our principal sources of revenue are derived from activities in the following business segments:
| •
| Financial Advisory, which offers corporate, partnership, institutional, government, sovereign and individual clients across the globe a wide array of financial advisory services regarding strategic and mergers and acquisitions (“M&A”) advisory, capital markets advisory, shareholder advisory, restructuring and capital solutions, sovereign advisory, geopolitical advisory, capital raising and placement, and other strategic advisory matters, and
|
| •Financial Advisory, which offers corporate, partnership, institutional, government, sovereign and individual clients across the globe a wide array of financial advisory services regarding strategic and mergers and acquisitions (“M&A”) advisory, capital markets advisory, shareholder advisory, restructuring and liability management, sovereign advisory, geopolitical advisory and other strategic advisory matters and capital raising and placement, and• | Asset Management, which offers a broad range of global investment solutions and investment and wealth management services in equity and fixed income strategies, asset allocation strategies, alternative investments and private equity funds to corporations, public funds, sovereign entities, endowments and foundations, labor funds, financial intermediaries and private clients.
|
•Asset Management, which offers a broad range of global investment solutions and investment and wealth management services in equity and fixed income strategies, asset allocation strategies, alternative investments and private equity funds to corporations, public funds, sovereign entities, endowments and foundations, labor funds, financial intermediaries and private clients.
In addition, we record selected other activities in our Corporate segment, including management of cash, investments,
deferred tax assets, outstanding indebtedness
certain contingent obligations and certain assets and liabilities associated with
(i) Lazard Group’s Paris-based subsidiary, Lazard Frères Banque SA (“LFB”), and (ii) a special purpose acquisition company
that was sponsored by an affiliate of the Company, Lazard Growth Acquisition Corp. I (“LGAC”).
Our consolidated net revenue was derived from the following segments:
| | Year Ended December 31, | |
| | 2022 | | | 2021 | | | 2020 | |
Financial Advisory | | | 60 | % | | | 56 | % | | | 55 | % |
Asset Management | | | 44 | | | | 44 | | | | 46 | |
Corporate | | | (4 | ) | | | - | | | | (1 | ) |
Total | | | 100 | % | | | 100 | % | | | 100 | % |
We also invest our own capital from time to time, generally alongside capital of qualified institutional and individual investors in alternative investments or private equity investments, and make investments to seed our Asset Management strategies.
Our consolidated net revenue was derived from the following segments:
| | | | | | | | | | | | | | | | | |
| Year Ended December 31, |
| 2023 | | 2022 | | 2021 |
| Financial Advisory | 55 | % | | 60 | % | | 56 | % |
| Asset Management | 46 | | | 44 | | | 44 | |
| Corporate | (1) | | | (4) | | | – | |
| Total | 100 | % | | 100 | % | | 100 | % |
Business Environment and Outlook
Economic and global financial market conditions can materially affect our financial performance. As described above, our principal sources of revenue are derived from activities in our Financial Advisory and Asset Management business segments. Our Financial Advisory revenues are primarily dependent on the successful completion of merger, acquisition,
sale, restructuring, capital raising or similar transactions, and our Asset Management revenues are primarily driven by the levels of assets under management (“AUM”). Weak
global economic and
global financial market conditions can result in a challenging business environment for M&A and capital-raising activity as well as our Asset Management business, but may provide opportunities for our restructuring business.
The global macroeconomic environment
remains uncertain, characterized by global inflation at multi-decade highs, risingis improving and capital market trends are positive. At the same time, there is a high degree of geopolitical uncertainty that continues to be top of mind for decision-makers. In our Financial Advisory business, we are seeing M&A activity strengthen while financing, valuation, and regulatory headwinds abate. In our Asset Management business, positive market sentiment and a widening dispersion of returns across asset classes is leading to increased investor interest
rates, and turbulent capital markets.across a range of actively managed strategies.
Our outlook with respect to our Financial Advisory and Asset Management businesses is described below.
| •
| Financial Advisory—The global scale and breadth of our Financial Advisory business enables us to advise on a wide range of strategic and restructuring transactions across a variety of industries. In addition, we continue to invest in our Financial Advisory business by selectively hiring talented senior professionals in an effort to enhance our capabilities and sector expertise in M&A, capital structure and public and private capital markets.
|
| •Financial Advisory—Despite M&A announcements in 2023 being at their lowest levels in a decade, we remained actively engaged with our clients. The global scale and breadth of our Financial Advisory business, with particular strength in both the U.S. and Europe, enables us to advise on a wide range of strategic and restructuring transactions across a variety of industries. In 2024, we could see increased M&A activity occurring alongside greater restructuring activity as rates remain high and debt maturities approach. In addition, we continue to invest in our Financial Advisory business by selectively hiring talented senior professionals in an effort to enhance our capabilities and sector expertise in M&A, capital structure, restructuring, and public and private capital markets.• | Asset Management—Given our diversified investment platform and our ability to provide investment solutions for a global mix of clients, we believe we are positioned to benefit from opportunities across the asset management industry despite uncertain global macroeconomic conditions. We are continually developing new investment strategies that extend our existing platforms and assessing potential product acquisitions or other inorganic growth opportunities.
|
•Asset Management—Given our diversified, actively managed investment platform and our ability to provide investment solutions for a global mix of clients, we believe we are positioned to benefit from opportunities across the asset management industry. We are continually developing new investment strategies that extend our existing platforms and assessing potential product acquisitions or other inorganic growth opportunities.
We operate in a very competitive and rapidly changing environment. New risks and uncertainties emerge continuously, and it is not possible for our management to predict all risks and uncertainties, nor can we assess the impact of all potentially applicable factors on our business or the extent to which any factor, or combination of factors, may cause actual results to differ materially from those contained in any forward-looking statements. See Item 1A, “Risk Factors” in this Form 10-K. Furthermore, net income and revenue in any period may not be indicative of full-year results or the results of any other period and may vary significantly from year to year and quarter to quarter.
Overall, we continue to focus on the development of our business, including the generation of
stable revenue growth, earnings growth and member returns, the evaluation of potential growth opportunities, the investment in new technology to support the development of existing and new business opportunities, the prudent management of our costs and expenses, the efficient use of our assets and the return of equity to our members.
Certain market data with respect to our Financial Advisory and Asset Management businesses is included below.
As reflected in the following table, which sets forth global M&A industry statistics, the value and number of all completed transactions, including the subset of completed transactions involving values greater than $500 million, decreased in
20222023 as compared to
2021.2022. With respect to announced M&A transactions, the value and number of all transactions, including the subset of announced transactions involving values greater than $500 million, decreased in
20222023 as compared to
2021.2022. | | Year Ended December 31, | |
| | 2022 | | | 2021 | | | % Incr / (Decr) | |
| | ($ in billions) | |
| Year Ended December 31, | | | Year Ended December 31, |
| 2023 | | | 2023 | | 2022 | | %
Incr / (Decr) |
| ($ in billions) | | | ($ in billions) |
Completed M&A Transactions: | | | | | | | | | | | | |
All deals: | | | | | | | | | | | | |
| All deals: | |
| All deals: | |
| Value | |
| Value | |
Value | | $ | 3,954 | | | $ | 5,492 | | | | (28 | )% | $ | 2,915 | | | $ | | $ | 4,285 | | | (32) | | (32) | % |
Number | | | 35,932 | | | | 43,284 | | | | (17 | )% | Number | 33,219 | | 42,993 | | (23) | % |
Deals Greater than $500 million: | | | | | | | | | | | | |
Value | | $ | 3,057 | | | $ | 4,239 | | | | (28 | )% |
| Value | |
| Value | | $ | 2,274 | | | $ | 3,252 | | | (30) | % |
Number | | | 1,284 | | | | 1,789 | | | | (28 | )% | Number | 948 | | 1,407 | | (33) | % |
Announced M&A Transactions: | | | | | | | | | | | | |
All deals: | | | | | | | | | | | | |
| All deals: | |
| All deals: | |
| Value | |
| Value | |
Value | | $ | 3,752 | | | $ | 5,917 | | | | (37 | )% | $ | 3,134 | | | $ | | $ | 3,743 | | | (16) | | (16) | % |
Number | | | 38,438 | | | | 43,781 | | | | (12 | )% | Number | 36,014 | | 43,538 | | (17) | % |
Deals Greater than $500 million: | | | | | | | | | | | | |
Value | | $ | 2,758 | | | $ | 4,624 | | | | (40 | )% |
| Value | |
| Value | | $ | 2,380 | | | $ | 2,716 | | | (12) | % |
Number | | | 1,244 | | | | 1,982 | | | | (37 | )% | Number | 1,096 | | 1,235 | | (11) | % |
Source:
| Dealogic as of January 4, 2023.
|
______________________Source: Dealogic as of January 5, 2024.
Global restructuring activity during
2022,2023, as measured by the number of corporate defaults, increased as compared to
2021.2022. The number of defaulting issuers was
90159 in
2022,2023, according to Moody’s Investors Service, Inc., as compared to
55157 in
2021.2022.
Net revenue trends in Financial Advisory are generally correlated to the level of completed industry-wide M&A transactions and restructuring transactions occurring subsequent to corporate debt defaults, respectively. However, deviations from this relationship can occur in any given year for a number of reasons. For instance, our results can diverge from industry-wide activity where there are material variances from the level of industry-wide M&A activity in a particular market where Lazard has
significantgreater or lesser relative market share, or regarding the relative number of our advisory engagements with respect to larger-sized transactions, and where we are involved in non-public or sovereign advisory assignments.
The percentage change in major equity market indices (i)
at December 31, 2023, as compared to such indices at December 31, 2022, and (ii) at December 31, 2022, as compared to such indices at December 31, 2021,
and (ii) at December 31, 2021, as compared to such indices at December 31, 2020, is shown in the table below.
| | Percentage Changes December 31, | |
| | 2022 vs. 2021 | | | 2021 vs. 2020 | |
| Percentage Changes
December 31, | | | Percentage Changes
December 31, |
| 2023 vs 2022 | | | 2023 vs 2022 | | 2022 vs 2021 |
MSCI World Index | | | (18 | %) | | | 22 | % | MSCI World Index | 24 | % | | (18 | %) |
Euro Stoxx | | | (9 | %) | | | | 24 | % | Euro Stoxx | 23 | % | | (9 | %) |
MSCI Emerging Market | | | (20 | %) | | | | (3 | %) | MSCI Emerging Market | 10 | % | | (20 | %) |
S&P 500 | | | (18 | %) | | | 29 | % | S&P 500 | 26 | % | | (18 | %) |
The fees that we receive for providing investment management and advisory services are primarily driven by the level of AUM and the nature of the AUM product mix. Accordingly, market movements, foreign currency exchange rate volatility and changes in our AUM product mix will impact the level of revenues we receive from our Asset Management business when comparing periodic results. A substantial portion of our AUM is invested in equities. Movements in AUM during the period generally reflect the changes in equity market indices.
Financial Statement Overview
The majority of Lazard’s Financial Advisory net revenue historically has been earned from advice and other services provided in M&A transactions. The amount of the successfulfee earned can vary depending upon the type, size and complexity of the transaction Lazard is advising on. M&A fees can be earned as a retainer, working fee, announcement fee, milestone fee, opinion fee or transaction completion fee. With most fees being paid upon completion of a transaction the timing can be impacted by delays to securing financing, board approvals, regulatory approvals, shareholder votes, changing market conditions or other factors.
Our restructuring and liability management team advises on situations where our clients are financially distressed, providing advice on financial debt restructurings, liability management and M&A transactions,&A. Bankruptcy proceedings may require court approval of our fees. The capital markets advisory team advises both public and private issuers on the raising of capital, while the private capital advisory team provides fundraising and secondary advisory services for private equity, private credit, real estate and real assets-focused investment firms. Additionally, Lazard earns fees from providing strategic advice to clients, which may include shareholder advisory, restructuring and capital solutions, sovereigngeopolitical advisory capital raising and placement, and other strategic advisory matters. The main driversmatters, with such fees not being dependent on the completion of a transaction.
Our Financial Advisory net revenue arebusinesses may be impacted by overall M&A activity levels in the market, the level of corporate debt defaults and the environment for capital raising activities, particularly in the industries and geographic markets in which Lazard focuses. In some client engagements, often those involving financially distressed companies, revenue is earned in the form of retainers and similar fees that are contractually agreed upon with each client for each assignment and are not necessarily linked to the completion of a transaction. In addition, Lazard also earns fees from providing strategic advice to clients, with such fees not being dependent on a specific transaction, and may also earn fees in connection with public and private securities offerings. among other factors.
Significant fluctuations in Financial Advisory net revenue can occur over the course of any given year, because a significant portion of such net revenue is earned upon the successful completion of a transaction, restructuring or capital raising activity, the timing of which is uncertain and is not subject to Lazard’s control.
Lazard’s Asset Management segment principally includes LAM, LFG, LFB and Edgewater. Asset Management net revenue is derived from fees for investment management and advisory services provided to clients. As noted above, the main driver of Asset Management net revenue is the level and product mix of AUM, which is generally influenced by the performance of the global equity markets and, to a lesser extent, fixed income markets as well as Lazard’s investment performance, which impacts its ability to successfully attract and retain assets. As a result, fluctuations (including timing thereof) in financial markets and client asset inflows and outflows have a direct effect on Asset Management net revenue and operating income. Asset Management fees are generally based on the level of AUM measured daily, monthly or quarterly, and an increase or reduction in AUM, due to market price fluctuations, currency fluctuations, changes in product mix, or net client asset flows will result in a corresponding increase or decrease in management fees. The majority of ourOur investment advisory contracts are generally terminable at any time or on notice of 30 days or less. Institutional and individual clients, and firms with which we have strategic alliances, can terminate their relationship with us, reduce the aggregate amount of AUM or shift their funds to other types of accounts with different rate structures for a number of reasons, including
investment performance, changes in prevailing interest rates and financial market performance. In addition, as Lazard’s AUM includes significant amounts of assets that are denominated in currencies other than U.S. Dollars, changes in the value of the U.S. Dollar relative to foreign currencies will impact the value of Lazard’s AUM and the overall amount of management fees generated by the AUM. Fees vary with the type of assets managed and the vehicle in which they are managed, with higher fees earned on equity assets and alternative investment funds, such as hedge funds and private equity funds, and lower fees earned on fixed income and cash management products.
40
The Company earns performance-based incentive fees on various investment products, including traditional products and alternative investment funds, such as hedge funds and private equity funds.
For hedge funds, incentive fees are calculated based on a specified percentage of a fund’s net appreciation, in some cases in excess of established benchmarks or thresholds. The Company records incentive fees on traditional products and hedge funds at the end of the relevant performance measurement period, when potential uncertainties regarding the ultimate realizable amounts have been determined. The incentive fee measurement period is generally an annual period (unless an account terminates or redemption occurs during the year). The incentive fees received at the end of the measurement period are not subject to reversal or payback. Incentive fees on hedge funds are often subject to loss carryforward provisions in which losses incurred by the hedge funds in any year are applied against certain gains realized by the hedge funds in future periods before any incentive fees can be earned.
For private equity funds, incentive fees may be earned in the form of a “carried interest” if profits arising from realized investments exceed a specified threshold. Typically, such carried interest is ultimately calculated on a whole-fund or investment by investment basis and, therefore, clawback of carried interest toward the end of the life of the fund can occur. As a result, the Company recognizes incentive fees earned on our private equity funds
only when it is probable that a clawback will not occur.
Corporate segment net revenue consists primarily of investment gains and losses on the Company’s
“seed investments” relatedinvestments to
seed strategies in our Asset Management business,
net of hedging activities, and principal investments in private equity funds,
net of hedging activities, as well as gains and losses on investments held in connection with Lazard Fund Interests (“LFI”) and interest income and interest expense. Corporate net revenue
also can fluctuate due to changes in the fair value of debt and equity securities, as well as due to changes in interest and currency exchange rates and
in the levels of cash, investments and indebtedness.
Corporate segment total assets represented
62%44% of Lazard’s consolidated total assets as of December 31,
2022,2023, which are attributable to cash and cash equivalents,
restricted cash associated with LGAC, investments in debt and equity securities, interests in alternative investment, debt, equity and private equity
funds, investments accounted for under the equity method of accounting, deferred tax assets and certain other assets associated with LFB and LGAC.funds.
The majority of Lazard’s operating expenses relate to compensation and benefits for managing directors and employees. Our compensation and benefits expense includes (i) salaries and benefits, (ii) amortization of the relevant portion of previously granted deferred incentive compensation awards, including (a) share-based incentive compensation under
the Lazard LtdLazard’s 2018 Incentive Compensation Plan, as amended (the “2018
Plan”) and the Lazard Ltd 2008 Incentive Compensation Plan (the “2008 Plan”) and (b) LFI and other similar deferred compensation arrangements (see Note
1516 of Notes to Consolidated Financial Statements), (iii) a provision for discretionary or guaranteed cash bonuses and profit pools and (iv) when applicable, severance payments. Compensation expense in any given period is dependent on many factors, including general economic and market conditions, our actual and forecasted operating and financial performance, staffing levels, estimated forfeiture rates, competitive pay conditions and the nature of revenues earned, as well as the mix between current and deferred compensation.
We believe that “awarded compensation and benefits expense” and the ratio of “awarded compensation and benefits expense” to “operating revenue,” both non-GAAP measures, when presented in conjunction with accounting principles generally accepted in the United States of America (“U.S. GAAP”) measures, are appropriate measures to assess the annual cost of compensation and provide a meaningful and useful basis for comparison of compensation and benefits expense between present, historical and future years. “Awarded compensation and benefits expense” for a given year is calculated using “adjusted compensation and benefits expense,” also a non-GAAP measure, as modified by the following items:
| •
| we deduct amortization expense recorded for U.S. GAAP purposes in the fiscal year associated with deferred incentive compensation awards;
|
41
| •
| we add incentive compensation with respect to the fiscal year, which is comprised of:
|
| (i)
| the deferred incentive compensation awards granted in the year-end compensation process with respect to the fiscal year (e.g., deferred incentive compensation awards granted in 2023 related to the 2022 year-end compensation process), including performance-based restricted stock unit (“PRSU”) and performance-based restricted participation unit (“PRPU”) awards (based on the target payout level);
|
| (ii)
| the portion of investments in people (e.g., “sign-on” bonuses or retention awards) and other special deferred incentive compensation awards that is applicable to the fiscal year the award becomes effective; and
|
| (iii)
| amounts in excess of the target payout level for PRSU and PRPU awards at the end of their respective performance periods; and
|
| •
| we reduce the amounts in (i), (ii) and (iii) above by an estimate of future forfeitures with respect to such awards.
|
We also use “adjusted compensation and benefits expense” and the ratio of “adjusted compensation and benefits expense” to “operating revenue,” both non-GAAP measures, for comparison of compensation and benefits expense between periods. For the reconciliations and calculations with respect to “adjusted compensation and benefits expense” and “awarded compensation and benefits expense” and related ratios to “operating revenue,” see the table under “Consolidated Results of Operations” below.
Compensation and benefits expense is the largest component of our operating expenses. We seek to maintain discipline with respect to compensation, including the rate at which we award deferred compensation. Our goal is to maintainWe focus on a ratio of awardedadjusted compensation and benefits expense to operating revenue andto manage costs, balancing a view of current market conditions alongside our objective to drive long-term shareholder value. Our goal remains to maintain a ratio of adjusted compensation and benefits expense to operating revenue over the cycle in the mid- tomid-to high-50s percentage range, while
targeting a consistent deferral policy. While we have implemented policies and initiatives that we believe will assist us in maintaining ratios within this range, there can be no guarantee that we will
continuebe able to maintain such ratios, or that our policies or initiatives will not change, in the future.
Our practice is to pay our employees competitively to foster retention and motivate performance and in doing so we look to the market for talent and other factors, which are typically correlated with industry revenues, but may vary year by year. At the same time, the amount of compensation we award in a particular year is, in part, deferred and amortized over the successive years. Increased competition for professionals, changes in the macroeconomic environment or the financial markets generally, lower operating revenue resulting from, for example, a decrease in M&A activity, our share of the M&A market or our AUM levels, changes in the mix of revenues from our businesses, investments in our businesses or various other factors could prevent us from achieving this
goal; however, in future periods we may benefit from pressure on compensation costs within the financial services industry.goal.
Our operating expenses also include “non-compensation expense”, which includes costs for occupancy and equipment, marketing and business development, technology and information services, professional services, fund administration and outsourced services,
amortization and other acquisition-related costs and other expenses. Our occupancy costs represent a significant portion of our aggregate operating expenses and are subject to change from time to time, particularly as leases for real property expire and are renewed or replaced with new, long-term leases for the same or other real property.
We believe that “adjusted non-compensation expense”, a non-GAAP measure, when presented in conjunction with
measures prepared in accordance with accounting principles generally accepted in the United States of America (“U.S.
GAAP measuresGAAP”) provides a meaningful and useful basis for our investors to assess our operating results. For calculations with respect to “adjusted non-compensation expense”, see the table under “Consolidated Results of Operations” below.
Our operating expenses also include “amortization of intangible assets related to acquisitions”.
We do not believe inflation will have a significant effect on our compensation costs as they are substantially variable in nature. However, the rate of inflation may affect our other expenses.
To the extent inflation results in rising interest rates and has other effects upon the securities markets or general macroeconomic conditions, it may adversely affect our financial position and results of operations by impacting overall levels of M&A activity, reducing our AUM or net revenue,
increasing non-compensation expense, or otherwise.
42
Cost-Saving Initiatives
The Company conducted firm-wide cost-saving initiatives over the course of 2023 that will continue through the first quarter of 2024. See Note 18 of Notes to Consolidated Financial Statements.
Provision for Income Taxes
Lazard Group primarily operates in the U.S. as a limited liability company that is treated as a partnership for U.S. federal income tax purposes. As a result, Lazard Group’s income pertaining to the limited liability company is not subject to U.S. federal income tax because taxes associated with such income represent obligations of its partners. Lazard Group, through its subsidiaries, is subject to state and local taxes on its income apportioned to various state and local jurisdictions.
Outside the U.S., Lazard Group operates principally through subsidiary corporations
including through those domiciled outside the U.S. that are subject to local income taxes in foreign jurisdictions.
In addition, Lazard Group is
also subject to Unincorporated Business Tax (“UBT”) attributable to its operations apportioned to New York City.
Additionally, the Organization for Economic Cooperation and Development (the “OECD”) reached agreement among various countries, including the EU member states, to establish a 15% minimum tax on certain multinational companies, commonly called “Pillar Two”. Many countries continue to announce changes in their tax laws and regulations to implement the OECD Pillar Two proposals. Lazard is continuing to evaluate the potential impact on future periods of the Pillar Two proposals, as new guidance becomes available.
See “Critical Accounting Policies and Estimates—Income Taxes” below and Note
1719 of Notes to Consolidated Financial Statements for additional information regarding income taxes and our deferred tax assets.
Noncontrolling interests primarily consist of (i) amounts related to Edgewater’s management vehicles that the Company is deemed to control but not own, (ii) LGAC interests (see Note 1 of Notes to Consolidated Financial Statements) and (iii) consolidated VIE interests held by employees. See Notes
1415 and
2123 of Notes to Consolidated Financial Statements for information regarding the Company’s noncontrolling interests and consolidated VIEs.
Consolidated Results of Operations
Lazard’s consolidated financial statements are presented in U.S. Dollars. Many of our non-U.S. subsidiaries have a functional currency (i.e., the currency in which operational activities are primarily conducted) that is other than the U.S. Dollar, generally the currency of the country in which the subsidiaries are domiciled. Such subsidiaries’ assets and liabilities are translated into U.S. Dollars using exchange rates as of the respective balance sheet date, while revenue and expenses are translated at average exchange rates during the respective periods based on the daily closing exchange rates. Adjustments that result from translating amounts from a subsidiary’s functional currency are reported as a component of members’ equity. Foreign currency remeasurement gains and losses on transactions in non-functional currencies are included in the consolidated statements of operations. The consolidated financial statements are prepared in conformity with U.S. GAAP. Selected financial data derived from the Company’s reported consolidated results of operations is set forth below, followed by a more detailed discussion of both the consolidated and business segment results.
| | Year Ended December 31, | |
| | 2022 | | | 2021 | | | 2020 | |
| | ($ in thousands) | |
| Year Ended December 31, | | | Year Ended December 31, |
| 2023 | | | 2023 | | 2022 | | 2021 |
| ($ in thousands) | | | ($ in thousands) |
Net Revenue | | $ | 2,764,289 | | | $ | 3,223,209 | | | $ | 2,565,540 | |
Operating Expenses: | | | | | | | | | | | | |
Compensation and benefits | | | 1,647,811 | | | | 1,884,859 | | | | 1,541,228 | |
| Compensation and benefits | |
| Compensation and benefits | |
Non-compensation | | | 595,617 | | | | 567,627 | | | | 508,897 | |
Amortization of intangible assets related to acquisitions | | | 60 | | | | 60 | | | | 1,744 | |
Total operating expenses | | | 2,243,488 | | | | 2,452,546 | | | | 2,051,869 | |
Operating Income | | | 520,801 | | | | 770,663 | | | | 513,671 | |
| Operating Income (Loss) | |
Provision for income taxes | | | 81,653 | | | | 101,687 | | | | 56,564 | |
Net Income | | | 439,148 | | | | 668,976 | | | | 457,107 | |
Less - Net Income Attributable to Noncontrolling Interests | | | 34,966 | | | | 14,481 | | | | 231 | |
Net Income Attributable to Lazard Group | | $ | 404,182 | | | $ | 654,495 | | | $ | 456,876 | |
Operating Income, as a % of net revenue | | | 18.8 | % | | | 23.9 | % | | | 20.0 | % |
| Net Income (Loss) | |
| Less - Net Income (Loss) Attributable to Noncontrolling Interests | |
| Net Income (Loss) Attributable to Lazard Group | |
| Operating Income (Loss), as a % of net revenue | | Operating Income (Loss), as a % of net revenue | (4.4) | % | | 18.8 | % | | 23.9 | % |
The tables below describe the components of operating revenue, adjusted
and awarded compensation and benefits expense, adjusted non-compensation expense, earnings from operations and related key ratios, which are non-GAAP measures used by the Company to manage its business. We believe such non-GAAP measures in conjunction with U.S. GAAP measures provide a meaningful and useful basis for comparison between present, historical and future periods, as described above.
| | Year Ended December 31, | |
| | 2022 | | | 2021 | | | 2020 | |
| | ($ in thousands) | |
Operating Revenue: | | | | | | | | | | | | |
Net revenue | | $ | 2,764,289 | | | $ | 3,223,209 | | | $ | 2,565,540 | |
Adjustments: | | | | | | | | | | | | |
Interest expense (a) | | | 75,370 | | | | 74,176 | | | | 74,341 | |
Distribution fees, reimbursable deal costs, bad debt expense and other (b) | | | (74,207 | ) | | | (85,041 | ) | | | (64,988 | ) |
Revenue related to noncontrolling interests (c) | | | (49,073 | ) | | | (31,624 | ) | | | (11,497 | ) |
(Gains) losses on investments pertaining to LFI (d) | | | 44,261 | | | | (35,494 | ) | | | (40,634 | ) |
Gains associated with restructuring and closing of certain offices (e) | | | - | | | | (7,516 | ) | | | - | |
Operating revenue | | $ | 2,760,640 | | | $ | 3,137,710 | | | $ | 2,522,762 | |
(a)
| Interest expense (excluding interest expense incurred by LFB) is added back in determining operating revenue because such expense relates to corporate financing activities and is not considered to be a cost directly related to the revenue of our business.
|
(b)
| Represents certain distribution, introducer and management fees paid to third parties, reimbursable deal costs and bad debt expense relating to fees that are deemed uncollectible for which an equal amount is excluded for purposes of determining adjusted non-compensation expense.
|
| | | | | | | | | | | | | | | | | |
| Year Ended December 31, |
| 2023 | | 2022 | | 2021 |
| ($ in thousands) |
| Operating Revenue: | | | | | |
| Net revenue | $ | 2,516,228 | | | $ | 2,764,289 | | | $ | 3,223,209 | |
| Adjustments: | | | | | |
| Interest expense (a) | 75,159 | | | 75,370 | | | 74,176 | |
| Distribution fees, reimbursable deal costs, bad debt expense and other (b) | (105,693) | | | (74,207) | | | (85,041) | |
| Asset impairment charges | 19,129 | | | – | | | – | |
| Revenue related to noncontrolling interests (c) | (30,190) | | | (49,073) | | | (31,624) | |
| (Gains) losses on investments pertaining to LFI (d) | (41,463) | | | 44,261 | | | (35,494) | |
| (Gains) losses associated with cost-saving initiatives, restructuring and closing of certain offices (e) | 5,465 | | | – | | | (7,516) | |
| Operating revenue (f) | $ | 2,438,635 | | | $ | 2,760,640 | | | $ | 3,137,710 | |
(c)
| Revenue or loss related to the consolidation of noncontrolling interests is excluded from operating revenue because the Company has no economic interest in such amount.
|
_______________________(d)
| Represents changes in the fair value of investments held in connection with LFI and other similar deferred compensation arrangements for which a corresponding equal amount is excluded from compensation and benefits expense.
|
(e)(a)Interest expense (excluding interest expense incurred by LFB) is added back in determining operating revenue because such expense relates to corporate financing activities and is not considered to be a cost directly related to the revenue of our business.
| Represents gains related to the reclassification of currency translation adjustments to earnings from accumulated other comprehensive loss associated with restructuring and closing of certain of our offices in the year ended December 31, 2021.
|
(b)Represents certain distribution, introducer and management fees paid to third parties, reimbursable deal costs and bad debt expenses relating to fees and other receivables that are deemed uncollectible for which an equal amount is excluded for purposes of determining adjusted non-compensation expense.
| | Year Ended December 31, | |
| | 2022 | | | 2021 | | | 2020 | |
| | ($ in thousands) | |
Adjusted and Awarded Compensation and Benefits Expense: | | | | | | | | | | | | |
Total compensation and benefits expense | | $ | 1,647,811 | | | $ | 1,884,859 | | | $ | 1,541,228 | |
Adjustments: | | | | | | | | | | | | |
Noncontrolling interests (a) | | | (10,855 | ) | | | (9,216 | ) | | | (7,927 | ) |
(Charges) credits pertaining to LFI (b) | | | 44,261 | | | | (35,494 | ) | | | (40,634 | ) |
Expenses associated with senior management transition (c) | | | (33,019 | ) | | | - | | | | - | |
Expenses associated with restructuring and closing of certain offices | | | - | | | | (14,922 | ) | | | - | |
Adjusted compensation and benefits expense | | | 1,648,198 | | | | 1,825,227 | | | | 1,492,667 | |
Deduct - amortization of deferred incentive compensation awards | | | (368,492 | ) | | | (398,092 | ) | | | (380,086 | ) |
Total adjusted cash compensation and benefits expense (d) | | | 1,279,706 | | | | 1,427,135 | | | | 1,112,581 | |
Add: | | | | | | | | | | | | |
Year-end deferred incentive compensation awards (e) | | | 434,659 | | | | 389,257 | | | | 363,523 | |
Sign-on and other special incentive awards (f) | | | 77,978 | | | | 48,501 | | | | 54,784 | |
Deduct - adjustments for estimated forfeitures (g) | | | (33,321 | ) | | | (28,454 | ) | | | (27,190 | ) |
Awarded compensation and benefits expense | | $ | 1,759,022 | | | $ | 1,836,439 | | | $ | 1,503,698 | |
Adjusted compensation and benefits expense, as a % of operating revenue | | | 59.7 | % | | | 58.2 | % | | | 59.2 | % |
Awarded compensation and benefits expense, as a % of operating revenue | | | 63.7 | % | | | 58.5 | % | | | 59.6 | % |
(a)(c)Revenue or loss related to the consolidation of noncontrolling interests is excluded from operating revenue because the Company has no economic interest in such amount.
| Expenses related to the consolidation of noncontrolling interests are excluded because Lazard has no economic interest in such amounts.
|
(b)(d)Represents changes in the fair value of investments held in connection with LFI and other similar deferred compensation arrangements for which a corresponding equal amount is excluded from compensation and benefits expense.
| Represents changes in fair value of the compensation liability recorded in connection with LFI and other similar deferred incentive compensation awards for which a corresponding equal amount is excluded from operating revenue.
|
(c)(e)Represents losses (gains) associated with the reclassification of currency translation adjustments to earnings from accumulated other comprehensive losses in the year ended December 31, 2023 and 2021 and transactions related to foreign currency exchange in the year ended December 31, 2023.
| Represents expenses associated with senior management transition reflecting the departure of certain executive officers.
|
(d)(f)Operating revenue is a non-GAAP measure.
| Includes base salaries and benefits of $823,815, $767,370 and $679,270 for 2022, 2021 and 2020, respectively, and cash incentive compensation of $455,891, $659,765 and $433,312 for the respective years.
|
(e)
| Deferred incentive compensation awards applicable to the relevant year-end compensation process (e.g., deferred incentive compensation awards granted in 2023, 2022 and 2021 related to the 2022, 2021 and 2020 year-end compensation processes, respectively).
|
| | | | | | | | | | | | | | | | | |
| Year Ended December 31, |
| 2023 | | 2022 | | 2021 |
| ($ in thousands) |
| Adjusted Compensation and Benefits Expense: | | | | | |
| Total compensation and benefits expense | $ | 1,939,840 | | | $ | 1,647,811 | | | $ | 1,884,859 | |
| Adjustments: | | | | | |
| Noncontrolling interests (a) | (9,233) | | | (10,855) | | | (9,216) | |
| (Charges) credits pertaining to LFI (b) | (41,463) | | | 44,261 | | | (35,494) | |
| Expenses associated with senior management transition (c) | (10,674) | | | (33,019) | | | – | |
| Expenses associated with cost-saving initiatives, restructuring and closing of certain offices | (178,341) | | | – | | | (14,922) | |
| Adjusted compensation and benefits expense (d) | $ | 1,700,129 | | | $ | 1,648,198 | | | $ | 1,825,227 | |
| Adjusted compensation and benefits expense, as a % of operating revenue | 69.7 | % | | 59.7 | % | | 58.2 | % |
(f)
| Represents special deferred incentive awards that are granted outside the year-end compensation process, and includes grants to new hires, retention awards and performance units earned under PRSU grants.
|
_____________________________(g)(a)Expenses related to the consolidation of noncontrolling interests are excluded because Lazard has no economic interest in such amounts.
| An estimate, based on historical experience and future expectations, for future forfeitures of the deferred portion of such awards in order to present awarded compensation and benefits expense on a similar basis to that under U.S. GAAP, which also considers estimated forfeitures.
|
(b)Represents changes in fair value of the compensation liability recorded in connection with LFI and other similar deferred incentive compensation awards for which a corresponding equal amount is excluded from operating revenue.
| | Year Ended December 31, | |
| | 2022 | | | 2021 | | | 2020 | |
| | ($ in thousands) | |
Adjusted Non-Compensation Expense: | | | | | | | | | | | | |
Total non-compensation expense | | $ | 595,617 | | | $ | 567,627 | | | $ | 508,897 | |
Adjustments: | | | | | | | | | | | | |
Expenses relating to office space reorganization (a) | | | (3,764 | ) | | | (4,611 | ) | | | (12,646 | ) |
Distribution fees, reimbursable deal costs bad debt expense and other (b) | | | (74,207 | ) | | | (85,041 | ) | | | (64,988 | ) |
Noncontrolling interests (c) | | | (3,255 | ) | | | (7,932 | ) | | | (2,430 | ) |
Expenses associated with restructuring and closing of certain offices | | | - | | | | (1,539 | ) | | | - | |
Adjusted non-compensation expense | | $ | 514,391 | | | $ | 468,504 | | | $ | 428,833 | |
Adjusted non-compensation expense, as a % of operating revenue | | | 18.6 | % | | | 14.9 | % | | | 17.0 | % |
(a)(c)Represents expenses associated with senior management transition reflecting the departure of certain executive officers.
| Represents building depreciation and other costs related to office space reorganization.
|
(b)(d)Adjusted compensation and benefits expense is a non-GAAP measure.
| Represents certain distribution, introducer and management fees paid to third parties, reimbursable deal costs and bad debt expense relating to fees that are deemed uncollectible for which an equal amount is included for purposes of determining operating revenue.
|
(c)
| Expenses related to the consolidation of noncontrolling interests are excluded because the Company has no economic interest in such amounts.
|
| | Year Ended December 31, | |
| | 2022 | | | 2021 | | | 2020 | |
| | ($ in thousands) | |
Earnings From Operations: | | | | | | | | | | | | |
Operating revenue | | $ | 2,760,640 | | | $ | 3,137,710 | | | $ | 2,522,762 | |
Deduct: | | | | | | | | | | | | |
Adjusted compensation and benefits expense | | | (1,648,198 | ) | | | (1,825,227 | ) | | | (1,492,667 | ) |
Adjusted non-compensation expense | | | (514,391 | ) | | | (468,504 | ) | | | (428,833 | ) |
Earnings from operations | | $ | 598,051 | | | $ | 843,979 | | | $ | 601,262 | |
Earnings from operations, as a % of operating revenue | | | 21.7 | % | | | 26.9 | % | | | 23.8 | % |
| | | | | | | | | | | | | | | | | |
| Year Ended December 31, |
| 2023 | | 2022 | | 2021 |
| ($ in thousands) |
| Adjusted Non-Compensation Expense: | | | | | |
| Total non-compensation expense | $ | 686,572 | | | $ | 595,677 | | | $ | 567,687 | |
| Adjustments: | | | | | |
| Expenses relating to office space reorganization (a) | – | | | (3,764) | | | (4,611) | |
| Distribution fees, reimbursable deal costs, bad debt expense and other (b) | (105,693) | | | (74,207) | | | (85,041) | |
| Amortization and other acquisition-related costs | (334) | | | (60) | | | (60) | |
| Noncontrolling interests (c) | (2,788) | | | (3,255) | | | (7,932) | |
| Expenses associated with cost-saving initiatives, restructuring and closing of certain offices | (13,012) | | | – | | | (1,539) | |
| Adjusted non-compensation expense (d) | $ | 564,745 | | | $ | 514,391 | | | $ | 468,504 | |
| Adjusted non-compensation expense, as a % of operating revenue | 23.2 | % | | 18.6 | % | | 14.9 | % |
________________________
(a)Represents building depreciation and other costs related to office space reorganization.
(b)Represents certain distribution, introducer and management fees paid to third parties, reimbursable deal costs and bad debt expenses relating to fees and other receivables that are deemed uncollectible for which an equal amount is included for purposes of determining operating revenue.
(c)Expenses related to the consolidation of noncontrolling interests are excluded because the Company has no economic interest in such amounts.
(d)Adjusted non-compensation expense is a non-GAAP measure.
| | | | | | | | | | | | | | | | | |
| Year Ended December 31, |
| 2023 | | 2022 | | 2021 |
| ($ in thousands) |
| Earnings From Operations (a): | | | | | |
| Operating revenue | $ | 2,438,635 | | | $ | 2,760,640 | | | $ | 3,137,710 | |
| Deduct: | | | | | |
| Adjusted compensation and benefits expense | (1,700,129) | | | (1,648,198) | | | (1,825,227) | |
| Adjusted non-compensation expense | (564,745) | | | (514,391) | | | (468,504) | |
| Earnings from operations | $ | 173,761 | | | $ | 598,051 | | | $ | 843,979 | |
| Earnings from operations, as a % of operating revenue | 7.1 | % | | 21.7 | % | | 26.9 | % |
_________________
(a)Earnings from operations is a non-GAAP measure.
Headcount information is set forth below:
| | As of December 31, | |
| | 2022 | | | 2021 | | | 2020 | |
| As of December 31, | | | As of December 31, |
| 2023 | | | 2023 | | 2022 | | 2021 |
Headcount: | | | | | | | | | | | | |
Managing Directors: | | | | | | | | | | | | |
| Managing Directors: | |
| Managing Directors: | |
| Financial Advisory (a) | |
| Financial Advisory (a) | |
Financial Advisory (a) | | | 211 | | | | 176 | | | | 168 | | 210 | | 211 | | 176 |
Asset Management | | | 120 | | | | 110 | | | | 105 | | Asset Management | 114 | | 120 | | 110 |
Corporate | | | 25 | | | | 22 | | | | 21 | | Corporate | 26 | | 25 | | 22 |
Total Managing Directors | | | 356 | | | | 308 | | | | 294 | | Total Managing Directors | 350 | | 356 | | 308 |
Other Business Segment Professionals and Support Staff: | | | | | | | | | | | | |
Financial Advisory (a) | | | 1,452 | | | | 1,335 | | | | 1,370 | |
| Financial Advisory (a) | |
| Financial Advisory (a) | | 1,392 | | 1,452 | | 1,335 |
Asset Management | | | 1,105 | | | | 1,088 | | | | 1,012 | | Asset Management | 1,107 | | 1,105 | | 1,088 |
Corporate | | | 476 | | | | 429 | | | | 412 | | Corporate | 440 | | 476 | | 429 |
Total | | | 3,389 | | | | 3,160 | | | | 3,088 | | Total | 3,289 | | 3,389 | | 3,160 |
(a)
| Financial Advisory headcount reflects that, in addition to customary year-end changes, 20 employees were reclassified in the first quarter of 2022 from professionals to managing directors due to a consolidation of the Lazard Middle Market LLC broker-dealer license.
|
________________________46
(a)Financial Advisory headcount reflects that, in addition to customary year-end changes, 20 employees were reclassified in the first quarter of 2022 from professionals to managing directors in connection with a consolidation of the Lazard Middle Market LLC broker-dealer license.
A review of our operating results for the year ended December 31,
20222023 compared to our operating results for the year ended December 31,
20212022 appears below. A detailed review of our operating results for the year ended December 31,
20212022 compared to the year ended December 31,
20202021 is set forth in Part II, Item 7 of our Annual Report on Form 10-K for the year ended December 31,
20212022 under the caption “Management’s Discussion and Analysis of Financial Condition and Results of Operations—Operating Results”.
Year Ended December 31,
20222023 versus December 31,
20212022
The Company reported
a net
incomeloss attributable to Lazard Group of
$404$177 million, as compared to net income attributable to Lazard Group of
$654$404 million in
2021.2022.
Net revenue decreased $459$248 million, or 14%9%, with operating revenue decreasing $377$322 million, or 12%, as compared to 2021.2022. Fee revenue from investment banking and other advisory activities decreased $136$265 million, or 8%16%, as compared to 2021.2022. Asset management fees, including incentive fees, decreased $229$48 million, or 17%4%, as compared to 2021.2022. In the aggregate, interest income, other revenue and interest expense decreased $94increased $65 million as compared to 2022, the majority of which is recorded in the Corporate segment.
Compensation and benefits expense increased $292 million, or
112%18%, as compared to
2021.Compensation and benefits expense decreased $237 million, or 13%, as compared to 2021.
2022.
Adjusted compensation and benefits expense (which excludes certain items and which we believe allows for improved comparability between periods, as described above) was $1,648$1,700 million, a decreasean increase of $177$52 million, or 10%3%, as compared to $1,825$1,648 million in 2021.2022. The ratio of adjusted compensation and benefits expense to operating revenue was 59.7%69.7% for 2022,2023, as compared to 58.2%59.7% for 2021. Awarded compensation and benefits2022.
Non-compensation expense
in 2022 was $1,759 million, a decrease of $77increased $91 million, or
4%, when compared to $1,836 million in 2021. The ratio of awarded compensation and benefits expense to operating revenue was 63.7%15%, as compared to
58.5% for 2021. The year-end deferred incentive compensation awarded for 2022,
was $435 million, representing an increase of $45 million, or 12%, as compared to 2021. As described above, when analyzing compensation and benefits expense on a full-year basis, we believe that awarded compensation and benefits expense provides the most meaningful basis for comparison of compensation and benefits expense between present, historical and future years.Non-compensation expense increased $28 million, or 5%, as compared to 2021, primarily due to increased marketinghigher professional services expenses and travel and business development expenses, from higher travel, andcontinued investments in technology.technology and expenses associated with the cost-saving initiatives in 2023. Adjusted non-compensation expense increased $46$50 million, or 10%, as compared to 2021.2022. The ratio of adjusted non-compensation expense to operating revenue was 18.6%23.2% for 2022,2023, as compared to 14.9%18.6% for 2022.
The Company reported an operating loss of $110 million, as compared to operating income of $521 million in
2021.Operating income2022.
Earnings from operations decreased
$250$424 million, or
32%71%, as compared to
2021.Earnings from operations decreased $246 million, or 29%, as compared to 2021,2022, and, as a percentage of operating revenue, was 21.7%7.1%, as compared to 26.9%21.7% in 2021.
2022.
The provision for income taxes reflects an effective tax rate of
15.7%(44.5)%, as compared to
13.2%15.7% in
2021.2022. See Note
1719 of Notes to Consolidated Financial Statements.
Net income attributable to noncontrolling interests
increased $20decreased $17 million as compared to
2021.2022. See Note
1415 of Notes to Consolidated Financial Statements.
The following is a discussion of net revenue and operating income for the Company’s segments: Financial Advisory, Asset Management and Corporate.
Each segment’s operating expenses include (i) compensation and benefits expenses that are incurred directly in supportSee Note 22 of
the segment and (ii) other operating expenses, which include directly incurred expensesNotes to Consolidated Financial Statements for
occupancy and equipment, marketing and business development, technology andfurther information
services, professional services, fund administration and outsourcing, and indirect support costs (including compensation and benefits expense and other operating expenses related thereto) for administrative47
services. Such administrative services include, but are not limited to, accounting, tax, human resources, legal, information technology, facilities management and senior management activities. Such support costs are allocated to the relevant segments based on various statistical drivers such as revenue, headcount, square footage and other factors.
regarding segments.
The following table summarizes the reported operating results attributable to the Financial Advisory segment:
| | Year Ended December 31, | |
| | 2022 | | | 2021 | | | 2020 | |
| | ($ in thousands) | |
| Year Ended December 31, | | | Year Ended December 31, |
| 2023 | | | 2023 | | 2022 | | 2021 |
| ($ in thousands) | | | ($ in thousands) |
Net Revenue | | $ | 1,655,596 | | | $ | 1,794,132 | | | $ | 1,420,042 | |
Operating Expenses | | | 1,292,382 | | | | 1,345,849 | | | | 1,122,002 | |
Operating Income | | $ | 363,214 | | | $ | 448,283 | | | $ | 298,040 | |
Operating Income, as a % of net revenue | | | 21.9 | % | | | 25.0 | % | | | 21.0 | % |
| Operating Income (Loss) | |
| Operating Income (Loss), as a % of net revenue | | Operating Income (Loss), as a % of net revenue | (7.2) | % | | 21.9 | % | | 25.0 | % |
(a)See Note 18 of Notes to Consolidated Financial Statements for information regarding cost-saving initiatives.
Certain Lazard fee and transaction statistics for the Financial Advisory segment are set forth below:
| | Year Ended December 31, | |
| | 2022 | | | 2021 | | | 2020 | |
Lazard Statistics: | | | | | | | | | | | | |
Number of clients with fees greater than $1 million: | | | | | | | | | | | | |
Financial Advisory | | | 304 | | | | 370 | | | | 261 | |
Percentage of total Financial Advisory net revenue from top 10 clients (a) | | | 19 | % | | | 15 | % | | | 19 | % |
Number of M&A transactions completed with values greater than $500 million (b) | | | 90 | | | | 104 | | | | 70 | |
(a)
| No individual client constituted more than 10% of our Financial Advisory segment net revenue in the years ended December 31, 2022, 2021 and 2020.
|
(b)
| Source: Dealogic as of January 4, 2023.
|
| | | | | | | | | | | | | | | | | |
| Year Ended December 31, |
| 2023 | | 2022 | | 2021 |
| Lazard Statistics: | | | | | |
| Number of clients with fees greater than $1 million: | | | | | |
| Financial Advisory | 299 | | 304 | | 370 |
| Percentage of total Financial Advisory net revenue from top 10 clients (a) | 19 | % | | 19 | % | | 15 | % |
| Number of M&A transactions completed with values greater than $500 million (b) | 47 | | 91 | | 104 |
________________________
(a)No individual client constituted more than 10% of our Financial Advisory segment net revenue in the years ended December 31, 2023, 2022 and 2021.
(b)Source: Dealogic as of January 5, 2024.
The geographical distribution of Financial Advisory net revenue is set forth below in percentage terms and is based on the Lazard offices that generate Financial Advisory net revenue, which are located in the Americas (U.S. and
Latin America), EMEA (primarily in the U.K., France, Germany, Italy and Spain) and the Asia Pacific region and therefore may not be reflective of the geography in which the clients are located.
| | Year Ended December 31, | |
| | 2022 | | | 2021 | | | 2020 | |
| Year Ended December 31, | | | Year Ended December 31, |
| 2023 | | | 2023 | | 2022 | | 2021 |
Americas | | | 59 | % | | | 63 | % | | | 67 | % | Americas | 55 | % | | 59 | % | | 63 | % |
EMEA | | | 40 | | | | 36 | | | | 31 | |
Asia Pacific | | | 1 | | | | 1 | | | | 2 | |
Total | | | 100 | % | | | 100 | % | | | 100 | % | Total | 100 | % | | 100 | % | | 100 | % |
The Company’s managing directors and many of its professionals have significant experience, and many of them are able to use this experience to advise on
a combination of M&A, restructuring and other strategic advisory matters, depending on clients’ needs. This
flexibility allowsadaptability enables Lazard to
better matchmore effectively deploy its professionals
withto best advantage based on the
often counter-cyclical
business cyclesnature of
mergers and acquisitions and restructurings.restructuring as compared to our M&A business. While Lazard measures revenue by practice area, Lazard does not separately measure the costs or profitability of M&A services as compared to restructuring or other services. Accordingly, Lazard measures performance in its Financial Advisory segment based on overall segment operating revenue and operating income margins.
48
Financial Advisory Results of Operations
Year Ended December 31,
20222023 versus December 31,
20212022
Financial Advisory net revenue decreased
$139$271 million, or
8%16%, as compared to
2021.2022. The decrease in Financial Advisory net revenue was primarily
a result of a decrease in thedriven by decreased number of
fees between $1 million and $5completed M&A transactions with values greater than $500 million as compared to
2021.2022, reflecting a significant decline in industry-wide completed M&A transactions.
Operating expenses,
decreased $53which include $97 million associated with cost-saving initiatives in 2023, increased $191 million, or
4%15%, as compared to
2021, primarily due to decreased compensation and benefits expense associated with decreased operating revenue, partially offset by increased marketing and business development expenses from higher travel.2022.
The Financial Advisory operating
incomeloss was
$363$99 million,
a decrease of $85 million, or 19%, as compared to operating income of
$448$363 million in
20212022 and, as a percentage of net revenue, was
21.9%(7.2)%, as compared to
25.0%21.9% in
2021.2022.
AUM primarily consists of debt and equity instruments, which have a value that is readily available based on either prices quoted on a recognized exchange or prices provided by external pricing services.
Prices of equity and debt securities and other instruments that comprise our AUM are provided by well-recognized, independent, third-party vendors. Such third-party vendors rely on prices provided by external pricing services which are obtained from recognized exchanges or markets, or, for certain fixed income securities, from evaluated bids or other similarly sourced price.
Either directly, or through our third-party vendors, we perform a variety of regular due diligence procedures on our pricing service providers.
The following table shows the composition of AUM for the Asset Management segment (see Item 1, “Business—Principal Business Lines—Asset Management—Investment Strategies”):
| | As of December 31, | |
| | 2022 | | | 2021 | | | 2020 | |
| | ($ in millions) | |
| As of December 31, | | | As of December 31, |
| 2023 | | | 2023 | | 2022 | | 2021 |
| ($ in millions) | | | ($ in millions) |
AUM by Asset Class: | | | | | | | | | | | | |
Equity: | | | | | | | | | | | | |
| Equity: | |
| Equity: | |
| Emerging Markets | |
| Emerging Markets | |
Emerging Markets | | $ | 21,557 | | | $ | 31,227 | | | $ | 33,254 | |
Global | | | 46,861 | | | | 59,516 | | | | 56,246 | |
Local | | | 47,504 | | | | 56,310 | | | | 48,672 | |
Multi-Regional | | | 51,473 | | | | 73,953 | | | | 71,560 | |
Total Equity | | | 167,395 | | | | 221,006 | | | | 209,732 | |
Fixed Income: | | | | | | | | | | | | |
Emerging Markets | | | 8,944 | | | | 12,231 | | | | 13,651 | |
| Emerging Markets | |
| Emerging Markets | |
Global | | | 11,029 | | | | 14,410 | | | | 11,962 | |
Local | | | 5,352 | | | | 6,022 | | | | 5,600 | |
Multi-Regional | | | 18,061 | | | | 13,623 | | | | 12,571 | |
Total Fixed Income | | | 43,386 | | | | 46,286 | | | | 43,784 | |
Alternative Investments | | | 3,812 | | | | 4,203 | | | | 2,748 | |
| Other Alternative Investments | |
Private Equity | | | 1,038 | | | | 1,290 | | | | 1,420 | |
Cash Management | | | 494 | | | | 954 | | | | 958 | |
Total AUM | | $ | 216,125 | | | $ | 273,739 | | | $ | 258,642 | |
Total AUM at December 31, 20222023 was $216$247 billion, a decreasean increase of $58$31 billion, or 21%14%, as compared to total AUM of $274$216 billion at December 31, 20212022 due to market and foreign exchange depreciation andappreciation, partially offset by net outflows. Average AUM for the year ended December 31, 2022 decreased $452023 increased $6 billion, or 16%2%, as compared to 2021.
2022.
As of both December 31, 2023 and 2022, approximately 85% of our AUM was managed on behalf of institutional and intermediary clients, including corporations, labor unions, public pension funds, insurance companies and banks, and through sub-advisory relationships, mutual fund sponsors, broker-dealers and registered advisors, compared to 87% asadvisors. As of both December 31, 2021. As of December 31,2023 and 2022, approximately 15% of our AUM was managed on behalf of individual client relationships, which was principally with family offices and individuals, compared to approximately 13% asrelationships.
As of December 31,
2021.As of both December 31, 2022 and 2021,2023, AUM with foreign currency exposure represented approximately 65%64% of our total AUM.
AUM as compared to 65% at December 31, 2022. AUM with foreign currency exposure generally declines in value with
the strengthening of the U.S. Dollar and increases in value as the U.S. Dollar weakens, with all other factors held constant.
The following is a summary of changes in AUM by asset class for the years ended December 31,
2023, 2022
2021 and
2020:2021: | | Year Ended December 31, 2022 | |
| | AUM Beginning Balance | | | Inflows | | | Outflows | | | Net Flows | | | Market Value Appreciation/ (Depreciation) | | | Foreign Exchange Appreciation/ (Depreciation) | | | AUM Ending Balance | |
| | ($ in millions) | |
| Year Ended December 31, 2023 | | | Year Ended December 31, 2023 |
| AUM
Beginning
Balance | | | AUM
Beginning
Balance | | Inflows | | Outflows | | Net
Flows | | Market Value
Appreciation/
(Depreciation) | | Foreign
Exchange
Appreciation/
(Depreciation) | | AUM
Ending
Balance |
| ($ in millions) | | | ($ in millions) |
Equity | | $ | 221,006 | | | $ | 23,495 | | | $ | (39,319 | ) | | $ | (15,824 | ) | | $ | (30,438 | ) | | $ | (7,349 | ) | | $ | 167,395 | |
Fixed Income | | | 46,286 | | | | 9,890 | | | | (10,488 | ) | | | (598 | ) | | | (688 | ) | | | (1,614 | ) | | | 43,386 | |
Other | | | 6,447 | | | | 2,645 | | | | (3,138 | ) | | | (493 | ) | | | (418 | ) | | | (192 | ) | | | 5,344 | |
Total | | $ | 273,739 | | | $ | 36,030 | | | $ | (52,945 | ) | | $ | (16,915 | ) | | $ | (31,544 | ) | | $ | (9,155 | ) | | $ | 216,125 | |
Inflows include approximately $3.9 billion related to a wealth management acquisition.
Inflows in the Equity asset class were primarily attributable to the Global and Multi-Regional platforms, and
inflows in the Fixed Income asset class were primarily attributable to the Multi-Regional and Global platforms. Outflows in
the Equity asset class were primarily attributable to the Global, Multi-Regional and
Emerging Markets equityLocal platforms, and outflows in the Fixed Income asset class were primarily attributable to the
Multi-Regional and Global
Emerging Markets and Multi-Regional platforms.
| | Year Ended December 31, 2021 | |
| | AUM Beginning Balance | | | Inflows | | | Outflows | | | Net Flows | | | Market Value Appreciation/ (Depreciation) | | | Foreign Exchange Appreciation/ (Depreciation) | | | AUM Ending Balance | |
| | ($ in millions) | |
| Year Ended December 31, 2022 | | | Year Ended December 31, 2022 |
| AUM
Beginning
Balance | | | AUM
Beginning
Balance | | Inflows | | Outflows | | Net
Flows | | Market Value
Appreciation/
(Depreciation) | | Foreign
Exchange
Appreciation/
(Depreciation) | | AUM
Ending
Balance |
| ($ in millions) | | | ($ in millions) |
Equity | | $ | 209,732 | | | $ | 27,229 | | | $ | (44,372 | ) | | $ | (17,143 | ) | | $ | 34,730 | | | $ | (6,313 | ) | | $ | 221,006 | |
Fixed Income | | | 43,784 | | | | 12,597 | | | | (8,517 | ) | | | 4,080 | | | | 704 | | | | (2,282 | ) | | | 46,286 | |
Other | | | 5,126 | | | | 3,005 | | | | (1,515 | ) | | | 1,490 | | | | (50 | ) | | | (119 | ) | | | 6,447 | |
Total | | $ | 258,642 | | | $ | 42,831 | | | $ | (54,404 | ) | | $ | (11,573 | ) | | $ | 35,384 | | | $ | (8,714 | ) | | $ | 273,739 | |
| | Year Ended December 31, 2020 | |
| | AUM Beginning Balance | | | Inflows | | | Outflows | | | Net Flows | | | Market Value Appreciation/ (Depreciation) | | | Foreign Exchange Appreciation/ (Depreciation) | | | AUM Ending Balance | |
| | ($ in millions) | |
| Year Ended December 31, 2021 | | | Year Ended December 31, 2021 |
| AUM
Beginning
Balance | | | AUM
Beginning
Balance | | Inflows | | Outflows | | Net
Flows | | Market Value
Appreciation/
(Depreciation) | | Foreign
Exchange
Appreciation/
(Depreciation) | | AUM
Ending
Balance |
| ($ in millions) | | | ($ in millions) |
Equity | | $ | 205,541 | | | $ | 30,514 | | | $ | (43,973 | ) | | $ | (13,459 | ) | | $ | 13,613 | | | $ | 4,037 | | | $ | 209,732 | |
Fixed Income | | | 38,263 | | | | 11,255 | | | | (9,509 | ) | | | 1,746 | | | | 2,550 | | | | 1,225 | | | | 43,784 | |
Other | | | 4,435 | | | | 1,075 | | | | (730 | ) | | | 345 | | | | 235 | | | | 111 | | | | 5,126 | |
Total | | $ | 248,239 | | | $ | 42,844 | | | $ | (54,212 | ) | | $ | (11,368 | ) | | $ | 16,398 | | | $ | 5,373 | | | $ | 258,642 | |
As of January 31, 2023, AUM was $230.6 billion, a $14.5 billion increase since December 31, 2022. The increase in AUM was due to market appreciation of $11.6 billion, foreign exchange appreciation of $2.0 billion, net inflows of $1.1 billion, partially offset by other decreases of $146 million.
Average AUM for the years ended December 31, 2023, 2022 2021 and 20202021 for each significant asset class is set forth below. Average AUM generally represents the average of the monthly ending AUM balances for the period.
| | Year Ended December 31, | |
| | 2022 | | | 2021 | | | 2020 | |
| | ($ in millions) | |
| Year Ended December 31, | | | Year Ended December 31, |
| 2023 | | | 2023 | | 2022 | | 2021 |
| ($ in millions) | | | ($ in millions) |
Average AUM by Asset Class: | | | | | | | | | | | | |
| Equity | |
| Equity | |
Equity | | $ | 179,178 | | | $ | 220,146 | | | $ | 182,308 | |
Fixed Income | | | 42,093 | | | | 46,252 | | | | 38,575 | |
Alternative Investments | | | 4,167 | | | | 3,492 | | | | 2,221 | |
| Other Alternative Investments | |
Private Equity | | | 1,165 | | | | 1,318 | | | | 1,402 | |
Cash Management | | | 841 | | | | 843 | | | | 855 | |
Total Average AUM | | $ | 227,444 | | | $ | 272,051 | | | $ | 225,361 | |
The following table summarizes the reported operating results attributable to the Asset Management segment:
| | Year Ended December 31, | |
| | 2022 | | | 2021 | | | 2020 | |
| | ($ in thousands) | |
| Year Ended December 31, | | | Year Ended December 31, |
| 2023 | | | 2023 | | 2022 | | 2021 |
| ($ in thousands) | | | ($ in thousands) |
Net Revenue | | $ | 1,204,927 | | | $ | 1,424,985 | | | $ | 1,167,466 | |
Operating Expenses | | | 963,640 | | | | 1,032,825 | | | | 861,031 | |
Operating Income | | $ | 241,287 | | | $ | 392,160 | | | $ | 306,435 | |
Operating Income, as a % of net revenue | | | 20.0 | % | | | 27.5 | % | | | 26.2 | % | Operating Income, as a % of net revenue | 12.2 | % | | 20.0 | % | | 27.5 | % |
(a)See Note 18 of Notes to Consolidated Financial Statements for information regarding cost-saving initiatives.
Our top ten clients accounted for
27%29%,
29%27% and
27%29% of our total AUM at December 31,
2023, 2022
2021 and
2020,2021, respectively, and no individual client constituted more than 10% of our Asset Management segment net revenue during any of the respective years.
The geographical distribution of Asset Management net revenue is set forth below in percentage terms, and is based on the Lazard offices that manage and distribute the respective AUM amounts. Such geographical distribution may not be reflective of the geography of the investment products or clients.
| | Year Ended December 31, | |
| | 2022 | | | 2021 | | | 2020 | |
| Year Ended December 31, | | | Year Ended December 31, |
| 2023 | | | 2023 | | 2022 | | 2021 |
Americas | | | 48 | % | | | 48 | % | | | 52 | % | Americas | 42 | % | | 48 | % | | 48 | % |
EMEA | | | 41 | | | | 42 | | | | 37 | |
Asia Pacific | | | 11 | | | | 10 | | | | 11 | |
Total | | | 100 | % | | | 100 | % | | | 100 | % | Total | 100 | % | | 100 | % | | 100 | % |
Asset Management Results of Operations
Year Ended December 31,
20222023 versus December 31,
20212022
Asset Management net revenue decreased
$220$53 million, or
15%4%, as compared to
2021.2022. Management fees and other revenue was
$1,138$1,122 million, a decrease of
$167$16 million, or
13%1%, as compared to
$1,305$1,138 million in
2021, primarily due to a decrease in average AUM.2022. Incentive fees were
$67$30 million, a decrease of
$53$38 million, as compared to
$120$67 million in
2021.2022.
Operating expenses,
decreased $69which included $57 million associated with cost-saving initiatives in 2023, increased $48 million, or
7%5%, as compared to
2021, primarily due to decreased compensation and benefits expense associated with decreased operating revenue.51
2022.
Asset Management operating income was
$241$140 million, a decrease of
$151$101 million, or
38%42%, as compared to operating income of
$392$241 million in
20212022 and, as a percentage of net revenue, was
20.0%12.2%, as compared to
27.5%20.0% in
2021.2022.
The following table summarizes the reported operating results attributable to the Corporate segment:
| | Year Ended December 31, | |
| | 2022 | | | 2021 | | | 2020 | |
| | ($ in thousands) | |
Interest Income | | $ | 18,893 | | | $ | 2,877 | | | $ | 3,526 | |
Interest Expense | | | (75,911 | ) | | | (75,152 | ) | | | (75,448 | ) |
| Year Ended December 31, | | | Year Ended December 31, |
| 2023 | | | 2023 | | 2022 | | 2021 |
| ($ in thousands) | | | ($ in thousands) |
| Interest income | |
| Interest expense | |
Net Interest Expense | | | (57,018 | ) | | | (72,275 | ) | | | (71,922 | ) |
Other Revenue (Loss) | | | (39,216 | ) | | | 76,367 | | | | 49,954 | |
Net Revenue (Loss) | | | (96,234 | ) | | | 4,092 | | | | (21,968 | ) |
Operating Expenses (Credits) | | | (12,534 | ) | | | 73,872 | | | | 68,836 | |
Operating Loss | | $ | (83,700 | ) | | $ | (69,780 | ) | | $ | (90,804 | ) |
(a)See Note 18 of Notes to Consolidated Financial Statements for information regarding cost-saving initiatives.
Corporate Results of Operations
Year Ended December 31,
20222023 versus December 31,
20212022
Net interest expense decreased
$15$2 million, or
21%4%, as compared to
2021, primarily due to higher interest income which reflected rising interest rates as compared to 2021.2022.
Other revenue
decreased $116 million as compared to 2021, primarily due to losses in 2022 as compared to(loss) was positively impacted by gains
in 2021 attributable to investments held in connection with
LFI.LFI in 2023, as compared to losses in 2022. Such gains in 2023 were offset by losses incurred from the impairment of equity method investments and the liquidation of LGAC in February 2023.
Operating expenses
decreased $86increased $144 million, as compared to
2021,2022 primarily due to
decreased compensation$37 million associated with cost-saving initiatives in 2023, and
benefits expense which reflectedcharges in 2023 as compared to credits in 2022
as compared to charges in 2021 pertaining to LFI.
The Company’s cash flows are influenced primarily by the timing of the receipt of Financial Advisory and Asset Management fees, the timing of distributions to members, payments of incentive compensation to managing directors and employees and purchases of common stock.
M&A and other advisory and Asset Management fees are generally collected within 60 days of billing, while Restructuring fee collections may extend beyond 60 days, particularly those that involve bankruptcies with court-ordered holdbacks. Fees from our Private Capital Advisory activities are generally collected over a four-year period from billing and typically include an interest component.
The Company makes cash payments for a significant portion of its incentive compensation during the first three months of each calendar year with respect to the prior year’s results.
See the Consolidated Financial Statements—
Consolidated Statements of Cash Flows for further detail.
Summary of Cash Flows:
| | Year Ended December 31, | |
| | 2022 | | | 2021 | | | 2020 | |
| | ($ in millions) | |
Cash Provided By (Used In): | | | | | | | | | | | | |
Operating activities: | | | | | | | | | | | | |
Net income | | $ | 439 | | | $ | 669 | | | $ | 457 | |
Adjustments to reconcile net income to net cash provided by operating activities (a) | | | 511 | | | | 503 | | | | 454 | |
Other operating activities (b) | | | (117 | ) | | | (252 | ) | | | (359 | ) |
Net cash provided by operating activities | | | 833 | | | | 920 | | | | 552 | |
Investing activities | | | (56 | ) | | | (39 | ) | | | (63 | ) |
Financing activities (c) | | | (1,407 | ) | | | 183 | | | | (526 | ) |
Effect of exchange rate changes | | | (186 | ) | | | (162 | ) | | | 148 | |
Net Increase (Decrease) in Cash and Cash Equivalents and Restricted Cash | | | (816 | ) | | | 902 | | | | 111 | |
Cash and Cash Equivalents and Restricted Cash (d): | | | | | | | | | | | | |
Beginning of Period | | | 3,401 | | | | 2,499 | | | | 2,388 | |
End of Period | | $ | 2,585 | | | $ | 3,401 | | | $ | 2,499 | |
(a)
| Consists of the following:
|
| | Year Ended December 31, | |
| | 2022 | | | 2021 | | | 2020 | |
| | ($ in millions) | |
Depreciation and amortization of property | | $ | 42 | | | $ | 38 | | | $ | 35 | |
Noncash lease expense | | | 60 | | | | 74 | | | | 65 | |
Currency translation adjustment reclassification | | | - | | | | (8 | ) | | | - | |
Amortization of deferred expenses and share-based incentive compensation | | | 405 | | | | 393 | | | | 345 | |
Deferred tax provision | | | 4 | | | | 6 | | | | 7 | |
Amortization of intangible assets related to acquisitions | | | - | | | | - | | | | 2 | |
Total | | $ | 511 | | | $ | 503 | | | $ | 454 | |
(b)
| Includes net changes in operating assets and liabilities.
|
(c)
| Consists primarily of purchases of shares of common stock, tax withholdings related to the settlement of vested RSUs, vested RSAs and vested PRSUs, changes in customer deposits, distributions to members and noncontrolling interest holders, and in 2021, contributions from redeemable noncontrolling interests and payments of underwriting fees and other offering costs associated with the LGAC IPO.
|
| | | | | | | | | | | | | | | | | |
| Year Ended December 31, |
| 2023 | | 2022 | | 2021 |
| ($ in millions) |
| Cash Provided By (Used In): | | | | | |
| Operating activities: | | | | | |
| Net income (loss) | $ | (159) | | | $ | 439 | | | $ | 669 | |
| Adjustments to reconcile net income to net cash provided by operating activities (a) | 580 | | | 511 | | | 503 | |
| Other operating activities (b) | (250) | | | (117) | | | (252) | |
| Net cash provided by (used in) operating activities | 171 | | | 833 | | | 920 | |
| Investing activities | (38) | | | (56) | | | (39) | |
| Financing activities (c) | (1,528) | | | (1,407) | | | 183 | |
| Effect of exchange rate changes | 30 | | | (186) | | | (162) | |
| Net Increase (Decrease) in Cash and Cash Equivalents and Restricted Cash | (1,365) | | | (816) | | | 902 | |
| Cash and Cash Equivalents and Restricted Cash (d): | | | | | |
| Beginning of Period | 2,585 | | | 3,401 | | | 2,499 | |
| End of Period | $ | 1,220 | | | $ | 2,585 | | | $ | 3,401 | |
(d)
| Consists of cash and cash equivalents, deposits with banks and short-term investments and restricted cash.
|
________________________(a)Consists primarily of amortization of deferred expenses and share-based incentive compensation, noncash lease expenses, depreciation and amortization of property and deferred tax provision (benefit).
(b)Includes net changes in operating assets and liabilities.
(c)Consists primarily of purchases of shares of common stock, tax withholdings related to the settlement of vested RSUs, vested RSAs and vested PRSUs, changes in customer deposits, distributions to members and noncontrolling interest holders, distributions to redeemable noncontrolling interests associated with LGAC’s redemption of all its outstanding Class A ordinary shares in 2023, and contributions from redeemable noncontrolling interests and payments of underwriting fees and other offering costs associated with the LGAC IPO in 2021.
(d)Consists of cash and cash equivalents, deposits with banks and short-term investments and restricted cash.
Liquidity and Capital Resources
The Company’s liquidity and capital resources are derived from
operating activities, financing activitiesmultiple sources as described in “—Sources and
equity offerings.Operating Activities
Uses of Liquidity”.
Sources and Uses of Liquidity
Net revenue, operating income and cash receipts fluctuate significantly between periods and could be affected by various risks and uncertainties.
InWhile cash flow from Asset Management activities is relatively stable, in the case of Financial Advisory, fee receipts are generally dependent upon the successful completion of client transactions, the occurrence and timing of which is irregular and not subject to Lazard’s control.
53
Liquidity is significantly impacted by cash payments for incentive compensation, a significant portion of which are made during the first three months of the year. As a consequence, cash on hand generally declines in the beginning of the year and gradually builds over the remainder of the year. We also pay certain tax advances during the year on behalf of certain managing directors, which serve to reduce their respective incentive compensation payments. Additionally, we made payments in August 2023 with respect to deferred cash awards and throughout the year relating to severance and other employee termination costs associated with the cost-saving initiatives. We expect this seasonal patternto make the majority of cash flowadditional payments relating to continue.severance and other employee termination costs associated with the cost-saving initiatives through the first half of 2024. (See Note 18 of Notes to Consolidated Financial Statements).
Liquidity is also affected by the level of
LFB customer-related demand deposits,
primarily from clients and
other customer payables, principally at LFB.funds managed by LFG. To the extent that such deposits
and other customer payables rise or fall, this has a corresponding impact on liquidity held at LFB, with the majority of such amounts generally being recorded in “deposits with banks and short-term investments”. In the year ended December 31,
2022,2023, as reflected on the consolidated statements of financial condition, both “deposits
and other customer payables” and “deposits with banks and short-term investments”
and “deposits and other customer payables” decreased as compared to December 31,
2021,2022, due primarily to customer deposits withdrawals driven by the rising interest rate environment. LFB is subject to, and
reflect the level of LFB customer-related demand deposits, primarily from clientsin compliance with, regulatory liquidity coverage ratios and
funds managed by LFG.Lazard’s consolidated financial statementsliquidity levels are presented in U.S. Dollars. Many of Lazard’s non-U.S. subsidiaries havemonitored on a functional currency (i.e., the currency in which operational activities are primarily conducted) that is other than the U.S. Dollar, generally the currency of the country in which such subsidiaries are domiciled. Such subsidiaries’ assets and liabilities are translated into U.S. Dollars at the respective balance sheet date exchange rates, while revenue and expenses are translated at average exchange rates during the year based on the daily closing exchange rates. Adjustments that result from translating amounts from a subsidiary’s functional currency are reported as a component of members’ equity. Foreign currency remeasurement gains and losses on transactions in non-functional currencies are included on the consolidated statements of operations.
basis.
We regularly monitor our liquidity position, including cash levels, lease obligations, investments,
in U.S. Treasury securities, credit lines, principal investment commitments, interest and principal payments on debt, capital expenditures,
distributionsdistribution to members, purchases of shares of common stock,
compensation and matters relating to liquidity and to compliance with regulatory net capital requirements. At December 31,
2022,2023, Lazard had approximately
$1,180$966 million of cash, including approximately
$652$595 million held at Lazard’s operations outside the U.S. Lazard provides for income taxes on substantially all of its foreign earnings. We expect that no material amount of additional taxes would be recognized upon receipt of dividends or distributions of such earnings from our foreign operations.
As of December 31,
2022,2023, the Company’s remaining lease obligations were
$79$82 million for
2023, $1422024, $138 million from
20242025 through
2025, $1162026, $123 million from
20262027 through
20272028 and
$264$221 million through
2033.2034.
As of December 31,
2022,2023, Lazard had approximately
$204$209 million in unused lines of credit available to it, including a $200 million,
three-year,five-year, senior revolving credit facility
with a group of lenders that expires in July 2023 (the “Amendedunder the Second Amended and Restated Credit
Agreement”).Agreement.
The
Second Amended and Restated Credit Agreement contains customary terms and conditions, including limitations on consolidations, mergers, indebtedness and certain payments, as well as financial condition covenants relating to leverage and interest coverage ratios. Lazard Group’s obligations under the
Second Amended and Restated Credit Agreement may be accelerated upon customary events of default, including non-payment of principal or interest, breaches of covenants, cross-defaults to other material debt, a change in control and specified bankruptcy events. Borrowings under the
Second Amended and Restated Credit Agreement generally will bear interest at
LIBORadjusted term SOFR plus an applicable margin for specific interest periods determined based on Lazard Group’s highest credit rating from an internationally recognized credit agency.
54
As long as the lenders’ commitments remain in effect, any loan pursuant to the Amended and Restated Credit Agreement remains outstanding and unpaid or any other amount is due to the lending bank group, the
The Second Amended and Restated Credit Agreement includes financial covenants that require that Lazard Group not permit (i) its Consolidated Leverage Ratio (as defined in the
Second Amended and Restated Credit Agreement) for the 12-month period ending on the last day of any fiscal quarter to be greater than 3.25 to 1.00, provided that the Consolidated Leverage Ratio may be greater than 3.25 to 1.00 for
twofour (consecutive or nonconsecutive) quarters so long as it is not greater than 3.50 to 1.00 on the last day of any such quarter, or (ii) its Consolidated Interest Coverage Ratio (as defined in the
Second Amended and Restated Credit Agreement) for the 12-month period ending on the last day of any fiscal quarter to be less than 3.00 to 1.00. For the 12-month period ended December 31,
2022,2023, Lazard Group was in compliance with such
ratios, with its Consolidated Leverage Ratio being 1.63 to 1.00 and its Consolidated Interest Coverage Ratio being 14.82 to 1.00.ratios. In any event, no amounts were outstanding under the
Second Amended and Restated Credit Agreement as of December 31,
2022.2023.
In addition, the
Second Amended and Restated Credit Agreement contains certain other covenants (none of which relate to financial condition), events of default and other customary
provisions and also contains customary LIBOR-replacement mechanics.provisions. At December 31,
2022,2023, the Company was in compliance with all of these provisions.
Lazard’s annual cash flow generated from operations historically has been sufficient to enable it to meet its annual obligations. We believe that
our cash flows from operating activitiesthe sources of liquidity described above should be sufficient for us to fund our current obligations for the next 12 months.
See also Notes
13, 15,14, 16,
17, 19 and
1721 of Notes to Consolidated Financial Statements regarding information in connection with commitments, incentive plans, employee benefit plans,
and income taxes
and regulatory requirements, respectively.
Financing Activities
Senior Debt
The table below sets forth our corporate indebtedness as of December 31,
20222023 and
2021.2022. The agreements with respect to this indebtedness are discussed in more detail in our consolidated financial statements and related notes included elsewhere in this Form 10-K.
| | | | Outstanding as of | |
| | | | December 31, 2022 | | | December 31, 2021 | |
| | | | Outstanding as of | | | | | | Outstanding as of |
| | | | December 31, 2023 | | | | | | December 31, 2023 | | December 31, 2022 |
Senior Debt | | Maturity Date | | Principal | | | Unamortized Debt Costs | | | Carrying Value | | | Principal | | | Unamortized Debt Costs | | | Carrying Value | | Senior Debt | | Maturity | | Principal | | Unamortized
Debt Costs | | Carrying
Value | | Principal | | Unamortized
Debt Costs | | Carrying
Value |
| | | | ($ in millions) | |
| | | | ($ in millions) | | | | | | ($ in millions) |
Lazard Group 2025 Senior Notes | | 2025 | | $ | 400.0 | | | $ | 1.0 | | | $ | 399.0 | | | $ | 400.0 | | | $ | 1.5 | | | $ | 398.5 | |
Lazard Group 2027 Senior Notes | | 2027 | | | 300.0 | | | | 1.6 | | | | 298.4 | | | | 300.0 | | | | 2.0 | | | | 298.0 | |
Lazard Group 2028 Senior Notes | | 2028 | | | 500.0 | | | | 4.9 | | | | 495.1 | | | | 500.0 | | | | 5.7 | | | | 494.3 | |
Lazard Group 2029 Senior Notes | | 2029 | | | 500.0 | | | | 4.8 | | | | 495.2 | | | | 500.0 | | | | 5.6 | | | | 494.4 | |
| | | | $ | 1,700.0 | | | $ | 12.3 | | | $ | 1,687.7 | | | $ | 1,700.0 | | | $ | 14.8 | | | $ | 1,685.2 | |
| | | | $ | |
The indenture and supplemental indentures relating to Lazard Group’s senior notes contain certain covenants (none of which relate to financial condition), events of default and other customary provisions. At December 31,
2022,2023, the Company was in compliance with all of these provisions. We may, to the extent required and subject to restrictions contained in our financing arrangements, use other financing sources, which may cause us to be subject to additional restrictions or covenants.
See Note
1213 of Notes to Consolidated Financial Statements for additional information regarding senior debt.
55
At December 31,
2022,2023, total members’ equity was
$467$182 million, as compared to
$874$467 million and
$711$874 million at December 31,
20212022 and
2020,2021, respectively, including
$136 million, $358 million
$776 million and
$625$776 million attributable to Lazard Group on the respective dates. The net activity in members’ equity during the years ended December 31,
20222023 and
20212022 is reflected in the table below:
| | Year Ended December 31, | |
| | 2022 | | | 2021 | |
| | ($ in millions) | |
Members’ Equity - Beginning of Year | | $ | 874 | | | $ | 711 | |
Increase (decrease) due to: | | | | | | | | |
Net income (a) | | | 425 | | | | 673 | |
Other comprehensive income (loss) | | | (72 | ) | | | (16 | ) |
Amortization of share-based incentive compensation | | | 241 | | | | 234 | |
Purchase of common stock | | | (692 | ) | | | (406 | ) |
Settlement of share-based incentive compensation (b) | | | (62 | ) | | | (68 | ) |
Distribution to members and noncontrolling interests, net | | | (259 | ) | | | (244 | ) |
Contributions from members | | | - | | | | 14 | |
Change in redemption value of redeemable noncontrolling interests | | | 6 | | | | (44 | ) |
Other - net | | | 6 | | | | 20 | |
Members’ Equity - End of Year | | $ | 467 | | | $ | 874 | |
| (a)
| Excludes net income (loss) associated with redeemable noncontrolling interests of $14 million and $(4) million in 2022 and 2021, respectively.
|
| (b)
| The tax withholding portion of share-based compensation is settled in cash, not shares.
|
| | | | | | | | | | | |
| Year Ended December 31, |
| 2023 | | 2022 |
| ($ in millions) |
| Members’ Equity - Beginning of Year | $ | 467 | | | $ | 874 | |
| Increase (decrease) due to: | | | |
| Net income (loss) (a) | (171) | | | 425 | |
| Other comprehensive income (loss) | 6 | | | (72) | |
| Amortization of share-based incentive compensation | 251 | | | 241 | |
| Purchase of common stock | (102) | | | (692) | |
| Settlement of share-based incentive compensation (b) | (55) | | | (62) | |
| Distribution to members and noncontrolling interests | (166) | | | (259) | |
| LFI Consolidated Funds | (74) | | | 18 | |
| Other - net | 26 | | | (6) | |
| Members’ Equity - End of Year | $ | 182 | | | $ | 467 | |
______________________
(a)Excludes net income associated with redeemable noncontrolling interests of $12 million and $14 million in 2023 and 2022, respectively.
(b)The tax withholding portion of share-based compensation is settled in cash, not shares.
See the Consolidated Financial Statements—Consolidated Statements of Changes in Members’ Equity and Redeemable Noncontrolling Interests for further detail.
The Board of Directors of Lazard has issued a series of authorizations to repurchase common stock, which help offset the dilutive effect of our share-based incentive compensation plans.
During a given year Lazard
Ltd intendsaims to repurchase at least as many shares as it expects to issue pursuant to such compensation plans in respect of year-end incentive compensation
attributable to the prior year.over time. The rate at which Lazard
Ltd purchases shares in connection with this annual objective may vary from period to period due to a variety of factors. Purchases with respect to such program are set forth in the table below:
| Year Ended December 31: | | Number of Shares | | | Average Price Per Share | | Year Ended December 31: | | Number of
Shares Purchased | | Average
Price Per
Share |
2020 | | | 2,912,035 | | | $ | 32.70 | |
2021 | | | 9,124,295 | | | $ | 44.51 | |
2022 | | | 19,666,798 | | | $ | 35.17 | |
| 2023 | |
As of December 31,
2022,2023, a total of
$302$200 million of share repurchase authorization
remainedremaining available under Lazard Ltd’s share repurchase program
which authorization will expire on December 31, 2024.
During the year ended December 31,
2022,2023, Lazard Ltd had in place trading plans under Rule 10b5-1 of the Securities Exchange Act of 1934, as amended (the “Exchange Act”), pursuant to which it effected stock repurchases in the open market.
See Notes
1415 and
1516 of Notes to Consolidated Financial Statements for additional information regarding Lazard’s members’ equity and incentive plans, respectively.
We actively monitor our regulatory capital base. Our principal subsidiaries are subject to regulatory requirements in their respective jurisdictions to ensure their general financial soundness and liquidity, which require,
56
among other things, that we comply with rules regarding certain minimum capital requirements, record-keeping, reporting procedures, relationships with customers, experience and training requirements for employees and certain other requirements and procedures.requirements. These regulatory requirements may restrict the flow of funds to and from affiliates. See Note 1921 of Notes to Consolidated Financial Statements for further information. These regulations differ in the U.S., the U.K., France and other countries in which we operate. Our capital structure is designed to provide each of our subsidiaries with capital and liquidity consistent with its business and regulatory requirements. For a discussion of regulations relating to us, see Item 1, “Business—Regulation” included in this Form 10-K.
Critical Accounting Policies and Estimates
The preparation of Lazard’s consolidated financial statements, in conformity with U.S. GAAP, requires us to make estimates and assumptions that affect the reported amounts of assets, liabilities, revenue and expenses, and related disclosure of contingent assets and liabilities. On an ongoing basis, Lazard evaluates its estimates, including those related to revenue recognition, the allowance for credit losses, income taxes and goodwill. Lazard bases these estimates on historical experience and various other assumptions that it believes to be reasonable under the circumstances, the results of which form the basis for making judgments, including judgments regarding the carrying values of assets and liabilities, that are not readily apparent from other sources. Actual results may differ from these estimates.
The following is a description of Lazard’s critical accounting estimates and judgments used in the preparation of its consolidated financial statements.
Lazard generates substantially all of its revenue from providing Financial Advisory and Asset Management services to clients. Lazard recognizes revenue in accordance with the criteria in Note 2 of Notes to Consolidated Financial Statements.
Assessment of these criteria requires the application of judgment in determining the timing and amount of revenue recognized, including the probability of collection of fees.
Allowance for Credit Losses
We maintain an allowance for credit losses to provide coverage for estimated losses from our receivables. We determine the adequacy of the allowance under the current expected credit losses (“CECL”) guidance by (i) applying a bad debt charge-off rate based on historical charge-off experience; (ii) estimating the probability of loss based on our analysis of the client’s creditworthiness
and specifically reserveresulting in specific reserves against exposures where we determine the receivables are uncollectible, which may include situations where a fee is in dispute or litigation has commenced; and (iii) performing qualitative assessments to monitor economic risks that may require additional adjustments.
The allowance for credit losses involves judgment including incorporation of historical loss experience and assessment of risk characteristics of our clients. The bad debt charge-off rate based on historical charge-off experience was an average annual rate estimated using the most recent two years of charge-off data. When assessing risk characteristics of individual clients, we considered the macroeconomic environment in the local market, our collection experience and recent communication with the client, as well as any potential future engagement with the client.
We have also considered risks associated with the COVID-19 pandemic that started in early 2020 and have made necessary adjustments to the allowance for risks associated with certain clients that had been adversely impacted.As part of the process of preparing our consolidated financial statements, we estimate our income taxes for each of our tax-paying entities in its respective jurisdiction. In addition to estimating actual current tax liabilities for these jurisdictions, we also must account for the tax effects of differences between the financial reporting and tax reporting of items, such as basis adjustments, compensation and benefits expense, and depreciation and
57
amortization. Differences which are temporary in nature result in deferred tax assets and liabilities. Significant judgment is required in determining our provision for income taxes, our deferred tax assets and liabilities, any valuation allowance recorded against our deferred tax assets and our unrecognized tax benefits.
We recognize a deferred tax asset if it is more likely than not (defined as a likelihood of greater than 50%) that a tax benefit will be accepted by the relevant taxing authority. The measurement of deferred tax assets and liabilities is based upon currently enacted tax rates in the applicable jurisdictions.
At December 31, 2022, on a consolidated basis, we recorded gross deferred tax assets of approximately $149 million, with such amount partially offset by a valuation allowance of approximately $80 million (as described below).Subsequent to the initial recognition of deferred tax assets, we also must continually assess the likelihood that such deferred tax assets will be realized. If we determine that we may not fully derive the benefit from a deferred tax asset, we consider whether it would be appropriate to apply a valuation allowance against the applicable deferred tax asset, taking into account all available information. The ultimate realization of a deferred tax asset for a particular entity depends, among other things, on the generation of taxable income by such entity in the applicable jurisdiction.
We consider multiple possible sources of taxable income when assessing a valuation allowance against a deferred tax asset. See Note 2 of Notes to Consolidated Financial Statements for additional information on sources of taxable income, and the information considered when assessing whether a valuation allowance is required.
The weight we give to any particular item is, in part, dependent upon the degree to which it can be objectively verified. We give greater weight to the recent results of operations of a relevant entity. Pre-tax operating losses on a three-year cumulative basis or lack of sustainable profitability are considered objectively verifiable evidence and will generally outweigh a projection of future taxable income.
Certain of our tax-paying entities have individually experienced losses on a cumulative three-year basis or have tax attributes that may expire unused. In addition, some of our tax-paying entities have recorded a valuation allowance on substantially all of their deferred tax assets due to the combined effect of operating losses in certain subsidiaries of these entities as well as foreign taxes that together substantially offset any U.S. tax liability. Taking into account all available information, we cannot determine that it is more likely than not that deferred tax assets held by these entities will be realized. Consequently, we have recorded valuation allowances on
$80 million of deferred tax assets held by these entities as of December 31,
2022.2023.
We record tax positions taken or expected to be taken in a tax return based upon our estimates regarding the amount that is more likely than not to be realized or paid, including in connection with the resolution of any related appeals or other legal processes. Accordingly, we recognize liabilities for certain unrecognized tax benefits based on the amounts
that are more likely than not to be settled with the relevant taxing authority. Such liabilities are evaluated periodically as new information becomes available and any changes in the amounts of such liabilities are recorded as adjustments to “income tax expense.” Liabilities for unrecognized tax benefits involve significant judgment and the ultimate resolution of such matters may be materially different from our estimates.
In addition to the discussion above regarding deferred tax assets and associated valuation allowances, as well as unrecognized tax benefit liability estimates, other factors affect our provision for income taxes, including changes in the geographic mix of our business, the level of our annual pre-tax income, transfer pricing and intercompany transactions.
See Item 1A, “Risk Factors” and Note
1719 of Notes to Consolidated Financial Statements for additional information related to income taxes.
Goodwill
In accordance with current accounting guidance, goodwill
Goodwill has an indefinite life and is tested for impairment annually, as of November 1, or more frequently if circumstances indicate impairment may have occurred. The
goodwill associated with each business combination is allocated to the related reporting units for impairment testing. The Company performs a qualitative
evaluationassessment about whether it is more likely than not that the fair value of a reporting unit is less than its carrying amount in lieu of actually calculating the fair value of the reporting unit. The
58
qualitative evaluationassessment includes significant judgment on the business outlook assumptions of each reporting unit based on historical data, current economic conditions, stock performance and industry trends. If events indicate that it is more likely than not that the reporting unit’s fair value is less than its carrying value, the Company performs a quantitative assessment to determine the fair value of the reporting unit and compares it to its carrying values. If the carrying value of a reporting unit exceeds its fair value, the Company would recognize an impairment loss equal to the excess. The goodwill impairment test as of November 1, 2022tests indicated that no reporting units were at risk of impairment. See Note 1011 of Notes to Consolidated Financial Statements for additional information regarding goodwill.
The consolidated financial statements include entities in which Lazard has a controlling
financial interest. Lazard determines whether it has a controlling
financial interest in an entity by first evaluating whether the entity is a voting interest entity (“VOE”) or a variable interest entity (“VIE”) under U.S. GAAP.
| •
| Voting Interest Entities. VOEs are entities in which (i) the total equity investment at risk is sufficient to enable the entity to finance itself independently and (ii) the equity holders have the obligation to absorb losses, the right to receive residual returns and the right to make decisions about the entity’s activities. Lazard is required to consolidate a VOE if it holds a majority of the voting interest in such VOE.
|
| •Voting Interest Entities. VOEs are entities in which (i) the total equity investment at risk is sufficient to enable the entity to finance itself independently and (ii) the equity holders have the obligation to absorb losses, the right to receive residual returns and the right to make decisions about the entity’s activities. Lazard is required to consolidate a VOE if it holds a majority of the voting interest in such VOE.• | Variable Interest Entities. VIEs are entities that lack one or more of the characteristics of a VOE. If Lazard has a variable interest, or a combination of variable interests, in a VIE, it is required to analyze whether it needs to consolidate such VIE. Lazard is required to consolidate a VIE if we are the primary beneficiary having (i) the power to direct the activities of the VIE that most significantly impact the VIE’s economic performance and (ii) the obligation to absorb losses of, or receive benefits from, the VIE that could be potentially significant to the VIE.
|
•Variable Interest Entities. VIEs are entities that lack one or more of the characteristics of a VOE. If Lazard has a variable interest, or a combination of variable interests, in a VIE, it is required to analyze whether it needs to consolidate such VIE. Lazard is required to consolidate a VIE if we are the primary beneficiary having (i) the power to direct the activities of the VIE that most significantly impact the VIE’s economic performance and (ii) the obligation to absorb losses of, or receive benefits from, the VIE that could be potentially significant to the VIE.
Lazard’s involvement with various entities that are VOEs or VIEs primarily arises from LFI investments,
investment management contracts with fund entitiesseed and other investments in our Asset Management business, and LGAC. Lazard
is not required to consolidate suchconsolidates these entities
because, with the exception of certain seed and LFI investments, and LGAC, as discussed below, we do not hold more than an inconsequential equity interest in such entities and we do not hold other variable interests (including our investment management agreements, which do not meet the definition of variable interests) in such entities.Lazard makes seed and LFI investments in certain entities that are considered VOEs and VIEs and often require consolidation aswhen it has a result of our investment. controlling financial interest.
The impact of seed and LFI investment entities that require consolidation on the consolidated financial statements, including any consolidation or deconsolidation of such entities, is not material to our financial statements. Our exposure to loss from entities in which we have made such investments is limited to the extent of our investment in, or investment commitment to, such entities.
Generally, when the Company initially invests to seed an investment entity, the Company is the majority owner of the entity. Our majority ownership in seed investment entities represents a controlling
financial interest, except when we are the general partner in such entities and the third-party investors have the right to replace the general partner. To the extent material, we consolidate seed and LFI investment entities in which we own a controlling
financial interest, and we would deconsolidate any such entity when we no longer have a controlling
financial interest in such entity.
Seed investments held in entities in which the Company maintained a controlling
financial interest were
$114 million in eleven entities as of December 31, 2023, as compared to $112 million in thirteen entities as of December 31,
2022, as compared to $74 million in ten entities as of December 31, 2021.2022. LFI investments held in entities in which the Company maintained a controlling
financial interest were
$144 million in nine entities as of December 31, 2023, as compared to $139 million in nine entities as of December 31,
2022, as compared to $175 million in ten entities as of December 31, 2021.2022.
As of December 31,
20222023 and
2021,2022, the Company did not consolidate any seed investment entities or LFI investment entities, with the exception of the consolidation of certain LFI funds (see Note
2123 of Notes to Consolidated Financial Statements). As such, seed investments and substantially all of LFI investments included in “investments” on the consolidated statements of financial condition represented the Company’s economic interest in the seed and LFI investments.
See Note 1 of Notes to Consolidated Financial Statements for additional information on the consolidation of LGAC.
59
Investments consist primarily of debt and equity securities, and interests in alternative investment, debt, equity and private equity funds. These investments are carried at fair value on the consolidated statements of financial condition and any increases or decreases in the fair value of these investments are reflected in earnings. The fair value of investments is generally based upon market prices or the net asset value (“NAV”) or its equivalent for investments in funds.
Investments also include those investments accounted for under the equity method of accounting. Any increases or decreases in the Company’s share of net income or losses pertaining to its equity method investments are reflected in earnings.
See Note
67 of Notes to Consolidated Financial Statements for additional information on the measurement of the fair value of investments.
Lazard is subject to market and
credit riskother risks on investments held. As such, gains and losses on investment positions held, which arise from sales or changes in the fair value of the investments, are not predictable and can cause periodic fluctuations in net income.
Data relating to investments is set forth below:
| | December 31, | |
| | 2022 | | | 2021 | |
| | ($ in thousands) | |
Seed investments by asset class: | | | | | | | | |
Equities (a) | | $ | 126,632 | | | $ | 121,627 | |
Fixed income | | | 14,774 | | | | 10,343 | |
Alternative investments | | | 31,634 | | | | 30,495 | |
Private equity | | | 18,508 | | | | - | |
Total seed investments | | | 191,548 | | | | 162,465 | |
Other investments owned: | | | | | | | | |
Private equity | | | 18,876 | | | | 30,127 | |
U.S. Treasury securities | | | - | | | | 299,990 | |
Fixed income and other | | | 23,337 | | | | 24,226 | |
Total other investments owned | | | 42,213 | | | | 354,343 | |
Subtotal | | | 233,761 | | | | 516,808 | |
Add: | | | | | | | | |
Private equity consolidated, not owned | | | 16,438 | | | | 16,462 | |
Equity method | | | 15,481 | | | | 16,250 | |
LFI | | | 433,297 | | | | 457,819 | |
Total investments | | $ | 698,977 | | | $ | 1,007,339 | |
(a)
| At December 31, 2022 and 2021, seed investments in directly owned equity securities were invested as follows:
|
| | December 31, | |
| | 2022 | | | 2021 | |
Percentage invested in: | | | | | | | | |
Financials | | | 15 | % | | | 16 | % |
Consumer | | | 34 | | | | 32 | |
Industrial | | | 12 | | | | 14 | |
Technology | | | 17 | | | | 26 | |
Other | | | 22 | | | | 12 | |
Total | | | 100 | % | | | 100 | % |
| | | | | | | | | | | |
| December 31, |
| 2023 | | 2022 |
| ($ in thousands) |
| Seed investments by asset class: | | | |
| Debt | $ | 4,285 | | | $ | – | |
| Equities (a) | 112,807 | | | 126,632 | |
| Fixed income | 15,860 | | | 14,774 | |
| Alternative investments | 33,073 | | | 31,634 | |
| Private equity | 19,361 | | | 18,508 | |
| Total seed investments | 185,386 | | | 191,548 | |
| Other investments owned: | | | |
| Private equity | 10,963 | | | 18,876 | |
| Fixed income and other | 2,119 | | | 23,337 | |
| Total other investments owned | 13,082 | | | 42,213 | |
| Subtotal | 198,468 | | | 233,761 | |
| Private equity consolidated, not owned | 16,494 | | | 16,438 | |
| Equity method | – | | | 15,481 | |
| LFI | 487,002 | | | 433,297 | |
| Total investments | $ | 701,964 | | | $ | 698,977 | |
_______________________
(a)At December 31, 2023 and 2022, seed investments in directly owned equity securities were invested as follows:
| | | | | | | | | | | |
| December 31, |
| 2023 | | 2022 |
| Percentage invested in: | | | |
| Financials | 14 | % | | 15 | % |
| Consumer | 32 | | | 34 | |
| Industrial | 15 | | | 12 | |
| Technology | 20 | | | 17 | |
| Other | 19 | | | 22 | |
| Total | 100 | % | | 100 | % |
The Company makes investments primarily to seed strategies in our Asset Management business or to reduce exposure arising from LFI and other similar deferred compensation arrangements. The Company
measuresmanages its net economic exposure to market and other risks arising from
seed investments
that it owns, excluding (i)and other investments
held in connectionowned. The Company does not hedge investments associated with LFI and other similar deferred compensation arrangements,
(ii)or investments in funds owned entirely by the noncontrolling interest holders,
of certain acquired entities and (iii) investments accounted for under the equity method of accounting.as there is no net economic exposure.
The market risk associated with investments held in connection with LFI and other similar deferred compensation arrangements is equally offset by the market risk associated with the derivative liability with respect to awards expected to vest. The Company is subject to market risk associated with any portion of such investments that employees may forfeit. See “—Risk Management—Risks Related to Derivatives” for risk management information relating to derivatives.
Risk sensitivities include the effects of economic hedging. For equity market price risk, investment portfolios and their corresponding hedges are beta-adjusted to the All-Country World equity index.
Interest rate and credit spread risk and foreign exchange rate risks are hedged using relevant benchmark indices. Private equity risk is not hedged due to lack of proxy hedging instruments. Fair value and sensitivity measurements presented herein are based on various portfolio exposures at a particular point in time and may not be representative of future results. Risk exposures may change as a result of ongoing portfolio activities and changing market conditions, among other things.
Equity Market Price Risk—At December 31,
20222023 and
2021,2022, the Company’s exposure to equity market price risk in its investment portfolio, which primarily relates to investments in equity securities, equity funds and hedge funds, was approximately
$147$150 million and
$138$147 million, respectively. The Company hedges market exposure arising from a significant portion of our equity investment portfolios by entering into total return swaps. The Company estimates that a hypothetical 10% adverse change in market prices would result in a net
increase of approximately $0.2 million as of December 31, 2023 and a net decrease of approximately $2.0 million
and $0.3 millionas of December 31, 2022 in the carrying value of such investments,
as of December 31, 2022 and 2021, respectively, including the effect of the hedging transactions.
Interest
Rate/Rate and Credit Spread Risk—At December 31,
20222023 and
2021,2022, the Company’s exposure to interest rate and credit spread risk in its investment portfolio related to investments in debt securities or funds which invest primarily in debt securities was
$53$18 million and
$351$53 million, respectively. The Company hedges market exposure arising from a portion of our debt investment portfolios by entering into total return swaps. The Company estimates that a hypothetical 100 basis point adverse change in interest rates or credit spreads would result in a
net increase of approximately $0.05 million as of December 31, 2023 and a net decrease of approximately $0.1 million
and $0.6 millionas of December 31, 2022 in the carrying value of such investments,
as of December 31, 2022 and 2021, respectively, including the effect of the hedging transactions.
Foreign Exchange Rate Risk—At December 31,
20222023 and
2021,2022, the Company’s exposure to foreign exchange rate risk in its investment portfolio, which primarily relates to investments in foreign currency denominated equity and debt securities and, at December 31,
2022,2023, private equity investments, was
$63$69 million and
$68$63 million, respectively. A significant portion of the Company’s foreign currency exposure related to our equity and debt investment portfolios is hedged through the aforementioned total return swaps. The Company estimates that a 10% adverse change in foreign exchange rates versus the U.S. Dollar would result in a
net decrease of approximately
$3.0$2.0 million and
$2.4$3.0 million in the carrying value of such investments as of December 31,
20222023 and
2021,2022, respectively, including the effect of the hedging transactions.
Private Equity—The Company invests in private equity primarily as a part of its co-investment activities and in connection with certain legacy businesses. At December 31,
20222023 and
2021,2022, the Company’s exposure to changes in fair value of such investments was approximately
$37$30 million and
$30$37 million, respectively. The Company estimates that a hypothetical 10% adverse change in fair value would result in a decrease of approximately
$3.7$3.0 million and
$3.0$3.7 million in the carrying value of such investments as of December 31,
2023 and 2022,
and 2021, respectively.
For additional information regarding risks associated with our investments, see Item 1A, “Risk Factors—Other Business Risks—Our results of operations may be affected by fluctuations in the fair value of positions held in our investment
portfolios.”61
portfolios”.
Risks Related to Receivables
We maintain an allowance for credit losses to provide coverage for expected losses from our receivables.
We determine the adequacyAt December 31, 2023, total receivables amounted to $845 million, net of
thean allowance
by estimating the expectedfor credit losses
based on our analysis of
the client’s creditworthiness$29 million. As of that date, Financial Advisory and
specifically provide for exposures where we determine theAsset Management fees, receivables
are uncollectible.from Lazard Ltd subsidiaries and customers and other receivables comprised 66%, 10% and 24% of total receivables, respectively. At December 31, 2022, total receivables amounted to $727 million, net of an allowance for credit losses of $18 million. As of that date, Financial Advisory and Asset Management fees, receivables from Lazard Ltd subsidiaries and customers and other receivables comprised 68%, 10% and 22% of total receivables, respectively.
At December 31, 2021, total receivables amounted to $864 million, net of an allowance for credit losses of $34 million. As of that date, Financial Advisory and Asset Management fees, receivables from Lazard Ltd subsidiaries and customers and other receivables comprised 77%, 7% and 16% of total receivables, respectively. See also “Critical Accounting Policies and Estimates—Revenue Recognition” above and Note
45 of Notes to Consolidated Financial Statements for additional information regarding receivables.
LFG and LFB offer wealth management and banking services to high net worth individuals and families. At December 31,
20222023 and
2021,2022, customers and other receivables included
$129$86 million and
$122$129 million, respectively, of LFB loans. Such loans were fully collateralized and
closely monitored for counterparty creditworthiness. Therefore, there was no allowance for credit losses required at those dates related to such receivables.
The Company monitors its exposures to individual counterparties and diversifies where appropriate to reduce the exposure to concentrations of credit.
Risks Related to Derivatives
Lazard enters into forward foreign currency exchange contracts and interest rate swaps to hedge exposures to currency exchange rates and interest rates and uses total return swap contracts on various equity and debt indices to hedge a portion of its market exposure with respect to certain
investments that seed
investments related tostrategies in our Asset Management business. Derivative contracts are recorded at fair value.
In entering into derivative agreements the Company is subject to counterparty risk. Net derivative assets amounted to
$15$3 million and
$1$15 million at December 31,
20222023 and
2021,2022, respectively, and net derivative liabilities, excluding the derivative liability arising from the Company’s obligation pertaining to LFI and other similar deferred compensation arrangements
and the derivative liability for warrants exercisable for LGAC Class A ordinary shares that were issued in connection with the LGAC IPO (the “LGAC Warrants”), amounted to
$1$3 million and
$3$1 million at December 31,
2023 and 2022,
and 2021, respectively.
The Company records the LGAC Warrants as derivative liabilities at fair value, which amounted to $0.1 million and $10 million at December 31, 2022 and 2021, respectively, with remeasurement gains and losses recorded in earnings. See Note 1 of Notes to Consolidated Financial Statements.
The Company also records derivative liabilities relating to its obligations pertaining to LFI awards and other similar deferred compensation arrangements, the fair value of which is based on the value of the underlying investments, adjusted for estimated forfeitures. Changes in the fair value of the derivative liabilities are equally offset by the changes in the fair value of investments which are expected to be delivered upon settlement of LFI awards. Derivative liabilities relating to LFI amounted to
$326$365 million and
$359$326 million at December 31,
2023 and 2022,
and 2021, respectively.
62
Risks Related to Cash and Cash Equivalents and Corporate Indebtedness
A significant portion of the Company’s indebtedness has fixed interest rates, while its cash and cash equivalents generally have market interest rates. Based on account balances as of December 31,
2022,2023, Lazard estimates that its annual operating income relating to cash and cash equivalents would increase by approximately
$12$10 million in the event interest rates were to increase by 1% and decrease by approximately
$12$10 million if rates were to decrease by 1%.
As of December 31,
2022,2023, the Company’s cash and cash equivalents totaled approximately
$1,180$966 million. Substantially all of the Company’s cash and cash equivalents were invested in (i) highly liquid institutional money market funds (a significant majority of which were invested solely in U.S. Government or agency money market funds), (ii) in short-term interest bearing and non-interest bearing accounts at a number of leading banks throughout the world, and (iii) in short-term certificates of deposit from such banks. Cash and cash equivalents are
constantlycontinuously monitored. On a regular basis, management reviews its investment profile as well as the credit profile of its list of depositor banks in order to adjust any deposit or investment thresholds as necessary.
Operational risk is inherent in all of our businesses and may, for example, manifest itself in the form of errors, breaches in the system of internal controls, employee misconduct, business interruptions, fraud, including fraud perpetrated by third parties, legal actions due to operating deficiencies, noncompliance or cyber attacks. The Company maintains a framework including policies and a system of internal controls designed to monitor and manage operational risk and provide management with timely and accurate information. Management within each of our operating subsidiaries is primarily responsible for its operational risk programs. The Company has in place business continuity and disaster recovery programs that manage its capabilities to provide services in the case of a disruption. We purchase insurance policies designed to help protect the Company against accidental loss and losses that may significantly affect our financial objectives, personnel, property or our ability to continue to meet our responsibilities to our various stakeholder groups. See Item 1A, “Risk Factors” above for more information regarding operational risk in our
business.business and Item 1C, “Cybersecurity” above for more information on the Company’s processes to identify, assess and manage cybersecurity risks.Item 7A.
| Quantitative and Qualitative Disclosures About Market Risk
|
Item 7A. Quantitative and Qualitative Disclosures About Market Risk
Quantitative and qualitative disclosures about market risk are included under the caption “Management’s Discussion and Analysis of Financial Condition and Results of Operations—Risk Management.”
Item 8. Financial Statements and Supplementary Data
| Item 8.
| Financial Statements and Supplementary Data
| | | |
Index to Consolidated Financial Statements | | Page |
| | |
| | 65
|
| | |
| | 66
|
| | |
| | 69
|
| | |
| | 71
|
| | |
| | 72
|
| | |
| | 73
|
| | |
| | 75
|
| | |
| | 78
|
| | |
| | 122
|
| | |
Financial Statement Schedules | | |
| | |
Schedule I—Condensed Financial Information of Registrant (Parent Company Only) | | |
| | |
| | F-2
|
| | |
| | F-3
|
| | |
| | |
| | |
| | F-5
|
| | |
| | F-6
|
MANAGEMENT’S REPORT ON INTERNAL CONTROL OVER FINANCIAL REPORTING
Management of Lazard Group LLC and its subsidiaries (the “Company”) is responsible for establishing and maintaining adequate internal control over financial reporting. Internal control over financial reporting is a process designed under the supervision of the Company’s principal executive and principal financial officers to provide reasonable assurance regarding the reliability of financial reporting and the preparation of the Company’s consolidated financial statements for external purposes in accordance with U.S. generally accepted accounting principles.
Our internal control over financial reporting includes those policies and procedures that:
| •
| pertain to the maintenance of records that, in reasonable detail, accurately and fairly reflect the transactions and dispositions of the assets of the Company;
|
| •pertain to the maintenance of records that, in reasonable detail, accurately and fairly reflect the transactions and dispositions of the assets of the Company;• | provide reasonable assurance that transactions are recorded as necessary to permit preparation of consolidated financial statements in accordance with U.S. generally accepted accounting principles, and that our receipts and expenditures are being made only in accordance with authorizations of the Company’s management and directors; and
|
| •provide reasonable assurance that transactions are recorded as necessary to permit preparation of consolidated financial statements in accordance with U.S. generally accepted accounting principles, and that our receipts and expenditures are being made only in accordance with authorizations of the Company’s management and directors; and •provide reasonable assurance regarding prevention or timely detection of unauthorized acquisition, use or disposition of our assets that could have a material effect on the consolidated financial statements. •
| provide reasonable assurance regarding prevention or timely detection of unauthorized acquisition, use or disposition of our assets that could have a material effect on the consolidated financial statements.
|
Management assessed the effectiveness of the Company’s internal control over financial reporting as of December 31, 2022.2023. In making this assessment, management used the criteria set forth by the Committee of Sponsoring Organizations of the Treadway Commission (COSO) in Internal Control-Integrated Framework (2013). Based on management’s assessment and those criteria, management concluded that the Company maintained effective internal control over financial reporting as of December 31, 2022.
2023.
Because of its inherent limitations, internal control over financial reporting may not prevent or detect misstatements. Projections of any evaluation of effectiveness to future periods are subject to the risk that controls may become inadequate because of changes in conditions, or that the degree of compliance with the policies or procedures may deteriorate.
The Company’s independent registered public accounting firm, Deloitte & Touche LLP, audited the Company’s internal control over financial reporting as of December 31,
2022,2023, as stated in their report which appears under “Report of Independent Registered Public Accounting Firm.”
REPORT OF INDEPENDENT REGISTERED PUBLIC ACCOUNTING FIRM
To the
Membersmembers and the Board of Directors of Lazard Group LLC:
Opinion on Internal Control over Financial Reporting
We have audited the internal control over financial reporting of Lazard Group LLC and subsidiaries (the "Company"“Company”) as of December 31, 2022,2023, based on criteria established in Internal Control — Integrated Framework (2013) issued by the Committee of Sponsoring Organizations of the Treadway Commission (COSO). In our opinion, the Company maintained, in all material respects, effective internal control over financial reporting as of December 31, 2022,2023, based on criteria established in Internal Control — Integrated Framework (2013) issued by COSO. We have also audited, in accordance with the standards of the Public Company Accounting Oversight Board (United States) (PCAOB), the consolidated financial statements and
financial schedule as listed in the Index at Item 8 as of and for the year ended December 31,
2022,2023, of the Company and our report dated February 23,
2023,2024, expressed an unqualified opinion on those consolidated financial statements and
financial schedule.
The Company’s management is responsible for maintaining effective internal control over financial reporting and for its assessment of the effectiveness of internal control over financial reporting, included in the accompanying
"Management's“Management's Report on Internal Control Over Financial
Reporting"Reporting”. Our responsibility is to express an opinion on the Company’s internal control over financial reporting based on our audit. We are a public accounting firm registered with the PCAOB and are required to be independent with respect to the Company in accordance with the U.S. federal securities laws and the applicable rules and regulations of the Securities and Exchange Commission and the PCAOB.
We conducted our audit in accordance with the standards of the PCAOB. Those standards require that we plan and perform the audit to obtain reasonable assurance about whether effective internal control over financial reporting was maintained in all material respects. Our audit included obtaining an understanding of internal control over financial reporting, assessing the risk that a material weakness exists, testing and evaluating the design and operating effectiveness of internal control based on the assessed risk, and performing such other procedures as we considered necessary in the circumstances. We believe that our audit provides a reasonable basis for our opinion.
Definition and Limitations of Internal Control over Financial Reporting
A company’s internal control over financial reporting is a process designed to provide reasonable assurance regarding the reliability of financial reporting and the preparation of financial statements for external purposes in accordance with generally accepted accounting principles. A company’s internal control over financial reporting includes those policies and procedures that (1) pertain to the maintenance of records that, in reasonable detail, accurately and fairly reflect the transactions and dispositions of the assets of the company; (2) provide reasonable assurance that transactions are recorded as necessary to permit preparation of financial statements in accordance with generally accepted accounting principles, and that receipts and expenditures of the company are being made only in accordance with authorizations of management and directors of the company; and (3) provide reasonable assurance regarding prevention or timely detection of unauthorized acquisition, use, or disposition of the company’s assets that could have a material effect on the financial statements.
Because of its inherent limitations, internal control over financial reporting may not prevent or detect misstatements. Also, projections of any evaluation of effectiveness to future periods are subject to the risk that controls may become inadequate because of changes in conditions, or that the degree of compliance with the policies or procedures may deteriorate.
/s/ Deloitte & Touche LLP
REPORT OF INDEPENDENT REGISTERED PUBLIC ACCOUNTING FIRM
To the
Membersmembers and the Board of Directors of Lazard Group LLC:
Opinion on the Consolidated Financial Statements
We have audited the accompanying consolidated statements of financial condition of Lazard Group LLC and subsidiaries (the
"Company"“Company”) as of December 31,
20222023 and
2021,2022, and the related consolidated statements of operations, comprehensive income, cash flows, and changes in members’ equity and redeemable noncontrolling interests for each of the three years in the period ended December 31,
2022,2023, the related notes and the schedule listed in the Index at Item 8 (collectively the “consolidated financial statements”). In our opinion, the consolidated financial statements present fairly, in all material respects, the financial position of the Company as of December 31,
20222023 and
2021,2022, and the results of its operations and its cash flows for each of the three years in the period ended December 31,
2022,2023, in conformity with accounting principles generally accepted in the United States of America (U.S. GAAP).
We have also audited, in accordance with the standards of the Public Company Accounting Oversight Board (United States) (PCAOB), the Company’s internal control over financial reporting as of December 31, 2022,2023, based on criteria established in Internal Control—Integrated Framework (2013) issued by the Committee of Sponsoring Organizations of the Treadway Commission and our report dated February 23, 2023,2024, expressed an unqualified opinion on the Company’s internal control over financial reporting. These consolidated financial statements are the responsibility of the Company’s management. Our responsibility is to express an opinion on the Company’s consolidated financial statements based on our audits. We are a public accounting firm registered with the PCAOB and are required to be independent with respect to the Company in accordance with the U.S. federal securities laws and the applicable rules and regulations of the Securities and Exchange Commission and the PCAOB.
We conducted our audits in accordance with the standards of the PCAOB. Those standards require that we plan and perform the audit to obtain reasonable assurance about whether the consolidated financial statements are free of material misstatement, whether due to error or fraud. Our audits included performing procedures to assess the risks of material misstatement of the consolidated financial statements, whether due to error or fraud, and performing procedures that respond to those risks. Such procedures included examining, on a test basis, evidence regarding the amounts and disclosures in the consolidated financial statements. Our audits also included evaluating the accounting principles used and significant estimates made by management, as well as evaluating the overall presentation of the consolidated financial statements. We believe that our audits provide a reasonable basis for our opinion.
The critical audit matter communicated below is a matter arising from the current-period audit of the consolidated financial statements that was communicated or required to be communicated to the audit committee and that (1) relates to accounts or disclosures that are material to the consolidated financial statements and (2) involved our especially challenging, subjective, or complex judgments. The communication of critical audit matters does not alter in any way our opinion on the consolidated financial statements, taken as a whole, and we are not, by communicating the critical audit matter below, providing a separate opinion on the critical audit matter or on the accounts or disclosures to which it relates.
67
Investment banking and other advisory fees—Refer to Note 34 Revenue Recognition to the consolidated financial statements Critical Audit Matter Description
The Company generally recognizes investment banking and other advisory fees as the benefits of these advisory services are provided to the Company’s clients. These advisory services typically include transaction announcement and transaction completion fees. These fees are not typically recognized until there is an announcement or completion
respectively, due to the uncertainty associated with those events. However, earlier recognition is appropriate if it is probable that significant reversal of the applicable revenue will not occur.
We identified the recognition of investment banking and other advisory fees as a critical audit matter because of the judgment required in determining the appropriate period to recognize transaction announcement and transaction completion fees, including obtaining and evaluating appropriate supporting documentation. As such, auditing these transactions required a high degree of auditor judgment when performing audit procedures and evaluating the results of those procedures.
How the Critical Audit Matter Was Addressed in the Audit
Our audit procedures related to investment banking and other advisory fees included the following, among others:
•
| We tested the effectiveness of controls over the recognition of investment banking and other advisory fees, including those over the timing of revenue recognition.
|
•We tested the effectiveness of controls over the recognition of investment banking and other advisory fees, including those over the timing of revenue recognition.• | We selected a sample of contracts with clients and performed the following:
|
| –•We selected a sample of contracts with clients and performed the following:
| Evaluated the terms and conditions of the respective contract to verify the Company appropriately identified its performance obligations and the related fees.
|
| –Evaluated the terms and conditions of the respective contract to verify the Company appropriately identified its performance obligations and the related fees. | Evaluated the accuracy of management’s calculation of investment banking and other advisory fees recognized by recalculating the revenue amounts and comparing our expectation to the amount recorded by management.
|
| –Evaluated the accuracy of management’s calculation of investment banking and other advisory fees recognized by recalculating the revenue amounts and comparing our expectation to the amount recorded by management. | Evaluated third party and the Company’s evidence, including, but not limited to, confirmations, court and regulatory approvals, press releases, executed agreements, communications and underlying transaction closing documents, to verify that the revenue recognition criteria were met and revenue was recognized in accordance with U.S. GAAP, including in the appropriate period.
|
–Evaluated third party and the Company’s evidence, including, but not limited to, confirmations, court and regulatory approvals, press releases, executed agreements, communications and underlying transaction closing documents, to verify that the revenue recognition criteria were met and revenue was recognized in accordance with U.S. GAAP, including in the appropriate period.• | On a sample basis, we performed the above procedures on investment banking and other advisory fees recognized in the subsequent year to determine if such revenue should have been recorded in the current year.
|
•On a sample basis, we performed the above procedures on investment banking and other advisory fees recognized in the subsequent year to determine if such revenue should have been recorded in the current year.
/s/ Deloitte & Touche LLP
We have served as the Company’s auditor since 2000.
CONSOLIDATED STATEMENTS OF FINANCIAL CONDITION
DECEMBER 31,
2023 AND 2022
and 2021 | | December 31, | |
| | 2022 | | | 2021 | |
| December 31, | | | December 31, |
| 2023 | | | 2023 | | 2022 |
ASSETS | | | | | | | | |
| Cash and cash equivalents | |
| Cash and cash equivalents | |
Cash and cash equivalents | | $ | 1,180,473 | | | $ | 1,435,576 | |
Deposits with banks and short-term investments | | | 779,246 | | | | 1,347,544 | |
Restricted cash | | | 625,381 | | | | 617,448 | |
Receivables (net of allowance for credit losses of $17,737 and $33,955 at December 31, 2022 and 2021, respectively): | | | | | | | | |
| Receivables (net of allowance for credit losses of $28,503 and $17,737 at December 31, 2023 and 2022, respectively): | |
| Fees | |
| Fees | |
Fees | | | 491,861 | | | | 669,355 | |
Customers and other | | | 160,898 | | | | 136,345 | |
Lazard Ltd subsidiaries | | | 74,005 | | | | 58,597 | |
| | | 726,764 | | | | 864,297 | |
| 844,770 | |
Investments | | | 698,977 | | | | 1,007,339 | |
Property (net of accumulated amortization and depreciation of $393,595 and $366,215 at December 31, 2022 and 2021, respectively) | | | 250,037 | | | | 249,648 | |
| Property (net of accumulated amortization and depreciation of $414,547 and $393,595 at December 31, 2023 and 2022, respectively, including $72,921 of property held for sale at December 31, 2023) | |
Operating lease right-of-use assets | | | 430,665 | | | | 465,903 | |
Goodwill and other intangible assets (net of accumulated amortization of $67,621 and $67,561 at December 31, 2022 and 2021, respectively) | | | 356,459 | | | | 357,337 | |
| Goodwill and other intangible assets (net of accumulated amortization of $67,681 and $67,621 at December 31, 2023 and 2022, respectively) | |
Deferred tax assets | | | 37,601 | | | | 31,926 | |
Other assets | | | 376,196 | | | | 363,364 | |
Total Assets | | $ | 5,461,799 | | | $ | 6,740,382 | |
See notes to consolidated financial statements.
68
CONSOLIDATED STATEMENTS OF FINANCIAL CONDITION
DECEMBER 31,
2023 AND 2022
and 2021 | | December 31, | |
| | 2022 | | | 2021 | |
| December 31, | | | December 31, |
| 2023 | | | 2023 | | 2022 |
LIABILITIES, REDEEMABLE NONCONTROLLING INTERESTS AND MEMBERS’ EQUITY | | | | | | | | |
Liabilities: | | | | | | | | |
| Liabilities: | |
| Liabilities: | |
| Deposits and other customer payables | |
| Deposits and other customer payables | |
Deposits and other customer payables | | $ | 921,834 | | | $ | 1,442,701 | |
Accrued compensation and benefits | | | 733,460 | | | | 968,766 | |
Operating lease liabilities | | | 512,730 | | | | 552,345 | |
Senior debt | | | 1,687,714 | | | | 1,685,227 | |
Payable to Lazard Ltd subsidiaries | | | 20,189 | | | | 17,947 | |
Deferred tax liabilities | | | 3,920 | | | | 1,827 | |
Other liabilities | | | 531,968 | | | | 622,103 | |
Total Liabilities | | | 4,411,815 | | | | 5,290,916 | |
Commitments and contingencies | | | | | | | | | Commitments and contingencies | | | |
Redeemable noncontrolling interests | | | 583,471 | | | | 575,000 | |
MEMBERS’ EQUITY | | | | | | | | |
Members' equity (net of 26,774,550 and 12,006,477 shares of Lazard Ltd Class A common stock, at a cost of $993,065 and $506,587 at December 31, 2022 and 2021, respectively) | | | 638,956 | | | | 984,807 | |
Members' equity (net of 25,300,624 and 26,774,550 shares of Lazard Ltd Class A common stock, at a cost of $937,112 and $993,065 at December 31, 2023 and 2022, respectively) | |
Members' equity (net of 25,300,624 and 26,774,550 shares of Lazard Ltd Class A common stock, at a cost of $937,112 and $993,065 at December 31, 2023 and 2022, respectively) | |
Members' equity (net of 25,300,624 and 26,774,550 shares of Lazard Ltd Class A common stock, at a cost of $937,112 and $993,065 at December 31, 2023 and 2022, respectively) | |
Accumulated other comprehensive loss, net of tax | | | (280,587 | ) | | | (209,037 | ) |
Total Lazard Group LLC Members' Equity | | | 358,369 | | | | 775,770 | |
Noncontrolling interests | | | 108,144 | | | | 98,696 | |
Total Members’ Equity | | | 466,513 | | | | 874,466 | |
Total Liabilities, Redeemable Noncontrolling Interests and Members’ Equity | | $ | 5,461,799 | | | $ | 6,740,382 | |
See notes to consolidated financial statements.
69
CONSOLIDATED STATEMENTS OF OPERATIONS
FOR THE YEARS ENDED DECEMBER 31,
2023, 2022
2021 AND
20202021
| | Year Ended December 31, | |
| | 2022 | | | 2021 | | | 2020 | |
| Year Ended December 31, | | | Year Ended December 31, |
| 2023 | | | 2023 | | 2022 | | 2021 |
REVENUE | | | | | | | | | | | | |
| Investment banking and other advisory fees | |
| Investment banking and other advisory fees | |
Investment banking and other advisory fees | | $ | 1,648,520 | | | $ | 1,784,932 | | | $ | 1,417,592 | |
Asset management fees | | | 1,125,955 | | | | 1,354,622 | | | | 1,117,419 | |
Interest income | | | 29,214 | | | | 5,609 | | | | 5,569 | |
Other | | | 40,964 | | | | 158,615 | | | | 105,416 | |
Total revenue | | | 2,844,653 | | | | 3,303,778 | | | | 2,645,996 | |
Interest expense | | | 80,364 | | | | 80,569 | | | | 80,456 | |
Net revenue | | | 2,764,289 | | | | 3,223,209 | | | | 2,565,540 | |
OPERATING EXPENSES | | | | | | | | | | | | |
Compensation and benefits | | | 1,647,811 | | | | 1,884,859 | | | | 1,541,228 | |
| Compensation and benefits | |
| Compensation and benefits | |
Occupancy and equipment | | | 121,624 | | | | 127,395 | | | | 127,139 | |
Marketing and business development | | | 82,914 | | | | 42,705 | | | | 42,375 | |
Technology and information services | | | 171,478 | | | | 146,572 | | | | 133,346 | |
Professional services | | | 66,929 | | | | 75,337 | | | | 64,168 | |
Fund administration and outsourced services | | | 109,978 | | | | 130,501 | | | | 103,070 | |
Amortization of intangible assets related to acquisitions | | | 60 | | | | 60 | | | | 1,744 | |
| Amortization and other acquisition-related costs | |
Other | | | 42,694 | | | | 45,117 | | | | 38,799 | |
Total operating expenses | | | 2,243,488 | | | | 2,452,546 | | | | 2,051,869 | |
OPERATING INCOME | | | 520,801 | | | | 770,663 | | | | 513,671 | |
| OPERATING INCOME (LOSS) | |
Provision for income taxes | | | 81,653 | | | | 101,687 | | | | 56,564 | |
NET INCOME | | | 439,148 | | | | 668,976 | | | | 457,107 | |
| NET INCOME (LOSS) | |
LESS - NET INCOME ATTRIBUTABLE TO NONCONTROLLING INTERESTS | | | 34,966 | | | | 14,481 | | | | 231 | |
NET INCOME ATTRIBUTABLE TO LAZARD GROUP LLC | | $ | 404,182 | | | $ | 654,495 | | | $ | 456,876 | |
| NET INCOME (LOSS) ATTRIBUTABLE TO LAZARD GROUP LLC | |
See notes to consolidated financial statements.
70
CONSOLIDATED STATEMENTS OF COMPREHENSIVE INCOME
(LOSS)
FOR THE YEARS ENDED DECEMBER 31,
2023, 2022
2021 AND
20202021
| | Year Ended December 31, | |
| | 2022 | | | 2021 | | | 2020 | |
NET INCOME | | $ | 439,148 | | | $ | 668,976 | | | $ | 457,107 | |
OTHER COMPREHENSIVE INCOME (LOSS), NET OF TAX: | | | | | | | | | | | | |
Currency translation adjustments: | | | | | | | | | | | | |
Currency translation adjustments before reclassification | | | (63,779 | ) | | | (48,401 | ) | | | 53,931 | |
Adjustment for items reclassified to earnings | | | 32 | | | | (7,516 | ) | | | - | |
Employee benefit plans: | | | | | | | | | | | | |
Actuarial gain (loss) (net of tax expense (benefit) of $(5,437), $11,912 and $(2,040) for the years ended December 31, 2022, 2021 and 2020, respectively) | | | (11,955 | ) | | | 34,666 | | | | (3,017 | ) |
Adjustment for items reclassified to earnings (net of tax expense of $994, $1,609 and $1,476 for the years ended December 31, 2022, 2021 and 2020, respectively) | | | 4,152 | | | | 5,660 | | | | 6,046 | |
OTHER COMPREHENSIVE INCOME (LOSS), NET OF TAX | | | (71,550 | ) | | | (15,591 | ) | | | 56,960 | |
COMPREHENSIVE INCOME | | | 367,598 | | | | 653,385 | | | | 514,067 | |
LESS - COMPREHENSIVE INCOME ATTRIBUTABLE TO NONCONTROLLING INTERESTS | | | 34,966 | | | | 14,481 | | | | 233 | |
COMPREHENSIVE INCOME ATTRIBUTABLE TO LAZARD GROUP LLC | | $ | 332,632 | | | $ | 638,904 | | | $ | 513,834 | |
| | | | | | | | | | | | | | | | | |
| Year Ended December 31, |
| 2023 | | 2022 | | 2021 |
| NET INCOME (LOSS) | $ | (159,243) | | | $ | 439,148 | | | $ | 668,976 | |
| OTHER COMPREHENSIVE INCOME (LOSS), NET OF TAX: | | | | | |
| Currency translation adjustments: | | | | | |
| Currency translation adjustments before reclassification | 30,720 | | | (63,779) | | | (48,401) | |
| Adjustment for items reclassified to earnings | 2,413 | | | 32 | | | (7,516) | |
| Employee benefit plans: | | | | | |
| Actuarial gain (loss) (net of tax expense (benefit) of $(7,657), $(5,437) and $11,912 for the years ended December 31, 2023, 2022 and 2021, respectively) | (24,459) | | | (11,955) | | | 34,666 | |
| Prior service cost (net of tax benefit of $2,567 for the year ended December 31, 2023) | (7,751) | | | – | | | – | |
| Adjustment for items reclassified to earnings (net of tax expense of $1,521, $994 and $1,609 for the years ended December 31, 2023, 2022 and 2021, respectively) | 5,233 | | | 4,152 | | | 5,660 | |
| OTHER COMPREHENSIVE INCOME (LOSS), NET OF TAX | 6,156 | | | (71,550) | | | (15,591) | |
| COMPREHENSIVE INCOME (LOSS) | (153,087) | | | 367,598 | | | 653,385 | |
| LESS - COMPREHENSIVE INCOME ATTRIBUTABLE TO NONCONTROLLING INTERESTS | 18,173 | | | 34,966 | | | 14,481 | |
| COMPREHENSIVE INCOME (LOSS) ATTRIBUTABLE TO LAZARD GROUP LLC | $ | (171,260) | | | $ | 332,632 | | | $ | 638,904 | |
See notes to consolidated financial statements.
71
CONSOLIDATED STATEMENTS OF CASH FLOWS
FOR THE YEARS ENDED DECEMBER 31,
2023, 2022
2021 AND
20202021
| | Year Ended December 31, | |
| | 2022 | | | 2021 | | | 2020 | |
| Year Ended December 31, | | | Year Ended December 31, |
| 2023 | | | 2023 | | 2022 | | 2021 |
CASH FLOWS FROM OPERATING ACTIVITIES: | | | | | | | | | | | | |
Net income | | $ | 439,148 | | | $ | 668,976 | | | $ | 457,107 | |
Adjustments to reconcile net income to net cash provided by (used in) operating activities: | | | | | | | | | | | | |
| Net income (loss) | |
| Net income (loss) | |
| Net income (loss) | |
| Adjustments to reconcile net income (loss) to net cash provided by (used in) operating activities: | |
| Depreciation and amortization of property | |
| Depreciation and amortization of property | |
Depreciation and amortization of property | | | 42,037 | | | | 38,014 | | | | 34,786 | |
Noncash lease expense | | | 60,420 | | | | 73,865 | | | | 64,566 | |
Currency translation adjustment reclassification | | | 32 | | | | (7,516 | ) | | | - | |
Amortization of deferred expenses and share-based incentive compensation | | | 405,125 | | | | 393,056 | | | | 345,458 | |
Amortization of intangible assets related to acquisitions | | | 60 | | | | 60 | | | | 1,744 | |
Deferred tax provision | | | 3,795 | | | | 5,858 | | | | 7,077 | |
| Amortization and other acquisition-related costs | |
| Deferred tax provision (benefit) | |
| Impairment of equity method investments and other receivables | |
| Impairment of assets associated with cost-saving initiatives | |
| Loss on LGAC liquidation | |
(Increase) decrease in operating assets and increase (decrease) in operating liabilities: | | | | | | | | | | | | |
| Receivables-net | |
| Receivables-net | |
Receivables-net | | | 125,522 | | | | (8,718 | ) | | | (169,013 | ) |
Investments | | | 178,025 | | | | (458,593 | ) | | | (198,556 | ) |
Other assets | | | (46,588 | ) | | | (26,826 | ) | | | 2,478 | |
Accrued compensation and benefits and other liabilities | | | (373,318 | ) | | | 241,841 | | | | 6,222 | |
Net cash provided by operating activities | | | 834,258 | | | | 920,017 | | | | 551,869 | |
CASH FLOWS FROM INVESTING ACTIVITIES: | | | | | | | | | | | | |
Additions to property | | | (49,509 | ) | | | (39,698 | ) | | | (64,237 | ) |
| Additions to property | |
| Additions to property | |
Disposals of property | | | 573 | | | | 641 | | | | 1,315 | |
Other | | | (7,500 | ) | | | - | | | | - | |
| Acquisition of business, net of cash acquired | |
| Other investing activities | |
Net cash used in investing activities | | | (56,436 | ) | | | (39,057 | ) | | | (62,922 | ) |
CASH FLOWS FROM FINANCING ACTIVITIES: | | | | | | | | | | | | |
Proceeds from: | | | | | | | | | | | | |
| Proceeds from: | |
| Proceeds from: | |
| Customer deposits, net | |
| Customer deposits, net | |
Customer deposits, net | | | - | | | | 350,868 | | | | - | |
LGAC IPO | | | - | | | | 575,000 | | | | - | |
Contributions from members | | | - | | | | 14,000 | | | | - | |
Contributions from noncontrolling interests | | | 464 | | | | 334 | | | | 398 | |
Other financing activities | | | 50 | | | | - | | | | 25 | |
Payments for: | | | | | | | | | | | | |
Customer deposits, net | | | (373,044 | ) | | | - | | | | (143,046 | ) |
| Customer deposits, net | |
| Customer deposits, net | |
Distributions to noncontrolling interests | | | (31,911 | ) | | | (11,328 | ) | | | (2,851 | ) |
Payments of LGAC IPO underwriting fees and other offering costs | | | - | | | | (9,352 | ) | | | - | |
| LGAC IPO underwriting fees and other offering costs | |
Purchase of Class A common stock | | | (691,705 | ) | | | (406,149 | ) | | | (95,227 | ) |
Distributions to members | | | (228,045 | ) | | | (233,234 | ) | | | (201,019 | ) |
| Distribution to redeemable noncontrolling interests in connection with LGAC redemption | |
| Distribution to members | |
Settlement of share-based incentive compensation in satisfaction of tax withholding requirements | | | (61,916 | ) | | | (68,012 | ) | | | (72,636 | ) |
LFI Consolidated Funds redemptions | | | (10,020 | ) | | | (20,915 | ) | | | - | |
Other financing activities | | | (11,035 | ) | | | (8,450 | ) | | | (11,962 | ) |
Net cash provided by (used in) financing activities | | | (1,407,162 | ) | | | 182,762 | | | | (526,318 | ) |
EFFECT OF EXCHANGE RATE CHANGES ON CASH AND CASH EQUIVALENTS AND RESTRICTED CASH | | | (186,128 | ) | | | (161,817 | ) | | | 147,933 | |
NET INCREASE (DECREASE) IN CASH AND CASH EQUIVALENTS AND RESTRICTED CASH | | | (815,468 | ) | | | 901,905 | | | | 110,562 | |
CASH AND CASH EQUIVALENTS AND RESTRICTED CASH— January 1 | | | 3,400,568 | | | | 2,498,663 | | | | 2,388,101 | |
CASH AND CASH EQUIVALENTS AND RESTRICTED CASH— December 31 | | $ | 2,585,100 | | | $ | 3,400,568 | | | $ | 2,498,663 | |
See notes to consolidated financial statements.
RECONCILIATION OF CASH AND CASH EQUIVALENTS AND RESTRICTED CASH WITHIN THE CONSOLIDATED STATEMENTS OF FINANCIAL CONDITION: | | | | | | | | | | | | |
| | December 31, | |
| | 2022 | | | 2021 | | | 2020 | |
Cash and cash equivalents | | $ | 1,180,473 | | | $ | 1,435,576 | | | $ | 1,319,712 | |
Deposits with banks and short-term investments | | | 779,246 | | | | 1,347,544 | | | | 1,134,463 | |
Restricted cash | | | 625,381 | | | | 617,448 | | | | 44,488 | |
TOTAL CASH AND CASH EQUIVALENTS AND RESTRICTED CASH | | $ | 2,585,100 | | | $ | 3,400,568 | | | $ | 2,498,663 | |
| | | | | | | | | | | | |
SUPPLEMENTAL DISCLOSURES OF CASH FLOW INFORMATION: | | | | | | | | | | | | |
Cash paid during the year for: | | | | | | | | | | | | |
Interest | | $ | 77,024 | | | $ | 77,861 | | | $ | 77,276 | |
Income taxes, net of refunds | | $ | 133,381 | | | $ | 73,516 | | | $ | 40,551 | |
| | | | | | | | | | | | | | | | | |
| RECONCILIATION OF CASH AND CASH EQUIVALENTS AND RESTRICTED CASH WITHIN THE CONSOLIDATED STATEMENTS OF FINANCIAL CONDITION: | | | | | |
| | | | | |
| December 31, |
| 2023 | | 2022 | | 2021 |
| Cash and cash equivalents | $ | 966,168 | | | $ | 1,180,473 | | | $ | 1,435,576 | |
| Deposits with banks and short-term investments | 219,576 | | | 779,246 | | | 1,347,544 | |
| Restricted cash | 34,091 | | | 625,381 | | | 617,448 | |
| TOTAL CASH AND CASH EQUIVALENTS AND RESTRICTED CASH | $ | 1,219,835 | | | $ | 2,585,100 | | | $ | 3,400,568 | |
| | | | | |
| SUPPLEMENTAL DISCLOSURES OF CASH FLOW INFORMATION: | | | | | |
| Cash paid during the year for: | | | | | |
| Interest | $ | 72,157 | | | $ | 77,024 | | | $ | 77,861 | |
| Income taxes, net of refunds | $ | 43,810 | | | $ | 133,381 | | | $ | 73,516 | |
See notes to consolidated financial statements.
73
CONSOLIDATED STATEMENTS OF CHANGES IN MEMBERS’ EQUITY AND REDEEMABLE NONCONTROLLING INTERESTS
FOR THE YEARS ENDED DECEMBER 31,
2023, 2022
2021 AND
20202021
| | | | | | Accumulated Other Comprehensive | | | Total Lazard Group | | | | | | | Total | |
| | Members' | | | Income (Loss), | | | Members' | | | Noncontrolling | | | Members' | |
| | Equity | | | Net of Tax | | | Equity | | | Interests | | | Equity | |
Balance - January 1, 2020 | | $ | 469,324 | | | $ | (250,404 | ) | | $ | 218,920 | | | $ | 68,406 | | | $ | 287,326 | |
Adjustment for cumulative effect on prior years from the adoption of new accounting guidance | | | (7,571 | ) | | | | | | | (7,571 | ) | | | | | | | (7,571 | ) |
Balance, as adjusted January 1, 2020 | | | 461,753 | | | | (250,404 | ) | | | 211,349 | | | | 68,406 | | | | 279,755 | |
Comprehensive income: | | | | | | | | | | | | | | | | | | | | |
Net income | | | 456,876 | | | | | | | | 456,876 | | | | 231 | | | | 457,107 | |
Other comprehensive income - net of tax | | | | | | | 56,958 | | | | 56,958 | | | | 2 | | | | 56,960 | |
Amortization of share-based incentive compensation | | | 218,449 | | | | | | | | 218,449 | | | | | | | | 218,449 | |
Distributions to members and noncontrolling interests, net | | | (201,019 | ) | | | | | | | (201,019 | ) | | | (2,453 | ) | | | (203,472 | ) |
Purchase of Class A common stock | | | (95,227 | ) | | | | | | | (95,227 | ) | | | | | | | (95,227 | ) |
Delivery of Class A common stock in connection with share-based incentive compensation and related tax benefit of $32 | | | (72,604 | ) | | | | | | | (72,604 | ) | | | | | | | (72,604 | ) |
Contributions from members | | | 55,941 | | | | | | | | 55,941 | | | | | | | | 55,941 | |
LFI Consolidated Funds | | | - | | | | | | | | - | | | | 19,699 | | | | 19,699 | |
Other | | | (5,739 | ) | | | | | | | (5,739 | ) | | | | | | | (5,739 | ) |
Balance - December 31, 2020 (*) | | $ | 818,430 | | | $ | (193,446 | ) | | $ | 624,984 | | | $ | 85,885 | | | $ | 710,869 | |
| | | | | | | | | | | | | | | | | | | | | | | | | | | | | | | | | | | |
| Members' Equity | | Accumulated Other Comprehensive Income (Loss), Net of Tax | | Total Lazard Group Members’ Equity | | Noncontrolling
Interests | | Total
Members’
Equity | | Redeemable Noncontrolling Interests |
| | | | | |
| Balance - January 1, 2023 | $ | 638,956 | | | $ | (280,587) | | | $ | 358,369 | | | $ | 108,144 | | | $ | 466,513 | | | $ | 583,471 | |
| Comprehensive income (loss): | | | | | | | | | | | |
| Net income (loss) | (177,416) | | | | | (177,416) | | | 6,192 | | | (171,224) | | | 11,981 | |
| Other comprehensive income - net of tax | | | 6,156 | | | 6,156 | | | | | 6,156 | | | |
| Amortization of share-based incentive compensation | 250,570 | | | | | 250,570 | | | | | 250,570 | | | |
| Distributions to members and noncontrolling interests, net | (161,984) | | | | | (161,984) | | | (4,165) | | | (166,149) | | | |
| Purchase of Class A common stock | (102,051) | | | | | (102,051) | | | | | (102,051) | | | |
| Delivery of Class A common stock in connection with share-based incentive compensation and related tax benefit of $9 | (54,519) | | | | | (54,519) | | | | | (54,519) | | | |
| Business acquisitions and related equity transactions: | | | | | | | | | | | |
| Class A common stock issuable | 1,775 | | | | | 1,775 | | | | | 1,775 | | | |
| LFI Consolidated Funds | | | | | | | (74,164) | | | (74,164) | | | 77,525 | |
| Change in redemption value of redeemable noncontrolling interests | (412) | | | | | (412) | | | (177) | | | (589) | | | 589 | |
| LGAC liquidation: | | | | | | | | | | | |
| Distribution to redeemable noncontrolling interests | | | | | | | | | | | (585,891) | |
| Reversal to net loss of amounts previously charged to members' equity and noncontrolling interests | 13,195 | | | | | 13,195 | | | 4,734 | | | 17,929 | | | |
| Reversal of deferred offering costs liability | 14,087 | | | | | 14,087 | | | 6,038 | | | 20,125 | | | |
| Dividend-equivalents | (11,600) | | | | | (11,600) | | | | | (11,600) | | | |
| Other | (290) | | | | | (290) | | | (17) | | | (307) | | | |
| Balance - December 31, 2023 (*) | $ | 410,311 | | | $ | (274,431) | | | $ | 135,880 | | | $ | 46,585 | | | $ | 182,465 | | | $ | 87,675 | |
| ______________________ | | | | | | | | | | | |
| (*) At December 31, 2023, in addition to profit participation interests, there were two managing member interests. | | |
(
*
) At December 31, 2020, in addition to profit participation interests, there were two managing member interests.
See notes to consolidated financial statements.
74
CONSOLIDATED STATEMENTS OF CHANGES IN MEMBERS’ EQUITY AND REDEEMABLE NONCONTROLLING INTERESTS
FOR THE YEARS ENDED DECEMBER 31,
2023, 2022
2021 AND
20202021
| | | | | | Accumulated Other Comprehensive | | | Total Lazard Group | | | | | | | Total | | | Redeemable | |
| | Members' | | | Income (Loss), | | | Members’ | | | Noncontrolling | | | Members’ | | | Noncontrolling | |
| | Equity | | | Net of Tax | | | Equity | | | Interests | | | Equity | | | Interests | |
Balance - January 1, 2021 | | $ | 818,430 | | | $ | (193,446 | ) | | $ | 624,984 | | | $ | 85,885 | | | $ | 710,869 | | | $ | - | |
Comprehensive income (loss): | | | | | | | | | | | | | | | | | | | | | | | | |
Net income | | | 654,495 | | | | | | | | 654,495 | | | | 18,146 | | | | 672,641 | | | | (3,665 | ) |
Other comprehensive loss - net of tax | | | | | | | (15,591 | ) | | | (15,591 | ) | | | | | | | (15,591 | ) | | | | |
Amortization of share-based incentive compensation | | | 233,958 | | | | | | | | 233,958 | | | | | | | | 233,958 | | | | | |
Distributions to members and noncontrolling interests, net | | | (233,234 | ) | | | | | | | (233,234 | ) | | | (10,994 | ) | | | (244,228 | ) | | | | |
Purchase of Class A common stock | | | (406,149 | ) | | | | | | | (406,149 | ) | | | | | | | (406,149 | ) | | | | |
Delivery of Class A common stock in connection with share-based incentive compensation and related tax expense of $39 | | | (68,051 | ) | | | | | | | (68,051 | ) | | | | | | | (68,051 | ) | | | | |
Contributions from members | | | 14,000 | | | | | | | | 14,000 | | | | | | | | 14,000 | | | | | |
Transfer of Class A common stock to Lazard Ltd Subsidiaries | | | 10,536 | | | | | | | | 10,536 | | | | | | | | 10,536 | | | | | |
Contribution from redeemable noncontrolling interests, net | | | | | | | | | | | - | | | | | | | | - | | | | 534,746 | |
Change in redemption value of redeemable noncontrolling interests | | | (30,749 | ) | | | | | | | (30,749 | ) | | | (13,170 | ) | | | (43,919 | ) | | | 43,919 | |
LFI Consolidated Funds | | | | | | | | | | | - | | | | 18,832 | | | | 18,832 | | | | | |
Other | | | (8,429 | ) | | | | | | | (8,429 | ) | | | (3 | ) | | | (8,432 | ) | | | | |
Balance - December 31, 2021 (*) | | $ | 984,807 | | | $ | (209,037 | ) | | $ | 775,770 | | | $ | 98,696 | | | $ | 874,466 | | | $ | 575,000 | |
(
| | | | | | | | | | | | | | | | | | | | | | | | | | | | | | | | | | | |
| Members' Equity | | Accumulated Other Comprehensive Income (Loss), Net of Tax | | Total Lazard Group Members’ Equity | | Noncontrolling
Interests | | Total
Members’
Equity | | Redeemable Noncontrolling Interests |
| | | | | |
| Balance - January 1, 2022 | $ | 984,807 | | | $ | (209,037) | | | $ | 775,770 | | | $ | 98,696 | | | $ | 874,466 | | | $ | 575,000 | |
| Comprehensive income (loss): | | | | | | | | | | | |
| Net income | 404,182 | | | | | 404,182 | | | 20,954 | | | 425,136 | | | 14,012 | |
| Other comprehensive loss - net of tax | | | (71,550) | | | (71,550) | | | | | (71,550) | | | |
| Amortization of share-based incentive compensation | 240,641 | | | | | 240,641 | | | | | 240,641 | | | |
| Distributions to members and noncontrolling interests, net | (228,045) | | | | | (228,045) | | | (31,447) | | | (259,492) | | | |
| Purchase of Class A common stock | (691,705) | | | | | (691,705) | | | | | (691,705) | | | |
| Delivery of Class A common stock in connection with share-based incentive compensation and related tax benefit of $96 | (61,820) | | | | | (61,820) | | | | | (61,820) | | | |
| Dividend equivalents | (10,872) | | | | | (10,872) | | | | | (10,872) | | | |
| Change in redemption value of redeemable noncontrolling interests | 3,879 | | | | | 3,879 | | | 1,662 | | | 5,541 | | | (5,541) | |
| LFI Consolidated Funds | | | | | | | | 18,279 | | | 18,279 | | | |
| Other | (2,111) | | | | | (2,111) | | | | | (2,111) | | | |
| Balance - December 31, 2022 (*) | $ | 638,956 | | | $ | (280,587) | | | $ | 358,369 | | | $ | 108,144 | | | $ | 466,513 | | | $ | 583,471 | |
| ______________________ | | | | | | | | | | | |
| (*) At December 31, 2022, in addition to profit participation interests, there were two managing member interests. | | |
*
) At December 31, 2021, in addition to profit participation interests, there were two managing member interests.
See notes to consolidated financial statements.
75
CONSOLIDATED STATEMENTS OF CHANGES IN MEMBERS’ EQUITY AND REDEEMABLE NONCONTROLLING INTERESTS
FOR THE YEARS ENDED DECEMBER 31,
2023, 2022
2021 AND
20202021
| | | | | | Accumulated Other Comprehensive | | | Total Lazard Group | | | | | | | Total | | | Redeemable | |
| | Members' | | | Income (Loss), | | | Members’ | | | Noncontrolling | | | Members’ | | | Noncontrolling | |
| | Equity | | | Net of Tax | | | Equity | | | Interests | | | Equity | | | Interests | |
Balance - January 1, 2022 | | $ | 984,807 | | | $ | (209,037 | ) | | $ | 775,770 | | | $ | 98,696 | | | $ | 874,466 | | | $ | 575,000 | |
Comprehensive income (loss): | | | | | | | | | | | | | | | | | | | | | | | | |
Net income | | | 404,182 | | | | | | | | 404,182 | | | | 20,954 | | | | 425,136 | | | | 14,012 | |
Other comprehensive loss - net of tax | | | | | | | (71,550 | ) | | | (71,550 | ) | | | | | | | (71,550 | ) | | | | |
Amortization of share-based incentive compensation | | | 240,641 | | | | | | | | 240,641 | | | | | | | | 240,641 | | | | | |
Distributions to members and noncontrolling interests, net | | | (228,045 | ) | | | | | | | (228,045 | ) | | | (31,447 | ) | | | (259,492 | ) | | | | |
Purchase of Class A common stock | | | (691,705 | ) | | | | | | | (691,705 | ) | | | | | | | (691,705 | ) | | | | |
Delivery of Class A common stock in connection with share-based incentive compensation and related tax benefit of $96 | | | (61,820 | ) | | | | | | | (61,820 | ) | | | | | | | (61,820 | ) | | | | |
Dividend equivalents | | | (10,872 | ) | | | | | | | (10,872 | ) | | | | | | | (10,872 | ) | | | | |
Change in redemption value of redeemable noncontrolling interests | | | 3,879 | | | | | | | | 3,879 | | | | 1,662 | | | | 5,541 | | | | (5,541 | ) |
LFI Consolidated Funds | | | - | | | | | | | | - | | | | 18,279 | | | | 18,279 | | | | | |
Other | | | (2,111 | ) | | | | | | | (2,111 | ) | | | | | | | (2,111 | ) | | | | |
Balance - December 31, 2022 (*) | | $ | 638,956 | | | $ | (280,587 | ) | | $ | 358,369 | | | $ | 108,144 | | | $ | 466,513 | | | $ | 583,471 | |
| | | | | | | | | | | | | | | | | | | | | | | | | | | | | | | | | | | |
| Members' Equity | | Accumulated Other Comprehensive Income (Loss), Net of Tax | | Total Lazard Group Members’ Equity | | Noncontrolling
Interests | | Total
Members’
Equity | | Redeemable Noncontrolling Interests |
| | | | | |
| Balance - January 1, 2021 | $ | 818,430 | | | $ | (193,446) | | | $ | 624,984 | | | $ | 85,885 | | | $ | 710,869 | | | $ | – | |
| Comprehensive income (loss): | | | | | | | | | | | |
| Net income (loss) | 654,495 | | | | | 654,495 | | | 18,146 | | | 672,641 | | | (3,665) | |
| Other comprehensive loss - net of tax | | | (15,591) | | | (15,591) | | | | | (15,591) | | | |
| Amortization of share-based incentive compensation | 233,958 | | | | | 233,958 | | | | | 233,958 | | | |
| Distributions to members and noncontrolling interests, net | (233,234) | | | | | (233,234) | | | (10,994) | | | (244,228) | | | |
| Purchase of Class A common stock | (406,149) | | | | | (406,149) | | | | | (406,149) | | | |
| Delivery of Class A common stock in connection with share-based incentive compensation and related tax expense of $39 | (68,051) | | | | | (68,051) | | | | | (68,051) | | | |
| Contribution from members | 14,000 | | | | | 14,000 | | | | | 14,000 | | | |
| Transfer of Class A common stock to Lazard Ltd Subsidiaries | 10,536 | | | | | 10,536 | | | | | 10,536 | | | |
| Contribution from redeemable noncontrolling interests, net | | | | | – | | | | | – | | | 534,746 | |
| Change in redemption value of redeemable noncontrolling interests | (30,749) | | | | | (30,749) | | | (13,170) | | | (43,919) | | | 43,919 | |
| LFI Consolidated Funds | | | | | – | | | 18,832 | | | 18,832 | | | |
| Other | (8,429) | | | | | (8,429) | | | (3) | | | (8,432) | | | |
| Balance - December 31, 2021 (*) | $ | 984,807 | | | $ | (209,037) | | | $ | 775,770 | | | $ | 98,696 | | | $ | 874,466 | | | $ | 575,000 | |
| ______________________ | | | | | | | | | | | |
| (*) At December 31, 2021, in addition to profit participation interests, there were two managing member interests. | | |
(
*
) At December 31, 2022, in addition to profit participation interests, there were two managing member interests.
See notes to consolidated financial statements.
76
NOTES TO CONSOLIDATED FINANCIAL STATEMENTS
(dollars in thousands, unless otherwise noted)
1.
| ORGANIZATION AND BASIS OF PRESENTATION
|
1. ORGANIZATION AND BASIS OF PRESENTATION
The accompanying consolidated financial statements are those of Lazard Group LLC and its subsidiaries (collectively referred to as “Lazard Group”, “we” or the “Company”). Lazard Group is a Delaware limited liability company, which
isas of December 31, 2022 was governed by an Amended and Restated Operating Agreement dated as of February 4,
2019 (the2019. Such operating agreement was subsequently amended and restated effective as of January 1, 2023 (as so amended and restated, the “Operating Agreement”).
Lazard Ltd, a Bermuda holding company, and its subsidiaries (collectively referred to as “Lazard Ltd”)
, including its indirect investment in Lazard Group, is one of the world’s preeminent financial advisory and asset management firms that specializes in crafting solutions to the complex financial and strategic challenges of our clients. We serve a diverse set of clients around the world, including corporations, governments, institutions, partnerships and individuals.
Lazard Ltd indirectly held 100% of all outstanding Lazard Group common membership interests as of December 31,
20222023 and
2021.2022. Lazard Ltd, through its control of the managing members of Lazard Group, controls Lazard Group.
On January 1, 2024, Lazard Ltd completed its conversion (the “Conversion”) from an exempted company incorporated under the laws of Bermuda named Lazard Ltd to a U.S. C-Corporation named Lazard, Inc.
Lazard Group’s principal operating activities are included in two business segments:
| •
| Financial Advisory, which offers corporate, partnership, institutional, government, sovereign and individual clients across the globe a wide array of financial advisory services regarding strategic and mergers and acquisitions (“M&A”) advisory, capital markets advisory, shareholder advisory, restructuring and capital solutions, sovereign advisory, geopolitical advisory, capital raising and placement, and other strategic advisory matters, and
|
| •Financial Advisory, which offers corporate, partnership, institutional, government, sovereign and individual clients across the globe a wide array of financial advisory services regarding strategic and mergers and acquisitions (“M&A”) advisory, capital markets advisory, shareholder advisory, restructuring and liability management, sovereign advisory, geopolitical advisory and other strategic advisory matters and capital raising and placement, and• | Asset Management, which offers a broad range of global investment solutions and investment and wealth management services in equity and fixed income strategies, asset allocation strategies, alternative investments and private equity funds to corporations, public funds, sovereign entities, endowments and foundations, labor funds, financial intermediaries and private clients.
|
•Asset Management, which offers a broad range of global investment solutions and investment and wealth management services in equity and fixed income strategies, asset allocation strategies, alternative investments and private equity funds to corporations, public funds, sovereign entities, endowments and foundations, labor funds, financial intermediaries and private clients.
In addition, we record selected other activities in our Corporate segment, including management of cash, investments,
deferred tax assets, outstanding indebtedness,
certain contingent obligations, and certain assets and liabilities associated with
(i) Lazard Group’s Paris-based subsidiary, Lazard Frères Banque SA (“LFB”), and (ii) a special purpose acquisition company
that was sponsored by an affiliate of the Company, Lazard Growth Acquisition Corp. I (“LGAC”).
The consolidated financial statements are prepared in conformity with accounting principles generally accepted in the United States of America (“U.S. GAAP”). The Company’s policy is to consolidate entities in which it has a controlling financial interest. The Company consolidates:
| •
| Voting interest entities (“VOEs”) where the Company holds a majority of the voting interest in such VOEs, and
|
| •
| Variable•Voting interest entities (“VOEs”) where the Company holds a majority of the voting interest entities (“VIEs”) where the Company is the primary beneficiary having the power to direct the activities of the VIE that most significantly impact the VIE’s economic performance and the obligation to absorb losses of, or receive benefits from, the VIE that could be potentially significant to the VIE (see Note 21).
|
78
LAZARD GROUP LLC
NOTES TO CONSOLIDATED FINANCIAL STATEMENTS—(Continued)
(dollars in thousands, unless otherwise noted)
such VOEs, and
•Variable interest entities (“VIEs”) where the Company is the primary beneficiary having the power to direct the activities of the VIE that most significantly impact the VIE’s economic performance and the obligation to absorb losses of, or receive benefits from, the VIE that could be potentially significant to the VIE (see Note 23).
When the Company does not have a controlling interest in an entity, but exerts significant influence over such entity’s operating and financial decisions, the Company either (i) applies the equity method of accounting in which it records a proportionate share of the entity’s net earnings or losses or (ii) elects the option to measure its investment at fair value.
LAZARD GROUP LLC
NOTES TO CONSOLIDATED FINANCIAL STATEMENTS—(Continued)
(dollars in thousands, unless otherwise noted)
Intercompany transactions and balances have been eliminated.
The consolidated financial statements include Lazard Group and Lazard Group’s principal operating subsidiaries: Lazard Frères & Co. LLC (“LFNY”), a New York limited liability company, along with its subsidiaries, including Lazard Asset Management LLC and its subsidiaries (collectively referred to as “LAM”); the French limited liability companies Compagnie Financière Lazard Frères SAS (“CFLF”), along with its subsidiaries,
LFBLazard Frères Banque SA (“LFB”) and Lazard Frères Gestion SAS (“LFG”), and Maison Lazard SAS and its subsidiaries; and Lazard & Co., Limited (“LCL”), through Lazard & Co., Holdings Limited (“LCH”), an English private limited company, together with their jointly owned affiliates and subsidiaries.
Lazard Growth Acquisition Corp. I
In February 2021, LGAC consummated its $575,000 initial public offering (the “LGAC IPO”). LGAC
iswas a special purpose acquisition company,
that was incorporated as a Cayman Islands exempted company for the purpose of effecting a merger, share exchange, asset acquisition, share purchase, reorganization or similar business combination with one or more businesses (a “Business Combination”). LGACo 1 LLC, a Delaware series limited liability company and the Company’s subsidiary,
iswas the sponsor of LGAC. LGAC
iswas considered to be a VIE. The Company
holdsheld a controlling financial interest in LGAC through the sponsor’s ownership of Class B founder shares of LGAC. As a result, both LGAC and the sponsor
arewere consolidated in the Company’s financial statements.
The proceeds from the LGAC IPO of $575,000
arewere held in a trust account,
, until the earlier of: (i) the completion of a Business Combination and (ii) the distribution of the funds in the trust account to the LGAC shareholders in connection with the redemption of LGAC’s Class A ordinary shares, subject to certain conditions. The cash held in the trust account
iswas recorded in “restricted cash” on the consolidated statements of financial
condition.condition as of December 31, 2022.
Transaction costs, which consisted of a net underwriting fee of $8,500, $20,125 of non-cash deferred underwriting fees (included in “other liabilities” on the consolidated statements of financial
condition)condition as of December 31, 2022) and $852 of other offering costs, were charged against the gross proceeds of the LGAC
IPO, consistent with SEC Staff Accounting Bulletin (SAB) Topic 5.IPO.
“Redeemable noncontrolling interests” of $583,471 associated with the publicly held LGAC Class A ordinary shares
arewere recorded on the Company’s consolidated statements of financial condition as of December 31, 2022 at redemption value and classified as temporary
equity in accordance with Financial Accounting Standards Board (“FASB”) Accounting Standards Codification (“ASC”) Topic 480 “Distinguishing Liabilities from Equity”.equity. Changes in redemption value
arewere recognized immediately as they
occuroccurred and
will adjustadjusted the carrying value of redeemable noncontrolling interests to equal the redemption value at the end of each reporting period. Increases or decreases in the carrying amount of redeemable noncontrolling interests
shall bewere affected by credits or charges to
additional paid-in-capitalmembers’ equity and noncontrolling interests attributable to certain members of LGACo 1 LLC based on pro rata ownership.
The warrants exercisable for LGAC Class A ordinary shares that were issued in connection with the LGAC IPO (the “LGAC Warrants”)
meetmet the definition of a liability under
FASB ASCFinancial Accounting Standards Board (“FASB”) Accounting Standards Codification (“ASC”) Topic 815 and
arewere classified as derivative liabilities which
arewere remeasured at fair value at each balance sheet date until exercised
or cancelled, with changes in fair value reported to earnings. See Note
7.8.
On February 23, 2023, LGAC redeemed all of its outstanding publicly held Class A ordinary shares
effective on or about February 23, 2023, becauseas a result of LGAC
did not
consummateconsummating a Business Combination within the time period required by its amended and restated memorandum and articles of
association.association resulting in the distribution of $585,891 of the cash held in the trust account to the LGAC shareholders. The Company recognized $17,929 of losses on the liquidation of LGAC in “revenue-other” on the consolidated statements of operations for the year ended December 31, 2023. In addition, the $20,125 of non-cash deferred underwriting fees noted above was no longer probable of being incurred and therefore was reversed from other liabilities to members’ equity. There
will bewere no redemption rights or liquidating distributions with respect to the LGAC warrants.
79
LAZARD GROUP LLC
NOTES TO CONSOLIDATED FINANCIAL STATEMENTS—(Continued)
(dollars in thousands, unless otherwise noted)
2.
| SIGNIFICANT ACCOUNTING POLICIES
|
2. SIGNIFICANT ACCOUNTING POLICIES
The accounting policies below relate to reported amounts and disclosures in the consolidated financial statements.
LAZARD GROUP LLC
NOTES TO CONSOLIDATED FINANCIAL STATEMENTS—(Continued)
(dollars in thousands, unless otherwise noted)
Foreign Currency Translation—Currency—The consolidated financial statements are presented in U.S. Dollars. Many of the Company’s non-U.S. subsidiaries have a functional currency (i.e., the currency in which operational activities are primarily conducted) that is other than the U.S. Dollar, generally the currency of the country in which such subsidiaries are domiciled. Such subsidiaries’ assets and liabilities are translated into U.S. Dollars at year-end exchange rates, while revenue and expenses are translated at average exchange rates during the year based on the daily closing exchange rates. Adjustments that result from translating amounts from a subsidiary’s functional currency to U.S. Dollars are reported in “accumulated other comprehensive income (loss), net of tax” (“AOCI”). Foreign currency remeasurement gains and losses on transactions in non-functional currencies are included on the consolidated statements of operations. Foreign currency remeasurement gains (losses), net of gains and losses from forward foreign currency exchange rate contracts (see Note 7)8) amounted to $(5,531), $778 $(952) and $(904)$(952) for the years ended December 31, 2023, 2022 2021 and 2020,2021, respectively, and are included in “revenue-other” on the respective consolidated statements of operations. Use of Estimates—The preparation of consolidated financial statements in conformity with U.S. GAAP requires the use of management’s estimates. In preparing the consolidated financial statements, management makes estimates and assumptions regarding: | •
| valuations of assets and liabilities requiring fair value estimates including, but not limited to, investments, derivatives and assumptions used to value pension and other post-retirement plans;
|
| •valuations of assets and liabilities requiring fair value estimates including, but not limited to, investments, derivatives and assumptions used to value pension and other post-retirement plans;• | the assessment of probability with respect to recognizing revenue;
|
| •the assessment of probability with respect to recognizing revenue;• | the discount rate used to measure operating lease right-of-use assets and operating lease liabilities;
|
| •the discount rate used to measure operating lease right-of-use assets and operating lease liabilities;• | the adequacy of the allowance for credit losses;
|
| •the adequacy of the allowance for credit losses;• | the realization of deferred tax assets and adequacy of tax reserves for uncertain tax positions;
|
| •the realization of deferred tax assets and adequacy of tax reserves for uncertain tax positions;• | the outcome of litigation;
|
| •the outcome of litigation;• | the carrying amount of goodwill and other intangible assets;
|
| •the carrying amount of goodwill and other intangible assets;• | the vesting of share-based and other deferred compensation plan awards; and
|
| •the vesting of share-based and other deferred compensation plan awards; and• | other matters that affect the reported amounts and disclosure of contingencies in the consolidated financial statements.
|
•other matters that affect the reported amounts and disclosure of contingencies in the consolidated financial statements.
Estimates, by their nature, are based on judgment and available information. Therefore, actual results could differ from those estimates and could have a material impact on the consolidated financial statements.
Cash and Cash Equivalents—The Company defines cash equivalents as short-term, highly liquid securities and cash deposits with original maturities of 90 days or less when purchased.80
LAZARD GROUP LLC
NOTES TO CONSOLIDATED FINANCIAL STATEMENTS—(Continued)
(dollars in thousands, unless otherwise noted)
Deposits with Banks and Short-Term Investments—Represents LFB’s short-term deposits, including with the Banque de France and amounts placed by LFB in short-term, highly liquid securities with original maturities of 90 days or less when purchased. The level of these deposits and investments may be driven by the level of LFB demand deposits (which can fluctuate significantly on a daily basis) and by changes in asset allocation. Restricted Cash—Primarily represents LGAC restricted cash (see Note 1) in 2022, escrowed cash balances that the Company cannot access prior to meeting certain requirements and other restricted cash deposits made by the Company, including those to satisfy the requirements of clearing organizations. Receivables and Allowance for Credit Losses—The Company’s receivables represent fee receivables, amounts due from customers and other receivables. The fee receivables are generally due within 60 days from the date of invoice, except as related to certain Restructuringrestructuring services and certain Capital Raisingcapital raising activities specifically Private Capital Advisory services, which have fee receivableswhere fees are due upon specified contractual payment terms. For customer loans within customers and other receivables, the Company has elected to apply the practical expedient, in accordance with the current expected credit losses (“CECL”) guidance for financial assets with collateral maintenance provisions, which generally results in no expected credit losses given that these loans are maintainedfully collateralized and monitored for counterparty creditworthiness, with such collateral having a fair value in excess of the carrying amount of the loans.
LAZARD GROUP LLC
NOTES TO CONSOLIDATED FINANCIAL STATEMENTS—(Continued)
(dollars in thousands, unless otherwise noted)
Receivables are stated net of an estimated allowance for credit losses determined in accordance with the CECL model, for general credit risk of the overall portfolio and for specific accounts deemed uncollectible, which may include situations where a fee is in dispute.
For fee receivables, the allowance for credit losses is determined together for all Financial Advisory fees, except for Private Capital Advisory given the different nature of the business, client composition, and risk characteristics. An allowance for credit losses is determined separately for Private Capital Advisory. In addition, a separate allowance for credit losses is determined for all Asset Management fees. The
allowance isallowances are measured by the application of an average charge-off rate, determined annually based on historical bad debt charge-off experience, to the fee receivable balance of the respective services, adjusted for the specific allowance recognized based on current conditions of individual clients. The current conditions are considered on a quarterly basis and include the aging of the receivables, the client’s ability to make payments, and the Company’s relationship with the client. In addition, the Company also performs a qualitative assessment on a quarterly basis to monitor economic factors and other uncertainties that may require additional adjustment to the expected credit losses allowance.
Financial Advisory and Asset Management fee receivables are generally deemed past due when they are outstanding 60 days from the date of invoice, except for certain transactions that include specific contractual payment terms that may vary from approximately one month to four years following the invoice date (as is the case for certain Private Capital Advisory fees) or may be subject to court approval (as is the case with Restructuring activities that include bankruptcy proceedings). In such cases, receivables are deemed past due when payment is not received by the agreed-upon contractual date or the court approval date, respectively. Financial Advisory and Asset Management fee receivables past due in excess of 180 days and 10 months, respectively, are generally fully provided for unless there is evidence that the balance is collectible. Notwithstanding our policy for receivables past due, any specific receivables that are deemed uncollectible result in specific reserves against such exposures.
See Note
45 for additional information regarding the Company’s receivables and allowance for credit losses.
Investments—Investments in debt and marketable equity securities held either directly, or indirectly through asset management funds at the Company’s broker-dealer and non broker-dealer subsidiaries are accounted for at fair value, with any increase or decrease in fair value recorded in earnings. Such amounts are reflected in “revenue-other” in the consolidated statements of operations.81
LAZARD GROUP LLC
NOTES TO CONSOLIDATED FINANCIAL STATEMENTS—(Continued)
(dollars in thousands, unless otherwise noted)
Investments also include interests in alternative investment funds and private equity funds, each accounted for at fair value, and investments accounted for under the equity method of accounting. Any increases or decreases in the carrying value of the investments accounted for at fair value and the Company’s share of net income or losses pertaining to its equity method investments are reflected in “revenue-other” in the consolidated statements of operations. Additionally, equity method investments are tested for impairment
annually, or more frequently if circumstances indicate impairment may have occurred.
Impairment charges are reflected in “revenue-other” in the consolidated statements of operations.
Dividend income is reflected in “revenue-other” in the consolidated statements of operations. Securities transactions and the related revenue and expenses are recorded on a “trade date” basis.
See Notes
56 and
67 for additional information regarding the Company’s investments.
Property-net—Property is stated at cost less accumulated depreciation and amortization. Buildings are depreciated on a straight-line basis over their estimated useful lives. Leasehold improvements are capitalized and are amortized over the lesser of the economic useful life of the improvement or the term of the lease. Depreciation of furniture and equipment, including computer hardware and software, is determined on a straight-line basis using estimated useful lives. Depreciation and amortization expenses aggregating $42,847, $42,037 $38,014 and $34,786$38,014 for the years ended December 31, 2023, 2022 2021 and 2020,2021, respectively, are included on the consolidated statements of operations in “occupancy and equipment” or “technology and information services”, depending on the nature of the underlying asset. Repairs and maintenance are expensed as incurred. Operating Lease Right-of-use Assets and Operating Lease Liabilities—The Company determines if an arrangement is, or contains, a lease at its inception and reevaluates the arrangement if the terms are modified. Operating
LAZARD GROUP LLC
NOTES TO CONSOLIDATED FINANCIAL STATEMENTS—(Continued)
(dollars in thousands, unless otherwise noted)
lease right-of-use assets (“ROU assets”) represent the right to use an underlying asset for the lease term and operating lease liabilities reflect the obligation to make lease payments arising from the lease. At any given time during the lease term, the operating lease liability represents the present value of the remaining lease payments and the operating lease ROU asset is measured at the amount of the lease liability, adjusted for rent prepayments, unamortized initial direct costs and the remaining balance of lease incentives received. Both the operating lease ROU asset and the operating lease liability are reduced to zero at the end of the lease.
See Note
910 for additional information regarding the Company’s ROU assets and operating lease liabilities.
Goodwill and Other Intangible Assets—As goodwillGoodwill has an indefinite life itand is required to be tested for impairment annually, as of November 1, or more frequently if circumstances indicate impairment may have occurred. The Company performs a qualitative evaluationassessment about whether it is more likely than not that the fair value of a reporting unit is less than its carrying amount in lieu of actually calculating the fair value of the reporting unit. If events indicate that it is more likely than not that a reporting unit’s fair value is less than its carrying value, the Company performs a quantitative assessment to determine the fair value of the reporting unit and compares it to its carrying value. If the carrying value of a reporting unit exceeds its fair value, the Company would recognize an impairment loss equal to the excess. Intangible assets that are not deemed to have an indefinite life are amortized over their estimated useful lives and are reviewed for impairment whenever events or changes in circumstances indicate that the carrying amount of such assets may not be recoverable. The pattern of amortization reflects the timing of the realization of the economic benefits of such intangible assets. For acquired customer contracts, the period of realization is deemed to be the period when the related revenue is recognized.
ThisThe impairment analysis is performed by comparing the carrying value of the intangible asset being reviewed for impairment to the current and expected future cash flows expected to be generated from such asset on an undiscounted basis, including eventual disposition. An impairment loss would be measured for the amount by which the carrying amount of the intangible asset exceeds its fair value.
See Note
1011 with respect to goodwill and other intangible assets.
Derivative Instruments—A derivative is typically defined as a financial instrument whose value is “derived” from underlying assets, indices or reference rates, such as a future, forward, swap, warrant or option contract, or other financial instrument with similar characteristics. Derivative contracts often involve future commitments to exchange interest payment streams or currencies based on a notional or contractual amount (e.g., interest rate swaps or currency forwards) or to purchase or sell other financial instruments at specified terms on a specified date (e.g., options to buy or sell securities or currencies).82
LAZARD GROUP LLC
NOTES TO CONSOLIDATED FINANCIAL STATEMENTS—(Continued)
(dollars in thousands, unless otherwise noted)
The Company enters into forward foreign currency exchange rate contracts, interest rate swaps, interest rate futures, total return swap contracts on various equity and debt indices and other derivative contracts to economically hedge exposures to fluctuations in currency exchange rates, interest rates and equity and debt prices. The Company reports its derivative instruments separately as assets and liabilities unless a legal right of set-off exists under a master netting agreement enforceable by law, in which case the Company would net the applicable assets and liabilities and related receivable and payable for net cash collateral under such contracts. The Company’s derivative instruments are recorded at their fair value, and are included in “other assets” and “other liabilities” on the consolidated statements of financial condition. Gains and losses on the Company’s derivative instruments are generally included in “interest income” and “interest expense” or “revenue-other”, depending on the nature of the underlying item, in the consolidated statements of operations.
In addition to the derivative instruments described above, the Company records derivative liabilities relating to its obligations pertaining to Lazard Fund Interests (“LFI”) and other similar deferred compensation arrangements, the fair value of which is based on the value of the underlying investments, adjusted for estimated forfeitures, and is included in “accrued compensation and benefits” in the consolidated statements of financial condition. Changes in the fair value of the derivative liabilities are included in “compensation and benefits” in the consolidated statements of operations, the impact of which equally offsets the changes in the fair value of investments which are currently expected to be delivered upon settlement of LFI and other similar deferred compensation arrangements, which are reported in “revenue-other” in the
LAZARD GROUP LLC
NOTES TO CONSOLIDATED FINANCIAL STATEMENTS—(Continued)
(dollars in thousands, unless otherwise noted)
consolidated statements of operations. For information regarding LFI and other similar deferred compensation arrangements, see Notes
5, 76, 8 and
15.16.
For information regarding LGAC Warrants that are accounted for as derivative liabilities, see Notes 1 and
7.8.
Deposits and Other Customer Payables—Principally consists of LFB customer-related demand deposits. Securities Sold, Not Yet Purchased—Securities sold, not yet purchased represents liabilities for securities sold for which payment has been received and the obligations to deliver such securities are included within “other liabilities” in the consolidated statements of financial condition. These securities are accounted for at fair value, with any increase or decrease in fair value recorded in earnings in accordance with standard securities industry practices. Such gains and losses are reflected in “revenue-other” in the consolidated statements of operations. Fair Value of Financial Assets and Liabilities—The majority of the Company’s financial assets and liabilities are recorded at fair value or at amounts that approximate fair value. Such assets and liabilities include cash and cash equivalents, deposits with banks and short-term investments, restricted cash, receivables, investments (excluding investments accounted for under the equity method of accounting), derivative instruments, deposits and other customer payables. Redeemable Noncontrolling Interests—SeeNotes 15 and 23 for information regarding consolidated VIE interests held by employees and Note 1 for information regarding interests in LGAC classified as temporary equity. Investment Banking and Other Advisory Fees —Fees for Financial Advisory services are recorded when: (i) a contract with a client has been identified, (ii) the performance obligations in the contract have been identified, (iii) the fee or other transaction price has been determined, (iv) the fee or other transaction price has been allocated to each performance obligation in the contract, and (v) the Company has satisfied the applicable performance obligation. The expenses that are directly related to such transactions are recorded as incurred and presented within operating expenses when the Company is primarily responsible for fulfilling the promise of the arrangement. Revenues associated with the reimbursement of such expenses are recorded when the Company is contractually entitled to reimbursement and presented within investment banking and other advisory fees.83
LAZARD GROUP LLC
NOTES TO CONSOLIDATED FINANCIAL STATEMENTS—(Continued)
(dollars in thousands, unless otherwise noted)
Asset Management Fees—Fees for Asset Management services are primarily comprised of management fees and incentive fees. Management fees are derived from fees for investment management and other services provided to clients. Revenue is recorded in accordance with the same five criteria as Financial Advisory fees, which generally results in management fees being recorded on a daily, monthly or quarterly basis, primarily based on a percentage of client assets managed. Fees vary with the type of assets managed, with higher fees earned on equity assets, alternative investment (such as hedge fund) and private equity funds, and lower fees earned on fixed income and money market products. Expenses that are directly related to the sale or distribution of fund interests are recorded as incurred and presented within operating expenses when the Company is primarily responsible for fulfilling the promise of the arrangement. Revenues associated with the reimbursement of such expenses are recorded when the Company is contractually entitled to reimbursement and presented within asset management fees. In addition, the Company earns performance-based incentive fees on various investment products, including traditional products and alternative investment funds such as hedge funds and private equity funds.
For hedge funds, incentive fees are calculated based on a specific percentage of a fund’s net appreciation, in some cases in excess of established benchmarks or thresholds. The Company records incentive fees on traditional products and hedge funds when a significant reversal in the amount of the cumulative revenue to be recognized is not probable, which is typically at the end of the relevant performance measurement period. The incentive fee measurement period is generally an annual period (unless an account is terminated during the year). The incentive fees received at the end of the measurement period are not subject to reversal or
payback.clawback. Incentive fees on hedge funds generally are subject to loss carryforward provisions in which losses incurred by the hedge funds in any year are applied against certain gains realized by the hedge funds in future periods before any incentive fees can be earned.
LAZARD GROUP LLC
NOTES TO CONSOLIDATED FINANCIAL STATEMENTS—(Continued)
(dollars in thousands, unless otherwise noted)
For private equity funds, incentive fees may be earned in the form of a “carried interest” if profits arising from realized investments exceed a specified threshold. Typically, such carried interest is ultimately calculated on a whole-fund or investment by investment basis and, therefore, clawback of carried interest toward the end of the life of the fund can occur. As a result, the Company recognizes incentive fees earned on our private equity funds
only when it is probable that a clawback will not occur.
Receivables relating to asset management and incentive fees are reported in “fees receivable” on the consolidated statements of financial condition.
Equity-Based Incentive Compensation Awards—Equity-based incentive compensation awards that do not require future service are expensed immediately. Equity-based compensation awards that require future service are expensed over the applicable vesting period, or requisite service period, based on the grant date fair value of Lazard Ltd’s Class A common stock (“common stock”), the only class of common stock of Lazard Ltd outstanding, on the date of grant.award. Compensation expense recognized for equity-based incentive compensation is determined based on the number of awards that in the Company’s estimate are considered probable of vesting (including as a result of any applicable performance conditions). Equity-based incentive compensation is primarily recognized in “compensation and benefits” expense. Income Taxes—Deferred income taxes reflect the net tax effects of temporary differences between the financial reporting and tax basis of assets and liabilities and are measured using the enacted tax rates and laws that will be in effect when such differences are expected to reverse. Such temporary differences are reflected as deferred“deferred tax assetsassets” and deferred“deferred tax liabilitiesliabilities” on the consolidated statements of financial condition. A deferred tax asset is recognized if it is more likely than not (defined as a likelihood of greater than 50%) that a tax benefit will be accepted by the relevant taxing authority.84
LAZARD GROUP LLC
NOTES TO CONSOLIDATED FINANCIAL STATEMENTS—(Continued)
(dollars in thousands, unless otherwise noted)
In assessing the realizability of deferred tax assets, management considers whether it is more likely than not that some portion or all of the deferred tax assets will not be realized and, when necessary, a valuation allowance is established. The ultimate realization of the deferred tax assets is dependent upon the generation of future taxable income during the periods in which temporary differences become deductible. Management considers the following possible sources of taxable income when assessing the realization of deferred tax assets:
| •
| future reversals of existing taxable temporary differences;
|
| •future reversals of existing taxable temporary differences;• | future taxable income exclusive of reversing temporary differences and carryforwards;
|
| •future taxable income exclusive of reversing temporary differences and carryforwards;• | taxable income in prior carryback years; and
|
| •taxable income in prior carryback years; and• | tax-planning strategies.
|
•tax-planning strategies.
The assessment regarding whether a valuation allowance is required or should be adjusted also considers all available information, including the following:
| •
| nature, frequency, magnitude and duration of any past losses and current operating results;
|
| •nature, frequency, magnitude and duration of any past losses and current operating results;• | duration of statutory carryforward periods;
|
| •duration of statutory carryforward periods;• | historical experience with tax attributes expiring unused; and
|
| •historical experience with tax attributes expiring unused; and• | near-term and medium-term financial outlook.
|
•near-term and medium-term financial outlook.
The Company records tax positions taken or expected to be taken in a tax return based upon the Company’s estimates regarding the amount that is more likely than not to be realized or paid, including in connection with the resolution of any related appeals or other legal processes. Accordingly, the Company recognizes liabilities for certain unrecognized tax benefits based on the amounts that are more likely than not to be settled with the relevant taxing authority.
The Company recognizes interest and/or penalties related to unrecognized tax benefits in “provision for income taxes”. See Note
1719 for additional information relating to income taxes.
LAZARD GROUP LLC
NOTES TO CONSOLIDATED FINANCIAL STATEMENTS—(Continued)
(dollars in thousands, unless otherwise noted)
3. RECENT ACCOUNTING DEVELOPMENTS
Segment Reporting (Topic 280): Improvements to Reportable Segment Disclosures—In November 2023, the Financial Accounting Standards Board (“FASB”) issued an accounting standard update to improve the disclosures about a public entity’s reportable segments and address requests from investors for additional, more detailed information about reportable segment’s expenses. The amendments include new annual and interim disclosure requirements primarily related to significant segment expenses, reportable segments’ profit or loss, and information on the chief operating decision maker. The new guidance is effective for annual periods beginning after December 15, 2023, and interim periods beginning after December 15, 2024. The amendments shall be applied retrospectively to all prior periods presented in the consolidated financial statements. The Company is currently evaluating the new guidance.
Income Taxes (Topic 740): Improvements to Income Tax Disclosures —In December 2023, the FASB issued an accounting standard update to enhance the transparency and decision usefulness of income tax disclosures. The amendments include new annual disclosure requirements related to the rate reconciliation, information about income taxes paid, and disaggregated information on pre-tax income or loss and income tax expense from continuing operations. The amendments also eliminated certain disclosure requirements. The new guidance is effective for annual periods beginning after December 15, 2024, and shall be applied on a prospective basis. The Company is currently evaluating the new guidance.
4. REVENUE RECOGNITION
The Company disaggregates revenue based on its business segment results and believes that the following information provides a reasonable representation of how performance obligations relate to the nature, amount, timing and uncertainty of revenue and cash flows:
| | Year Ended December 31, | |
| | 2022 | | | 2021 | | | 2020 | |
| Year Ended December 31, | | | Year Ended December 31, |
| 2023 | | | 2023 | | 2022 | | 2021 |
Net Revenue: | | | | | | | | | | | | |
Financial Advisory (a) | |
Financial Advisory (a) | |
Financial Advisory (a) | | $ | 1,655,596 | | | $ | 1,794,132 | | | $ | 1,420,042 | |
| | | | | | | | | | | | |
Asset Management: | | | | | | | | | | | | |
| Asset Management: | |
| Asset Management: | |
| Management fees and other (b) | |
| Management fees and other (b) | |
Management fees and other (b) | | $ | 1,137,583 | | | $ | 1,304,582 | | | $ | 1,109,439 | |
Incentive fees (c) | | | 67,344 | | | | 120,403 | | | | 58,027 | |
Total Asset Management | | $ | 1,204,927 | | | $ | 1,424,985 | | | $ | 1,167,466 | |
(a)
| Financial Advisory is comprised of a wide array of financial advisory services regarding M&A advisory, capital markets advisory, shareholder advisory, restructuring and capital solutions, sovereign advisory, capital raising and placement, and other strategic advisory work for clients. The benefits of these advisory services are generally transferred to the Company’s clients over time, and consideration for these advisory services typically includes transaction completion, transaction announcement and retainer fees. Retainer fees are generally fixed and recognized over the period in which the advisory services are performed. However, transaction announcement and transaction completion fees are variable and subject to constraints, and they are typically not recognized until there is an announcement date or a completion date, respectively, due to the uncertainty associated with those events. Therefore, in any given period, advisory fees recognized for certain transactions may relate to services performed in prior periods. The advisory fees that may be unrecognized as of the end of a reporting period, primarily comprised of fees associated with transaction announcements and transaction completions, generally remain unrecognized due to the uncertainty associated with those events.
|
________________________85
(a)Financial Advisory is comprised of a wide array of financial advisory services regarding M&A advisory, capital markets advisory, shareholder advisory, restructuring and liability management, sovereign advisory, geopolitical advisory and other strategic advisory and capital raising and placement work for clients. The benefits of these advisory services are generally transferred to the Company’s clients over time, and consideration for these advisory services typically includes transaction completion, transaction announcement and retainer fees. Retainer fees are generally fixed and recognized over the period in which the advisory services are performed. However, transaction announcement and transaction completion fees are variable and subject to constraints, and they are typically not recognized until there is an announcement date or a completion date, respectively, due to the uncertainty associated with those events. Therefore, in any given period, advisory fees recognized for certain transactions may relate to services performed in prior periods. The advisory fees that may be unrecognized as of the end of a reporting period, primarily comprised of fees associated with transaction announcements and transaction completions, generally remain unrecognized due to the uncertainty associated with those events.
(b)Management fees and other is primarily comprised of management services. The benefits of these management services are transferred to the Company’s clients over time. Consideration for these management services generally includes management fees, which are based on assets under management and recognized over the period in which the management services are performed. The selling or distribution of fund interests is a separate
NOTES TO CONSOLIDATED FINANCIAL STATEMENTS—(Continued)
(dollars in thousands, unless otherwise noted)
(b)
| Management fees and other is primarily comprised of management services. The benefits of these management services are transferred to the Company’s clients over time. Consideration for these management services generally includes management fees, which are based on assets under management and recognized over the period in which the management services are performed. The selling or distribution of fund interests is a separate performance obligation within management fees and other, and the benefits of such services are transferred to the Company’s clients at the point in time that such fund interests are sold or distributed.
|
(c)Incentive fees is primarily comprised of management services. The benefits of these management services are transferred to the Company’s clients over time. Consideration for these management services is generally variable and includes performance or incentive fees. The fees allocated to these management services that are unrecognized as of the end of the reporting period are generally amounts that are subject to constraints due to the uncertainty associated with performance targets and clawbacks. | Incentive fees is primarily comprised of management services. The benefits of these management services are transferred to the Company’s clients over time. Consideration for these management services is generally variable and includes performance or incentive fees. The fees allocated to these management services that are unrecognized as of the end of the reporting period are generally amounts that are subject to constraints due to the uncertainty associated with performance targets and clawbacks.
|
In addition to the above, contracts with clients include trade-based commission income, which is recognized at the point in time of execution and presented within other revenue. Such income may be earned by providing trade facilitation, execution, clearance and settlement, custody, and trade administration services to clients.
With regard to the disclosure requirement for remaining performance obligations, the Company elected the practical expedients permitted in the guidance to (i) exclude contracts with a duration of one year or less; and (ii) exclude variable consideration, such as transaction completion and transaction announcement fees, that is allocated entirely to unsatisfied performance obligations. Excluded variable consideration typically relates to contracts with a duration of one year or less, and is generally constrained due to uncertainties. Therefore, when applying the practical expedients, amounts related to remaining performance obligations are not material to the Company’s
consolidated financial statements.
4.
| RECEIVABLES AND ALLOWANCE FOR CREDIT LOSSES
|
5. RECEIVABLES AND ALLOWANCE FOR CREDIT LOSSES
The Company’s receivables represent fee receivables, amounts due from customers and other receivables and amounts due from Lazard Ltd subsidiaries. Where applicable, receivables are stated net of an estimated allowance for credit losses determined in accordance with the CECL model,model.
Of the Company’s fee receivables at December 31, 2023 and 2022, $113,929 and $97,964, respectively, represented financing receivables for general credit riskour Private Capital Advisory fees.
At December 31, 2023 and 2022, customers and other receivables included $86,412 and $128,890, respectively, of customer loans, which are fully collateralized and monitored for counterparty creditworthiness, with such collateral having a fair value in excess of the
overall portfoliocarrying amount of the loans as of both December 31, 2023 and
for specific accounts deemed uncollectible, which may include situations where a fee is in dispute.2022.
The aggregate carrying amount of other fees and customers and other receivables and amounts due from Lazard Ltd subsidiaries was $644,429 and $499,910 at December 31, 2023 and 2022, respectively.
Activity in the allowance for credit losses for the years ended December 31,
2023, 2022
2021 and
20202021 was as follows:
| | Year Ended December 31, | |
| | 2022 | | | 2021 | | | 2020 | |
| Year Ended December 31, | | | Year Ended December 31, |
| 2023 | | | 2023 | | 2022 | | 2021 |
Beginning Balance | | $ | 33,955 | | | $ | 36,649 | | | $ | 27,130 | |
Adjustment for adoption of new accounting guidance | | | - | | | | - | | | | 7,571 | |
Bad debt expense, net of reversals | | | 1,769 | | | | 3,805 | | | | 3,995 | |
Charge-offs, foreign currency translation and other adjustments | | | (17,987 | ) | | | (6,499 | ) | | | (2,047 | ) |
Ending Balance | | $ | 17,737 | | | $ | 33,955 | | | $ | 36,649 | |
86
LAZARD GROUP LLC
NOTES TO CONSOLIDATED FINANCIAL STATEMENTS—(Continued)
(dollars in thousands, unless otherwise noted)
Bad debt expense, net of reversals represents the current period provision of expected credit losses and is included in “operating expenses–other” on the consolidated statements of operations.
Of the Company’s fee receivables at December 31, 2022 and 2021, $97,964 and $123,189, respectively, represented financing receivables for our Private Capital Advisory fees.
At December 31, 2022 and 2021, customers and other receivables included $128,890 and $122,229, respectively, of customer loans, which are fully collateralized and closely monitored for counterparty creditworthiness, with such collateral having a fair value in excess of the carrying amount of the loans as of December 31, 2022 and 2021.
The aggregate carrying amount of other fees and customers and other receivables and amounts due from Lazard Ltd subsidiaries was $499,910 and $618,879 at December 31, 2022 and 2021, respectively.
The allowance for credit losses is substantially all related to
M&AFinancial Advisory fee receivables and
Restructuring feeother receivables.
LAZARD GROUP LLC
NOTES TO CONSOLIDATED FINANCIAL STATEMENTS—(Continued)
(dollars in thousands, unless otherwise noted)
6. INVESTMENTS
The Company’s investments and securities sold, not yet purchased, consist of the following at December 31, 2023 and 2022:
| | | | | | | | | | | |
| December 31, |
| 2023 | | 2022 |
| Debt | $ | 4,285 | | | $ | – | |
| Equities | 54,717 | | | 43,889 | |
| Funds: | | | |
| Alternative investments (a) | 61,680 | | | 56,947 | |
| Debt (a) | 191,325 | | | 178,556 | |
| Equity (a) | 343,139 | | | 350,282 | |
| Private equity | 46,818 | | | 53,822 | |
| 642,962 | | | 639,607 | |
| Investments, at fair value | 701,964 | | | 683,496 | |
| Equity method investments | – | | | 15,481 | |
| Total investments | $ | 701,964 | | | $ | 698,977 | |
_______________________
(a)Interests in alternative investment funds, debt funds and equity funds include investments, including those held by LFI Consolidated Funds (see Note 23), with fair values of $27,454, $175,449 and $284,099, respectively, at December 31, 2023 and $24,137, $142,632 and $266,528, respectively, at December 31, 2022, held in order to satisfy the Company’s obligation upon vesting of previously granted LFI and 2021:other similar deferred compensation arrangements. LFI represent grants by the Company to eligible employees of interests in a number of Lazard-managed funds, subject to service-based vesting conditions (see Notes 8 and 16). | | December 31, | |
| | 2022 | | | 2021 | |
Debt | | $ | - | | | $ | 299,990 | |
Equities | | | 43,889 | | | | 54,040 | |
Funds: | | | | | | | | |
Alternative investments (a) | | | 56,947 | | | | 49,757 | |
Debt (a) | | | 178,556 | | | | 164,952 | |
Equity (a) | | | 350,282 | | | | 375,761 | |
Private equity | | | 53,822 | | | | 46,589 | |
| | | 639,607 | | | | 637,059 | |
Investments, at fair value | | | 683,496 | | | | 991,089 | |
Equity method investments | | | 15,481 | | | | 16,250 | |
Total investments | | $ | 698,977 | | | $ | 1,007,339 | |
Securities sold, not yet purchased, at fair value (included in “other liabilities”) | | $ | 4,651 | | | $ | 6,828 | |
(a)
| Interests in alternative investment funds, debt funds and equity funds include investments, including those held by LFI Consolidated Funds (see Note 21), with fair values of $24,137, $142,632 and $266,528, respectively, at December 31, 2022 and $18,326, $132,875 and $306,618, respectively, at December 31, 2021, held in order to satisfy the Company’s obligation upon vesting of previously granted LFI and other similar deferred compensation arrangements. LFI represent grants by the Company to eligible employees of actual or notional interests in a number of Lazard-managed funds, subject to service-based vesting conditions (see Notes 7 and 15).
|
Debt primarily consists of U.S. Treasuryinvestments in government securities with original maturities of greater than three months and less than one year.
held within separately managed accounts in order to seed strategies in our Asset Management business.
Equities primarily consist of
seed investments
invested in marketable equity securities of large-, mid- and small-cap domestic, international and global companies held within separately managed accounts
relatedin order to
seed strategies in our Asset Management business.
87
LAZARD GROUP LLC
NOTES TO CONSOLIDATED FINANCIAL STATEMENTS—(Continued)
(dollars in thousands, unless otherwise noted)
Alternative investment funds primarily consist of interests in various Lazard-managed hedge funds, funds of funds and mutual funds. Such amounts primarily consist of
seed investments in funds
relatedin order to
seed strategies in our Asset Management business, and amounts related to LFI discussed above.
Debt funds primarily consist of
seed investments in
funds relateddebt securities in order to
seed strategies in our Asset Management business,
that invest in debt securities, amounts related to LFI discussed above and an investment in a Lazard-managed debt fund.
Equity funds primarily consist of
seed investments in
funds relatedequity securities in order to
seed strategies in our Asset Management business,
that invest in equity securities, and amounts related to LFI discussed above.
Private equity investments include those owned by Lazard and those consolidated but not owned by Lazard. Private equity investments owned by Lazard are primarily comprised of investments in private equity funds. Such investments primarily include (i) Edgewater Growth Capital Partners III, L.P. (“EGCP III”), a fund primarily making equity and buyout investments in middle market companies, (ii) a fund targeting significant noncontrolling-stake investments in established private companies and (iii) a seed investment in a fund
related to our Asset Management business that invests in sustainable private infrastructure opportunities.
Private equity investments consolidated but not owned by Lazard relate to the economic interests that are owned by the management team and other investors in the Edgewater Funds (“Edgewater”).
LAZARD GROUP LLC
NOTES TO CONSOLIDATED FINANCIAL STATEMENTS—(Continued)
(dollars in thousands, unless otherwise noted)
Equity method investments represent certain partnership interests accounted for under the equity method of accounting.
During the years ended December 31,
2023, 2022
2021 and
2020,2021, the Company reported in “revenue-other” on its consolidated statements of operations net unrealized investment gains and losses pertaining to equity securities and trading debt securities still held as of the reporting date as follows:
| | Year Ended December 31, | |
| | 2022 | | | 2021 | | | 2020 | |
Net unrealized investment gains (losses) | | $ | (92,793 | ) | | $ | 14,154 | | | $ | 49,719 | |
| | | | | | | | | | | | | | | | | |
| Year Ended December 31, |
| 2023 | | 2022 | | 2021 |
| Net unrealized investment gains (losses) | $ | 54,228 | | | $ | (92,793) | | | $ | 14,154 | |
7. FAIR VALUE MEASUREMENTS 6.
| FAIR VALUE MEASUREMENTS
|
Fair Value Hierarchy of Investments and Certain Other Assets and Liabilities—Lazard categorizes its investments and certain other assets and liabilities recorded at fair value into a three-level fair value hierarchy as follows:
Level 1.
| Assets and liabilities whose values are based on unadjusted quoted prices for identical assets or liabilities in an active market that Lazard has the ability to access.
|
Level 2.Level 1.Assets and liabilities whose values are based on unadjusted quoted prices for identical assets or liabilities in an active market that Lazard has the ability to access.
| Assets and liabilities whose values are based on (i) quoted prices for similar assets or liabilities in an active market, or quoted prices for identical or similar assets or liabilities in non-active markets, or (ii) inputs other than quoted prices that are directly observable or derived principally from, or corroborated by, market data.
|
Level 3.Level 2.Assets and liabilities whose values are based on (i) quoted prices for similar assets or liabilities in an active market, or quoted prices for identical or similar assets or liabilities in non-active markets, or (ii) inputs other than quoted prices that are directly observable or derived principally from, or corroborated by, market data.
| Assets and liabilities whose values are based on prices or valuation techniques that require inputs that are both unobservable and significant to the overall fair value measurement. These inputs reflect our own assumptions about the assumptions a market participant would use in pricing the asset or liability. Items included in Level 3 include securities or other financial assets whose trading volume and level of activity have significantly decreased when compared with normal market activity and there is no longer sufficient frequency or volume to provide pricing information on an ongoing basis.
|
Level 3.Assets and liabilities whose values are based on prices or valuation techniques that require inputs that are both unobservable and significant to the overall fair value measurement. These inputs reflect our own assumptions about the assumptions a market participant would use in pricing the asset or liability. Items included in Level 3 include securities or other financial assets whose trading volume and level of activity have significantly decreased when compared with normal market activity and there is no longer sufficient frequency or volume to provide pricing information on an ongoing basis.
The fair value of debt is classified as Level 1 when the fair values are based on unadjusted quoted prices in active markets.
88
LAZARD GROUP LLC
NOTES TO CONSOLIDATED FINANCIAL STATEMENTS—(Continued)
(dollars in thousands, unless otherwise noted)
The fair value of equities is classified as Level 1 or Level 3 as follows: marketable equity securities are classified as Level 1 and are valued based on the last trade price on the primary exchange for that security as provided by external pricing services; equity interests in private companies are generally classified as Level 3.
The fair value of investments in alternative investment funds, debt funds and equity funds is classified as Level 1 when the fair values are based on the publicly reported closing price for the
fund.fund, or Level 2 when based on one or more quoted prices in markets that are not active or for which all significant inputs are observable, either directly or indirectly.
The fair value of investments in certain private equity funds is classified as Level 3 for (i) certain investments that are valued based on the potential transaction value and (ii) when the acquisition price is considered the best measure of fair value.
The fair value of securities sold, not yet purchased, is classified as Level 1 when the fair values are based on unadjusted quoted prices in active markets.
The fair value of the contingent consideration liability is classified as Level 3. The contingent consideration liability is initially recorded at fair value on the acquisition date and is included in “other liabilities” on the consolidated statements of financial condition. The fair value of the contingent consideration liability is remeasured at each reporting period. The inputs used to derive the fair value of the contingent consideration include the application of probabilities when assessing certain performance thresholds for the relevant periods. Any change in the fair value is recognized in “amortization and other acquisition-related costs” in the consolidated statements of operations.Our business acquisitions may involve the potential payment of contingent consideration upon the achievement of certain performance thresholds.
LAZARD GROUP LLC
NOTES TO CONSOLIDATED FINANCIAL STATEMENTS—(Continued)
(dollars in thousands, unless otherwise noted)
The fair value of derivatives
entered into by the Company and classified as Level 1 is based on the listed market price of such instruments. The fair value of derivatives
entered into by the Company and classified as Level 2 is based on the values of the related underlying assets, indices or reference rates as follows: the fair value of forward foreign currency exchange rate contracts is a function of the spot rate and the interest rate differential of the two currencies from the trade date to settlement date; the fair value of total return swaps is based on the change in fair value of the related underlying equity security, financial instrument or index and a specified notional holding; the fair value of interest rate swaps is based on the interest rate yield curve; and the fair value of derivative liabilities related to LFI and other similar deferred compensation arrangements is based on the value of the underlying investments, adjusted for forfeitures. The fair value of derivatives
entered into by the Company and classified as Level 3 is based on a Black-Scholes valuation model that utilizes both observable and unobservable inputs. Unobservable inputs include model adjustments for valuation uncertainty. See Note
7.8.
Investments Measured at Net Asset Value (“NAV”)—As a practical expedient, the Company uses NAV or its equivalent to measure the fair value of certain investments. NAV is primarily determined based on information provided by external fund administrators. The Company’s investments valued at NAV as a practical expedient in (i) alternative investment funds, debt funds and equity funds are redeemable in the near term, and (ii) private equity funds are not redeemable in the near term as a result of redemption restrictions. The following tables present, as of December 31,
20222023 and
2021,2022, the classification of (i) investments and certain other assets and liabilities measured at fair value on a recurring basis within the fair value hierarchy and (ii) investments measured at NAV or its equivalent as a practical expedient:
| | December 31, 2022 | |
| | Level 1 | | | Level 2 | | | Level 3 | | | NAV | | | Total | |
| December 31, 2023 | | | December 31, 2023 |
| Level 1 | | | Level 1 | | Level 2 | | Level 3 | | NAV | | Total |
Assets: | | | | | | | | | | | | | | | | | | | | |
Investments: | | | | | | | | | | | | | | | | | | | | |
| Investments: | |
| Investments: | |
| Debt | |
| Debt | |
| Debt | |
Equities | | $ | 43,243 | | | $ | - | | | $ | 646 | | | $ | - | | | $ | 43,889 | |
Funds: | | | | | | | | | | | | | | | | | | | | |
| Alternative investments | |
| Alternative investments | |
Alternative investments | | | 27,073 | | | | - | | | | - | | | | 29,874 | | | | 56,947 | |
Debt | | | 178,552 | | | | - | | | | - | | | | 4 | | | | 178,556 | |
Equity | | | 350,242 | | | | - | | | | - | | | | 40 | | | | 350,282 | |
Private equity | | | - | | | | - | | | | 18,772 | | | | 35,050 | | | | 53,822 | |
Derivatives | | | - | | | | 14,554 | | | | - | | | | - | | | | 14,554 | |
Total | | $ | 599,110 | | | $ | 14,554 | | | $ | 19,418 | | | $ | 64,968 | | | $ | 698,050 | |
Liabilities: | | | | | | | | | | | | | | | | | | | | |
Securities sold, not yet purchased | | $ | 4,651 | | | $ | - | | | $ | - | | | $ | - | | | $ | 4,651 | |
| Securities sold, not yet purchased | |
| Securities sold, not yet purchased | |
| Contingent consideration liability | |
Derivatives | | | 115 | | | | 327,045 | | | | - | | | | - | | | | 327,160 | |
Total | | $ | 4,766 | | | $ | 327,045 | | | $ | - | | | $ | - | | | $ | 331,811 | |
89
NOTES TO CONSOLIDATED FINANCIAL STATEMENTS—(Continued)
(dollars in thousands, unless otherwise noted)
| | December 31, 2021 | |
| | Level 1 | | | Level 2 | | | Level 3 | | | NAV | | | Total | |
| December 31, 2022 | | | December 31, 2022 |
| Level 1 | | | Level 1 | | Level 2 | | Level 3 | | NAV | | Total |
Assets: | | | | | | | | | | | | | | | | | | | | |
Investments: | | | | | | | | | | | | | | | | | | | | |
Debt | | $ | 299,990 | | | $ | - | | | $ | - | | | $ | - | | | $ | 299,990 | |
| Investments: | |
| Investments: | |
| Equities | |
| Equities | |
Equities | | | 53,462 | | | | - | | | | 578 | | | | - | | | | 54,040 | |
Funds: | | | | | | | | | | | | | | | | | | | | |
| Alternative investments | |
| Alternative investments | |
Alternative investments | | | 24,972 | | | | - | | | | - | | | | 24,785 | | | | 49,757 | |
Debt | | | 164,947 | | | | - | | | | - | | | | 5 | | | | 164,952 | |
Equity | | | 375,712 | | | | - | | | | - | | | | 49 | | | | 375,761 | |
Private equity | | | - | | | | - | | | | 293 | | | | 46,296 | | | | 46,589 | |
Derivatives | | | - | | | | 922 | | | | - | | | | - | | | | 922 | |
Total | | $ | 919,083 | | | $ | 922 | | | $ | 871 | | | $ | 71,135 | | | $ | 992,011 | |
Liabilities: | | | | | | | | | | | | | | | | | | | | |
Securities sold, not yet purchased | | $ | 6,828 | | | $ | - | | | $ | - | | | $ | - | | | $ | 6,828 | |
| Securities sold, not yet purchased | |
| Securities sold, not yet purchased | |
Derivatives | | | 10,005 | | | | 362,240 | | | | - | | | | - | | | | 372,245 | |
Total | | $ | 16,833 | | | $ | 362,240 | | | $ | - | | | $ | - | | | $ | 379,073 | |
The following tables provide a summary of changes in fair value of the Company’s Level 3 assets and liabilities for the years ended December 31,
2023, 2022
2021 and
2020:2021: | | Year Ended December 31, 2022 | |
| | Beginning Balance | | | Net Unrealized/ Realized Gains/Losses Included In Earnings (a) | | | Purchases/ Issuances | | | Sales/ Settlements | | | Foreign Currency Translation Adjustments | | | Ending Balance | |
| Year Ended December 31, 2023 | | | Year Ended December 31, 2023 |
| Beginning
Balance | | | Beginning
Balance | | Net Unrealized/
Realized
Gains/Losses
Included In
Earnings (a) | | Purchases/
Acquisitions/
Issuances | | Sales/
Settlements/
Transfers (b) | | Foreign
Currency
Translation
Adjustments | | Ending
Balance |
Assets: | | | | | | | | | | | | | | | | | | | | | | | | |
Investments: | | | | | | | | | | | | | | | | | | | | | | | | |
| Investments: | |
| Investments: | |
| Equities | |
| Equities | |
Equities | | $ | 578 | | | $ | 99 | | | $ | - | | | $ | - | | | $ | (31 | ) | | $ | 646 | |
Private equity funds | | | 293 | | | | - | | | | 18,000 | | | | (13 | ) | | | 492 | | | | 18,772 | |
Total Level 3 assets | | $ | 871 | | | $ | 99 | | | $ | 18,000 | | | $ | (13 | ) | | $ | 461 | | | $ | 19,418 | |
| | Liabilities: | |
| Liabilities: | |
| Liabilities: | |
Contingent consideration
liability (c) | |
Contingent consideration
liability (c) | |
Contingent consideration
liability (c) | |
| Total Level 3 liabilities | |
| | Year Ended December 31, 2021 | |
| | Beginning Balance | | | Net Unrealized/ Realized Gains/Losses Included In Earnings (a) | | | Purchases/ Issuances | | | Sales/ Settlements/ Transfers (b) | | | Foreign Currency Translation Adjustments | | | Ending Balance | |
Assets: | | | | | | | | | | | | | | | | | | | | | | | | |
Investments: | | | | | | | | | | | | | | | | | | | | | | | | |
Equities | | $ | 1,671 | | | $ | (796 | ) | | $ | - | | | $ | (235 | ) | | $ | (62 | ) | | $ | 578 | |
Private equity funds | | | 1,486 | | | | 951 | | | | - | | | | (2,121 | ) | | | (23 | ) | | | 293 | |
Total Level 3 assets | | $ | 3,157 | | | $ | 155 | | | $ | - | | | $ | (2,356 | ) | | $ | (85 | ) | | $ | 871 | |
| | | | | | | | | | | | | | | | | | | | | | | | |
Liabilities: | | | | | | | | | | | | | | | | | | | | | | | | |
Derivatives | | $ | - | | | $ | - | | | $ | 11,500 | | | $ | (11,500 | ) | | $ | - | | | $ | - | |
Total Level 3 liabilities | | $ | - | | | $ | - | | | $ | 11,500 | | | $ | (11,500 | ) | | $ | - | | | $ | - | |
NOTES TO CONSOLIDATED FINANCIAL STATEMENTS—(Continued)
(dollars in thousands, unless otherwise noted)
| | | Year Ended December 31, 2020 | |
| | | Beginning Balance | | | Net Unrealized/ Realized Gains/Losses Included In Earnings (a) | | | Purchases/ Issuances | | | Sales/ Settlements | | | Foreign Currency Translation Adjustments | | | Ending Balance | |
| Year Ended December 31, 2022 | | | Year Ended December 31, 2022 |
| Beginning
Balance | | | Beginning
Balance | | Net Unrealized/
Realized
Gains/Losses
Included In
Earnings (a) | | Purchases/
Issuances | | Sales/
Settlements | | Foreign
Currency
Translation
Adjustments | | Ending
Balance |
Assets: | | | | | | | | | | | | | | | | | | | | | | | | | |
Investments: | | | | | | | | | | | | | | | | | | | | | | | | | |
| Investments: | |
| Investments: | |
| Equities | |
| Equities | |
Equities | | | $ | 1,600 | | | $ | 73 | | | $ | - | | | $ | - | | | $ | (2 | ) | | $ | 1,671 | |
Private equity funds | | | | 1,371 | | | | (190 | ) | | | 299 | | | | - | | | | 6 | | | | 1,486 | |
Total Level 3 assets | | | $ | 2,971 | | | $ | (117 | ) | | $ | 299 | | | $ | - | | | $ | 4 | | | $ | 3,157 | |
| | | | | | | | | | | | | | | | | | | | | | | | | | | | | | | | | | | |
| Year Ended December 31, 2021 |
| Beginning
Balance | | Net Unrealized/
Realized
Gains/Losses
Included In
Earnings (a) | | Purchases/
Issuances | | Sales/
Settlements/
Transfers (b) | | Foreign
Currency
Translation
Adjustments | | Ending
Balance |
| Assets: | | | | | | | | | | | |
| Investments: | | | | | | | | | | | |
| Equities | $ | 1,671 | | | $ | (796) | | | $ | – | | | $ | (235) | | | $ | (62) | | | $ | 578 | |
| Private equity funds | 1,486 | | | 951 | | | – | | | (2,121) | | | (23) | | | 293 | |
| Total Level 3 assets | $ | 3,157 | | | $ | 155 | | | $ | – | | | $ | (2,356) | | | $ | (85) | | | $ | 871 | |
| | | | | | | | | | | |
| Liabilities: | | | | | | | | | | | |
| Derivatives | $ | – | | | $ | – | | | $ | 11,500 | | | $ | (11,500) | | | $ | – | | | $ | – | |
| Total Level 3 liabilities | $ | – | | | $ | – | | | $ | 11,500 | | | $ | (11,500) | | | $ | – | | | $ | – | |
_____________________
(a)Earnings recorded in “other revenue”“other revenue” for investments in Level 3 assets for the years ended December 31, 2023, 2022 2021 and 20202021 include net unrealized gains (losses) of $(6), $99 and $155, respectively. Unrealized losses of $274 were recorded in “amortization and $(117)other acquisition-related costs” for the contingent consideration liability for the year ended December 31, 2023.
(b)Transfers out of Level 3 private equity funds during the years ended December 31, 2023 and 2021 reflect investments valued at NAV as of December 31, 2023 and 2021. Transfers out of Level 3 derivatives during the year ended December 31, 2021 reflected transfers of derivative liabilities for LGAC Warrants to Level 1 principally due to a change in the inputs used to value these derivatives.
(c)For the year ended December 31, 2023, acquisitions represent the initial recognition of the contingent consideration liability (noncash transaction), respectively.and settlements represent aggregate cash and noncash settlement of contingent consideration after the acquisition date.
(b)
| Transfers out of Level 3 private equity funds during the year ended December 31, 2021 reflect investments valued at NAV as of December 31, 2021. Transfers out of Level 3 derivatives during the year ended December 31, 2021 reflected transfers of derivative liabilities for LGAC Warrants to Level 1 principally due to a change in the inputs used to value these derivatives.
|
There were no other transfers into or out of Level 3 within the fair value hierarchy during the years ended December 31, 2023, 2022 2021 and 2020.
2021.
LAZARD GROUP LLC
NOTES TO CONSOLIDATED FINANCIAL STATEMENTS—(Continued)
(dollars in thousands, unless otherwise noted)
Financial Instruments Not Measured at Fair Value—The tables below present the carrying value, fair value and fair value hierarchy category of certain financial instruments as of December 31, 20222023 and 20212022 that are not measured at fair value in the Company’s consolidated statement of financial condition. | | December 31, 2022 | |
| | | | | | Fair Value Measurements Using: | | | | | |
| | Carrying Value | | | Fair Value | | | Quoted Prices in Active Markets for Identical Assets (Level 1) | | | Significant Observable Inputs (Level 2) | | | Significant Unobservable Inputs (Level 3) | |
| December 31, 2023 | | | December 31, 2023 |
| | | Fair Value Measurements Using: | |
| Carrying Value | |
| Carrying Value | |
| Carrying Value | | | Fair Value | | Level 1 | | Level 2 | | Level 3 |
Financial Assets: | | | | | | | | | | | | | | | | | | | | |
| Cash and cash equivalents | |
| Cash and cash equivalents | |
Cash and cash equivalents | | $ | 1,180,473 | | | $ | 1,180,473 | | | $ | 1,180,473 | | | $ | - | | | $ | - | |
Deposits with banks and short-term investments | | | 779,246 | | | | 779,246 | | | | 779,246 | | | | - | | | | - | |
Restricted cash | | | 625,381 | | | | 625,381 | | | | 625,381 | | | | - | | | | - | |
Financing receivables | | | 97,964 | | | | 98,362 | | | | - | | | | - | | | | 98,362 | |
Customer loans | | | 128,890 | | | | 128,890 | | | | - | | | | - | | | | 128,890 | |
Other fees and customers and other receivables and amounts due from Lazard Ltd subsidiaries | | | 499,910 | | | | 499,910 | | | | 499,910 | | | | - | | | | - | |
Financial Liabilities: | | | | | | | | | | | | | | | | | | | | |
Deposits and other customer payables | | $ | 921,834 | | | $ | 921,834 | | | $ | 921,834 | | | $ | - | | | $ | - | |
| Deposits and other customer payables | |
| Deposits and other customer payables | |
Senior debt | | | 1,687,714 | | | | 1,601,917 | | | | - | | | | 1,601,917 | | | | - | |
91
LAZARD GROUP LLC
NOTES TO CONSOLIDATED FINANCIAL STATEMENTS—(Continued)
(dollars in thousands, unless otherwise noted)
| | December 31, 2021 | |
| | | | | | Fair Value Measurements Using: | | | | | |
| | Carrying Value | | | Fair Value | | | Quoted Prices in Active Markets for Identical Assets (Level 1) | | | Significant Observable Inputs (Level 2) | | | Significant Unobservable Inputs (Level 3) | |
| December 31, 2022 | | | December 31, 2022 |
| Carrying Value | |
| | Fair Value | |
| | Fair Value | |
| | Fair Value | | | Level 1 | | Level 2 | | Level 3 |
Financial Assets: | | | | | | | | | | | | | | | | | | | | |
| Cash and cash equivalents | |
| Cash and cash equivalents | |
Cash and cash equivalents | | $ | 1,435,576 | | | $ | 1,435,576 | | | $ | 1,435,576 | | | $ | - | | | $ | - | |
Deposits with banks and short-term investments | | | 1,347,544 | | | | 1,347,544 | | | | 1,347,544 | | | | - | | | | - | |
Restricted cash | | | 617,448 | | | | 617,448 | | | | 617,448 | | | | - | | | | - | |
Financing receivables | | | 123,189 | | | | 125,024 | | | | - | | | | - | | | | 125,024 | |
Customer loans | | | 122,229 | | | | 122,229 | | | | - | | | | - | | | | 122,229 | |
Other fees and customers and other receivables and amounts due from Lazard Ltd subsidiaries | | | 618,879 | | | | 618,879 | | | | 618,879 | | | | - | | | | - | |
Financial Liabilities: | | | | | | | | | | | | | | | | | | | | |
Deposits and other customer payables | | $ | 1,442,701 | | | $ | 1,442,701 | | | $ | 1,442,701 | | | $ | - | | | $ | - | |
| Deposits and other customer payables | |
| Deposits and other customer payables | |
Senior debt | | | 1,685,227 | | | | 1,884,690 | | | | - | | | | 1,884,690 | | | | - | |
Cash and cash equivalents are carried at either cost or amortized cost that approximates fair value due to their short-term maturities.
The carrying value of deposits with banks and short-term investments, and restricted cash, approximates fair value because of the relatively short period of time between their origination and expected maturity.
LAZARD GROUP LLC
NOTES TO CONSOLIDATED FINANCIAL STATEMENTS—(Continued)
(dollars in thousands, unless otherwise noted)
Fair values of financing receivables were generally determined by discounting both principal and interest cash flows expected to be collected, using a discount rate approximating current market interest rates for comparable financial instruments and based on unobservable inputs.
The carrying value of customer loans approximates fair value as such loans are fully collateralized and bear interest at rates that regularly reset in accordance with market reference rates.
The carrying value of other fees and customers and other receivables and amounts due from Lazard Ltd subsidiaries and deposits and other customer payables approximates fair value due to their short-term nature.
The Company’s senior debt is carried at its principal
balancesamount outstanding, net of unamortized debt costs. The fair value of the Company’s senior debt is based on market quotations.
92
LAZARD GROUP LLC
NOTES TO CONSOLIDATED FINANCIAL STATEMENTS—(Continued)
(dollars in thousands, unless otherwise noted)
The following tables present, at December 31,
20222023 and
2021,2022, certain investments that are valued using NAV or its equivalent as a practical expedient in determining fair value:
| | December 31, 2022 |
| | | | | | | | | | | | | | | Investments Redeemable |
| | Fair Value | | | Unfunded Commitments | | | | % of Fair Value Not Redeemable | | | Redemption Frequency | | Redemption Notice Period |
Alternative investment funds: | | | | | | | | | | | | | | | | | |
Hedge funds | | $ | 29,259 | | | $ | - | | | | NA | | | (a) | | 30-60 days |
Other | | | 615 | | | | - | | | | NA | | | (b) | | <30-30 days |
Debt funds | | | 4 | | | | - | | | | NA | | | (c) | | <30 days |
Equity funds | | | 40 | | | | - | | | | NA | | | (d) | | <30-60 days |
Private equity funds: | | | | | | | | | | | | | | | | | |
Equity growth | | | 35,050 | | | | 5,455 | | (e) | | | 100 | % | (f) | NA | | NA |
Total | | $ | 64,968 | | | $ | 5,455 | | | | | | | | | | |
(a)
| monthly (68%) and quarterly (32%)
|
(b)
| daily (5%) and monthly (95%)
|
| | | | | | | | | | | | | | | | | | | | | | | | | | | | | |
| December 31, 2023 |
| | | | | | | Investments Redeemable |
| NAV | | Unfunded Commitments | | % of NAV Not Redeemable | | Redemption Frequency | | Redemption Notice Period |
| Alternative investment funds: | | | | | | | | | |
| Hedge funds | $ | 45,324 | | | $ | – | | | NA | | (a) | | 30-60 days |
| Other | 680 | | | – | | | NA | | (b) | | <30-30 days |
| Debt funds | 5 | | | – | | | NA | | (c) | | <30 days |
| Equity funds | 45 | | | – | | | NA | | (d) | | <30-60 days |
| Private equity funds: | | | | | | | | | |
| Equity growth | 46,545 | | | 5,505 | | (e) | 100 | % | (f) | NA | | NA |
| Total | $ | 92,599 | | | $ | 5,505 | | | | | | | |
(d)(a)monthly (74%) and quarterly (26%)
| monthly (35%) and annually (65%)
|
(e)
| Unfunded commitments to private equity investments consolidated but not owned by Lazard of $8,003(b)daily (4%) and monthly (96%)
(c)daily (100%) (d)monthly (34%) and annually (66%) (e)Unfunded commitments to private equity investments consolidated but not owned by Lazard of $9,605 are excluded. Such commitments are required to be funded by capital contributions from noncontrolling interest holders. |
(f)
| Distributions from each fund will be received as the underlying investments of the funds are liquidated.
|
| | December 31, 2021 |
| | | | | | | | | | | | | | | Investments Redeemable |
| | Fair Value | | | Unfunded Commitments | | | | % of Fair Value Not Redeemable | | | Redemption Frequency | | Redemption Notice Period |
Alternative investment funds: | | | | | | | | | | | | | | | | | |
Hedge funds | | $ | 24,162 | | | $ | - | | | | NA | | | (a) | | 30-60 days |
Other | | | 623 | | | | - | | | | NA | | | (b) | | <30-30 days |
Debt funds | | | 5 | | | | - | | | | NA | | | (c) | | <30 days |
Equity funds | | | 49 | | | | - | | | | NA | | | (d) | | <30-60 days |
Private equity funds: | | | | | | | | | | | | | | | | | |
Equity growth | | | 46,296 | | | | 5,597 | | (e) | | | 100 | % | (f) | NA | | NA |
Total | | $ | 71,135 | | | $ | 5,597 | | | | | | | | | | |
(a)
| monthly (79%) and quarterly (21%)
|
(b)
| daily (8%) and monthly (92%)
|
(d)
| monthly (36%) and annually (64%)
|
(e)
| Unfunded commitments to private equity investments consolidated but not owned by Lazard of $9,128 are excluded. Such commitments are required to be funded by capital contributions from noncontrolling interest holders.
|
(f)
| Distributions from each fund will be received as the underlying investments of the funds are liquidated.
|
Investment Capital Funding Commitments—At December 31, 2022, the Company’s maximum unfunded commitments for capital contributions to investmentfrom noncontrolling interest holders.
(f)Distributions from each fund will be received as the underlying investments of the funds primarily arose from commitments to EGCP III, which amounted to $5,093. The investment period for EGCP III ended on October 12, 2016, after which point the Company’s obligation to fund capital contributions for new investments in EGCP III expired. The Company remains obligated until October 12, 2023 (or any earlier liquidation of EGCP III) to make capital contributions necessary to fund follow-on investments and to pay for fund expenses.are liquidated.93
NOTES TO CONSOLIDATED FINANCIAL STATEMENTS—(Continued)
(dollars in thousands, unless otherwise noted)
| | | | | | | | | | | | | | | | | | | | | | | | | | | | | |
| December 31, 2022 |
| | | | | | | Investments Redeemable |
| NAV | | Unfunded Commitments | | % of NAV Not Redeemable | | Redemption Frequency | | Redemption Notice Period |
| Alternative investment funds: | | | | | | | | | |
| Hedge funds | $ | 29,259 | | | $ | – | | | NA | | (a) | | 30-60 days |
| Other | 615 | | | – | | | NA | | (b) | | <30-30 days |
| Debt funds | 4 | | | – | | | NA | | (c) | | <30 days |
| Equity funds | 40 | | | – | | | NA | | (d) | | <30-60 days |
| Private equity funds: | | | | | | | | | |
| Equity growth | 35,050 | | | 5,455 | | (e) | 100 | % | (f) | NA | | NA |
| Total | $ | 64,968 | | | $ | 5,455 | | | | | | | |
____________________
(a)monthly (68%) and quarterly (32%)
(b)daily (5%) and monthly (95%)
(c)daily (100%)
(d)monthly (35%) and annually (65%)
(e)Unfunded commitments to private equity investments consolidated but not owned by Lazard of $8,003 are excluded. Such commitments are required to be funded by capital contributions from noncontrolling interest holders.
(f)Distributions from each fund will be received as the underlying investments of the funds are liquidated.
8. DERIVATIVES
The tables below present the fair value of the Company’s derivative instruments reported within “other assets” and “other liabilities” and the fair value of the Company’s derivative liabilities relating to its obligations pertaining to LFI and other similar deferred compensation arrangements reported within “accrued compensation and benefits” (see Note
15)16) on the accompanying consolidated statements of financial condition as of December 31,
20222023 and
2021.2022. Notional amounts provide an indication of the volume of the Company's derivative activity.
Derivative assets and liabilities, as well as the related cash collateral from the same counterparty, have been netted on the consolidated statements of financial condition where the Company has obtained an appropriate legal opinion with respect to the master netting agreement. Where such a legal opinion has not been either sought or obtained, amounts are not eligible for netting on the consolidated statements of financial condition, and those derivative assets and liabilities are shown separately in the table below.
In addition to the cash collateral received and transferred that is presented on a net basis with derivative assets and liabilities, the Company receives and transfers additional securities and cash collateral. These amounts mitigate
LAZARD GROUP LLC
NOTES TO CONSOLIDATED FINANCIAL STATEMENTS—(Continued)
(dollars in thousands, unless otherwise noted)
counterparty credit risk associated with the Company’s derivative instruments, but are not eligible for net presentation on the consolidated statements of financial condition.
| | December 31, 2022 | |
| | Derivative Assets | | | Derivative Liabilities | |
| | Fair Value | | | Notional | | | Fair Value | | | Notional | |
| December 31, 2023 | | | December 31, 2023 |
| Derivative Assets | | | Derivative Assets | | Derivative Liabilities |
| Fair Value | | | Fair Value | | Notional | | Fair Value | | Notional |
Forward foreign currency exchange rate contracts | | $ | 1,356 | | | $ | 170,103 | | | $ | 921 | | | $ | 128,098 | |
Total return swaps and other | | | 13,427 | | | | 155,026 | | | | 72 | | | | 1,398 | |
LGAC Warrants | | | - | | | | - | | | | 115 | | | | 11,500 | |
LFI and other similar deferred compensation arrangements | | | - | | | | - | | | | 326,282 | | | | 338,126 | |
Total gross derivatives | | | 14,783 | | | $ | 325,129 | | | | 327,390 | | | $ | 479,122 | |
Counterparty and cash collateral netting: | | | | | | | | | | | | | | | | | Counterparty and cash collateral netting: | | | | | | | |
Forward foreign currency exchange rate contracts | | | (157 | ) | | | | | | | (158 | ) | | | | | Forward foreign currency exchange rate contracts | (604) | | | | | (603) | | | | (603) | | | | | |
Total return swaps and other | | | (72 | ) | | | | | | | (72 | ) | | | | | Total return swaps and other | (140) | | | | | (10,281) | | | | (10,281) | | | | | |
Net derivatives in "other assets" and "other liabilities" | | | 14,554 | | | | | | | | 327,160 | | | | | | Net derivatives in "other assets" and "other liabilities" | 2,789 | | | | | | | 368,673 | | | | | |
Amounts not netted (a): | | | | | | | | | | | | | | | | | Amounts not netted (a): | | | |
Cash collateral | | | - | | | | | | | | - | | | | | | Cash collateral | – | | | | | | | (243) | | | | | |
Securities collateral | | | - | | | | | | | | - | | | | | | Securities collateral | – | | | | | | | – | | | | | |
| | $ | 14,554 | | | | | | | $ | 327,160 | | | | | |
| $ | | | $ | 2,789 | | | | | $ | 368,430 | | | |
94
LAZARD GROUP LLC
NOTES TO CONSOLIDATED FINANCIAL STATEMENTS—(Continued)
(dollars in thousands, unless otherwise noted)
| | December 31, 2021 | |
| | Derivative Assets | | | Derivative Liabilities | |
| | Fair Value | | | Notional | | | Fair Value | | | Notional | |
| December 31, 2022 | | | December 31, 2022 |
| Derivative Assets | | | Derivative Assets | | Derivative Liabilities |
| Fair Value | | | Fair Value | | Notional | | Fair Value | | Notional |
Forward foreign currency exchange rate contracts | | $ | 1,005 | | | $ | 253,059 | | | $ | 761 | | | $ | 174,550 | |
Total return swaps and other | | | 1,052 | | | | 20,888 | | | | 13,709 | | | | 83,706 | |
LGAC Warrants | | | - | | | | - | | | | 10,005 | | | | 11,500 | |
LFI and other similar deferred compensation arrangements | | | - | | | | - | | | | 358,877 | | | | 301,478 | |
Total gross derivatives | | | 2,057 | | | $ | 273,947 | | | | 383,352 | | | $ | 571,234 | |
Counterparty and cash collateral netting: | | | | | | | | | | | | | | | | |
Forward foreign currency exchange rate contracts | | | (83 | ) | | | | | | | (83 | ) | | | | |
| Forward foreign currency exchange rate contracts | |
| Forward foreign currency exchange rate contracts | |
| Total return swaps and other | |
| Total return swaps and other | |
Total return swaps and other | | | (1,052 | ) | | | | | | | (11,024 | ) | | | | |
Net derivatives in "other assets" and "other liabilities" | | | 922 | | | | | | | | 372,245 | | | | | |
| Net derivatives in "other assets" and "other liabilities" | |
| Net derivatives in "other assets" and "other liabilities" | |
| Amounts not netted (a): | |
| Amounts not netted (a): | |
Amounts not netted (a): | | | | | | | | | | | | | | | | |
Cash collateral | | | - | | | | | | | | (2,476 | ) | | | | |
| Cash collateral | |
| Cash collateral | |
Securities collateral | | | - | | | | | | | | (391 | ) | | | | |
| | $ | 922 | | | | | | | $ | 369,378 | | | | | |
| Securities collateral | |
| Securities collateral | |
| $ | |
| $ | |
| $ | |
(a)
| Amounts are subject to master netting arrangements but do not meet the criteria for netting on the consolidated statements of financial condition under U.S. GAAP. For some counterparties, the collateral amounts of securities and cash collateral pledged may exceed the derivative assets and derivative liabilities balances. Where this is the case, the total amount reported is limited to the net derivative assets and net derivative liabilities balances with that counterparty.
|
_____________________(a)Amounts are subject to master netting arrangements but do not meet the criteria for netting on the consolidated statements of financial condition under U.S. GAAP. For some counterparties, the collateral amounts of securities and cash collateral pledged may exceed the derivative assets and derivative liabilities balances. Where this is the case, the total amount reported is limited to the net derivative assets and net derivative liabilities balances with that counterparty.
Net gains (losses) with respect to derivative instruments (included in “revenue-other”) and the Company’s derivative liabilities relating to its obligations pertaining to LFI and other similar deferred compensation arrangements (included
LAZARD GROUP LLC
NOTES TO CONSOLIDATED FINANCIAL STATEMENTS—(Continued)
(dollars in thousands, unless otherwise noted)
(included in “compensation and benefits” expense) as reflected on the accompanying consolidated statements of operations for the years ended December 31,
2023, 2022
2021 and
2020,2021, were as follows:
| | Year Ended December 31, | |
| | 2022 | | | 2021 | | | 2020 | |
| Year Ended December 31, | | | Year Ended December 31, |
| 2023 | | | 2023 | | 2022 | | 2021 |
Forward foreign currency exchange rate contracts | | $ | 4,721 | | | $ | 11,007 | | | $ | (8,356 | ) |
LFI and other similar deferred compensation arrangements | | | 44,261 | | | | (35,494 | ) | | | (40,634 | ) |
LGAC Warrants | | | 9,890 | | | | 1,495 | | | | - | |
Total return swaps and other | | | 23,212 | | | | (14,460 | ) | | | (9,236 | ) |
Total | | $ | 82,084 | | | $ | (37,452 | ) | | $ | (58,226 | ) |
See Note 1 for additional information on LGAC Warrants.
95
LAZARD GROUP LLC
NOTES TO CONSOLIDATED FINANCIAL STATEMENTS—(Continued)
(dollars in thousands, unless otherwise noted)
9. PROPERTY, NET
At December 31,
20222023 and
2021,2022, property consisted of the following:
| | Estimated | | | | | | | | | |
| | Depreciable | | | December 31, | |
| | Life in Years | | | 2022 | | | 2021 | |
Buildings | | | 33 | | | $ | 135,103 | | | $ | 143,464 | |
Leasehold improvements | | 3-20 | | | | 207,285 | | | | 208,363 | |
| Estimated
Depreciable
Life in Years | | | Estimated
Depreciable
Life in Years | | December 31, |
| | 2023 | | | | 2023 | | 2022 |
| Buildings (a) | |
| Leasehold improvements (a) | |
Furniture and equipment | | 3-10 | | | | 235,684 | | | | 217,984 | |
Construction in progress | | | | | | | 65,560 | | | | 46,052 | |
Total | | | | | | | 643,632 | | | | 615,863 | |
Less - Accumulated depreciation and amortization | | | | | | | 393,595 | | | | 366,215 | |
| Less - Accumulated depreciation and amortization (a) | |
Property, net | | | | | | $ | 250,037 | | | $ | 249,648 | |
(a)The Company classified assets relating to an owned office building as held for sale as of December 31, 2023, the carrying amount of which was $72,921 (net of accumulated depreciation). The owned office building is available for immediate sale in its present condition and the Company expects the owned office building to be sold within one year. The property held for sale is reported within the Corporate segment. Effective January 1, 2024, depreciation expense will no longer be recorded on this asset.
10. LEASES
The Company as a Lessee
The Company leases office space and equipment under non-cancelable lease agreements, which expire on various dates through
2033.2034. Substantially all of these arrangements are operating leases relating to office space. Certain leases have renewal options that can be exercised at the discretion of the Company. The Company only includes renewal options in the lease term when it is reasonably certain to exercise the option. The Company does not record leases with a lease term of 12 months or less on the consolidated statements of financial condition; lease expense for these leases is recognized over the lease term on a straight-line basis.
The operating lease liabilities at commencement reflect total lease payments discounted using an incremental borrowing rate (on a collateralized basis) based on the lease term (the “Discount”), as an implicit rate was not readily determinable for any of the Company’s
existing operating leases. The Company determines its Discount with consideration of the Company’s public debt issuances as well as publicly available data for instruments with similar characteristics.
LAZARD GROUP LLC
NOTES TO CONSOLIDATED FINANCIAL STATEMENTS—(Continued)
(dollars in thousands, unless otherwise noted)
For
leases commencing on January 1, 2019 or thereafter that relate to office space and equipment
leases, the Company accounts for the lease and non-lease components as a single lease component.
In addition to rent payments, operating leases for office space generally contain payments for real estate taxes, insurance costs, common area maintenance, and utilities that are not fixed. The Company accounts for these costs as variable payments and does not include them in the lease component. There are certain office leases outside of the U.S. that have annual rent increases based on a year-over-year change in an index that are also accounted for as variable payments and are excluded from the lease component.
96
LAZARD GROUP LLC
NOTES TO CONSOLIDATED FINANCIAL STATEMENTS—(Continued)
(dollars in thousands, unless otherwise noted)
The following table summarizes the components of operating lease expense reflected on the accompanying consolidated statements of operations for the years ended December 31,
2023, 2022
2021 and
2020:2021: | | Year Ended December 31, | |
| | 2022 | | | 2021 | | | 2020 | |
| Year Ended December 31, | | | Year Ended December 31, |
| 2023 | | | 2023 | | 2022 | | 2021 |
Operating lease cost | | $ | 78,259 | | | $ | 86,023 | | | $ | 85,666 | |
Variable lease cost | | | 20,968 | | | | 21,056 | | | | 21,277 | |
Sublease income | | | (4,969 | ) | | | (7,303 | ) | | | (6,827 | ) |
Total | | $ | 94,258 | | | $ | 99,776 | | | $ | 100,116 | |
The following table summarizes the supplemental cash flow information and certain other information related to operating leases for the years ended December 31,
20222023 and
2021:2022: | | Year Ended December 31, | |
| Year Ended December 31, | | | Year Ended December 31, |
| 2023 | | | 2023 | | 2022 |
| Cash paid for amounts included in the measurement of lease liabilities: | |
| Operating cash flows paid for operating leases | |
| Operating cash flows paid for operating leases | |
| Operating cash flows paid for operating leases | | $ | 81,530 | | $ | 81,219 |
| | 2022 | | | 2021 | |
Cash paid for amounts included in the measurement of lease liabilities: | | | | | | | | |
Operating cash flows from operating leases | | $ | 81,219 | | | $ | 92,051 | |
| | | | | | | | |
| Operating lease right-of-use assets obtained in exchange for operating lease liabilities | |
| Operating lease right-of-use assets obtained in exchange for operating lease liabilities | |
Operating lease right-of-use assets obtained in exchange for operating lease liabilities | | $ | 33,531 | | | $ | 36,172 | | $ | 35,282 | | $ | 33,531 |
| | | | | | | | |
Weighted average remaining lease term | | 9 years | | | 10 years | |
| Weighted average remaining lease term | |
| Weighted average remaining lease term | | 8 years | | 9 years |
| | | | | | | | |
Weighted average discount rate | | | 3.7 | % | | | 3.6 | % |
| Weighted average discount rate | |
| Weighted average discount rate | | 3.9 | % | | 3.7 | % |
Maturities of the operating lease liabilities outstanding at December 31,
20222023 for each of the years in the period ending December 31,
20272028 and thereafter are set forth in the table below.
| Year Ending December 31, | | | | |
2023 | | $ | 78,717 | |
| 2024 | |
| 2024 | |
2024 | | | 76,249 | |
2025 | | | 65,788 | |
2026 | | | 58,316 | |
2027 | | | 57,415 | |
| 2028 | |
Thereafter | | | 264,270 | |
Total lease payments | | | 600,755 | |
Less - Discount | | | 88,025 | |
Operating lease liabilities | | $ | 512,730 | |
LAZARD GROUP LLC
NOTES TO CONSOLIDATED FINANCIAL STATEMENTS—(Continued)
(dollars in thousands, unless otherwise noted)
In addition, to the table above, the Company had undiscounted future lease payments of
$130,000$119,225 related to
an operating
leaseslease that
werewas signed but not yet commenced
asat December 31,
2022. These2023. This operating
leaseslease will commence
between 2023 andin 2024 with
a lease
terms up toterm of 15 years.
97
LAZARD GROUP LLC
NOTES TO CONSOLIDATED FINANCIAL STATEMENTS—(Continued)
(dollars in thousands, unless otherwise noted)
The Company as a Lessor
The Company has entered into a lease agreement which provides a third-party the right to use its owned office building. The lease contains options to renew and terminate and is classified as an operating lease.
The following table presents the carrying value of the assets subject to leases reported on the consolidated statements of financial condition:
| | | | | |
| 10.Year Ending |
| December 31, 2023 |
| Property, net | GOODWILL AND OTHER INTANGIBLE ASSETS
$ | 72,921 | |
| Accumulated depreciation | $ | 104,171 | |
The Company classified the owned office building as held for sale as of December 31, 2023. See Note 9.
For the year ended December 31, 2023, the Company’s operating lease income included in “revenue-other” on the consolidated statements of operations was $6,393.
The following table presents undiscounted future cash inflows under the operating lease as of December 31, 2023:
| | | | | |
| Year Ending December 31, | |
| 2024 | $ | 2,758 | |
| 2025 | 8,273 | |
| 2026 | 8,273 | |
| 2027 | 8,273 | |
| 2028 | 8,273 | |
| Thereafter | 24,820 | |
| Total lease payment to be received | $ | 60,670 | |
11. GOODWILL AND OTHER INTANGIBLE ASSETS
The components of goodwill and other intangible assets at December 31,
20222023 and
20212022 are presented below:
| | December 31, | |
| | 2022 | | | 2021 | |
| December 31, | | | December 31, |
| 2023 | | | 2023 | | 2022 |
Goodwill | | $ | 356,369 | | | $ | 357,187 | |
Other intangible assets (net of accumulated amortization) | | | 90 | | | | 150 | |
| | $ | 356,459 | | | $ | 357,337 | |
| $ | |
At December 31, 2022 and 2021, goodwill of $291,828 and $292,646, respectively, was attributable to the Company’s Financial Advisory segment and, at each such respective date, $64,541 of goodwill was attributable to the Company’s Asset Management segment.
LAZARD GROUP LLC
NOTES TO CONSOLIDATED FINANCIAL STATEMENTS—(Continued)
(dollars in thousands, unless otherwise noted)
Changes in the carrying amount of goodwill for the years ended December 31,
2023, 2022
2021 and
20202021 are as follows:
| | Year Ended December 31, | |
| | 2022 | | | 2021 | | | 2020 | |
| Year Ended December 31, | | | Year Ended December 31, |
| 2023 | | | 2023 | | 2022 | | 2021 |
| Financial Advisory | | | Financial Advisory | | Asset Management | | Total | | Financial Advisory | | Asset Management | | Total | | Financial Advisory | | Asset Management | | Total |
Balance, January 1 | | $ | 357,187 | | | $ | 361,682 | | | $ | 350,029 | |
Acquisition of
business | |
Foreign currency translation adjustments | | | (818 | ) | | | (4,495 | ) | | | 11,653 | |
Balance, December 31 | | $ | 356,369 | | | $ | 357,187 | | | $ | 361,682 | |
All changes in the carrying amount of goodwill for the years ended December 31, 2022, 2021 and 2020 are attributable to the Company’s Financial Advisory segment.
The Company
evaluatestests goodwill for impairment annually or more frequently if circumstances indicate that impairment may have occurred. Pursuant to the Company’s goodwill impairment
reviewtests for the years ended December 31,
2023, 2022
2021 and
2020,2021, the Company determined that no impairment existed.
Amortization expense of intangible assets, included in “amortization of intangible assets related to acquisitions”and other acquisition-related costs” in the consolidated statements of operations, for the years ended December 31, 2023, 2022 2021 and 20202021 was $60, $60 and $1,744,$60, respectively. 11.
| OTHER ASSETS AND OTHER LIABILITIES
|
12. OTHER ASSETS AND OTHER LIABILITIES
The following table sets forth the Company’s other assets, by type, as of December 31,
20222023 and
2021:2022: | | December 31, | |
| | 2022 | | | 2021 | |
| December 31, | | | December 31, |
| 2023 | | | 2023 | | 2022 |
Current income and other tax receivables | | $ | 55,193 | | | $ | 39,703 | |
Prepaid compensation (see Note 15) | | | 112,124 | | | | 108,049 | |
| Prepaid compensation (see Note 16) | |
Other advances and prepayments | | | 105,653 | | | | 130,056 | |
Other | | | 103,226 | | | | 85,556 | |
Total | | $ | 376,196 | | | $ | 363,364 | |
NOTES TO CONSOLIDATED FINANCIAL STATEMENTS—(Continued)
(dollars in thousands, unless otherwise noted)
The following table sets forth the Company’s other liabilities, by type, as of December 31, 2023 and 2022:
| | | | | | | | | | | |
| December 31, |
| 2023 | | 2022 |
| Accrued expenses | $ | 193,290 | | | $ | 195,218 | |
| Current income and other taxes payable | 131,813 | | | 110,998 | |
| Employee benefit-related liabilities | 23,829 | | | 30,580 | |
| Unclaimed funds at LFB | 16,994 | | | 16,435 | |
| Deferred revenue (a) | 140,417 | | | 137,330 | |
| Securities sold, not yet purchased | 4,809 | | | 4,651 | |
| Deferred offering costs | – | | | 20,125 | |
| Other | 27,211 | | | 16,631 | |
| Total | $ | 538,363 | | | $ | 531,968 | |
_____________________
(a)Deferred revenue primarily relates to cash received for carried interest subject to clawback and unearned advisory fees received from private equity investments. Revenue recognized during the year ended December 31, 2023 that was included in the deferred revenue balance as of December 31, 2022 and 2021:was $18,775. | | December 31, | |
| | 2022 | | | 2021 | |
Accrued expenses | | $ | 195,218 | | | $ | 196,957 | |
Current income taxes and other taxes | | | 110,998 | | | | 166,304 | |
Employee benefit-related liabilities | | | 30,580 | | | | 53,624 | |
Unclaimed funds at LFB | | | 16,435 | | | | 17,443 | |
Deferred revenue (a) | | | 137,330 | | | | 130,664 | |
Securities sold, not yet purchased | | | 4,651 | | | | 6,828 | |
Deferred offering costs | | | 20,125 | | | | 20,125 | |
Other | | | 16,631 | | | | 30,158 | |
Total | | $ | 531,968 | | | $ | 622,103 | |
| (a)
| Deferred revenue primarily relates to cash received for carried interest subject to clawback and unearned advisory fees received from private equity investments. Revenue recognized during the year ended December 31, 2022 that was included in the deferred revenue balance as of December 31, 2021 was $44,840.
|
13. SENIOR DEBTSenior debt is comprised of the following as of December 31, 20222023 and 2021:
2022: | | | | | | | | | | | | Outstanding as of | |
| | Initial | | | | | Annual | | | December 31, 2022 | | | December 31, 2021 | |
| | Principal Amount | | | Maturity Date | | Interest Rate(a) | | | Principal | | | Unamortized Debt Costs | | | Carrying Value | | | Principal | | | Unamortized Debt Costs | | | Carrying Value | |
Lazard Group 2025 Senior Notes | | $ | 400,000 | | | 2/13/25 | | | 3.75 | % | | $ | 400,000 | | | $ | 1,003 | | | $ | 398,997 | | | $ | 400,000 | | | $ | 1,476 | | | $ | 398,524 | |
Lazard Group 2027 Senior Notes | | | 300,000 | | | 3/1/27 | | | 3.625 | % | | | 300,000 | | | | 1,625 | | | | 298,375 | | | | 300,000 | | | | 2,015 | | | | 297,985 | |
Lazard Group 2028 Senior Notes | | | 500,000 | | | 9/19/28 | | | 4.50 | % | | | 500,000 | | | | 4,864 | | | | 495,136 | | | | 500,000 | | | | 5,716 | | | | 494,284 | |
Lazard Group 2029 Senior Notes | | | 500,000 | | | 3/11/29 | | | 4.375 | % | | | 500,000 | | | | 4,794 | | | | 495,206 | | | | 500,000 | | | | 5,566 | | | | 494,434 | |
Total | | | | | | | | | | | | $ | 1,700,000 | | | $ | 12,286 | | | $ | 1,687,714 | | | $ | 1,700,000 | | | $ | 14,773 | | | $ | 1,685,227 | |
| | | | | | | | | | | | | | | | | | | | | | | | | | | | | | | | | | | | | | | | | | | | | | | | | | | | | |
| | | | | | | Outstanding as of |
| | | | | | | December 31, 2023 | | December 31, 2022 |
| Initial Principal Amount | | Maturity Date | | Annual Interest Rate(a) | | Principal | | Unamortized Debt Costs | | Carrying Value | | Principal | | Unamortized Debt Costs | | Carrying Value |
| Lazard Group 2025 Senior Notes | $ | 400,000 | | | 2/13/25 | | 3.75 | % | | $ | 400,000 | | | $ | 531 | | | $ | 399,469 | | | $ | 400,000 | | | $ | 1,003 | | | $ | 398,997 | |
| Lazard Group 2027 Senior Notes | 300,000 | | | 3/1/27 | | 3.625 | % | | 300,000 | | | 1,235 | | | 298,765 | | | 300,000 | | | 1,625 | | | 298,375 | |
| Lazard Group 2028 Senior Notes | 500,000 | | | 9/19/28 | | 4.50 | % | | 500,000 | | | 4,012 | | | 495,988 | | | 500,000 | | | 4,864 | | | 495,136 | |
| Lazard Group 2029 Senior Notes | 500,000 | | | 3/11/29 | | 4.375 | % | | 500,000 | | | 4,022 | | | 495,978 | | | 500,000 | | | 4,794 | | | 495,206 | |
| Total | | | | | | | $ | 1,700,000 | | | $ | 9,800 | | | $ | 1,690,200 | | | $ | 1,700,000 | | | $ | 12,286 | | | $ | 1,687,714 | |
(a)
| The effective interest rates of Lazard Group’s 3.75% senior notes due February 13, 2025 (the “2025 Notes”), Lazard Group’s 3.625% senior notes due March 1, 2027 (the “2027 Notes”), Lazard Group’s 4.50% senior notes due September 19, 2028 (the “2028 Notes”) and Lazard Group’s 4.375% senior notes due March 11, 2029 (the “2029 Notes”) are 3.87%, 3.76%, 4.67% and 4.53%, respectively.
|
_____________________(a)The effective interest rates of Lazard Group’s 3.75% senior notes due February 13, 2025 (the “2025 Notes”), Lazard Group’s 3.625% senior notes due March 1, 2027 (the “2027 Notes”), Lazard Group’s 4.50% senior notes due September 19, 2028 (the “2028 Notes”) and Lazard Group’s 4.375% senior notes due March 11, 2029 (the “2029 Notes”) are 3.87%, 3.76%, 4.67% and 4.53%, respectively.
On July 22, 2020,June 6, 2023, Lazard Group entered into ana Second Amended and Restated Credit Agreement with a group of lenders for a three-year,five-year, $200,000 senior revolving credit facility expiring in July 2023June 2028 (the “Amended“Second Amended and Restated Credit Agreement”). The Second Amended and Restated Credit Agreement amended and restated the three-year, $200,000 senior revolving credit facility that was due to expire in July 2023 (the “Previous Credit Agreement”) in its entirety. Borrowings under the Second Amended and Restated Credit Agreement generally will bear interest at LIBORadjusted term SOFR plus an applicable margin for specific interest periods determined based on Lazard Group’s highest credit rating from an
LAZARD GROUP LLC
NOTES TO CONSOLIDATED FINANCIAL STATEMENTS—(Continued)
(dollars in thousands, unless otherwise noted)
internationally recognized credit agency. The
Second Amended and Restated Credit Agreement contains certain covenants, events of default and other customary provisions, including customary
LIBOR-replacement99
LAZARD GROUP LLC
NOTES TO CONSOLIDATED FINANCIAL STATEMENTS—(Continued)
(dollars in thousands, unless otherwise noted)
benchmark-replacement mechanics.
At December 31,
20222023 and
2021,2022, no amounts were outstanding under the
Second Amended and Restated Credit
Agreement.Agreement and the Previous Credit Agreement, respectively.
As of December 31,
2022,2023, the Company had approximately
$203,700$209,400 in unused lines of credit available to it, including the credit facility provided under the
Second Amended and Restated Credit Agreement.
The
Second Amended and Restated Credit Agreement and the indenture and the supplemental indentures relating to Lazard Group’s senior notes contain certain covenants, events of default and other customary provisions, including a customary make-whole provision in the event of early redemption, where applicable. As of December 31,
2022,2023, the Company was in compliance with such provisions. All of the Company’s senior debt obligations are unsecured.
Debt maturities relating to senior borrowings outstanding at December 31,
20222023 for each of the five years in the period ending December 31,
20272028 and thereafter are set forth in the table below.
| Year Ending December 31, | | | | |
2023 - 2024 | | $ | - | |
| 2024 | |
| 2024 | |
| 2024 | |
2025 | | | 400,000 | |
2026 | | | - | |
2027 | | | 300,000 | |
| 2028 | |
Thereafter | | | 1,000,000 | |
Total | | $ | 1,700,000 | |
The Company’s senior debt at December 31,
20222023 and
20212022 is carried at
itsthe principal
balancesamount outstanding, net of unamortized debt costs. See Note
67 for information regarding the fair value and fair value hierarchy category of the Company’s senior debt.
14. COMMITMENTS AND CONTINGENCIES Commitments—13. | COMMITMENTS AND CONTINGENCIES
|
Other Commitments—The Company has various other contractual commitments arising in the ordinary course of business. In addition, from time to time, LFB and LFNY may enter into underwriting commitments in which it will participate as an underwriter. At December 31, 2022, LFB and LFNY had no such underwriting commitments.
See Notes 67 and 1617 for information regarding commitments relating to investment capital funding commitments and obligations to fund our pension plans, respectively.
In the opinion of management, the
The fulfillment of the commitments described herein
willshould not have a material adverse effect on the Company’s consolidated financial position or results of operations.
Legal—The Company is involved from time to time in judicial, governmental, regulatory and arbitration proceedings and inquiries concerning matters arising in connection with the conduct of our businesses, including proceedings initiated by former employees alleging wrongful termination. The Company reviews such matters on a case-by-case basis and establishes any required accrual if a loss is probable and the amount of such loss can be reasonably estimated. The Company may experience significant variation in its revenue and earnings on an annual basis. Accordingly, the results of any pending matter or matters could be significant when compared to the Company’s earnings in any particular year. The Company believes, however, based on currently available information, that the results of any pending matters, in the aggregate, will not have a material effect on its business or financial condition.100
LAZARD GROUP LLC
NOTES TO CONSOLIDATED FINANCIAL STATEMENTS—(Continued)
(dollars in thousands, unless otherwise noted)
15. MEMBERS’ EQUITY AND REDEEMABLE NONCONTROLLING INTERESTS 14.
| MEMBERS’ EQUITY
|
Lazard Group Distributions—Distributions in respect of Lazard Group’s common membership interests are allocated to the holders of such interests in accordance with the provisions of the Operating Agreement. Such distributions primarily represent amounts necessary to fund (i) any dividends Lazard Ltd may declare on its Class A common stock
LAZARD GROUP LLC
NOTES TO CONSOLIDATED FINANCIAL STATEMENTS—(Continued)
(dollars in thousands, unless otherwise noted)
(“common stock”), the only class of common stock of Lazard outstanding, and (ii) tax distributions in respect of income taxes that Lazard Ltd’s subsidiaries incur.
During the years ended December 31,
2023, 2022
2021 and
2020,2021, Lazard Group distributed
$161,984, $228,045
$233,234 and
$201,019,$233,234, respectively, to the subsidiaries of Lazard Ltd.
In addition, in March 2023 and February 2022, Lazard Group distributed 1,521,620 and 1,902,756 shares of common stock, respectively, to one of its managing members, which is a subsidiary of Lazard Ltd, in a non-cash transaction,transactions, in connection with the settlement of profits interest participation rights during the year ended December 31, 2022 (see Note 15)16). There was no impact on total members’ equity resulting from this distribution.such distributions.
Pursuant to Lazard Group’s Operating Agreement, Lazard Group allocates and distributes to its members a substantial portion of its distributable profits in installments as soon as practicable after the end of each fiscal year. Such installment distributions usually begin in February.
Contributions From Members—
See Note
1820 for information regarding a related party transaction.
Share Repurchase Program—During 2021 and through the year ended December 31, 2022, theThe Board of Directors of Lazard authorized the repurchase of common stock as set forth in the table below. Date | | Repurchase Authorization | | | | Expiration |
April 2021 | | $ | 300,000 | | | | December 31, 2022 |
February 2022 | | $ | 300,000 | | | | December 31, 2024 |
July 2022 | | $ | 500,000 | | | | December 31, 2024 |
| | | | | | | | | | | | | | |
| Date | | Repurchase
Authorization | | Expiration |
| February 2022 | | $ | 300,000 | | | December 31, 2024 |
| July 2022 | | $ | 500,000 | | | December 31, 2024 |
The Company expects that the share repurchase program will continue to be used to offset a portion of the shares that have been or will be issued under
the Lazard Ltd 2008 Incentive Compensation Plan (the “2008 Plan”) and the Lazard LtdLazard’s 2018 Incentive Compensation Plan, as amended (the “2018 Plan”). Pursuant to the share repurchase program, purchases have been made in the open market or through privately negotiated transactions. The rate at which the Company purchases shares in connection with the share repurchase program may vary from period to period due to a variety of factors. Purchases with respect to such program are set forth in the table below:
| Year Ended December 31: | | Number of Shares Purchased | | | Average Price Per Share | | Year Ended December 31: | | Number of
Shares
Purchased | | Average
Price Per
Share |
2020 | | | 2,912,035 | | | $ | 32.70 | |
2021 | | | 9,124,295 | | | $ | 44.51 | |
2022 | | | 19,666,798 | | | $ | 35.17 | |
| 2023 | |
There were
26,774,55025,300,624 and
12,006,47726,774,550 shares of common stock held by Lazard Group at December 31,
20222023 and
2021,2022, respectively. Such shares of common stock are reported, at cost, as a reduction of members’ equity within the accompanying consolidated statements of financial condition.
During
2023, 2022
2021 and
2020,2021, certain of our executive officers received common stock in connection with the vesting or settlement of previously-granted deferred equity incentive awards. The vesting or settlement of such equity awards gave rise to a tax payable by the executive officers, and, consistent with our past practice, the Company purchased shares of common stock from certain of our executive officers equal in value to all or a portion of the estimated amount of such tax. In addition, during the years ended December 31,
2023, 2022
and 2021,
and 2020, the
101
LAZARD GROUP LLC
NOTES TO CONSOLIDATED FINANCIAL STATEMENTS—(Continued)
(dollars in thousands, unless otherwise noted)
Company purchased shares of common stock from certain of our executive officers. The aggregate value of all such purchases in 2023, 2022 2021 and 20202021 was approximately $11,100, $16,500 $19,800 and $10,000,$19,800, respectively. Such shares of common stock are reported at cost.
As of December 31,
2022,2023, a total of
$302,145$200,095 of share repurchase authorization
remainedremaining available under Lazard Ltd’s share repurchase program
which authorization will expire on December 31, 2024.
LAZARD GROUP LLC
NOTES TO CONSOLIDATED FINANCIAL STATEMENTS—(Continued)
(dollars in thousands, unless otherwise noted)
During the year ended December 31,
2022,2023, Lazard Ltd had in place trading plans under Rule 10b5-1 of the Securities Exchange Act of 1934, as amended (the “Exchange Act”), pursuant to which it effected stock repurchases in the open market.
Accumulated Other Comprehensive Income (Loss) (“AOCI”), Net of Tax—The tables below reflect the balances of each component of AOCI at December 31, 2023, 2022 2021 and 20202021 and activity during the years then ended: | | Currency Translation Adjustments | | | Employee Benefit Plans | | | Total AOCI | | | Amount Attributable to Noncontrolling Interests | | | Total Lazard Group AOCI | |
Balance, January 1, 2022 | | $ | (76,355 | ) | | $ | (132,680 | ) | | $ | (209,035 | ) | | $ | 2 | | | $ | (209,037 | ) |
Activity: | | | | | | | | | | | | | | | | | | | | |
Other comprehensive loss before reclassifications | | | (63,779 | ) | | | (11,955 | ) | | | (75,734 | ) | | | - | | | | (75,734 | ) |
Adjustments for items reclassified to earnings, net of tax | | | 32 | | | | 4,152 | | | | 4,184 | | | | - | | | | 4,184 | |
Net other comprehensive loss | | | (63,747 | ) | | | (7,803 | ) | | | (71,550 | ) | | | - | | | | (71,550 | ) |
Balance, December 31, 2022 | | $ | (140,102 | ) | | $ | (140,483 | ) | | $ | (280,585 | ) | | $ | 2 | | | $ | (280,587 | ) |
| | | | | | | | | | | | | | | | | | | | | | | | | | | | | |
| Currency
Translation
Adjustments | | Employee
Benefit
Plans | | Total
AOCI | | Amount
Attributable to
Noncontrolling
Interests | | Total
Lazard Group
AOCI |
| Balance, January 1, 2023 | $ | (140,102) | | | $ | (140,483) | | | $ | (280,585) | | | $ | 2 | | | $ | (280,587) | |
| Activity: | | | | | | | | | |
| Other comprehensive income (loss) before reclassifications | 30,720 | | | (32,210) | | | (1,490) | | | – | | | (1,490) | |
| Adjustments for items reclassified to earnings, net of tax | 2,413 | | | 5,233 | | | 7,646 | | | – | | | 7,646 | |
| Net other comprehensive income (loss) | 33,133 | | | (26,977) | | | 6,156 | | | – | | | 6,156 | |
| Balance, December 31, 2023 | $ | (106,969) | | | $ | (167,460) | | | $ | (274,429) | | | $ | 2 | | | $ | (274,431) | |
| | Currency Translation Adjustments | | | Employee Benefit Plans | | | Total AOCI | | | Amount Attributable to Noncontrolling Interests | | | Total Lazard Group AOCI | |
Balance, January 1, 2021 | | $ | (20,438 | ) | | $ | (173,006 | ) | | $ | (193,444 | ) | | $ | 2 | | | $ | (193,446 | ) |
Activity: | | | | | | | | | | | | | | | | | | | | |
Other comprehensive income (loss) before reclassifications | | | (48,401 | ) | | | 34,666 | | | | (13,735 | ) | | | - | | | | (13,735 | ) |
Adjustments for items reclassified to earnings, net of tax | | | (7,516 | ) | | | 5,660 | | | | (1,856 | ) | | | - | | | | (1,856 | ) |
Net other comprehensive income (loss) | | | (55,917 | ) | | | 40,326 | | | | (15,591 | ) | | | - | | | | (15,591 | ) |
Balance, December 31, 2021 | | $ | (76,355 | ) | | $ | (132,680 | ) | | $ | (209,035 | ) | | $ | 2 | | | $ | (209,037 | ) |
| | | | | | | | | | | | | | | | | | | | | | | | | | | | | |
| Currency
Translation
Adjustments | | Employee
Benefit
Plans | | Total
AOCI | | Amount
Attributable to
Noncontrolling
Interests | | Total
Lazard Group
AOCI |
| Balance, January 1, 2022 | $ | (76,355) | | | $ | (132,680) | | | $ | (209,035) | | | $ | 2 | | | $ | (209,037) | |
| Activity: | | | | | | | | | |
| Other comprehensive loss before reclassifications | (63,779) | | | (11,955) | | | (75,734) | | | – | | | (75,734) | |
| Adjustments for items reclassified to earnings, net of tax | 32 | | | 4,152 | | | 4,184 | | | – | | | 4,184 | |
| Net other comprehensive loss | (63,747) | | | (7,803) | | | (71,550) | | | – | | | (71,550) | |
| Balance, December 31, 2022 | $ | (140,102) | | | $ | (140,483) | | | $ | (280,585) | | | $ | 2 | | | $ | (280,587) | |
| | Currency Translation Adjustments | | | Employee Benefit Plans | | | Total AOCI | | | Amount Attributable to Noncontrolling Interests | | | Total Lazard Group AOCI | |
Balance, January 1, 2020 | | $ | (74,369 | ) | | $ | (176,035 | ) | | $ | (250,404 | ) | | $ | - | | | $ | (250,404 | ) |
Activity: | | | | | | | | | | | | | | | | | | | | |
Other comprehensive income (loss) before reclassifications | | | 53,931 | | | | (3,017 | ) | | | 50,914 | | | | 2 | | | | 50,912 | |
Adjustments for items reclassified to earnings, net of tax | | | - | | | | 6,046 | | | | 6,046 | | | | - | | | | 6,046 | |
Net other comprehensive income | | | 53,931 | | | | 3,029 | | | | 56,960 | | | | 2 | | | | 56,958 | |
Balance, December 31, 2020 | | $ | (20,438 | ) | | $ | (173,006 | ) | | $ | (193,444 | ) | | $ | 2 | | | $ | (193,446 | ) |
| | | | | | | | | | | | | | | | | | | | | | | | | | | | | |
| Currency
Translation
Adjustments | | Employee
Benefit
Plans | | Total
AOCI | | Amount
Attributable to
Noncontrolling
Interests | | Total
Lazard Group
AOCI |
| Balance, January 1, 2021 | $ | (20,438) | | | $ | (173,006) | | | $ | (193,444) | | | $ | 2 | | | $ | (193,446) | |
| Activity: | | | | | | | | | |
| Other comprehensive income (loss) before reclassifications | (48,401) | | | 34,666 | | | (13,735) | | | – | | | (13,735) | |
| Adjustments for items reclassified to earnings, net of tax | (7,516) | | | 5,660 | | | (1,856) | | | – | | | (1,856) | |
| Net other comprehensive income (loss) | (55,917) | | | 40,326 | | | (15,591) | | | – | | | (15,591) | |
| Balance, December 31, 2021 | $ | (76,355) | | | $ | (132,680) | | | $ | (209,035) | | | $ | 2 | | | $ | (209,037) | |
NOTES TO CONSOLIDATED FINANCIAL STATEMENTS—(Continued)
(dollars in thousands, unless otherwise noted)
The table below reflects adjustments for items reclassified out of AOCI, by component, for the years ended December 31,
2023, 2022
2021 and
2020: | | Year Ended December 31, | |
| | 2022 | | | 2021 | | | 2020 | |
Currency translation losses (gains) (a) | | $ | 32 | | | $ | (7,516 | ) | | $ | - | |
Employee benefit plans: | | | | | | | | | | | | |
Amortization relating to employee benefit plans (b) | | | 5,146 | | | | 7,269 | | | | 7,522 | |
Less - related income taxes | | | 994 | | | | 1,609 | | | | 1,476 | |
| | | 4,152 | | | | 5,660 | | | | 6,046 | |
Total reclassifications, net of tax | | $ | 4,184 | | | $ | (1,856 | ) | | $ | 6,046 | |
(a)
| Represents currency translation losses (gains) reclassified to earnings out of AOCI associated with restructuring and closing of certain of our offices. Such amounts are included in “revenue–other” on the consolidated statements of operations.
|
2021: | | | | | | | | | | | | | | | | | | | Year Ended December 31, | | 2023 | | 2022 | | 2021 | | Currency translation losses (gains) (a) | $ | 2,413 | | | $ | 32 | | | $ | (7,516) | | | Employee benefit plans: | | | | | | | Amortization relating to employee benefit plans (b) | 6,754 | | | 5,146 | | | 7,269 | | | Less - related income taxes | 1,521 | | | 994 | | | 1,609 | | | 5,233 | | | 4,152 | | | 5,660 | | | Total reclassifications, net of tax | $ | 7,646 | | | $ | 4,184 | | | $ | (1,856) | |
________________________ (a)Represents currency translation losses (gains) reclassified from AOCI associated with closing certain of our offices. Such amounts are included in “revenue–other” on the consolidated statements of operations. (b)Included in the computation of net periodic benefit cost (see Note 17). Such amounts are included in “operating expenses–other” on the consolidated statements of operations. (b)
| Included in the computation of net periodic benefit cost (see Note 16). Such amounts are included in “operating expenses–other” on the consolidated statements of operations.
|
Noncontrolling Interests—Noncontrolling interests principally represent (i) interests held in Edgewater’s management vehicles that the Company is deemed to control, but does not own, (ii) LGAC interests (see Note 1) and (iii) consolidated VIE interests held by employees (see Note 21)23).
The tables below summarize net income (loss) attributable to noncontrolling interests for the years ended December 31,
2023, 2022
2021 and
20202021 and noncontrolling interests as of December 31,
20222023 and
20212022 in the Company’s consolidated financial statements:
| | Net Income (Loss) Attributable to Noncontrolling Interests Year Ended December 31, | |
| | 2022 | | | 2021 | | | 2020 | |
| Net Income (Loss)
Attributable to Noncontrolling Interests
Year Ended December 31, | | | Net Income (Loss)
Attributable to Noncontrolling Interests
Year Ended December 31, |
| 2023 | | | 2023 | | 2022 | | 2021 |
Edgewater | | $ | 31,314 | | | $ | 10,466 | | | $ | (2,349 | ) |
LFI Consolidated Funds | | | (11,415 | ) | | | 7,950 | | | | 2,577 | |
LGAC | | | 15,064 | | | | (3,940 | ) | | | - | |
Other | | | 3 | | | | 5 | | | | 3 | |
Total | | $ | 34,966 | | | $ | 14,481 | | | $ | 231 | |
| | Noncontrolling Interests as of December 31, | |
| | 2022 | | | 2021 | |
| Noncontrolling Interests
as of December 31, | | | Noncontrolling Interests
as of December 31, |
| 2023 | | | 2023 | | 2022 |
Edgewater | | $ | 44,681 | | | $ | 44,826 | |
LFI Consolidated Funds | | | 74,164 | | | | 67,299 | |
LGAC | | | (10,714 | ) | | | (13,445 | ) |
Other | | | 13 | | | | 16 | |
Total | | $ | 108,144 | | | $ | 98,696 | |
RedeemableNoncontrolling Interests—Redeemable noncontrolling interests principally represent LGAC interests as of December 31, 2022 (see Note 1) and consolidated VIE interests held by employees as of December 31, 2023 (see Note 23). Consolidated VIE interests held by employees (vested LFI awards), which may be redeemed at any time at the option of the holder for cash, are recorded on the Company’s consolidated statements of financial position at redemption value and classified as temporary equity. Changes in redemption value are recognized immediately as they
NOTES TO CONSOLIDATED FINANCIAL STATEMENTS—(Continued)
(dollars in thousands, unless otherwise noted)
occur and will adjust the carrying value of redeemable noncontrolling interests to equal the redemption value at the end of each reporting period. 16. INCENTIVE PLANS
Share-Based Incentive Plan Awards
A description of Lazard Ltd’s 2018 Plan
and 2008
Plan and 2005 Equity Incentive
Compensation Plan (the
“2005“2008 Plan”) and activity with respect thereto during the years ended December 31,
2023, 2022
2021 and
20202021 is presented below.
Shares Available Under the 2018 Plan
and 2008 Plan
and 2005 PlanThe
Total shares available for issuance under incentive compensation plans are primarily from the 2018 Plan,
which became effective on April 24,
2018 and was amended on April 29, 2021 to increase the2018. The aggregate number of shares authorized for issuance under the 2018 Plan
by 20,000,000 shares. The 2018 Plan replaced the 2008 Plan, which was terminated on April 24, 2018. The 2018 Plan originally authorized issuance of up to 30,000,000 shares of common stock, plus any shares of common stock that were subject to outstanding awards under the 2008 Plan as of March 14, 2018 that are forfeited, canceled or settled in cash following April 24, 2018, which was the date that the 2018 Plan was approved by our shareholders.is 50,000,000. Such shares may be issued pursuant to the grant or exercise of stock options, stock appreciation rights, restricted stock units (“RSUs”), performance-based restricted stock units (“PRSUs”), restricted stock awards (“RSAs”), profits interest participation rights
including performance-based restricted participation units (“
PRPUs”PIPRs”), and other share-based
awards.awards, as further discussed below.
The 2008 Plan authorized the issuance of shares of common stock pursuant to the grant or exercise of stock options, stock appreciation rights, RSUs, PRSUs and other share-based awards.
Under the 2008 Plan, the maximum number of shares available was based on a formula that limited the aggregate number of shares that could, at any time, be subject to awards that were considered “outstanding” under the 2008 Plan to 30% of the then-outstanding shares of common stock. The 2008 Plan was terminated on April 24, 2018,
and no additional awards have been or will be granted under the 2008 Plan after its termination, although outstanding deferred stock unit (“DSU”) awards granted under the 2008 Plan before its termination continue to be subject to its terms.
The 2005 Plan authorized the issuance of up to 25,000,000 shares of common stock pursuant to the grant or exercise of stock options, stock appreciation rights, RSUs and other share-based awards. The 2005 Plan expired in the second quarter of 2015, although outstanding DSU awards granted under the 2005 Plan before its expiration continue to be subject to its terms.
Expense
The following reflects the
amortization expense recorded with respect to share-based incentive plans within “compensation and benefits” expense (with respect to RSUs, PRSUs, RSAs and
profits interest participation rights, including PRPUs)PIPRs) and “professional services” expense (with respect to DSUs) within the Company’s accompanying consolidated statements of operations:
| | Year Ended December 31, | |
| | 2022 | | | 2021 | | | 2020 | |
| Year Ended December 31, | | | Year Ended December 31, |
| 2023 | | | 2023 | | 2022 | | 2021 |
Share-based incentive awards: | | | | | | | | | | | | |
| RSUs | |
| RSUs | |
RSUs | | $ | 125,664 | | | $ | 124,895 | | | $ | 140,556 | |
PRSUs | | | 2,011 | | | | 6,136 | | | | 6,264 | |
RSAs | | | 23,923 | | | | 17,765 | | | | 27,976 | |
Profits interest participation rights | | | 86,810 | | | | 83,046 | | | | 41,293 | |
| PIPRs | |
DSUs | | | 1,116 | | | | 1,058 | | | | 1,180 | |
Total | | $ | 239,524 | | | $ | 232,900 | | | $ | 217,269 | |
The ultimate amount of compensation
Compensation and benefits expense relating to share-based awards with service and/or performance conditions is dependent uponreversed if the actual number of shares of common stock that vest. awards are forfeited due to these conditions not being met. Compensation and benefits expense relating to share-based awards with market-based conditions is not reversed if these awards are forfeited based solely on failing to meet such market-based conditions.
The Company periodically assesses
the forfeiture rates,
used for such estimates, including as a result of any applicable performance conditions. A change in estimated forfeiture rates or performance results in a cumulative adjustment to compensation and benefits expense and also would cause
104
LAZARD GROUP LLC
NOTES TO CONSOLIDATED FINANCIAL STATEMENTS—(Continued)
(dollars in thousands, unless otherwise noted)
the aggregate amount of compensation expense recognized in future periods to differ from the estimated unrecognized compensation expense described below.
The Company’s share-based incentive plans and awards are described below.
LAZARD GROUP LLC
NOTES TO CONSOLIDATED FINANCIAL STATEMENTS—(Continued)
(dollars in thousands, unless otherwise noted)
RSUs generally require future service as a condition for
the delivery of the underlying shares of common stockvesting (unless the recipient is then eligible for retirement under the Company’s retirement policy) and convert into shares of common stock on a one-for-one basis after the stipulated vesting periods. The grant date fair value of the RSUs, net of an estimated forfeiture rate, is
amortizedexpensed over the
vesting periods or requisite service periods (generally, one-third after two years and the remaining two-thirds after the third year), and is adjusted for actual forfeitures over such period.
RSUs generally include a dividend participation right that provides that, during the applicable vesting period, each RSU is attributed additional RSUs equivalent to any dividends paid on common stock during such period. During the year ended December 31,
2022,2023, dividend participation rights required the issuance of
455,287711,673 RSUs.
Non-executive members of the Board of Directors of Lazard Group, who are the same Non-Executive Directors of Lazard Ltd (“Non-Executive Directors”), receive approximately 55% of their annual compensation for service on the Board of Directors and its committees in the form of DSUs, which resulted in 44,772 DSUs being granted during the year ended December 31, 2022. Their remaining compensation is payable in cash, which they may elect to receive in the form of additional DSUs under the Directors’ Fee Deferral Unit Plan described below. DSUs are convertible into shares of common stock at the time of cessation of service to the Board of Directors. DSUs include a cash dividend participation right equivalent to dividends paid on common stock.
Lazard Ltd’s Directors’ Fee Deferral Unit Plan permits the Non-Executive Directors to elect to receive additional DSUs in lieu of some or all of their cash fees. The number of DSUs granted to a Non-Executive Director pursuant to this election will equal the value of cash fees that the applicable Non-Executive Director has elected to forego pursuant to such election, divided by the market value of a share of common stock on the date immediately preceding the date of the grant. During the year ended December 31, 2022, 17,640 DSUs had been granted pursuant to such Plan.
DSU awards are expensed at their fair value on their date of grant, inclusive of amounts related to the Directors’ Fee Deferral Unit Plan.
The following is a summary of activity relating to RSUs and DSUs for the year ended December 31, 2022:
| | RSUs | | | DSUs | |
| | Units | | | Weighted Average Grant Date Fair Value | | | Units | | | Weighted Average Grant Date Fair Value | |
Balance, January 1, 2022 | | | 8,150,782 | | | $ | 41.16 | | | | 338,408 | | | $ | 38.01 | |
Granted (including 455,287 RSUs relating to dividend participation) | | | 5,329,456 | | | $ | 33.73 | | | | 62,412 | | | $ | 35.78 | |
Forfeited | | | (310,646 | ) | | $ | 39.16 | | | | - | | | $ | - | |
Settled | | | (4,146,675 | ) | | $ | 38.71 | | | | - | | | $ | - | |
Balance, December 31, 2022 | | | 9,022,917 | | | $ | 37.97 | | | | 400,820 | | | $ | 37.66 | |
The weighted-average grant date fair value of RSUs granted in 2022, 2021 and 2020 was $33.73, $43.38 and $42.60, respectively. The weighted-average grant date fair value of DSUs granted in 2022, 2021 and 2020 was $35.78, $46.75 and $28.49, respectively.
105
LAZARD GROUP LLC
NOTES TO CONSOLIDATED FINANCIAL STATEMENTS—(Continued)
(dollars in thousands, unless otherwise noted)
In connection with RSUs that settled during the year ended December 31, 2022,2023, the Company satisfied its minimum statutory tax withholding requirements in lieu of delivering 1,527,4761,213,264 shares of common stock during the year. Accordingly, 2,619,1992,158,820 shares of common stock, respectively, held by the Company were delivered during the year ended December 31, 2022.
As of December 31, 2022, estimated unrecognized RSU compensation expense was $115,641, with such expense expected to be recognized over a weighted average period of approximately 0.9 years subsequent to December 31, 2022.
RSAs
The following is a summary of activity related to RSAs associated with compensation arrangements during the year ended December 31, 2022:
2023. | | RSAs | | | Weighted Average Grant Date Fair Value | |
Balance, January 1, 2022 | | | 871,227 | | | $ | 41.24 | |
Granted (including 67,261 relating to dividend participation) | | | 1,064,296 | | | $ | 33.37 | |
Forfeited | | | (81,178 | ) | | $ | 37.69 | |
Settled | | | (587,921 | ) | | $ | 36.63 | |
Balance, December 31, 2022 | | | 1,266,424 | | | $ | 36.99 | |
The weighted-average grant date fair value of RSAs granted in 2022, 2021 and 2020 was $33.37, $43.80 and $42.89, respectively.
In connection with RSAs that settled during the year ended December 31, 2022, the Company satisfied its minimum statutory tax withholding requirements in lieu of delivering 203,490 shares of common stock during the year. Accordingly, 384,431 shares of common stock held by the Company were delivered during the year ended December 31, 2022.
RSAs granted in 2022 generally include a dividend participation right that provides that during the applicable vesting period each RSA is attributed additional RSAs equivalent to any dividends paid on common stock during such period. During the year ended December 31, 2022, dividend participation rights required the issuance of 67,261 RSAs.
At December 31, 2022, estimated unrecognized RSAs expense was $19,897, with such expense to be recognized over a weighted average period of approximately 0.9 years subsequent to December 31, 2022.
PRSUs
PRSUs are RSUs that are subject to performance-based and service-based vesting conditions, and beginning with awards granted in February 2021, a market-based condition. The number of shares of common stock that a recipient will receivereceives upon vesting of a PRSU will beis calculated by reference to certain performance-based and market-based metrics that relate to Lazard Ltd’s performance over a three-year period. The target number of shares of common stock subject to each PRSU is one; however, based on the achievement of both the performance-based and market-based criteria,conditions, the number of shares of common stock that may be received will range from zero to 2.4 times the target number. PRSUs will vest on a single date approximately three years following the date of the grant, provided the applicable service and performance conditions are satisfied. PRSUs include dividend participation rights that are subject to the same vesting restrictions (including performance criteria)conditions) as the underlying PRSUs to which they relate and are settled in cash at the same rate that dividends are paid on common stock.
106
LAZARD GROUP LLC
NOTES TO CONSOLIDATED FINANCIAL STATEMENTS—(Continued)
(dollars in thousands, unless otherwise noted)
The following is a summary of activity relating to PRSUs during the year ended December 31, 2022:
| | PRSUs | | | Weighted Average Grant Date Fair Value | |
Balance, January 1, 2022 | | | 32,394 | | | $ | 46.63 | |
Granted | | | 62,296 | | | $ | 35.44 | |
Balance, December 31, 2022 | | | 94,690 | | | $ | 39.27 | |
The weighted-average grant date fair value of PRSUs granted in 2022, 2021 and 2020 was $35.44, $46.63 and $50.74, respectively.
Compensation expense recognized for PRSU awards is determined by multiplying the number of shares of common stock underlying such awards that, based on the Company’s estimate, are considered probable of vesting, by the grant date fair value.
Non-executive members of the Board of Directors of Lazard Group, who are the same Non-Executive Directors of Lazard Ltd (“Non-Executive Directors”) receive a portion of their compensation for service on the Board of Directors and its committees in the form of DSUs and can elect to receive the cash-portion of their compensation in DSUs in lieu of cash. Total DSUs granted to Non-Executive Directors during the year ended December 31, 2023 were 62,654. DSUs are convertible into shares of common stock on a one-for-one basis at the time of cessation of service to the Board of Directors. DSUs include a cash dividend participation right equivalent to dividends paid on common stock. DSU awards are expensed at their fair value on their date of grant.
LAZARD GROUP LLC
NOTES TO CONSOLIDATED FINANCIAL STATEMENTS—(Continued)
(dollars in thousands, unless otherwise noted)
The following is a summary of activity relating to RSUs, PRSUs and DSUs for the year ended December 31, 2023:
| | | | | | | | | | | | | | | | | | | | | | | | | | | | | | | | | | | |
| RSUs | | PRSUs | | DSUs |
| Units | | Weighted
Average
Grant Date
Fair Value | | Units | | Weighted
Average
Grant Date
Fair Value | | Units | | Weighted
Average
Grant Date
Fair Value |
| Balance, January 1, 2023 | 9,022,917 | | $ | 37.97 | | | 94,690 | | $ | 39.27 | | | 400,820 | | $ | 37.66 | |
| Granted (including 711,673 RSUs relating to dividend participation) | 5,700,485 | | $ | 36.49 | | | – | | $ | – | | | 62,654 | | $ | 29.71 | |
| Forfeited | (282,967) | | $ | 35.37 | | | – | | $ | – | | | - | | $ | – | |
| Settled | (3,372,084) | | $ | 41.65 | | | – | | $ | – | | | (134,744) | | $ | 36.21 | |
| PRSUs performance units earned (a) | | | | | 30,775 | | $ | 46.63 | | | | | |
| Balance, December 31, 2023 | 11,068,351 | | $ | 36.15 | | | 125,465 | | $ | 41.07 | | | 328,730 | | $ | 36.74 | |
_____________________(a)Represents PRSUs earned during the fiscal year under the performance conditions of previously-granted PRSU awards in excess of the target payout levels of such awards.
The weighted-average grant date fair value of RSUs granted in 2023, 2022 and 2021 was $36.49, $33.73 and $43.38, respectively. The weighted-average grant date fair value of PRSUs granted in 2022 and 2021 was $35.44 and $46.63, respectively. The weighted-average grant date fair value of DSUs granted in 2023, 2022 and 2021 was $29.71, $35.78 and $46.75, respectively.
As of December 31, 2022,2023, the total estimated unrecognized compensation expense of RSUs and PRSUs was $3,295,$122,498 and the$1,185, respectively. The Company expects to amortizeexpense such amounts over weighted-average periods of approximately 0.9 and 0.4 years, respectively, subsequent to December 31, 2023.
RSAs
The following is a summary of activity related to RSAs associated with compensation arrangements during the year ended December 31, 2023:
| | | | | | | | | | | |
| RSAs | | Weighted
Average
Grant Date
Fair Value |
| Balance, January 1, 2023 | 1,266,424 | | $ | 36.99 | |
| Granted (including 94,985 relating to dividend participation) | 670,064 | | $ | 37.60 | |
| Forfeited | (15,897) | | $ | 39.14 | |
| Settled | (684,645) | | $ | 39.13 | |
| Balance, December 31, 2023 | 1,235,946 | | $ | 36.10 | |
The weighted-average grant date fair value of RSAs granted in 2023, 2022 and 2021 was $37.60, $33.37 and $43.80, respectively.
In connection with RSAs that settled during the year ended December 31, 2023, the Company satisfied its minimum statutory tax withholding requirements in lieu of delivering 279,385 shares of common stock during the year. Accordingly, 405,260 shares of common stock held by the Company were delivered during the year ended December 31, 2023.
LAZARD GROUP LLC
NOTES TO CONSOLIDATED FINANCIAL STATEMENTS—(Continued)
(dollars in thousands, unless otherwise noted)
RSAs generally include a dividend participation right that provides that during the applicable vesting period each RSA is attributed additional RSAs equivalent to any dividends paid on common stock during such period. During the year ended December 31, 2023, dividend participation rights required the issuance of 94,985 RSAs.
At December 31, 2023, estimated unrecognized RSAs expense was $15,967, with such expense
to be recognized over a
weighted-averageweighted average period of approximately 0.8 years subsequent to December 31,
2022.2023.
Profits Interest Participation Rights
Profits interest participation rights
(“PIPRs”) are equity incentive awards that, subject to certain
vesting and other conditions
described below, may be exchanged for shares of common stock pursuant to the 2018 Plan.
The Company granted profits interest participation rights subject to service-based and performance-based vesting criteria and other conditions, and beginning in February 2021, incremental market-based vesting criteria, which we refer to as performance-based restricted participation units (“PRPUs”), to certain of our executive officers. The Company also granted profits interest participation rights subject to service-based vesting criteria and other conditions, but not the performance-based and incremental market-based vesting criteria associated with PRPUs, to a limited number of other senior employees. Profits interest participation rights generally provide for vesting approximately three years following the grant date, so long as applicable conditions have been satisfied.Profits interest participation rightsThey are a class of membership interests in the Company that are intended to qualify as “profits interests” for U.S. federal income tax purposes and are recorded within members’ equity in the Company’s consolidated statements of financial condition. The profits interest participation rights
PIPRs, with the exception of Stock Price PIPRs (“SP-PIPRs”), as explained below, generally allowprovide for vesting approximately three years following the grant date, so long as applicable vesting and other conditions have been satisfied. Like outstanding RSUs and similar awards, PIPRs are subject to continued employment and other conditions and restrictions and are forfeited if those conditions and restrictions are not fulfilled.
A recipient
to realizegenerally realizes value
from PIPRs only to the extent that
both (i) the service-basedapplicable vesting
conditions and
if applicable, the performance-based and incremental market-basedother conditions are satisfied, and
(ii) an amount of economic appreciation in the assets of the Company occurs as necessary to satisfy certain partnership tax rules (referred to as the “Minimum Value Condition”)
before the fifth anniversary of the grant date,, otherwise the
profits interest participation rightsPIPRs will be forfeited. Upon satisfaction of such conditions,
profits interest participation rightsPIPRs that are in parity with the value of common stock will be exchanged on a one-for-one basis for shares of common stock. If forfeited based solely on failing to meet the Minimum Value Condition,
or, if applicable, common stock price milestones as described below, the associated compensation expense would not be reversed.
With regard to the profits interest participation rights granted in February 2019 and February 2020, the Minimum Value Condition was met during the years ended December 31, 2020 and December 31, 2021, respectively. On March 1, 2022, the profits interest participation rights granted in February 2019, for which the Minimum Value Condition and other vesting conditions were satisfied, were exchanged on a one-for-one basis for shares of common stock.Like outstanding RSUs and similar
All PIPR awards profits interest participation rights are subject to continued employmentservice-based vesting conditions. In addition to PIPR awards with only service-based vesting conditions (“Ordinary PIPRs”) granted to certain of our executive officers and other conditions and restrictions and are forfeited if those conditions and restrictions are not fulfilled. More specifically, vestinga limited number of profits interest participation rightsemployees, the Company has granted the following types of PIPRs to certain of our executive officers, that are subject to compliance with restrictive covenants including non-compete, non-solicitation of clients, no hire of employeesadditional vesting and confidentiality,market-based conditions:
•Performance PIPRs (“P-PIPRs”), which are similarsubject to those applicableservice-based and performance-based vesting conditions, and beginning in February 2021, incremental market-based conditions.
•SP-PIPRs, which are subject to PRSUsservice-based vesting conditions and RSUs. In addition, profits interest participation rights must satisfy the Minimum Value Condition.107
LAZARD GROUP LLC
NOTES TO CONSOLIDATED FINANCIAL STATEMENTS—(Continued)
(dollarscommon stock price milestones and are eligible to vest in thousands, unless otherwise noted)
three tranches.
The number of shares of common stock that a recipient will receive upon the exchange of a PRPUP-PIPR award is calculated by reference to applicable performance-based vesting conditions and, beginning with PRPUsP-PIPRs granted in 2021, incremental market-based conditions and only result in value to the recipient to the extent the vesting and other conditions are satisfied. The target number of shares of common stock subject to each PRPUP-PIPR is one. Based on the achievement of performance criteria,conditions, as determined and approved by the Compensation Committee, the number of shares of common stock that may be received in connection with the PRPUP-PIPR awards granted prior to February 2021 will range from zero to two times the target number. For the PRPUP-PIPR awards granted beginning in February 2021, subject to both performance-based and incremental market-based criteria,conditions, the number of shares that may be received will range from zero to 2.4 times the target number. Unless applicable vesting and other conditions are satisfied during the three yearthree-year performance period, and the Minimum Value Condition is satisfied within five years following the grant date, all PRPUsP-PIPRs will be forfeited, and the recipients will not be entitledforfeited.
SP-PIPRs are eligible to
any such awards. The performance metrics applicable to the PRPU awards granted prior to February 2021 were also evaluated on an annual basis at the end of each fiscal year during the performance period, and, if Lazard Ltd achievedvest in three tranches (each, a threshold level of performance with respect to the fiscal year, 25% of the target number of PRPUs are no longer at risk of forfeiture“Tranche”) based on the achievement of performance criteria. Profits interest participation rights are allocated income,service conditions and Tranche-specific common stock price milestones measured as of a specified anniversary of the date of grant, as described below. Their aggregate fair value at the grant date, which based on the estimated probability of achieving the common stock price milestones is approximately $33,900, is expensed over the requisite service periods.
SP-PIPRs will vest:
LAZARD GROUP LLC
NOTES TO CONSOLIDATED FINANCIAL STATEMENTS—(Continued)
(dollars in thousands, unless otherwise noted)
•20% if, during the three years following the date of grant, the Company’s common stock price has appreciated 25% above the average trailing 30 consecutive day stock price preceding the date of grant (the “Grant Date Stock Price”);
•40% if, during the five years following the date of grant, the Company’s common stock price has appreciated 50% above the Grant Date Stock Price;
•40% if, during the seven years following the date of grant, the Company’s common stock price has appreciated 100% above the Grant Date Stock Price.
Each Tranche is subject to vestingthe executive’s continued employment through the applicable anniversary of the date of grant and settledrequires that the applicable common stock price milestone is sustained for any 30 consecutive day period prior to the anniversary of the date of grant of the applicable Tranche (the “Expiration Date”).
If the service conditions and common stock price milestones, as described above, are not achieved as of the Expiration Date, all SP-PIPRs in
cash, in respect of dividends paid on common stock.such Tranche will be forfeited.
The following is a summary of activity relating to
profits interest participation rights, including PRPUs,all PIPRs during the year ended December 31,
2022: | | Profits Interest Participation Rights | | | Weighted Average Grant Date Fair Value | |
Balance, January 1, 2022 | | | 4,122,993 | | | $ | 41.50 | |
Granted | | | 1,521,103 | | | $ | 34.53 | |
Forfeited | | | (96,323 | ) | | $ | 38.92 | |
Settled | | | (1,902,756 | ) | | $ | 38.76 | |
Performance units earned (a) | | | 486,611 | | | $ | 40.64 | |
Balance, December 31, 2022 (b) | | | 4,131,628 | | | $ | 40.15 | |
(a)
| Represents shares of common stock earned during the fiscal year under the performance criteria of previously-granted PRPU awards in excess of the target payout levels of such awards.
|
2023:(b)
| Table includes 2,447,224 PRPUs, which represents the target number of PRPUs granted and performance units earned, net of settlements as of December 31, 2022, including 2,001,174 PRPUs as of January 1, 2022 and 963,660 PRPUs granted and 486,611 performance units earned, net of 1,004,221 PRPUs settled during the year ended December 31, 2022. The weighted average grant date fair values for PRPUs and other profits interest participation rights outstanding as of January 1, 2022 were $41.82 and $41.20, respectively. The weighted average grant date fair values for PRPUs and other profits interest participation rights granted during the year ended December 31, 2022 were $35.44 and $32.95, respectively. The weighted average grant date fair values for other profits interest participation rights forfeited during the year ended December 31, 2022 were $38.92. The weighted average grant date fair values for PRPUs and other profits interest participation rights settled during the year ended December 31, 2022 were $38.86 and $38.65, respectively. The weighted average grant date fair values for PRPUs and other profits interest participation rights outstanding as of December 31, 2022 were $40.29 and $39.96, respectively.
|
| | | | | | | | | | | | | | | | | | | | | | | | | | | | | | | | | | | |
| Ordinary PIPRs (a) | | P-PIPRs | | SP-PIPRs |
| | Units | | Weighted
Average
Grant Date
Fair Value | | Units | | Weighted
Average
Grant Date
Fair Value | | Units | | Weighted
Average
Grant Date
Fair Value |
| Balance, January 1, 2023 | 1,684,404 | | $ | 39.96 | | | 2,447,224 | | $ | 40.29 | | | – | | $ | – | |
| Granted | 1,521,458 | | $ | 34.50 | | | – | | $ | – | | | 2,250,000 | | $ | 15.06 | |
| Forfeited | (16,695) | | $ | 43.23 | | | – | | $ | – | | | – | | $ | – | |
| Settled | (548,398) | | $ | 42.89 | | | (973,222) | | $ | 41.76 | | | – | | $ | – | |
| Performance units earned (b) | | | | | 484,827 | | $ | 46.63 | | | | | |
| Balance, December 31, 2023 | 2,640,769 | | $ | 36.19 | | | 1,958,829 | | $ | 41.12 | | | 2,250,000 | | $ | 15.06 | |
_____________________
(a)Includes PIPR awards with only service-based vesting conditions.
(b)Represents P-PIPRs earned during the fiscal year under the performance conditions of previously-granted P-PIPR awards in excess of the target payout levels of such awards.
Fair values shown above represent the weighted average as of grant date. The weighted-average grant date fair value of profits interest participation rightsordinary PIPRs and SP-PIPRs granted in 2023 was $34.50 and $15.06, respectively. The weighted-average grant date fair value of ordinary PIPRs and P-PIPRs granted in 2022 was $32.95 and $35.44, respectively. The weighted-average grant date fair value of ordinary PIPRs and P-PIPRs granted in 2021 was $43.23 and 2020 was $34.53, $44.73 and $42.89,$46.63, respectively.
Compensation expense recognized for
profits interest participation rights, including PRPUs,ordinary PIPRs and P-PIPRs is determined by multiplying the number of shares of common stock underlying such awards that, based on the Company’s estimate, are considered probable of vesting, by the grant date fair value.
Compensation expense recognized for SP-PIPRs is determined by multiplying the number of shares of common stock underlying such awards by the grant date fair value. As of December 31,
2022,2023, the total estimated unrecognized compensation expense
of all profits interest participation rights was
$21,331$57,954 and the Company expects to
amortizeexpense such
expenseamount over a weighted-average period of approximately
0.91.8 years subsequent to December 31,
2022.108
LAZARD GROUP LLC
NOTES TO CONSOLIDATED FINANCIAL STATEMENTS—(Continued)
(dollars in thousands, unless otherwise noted)
2023.
LFI and Other Similar Deferred Compensation Arrangements
In connection with LFI and other similar deferred compensation arrangements, granted to eligible employees, which generally require future service as a condition for vesting, the Company recordedrecords a prepaid compensation asset and a corresponding compensation liability on the grant date based upon the fair value of the award. The prepaid asset is
LAZARD GROUP LLC
NOTES TO CONSOLIDATED FINANCIAL STATEMENTS—(Continued)
(dollars in thousands, unless otherwise noted)
amortized on a straight-line basis over the applicable
vesting periods or requisite service periods (which are generally similar to the comparable periods for RSUs) and is charged to “compensation and benefits” expense within the Company’s consolidated
statementstatements of operations. LFI and similar deferred compensation arrangements that do not require future service are expensed immediately. The related compensation liability is accounted for at fair value as a derivative liability, which contemplates the impact of estimated forfeitures, and is adjusted for changes in fair value primarily related to changes in value of the underlying investments.
The following is a summary of activity relating to LFI and other similar deferred compensation arrangements during the year ended December 31,
2022:2023: | | Prepaid Compensation Asset | | | Compensation Liability | |
Balance, January 1, 2022 | | $ | 108,049 | | | $ | 358,877 | |
Granted | | | 167,654 | | | | 167,654 | |
Settled | | | - | | | | (145,666 | ) |
Forfeited | | | (5,033 | ) | | | (16,894 | ) |
Amortization | | | (158,483 | ) | | | - | |
Change in fair value related to: | | | | | | | | |
Change in fair value of underlying investments | | | - | | | | (44,261 | ) |
Adjustment for estimated forfeitures | | | - | | | | 8,256 | |
Other | | | (63 | ) | | | (1,684 | ) |
Balance, December 31, 2022 | | $ | 112,124 | | | $ | 326,282 | |
| | | | | | | | | | | |
| Prepaid
Compensation
Asset | | Compensation
Liability |
| Balance, January 1, 2023 | $ | 112,124 | | | $ | 326,282 | |
| Granted | 159,981 | | | 159,981 | |
| Settled | – | | | (171,738) | |
| Amortization and the impact of forfeitures | (156,254) | | | 8,103 | |
| Change in fair value of underlying investments | – | | | 41,463 | |
| Other | 121 | | | 1,329 | |
| Balance, December 31, 2023 | $ | 115,972 | | | $ | 365,420 | |
The amortization of the prepaid compensation asset will generally be recognized over a weighted average period of approximately 0.8 years subsequent to December 31,
2022.2023.
The following is a summary of the impact of LFI and other similar deferred compensation arrangements on “compensation and benefits” expense within the accompanying consolidated statements of operations for the years ended December 31,
2023, 2022
2021 and
2020:2021: | | Year Ended December 31, | | | |
| | 2022 | | | 2021 | | | 2020 | | |
Amortization, net of forfeitures | | $ | 154,878 | | | $ | 151,604 | | | $ | 119,441 | | |
| Year Ended December 31, | | | Year Ended December 31, |
| 2023 | | | 2023 | | 2022 | | 2021 |
| Amortization and the impact of forfeitures | |
Change in the fair value of underlying investments | | | (44,261 | ) | | | 35,494 | | | | 40,634 | | |
Total | | $ | 110,617 | | | $ | 187,098 | | | $ | 160,075 | | |
109
LAZARD GROUP LLC
NOTES TO CONSOLIDATED FINANCIAL STATEMENTS—(Continued)
(dollars in thousands, unless otherwise noted)
Incentive Awards Granted in the First Quarter of 2024
In
February 2023In February 2023,the first quarter of 2024, the Company granted approximately $434,700$374,000 of deferred share-based incentive compensation awards to eligible employees as part of the 2023 year-end compensation process with respect to the 2022 fiscal year.process. These grants included: RSUs or RSAs; PRSUs; profits interest participation rights,including PRPUs;RSUs; PIPRs; and LFI awards;and other similar deferred compensation arrangements. The Company also granted approximately $95,000 of cash awards; andretention awards that are subject to a portion of certain fund managers’ year-end incentive compensation that is reinvested in certain funds managedrequired three-year service period subsequent to payment by the Company’sAsset Management business.
Company. If the service requirement is not met, the award is subject to clawback. The RSUs, RSAs and LFI granted generally provide for one-third vestingcash retention awards will be amortized over the requisite service period beginning on the second anniversary of the grant date and the remaining two-thirds vesting on the third anniversary of the grant date, so long as applicable conditions have been satisfied. PRSUs and the profits interest participation rights, including PRPUs, granted generally provide for vesting on the third anniversary of the grant date, so long as applicable conditions have been satisfied. The majority of deferred cash awards vest in August 2023, so long as applicable conditions have been satisfied. Compensation expense with respect to such incentive awards will generally be recognized over the applicable service period.
date.16.
| EMPLOYEE BENEFIT PLANS
|
17. EMPLOYEE BENEFIT PLANS
The Company provides retirement and other post-retirement benefits to certain of its employees through defined benefit pension plans (the “pension plans”). The Company also offers defined contribution plans to its employees. The pension plans generally provide benefits to participants based on average levels of compensation. Expenses related to the Company’s employee benefit plans are included in “compensation and benefits” expense for the service cost component, and “operating expenses–other” for the other components of benefit costs on the consolidated statements of operations.
LAZARD GROUP LLC
NOTES TO CONSOLIDATED FINANCIAL STATEMENTS—(Continued)
(dollars in thousands, unless otherwise noted)
Employer Contributions to Pension Plans—The Company’s funding policy for its U.S. and non-U.S. pension plans is to fund when required or when applicable upon an agreement with the plans’ trustees. Management also evaluates from time to time whether to make voluntary contributions to the plans.The Company expects to contribute approximately $1,000 to the U.S pension plan and approximately $3,000
Contributions to the non-U.S. pension plans during the year ending December 31,
2023. 110
LAZARD GROUP LLC
NOTES TO CONSOLIDATED FINANCIAL STATEMENTS—(Continued)
(dollars in thousands, unless otherwise noted)
2024 are not expected to be material.
The following table summarizes the changes in the benefit obligations, the fair value of the assets, the funded status and amounts recognized in the consolidated statements of financial condition for the post-retirement plans. The Company uses December 31 as the measurement date for its post-retirement plans.
| | Pension Plans | |
| | 2022 | | | 2021 | |
| Pension Plans | | | Pension Plans |
| 2023 | | | 2023 | | 2022 |
Change in benefit obligation | | | | | | | | |
| Benefit obligation at beginning of year | |
| Benefit obligation at beginning of year | |
Benefit obligation at beginning of year | | $ | 731,978 | | | $ | 811,662 | |
Service cost | | | 543 | | | | 876 | |
Interest cost | | | 11,130 | | | | 8,679 | |
| Amendments | |
Actuarial (gain) loss | | | (203,009 | ) | | | (39,706 | ) |
Benefits paid | | | (29,357 | ) | | | (29,327 | ) |
Settlements | | | - | | | | (4,643 | ) |
| | Foreign currency translation and other adjustments | |
| Foreign currency translation and other adjustments | |
Foreign currency translation and other adjustments | | | (71,235 | ) | | | (15,563 | ) |
Benefit obligation at end of year | | | 440,050 | | | | 731,978 | |
Change in plan assets | | | | | | | | |
Fair value of plan assets at beginning of year | | | 782,463 | | | | 799,895 | |
| Fair value of plan assets at beginning of year | |
| Fair value of plan assets at beginning of year | |
Actual return on plan assets | | | (215,237 | ) | | | 26,046 | |
Employer contributions | | | 4,206 | | | | 4,493 | |
Benefits paid | | | (29,357 | ) | | | (29,327 | ) |
Settlements | | | - | | | | (4,643 | ) |
| | Foreign currency translation and other adjustments | |
| Foreign currency translation and other adjustments | |
Foreign currency translation and other adjustments | | | (73,203 | ) | | | (14,001 | ) |
Fair value of plan assets at end of year | | | 468,872 | | | | 782,463 | |
Funded (deficit) at end of year | | $ | 28,822 | | | $ | 50,485 | |
Amounts recognized in the consolidated statements of financial condition at December 31, 2022 and 2021 consist of: | | | | | | | | |
| Amounts recognized in the consolidated statements of financial condition at December 31, 2023 and 2022 consist of: | |
| Prepaid pension asset (included in “other assets”) | |
| Prepaid pension asset (included in “other assets”) | |
Prepaid pension asset (included in “other assets”) | | $ | 35,268 | | | $ | 78,058 | |
Accrued benefit liability (included in “other liabilities”) | | | (6,446 | ) | | | (27,573 | ) |
Net amount recognized | | $ | 28,822 | | | $ | 50,485 | |
Amounts recognized in AOCI (excluding tax benefits of $29,813 and $25,370 at December 31, 2022 and 2021, respectively) consist of: | | | | | | | | |
| Amounts recognized in AOCI (excluding tax benefits of $38,516 and $29,813 at December 31, 2023 and 2022, respectively) consist of: | |
| Actuarial net loss | |
| Actuarial net loss | |
Actuarial net loss | | $ | 167,724 | | | $ | 155,052 | |
Prior service cost | | | 2,572 | | | | 2,999 | |
Net amount recognized | | $ | 170,296 | | | $ | 158,051 | |
For the years ended December 31,
20222023 and
2021,2022, the change in the benefit obligation related to the actuarial (gain) loss is principally attributable to changes in the discount rates.
LAZARD GROUP LLC
NOTES TO CONSOLIDATED FINANCIAL STATEMENTS—(Continued)
(dollars in thousands, unless otherwise noted)
The following table summarizes the fair value of plan assets, the accumulated benefit obligation and the projected benefit obligation at December 31,
20222023 and
2021:2022: | | U.S. Pension Plans | | | Non-U.S. Pension Plans | | | Total | |
| | As Of December 31, | | | As Of December 31, | | | As Of December 31, | |
| | 2022 | | | 2021 | | | 2022 | | | 2021 | | | 2022 | | | 2021 | |
| U.S. Pension Plans
As Of December 31, | | | U.S. Pension Plans
As Of December 31, | | Non-U.S. Pension Plans
As Of December 31, | | Total
As Of December 31, |
| 2023 | | | 2023 | | 2022 | | 2023 | | 2022 | | 2023 | | 2022 |
Fair value of plan assets | | $ | 14,983 | | | $ | 24,227 | | | $ | 453,889 | | | $ | 758,236 | | | $ | 468,872 | | | $ | 782,463 | |
Accumulated benefit obligation | | $ | 20,518 | | | $ | 31,543 | | | $ | 419,532 | | | $ | 700,435 | | | $ | 440,050 | | | $ | 731,978 | |
Projected benefit obligation | | $ | 20,518 | | | $ | 31,543 | | | $ | 419,532 | | | $ | 700,435 | | | $ | 440,050 | | | $ | 731,978 | |
111
LAZARD GROUP LLC
NOTES TO CONSOLIDATED FINANCIAL STATEMENTS—(Continued)
(dollars in thousands, unless otherwise noted)
The following table summarizes the components of net periodic benefit cost (credit), the return on the Company’s post-retirement plan assets, benefits paid, contributions and other amounts recognized in AOCI for the years ended December 31,
2023, 2022
2021 and
2020:2021: | | Pension Plans | |
| | For The Year Ended | |
| | December 31, | |
| | 2022 | | | 2021 | | | 2020 | |
| Pension Plans
For The Year Ended
December 31, | | | Pension Plans
For The Year Ended
December 31, |
| 2023 | | | 2023 | | 2022 | | 2021 |
Components of Net Periodic Benefit Cost (Credit): | | | | | | | | | | | | |
| Service cost | |
| Service cost | |
Service cost | | $ | 543 | | | $ | 876 | | | $ | 843 | |
Interest cost | | | 11,130 | | | | 8,679 | | | | 11,912 | |
Expected return on plan assets | | | (24,482 | ) | | | (26,077 | ) | | | (26,711 | ) |
Amortization of: | | | | | | | | | | | | |
| Prior service cost | |
| Prior service cost | |
Prior service cost | | | 106 | | | | 118 | | | | 111 | |
Net actuarial loss | | | 5,040 | | | | 7,151 | | | | 7,411 | |
Settlement loss | | | - | | | | 1,056 | | | | 1,329 | |
Net periodic benefit cost (credit) | | $ | (7,663 | ) | | $ | (8,197 | ) | | $ | (5,105 | ) |
| | | | | | | | | | | | |
| | | | | | | | | | | | |
Actual return on plan assets | | $ | (215,237 | ) | | $ | 26,046 | | | $ | 86,248 | |
| | Actual return on plan assets | |
| | Actual return on plan assets | |
Employer contributions | | $ | 4,206 | | | $ | 4,493 | | | $ | 6,708 | |
Benefits paid | | $ | 29,357 | | | $ | 29,327 | | | $ | 30,272 | |
Other changes in plan assets and benefit obligations recognized in AOCI (excluding tax expense (benefit) of $(4,443), $13,521 and $(564), during the years ended December 31, 2022, 2021 and 2020, respectively): | | | | | | | | | | | | |
| Other changes in plan assets and benefit obligations recognized in AOCI (excluding tax expense (benefit) of $(8,703), $(4,443) and $13,521 during the years ended December 31, 2023, 2022 and 2021, respectively): | |
Net actuarial (gain) loss | | $ | 31,174 | | | $ | (40,717 | ) | | $ | (4,085 | ) |
| Net actuarial (gain) loss | |
| Net actuarial (gain) loss | |
| Prior service cost | |
Reclassification of prior service (cost) credit to earnings | | | (106 | ) | | | (118 | ) | | | (111 | ) |
Reclassification of actuarial gain (loss) to earnings | | | (5,040 | ) | | | (7,151 | ) | | | (7,411 | ) |
Currency translation and other adjustments | | | (13,783 | ) | | | (5,860 | ) | | | 9,142 | |
Total recognized in AOCI | | $ | 12,245 | | | $ | (53,846 | ) | | $ | (2,465 | ) |
Net amount recognized in total periodic benefit cost and AOCI | | $ | 4,582 | | | $ | (62,043 | ) | | $ | (7,570 | ) |
112
NOTES TO CONSOLIDATED FINANCIAL STATEMENTS—(Continued)
(dollars in thousands, unless otherwise noted)
The assumptions used to develop actuarial present value of the projected benefit obligation and net periodic pension cost as of or for the years ended December 31,
2023, 2022
2021 and
20202021 are set forth below:
| | Pension Plans | |
| | December 31, | |
| | 2022 | | | 2021 | | | 2020 | |
Weighted average assumptions used to determine benefit obligations: | | | | | | | | | | | | |
Discount rate | | | 4.7 | % | | | 1.8 | % | | | 1.3 | % |
Weighted average assumptions used to determine net periodic benefit cost: | | | | | | | | | | | | |
Discount rate | | | 2.1 | % | | | 1.1 | % | | | 1.6 | % |
Expected long-term rate of return on plan assets | | | 3.4 | % | | | 3.3 | % | | | 3.9 | % |
| | | | | | | | | | | | | | | | | |
| Pension Plans
December 31, |
| 2023 | | 2022 | | 2021 |
| Weighted average assumptions used to determine benefit obligations: | | | | | |
| Discount rate | 4.4 | % | | 4.7 | % | | 1.8 | % |
| Weighted average assumptions used to determine net periodic benefit cost: | | | | | |
| Discount rate | 4.3 | % | | 2.1 | % | | 1.1 | % |
| Expected long-term rate of return on plan assets | 5.1 | % | | 3.4 | % | | 3.3 | % |
Generally, the Company determined the discount rates for its defined benefit plans by utilizing indices for long-term, high-quality bonds and ensuring that the discount rate does not exceed the yield reported for those indices after adjustment for the duration of the plans’ liabilities.
In selecting the expected long-term rate of return on plan assets, the Company considered the average rate of earnings expected on the funds invested or to be invested to provide for the benefits of the plan, giving consideration to expected returns on different asset classes held by the plans in light of prevailing economic conditions as well as historical returns. This basis is consistent for all years presented.
Expected Benefit Payments—The following table summarizes the expected benefit payments for the Company’s pension plans for each of the next five fiscal years and in the aggregate for the five fiscal years thereafter: | | Pension | |
| | Plans | |
2023 | | $ | 25,144 | |
| Pension
Plans | | | Pension
Plans |
2024 | | | 27,605 | |
2025 | | | 27,037 | |
2026 | | | 27,459 | |
2027 | | | 27,777 | |
2028-2032 | | | 140,985 | |
| 2028 | |
| 2029-2033 | |
113
NOTES TO CONSOLIDATED FINANCIAL STATEMENTS—(Continued)
(dollars in thousands, unless otherwise noted)
Plan Assets—The following tables present the categorization of our pension plans’ assets as of December 31, 20222023 and 2021,2022, measured at fair value, into a fair value hierarchy and investments measured at NAV or its equivalent as a practical expedient in accordance with fair value measurement disclosure requirements: | | As of December 31, 2022 | |
| | Level 1 | | | Level 2 | | | Level 3 | | | NAV (a) | | | Total | |
| As of December 31, 2023 | | | As of December 31, 2023 |
| Level 1 | | | Level 1 | | Level 2 | | Level 3 | | NAV (a) | | Total |
Assets: | | | | | | | | | | | | | | | | | | | | |
| Cash | |
| Cash | |
Cash | | $ | 18,084 | | | $ | - | | | $ | - | | | $ | - | | | $ | 18,084 | |
Debt | | | 79,505 | | | | - | | | | - | | | | - | | | | 79,505 | |
Equities | | | 15,480 | | | | - | | | | - | | | | - | | | | 15,480 | |
Funds: | | | | | | | | | | | | | | | | | | | | |
Alternative investments | | | - | | | | - | | | | - | | | | 9,113 | | | | 9,113 | |
| Alternative investments | |
| Alternative investments | |
Debt | | | 6,350 | | | | - | | | | - | | | | 220,141 | | | | 226,491 | |
Equity | | | 49,041 | | | | 49,297 | | | | - | | | | 7,138 | | | | 105,476 | |
Other | | | - | | | | 14,723 | | | | - | | | | - | | | | 14,723 | |
Total | | $ | 168,460 | | | $ | 64,020 | | | $ | - | | | $ | 236,392 | | | $ | 468,872 | |
| | As of December 31, 2021 | |
| | Level 1 | | | Level 2 | | | Level 3 | | | NAV (a) | | | Total | |
| As of December 31, 2022 | | | As of December 31, 2022 |
| Level 1 | | | Level 1 | | Level 2 | | Level 3 | | NAV (a) | | Total |
Assets: | | | | | | | | | | | | | | | | | | | | |
| Cash | |
| Cash | |
Cash | | $ | 11,036 | | | $ | - | | | $ | - | | | $ | - | | | $ | 11,036 | |
Debt | | | 84,005 | | | | - | | | | - | | | | - | | | | 84,005 | |
Equities | | | 43,174 | | | | - | | | | - | | | | - | | | | 43,174 | |
Funds: | | | | | | | | | | | | | | | | | | | | |
Alternative investments | | | - | | | | - | | | | - | | | | 17,758 | | | | 17,758 | |
| Alternative investments | |
| Alternative investments | |
Debt | | | 10,990 | | | | 81,417 | | | | - | | | | 318,316 | | | | 410,723 | |
Equity | | | 141,390 | | | | 60,118 | | | | - | | | | 11,090 | | | | 212,598 | |
Other | | | - | | | | 3,169 | | | | - | | | | - | | | | 3,169 | |
Total | | $ | 290,595 | | | $ | 144,704 | | | $ | - | | | $ | 347,164 | | | $ | 782,463 | |
(a)
| Represents certain investments measured at NAV or its equivalent as a practical expedient in determining fair value. In accordance with current accounting guidance, these investments have not been classified in the fair value hierarchy.
|
_____________________(a)Represents certain investments measured at NAV or its equivalent as a practical expedient in determining fair value. In accordance with current accounting guidance, these investments have not been classified in the fair value hierarchy.
Included in equity funds are
$54,810$63,927 and
$68,529$54,810 as of December 31,
20222023 and
2021,2022, respectively, that are invested in funds managed by the Company.
Consistent with the plans’ investment strategies, at December 31,
20222023 and
2021,2022, the Company’s U.S. pension plan had
57%50% and
54%57%, respectively, of the plans’ assets invested in equity funds in Level 1 and measured at NAV or its equivalent as a practical expedient,
42%47% and
46%42%, respectively, invested in Level 1 debt funds, and at December 31,
2023 and 2022,
3% and 1%
was, respectively, invested in cash, which is a Level 1 asset. The Company’s non-U.S. pension plans at December 31,
2023 and 2022
had 26% and
2021 had 25%
and 32%, respectively, of the plans’ assets invested in equities and equity funds that are primarily Level 1 and Level 2 assets;
66%70% and
64%66%, respectively, of the plans’ assets invested in debt and debt funds that are Level 1,
and Level 2
assets orand measured at NAV or its equivalent as a practical expedient, and
9%4% and
4%9%, respectively, of the plans’ assets invested in cash, which is a Level 1 asset, other investments, which is a Level 2 asset, or in alternative investment funds that are primarily measured at NAV.
LAZARD GROUP LLC
NOTES TO CONSOLIDATED FINANCIAL STATEMENTS—(Continued)
(dollars in thousands, unless otherwise noted)
Investment Policies and Strategies—The primary investment goal is to ensure that the pension plans remain well funded, taking account of the likely future risks to investment returns and contributions. As a result, a portfolio of assets is maintained with appropriate liquidity and diversification that can be expected to generate long-term future returns that minimize the long-term costs of the pension plans without exposing the plans to an unacceptable risk of under-funding. The Company’s likely future ability to pay such contributions as are required to maintain the114
LAZARD GROUP LLC
NOTES TO CONSOLIDATED FINANCIAL STATEMENTS—(Continued)
(dollars in thousands, unless otherwise noted)
funded status of the plans over a reasonable time period is considered when determining the level of risk that is appropriate. The fair value of plan investments classified as Level 1 assets are based on market quotes. The fair value of plan investments classified as Level 2 assets are based on (i) quoted prices for similar assets or liabilities in an active market, or quoted prices for identical or similar assets or liabilities in non-active markets, or (ii) inputs other than quoted prices that are directly observable or derived principally from, or corroborated by, market data. The fair value of plan investments measured at NAV or its equivalent as a practical expedient is determined based on information provided by external fund administrators and such investments are redeemable in the near term.
Defined Contribution Plans—Pursuant to certain matching contributions, the Company contributes to employer sponsored defined contribution plans. Such contributions amounted to $22,190, $19,636 $17,764 and $16,627$17,764 for the years ended December 31, 2023, 2022 2021 and 2020,2021, respectively, which are included in “compensation and benefits” expense on the consolidated statements of operations.
18. COST-SAVING INITIATIVES
The Company conducted firm-wide cost-saving initiatives that will continue through the first quarter of 2024.
Expenses and losses associated with the cost-saving initiatives for the year ended December 31, 2023 consisted of the following:
| | | | | | | | | | | | | | | | | | | | | | | |
| Year Ended December 31, 2023 |
| Financial Advisory | | Asset Management | | Corporate | | Total |
Severance and other employee
termination expenses (included
in "compensation and benefits"
expense) | $ | 94,457 | | | $ | 49,152 | | | $ | 34,732 | | | $ | 178,341 | |
Technology asset impairments
(included in "technology and
information services") | 144 | | | 7,877 | | | – | | | 8,021 | |
Foreign exchange related losses
associated with closing
of certain offices (included in
"revenue-other") | 2,411 | | | – | | | 3,054 | | | 5,465 | |
| Other | 2,230 | | | 470 | | | 2,291 | | | 4,991 | |
| Total | $ | 99,242 | | | $ | 57,499 | | | $ | 40,077 | | | $ | 196,818 | |
LAZARD GROUP LLC
NOTES TO CONSOLIDATED FINANCIAL STATEMENTS—(Continued)
(dollars in thousands, unless otherwise noted)
Additional compensation and benefits expense of approximately $40,000 was incurred in the first quarter of 2024.
Activity related to the obligations pursuant to the cost-saving initiatives during the year ended December 31, 2023 was as follows:
| | | | | | | | | | | | | | | | | |
| Accrued Compensation and Benefits | | Other | | Total |
| Balance, January 1, 2023 | $ | – | | | $ | – | | | $ | – | |
| Total expenses | 178,341 | | | 18,477 | | | 196,818 | |
| Less: | | | | | |
| Noncash expenses (a) | 32,757 | | | 11,213 | | | 43,970 | |
| Payments and settlements | 94,238 | | | 6,312 | | | 100,550 | |
| Balance, December 31, 2023 | $ | 51,346 | | | $ | 952 | | | $ | 52,298 | |
(a)Noncash expenses reflected in “accrued compensation and benefits” activity principally represents accelerated amortization of deferred incentive compensation awards. Noncash expenses reflected in “other” activity principally relates to technology asset impairments and certain foreign exchange related losses.
19. INCOME TAXES
Although a portion of Lazard
Group'sGroup’s income is subject to U.S. federal income taxes, Lazard Group primarily operates in the U.S. as a limited liability company that is treated as a partnership for U.S. federal income tax purposes. As a result, Lazard
Group'sGroup’s income from its U.S. operations is generally not subject to U.S. federal income taxes because such income is attributable to its partners. Lazard Group, through its subsidiaries, is subject to state and local taxes on its income apportioned to various state and local jurisdictions. Outside the U.S., Lazard Group operates principally through subsidiary corporations that are subject to local income taxes in foreign jurisdictions. Lazard Group is also subject to Unincorporated Business Tax (“UBT”) attributable to its operations apportioned to New York City.
LAZARD GROUP LLC
NOTES TO CONSOLIDATED FINANCIAL STATEMENTS—(Continued)
(dollars in thousands, unless otherwise noted)
The components of the Company’s provision for income taxes for the years ended December 31,
2023, 2022
2021 and
2020,2021, and a reconciliation of the U.S. federal statutory income tax rate to the Company’s effective tax rates for such years, are shown below.
| | Year Ended December 31, | |
| | 2022 | | | 2021 | | | 2020 | |
| Year Ended December 31, | | | Year Ended December 31, |
| 2023 | | | 2023 | | 2022 | | 2021 |
Current: | | | | | | | | | | | | |
| Federal | |
| Federal | |
Federal | | $ | 248 | | | $ | (3,808 | ) | | $ | 2,207 | |
Foreign | | | 71,800 | | | | 98,142 | | | | 44,255 | |
State and local | | | 5,810 | | | | 1,495 | | | | 3,025 | |
Total current | | | 77,858 | | | | 95,829 | | | | 49,487 | |
Deferred: | | | | | | | | | | | | |
Federal | | | 5 | | | | 82 | | | | 95 | |
| Federal | |
| Federal | |
Foreign | | | 3,299 | | | | 5,081 | | | | 8,480 | |
State and local | | | 491 | | | | 695 | | | | (1,498 | ) |
Total deferred | | | 3,795 | | | | 5,858 | | | | 7,077 | |
Total | | $ | 81,653 | | | $ | 101,687 | | | $ | 56,564 | |
| | Year Ended December 31, | |
| | 2022 | | | 2021 | | | 2020 | |
| Year Ended December 31, | | | Year Ended December 31, |
| 2023 | | | 2023 | | 2022 | | 2021 |
U.S. federal statutory income tax rate | | | 21.0 | % | | | 21.0 | % | | | 21.0 | % | U.S. federal statutory income tax rate | 21.0 | % | | 21.0 | % | | 21.0 | % |
Rate benefit for U.S. Partnership operations | | | (21.0 | ) | | | (21.0 | ) | | | (21.0 | ) |
Foreign taxes | | | 15.0 | | | | 13.3 | | | | 9.6 | |
State and local taxes | | | 1.0 | | | | 0.7 | | | | 0.5 | |
Uncertain tax positions | | | (0.3 | ) | | | (0.3 | ) | | | 0.6 | |
Other | | | - | | | | (0.5 | ) | | | 0.3 | |
Effective income tax rate | | | 15.7 | % | | | 13.2 | % | | | 11.0 | % | Effective income tax rate | (44.5 | %) | | 15.7 | % | | 13.2 | % |
|
115
LAZARD GROUP LLC
NOTES TO CONSOLIDATED FINANCIAL STATEMENTS—(Continued)
(dollars in thousands, unless otherwise noted)
See Note
2022 regarding “operating income (loss)” by geographic region.
LAZARD GROUP LLC
NOTES TO CONSOLIDATED FINANCIAL STATEMENTS—(Continued)
(dollars in thousands, unless otherwise noted)
Deferred income taxes are provided for the effects of temporary differences between the tax basis of an asset or liability and its reported amount in the consolidated statements of financial condition. These temporary differences result in taxable or deductible amounts in future years. Details of the Company’s deferred tax assets and liabilities are as follows:
| | December 31, | |
| | 2022 | | | 2021 | |
| December 31, | | | December 31, |
| 2023 | | | 2023 | | 2022 |
Deferred Tax Assets: | | | | | | | | |
| Basis adjustments (a) | |
| Basis adjustments (a) | |
Basis adjustments (a) | | $ | 22 | | | $ | 68 | |
Compensation and benefits | | | 63,334 | | | | 73,902 | |
Net operating loss and tax credit carryforwards | | | 76,509 | | | | 72,777 | |
Depreciation and amortization | | | 1,168 | | | | 5,534 | |
Other | | | 8,254 | | | | 4,432 | |
Gross deferred tax assets | | | 149,287 | | | | 156,713 | |
Valuation allowance | | | (80,347 | ) | | | (79,129 | ) |
Deferred tax assets (net of valuation allowance) | | | 68,940 | | | | 77,584 | |
Deferred Tax Liabilities: | | | | | | | | |
Depreciation and amortization | | | 4,476 | | | | 5,373 | |
| Depreciation and amortization | |
| Depreciation and amortization | |
Compensation and benefits | | | 22,927 | | | | 32,189 | |
Goodwill | | | 1,512 | | | | 836 | |
Other | | | 6,344 | | | | 9,087 | |
Deferred tax liabilities | | | 35,259 | | | | 47,485 | |
Net deferred tax assets | | $ | 33,681 | | | $ | 30,099 | |
(a)
| The basis adjustments recorded as of December 31, 2022 and 2021 are primarily the result of additional basis from acquisitions of interests.
|
_____________________(a)The basis adjustments recorded as of December 31, 2023 and 2022 are primarily the result of additional basis from acquisitions of interests.
The historical profitability of each tax-paying entity is an important factor in determining whether to record a valuation allowance and when to release any such allowance. Certain of our tax-paying entities have individually experienced losses on a cumulative three year basis or have tax attributes that may expire unused. In addition, some of our tax-paying entities have recorded a valuation allowance on substantially all of their deferred tax assets due to the combined effect of operating losses in certain subsidiaries of these entities as well as foreign taxes that together substantially offset any U.S. tax liability. Taking into account all available information, we cannot determine that it is more likely than not that deferred tax assets held by these entities will be realized. Consequently, we have recorded valuation allowances on
$80,347$79,127 and
$79,129$80,347 of deferred tax assets held by these entities as of December 31,
2023 and 2022,
and 2021, respectively.
Changes in the deferred tax assets valuation allowance for the years ended December 31,
2023, 2022
2021 and
20202021 was as follows:
| | Year Ended December 31, | |
| | 2022 | | | 2021 | | | 2020 | |
Beginning Balance | | $ | 79,129 | | | $ | 76,728 | | | $ | 70,429 | |
Charged (credited) to provision for income taxes | | | 6,844 | | | | 4,400 | | | | 5,173 | |
Charged (credited) to other comprehensive income and other | | | (5,626 | ) | | | (1,999 | ) | | | 1,126 | |
Ending Balance | | $ | 80,347 | | | $ | 79,129 | | | $ | 76,728 | |
| | | | | | | | | | | | | | | | | |
| Year Ended December 31, |
| 2023 | | 2022 | | 2021 |
| Beginning Balance | $ | 80,347 | | | $ | 79,129 | | | $ | 76,728 | |
| Charged (credited) to provision for income taxes | (474) | | | 6,844 | | | 4,400 | |
| Charged (credited) to other comprehensive income and other | (746) | | | (5,626) | | | (1,999) | |
| Ending Balance | $ | 79,127 | | | $ | 80,347 | | | $ | 79,129 | |
116
NOTES TO CONSOLIDATED FINANCIAL STATEMENTS—(Continued)
(dollars in thousands, unless otherwise noted)
The Company had net operating loss and tax credit carryforwards for which related deferred tax assets of
$76,509$80,795 were recorded at December 31,
20222023 primarily relating to:
| (i)
| indefinite-lived net operating loss carryforwards (subject to various limitations) of approximately $20,000 in Australia, Germany, Hong Kong, Saudi Arabia, Singapore; and
|
| (ii)(i)indefinite-lived net operating loss carryforwards (subject to various limitations) of approximately $27,000 in Australia, Brazil, Germany, Hong Kong, Luxembourg, Saudi Arabia, Singapore; and
| certain carryforwards of approximately $51,000 in the U.S. Foreign Tax Credits of $5,600 begin expiring in 2024 and is fully offset by a valuation allowance.
|
(ii)carryforwards of approximately $47,000 that expire in different periods, includingU.S. foreign tax credits of $5,600 that begin to expire in 2024 and are fully offset by a valuation allowance.
With few exceptions, the Company is no longer subject to income tax examination by foreign tax authorities and by U.S. federal, state and local tax authorities for years prior to
2014.2017. While the Company is under examination in various tax jurisdictions with respect to certain open years, the Company does not expect that the result of any final determination related to these examinations will have a material impact on its financial statements. Developments with respect to such examinations are monitored on an ongoing basis and adjustments to tax liabilities are made as appropriate.
A reconciliation of the beginning to the ending amount of gross unrecognized tax benefits (excluding interest and penalties) for the years ended December 31,
2023, 2022
2021 and
20202021 is as follows:
| | Year Ended December 31, | |
| | 2022 | | | 2021 | | | 2020 | |
Balance, January 1 (excluding interest and penalties of $18,442, $18,745 and $18,161, respectively) | | $ | 53,507 | | | $ | 55,725 | | | $ | 60,838 | |
| Year Ended December 31, | | | Year Ended December 31, |
| 2023 | | | 2023 | | 2022 | | 2021 |
| Balance, January 1 (excluding interest and penalties of $17,855, $18,442 and $18,745, respectively) | |
Increases in gross unrecognized tax benefits relating to tax positions taken during: | | | | | | | | | | | | |
| Prior years | |
| Prior years | |
Prior years | | | 257 | | | | 165 | | | | 1,215 | |
Current year | | | 13,273 | | | | 11,841 | | | | 9,516 | |
Decreases in gross unrecognized tax benefits relating to: | | | | | | | | | | | | |
Tax positions taken during prior years | | | (975 | ) | | | (5,774 | ) | | | (9,814 | ) |
| Tax positions taken during prior years | |
| Tax positions taken during prior years | |
Settlements with tax authorities | | | (43 | ) | | | (134 | ) | | | (904 | ) |
Lapse of the applicable statute of limitations | | | (13,142 | ) | | | (8,316 | ) | | | (5,126 | ) |
Balance, December 31 (excluding interest and penalties of $17,855, $18,442 and $18,745, respectively) | | $ | 52,877 | | | $ | 53,507 | | | $ | 55,725 | |
| Balance, December 31 (excluding interest and penalties of $18,446, $17,855 and $18,442, respectively) | |
Additional information with respect to unrecognized tax benefits is as follows:
| | Year Ended December 31, | |
| | 2022 | | | 2021 | | | 2020 | |
Unrecognized tax benefits at the end of the year that, if recognized, would favorably affect the effective tax rate (includes interest and penalties of $17,855, $18,442, and $18,745, respectively) | | $ | 59,202 | | | $ | 61,452 | | | $ | 64,868 | |
Unrecognized tax benefits that, if recognized, would not affect the effective tax rate | | $ | 11,530 | | | $ | 10,497 | | | $ | 9,602 | |
Interest and penalties recognized in current income tax expense (after giving effect to the reversal of interest and penalties of $6,344, $5,210 and $3,679, respectively) | | $ | (587 | ) | | $ | (303 | ) | | $ | 584 | |
| | | | | | | | | | | | | | | | | |
| Year Ended December 31, |
| 2023 | | 2022 | | 2021 |
| Unrecognized tax benefits at the end of the year that, if recognized, would favorably affect the effective tax rate (includes interest and penalties of $18,446, $17,855 and $18,442, respectively) | $ | 60,225 | | | $ | 59,202 | | | $ | 61,452 | |
| Unrecognized tax benefits that, if recognized, would not affect the effective tax rate | $ | 12,208 | | | $ | 11,530 | | | $ | 10,497 | |
| Interest and penalties recognized in current income tax expense (after giving effect to the reversal of interest and penalties of $5,446, $6,344 and $5,210, respectively) | $ | 591 | | | $ | (587) | | | $ | (303) | |
117
LAZARD GROUP LLC
NOTES TO CONSOLIDATED FINANCIAL STATEMENTS—(Continued)
(dollars in thousands, unless otherwise noted)
The Company anticipates that it is reasonably possible that approximately
$12,100$9,700 of unrecognized tax benefits, including interest and penalties recorded at December 31,
2022,2023, may be recognized within 12 months as a result of the lapse of the statute of limitations in various tax jurisdictions.
LAZARD GROUP LLC
NOTES TO CONSOLIDATED FINANCIAL STATEMENTS—(Continued)
(dollars in thousands, unless otherwise noted)
20. RELATED PARTIES
Receivable from and Payable to Lazard Ltd Subsidiaries
The partial settlement of the interest-bearing loans as of December 31, 2021 of $10,536 reflects the transfer of 241,235 shares of common stock from Lazard Group to a subsidiary of Lazard Ltd. Such amount was reflected in members’ equity as of December 31, 2021 and was a non-cash transaction.
In the first quarter of 2020, a subsidiary of Lazard Ltd contributed an interest-bearing intercompany loan, including interest thereon, of $55,941 due from a Lazard Group subsidiary to Lazard Group. Such amount was reflected in members’ equity as of December 31, 2020 and was a non-cash transaction.
The Company serves as an investment advisor for certain affiliated investment companies and fund entities and receives management fees and, for the alternative investment funds, performance-based incentive fees for providing such services.
Investment advisoryAsset management fees relating to such services were
$538,457, $592,985
$708,900 and
$564,686$708,900 for the years ended December 31,
2023, 2022
2021 and
2020,2021, respectively, and are included in “asset management fees” on the consolidated statements of operations. Of such amounts,
$57,283$67,598 and
$96,740$57,283 remained as receivables at December 31,
20222023 and
2021,2022, respectively, and are included in “fees receivable” on the consolidated statements of financial condition.
See Note
1415 for information regarding related party transactions pertaining to shares repurchased from certain of our executive officers.
19.
| REGULATORY AUTHORITIES
|
21. REGULATORY AUTHORITIES
LFNY is a U.S. registered broker-dealer and is subject to the net capital requirements of Rule 15c3-1 under the Exchange Act. Under the basic method permitted by this rule, the minimum required net capital, as defined, is a specified fixed percentage
(6(6 2/3%3%) of total aggregate indebtedness recorded in LFNY’s Financial and Operational Combined Uniform Single (“FOCUS”) report filed with the Financial Industry Regulatory Authority (“FINRA”), or $5, whichever is greater. In addition, the ratio of aggregate indebtedness (as defined) to net capital may not exceed 15:1. At December 31,
2022, LFNY’s2023, LFNY exceeded its minimum requirement for regulatory net capital
of $6,529, and was
$110,275, which exceeded the minimum requirement by $105,521. LFNY’sin compliance with its aggregate indebtedness to net capital ratio
was 0.64:1 as of December 31, 2022.requirement.
Certain U.K. subsidiaries of the Company, including LCL, Lazard Fund Managers Limited and Lazard Asset Management Limited (collectively, the “U.K. Subsidiaries”) are regulated by the Financial Conduct Authority. At December 31,
2022,2023, the aggregate regulatory net capital of the U.K. Subsidiaries was
$176,397,$220,204, which exceeded the minimum requirement by
$119,088.$154,383.
CFLF, under which asset management and commercial banking activities are carried out in France, is subject to regulation by the Autorité de Contrôle Prudentiel et de Résolution (“ACPR”) for its banking activities conducted through its subsidiary, LFB. LFB, as a registered bank, is engaged primarily in commercial and private banking services for clients and funds managed by LFG (asset management) and other clients, and asset-liability management. The investment services activities exercised through LFB and other subsidiaries of CFLF, primarily LFG, also are subject to regulation and supervision by the Autorité des Marchés Financiers. At December 31,
2022,2023, the consolidated regulatory net capital of CFLF was
$152,442,$156,703, which exceeded the minimum requirement set for regulatory capital levels by
$74,403.$62,519. In addition, pursuant to the consolidated supervision rules in the European
118
LAZARD GROUP LLC
NOTES TO CONSOLIDATED FINANCIAL STATEMENTS—(Continued)
(dollars in thousands, unless otherwise noted)
Union, LFB, in particular, as a French credit institution, is required to be supervised by a regulatory body, either in the U.S. or in the European Union. During the third quarter ofIn 2013, the Company and the ACPR agreed on terms for the consolidated supervision of LFB and certain other non-Financial Advisory European subsidiaries of the Company (referred to herein, on a combined basis, as the “combined European regulated group”) under such rules. Under this supervision, the combined European regulated group is required to comply with minimum requirements for regulatory net capital to be reported on a quarterly basis and satisfy periodic financial and other reporting obligations.capital. At December 31, 2022,2023, the regulatory net capital of the combined European regulated group was $176,343,$181,665, which exceeded the minimum requirement set for regulatory capital levels by $89,905.$78,796. Additionally, the combined European regulated group, together with our European Financial Advisory entities, is required to perform an annual risk assessment and provide certain other information on a periodic basis, including financial reports and information relating to financial performance, balance sheet data and capital structure.
basis.
Certain other U.S. and non-U.S. subsidiaries are subject to various capital adequacy requirements promulgated by various regulatory and exchange authorities in the countries in which they operate. At December 31, 2022,2023, for those
LAZARD GROUP LLC
NOTES TO CONSOLIDATED FINANCIAL STATEMENTS—(Continued)
(dollars in thousands, unless otherwise noted)
subsidiaries with regulatory capital requirements, their aggregate net capital was
$189,167,$143,682, which exceeded the minimum required capital by
$162,010.$120,239.
At December 31,
2022,2023, each of these subsidiaries individually was in compliance with its regulatory capital requirements.
22. SEGMENT INFORMATION
The Company’s reportable segments offer different products and services and are managed separately, as different levels and types of expertise are required to effectively manage the segments’ transactions. Each segment is reviewed to determine the allocation of resources and to assess its performance. The Company’s principal operating activities are included in its Financial Advisory and Asset Management business segments as described in Note 1. In addition, as described in Note 1, the Company records selected other activities in its Corporate segment.
The Company’s segment information for the years ended December 31,
2023, 2022
2021 and
20202021 is prepared using the following methodology:
| •
| Revenue and expenses directly associated with each segment are included in determining operating income.
|
| •Revenue and expenses directly associated with each segment are included in determining operating income.• | Expenses not directly associated with specific segments are allocated based on the most relevant measures applicable, including headcount, square footage and other factors.
|
| •
| Segment assets are based on those directly associated with each segment, and include an allocation of certain assets relating to various•Expenses not directly associated with specific segments are allocated based on the most relevant measures applicable, including revenue, headcount, square footage and other factors.
|
•Segment assets are based on those directly associated with each segment, and include an allocation of certain assets relating to various segments, based on the most relevant measures applicable, including headcount, square footage and other factors.
The Company records other revenue, interest income and interest expense among the various segments based on the segment in which the underlying asset or liability is reported.
Each segment’s operating expenses include (i) compensation and benefits expenses incurred directly in support of the businesses and (ii) other operating expenses, which include directly incurred expenses for occupancy and equipment, marketing and business development, technology and information services, professional services, fund administration and outsourced services and indirect support costs (including compensation and other operating expenses related thereto) for administrative services. Such administrative services include, but are not limited to, accounting, tax, human resources, legal,
information technology, facilities management and senior management activities.
For the years ended December 31,
2023, 2022
2021 and
2020,2021, no individual client constituted more than 10% of the net revenue of any of the Company’s business segments.
119
NOTES TO CONSOLIDATED FINANCIAL STATEMENTS—(Continued)
(dollars in thousands, unless otherwise noted)
Management evaluates segment results based on net revenue and operating income (loss) and believes that the following information provides a reasonable representation of each segment’s contribution with respect to net revenue, operating income (loss) and total assets:
| | | | As of or for the Year Ended December 31, | |
| | | | 2022 | | | 2021 | | | 2020 | |
| | Year Ended December 31, | | | | Year Ended December 31, |
| | 2023 | | | | 2023 | | 2022 | | 2021 |
Financial Advisory | | Net Revenue | | $ | 1,655,596 | | | $ | 1,794,132 | | | $ | 1,420,042 | |
| | Operating Expenses (a) | | | 1,292,382 | | | | 1,345,849 | | | | 1,122,002 | |
| | Operating Income | | $ | 363,214 | | | $ | 448,283 | | | $ | 298,040 | |
| | Total Assets | | $ | 1,074,278 | | | $ | 1,217,654 | | | $ | 1,157,844 | |
| Operating Expenses (a) | |
| Operating Income (Loss) | |
Asset Management | | Net Revenue | | $ | 1,204,927 | | | $ | 1,424,985 | | | $ | 1,167,466 | |
| | Operating Expenses (a) | | | 963,640 | | | | 1,032,825 | | | | 861,031 | |
| | Operating Income | | $ | 241,287 | | | $ | 392,160 | | | $ | 306,435 | |
| | Total Assets | | $ | 978,083 | | | $ | 1,128,549 | | | $ | 958,588 | |
| Operating Expenses (a) | |
| Operating Income | |
Corporate | | Net Revenue (Loss) | | $ | (96,234 | ) | | $ | 4,092 | | | $ | (21,968 | ) |
| | Operating Expenses (Credit) (a) | | | (12,534 | ) | | | 73,872 | | | | 68,836 | |
| | Operating Loss | | $ | (83,700 | ) | | $ | (69,780 | ) | | $ | (90,804 | ) |
| | Total Assets | | $ | 3,409,438 | | | $ | 4,394,179 | | | $ | 3,399,315 | |
| Operating Expenses (Credit) (a) | |
| Operating Loss | |
Total | | Net Revenue | | $ | 2,764,289 | | | $ | 3,223,209 | | | $ | 2,565,540 | |
| | Operating Expenses (a) | | | 2,243,488 | | | | 2,452,546 | | | | 2,051,869 | |
| | Operating Income | | $ | 520,801 | | | $ | 770,663 | | | $ | 513,671 | |
| | Total Assets | | $ | 5,461,799 | | | $ | 6,740,382 | | | $ | 5,515,747 | |
| Operating Expenses (a) | |
| Operating Income (Loss) | |
(a) | Operating expenses include depreciation and amortization of property as set forth in table below. |
| | Year Ended December 31, | |
| | 2022 | | | 2021 | | | 2020 | |
| Year Ended December 31, | | | Year Ended December 31, |
| 2023 | | | 2023 | | 2022 | | 2021 |
Financial Advisory | | $ | 8,669 | | | $ | 8,180 | | | $ | 5,795 | |
Asset Management | | | 9,390 | | | | 5,618 | | | | 3,730 | |
Corporate | | | 23,978 | | | | 24,216 | | | | 25,261 | |
Total | | $ | 42,037 | | | $ | 38,014 | | | $ | 34,786 | |
| | | | | | | | | | | |
| December 31, |
| 2023 | | 2022 |
| Total Assets | | | |
| Financial Advisory | $ | 1,131,657 | | | $ | 1,074,278 | |
| Asset Management (b) | 1,232,364 | | | 1,786,830 | |
| Corporate (b) | 1,866,304 | | | 2,600,691 | |
| Total | $ | 4,230,325 | | | $ | 5,461,799 | |
_____________________(b)Effective December 31, 2023, certain assets, primarily “deposits with banks and short-term investments”, previously reported in the Corporate segment are reported in the Asset Management segment resulting from a change in the segment in which such assets are managed. Comparable prior year information has been recast to reflect the updated presentation.
Due to the highly integrated nature of international financial markets, the Company manages its business based on the profitability of the enterprise as a whole, not by geographic region. The Company’s revenue and
identifiabletotal assets are generally allocated based on the country or domicile of the legal entity providing the service.
120
NOTES TO CONSOLIDATED FINANCIAL STATEMENTS—(Continued)
(dollars in thousands, unless otherwise noted)
The following table sets forth the net revenue from, and
identifiabletotal assets for, the Company and its consolidated subsidiaries by geographic region allocated on the basis described above. In the table below, Americas principally includes the U.S., EMEA principally includes the U.K. and France, and Asia Pacific principally includes Australia.
| | As of or for the Year Ended December 31, | |
| | 2022 | | | 2021 | | | 2020 | |
| Year Ended December 31, | | | Year Ended December 31, |
| 2023 | | | 2023 | | 2022 | | 2021 |
Net Revenue: | | | | | | | | | | | | |
| Americas | |
| Americas | |
Americas | | $ | 1,477,774 | | | $ | 1,810,976 | | | $ | 1,529,501 | |
EMEA | | | 1,136,636 | | | | 1,251,058 | | | | 885,925 | |
Asia Pacific | | | 149,879 | | | | 161,175 | | | | 150,114 | |
Total | | $ | 2,764,289 | | | $ | 3,223,209 | | | $ | 2,565,540 | |
Operating Income: | | | | | | | | | | | | |
Americas | | $ | 239,593 | | | $ | 446,731 | | | $ | 373,976 | |
EMEA | | | 248,404 | | | | 295,991 | | | | 109,991 | |
Asia Pacific | | | 32,804 | | | | 27,941 | | | | 29,704 | |
Total | | $ | 520,801 | | | $ | 770,663 | | | $ | 513,671 | |
Identifiable Assets: | | | | | | | | | | | | |
| Americas | |
Americas | | $ | 3,067,477 | | | $ | 3,604,272 | | | $ | 2,667,985 | |
EMEA | | | 2,218,147 | | | | 2,933,180 | | | | 2,534,172 | |
Asia Pacific | | | 176,175 | | | | 202,930 | | | | 313,590 | |
Total | | $ | 5,461,799 | | | $ | 6,740,382 | | | $ | 5,515,747 | |
| | | | | | | | | | | | | December 31, | | 2023 | | 2022 | | Total Assets: | | | | | Americas | $ | 2,403,506 | | | $ | 3,067,477 | | | EMEA | 1,679,644 | | | 2,218,147 | | | Asia Pacific | 147,175 | | | 176,175 | | | Total | $ | 4,230,325 | | | $ | 5,461,799 | |
23. CONSOLIDATED VIEs 21.
| CONSOLIDATED VIEs
|
The Company’s consolidated VIEs as of December 31, 2022 and 2021 include LGAC (see Note 1) and as of December 31, 2023 and 2022 include certain funds (“LFI Consolidated Funds”) that were established for the benefit of employees participating in the Company’s existing LFI deferred compensation arrangement. Lazard invests in these funds and is the investment manager and is therefore deemed to have both the power to direct the most significant activities of the funds and the right to receive benefits (or the obligation to absorb losses) that could potentially be significant to these funds. The assets of LFI Consolidated Funds, except as it relates to $113,174 and $115,666 and $140,371 of LFI held by Lazard Group as of December 31, 20222023 and 2021,2022, respectively, can only be used to settle the obligations of LFI Consolidated Funds. The
LAZARD GROUP LLC
NOTES TO CONSOLIDATED FINANCIAL STATEMENTS—(Continued)
(dollars in thousands, unless otherwise noted)
Company’s consolidated VIE assets and liabilities for LFI Consolidated Funds as reflected in the consolidated statements of financial condition consist of the following at December 31, 20222023 and 2021.2022.
| | | | | | | | | | | |
| December 31, |
| 2023 | | 2022 |
| ASSETS | | | |
| Cash and cash equivalents | $ | 4,627 | | | $ | 3,644 | |
| Customers and other receivables | 23,277 | | | 240 | |
| Investments | 196,112 | | | 186,300 | |
| Other assets | 683 | | | 622 | |
| Total assets | $ | 224,699 | | | $ | 190,806 | |
| LIABILITIES | | | |
| Deposits and other customer payables | $ | 23,498 | | | $ | 528 | |
| Other liabilities | 353 | | | 448 | |
| Total liabilities | $ | 23,851 | | | $ | 976 | |
| | December 31, | |
| | 2022 | | | 2021 | |
ASSETS | | | | | | | | |
Cash and cash equivalents | | $ | 3,644 | | | $ | 3,936 | |
Customers and other receivables | | | 240 | | | | 305 | |
Investments | | | 186,300 | | | | 204,062 | |
Other assets | | | 622 | | | | 328 | |
Total Assets | | $ | 190,806 | | | $ | 208,631 | |
LIABILITIES | | | | | | | | |
Deposits and other customer payables | | $ | 528 | | | $ | 50 | |
Other liabilities | | | 448 | | | | 910 | |
Total Liabilities | | $ | 976 | | | $ | 960 | |
SUPPLEMENTAL FINANCIAL INFORMATION
Item 9.
| Changes in and Disagreements with Accountants on Accounting and Financial Disclosures
|
Item 9. Changes in and Disagreements with Accountants on Accounting and Financial Disclosures
There were no changes in or disagreements with accountants on accounting and financial disclosure during the last two fiscal years.
Item 9A.
| Controls and Procedures
|
Item 9A. Controls and Procedures
Our management, including our Chief Executive Officer and Chief Financial Officer, evaluated the effectiveness of our disclosure controls and procedures pursuant to Rule 13a-15 under the Exchange Act as of the end of the period covered by this Annual Report on Form 10-K. Based on that evaluation, our Chief Executive Officer and Chief Financial Officer have concluded that, as of the end of the period covered by this Annual Report on Form 10-K, our disclosure controls and procedures (as defined in Rule 13a-15(e) under the Exchange Act) are effective to ensure that information we are required to disclose in reports that we file or submit under the Exchange Act is recorded, processed, summarized and reported within the time periods specified in Securities and Exchange Commission rules and forms, and that such information is accumulated and communicated to our management, including our Chief Executive Officer and Chief Financial Officer, as appropriate, to allow timely decisions regarding required disclosure.
In addition, no change in our internal control over financial reporting (as defined in Rule 13a-15(f) under the Exchange Act) occurred during our most recent fiscal quarter that has materially affected, or is likely to materially affect, our internal control over financial reporting.
Management’s Report on Internal Control Over Financial Reporting (as defined in Rules 13a-15(f) and 15d-15(f) of the Exchange Act), and the related report of our independent registered public accounting firm, are set forth in Part II, Item 8 of this Annual Report on Form 10-K and are incorporated herein by reference.
Item 9B.
| Other Information
|
None.
Item 9C.
| Disclosure Regarding Foreign Jurisdictions that Prevent Inspections
|
Item 9B. Other InformationDuring the three months ended December 31, 2023, no director or officer of the Company adopted or terminated a “Rule 10b5-1 trading arrangement” or “Non-Rule 10b5-1 trading arrangement” as each term is defined in Item 408 of Regulation S-K.
Item 9C. Disclosure Regarding Foreign Jurisdictions that Prevent Inspections
Item 10.
| Directors, Executive Officers and Corporate Governance
|
Item 10. Directors, Executive Officers and Corporate Governance
The Registrant meets the conditions set forth in General Instruction (I)(l)(a) and (b) of Form 10-K and has omitted the information called for by this Item.
Item 11.
| Executive Compensation
|
Item 11. Executive Compensation
The Registrant meets the conditions set forth in General Instruction (I)(l)(a) and (b) of Form 10-K and has omitted the information called for by this Item.
Item 12.
| Security Ownership of Certain Beneficial Owners and Management and Related Stockholder Matters
|
Item 12. Security Ownership of Certain Beneficial Owners and Management and Related Stockholder Matters
The Registrant meets the conditions set forth in General Instruction (I)(l)(a) and (b) of Form 10-K and has omitted the information called for by this Item.
Item 13.
| Certain Relationships and Related Transactions, and Director Independence
|
Item 13. Certain Relationships and Related Transactions, and Director Independence
The Registrant meets the conditions set forth in General Instruction (I)(l)(a) and (b) of Form 10-K and has omitted the information called for by this Item.
Item 14.
| Principal Accounting Fees and Services
|
Item 14. Principal Accounting Fees and Services
For the fiscal years ended December 31,
20222023 and
2021,2022, fees for services provided by Deloitte & Touche LLP, the member firms of Deloitte Touche Tohmatsu and their respective affiliates were as follows (in thousands of dollars):
Fees | | 2022 | | | 2021 | |
Audit Fees for the audit of the Company's annual financial statements, the audit of the effectiveness of the Company's internal controls over financial reporting and reviews of the financial statements included in the Company's quarterly reports Form 10-Q, including services in connection with statutory and regulatory filings or engagements | | $ | 8,870 | | | $ | 8,882 | |
Audit-Related Fees, including fees for audits of employee benefit plans, computer and control-related attest services, agreed upon procedures, regulatory and compliance reviews, fund audits and other accounting research services | | $ | 1,473 | | | $ | 1,559 | |
Tax Fees for tax advisory and compliance services not related to the audit | | $ | 429 | | | $ | 492 | |
All Other Fees (1) | | $ | 265 | | | $ | 13 | |
| | | | | | | | |
| Fees | 2023 | 2022 |
Audit Fees for the audit of the Company's annual financial statements, the audit of the effectiveness of the Company's internal controls over financial reporting and reviews of the financial statements included in the Company's quarterly reports Form 10-Q, including services in connection with statutory and regulatory filings or engagements. | $ | 9,908 | | $ | 8,870 | |
Audit-Related Fees, including fees for audits of employee benefit plans, computer and control-related attest services, agreed upon procedures, regulatory and compliance reviews, fund audits and other accounting research services. | $ | 1,688 | | $ | 1,473 | |
Tax Fees for tax advisory and compliance services not related to the audit. | $ | 343 | | $ | 429 | |
| All Other Fees (1) | $ | 153 | | $ | 265 | |
(1)
| Includes fees for subscriptions, training(1) Includes fees for subscriptions, trainings and data classification services that were provided to the Company by affiliates of Deloitte & Touche LLP that were unrelated to the audit, audit-related and tax services described above.
|
The Audit Committee of the Board of Directors of Lazard, LtdInc. (the “Audit Committee”) has adopted a policy regarding pre-approval of audit and non-audit services provided by Deloitte & Touche LLP to the Company and its subsidiaries. The policy provides the guidelines necessary to adhere to Lazard’s commitment to auditor independence and compliance with relevant laws, regulations and guidelines relating to auditor independence. The policy sets forth four categories of permitted services (Audit, Audit-Related, Tax and Other), listing the types of permitted services in each category. All of the permitted services require pre-approval by the Audit Committee. In lieu of Audit Committee pre-approval on an engagement-by-engagement basis, each category of permitted services, with reasonable detail as to the types of services contemplated, is pre-approved as part of the annual budget approval by the Audit Committee. Permitted services not contemplated during the budget process must be presented to the Audit Committee for approval prior to the
commencement of the relevant engagement. The Audit Committee chair, or, if he is not available, any other member of the Audit Committee, may grant approval for any such engagement if approval is required prior to the next scheduled meeting of the Audit Committee. All of the fees paid to Deloitte & Touche LLP in 20222023 were pre-approved in accordance with these procedures, and there were no services for which the de minimis exception permitted in certain circumstances under SEC rules was utilized.
PART IV
Item 15.
| Exhibits and Financial Statement Schedules
|
(a)
| Documents filed as part of this Report:
|
| 1.
| Consolidated Financial Statements
|
Item 15. Exhibits and Financial Statement Schedules(a)Documents filed as part of this Report:
1.Consolidated Financial Statements
The consolidated financial statements required to be filed in the Annual Report on Form 10-K are listed on page F-1 hereof and in Part II, Item 8 hereof.
| 2.Financial Statement Schedule | Financial Statement Schedule
|
The financial statement schedule required in the Annual Report on Form 10-K is listed on page F-1 hereof. The required schedule appears on pages F-2 through F-6 hereof. All other schedules have been omitted because they are not applicable, not required or the information required is included in the Company’s consolidated financial statements or notes thereto.
3.Exhibits
| 10.3*
| | Lazard Ltd’s 2005 Equity Incentive Plan (incorporated by reference to Exhibit 10.21 to Lazard Ltd’s Registration Statement (File No. 333-121407) on Form S-1/A filed on May 2, 2005).
| | | | | |
| 10.3* | | |
10.4*
| | | |
| | |
10.5*
10.4* | | | |
| | |
10.6*
10.5* | Second Amendment to the Lazard Ltd 2018 Incentive Compensation Plan (incorporated by reference to Exhibit 10.2 to Lazard, Inc.’s Post-Effective Amendment No. 1 to Registration Statements on Form S-8 (File Nos. 333-154977, 333-193845, 333-217597, 333-224552 and 333-269977) filed on February 2, 2024. | |
| | |
| 10.6* | First Amendment to the Lazard Ltd 2008 Incentive Compensation Plan (incorporated by reference to Exhibit 10.1 to Lazard, Inc,’s Post-Effective Amendment No. 1 to Registration Statements on Form S-8 (File Nos. 333-154977, 333-193845, 333-217597, 333-224552 and 333-269977) filed on February 2, 2024. | |
| | |
| 10.7* | | |
| | |
10.7*
10.8* | | |
| | |
| 10.9* | | |
| | |
10.8*
10.10* | | |
| | |
| 10.11* | | |
| | |
10.9*
10.12* | | |
| | |
| 10.13* | | |
| | |
10.10*
10.14* | | | |
| | |
10.11*
10.15* | | |
| | |
| | | | | | | | |
| 10.16* | | |
| | |
10.12*
10.17* | | | |
| | |
10.13*
10.18* | | |
| | |
| 10.19* | | |
| | |
10.14*
10.20* | | |
| | |
| 10.21* | | |
| | |
| 10.22* | | |
| | |
10.15*
10.23* | | | |
| | |
10.16
10.24 | | Second Amended and Restated Credit Agreement, datedated as of July 22, 2020,June 6, 2023, among the Registrant, the Banks from time to time parties thereto, and Citibank, N.A., as Administrative Agent (incorporated by reference to Exhibit 10.1610.21 to the Registrant’s Quarterly Report (File No. 333-126751) on Form 10-Q (File No.333-126751) filed on August 4, 2020)July 31, 2023). | |
| | |
10.17*
10.25* | | | |
| | |
10.18*
10.26* | | |
| | |
| | | | | | | | |
| | |
23.1 | | | |
| 31.1 | | |
31.1
| | | |
| | |
31.2 | | | |
| | |
32.1 | | | |
| | |
32.2 | | | |
| | |
| 101.INS | | |
101.INS
| | Inline XBRL Instance Document – the instance document does not appear in the Interactive Data File because iXBRL tags are embedded within the Inline XBRL document. | |
| | |
101.SCH | | Inline XBRL Taxonomy Extension Schema | |
| | |
101.CAL | | Inline XBRL Taxonomy Extension Calculation Linkbase | |
| | |
101.DEF | | Inline XBRL Taxonomy Extension Definition Linkbase | |
| | |
101.LAB | | Inline XBRL Taxonomy Extension Label Linkbase | |
| | |
101.PRE | | Inline XBRL Taxonomy Extension Presentation Linkbase | |
| | |
104 | | Cover Page Interactive Data File (formatted as inline XBRL and contained in Exhibit 101) | |
*_____________________
| Management contract or compensatory plan or arrangement.
|
*Management contract or compensatory plan or arrangement.
INDEX TO FINANCIAL STATEMENTS AND FINANCIAL STATEMENT SCHEDULE
ITEMS 15(a)(1) AND 15(a)(2)
| | | | | |
| Page No. |
| | 65
|
| | |
| | 66
|
| | |
Consolidated Financial Statements | | |
| | |
| | 69
|
| | |
| | 71
|
| | |
| | 72
|
| | |
| | 73
|
| | |
| | 75
|
| | |
| | 78
|
| | |
| | 122
|
| | |
Financial Statement Schedules | | |
| | |
Schedule I—Condensed Financial Information of Registrant (Parent Company Only) | | |
| | |
| | F-2
|
| | |
| | F-3
|
| | |
| | F-4
|
| | |
| | F-5
|
| | |
| | F-6
|
Schedules not listed above have been omitted because the information required to be set forth therein is not applicable or is shown in the consolidated financial statements or notes thereto.
CONDENSED STATEMENTS OF FINANCIAL CONDITION
DECEMBER 31,
20222023 AND
20212022
| | December 31, | |
| | 2022 | | | 2021 | |
| December 31, | | | December 31, |
| 2023 | | | 2023 | | 2022 |
ASSETS | | | | | | | | |
| Cash and cash equivalents | |
| Cash and cash equivalents | |
Cash and cash equivalents | | $ | 142,793 | | | $ | 75,844 | |
Due from subsidiaries of Lazard Ltd | | | 509,375 | | | | 478,913 | |
Other receivables, net | | | 12,658 | | | | 497 | |
Investments in subsidiaries, equity method | | | 1,441,091 | | | | 1,655,481 | |
Other investments | | | 234,371 | | | | 566,162 | |
Property, net | | | 85,669 | | | | 94,316 | |
Operating lease right-of-use assets | | | 295,369 | | | | 313,554 | |
Goodwill and other intangibles assets, net | | | 148,796 | | | | 148,796 | |
| Goodwill and other intangible assets, net | |
Other assets | | | 74,192 | | | | 83,236 | |
Total assets | | $ | 2,944,314 | | | $ | 3,416,799 | |
LIABILITIES AND MEMBERS’ EQUITY | | | | | | | | |
Liabilities: | | | | | | | | |
| Liabilities: | |
| Liabilities: | |
| Accrued compensation and benefits | |
| Accrued compensation and benefits | |
Accrued compensation and benefits | | $ | 190,837 | | | $ | 265,120 | |
Due to subsidiaries of Lazard Ltd | | | 313,080 | | | | 269,716 | |
Operating lease liabilities | | | 361,396 | | | | 382,608 | |
Senior debt | | | 1,687,714 | | | | 1,685,227 | |
Other liabilities | | | 32,918 | | | | 38,358 | |
Total liabilities | | | 2,585,945 | | | | 2,641,029 | |
Commitments and contingencies | | | | | | | | | Commitments and contingencies | | | |
MEMBERS’ EQUITY | | | | | | | | |
Members' equity | | | 638,956 | | | | 984,807 | |
| Members' equity | |
| Members' equity | |
Accumulated other comprehensive loss, net of tax | | | (280,587 | ) | | | (209,037 | ) |
Total members’ equity | | | 358,369 | | | | 775,770 | |
Total liabilities and members’ equity | | $ | 2,944,314 | | | $ | 3,416,799 | |
| Total liabilities and members' equity | |
See notes to condensed financial statements.
F-2
CONDENSED STATEMENTS OF OPERATIONS
FOR THE YEARS ENDED DECEMBER 31,
2023, 2022
2021 AND
20202021
| | Year Ended December 31, | |
| | 2022 | | | 2021 | | | 2020 | |
| Year Ended December 31, | | | Year Ended December 31, |
| 2023 | | | 2023 | | 2022 | | 2021 |
REVENUE | | | | | | | | | | | | |
| Equity in earnings of subsidiaries | |
| Equity in earnings of subsidiaries | |
Equity in earnings of subsidiaries | | $ | 607,764 | | | $ | 827,651 | | | $ | 632,560 | |
Interest income | | | 2,999 | | | | 327 | | | | 2,095 | |
Other | | | (20,255 | ) | | | 55,709 | | | | 21,247 | |
Total revenue | | | 590,508 | | | | 883,687 | | | | 655,902 | |
Interest expense | | | 75,978 | | | | 74,210 | | | | 75,142 | |
Net revenue | | | 514,530 | | | | 809,477 | | | | 580,760 | |
| Net revenue (loss) | |
OPERATING EXPENSES | | | | | | | | | | | | |
| Compensation and benefits | |
| Compensation and benefits | |
Compensation and benefits | | | 97,797 | | | | 142,260 | | | | 113,347 | |
Professional services | | | 7,720 | | | | 6,457 | | | | 6,328 | |
Other | | | 1,056 | | | | 4,505 | | | | 3,151 | |
Total operating expenses | | | 106,573 | | | | 153,222 | | | | 122,826 | |
OPERATING INCOME | | | 407,957 | | | | 656,255 | | | | 457,934 | |
Provision for income taxes | | | 3,775 | | | | 1,760 | | | | 1,058 | |
NET INCOME | | $ | 404,182 | | | $ | 654,495 | | | $ | 456,876 | |
| OPERATING INCOME (LOSS) | |
| Provision (benefit) for income taxes | |
| NET INCOME (LOSS) | |
See notes to condensed financial statements.
F-3
CONDENSED STATEMENTS OF COMPREHENSIVE INCOME
(LOSS)
FOR THE YEARS ENDED DECEMBER 31,
2023, 2022
2021 AND
20202021
| | Year Ended December 31, | |
| | 2022 | | | 2021 | | | 2020 | |
NET INCOME | | $ | 404,182 | | | $ | 654,495 | | | $ | 456,876 | |
OTHER COMPREHENSIVE INCOME (LOSS), NET OF TAX: | | | | | | | | | | | | |
Currency translation adjustments: | | | | | | | | | | | | |
Currency translation adjustments before reclassification | | | (63,779 | ) | | | (48,401 | ) | | | 53,929 | |
Adjustment for items reclassified to earnings | | | 32 | | | | (7,516 | ) | | | - | |
Employee benefit plans: | | | | | | | | | | | | |
Actuarial gain (loss) (net of tax expense (benefit) of $(5,437), $11,912 and $(2,040) for the years ended December 31, 2022, 2021 and 2020, respectively) | | | (11,955 | ) | | | 34,666 | | | | (3,017 | ) |
Adjustments for items reclassified to earnings (net of tax expense of $994, $1,609 and $1,476 for the years ended December 31, 2022, 2021 and 2020, respectively) | | | 4,152 | | | | 5,660 | | | | 6,046 | |
OTHER COMPREHENSIVE INCOME (LOSS), NET OF TAX | | | (71,550 | ) | | | (15,591 | ) | | | 56,958 | |
COMPREHENSIVE INCOME | | $ | 332,632 | | | $ | 638,904 | | | $ | 513,834 | |
| | | | | | | | | | | | | | | | | |
| Year Ended December 31, |
| 2023 | | 2022 | | 2021 |
| NET INCOME (LOSS) | $ | (177,416) | | | $ | 404,182 | | | $ | 654,495 | |
| OTHER COMPREHENSIVE INCOME (LOSS), NET OF TAX: | | | | | |
| Currency translation adjustments: | | | | | |
| Currency translation adjustments before reclassification | 30,720 | | | (63,779) | | | (48,401) | |
| Adjustment for items reclassified to earnings | 2,413 | | | 32 | | | (7,516) | |
| Employee benefit plans: | | | | | |
| Actuarial gain (loss) (net of tax expense (benefit) of $(7,657), $(5,437) and $11,912 for the years ended December 31, 2023, 2022 and 2021, respectively) | (24,459) | | | (11,955) | | | 34,666 | |
Prior service cost (net of tax benefit of $2,567 for the year ended December 31, 2023) | (7,751) | | | – | | | – | |
| Adjustments for items reclassified to earnings (net of tax expense of $1,521, $994 and $1,609 for the years ended December 31, 2023, 2022 and 2021, respectively) | 5,233 | | | 4,152 | | | 5,660 | |
| OTHER COMPREHENSIVE INCOME (LOSS), NET OF TAX | 6,156 | | | (71,550) | | | (15,591) | |
| COMPREHENSIVE INCOME (LOSS) | $ | (171,260) | | | $ | 332,632 | | | $ | 638,904 | |
See notes to condensed financial statements.
F-4
CONDENSED STATEMENTS OF CASH FLOWS
FOR THE YEARS ENDED DECEMBER 31,
2023, 2022
2021 AND
20202021
| | Year Ended December 31, | |
| | 2022 | | | 2021 | | | 2020 | |
| Year Ended December 31, | | | Year Ended December 31, |
| 2023 | | | 2023 | | 2022 | | 2021 |
CASH FLOWS FROM OPERATING ACTIVITIES: | | | | | | | | | | | | |
Net income | | $ | 404,182 | | | $ | 654,495 | | | $ | 456,876 | |
Adjustments to reconcile net income to net cash provided by operating activities: | | | | | | | | | | | | |
| Net income (loss) | |
| Net income (loss) | |
| Net income (loss) | |
| Adjustments to reconcile net income (loss) to net cash provided by operating activities: | |
| Equity in earnings of subsidiaries | |
| Equity in earnings of subsidiaries | |
Equity in earnings of subsidiaries | | | (607,764 | ) | | | (827,651 | ) | | | (632,560 | ) |
Deferred tax provision (benefit) | | | 443 | | | | 271 | | | | (324 | ) |
Amortization of deferred expenses and share-based incentive compensation | | | 341,317 | | | | 346,981 | | | | 308,306 | |
Depreciation and amortization of property | | | 12,722 | | | | 10,775 | | | | 10,435 | |
Noncash lease expense | | | 23,996 | | | | 22,603 | | | | 22,514 | |
Impairment of equity method investments and other
receivables | |
Distributions received from subsidiaries | | | 757,968 | | | | 651,362 | | | | 458,821 | |
Changes in operating assets and liabilities: | | | | | | | | | | | | |
| Due to/from subsidiaries | |
| Due to/from subsidiaries | |
Due to/from subsidiaries | | | 16,806 | | | | 80,921 | | | | 51,271 | |
Other investments | | | 223,106 | | | | (352,359 | ) | | | (137,685 | ) |
Other operating assets and liabilities | | | (95,530 | ) | | | (21,778 | ) | | | 15,243 | |
Net cash provided by operating activities | | | 1,077,246 | | | | 565,620 | | | | 552,897 | |
CASH FLOWS FROM INVESTING ACTIVITIES: | | | | | | | | | | | | |
Additions to property | | | (3,912 | ) | | | (4,123 | ) | | | (6,383 | ) |
| Additions to property | |
| Additions to property | |
Capital contribution to subsidiaries | | | (6,257 | ) | | | (26,168 | ) | | | (65,023 | ) |
Other investing activities | | | (7,500 | ) | | | - | | | | - | |
Net cash used in investing activities | | | (17,669 | ) | | | (30,291 | ) | | | (71,406 | ) |
CASH FLOWS FROM FINANCING ACTIVITIES: | | | | | | | | | | | | |
Proceeds from: | | | | | | | | | | | | |
| Proceeds from: | |
| Proceeds from: | |
| Contributions from members | |
| Contributions from members | |
Contributions from members | | | - | | | | 14,000 | | | | - | |
Other financing activities | | | 50 | | | | - | | | | 25 | |
Payments for: | | | | | | | | | | | | |
| Distributions to members | |
| Distributions to members | |
Distributions to members | | | (228,045 | ) | | | (233,234 | ) | | | (201,019 | ) |
Settlement of share-based incentive compensation in satisfaction of tax withholding requirements | | | (61,916 | ) | | | (68,012 | ) | | | (72,636 | ) |
Purchase of Lazard Ltd Class A common stock | | | (691,705 | ) | | | (406,149 | ) | | | (95,227 | ) |
Other financing activities | | | (11,012 | ) | | | (8,429 | ) | | | (7,024 | ) |
Net cash used in financing activities | | | (992,628 | ) | | | (701,824 | ) | | | (375,881 | ) |
Net increase (decrease) in cash and cash equivalents | | | 66,949 | | | | (166,495 | ) | | | 105,610 | |
Cash and cash equivalents, January 1 | | | 75,844 | | | | 242,339 | | | | 136,729 | |
Cash and cash equivalents, December 31 | | $ | 142,793 | | | $ | 75,844 | | | $ | 242,339 | |
See notes to condensed financial statements.
F-5
NOTES TO CONDENSED FINANCIAL STATEMENTS
1. BASIS OF PRESENTATION
The accompanying Lazard Group LLC condensed financial statements (the “Parent Company Financial Statements”), including the notes thereto, should be read in conjunction with the consolidated financial statements of Lazard Group LLC and its subsidiaries (the “Company”) and the notes thereto.
The Parent Company Financial Statements as of December 31,
20222023 and
2021,2022, and for each of the three years in the period ended December 31,
2022,2023, are prepared in conformity with accounting principles generally accepted in the United States of America (“U.S. GAAP”), which require management to make estimates and assumptions that affect the reported amounts of assets and liabilities, revenue and expenses, and the disclosures in the condensed financial statements. Management believes that the estimates utilized in the preparation of the condensed financial statements are reasonable. Actual results could differ materially from these estimates.
The Parent Company Financial Statements include investments in subsidiaries, accounted for under the equity method.
Pursuant to the requirements of Section 13 or 15(d) of the Securities Exchange Act of 1934, as amended, the Registrant has duly caused this Report to be signed on its behalf by the undersigned, thereunto duly authorized.
Dated: February 23,
20232024 | | | | | | | | |
| LAZARD GROUP LLC | |
| |
By: | /s/ Kenneth M. Jacobs Peter R. Orszag | |
| Peter R. Orszag | | Kenneth M. Jacobs
| Chairman and Chief Executive Officer
| |
Pursuant to the requirements of the Securities Exchange Act of 1934, as amended, this Report has been signed below by the following persons on behalf of the Registrant in the capacities and on the dates indicated.
| | | | | | | | | | | | | | |
| Signature | | Capacity | | Capacity
| Date |
| | | | |
/s/ Kenneth M. Jacobs | | Executive Chairman and Director | | Chairman,
February 23, 2024 |
| Kenneth M. Jacobs | | | | |
| | | | |
| /s/ Peter R. Orszag | | Chief Executive Officer and Director | | February 23, 2023 2024 |
Kenneth M. Jacobs
Peter R. Orszag | | (Principal Executive OfficerOfficer)) | | |
| | | | |
/s/ Mary Ann Betsch | | Chief Financial Officer | | February 23, 2023 2024 |
Mary Ann Betsch | | (Principal Financial OfficerOfficer)) | | |
| | | | |
/s/ Dominick Ragone Michael Gathy | | Chief Accounting Officer | | February 23, 2023 2024 |
Dominick Ragone
Michael Gathy | | | | |
| | | | |
/s/ Ann-Kristin Achleitner | | Director | | Director
| February 23, 2023 2024 |
Ann-Kristin Achleitner | | | | |
| | | | |
/s/ Andrew M. Alper | | Director | | Director
| February 23, 2023 2024 |
Andrew M. Alper | | | | |
| | | | |
/s/ Richard N. Haass
| | Director
| | February 23, 2023
|
Richard N. Haass
| | | | |
| | | | |
/s/ Michelle Jarrard | | Director | | Director
| February 23, 2023 2024 |
Michelle Jarrard | | | | |
| | | | |
/s/ Iris Knobloch Iris Knobloch
| | Director | | Director
| February 23, 2023 2024 |
| Iris Knobloch | | | | |
| /s/ Philip A. Laskawy
| | Director
| | February 23, 2023
Philip A. Laskawy
| | | | |
| | | | |
/s/ William M. Lewis, Jr.
| | Director
| | February 23, 2023
|
William M. Lewis, Jr.
| | | | |
| | | | |
/s/ Jane L. Mendillo | | Director | | Director
| February 23, 2023 2024 |
Jane L. Mendillo | | | | |
| | | | |
/s/ Richard D. Parsons | | Director | | Director
| February 23, 2023 2024 |
Richard D. Parsons | | | | |
| | | | |

