UNITED STATES SECURITIES AND EXCHANGE COMMISSION
Washington, D.C. 20549
Form 10-K
|
| | |
| x | | ANNUAL REPORT PURSUANT TO SECTION 13 OR 15(d) OF THE SECURITIES EXCHANGE ACT OF 1934 For the Fiscal Year ended December 31, 2015.2016. |
| | | |
| o | | TRANSITION REPORT PURSUANT TO SECTION 13 OR 15(d) OF THE SECURITIES EXCHANGE ACT OF 1934 For the Transition period from to . |
Commission File Number: 001-36002
NRG Yield, Inc.
(Exact name of registrant as specified in its charter)
|
| | |
Delaware (State or other jurisdiction of incorporation or organization) | | 46-1777204 (I.R.S. Employer Identification No.) |
| | | |
211804 Carnegie Center, Princeton, New Jersey
(Address of principal executive offices) | | 08540 (Zip Code) |
(609) 524-4500
(Registrant’s telephone number, including area code)
Securities registered pursuant to Section 12(b) of the Act:
|
| | |
| Title of Each Class | | Name of Exchange on Which Registered |
| Common Stock, Class A, par value $0.01 | | New York Stock Exchange |
| Common Stock, Class C, par value $0.01 | | New York Stock Exchange |
Securities registered pursuant to Section 12(g) of the Act:
None
Indicate by check mark if the registrant is a well-known seasoned issuer, as defined in Rule 405 of the Securities Act. Yes x No o
Indicate by check mark if the registrant is not required to file reports pursuant to Section 13 or Section 15(d) of the Exchange Act. Yes o No x
Indicate by check mark whether the registrant (1) has filed all reports to be filed by Section 13 or 15(d) of the Securities Exchange Act of 1934 during the preceding 12 months (or for such shorter period that the registrant was required to file such reports), and (2) has been subject to such filing requirements for the past 90 days. Yes x No o
Indicate by check mark whether the registrant has submitted electronically and posted on its corporate Web site, if any, every Interactive Data File required to be submitted and posted pursuant to Rule 405 of Regulation S-T (§232.405 of this chapter) during the preceding 12 months (or for such shorter period that the registrant was required to submit and post such files). Yes x No o
Indicate by check mark if disclosure of delinquent filers pursuant to Item 405 of Regulation S-K (§ 229.405 of this chapter) is not contained herein, and will not be contained, to the best of the registrant's knowledge, in definitive proxy or information statements incorporated by reference in Part III of this Form 10-K or any amendment to this Form 10-K. x
Indicate by check mark whether the registrant is a large accelerated filer, an accelerated filer, a non-accelerated filer, or a smaller reporting company. See the definitions of "large accelerated filer," "accelerated filer" and "smaller reporting company" in Rule 12b-2 of the Exchange Act.
|
| | | | | | |
Large accelerated filer x | | Accelerated filer o | | Non-accelerated filer o | | Smaller reporting company o |
| | | | | (Do not check if a smaller reporting company) | | |
Indicate by check mark whether the registrant is a shell company (as defined in Rule 12b-2 of the Act). Yes o No x
As of the last business day of the most recently completed second fiscal quarter, the aggregate market value of the common stock of the registrant held by non-affiliates was approximately $1,944,615,167$1,502,686,604 based on the closing sale prices of such shares as reported on the New York Stock Exchange.
Indicate the number of shares outstanding of each of the registrant's classes of common stock as of the latest practicable date.
|
| | |
| Class | | Outstanding at January 31, 20162017 |
| Common Stock, Class A, par value $0.01 per share | | 34,586,250 |
| Common Stock, Class B, par value $0.01 per share | | 42,738,750 |
| Common Stock, Class C, par value $0.01 per share | | 62,784,25062,789,804 |
| Common Stock, Class D, par value $0.01 per share | | 42,738,750 |
Documents Incorporated by Reference:
Portions of the Registrant's Definitive Proxy Statement relating to its 20162017 Annual Meeting of Stockholders
are incorporated by reference into Part III of this Annual Report on Form 10-K
TABLE OF CONTENTS
Index
|
| |
| GLOSSARY OF TERMS | |
| PART I | |
| Item 1 — Business | |
| Item 1A — Risk Factors | |
| Item 1B — Unresolved Staff Comments | |
| Item 2 — Properties | |
| Item 3 — Legal Proceedings | |
| Item 4 — Mine Safety Disclosures | |
| PART II | |
| Item 5 — Market for Registrant's Common Equity, Related Stockholder Matters and Issuer Purchases of Equity Securities | |
| Item 6 — Selected Financial Data | |
| Item 7 — Management's Discussion and Analysis of Financial Condition and Results of Operations | |
| Item 7A — Quantitative and Qualitative Disclosures About Market Risk | |
| Item 8 — Financial Statements and Supplementary Data | |
| Item 9 — Changes in Disagreements With Accountants on Accounting and Financial Disclosure | |
| Item 9A — Controls and Procedures | |
| Item 9B — Other Information | |
| PART III | |
| Item 10 — Directors, Executive Officers and Corporate Governance | |
| Item 11 — Executive Compensation | |
| Item 12 — Security Ownership of Certain Beneficial Owners and Management and Related Stockholder Matters | |
| Item 13 — Certain Relationships and Related Transactions, and Director Independence | |
| Item 14 — Principal Accounting Fees and Services | |
| PART IV | |
| Item 15 — Exhibits, Financial Statement Schedules | |
| EXHIBIT INDEX | |
| Item 16 — Form 10-K Summary | |
GLOSSARY OF TERMS
When the following terms and abbreviations appear in the text of this report, they have the meanings indicated below:
|
| | |
| 2017 Drop Down Assets | | (i) a 16% interest (approximately 31% of NRG's 51% interest) in the Agua Caliente solar farm and (ii) NRG's 50% interests in seven utility-scale solar farms located in Utah. Both are subject of the definitive purchase agreements that the Company entered into with NRG on February 24, 2017 |
| 2019 Convertible Notes | | $345 million aggregate principal amount of 3.50% Convertible Notes due 2019 |
| 2020 Convertible Notes | | $287.5 million aggregate principal amount of 3.25% Convertible Notes due 2020 |
Alta Sellers2024 Senior Notes | | Terra-Gen Finance Company,$500 million aggregate principal amount of 5.375% unsecured senior notes due 2024, issued by NRG Yield Operating LLC and certain |
| 2026 Senior Notes | | $350 million aggregate principal amount of its affiliates5.00% unsecured senior notes due 2026, issued by NRG Yield Operating LLC |
| 2037 Notes | | $200 million aggregate principal amount of 4.68% senior secured notes due 2037, issued by CVSR Holdco |
| Alta TE Holdco | | Alta Wind X-XI TE Holdco LLC |
| Alta Wind Portfolio | | Seven wind facilities that total 947 MW located in Tehachapi, California and a portfolio of associated land leases |
| AOCL | | Accumulated Other Comprehensive Loss |
| ARO | | Asset Retirement Obligation |
| ARRA | | American Recovery and Reinvestment Act of 2009 |
| ASC | | The FASB Accounting Standards Codification, which the FASB established as the source of authoritative U.S. GAAP |
| ASU | | Accounting Standards Updates – updates to the ASC |
| ATM Program | | At-The-Market Equity Offering Program |
| Buffalo Bear | | Buffalo Bear, LLC, the operating subsidiary of Tapestry Wind LLC, which owns the Buffalo Bear project |
| CAA | | Clean Air Act |
| CAFD | | Cash Available For Distribution, which the Company defines as net income before interest expense, income taxes, depreciation and amortization, plus cash distributions from unconsolidated affiliates, cash receipts from notes receivable, less cash distributions to noncontrolling interests, maintenance capital expenditures, pro-rata EBITDA from unconsolidated affiliates, cash interest paid, income taxes paid, principal amortization of indebtedness and changes in other assets.prepaid and accrued capacity payments |
| CfD | | Contract for Differences |
| CFTC | | U.S. Commodity Future Trading Commission |
CO2
| | Carbon Dioxide |
| COD | | Commercial Operations Date |
| Code | | Internal Revenue Code of 1986, as amended |
| Company | | NRG Yield, Inc. together with its consolidated subsidiaries |
| CVSR | | California Valley Solar Ranch |
| CVSR Drop Down | | The Company's acquisition from NRG of the remaining 51.05% interest of CVSR Holdco |
| CVSR Holdco | | CVSR Holdco LLC, the indirect owner of CVSR |
| DGCL | | Delaware General Corporation Law |
| DGPV Holdco 1 | | NRG DGPV Holdco 1 LLC |
| DGPV Holdco 2 | | NRG DGPV Holdco 2 LLC |
| Distributed Solar | | Solar power projects, typically less than 20 MW in size, that primarily sell power produced to customers for usage on site, or are interconnected to sell power into the local distribution grid |
Dodd-Frank Act | | The Dodd-Frank Wall Street Reform and Consumer Protection Act of 2012 |
| Drop Down Assets | | Collectively, the June 2014 Drop Down Assets, the January 2015 Drop Down Assets, and the November 2015 Drop Down Assets, and CVSR Drop Down |
Economic gross marginGross Margin | | Energy and capacity revenue, less cost of fuels |
| EDA | | Equity Distribution Agreement |
| EGU | | Electric Utility Generating Unit |
|
| | |
| El Segundo | | NRG West Holdings LLC, the subsidiary of Natural Gas Repowering LLC, which owns the El Segundo Energy Center project |
| EME | | Edison Mission Energy |
| EME Assets | | The January 2015 Drop Down Assets and the November 2015 Drop Down Assets (other than Elbow Creek), originally acquired by NRG from EME on April 1, 2014 |
| EPC | | Engineering, Procurement and Construction |
| ERCOT | | Electric Reliability Council of Texas, the ISO and the regional reliability coordinator of the various electricity systems within Texas |
|
| | |
| EWG | | Exempt Wholesale Generator |
| Exchange Act | | The Securities Exchange Act of 1934, as amended |
| FASB | | Financial Accounting Standards Board |
FCM | | Forward Capacity Market |
| FERC | | Federal Energy Regulatory Commission |
FFB | | Federal Financing Bank |
| FPA | | Federal Power Act |
| GAAP | | Accounting principles generally accepted in the U.S. |
| GenConn | | GenConn Energy LLC |
| GHG | | Greenhouse gasesgas |
| GW | | Gigawatt |
| HLBV | | Hypothetical Liquidation at Book Value |
| IASB | | International Accounting Standards Board |
IPO | | Initial Public Offering |
| IRS | | Internal Revenue Service |
| ISO | | Independent System Operator, also referred to as Regional Transmission Organization, or RTO |
ISO-NE | | ISO New England Inc. |
| ITC | | Investment Tax Credit |
| January 2015 Drop Down Assets | | The Laredo Ridge, Tapestry and Walnut Creek projects, which were acquired by Yield Operating LLC from NRG on January 2, 2015 |
| June 2014 Drop Down Assets | | The TA High Desert, Kansas South and El Segundo projects, which were acquired by Yield Operating LLC from NRG on June 30, 2014 |
| Kansas South | | NRG Solar Kansas South LLC, the operating subsidiary of NRG Solar Kansas South Holdings LLC, which owns the Kansas South project |
| KPPH | | 1,000 Pounds Per Hour |
| Laredo Ridge | | Laredo Ridge Wind, LLC, the operating subsidiary of Mission Wind Laredo, LLC, which owns the Laredo Ridge project |
| LIBOR | | London Inter-Bank Offered Rate |
| Marsh Landing | | NRG Marsh Landing LLC, formerly GenOn Marsh Landing LLC |
| MMBtu | | Million British Thermal Units |
| MW | | Megawatt |
| MWh | | Saleable megawatt hours, net of internal/parasitic load megawatt-hours |
| MWt | | Megawatts Thermal Equivalent |
| NECP | | NRG Energy Center Pittsburgh LLC |
| NERC | | North American Electric Reliability Corporation |
| Net Exposure | | Counterparty credit exposure to NRG Yield, Inc. net of collateral |
| NOLs | | Net Operating Losses |
| November 2015 Drop Down Assets | | 75% of the Class B interests of NRG Wind TE Holdco, which owns a portfolio of 12 wind facilities totaling 814 net MW, which was acquired by Yield Operating LLC from NRG on November 3, 2015 |
NOx | | Nitrogen OxideOxides |
| NPNS | | Normal Purchases and Normal Sales |
| NRG | | NRG Energy, Inc. |
| NRG Wind TE Holdco | | NRG Wind TE Holdco LLC |
| NRG Yield, Inc. | | NRG Yield, Inc., together with its consolidated subsidiaries, or the Company |
|
| | |
| NRG Yield LLC | | The holding company through which the projects are owned by NRG, the holder of Class B and Class D units, and NRG Yield, Inc., the holder of the Class A and Class C units |
| NRG Yield Operating LLC | | The holder of the project assets that belong to NRG Yield LLC |
NSPS | | New Source Performance Standards |
| OCI/OCL | | Other comprehensive income/loss |
| OSHA | | Occupational Safety and Health Administration |
| PG&E | | Pacific Gas & Electric Company |
|
| | |
| Pinnacle | | Pinnacle Wind, LLC, the operating subsidiary of Tapestry Wind LLC, which owns the Pinnacle project |
| PJM | | PJM Interconnection, LLC |
| PPA | | Power Purchase Agreement |
| PTC | | Production Tax Credit |
| PUCT | | Public Utility Commission of Texas |
| PUHCA | | Public Utility Holding Company Act of 2005 |
| PURPA | | Public Utility Regulatory Policies Act of 1978 |
| QF | | Qualifying Facility under PURPA |
| REC | | Renewable Energy Certificate |
| Recapitalization | | The adoption of the Company's Second Amended and Restated Certificate of Incorporation which authorized two new classes of common stock, Class C common stock and Class D common stock, and distributed shares of such new classes of common stock to holders of the Company’s outstanding Class A common stock and Class B common stock, respectively, through a stock split on May 14, 2015 |
| ROFO Agreement | | Amended and Restated Right of First Offer Agreement between the Company and NRG |
| RPM | | Reliability Pricing Model |
| RPS | | Renewable Portfolio Standards |
| RPV Holdco | | NRG RPV Holdco 1 LLC |
| RTO | | Regional Transmission Organization |
| SCE | | Southern California Edison |
| SEC | | U.S. Securities and Exchange Commission |
| Senior Notes | | NRG Yield Operating LLC's $500 million of 5.375% unsecured senior notes dueCollectively, the 2024 Senior Notes and the 2026 Senior Notes |
SO2 | | Sulfur Dioxide |
| TA High Desert | | TA-High Desert LLC, the operating subsidiary of NRG Solar Mayfair LLC, which owns the TA High Desert project |
| Taloga | | Taloga Wind, LLC, the operating subsidiary of Tapestry Wind LLC, which owns the Taloga project |
| Tapestry | | Collection of the Pinnacle, Buffalo Bear and Taloga projects |
Terra-Gen | | Terra-Gen Operating Company, LLC |
| Thermal Business | | The Company's thermal business, which consists of thermal infrastructure assets that provide steam, hot water and/or chilled water, and in some instances electricity, to commercial businesses, universities, hospitals and governmental units |
| UPMC | | University of Pittsburgh Medical Center |
| U.S. | | United States of America |
| U.S. DOE | | U.S. Department of Energy |
U.S. GAAP | | Accounting principles generally accepted in the United States |
| Utility Scale Solar | | Solar power projects, typically 20 MW or greater in size (on an alternating current, or AC, basis), that are interconnected into the transmission or distribution grid to sell power at a wholesale level |
| VaR | | Value at Risk |
| VIE | | Variable Interest Entity |
| Walnut Creek | | NRG Walnut Creek, LLC, the operating subsidiary of WCEP Holdings, LLC, which owns the Walnut Creek project |
PART I
Item 1 — Business
General
NRG Yield, Inc., together with its consolidated subsidiaries, or the Company, is a dividend growth-oriented company formed to serve as the primary vehicle through which NRG owns, operates and acquires contracted renewable and conventional generation and thermal infrastructure assets. The Company believes it is well positioned to be a premier company for investors seeking stable and growing dividend income from a diversified portfolio of lower-risk, high-quality assets.
The Company owns a diversified portfolio of contracted renewable and conventional generation and thermal infrastructure assets in the U.S. The Company’s contracted renewable and conventional generation portfolio collectively represents 4,563 net MW as of December 31, 2015 collectively represents2016 4,435 net MW.. Each of these assets sells substantially all of its output pursuant to long-term offtake agreements with creditworthy counterparties. The weighted average remaining contract duration of these offtake agreements was approximately 1716 years as of December 31, 20152016, based on CAFD. The Company also owns thermal infrastructure assets with an aggregate steam and chilled water capacity of 1,3151,319 net MWt and electric generation capacity of 124123 net MW. These thermal infrastructure assets provide steam, hot water and/or chilled water, and, in some instances, electricity to commercial businesses, universities, hospitals and governmental units in multiple locations, principally through long-term contracts or pursuant to rates regulated by state utility commissions.
A complete listing of the Company's interests in facilities, operations and/or projects owned or leased as of December 31, 20152016 can be found in Item 2 — Properties.
History
The Company was formed by NRG Energy, Inc., or NRG, as a Delaware corporation on December 20, 2012. On July 22, 2013, the Company2012 and closed theits initial public offering of 22,511,250 shares of its Class A common stock at an offering price of $22.00 per share.on July 22, 2013. In connection with theits initial public offering, the Company’sCompany's shares of Class A common stock began trading on the New York Stock Exchange under the symbol “NYLD”. The net proceeds to the Company from the offering, after deducting underwriting discounts, were approximately $468 million, of which the Company used $395 million to purchase 19,011,250 NRG Yield LLC Class A units from NRG and $73 million to purchase 3,500,000 NRG Yield LLC Class A units directly from NRG Yield LLC. At the time of the offering, NRG owned 42,738,750 NRG Yield LLC Class B units.
On July 29, 2014, the Company issued 12,075,000 shares of Class A common stock for net proceeds, after underwriting discount and expenses, of $630 million. The Company utilized the proceeds of the offering to acquire 12,075,000 additional Class A units of NRG Yield LLC.“NYLD.”
Effective May 14, 2015, the Company completed a stock split in connection with whichwhereby each outstanding share of Class A common stock was split into one share of Class A common stock and one share of Class C common stock, and each outstanding share of Class B common stock was split into one share of Class B common stock and one share of Class D common stock. The stock split is referred to as the Recapitalization and all references to share or per share amounts in the accompanying consolidated financial statements and applicable disclosures have been retrospectively adjusted to reflect the Recapitalization. Following the Recapitalization, the Company's Class A common stock continued trading on the New York Stock Exchange under the new ticker symbol "NYLD.A" and the Class C common stock began trading under the ticker symbol "NYLD". In addition, on June 29, 2015, the Company completed the issuance of 28,198,000 shares of Class C common stock for net proceeds of $599 million and utilized the proceeds of the offering to acquire 28,198,000 Class C units of NRG Yield LLC."NYLD."
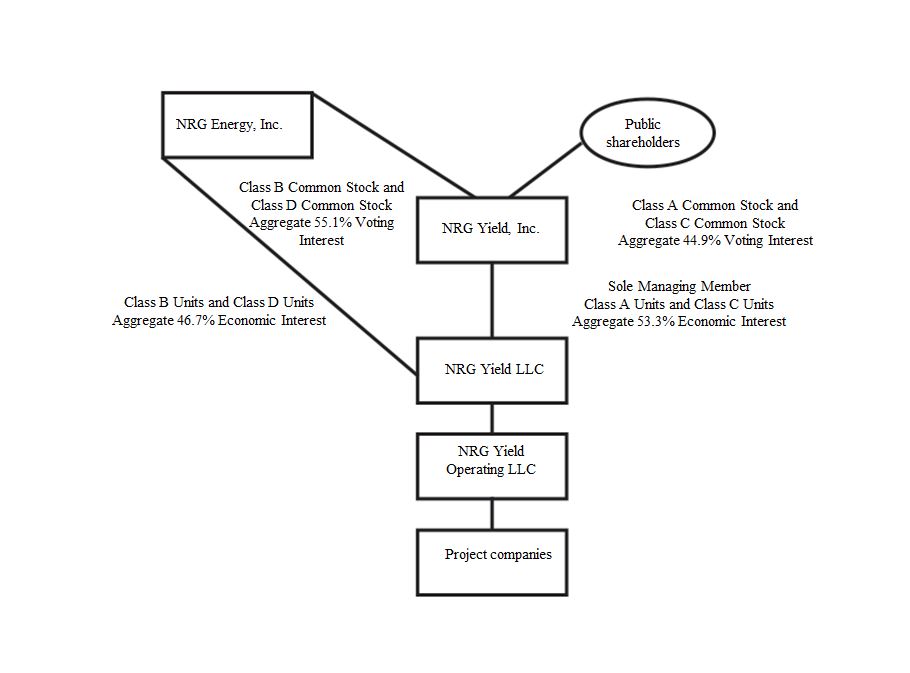
NRG, through its holdings of Class B common stock and Class D common stock, has a 55.1% voting interest in the Company and receives distributions from NRG Yield LLC through its ownership of Class B units and Class D units. The holders of the Company's issued and outstanding shares of Class A common stock and Class C common stock are entitled to dividends as declared and have 44.9% of the voting power in the Company.
As of December 31, 2015, NRG owned 42,738,750 NRG Yield LLC Class B units and 42,738,750 NRG Yield LLC Class D units and the Company owned 34,586,250 NRG Yield LLC Class A units and 62,784,250 NRG Yield LLC Class C units. As of December 31, 2015, the Company and NRG have 53.3% and 46.7% economic interests in NRG Yield LLC, respectively. The Company is the sole managing member of NRG Yield LLC and operates and controls all of its business and affairs and consolidates the financial results of NRG Yield LLC and its subsidiaries. NRG Yield LLC is a holding company for the companies that directly and indirectly own and operate the Company's business. As of December 31, 2016, the Company and NRG have 53.3% and 46.7% economic interests in NRG Yield LLC, respectively. As a result of the current ownership of the Class B common stock and Class D common stock, NRG continues at the present time to control the Company, and the Company in turn, as the sole managing member of NRG Yield LLC, controls NRG Yield LLC and its subsidiaries.
The diagram below depicts the Company’s organizational structure as of December 31, 2015:2016:
Business Strategy
The Company's primary business strategy is to focus on the acquisition and ownership of assets with predictable, long-term cash flows in order that it may be able to increase the cash dividends paid to holders of the Company's Class A and Class C common stock over time without compromising the ongoing stability of the business. The Company's plan for executing this strategy includes the following key components:
Focus on contracted renewable energy and conventional generation and thermal infrastructure assets. The Company owns and operates utility scale and distributed renewable energy and natural gas-fired generation, thermal and other infrastructure assets with proven technologies, low operating risks and stable cash flows. The Company believes by focusing on this core asset class and leveraging its industry knowledge, it will maximize its strategic opportunities, be a leader in operational efficiency and maximize its overall financial performance.
Growing the business through acquisitions of contracted operating assets.The Company believes that its base of operations and relationship with NRG provide a platform in the conventional and renewable power generation and thermal sectors for strategic growth through cash accretive and tax advantaged acquisitions complementary to its existing portfolio. In connectionaddition to acquiring renewable generation, conventional generation and thermal infrastructure assets from third parties where the Company believes its knowledge of the market and operating expertise provides it with its initial public offering,a competitive advantage, the Company entered into a Right of First Offer Agreement with NRG, which was amended and restated in connection withor the Recapitalization, or asROFO Agreement. On February 24, 2017, the Company amended and restated the ROFO Agreement.Agreement, expanding the NRG ROFO pipeline with the addition of 234 net MW of utility-scale solar projects, consisting of Buckthorn, a 154 net MW solar facility in Texas, and Hawaii solar projects, which have a combined capacity of 80 net MW. Under the ROFO Agreement, NRG has granted the Company and its affiliates a right of first offer on any proposed sale, transfer or other disposition of certain assets of NRG for a period of seven years from the completion of the Recapitalization.until February 24, 2022. In addition to the assets described in the table below which reflects the remaining assets subject to sale, the ROFO Agreement also provides the Company with a right of first offer with respect to up to $250 million of equity in one or more residential or distributed solar generation portfolios developed by affiliates of NRG, together with the assets listed in the table below, the NRG ROFO Assets.
| | | Asset | | Fuel Type | | Rated Capacity (MW)(a) | | COD | | Fuel Type | | Rated Capacity (MW)(a) | | COD |
CVSR(b) | | Solar | | 128 | | 2013 | |
Ivanpah(c) | | Solar | | 193 | | 2013 | |
Agua Caliente(d) | | Solar | | 148 | | 2014 | |
Ivanpah(b) | | | Solar | | 193 | | 2013 |
Agua Caliente(c) | | | Solar | | 148 | | 2014 |
| Buckthorn | | | Solar | | 154 | | 2018 |
| Hawaii | | | Solar | | 80 | | 2019 |
| Carlsbad | | Conventional | | 527 | | 2018 | | Conventional | | 527 | | 2018 |
| Puente/Mandalay | | Conventional | | 262 | | 2020 | | Conventional | | 262 | | 2020 |
TE Wind Holdco(e): | | |
Wind TE Holdco(d): | | |
| Elkhorn Ridge | | Wind | | 13 | | 2009 | | Wind | | 13 | | 2009 |
| San Juan Mesa | | Wind | | 22 | | 2005 | | Wind | | 22 | | 2005 |
| Wildorado | | Wind | | 40 | | 2007 | | Wind | | 40 | | 2007 |
| Crosswinds | | Wind | | 5 | | 2007 | | Wind | | 5 | | 2007 |
| Forward | | Wind | | 7 | | 2008 | | Wind | | 7 | | 2008 |
| Hardin | | Wind | | 4 | | 2007 | | Wind | | 4 | | 2007 |
| Odin | | Wind | | 5 | | 2007 | | Wind | | 5 | | 2007 |
| Sleeping Bear | | Wind | | 24 | | 2007 | | Wind | | 24 | | 2007 |
| Spanish Fork | | Wind | | 5 | | 2008 | | Wind | | 5 | | 2008 |
| Goat Wind | | Wind | | 37 | | 2008/2009 | | Wind | | 37 | | 2008/2009 |
| Lookout | | Wind | | 9 | | 2008 | | Wind | | 9 | | 2008 |
| Elbow Creek | | Wind | | 30 | | 2008 | | Wind | | 30 | | 2008 |
| Community | | Wind | | 30 | | 2011 | | Wind | | 30 | | 2011 |
| Jeffers | | Wind | | 50 | | 2008 | | Wind | | 50 | | 2008 |
Minnesota Portfolio(f) | | Wind | | 40 | | 2003/2006 | |
Minnesota Portfolio(e) | | | Wind | | 40 | | 2003/2006 |
(a) Represents the maximum, or rated, electricity generating capacity of the facility in MW multiplied by NRG's percentage ownership interest in the facility as of December 31, 2015.2016.
(b)Represents NRG’s remaining 51.05% ownership interest in CVSR.
(c) Represents 49.95% of NRG's 50.01% ownership interest in Ivanpah. Following a sale of this 49.95% interest, the remaining 50.05% of Ivanpah would be owned by NRG, Google Inc. and BrightSource Energy Inc.
(d)(c) Represents NRG’s 51% ownership interest in Agua Caliente. The remaining 49% of Agua Caliente is owned by MidAmerican EnergyBHE AC Holdings, Inc.LLC. As further described below, the Company has entered into an agreement with NRG to acquire 16% of Agua Caliente.
(e)(d) Represents NRG's remaining 25% of the Class B interests of NRG Wind TE Holdco. NRG Yield, Inc. acquired 75% of the Class B interests in November 2015. A tax equity investor owns the Class A interests in NRG Wind TE Holdco.
(f)(e) Includes Bingham Lake, Eastridge, and Westridge projects.
NRG is not obligated to sell the remaining NRG ROFO Assets to the Company and, if offered by NRG, the Company cannot be sure whether these assets will be offered on acceptable terms, or that the Company will choose to consummate such acquisitions. In addition, NRG may offer additional assets to the Company, as described in Item 7 — Management's Discussion and Analysis of Financial Condition and Results of Operations.
In December 2016, NRG offered the Company the opportunity to purchase the following assets: (i) the Minnesota Portfolio, a 40 MW portfolio of wind projects; (ii) the 30 MW Community wind project; (iii) the 50 MW Jeffers wind projects; and (iv) a 16% interest in the 290 MW Agua Caliente solar project, pursuant to the ROFO Agreement. In addition to these ROFO Assets, NRG also offered the Company the opportunity to purchase NRG's 50% interests in seven utility-scale solar projects located in Utah, representing 265 net MW of capacity, based on cash to be distributed, that were part of NRG's recent acquisition of projects from SunEdison.
On February 24, 2017, the Company and NRG entered into a definitive agreement regarding the acquisition of the following facilities: (i) a 16% interest (approximately 31% of NRG's 51% interest) in the Agua Caliente solar farm, one of the NRG ROFO assets, representing ownership of approximately 46 net MW of capacity. Agua Caliente is located in Yuma County, AZ and sells power subject to a 25-year PPA with Pacific Gas and Electric, with 22 years remaining on that contract; and (ii) NRG's 50% interests in seven utility-scale solar farms located in Utah representing 265 net MW of capacity, based on cash to be distributed, that were part of NRG's recent acquisition of projects from SunEdison. The Utah assets achieved commercial operations in 2016, sell power subject to 20-year PPAs with PacifiCorp, a subsidiary of Berkshire Hathaway and are part of a tax equity structure with Dominion Solar Projects III, Inc., or Dominion, from which NRG currently receives 50% of cash to be distributed. The Company may also have opportunitiesexpects to acquire other generationpay total cash consideration of $130 million for the transaction, excluding adjustments for working capital and thermal infrastructure assets from third parties whereassume non-recourse project debt of approximately $328 million, which will be consolidated, as well as its pro-rata share of non-recourse project level debt of $136 million. The Company elected not to pursue the Company believes its knowledgeacquisition of the marketMinnesota Portfolio, Community and operating expertise provides itJeffers wind projects at this time, but may continue its evaluation of the projects. The Company has retained the right with NRG, pursuant to the ROFO Agreement, to participate in any third party process to the extent NRG elected to pursue a competitive advantage.third party sale of these assets.
Primary Focusfocus on North America. The Company intends to primarily focus its investments in North America (including the unincorporated territories of the U.S.). The Company believes that industry fundamentals in North America present it with significant opportunity to acquire renewable, natural gas-fired generation and thermal infrastructure assets, without creating significant exposure to currency and sovereign risk. By primarily focusing its efforts on North America, the Company believes it will best leverage its regional knowledge of power markets, industry relationships and skill sets to maximize the performance of the Company.
Maintain sound financial practices to grow the dividend. The Company intends to maintain a commitment to disciplined financial analysis and a balanced capital structure to enable it to increase its quarterly dividend over time and serve the long-term interests of its stockholders. The Company's financial practices include a risk and credit policy focused on transacting with credit-worthy counterparties; a financing policy, which focuses on seeking an optimal capital structure through various capital formation alternatives to minimize interest rate and refinancing risks, ensure stable long-term dividends and maximize value; and a dividend policy that is based on distributing a significant portion of CAFD each quarter that the Company receives from NRG Yield LLC, subject to available capital, market conditions, and compliance with associated laws, regulations and other contractual obligations. The Company intends to evaluate various alternatives for financing future acquisitions and refinancing of existing project-level debt, in each case, to reduce the cost of debt, extend maturities and maximize CAFD. The Company believes it has additional flexibility to seek alternative financing arrangements, including, but not limited to, debt financings at a holding company level.and equity-like instruments.
Competition
Power generation is a capital-intensive business with numerous and diverse industry participants. The Company competes on the basis of the location of its plants and on the basis of contract price and terms of individual project.projects. Within the power industry, there is a wide variation in terms of the capabilities, resources, nature and identity of the companies with whom the Company competes with depending on the market. Competitors for energy supply are utilities, independent power producers and other providers of distributed generation. The Company also competes to acquire new projects with solarrenewable developers who retain solarrenewable power plant ownership, independent power producers, financial investors and other dividend, growth-oriented companies. Competitive conditions may be substantially affected by capital market conditions and by various forms of energy legislation and regulation considered by federal, state and local legislatures and administrative agencies.agencies, including tax policy. Such laws and regulations may substantially increase the costs of acquiring, constructing and operating projects, and it could be difficult for the Company to adapt to and operate under such laws and regulations.
The Company's thermal business has certain cost efficiencies that may form barriers to entry. Generally, there is only one district energy system in a given territory, for which the only competition comes from on-site systems. While the district energy system can usually make an effective case for the efficiency of its services, some building owners nonetheless may opt for on-site systems, either due to corporate policies regarding allocation of capital, unique situations where an on-site system might in fact prove more efficient, or because of previously committed capital in systems that are already on-site. Growth in existing district energy systems generally comes from new building construction or existing building conversions within the service territory of the district energy provider.
Competitive Strengths
Stable, high quality cash flows. The Company's facilities have a highly stable, predictable cash flow profile consisting of predominantly long-life electric generation assets that sell electricity under long-term fixed priced contracts or pursuant to regulated rates with investment grade and certain other credit-worthy counterparties. Additionally, the Company's facilities have minimal fuel risk. For the Company's five conventional assets, fuel is provided by the toll counterparty or the cost thereof is a pass-through cost under the CfD. Renewable facilities have no fuel costs, and most of the Company's thermal infrastructure assets have contractual or regulatory tariff mechanisms for fuel cost recovery. The offtake agreements for the Company's conventional and renewable generation facilities have a weighted-average remaining duration of approximately 1716 years as of December 31, 2015,2016, based on CAFD, providing long-term cash flow stability. The Company's generation offtake agreements with counterparties for whom credit ratings are available have a weighted-average Moody’s rating of A3 based on rated capacity under contract. All of the Company's assets are in the U.S. and accordingly have no currency or repatriation risks.
High quality, long-lived assets with low operating and capital requirements. The Company benefits from a portfolio of relatively newly-constructed assets, other than thermal infrastructure assets. The Company's assets are comprised of proven and reliable technologies, provided by leading original solar and wind equipment manufacturers such as General Electric, Siemens AG, SunPower Corporation, or SunPower, First Solar Inc., or First Solar, Vestas, Suzlon and Mitsubishi. Given the modern nature of the portfolio, which includes a substantial number of relatively low operating and maintenance cost solar and wind generation assets, the Company expects to achieve high fleet availability and expend modest maintenance-related capital expenditures. The Company estimates each of its solar and wind portfolios have weighted average remaining expected lives based on CAFD of approximately 20 years. Additionally, with the support of services provided by NRG, the Company expects to continue to implement the same rigorous preventative operating and management practices that NRG uses across its fleet of assets. In 2015, NRG achieved a 0.71 OSHA recordable rate, which is within the top quartile plant operating performance for its entire fleet, based on applicable OSHA standards.
Significant scale and diversity. The Company owns and operates a large and diverse portfolio of contracted electric generation and thermal infrastructure assets. As of December 31, 2015,2016, the Company's 4,4354,563 net MW contracted generation portfolio benefits from significant diversification in terms of technology, fuel type, counterparty and geography. The Company's thermal business consists of twelve operations, seven of which are district energy centers that provide steam and chilled water to approximately 695705 customers, and five of which provide generation. The Company believes its scale and access to best practices across the fleet improves its business development opportunities through enhanced industry relationships, reputation and understanding of regional power market dynamics. Furthermore, the Company's diversification reduces its operating risk profile and reliance on any single market.
Relationship with NRG. The Company believes its relationship with NRG, including NRG’s expressed intention to maintain a controlling interest in the Company, provides significant benefits including management and operational expertise, and future growth opportunities. The Company's executive officers have considerable experience in owning and operating, as well as developing, acquiring and integrating, generation and thermal infrastructure assets:to the Company, including:
• NRG Management and Operational Expertise. The Company has access to the significant resources of NRG, the largest competitive power generator in the U.S., to support theits operational, finance,financial, legal, regulatory and environmental aspects, and growth strategy of its business. As such, the Company believes it avails itself of best-in-class resources, including management and operational expertise.functions.
• NRG Asset Development and Acquisition Track Record. NRG's development and strategic teams are focused on the development and acquisition of renewable and conventional generation assets. They have successfully helped grow NRG's powerassets, which may provide future growth opportunities for the Company in addition to the assets set forth in the ROFO Agreement. The Company believes NRG’s ownership position in the Company incentivizes NRG to support the Company's growth strategy, including through the development of renewable and conventional generation portfolio from 24,365 netprojects. During 2016, NRG acquired 1,639 MWs at the end of 2009 to 49,324 netutility scale solar and wind projects and 107 MWs as of December 31, 2015.distributed generation and community solar projects that are currently under development or in operation.
• NRG Financing Experience.Expertise. The Company, believeswith the support of NRG, has demonstratedbeen able to achieve a successful track record of sourcing attractive low-cost, long duration capital to fund project development and acquisitions. The Company expects to continue to realize significant benefits from NRG’s financing and structuring expertise as well as its relationships with financial institutions and other lenders.
Environmentally well-positioned portfolio of assets. On a net capacity basis, theThe Company's portfolio of electric generation assets consists of 2,4902,618 net MW of renewable generation capacity that are non-emitting sources of power generation. The Company's conventional assets consist of the dual fuel-fired GenConn assets as well as the Marsh Landing and Walnut Creek simple cycle natural gas-fired peaking generation facilities and the El Segundo combined cycle natural gas-fired peaking facility. The Company does not anticipate having to expend any significant capital expenditures in the foreseeable future to comply with current environmental regulations applicable to its generation assets. Taken as a whole, the Company believes its strategy will be a net beneficiary of current and potential environmental legislation and regulatory requirements that may serve as a catalyst for capacity retirements and improve market opportunities for environmentally well-positioned assets like the Company's assets once its current offtake agreements expire.
Thermal infrastructure business has high entry costs. Significant capital has been invested to construct the Company's thermal infrastructure assets, serving as a barrier to entry in the markets in which such assets operate. As of December 31, 2015,2016, the Company's thermal gross property, plant, and equipment was approximately $452$467 million. The Company's thermal district energy centers are located in urban city areas, with the chilled water and steam delivery systems located underground. Constructing underground delivery systems in urban areas requires long lead times for permitting, rights of way and inspections and is costly. By contrast, the incremental cost to add new customers in existing markets is relatively low. Once thermal infrastructure is established, the Company believes it has the ability to retain customers over long periods of time and to compete effectively for additional business against stand-alone on-site heating and cooling generation facilities. Installation of stand-alone equipment can require significant modification to a building as well as significant space for equipment and funding for capital expenditures. The Company's system technologies often provide economies of scale in terms of fuel procurement, ability to switch between multiple types of fuel to generate thermal energy, and fuel conversion efficiency. The Company's top ten thermal customers, which make up approximately 7% of the Company's consolidated revenues for the year ended December 31, 2015, have had a relationship with the Company for an average of over 20 years.
Segment Review
The following table summarizestables summarize the Company's operating revenues, net income (loss) and assets by segment for the years ended December 31, 2016, 2015 2014, and 2013,2014, as discussed in Item 15 — Note 12,13, Segment Reporting, to the Consolidated Financial Statements. Refer to that footnote for additional information about the Company's segments. In addition, refer to Item 2 — Properties, for information about the facilities in each of the Company's segments. All amounts have been recast to include the effect of the acquisitions of the Drop Down Assets, which were accounted for as transfers of entities under common control. The accounting guidance requires retrospective combination of the entities for all periods presented as if the combination has been in effect since the inception of common control. Accordingly, the Company prepared its consolidated financial statements to reflect the transfers as if they had taken place from the beginning of the financial statements period or from the date the entities were under common control (if later than the beginning of the financial statements period).
|
| | | | | | | | | | | | | | | | | | | |
| Year ended December 31, 2015 |
| (In millions) | Conventional Generation |
| Renewables |
| Thermal |
| Corporate |
| Total |
| Operating revenues | $ | 336 |
| | $ | 359 |
| | $ | 174 |
| | $ | — |
| | $ | 869 |
|
| Net income (loss) | 156 |
| | (35 | ) | | 22 |
| | (88 | ) | | 55 |
|
| Total assets | 2,102 |
| | 5,056 |
| | 428 |
| | 189 |
| | 7,775 |
|
| | | | Year ended December 31, 2014 | Year ended December 31, 2016 |
| (In millions) | Conventional Generation | | Renewables | | Thermal | | Corporate | | Total | Conventional Generation |
| Renewables |
| Thermal |
| Corporate |
| Total |
| Operating revenues | $ | 317 |
| | $ | 234 |
| | $ | 195 |
| | $ | — |
| | $ | 746 |
| $ | 333 |
| | $ | 518 |
| | $ | 170 |
| | $ | — |
| | $ | 1,021 |
|
| Net income (loss) | 141 |
| | (28 | ) | | 31 |
| | (45 | ) | | 99 |
| 153 |
| | (103 | ) | | 29 |
| | (94 | ) | | (15 | ) |
| Total assets | 2,169 |
| | 4,790 |
| | 436 |
| | 465 |
| | 7,860 |
| 1,993 |
| | 5,535 |
| | 426 |
| | 429 |
| | 8,383 |
|
| | | | Year ended December 31, 2013 | Year ended December 31, 2015 |
| (In millions) | Conventional Generation | | Renewables | | Thermal | | Corporate | | Total | Conventional Generation | | Renewables | | Thermal | | Corporate | | Total |
| Operating revenues | $ | 138 |
| | $ | 97 |
| | $ | 152 |
| | $ | — |
| | $ | 387 |
| $ | 336 |
| | $ | 443 |
| | $ | 174 |
| | $ | — |
| | $ | 953 |
|
| Net income (loss) | 87 |
| | 31 |
| | 20 |
| | (15 | ) | | 123 |
| 156 |
| | (25 | ) | | 22 |
| | (88 | ) | | 65 |
|
| Total assets | | 2,102 |
| | 5,970 |
| | 428 |
| | 189 |
| | 8,689 |
|
|
| | | | | | | | | | | | | | | | | | | |
| | Year ended December 31, 2014 |
| (In millions) | Conventional Generation | | Renewables | | Thermal | | Corporate | | Total |
| Operating revenues | $ | 317 |
| | $ | 316 |
| | $ | 195 |
| | $ | — |
| | $ | 828 |
|
| Net income (loss) | 141 |
| | (19 | ) | | 31 |
| | (45 | ) | | 108 |
|
Government Incentives
Government incentives, including PTCs and ITCs, can enhance the economics of the Company's generating assets and investments by providing, for example, loan guarantees, cash grants, favorable tax treatment, favorable depreciation rules or other incentives. Certain recentThe Company cannot predict the effects that the new U.S. presidential administration will have on government approvals have enhanced federal incentives for renewable generation — including through the extension of the wind power Production Tax Credit and the extension of the solar Investment Tax Credit as further described in Regulatory Developments and could incentivize the development of additional renewable energy projects that would fit within the Company’s asset portfolio. In addition, direct cash incentives may encourage additional renewable energy development by entities that cannot presently benefit from tax credits.
incentives.
Regulatory Matters
As owners of power plants and participants in wholesale and thermal energy markets, certain of the Company's subsidiaries are subject to regulation by various federal and state government agencies. These agencies include FERC and the PUCT, as well as other public utility commissions in certain states where the Company's assets are located. Each of the Company's U.S. generating facilities qualifies as an EWG or QF. In addition, the Company is subject to the market rules, procedures and protocols of the various ISO and RTO markets in which it participates. Likewise, the Company must also comply with the mandatory reliability requirements imposed by NERC and the regional reliability entities in the regions where the Company operates. The Company's operations within the ERCOT footprint are not subject to rate regulation by FERC, as they are deemed to operate solely within the ERCOT market and not in interstate commerce. These operations are subject to regulation by PUCT.
CFTC
The CFTC, among other things, has regulatory oversight authority overregulates the trading of swaps, futures and many commodities under the Commodity Exchange Act, or CEA. Since 2010, there have been a number of reforms to the regulation of the derivatives markets, both in the U.S. and internationally.markets. These regulations, and any further changes thereto, or adoption of additional regulations, including any regulations relating to position limits on futures and other derivatives or margin for derivatives, could negatively impact the Company’s ability to hedge its portfolio in an efficient, cost-effective manner by, among other things, potentially decreasing liquidity in the forward commodity and derivatives markets or limiting the Company’s ability to utilize non-cash collateral for derivatives transactions.
FERC
FERC, among other things, regulates the transmission and the wholesale sale of electricity in interstate commerce under the authority of the FPA. The transmission of electric energy occurring wholly within ERCOT is not subject to FERC’s jurisdiction under Sections 203 or 205 of the FPA. Under existing regulations, FERC determines whether an entity owning a generation facility is an EWG, as defined in the PUHCA. FERC also determines whether a generation facility meets the ownership and technical criteria of a QF under the PURPA. Each of the Company’s non-ERCOT U.S. generating facilities qualifies as an EWG.
The FPA gives FERC exclusive rate-making jurisdiction over the wholesale sale of electricity and transmission of electricity in interstate commerce of public utilities (as defined by the FPA). Under the FPA, FERC, with certain exceptions, regulates the owners of facilities used for the wholesale sale of electricity or transmission in interstate commerce as public utilities, and establishes market rules that are just and reasonable.
Public utilities are required to obtain FERC’s acceptance, pursuant to Section 205 of the FPA, of their rate schedules for the wholesale sale of electricity. All of the Company’s non-QF generating entities located outside of ERCOT make sales of electricity pursuant to market-based rates, as opposed to traditional cost-of-service regulated rates. Every three years FERC will conduct a review of the Company’s market based rates and potential market power on a regional basis.
In accordance with the Energy Policy Act of 2005, FERC has approved the NERC as the national Energy Reliability Organization, or ERO. As the ERO, NERC is responsible for the development and enforcement of mandatory reliability standards for the wholesale electric power system. In addition to complying with NERC requirements, each NRG entity must comply with the requirements of the regional reliability entity for the region in which it is located.
The PURPA was passed in 1978 in large part to promote increased energy efficiency and development of independent power producers. The PURPA created QFs to further both goals, and FERC is primarily charged with administering the PURPA as it applies to QFs. Certain QFs are exempt from regulation, either in whole or in part, under the FPA as public utilities.
The PUHCA provides FERC with certain authority over and access to books and records of public utility holding companies not otherwise exempt by virtue of their ownership of EWGs, QFs, and Foreign Utility Companies. The Company is exempt from many of the accounting, record retention, and reporting requirements of the PUHCA.
Regulatory Developments
U.S. Supreme Court Agrees to Consider the Constitutionality of Maryland's Generator Contracting Programs — On October 19, 2015, the U.S. Supreme Court agreed to hear challenges to one of two cases involving the rights of states to enter into long-term contracts for power generation facilities. The case involves the right of the Maryland Public Service Commission to award long-term power purchase contracts to a generation developer to encourage the construction of new generation capacity in Maryland. The constitutionality of the long-term contracts was challenged in the U.S. District Court for the District of Maryland, which, in an October 24, 2013, decision, found that the contract violated the Supremacy Clause of the U.S. Constitution and was invalid. On June 30, 2014, the U.S. Court of Appeals for the Fourth Circuit affirmed the Maryland District Court's decision. A companion case alleging similar facts in New Jersey will be decided in accordance with the Supreme Court’s decision in the Maryland case. NRG filed a friend-of-the-court brief urging the Supreme Court to uphold the right of states to enter into long-term contracts, which play an important role in financing new generation resources. The Supreme Court heard oral argument on February 24, 2016, and the outcome of this litigation could have broad impacts on how states contract with new generation resources, as well as how such contracted resources interact with the wholesale markets.
Solar ITC and Wind PTC Extensions — In December 2015, the U.S. Congress enacted an extension of the 30% solar ITC so that projects that begin construction in 2016 through 2019 will continue to qualify for the 30% ITC. Projects beginning construction in 2020 and 2021 will be eligible for the ITC at the rates of 26% and 22%, respectively. The same legislation also extended the 10-year wind PTC for wind projects that begin construction in years 2016 through 2019. Wind projects that begin construction in the years 2017, 2018 and 2019 are eligible for PTC at 80%, 60% and 40% of the statutory rate per kWh, respectively. The extension of the ITC and PTC could promote additional development of solar and wind energy resources.
Environmental Matters
The Company is subject to a wide range of environmental laws in the development, construction, ownership and operation of projects. These laws generally require that governmental permits and approvals be obtained before construction and during operation of facilities. The Company is also subject to laws regarding the protection of wildlife, including migratory birds, eagles, and threatened and endangered species. EnvironmentalFederal and state environmental laws have become increasinglymore stringent and the Company expectsover time, although this trend could change in the near term with respect to continue.federal laws under the new U.S. presidential administration.
In October 2015, the EPA promulgated a GHG emissions rule for existing fossil-fuel-fired electric generating units. The rule is calledfinalized the Clean Power Plan, or CPP.CPP, addressing GHG emissions from existing EGUs. On February 9, 2016, the U.S. Supreme Court stayed the CPP. The CPP faces numerousU.S. Court of Appeals for the D.C. Circuit, sitting en banc, heard oral argument on the legal challenges that likely will take several years to resolve. Ifthe CPP in September 2016. Due to the ongoing litigation and the potential impact of the new U.S. presidential administration, the Company believes the CPP is eventually upheld, it may take several more years for the impacts of this rulenot likely to be clear as states would be required to develop and put in place plans to implement the rule to achieve state-specific goals.survive.
Customers
The Company sells its electricity and environmental attributes, including RECs, primarily to local utilities under long-term, fixed-price PPAs. During the year ended December 31, 2015,2016, the Company derived approximately 43%42% of its consolidated revenue from Southern California Edison, or SCE, and approximately 17%23% of its consolidated revenue from Pacific Gas and Electric, or PG&E.
Employees
The Company employs Christopher Sotos as its President and Chief Executive Officer and Chad Plotkin as its Senior Vice President and Chief Financial Officer. Other than Messrs. Sotos and Plotkin, the Company does not employ any of the individuals who manage operations.other employees. The personnel that carry out these activitiesmanage operations of the Company are employees of NRG or third parties managed by NRG, and their services are provided for the Company's benefit under the Management Services Agreement and project operations and maintenance agreements with NRG as described in Item 15 — Note 1415, Related Party Transactions, to the Consolidated Financial Statements.
Available Information
The Company's annual reports on Form 10-K, quarterly reports on Form 10-Q, current reports on Form 8-K, and amendments to those reports filed or furnished pursuant to section 13(a) or 15(d) of the Exchange Act are available free of charge through the Company's website, www.nrgyield.com, as soon as reasonably practicable after they are electronically filed with, or furnished to, the SEC. The Company also routinely posts press releases, presentations, webcasts, and other information regarding the Company on its website.
Item 1A — Risk Factors
Risks Related to the Company's Business
Certain facilities are newly constructed and may not perform as expected.
Certain of the Company's conventional and renewable assets are newly constructed. The ability of these facilities to meet the Company's performance expectations is subject to the risks inherent in newly constructed power generation facilities and the construction of such facilities, including, but not limited to, degradation of equipment in excess of the Company's expectations, system failures, and outages. The failure of these facilities to perform as the Company expects could have a material adverse effect on the Company's business, financial condition, results of operations, and cash flows and its ability to pay dividends to holders of the Company's common stock.
Pursuant to the Company's cash dividend policy, the Company intends to distribute all or substantially all of the CAFD through regular quarterly distributions and dividends, and the Company's ability to grow and make acquisitions through cash on hand could be limited.
The Company expects to distribute all or substantially all of the CAFD each quarter and to rely primarily upon external financing sources, including the issuance of debt and equity securities and, if applicable, borrowings under the Company's amended and restated revolving credit facility to fund acquisitions and growth capital expenditures. The Company may be precluded from pursuing otherwise attractive acquisitions if the projected short-term cash flow from the acquisition or investment is not adequate to service the capital raised to fund the acquisition or investment, after giving effect to the Company's available cash reserves. The Company's growth may not be as fast as that of businesses that reinvest their available cash to expand ongoing operations. To the extent the Company issues additional equity securities in connection with any acquisitions or growth capital expenditures, the payment of dividends on these additional equity securities may increase the risk that the Company will be unable to maintain or increase its per share dividend. The incurrence of bank borrowings or other debt by NRG Yield Operating LLC or by the Company's project-level subsidiaries to finance the Company’s growth strategy will result in increased interest expense and the imposition of additional or more restrictive covenants, which, in turn, may impact the cash distributions the Company receives to distribute to holders of the Company’s common stock.
The Company may not be able to effectively identify or consummate any future acquisitions on favorable terms, or at all.
The Company's business strategy includes growth through the acquisitions of additional generation assets (including through corporate acquisitions). This strategy depends on the Company’s ability to successfully identify and evaluate acquisition opportunities and consummate acquisitions on favorable terms. However, the number of acquisition opportunities is limited. In addition, the Company will compete with other companies for these limited acquisition opportunities, which may increase the Company’s cost of making acquisitions or cause the Company to refrain from making acquisitions at all. Some of the Company’s competitors for acquisitions are much larger than the Company with substantially greater resources. These companies may be able to pay more for acquisitions and may be able to identify, evaluate, bid for and purchase a greater number of assets than the Company’s financial or human resources permit. If the Company is unable to identify and consummate future acquisitions, it will impede the Company’s ability to execute its growth strategy and limit the Company’s ability to increase the amount of dividends paid to holders of the Company’s common stock.
Furthermore, the Company’s ability to acquire future renewable facilities may depend on the viability of renewable assets generally. These assets currently are largely contingent on public policy mechanisms including ITCs, cash grants, loan guarantees, accelerated depreciation, RPS and carbon trading plans. These mechanisms have been implemented at the state and federal levels to support the development of renewable generation, demand-side and smart grid and other clean infrastructure technologies. The availability and continuation of public policy support mechanisms will drive a significant part of the economics and viability of the Company’s growth strategy and expansion into clean energy investments.
The Company’s ability to effectively consummate future acquisitions will also depend on the Company’s ability to arrange the required or desired financing for acquisitions.
The Company may not have sufficient availability under the Company’s credit facilities or have access to project-level financing on commercially reasonable terms when acquisition opportunities arise. An inability to obtain the required or desired financing could significantly limit the Company’s ability to consummate future acquisitions and effectuate the Company’s growth strategy. If financing is available, utilization of the Company’s credit facilities or project-level financing for all or a portion of the purchase price of an acquisition could significantly increase the Company’s interest expense, impose additional or more restrictive
covenants and reduce CAFD. Similarly, the issuance of additional equity securities as consideration for acquisitions could cause significant stockholder dilution and reduce the Company’s per share CAFDdividends if the acquisitions are not sufficiently accretive. The Company’s ability to consummate future acquisitions may also depend on the Company’s ability to obtain any required regulatory approvals for such acquisitions, including, but not limited to, approval by FERC under Section 203 of the FPA.
Finally, the acquisition of companies and assets are subject to substantial risks, including the failure to identify material problems during due diligence (for which the Company may not be indemnified post-closing), the risk of over-paying for assets (or not making acquisitions on an accretive basis) and the ability to retain customers. Further, the integration and consolidation of acquisitions requires substantial human, financial and other resources and, ultimately, the Company's acquisitions may divert management’s attention from the Company's existing business concerns, disrupt the Company's ongoing business or not be successfully integrated. There can be no assurances that any future acquisitions will perform as expected or that the returns from such acquisitions will support the financing utilized to acquire them or maintain them. As a result, the consummation of acquisitions may have a material adverse effect on the Company's business, financial condition, results of operations, and cash flows and ability to pay dividends to holders of the Company’s common stock.
Even if the Company consummates acquisitions that it believes will be accretive to CAFD per share of Class A common stock and Class C common stock, those acquisitions may decrease the CAFD per share of Class A common stock and Class C common stock as a result of incorrect assumptions in the Company’s evaluation of such acquisitions, unforeseen consequences or other external events beyond the Company’s control.
The acquisition of existing generation assets involves the risk of overpaying for such projects (or not making acquisitions on an accretive basis) and failing to retain the customers of such projects. While the Company will perform due diligence on prospective acquisitions, the Company may not discover all potential risks, operational issues or other issues in such generation assets. Further, the integration and consolidation of acquisitions require substantial human, financial and other resources and, ultimately, the Company’s acquisitions may divert the Company’s management’s attention from its existing business concerns, disrupt its ongoing business or not be successfully integrated. Future acquisitions might not perform as expected or the returns from such acquisitions might not support the financing utilized to acquire them or maintain them. A failure to achieve the financial returns the Company expects when it acquires generation assets could have a material adverse effect on the Company’s ability to grow its business and make cash distributions to its Class A and Class C stockholders. Any failure of the Company’s acquired generation assets to be accretive or difficulty in integrating such acquisition into the Company’s business could have a material adverse effect on the Company’s ability to grow its business and make cash distributions to its Class A and Class C stockholders.
The Company’s indebtedness could adversely affect its ability to raise additional capital to fund the Company’s operations or pay dividends. It could also expose the Company to the risk of increased interest rates and limit the Company’s ability to react to changes in the economy or the Company’s industry as well as impact the Company’s CAFD.results of operations, financial condition and cash flows.
As of December 31, 2015,2016, the Company had approximately $4,863$5,770 million of total consolidated indebtedness, $3,461$4,314 million of which was incurred by the Company's non-guarantor subsidiaries. In addition, the Company’s share of its unconsolidated affiliates’ total indebtedness and letters of credit outstanding as of December 31, 2015,2016, totaled approximately $842$453 million and $83$86 million, respectively (calculated as the Company’s unconsolidated affiliates’ total indebtedness as of such date multiplied by the Company’s percentage membership interest in such assets).
The Company’s substantial debt could have important negative consequences on the Company’s financial condition, including:
increasing the Company’s vulnerability to general economic and industry conditions;
requiring a substantial portion of the Company’s cash flow from operations to be dedicated to the payment of principal and interest on the Company’s indebtedness, therefore reducing the Company’s ability to pay dividends to holders of the Company’s capital stock (including the Class A and Class C common stock) or to use the Company’s cash flow to fund its operations, capital expenditures and future business opportunities;
limiting the Company’s ability to enter into long-term power sales or fuel purchases which require credit support;
limiting the Company’s ability to fund operations or future acquisitions;
restricting the Company’s ability to make certain distributions with respect to the Company’s capital stock (including the Class A and Class C common stock) and the ability of the Company’s subsidiaries to make certain distributions to it, in light of restricted payment and other financial covenants in the Company’s credit facilities and other financing agreements;
exposing the Company to the risk of increased interest rates because certain of the Company’s borrowings, which may include borrowings under the Company’s amended and restated revolving credit facility, are at variable rates of interest;
limiting the Company’s ability to obtain additional financing for working capital including collateral postings, capital expenditures, debt service requirements, acquisitions and general corporate or other purposes; and
limiting the Company’s ability to adjust to changing market conditions and placing it at a competitive disadvantage compared to the Company’s competitors who have less debt.
The Company's amended and restated revolving credit facility contains financial and other restrictive covenants that limit the Company’s ability to return capital to stockholders or otherwise engage in activities that may be in the Company’s long-term best interests. The Company’s inability to satisfy certain financial covenants could prevent the Company from paying cash dividends, and the Company’s failure to comply with those and other covenants could result in an event of default which, if not cured or waived, may entitle the related lenders to demand repayment or enforce their security interests, which could have a material adverse effect on the Company’s business, financial condition, results of operations and cash flows. In addition, failure to comply with such covenants may entitle the related lenders to demand repayment and accelerate all such indebtedness.
The agreements governing the Company’s project-level financing contain financial and other restrictive covenants that limit the Company’s project subsidiaries’ ability to make distributions to the Company or otherwise engage in activities that may be in the Company’s long-term best interests. The project-level financing agreements generally prohibit distributions from the project entities to the Company unless certain specific conditions are met, including the satisfaction of certain financial ratios. The Company’s inability to satisfy certain financial covenants may prevent cash distributions by the particular project(s) to it and, the Company’s failure to comply with those and other covenants could result in an event of default which, if not cured or waived may entitle the related lenders to demand repayment or enforce their security interests, which could have a material adverse effect on the Company’s business, results of operations and financial condition. In addition, failure to comply with such covenants may entitle the related lenders to demand repayment and accelerate all such indebtedness. If the Company is unable to make distributions from the Company’s project-level subsidiaries, it would likely have a material adverse effect on the Company’s ability to pay dividends to holders of the Company’s common stock.
Letter of credit facilities to support project-level contractual obligations generally need to be renewed after five to seven years, at which time the Company will need to satisfy applicable financial ratios and covenants. If the Company is unable to renew the Company’s letters of credit as expected or replace them with letters of credit under different facilities on favorable terms or at all, the Company may experience a material adverse effect on its business, financial condition, or results of operations and cash flows. Furthermore, such inability may constitute a default under certain project-level financing arrangements, restrict the ability of the project-level subsidiary to make distributions to it and/or reduce the amount of cash available at such subsidiary to make distributions to the Company.
In addition, the Company’s ability to arrange financing, either at the corporate level or at a non-recourse project-level subsidiary, and the costs of such capital, are dependent on numerous factors, including:
general economic and capital market conditions;
credit availability from banks and other financial institutions;
investor confidence in the Company, its partners, NRG, as the Company’s principal stockholder (on a combined voting basis) and manager under the Management Services Agreement, and the regional wholesale power markets;
the Company’s financial performance and the financial performance of the Company subsidiaries;
the Company’s level of indebtedness and compliance with covenants in debt agreements;
maintenance of acceptable project credit ratings or credit quality;
cash flow; and
provisions of tax and securities laws that may impact raising capital.
The Company may not be successful in obtaining additional capital for these or other reasons. Furthermore, the Company may be unable to refinance or replace project-level financing arrangements or other credit facilities on favorable terms or at all upon the expiration or termination thereof. The Company's failure, or the failure of any of the Company’s projects, to obtain additional capital or enter into new or replacement financing arrangements when due may constitute a default under such existing indebtedness and may have a material adverse effect on the Company's business, financial condition, results of operations and cash flows.
Certain of the Company's long-term bilateral contracts result from state-mandated procurements and could be declared invalid by a court of competent jurisdiction.
A significant portion of the Company's revenues are derived from long-term bilateral contracts with utilities that are regulated by their respective states, and have been entered into pursuant to certain state programs. Certain long-term contracts that other companies have with state-regulated utilities have been challenged in federal court and have been declared unconstitutional on the grounds that the rate for energy and capacity established by the contracts impermissibly conflicts with the rate for energy and capacity established by FERC pursuant to the FPA. To date, federal district courts in New Jersey and Maryland have struck down contracts on similar grounds, and the U.S. Courts of Appeals for the Third and Fourth Circuits, respectively, have affirmed the lower court decisions. On October 19, 2015, the U.S. Supreme Court granted certiorari in the Fourth Circuit case, and the Court heard oral argument on February 24, 2016. The outcome of this litigation could affect future capacity prices
in PJM, as well as the legal status of the Company's bilateral contracts with state-regulated utilities. If certain of the Company's state-mandated agreements with utilities are ever held to be invalid, the Company may be unable to replace such contracts, which could have a material adverse effect on the Company's business, financial condition, results of operations and cash flows.
The generation of electric energy from solar and wind energy sources depends heavily on suitable meteorological conditions.
If solar or wind conditions are unfavorable, the Company's electricity generation and revenue from renewable generation facilities may be substantially below the Company's expectations. The electricity produced and revenues generated by a solar electric or wind energy generation facility is highly dependent on suitable solar or wind conditions, as applicable, and associated weather conditions, which are beyond the Company's control. Furthermore, components of the Company's systems, such as solar panels and inverters, could be damaged by severe weather, such as hailstorms or tornadoes. In addition, replacement and spare parts for key components may be difficult or costly to acquire or may be unavailable. Unfavorable weather and atmospheric conditions could impair the effectiveness of the Company's assets or reduce their output beneath their rated capacity or require shutdown of key equipment, impeding operation of the Company's renewable assets. In addition, climate change may have the long-term effect of changing wind patterns at our projects. Changing wind patterns could cause changes in expected electricity generation. These events could also degrade equipment or components and the interconnection and transmission facilities’ lives or maintenance costs.
Although the Company bases its investment decisions with respect to each renewable generation facility on the findings of related wind and solar studies conducted on-site prior to construction or based on historical conditions at existing facilities, actual climatic conditions at a facility site, particularly wind conditions, may not conform to the findings of these studies and may be affected by variations in weather patterns, including any potential impact of climate change. Therefore, the Company's solar and wind energy facilities may not meet anticipated production levels or the rated capacity of the Company's generation assets, which could adversely affect the business, financial condition, and results of operations and cash flows.
Operation of electric generation facilities involves significant risks and hazards customary to the power industry that could have a material adverse effect on the Company's business, financial condition, results of operations and cash flows.
The ongoing operation of the Company's facilities involves risks that include the breakdown or failure of equipment or processes or performance below expected levels of output or efficiency due to wear and tear, latent defect, design error or operator error or force majeure events, among other things. Operation of the Company's facilities also involves risks that the Company will be unable to transport its products to its customers in an efficient manner due to a lack of transmission capacity. Unplanned outages of generating units, including extensions of scheduled outages due to mechanical failures or other problems, occur from time to time and are an inherent risk of the business. Unplanned outages typically increase operation and maintenance expenses, capital expenditures and may reduce revenues as a result of selling fewer MWh or require the Company to incur significant costs as a result of obtaining replacement power from third parties in the open market to satisfy forward power sales obligations. The Company's inability to operate its electric generation assets efficiently, manage capital expenditures and costs and generate earnings and cash flow from the Company's asset-based businesses could have a material adverse effect on the business, financial condition, results of operations and cash flows. While the Company maintains insurance, obtains warranties from vendors and obligates contractors to meet certain performance levels, the proceeds of such insurance, warranties or performance guarantees may not cover the Company's lost revenues, increased expenses or liquidated damages payments should it experience equipment breakdown or non-performance by contractors or vendors.
Power generation involves hazardous activities, including acquiring, transporting and unloading fuel, operating large pieces of rotating equipment and delivering electricity to transmission and distribution systems.
In addition to natural risks such as earthquake, flood, lightning, hurricane and wind, other hazards, such as fire, explosion, structural collapse and machinery failure are inherent risks in the Company's operations. These and other hazards can cause significant personal injury or loss of life, severe damage to and destruction of property, plant and equipment and contamination of, or damage to, the environment and suspension of operations. The occurrence of any one of these events may result in the Company being named as a defendant in lawsuits asserting claims for substantial damages, including for environmental cleanup costs, personal injury and property damage and fines and/or penalties. The Company maintains an amount of insurance protection that it considers adequate but cannot provide any assurance that the Company's insurance will be sufficient or effective under all circumstances and against all hazards or liabilities to which the Company may be subject. Furthermore, the Company's insurance coverage is subject to deductibles, caps, exclusions and other limitations. A loss for which the Company is not fully insured (which may include a significant judgment against any facility or facility operator) could have a material adverse effect on the Company's business, financial condition, results of operations or cash flows. Further, due to rising insurance costs and changes in the insurance markets, the Company cannot provide any assurance that its insurance coverage will continue to be available at all or at rates or on terms similar to those presently available. Any losses not covered by insurance could have a material adverse effect on the Company's business, financial condition, results of operations and cash flows.
Maintenance, expansion and refurbishment of electric generation facilities involve significant risks that could result in unplanned power outages or reduced output.
The Company's facilities may require periodic upgrading and improvement. Any unexpected operational or mechanical failure, including failure associated with breakdowns and forced outages, could reduce the Company's facilities' generating capacity below expected levels, reducing the Company's revenues and jeopardizing the Company's ability to pay dividends to holders of its common stock at expected levels or at all. Degradation of the performance of the Company's solar facilities above levels provided for in the related offtake agreements may also reduce the Company's revenues. Unanticipated capital expenditures associated with maintaining, upgrading or repairing the Company's facilities may also reduce profitability.
If the Company makes any major modifications to its conventional power generation facilities, it may be required to install the best available control technology or to achieve the lowest achievable emission rates as such terms are defined under the new source review provisions of the CAA in the future. Any such modifications could likely result in substantial additional capital expenditures. The Company may also choose to repower, refurbish or upgrade its facilities based on its assessment that such activity will provide adequate financial returns. Such facilities require time for development and capital expenditures before commencement of commercial operations, and key assumptions underpinning a decision to make such an investment may prove incorrect, including assumptions regarding construction costs, timing, available financing and future fuel and power prices. These events could have a material adverse effect on the Company's business, financial condition, results of operations and cash flows.
Counterparties to the Company's offtake agreements may not fulfill their obligations and, as the contracts expire, the Company may not be able to replace them with agreements on similar terms in light of increasing competition in the markets in which the Company operates.
A significant portion of the electric power the Company generates is sold under long-term offtake agreements with public utilities or industrial or commercial end-users, with a weighted average remaining duration of approximately 1416 years (based on net capacity under contract)CAFD). As of December 31, 2015,2016, the largest customers of the Company's power generation assets, including assets in which the Company has less than a 100% membership interest, were SCE and PG&E, which represented 46%45% and 23%25%, respectively, of the net electric generation capacity of the Company's facilities.
If, for any reason, any of the purchasers of power under these agreements are unable or unwilling to fulfill their related contractual obligations or if they refuse to accept delivery of power delivered thereunder or if they otherwise terminate such agreements prior to the expiration thereof, the Company's assets, liabilities, business, financial condition, results of operations and cash flows could be materially and adversely affected. Furthermore, to the extent any of the Company's power purchasers are, or are controlled by, governmental entities, the Company's facilities may be subject to legislative or other political action that may impair their contractual performance.
The power generation industry is characterized by intense competition and the Company's electric generation assets encounter competition from utilities, industrial companies and other independent power producers, in particular with respect to uncontracted output. In recent years, there has been increasing competition among generators for offtake agreements and this has contributed to a reduction in electricity prices in certain markets characterized by excess supply above designated reserve margins. In light of these market conditions, the Company may not be able to replace an expiring or terminated agreement with an agreement on equivalent terms and conditions, including at prices that permit operation of the related facility on a profitable basis. In addition, the Company believes many of its competitors have well-established relationships with the Company's current and potential suppliers, lenders and customers, and have extensive knowledge of its target markets. As a result, these competitors may be able to respond more quickly to evolving industry standards and changing customer requirements than the Company will be able to. Adoption of technology more advanced than the Company's could reduce its competitors' power production costs resulting in their having a lower cost structure than is achievable with the technologies currently employed by the Company and adversely affect its ability to compete for offtake agreement renewals. If the Company is unable to replace an expiring or terminated offtake agreement, the affected facility may temporarily or permanently cease operations. External events, such as a severe economic downturn, could also impair the ability of some counterparties to the Company's offtake agreements and other customer agreements to pay for energy and/or other products and services received.
The Company's inability to enter into new or replacement offtake agreements or to compete successfully against current and future competitors in the markets in which the Company operates could have a material adverse effect on the Company's business, financial condition, results of operations and cash flows.
Certain of the Company's assets have previously or currentlyThe Company’s facilities may operate, wholly or partially, without long-term power salesales agreements.
Certain
The Company’s facilities may operate without long-term power sales agreements for some or all of their generating capacity and output and therefore be exposed to market fluctuations. Without the benefit of long-term power sales agreements for the facilities, the Company cannot be sure that it will be able to sell any or all of the power generated by the facilities at commercially attractive rates or that the facilities will be able to operate profitably. This could lead to less predictable revenues, future impairments of the Company's assets have previouslyproperty, plant and equipment or currently operate, wholly or partially, without long-term power sale agreements. The generation capacityto the closing of the Company’s Paxton thermal generation asset has been sold through May 2019 in the annual Base Residual Auction, or BRA, under the PJM-administered RPM. Capacity revenue beginning in June 2019 is not yet determined. This facility does not have an offtake agreement for energy sales and sells energy through NRG Power Marketing LLC, an NRG affiliate, into the bid-based auction market for energy administered by PJM based on economic dispatchcertain of its unit. If the Company is unable to sell available capacity from the Paxton facility beginningfacilities, resulting in June 2019 through the BRA or one of the other RPM capacity auctions or is unable to enter into a offtake agreement or otherwise sell unallocated or unsold capacity at favorable terms, there may beeconomic losses and liabilities, which could have a material adverse effect on the Company's business, financial condition, results of operations, andfinancial condition or cash flows.
A portion of the steam and chilled water produced by the Company's thermal assets is sold at regulated rates, and the revenue earned by the Company's GenConn assets is established each year in a rate case; accordingly, the profitability of these assets is dependent on regulatory approval.
Approximately 375378 net MWt of capacity from certain of the Company's thermal assets are sold at rates approved by one or more federal or state regulatory commissions, including the Pennsylvania Public Utility Commission and the California Public Utilities Commission for the thermal assets. Similarly, the revenues related to approximately 380 MW of capacity from the GenConn assets are established each year by the Connecticut Public Utilities Regulatory Authority. While such regulatory oversight is generally premised on the recovery of prudently incurred costs and a reasonable rate of return on invested capital, the rates that the Company may charge, or the revenue that the Company may earn with respect to this capacity are subject to authorization of the applicable regulatory authorities. There can be no assurance that such regulatory authorities will consider all of the costs to have been prudently incurred or that the regulatory process by which rates or revenues are determined will always result in rates or revenues that achieve full recovery of costs or an adequate return on the Company's capital investments. While the Company's rates and revenues are generally established based on an analysis of costs incurred in a base year, the rates the Company is allowed to charge, and the revenues the Company is authorized to earn, may or may not match the costs at any given time. If the Company's costs are not adequately recovered through these regulatory processes, it could have a material adverse effect on the business, financial condition, results of operations and cash flows.
Supplier and/or customer concentration at certain of the Company's facilities may expose the Company to significant financial credit or performance risks.
The Company often relies on a single contracted supplier or a small number of suppliers for the provision of fuel, transportation of fuel, equipment, technology and/or other services required for the operation of certain facilities. In addition, certain of the Company's suppliers provide long-term warranties with respect to the performance of their products or services. If any of these suppliers cannot perform under their agreements with the Company, or satisfy their related warranty obligations, the Company will need to utilize the marketplace to provide or repair these products and services. There can be no assurance that the marketplace can provide these products and services as, when and where required. The Company may not be able to enter into replacement agreements on favorable terms or at all. If the Company is unable to enter into replacement agreements to provide for fuel, equipment, technology and other required services, it would seek to purchase the related goods or services at market prices, exposing the Company to market price volatility and the risk that fuel and transportation may not be available during certain periods at any price. The Company may also be required to make significant capital contributions to remove, replace or redesign equipment that cannot be supported or maintained by replacement suppliers, which could have a material adverse effect on the business, financial condition, results of operations, credit support terms and cash flows.
In addition, potential or existing customers at the Company’s district energy centers and combined heat and power plants, or the Energy Centers, may opt for on-site systems in lieu of using the Company’s Energy Centers, either due to corporate policies regarding the allocation of capital, unique situations where an on-site system might in fact prove more efficient, because of previously committed capital in systems that are already on-site, or otherwise. At times, the Company relies on a single customer or a few customers to purchase all or a significant portion of a facility's output, in some cases under long-term agreements that account for a substantial percentage of the anticipated revenue from a given facility.
The failure of any supplier to fulfill its contractual obligations to the Company or the Company’s loss of potential or existing customers could have a material adverse effect on its financial results. Consequently, the financial performance of the Company's facilities is dependent on the credit quality of, and continued performance by, the Company's suppliers and vendors and the Company’s ability to solicit and retain customers.
The Company currently owns, and in the future may acquire, certain assets in which the Company has limited control over management decisions and its interests in such assets may be subject to transfer or other related restrictions.
TheAs described in Item 15 — Note 5, Investments Accounted for by the Equity Method and Variable Interest Entities, the Company has limited control over the operation of GenConn, Avenal, CVSR and Desert Sunlightcertain of its assets, because the Company beneficially owns 50%, 50%, 48.95% and 25%, respectively,less than a majority of the membership interests in such assets. The Company may seek to acquire additional assets in which it owns less than a majority of the related membership interests in the future. In these investments, the Company will seek to exert a degree of influence with respect to the management and operation of assets in which it owns less than a majority of the membership interests by negotiating to obtain positions on management committees or to receive certain limited governance rights, such as rights to veto significant actions. However, the Company may not always succeed in such negotiations. The Company may be dependent on its co-venturers to operate such assets. The Company's co-venturers may not have the level of experience, technical expertise, human resources management and other attributes necessary to operate these assets optimally. In addition, conflicts of interest may arise in the future between the Company and its stockholders, on the one hand, and the Company's co-venturers, on the other hand, where the Company's co-venturers' business interests are inconsistent with the interests of the Company and its stockholders. Further, disagreements or disputes between the Company and its co-venturers could result in litigation, which could increase expenses and potentially limit the time and effort the Company's officers and directors are able to devote to the business.
The approval of co-venturers may also may be required for the Company to receive distributions of funds from assets or to sell, pledge, transfer, assign or otherwise convey its interest in such assets, or for the Company to acquire NRG's interests in such co-ventures as an initial matter. Alternatively, the Company's co-venturers may have rights of first refusal or rights of first offer in the event of a proposed sale or transfer of the Company's interests in such assets. These restrictions may limit the price or interest level for interests in such assets, in the event the Company wants to sell such interests.
Furthermore, certain of the Company's facilities are operated by third-party operators, such as First Solar. To the extent that third-party operators do not fulfill their obligations to manage operations of the facilities or are not effective in doing so, the amount of CAFD may be adversely affected.
The Company's assets are exposed to risks inherent in the use of interest rate swaps and forward fuel purchase contracts and the Company may be exposed to additional risks in the future if it utilizes other derivative instruments.
The Company uses interest rate swaps to manage interest rate risk. In addition, the Company uses forward fuel purchase contracts to hedge its limited commodity exposure with respect to the Company's district energy assets. If the Company elects to enter into such commodity hedges, the related asset could recognize financial losses on these arrangements as a result of volatility in the market values of the underlying commodities or if a counterparty fails to perform under a contract. If actively quoted market prices and pricing information from external sources are not available, the valuation of these contracts would involve judgment or the use of estimates. As a result, changes in the underlying assumptions or use of alternative valuation methods could affect the reported fair value of these contracts. If the values of these financial contracts change in a manner that the Company does not anticipate, or if a counterparty fails to perform under a contract, it could harm the business, financial condition, results of operations and cash flows.
The Company's business is subject to restrictions resulting from environmental, health and safety laws and regulations.
The Company is subject to various federal, state and local environmental and health and safety laws and regulations. In addition, the Company may be held primarily or jointly and severally liable for costs relating to the investigation and clean-up of any property where there has been a release or threatened release of a hazardous regulated material as well as other affected properties, regardless of whether the Company knew of or caused the release. In addition to these costs, which are typically not limited by law or regulation and could exceed an affected property's value, the Company could be liable for certain other costs, including governmental fines and injuries to persons, property or natural resources. Further, some environmental laws provide for the creation of a lien on a contaminated site in favor of the government as security for damages and any costs the government incurs in connection with such contamination and associated clean-up. Although the Company generally requires its operators to undertake to indemnify it for environmental liabilities they cause, the amount of such liabilities could exceed the financial ability of the operator to indemnify the Company. The presence of contamination or the failure to remediate contamination may adversely affect the Company's ability to operate the business.
The Company does not own all of the land on which its power generation or thermal assets are located, which could result in disruption to its operations.
The Company does not own all of the land on which its power generation or thermal assets are located and the Company is, therefore, subject to the possibility of less desirable terms and increased costs to retain necessary land use if it does not have valid leases or rights-of-way or if such rights-of-way lapse or terminate. Although the Company has obtained rights to construct and operate these assets pursuant to related lease arrangements, the rights to conduct those activities are subject to certain exceptions,
including the term of the lease arrangement. The Company is also at risk of condemnation on land it owns. The loss of these rights, through the Company's inability to renew right-of-way contracts, condemnation or otherwise, may adversely affect the Company's ability to operate its generation and thermal infrastructure assets.
The Company’s use and enjoyment of real property rights for its projects may be adversely affected by the rights of lienholders and leaseholders that are superior to those of the grantors of those real property rights to the Company.
Solar and wind projects generally are, and are likely to be, located on land occupied by the project pursuant to long-term easements and leases. The ownership interests in the land subject to these easements and leases may be subject to mortgages securing loans or other liens (such as tax liens) and other easement and lease rights of third parties (such as leases of oil or mineral rights) that were created prior to the project’s easements and leases. As a result, the project’s rights under these easements or leases may be subject, and subordinate, to the rights of those third parties. The Company performs title searches and obtains title insurance to protect itself against these risks. Such measures may, however, be inadequate to protect the Company against all risk of loss of its rights to use the land on which the wind projects are located, which could have a material adverse effect on the Company’s business, financial condition and results of operations.
The electric generation business is subject to substantial governmental regulation and may be adversely affected by changes in laws or regulations, as well as liability under, or any future inability to comply with, existing or future regulations or other legal requirements.
The Company's electric generation business is subject to extensive U.S. federal, state and local laws and regulation.regulations. Compliance with the requirements under these various regulatory regimes may cause the Company to incur significant additional costs, and failure to comply with such requirements could result in the shutdown of the non-complying facility, the imposition of liens, fines, and/or civil or criminal liability. Public utilities under the FPA are required to obtain FERC acceptance of their rate schedules for wholesale sales of electric energy, capacity and ancillary services. Except for generating facilities within the footprint of ERCOT which are regulated by the PUCT, all of the Company’s assets make wholesale sales of electric energy, capacity and ancillary services in interstate commerce and are public utilities for purposes of the FPA, unless otherwise exempt from such status. FERC's orders that grant market-based rate authority to wholesale power marketers reserve the right to revoke or revise that authority if FERC subsequently determines that the seller can exercise market power in transmission or generation, create barriers to entry, or engage in abusive affiliate transactions. In addition, public utilities are subject to FERC reporting requirements that impose administrative burdens and that, if violated, can expose the company to criminal and civil penalties or other risks.
The Company's market-based sales will be subject to certain rules prohibiting manipulative or deceptive conduct, and if any of the Company's generating companies are deemed to have violated those rules, they will be subject to potential disgorgement of profits associated with the violation, penalties, suspension or revocation of market based rate authority. If such generating companies were to lose their market-based rate authority, such companies would be required to obtain FERC's acceptance of a cost-of-service rate schedule and could become subject to the significant accounting, record-keeping, and reporting requirements that are imposed on utilities with cost- basedcost-based rate schedules. This could have a material adverse effect on the rates the Company is able to charge for power from its facilities.
Most of the Company's assets are operating as EWGs as defined under the PUHCA, or QFs as defined under the PURPA, as amended, and therefore are exempt from certain regulation under the PUHCA and the PURPA. If a facility fails to maintain its status as an EWG or a QF or there are legislative or regulatory changes revoking or limiting the exemptions to the PUHCA, then the Company may be subject to significant accounting, record-keeping, access to books and records and reporting requirements and failure to comply with such requirements could result in the imposition of penalties and additional compliance obligations.
Substantially all of the Company's generation assets are also subject to the reliability standards promulgated by the designated Electric Reliability Organization (currently the North American Electric Reliability Corporation, or NERC) and approved by FERC. If the Company fails to comply with the mandatory reliability standards, it could be subject to sanctions, including substantial monetary penalties and increased compliance obligations. The Company will also be affected by legislative and regulatory changes, as well as changes to market design, market rules, tariffs, cost allocations, and bidding rules that occur in the existing regional markets operated by RTOs or ISOs, such as PJM. The RTOs/ISOs that oversee most of the wholesale power markets impose, and in the future may continue to impose, mitigation, including price limitations, offer caps, non-performance penalties and other mechanisms to address some of the volatility and the potential exercise of market power in these markets. These types of price limitations and other regulatory mechanisms may have a material adverse effect on the profitability of the Company's generation facilities acquired in the future that sell energy, capacity and ancillary products into the wholesale power markets. The regulatory environment for electric generation has undergone significant changes in the last several years due to state and federal policies affecting wholesale competition and the creation of incentives for the addition of large amounts of new renewable generation and, in some cases, transmission assets. These changes are ongoing and the Company cannot predict the future design of the wholesale power markets or the ultimate effect that the changing regulatory environment will have on the
Company's business. In addition, in some of these markets, interested parties have proposed to re-regulate the markets or require divestiture of electric generation assets by asset owners or operators to reduce their market share. Other proposals to re-regulate may be made and legislative or other attention to the electric power market restructuring process may delay or reverse the deregulation process. If competitive restructuring of the electric power markets is reversed, discontinued, or delayed, the Company's business prospects and financial results could be negatively impacted.
The Company is subject to environmental laws and regulations that impose extensive and increasingly stringent requirements on its operations, as well as potentially substantial liabilities arising out of environmental contamination.
The Company's assets are subject to numerous and significant federal, state and local laws, including statutes, regulations, guidelines, policies, directives and other requirements governing or relating to, among other things: protection of wildlife, including threatened and endangered species; air emissions; discharges into water; water use; the storage, handling, use, transportation and distribution of dangerous goods and hazardous, residual and other regulated materials, such as chemicals; the prevention of releases of hazardous materials into the environment; the prevention, presence and remediation of hazardous materials in soil and groundwater, both on and offsite; land use and zoning matters; and workers' health and safety matters. The Company's facilities could experience incidents, malfunctions and other unplanned events that could result in spills or emissions in excess of permitted levels and result in personal injury, penalties and property damage. As such, the operation of the Company's facilities carries an inherent risk of environmental, health and safety liabilities (including potential civil actions, compliance or remediation orders, fines and other penalties), and may result in the assets being involved from time to time in administrative and judicial proceedings relating to such matters. The Company has implemented environmental, health and safety management programs designed to continually improve environmental, health and safety performance. Environmental laws and regulations have generally become more stringent over time, and the Company expectsalthough this trend to continue.could change in the near term under the new U.S. presidential administration. Significant costs may be incurred for capital expenditures under environmental programs to keep the assets compliant with such environmental laws and regulations. If it is not economical to make those expenditures, it may be necessary to retire or mothball facilities or restrict or modify the Company's operations to comply with more stringent standards. These environmental requirements and liabilities could have a material adverse effect on the business, financial condition, results of operations and cash flows.
Risks that are beyond the Company's control, including but not limited to acts of terrorism or related acts of war, natural disaster, hostile cyber intrusions or other catastrophic events, could have a material adverse effect on the business, financial condition, results of operations and cash flows.
The Company's generation facilities that were acquired or those that the Company otherwise acquires or constructs and the facilities of third parties on which they rely may be targets of terrorist activities, as well as events occurring in response to or in connection with them, that could cause environmental repercussions and/or result in full or partial disruption of the facilities ability to generate, transmit, transport or distribute electricity or natural gas. Strategic targets, such as energy-related facilities, may be at greater risk of future terrorist activities than other domestic targets. Hostile cyber intrusions, including those targeting information systems as well as electronic control systems used at the generating plants and for the related distribution systems, could severely disrupt business operations and result in loss of service to customers, as well as create significant expense to repair security breaches or system damage.
Furthermore, certain of the Company's power generation thermal assets are located in active earthquake zones in California and Arizona, and certain project companies and suppliers conduct their operations in the same region or in other locations that are susceptible to natural disasters. In addition, California and some of the locations where certain suppliers are located, from time to time, have experienced shortages of water, electric power and natural gas. The occurrence of a natural disaster, such as an earthquake, drought, flood or localized extended outages of critical utilities or transportation systems, or any critical resource shortages, affecting the Company or its suppliers, could cause a significant interruption in the business, damage or destroy the Company's facilities or those of its suppliers or the manufacturing equipment or inventory of the Company's suppliers. Any such terrorist acts, environmental repercussions or disruptions or natural disasters could result in a significant decrease in revenues or significant reconstruction or remediation costs, beyond what could be recovered through insurance policies, which could have a material adverse effect on the business, financial condition, results of operations and cash flows.
The operation of the Company’s businesses is subject to cyber-based security and integrity risk.
Numerous functions affecting the efficient operation of the Company’s businesses are dependent on the secure and reliable storage, processing and communication of electronic data and the use of sophisticated computer hardware and software systems. The operation of the Company's generating assets are reliant on cyber-based technologies and, therefore, subject to the risk that such systems could be the target of disruptive actions, particularly through cyber-attack or cyber intrusion, including by computer hackers, foreign governments and cyber terrorists, or otherwise be compromised by unintentional events. As a result, operations could be interrupted, property could be damaged and sensitive customer information could be lost or stolen, causing the Company
to incur significant losses of revenues, other substantial liabilities and damages, costs to replace or repair damaged equipment and
damage to the Company's reputation. In addition, the Company may experience increased capital and operating costs to implement increased security for its cyber systems and generating assets.
Government regulations providing incentives for renewable generation could change at any time and such changes may negatively impact the Company's growth strategy.
The Company's growth strategy depends in part on government policies that support renewable generation and enhance the economic viability of owning renewable electric generation assets. Renewable generation assets currently benefit from various federal, state and local governmental incentives such as ITCs, cash grants in lieu of ITCs, loan guarantees, RPS, programs, modified accelerated cost-recovery system of depreciation and bonus depreciation. In December 2015, the U.S. Congress enacted an extension of the 30% solar ITC so that projects that beginbegan construction in 2016 through 2019 will continue to qualify for the 30% ITC. Projects beginning construction in 2020 and 2021 will be eligible for the ITC at the rates of 26% and 22%, respectively. The same legislation also extended the 10-year wind PTC for wind projects that beginbegan construction in years 2016 through 2019. Wind projects that begin construction in the years 2017, 2018 and 2019 are eligible for PTC at 80%, 60% and 40% of the statutory rate per kWh, respectively.
Many states have adopted RPS programs mandating that a specified percentage of electricity sales come from eligible sources of renewable energy. However, the regulations that govern the RPS programs, including pricing incentives for renewable energy, or reasonableness guidelines for pricing that increase valuation compared to conventional power (such as a projected value for carbon reduction or consideration of avoided integration costs), may change. If the RPS requirements are reduced or eliminated, it could lead to fewer future power contracts or lead to lower prices for the sale of power in future power contracts, which could have a material adverse effect on the Company's future growth prospects. Such material adverse effects may result from decreased revenues, reduced economic returns on certain project company investments, increased financing costs, and/or difficulty obtaining financing. Furthermore, the ARRA included incentives to encourage investment in the renewable energy sector, such as cash grants in lieu of ITCs, bonus depreciation and expansion of the U.S. DOE loan guarantee program. It is uncertain what loan guarantees may be made by the U.S. DOE loan guarantee program in the future. In addition, the cash grant in lieu of ITCs program only applies to facilities that commenced construction prior to December 31, 2011, which commencement date may be determined in accordance with the safe harbor if more than 5% of the total cost of the eligible property was paid or incurred by December 31, 2011.
If the Company is unable to utilize various federal, state and local government incentives to acquire additional renewable assets in the future, or the terms of such incentives are revised in a manner that is less favorable to the Company, it may suffer a material adverse effect on the business, financial condition, results of operations and cash flows.
The Company relies on electric interconnection and transmission facilities that it does not own or control and that are subject to transmission constraints within a number of the Company's regions. If these facilities fail to provide the Company with adequate transmission capacity, it may be restricted in its ability to deliver electric power to its customers and may either incur additional costs or forego revenues.
The Company depends on electric interconnection and transmission facilities owned and operated by others to deliver the wholesale power it will sell from its electric generation assets to its customers. A failure or delay in the operation or development of these interconnection or transmission facilities or a significant increase in the cost of the development of such facilities could result in lost revenues. Such failures or delays could limit the amount of power the Company's operating facilities deliver or delay the completion of the Company's construction projects. Additionally, such failures, delays or increased costs could have a material adverse effect on the business, financial condition and results of operations. If a region's power transmission infrastructure is inadequate, the Company's recovery of wholesale costs and profits may be limited. If restrictive transmission price regulation is imposed, the transmission companies may not have a sufficient incentive to invest in expansion of transmission infrastructure. The Company also cannot predict whether interconnection and transmission facilities will be expanded in specific markets to accommodate competitive access to those markets. In addition, certain of the Company's operating facilities' generation of electricity may be curtailed without compensation due to transmission limitations or limitations on the electricity grid's ability to accommodate intermittent electricity generating sources, reducing the Company's revenues and impairing its ability to capitalize fully on a particular facility's generating potential. Such curtailments could have a material adverse effect on the business, financial condition, results of operations and cash flows. Furthermore, economic congestion on transmission networks in certain of the markets in which the Company operates may occur and the Company may be deemed responsible for congestion costs. If the Company were liable for such congestion costs, its financial results could be adversely affected.
The Company's costs, results of operations, financial condition and cash flows could be adversely impacted by the disruption of the fuel supplies necessary to generate power at its conventional and thermal power generation facilities.
Delivery of fossil fuels to fuel the Company's conventional and thermal generation facilities is dependent upon the infrastructure (including natural gas pipelines) available to serve each such generation facility as well as upon the continuing financial viability of contractual counterparties. As a result, the Company is subject to the risks of disruptions or curtailments in the production of power at these generation facilities if a counterparty fails to perform or if there is a disruption in the fuel delivery infrastructure.
The Company depends on key management employees.
The Company believes its current operations and future success depend largely on the continued services of the management employees that it employs, in particular Christopher Sotos, the Company’s President and Chief Executive Officer and Chad Plotkin, the Company’s Senior Vice President and Chief Financial Officer. Although the Company has access to the resources of NRG, the loss of Mr. Sotos’ or Mr. Plotkin’s services, or other key management personnel employed by the Company in the future, could have a material adverse effect on the Company’s financial condition and results of operations.
Risks Related to the Company's Relationship with NRG
NRG is the Company's controlling stockholder and exercises substantial influence over the Company. The Company is highly dependent on NRG.
NRG owns all of the Company's outstanding Class B and Class D common stock. The Company's outstanding Class B and Class D common stock is entitled to one vote per share and 1/100th of a vote per share, respectively. As a result of its ownership of the Class B and Class D common stock, NRG owns 55.1% of the combined voting power of the Company's common stock as of December 31, 2015.2016. NRG has also expressed its intention to maintain a controlling interest in the Company. As a result of this ownership, NRG has a substantial influence on the Company's affairs and its voting power will constitute a large percentage of any quorum of the Company's stockholders voting on any matter requiring the approval of the Company's stockholders. Such matters include the election of directors, the adoption of amendments to the Company's second amended and restated certificate of incorporation and third amended and restated bylaws and approval of mergers or sale of all or substantially all of its assets. This concentration of ownership may also have the effect of delaying or preventing a change in control of the Company or discouraging others from making tender offers for the Company's shares. In addition, NRG has the right to appointelect all of the Company's directors. NRG may cause corporate actions to be taken even if their interests conflict with the interests of the Company's other stockholders (including holders of the Company's Class A and Class C common stock).
Furthermore, the Company depends on the management and administration services provided by or under the direction of NRG under the Management Services Agreement. NRG personnel and support staff that provide services to the Company under the Management Services Agreement are not required to, and the Company does not expect that they will, have as their primary responsibility the management and administration of the Company or to act exclusively for the Company and the Management Services Agreement does not require any specific individuals to be provided by NRG. Under the Management Services Agreement, NRG has the discretion to determine which of its employees perform assignments required to be provided to the Company. Any failure to effectively manage the Company's operations or to implement its strategy could have a material adverse effect on the business, financial condition, results of operations and cash flows. The Management Services Agreement will continue in perpetuity, until terminated in accordance with its terms.
The Company also depends upon NRG for the provision of management, administration and certain other services at all of the Company's facilities and contracts with NRG, or its subsidiaries, to procure fuel and sell power for certain of its operating facilities. Any failure by NRG to perform its requirements under these arrangements or the failure by the Company to identify and contract with replacement service providers, if required, could adversely affect the operation of the Company's facilities and have a material adverse effect on the business, financial condition, results of operations and cash flows.
The Company may not be able to consummate future acquisitions from NRG.
The Company's ability to grow through acquisitions depends, in part, on NRG's ability to identify and present the Company with acquisition opportunities. NRG established the Company to hold and acquire a diversified suite of power generating assets in the U.S. and its territories. Although NRG has agreed to grant the Company a right of first offer with respect to certain power generation assets that NRG may elect to sell in the future, NRG is under no obligation to sell any such power generation assets or to accept any related offer from the Company. Furthermore, NRG has no obligation to source acquisition opportunities specifically for the Company. In addition, NRG has not agreed to commit any minimum level of dedicated resources for the pursuit of renewable power-related acquisitions. There are a number of factors which could materially and adversely impact the extent to which suitable acquisition opportunities are made available from NRG, including:
the same professionals within NRG's organization that are involved in acquisitions that are suitable for the Company have responsibilities within NRG's broader asset management business, which may include sourcing acquisition opportunities for NRG. Limits on the availability of such individuals will likewise result in a limitation on the availability of acquisition opportunities for the Company; and
in addition to structural limitations, the question of whether a particular asset is suitable is highly subjective and is dependent on a number of factors including an assessment by NRG relating to the Company's liquidity position at the time, the risk profile of the opportunity and its fit with the balance of the Company's then current operations and other factors. If NRG determines that an opportunity is not suitable for the Company, it may still pursue such opportunity on its own behalf, or on behalf of another NRG affiliate.
In making these determinations, NRG may be influenced by factors that result in a misalignment with the Company's interests or conflict of interest.
The departure of some or all of NRG's employees could prevent the Company from achieving its objectives.
The Company depends on the diligence, skill and business contacts of NRG's professionals and the information and opportunities they generate during the normal course of their activities. Furthermore, approximately 27%30% of NRG's employees at the Company's generation plants are covered by collective bargaining agreements as of December 31, 2015.2016. The Company's future success will depend on the continued service of these individuals, who are not obligated to remain employed with NRG, or otherwise successfully renegotiate their collective bargaining agreements when such agreements expire or otherwise terminate. NRG has experienced departures of key professionals and personnel in the past and may do so in the future, and the Company cannot predict the impact that any such departures will have on its ability to achieve its objectives. The Management Services Agreement does not require NRG to maintain the employment of any of its professionals or to cause any particular professional to provide services to the Company or on its behalf. The departure of a significant number of NRG's professionals or a material portion of the NRG employees who work at any of the Company's facilities for any reason, or the failure to appoint qualified or effective successors in the event of such departures, could have a material adverse effect on the Company's ability to achieve its objectives. The Management Services Agreement does not require NRG to maintain the employment of any of its professionals or to cause any particular professional to provide services to the Company or on its behalf.
The Company's organizational and ownership structure may create significant conflicts of interest that may be resolved in a manner that is not in the best interests of the Company or the best interests of holders of its Class A and Class C common stock and that may have a material adverse effect on the business, financial condition, results of operations and cash flows.
The Company's organizational and ownership structure involves a number of relationships that may give rise to certain conflicts of interest between the Company and holders of its Class A and Class C common stock, on the one hand, and NRG, on the other hand. Pursuant to the Management Services Agreement with NRG, eachcertain of the Company's executive officers are a shared NRG executiveexecutives and devote his or hertheir time to both the Company and NRG as needed to conduct the respective businesses. Although the Company's directors and executive officers owe fiduciary duties to the Company's stockholders, these shared NRG executives have fiduciary and other duties to NRG, which duties may be inconsistent with the Company's best interests and holders of the Company's Class A and Class C common stock. In addition, NRG and its representatives, agents and affiliates have access to the Company's confidential information. Although some of these persons are subject to confidentiality obligations pursuant to confidentiality agreements or implied duties of confidence, the Management Services Agreement does not contain general confidentiality provisions.
Additionally, all of the Company's executive officers continue to have economic interests in NRG and, accordingly, the benefit to NRG from a transaction between the Company and NRG will proportionately inure to their benefit as holders of economic interests in NRG. NRG is a related partyperson under the applicable securities laws governing related partyperson transactions and may have interests which differ from the Company's interests or those of holders of the Class A and Class C common stock, including with respect to the types of acquisitions made, the timing and amount of dividends by the Company, the reinvestment of returns generated by the Company's operations, the use of leverage when making acquisitions and the appointment of outside advisors and service providers. Any material transaction between the Company and NRG will be subject to the Company's related partyperson transaction policy, which will require prior approval of such transaction by the Company's corporateboard committees. Those of the Company's executive officers who have economic interests in NRG may be conflicted when advising the Company's corporateboard committees or otherwise participating in the negotiation or approval of such transactions. These executive officers have significant project- and industry-specific expertise that could prove beneficial to the Company's decision-making process and the absence of such strategic guidance could have a material adverse effect on the corporateboard committees' ability to evaluate any such transaction. Furthermore, the creation of corporateboard committees and the Company's related partyperson transaction approval policy may not insulate the Company from derivative claims relatedwith respect to related partyperson transactions and the conflicts of interest described in this risk factor. Regardless of the merits of such claims, the Company may be required to expend significant management time and financial resources in the defense thereof. Additionally, to the extent the Company fails to appropriately deal with any such conflicts, it could negatively impact the Company's reputation and ability to raise additional funds and the willingness of counterparties to do business with the Company, all of which could have a material adverse effect on the business, financial condition, results of operations and cash flows.
The Company may be unable or unwilling to terminate the Management Services Agreement.
The Management Services Agreement provides that the Company may terminate the agreement upon 30 days prior written notice to NRG upon the occurrence of any of the following: (i) NRG defaults in the performance or observance of any material term, condition or covenant contained therein in a manner that results in material harm to the Company and the default continues unremedied for a period of 30 days after written notice thereof is given to NRG; (ii) NRG engages in any act of fraud, misappropriation of funds or embezzlement that results in material harm to the Company; (iii) NRG is grossly negligent in the performance of its duties under the agreement and such negligence results in material harm to the Company; or (iv) upon the happening of certain events relating to the bankruptcy or insolvency of NRG. Furthermore, if the Company requests an amendment to the scope of services provided by NRG under the Management Services Agreement and is not able to agree with NRG as to a change to the service fee resulting from a change in the scope of services within 180 days of the request, the Company will be able to terminate the agreement upon 30 days prior notice to NRG. The Company will not be able to terminate the agreement for any other reason, including if NRG experiences a change of control, and the agreement continues in perpetuity, until terminated in accordance with its terms. If NRG's performance does not meet the expectations of investors, and the Company is unable to terminate the Management Services Agreement, the market price of the Class A and Class C common stock could suffer.
If NRG terminates the Management Services Agreement or defaults in the performance of its obligations under the agreement, the Company may be unable to contract with a substitute service provider on similar terms, or at all.
The Company relies on NRG to provide it with management services under the Management Services Agreement and does not havehas limited executive or senior management personnel independent from NRG. The Management Services Agreement provides that NRG may terminate the agreement upon 180 days prior written notice of termination to the Company if it defaults in the performance or observance of any material term, condition or covenant contained in the agreement in a manner that results in material harm and the default continues unremedied for a period of 30 days after written notice of the breach is given. If NRG terminates the Management Services Agreement or defaults in the performance of its obligations under the agreement, the Company may be unable to contract with a substitute service provider on similar terms or at all, and the costs of substituting service providers may be substantial. In addition, in light of NRG's familiarity with the Company's assets, a substitute service provider may not be able to provide the same level of service due to lack of pre-existing synergies. If the Company cannot locate a service provider that is able to provide substantially similar services as NRG does under the Management Services Agreement on similar terms, it would likely have a material adverse effect on the business, financial condition, results of operation and cash flows.
The liability of NRG is limited under the Company's arrangements with it and the Company has agreed to indemnify NRG against claims that it may face in connection with such arrangements, which may lead itNRG to assume greater risks when making decisions relating to the Company than it otherwise wouldmight if acting solely for its own account.
Under the Management Services Agreement, NRG does not assume any responsibility other than to provide or arrange for the provision of the services described in the Management Services Agreement in good faith. In addition, under the Management Services Agreement, the liability of NRG and its affiliates is limited to the fullest extent permitted by law to conduct involving bad faith, fraud, willful misconduct or gross negligence or, in the case of a criminal matter, action that was known to have been unlawful. In addition, the Company has agreed to indemnify NRG to the fullest extent permitted by law from and against any claims, liabilities, losses, damages, costs or expenses incurred by an indemnified person or threatened in connection with the Company's operations, investments and activities or in respect of or arising from the Management Services Agreement or the services provided by NRG, except to the extent that the claims, liabilities, losses, damages, costs or expenses are determined to have resulted from the conduct in respect of which such persons have liability as described above. These protections may result in NRG tolerating greater risks when making decisions than otherwise wouldmight be the case, including when determining whether to use leverage in connection with acquisitions. The indemnification arrangements to which NRG is a party may also give rise to legal claims for indemnification that are adverse to the Company and holders of its common stock.
Certain of the Company’s PPAs and project-level financing arrangements include provisions that would permit the counterparty to terminate the contract or accelerate maturity in the event NRG ceases to control or own, directly or indirectly, a majority of the voting power of the Company.
Certain of the Company’s PPAs and project-level financing arrangements contain change in control provisions that provide the counterparty with a termination right or the ability to accelerate maturity in the event of a change of control of the Company without the counterparty's consent. These provisions are triggered in the event NRG ceases to own, directly or indirectly, capital stock representing more than 50% of the voting power of all of the Company’s capital stock outstanding on such date, or, in some cases, if NRG ceases to be the majority owner, directly or indirectly, of the applicable project subsidiary. As a result, if NRG ceases to control, or in some cases, own a majority of the voting power of the Company, the counterparties could terminate such contracts or accelerate the maturity of such financing arrangements. The termination of any of the Company’s PPAs or the acceleration of the maturity of any of the Company’s project-level financing could have a material adverse effect on the Company’s business, financial condition,
results of operations and cash flow.
The Company is a "controlled“controlled company," controlled by NRG, whose interest in the Company's business may be differentand as a result, is exempt from other holderscertain corporate governance requirements that are designed to provide protection to stockholders of the Company's common stock.companies that are not controlled companies.
As of December 31, 2015,2016, NRG controls 55.1% of the Company's combined voting power and is able to elect all of the Company's board of directors. As a result, the Company is considered a "controlled company" for the purposes of the NYSE listing requirements. As a "controlled company," the Company is permitted to, and the Company may, opt out of the NYSE listing requirements that would require (i) a majority of the members of the Company's board of directors to be independent, (ii) that the Company establish a compensation committee and a nominating and governance committee, each comprised entirely of independent directors, or (iii) that the compensationan annual performance evaluation of the Company's executive officersnominating and nominees for directors are determined or recommended to the Company's board of directors by the independent members of the Company's board of directors.governance and compensation committees. The NYSE listing requirements are intended to ensure that directors who meet the independence standards are free of any conflicting interest that could influence their actions as directors. While the Company has elected to have a Compensation Committee and a Corporate Governance, Conflicts and Nominating Committee consisting entirely of independent directors and to conduct an annual performance evaluation of these committees, the majority of the members of the Company’s board of directors are not considered independent. Therefore, the Company’s stockholders may not have the same protections afforded to stockholders of companies that are subject to all of the applicable NYSE listing requirements. It is also possible that the interests of NRG may in some circumstances conflict with the Company's interests and the interests of the holders of the Company's Class A and Class C common stock.
Risks Inherent in an Investment in the Company
The Company may not be able to continue paying comparable or growing cash dividends to holders of its common stock in the future.
The amount of CAFD principally depends upon the amount of cash the Company generates from its operations, which will fluctuate from quarter to quarter based on, among other things:
the level and timing of capital expenditures the Company makes;
the level of operating and general and administrative expenses, including reimbursements to NRG for services provided to the Company in accordance with the Management Services Agreement;
variations in revenues generated by the business, due to seasonality or otherwise;
debt service requirements and other liabilities;
fluctuations in working capital needs;
the Company's ability to borrow funds and access capital markets;
restrictions contained in the Company's debt agreements (including project-level financing and, if applicable, corporate debt); and
other business risks affecting cash levels.
As a result of all these factors, the Company cannot guarantee that it will have sufficient cash generated from operations to pay a specific level of cash dividends to holders of its common stock. Furthermore, holders of the Company's common stock should be aware that the amount of CAFD depends primarily on operating cash flow, and is not solely a function of profitability, which iscan be affected by non-cash items.
The Company may incur other expenses or liabilities during a period that could significantly reduce or eliminate its CAFD and, in turn, impair its ability to pay dividends to holders of the Company's common stock during the period. Because the Company is a holding company, its ability to pay dividends on the Company's common stock isrestricted and further limited by restrictions on its ability to pay dividends and the ability of the Company's subsidiaries to make distributions to the Company, including restrictions under the terms of the agreements governing the Company's corporate debt and project-level financing. The project-level financing agreements generally prohibit distributions from the project entities prior to COD and thereafter prohibit distributions to the Company unless certain specific conditions are met, including the satisfaction of financial ratios. The Company's amended and restated revolving credit facility also restricts the Company's ability to declare and pay dividends if an event of default has occurred and is continuing or if the payment of the dividend would result in an event of default.
NRG Yield LLC's CAFD will likely fluctuate from quarter to quarter, in some cases significantly, due to seasonality. As a result, the Company may cause NRG Yield LLC to reduce the amount of cash it distributes to its members in a particular quarter to establish reserves to fund distributions to its members in future periods for which the cash distributions the Company would otherwise receive from NRG Yield LLC would otherwise be insufficient to fund its quarterly dividend. If the Company fails to cause NRG Yield LLC to establish sufficient reserves, the Company may not be able to maintain its quarterly dividend with respect to a quarter adversely affected by seasonality.
Finally, dividends to holders of the Company's common stock will be paid at the discretion of the Company's board of directors. The Company's board of directors may decrease the level, or entirely discontinue payment, of dividends.
The Company is a holding company and its only material asset is its interest in NRG Yield LLC, and the Company is accordingly dependent upon distributions from NRG Yield LLC and its subsidiaries to pay dividends and taxes and other expenses.
The Company is a holding company and has no material assets other than its ownership of membership interests in NRG Yield LLC, a holding company that has no material assets other than its interest in NRG Yield Operating LLC, whose sole material assets are the project companies. None of the Company, NRG Yield LLC or NRG Yield Operating LLC has any independent means of generating revenue. The Company intends to continue to cause NRG Yield Operating LLC's subsidiaries to make distributions to NRG Yield Operating LLC and, in turn, make distributions to NRG Yield LLC, and, in turn, to make distributions to the Company in an amount sufficient to cover all applicable taxes payable and dividends, if any, declared by the Company. To the extent that the Company needs funds for a quarterly cash dividend to holders of the Company's Class A and Class C common stock or otherwise, and NRG Yield Operating LLC or NRG Yield LLC is restricted from making such distributions under applicable law or regulation or is otherwise unable to provide such funds (including as a result of NRG Yield Operating LLC's operating
subsidiaries being unable to make distributions), it could materially adversely affect the Company's liquidity and financial condition and limit the Company's ability to pay dividends to holders of the Company's Class A and Class C common stock.
The Company has a limited operating history and as a result there is no assurance the Company can operate on a profitable basis.
The Company has a limited operating history on which to base an evaluation of its business and prospects. The Company's prospects must be considered in light of the risks, expenses and difficulties frequently encountered by companies in their early stages of operation. The Company cannot assure investors that it will be successful in addressing the risks the Company may encounter, and the Company's failure to do so could have a material adverse effect on its business, financial condition, results of operations and cash flows.
Market interest rates may have an effect on the value of the Company's Class A and Class C common stock.
One of the factors that influences the price of shares of the Company's Class A and Class C common stock is the effective dividend yield of such shares (i.e., the yield as a percentage of the then market price of the Company's shares) relative to market interest rates. An increase in market interest rates, which are currently at low levels relative to historical rates, may lead investors of shares of the Company's Class A and Class C common stock to expect a higher dividend yield and the Company's inability to increase its dividend as a result of an increase in borrowing costs, insufficient CAFD or otherwise, could result in selling pressure on, and a decrease in the market prices of the Company's Class A and Class C common stock as investors seek alternative investments with higher yield.
If the Company is deemed to be an investment company, the Company may be required to institute burdensome compliance requirements and the Company's activities may be restricted, which may make it difficult for the Company to complete strategic acquisitions or effect combinations.
If the Company is deemed to be an investment company under the Investment Company Act of 1940, or the Investment Company Act, the Company's business would be subject to applicable restrictions under the Investment Company Act, which could make it impracticable for the Company to continue its business as contemplated. The Company believes it is not an investment company under Section 3(b)(1) of the Investment Company Act because the Company is primarily engaged in a non-investment company business. The Company intends to conduct its operations so that the Company will not be deemed an investment company. However, if the Company were to be deemed an investment company, restrictions imposed by the Investment Company Act, including limitations on the Company's capital structure and the Company's ability to transact with affiliates, could make it impractical for the Company to continue its business as contemplated.
Market volatility may affect the price of the Company's Class A and Class C common stock.
The market price of the Company's Class A and Class C common stock may fluctuate significantly in response to a number of factors, most of which the Company cannot predict or control, including general market and economic conditions, disruptions, downgrades, credit events and perceived problems in the credit markets; actual or anticipated variations in its quarterly operating results or dividends; changes in the Company's investments or asset composition; write-downs or perceived credit or liquidity issues affecting the Company's assets; market perception of NRG, the Company's business and the Company's assets; the Company's level of indebtedness and/or adverse market reaction to any indebtedness that the Company may incur in the future; the Company's ability to raise capital on favorable terms or at all; loss of any major funding source; the termination of the Management Services Agreement or additions or departures of the Company's executive officers or NRG's key personnel; changes in market valuations of similar power generation companies; and speculation in the press or investment community regarding the Company or NRG.
Securities markets in general have experienced extreme volatility that has often been unrelated to the operating performance of particular companies. Any broad market fluctuations may adversely affect the trading price of the Company's Class A and Class C common stock.
CurrentVolatility of market conditions have increasedmay increase certain of the risks the companyCompany faces.
Conditions in theThe capital markets for growth, income and energy companies, including renewables companies, generally deteriorated in 2015. In some cases, these developments have affectedgeneral are often subject to volatility that is unrelated to the operating performance of particular companies. Market volatility can affect the plans and perspectives of various market participants, including operating entities, consumers and financing providers, and have increasedmay increase uncertainty and heightenedheighten some of the risks the Company faces. The Company and other companies may have adjustedto adjust their plans and priorities in light of these developments.
such volatility.
Risks that have increasedmay increase as a result of these developmentsmarket volatility include, but are not limited to, risks related to access to capital and liquidity and risks related to the performance of third parties, including NRG. The Company has significant relationships with, and in certain areas depends significantly on, NRG. In particular, NRG provides management and operational services and other support. The Company’s growth strategy depends on its ability to identify and acquire additional facilities from NRG and unaffiliated third parties. The Company interacts with or depends on NRG for many third-party acquisition opportunities and for operations and maintenance support on various pending and completed transactions. As a result, the Company’s financial and operating performance and prospects, including the Company’s ability to grow its dividend per share, may be affected by the performance, prospects, and priorities of NRG, and material adverse developments at NRG or changes in its strategic priorities may materially affect ourthe Company's business, financial condition and results of operations.
Furthermore, any significant disruption to the Company’s ability to access the capital markets, or a significant increase in interest rates, could make it difficult for the Company to successfully acquire attractive projects from third parties and may also
limit the Company’s ability to obtain debt or equity financing to complete such acquisitions. If the Company is unable to raise adequate proceeds when needed to fund such acquisitions, the ability to grow the Company’s project portfolio may be limited, which could have a material adverse effect on the Company’s ability to implement its growth strategy and, ultimately, its business, financial condition, results of operations and cash flows.
Provisions of the Company's charter documents or Delaware law could delay or prevent an acquisition of the Company, even if the acquisition would be beneficial to holders of the Company's Class A and Class C common stock, and could make it more difficult to change management.
Provisions of the Company's second amended and restated certificate of incorporation and third amended and restated bylaws may discourage, delay or prevent a merger, acquisition or other change in control that holders of the Company's Class A and Class C common stock may consider favorable, including transactions in which such stockholders might otherwise receive a premium for their shares. This is because these provisions may prevent or frustrate attempts by stockholders to replace or remove members of the Company's management. These provisions include:
a prohibition on stockholder action through written consent;
a requirement that special meetings of stockholders be called upon a resolution approved by a majority of the Company's directors then in office;
advance notice requirements for stockholder proposals and nominations; and
the authority of the board of directors to issue preferred stock with such terms as the board of directors may determine.
Section 203 of the DGCL prohibits a publicly held Delaware corporation from engaging in a business combination with an interested stockholder, generally a person that together with its affiliates owns or within the last three years has owned 15% of voting stock, for a period of three years after the date of the transaction in which the person became an interested stockholder, unless the business combination is approved in a prescribed manner. Additionally, the Company's second amended and restated certificate of incorporation prohibits any person and any of its associate or affiliate companies in the aggregate, public utility or holding company from acquiring, other than secondary market transactions, an amount of the Company's Class A or Class C common stock sufficient to result in a transfer of control without the prior written consent of the Company's board of directors. Any such change of control, in addition to prior approval from the Company's board of directors, would require prior authorization from FERC. Similar restrictions may apply to certain purchasers of the Company's securities which are holding companies regardless of whether the Company's securities are purchased in offerings by the Company or NRG, in open market transactions or otherwise. A purchaser of the Company's securities which is a holding company will need to determine whether a given purchase of the Company's securities may require prior FERC approval.
Investors may experience dilution of ownership interest due to the future issuance of additional shares of the Company's Class A or Class C common stock.
The Company is in a capital intensive business, and may not have sufficient funds to finance the growth of the Company's business, future acquisitions or to support the Company's projected capital expenditures. As a result, the Company may require additional funds from further equity or debt financings, including tax equity financing transactions or sales of preferred shares or convertible debt to complete future acquisitions, expansions and capital expenditures and pay the general and administrative costs of the Company's business. In the future, the Company may issue the Company's previously authorized and unissued securities, resulting in the dilution of the ownership interests of purchasers of the Company's Class A and Class C common stock. Under the Company's second amended and restated certificate of incorporation, the Company is authorized to issue 500,000,000 shares of Class A common stock, 500,000,000 shares of Class B common stock, 1,000,000,000 shares of Class C common stock, 1,000,000,000 shares of Class D common stock and 10,000,000 shares of preferred stock with preferences and rights as determined by the Company's board of directors. The potential issuance of additional shares of common stock or preferred stock or convertible debt may create downward pressure on the trading price of the Company's Class A and Class C common stock.
If securities or industry analysts do not publish or cease publishing research or reports about the Company, the Company's business or the Company's market, or if they change their recommendations regarding the Company's Class A and/or Class C common stock adversely, the stock price and trading volume of the Company's Class A and/or Class C common stock could decline.
The trading market for the Company's Class A and Class C common stock is influenced by the research and reports that industry or securities analysts may publish about the Company, the Company's business, the Company's market or the Company's competitors. If any of the analysts who may cover the Company change their recommendation regarding the Company's Class A and/or Class C common stock adversely, or provide more favorable relative recommendations about the Company's competitors,
the price of the Company's Class A and/or Class C common stock would likely decline. If any analyst who covers the Company were to cease coverage of the Company or fail to regularly publish reports on the Company, the Company could lose visibility in the financial markets, which in turn could cause the stock price or trading volume of the Company's Class A and/or Class C common stock to decline.
Future sales of the Company's Class A or Class C common stock by NRG may cause the price of the Company's Class A or Class C common stock to fall.
The market price of the Company's Class A or Class C common stock could decline as a result of sales by NRG of such shares (issuable to NRG upon the exchange of some or all of its NRG Yield LLC Class B or Class D units, respectively) in the market, or the perception that these sales could occur.
The market price of the Company's Class A or Class C common stock may also decline as a result of NRG disposing or transferring some or all of the Company's outstanding Class B or Class D common stock, which disposals or transfers would reduce NRG's ownership interest in, and voting control over, the Company. These sales might also make it more difficult for the Company to sell equity securities at a time and price that the Company deems appropriate. NRG and certain of its affiliates have certain demand and piggyback registration rights with respect to shares of the Company's Class A common stock issuable upon the exchange of NRG Yield LLC's Class B units and/or Class C common stock issuable upon the exchange of NRG Yield LLC's Class D units. The presence of additional shares of the Company's Class A and/or Class C common stock trading in the public market, as a result of the exercise of such registration rights, may have a material adverse effect on the market price of the Company's securities.
Risks Related to Taxation
The Company's future tax liability may be greater than expected if the Company does not generate NOLs sufficient to offset taxable income, if federal, state and local tax authorities challenge certain of the Company’s tax positions and exemptions or if changes in federal, state and local tax regulationslaws occur.
The Company expects to generate NOLs and carryforward prior year NOL balances to offset future taxable income. Based on the Company's current portfolio of assets, which include renewable assets that benefit from accelerated tax depreciation deductions, the Company does not expect to pay significant federal income tax for a period of approximately nineten years. While the Company expects these losses will be available as a future benefit, in the event that they are not generated as expected, successfully challenged by the IRS or state and local jurisdictions (in a tax audit or otherwise) or subject to future limitations from a potential change in ownership as discussed below, the Company's ability to realize these benefits may be limited. In addition, the Company’s ability to realize state and local tax exemptions, including property or sales and use tax exemptions, is subject to various tax laws. If these exemptions are successfully challenged by state and local jurisdictions or if a change in tax law occurs, the Company’s ability to realize these exemptions could be affected. A reduction in the Company's expected NOLs, a limitation on the Company's ability to use such losses or tax credits, and challenges by tax authorities to the Company’s tax positions may result in a material increase in the Company's estimated future income tax liability and may negatively impact the Company's liquidity and financial condition.
The Company's ability to use NOLs to offset future income may be limited.
The Company's ability to use NOLs could be substantially limited if the Company were to experience an "ownership change" as defined under Section 382 of the Code. In general, an "ownership change" would occur if the Company's "5-percent shareholders," as defined under Section 382 of the Code, collectively increased their ownership in the Company by more than 50 percentage points over a rolling three-year period. A corporation that experiences an ownership change will generally be subject to an annual limitation on the use of its pre-ownership change deferred tax assets equal to the equity value of the corporation immediately before the ownership change, multiplied by the long-term tax-exempt rate for the month in which the ownership change occurs. Future sales of any class of the Company's common stock by NRG, as well as future issuances by the Company, could contribute to a potential ownership change.
A valuation allowance may be required for the Company's deferred tax assets.
The Company's expected NOLs and tax credits will be reflected as a deferred tax asset as they are generated until utilized to offset income. Valuation allowances may need to be maintained for deferred tax assets that the Company estimates are more likely than not to be unrealizable, based on available evidence at the time the estimate is made. Valuation allowances related to deferred tax assets can be affected by changes to tax laws, statutory tax rates and future taxable income levels. In the event that the Company was to determine that it would not be able to realize all or a portion of the net deferred tax assets in the future, the Company would reduce such amounts through a charge to income tax expense in the period in which that determination was made, which could have a material adverse impact on the Company's financial condition and results of operations.
Distributions to holders of the Company's Class A and Class C common stock may be taxable.
The amount of distributions that will be treated as taxable for U.S. federal income tax purposes will depend on the amount of the Company's current and accumulated earnings and profits. It is difficult to predict whether the Company will generate earnings or profits as computed for federal income tax purposes in any given tax year. Generally, a corporation's earnings and profits are computed based upon taxable income, with certain specified adjustments. Distributions will constitute ordinary dividend income to the extent paid from the Company's current or accumulated earnings and profits, and a nontaxable return of capital to the extent of a stockholder's basis in his or her Class A or Class C common stock. Distributions in excess of the Company's current and accumulated earnings and profits and in excess of a stockholder's basis will be treated as gain from the sale of the common stock.
For U.S. tax purposes, NRG Yield, Inc.'s 2015the Company's distributions to its shareholdersstockholders in 2016 and 2015 are classified for U.S. federal income tax purposes as a nontaxable return of capital and reduction of a U.S. shareholder'sstockholder's tax basis, to the extent of a U.S. shareholder'sstockholder's tax basis in each of its NRG Yield, Inc’sthe Company's common shares, with any remaining amount being taxed as capital gain.
CAUTIONARY STATEMENT REGARDING FORWARD-LOOKING INFORMATION
This Annual Report on Form 10-K of NRG Yield, Inc., together with its consolidated subsidiaries, or the Company, includes forward-looking statements within the meaning of Section 27A of the Securities Act of 1933, as amended, or the Securities Act, and Section 21E of the Securities Exchange Act of 1934, as amended, or the Exchange Act. The words "believes," "projects," "anticipates," "plans," "expects," "intends," "estimates" and similar expressions are intended to identify forward-looking statements. These forward-looking statements involve known and unknown risks, uncertainties and other factors that may cause the Company's actual results, performance and achievements, or industry results, to be materially different from any future results, performance or achievements expressed or implied by such forward-looking statements. These factors, risks and uncertainties include the factors described under Item 1A — Risk Factors and the following:
The Company's ability to maintain and grow its quarterly dividend;
The Company's ability to successfully identify, evaluate and consummate acquisitions from third parties;
The Company's ability to acquire assets from NRG;
The Company's ability to raise additional capital due to its indebtedness, corporate structure, market conditions or otherwise;
Hazards customary to the power production industry and power generation operations such as fuel and electricity price volatility, unusual weather conditions (including wind and solar conditions), catastrophic weather-related or other damage to facilities, unscheduled generation outages, maintenance or repairs, unanticipated changes to fuel supply costs or availability due to higher demand, shortages, transportation problems or other developments, environmental incidents, or electric transmission or gas pipeline system constraints and the possibility that the Company may not have adequate insurance to cover losses as a result of such hazards;
The Company's ability to operate its businesses efficiently, manage maintenance capital expenditures and costs effectively, and generate earnings and cash flows from its asset-based businesses in relation to its debt and other obligations;
The willingness and ability of counterparties to the Company's offtake agreements to fulfill their obligations under such agreements;
The Company's ability to enter into contracts to sell power and procure fuel on acceptable terms and prices as current offtake agreements expire;
Government regulation, including compliance with regulatory requirements and changes in market rules, rates, tariffs and environmental laws;
Changes in law, including judicial decisions;
The Company's ability to receive anticipated cash grants with respect to certain renewable (wind and solar) assets;
Operating and financial restrictions placed on the Company and its subsidiaries that are contained in the project-level debt facilities and other agreements of certain subsidiaries and project-level subsidiaries generally, in the NRG Yield Operating LLC amended and restated revolving credit facility, in the indenture governing the Senior Notes and in the indentures governing the Company's convertible notes; and
The Company's ability to borrow additional funds and access capital markets, as well as the Company's substantial indebtedness and the possibility that the Company may incur additional indebtedness going forward.
Forward-looking statements speak only as of the date they were made, and the Company undertakes no obligation to publicly update or revise any forward-looking statements, whether as a result of new information, future events or otherwise. The foregoing review of factors that could cause the Company's actual results to differ materially from those contemplated in any forward-looking statements included in this Annual Report on Form 10-K should not be construed as exhaustive.
Item 1B — Unresolved Staff Comments
None.
Item 2 — Properties
Listed below are descriptions of the Company's interests in facilities, operations and/or projects owned or leased as of December 31, 2015.2016.
| | | | | Capacity | | | | | | Capacity | | | | |
| | | Rated MW | | Net MW(a) | | Ownership | | PPA Terms | | Rated MW | | Net MW(a) | | Owner-ship | | PPA Terms |
| Assets | | Location | | Fuel | | COD | | Counterparty | | Expiration | | Location | | Fuel | | COD | | Counterparty | | Expiration |
| Conventional | | | | | | | | | | | | | | |
| El Segundo | | El Segundo, CA | | 550 |
| | 550 |
| | 100 | % | | Natural Gas | | August 2013 | | Southern California Edison | | 2023 | | El Segundo, CA | | 550 |
| | 550 |
| | 100 | % | | Natural Gas | | August 2013 | | Southern California Edison | | 2023 |
GenConn Devon (b) | | Milford, CT | | 190 |
| | 95 |
| | 50 | % | | Natural Gas/Oil | | June 2010 | | Connecticut Light & Power | | 2040 | | Milford, CT | | 190 |
| | 95 |
| | 50 | % | | Natural Gas/Oil | | June 2010 | | Connecticut Light & Power | | 2040 |
GenConn Middletown (b) | | Middletown, CT | | 190 |
| | 95 |
| | 50 | % | | Natural Gas/Oil | | June 2011 | | Connecticut Light & Power | | 2041 | | Middletown, CT | | 190 |
| | 95 |
| | 50 | % | | Natural Gas/Oil | | June 2011 | | Connecticut Light & Power | | 2041 |
| Marsh Landing | | Antioch, CA | | 720 |
| | 720 |
| | 100 | % | | Natural Gas | | May 2013 | | Pacific Gas and Electric | | 2023 | | Antioch, CA | | 720 |
| | 720 |
| | 100 | % | | Natural Gas | | May 2013 | | Pacific Gas and Electric | | 2023 |
| Walnut Creek | | City of Industry, CA | | 485 |
| | 485 |
| | 100 | % | | Natural Gas | | May 2013 | | Southern California Edison | | 2023 | | City of Industry, CA | | 485 |
| | 485 |
| | 100 | % | | Natural Gas | | May 2013 | | Southern California Edison | | 2023 |
| Total Conventional | Total Conventional | | 2,135 |
| | 1,945 |
| | | | Total Conventional | | 2,135 |
| | 1,945 |
| | | |
| Utility Scale Solar | Utility Scale Solar | | | | | | | | Utility Scale Solar | | | | | | | |
| Alpine | | Lancaster, CA | | 66 |
| | 66 |
| | 100 | % | | Solar | | January 2013 | | Pacific Gas and Electric | | 2033 | | Lancaster, CA | | 66 |
| | 66 |
| | 100 | % | | Solar | | January 2013 | | Pacific Gas and Electric | | 2033 |
Avenal (b) | | Avenal, CA | | 45 |
| | 23 |
| | 50 | % | | Solar | | August 2011 | | Pacific Gas and Electric | | 2031 | | Avenal, CA | | 45 |
| | 23 |
| | 50 | % | | Solar | | August 2011 | | Pacific Gas and Electric | | 2031 |
| Avra Valley | | Pima County, AZ | | 26 |
| | 26 |
| | 100 | % | | Solar | | December 2012 | | Tucson Electric Power | | 2032 | | Pima County, AZ | | 26 |
| | 26 |
| | 100 | % | | Solar | | December 2012 | | Tucson Electric Power | | 2032 |
| Blythe | | Blythe, CA | | 21 |
| | 21 |
| | 100 | % | | Solar | | December 2009 | | Southern California Edison | | 2029 | | Blythe, CA | | 21 |
| | 21 |
| | 100 | % | | Solar | | December 2009 | | Southern California Edison | | 2029 |
| Borrego | | Borrego Springs, CA | | 26 |
| | 26 |
| | 100 | % | | Solar | | February 2013 | | San Diego Gas and Electric | | 2038 | | Borrego Springs, CA | | 26 |
| | 26 |
| | 100 | % | | Solar | | February 2013 | | San Diego Gas and Electric | | 2038 |
| CVSR | | San Luis Obispo, CA | | 250 |
| | 122 |
| | 48.95 | % | | Solar | | October 2013 | | Pacific Gas and Electric | | 2038 | | San Luis Obispo, CA | | 250 |
| | 250 |
| | 100 | % | | Solar | | October 2013 | | Pacific Gas and Electric | | 2038 |
| Desert Sunlight 250 | | Desert Center, California | | 250 |
| | 63 |
| | 25 | % | | Solar | | December 2013 | | Southern California Edison | | 2035 | | Desert Center, California | | 250 |
| | 63 |
| | 25 | % | | Solar | | December 2013 | | Southern California Edison | | 2035 |
| Desert Sunlight 300 | | Desert Center, California | | 300 |
| | 75 |
| | 25 | % | | Solar | | December 2013 | | Pacific Gas and Electric | | 2040 | | Desert Center, California | | 300 |
| | 75 |
| | 25 | % | | Solar | | December 2013 | | Pacific Gas and Electric | | 2040 |
| Kansas South | | Lemoore, CA | | 20 |
| | 20 |
| | 100 | % | | Solar | | June 2013 | | Pacific Gas and Electric | | 2033 | | Lemoore, CA | | 20 |
| | 20 |
| | 100 | % | | Solar | | June 2013 | | Pacific Gas and Electric | | 2033 |
| Roadrunner | | Santa Teresa, NM | | 20 |
| | 20 |
| | 100 | % | | Solar | | August 2011 | | El Paso Electric | | 2031 | | Santa Teresa, NM | | 20 |
| | 20 |
| | 100 | % | | Solar | | August 2011 | | El Paso Electric | | 2031 |
| TA High Desert | | Lancaster, CA | | 20 |
| | 20 |
| | 100 | % | | Solar | | March 2013 | | Southern California Edison | | 2033 | | Lancaster, CA | | 20 |
| | 20 |
| | 100 | % | | Solar | | March 2013 | | Southern California Edison | | 2033 |
| Total Utility Scale Solar | Total Utility Scale Solar | | 1,044 |
| | 482 |
| | | | Total Utility Scale Solar | | 1,044 |
| | 610 |
| | | |
| Distributed Solar | Distributed Solar | | | | | | | | Distributed Solar | | | | | | | |
| AZ DG Solar Projects | | AZ | | 5 |
| | 5 |
| | 100 | % | | Solar | | December 2010 - January 2013 | | Various | | 2025 - 2033 | | AZ | | 5 |
| | 5 |
| | 100 | % | | Solar | | December 2010 - January 2013 | | Various | | 2025 - 2033 |
| PFMG DG Solar Projects | | CA | | 9 |
| | 4 |
| | 51 | % | | Solar | | October 2012 - December 2012 | | Various | | 2032 | | CA | | 9 |
| | 4 |
| | 51 | % | | Solar | | October 2012 - December 2012 | | Various | | 2032 |
| Total Distributed Solar | Total Distributed Solar | | 14 |
| | 9 |
| | | | Total Distributed Solar | | 14 |
| | 9 |
| | | |
| Wind | Wind | | | | | | | | Wind | | | | | | | |
| Alta I | | Tehachapi, CA | | 150 |
| | 150 |
| | 100 | % | | Wind | | December 2010 | | Southern California Edison | | 2035 | | Tehachapi, CA | | 150 |
| | 150 |
| | 100 | % | | Wind | | December 2010 | | Southern California Edison | | 2035 |
| Alta II | | Tehachapi, CA | | 150 |
| | 150 |
| | 100 | % | | Wind | | December 2010 | | Southern California Edison | | 2035 | | Tehachapi, CA | | 150 |
| | 150 |
| | 100 | % | | Wind | | December 2010 | | Southern California Edison | | 2035 |
| Alta III | | Tehachapi, CA | | 150 |
| | 150 |
| | 100 | % | | Wind | | February 2011 | | Southern California Edison | | 2035 | | Tehachapi, CA | | 150 |
| | 150 |
| | 100 | % | | Wind | | February 2011 | | Southern California Edison | | 2035 |
| Alta IV | | Tehachapi, CA | | 102 |
| | 102 |
| | 100 | % | | Wind | | March 2011 | | Southern California Edison | | 2035 | | Tehachapi, CA | | 102 |
| | 102 |
| | 100 | % | | Wind | | March 2011 | | Southern California Edison | | 2035 |
| Alta V | | Tehachapi, CA | | 168 |
| | 168 |
| | 100 | % | | Wind | | April 2011 | | Southern California Edison | | 2035 | | Tehachapi, CA | | 168 |
| | 168 |
| | 100 | % | | Wind | | April 2011 | | Southern California Edison | | 2035 |
Alta X (d)(b) | | Tehachapi, CA | | 137 |
| | 137 |
| | 100 | % | | Wind | | February 2014 | | Southern California Edison | | 2038 | | Tehachapi, CA | | 137 |
| | 137 |
| | 100 | % | | Wind | | February 2014 | | Southern California Edison | | 2038 |
| | | | | Capacity | | | | | | Capacity | | | | |
| | | Rated MW | | Net MW | | Ownership | | PPA Terms | | Rated MW | | Net MW(a) | | Owner- ship | | PPA Terms |
| Assets | | Location | | Fuel | | COD | | Counterparty | | Expiration | | Location | | Fuel | | COD | | Counterparty | | Expiration |
Alta XI (d)(b) | | Tehachapi, CA | | 90 |
| | 90 |
| | 100 | % | | Wind | | February 2014 | | Southern California Edison | | 2038 | | Tehachapi, CA | | 90 |
| | 90 |
| | 100 | % | | Wind | | February 2014 | | Southern California Edison | | 2038 |
| Buffalo Bear | | Buffalo, OK | | 19 |
| | 19 |
| | 100 | % | | Wind | | December 2008 | | Western Farmers Electric Co-operative | | 2033 | | Buffalo, OK | | 19 |
| | 19 |
| | 100 | % | | Wind | | December 2008 | | Western Farmers Electric Co-operative | | 2033 |
Crosswinds | | Ayrshire, IA | | 21 |
| | 16 |
| | 74.3 | % | | Wind | | June 2007 | | Corn Belt Power Cooperative | | 2027 | | Ayrshire, IA | | 21 |
| | 16 |
| | 74.3 | % | | Wind | | June 2007 | | Corn Belt Power Cooperative | | 2027 |
Elbow Creek | | Howard County, TX | | 122 |
| | 92 |
| | 75 | % | | Wind | | December 2008 | | NRG Power Marketing LLC | | 2022 | | Howard County, TX | | 122 |
| | 92 |
| | 75 | % | | Wind | | December 2008 | | NRG Power Marketing LLC | | 2022 |
Elkhorn Ridge | | Bloomfield, NE | | 54 |
| | 41 |
| | 50.3 | % | | Wind | | March 2009 | | Nebraska Public Power District | | 2029 | | Bloomfield, NE | | 54 |
| | 41 |
| | 50.3 | % | | Wind | | March 2009 | | Nebraska Public Power District | | 2029 |
Forward | | Berlin, PA | | 29 |
| | 22 |
| | 75 | % | | Wind | | April 2008 | | Constellation NewEnergy, Inc. | | 2017 | | Berlin, PA | | 29 |
| | 22 |
| | 75 | % | | Wind | | April 2008 | | Constellation NewEnergy, Inc. | | 2017 |
Goat Wind | | Sterling City, TX | | 150 |
| | 113 |
| | 74.9 | % | | Wind | | April 2008/June 2009 | | Dow Pipeline Company | | 2025 | | Sterling City, TX | | 150 |
| | 113 |
| | 74.9 | % | | Wind | | April 2008/June 2009 | | Dow Pipeline Company | | 2025 |
Hardin | | Jefferson, IA | | 15 |
| | 11 |
| | 74.3 | % | | Wind | | May 2007 | | Interstate Power and Light Company | | 2027 | | Jefferson, IA | | 15 |
| | 11 |
| | 74.3 | % | | Wind | | May 2007 | | Interstate Power and Light Company | | 2027 |
| Laredo Ridge | | Petersburg, NE | | 80 |
| | 80 |
| | 100 | % | | Wind | | February 2011 | | Nebraska Public Power District | | 2031 | | Petersburg, NE | | 80 |
| | 80 |
| | 100 | % | | Wind | | February 2011 | | Nebraska Public Power District | | 2031 |
Lookout | | Berlin, PA | | 38 |
| | 29 |
| | 75 | % | | Wind | | October 2008 | | Southern Maryland Electric Cooperative | | 2030 | | Berlin, PA | | 38 |
| | 29 |
| | 75 | % | | Wind | | October 2008 | | Southern Maryland Electric Cooperative | | 2030 |
Odin | | Odin, MN | | 20 |
| | 15 |
| | 74.9 | % | | Wind | | June 2008 | | Missouri River Energy Services | | 2028 | | Odin, MN | | 20 |
| | 15 |
| | 74.9 | % | | Wind | | June 2008 | | Missouri River Energy Services | | 2028 |
| Pinnacle | | Keyser, WV | | 55 |
| | 55 |
| | 100 | % | | Wind | | December 2011 | | Maryland Department of General Services and University System of Maryland | | 2031 | | Keyser, WV | | 55 |
| | 55 |
| | 100 | % | | Wind | | December 2011 | | Maryland Department of General Services and University System of Maryland | | 2031 |
San Juan Mesa | | Elida, NM | | 90 |
| | 68 |
| | 56.3 | % | | Wind | | December 2005 | | Southwestern Public Service Company | | 2025 | | Elida, NM | | 90 |
| | 68 |
| | 56.3 | % | | Wind | | December 2005 | | Southwestern Public Service Company | | 2025 |
Sleeping Bear | | Woodward, OK | | 95 |
| | 71 |
| | 75 | % | | Wind | | October 2007 | | Public Service Company of Oklahoma | | 2032 | | Woodward, OK | | 95 |
| | 71 |
| | 75 | % | | Wind | | October 2007 | | Public Service Company of Oklahoma | | 2032 |
| South Trent | | Sweetwater, TX | | 101 |
| | 101 |
| | 100 | % | | Wind | | January 2009 | | AEP Energy Partners | | 2029 | | Sweetwater, TX | | 101 |
| | 101 |
| | 100 | % | | Wind | | January 2009 | | AEP Energy Partners | | 2029 |
Spanish Fork | | Spanish Fork, UT | | 19 |
| | 14 |
| | 75 | % | | Wind | | July 2008 | | PacifiCorp | | 2028 | | Spanish Fork, UT | | 19 |
| | 14 |
| | 75 | % | | Wind | | July 2008 | | PacifiCorp | | 2028 |
Spring Canyon II (c)(b) | | Logan County, CO | | 32 |
| | 29 |
| | 90.1 | % | | Wind | | October 2014 | | Platte River Power Authority | | 2039 | | Logan County, CO | | 32 |
| | 29 |
| | 90.1 | % | | Wind | | October 2014 | | Platte River Power Authority | | 2039 |
Spring Canyon III (c)(b) | | Logan County, CO | | 28 |
| | 25 |
| | 90.1 | % | | Wind | | December 2014 | | Platte River Power Authority | | 2039 | | Logan County, CO | | 28 |
| | 25 |
| | 90.1 | % | | Wind | | December 2014 | | Platte River Power Authority | | 2039 |
| Taloga | | Putnam, OK | | 130 |
| | 130 |
| | 100 | % | | Wind | | July 2011 | | Oklahoma Gas & Electric | | 2031 | | Putnam, OK | | 130 |
| | 130 |
| | 100 | % | | Wind | | July 2011 | | Oklahoma Gas & Electric | | 2031 |
Wildorado | | Vega, TX | | 161 |
| | 121 |
| | 74.9 | % | | Wind | | April 2007 | | Southwestern Public Service Company | | 2027 | | Vega, TX | | 161 |
| | 121 |
| | 74.9 | % | | Wind | | April 2007 | | Southwestern Public Service Company | | 2027 |
| Total Wind | Total Wind | | 2,206 |
| | 1,999 |
| | | | Total Wind | | 2,206 |
| | 1,999 |
| | | |
| Thermal Generation | Thermal Generation | | | | | | | | Thermal Generation | | | | | | | |
| Dover | | Dover, DE | | 104 |
| | 104 |
| | 100 | % | | Natural Gas | | June 2013 | | Power sold into PJM markets | | Dover, DE | | 103 |
| | 103 |
| | 100 | % | | Natural Gas | | June 2013 | | NRG Power Marketing LLC |
| 2018 |
| Paxton Creek Cogen | | Harrisburg, PA | | 12 |
| | 12 |
| | 100 | % | | Natural Gas | | November 1986 | | Power sold into PJM markets | | Harrisburg, PA | | 12 |
| | 12 |
| | 100 | % | | Natural Gas | | November 1986 | | Power sold into PJM markets |
| Princeton Hospital | | Princeton, NJ | | 5 |
| | 5 |
| | 100 | % | | Natural Gas | | January 2012 | | Excess power sold to local utility | | Princeton, NJ | | 5 |
| | 5 |
| | 100 | % | | Natural Gas | | January 2012 | | Excess power sold to local utility |
| Tucson Convention Center | | Tucson, AZ | | 2 |
| | 2 |
| | 100 | % | | Natural Gas | | January 2003 | | Excess power sold to local utility | | Tucson, AZ | | 2 |
| | 2 |
| | 100 | % | | Natural Gas | | January 2003 | | Excess power sold to local utility |
| University of Bridgeport | | Bridgeport, CT | | 1 |
| | 1 |
| | 100 | % | | Natural Gas | | April 2015 | | University of Bridgeport | | 2034 | | Bridgeport, CT | | 1 |
| | 1 |
| | 100 | % | | Natural Gas | | April 2015 | | University of Bridgeport | | 2034 |
| Total Thermal Generation | Total Thermal Generation | | 124 |
| | 124 |
| | | | Total Thermal Generation | | 123 |
| | 123 |
| | | |
Total NRG Yield, Inc. (e)(c) | Total NRG Yield, Inc. (e)(c) | | 5,523 |
| | 4,559 |
| | | | Total NRG Yield, Inc. (e)(c) | | 5,522 |
| | 4,686 |
| | | |
(a) Net capacity represents the maximum, or rated, generating capacity of the facility multiplied by the Company's percentage ownership in the facility as of December 31, 2015.2016.
(b) On September 30, 2015, the Company acquired NRG's remaining 0.05% for an immaterial amount.
(c)Projects are part of tax equity arrangements, as further described in Note 2, Summary of Significant Accounting Policies.
(d)(c) PPA beganNRG Yield's total generation capacity is net of 6 MWs for noncontrolling interest for Spring Canyon II and III. NRG Yield's generation capacity including this noncontrolling interest was 4,692 MWs.
In addition to the facilities owned or leased in the table above, the Company entered into partnerships to own or purchase solar power generation projects, as well as other ancillary related assets from a related party via intermediate funds. The Company
does not consolidate these partnerships and accounts for them as equity method investments. The Company's net interest in these projects is 131 MW based on January 1, 2016.
(e) Total net capacity excludes capacity for RPV Holdco and DGPV Holdco, which are consolidated by NRG, ascash to be distributed. For further described indiscussions, refer to Item 15 — Note 5, Investments Accounted for by the Equity Method and Variable Interest Entities.Entities
During to the year ended December 31, 2015, the Company entered into a partnership agreement with NRG, the purpose of which is to own or purchase solar power generation projects and other ancillary related assets in the U.S. from NRG Renew DG Holdings LLC, as summarized in the table below:
|
| | | | | | | | | | | | | |
| | | | | | | | | | | | | |
| | | | | | | | | | | PPA Terms |
| Tax-equity projects | | Rated MW (a) | | Sites | | COD | | Fuel | | Counterparty | | Expiration |
| | | | | | | | | | | | | |
| Community solar projects | | 8 |
| | 10 | | Q3 2015 | | Solar | | Various commercial, residential and government entities | | 2035 |
| Commercial photovoltaic projects | | 37 |
| | 12 | | Q3 2015-Q1 2016 | | Solar | | Various commercial and government entities | | 2030-2035 |
| Total distributed generation tax equity projects | | 45 |
| | 22 | | | | | | | | |
| | | | | | | | | | | | | |
(a) Represents maximum generating capacity at standard test conditions of a facility multiplied by the Company's percentage ownership of that facility, disregarding any equity interests held by any tax equity investor, any lessor under sale-leaseback financing, or any non-controlling interests in a partnership.Consolidated Financial Statements.
The following table summarizes the Company's thermal steam and chilled water facilities as of December 31, 2015:2016:
| | | Name and Location of Facility | | % Owned | | Thermal Energy Purchaser | | Megawatt
Thermal
Equivalent
Capacity (MWt) | | Generating
Capacity | | Thermal Energy Purchaser | | % Owned | | Rated Megawatt
Thermal
Equivalent
Capacity (MWt) | | Net Megawatt
Thermal
Equivalent
Capacity (MWt) | | Generating
Capacity |
| NRG Energy Center Minneapolis, MN | | 100.0 | | Approx. 100 steam and 50 chilled water customers | | 322
136 |
| | Steam: 1,100 MMBtu/hr.
Chilled water: 38,700 tons | | Approx. 100 steam and 55 chilled water customers | | 100 | | 322
136 |
| | 322
136 |
| | Steam: 1,100 MMBtu/hr.
Chilled water: 38,700 tons |
| NRG Energy Center San Francisco, CA | | 100.0 | | Approx. 180 steam customers | | 133 |
| | Steam: 454 MMBtu/hr. | | Approx. 180 steam customers | | 100 | | 133 |
| | 133 |
| | Steam: 454 MMBtu/hr. |
| NRG Energy Center Omaha, NE | | 100.0
12.0(a)
100.0
0.0(a) | | Approx. 60 steam and 60 chilled water customers | | 142
73
77
26 |
| | Steam: 485 MMBtu/hr
Steam: 250 MMBtu/hr
Chilled water: 22,000 tons
Chilled water: 7,250 tons | | Approx. 60 steam and 65 chilled water customers | | 100
12(a)
100
0(a) | | 142
73
77
26 |
| | 142
9
77
0 |
| | Steam: 485 MMBtu/hr
Steam: 250 MMBtu/hr
Chilled water: 22,000 tons
Chilled water: 7,250 tons |
| NRG Energy Center Harrisburg, PA | | 100.0 | | Approx. 140 steam and 3 chilled water customers | | 108
13 |
|
| Steam: 370 MMBtu/hr.
Chilled water: 3,600 tons | | Approx. 130 steam and 5 chilled water customers | | 100 | | 108
13 |
|
| 108
13 |
| | Steam: 370 MMBtu/hr.
Chilled water: 3,600 tons |
| NRG Energy Center Phoenix, AZ | | 0.0(a)
100.0
12.0(a)
0.0(a) | | Approx. 35 chilled water customers | | 4 104 14 28 |
| | Steam: 13 MMBtu/hr
Chilled water: 29,600 tons
Chilled water: 3,950 tons
Chilled water: 8,000 tons | | Approx. 35 chilled water customers | | 24(a)
100
12(a)
0(a) | | 5 104 14 28 |
| | 1 104 2 0 |
| | Steam: 17 MMBtu/hr
Chilled water: 29,600 tons
Chilled water: 3,920 tons
Chilled water: 8,000 tons |
| NRG Energy Center Pittsburgh, PA | | 100.0 | | Approx. 25 steam and 25 chilled water customers | | 88
46 |
| | Steam: 302 MMBtu/hr.
Chilled water: 12,934 tons | | Approx. 25 steam and 25 chilled water customers | | 100 | | 88
49 |
| | 88
49 |
| | Steam: 302 MMBtu/hr.
Chilled water: 13,874 tons |
| NRG Energy Center San Diego, CA | | 100.0 | | Approx. 15 chilled water customers | | 31 |
| | Chilled water: 8,825 tons | | Approx. 20 chilled water customers | | 100 | | 31 |
| | 31 |
| | Chilled water: 8,825 tons |
| NRG Energy Center Dover, DE | | 100.0 | | Kraft Foods Inc. and Procter & Gamble Company | | 66 |
| | Steam: 225 MMBtu/hr. | | Kraft Heinz Company; Proctor and Gamble | | 100 | | 66 |
| | 66 |
| | Steam: 225 MMBtu/hr. |
| NRG Energy Center Princeton, NJ | | 100.0 | | Princeton HealthCare System | | 21
17 |
| | Steam: 72 MMBtu/hr.
Chilled water: 4,700 tons | | Princeton HealthCare System | | 100 | | 21
17 |
| | 21
17 |
| | Steam: 72 MMBtu/hr.
Chilled water: 4,700 tons |
| | | Total Generating Capacity (MWt) | | 1,449 |
| | | Total Generating Capacity (MWt) | | 1,453 |
| | 1,319 |
| |
(a) Net MWt capacity excludes 134 MWt available under the right-to-use provisions contained in agreements between two of the Company's thermal facilities and certain of its customers.
Other Properties
Through the Management Services Agreement with NRG, the Company utilizes NRG's leased corporate headquarters offices at 211804 Carnegie Center, Princeton, New Jersey. During 2016, NRG expects to move its 211 Carnegie Center, Princeton, New Jersey headquarters to a newly leased headquarters at 804 Carnegie Center, Princeton, New Jersey, which is currently under construction.
Item 3 — Legal Proceedings
None.See Item 15 — Note 16, Commitments and Contingencies, to the Consolidated Financial Statements for discussion of the material legal proceedings to which the Company is a party.
Item 4 — Mine Safety Disclosures
Not applicable.
PART II
Item 5 — Market for Registrant's Common Equity, Related Stockholder Matters and Issuer Purchases of Equity Securities
Market Information, Equity Holders, and HoldersDividends
The Company's Class A common stock and Class C common stock are listed on the New York Stock Exchange and trade under the ticker symbols "NYLD.A" and "NYLD","NYLD," respectively. The Company's Class B common stock and Class D common stock are not publicly traded.
As of January 31, 2016,2017, there were two holders of record of the Class A common stock, one holder of record of the Class B common stock, two holders of record of the Class C common stock and one holder of record of the Class D common stock.
The following table sets forth, for the period indicated, the high and low sales prices, as well as the closing price of the Company's Class A and Class C common stock as reported by the New York Stock Exchange.Exchange, as well as dividends per common share paid during those periods. The Company's Class C common stock began trading on the New York Stock Exchange on May 15, 2015. The historical Class A common stock sales prices below are adjusted to give effect to the stock split that occurred in connection with the Recapitalization:
| | | Common Stock Price Class A | Fourth Quarter 2015 | | Third Quarter 2015 | | Second Quarter 2015 | | First Quarter 2015 (a) | | Fourth Quarter 2014 (a) | | Third Quarter 2014 (a) | | Second Quarter 2014 (a) | | First Quarter 2014 (a) | Fourth Quarter 2016 | | Third Quarter 2016 | | Second Quarter 2016 | | First Quarter 2016 | | Fourth Quarter 2015 | | Third Quarter 2015 | | Second Quarter 2015 | | First Quarter 2015 (a) |
| High | $16.11 | | $22.55 | | $26.95 | | $26.65 | | $25.42 | | $27.58 | | $26.60 | | $20.29 | $16.50 | | $17.78 | | $15.97 | | $14.12 | | $16.11 | | $22.55 | | $26.95 | | $26.65 |
| Low | 10.50 | | 10.44 | | 21.84 | | 22.19 | | 19.82 | | 23.45 | | 19.72 | | 17.44 | 13.40 | | 14.93 | | 13.01 | | 9.83 | | 10.50 | | 10.44 | | 21.84 | | 22.19 |
| Closing | 13.91 | | 11.15 | | 21.99 | | 24.29 | | 23.57 | | 26.99 | | 20.20 | | 20.00 | 15.36 | | 16.32 | | 15.22 | | 13.57 | | 13.91 | | 11.15 | | 21.99 | | 24.29 |
| Dividends Per Common Share | $0.215 | | $0.21 | | $0.20 | | $0.195 | | $0.1875 | | $0.183 | | $0.175 | | $0.165 | $0.25 | | $0.24 | | $0.23 | | $0.225 | | $0.215 | | $0.21 | | $0.20 | | $0.195 |
| Common Stock Price Class C | | |
| High | $16.79 | | $22.63 | | $28.11 | | N/A | | N/A | | N/A | | N/A | | N/A | $17.01 | | $18.56 | | $16.78 | | $14.93 | | $16.79 | | $22.63 | | $28.11 | | N/A |
| Low | 11.30 | | 10.79 | | 21.79 | | N/A | | N/A | | N/A | | N/A | | N/A | 13.98 | | 15.33 | | 13.78 | | 10.49 | | 11.30 | | 10.79 | | 21.79 | | N/A |
| Closing | 14.76 | | 11.61 | | 21.89 | | N/A | | N/A | | N/A | | N/A | | N/A | 15.80 | | 16.96 | | 15.59 | | 14.24 | | 14.76 | | 11.61 | | 21.89 | | N/A |
| Dividends Per Common Share | $0.215 | | $0.21 | | $0.20 | | $0.195 | | $0.1875 | | $0.183 | | $0.175 | | $0.165 | $0.25 | | $0.24 | | $0.23 | | $0.225 | | $0.215 | | $0.21 | | $0.20 | | $0.195 |
(a) Dividends per common share have been retroactively adjusted to give effect to the stock split that occurred in connection with the Recapitalization.
N/A - Not applicable.
Dividends
On February 17, 2016,15, 2017, the Company declared a quarterly dividend on its Class A and Class C common stock of $0.225$0.26 per share payable on March 15, 2016,2017, to stockholders of record as of March 1, 2016.2017.
The Company's Class A and Class C common stock dividends are subject to available capital, market conditions, and compliance with associated laws and regulations. The Company expects that, based on current circumstances, comparable cash dividends will continue to be paid in the foreseeable future.
Stock Performance Graph
The performance graph below compares the Company's cumulative total stockholder return on the Company's Class A common stock for the period from July 16, 2013 through May 14, 2015, the date of the Recapitalization, and the Company's Class A common stock and Class C common stock from May 15, 2015 through December 31, 2015,2016, with the cumulative total return of the Standard & Poor's 500 Composite Stock Price Index, or S&P 500, and the Philadelphia Utility Sector Index, or UTY.
The performance graph shown below is being furnished and compares each period assuming that $100 was invested on the initial public offering date in each of the Class A common stock of the Company, the Class C common stock of the Company, the stocks included in the S&P 500 and the stocks included in the UTY, and that all dividends were reinvested.
Comparison of Cumulative Total Return
| | | | July 16, 2013 | | December 31, 2013 | | December 31, 2014 | | December 31, 2015 | July 16, 2013 | | December 31, 2013 | | December 31, 2014 | | December 31, 2015 | | December 31, 2016 |
| NRG Yield, Inc. Class A common stock | $ | 100.00 |
| | $ | 187.32 |
| | $ | 226.55 |
| | $ | 146.55 |
| $ | 100.00 |
| | $ | 183.04 |
| | $ | 222.39 |
| | $ | 137.17 |
| | $ | 161.81 |
|
NRG Yield, Inc. Class C common stock (a) | 100.00 |
| | 187.32 |
| | 226.55 |
| | 154.27 |
| 100.00 |
| | 183.04 |
| | 222.39 |
| | 144.60 |
| | 164.80 |
|
| S&P 500 | 100.00 |
| | 111.36 |
| | 126.61 |
| | 128.36 |
| 100.00 |
| | 111.36 |
| | 126.61 |
| | 128.36 |
| | 143.71 |
|
| UTY | 100.00 |
| | 97.64 |
| | 124.97 |
| | 117.51 |
| 100.00 |
| | 97.77 |
| | 126.06 |
| | 118.18 |
| | 138.73 |
|
(a) Class C common stock price has been indexed to the Class A common stock price from the NRG Yield, Inc. initial public offering date until the Recapitalization, and reflects the Class C common stock Total Return Performance beginning on May 15, 2015.
Item 6 — Selected Financial Data
The following table presents the Company's historical selected financial data, which has been recast to include the Drop Down Assets, as if the transfers had taken place from the beginning of the financial statements period, or from the date the respective entities were under common control (if later than the beginning of the financial statements period). The acquisitions are further described in Item 15 — Note 3, Business Acquisitions, to the Consolidated Financial Statements. Additionally, for all periods prior to the initial public offering, the data below reflects the Company's accounting predecessor, or NRG Yield, the financial statements of which were prepared on a ''carve-out'' basis from NRG and are intended to represent the financial results of the contracted renewable energy and conventional generation and thermal infrastructure assets in the U.S. that were acquired by NRG Yield LLC on July 22, 2013. For all periods subsequent to the initial public offering, the data below reflects the Company's consolidated financial results.
This historical data should be read in conjunction with the Consolidated Financial Statements and the related notes thereto in Item 15 and Item 7, Management's Discussion and Analysis of Financial Condition and Results of Operations.
| | | | Fiscal year ended December 31, | Fiscal year ended December 31, |
| (In millions, except per share data) | 2015 | | 2014 | | 2013 | | 2012 | | 2011 | 2016 | | 2015 | | 2014 | | 2013 | | 2012 |
| Statement of Income Data: | | | | | | |
| Operating Revenues | | | | | | | | | | | | | | | | | | |
| Total operating revenues | $ | 869 |
| | $ | 746 |
| | $ | 387 |
| | $ | 184 |
| | $ | 173 |
| $ | 1,021 |
| | $ | 953 |
| | $ | 828 |
| | $ | 434 |
| | $ | 186 |
|
| Operating Costs and Expenses | | | | | | | | | | | | | | | | | | |
| Cost of operations | 312 |
| | 266 |
| | 148 |
| | 118 |
| | 112 |
| 306 |
| | 321 |
| | 277 |
| | 154 |
| | 118 |
|
| Depreciation and amortization | 265 |
| | 202 |
| | 74 |
| | 38 |
| | 35 |
| 297 |
| | 297 |
| | 233 |
| | 92 |
| | 39 |
|
| Impairment losses | | 183 |
| | — |
| | — |
| | — |
| | — |
|
| General and administrative | 12 |
| | 8 |
| | 7 |
| | 7 |
| | 6 |
| 16 |
| | 12 |
| | 8 |
| | 7 |
| | 7 |
|
| Acquisition-related transaction and integration costs | 3 |
| | 4 |
| | — |
| | — |
| | — |
| 1 |
| | 3 |
| | 4 |
| | — |
| | — |
|
| Total operating costs and expenses | 592 |
| | 480 |
| | 229 |
| | 163 |
| | 153 |
| 803 |
| | 633 |
| | 522 |
| | 253 |
| | 164 |
|
| Operating Income | 277 |
| | 266 |
| | 158 |
| | 21 |
| | 20 |
| 218 |
| | 320 |
| | 306 |
| | 181 |
| | 22 |
|
| Other Income (Expense) | | | | | | | | | | | | | | | | | | |
| Equity in earnings of unconsolidated affiliates | 35 |
| | 25 |
| | 22 |
| | 19 |
| | 13 |
| 37 |
| | 26 |
| | 17 |
| | 20 |
| | 19 |
|
| Other income, net | 2 |
| | 3 |
| | 3 |
| | 2 |
| | 2 |
| 3 |
| | 3 |
| | 6 |
| | 4 |
| | 3 |
|
| Loss on extinguishment of debt | (9 | ) | | — |
| | — |
| | — |
| | — |
| |
| Loss on debt extinguishment | | — |
| | (9 | ) | | (1 | ) | | — |
| | — |
|
| Interest expense | (238 | ) | | (191 | ) | | (52 | ) | | (28 | ) | | (21 | ) | (274 | ) | | (263 | ) | | (216 | ) | | (72 | ) | | (29 | ) |
| Total other expense, net | (210 | ) | | (163 | ) | | (27 | ) | | (7 | ) | | (6 | ) | (234 | ) | | (243 | ) | | (194 | ) | | (48 | ) | | (7 | ) |
| Income Before Income Taxes | 67 |
| | 103 |
| | 131 |
| | 14 |
| | 14 |
| |
| Income tax expense | 12 |
| | 4 |
| | 8 |
| | 10 |
| | 9 |
| |
| Net Income | $ | 55 |
| | $ | 99 |
| | $ | 123 |
| | $ | 4 |
| | $ | 5 |
| |
| Less: Pre-acquisition net (loss) income of Drop Down Assets | (20 | ) | | 35 |
| | 14 |
| | | | | |
| Net Income Excluding Pre-acquisition Net Income of Acquired ROFO Assets | 75 |
| | 64 |
| | 109 |
| |
|
| | | |
| (Loss) Income Before Income Taxes | | (16 | ) | | 77 |
| | 112 |
| | 133 |
| | 15 |
|
| Income tax (benefit) expense | | (1 | ) | | 12 |
| | 4 |
| | 8 |
| | 10 |
|
| Net (Loss) Income | | (15 | ) | | 65 |
| | 108 |
| | 125 |
| | $ | 5 |
|
| Less: Pre-acquisition net income (loss) of Drop Down Assets | | 10 |
| | (10 | ) | | 44 |
| | 16 |
| | |
| Net Income Excluding Pre-acquisition Net (Loss) Income of Drop Down Assets | | (25 | ) | | 75 |
| | 64 |
| | 109 |
| | |
| Less: Predecessor income prior to initial public offering on July 22, 2013 | — |
| | — |
| | 54 |
| | | | | — |
| | — |
| | — |
| | 54 |
| | |
| Less: Net income attributable to noncontrolling interests | 42 |
| | 48 |
| | 42 |
| | | | | |
| Less: Net (loss) income attributable to noncontrolling interests | | (82 | ) | | 42 |
| | 48 |
| | 42 |
| | |
| Net Income Attributable to NRG Yield, Inc. | $ | 33 |
| | $ | 16 |
| | $ | 13 |
| | | | | $ | 57 |
| | $ | 33 |
| | $ | 16 |
| | $ | 13 |
| | |
| Earnings Per Share Attributable to NRG Yield, Inc. Class A and Class C Common Stockholders | | | | | | | | | | | | | | | | | | |
| Earnings per Weighted Average Class A and Class C Common Share - Basic and Diluted | $ | 0.40 |
| | $ | 0.30 |
| | $ | 0.29 |
| | N/A |
| | N/A |
| $ | 0.58 |
| | $ | 0.40 |
| | $ | 0.30 |
| | $ | 0.29 |
| | N/A |
|
Dividends per Class A common share (a) | $ | 1.015 |
| | $ | 1.42 |
| | $ | 0.23 |
| | N/A |
| | N/A |
| $ | 0.945 |
| | $ | 1.015 |
| | $ | 1.42 |
| | $ | 0.23 |
| | N/A |
|
Dividends per Class C common share (a) | 0.625 |
| | N/A |
| | N/A |
| | N/A |
| | N/A |
| $ | 0.945 |
| | $ | 0.625 |
| | N/A |
| | N/A |
| | N/A |
|
| Other Financial Data: | | | | | | | | | | | | | | | | | | |
| Capital expenditures | $ | 29 |
| | $ | 33 |
| | $ | 353 |
| | $ | 564 |
| | $ | 373 |
| $ | 20 |
| | $ | 29 |
| | $ | 60 |
| | $ | 782 |
| | $ | 1,398 |
|
| Cash Flow Data: | | | | | | | | | | | | | | | | | | |
| Net cash provided by (used in): | | | | | | | | | | | | | | | | | | |
| Operating activities | $ | 373 |
| | $ | 310 |
| | $ | 120 |
| | $ | 56 |
| | $ | 32 |
| $ | 560 |
| | $ | 405 |
| | $ | 362 |
| | $ | 168 |
| | $ | 57 |
|
| Investing activities | (1,118 | ) | | (1,033 | ) | | (515 | ) | | (594 | ) | | (468 | ) | (161 | ) | | (1,108 | ) | | (739 | ) | | (965 | ) | | (1,421 | ) |
| Financing activities | 427 |
| | 1,093 |
| | 432 |
| | 536 |
| | 427 |
| (193 | ) | | 385 |
| | 747 |
| | 834 |
| | 1,362 |
|
| Balance Sheet Data (at period end): | | | | | | | | | | | | | | | | | | |
| Cash and cash equivalents | $ | 111 |
| | $ | 429 |
| | $ | 59 |
| | $ | 22 |
| | $ | 24 |
| $ | 317 |
| | $ | 111 |
| | $ | 429 |
| | $ | 59 |
| | $ | 22 |
|
| Property, plant and equipment, net | 5,056 |
| | 5,175 |
| | 2,498 |
| | 2,350 |
| | 1,095 |
| 5,460 |
| | 5,878 |
| | 6,009 |
| | 3,388 |
| | 3,392 |
|
| Total assets | 7,775 |
| | 7,860 |
| | 3,430 |
| | 2,745 |
| | 1,461 |
| 8,383 |
| | 8,689 |
| | 8,794 |
| | 4,717 |
| | 3,790 |
|
| Long-term debt, including current maturities | 4,803 |
| | 4,921 |
| | 1,745 |
| | 1,094 |
| | 445 |
| 5,708 |
| | 5,593 |
| | 5,731 |
| | 2,849 |
| | 1,880 |
|
| Total liabilities | 5,143 |
| | 5,235 |
| | 1,947 |
| | 1,503 |
| | 652 |
| 6,013 |
| | 5,951 |
| | 6,062 |
| | 3,129 |
| | 2,449 |
|
| Total stockholders' equity | 2,632 |
| | 2,625 |
| | 1,483 |
| | 1,242 |
| | 809 |
| $ | 2,370 |
| | $ | 2,738 |
| | $ | 2,732 |
| | $ | 1,588 |
| | $ | 1,341 |
|
(a) The Company began paying dividends on Class A common stock after the initial public offering on July 22, 2013. The Company began paying dividends on Class C common stock after the Recapitalization on May 14, 2015.
Item 7 — Management's Discussion and Analysis of Financial Condition and the Results of Operations
The following discussion analyzes the Company's historical financial condition and results of operations, which were recast to include the effect of the June 2014 Drop Down Assets the January 2015 Drop Down Assets and the November 2015 Drop Down Assets, which were acquired on June 30, 2014, January 2, 2015, and November 3, 2015, respectively.and September 1, 2016. As further discussed in Item 15 — Note 1, Nature of Business, to the Consolidated Financial Statements, the purchases of these assets were accounted for in accordance with ASC 805-50, Business Combinations - Related Issues, whereas the assets and liabilities transferred to the Company relate to interests under common control by NRG and, accordingly, were recorded at historical cost. The difference between the cash proceeds and historical value of the net assets was recorded as a distribution to/from NRG and offset to the noncontrolling interest. TheIn accordance with GAAP guidance, requires retrospective combination of the entities for all periods presented as if the combination has been in effect since the inception of common control. Accordingly, the Company prepared its consolidated financial statements to reflect the transfers as if they had taken place from the beginning of the financial statements period, (January 1, 2013), or from the date the entities were under common control (if later than the beginning of the financial statements period). The financial statements reflect the transfers as if they had taken place on May 13, 2013,January 1, 2014 for Kansas South, March 28, 2013, for TA High Desert, and CVSR Drop Down; April 1, 2014 for the January 2015 Drop Down Assets and the majority of the November 2015 Drop Down Assets, which represents the date these entities were acquired by NRG. The Company reduces net income attributable to its Class A and Class C common stockholders by the pre-acquisition net income for the Drop Down Assets, as it iswas not available to the stockholders.
In addition, for all periods prior to the initial public offering, the discussion reflects the Company's accounting predecessor, NRG Yield, the financial statements of which were prepared on a ''carve-out'' basis from NRG and are intended to represent the financial results of the contracted renewable energy and conventional generation and thermal infrastructure assets in the U.S. that were acquired by NRG Yield LLC on July 22, 2013. For all periods subsequent to the initial public offering, the discussion reflects the Company's consolidated financial results.
As you read this discussion and analysis, refer to the Company's Consolidated Statements of Operations to this Form 10-K, which present the results of operations for the years ended December 31, 20152016, 20142015, and 2013.2014. Also refer to Item 1 — Business and Item 1A — Risk Factors, which include detailed discussions of various items impacting the Company's business, results of operations and financial condition.
The discussion and analysis below has been organized as follows:
Executive Summary, including a description of the business and significant events that are important to understanding the results of operations and financial condition;
Results of operations, including an explanation of significant differences between the periods in the specific line items of the consolidated statements of operations;
Financial condition addressing liquidity position, sources and uses of cash, capital resources and requirements, commitments, and off-balance sheet arrangements;
Known trends that may affect the Company’s results of operations and financial condition in the future; and
Critical accounting policies which are most important to both the portrayal of the Company's financial condition and results of operations, and which require management's most difficult, subjective or complex judgment.
Executive Summary
Introduction and Overview
The Company is a dividend growth-oriented company formed to serve as the primary vehicle through which NRG owns, operates and acquires contracted renewable and conventional generation and thermal infrastructure assets. The Company believes it is well positioned to be a premier company for investors seeking stable and growing dividend income from a diversified portfolio of lower-risk high-quality assets.
The Company owns a diversified portfolio of contracted renewable and conventional generation and thermal infrastructure assets in the U.S. The Company’s contracted generation portfolio collectively represents 4,4354,563 net MW. Each of these assets sells substantially all of its output pursuant to long-term offtake agreements with creditworthy counterparties. The average remaining contract duration of these offtake agreements was approximately 1716 years as of December 31, 20152016, based on CAFD. The Company also owns thermal infrastructure assets with an aggregate steam and chilled water capacity of 1,3151,319 net MWt and electric generation capacity of 124123 net MW. These thermal infrastructure assets provide steam, hot water and/or chilled water, and in some instances electricity, to commercial businesses, universities, hospitals and governmental units in multiple locations, principally through long-term contracts or pursuant to rates regulated by state utility commissions.
Government Incentives
Government incentives can enhance the economics of the Company's generating assets or investments by providing, for example, loan guarantees, cash grants, favorable tax treatment, favorable depreciation rules, or other incentives. Certain changes in law enhance federal incentives for renewable generation — including through the extensions of the wind power PTC and the solar power ITC — and could incentivize the development of additional renewable energy projects that would fit within the Company’s asset portfolio. In addition, direct cash incentives may encourage additional renewable energy development by entities that cannot presently benefit from tax credits.
Significant Events During the Year Ended December 31, 2015
On November 3, 2015, the Company acquired 75% of the Class B interests of NRG Wind TE Holdco, or the November 2015 Drop Down Assets, which owns a portfolio of 12 wind facilities totaling 814 net MW, from NRG for total cash consideration of $209 million. In February 2016, NRG made a final working capital payment of $2 million, reducing total cash consideration to $207 million. The Company is responsible for its pro-rata share of non-recourse project debt of $193 million and noncontrolling interest associated with a tax equity structure of $159 million (as of the acquisition date).
On June 30, 2015, the Company sold an economic interest in the Alta X and Alta XI wind facilities through a tax equity financing arrangement and received $119 million in net proceeds. These proceeds, as well as proceeds obtained from the Company's June 2015 equity and debt offerings discussed below, were utilized to repay all of the outstanding project indebtedness associated with the Alta X and Alta XI wind facilities.
On June 29, 2015, the Company issued 28,198,000 shares of Class C common stock for net proceeds, after underwriting discounts and expenses, of $599 million. The Company utilized the proceeds of the offering to acquire 28,198,000 additional Class C units of NRG Yield LLC and, as a result, it currently owns 53.3% of the economic interests of NRG Yield LLC, with NRG retaining 46.7% of the economic interests of NRG Yield LLC. Additionally, on June 29, 2015, the Company completed an offering of $287.5 million aggregate principal amount of 3.25% Convertible Notes due 2020, which proceeds were subsequently lent to NRG Yield LLC.
On June 29, 2015, the Company acquired 25% of the membership interest in Desert Sunlight Investment Holdings, LLC, which owns two solar photovoltaic facilities totaling 550 MW, located in Desert Center, California, from EFS Desert Sun, LLC, a subsidiary of GE Energy Financial Services, for a purchase price of $285 million, utilizing a portion of the proceeds from the Class C common stock issuance. The Company's pro-rata share of non-recourse project level debt was $272 million as of December 31, 2015.
Effective May 14, 2015, the Company amended its certificate of incorporation to create two new classes of capital stock, Class C common stock and Class D common stock, and distributed shares of the Class C common stock and Class D common stock to holders of the Company's outstanding Class A common stock and Class B common stock, respectively, through a stock split, which is referred to as the Recapitalization. The Recapitalization enhances the Company’s ability to focus on growth opportunities without the constraints of NRG’s capital allocation to the Company, while maintaining the Company’s relationship with NRG. The Recapitalization preserves NRG’s management and operational expertise,
asset development and acquisition track record, financing experience and provides flexibility for the Company to raise capital to fund its growth.
The Class C common stock and Class D common stock have the same rights and privileges and rank equally, share ratably and are identical in all respects to the shares of Class A common stock and Class B common stock, respectively, as to all matters, except that each share of Class C common stock and Class D common stock is entitled to 1/100th of a vote on all stockholder matters.
In connection with the Recapitalization, the ROFO Agreement was amended to make additional assets available to the Company should NRG choose to sell them, including (i) two natural gas facilities totaling 795 MW of net capacity that are expected to reach COD in 2017 and 2020, (ii) an equity interest in a wind portfolio that includes wind facilities totaling approximately 934 MW of net capacity, the majority of which was sold to the Company on November 3, 2015, and (iii) up to $250 million of equity interests in one or more residential or distributed solar generation portfolios developed by affiliates of NRG.
On May 8, 2015, the Company and NRG entered into a partnership by forming NRG DGPV Holdco 1 LLC, or DGPV Holdco 1, the purpose of which is to own or purchase solar power generation projects and other ancillary related assets from NRG Renew DG Holdings LLC, via intermediate funds, including: (i) a tax equity-financed portfolio of 10 recently completed community solar projects representing approximately 8 MW with a weighted average remaining PPA term of 20 years; and (ii) a tax equity-financed portfolio of approximately 12 commercial photovoltaic systems representing approximately 37 MW with a weighted average remaining PPA term of 19 years. Under this partnership, the Company committed to fund up to $100 million of capital. On February 29, 2016,the Company and NRG entered into an additional partnership by forming NRG DGPV Holdco 2 LLC, or DGPV Holdco 2, to own or purchase solar power generation projects and other ancillary related assets from NRG Renew LLC or its subsidiaries, via intermediate funds. Under this partnership, the Company committed to fund up to $50 million of capital.
On May 7, 2015, the Company acquired a 90.1% interest in Spring Canyon II, a 32 MW wind facility, and Spring Canyon III, a 28 MW wind facility, each located in Logan County, Colorado, from Invenergy Wind Global LLC. The purchase price was funded with cash on hand. Power generated by Spring Canyon II and Spring Canyon III is sold to Platte River Power Authority under long-term PPAs with approximately 24 years of remaining contract life.
On April 30, 2015, the Company completed the acquisition of the University of Bridgeport Fuel Cell project in Bridgeport, Connecticut from FuelCell Energy, Inc. The project added an additional 1.4 MW of thermal capacity with a 12-year contract, with the option for a 7-year extension.
On April 9, 2015, the Company and NRG entered into a partnership by forming RPV Holdco, to invest in and hold operating portfolios of residential solar assets developed by NRG Home Solar, a subsidiary of NRG, including: (i) an existing, unlevered portfolio of over 2,200 leases across nine states representing approximately 17 MW with a weighted average remaining lease term of approximately 17 years, in which the Company invested $26 million in April 2015; and (ii) a tax equity financed portfolio of approximately 5,700 leases representing approximately 40 MW, with an average lease term for the existing and new leases of approximately 17 to 20 years, in which the Company invested $36 million of its $150 million commitment through December 31, 2015. On February 29, 2016, the Company and NRG amended the RPV Holdco partnership to reduce the aggregate commitment of $150 million to $100 million in connection with the formation of DGPV Holdco 2 discussed above.
On January 2, 2015, the Company acquired the following projects from NRG: (i) Laredo Ridge, an 80 MW wind facility located in Petersburg, Nebraska, (ii) Tapestry, which includes Buffalo Bear, a 19 MW wind facility in Buffalo, Oklahoma; Taloga, a 130 MW wind facility in Putnam, Oklahoma; and Pinnacle, a 55 MW wind facility in Keyser, West Virginia, and (iii) Walnut Creek, a 485 MW natural gas facility located in City of Industry, California, for total cash consideration of $489 million, including $9 million for working capital, plus assumed project-level debt of $737 million. The Company funded the acquisition with cash on hand and drawings under its revolving credit facility.
In January 2015, El Segundo experienced a steam turbine water intrusion resulting in a forced outage on Units 5 and 6. The units returned to service in April 2015. The Company completed a root cause analysis and has implemented steps to prevent a recurrence of the event. The Company reviewed the financial impact of repair costs and lost capacity revenue and collected approximately $4 million of insurance proceeds in the fourth quarter of 2015.
Significant Events During the Year Ended December 31, 20142016
On August 12, 2014,During the fourth quarter of 2016, the Company acquired 100%recorded asset impairment losses of $117 million, $60 million, and $6 million for Elbow Creek, Goat Wind and Forward, respectively. For further discussion, refer to Management’s discussion of the membership interestsresults of Alta Wind operations for the years ended December 31, 2016 and 2015 andCritical Accounting Policies in this Item 7 below, as well as Item 15 — Note 9, Asset Management Holdings,Impairments, to the Consolidated Financial Statements.
On October 31, 2016, NRG Energy Center Minneapolis LLC, Alta Winda subsidiary of the Company, LLC, Alta Wind X Holding Company, LLC and Alta Wind XI Holding Company, LLC, which
collectively own seven wind facilities that total 947 MW located in Tehachapi, California, and a portfolioreceived proceeds of associated land leases,$125 million from the issuance of 3.55% Series D notes due October 31, 2031, or the Alta Wind Portfolio. The purchase priceSeries D Notes, and entered into a shelf facility for the Alta Wind Portfolio was $923anticipated issuance of an additional $70 million of notes at a 4.80% fixed rate. In the first quarter of 2017, NRG Energy Center Minneapolis LLC expects to amend its existing note purchase and private shelf agreement to permit the issuance of $10 million of notes, which includedif issued, will be utilized in addition to the existing, authorized $70 million of notes to make payments with respect to the EPC agreement discussed below.
Additionally, on October 31, 2016, NRG Business Services LLC, a base purchase pricesubsidiary of $870NRG, and NECP, a wholly owned subsidiary of the Company, entered into an EPC agreement for the construction of a 73 MWt district energy system for NECP to provide 150 kpph of steam, 6,750 tons of chilled water and 7.5 MW of emergency backup power service to UPMC Mercy. The initial term of the energy services agreement with UPMC Mercy will be for a period of twenty years from the service commencement date. Pursuant to the terms of the EPC agreement, NECP agreed to pay NRG Business Services LLC $79 million, andsubject to adjustment based upon certain conditions in the EPC agreement, upon substantial completion of the project. The project is expected to reach COD in the first quarter of 2018. On January 5, 2017, the parties amended the EPC Agreement, based on a payment for working capital of $53 million, plus the assumption of $1.6 billion of non-recourse project-level debt. Incustomer change order, to fundincrease the purchase price, the Company completed an equity offering of 12,075,000 shares of its Class A common stock on July 29, 2014, which resulted in net proceeds of $630 million, after underwriting discounts and expenses, that were utilized to acquire additional Class A units in NRG Yield LLC. In addition, on August 5, 2014, NRG Yield Operating LLC, or Yield Operating, the holdercapacity of the project assets that belongdistrict energy system from 73 MWt to Yield LLC, issued $50080 MWt, which also increased the payment from $79 million of Senior Notes,to $87 million.
On September 1, 2016, as describeddiscussed in Item 15 — Note 9,3, Business Acquisitions, to the Consolidated Financial Statements, the Company acquired the remaining 51.05% interest of CVSR Holdco LLC from NRG for total cash consideration of $78.5 million. The acquisition was funded with cash on hand. The Company also assumed additional debt of $496 million, which represents 51.05% of the CVSR project level debt and 51.05% of the notes issued under the CVSR Holdco Financing Agreement. In connection with the retrospective adjustment of prior periods, the Company now consolidates CVSR and 100% of its debt, consisting of $771 million of project level debt and $200 million of notes issued under the CVSR Holdco Financing Agreement as of September 1, 2016.
On August 18, 2016, NRG Yield Operating LLC issued $350 million of senior unsecured notes, or the 2026 Senior Notes. The 2026 Senior Notes bear interest at 5.00% and mature on September 15, 2026. A portion of the proceeds of the 2026 Senior Notes were used to repay the Company's revolving credit facility. For further discussion, refer to Item 15 — Note 10, Long-term Debt, to the Consolidated Financial Statements.
On June 30, 2014, the Company acquired from NRG: (i) El Segundo, a 550 MW fast-start, gas-fired facility located in Los Angeles County, California; (ii) TA High Desert, a 20 MW solar facility located in Los Angeles County, California; and (iii) Kansas South, a 20 MW solar facility located in Kings County, California. The assets were acquired pursuant to the ROFO Agreement. The Company paid NRG total cash consideration of $357 million, which represents a base purchase price of $349 million and a payment for working capital of $8 million. In addition, the acquisition included the assumption of $612 million in project-level debt.
During the first quarter of 2014, the Company issued $345 million in aggregate principal amount of its convertible notesOn August 9, 2016, NRG Yield, Inc. established a $150,000,000 at-the-market equity offering program, or ATM Program, as described in Sources of Liquidity in this Item 7below. As of December 31, 2016, no shares were issued under the ATM Program.
On July 15, 2016, CVSR Holdco, issued $200 million of senior secured notes that bear interest at 4.68% and mature on March 31, 2037. The proceeds were utilized, along with $28 million of cash on hand, to reduce borrowings under the
Company’s revolving credit facility. For further discussion, refer to Item 15 — Note 9,10, Long-term Debt, to the Consolidated Financial Statements.
Significant Events During the Year Ended December 31, 2013
On December 31, 2013, NRG Energy Center Omaha Holdings, LLC, an indirect wholly owned subsidiary of NRG Yield LLC, acquired Energy Systems Company, or Energy Systems, an operator of steam and chilled thermal facilities that provides heating and cooling services to nonresidential customers in Omaha, Nebraska. StatementsSee Item 15 .— Note 3, Business Acquisitions, to the Consolidated Financial Statements for information related to the acquisition.
During 2013, Alpine, Avra, Borrego, CVSR, El Segundo, Marsh Landing, Kansas South, and TA High Desert achieved COD. In addition, Borrego completed financing arrangements with a group of lenders. See Item 15 —Note 9,Long-term Debt, to the Consolidated Financial Statements for information related to these financing activities.
The Company completed its initial public offering of its Class A common stock on July 22, 2013. See Item 15 — Note 1, Nature of Business, to the Consolidated Financial Statements for information related to the initial public offering.
Environmental Matters and Regulatory Matters
Details of environmental matters and regulatory matters are presented in Item 1 — Business, Regulatory Matters and Item 1A— Risk Factors. Details of some of this information relate to costs that may impact the Company's financial results.
Trends Affecting Results of Operations and Future Business Performance
Wind and Solar Resource Availability
WindThe availability of the wind and solar resourceresources affects the financial performance of the wind and solar facilities, which may impact the Company’s overall financial performance. Due to the variable nature of the wind and solar resources, the Company cannot predict the availability can affectof the Company's results. The Company's results were impacted by lower than normal wind resource availability in 2015. Whileand solar resources and the Company'spotential variances from expected performance levels from quarter to quarter. To the extent the wind facilities wereand solar resources are not available adverse weather hadat expected levels, it could have a negative impact on wind resources. The Company cannot predict wind and solar resource availability and their related impacts on future results.the Company’s financial performance for such periods.
Capital Market Conditions
The Company and its peer group have recently experienced difficult conditionscapital markets in general are often subject to volatility that is unrelated to the capital markets.operating performance of particular companies. The Company’s growth strategy depends on its ability to identify and acquire additional conventional and renewable facilities from NRG and unaffiliated third parties. A prolonged disruption in the equity capital market conditions could make it difficult for the Companyparties, which will require access to successfully acquire attractive projects from NRG or third partiesdebt and may also limit the Company’s ability to obtain debt or equity financing to complete such acquisitions or replenish capital for future acquisitions. If the Company is unable to raise adequate proceeds when needed to fund such acquisitions, the ability to grow its project portfolioAny broad market fluctuations may be limited, which could have a material adverse effect onaffect the Company’s ability to implement its growth strategy. A full descriptionaccess such capital through debt or equity financings. The Company believes that improved capital market conditions may allow it to access capital in 2017.
Operational Matters
Walnut Creek Forced Outage
In July and August 2016, Walnut Creek experienced two unrelated outages causing damage to a circuit breaker and a compressor resulting in forced outages on Units 2 and 4, respectively. The Company has undertaken a root cause analysis and is reviewing what is covered by insurance. Unit 2 returned to service on August 10, 2016 and Unit 4 returned to service on September 15, 2016.
El Segundo Forced Outage
In January 2017, the El Segundo Energy Center began a forced outage on Units 5 and 6 due to increasing vibrations on successive operations at Unit 5. In consultation with the Company’s operations and maintenance service provider, a subsidiary of NRG Energy Inc., the risks applicableCompany elected to replace the Company's businessrotor on Unit 5. Both Unit 5 and 6 returned to service on February 24, 2017. The Company is presented in Item 1A,reviewing the warranty coverage with the original equipment manufacturer as well as available insurance coverage. Risk Factors.
Consolidated Results of Operations
20152016 compared to 20142015
The following table provides selected financial information: | | | | Year ended December 31, | Year ended December 31, |
| (In millions, except otherwise noted) | 2015 | | 2014 | | Change % | |
| (In millions) | | 2016 | | 2015 | | Change |
| Operating Revenues | | | | | | | | | | |
| Energy and capacity revenues | $ | 925 |
| | $ | 773 |
| | 20 |
| $ | 1,089 |
| | $ | 1,009 |
| | $ | 80 |
|
| Contract amortization | (54 | ) | | (29 | ) | | 86 |
| (68 | ) | | (54 | ) | | (14 | ) |
| Mark-to-market economic hedging activities | (2 | ) | | 2 |
| | (200 | ) | — |
| | (2 | ) | | 2 |
|
| Total operating revenues | 869 |
| | 746 |
| | 16 |
| 1,021 |
| | 953 |
| | 68 |
|
| Operating Costs and Expenses | | | | | | | | | | |
| Cost of fuels | 71 |
| | 89 |
| | (20 | ) | 61 |
| | 71 |
| | (10 | ) |
| Emissions credit amortization | | 6 |
| | — |
| | 6 |
|
| Operations and maintenance | 171 |
| | 131 |
| | 31 |
| 174 |
| | 178 |
| | (4 | ) |
| Other cost of operations | 70 |
| | 46 |
| | 52 |
| |
| Other costs of operations | | 65 |
| | 72 |
| | (7 | ) |
| Depreciation and amortization | 265 |
| | 202 |
| | 31 |
| 297 |
| | 297 |
| | — |
|
| Impairment losses | | 183 |
| | — |
| | 183 |
|
| General and administrative | 12 |
| | 8 |
| | 50 |
| 16 |
| | 12 |
| | 4 |
|
| Acquisition-related transaction and integration costs | 3 |
| | 4 |
| | (25 | ) | 1 |
| | 3 |
| | (2 | ) |
| Total operating costs and expenses | 592 |
| | 480 |
| | 23 |
| 803 |
| | 633 |
| | 170 |
|
| Operating Income | 277 |
| | 266 |
| | 4 |
| 218 |
| | 320 |
| | (102 | ) |
| Other Income (Expense) | | | | |
| | | | |
|
| Equity in earnings of unconsolidated affiliates | 35 |
| | 25 |
| | 40 |
| 37 |
| | 26 |
| | 11 |
|
| Other income, net | 2 |
| | 3 |
| | (33 | ) | 3 |
| | 3 |
| | — |
|
| Loss on extinguishment of debt | (9 | ) | | — |
| | 100 |
| |
| Loss on debt extinguishment | | — |
| | (9 | ) | | 9 |
|
| Interest expense | (238 | ) | | (191 | ) | | 25 |
| (274 | ) | | (263 | ) | | (11 | ) |
| Total other expense, net | (210 | ) | | (163 | ) | | 29 |
| (234 | ) | | (243 | ) | | 9 |
|
| Income Before Income Taxes | 67 |
| | 103 |
| | (35 | ) | |
| Income tax expense | 12 |
| | 4 |
| | 200 |
| |
| Net Income | 55 |
| | 99 |
| | (44 | ) | |
| Less: Pre-acquisition net income of Drop Down Assets | (20 | ) | | 35 |
| | (157 | ) | |
| Net Income Excluding Pre-acquisition Net Income of Drop Down Assets | 75 |
| | 64 |
| | 17 |
| |
| Less: Net income attributable to noncontrolling interests | 42 |
| | 48 |
| | (13 | ) | |
| (Loss) Income Before Income Taxes | | (16 | ) | | 77 |
| | (93 | ) |
| Income tax (benefit) expense | | (1 | ) | | 12 |
| | (13 | ) |
| Net (Loss) Income | | (15 | ) | | 65 |
| | (80 | ) |
| Less: Pre-acquisition net income (loss) of Drop Down Assets | | 10 |
| | (10 | ) | | 20 |
|
| Net (Loss) Income Excluding Pre-acquisition Net Income of Drop Down Assets | | (25 | ) | | 75 |
| | (100 | ) |
| Less: Net (loss) income attributable to noncontrolling interests | | (82 | ) | | 42 |
| | (124 | ) |
| Net Income Attributable to NRG Yield, Inc. | $ | 33 |
| | $ | 16 |
| | 106 |
| $ | 57 |
| | $ | 33 |
| | $ | 24 |
|
| | | | Year ended December 31, | Year ended December 31, |
| Business metrics: | 2015 | | 2014 | 2016 | | 2015 |
Renewable MWh sold (in thousands) (a) | 5,740 |
| | 3,977 |
| |
Renewables MWh generated/sold (in thousands) (a) | | 7,236 |
| | 6,412 |
|
Conventional MWh generated (in thousands) (a)(b) | | 1,697 |
| | 2,487 |
|
| Thermal MWt sold (in thousands) | 1,946 |
| | 2,060 |
| 1,966 |
| | 1,946 |
|
| Thermal MWh sold (in thousands) | 297 |
| | 205 |
| |
Thermal MWh sold (in thousands) (c) | | 71 |
| | 297 |
|
(a)Volumes sold do not include the MWh generatedgenerated/sold by the Company's equity method investments.
(b) Volumes generated are not sold as the Conventional facilities sell capacity rather than energy.
(c) MWh sold do not include 204 MWh generated by NRG Dover, a subsidiary of the Company, under the PPA with NRG Power Marketing during the year ended December 31, 2016, as further described in Item 15 — Note 15, Related Party Transactions, to the Consolidated Financial Statements.
Management’s discussion of the results of operations for the years ended December 31, 2016 and 2015
Gross Margin
The Company calculates gross margin in order to evaluate operating performance as operating revenues less cost of sales, which includes cost of fuel, contract and emission credit amortization and mark-to-market for economic hedging activities.
Economic Gross Margin
In addition to gross margin, the Company evaluates its operating performance using the measure of economic gross margin, which is not a GAAP measure and may not be comparable to other companies’ presentations or deemed more useful than the GAAP information provided elsewhere in this report. Economic gross margin should be viewed as a supplement to and not a substitute for the Company' presentation of gross margin, which is the most directly comparable GAAP measure. Economic gross margin is not intended to represent gross margin. The Company believes that economic gross margin is useful to investors as it is a key operational measure reviewed by the Company's chief operating decision maker. Economic gross margin is defined as energy and capacity revenue less cost of fuels. Economic gross margin excludes the following components from GAAP gross margin: contract amortization, mark-to-market results, emissions credit amortization and (losses) gains on economic hedging activities. Mark-to-market results consist of unrealized gains and losses on contracts that are not yet settled.
The below tables present the composition of gross margin, as well as the reconciliation to economic gross margin for the years ended December 31, 2016 and 2015:
|
| | | | | | | | | | | | | | | |
| | Conventional | | Renewables | | Thermal | | Total |
| (In millions) | |
| Year ended December 31, 2016 | | | | | | |
|
| Energy and capacity revenues | $ | 338 |
| | $ | 579 |
| | $ | 172 |
| | $ | 1,089 |
|
| Cost of fuels | (1 | ) | | — |
| | (60 | ) | | (61 | ) |
| Contract amortization | (5 | ) | | (61 | ) | | (2 | ) | | (68 | ) |
| Emissions credit amortization | (6 | ) | | — |
| | — |
| | (6 | ) |
| Gross margin | 326 |
| | 518 |
| | 110 |
| | 954 |
|
| Contract amortization | 5 |
| | 61 |
| | 2 |
| | 68 |
|
| Emissions credit amortization | 6 |
| | — |
| | — |
| | 6 |
|
| Economic gross margin | $ | 337 |
| | $ | 579 |
| | $ | 112 |
| | $ | 1,028 |
|
| |
|
| |
|
| |
|
| |
|
| Year ended December 31, 2015 | | | | | | | |
| Energy and capacity revenues | $ | 341 |
| | $ | 492 |
| | $ | 176 |
| | $ | 1,009 |
|
| Cost of fuels | (1 | ) | | (1 | ) | | (69 | ) | | (71 | ) |
| Contract amortization | (5 | ) | | (47 | ) | | (2 | ) | | (54 | ) |
| Mark-to-market for economic hedging activities | — |
| | (2 | ) | | — |
| | (2 | ) |
| Gross margin | 335 |
| | 442 |
| | 105 |
| | 882 |
|
| Contract amortization | 5 |
| | 47 |
| | 2 |
| | 54 |
|
| Mark-to-market for economic hedging activities | — |
| | 2 |
| | — |
| | 2 |
|
| Economic gross margin | $ | 340 |
| | $ | 491 |
| | $ | 107 |
| | $ | 938 |
|
Gross margin increased by $72 million and economic gross margin increased by $90 million during the year ended December 31, 2016, compared to the same period in 2015, primarily due to:
|
| | | |
| (In millions) | |
| Renewables: | |
| 26% increase in volume generated at the Alta wind projects, as well as a 7% increase in generation at other Wind projects. Additionally, there was an increase of $4 million in economic gross margin due to the acquisition of Spring Canyon in May 2015 | $ | 61 |
|
| Increase in average price per MWh due to higher pricing in the Alta X and XI PPAs which were effective in January 2016, compared with merchant prices in 2015 | 27 |
|
| Thermal: | |
| Higher sales volume in 2016 as a result of milder weather in 2015, as well as the completion of a project for a new customer in the second half of the year | 5 |
|
| Conventional: | |
| Lower revenues at Walnut Creek as a result of forced outages in 2016, partially offset by higher revenues at El Segundo in 2016 as a result of forced outages in 2015 | (3 | ) |
| Increase in economic gross margin | $ | 90 |
|
| Higher contract amortization primarily for the Alta X and XI PPAs, which began in January 2016 | (14 | ) |
| Emissions credit amortization of NOx allowances at Walnut Creek and El Segundo in compliance with amendments to the Regional Clean Air Incentives Market program | (6 | ) |
| Unrealized losses on forward contracts prior to the start of the PPA for Elbow Creek which began October 2015 | 2 |
|
| Increase in gross margin | $ | 72 |
|
Operations and Maintenance Expense
|
| | | | | | | | | | | | | | | |
| | Conventional | | Renewables | | Thermal | | Total |
| (In millions) | |
| Year ended December 31, 2016 | $ | 32 |
| | $ | 94 |
| | $ | 48 |
| | $ | 174 |
|
| Year ended December 31, 2015 | 30 |
| | 97 |
| | 51 |
| | 178 |
|
Operations and maintenance expense decreased by $4 million during the year ended December 31, 2016, compared to the same period in 2015, due to:
|
| | | |
| | (In millions) |
| Increase in Conventional segment primarily due to Walnut Creek forced outages in 2016, compared to the forced outages at El Segundo in 2015 | $ | 2 |
|
| Decrease in Renewables segment primarily due to insurance proceeds received at Wildorado in 2016 in connection with a 2014 wind outage claim | (3 | ) |
| Decrease in Thermal segment primarily due to acceleration of maintenance work on thermal facilities into 2015 | (3 | ) |
| | $ | (4 | ) |
Other Costs of Operations
Other costs of operations decreased by $7 million during the year ended December 31, 2016, compared to the same period in 2015, primarily due to lower assessments for property taxes at Alta X and XI and NRG Wind TE Holdco.
General and Administrative Expenses
General and administrative expenses increased by $4 million for the year ended December 31, 2016 compared to the same period in 2015, primarily due to new executive compensation in 2016, and an increase in base management fee for the Management Services Agreement with NRG in connection with the acquisition of the Drop Down Assets.
Impairment Losses
For the year ended December 31, 2016, the Company recorded impairment losses of $183 million, due to the impairments of property, plant and equipment for Elbow Creek, Goat Wind, and Forward, as further described in Item 15 — Note 9, Asset Impairments, to the Consolidated Financial Statements, as well as in Critical Accounting Policies and Estimates in this Item 7 below. Because the projects were acquired from NRG and related to interests under common control by NRG, the property, plant and equipment for these assets was recorded at historical cost of $298 million rather than estimated fair value of $132 million at the acquisition date. The three projects were acquired as part of the November 2015 Drop Down Assets. As discussed in Item 15 — Note 3, Business Acquisitions, the historical cost for November 2015 Drop Down Assets was $369 million for the net assets, which was higher than the fair value paid of $207 million. The difference between the historical cost of net assets and the fair value paid for the November 2015 Drop Down Assets was recorded to noncontrolling interest on the Company’s consolidated balance sheet.
Loss on Debt Extinguishment
A loss on debt extinguishment of $9 million was recorded for the year ended December 31, 2015, driven by the refinancing of the El Segundo credit facility and the termination of the interest rate swaps for Alta Wind X and XI in connection with the sale of an economic interest in Alta TE Holdco to a financial institution, as further described in Item 15 — Note 5, Investments Accounted for by the Equity Method and Variable Interest Entities, to the Consolidated Financial Statements.
Equity in Earnings of Unconsolidated Affiliates
Equity in earnings of unconsolidated affiliates increased by $11 million during the year ended December 31, 2016, compared to the same period in 2015, primarily due to an increase in equity earnings from Desert Sunlight, which was acquired in June 2015, DGPV Holdco 1 and RPV Holdco, partially offset by losses from Elkhorn Ridge.
Interest Expense
Interest expense increased by $11 million during the year ended December 31, 2016 compared to the same period in 2015 due to:
|
| | | |
| | (In millions) |
| Amortization of the fair value of interest rate swaps primarily acquired with the January 2015 Drop Down Assets and November 2015 Drop Down Assets | $ | 10 |
|
| Issuance of the 2020 Convertible Notes in the second quarter of 2015 and amortization of the related discount and debt issuance costs | 8 |
|
| Issuance of 2026 Senior Notes in August 2016 | 7 |
|
| Issuance of 2037 CVSR Holdco Notes in July 2016 | 4 |
|
| Higher revolving credit facility borrowings in 2016 | 2 |
|
| Repricing of project-level financing arrangements and lower principal balances | (20 | ) |
| | $ | 11 |
|
Income Tax Expense
For the year ended December 31, 2016, the Company recorded an income tax benefit of $1 million on a pretax loss of $16 million. For the same period in 2015, the Company recorded income tax expense of $12 million on pretax income of $77 million. For the years ended December 31, 2016 and 2015, the overall effective tax rate was different than the statutory rate of 35% primarily due to taxable earnings allocated to NRG resulting from NRG's interest in NRG Yield LLC and PTCs and ITCs generated from certain wind and solar assets, respectively.
Income Attributable to Noncontrolling Interests
For the year ended December 31, 2016, the Company had income of $29 million attributable to NRG's interest in the Company and a loss of $111 million attributable to noncontrolling interests with respect to its tax equity financing arrangements and the application of the HLBV method, which was primarily related to the impairment losses described above.
For the year ended December 31, 2015, the Company had income of $56 million attributable to NRG's interest in the Company and a loss of $14 million attributable to noncontrolling interests with respect to its tax equity financing arrangements and the application of the HLBV method.
Consolidated Results of Operations
2015 compared to 2014
The following table provides selected financial information:
|
| | | | | | | | | | | |
| | Year ended December 31, |
| (In millions) | 2015 | | 2014 | | Change |
| Operating Revenues | | | | | |
| Energy and capacity revenues | $ | 1,009 |
| | $ | 855 |
| | $ | 154 |
|
| Contract amortization | (54 | ) | | (29 | ) | | (25 | ) |
| Mark-to-market economic hedging activities | (2 | ) | | 2 |
| | (4 | ) |
| Total operating revenues | 953 |
| | 828 |
| | 125 |
|
| Operating Costs and Expenses | | | | | |
| Cost of fuels | 71 |
| | 89 |
| | (18 | ) |
| Operations and maintenance | 178 |
| | 140 |
| | 38 |
|
| Other costs of operations | 72 |
| | 48 |
| | 24 |
|
| Depreciation and amortization | 297 |
| | 233 |
| | 64 |
|
| General and administrative — affiliate | 12 |
| | 8 |
| | 4 |
|
| Acquisition-related transaction and integration costs | 3 |
| | 4 |
| | (1 | ) |
| Total operating costs and expenses | 633 |
| | 522 |
| | 111 |
|
| Operating Income | 320 |
| | 306 |
| | 14 |
|
| Other Income (Expense) | | | | | |
| Equity in earnings of unconsolidated affiliates | 26 |
| | 17 |
| | 9 |
|
| Other income, net | 3 |
| | 6 |
| | (3 | ) |
| Loss on debt extinguishment | (9 | ) | | (1 | ) | | (8 | ) |
| Interest expense | (263 | ) | | (216 | ) | | (47 | ) |
| Total other expense, net | (243 | ) | | (194 | ) | | (49 | ) |
| Income Before Income Taxes | 77 |
| | 112 |
| | (35 | ) |
| Income tax expense | 12 |
| | 4 |
| | 8 |
|
| Net Income | 65 |
| | 108 |
| | (43 | ) |
| Less: Pre-acquisition net (loss) income of Drop Down Assets | (10 | ) | | 44 |
| | (54 | ) |
| Net Income Excluding Pre-acquisition Net (Loss) Income of Drop Down Assets | 75 |
| | 64 |
| | 11 |
|
| Less: Net income attributable to noncontrolling interests | 42 |
| | 48 |
| | (6 | ) |
| Net Income Attributable to NRG Yield, Inc. | $ | 33 |
| | $ | 16 |
| | $ | 17 |
|
|
| | | | | |
| | Year ended December 31, |
| Business metrics: | 2015 | | 2014 |
Renewables MWh generated/sold (in thousands) (a) | 6,412 |
| | 4,659 |
|
Conventional MWh generated (in thousands) (a)(b) | 2,487 |
| | 2,130 |
|
| Thermal MWt sold (in thousands) | 1,946 |
| | 2,060 |
|
| Thermal MWh sold (in thousands) | 297 |
| | 205 |
|
(a) Volumes do not include the MWh generated/sold by the Company's equity method investments.
(b) Volumes generated are not sold as the Conventional facilities sell capacity rather than energy.
Management’s discussion of the results of operations for the years ended December 31, 2015 and 2014
As described in Item 15 — Note 3, Business Acquisitions, to the Consolidated Financial Statements, the Company completed the following acquisitions from NRG during the year ended December 31, 2015:
On November 3, 2015, the Company acquired 75% of the Class B interests of NRG Wind TE Holdco, or the November 2015 Drop Down Assets, which owns a portfolio of 12 wind facilities totaling 814 net MW, from NRG for total cash consideration of $209 million. In February 2016, NRG made a final working capital payment of $2 million, reducing total cash consideration to $207 million.
On January 2, 2015, the Company acquired the Laredo Ridge, Tapestry, and Walnut Creek projects, or the January 2015 Drop Down Assets, for total cash consideration of $489 million, plus assumed project-level debt of $737 million.
The January 2015 Drop Down Assets and the November 2015 Drop Down Assets (other than Elbow Creek) were originally acquired by NRG from EME on April 1, 2014, and are collectively referred to as "EME Assets" throughout this discussion. The Company prepared its consolidated financial statements for the periods ending December 31, 2015 and 2014 to reflect the acquisitions as if they had taken place from the date the entities were under common control, which was April 1, 2014 for the EME Assets. Accordingly, the results presented herein reflect the Company's ownership of the EME Assets for the full year ended December 31, 2015, compared to the nine months from April 1, 2014, through December 31, 2014.
Gross Margin
The Company calculates gross margin in order to evaluate operating performance as operating revenues less cost of sales, which includes cost of fuel, contract and emission credit amortization and mark-to-market for economic hedging activities.
Economic Gross Margin
TheIn addition to gross margin, the Company evaluates its operating performance using the measure of economic gross margin, which is not a GAAP measure and may not be comparable to other companies’ presentations or deemed more useful than the GAAP information provided elsewhere in this report. Economic gross margin should be viewed as a supplement to and not a substitute for the Company' presentation of gross margin, which is the most directly comparable GAAP measure. Economic gross margin is not intended to represent gross margin. The Company believes that economic gross margin is useful to investors as it is a key operational measure reviewed by the Company's chief operating decision maker. Economic gross margin is defined as energy and capacity revenue less cost of fuels. Economic gross margin does not includeexcludes the following components from GAAP gross margin: contract amortization, mark-to-market results, emissions credit amortization and (losses) gains or losses on economic hedging activities or contract amortization. activities. Mark-to-market results consist of unrealized gains and losses on contracts that are not yet settled.
The following tables present the composition of gross margin, as well as the reconciliation to economic gross margin for the years ended December 31, 2015 and 2014:
| | | | Conventional | | Renewables | | Thermal | | Total | Conventional | | Renewables | | Thermal | | Total |
| (In millions) | | | | |
| Year ended December 31, 2015 | | | | | | |
| | | | | | |
|
| Energy and capacity revenues | $ | 341 |
| | $ | 408 |
| | $ | 176 |
| | $ | 925 |
| $ | 341 |
| | $ | 492 |
| | $ | 176 |
| | $ | 1,009 |
|
| Cost of fuels | (1 | ) | | (1 | ) | | (69 | ) | | (71 | ) | (1 | ) | | (1 | ) | | (69 | ) | | (71 | ) |
| Contract amortization | | (5 | ) | | (47 | ) | | (2 | ) | | (54 | ) |
| Mark-to-market for economic hedging activities | | — |
| | (2 | ) | | — |
| | (2 | ) |
| Gross margin | | $ | 335 |
| | $ | 442 |
| | $ | 105 |
| | $ | 882 |
|
| Contract amortization | | 5 |
| | 47 |
| | 2 |
| | 54 |
|
| Mark-to-market for economic hedging activities | | — |
| | 2 |
| | — |
| | 2 |
|
| Economic gross margin | $ | 340 |
| | $ | 407 |
| | $ | 107 |
| | $ | 854 |
| $ | 340 |
| | $ | 491 |
| | $ | 107 |
| | $ | 938 |
|
| | | | | | | | | | | | | | | |
| Year ended December 31, 2014 | | | | | | | | | | | | | | |
| Energy and capacity revenues | $ | 321 |
| | $ | 255 |
| | $ | 197 |
| | $ | 773 |
| $ | 321 |
| | $ | 337 |
| | $ | 197 |
| | $ | 855 |
|
| Cost of fuels | (2 | ) | | (1 | ) | | (86 | ) | | (89 | ) | (2 | ) | | (1 | ) | | (86 | ) | | (89 | ) |
| Contract amortization | | (4 | ) | | (23 | ) | | (2 | ) | | (29 | ) |
| Mark-to-market for economic hedging activities | | — |
| | 2 |
| | — |
| | 2 |
|
| Gross margin | | $ | 315 |
| | $ | 315 |
| | $ | 109 |
| | $ | 739 |
|
| Contract amortization | | 4 |
| | 23 |
| | 2 |
| | 29 |
|
| Mark-to-market for economic hedging activities | | — |
| | (2 | ) | | — |
| | (2 | ) |
| Economic gross margin | $ | 319 |
| | $ | 254 |
| | $ | 111 |
| | $ | 684 |
| $ | 319 |
| | $ | 336 |
| | $ | 111 |
| | $ | 766 |
|
EconomicGross margin increased by $143 million and economic gross margin increased by $170$172 million during the year ended December 31, 2015, compared to the same period in 2014, driven by:
| | | Renewable: | | |
| Renewables: | | (In millions) |
| Acquisitions of the Alta Wind Portfolio in August 2014 and Spring Canyon in May 2015 | $ | 126 |
| $ | 126 |
|
| Acquisition of EME Assets (Wind) | 31 |
| 31 |
|
| Other | (4 | ) | (2 | ) |
| Conventional: | |
|
| Acquisition of EME Assets (Walnut Creek) | 25 |
| 25 |
|
| Decrease due to the forced outage at El Segundo in the first half of 2015 | (4 | ) | |
| Forced outage at El Segundo in the first half of 2015 | | (4 | ) |
| Thermal: | |
|
| Decrease due to milder weather conditions in 2015 compared to 2014 | (4 | ) | |
| | $ | 170 |
| |
| Milder weather conditions in 2015 compared to 2014 | | (4 | ) |
| Increase in economic gross margin | | $ | 172 |
|
| Higher contract amortization primarily due to the amortization of the PPAs acquired in the acquisition of the Alta Wind Portfolio in August 2014 | | (25 | ) |
| Unrealized losses in 2015 and unrealized gains in 2014 on forward contracts with an NRG subsidiary hedging the forecasted sale of power from Elbow Creek, prior to the start of the PPA | | (4 | ) |
| Increase in gross margin | | $ | 143 |
|
Operations and Maintenance Expense
|
| | | | | | | | | | | | | | | |
| | Conventional | | Renewables | | Thermal | | Total |
| (In millions) | | | |
| Year ended December 31, 2015 | $ | 30 |
| | $ | 97 |
| | $ | 51 |
| | $ | 178 |
|
| Year ended December 31, 2014 | 30 |
| | 63 |
| | 47 |
| | 140 |
|
Contract amortization
Contract amortizationOperations and maintenance expense increased by $25$38 million during the year ended December 31, 2015,, compared to the same period in2014, due primarily to the amortization of the PPAs acquired in the acquisition of the Alta Wind Portfolio in August 2014.
Mark-to-market for economic hedging activities
Mark-to-market results for the years ended December 31, 2015, and 2014 represent the unrealized losses and gains, respectively, on forward contracts with an NRG subsidiary hedging the sale of power from the Elbow Creek wind facility extending through the end of 2015, as further described in Item 15 — Note 7, Accounting for Derivative Instruments and Hedging Activities, to the Consolidated Financial Statements.
Operations and Maintenance Expense
|
| | | | | | | | | | | | | | | |
| | Conventional | | Renewables | | Thermal | | Total |
| (In millions) | |
| Year ended December 31, 2015 | $ | 30 |
| | $ | 90 |
| | $ | 51 |
| | $ | 171 |
|
| Year ended December 31, 2014 | 30 |
| | 54 |
| | 47 |
| | 131 |
|
Operations and maintenance expense increased by $40 million during the year ended December 31, 2015, compared to the same period in 2014,, driven by:
|
| | | |
| Acquisition of Alta Wind Portfolio in August 2014 and Spring Canyon in May 2015 | $ | 21 |
|
| Acquisition of EME Assets, primarily in the Renewable segment | 16 |
|
| Other | 3 |
|
| | $ | 40 |
|
|
| | | |
| | (In millions) |
| Acquisition of the Alta Wind Portfolio in August 2014 and Spring Canyon in May 2015 | $ | 21 |
|
| Acquisition of EME Assets, primarily in the Renewables segment | 16 |
|
| Other | 1 |
|
| | $ | 38 |
|
Other Costs of Operations
Other costs of operations increased by $24 million during the year ended December 31, 2015, compared to the same period in 2014, primarily due primarily to an increase in property taxes resulting from the acquisitions of the Alta Wind Portfolio in August 2014, and the EME Assets in April 2014.
Depreciation and Amortization
Depreciation and amortization increased by $63$64 million during the year ended December 31, 2015,, compared to the same period in 2014,, primarily due primarily to the acquisitions of the Alta Wind Portfolio in August 2014 and the EME Assets in April 2014. Equity in Earnings of Unconsolidated Affiliates
Equity in earnings of unconsolidated affiliates increased by $10$9 million during the year ended December 31, 2015,, compared to the same period in 2014,, primarily due primarily to the acquisition of Desert Sunlight in June 2015 as well as the Elkhorn Ridge and San Juan Mesa projects, acquired as part of the EME Assets.
Interest Expense
Interest expense increased by $47 million during the year ended December 31, 2015,, compared to the same period in 2014, due to:
|
| | | |
| (In millions) |
| Acquisition of Alta Wind Portfolio in August 2014 | $ | 32 |
|
| Issuance of the Senior Notes due 2024 in the third quarter of 2014, 2020 Convertible Notes in the second quarter of 2015, and the 2019 Convertible Notes in the first quarter of 2014 | 31 |
|
| Acquisition of EME Assets in April 2014 | 3 |
|
| Repricing of project-level financing arrangements and principal repayments | (9 | ) |
| Changes in the fair value of interest rate swaps | (10 | ) |
| | $ | 47 |
|
Income Tax Expense
For the year ended December 31, 2015,, the Company recorded income tax expense of $12 million on pretax income of $67$77 million. For the same period in 2014,, the Company recorded income tax expense of $4 million on pretax income of $103$112 million. For the years ended December 31, 2015, and 2014, the overall effective tax rate was different than the statutory rate of 35% primarily due to taxable earnings allocated to NRG resulting from itsNRG's interest in NRG Yield LLC and PTCs derivedand ITCs generated from certain wind generation facilities.and solar assets, respectively.
Income Attributable to Noncontrolling Interests
For the year ended December 31, 2015, the Company had income of $56 million attributable to NRG's interest in the Company and a loss of $14 million attributable to noncontrolling interests with respect to its tax equity financing arrangements and the application of the HLBV method. For the year ended December 31, 2014, the Company had income of $48 million attributable to NRG's interest in the Company.
Consolidated Results of Operations
2014 compared to 2013
The following table provides selected financial information:
|
| | | | | | | | | | |
| | Year ended December 31, |
| (In millions, except otherwise noted) | 2014 | | 2013 | | Change % |
| Operating Revenues | | | | | |
| Energy and capacity revenues | $ | 773 |
| | $ | 388 |
| | 99 |
|
| Contract amortization | (29 | ) | | (1 | ) | | N/M |
|
| Mark-to-market economic hedging activities | 2 |
| | — |
| | 100 |
|
| Total operating revenues | 746 |
| | 387 |
| | 93 |
|
| Operating Costs and Expenses | | | | | |
| Cost of fuels | 89 |
| | 68 |
| | 31 |
|
| Operations and maintenance | 131 |
| | 66 |
| | 98 |
|
| Other cost of operations | 46 |
| | 14 |
| | 229 |
|
| Depreciation and amortization | 202 |
| | 74 |
| | 173 |
|
| General and administrative — affiliate | 8 |
| | 7 |
| | 14 |
|
| Acquisition-related transaction and integration costs | 4 |
| | — |
| | 100 |
|
| Total operating costs and expenses | 480 |
| | 229 |
| | 110 |
|
| Operating Income | 266 |
| | 158 |
| | 68 |
|
| Other Income (Expense) | | | | | |
| Equity in earnings of unconsolidated affiliates | 25 |
| | 22 |
| | 14 |
|
| Other income, net | 3 |
| | 3 |
| | — |
|
| Interest expense | (191 | ) | | (52 | ) | | 267 |
|
| Total other expense, net | (163 | ) | | (27 | ) | | 504 |
|
| Income Before Income Taxes | 103 |
| | 131 |
| | (21 | ) |
| Income tax expense | 4 |
| | 8 |
| | (50 | ) |
| Net Income | 99 |
| | 123 |
| | (20 | ) |
| Less: Pre-acquisition net income of Drop Down Assets | 35 |
| | 14 |
| | 150 |
|
| Net Income Excluding Pre-acquisition Net Income of Drop Down Assets | 64 |
| | 109 |
| | (41 | ) |
| Less: Predecessor income prior to initial public offering on July 22, 2013 | — |
| | 54 |
| | (100 | ) |
| Less: Net income attributable to noncontrolling interests | 48 |
| | 42 |
| | 14 |
|
| Net Income Attributable to NRG Yield, Inc. | $ | 16 |
| | $ | 13 |
| | 23 |
|
|
| | | | | |
| | Year ended December 31, |
| Business metrics: | 2014 | | 2013 |
Renewable MWh sold (in thousands) (a) | 3,977 |
| | 1,221 |
|
| Thermal MWt sold (in thousands) | 2,060 |
| | 1,679 |
|
| Thermal MWh sold (in thousands) | 205 |
| | 139 |
|
(a)Volumes sold do not include the MWh generated by the Company's equity method investments.
N/M - Not meaningful.
Management’s discussion of the results of operations for the years ended December 31, 2014, and 2013
|
| | | | | | | | | | | | | | | |
| | Conventional | | Renewables | | Thermal | | Total |
| (In millions) | | | |
| Year ended December 31, 2014 | | | | | | |
|
| Energy and capacity revenues | $ | 321 |
| | $ | 255 |
| | $ | 197 |
| | $ | 773 |
|
| Cost of fuels | (2 | ) | | (1 | ) | | (86 | ) | | (89 | ) |
| Economic gross margin | $ | 319 |
| | $ | 254 |
| | $ | 111 |
| | $ | 684 |
|
| | | | | | | | |
| Year ended December 31, 2013 | | | | | | | |
| Energy and capacity revenues | $ | 138 |
| | $ | 97 |
| | $ | 153 |
| | $ | 388 |
|
| Cost of fuels | (5 | ) | | — |
| | (63 | ) | | (68 | ) |
| Economic gross margin | $ | 133 |
| | $ | 97 |
| | $ | 90 |
| | $ | 320 |
|
Economic gross marginincreased by $364 million during the year ended December 31, 2014, compared to the same period in 2013, driven by:
|
| | | |
| Conventional: | |
| Marsh Landing and El Segundo reaching commercial operations in 2013 | $ | 109 |
|
| Acquisition of EME Assets (Walnut Creek) | 77 |
|
| Renewable: | |
| Acquisition of EME Assets (Wind) | 85 |
|
| Acquisition of Alta Wind Portfolio in August 2014 | 64 |
|
| Kansas South, TA High Desert and Borrego facilities reaching commercial operations in 2013 | 6 |
|
| Other | 2 |
|
| Thermal: | |
| Acquisition of Energy Systems in December 2013 | 15 |
|
| Repowering of Dover facilities in the second quarter of 2013, and increased generation at other Thermal facilities due to weather conditions in the first quarter of 2014 | 6 |
|
| | $ | 364 |
|
Contract amortization
Contract amortization increased by $28 million during the year ended December 31, 2014, compared to the same period in2013, primarily due to the amortization of the PPAs acquired in the acquisitions of the Alta Wind Portfolio in August 2014 and the EME Assets in April 2014.
Mark-to-market for economic hedging activities
Mark-to-market results for the year ended December 31, 2014, represent the unrealized gains on forward contracts with an NRG subsidiary hedging the sale of power from the Elbow Creek wind facility extending through the end of 2015, as further described in Item 15 — Note 7, Accounting for Derivative Instruments and Hedging Activities, to the Consolidated Financial Statements.
Operations and Maintenance Expense
|
| | | | | | | | | | | | | | | |
| | Conventional | | Renewables | | Thermal | | Total |
| (In millions) | | | |
| Year ended December 31, 2014 | $ | 30 |
| | $ | 54 |
| | $ | 47 |
| | $ | 131 |
|
| Year ended December 31, 2013 | 11 |
| | 14 |
| | 41 |
| | 66 |
|
Operations and maintenance expense increased by $65 million during the year ended December 31, 2014, compared to the same period in 2013, driven by:
|
| | | |
| Conventional: | |
| Marsh Landing and El Segundo reaching commercial operations in 2013 | $ | 13 |
|
| Acquisition of EME Assets (Walnut Creek) | 6 |
|
| Renewable: | |
| Acquisition of EME Assets (Wind) | 27 |
|
| Acquisition of Alta Wind Portfolio in August 2014 | 11 |
|
| Kansas South, TA High Desert and Borrego facilities reaching commercial operations in 2013 | 2 |
|
| Thermal: | |
| Acquisition of Energy Systems in December 2013 | 6 |
|
| | $ | 65 |
|
Other Costs of Operations
Other costs of operations increased by $32 million during the year ended December 31, 2014, compared to the same period in 2013, primarily due to an increase in property taxes resulting from the acquisitions of the EME Assets in April 2014 and the Alta Wind Portfolio in August 2014, as well as Marsh Landing and El Segundo reaching commercial operations in 2013.
Depreciation and Amortization
Depreciation and amortization increased by $128 million during the year ended December 31, 2014, compared to the same period in 2013, due to:
|
| | | |
| (In millions) | |
| Acquisition of the EME Assets | $ | 54 |
|
| Marsh Landing and El Segundo, which reached commercial operations in 2013 | 45 |
|
| Acquisition of Alta Wind Portfolio in August 2014 | 23 |
|
| Acquisition of Energy Systems in December 2013 | 4 |
|
| Kansas South, TA High Desert and Borrego facilities reached commercial operations in 2013 | 2 |
|
| | $ | 128 |
|
Equity in Earnings of Unconsolidated Affiliates
Equity in earnings of unconsolidated affiliates increased by $3 million during the year ended December 31, 2014, compared to the same period in 2013, due primarily to CVSR reaching commercial operations in 2013, partially offset by losses from San Juan Mesa, acquired with the EME Assets.
Interest Expense
Interest expense increased by $139 million during the year ended December 31, 2014, compared to the same period in 2013, due to:
|
| | | |
| (In millions) | |
| Interest expense on the project-level debt assumed in the Alta Wind Portfolio acquisition in August 2014 | $ | 45 |
|
| Issuance of Senior Notes due 2024 in August 2014, Convertible Notes due 2019 in March 2014 and, to a lesser extent, increased interest expense on the Company's revolving credit facility | 30 |
|
| Increase due to the acquisition of the EME Assets in April 2014 | 25 |
|
| Increase in interest expense primarily related to Alpine interest rate swap | 21 |
|
| Increase in interest expense for the El Segundo and Marsh Landing projects which reached commercial operations in 2013 | 18 |
|
| | $ | 139 |
|
Income Tax Expense
For the year ended December 31, 2014, the Company recorded income tax expense of $4 million on pretax income of $103 million. For the same period in 2013, the Company recorded income tax expense of $8 million on pretax income of $131 million. For the year ended December 31, 2014, the Company's overall effective tax rate was different than the statutory rate of 35% primarily due to taxable earnings allocated to NRG resulting from its interest in NRG Yield LLC and PTCs generated from certain wind generation facilities. For the year ended December 31, 2013, the Company's overall effective tax rate was different than the statutory rate of 35% primarily due to taxable earnings allocated to NRG resulting from its interest in NRG Yield LLC.
Income Attributable to Noncontrolling Interests
For the twelve months ended December 31, 2014 and 2013, the Company had income of $48 million and $42 million, respectively, attributable to NRG's interest in the Company.
Liquidity and Capital Resources
The Company's principal liquidity requirements are to meet its financial commitments, finance current operations, fund capital expenditures, including acquisitions from time to time, to service debt and to pay dividends. Historically, the Company's predecessor operations were financed as part of NRG's integrated operations and largely relied on internally generated cash flows as well as corporate and/or project-level borrowings to satisfy its capital expenditure requirements. As a normal part of the Company's business, depending on market conditions, the Company will from time to time consider opportunities to repay, redeem, repurchase or refinance its indebtedness. Changes in the Company's operating plans, lower than anticipated sales, increased expenses, acquisitions or other events may cause the Company to seek additional debt or equity financing in future periods. There can be no guarantee that financing will be available on acceptable terms or at all. Debt financing, if available, could impose additional cash payment obligations and additional covenants and operating restrictions.
Liquidity Position
As of December 31, 20152016, and December 31, 20142015, the Company's liquidity was approximately $292$916 million and $888$375 million, respectively, comprised of cash, restricted cash, and availability under the Company's revolving credit facility. The decreaseCompany's liquidity includes $164 million and $131 million of restricted cash balances as of December 31, 2016 and 2015, respectively. Restricted cash consists primarily relatesof funds to increased borrowings undersatisfy the revolving credit facility used to fundrequirements of certain debt arrangements and funds held within the acquisition of the November 2015 Drop Down Assets and the use of cash on hand to fund the acquisition of the January 2015 Drop Down Assets.Company's projects that are restricted in their use. The Company's various financing arrangements are described in Item 15 — Note 910, Long-term Debt, to the Consolidated Financial Statements. On June 26, 2015, the Company amended the revolving credit facility to, among other things, increase the availability from $450 million to $495 million. As of December 31, 2015, $306 million of2016, there were no outstanding borrowings and $56the Company had $60 million of letters of credit were outstanding.outstanding under the revolving credit facility.
Management believes that the Company's liquidity position, cash flows from operations and availability under its revolving credit facility will be adequate to meet the Company's financial commitments; debt service obligations; growth, operating and maintenance capital expenditures; and to fund dividends to holders of the Company's Class A common stock and Class C common stock. Management continues to regularly monitor the Company's ability to finance the needs of its operating, financing and investing activity within the dictates of prudent balance sheet management.
Credit Ratings
Credit rating agencies rate a firm's public debt securities. These ratings are utilized by the debt markets in evaluating a firm's credit risk. Ratings influence the price paid to issue new debt securities by indicating to the market the Company's ability to pay principal, interest and preferred dividends. Rating agencies evaluate a firm's industry, cash flow, leverage, liquidity, and hedge profile, among other factors, in their credit analysis of a firm's credit risk.
The following table summarizes the credit ratings for the Company and its Senior Notes as of December 31, 20152016:. The ratings outlook is stable.
|
| | | |
| | S&P | | Moody's |
| NRG Yield, Inc. | BB+BB | | Ba2 |
| 5.375% Senior Notes, due 2024 | BB+BB | | Ba2 |
| 5.000% Senior Notes, due 2026 | BB | | Ba2 |
Sources of Liquidity
The Company's principal sources of liquidity include cash on hand, cash generated from operations, borrowings under new and existing financing arrangements and the issuance of additional equity and debt securities as appropriate given market conditions. As described in Item 15 — Note 910, Long-term Debt, to the Consolidated Financial Statements, and above in Significant Events During the Year Ended December 31, 2015,2016, and Significant Events During the Year Ended December 31, 2014, the Company's financing arrangements consist of the revolving credit facility, the 2019 Convertible Notes, the 2020 Convertible Notes, the 2024 Senior Notes, the 2026 Senior Notes, the ATM Program and project-level financings for its various assets.
At-the-Market Equity Offering Program
52On August 9, 2016, NRG Yield, Inc. entered into an equity distribution agreement, or EDA, with Barclays Capital Inc., Credit Suisse Securities (USA) LLC, J.P. Morgan Securities LLC and RBC Capital Markets, LLC, as sales agents. Pursuant to the terms of the EDA, NRG Yield, Inc. may offer and sell shares of its Class C common stock par value $0.01 per share, from time to time through the sales agents, as NRG Yield, Inc.’s sales agents for the offer and sale of the shares, up to an aggregate sales price of $150,000,000 through an at-the-market equity offering program, or ATM Program. NRG Yield, Inc. may also sell shares of its Class C common stock to any of the sales agents, as principals for its own account, at a price agreed upon at the time of sale. As of December 31, 2016, no shares were issued under the ATM Program.
Recapitalization
As described above in Significant Events During the Year Ended DecemberThermal Financing
On October 31, 2015, effective May 14, 2015,2016, NRG Yield, Inc. amended its certificate of incorporation to create two new classes of capital stock, Class C common stock and Class D common stock, and distributed sharesEnergy Center Minneapolis LLC, a subsidiary of the Class C common stockCompany, received proceeds of $125 million from the issuance of 3.55% Series D notes due October 31, 2031, or the Series D Notes, and Classentered into a shelf facility for the anticipated issuance of an additional $70 million of notes. In the first quarter of 2017, NRG Energy Center Minneapolis LLC anticipates amending the shelf facility to allow for the issuance of an additional $10 million of notes, increasing the total principal amount of notes available for issuance under the shelf facility to $80 million. The Series D common stock to holdersNotes are, and the additional notes, if issued, will be secured by substantially all of the Company's outstanding Class A common stockassets of NRG Energy Center Minneapolis LLC. NRG Thermal LLC has guaranteed the indebtedness and Class B common stock, respectively, throughits guarantee is secured by a stock split.
The par value per sharepledge of the Company’s Class A common stock and Class B common stock remains unchanged at $0.01 per share after the effect of the stock split. Accordingly, the stock split was accounted for as a stock dividend. The Company recorded a transfer between retained earnings and common stock equal to the par value of each share of Class C common stock and Class D common stock that was issued. The Company also gave retroactive effect to prior period share and per share amounts in the Consolidated Financial Statements for the effect of the stock dividend, such that all periods are comparable.
In connection with the amendment described above, the ROFO Agreement was amended to make additional assets available to the Company should NRG choose to sell them, including (i) two natural gas facilities totaling 795 MW of net capacity that are expected to reach COD in 2017 and 2020, (ii) an equity interest in a wind portfolio that includes wind facilities totaling approximately 934 MW of net capacity, the majority of which was sold to the Company on November 3, 2015, and (iii) up to $250 million of equity interests in one or more residential orall of NRG Thermal LLC’s subsidiaries. NRG Energy Center Minneapolis LLC distributed solar generation portfolios developed by affiliates of NRG.
On June 29, 2015, NRG Yield, Inc. issued 28,198,000 shares of Class C common stock for net proceeds of $599 million, net of underwriting discounts and commissions of $21 million. The Company utilized the proceeds of the offering to acquire 28,198,000 additional Class C units of NRG Yield LLC and, as a result, it currently owns 53.3% of the economic interests of NRG Yield LLC, with NRG retaining 46.7% of the economic interests of NRG Yield LLC. Additionally, on June 29, 2015, the Company completed an offering of $287.5 million aggregate principal amount of 3.25% ConvertibleSeries D Notes due 2020, which proceeds were subsequently lent to NRG Thermal LLC, who in turn distributed the proceeds to Yield LLC.Operating LLC to be utilized for general corporate purposes, including potential acquisitions.
Uses of Liquidity
The Company's requirements for liquidity and capital resources, other than for operating its facilities, are categorized as: (i) debt service obligations, as described more fully in Item 15 — Note 910, Long-term Debt, to the Consolidated Financial Statements; (ii) capital expenditures; (iii) acquisitions and investments; and (iv) cash dividends to investors.
Debt Service Obligations
Principal payments on debt as of December 31, 2015,2016 are due in the following periods:
| | | Description | 2016 | | 2017 | | 2018 | | 2019 | | 2020 | | There-after | | Total | 2017 | | 2018 | | 2019 | | 2020 | | 2021 | | There-after | | Total |
| | (In millions) | (In millions) |
| NRG Yield, Inc. Convertible Notes, due 2019 | $ | — |
| | $ | — |
| | $ | — |
| | $ | 345 |
| | $ | — |
| | $ | — |
| | $ | 345 |
| $ | — |
| | $ | — |
| | $ | 345 |
| | $ | — |
| | $ | — |
| | $ | — |
| | $ | 345 |
|
| NRG Yield, Inc. Convertible Notes, due 2020 | — |
| | — |
| | — |
| | — |
| | 287 |
| | — |
| | 287 |
| — |
| | — |
| | — |
| | 288 |
| | — |
| | — |
| | 288 |
|
| NRG Yield Operating LLC Senior Notes, due 2024 | — |
| | — |
| | — |
| | — |
| | — |
| | 500 |
| | 500 |
| — |
| | — |
| | — |
| | — |
| | — |
| | 500 |
| | 500 |
|
| NRG Yield LLC and NRG Yield Operating LLC Revolving Credit Facility, due 2019 | — |
| | — |
| | — |
| | 306 |
| | — |
| | — |
| | 306 |
| |
| NRG Yield Operating LLC Senior Notes, due 2026 | | — |
| | — |
| | — |
| | — |
| | — |
| | 350 |
| | 350 |
|
| Total Corporate-level debt | — |
| | — |
| | — |
| | 651 |
| | 287 |
| | 500 |
| | 1,438 |
| — |
| | — |
| | 345 |
| | 288 |
| | — |
| | 850 |
| | 1,483 |
|
| Project-level debt: | | | | | | | | | | | | | | | | | | | | | | | | | | |
| Alta Wind I, lease financing arrangement, due 2034 | 10 |
| | 11 |
| | 11 |
| | 12 |
| | 12 |
| | 196 |
| | 252 |
| 11 |
| | 11 |
| | 12 |
| | 12 |
| | 12 |
| | 184 |
| | 242 |
|
| Alta Wind II, lease financing arrangement, due 2034 | 7 |
| | 8 |
| | 8 |
| | 8 |
| | 9 |
| | 158 |
| | 198 |
| 8 |
| | 8 |
| | 8 |
| | 9 |
| | 9 |
| | 149 |
| | 191 |
|
| Alta Wind III, lease financing arrangement, due 2034 | 7 |
| | 8 |
| | 8 |
| | 8 |
| | 9 |
| | 166 |
| | 206 |
| 8 |
| | 8 |
| | 8 |
| | 9 |
| | 9 |
| | 156 |
| | 198 |
|
| Alta Wind IV, lease financing arrangement, due 2034 | 5 |
| | 5 |
| | 5 |
| | 5 |
| | 6 |
| | 107 |
| | 133 |
| 5 |
| | 5 |
| | 5 |
| | 6 |
| | 6 |
| | 101 |
| | 128 |
|
| Alta Wind V, lease financing arrangement, due 2035 | 7 |
| | 8 |
| | 8 |
| | 8 |
| | 9 |
| | 173 |
| | 213 |
| 8 |
| | 8 |
| | 8 |
| | 9 |
| | 9 |
| | 164 |
| | 206 |
|
| Alta Realty Investments, due 2031 | 1 |
| | 1 |
| | 2 |
| | 2 |
| | 1 |
| | 26 |
| | 33 |
| 1 |
| | 2 |
| | 2 |
| | 1 |
| | 2 |
| | 23 |
| | 31 |
|
| Alta Wind Asset Management, due 2031 | 1 |
| | 1 |
| | 1 |
| | 1 |
| | 1 |
| | 14 |
| | 19 |
| 1 |
| | 1 |
| | 1 |
| | 1 |
| | 1 |
| | 13 |
| | 18 |
|
| Alpine, due 2022 | 9 |
| | 9 |
| | 8 |
| | 8 |
| | 8 |
| | 112 |
| | 154 |
| 9 |
| | 8 |
| | 8 |
| | 8 |
| | 8 |
| | 104 |
| | 145 |
|
| Avra Valley, due 2031 | 3 |
| | 3 |
| | 3 |
| | 3 |
| | 4 |
| | 44 |
| | 60 |
| 3 |
| | 3 |
| | 3 |
| | 4 |
| | 3 |
| | 41 |
| | 57 |
|
| Blythe, due 2028 | 2 |
| | 2 |
| | 1 |
| | 2 |
| | 1 |
| | 13 |
| | 21 |
| 2 |
| | 1 |
| | 2 |
| | 1 |
| | 1 |
| | 12 |
| | 19 |
|
| Borrego, due 2025 and 2038 | 3 |
| | 3 |
| | 3 |
| | 3 |
| | 3 |
| | 57 |
| | 72 |
| 3 |
| | 3 |
| | 3 |
| | 3 |
| | 3 |
| | 54 |
| | 69 |
|
| CVSR, due 2037 | | 25 |
| | 26 |
| | 24 |
| | 21 |
| | 23 |
| | 652 |
| | 771 |
|
| CVSR Holdco Notes, due 2037 | | 5 |
| | 6 |
| | 6 |
| | 6 |
| | 7 |
| | 169 |
| | 199 |
|
| El Segundo Energy Center, due 2023 | 42 |
| | 43 |
| | 48 |
| | 49 |
| | 53 |
| | 250 |
| | 485 |
| 43 |
| | 48 |
| | 49 |
| | 53 |
| | 57 |
| | 193 |
| | 443 |
|
| Energy Center Minneapolis, due 2017 and 2025 | 12 |
| | 13 |
| | 7 |
| | 11 |
| | 11 |
| | 54 |
| | 108 |
| 13 |
| | 7 |
| | 11 |
| | 11 |
| | 11 |
| | 43 |
| | 96 |
|
| Energy Center Minneapolis Series D Notes, due 2031 | | — |
| | — |
| | — |
| | — |
| | — |
| | 125 |
| | 125 |
|
| Kansas South, due 2031 | 2 |
| | 2 |
| | 2 |
| | 2 |
| | 2 |
| | 23 |
| | 33 |
| 2 |
| | 2 |
| | 2 |
| | 2 |
| | 2 |
| | 20 |
| | 30 |
|
| Laredo Ridge, due 2028 | 5 |
| | 5 |
| | 5 |
| | 5 |
| | 6 |
| | 78 |
| | 104 |
| 5 |
| | 5 |
| | 5 |
| | 6 |
| | 6 |
| | 73 |
| | 100 |
|
| Marsh Landing, due 2017 and 2023 | 48 |
| | 52 |
| | 55 |
| | 57 |
| | 60 |
| | 146 |
| | 418 |
| 52 |
| | 55 |
| | 57 |
| | 60 |
| | 62 |
| | 84 |
| | 370 |
|
| Other | 2 |
| | — |
| | — |
| | — |
| | — |
| | — |
| | 2 |
| |
| PFMG and related subsidiaries financing agreement, due 2030 | 2 |
| | 1 |
| | 1 |
| | 2 |
| | 1 |
| | 22 |
| | 29 |
| 1 |
| | 1 |
| | 2 |
| | 1 |
| | 1 |
| | 21 |
| | 27 |
|
| Roadrunner, due 2031 | 3 |
| | 3 |
| | 3 |
| | 3 |
| | 2 |
| | 26 |
| | 40 |
| 3 |
| | 3 |
| | 3 |
| | 2 |
| | 3 |
| | 23 |
| | 37 |
|
| South Trent Wind, due 2020 | 5 |
| | 4 |
| | 4 |
| | 4 |
| | 45 |
| | — |
| | 62 |
| 4 |
| | 4 |
| | 4 |
| | 45 |
| | — |
| | — |
| | 57 |
|
| TA High Desert, due 2020 and 2032 | 3 |
| | 3 |
| | 3 |
| | 3 |
| | 3 |
| | 37 |
| | 52 |
| 3 |
| | 3 |
| | 3 |
| | 3 |
| | 3 |
| | 34 |
| | 49 |
|
| Tapestry Wind, due 2021 | 9 |
| | 10 |
| | 11 |
| | 11 |
| | 11 |
| | 129 |
| | 181 |
| |
| Tapestry, due 2021 | | 10 |
| | 11 |
| | 11 |
| | 11 |
| | 129 |
| | — |
| | 172 |
|
| Viento, due 2023 | 11 |
| | 13 |
| | 16 |
| | 18 |
| | 16 |
| | 115 |
| | 189 |
| 13 |
| | 16 |
| | 18 |
| | 16 |
| | 16 |
| | 99 |
| | 178 |
|
| Walnut Creek, due 2023 | 41 |
|
| 43 |
|
| 45 |
|
| 47 |
|
| 49 |
|
| 126 |
| | 351 |
| 43 |
|
| 45 |
|
| 47 |
|
| 49 |
|
| 52 |
|
| 74 |
| | 310 |
|
| WCEP Holdings, due 2023 | 1 |
|
| 1 |
|
| 2 |
|
| 4 |
|
| 4 |
|
| 34 |
| | 46 |
| 1 |
|
| 2 |
|
| 4 |
|
| 4 |
|
| 4 |
|
| 31 |
| | 46 |
|
| Total project-level debt | 241 |
| | 252 |
| | 260 |
| | 276 |
| | 326 |
| | 2,106 |
| | 3,461 |
| 282 |
| | 292 |
| | 306 |
| | 353 |
| | 439 |
| | 2,642 |
| | 4,314 |
|
| Total debt | $ | 241 |
| | $ | 252 |
| | $ | 260 |
|
| $ | 927 |
|
| $ | 613 |
|
| $ | 2,606 |
|
| $ | 4,899 |
| $ | 282 |
| | $ | 292 |
| | $ | 651 |
|
| $ | 641 |
|
| $ | 439 |
|
| $ | 3,492 |
|
| $ | 5,797 |
|
Capital Expenditures
The Company's capital spending program is mainly focused on maintenance capital expenditures, orconsisting of costs to maintain the assets currently operating, such as costs to replace or refurbish assets during routine maintenance, and growth capital expenditures or constructionconsisting of costs to construct new assets, and completingcosts to complete the construction of assets where construction is in process.process, and capital expenditures related to acquiring additional thermal customers. The Company develops annual capital spending plans based on projected requirements for maintenance and growth capital. For the years ended December 31, 20152016, 2014,2015, and 2013,2014, the Company used approximately $20 million, $29 million, $33 million, and $353$60 million, respectively, to fund capital expenditures, including maintenance capital expenditures of $20$16 million, $820 million, and $8 million, respectively. Growth capital expenditures in 20142016 were in primarily in the Thermal segment and 2013relate to servicing new customers in district energy centers. Growth capital expenditures in 2015 and 2014 primarily related to the construction of the Company’s solar generating assets, Marsh Landing and El Segundo.
In January 2015, El Segundo experienced a steam turbine water intrusion resulting in a forced outage on Units 5 and 6. The units returned to service in April 2015. The Company completed a root cause analysis and has implemented steps to prevent a recurrence of the event. The Company reviewed the financial impact of repair costs and lost capacity revenue and collected approximately $4 million of insurance proceeds in the fourth quarter of 2015.
Acquisitions and Investments
The Company intends to acquire generation and thermal infrastructure assets developed and constructed by NRG in the future, as well as generation and thermal infrastructure assets from third parties where the Company believes its knowledge of the market and operating expertise provides a competitive advantage, and to utilize such acquisitions as a means to grow its CAFD. See
On February 24, 2017, as discussed in Item 15 — Note 5, Significant Events DuringInvestments Accounted for by the Year Ended December 31, 2015Equity Method and Variable Interest Entities, above forthe Company and NRG entered into a descriptiondefinitive agreement regarding the acquisition of the acquisitionsfollowing facilities: (i) a 16% interest (approximately 31% of NRG's 51% interest) in the Agua Caliente solar farm and investments that have taken place during(ii) NRG's 50% interests in seven utility-scale solar farms located in Utah, which are part of a tax equity structure with Dominion Solar Projects III, Inc., or Dominion, from which NRG currently receives 50% of cash to be distributed. The Company expects to pay total cash consideration of $130 million and assume non-recourse project debt. The purchase price for the acquisition, which is subject to working capital adjustments to be calculated at close, is expected to be funded with cash on hand. The Company expects to record its interests in the acquired projects as equity method investments.
On September 1, 2016, as discussed in Item 15 — Note 3, Business Acquisitions, to the Consolidated Financial Statements, the Company acquired the remaining 51.05% interest of CVSR Holdco LLC from NRG for total cash consideration of $78.5 million. The acquisition was funded with cash on hand. The Company also assumed additional debt of $496 million, which represents 51.05% of the CVSR project level debt and 51.05% of the notes issued under the CVSR Holdco Financing Agreement. In connection with the retrospective adjustment of prior periods, the Company now consolidates CVSR and 100% of debt, or $771 million of CVSR project level debt and $200 million of notes issued under the CVSR Holdco Financing Agreement as of September 1, 2016.
During the year ended December 31, 2015.2016, the Company invested $80 million in distributed and residential solar investment partnerships with NRG, as further described in Item 15 — Note 5, Investments Accounting for by the Equity Method and Variable Interest Entities.
Cash Dividends to Investors
The Company intends to use the amount of cash that it receives from its distributions from NRG Yield LLC to pay quarterly dividends to the holders of its Class A common stock and Class C common stock. NRG Yield LLC intends to distribute to its unit holders in the form of a quarterly distribution all of the CAFD that is generated each quarter less reserves for the prudent conduct of the business, including among others, maintenance capital expenditures to maintain the operating capacity of the assets. CAFD is defined as net income before interest expense, income taxes, depreciation and amortization, plus cash distributions from unconsolidated affiliates, cash receipts from notes receivable, less cash distributions to noncontrolling interests, maintenance capital expenditures, pro-rata EBITDA from unconsolidated affiliates, cash interest paid, income taxes paid, principal amortization of indebtedness and changes in other assets.prepaid and accrued capacity payments. Dividends on the Class A common stock and Class C common stock are subject to available capital, market conditions, and compliance with associated laws, regulations and other contractual obligations. The Company expects that, based on current circumstances, comparable cash dividends will continue to be paid in the foreseeable future.
The following table lists the dividends paid on the Company's Class A common stock and Class C common stock during the year ended December 31, 2015:2016:
| | | | Fourth Quarter 2015 | | Third Quarter 2015 | | Second Quarter 2015 | | First Quarter 2015 | Fourth Quarter 2016 | | Third Quarter 2016 | | Second Quarter 2016 | | First Quarter 2016 |
| Dividends per Class A share | $ | 0.215 |
| | $ | 0.21 |
| | $ | 0.20 |
| | $ | 0.39 |
| $ | 0.25 |
| | $ | 0.24 |
| | $ | 0.23 |
| | $ | 0.225 |
|
| Dividends per Class C share | $ | 0.215 |
| | $ | 0.21 |
| | $ | 0.20 |
| | N/A |
| $ | 0.25 |
| | $ | 0.24 |
| | $ | 0.23 |
| | $ | 0.225 |
|
On February 17, 2016,15, 2017, the Company declared a quarterly dividend on its Class A and Class C common stock of $0.225$0.26 per share payable on March 15, 2016,2017, to stockholders of record as of March 1, 2016.2017.
Cash Flow Discussion
Year Ended December 31, 2015,2016 Compared to Year Ended December 31, 20142015
The following table reflects the changes in cash flows for the year ended December 31, 20152016, compared to 20142015:
| | | Year ended December 31, | 2015 | | 2014 | | Change | 2016 | | 2015 | | Change |
| (In millions) | | |
| Net cash provided by operating activities | $ | 373 |
| | $ | 310 |
| | $ | 63 |
| $ | 560 |
| | $ | 405 |
| | $ | 155 |
|
| Net cash used in investing activities | (1,118 | ) | | (1,033 | ) | | (85 | ) | (161 | ) | | (1,108 | ) | | 947 |
|
| Net cash provided by financing activities | 427 |
| | 1,093 |
| | (666 | ) | |
| Net cash (used in) provided by financing activities | | (193 | ) | | 385 |
| | (578 | ) |
Net Cash Provided By Operating Activities
|
| | | |
| Changes to net cash provided by operating activities were driven by: | (In millions) |
| Higher net distributions from unconsolidated affiliates for the period ending December 31, 2015, compared to the same period in 2014 | $ | 24 |
|
| Increase in operating income adjusted for non-cash items and changes in working capital | 39 |
|
| | $ | 63 |
|
|
| | | |
| Changes to net cash provided by operating activities were driven by: | (In millions) |
| Increase in operating income adjusted for non-cash items driven by higher revenues mainly in the Renewables segment in 2016 compared to 2015 | $ | 127 |
|
| Changes in working capital driven primarily by the timing of accounts receivable collections in 2015 compared to 2016 | 22 |
|
| Higher distributions from unconsolidated affiliates | 6 |
|
| | $ | 155 |
|
Net Cash Used In Investing Activities
|
| | | |
| Changes to net cash used in investing activities were driven by: | (In millions) |
| Payments to acquire businesses, net of cash acquired (primarily the Alta acquisition in 2014) | $ | 864 |
|
| Higher payments made to acquire Drop Down Assets in 2015 compared to payments made in 2014 | (387 | ) |
| Decrease in capital expenditures due to several projects being placed in service in early 2014 | 4 |
|
| Changes in restricted cash primarily due to cash transfers in connection with higher debt principal payments in 2015 | (50 | ) |
| Increase in net investments in unconsolidated affiliates in 2015, compared to 2014, primarily due to the investment in Desert Sunlight made in 2015 | (367 | ) |
| Proceeds from renewable energy grants in 2014 | (137 | ) |
| Other | (12 | ) |
| | $ | (85 | ) |
|
| | | |
| Changes to net cash used in investing activities were driven by: | (In millions) |
| Higher payments for the acquisition of the January 2015 and November 2015 Drop Down Assets in 2015 compared to the payments made for the CVSR Drop Down in 2016 | $ | 621 |
|
| Higher net investments in unconsolidated affiliates in 2015, primarily due to investment in Desert Sunlight | 308 |
|
| Payments to acquire businesses, net of cash acquired, in 2015 | 37 |
|
| Decrease in capital expenditures primarily due to the completion of a project in the Thermal segment in 2015, as well as lower maintenance capital expenditures in 2016 | 9 |
|
| Receipt of insurance proceeds in 2016 in the Renewables segment | 4 |
|
| Higher restricted cash balances in 2016, primarily driven by higher revenues in the Renewables segment in the third and fourth quarters of 2016, which in turn provided more cash available for distribution by certain projects | (32 | ) |
| | $ | 947 |
|
Net Cash (Used In) Provided By Financing Activities
|
| | | |
| Changes in net cash provided by financing activities were driven by: | (In millions) |
| Lower contributions from tax equity investors in 2015 | $ | (68 | ) |
| Lower payments of dividends and returns of capital to NRG, partially offset by contributions from NRG in 2014 | 250 |
|
| Lower net proceeds from Class C equity offering on June 29, 2015, compared to the net proceeds from Class A equity offering on July 29, 2014 | (31 | ) |
| Increase in debt payments, as well as a decrease in proceeds from long-term debt in 2015, compared to 2014 | (802 | ) |
| Increase in dividends and distributions paid | (38 | ) |
| Decrease in debt issuance costs due to lower borrowings in 2015 | 23 |
|
| | $ | (666 | ) |
|
| | | |
| Changes in net cash (used in) provided by financing activities were driven by: | (In millions) |
Proceeds from sale of an economic interest in Alta TE Holdco in 2015, as further described in Item 15 — Note 5, Investments Accounted for by the Equity Method and Variable Interest Entities, compared to lower net contributions from tax equity investors in 2016 | $ | (117 | ) |
| Higher payments of distributions to NRG related to NRG's 25% ownership of NRG Wind TE Holdco and distributions made to NRG from Drop Down Assets prior to the acquisition dates | (64 | ) |
| Proceeds from Class C equity offering on June 29, 2015 | (599 | ) |
| Net repayments of $306 million under the revolving credit facility in 2016 compared to the net borrowings of $306 million in 2015 | (612 | ) |
| Issuance of the Series D Notes in October 2016, 2026 Senior Notes in August 2016, and CVSR Holdco Notes, due 2037 in July 2016, partially offset by lower debt principal payments throughout 2016, compared to 2015 | 842 |
|
| Increase in dividends paid to common stockholders, as declared dividends increased 16.3% from 2015 to 2016 | (34 | ) |
| Lower debt issuance costs paid in 2016 | 6 |
|
| | $ | (578 | ) |
Year Ended December 31, 2014,2015 Compared to Year Ended December 31, 20132014
The following table reflects the changes in cash flows for the year ended December 31, 2014,2015 compared to 2013:2014:
| | | Year ended December 31, | 2014 | | 2013 | | Change | 2015 | | 2014 | | Change |
| (In millions) | (In millions) | | (In millions) | |
| Net cash provided by operating activities | $ | 310 |
| | $ | 120 |
| | $ | 190 |
| $ | 405 |
| | $ | 362 |
| | $ | 43 |
|
| Net cash used in investing activities | (1,033 | ) | | (515 | ) | | (518 | ) | (1,108 | ) | | (739 | ) | | (369 | ) |
| Net cash provided by financing activities | 1,093 |
| | 432 |
| | 661 |
| 385 |
| | 747 |
| | (362 | ) |
Net Cash Provided By Operating Activities
|
| | | |
| Changes to net cash provided by operating activities were driven by: | (In millions) |
| Increase in operating income due to El Segundo, Marsh Landing and a number of the Renewable projects being placed in service in 2013, as well as the acquisitions of the Alta Wind Portfolio and the EME Assets, adjusted for non-cash charges | $ | 140 |
|
| Higher net distributions from unconsolidated affiliates for the period ending December 31, 2014, compared to the same period in 2013 | 11 |
|
| Decreased working capital requirements due to assets placed in service in 2013 | 39 |
|
| | $ | 190 |
|
|
| | | |
| Changes to net cash provided by operating activities were driven by: | (In millions) |
| Increase in operating income adjusted for non-cash items | $ | 19 |
|
| Higher distributions from unconsolidated affiliates for the year ending December 31, 2015 compared to the same period in 2014 | 22 |
|
| Changes in working capital primarily driven by timing of capacity payments | 2 |
|
| $ | 43 |
|
Net Cash Used In Investing Activities
|
| | | |
| Changes to net cash used in investing activities were driven by: | (In millions) |
| Increase in cash paid for Alta Wind Portfolio in 2014 compared to cash paid for Energy Systems in 2013 | $ | (781 | ) |
| Payment to NRG for Drop Down Assets, net of cash acquired | (311 | ) |
| Decrease in capital expenditures for El Segundo, Marsh Landing and some Renewable projects, as the assets were placed in service in 2013 | 320 |
|
| Decrease in restricted cash, primarily for Marsh Landing, Borrego, Alta Wind Portfolio, El Segundo, Alpine and High Desert | 92 |
|
| Increase in notes receivable, including affiliates | (2 | ) |
| Increase in proceeds from renewable grants in 2014 compared to 2013 | 112 |
|
| Decrease in investments in unconsolidated affiliates in 2014 compared to 2013 | 41 |
|
| Other | 11 |
|
| | $ | (518 | ) |
|
| | | |
| Changes to net cash used in investing activities were driven by: | (In millions) |
| Payments to acquire businesses, net of cash acquired (primarily the Alta acquisition in 2014) | $ | 864 |
|
| Higher payments made to acquire Drop Down Assets in 2015 compared to payments made in 2014 | (387 | ) |
| Decrease in capital expenditures due to several projects being placed in service in early 2014 | 31 |
|
| Changes in restricted cash primarily due to cash transfers in connection with higher debt principal payments in 2015 | (26 | ) |
| Proceeds from renewable energy grants in 2014 | (422 | ) |
| Increase in net investments in unconsolidated affiliates in 2015 compared to 2014, primarily due to the investment in Desert Sunlight made in 2015 | (364 | ) |
| Receipt of indemnity from supplier for CVSR | (57 | ) |
| Other | (8 | ) |
| | $ | (369 | ) |
Net Cash Provided By Financing Activities
|
| | | |
| Changes in net cash provided by financing activities were driven by: | (In millions) |
| Decrease in dividends and returns of capital to NRG, net of change in cash contributions from NRG | $ | 248 |
|
| Contributions from tax equity investors in 2014 | 190 |
|
| Increase in proceeds from the issuance of Class A common stock on July 29, 2014, compared to the prior year initial public offering | 162 |
|
| Increase in dividends paid in 2014 compared to 2013 | (86 | ) |
| Increase in cash received from issuance of Senior Notes and other long-term debt, partially offset by higher principal payments in 2014 compared to 2013 | 178 |
|
| Increase in cash paid for deferred financing costs | (31 | ) |
| | $ | 661 |
|
|
| | | |
| Changes in net cash provided by financing activities were driven by: | (In millions) |
| Lower payments of dividends and returns of capital to NRG, partially offset by contributions from NRG in 2014 | $ | 274 |
|
| Lower contributions from tax equity investors in 2015 | (68 | ) |
| Lower net proceeds from Class C equity offering on June 29, 2015 compared to the net proceeds from Class A equity offering on July 29, 2014 | (31 | ) |
| Increase in dividends paid to common stockholders | (38 | ) |
| Lower net proceeds from the revolving credit facility in 2015 compared to 2014 | (194 | ) |
| A decrease in proceeds from long-term debt, as well as an increase in debt payments, in 2015 compared to 2014 | (328 | ) |
| Decrease in debt issuance costs due to lower borrowing in 2015 | 23 |
|
| | $ | (362 | ) |
NOLs, Deferred Tax Assets and Uncertain Tax Position Implications, under ASC 740
As of December 31, 2015,2016, the Company has a cumulative federal NOL carry forward balance of $519$648 million for financial statement purposes, which will begin expiring in 2033, and does not anticipate any federal income tax payments for 2016.2017. As a result of the Company's tax position, and based on current forecasts, the Company does not anticipate significant income tax payments for state and local jurisdictions in 2016.2017. Based on the Company's current and expected NOL balances generated primarily by accelerated tax depreciation of its property, plant and equipment, the Company does not expect to pay significant federal income tax for a period of approximately nineten years.
The Company has no uncertain tax benefits.
Off-Balance Sheet Arrangements
Obligations under Certain Guarantee Contracts
The Company may enter into guarantee arrangements in the normal course of business to facilitate commercial transactions with third parties.
Retained or Contingent Interests
The Company does not have any material retained or contingent interests in assets transferred to an unconsolidated entity.
Obligations Arising Out of a Variable Interest in an Unconsolidated Entity
Variable interest in equity investments — As of December 31, 20152016, the Company has several investments with an ownership interest percentage of 50% or less in energy and energy-related entities that are accounted for under the equity method. NRG DGPV Holdco 1 LLC, NRG DGPV Holdco 2 LLC, NRG RPV Holdco 1 LLC and GenConn are variable interest entities for which the Company is not the primary beneficiary.
The Company's pro-rata share of non-recourse debt held by unconsolidated affiliates was approximately $842$453 million as of December 31, 20152016. This indebtedness may restrict the ability of these subsidiaries to issue dividends or distributions to the Company. See also Item 15 — Note 5, Investments Accounted for by the Equity Method and Variable Interest Entities, to the Consolidated Financial Statements.
Contractual Obligations and Commercial Commitments
The Company has a variety of contractual obligations and other commercial commitments that represent prospective cash requirements in addition to the Company's capital expenditure programs. The following table summarizes the Company's contractual obligations. See Item 15 — Note 9,10, Long-term Debt and Note 15,16, Commitments and Contingencies, to the Consolidated Financial Statements for additional discussion.
| | | | By Remaining Maturity at December 31, | By Remaining Maturity at December 31, |
| | 2015 | | 2014 | 2016 | | 2015 |
| Contractual Cash Obligations | Under 1 Year | | 1-3 Years | | 3-5 Years | | Over 5 Years | | Total | | Total | Under 1 Year | | 1-3 Years | | 3-5 Years | | Over 5 Years | | Total | | Total |
| | (In millions) | (In millions) |
| Long-term debt (including estimated interest) | $ | 409 |
| | $ | 836 |
| | $ | 1,781 |
| | $ | 2,902 |
| | $ | 5,928 |
| | $ | 7,353 |
| $ | 554 |
| | $ | 1,439 |
| | $ | 1,475 |
| | $ | 4,412 |
| | $ | 7,880 |
| | $ | 7,016 |
|
| Operating leases | 12 |
| | 18 |
| | 17 |
| | 135 |
| | 182 |
| | 203 |
| 9 |
| | 19 |
| | 18 |
| | 152 |
| | 198 |
| | 219 |
|
| Fuel purchase and transportation obligations | 12 |
| | 9 |
| | 6 |
| | 21 |
| | 48 |
| | 53 |
| 13 |
| | 7 |
| | 6 |
| | 19 |
| | 45 |
| | 48 |
|
Other liabilities | 9 |
| | 18 |
| | 16 |
| | 62 |
| | 105 |
| | 118 |
| 14 |
| | 22 |
| | 21 |
| | 72 |
| | 129 |
| | 105 |
|
| Total | $ | 442 |
| | $ | 881 |
| | $ | 1,820 |
| | $ | 3,120 |
| | $ | 6,263 |
| | $ | 7,727 |
| $ | 590 |
| | $ | 1,487 |
| | $ | 1,520 |
| | $ | 4,655 |
| | $ | 8,252 |
| | $ | 7,388 |
|
(a) Includes water right agreements, service and maintenance agreements, and LTSA commitments.
Fair Value of Derivative Instruments
The Company may enter into fuel purchase contracts and other energy-related financial instruments to mitigate variability in earnings due to fluctuations in spot market prices and to hedge fuel requirements at certain generation facilities. In addition, in order to mitigate interest rate risk associated with the issuance of variable rate debt, the Company enters into interest rate swap agreements.
The tables below disclose the activities of non-exchange traded contracts accounted for at fair value in accordance with ASC 820. Specifically, these tables disaggregate realized and unrealized changes in fair value; disaggregate estimated fair values at December 31, 20152016, based on their level within the fair value hierarchy defined in ASC 820; and indicate the maturities of contracts at December 31, 20152016. For a full discussion of the Company's valuation methodology of its contracts, see Derivative Fair Value Measurements in Item 15 — Note 6, Fair Value of Financial Instruments, to the Consolidated Financial Statements.
| | | Derivative Activity (Losses)/Gains | (In millions) | (In millions) |
| Fair value of contracts as of December 31, 2014 | $ | (125 | ) | |
| Fair value of contracts as of December 31, 2015 | | $ | (100 | ) |
| Contracts realized or otherwise settled during the period | 64 |
| 37 |
|
| Changes in fair value | (39 | ) | (6 | ) |
| Fair Value of contracts as of December 31, 2015 | $ | (100 | ) | |
| Fair value of contracts as of December 31, 2016 | | $ | (69 | ) |
| | | | Fair Value of contracts as of December 31, 2015 | Fair value of contracts as of December 31, 2016 |
| | Maturity | | | Maturity | | |
| Fair Value Hierarchy Losses | 1 Year or Less | | Greater Than 1 Year to 3 Years | | Greater Than 3 Years to 5 Years | | Greater Than 5 Years | | Total Fair Value | 1 Year or Less | | Greater Than 1 Year to 3 Years | | Greater Than 3 Years to 5 Years | | Greater Than 5 Years | | Total Fair Value |
| | (In millions) | (In millions) |
| Level 1 | | $ | 1 |
| | $ | — |
| | $ | — |
| | $ | — |
| | $ | 1 |
|
| Level 2 | $ | (39 | ) | | $ | (38 | ) | | $ | (15 | ) | | $ | (8 | ) | | $ | (100 | ) | (28 | ) | | (27 | ) | | (9 | ) | | (6 | ) | | (70 | ) |
| Total | | $ | (27 | ) | | $ | (27 | ) | | $ | (9 | ) | | $ | (6 | ) | | $ | (69 | ) |
The Company has elected to disclose derivative assets and liabilities on a trade-by-trade basis and does not offset amounts at the counterparty master agreement level. As discussed below in Quantitative and Qualitative Disclosures about Market Risk -Commodity Price Risk, NRG, on behalf of the Company, measures the sensitivity of the portfolio to potential changes in market prices using VaR, a statistical model which attempts to predict risk of loss based on market price and volatility. NRG's risk management policy places a limit on one-day holding period VaR, which limits the net open position.
Critical Accounting Policies and Estimates
The Company's discussion and analysis of the financial condition and results of operations are based upon the consolidated financial statements, which have been prepared in accordance with U.S. GAAP. The preparation of these financial statements and related disclosures in compliance with U.S. GAAP requires the application of appropriate technical accounting rules and guidance as well as the use of estimates and judgments that affect the reported amounts of assets, liabilities, revenues and expenses, and related disclosures of contingent assets and liabilities. The application of these policies necessarily involves judgments regarding future events, including the likelihood of success of particular projects, legal and regulatory challenges, and the fair value of certain assets and liabilities. These judgments, in and of themselves, could materially affect the financial statements and disclosures based on varying assumptions, which may be appropriate to use. In addition, the financial and operating environment may also have a significant effect, not only on the operation of the business, but on the results reported through the application of accounting measures used in preparing the financial statements and related disclosures, even if the nature of the accounting policies has not changed.
On an ongoing basis, the Company evaluates these estimates, utilizing historic experience, consultation with experts and other methods the Company considers reasonable. In any event, actualActual results may differ substantially from the Company's estimates. Any effects on the Company's business, financial position or results of operations resulting from revisions to these estimates are recorded in the period in which the information that gives rise to the revision becomes known.
The Company's significant accounting policies are summarized in Item 15 — Note 2, Summary of Significant Accounting Policies, to the Consolidated Financial Statements. The Company identifies its most critical accounting policies as those that are the most pervasive and important to the portrayal of the Company's financial position and results of operations, and that require the most difficult, subjective and/or complex judgments by management regarding estimates about matters that are inherently uncertain. The Company's critical accounting policies include income taxes and valuation allowance for deferred tax assets, impairment of long lived assets and other intangible assets and acquisition accounting.
|
| |
| Accounting Policy | Judgments/Uncertainties Affecting Application |
| | |
| Income Taxes and Valuation Allowance for Deferred Tax Assets | Ability to withstand legal challenges of tax authority decisions or appeals |
| | Anticipated future decisions of tax authorities |
| | Application of tax statutes and regulations to transactions |
| | Ability to utilize tax benefits through carry backs to prior periods and carry forwards to future periods |
| Impairment of Long Lived Assets | Recoverability of investments through future operations |
| | Regulatory and political environments and requirements |
| | Estimated useful lives of assets |
| | Operational limitations and environmental obligations |
| | Estimates of future cash flows |
| | Estimates of fair value |
| | Judgment about triggering events |
| Acquisition Accounting | Identification of intangible assets acquired |
| | Inputs for fair value of assets and liabilities acquired |
| | Application of various methodologies |
Income Taxes and Valuation Allowance for Deferred Tax Assets
In assessingAs of December 31, 2016, the recoverabilityCompany had a valuation allowance of $16 million related to a deferred tax assets,asset expected to result in a capital loss for which no existing capital gains or tax planning strategies to utilize the asset in the future are available. Other than for this expected capital loss, the Company considers whetherbelieves it is more likely than not that some portion or allthe results of future operations will generate sufficient taxable income which includes the future reversal of existing taxable temporary differences to realize deferred tax assets will be realized.assets. The Company considered the profit before tax generated in recent years, as well as projections of future earnings and estimates of taxable income in arriving at this conclusion. The realization of deferred tax assets is primarily dependent upon earnings in federal and various state and local jurisdictions.
The Company's operating entities, as former subsidiaries of NRG, continue to be under audit for multiple years by taxing authorities in other jurisdictions. Considerable judgment is required to determine the tax treatment of a particular item that involves interpretations of complex tax laws. The project-level entities, as former subsidiaries of NRG, are subject to examination by taxing authorities for income tax returns filed in the U.S. federal jurisdiction and various state and local jurisdictions. NRGThe Company is no longer subject to U.S. federal, income tax examinations for years prior to 2012. With few exceptions, state and local income tax examinations are no longer open for all years before 2009.beginning in 2013.
Evaluation of Assets for Impairment and Other Than TemporaryOther-Than-Temporary Decline in Value
In accordance with ASC 360, Property, Plant, and Equipment, or ASC 360, property, plant and equipment and certain intangible assets are evaluated for impairment whenever indicators of impairment exist. Examples of such indicators or events are:
Significant decrease in the market price of a long-lived asset;
Significant adverse change in the manner an asset is being used or its physical condition;
Adverse business climate;
Accumulation of costs significantly in excess of the amount originally expected for the construction or acquisition of an asset;
Current-period loss combined with a history of losses or the projection of future losses; and
Change in the Company's intent about an asset from an intent to hold to a greater than 50% likelihood that an asset will be sold or disposed of before the end of its previously estimated useful life.
Recoverability of assets to be held and used is measured by a comparison of the carrying amount of the assets to the future net cash flows expected to be generated by the asset, through considering project specific assumptions for long-term power pool prices, escalated future project operating costs and expected plant operations. If such assets are considered to be impaired, the impairment to be recognized is measured by the amount by which the carrying amount of the assets exceeds the fair value of the assetsassets. The fair value may be determined by factoring in the probability weighting of different courses of action available to us.the Company as appropriate. Generally, fair value will be determined using valuation techniques such as the present value of expected future cash flows. The Company uses its best estimates in making these evaluations and considers various factors, including forward price curves for energy, fuel costs and operating costs. However, actual future market prices and project costs could vary from the assumptions used in the Company's estimates, and the impact of such variations could be material.
Annually, during the fourth quarter, the Company revises its views of power prices, including the Company's fundamental view for long-term power prices, forecasted generation and operating and capital expenditures, in connection with the preparation of its annual budget.
The Company recorded certain long-lived asset impairments in 2016, as described in Item 15 — Note 9, Asset Impairments, to the Consolidated Financial Statements, with respect to several wind projects that were acquired in connection with the acquisition of the November 2015 Drop Down Assets. Because the projects were acquired from NRG, they were recorded at historical cost rather than fair value. The historical cost of the assets was higher than its fair value at the date the interests under common control were acquired, as described in Item 15 — Note 3, Business Acquisitions, to the Consolidated Financial Statements.
During the fourth quarter of 2016, as the Company updated its estimated cash flows in connection with the preparation and review of the Company's annual budget, the Company determined that the cash flows for the Elbow Creek and Goat Wind projects located in Texas and the Forward project in Pennsylvania were below the carrying value (historical cost transferred under common control) of the related assets, primarily driven by declining merchant power prices in post-contract periods, and that the assets were considered impaired. The fair value of the facilities was determined using an income approach by applying a discounted cash flow methodology to the long-term budgets for each respective plant. The income approach utilizes estimates of discounted future cash flows, which include key inputs, such as forecasted power prices, operations and maintenance expense, and discount rates. The Company measured the impairment loss as the difference between the carrying amount and the fair value of the assets and recorded impairment losses of $117 million, $60 million and $6 million for Elbow Creek, Goat Wind and Forward, respectively.
The Company is also required to evaluate its equity method investments to determine whether or not they are impaired. ASC 323, Investments - Equity Method and Joint Ventures, or ASC 323, provides the accounting requirements for these investments. The standard for determining whether an impairment must be recorded under ASC 323 is whether the value is considered to be an "other than a temporary"other-than-temporary decline in value. The evaluation and measurement of impairments under ASC 323 involves the same uncertainties as described for long-lived assets that the Company owns directly and accounts for in accordance with ASC 360. Similarly, the estimates that the Company makes with respect to its equity method investments are subjective, and the impact of variations in these estimates could be material. Additionally, if the projects in which the Company holds these investments recognize an impairment under the provisions of ASC 360, the Company would record its proportionate share of that impairment loss and would evaluate its investment for an other than temporaryother-than-temporary decline in value under ASC 323.
Certain of the Company’s projects have useful lives that extend well beyond the contract period and therefore, management’s view of long-term power prices in the post-contract periods may have a significant impact on the expected future cash flows for these projects. Accordingly, if management’s view of long-term power prices in certain markets continues to decrease, it is possible that some of the Company’s other long-lived assets may be impaired.
Acquisition Accounting
The Company applies ASC 805, Business Combinations, when accounting for the acquisition of a business, with identifiable assets acquired and liabilities assumed recorded at their estimated fair values on the acquisition date. The Company completes the accounting for an acquisition when the evaluations are completed to the extent that additional information is obtained about the facts and circumstances that existed as of the acquisition date. The allocation of the purchase price may be modified up to one year from the date of the acquisition as more information is obtained about the fair value of assets acquired and liabilities assumed. Consideration is measured based on fair value of the assets transferred to the seller.
Significant judgment is required in determining the acquisition date fair value of the assets acquired and liabilities assumed, predominantly with respect to property, plant and equipment, power purchase agreements, asset retirement obligations and other contractual arrangements. Evaluations include numerous inputs including forecasted cash flows that incorporate the specific attributes of each asset including age, useful life, equipment condition and technology, as well as current replacement costs for similar assets. Other key inputs that require judgment include discount rates, comparable market transactions, estimated useful lives and probability of future transactions. The Company evaluates all available information, as well as all appropriate methodologies when determining the fair value of assets acquired and liabilities assumed in a business combination. In addition, once the appropriate fair values are determined, the Company must determine the remaining useful life for property, plant and equipment and the amortization period and method of amortization for each finite-lived intangible asset.
The Company must apply ASC 805-50, Business Combinations - Related Issues, when it acquires an interest from NRG. The assets and liabilities transferred to the Company related to interests under common control by NRG must be recorded at historical cost, with the difference between the amount paid and the historical value of the related equity recorded as a distribution to or contribution from NRG with the offset to noncontrolling interest. Economics may change in the years subsequent to NRG’s construction or acquisition of certain assets, and although the Company may acquire these assets from NRG based on a different valuation, the Company must record the assets at historical cost. These changes in economics may impact the amount that the Company pays for the assets but will not alter the carrying amount. Accordingly, significant changes in the economics related to these assets may trigger a requirement for impairment testing.
Recent Accounting Developments
See Item 15 — Note 2, Summary of Significant Accounting Policies, to the Consolidated Financial Statements for a discussion of recent accounting developments.
Item 7A — Quantitative and Qualitative Disclosures About Market Risk
The Company is exposed to several market risks in its normal business activities. Market risk is the potential loss that may result from market changes associated with the Company's power generation or with an existing or forecasted financial or commodity transaction. The types of market risks the Company is exposed to are commodity price risk, interest rate risk, liquidity risk, and credit risk.
Commodity Price Risk
Commodity price risks result from exposures to changes in spot prices, forward prices, volatilities, and correlations between various commodities, such as electricity, natural gas and emissions credits. The Company manages the commodity price risk of its merchant generation operations by entering into derivative or non-derivative instruments to hedge the variability in future cash flows from forecasted power sales or purchases of fuel. The portion of forecasted transactions hedged may vary based upon management's assessment of market, weather, operation and other factors. See item 15 — Note 7, Accounting for Derivative Instruments and Hedging Activities, to the Consolidated Financial Statements for more information.
Based on a sensitivity analysis using simplified assumptions, the impact of a $0.50 per MMBtu increase or decrease in natural gas prices across the term of the derivative contracts would cause a change of approximately $2$1 million in the net value of derivatives as of December 31, 20152016.
Interest Rate Risk
The Company is exposed to fluctuations in interest rates through its issuance of variable rate debt. Exposures to interest rate fluctuations may be mitigated by entering into derivative instruments known as interest rate swaps, caps, collars and put or call options. These contracts reduce exposure to interest rate volatility and result in primarily fixed rate debt obligations when taking into account the combination of the variable rate debt and the interest rate derivative instrument. NRG's risk management policies allow the Company to reduce interest rate exposure from variable rate debt obligations. See item 15 — Note 7, Accounting for Derivative Instruments and Hedging Activities, to the Consolidated Financial Statements for more information.
Most of the Company's project subsidiaries enter into interest rate swaps, intended to hedge the risks associated with interest rates on non-recourse project level debt. See Item 15 — Note 910, Long-term Debt, to the Consolidated Financial Statements for more information about interest rate swaps of the Company's project subsidiaries.
If all of the above swaps had been discontinued on December 31, 20152016, the Company would have owed the counterparties $101$72 million. Based on the investment grade ratingcredit ratings of the counterparties, the Company believes its exposure to credit risk due to nonperformance by counterparties to its hedge contracts to be insignificant.
The Company has long-term debt instruments that subject it to the risk of loss associated with movements in market interest rates. As of December 31, 20152016, a 1% change in interest rates would result in an approximately $3 million change in market interest expense on a rolling twelve monthtwelve-month basis.
As of December 31, 20152016, the fair value of the Company's debt was $4,745$5,769 million and the carrying value was $4,863$5,770 million. The Company estimates that a 1% decrease in market interest rates would have increased the fair value of its long-term debt by $331$476 million.
Liquidity Risk
Liquidity risk arises from the general funding needs of the Company's activities and in the management of the Company's assets and liabilities.
Counterparty Credit Risk
Credit risk relates to the risk of loss resulting from non-performance or non-payment by counterparties pursuant to the terms of their contractual obligations. The Company monitors and manages credit risk through credit policies that include: (i) an established credit approval process, and (ii) the use of credit mitigation measures such as prepayment arrangements or volumetric limits. Risks surrounding counterparty performance and credit could ultimately impact the amount and timing of expected cash flows. The Company seeks to mitigate counterparty risk by having a diversified portfolio of counterparties. See Item 15 — Note 1, Nature of Business, and Note 6, Fair Value of Financial Instruments, to the Consolidated Financial Statements for more information about concentration of credit risk.
Item 8 — Financial Statements and Supplementary Data
The financial statements and schedules are listed in Part IV, Item 15 of this Form 10-K.
Item 9 — Changes in and Disagreements with Accountants on Accounting and Financial Disclosure
None.
Item 9A — Controls and Procedures
Conclusion Regarding the Effectiveness of Disclosure Controls and Procedures and Internal Control Over Financial Reporting
Under the supervision and with the participation of the Company's management, including its principal executive officer, principal financial officer and principal accounting officer, the Company conducted an evaluation of the effectiveness of the design and operation of its disclosure controls and procedures, as such term is defined in Rules 13a-15(e) or 15d-15(e) of the Exchange Act. Based on this evaluation, the Company's principal executive officer, principal financial officer and principal accounting officer concluded that the disclosure controls and procedures were effective as of the end of the period covered by this report on Form 10-K.
Changes in Internal Control over Financial Reporting
There were no changes in the Company’s internal control over financial reporting (as such term is defined in Rule 13a-15(f) under the Exchange Act) that occurred in the fourth quarter of 20152016 that materially affected, or are reasonably likely to materially affect, the Company’s internal control over financial reporting.
Inherent Limitations over Internal Controls
The Company's internal control over financial reporting is designed to provide reasonable assurance regarding the reliability of financial reporting and the preparation of consolidated financial statements for external purposes in accordance with U.S. GAAP. The Company's internal control over financial reporting includes those policies and procedures that:
1. Pertain to the maintenance of records that, in reasonable detail, accurately and fairly reflect the transactions and dispositions of the Company's assets;
2. Provide reasonable assurance that transactions are recorded as necessary to permit preparation of consolidated financial statements in accordance with U.S. GAAP, and that the Company's receipts and expenditures are being made only in accordance with authorizations of its management and directors; and
3. Provide reasonable assurance regarding prevention or timely detection of unauthorized acquisition, use or disposition of the Company's assets that could have a material effect on the consolidated financial statements.
Internal control over financial reporting cannot provide absolute assurance of achieving financial reporting objectives because of its inherent limitations, including the possibility of human error and circumvention by collusion or overriding of controls. Accordingly, even an effective internal control system may not prevent or detect material misstatements on a timely basis. Also, projections of any evaluation of effectiveness to future periods are subject to the risk that controls may become inadequate because of changes in conditions or that the degree of compliance with the policies or procedures may deteriorate.
Management's Report on Internal Control over Financial Reporting
The Company's management is responsible for establishing and maintaining adequate internal control over financial reporting, as such term is defined in Exchange Act Rule 13a-15(f). Under the supervision and with the participation of the Company's management, including its principal executive officer, principal financial officer and principal accounting officer, the Company conducted an evaluation of the effectiveness of its internal control over financial reporting based on the framework in Internal Control — Integrated Framework (2013) issued by the Committee of Sponsoring Organizations of the Treadway Commission. Based on the Company's evaluation under the framework in Internal Control — Integrated Framework (2013), the Company's management concluded that its internal control over financial reporting was effective as of December 31, 2015.2016.
The effectiveness of the Company's internal control over financial reporting as of December 31, 2015,2016, has been audited by KPMG LLP, the Company's independent registered public accounting firm, as stated in its report which is included in this Form 10-K.
REPORT OF INDEPENDENT REGISTERED PUBLIC ACCOUNTING FIRM
The Board of Directors and Stockholders
NRG Yield, Inc.:
We have audited NRG Yield, Inc.’s internal control over financial reporting as of December 31, 2015,2016, based on criteria established in Internal Control — Integrated Framework (2013) issued by the Committee of Sponsoring Organizations of the Treadway Commission (COSO). NRG Yield, Inc.’s management is responsible for maintaining effective internal control over financial reporting and for its assessment of the effectiveness of internal control over financial reporting, included in the accompanying Management’s Report on Internal Control over Financial Reporting. Our responsibility is to express an opinion on the Company’s internal control over financial reporting based on our audit.
We conducted our audit in accordance with the standards of the Public Company Accounting Oversight Board (United States). Those standards require that we plan and perform the audit to obtain reasonable assurance about whether effective internal control over financial reporting was maintained in all material respects. Our audit included obtaining an understanding of internal control over financial reporting, assessing the risk that a material weakness exists, and testing and evaluating the design and operating effectiveness of internal control based on the assessed risk. Our audit also included performing such other procedures as we considered necessary in the circumstances. We believe that our audit provides a reasonable basis for our opinion.
A company’s internal control over financial reporting is a process designed to provide reasonable assurance regarding the reliability of financial reporting and the preparation of financial statements for external purposes in accordance with generally accepted accounting principles. A company’s internal control over financial reporting includes those policies and procedures that (1) pertain to the maintenance of records that, in reasonable detail, accurately and fairly reflect the transactions and dispositions of the assets of the company; (2) provide reasonable assurance that transactions are recorded as necessary to permit preparation of financial statements in accordance with generally accepted accounting principles, and that receipts and expenditures of the company are being made only in accordance with authorizations of management and directors of the company; and (3) provide reasonable assurance regarding prevention or timely detection of unauthorized acquisition, use, or disposition of the company’s assets that could have a material effect on the financial statements.
Because of its inherent limitations, internal control over financial reporting may not prevent or detect misstatements. Also, projections of any evaluation of effectiveness to future periods are subject to the risk that controls may become inadequate because of changes in conditions, or that the degree of compliance with the policies or procedures may deteriorate.
In our opinion, NRG Yield, Inc. maintained, in all material respects, effective internal control over financial reporting as of December 31, 2015,2016, based on criteria established in Internal Control — Integrated Framework (2013) issued by the Committee of Sponsoring Organizations of the Treadway Commission.
We also have audited, in accordance with the standards of the Public Company Accounting Oversight Board (United States), the consolidated balance sheets of NRG Yield, Inc. and subsidiaries as of December 31, 20152016 and 2014,2015, and the related consolidated statements of income,operations, comprehensive (loss) income, stockholders’ equity, and cash flows for each of the years in the three-year period ended December 31, 2015,2016, and our report dated February 29, 2016,28, 2017, expressed an unqualified opinion on those consolidated financial statements.
(signed) KPMG LLP
Philadelphia, PA
February 29, 201628, 2017
Item 9B — Other Information
On February 23, 2016, the Company filed a Certificate of Correction of the Company’s Second Amended and Restated Certificate of Incorporation with the Secretary of State of the State of Delaware. The Certificate of Correction was filed to clarify that the voting standards for director election and director removal are based on the proportion of “votes entitled to be cast” by the holders of the Company’s common stock, which is consistent with the voting scheme adopted by the Company's stockholders at the annual stockholder meeting approving the Recapitalization. The Certificate of Correction became effective upon filing.None.
A copy of the Certificate of Correction, as filed with the Secretary of State of the State of Delaware on February 23, 2016, is attached as Exhibit 3.3 to this Annual Report on Form 10-K and is incorporated herein by reference.
Also on February 23, 2016, the Company's Third Amended and Restated Bylaws became effective. The Third Amended and Restated Bylaws were adopted to clarify that a quorum for stockholder meetings is based on a majority of the voting power of the capital stock of the Company.
A copy of the Third Amended and Restated Bylaws is attached as Exhibit 3.4 to this Annual Report on Form 10-K and is incorporated herein by reference.
PART III
Item 10 — Directors, Executive Officers and Corporate Governance
Directors
Kirkland B. Andrews has served as Executive Vice President, Chief Financial Officer anda director since the Company's formation in December 2012. Mr. Andrews served as Executive Vice President and Chief Financial Officer of the Company from December 2012 to November 2016. Mr. Andrews has served as Executive Vice President and Chief Financial Officer of NRG Energy since September 2011. Prior to joining NRG, he served as Managing Director and Co-Head Investment Banking, Power and Utilities—Americas at Deutsche Bank Securities from June 2009 to September 2011. Prior to this, he served in several capacities at Citigroup Global Markets Inc., including Managing Director, Group Head, North American Power from November 2007 to June 2009, and Head of Power M&A, Mergers and Acquisitions from July 2005 to November 2007. In his banking career, Mr. Andrews led multiple large and innovative strategic, debt, equity and commodities transactions. Mr. Andrews’ extensive investment banking experience, specifically in the energy industry and financial structuring, brings important experience and skills to the Company’s board of directors.
John Chillemi has served as a director of the Company since May 2016. Mr. Chillemi has also served as Executive Vice President, National Business Development of NRG since December 2015. In this role, Mr. Chillemi is responsible for all wholesale generation development activities for NRG across the nation. Prior to December 2015, Mr. Chillemi was Senior Vice President and Regional President, West since NRG’s acquisition of GenOn Energy, Inc., or GenOn, in December 2012. Mr. Chillemi served as the Regional President in California and the West for GenOn from December 2010 to December 2012, and as President and Vice President of the West at Mirant Corporation from 2007 December 2010. Mr. Chillemi has 30 years of power industry experience, beginning with Georgia Power in 1986. Mr. Chillemi’s knowledge of the Company’s assets, operations and businesses bring important experience and skills to the Company’s board of directors.
John F. Chlebowski is the Company's Lead Independent Director and has been a director since July 2013.Mr. Chlebowski served as the Company's Interim Chairman of the Board sincefrom December 2015 and a director since July 2013.to May 2016. Mr. Chlebowski had been a director of NRG from December 2003 to July 2013. Mr. Chlebowski served as the President and Chief Executive Officer of Lakeshore Operating Partners, LLC, a bulk liquid distribution firm, from March 2000 until his retirement in December 2004. From July 1999 until March 2000, Mr. Chlebowski was a senior executive and cofounder of Lakeshore Liquids Operating Partners, LLC, a private venture firm in the bulk liquid distribution and logistics business, and from January 1998 until July 1999, he was a private investor and consultant in bulk liquid distribution. From 1994 until 1997, he was the President and Chief Executive Officer of GATX Terminals Corporation, a subsidiary of GATX Corporation. Prior to that, he served as Vice President of Finance and Chief Financial Officer of GATX Corporation from 1986 to 1994. Mr. Chlebowski is a director of First Midwest Bancorp Inc. andMr. Chlebowski also served as the Non-Executive Chairman of SemGroup Corporation.Corporation from December 2009 until January 2017. Mr. Chlebowski also served as a director of Laidlaw International, Inc. from June 2003 until October 2007, SpectraSite, Inc. from June 2004 until August 2005, and Phosphate Resource Partners Limited Partnership from June 2004 until August 2005. Mr. Chlebowski’s extensive leadership and financial expertise, as a result of his position as a former chief executive officer and his service on several boards of companies involved in the restructuring or recovery of their core business, enable him to contribute to the board of directors' significant managerial, strategic, and financial oversight skills. Furthermore, Mr. Chlebowski’s service on other public boards, notably as a non-executive Chairman, provides valuable insight into the application of various governance principals to the Company’s board of directors.
Brian R. Ford has served as a director since July 2013. Mr. Ford was the Chief Executive Officer of Washington Philadelphia Partners, LP, a real estate investment company, from 2008 through 2010. He retired as a partner from Ernst & Young LLP in June 2008 where he had been employed since 1971. Mr. Ford currently serves on the board of various public companies: GulfMark Offshore, Inc., a global provider of marine transportation, since 2009, where he also serves as the chairman of the audit committee and as a member of the governance nominating committee; AmeriGas Propane, Inc., a propane company, since 2013, where he also serves as a member of its audit committee and corporate governance committee; FS Investment Corporation III, a specialty finance company that invests primarily in the debt securities of private U.S. middle-market companies, since 2013, where he also serves as the chairman of the audit committee. He also serves on the boardsboard of Drexel University and Drexel University College of Medicine.University. Mr. Ford received his B.S. in Economics from Rutgers University. Mr. Ford's extensive experience in accounting and public company matters provides strong financial, audit and accounting skills to the Company's board of directors.
Mauricio Gutierrez has served as Interim President and Chief Executive OfficerChairman of the board of directors of the Company since December 2015,May 2016, and a director since the Company's formation in December 2012. From December 2015 to May 2016, Mr. Gutierrez was the Interim President and Chief Executive Officer of the Company. From December 2012 to December 2015, Mr. Gutierrez was the Executive Vice President and Chief Operating Officer of the Company. Mr. Gutierrez has also served as President and Chief Executive Officer of NRG since December 2015. Prior to December 2015, Mr. Gutierrez was the Executive Vice President and Chief Operating Officer of NRG from July 2010 to December 2015. Mr. Gutierrez has been with NRG since August 2004 and served in multiple executive positions within NRG including Executive Vice President - Commercial Operations of NRG from January 2009 to July 2010 and Senior Vice President - Commercial Operations of NRG from March 2008 to January 2009. Prior to joining NRG in August 2004, Mr. Gutierrez held various commercial positions within Dynegy, Inc. Mr. Gutierrez’s knowledge of the Company’s assets, operations and businesses bring important experience and skills to the Company’s board of directors.
Ferrell P. McClean has served as a director since July 2013. Ms. McClean was a Managing Director and the Senior Advisor to the head of the Global Oil & Gas Group in Investment Banking at J.P. Morgan Chase & Co. from 2000 through the end of 2001. She joined J.P. Morgan & Co. Incorporated in 1969 and founded the Leveraged Buyout and Restructuring Group within the Mergers & Acquisitions Group in 1986. From 1991 until 2000, Ms. McClean was a Managing Director and co-headed the Global Energy Group within the Investment Banking Group at J.P. Morgan & Co. She retired as a director of GrafTech International in 2014, El Paso Corporation in 2012 and Unocal Corporation in 2005. Ms. McClean's experience in investment banking for industrial companies as well as her experience and understanding of financial accounting, finance and disclosure matters enables her to provide essential guidance to the Company's board of directors and management team.
Christopher S. Sotos has served as President and Chief Executive Officer of the Company since May 2016, and as a director since May 2013. Mr. Sotos has also served in various positions at NRG, including most recently as SeniorExecutive Vice President—President - Strategy and Mergers and Acquisitions of NRG sincefrom February 2016 through May 2016 and Senior Vice President - Strategy and Mergers and Acquisitions from November 2012.2012 through February 2016. In this role, he led NRG’s corporate strategy, mergers and acquisitions, strategic alliances and other special projects for NRG. Previously, he served as NRG'sNRG’s Senior Vice President and Treasurer from March 2008 to September 2012. In this role,2012, where he was responsible for all treasury functions, including raising capital, valuation, debt administration and cash management. Mr. Sotos joined NRG in 2004 as a Senior Finance Analyst, following more than nine years in key financial roles within the energy sector and other industries for Houston-based companies such as Koch Capital Markets, Entergy Wholesale Operations and Service Corporation International. Mr. Sotos also serves on the board of FuelCell Energy, Inc. As President and Chief Executive Officer of the Company, Mr. Sotos provides the Company's Board with management’s perspective regarding the Company’s day to day operations and overall strategic plan. Mr. Sotos also brings strong financial and accounting skills to the Company's board of directors.Board.
Executive Officers
Christopher S. Sotoshas served as President and Chief Executive Officer of the Company since May 2016, and as a director of the Company since May 2013. For additional biographical information for Messrs. Gutierrez and Andrews,Mr. Sotos, see above under “Directors.”
Chad Plotkin has served as Senior Vice President and Chief Financial Officer of the Company since November 2016. Mr. Plotkin was employed by NRG for over nine years, most recently serving as Senior Vice President, Finance and Strategy, for the Company since January 2016. Prior to this, Mr. Plotkin served as Vice President, Investor Relations of the Company and of NRG from September 2015 to January 2016. Mr. Plotkin served as Vice President of Finance of NRG from February 2015 to September 2015. From January 2012 until February 2015, Mr. Plotkin served as Vice President, Investor Relations of NRG and the Company following the Company's initial public offering in July 2013. From October 2007 to January 2012, Mr. Plotkin served in various capacities in the Strategy and Mergers and Acquisitions group of NRG, including as Vice President, beginning in December 2010.
David Callen has served as Vice President and Chief Accounting Officer since March 2015. In this capacity, Mr. Callen is responsible for directing the Company's financial accounting and reporting activities. Mr. Callen also has served as Senior Vice President and Chief Accounting Officer of NRG since February 2016 and Vice President and Chief Accounting Officer from March 2015 to February 2016. Prior to this, Mr. Callen served as NRG's Vice President, Financial Planning & Analysis from November 2010 to March 2015. He previously served as Director, Finance from October 2007 through October 2010, Director, Financial Reporting from February 2006 through October 2007, and Manager, Accounting Research from September 2004 through February 2006. Prior to NRG, Mr. Callen was an auditor for KPMG LLP in both New York City and Tel Aviv, Israel, from October 1996 through April 2001.
David R. Hill has served as Executive Vice President and General Counsel since the Company's formation in December 2012. Mr. Hill has served as Executive Vice President and General Counsel of NRG since September 2012. Prior to joining NRG, Mr. Hill was a partner and co-head of Sidley Austin LLP's global energy practice group from February 2009 to August 2012. Prior to joining Sidley Austin, Mr. Hill served as General Counsel of the U.S. Department of Energy from August 2005 to January 2009 and, for the three years prior to that, as Deputy General Counsel for Energy Policy of the U.S. DOE. Prior to his federal government services, Mr. Hill was a partner at major law firms in Washington D.C. and Kansas City, Missouri, and handled a variety of regulatory, litigation and corporate matters.
Code of Ethics
The Company has adopted a code of ethics entitled "NRG Yield Code of Conduct" that applies to directors and officers of the Company. It may be accessed through the "Corporate Governance" section of the Company's website at http://www.nrgyield.com. The Company also elects to disclose the information required by Form 8-K, Item 5.05, "Amendments to the Registrant's Code of Ethics, or Waiver of a Provision of the Code of Ethics," through the Company's website, and such information will remain available on this website for at least a 12-month period. A copy of the "NRG Yield, Inc. Code of Conduct" is available in print to any stockholder who requests it.
Other information required by this Item will be incorporated by reference to the similarly named section of the Company's Definitive Proxy Statement for its 20162017 Annual Meeting of Stockholders.
Item 11 — Executive Compensation
Information required by this Item will be incorporated by reference to the similarly named section of the Company's Definitive Proxy Statement for its 20162017 Annual Meeting of Stockholders.
Item 12 — Security Ownership of Certain Beneficial Owners and Management and Related Stockholder Matters
Securities Authorized for Issuance under Equity Compensation Plans
| | | Plan Category | (a) Number of Securities to be Issued Upon Exercise of Outstanding Options, Warrants and Rights | | (b) Weighted-Average Exercise Price of Outstanding Options, Warrants and Rights | | (c) Number of Securities Remaining Available for Future Issuance Under Equity Compensation Plans (Excluding Securities Reflected in Column (a)) | (a) Number of Securities to be Issued Upon Exercise of Outstanding Options, Warrants and Rights | | (b) Weighted-Average Exercise Price of Outstanding Options, Warrants and Rights | | (c) Number of Securities Remaining Available for Future Issuance Under Equity Compensation Plans (Excluding Securities Reflected in Column (a)) |
| Equity compensation plans approved by security holders - Class A common stock | 25,746 |
| | $ | — |
| | 1,974,254 |
| 27,459 |
| | $ | — |
| | —(1) |
|
| Equity compensation plans approved by security holders - Class C common stock | 42,343 |
| | — |
| | 1,957,657 |
| 176,452 |
| | — |
| | 1,796,089 |
|
| Equity compensation plans not approved by security holders | — |
| | N/A |
| | — |
| — |
| | N/A |
| | — |
|
| Total | 68,089 |
| | $ | — |
| | 3,931,911 |
| 203,911 |
| | $ | — |
| | 1,796,089 |
|
(1) Consists of 1,796,089 shares of Class A and Class C common stock issuable under the NRG Yield, Inc. 2013 Equity Incentive Plan. Beginning in May 2015, awards granted and associated dividend equivalent rights will convert to Class C common stock upon vesting.
Other information required by this Item will be incorporated by reference to the similarly named section of the Company's Definitive Proxy Statement for its 20162017 Annual Meeting of Stockholders.
Item 13 — Certain Relationships and Related Transactions, and Director Independence
Information required by this Item will be incorporated by reference to the similarly named section of the Company's Definitive Proxy Statement for its 20162017 Annual Meeting of Stockholders.
Item 14 — Principal Accounting Fees and Services
Information required by this Item will be incorporated by reference to the similarly named section of the Company's Definitive Proxy Statement for its 20162017 Annual Meeting of Stockholders.
PART IV
Item 15 — Exhibits, Financial Statement Schedules
(a)(1) Financial Statements
The following consolidated financial statements of NRG Yield, Inc. and related notes thereto, together with the reports thereon of KPMG LLP, are included herein:
Consolidated Statements of Income — Years ended December 31, 20152016, 20142015 and 20132014
Consolidated Statements of Comprehensive Income — Years ended December 31, 20152016, 20142015 and 20132014
Consolidated Balance Sheets — As of December 31, 20152016 and 20142015
Consolidated Statements of Cash Flows — Years ended December 31, 20152016, 20142015 and 20132014
Consolidated Statements of Stockholders' Equity — Years ended December 31, 20152016, 20142015 and 20132014
Notes to Consolidated Financial Statements
(a)(2) Financial Statement Schedules
The following schedules of NRG Yield, Inc. are filed as part of Item 15 of this report and should be read in conjunction with the Consolidated Financial Statements:
NRG Yield, Inc. Financial Statements for the yearyears ended December 31, 2016, 2015 2014 and 2013,2014, are included in NRG Yield, Inc.'s Annual Report on Form 10-K pursuant to the requirements of Rule 5-04(c) of Regulation S-X
Schedule II — Valuation and Qualifying Accounts
All other schedules for which provision is made in the applicable accounting regulation of the Securities and Exchange Commission are not required under the related instructions or are inapplicable, and therefore, have been omitted
(a)(3) Exhibits: See Exhibit Index submitted as a separate section of this report
(b) Exhibits
See Exhibit Index submitted as a separate section of this report
(c) Not applicable
Report of Independent Registered Public Accounting Firm
The Board of Directors and Stockholders
NRG Yield, Inc.:
We have audited the accompanying consolidated balance sheets of NRG Yield, Inc. and subsidiaries as of December 31, 20152016 and 2014,2015, and the related consolidated statements of income,operations, comprehensive (loss) income, stockholders’ equity, and cash flows for each of the years in the three‑year period ended December 31, 2015.2016. In connection with our audits of the consolidated financial statements, we also have audited financial statement schedule “Schedule I. Condensed Financial Information of Registrant.” These consolidated financial statements and financial statement schedule are the responsibility of the Company’s management. Our responsibility is to express an opinion on these consolidated financial statements and financial statement schedule based on our audits.
We conducted our audits in accordance with the standards of the Public Company Accounting Oversight Board (United States). Those standards require that we plan and perform the audit to obtain reasonable assurance about whether the financial statements are free of material misstatement. An audit includes examining, on a test basis, evidence supporting the amounts and disclosures in the financial statements. An audit also includes assessing the accounting principles used and significant estimates made by management, as well as evaluating the overall financial statement presentation. We believe that our audits provide a reasonable basis for our opinion.
In our opinion, the consolidated financial statements referred to above present fairly, in all material respects, the financial position of NRG Yield, Inc. and subsidiaries as of December 31, 20152016 and 2014,2015, and the results of their operations and their cash flows for each of the years in the three‑year period ended December 31, 2015,2016, in conformity with U.S. generally accepted accounting principles. Also in our opinion, the related financial statement schedule, when considered in relation to the basic consolidated financial statements taken as a whole, presents fairly, in all material respects, the information set forth therein.
We also have audited, in accordance with the standards of the Public Company Accounting Oversight Board (United States), NRG Yield, Inc.’s internal control over financial reporting as of December 31, 2015,2016, based on criteria established in Internal Control - Integrated Framework (2013) issued by the Committee of Sponsoring Organizations of the Treadway Commission (COSO), and our report dated February 29, 201628, 2017 expressed an unqualified opinion on the effectiveness of the Company’s internal control over financial reporting.
(signed) KPMG LLP
Philadelphia, PA
February 29, 201628, 2017
NRG YIELD, INC.
CONSOLIDATED STATEMENTS OF OPERATIONS
|
| | | | | | | | | | | |
| | Year ended December 31, |
| (In millions, except per share amounts) | 2016 | | 2015 | | 2014 |
| Operating Revenues | | | | | |
| Total operating revenues | $ | 1,021 |
| | $ | 953 |
| | $ | 828 |
|
| Operating Costs and Expenses | | | | | |
| Cost of operations | 306 |
| | 321 |
| | 277 |
|
| Depreciation and amortization | 297 |
| | 297 |
| | 233 |
|
| Impairment losses | 183 |
| | — |
| | — |
|
| General and administrative | 16 |
| | 12 |
| | 8 |
|
| Acquisition-related transaction and integration costs | 1 |
| | 3 |
| | 4 |
|
| Total operating costs and expenses | 803 |
| | 633 |
| | 522 |
|
| Operating Income | 218 |
| | 320 |
| | 306 |
|
| Other Income (Expense) | | | | | |
| Equity in earnings of unconsolidated affiliates | 37 |
| | 26 |
| | 17 |
|
| Other income, net | 3 |
| | 3 |
| | 6 |
|
| Loss on debt extinguishment | — |
| | (9 | ) | | (1 | ) |
| Interest expense | (274 | ) | | (263 | ) | | (216 | ) |
| Total other expense, net | (234 | ) | | (243 | ) | | (194 | ) |
| (Loss) Income Before Income Taxes | (16 | ) | | 77 |
| | 112 |
|
| Income tax (benefit) expense | (1 | ) | | 12 |
| | 4 |
|
| Net (Loss) Income | (15 | ) | | 65 |
| | 108 |
|
| Less: Pre-acquisition net income (loss) of Drop Down Assets | 10 |
| | (10 | ) | | 44 |
|
| Net (Loss) Income Excluding Pre-acquisition Net Income (Loss) of Drop Down Assets | (25 | ) | | 75 |
| | 64 |
|
| Less: Net (loss) income attributable to noncontrolling interests | (82 | ) | | 42 |
| | 48 |
|
| Net Income Attributable to NRG Yield, Inc. | $ | 57 |
| | $ | 33 |
| | $ | 16 |
|
| Earnings Per Share Attributable to NRG Yield, Inc. Class A and Class C Common Stockholders | | | | | |
| Weighted average number of Class A common shares outstanding - basic and diluted | 35 |
| | 35 |
| | 28 |
|
| Weighted average number of Class C common shares outstanding - basic and diluted | 63 |
| | 49 |
| | 28 |
|
| Earnings per Weighted Average Class A and Class C Common Share - Basic and Diluted | $ | 0.58 |
| | $ | 0.40 |
| | $ | 0.30 |
|
| Dividends Per Class A Common Share | $ | 0.945 |
| | $ | 1.015 |
| | $ | 1.42 |
|
| Dividends Per Class C Common Share | $ | 0.945 |
| | $ | 0.625 |
| | N/A |
|
| | | | | | |
See accompanying notes to consolidated financial statements.
NRG YIELD, INC.
CONSOLIDATED STATEMENTS OF COMPREHENSIVE (LOSS) INCOME
|
| | | | | | | | | | | |
| | Year ended December 31, |
| (In millions, except per share amounts) | 2015 | | 2014 (a) | | 2013 (a) |
| Operating Revenues | | | | | |
| Total operating revenues | $ | 869 |
| | $ | 746 |
| | $ | 387 |
|
| Operating Costs and Expenses | | | | | |
| Cost of operations | 312 |
| | 266 |
| | 148 |
|
| Depreciation and amortization | 265 |
| | 202 |
| | 74 |
|
| General and administrative | 12 |
| | 8 |
| | 7 |
|
| Acquisition-related transaction and integration costs | 3 |
| | 4 |
| | — |
|
| Total operating costs and expenses | 592 |
| | 480 |
| | 229 |
|
| Operating Income | 277 |
| | 266 |
| | 158 |
|
| Other Income (Expense) | | | | | |
| Equity in earnings of unconsolidated affiliates | 35 |
| | 25 |
| | 22 |
|
| Other income, net | 2 |
| | 3 |
| | 3 |
|
| Loss on extinguishment of debt | (9 | ) | | — |
| | — |
|
| Interest expense | (238 | ) | | (191 | ) | | (52 | ) |
| Total other expense, net | (210 | ) | | (163 | ) | | (27 | ) |
| Income Before Income Taxes | 67 |
| | 103 |
| | 131 |
|
| Income tax expense | 12 |
| | 4 |
| | 8 |
|
| Net Income | 55 |
| | 99 |
| | 123 |
|
| Less: Pre-acquisition net (loss) income of Drop Down Assets | (20 | ) | | 35 |
| | 14 |
|
| Net Income Excluding Pre-acquisition Net (Loss) Income of Drop Down Assets | 75 |
| | 64 |
| | 109 |
|
| Less: Predecessor income prior to initial public offering on July 22, 2013 | — |
| | — |
| | 54 |
|
| Less: Net income attributable to noncontrolling interests | 42 |
| | 48 |
| | 42 |
|
| Net Income Attributable to NRG Yield, Inc. | $ | 33 |
| | $ | 16 |
| | $ | 13 |
|
| Earnings Per Share Attributable to NRG Yield, Inc. Class A and Class C Common Stockholders | | | | | |
| Weighted average number of Class A common shares outstanding - basic and diluted | 35 |
| | 28 |
| | 23 |
|
| Weighted average number of Class C common shares outstanding - basic and diluted | 49 |
| | 28 |
| | 23 |
|
| Earnings per Weighted Average Class A and Class C Common Share - Basic and Diluted | $ | 0.40 |
| | $ | 0.30 |
| | $ | 0.29 |
|
| Dividends Per Class A Common Share | $ | 1.015 |
| | $ | 1.42 |
| | $ | 0.23 |
|
| Dividends Per Class C Common Share | $ | 0.625 |
| | N/A |
| | N/A |
|
| | | | | | |
|
| | | | | | | | | | | |
| | Year ended December 31, |
| | 2016 | | 2015 | | 2014 |
| (In millions) | |
| Net (Loss) Income | $ | (15 | ) | | $ | 65 |
| | $ | 108 |
|
| Other Comprehensive Income (Loss), net of tax | | | | | |
| Unrealized gain (loss) on derivatives, net of income tax benefit of $0, $10, and $5 | 13 |
| | (7 | ) | | (60 | ) |
| Other comprehensive income (loss) | 13 |
| | (7 | ) | | (60 | ) |
| Comprehensive (Loss) Income | (2 | ) | | 58 |
| | 48 |
|
| Less: Pre-acquisition net income (loss) of Drop Down Assets | 10 |
| | (10 | ) | | 44 |
|
| Less: Comprehensive (loss) income attributable to noncontrolling interests | (68 | ) | | 53 |
| | (3 | ) |
| Comprehensive Income Attributable to NRG Yield, Inc. | $ | 56 |
| | $ | 15 |
| | $ | 7 |
|
See accompanying notes to consolidated financial statements.
NRG YIELD, INC.
CONSOLIDATED BALANCE SHEETS
|
| | | | | | | |
| | December 31, 2016 | | December 31, 2015 |
| ASSETS | (In millions) |
| Current Assets | | | |
| Cash and cash equivalents | $ | 317 |
| | $ | 111 |
|
| Restricted cash | 164 |
| | 131 |
|
| Accounts receivable — trade | 91 |
| | 101 |
|
| Inventory | 39 |
| | 36 |
|
| Derivative instruments | 2 |
| | — |
|
| Notes receivable — current | 16 |
| | 17 |
|
| Prepayments and other current assets | 16 |
| | 20 |
|
| Total current assets | 645 |
| | 416 |
|
| Property, plant and equipment, net | 5,460 |
| | 5,878 |
|
| Other Assets | | | |
| Equity investments in affiliates | 710 |
| | 697 |
|
| Notes receivable — non-current | 14 |
| | 30 |
|
| Intangible assets, net | 1,286 |
| | 1,362 |
|
| Derivative instruments | 1 |
| | — |
|
| Deferred income taxes | 216 |
| | 170 |
|
| Other non-current assets | 51 |
| | 136 |
|
| Total other assets | 2,278 |
| | 2,395 |
|
| Total Assets | $ | 8,383 |
| | $ | 8,689 |
|
| LIABILITIES AND STOCKHOLDERS’ EQUITY | | | |
| Current Liabilities | | | |
| Current portion of long-term debt | $ | 282 |
| | $ | 264 |
|
| Accounts payable — trade | 23 |
| | 23 |
|
| Accounts payable — affiliate | 40 |
| | 86 |
|
| Derivative instruments | 29 |
| | 39 |
|
| Accrued expenses and other current liabilities | 85 |
| | 77 |
|
| Total current liabilities | 459 |
| | 489 |
|
| Other Liabilities | | | |
| Long-term debt | 5,426 |
| | 5,329 |
|
| Accounts payable — affiliate | 9 |
| | — |
|
| Derivative instruments | 43 |
| | 61 |
|
| Other non-current liabilities | 76 |
| | 72 |
|
| Total non-current liabilities | 5,554 |
| | 5,462 |
|
| Total Liabilities | 6,013 |
| | 5,951 |
|
| Commitments and Contingencies | | | |
| Stockholders' Equity | | | |
| Preferred stock, $0.01 par value; 10,000,000 shares authorized; none issued | — |
| | — |
|
| Class A, Class B, Class C and Class D common stock, $0.01 par value; 3,000,000,000 shares authorized (Class A 500,000,000, Class B 500,000,000, Class C 1,000,000,000, Class D 1,000,000,000); 182,848,000 shares issued and outstanding (Class A 34,586,250, Class B 42,738,750, Class C 62,784,250, Class D 42,738,750) at December 31, 2016 and 2015 | 1 |
| | 1 |
|
| Additional paid-in capital | 1,879 |
| | 1,855 |
|
| (Accumulated deficit) Retained earnings | (2 | ) | | 12 |
|
| Accumulated other comprehensive loss | (28 | ) | | (27 | ) |
| Noncontrolling interest | 520 |
| | 897 |
|
| Total Stockholders' Equity | 2,370 |
| | 2,738 |
|
| Total Liabilities and Stockholders' Equity | $ | 8,383 |
| | $ | 8,689 |
|
See accompanying notes to consolidated financial statements.
NRG YIELD, INC.
CONSOLIDATED STATEMENTS OF CASH FLOWS
|
| | | | | | | | | | | |
| | Year ended December 31, |
| | 2016 | | 2015 | | 2014 |
| Cash Flows from Operating Activities | (In millions) |
| Net (loss) income | $ | (15 | ) | | $ | 65 |
| | $ | 108 |
|
| Adjustments to reconcile net income to net cash provided by operating activities: | | | | | |
| Equity in earnings of unconsolidated affiliates | (37 | ) | | (26 | ) | | (17 | ) |
| Distributions from unconsolidated affiliates | 49 |
| | 43 |
| | 21 |
|
| Depreciation, amortization and ARO accretion | 300 |
| | 299 |
| | 235 |
|
| Amortization of financing costs and debt discounts | 20 |
| | 16 |
| | 11 |
|
| Amortization of intangibles and out-of-market contracts | 75 |
| | 54 |
| | 28 |
|
| Loss on debt extinguishment | — |
| | 9 |
| | 1 |
|
| Change in deferred income taxes | (1 | ) | | 12 |
| | 4 |
|
| Impairment losses | 183 |
| | — |
| | — |
|
| Changes in derivative instruments | (19 | ) | | (43 | ) | | (12 | ) |
| Loss on disposal of asset components | 6 |
| | 3 |
| | — |
|
| Cash provided by (used in) changes in other working capital: | | | | | |
| Changes in prepaid and accrued capacity payments | (8 | ) | | (12 | ) | | — |
|
| Changes in other working capital | 7 |
| | (15 | ) | | (17 | ) |
| Net Cash Provided by Operating Activities | 560 |
| | 405 |
|
| 362 |
|
| Cash Flows from Investing Activities | | | | | |
| Acquisition of businesses, net of cash acquired | — |
| | (37 | ) | | (901 | ) |
| Acquisition of Drop Down Assets, net of cash acquired | (77 | ) | | (698 | ) | | (311 | ) |
| Capital expenditures | (20 | ) | | (29 | ) | | (60 | ) |
| Receipt of indemnity from supplier | — |
| | — |
| | 57 |
|
| (Increase) decrease in restricted cash | (33 | ) | | (1 | ) | | 25 |
|
| Cash receipts from notes receivable | 17 |
| | 17 |
| | 14 |
|
| Proceeds from renewable energy grants | — |
| | — |
| | 422 |
|
| Return of investment from unconsolidated affiliates | 28 |
| | 42 |
| | 4 |
|
| Investments in unconsolidated affiliates | (80 | ) | | (402 | ) | | — |
|
| Other | 4 |
| | — |
| | 11 |
|
| Net Cash Used in Investing Activities | (161 | ) | | (1,108 | ) |
| (739 | ) |
| Cash Flows from Financing Activities | | | | | |
| Contributions from tax equity investors, net of distributions | 5 |
| | 122 |
| | 190 |
|
| Capital contributions from NRG | — |
| | — |
| | 2 |
|
| Distributions and return of capital to NRG prior to the acquisition of Drop Down Assets | (113 | ) | | (59 | ) | | (335 | ) |
| Proceeds from the issuance of common stock | — |
| | 599 |
| | 630 |
|
| Payments of dividends and distributions | (183 | ) | | (139 | ) | | (101 | ) |
| Proceeds from the revolving credit facility | 60 |
| | 551 |
| | 500 |
|
| Payments for the revolving credit facility | (366 | ) | | (245 | ) | | — |
|
| Proceeds from issuance of long-term debt | 675 |
| | 293 |
| | 523 |
|
| Payments of debt issuance costs | (7 | ) | | (13 | ) | | (36 | ) |
| Payments for long-term debt | (264 | ) | | (724 | ) | | (626 | ) |
| Net Cash (Used in) Provided by Financing Activities | (193 | ) | | 385 |
| | 747 |
|
| Net Increase (Decrease) in Cash and Cash Equivalents | 206 |
| | (318 | ) | | 370 |
|
| Cash and Cash Equivalents at Beginning of Period | 111 |
| | 429 |
| | 59 |
|
| Cash and Cash Equivalents at End of Period | $ | 317 |
| | $ | 111 |
| | $ | 429 |
|
| | | | | | |
| Supplemental Disclosures | | | | | |
| Interest paid, net of amount capitalized | $ | (266 | ) | | $ | (274 | ) | | $ | (192 | ) |
| Non-cash investing and financing activities: | | | | | |
| Additions (reductions) to fixed assets for accrued capital expenditures | 3 |
| | 1 |
| | (21 | ) |
| Decrease to fixed assets for accrued grants | — |
| | — |
| | 34 |
|
| Decrease to fixed assets for deferred tax asset | — |
| | 19 |
| | 7 |
|
| Non-cash adjustment for change in tax basis of assets | 44 |
| | 38 |
| | (14 | ) |
| Increase in debt due to accrued interest converted to debt | — |
| | — |
| | 11 |
|
| Non-cash return of capital and distributions to NRG, net of contributions | $ | (43 | ) | | $ | (13 | ) | | $ | 1,058 |
|
See accompanying notes to consolidated financial statements.
NRG YIELD, INC.
CONSOLIDATED STATEMENTS OF STOCKHOLDERS' EQUITY
|
| | | | | | | | | | | | | | | | | | | | | | | | | | | |
| (In millions) | Preferred Stock | | Common Stock | | Additional Paid-In Capital | | Retained Earnings | | Accumulated Other Comprehensive Loss | | Noncontrolling Interest | | Total Stockholders' Equity |
| Balances at December 31, 2013 | $ | — |
| | $ | — |
| | $ | 621 |
| | $ | 8 |
| | $ | — |
| | $ | 959 |
| | $ | 1,588 |
|
| Net income | — |
| | — |
| | — |
| | 16 |
| | — |
| | 48 |
| | 64 |
|
| Pre-acquisition net income of acquired Drop Down Assets | — |
| | — |
| | — |
| | — |
| | — |
| | 44 |
| | 44 |
|
| Unrealized loss on derivatives, net of tax | — |
| | — |
| | — |
| | — |
| | (9 | ) | | (51 | ) | | (60 | ) |
| Payment for June 2014 Drop Down Assets | — |
| | — |
| | — |
| | — |
| | — |
| | (357 | ) | | (357 | ) |
Capital contributions from NRG, non-cash (a) | — |
| | — |
| | — |
| | — |
| | — |
| | 1,058 |
| | 1,058 |
|
| Distributions and returns of capital to NRG net of contributions | — |
| | — |
| | — |
| | — |
| | — |
| | (333 | ) | | (333 | ) |
| Capital contributions from tax equity investors | — |
| | — |
| | — |
| | — |
| | — |
| | 190 |
| | 190 |
|
| Proceeds from the issuance of Class A common stock | — |
| | — |
| | 630 |
| | — |
| | — |
| | — |
| | 630 |
|
| Non-cash adjustment for change in tax basis of property, plant and equipment | — |
| | — |
| | (14 | ) | | — |
| | — |
| | — |
| | (14 | ) |
| Equity portion of the 2019 Convertible Notes | — |
| | — |
| | 23 |
| | — |
| | — |
| | — |
| | 23 |
|
| Common stock dividends | — |
| | — |
| | (20 | ) | | (21 | ) | | — |
| | (60 | ) | | (101 | ) |
| Balances at December 31, 2014 | $ | — |
| | $ | — |
| | $ | 1,240 |
| | $ | 3 |
| | $ | (9 | ) | | $ | 1,498 |
| | $ | 2,732 |
|
| Net income | — |
| | — |
| | — |
| | 33 |
| | — |
| | 42 |
| | 75 |
|
| Pre-acquisition net loss of acquired Drop Down Assets | — |
| | — |
| | — |
| | — |
| | — |
| | (10 | ) | | (10 | ) |
| Unrealized loss on derivatives, net of tax | — |
| | — |
| | — |
| | — |
| | (18 | ) | | 11 |
| | (7 | ) |
| Payment for January 2015 and November 2015 Drop Down Assets | — |
| | — |
| | — |
| | — |
| | — |
| | (698 | ) | | (698 | ) |
| Capital contributions from tax equity investors | — |
| | — |
| | — |
| | — |
| | — |
| | 122 |
| | 122 |
|
| Noncontrolling interest acquired in Spring Canyon acquisition | — |
| | — |
| | — |
| | — |
| | — |
| | 74 |
| | 74 |
|
| Distributions and return of capital to NRG | — |
| | — |
| | — |
| | — |
| | — |
| | (59 | ) | | (59 | ) |
| Distributions and return of capital to NRG, net of contributions, non-cash | — |
| | — |
| | — |
| | — |
| | — |
| | (13 | ) | | (13 | ) |
| Stock-based compensation | — |
| | — |
| | 1 |
| | — |
| | — |
| | — |
| | 1 |
|
| Proceeds from the issuance of Class C Common Stock | — |
| | 1 |
| | 598 |
| | — |
| | — |
| | — |
| | 599 |
|
| Non-cash adjustment for change in tax basis of property, plant and equipment | — |
| | — |
| | 38 |
| | — |
| | — |
| | — |
| | 38 |
|
| Equity portion of the 2020 Convertible Notes | — |
| | — |
| | 23 |
| | — |
| | — |
| | — |
| | 23 |
|
| Common stock dividends | — |
| | — |
| | (45 | ) | | (24 | ) | | — |
| | (70 | ) | | (139 | ) |
| Balances as of December 31, 2015 | $ | — |
| | 1 |
| | $ | 1,855 |
| | $ | 12 |
| | $ | (27 | ) | | $ | 897 |
| | $ | 2,738 |
|
| Net income (loss) | — |
| | — |
| | — |
| | 57 |
| | — |
| | (82 | ) | | (25 | ) |
| Pre-acquisition net loss of acquired Drop Down Assets | — |
| | — |
| | — |
| | — |
| | — |
| | 10 |
| | 10 |
|
| Unrealized (loss) gain on derivatives, net of tax | — |
| | — |
| | — |
| | — |
| | (1 | ) | | 14 |
| | 13 |
|
| Payment for CVSR Drop Down Asset | — |
| | — |
| | — |
| | — |
| | — |
| | (77 | ) | | (77 | ) |
| Capital contributions from tax equity investors, net of distributions | — |
| | — |
| | — |
| | — |
| | — |
| | 5 |
| | 5 |
|
| Distributions and return of capital to NRG | — |
| | — |
| | — |
| | — |
| | — |
| | (123 | ) | | (123 | ) |
| Distributions and return of capital to NRG, net of contributions, non-cash | — |
| | — |
| | — |
| | — |
| | — |
| | (43 | ) | | (43 | ) |
| Stock-based compensation | — |
| | — |
| | 1 |
| | — |
| | — |
| | — |
| | 1 |
|
| Non-cash adjustment for change in tax basis of assets | — |
| | — |
| | 44 |
| | — |
| | — |
| | — |
| | 44 |
|
| Common stock dividends | — |
| | — |
| | (21 | ) | | (71 | ) | | — |
| | (81 | ) | | (173 | ) |
| Balances as of December 31, 2016 | $ | — |
| | 1 |
| | $ | 1,879 |
| | $ | (2 | ) | | $ | (28 | ) | | $ | 520 |
| | $ | 2,370 |
|
(a)Retrospectively adjusted as discussed in Note 1, Nature of Business.
See accompanying notes to consolidated financial statements.
NRG YIELD, INC.
CONSOLIDATED STATEMENTS OF COMPREHENSIVE INCOME
|
| | | | | | | | | | | |
| | Year ended December 31, |
| | 2015 | | 2014 (a) | | 2013 (a) |
| | (In millions) |
| Net Income | $ | 55 |
| | $ | 99 |
| | $ | 123 |
|
| Other Comprehensive (Loss) Income, net of tax | | | | | |
| Unrealized (loss) gain on derivatives, net of income tax benefit (expense) of $10, $5, and ($16) | (8 | ) | | (61 | ) | | 48 |
|
| Other comprehensive (loss) income | (8 | ) | | (61 | ) | | 48 |
|
| Comprehensive Income | 47 |
| | 38 |
| | $ | 171 |
|
| Less: Predecessor comprehensive income prior to initial public offering on July 22, 2013 | — |
| | — |
| | 73 |
|
| Less: Pre-acquisition net (loss) income of Drop Down Assets | (20 | ) | | 35 |
| | 14 |
|
| Less: Comprehensive income (loss) attributable to noncontrolling interests | 52 |
| | (4 | ) | | 69 |
|
| Comprehensive Income Attributable to NRG Yield Inc. | $ | 15 |
| | $ | 7 |
| | $ | 15 |
|
(a)Retrospectively adjusted as discussed in Note 1, Nature of Business.
See accompanying notes to consolidated financial statements.
NRG YIELD, INC.
CONSOLIDATED BALANCE SHEETS
|
| | | | | | | |
| | December 31, 2015 | | December 31, 2014 (a) |
| ASSETS | (In millions) |
| Current Assets | | | |
| Cash and cash equivalents | $ | 111 |
| | $ | 429 |
|
| Restricted cash | 48 |
| | 47 |
|
| Accounts receivable — trade | 95 |
| | 90 |
|
| Accounts receivable — affiliate | — |
| | 28 |
|
| Inventory | 35 |
| | 32 |
|
| Derivative instruments — affiliate | — |
| | 2 |
|
| Notes receivable | 7 |
| | 6 |
|
| Prepayments and other current assets | 22 |
| | 22 |
|
| Total current assets | 318 |
| | 656 |
|
| Property, plant and equipment | | | |
| In service | 5,748 |
| | 5,604 |
|
| Under construction | 9 |
| | 9 |
|
| Total property, plant and equipment | 5,757 |
| | 5,613 |
|
| Less accumulated depreciation | (701 | ) | | (438 | ) |
| Net property, plant and equipment | 5,056 |
| | 5,175 |
|
| Other Assets | | | |
| Equity investments in affiliates | 798 |
| | 410 |
|
| Notes receivable | 10 |
| | 15 |
|
| Intangible assets, net of accumulated amortization of $93 and $38 | 1,362 |
| | 1,424 |
|
| Derivative instruments | — |
| | 2 |
|
| Deferred income taxes | 170 |
| | 134 |
|
| Other non-current assets | 61 |
| | 44 |
|
| Total other assets | 2,401 |
| | 2,029 |
|
| Total Assets | $ | 7,775 |
| | $ | 7,860 |
|
(a)Retrospectively adjusted as discussed in Note 1, Nature of Business.
See accompanying notes to consolidated financial statements.
NRG YIELD, INC.
CONSOLIDATED BALANCE SHEETS (Continued)
|
| | | | | | | |
| | December 31, 2015 | | December 31, 2014 (a) |
| LIABILITIES AND STOCKHOLDERS’ EQUITY | (In millions, except share information) |
| Current Liabilities | | | |
| Current portion of long-term debt | $ | 241 |
| | $ | 224 |
|
| Accounts payable | 23 |
| | 22 |
|
| Accounts payable — affiliate | 85 |
| | 46 |
|
| Derivative instruments | 39 |
| | 52 |
|
| Accrued expenses and other current liabilities | 68 |
| | 65 |
|
| Total current liabilities | 456 |
| | 409 |
|
| Other Liabilities | | | |
| Long-term debt | 4,562 |
| | 4,697 |
|
| Derivative instruments | 61 |
| | 77 |
|
| Other non-current liabilities | 64 |
| | 52 |
|
| Total non-current liabilities | 4,687 |
| | 4,826 |
|
| Total Liabilities | 5,143 |
| | 5,235 |
|
| Commitments and Contingencies |
|
| |
|
|
| Stockholders' Equity | | | |
| Preferred stock, $0.01 par value; 10,000,000 shares authorized; none issued | — |
| | — |
|
| Class A, Class B, Class C and Class D common stock, $0.01 par value; 3,000,000,000 shares authorized (Class A 500,000,000, Class B 500,000,000, Class C 1,000,000,000, Class D 1,000,000,000); 182,848,000 shares issued and outstanding (Class A 34,586,250, Class B 42,738,750, Class C 62,784,250, Class D 42,738,750) at December 31, 2015 and 154,650,000 shares issued and outstanding (Class A 34,586,250, Class B 42,738,750, Class C 34,586,250, Class D 42,738,750) at December 31, 2014 | 1 |
| | — |
|
| Additional paid-in capital | 1,855 |
| | 1,240 |
|
| Retained earnings | 12 |
| | 3 |
|
| Accumulated other comprehensive loss | (27 | ) | | (9 | ) |
| Noncontrolling interest | 791 |
| | 1,391 |
|
| Total Stockholders' Equity | 2,632 |
| | 2,625 |
|
| Total Liabilities and Stockholders' Equity | $ | 7,775 |
| | $ | 7,860 |
|
(a)Retrospectively adjusted as discussed in Note 1, Nature of Business.
See accompanying notes to consolidated financial statements.
NRG YIELD, INC.
CONSOLIDATED STATEMENTS OF CASH FLOWS
|
| | | | | | | | | | | |
| | Year ended December 31, |
| | 2015 | | 2014 (a) | | 2013 (a) |
| | (In millions) |
| Cash Flows from Operating Activities | | | | | |
| Net income | $ | 55 |
| | $ | 99 |
| | $ | 123 |
|
| Adjustments to reconcile net income to net cash provided by operating activities: | | | | | |
| Distributions in excess of equity in earnings of unconsolidated affiliates | 29 |
| | 5 |
| | (6 | ) |
| Depreciation and amortization | 265 |
| | 202 |
| | 74 |
|
| Amortization of financing costs and debt discount/premiums | 16 |
| | 10 |
| | 4 |
|
| Amortization of intangibles and out-of-market contracts | 54 |
| | 28 |
| | 1 |
|
| Adjustment for debt extinguishment | 9 |
| | — |
| | — |
|
| Change in deferred income taxes | 12 |
| | 4 |
| | 8 |
|
| Changes in derivative instruments | (45 | ) | | (14 | ) | | (21 | ) |
| Changes in other working capital | (22 | ) | | (24 | ) | | (63 | ) |
| Net Cash Provided by Operating Activities | 373 |
| | 310 |
|
| 120 |
|
| Cash Flows from Investing Activities | | | | | |
| Acquisition of businesses, net of cash acquired | (37 | ) | | (901 | ) | | (120 | ) |
| Acquisition of Drop Down Assets, net of cash acquired | (698 | ) | | (311 | ) | | — |
|
| Capital expenditures | (29 | ) | | (33 | ) | | (353 | ) |
| (Increase) decrease in restricted cash | (1 | ) | | 49 |
| | (43 | ) |
| Decrease in notes receivable, including affiliates | 7 |
| | 8 |
| | 10 |
|
| Proceeds from renewable energy grants | — |
| | 137 |
| | 25 |
|
| Net investments in unconsolidated affiliates | (360 | ) | | 7 |
| | (34 | ) |
| Other | — |
| | 11 |
| | — |
|
| Net Cash Used in Investing Activities | (1,118 | ) | | (1,033 | ) |
| (515 | ) |
| Cash Flows from Financing Activities | | | | | |
| Contributions from tax equity investors | 122 |
| | 190 |
| | — |
|
| Capital contributions from NRG | — |
| | 2 |
| | 171 |
|
| Distributions and return of capital to NRG prior to the acquisition of Drop Down Assets and IPO | (38 | ) | | (290 | ) | | (707 | ) |
| Proceeds from the issuance of common stock | 599 |
| | 630 |
| | 468 |
|
| Payment of dividends and distributions | (139 | ) | | (101 | ) | | (15 | ) |
| Proceeds from issuance of long-term debt | 844 |
| | 975 |
| | 594 |
|
| Payment of debt issuance costs | (13 | ) | | (36 | ) | | (5 | ) |
| Payments for long-term debt — external | (948 | ) | | (277 | ) | | (72 | ) |
| Payments for long-term debt — affiliate | — |
| | — |
| | (2 | ) |
| Net Cash Provided by Financing Activities | 427 |
| | 1,093 |
| | 432 |
|
| Net (Decrease) Increase in Cash and Cash Equivalents | (318 | ) | | 370 |
| | 37 |
|
| Cash and Cash Equivalents at Beginning of Period | 429 |
| | 59 |
| | 22 |
|
| Cash and Cash Equivalents at End of Period | $ | 111 |
| | $ | 429 |
| | $ | 59 |
|
| | | | | | |
| Supplemental Disclosures | | | | | |
| Interest paid, net of amount capitalized | $ | (251 | ) | | $ | (180 | ) | | $ | (63 | ) |
| Non-cash investing and financing activities: | | | | | |
| Additions (reductions) to fixed assets for accrued capital expenditures | 1 |
| | (21 | ) | | 1 |
|
| Decrease to fixed assets for accrued grants | — |
| | — |
| | (207 | ) |
| Decrease to fixed assets for deferred tax asset | — |
| | — |
| | (12 | ) |
| Non-cash addition to additional paid-in capital for change in tax basis of property, plant and equipment for assets acquired from NRG | 38 |
| | (14 | ) | | 153 |
|
| Non-cash return of capital and distributions to NRG, net of contributions | $ | (22 | ) | | $ | 1,021 |
| | $ | 4 |
|
(a)Retrospectively adjusted as discussed in Note 1, Nature of Business.
See accompanying notes to consolidated financial statements.
NRG YIELD, INC.
CONSOLIDATED STATEMENTS OF STOCKHOLDERS' EQUITY
|
| | | | | | | | | | | | | | | | | | | | | | | | | | | | | | | |
| (In millions) | Preferred Stock | | Common Stock | | Additional Paid-In Capital | | Retained Earnings | | Accumulated Other Comprehensive Income (Loss) | | Noncontrolling Interest | | Members' Equity | | Total Members'/Stockholders' Equity |
Balances at December 31, 2012 (a) | $ | — |
| | $ | — |
| | $ | — |
| | $ | — |
| | $ | — |
| | $ | — |
| | $ | 1,002 |
| | $ | 1,002 |
|
| Members' equity - Acquired Drop Down Assets | — |
| | — |
| | — |
| | — |
| | — |
| | — |
| | 240 |
| | 240 |
|
| Balances at December 31, 2012 | — |
| | — |
| | — |
| | — |
| | — |
| | — |
| | 1,242 |
| | 1,242 |
|
| Net income | — |
| | — |
| | — |
| | — |
| | — |
| | — |
| | 54 |
| | 54 |
|
| Pre-acquisition net loss of acquired Drop Down Assets | — |
| | — |
| | — |
| | — |
| | — |
| | — |
| | (3 | ) | | (3 | ) |
| Unrealized gain on derivatives, net of tax | — |
| | — |
| | — |
| | — |
| | — |
| | — |
| | 38 |
| | 38 |
|
| Capital contributions from NRG, cash | — |
| | — |
| | — |
| | — |
| | — |
| | — |
| | 171 |
| | 171 |
|
| Capital contributions from NRG, non-cash | — |
| | — |
| | — |
| | — |
| | — |
| | — |
| | 66 |
| | 66 |
|
| Dividends and return of capital to NRG, cash | — |
| | — |
| | — |
| | — |
| | — |
| | — |
| | (312 | ) | | (312 | ) |
| Dividends and return of capital to NRG, non-cash | — |
| | — |
| | — |
| | — |
| | — |
| | — |
| | (33 | ) | | (33 | ) |
| Balance as of July 22, 2013 | $ | — |
| | $ | — |
| | $ | — |
| | $ | — |
| | $ | — |
| | $ | — |
| | $ | 1,223 |
| | $ | 1,223 |
|
| Net income | — |
| | — |
| | — |
| | 13 |
| | — |
| | 42 |
| | — |
| | 55 |
|
Pre-acquisition net income of acquired Drop Down Assets (c) | — |
| | — |
| | — |
| | — |
| | — |
| | 17 |
| | — |
| | 17 |
|
| Unrealized (loss) gain on derivatives, net | — |
| | — |
| | — |
| | — |
| | (3 | ) | | 9 |
| | — |
| | 6 |
|
| Capital contributions from NRG, non-cash | — |
| | — |
| | — |
| | — |
| | — |
| | 14 |
| | — |
| | 14 |
|
| Distributions and return of capital to NRG, cash | — |
| | — |
| | — |
| | — |
| | — |
| | — |
| | (395 | ) | | (395 | ) |
| Transfer of predecessors' equity to noncontrolling interest | — |
| | — |
| | — |
| | — |
| | 3 |
| | 825 |
| | (828 | ) | | — |
|
| Reduction to non-controlling interest, non-cash | — |
| | — |
| | — |
| | — |
| | — |
| | (43 | ) | | — |
| | (43 | ) |
| Common shares issued in public offering | — |
| | — |
| | 468 |
| | — |
| | — |
| | — |
| | — |
| | 468 |
|
| Adjustment for change in tax basis of property, plant and equipment, non-cash | — |
| | — |
| | 153 |
| | — |
| | — |
| | — |
| | — |
| | 153 |
|
| Common stock dividends | — |
| | — |
| | — |
| | (5 | ) | | — |
| | (10 | ) | | — |
| | (15 | ) |
| Balances at December 31, 2013 | $ | — |
| | $ | — |
| | $ | 621 |
| | $ | 8 |
| | $ | — |
| | $ | 854 |
| | $ | — |
| | $ | 1,483 |
|
| Net income | — |
| | — |
| | — |
| | 16 |
| | — |
| | 48 |
| | — |
| | 64 |
|
Pre-acquisition net income of acquired Drop Down Assets (c) | — |
| | — |
| | — |
| | — |
| | — |
| | 35 |
| | — |
| | 35 |
|
Unrealized loss on derivatives, net of tax (c) | — |
| | — |
| | — |
| | — |
| | (9 | ) | | (52 | ) | | — |
| | (61 | ) |
| Payment for June 2014 Drop Down Assets | — |
| | — |
| | — |
| | — |
| | — |
| | (357 | ) | | — |
| | (357 | ) |
Capital contributions from NRG, non-cash (b) | — |
| | — |
| | — |
| | — |
| | — |
| | 1,021 |
| | — |
| | 1,021 |
|
Distributions and returns of capital to NRG net of contributions, cash (c) | — |
| | — |
| | — |
| | — |
| | — |
| | (288 | ) | | — |
| | (288 | ) |
| Capital contributions from tax equity investors | — |
| | — |
| | — |
| | — |
| | — |
| | 190 |
| | — |
| | 190 |
|
| Proceeds from the issuance of Class A common stock | — |
| | — |
| | 630 |
| | — |
| | — |
| | — |
| | — |
| | 630 |
|
| Non-cash adjustment for change in tax basis of property, plant and equipment | — |
| | — |
| | (14 | ) | | — |
| | — |
| | — |
| | — |
| | (14 | ) |
| Equity portion of the Convertible Notes due 2019 | — |
| | — |
| | 23 |
| | — |
| | — |
| | — |
| | — |
| | 23 |
|
| Common stock dividends | — |
| | — |
| | (20 | ) | | (21 | ) | | — |
| | (60 | ) | | — |
| | (101 | ) |
| Balances at December 31, 2014 | $ | — |
| | $ | — |
| | $ | 1,240 |
| | $ | 3 |
| | $ | (9 | ) | | $ | 1,391 |
| | $ | — |
| | $ | 2,625 |
|
| Net income | — |
| | — |
| | — |
| | 33 |
| | — |
| | 42 |
| | — |
| | 75 |
|
| Pre-acquisition net loss of acquired Drop Down Assets | — |
| | — |
| | — |
| | — |
| | — |
| | (20 | ) | | — |
| | (20 | ) |
| Unrealized loss on derivatives, net of tax | — |
| | — |
| | — |
| | — |
| | (18 | ) | | 10 |
| | — |
| | (8 | ) |
| Payment for January 2015 Drop Down Assets | — |
| | — |
| | — |
| | — |
| | — |
| | (489 | ) | | — |
| | (489 | ) |
| Payment for November 2015 Drop Down Assets | — |
| | — |
| | — |
| | — |
| | — |
| | (209 | ) | | — |
| | (209 | ) |
| Capital contributions from tax equity investors | — |
| | — |
| | — |
| | — |
| | — |
| | 122 |
| | — |
| | 122 |
|
| Noncontrolling interest acquired in Spring Canyon acquisition | — |
| | — |
| | — |
| | — |
| | — |
| | 74 |
| | — |
| | 74 |
|
| Distributions and return of capital to NRG, cash | — |
| | — |
| | — |
| | — |
| | — |
| | (38 | ) | | — |
| | (38 | ) |
| Distributions and return of capital to NRG, net of contributions, non-cash | — |
| | — |
| | — |
| | — |
| | — |
| | (22 | ) | | — |
| | (22 | ) |
| Stock-based compensation | — |
| | — |
| | 1 |
| | — |
| | — |
| | — |
| | — |
| | 1 |
|
| Proceeds from the issuance of Class C Common Stock | — |
| | 1 |
| | 598 |
| | — |
| | — |
| | — |
| | — |
| | 599 |
|
| Non-cash adjustment for change in tax basis of property, plant and equipment | — |
| | — |
| | 38 |
| | — |
| | — |
| | — |
| | — |
| | 38 |
|
| Equity portion of the Convertible Notes due 2021 | — |
| | — |
| | 23 |
| | — |
| | — |
| | — |
| | — |
| | 23 |
|
| Common stock dividends | — |
| | — |
| | (45 | ) | | (24 | ) | | — |
| | (70 | ) | | — |
| | (139 | ) |
| Balance as of December 31, 2015 | $ | — |
| | $ | 1 |
| | $ | 1,855 |
| | $ | 12 |
| | $ | (27 | ) | | $ | 791 |
| | $ | — |
| | $ | 2,632 |
|
(a)As previously reported in the Company's audited financial statements for the year ended December 31, 2014, included in the Form 8-K dated May 22, 2015.
(b) Capital contributions from NRG, non-cash, primarily represent Drop Down Assets' equity transferred from NRG to the Company in accordance with guidance on business combinations between entities under common control, as further described in Note 1, Nature of Business.
(c) Retrospectively adjusted, as discussed in Note 1, Nature of Business.
See accompanying notes to consolidated financial statements.
NRG YIELD, INC.
NOTES TO CONSOLIDATED FINANCIAL STATEMENTS
Note 1 — Nature of Business
NRG Yield, Inc., together with its consolidated subsidiaries, or theThe Company is a dividend growth-oriented companywas formed by NRG as a Delaware corporation on December 20, 2012 to serve as the primary vehicle through which NRG owns, operates and acquires contracted renewable and conventional generation and thermal infrastructure assets. The Company used the net proceeds fromclosed its initial public offering of Class A common stock on July 22, 2013, to acquire 19,011,250 Class A units of NRG Yield LLC from NRG, as well as 3,500,000 Class A units directly from NRG Yield LLC. At2013. In connection with its initial public offering, the time of the offering, NRG owned 42,738,750 NRG Yield LLC Class B units. NRG Yield LLC, through its wholly owned subsidiary, NRG Yield Operating LLC, is a holder of a portfolio of renewable and conventional generation and thermal infrastructure assets, primarily located in the Northeast, Southwest and California regions of the U.S.
On July 29, 2014, the Company issued 12,075,000Company's shares of Class A common stock for net proceeds, after underwriting discount and expenses, of $630 million. The Company utilizedbegan trading on the proceeds ofNew York Stock Exchange under the offering to acquire 12,075,000 additional Class A units of NRG Yield LLC. Onsymbol “NYLD.”
Effective May 14, 2015, the Company completed a stock split in connection with which each outstanding share of Class A common stock was split into one share of Class A common stock and one share of Class C common stock, and each outstanding share of Class B common stock was split into one share of Class B common stock and one share of Class D common stock. The stock split is referred to as the Recapitalization and all references to share or per share amounts in the accompanying consolidated financial statements and applicable disclosures have been retrospectively adjusted to reflect the Recapitalization. In addition,Following the Recapitalization, the Company's Class A common stock continued trading on June 29, 2015, the Company completedNew York Stock Exchange under the issuance of 28,198,000 shares ofnew ticker symbol "NYLD.A" and the Class C common stock for net proceedsbegan trading under the ticker symbol "NYLD."
NRG, through its holdings of $599 million. See further discussionClass B common stock and Class D common stock, has a 55.1% voting interest in Note 11, Stockholders' Equity.
the Company and receives distributions from NRG Yield LLC through its ownership of Class B units and Class D units. The holders of the Company's issued and outstanding shares of Class A common stock and Class C common stock are entitled to dividends as declared. NRG receives its distributions from NRG Yield LLC through its ownershipdeclared and have 44.9% of the voting power in the Company.
The Company is the sole managing member of NRG Yield LLC and operates and controls all of its business and affairs and consolidates the financial results of NRG Yield LLC and its subsidiaries. NRG Yield LLC is a holding company for the companies that directly and indirectly own and operate the Company's business. As of December 31, 2016, the Company and NRG have 53.3% and 46.7% economic interests in NRG Yield LLC, respectively. As a result of the current ownership of the Class B common stock and Class D units.common stock, NRG continues at the present time to control the Company, and the Company in turn, as the sole managing member of NRG Yield LLC, controls NRG Yield LLC and its subsidiaries.
The following table represents the structure of the Company as of December 31, 2015: 2016:

For the periods prior to the initial public offering, the accompanying combined financial statements represent the combination of the assets that NRG Yield LLC acquired and were prepared using NRG's historical basis in the assets and liabilities. For the purposes of the combined financial statements, the term "NRG Yield" represents the accounting predecessor, or the combination of the acquired businesses. For all periods subsequent to the initial public offering, the accompanying audited consolidated financial statements represent the consolidated results of the Company, which consolidates NRG Yield LLC through its controlling interest.
As of December 31, 2015,2016, the Company's operating assets are comprised of the following projects:
| | | Projects | | Percentage Ownership | | Net Capacity (MW) (a) | | Offtake Counterparty | | Expiration | | Percentage Ownership | | Net Capacity (MW) (a) | | Offtake Counterparty | | Expiration |
| Conventional | | | | | | | | | | |
| El Segundo | | 100 | % | | 550 |
| | Southern California Edison | | 2023 | | 100 | % | | 550 |
| | Southern California Edison | | 2023 |
GenConn Devon(b) | | 50 | % | | 95 |
| | Connecticut Light & Power | | 2040 | | 50 | % | | 95 |
| | Connecticut Light & Power | | 2040 |
GenConn Middletown (b) | | 50 | % | | 95 |
| | Connecticut Light & Power | | 2041 | | 50 | % | | 95 |
| | Connecticut Light & Power | | 2041 |
| Marsh Landing | | 100 | % | | 720 |
| | Pacific Gas and Electric | | 2023 | | 100 | % | | 720 |
| | Pacific Gas and Electric | | 2023 |
| Walnut Creek | | 100 | % | | 485 |
| | Southern California Edison | | 2023 | | 100 | % | | 485 |
| | Southern California Edison | | 2023 |
| | | | | 1,945 |
| | | | | 1,945 |
| |
| Utility Scale Solar | | | | | | | | | | |
| Alpine | | 100 | % | | 66 |
| | Pacific Gas and Electric | | 2033 | | 100 | % | | 66 |
| | Pacific Gas and Electric | | 2033 |
Avenal (b) | | 50 | % | | 23 |
| | Pacific Gas and Electric | | 2031 | | 50 | % | | 23 |
| | Pacific Gas and Electric | | 2031 |
| Avra Valley | | 100 | % | | 26 |
| | Tucson Electric Power | | 2032 | | 100 | % | | 26 |
| | Tucson Electric Power | | 2032 |
| Blythe | | 100 | % | | 21 |
| | Southern California Edison | | 2029 | | 100 | % | | 21 |
| | Southern California Edison | | 2029 |
| Borrego | | 100 | % | | 26 |
| | San Diego Gas and Electric | | 2038 | | 100 | % | | 26 |
| | San Diego Gas and Electric | | 2038 |
| CVSR | | 48.95 | % | | 122 |
| | Pacific Gas and Electric | | 2038 | | 100 | % | | 250 |
| | Pacific Gas and Electric | | 2038 |
| Desert Sunlight 250 | | 25 | % | | 63 |
| | Southern California Edison | | 2035 | | 25 | % | | 63 |
| | Southern California Edison | | 2035 |
| Desert Sunlight 300 | | 25 | % | | 75 |
| | Pacific Gas and Electric | | 2040 | | 25 | % | | 75 |
| | Pacific Gas and Electric | | 2040 |
| Kansas South | | 100 | % | | 20 |
| | Pacific Gas and Electric | | 2033 | | 100 | % | | 20 |
| | Pacific Gas and Electric | | 2033 |
| Roadrunner | | 100 | % | | 20 |
| | El Paso Electric | | 2031 | | 100 | % | | 20 |
| | El Paso Electric | | 2031 |
| TA High Desert | | 100 | % | | 20 |
| | Southern California Edison | | 2033 | | 100 | % | | 20 |
| | Southern California Edison | | 2033 |
| | | | | 482 |
| | | | | 610 |
| |
| Distributed Solar | | | | | | | | | | |
| AZ DG Solar Projects | | 100 | % | | 5 |
| | Various | | 2025 - 2033 | | 100 | % | | 5 |
| | Various | | 2025 - 2033 |
| PFMG DG Solar Projects | | 51 | % | | 4 |
| | Various | | 2032 | | 51 | % | | 4 |
| | Various | | 2032 |
| | | | | 9 |
| | | | | 9 |
| |
| Wind | | | | | | | | | | |
| Alta I | | 100 | % | | 150 |
| | Southern California Edison | | 2035 | | 100 | % | | 150 |
| | Southern California Edison | | 2035 |
| Alta II | | 100 | % | | 150 |
| | Southern California Edison | | 2035 | | 100 | % | | 150 |
| | Southern California Edison | | 2035 |
| Alta III | | 100 | % | | 150 |
| | Southern California Edison | | 2035 | | 100 | % | | 150 |
| | Southern California Edison | | 2035 |
| Alta IV | | 100 | % | | 102 |
| | Southern California Edison | | 2035 | | 100 | % | | 102 |
| | Southern California Edison | | 2035 |
| Alta V | | 100 | % | | 168 |
| | Southern California Edison | | 2035 | | 100 | % | | 168 |
| | Southern California Edison | | 2035 |
Alta X (d)(b) | | 100 | % | | 137 |
| | Southern California Edison | | 2038 | | 100 | % | | 137 |
| | Southern California Edison | | 2038 |
Alta XI (d)(b) | | 100 | % | | 90 |
| | Southern California Edison | | 2038 | | 100 | % | | 90 |
| | Southern California Edison | | 2038 |
| Buffalo Bear | | 100 | % | | 19 |
| | Western Farmers Electric Co-operative | | 2033 | | 100 | % | | 19 |
| | Western Farmers Electric Co-operative | | 2033 |
Crosswinds | | 74.3 | % | | 16 |
| | Corn Belt Power Cooperative | | 2027 | | 74.3 | % | | 16 |
| | Corn Belt Power Cooperative | | 2027 |
Elbow Creek | | 75 | % | | 92 |
| | NRG Power Marketing LLC | | 2022 | | 75 | % | | 92 |
| | NRG Power Marketing LLC | | 2022 |
Elkhorn Ridge | | 50.3 | % | | 41 |
| | Nebraska Public Power District | | 2029 | | 50.3 | % | | 41 |
| | Nebraska Public Power District | | 2029 |
Forward | | 75 | % | | 22 |
| | Constellation NewEnergy, Inc. | | 2017 | | 75 | % | | 22 |
| | Constellation NewEnergy, Inc. | | 2017 |
Goat Wind | | 74.9 | % | | 113 |
| | Dow Pipeline Company | | 2025 | | 74.9 | % | | 113 |
| | Dow Pipeline Company | | 2025 |
Hardin | | 74.3 | % | | 11 |
| | Interstate Power and Light Company | | 2027 | | 74.3 | % | | 11 |
| | Interstate Power and Light Company | | 2027 |
| Laredo Ridge | | 100 | % | | 80 |
| | Nebraska Public Power District | | 2031 | | 100 | % | | 80 |
| | Nebraska Public Power District | | 2031 |
Lookout | | 75 | % | | 29 |
| | Southern Maryland Electric Cooperative | | 2030 | | 75 | % | | 29 |
| | Southern Maryland Electric Cooperative | | 2030 |
Odin | | 74.9 | % | | 15 |
| | Missouri River Energy Services | | 2028 | | 74.9 | % | | 15 |
| | Missouri River Energy Services | | 2028 |
| Pinnacle | | 100 | % | | 55 |
| | Maryland Department of General Services and University System of Maryland | | 2031 | | 100 | % | | 55 |
| | Maryland Department of General Services and University System of Maryland | | 2031 |
San Juan Mesa | | 56.3 | % | | 68 |
| | Southwestern Public Service Company | | 2025 | | 56.3 | % | | 68 |
| | Southwestern Public Service Company | | 2025 |
Sleeping Bear (b) | | | 75 | % | | 71 |
| | Public Service Company of Oklahoma | | 2032 |
| South Trent | | | 100 | % | | 101 |
| | AEP Energy Partners | | 2029 |
Spanish Fork (b) | | | 75 | % | | 14 |
| | PacifiCorp | | 2028 |
Spring Canyon II (b) | | | 90.1 | % | | 29 |
| | Platte River Power Authority | | 2039 |
Spring Canyon III (b) | | | 90.1 | % | | 25 |
| | Platte River Power Authority | | 2039 |
|
| | | | | | | | | | |
| Projects | | Percentage Ownership | | Net Capacity (MW) (a) | | Offtake Counterparty | | Expiration |
| Sleeping Bear | | 75 | % | | 71 |
| | Public Service Company of Oklahoma | | 2032 |
| South Trent | | 100 | % | | 101 |
| | AEP Energy Partners | | 2029 |
| Spanish Fork | | 75 | % | | 14 |
| | PacifiCorp | | 2028 |
Spring Canyon II (c) | | 90.1 | % | | 29 |
| | Platte River Power Authority | | 2039 |
Spring Canyon III (c) | | 90.1 | % | | 25 |
| | Platte River Power Authority | | 2039 |
| Taloga | | 100 | % | | 130 |
| | Oklahoma Gas & Electric | | 2031 |
| Wildorado | | 74.9 | % | | 121 |
| | Southwestern Public Service Company | | 2027 |
| | | | | 1,999 |
| | | | |
| Thermal | | | | | | | | |
Thermal equivalent MWt(e) | | 100 | % | | 1,315 |
| | Various | | Various |
| Thermal generation | | 100 | % | | 124 |
| | Various | | Various |
| | | | | | | | | |
Total net capacity (excluding equivalent MWt) (f) | | | | 4,559 |
| | | | |
|
| | | | | | | | | | |
| Projects | | Percentage Ownership | | Net Capacity (MW) (a) | | Offtake Counterparty | | Expiration |
| Taloga | | 100 | % | | 130 |
| | Oklahoma Gas & Electric | | 2031 |
Wildorado (b) | | 74.9 | % | | 121 |
| | Southwestern Public Service Company | | 2027 |
| | | | | 1,999 |
| | | | |
| Thermal | | | | | | | | |
Thermal equivalent MWt(c) | | 100 | % | | 1,319 |
| | Various | | Various |
| NRG Energy Center Dover LLC | | 100 | % | | 103 |
| | NRG Power Marketing LLC | | 2018 |
| Thermal generation | | 100 | % | | 20 |
| | Various | | Various |
| | | | | 1,442 |
| | | | |
Total net capacity (excluding equivalent MWt) (d) | | | | 4,686 |
| | | | |
(a) Net capacity represents the maximum, or rated, generating capacity of the facility multiplied by the Company's percentage ownership in the facility as of December 31, 2015.2016.
(b) On September 30, 2015, the Company acquired NRG's remaining 0.05% for an immaterial amount.
(c) Projects are part of tax equity arrangements, as further described in Note 2, Summary of Significant Accounting Policies andNote 5, Investments Accounted for by the Equity Method and Variable Interest Entities.arrangements.
(d)(c) PPA began on January 1, 2016.
(e)For thermal energy, net capacity represents MWt for steam or chilled water and excludes 134 MWt available under the right-to-use provisions contained in agreements between two of the Company's thermal facilities and certain of its customers.
(f)(d) TotalNRG Yield's total generation capacity is net of 6 MWs for noncontrolling interest for Spring Canyon II and III. NRG Yield's generation capacity excludes capacityincluding this noncontrolling interest was 4,692 MWs.
In addition to the facilities owned or leased in the table above, the Company entered into partnerships to own or purchase solar power generation projects, as well as other ancillary related assets from a related party via intermediate funds. The Company does not consolidate these partnerships and accounts for RPV Holdco and DGPV Holdco, which are consolidated by NRG,them as equity method investments. The Company's net interest in these projects is 131 MW based on cash to be distributed. For further described indiscussions, refer to Note 5, Investments Accounted for by the Equity Method and Variable Interest Entities.Entities to the Consolidated Financial Statements.
Substantially all of the Company's generation assets are under long-term contractual arrangements for the output or capacity from these assets. The thermal assets are comprised of district energy systems and combined heat and power plants that produce steam, hot water and/or chilled water and, in some instances, electricity at a central plant. Three out of the fourteen district energy systems are subject to rate regulation by state public utility commissions while the other district energy systems have rates determined by negotiated bilateral contracts.
The historical combined financial statements include allocations of certain NRG corporate expenses. Management believes the assumptions and methodology underlying the allocation of general corporate overhead expenses are reasonable. The allocated costs include legal, accounting, tax, treasury, information technology, insurance, employee benefit costs, and other corporate costs. However, such expenses may not be indicative of the actual level of expense that would have been incurred ifAs described in Note 15, Related Party Transactions, the Company had operated as an independent, publicly-traded company during the period prior to the offering or of the costs expected to be incurred in the future. Allocations of NRG corporate expenses were $3 million for the period from January 1, 2013, through July 22, 2013. In connection with the initial public offering, the Company entered intohas a management services agreement with NRG for various services, including human resources, accounting, tax, legal, information systems, treasury, and risk management. Costs incurred by the Company under this agreement were $3 million for the period from July 23, 2013, through December 31, 2013, $6 million for the year ended December 31, 2014 and $8 million for the year ended December 31, 2015, which included certain direct expenses incurred by NRG on behalf of the Company.
For the period prior to the initial public offering, members' equity represents the combined equity of the Company's subsidiaries, including adjustments necessary to present the Company's financial statements as if the Company were in existence as of the beginning of the periods presented. Member's equity represents NRG's equity in the subsidiaries, and accordingly, in connection with the initial public offering, the historical equity balance as of that date was reclassified into noncontrolling interest. Subsequent to the initial public offering, stockholders'Stockholders' equity represents the equity associated with the Class A and Class C common stockholders, with the equity associated with the Class B and Class D common stockholders, orstockholder, NRG, and the third-party interests under certain tax equity arrangements are classified as noncontrolling interest.
As described in Note 3, Business Acquisitions,During the years ending December 31, 2016 and 2015, the Company has completed three acquisitions of Drop Down Assets from NRG during the years ended December 31, 2015, and December 31, 2014, as follows:
On November 3, 2015, the Company acquired 75% of the Class B interests of NRG Wind TE Holdco, or the November 2015 Drop Down Assets, for total cash consideration of $209 million. In February 2016, NRG made a final working capital payment of $2 million, reducing total cash consideration to $207 million.NRG. The Company is responsible for its pro-rata share of non-recourse project debt of $193 million and noncontrolling interest associated with a tax equity structure of $159 million (as of the acquisition date).
On January 2, 2015, the Company acquired the Laredo Ridge, Tapestry, and Walnut Creek projects, or the January 2015 Drop Down Assets, for total cash consideration of $489 million, plus assumed project-level debt of $737 million.
On June 30, 2014, the Company acquired the TA High Desert, Kansas South, and El Segundo projects from NRG for total cash consideration of $357 million plus assumed project level debt of $612 million.
Theaccounting guidance requires retrospective combination of the entities for all periods presented as if the combination has been in effect since the inception of common control. Accordingly, the Company prepared its consolidated financial statements and the notes to the consolidated financial statements to reflect the transfers as if they had taken place from the beginning of the financial statementsstatement period or from the date the entities were under common control (if later than the beginning of the financial statementsstatement period), which was May 13, 2013 for Kansas South, March 28, 2013 for TA High Desert, and April 1, 2014 for the January 2015 Drop Down Assets and the majority of the November 2015 Drop Down Assets, and which represent the dates these entities were acquired by NRG. The recast did not affect net income attributable to NRG Yield, Inc., weighted average number of shares outstanding, earnings per common share, or dividends. With respect to the November 2015 Drop Down Asset acquisition, the Company has recorded all minority interests in NRG Wind TE Holdco as noncontrolling interest in the Consolidated Financial Statements for all periods presented.. For further discussion, see Note 3, Business Acquisitions.
Note 2 — Summary of Significant Accounting Policies
Basis of Presentation and Principles of Consolidation
The Company's consolidated and combined financial statements have been prepared in accordance with U.S. GAAP. The FASB ASC is the source of authoritative U.S. GAAP to be applied by nongovernmental entities. In addition, the rules and interpretative releases of the SEC under authority of federal securities laws are also sources of authoritative U.S. GAAP for SEC registrants.
The consolidated and combined financial statements include the Company's accounts and operations and those of its subsidiaries in which it has a controlling interest. All significant intercompany transactions and balances have been eliminated in consolidation. The usual condition for a controlling financial interest is ownership of a majority of the voting interests of an entity. However, a controlling financial interest may also exist through arrangements that do not involve controlling voting interests. As such, the Company applies the guidance of ASC 810, Consolidations, or ASC 810, to determine when an entity that is insufficiently capitalized or not controlled through its voting interests, referred to as a variable interest entity, or VIE, should be consolidated.
Cash and Cash Equivalents
Cash and cash equivalents include highly liquid investments with an original maturity of three months or less at the time of purchase. Cash and cash equivalents held at project subsidiaries was $93$105 million and $74$93 million as of December 31, 2015,2016 and 2014,2015, respectively.
Restricted Cash
Restricted cash consists primarily of funds held to satisfy the requirements of certain debt agreements and funds held within the Company's projects that are restricted in their use. Of these funds as of December 31, 2015,2016, approximately $2$25 million is designated for current debt service payments, $7$13 million is designated to fund operating expenses and $2$37 million is designated for distributions to the Company, with the remaining $37$90 million restricted for reserves including debt service, performance obligations and other reserves, as well as capital expenditures.
Trade Receivables and Allowance for Doubtful Accounts
Trade receivables are reported on the balance sheet at the invoiced amount adjusted for any write-offs and the allowance for doubtful accounts. The allowance for doubtful accounts is reviewed periodically based on amounts past due and significance. The allowance for doubtful accounts was immaterial as of December 31, 2015,2016 and 2014.2015.
Inventory
Inventory consists principally of spare parts and fuel oil andoil. Spare parts inventory is valued at the weighted average cost, unless evidence indicates that the weighted average cost will not be recovered with a normal profit in the ordinary course of business. Fuel oil inventory is valued at the lower of weighted average cost or market. The Company removes fuel inventories as they are used in the production of steam, chilled water or electricity. Spare parts inventory are removed when they are used for repairs, maintenance or capital projects.
Property, Plant and Equipment
Property, plant and equipment are stated at cost or, in the case of third party business acquisitions, fair value; however impairment adjustments are recorded whenever events or changes in circumstances indicate that their carrying values may not be recoverable. See Note 3, Business Acquisitions, for more information on acquired property, plant and equipment. Significant additions or improvements extending asset lives are capitalized as incurred, while repairs and maintenance that do not improve or extend the life of the respective asset are charged to expense as incurred. Depreciation is computed using the straight-line method over the estimated useful lives. Certain assets and their related accumulated depreciation amounts are adjusted for asset retirements and disposals with the resulting gain or loss included in cost of operations in the consolidated statements of operations.
Additionally, the Company reduces the book value of the property, plant and equipment of its eligible renewable energy projects for any cash grants that are submitted to the U.S. Treasury Department when the receivable is recorded for the net realizable amount. The related deferred tax asset is also recorded with a corresponding reduction to the book value of the property, plant and equipment.
Asset Impairments
Long-lived assets that are held and used are reviewed for impairment whenever events or changes in circumstances indicate carrying values may not be recoverable. Such reviews are performed in accordance with ASC 360. An impairment loss is recognizedindicated if the total future estimated undiscounted cash flows expected from an asset are less than its carrying value. An impairment charge is measured by the difference between an asset's carrying amount and fair value with the difference recorded in operating costs and expenses in the statements of operations. Fair values are determined by a variety of valuation methods, including appraisals, sales prices of similar assets and present value techniques. For further discussion of the Company's long-lived asset impairments, refer to Note 9, Asset Impairments.
Investments accounted for by the equity method are reviewed for impairment in accordance with ASC 323, Investments-Equity Method and Joint Ventures, which requires that a loss in value of an investment that is other than a temporaryan other-than-temporary decline should be recognized. The Company identifies and measures losses in the value of equity method investments based upon a comparison of fair value to carrying value.
Capitalized InterestInterest incurred on funds borrowed to finance capital projects is capitalized, until the project under construction is ready for its intended use. The amount of interest capitalized for the year ended December 31, 2013, was $18 million. The Company recorded less than $1 million of capitalized interest during the years ended December 31, 2015, and 2014.
When a project is available for operations, capitalized interest is reclassified to property, plant and equipment and depreciated on a straight-line basis over the estimated useful life of the project's related assets.
Debt Issuance Costs
Debt issuance costs are capitalized and amortized as interest expense on a basis which approximates the effective interest method over the term of the related debt. As discussed below, as of December 31, 2015, the Company adopted ASU 2015-03, Interest - Imputation of Interest (Subtopic 835-30): Simplifying the Presentation of Debt Issuance Costs, and reclassified debt issuance costs related to bethe long term debt are presented as a direct deduction from the carrying amount of the related debt in both the current and prior periods. Debt issuance costs related to the senior secured revolving credit facility line of credit are recorded as a non-current asset on the balance sheet and are amortized over the term of the loan.
Intangible Assets
Intangible assets represent contractual rights held by the Company. The Company recognizes specifically identifiable intangible assets including customer contracts,power purchase agreements, leasehold improvements, customer relationships, power purchase agreementscustomer contracts, and development rights when specific rights and contracts are acquired. These intangible assets are amortized primarily on a straight-line basis.
Notes Receivable
Notes receivable consistsconsist of receivables related to the financing of required network upgrades. The notes issued with respect to network upgrades will be repaid within a 5 year5-year period following the date each facility reachesreached commercial operations.
Income Taxes
The Company accounts for income taxes using the liability method in accordance with ASC 740, Income Taxes, or ASC 740, which requires that itthe Company use the asset and liability method of accounting for deferred income taxes and provide deferred income taxes for all significant temporary differences.
The Company has two categories of income tax expense or benefit — current and deferred, as follows:
Current income tax expense or benefit consists solely of current taxes payable less applicable tax credits, and
Deferred income tax expense or benefit is the change in the net deferred income tax asset or liability, excluding amounts charged or credited to accumulated other comprehensive income.
The Company reports some of its revenues and expenses differently for financial statement purposes than for income tax return purposes, resulting in temporary and permanent differences between the Company's financial statements and income tax returns. The tax effects of such temporary differences are recorded as either deferred income tax assets or deferred income tax liabilities in the Company's consolidated balance sheets. The Company measures its deferred income tax assets and deferred income tax liabilities using income tax rates that are currently in effect. The Company believes it is more likely than not that the results of future operations will generate sufficient taxable income which includes the future reversal of existing taxable temporary differences to realize deferred tax assets, net of valuation allowances. In arriving at this conclusion to utilize projections of future profit before tax in its estimate of future taxable income, the Company considered the profit before tax generated in recent years. A valuation allowance is recorded to reduce the net deferred tax assets to an amount that is more-likely-than-not to be realized.
The Company accounts for uncertain tax positions in accordance with ASC 740, which applies to all tax positions related to income taxes. Under ASC 740, tax benefits are recognized when it is more-likely-than-not that a tax position will be sustained upon examination by the authorities. The benefit recognized from a position that has surpassed the more-likely-than-not threshold is the largest amount of benefit that is more than 50% likely to be realized upon settlement. The Company recognizes interest and penalties accrued related to uncertain tax benefits as a component of income tax expense.
In accordance with ASC 805740 and as discussed further in Note 13,14, Income Taxes, changes to existing net deferred tax assets or valuation allowances or changes to uncertain tax benefits, are recorded to income tax expense.
Revenue Recognition
Thermal Revenues
Steam and chilled water revenue is recognized based on customer usage as determined by meter readings taken at month-end. Some locations read customer meters throughout the month, and recognize estimated revenue for the period between meter read date and month-end. The Thermal Business subsidiaries collect and remit state and local taxes associated with sales to their customers, as required by governmental authorities. These taxes are presented on a net basis in the income statement.
Power Purchase Agreements, or PPAs
The majority of the Company’s revenues are obtained through PPAs or other contractual agreements. In order to determine lease classificationagreements, which are accounted for as operating the Company evaluates the terms of the PPA to determine if the lease includes any of the following provisions which would indicate capital lease treatment:
•Transfers the ownership of the generating facility,
•Bargain purchase option at the end of the term of the lease,
•Lease term is greater than 75% of the economic life of the generating facility, or
Present value of minimum lease payments exceeds 90% of the fair value of the generating facility at inception of the lease
In considering the above it was determined that all of Company’s PPAs are operating leases.leases under ASC 840. ASC 840 requires the minimum lease payments received to be amortized over the term of the lease and contingent rentals are recorded when the achievement of the contingency becomes probable. Judgment is required by management in determining the economic life of each generating facility, in evaluating whether certain lease provisions constitute minimum payments or represent contingent rent and other factors in determining whether a contract contains a lease and whether the lease is an operating lease or capital lease.
Certain of these leases have no minimum lease payments and all of the rental income under these leases is recorded as contingent rent on an actual basis when the electricity is delivered. The contingent rental income recognized in the years ended December 31, 2016, 2015, and 2014 and 2013 was $332$553 million, $212$416 million, and $88$296 million, respectively.
Derivative Financial Instruments
The Company accounts for derivative financial instruments under ASC 815, Derivatives and Hedging, or ASC 815, which requires the Company to record all derivatives on the balance sheet at fair value unless they qualify for a NPNS exception. Changes in the fair value of non-hedge derivatives are immediately recognized in earnings. Changes in the fair value of derivatives accounted for as hedges, if elected for hedge accounting, are either:
Recognized in earnings as an offset to the changes in the fair value of the related hedged assets, liabilities and firm commitments; or
Deferred and recorded as a component of accumulated OCI until the hedged transactions occur and are recognized in earnings.
The Company's primary derivative instruments are power salespurchase or sale contracts used to mitigate variability in earnings due to fluctuations in market prices, fuels purchase contracts used to control customer reimbursable fuel cost, and interest rate instruments used to mitigate variability in earnings due to fluctuations in interest rates. On an ongoing basis, the Company assesses the effectiveness of all derivatives that are designated as hedges for accounting purposes in order to determine that each derivative continues to be highly effective in offsetting changes in fair values or cash flows of hedged items. Internal analyses that measure the statistical correlation between the derivative and the associated hedged item determine the effectiveness of such a contract designated as a hedge. If it is determined that the derivative instrument is not highly effective as a hedge, hedge accounting will be discontinued prospectively. In this case, the gain or loss previously deferred in accumulated OCI would be frozen until the underlying hedged item is delivered unless the transaction being hedged is no longer probable of occurring in which case the amount in OCI would be immediately reclassified into earnings. If the derivative instrument is terminated, the effective portion of this derivative deferred in accumulated OCI will be frozen until the underlying hedged item is delivered.
Revenues and expenses on contracts that qualify for the NPNS exception are recognized when the underlying physical transaction is delivered. While these contracts are considered derivative financial instruments under ASC 815, they are not recorded at fair value, but on an accrual basis of accounting. If it is determined that a transaction designated as NPNS no longer meets the scope exception, the fair value of the related contract is recorded on the balance sheet and immediately recognized through earnings.
Concentrations of Credit Risk
Financial instruments which potentially subject the Company to concentrations of credit risk consist primarily of accounts receivable, notes receivable and derivative instruments, which are concentrated within entities engaged in the energy and financial industry. These industry concentrations may impact the overall exposure to credit risk, either positively or negatively, in that the customers may be similarly affected by changes in economic, industry or other conditions. In addition, many of the Company's projects have only one customer. However, the Company believes that the credit risk posed by industry concentration is offset by the diversification and creditworthiness of its customer base. See Note 6, Fair Value of Financial Instruments, for a further discussion of derivative concentrations and Note 12,13, Segment Reporting, for concentration of counterparties.
Fair Value of Financial Instruments
The carrying amount of cash and cash equivalents, restricted cash, accounts receivable, accounts payable, intercompanyreceivable - affiliate, accounts payable, and receivable,current portion of account payable - affiliate, and accrued expenses and other current liabilities approximate fair value because of the short-term maturity of these instruments. See Note 6, Fair Value of Financial Instruments, for a further discussion of fair value of financial instruments.
Asset Retirement Obligations
Asset retirement obligations, or AROs, are accounted for in accordance with ASC 410-20, Asset Retirement Obligations, or ASC 410-20. Retirement obligations associated with long-lived assets included within the scope of ASC 410-20 are those for which a legal obligation exists under enacted laws, statutes, and written or oral contracts, including obligations arising under the doctrine of promissory estoppel, and for which the timing and/or method of settlement may be conditional on a future event. ASC 410-20 requires an entity to recognize the fair value of a liability for an ARO in the period in which it is incurred and a reasonable estimate of fair value can be made.
Upon initial recognition of a liability for an ARO, the asset retirement cost is capitalized by increasing the carrying amount of the related long-lived asset by the same amount. Over time, the liability is accreted to its future value, while the capitalized cost is depreciated over the useful life of the related asset. The Company's asset retirementAROs are primarily related to the future dismantlement of equipment on leased property and environmental obligations were $39 millionrelated to site closures and $29 million as of December 31, 2015, and 2014, respectively.fuel storage facilities. The Company records AROs as part of other non-current liabilities on its balance sheet.
The following table represents the balance of ARO obligations as of December 31, 2016 and 2015, along with the additions and accretion related to the Company's ARO obligations for the year ended December 31, 2016:
|
| | | |
| | (In millions) |
| Balance as of December 31, 2015 | $ | 43 |
|
| Revisions in estimates for current obligations | 2 |
|
| Accretion — expense | 3 |
|
| Balance as of December 31, 2016 | $ | 48 |
|
Guarantees
The Company enters into various contracts that include indemnification and guarantee provisions as a routine part of its business activities. Examples of these contracts include EPC agreements, operation and maintenance agreements, service agreements, commercial sales arrangements and other types of contractual agreements with vendors and other third parties, as well as affiliates. These contracts generally indemnify the counterparty for tax, environmental liability, litigation and other matters, as well as breaches of representations, warranties and covenants set forth in these agreements. Because many of the guarantees and indemnities the Company issues to third parties and affiliates do not limit the amount or duration of its obligations to perform under them, there exists a risk that the Company may have obligations in excess of the amounts agreed upon in the contracts mentioned above. For those guarantees and indemnities that do not limit the liability exposure, itthe Company may not be able to estimate what the liability would be, until a claim is made for payment or performance, due to the contingent nature of these contracts.
Investments Accounted for by the Equity Method
The Company has investments in ninevarious energy projects accounted for by the equity method, threefour of which are VIEs, where the Company is not a primary beneficiary, and two of which are owned by a subsidiary that is consolidated as a VIE, as described in Note 5, Investments Accounted for by the Equity Method and Variable Interest Entities. The equity method of accounting is applied to these investments in affiliates because the ownership structure prevents the Company from exercising a controlling influence over the operating and financial policies of the projects. Under this method, equity in pre-tax income or losses of the investments is reflected as equity in earnings of unconsolidated affiliates. Distributions from equity method investments that represent earnings on the Company's investment are included within cash flows from operating activities and distributions from equity method investments that represent a return of the Company's investment are included within cash flows from investing activities.
Sale Leaseback Arrangements
The Company is party to sale-leaseback arrangements that provide for the sale of certain assets to a third party and simultaneous leaseback to the Company. In accordance with ASC 840-40, Sale-Leaseback Transactions, if the seller-lessee retains, through the leaseback, substantially all of the benefits and risks incident to the ownership of the property sold, the sale-leaseback transaction is accounted for as a financing arrangement. An example of this type of continuing involvement would include an option to repurchase the assets or the buyer-lessor having the option to sell the assets back to the Company. This provision is included in most of the Company’s sale-leaseback arrangements. As such, the Company accounts for these arrangements as financings.
Under the financing method, the Company does not recognize as income any of the sale proceeds received from the lessor that contractually constitutes payment to acquire the assets subject to these arrangements. Instead, the sale proceeds received are accounted for as financing obligations and leaseback payments made by the Company are allocated between interest expense and a reduction to the financing obligation. Interest on the financing obligation is calculated using the Company’s incremental borrowing rate at the inception of the arrangement on the outstanding financing obligation. Judgment is required to determine the appropriate borrowing rate for the arrangement and in determining any gain or loss on the transaction that would be recorded either at the end of or over the lease term.
Business Combinations
The Company accounts for its business combinations in accordance with ASC 805, Business Combinations, or ASC 805. For third party acquisitions, ASC 805 requires an acquirer to recognize and measure in its financial statements the identifiable assets acquired, the liabilities assumed, and any noncontrolling interest in the acquiree at fair value at the acquisition date. It also recognizes and measures the goodwill acquired or a gain from a bargain purchase in the business combination and determines what information to disclose to enable users of an entity's financial statements to evaluate the nature and financial effects of the business combination. In addition, transaction costs are expensed as incurred. For acquisitions that relate to entities under common control, ASC 805 requires retrospective combination of the entities for all periods presented as if the combination has been in effect from the beginning of the financial statement period of from the date the entities were under common control (if later than the beginning of the financial statement period). The difference between the cash paid and historical value of the entities' equity is recorded as a distribution/contribution from/to NRG with the offset to noncontrolling interest. Transaction costs are expensed as incurred.
Use of Estimates
The preparation of consolidated financial statements in accordance with U.S. GAAP requires management to make estimates and assumptions. These estimates and assumptions impact the reported amount of assets and liabilities and disclosures of contingent assets and liabilities as of the date of the consolidated financial statements. They also impact the reported amount of net earnings during the reporting period. Actual results could be different from these estimates.
In recording transactions and balances resulting from business operations, the Company uses estimates based on the best information available. Estimates are used for such items as plant depreciable lives, tax provisions, uncollectible accounts, environmental liabilities, acquisition accounting and legal costs incurred in connection with recorded loss contingencies, among others. In addition, estimates are used to test long-lived assets for impairment and to determine the fair value of impaired assets. As better information becomes available or actual amounts are determinable, the recorded estimates are revised. Consequently, operating results can be affected by revisions to prior accounting estimates.
Tax Equity Arrangements
Certain portions of the Company’s noncontrolling interests in subsidiaries represent third-party interests in the net assets under certain tax equity arrangements, which are consolidated by the Company, that have been entered into to finance the cost of wind facilities eligible for certain tax credits. Additionally, certain portions of the Company’s investments in unconsolidated affiliates reflect the Company’s interests in tax equity arrangements, that are not consolidated by the Company, that have been entered into to finance the cost of distributed solar energy systems under operating leases or PPAs eligible for certain tax credits. The Company has determined that the provisions in the contractual agreements of these structures represent substantive profit sharing arrangements. Further, the Company has determined that the appropriate methodology for calculating the noncontrolling interest and investment in unconsolidated affiliates that reflects the substantive profit sharing arrangements is a balance sheet approach utilizing the hypothetical liquidation at book value, or HLBV, method. Under the HLBV method, the amounts reported as noncontrolling interests and investment in unconsolidated affiliates represent the amounts the investors to the tax equity arrangements would hypothetically receive at each balance sheet date under the liquidation provisions of the contractual agreements, assuming the net assets of the funding structures were liquidated at their recorded amounts determined in accordance with U.S. GAAP. The investors’ interests in the results of operations of the funding structures are determined as the difference in noncontrolling interests and investment in unconsolidated affiliates at the start and end of each reporting period, after taking into account any capital transactions between the structures and the funds’ investors. The calculations utilized to apply the HLBV method include estimated calculations of taxable income or losses for each reporting period.
Certain prior-yearprior year amounts have been reclassified for comparative purposes.
Recent Accounting Developments
ASU 2016-18 — In November 2016, the FASB issued ASU No. 2016-18, Statement of Cash Flows (Topic 230), Restricted Cash, or ASU No. 2016-18. The amendments of ASU No. 2016-18 were issued to address the diversity in classification and presentation of changes in restricted cash and restricted cash equivalents on the statement of cash flows which is currently not addressed under Topic 230. The amendments of ASU No. 2016-18 would require an entity to include amounts generally described as restricted cash and restricted cash equivalents with cash and cash equivalents when reconciling the beginning of period and end of period total amounts on the statement of cash flows. The amendments of ASU No. 2016-18 are effective for annual reporting periods beginning after December 15, 2017, and interim periods within those annual periods. Early adoption is permitted and the adoption of ASU No. 2016-18 should be applied retrospectively. The Company is currently evaluating the impact of the standard on the Company’s statement of cash flows.
ASU 2016-16 — In October 2016, the FASB issued ASU No. 2016-16, Income Taxes (Topic 740), Intra-Entity Transfers of Assets Other Than Inventory, or ASU No. 2016-16. The amendments of ASU No. 2016-16 were issued to improve the accounting for the income tax consequences of intra-entity transfers of assets other than inventory. Current GAAP prohibits the recognition of current and deferred income taxes for an intra-entity asset transfer until the asset has been sold to an outside party which has resulted in diversity in practice and increased complexity within financial reporting. The amendments of ASU No. 2016-16 would require an entity to recognize the income tax consequences of an intra-entity transfer of an asset other than inventory when the transfer occurs and do not require new disclosure requirements. The amendments of ASU No. 2016-16 are effective for annual reporting periods beginning after December 15, 2017, and interim periods within those annual periods. Early adoption is permitted and the adoption of ASU No. 2016-16 should be applied on a modified retrospective basis through a cumulative-effect adjustment directly to retained earnings as of the beginning of the period of adoption. The Company is currently evaluating the impact of the standard on the Company’s results of operations, cash flows and financial position.
ASU 2016-15 — In August 2016, the FASB issued ASU No. 2016-15, Statement of Cash Flows (Topic 230), Classification of Certain Cash Receipts and Cash Payments, or ASU No. 2016-15. The amendments of ASU No. 2016-15 were issued to address eight specific cash flow issues for which stakeholders have indicated to the FASB that a diversity in practice existed in how entities were presenting and classifying these items in the statement of cash flows. The issues addressed by ASU No. 2016-15 include but are not limited to the classification of debt prepayment and debt extinguishment costs, payments made for contingent consideration for a business combination, proceeds from the settlement of insurance proceeds, distributions received from equity method investees and separately identifiable cash flows and the application of the predominance principle. The amendments of ASU No. 2016-15 are effective for public entities for fiscal years beginning after December 15, 2017 and interim periods in those fiscal years. Early adoption is permitted, including adoption in an interim fiscal period with all amendments adopted in the same period. The adoption of ASU No. 2016-15 is required to be applied retrospectively. The Company is currently evaluating the impact of the standard on the Company's statement of cash flows.
ASU 2016-07 — In March 2016, the FASB issued ASU No. 2016-07, Investments - Equity Method and Joint Ventures (Topic 323), or ASU No. 2016-07. The amendments of ASU No. 2016-07 eliminate the requirement that when an investment qualifies
for use of the equity method as a result of an increase in the level of ownership interest or degree of influence, an investor must adjust the investment, results of operations, and retained earnings retroactively on a step-by-step basis as if the equity method had been in effect during all previous periods that the investment had been held. The amendments require that the equity method investor add the cost of acquiring the additional interest in the investee to the current basis of the investor's previously held interest and adopt the equity method of accounting with no retroactive adjustment to the investment. In addition, ASU No. 2016-07 requires that an entity that has an available-for-sale equity security that becomes qualified for the equity method of accounting recognize through earnings the unrealized holding gain or loss in accumulated other comprehensive income at the date the investment becomes qualified for use of the equity method. The Company adopted this standard effective January 1, 2017. The adoption of ASU No. 2016-07 is required to be applied prospectively. The Company does not expect the standard to have a material impact on its results of operations, cash flows and financial position.
ASU 2016-02 — In 2016, the FASB issued ASU No. 2016-02, Leases (Topic 842), or Topic 842, with the objective to increase transparency and comparability among organizations by recognizing lease assets and lease liabilities on the balance sheet and to improve financial reporting by expanding the related disclosures. The guidance in Topic 842 provides that a lessee that may have previously accounted for a lease as an operating lease under current GAAP should recognize the assets and liabilities that arise from a lease on the balance sheet. In addition, Topic 842 expands the required quantitative and qualitative disclosures with regards to lease arrangements. The Company expects to adopt the standard effective January 1, 2019 utilizing the required modified retrospective approach for the earliest period presented. The Company expects to elect certain of the practical expedients permitted, including the expedient that permits the Company to retain its existing lease assessment and classification. The Company is currently working through an adoption plan and evaluating the anticipated impact on the Company's results of operations, cash flows and financial position. While the Company is currently evaluating the impact the new guidance will have on its financial position and results of operations, the Company expects to recognize lease liabilities and right of use assets. The extent of the increase to assets and liabilities associated with these amounts remains to be determined pending the Company’s review of its existing lease contracts and service contracts which may contain embedded leases. As this review is still in process, it is currently not practicable to quantify the impact of adopting the ASU at this time.
ASU 2016-01 — In January 2016, the FASB issued ASU No. 2016-01, Financial Instruments - Overall (Subtopic 825-10): Recognition and Measurement of Financial Assets and Financial Liabilities, or ASU No. 2016-01. The amendments of ASU No. 2016-01 eliminate available-for-sale classification of equity investments and require that equity investments (except those accounted for under the equity method of accounting, or those that result in consolidation of the investee) to be generally measured at fair value with changes in fair value recognized in net income. Further, the amendments require that financial assets and financial liabilities to be presented separately in the notes to the financial statements, grouped by measurement category and form of financial asset. The guidance in ASU No. 2016-01 is effective for financial statements issued for fiscal years beginning after December 15, 2017, and interim periods within those annual periods. The Company is currently evaluating the impact of the standard on the Company's results of operations, cash flows and financial position.
ASU 2015-17 —In November 2015, the FASB issued ASU No. 2015-17, Income Taxes (Topic 740): Balance Sheet Classification of Deferred Taxes, or ASU No. 2015-17. The amendments of ASU No. 2015-17 require that deferred tax liabilities and assets, as well as any related valuation allowance, be presented as noncurrent in a classified statement of financial position. The guidance in ASU No. 2015-17 is effective for financial statements issued for fiscal years beginning after December 15, 2016, and interim periods within those annual periods. The amendments may be applied either prospectively to all deferred tax liabilities and assets or retrospectively to all periods presented. Early adoption is permitted. The Company adopted the standard for the year ended December 31, 2015, and elected to apply the amendments retrospectively. The adoption did not have any impact on the Company's results of operations, cash flows, or net assets.
ASU 2015-16 — In September 2015, the FASB issued ASU No. 2015-16, Business Combinations (Topic 805): Simplifying the Accounting for Measurement-Period Adjustments, or ASU No. 2015-16. The amendments of ASU No. 2015-16 require that an acquirer recognize measurement period adjustments to the provisional amounts recognized in a business combination in the reporting period during which the adjustments are determined. Additionally, the amendments of ASU No. 2015-16 require the acquirer to record in the same period's financial statements the effect on earnings of changes in depreciation, amortization or other income effects, if any, as a result of the measurement period adjustment, calculated as if the accounting had been completed at the acquisition date as well as disclosing on either the face of the income statement or in the notes the portion of the amount recorded in current period earnings that would have been recorded in previous reporting periods. The guidance in ASU No. 2015-16 is effective for financial statements issued for fiscal years beginning after December 15, 2015, and interim periods within those fiscal years. The amendments should be applied prospectively. The Company adopted ASU No. 2015-16 for the year ended December 31, 2016, and the adoption of this standard isdid not expected to have a material impact on the Company's results of operations, cash flows orand financial position.
ASU 2015-03 and ASU 2015-15 — In April 2015, the FASB issued ASU No. 2015-03, Interest - Imputation of Interest (Subtopic 835-30): Simplifying the Presentation of Debt Issuance Costs, or ASU No. 2015-03. The amendments of ASU No. 2015-03 were issued to reduce complexity in the balance sheet presentation of debt issuance costs. ASU No. 2015-03 requires that debt issuance costs be presented in the balance sheet as a direct deduction from the carrying amount of debt liability, consistent with debt discounts or premiums. The recognition and measurement guidance for debt issuance costs are not affected by the amendments in this standard. Additionally, in August 2015, the FASB issued ASU No. 2015-15, Interest - Imputation of Interest (Subtopic 835-30): Presentation and Subsequent Measurement of Debt Issuance Costs Associated with Line-of-Credit Arrangements, or ASU No. 2015-15, as ASU No. 2015-03 did not specifically address presentation or subsequent measurement of debt issuance costs related to line-of-credit arrangements. ASU No. 2015-15 allows an entity to continue to defer and present debt issuance costs ratably over the term of the line-of-credit arrangement, regardless of whether there are any outstanding borrowings on the line-of-credit arrangement. The guidance in ASU No. 2015-03 and ASU No. 2015-15 is effective for financial statements issued for fiscal years beginning after December 15, 2015, and interim periods within those fiscal years. Early adoption is permitted for financial statements that have not been previously issued. The Company adopted ASU No. 2015-03 for the year ended December 31, 2015, which resulted in decreases to other assets and debt of $60 million and $64 million as of December 31, 2015, and December 31, 2014, respectively. The adoption of this standard had no impact on the Company's results of operations, cash flows or net assets.
ASU 2015-02 — In February 2015, the FASB issued ASU No. 2015-02, Consolidation (Topic 810): Amendments to the Consolidation Analysis, or ASU No. 2015-02. The amendments of ASU No. 2015-02 were issued in an effort to minimize situations under previously existing guidance in which a reporting entity was required to consolidate another legal entity in which that reporting entity did not have: (1) the ability through contractual rights to act primarily on its own behalf; (2) ownership of the majority of the legal entity's voting rights; or (3) the exposure to a majority of the legal entity's economic benefits. ASU No. 2015-02 affects reporting entities that are required to evaluate whether they should consolidate certain legal entities. All legal entities are subject to reevaluation under the revised consolidation model. The guidance in ASU No. 2015-02 is effective for periods beginning after December 15, 2015. Early adoption is permitted. The Company adopted the standard effective January 1, 2015 and the adoption of this standard did not impact the Company's results of operations, cash flows or financial position.
ASU 2014-16 - In November 2014, the FASB issued ASU No. 2014-16, Derivatives and Hedging (Topic 815): Determining Whether the Host Contract in a Hybrid Financial Instrument Issued in the Form of a Share Is More Akin to Debt or to Equity, or ASU No. 2014-16. The amendments of ASU No. 2014-16 clarify how U.S. GAAP should be applied in determining whether the nature of a host contract is more akin to debt or equity and in evaluating whether the economic characteristics and risks of an embedded feature are "clearly and closely related" to its host contract. The guidance in ASU No. 2014-16 is effective for fiscal years, and interim periods within those fiscal years, beginning after December 15, 2015. Early adoption is permitted. The Company adopted the standard effective January 1, 2015 and the adoption of this standard did not impact the Company's results of operations, cash flows or financial position.
ASU 2014-09- — In May 2014, the FASB issued ASU No. 2014-09, Revenue from Contracts with Customers (Topic 606), or ASU No. 2014-09.2014-09, which was further amended through various updates issued by the FASB thereafter. The amendments of ASU No. 2014-09 completecompleted the joint effort between the FASB and the International Accounting Standards Board, or IASB, to develop a common revenue standard for U.S. GAAP and International Financial Reporting Standards, or IFRS, and to improve financial reporting. The guidance in ASU No. 2014-09under Topic 606 provides that an entity should recognize revenue to depict the transfer of goods or services to customers in an amount that reflects the consideration to which the entity expects to be entitled to in exchange for the goods or services provided and establishes the following stepsa five step model to be applied by an entity: (1) identifyentity in evaluating its contracts with customers. The Company expects to adopt the contract withstandard effective January 1, 2018 and apply the guidance retrospectively to contracts at the date of adoption. The Company will recognize the cumulative effect of applying Topic 606 at the date of initial application, as prescribed under the modified retrospective transition method. The Company also expects to elect the practical expedient available under Topic 606 for measuring progress toward complete satisfaction of a customer; (2) identify the performance obligationsobligation and for disclosure requirements of remaining performance obligations. The practical expedient allows an entity to recognize revenue in the contract; (3) determineamount to which the transaction price; (4) allocateentity has the transaction priceright to invoice such that the entity has a right to the consideration in an amount that corresponds directly with the value to the customer for performance obligations in the contract; and (5) recognize revenue when (or as) the entity satisfies the performance obligation. In August 2015, the FASB issued ASU 2015-14, which formally deferred the effectivecompleted to date by one year to make the guidance of ASU No. 2014-09 effective for annual reporting periods beginning after December 15, 2017, including interim reports therein. Early adoption is permitted, but not prior to the original effective date, which was for annual reporting periods beginning after December 15, 2016.entity. The Company is currently evaluating the impactmajority of the Company's revenues are obtained through PPAs, which are currently accounted for as operating leases. In connection with the implementation of Topic 842, as described above, the Company expects to elect certain of the practical expedients permitted, including the expedient that permits the Company to retain its existing lease assessment and classification. As leases are excluded from the scope of Topic 606, the Company expects the standard to have an immaterial impact on the Company's results of operations, cash flows and financial position.position; however, the Company continues to assess the impact in connection with its plan of adoption.
Note 3 — Business Acquisitions
2016 Acquisitions
CVSR Drop Down — Prior to September 1, 2016, the Company had a 48.95% interest in CVSR, which was accounted for as an equity method investment.On September 1, 2016, the Company acquired from NRG the remaining 51.05% interest of CVSR Holdco LLC, which indirectly owns the CVSR solar facility, CVSR Drop Down, for total cash consideration of $78.5 million, plus an immaterial working capital adjustment. The acquisition was funded with cash on hand. The Company also assumed additional debt of $496 million, which represents 51.05% of the CVSR project level debt and 51.05% of the notes issued under the CVSR Holdco Financing Agreement, as further described in Note 10, Long-term Debt. In connection with the retrospective adjustment of prior periods, the Company now consolidates CVSR and 100% of its debt, consisting of $771 million of project level debt and $200 million of notes issued under the CVSR Holdco Financing Agreement as of September 1, 2016.
The assets and liabilities transferred to the Company relate to interests under common control by NRG and were recorded at historical cost in accordance with ASC 805-50, Business Combinations - Related Issues. The difference between the cash paid and historical value of the entities' equity was recorded as a distribution to NRG with the offset to noncontrolling interest. Because the transaction constituted a transfer of net assets under common control, the guidance requires retrospective combination of the entities for all periods presented as if the combination has been in effect since the inception of common control. In connection with the retrospective adjustment of prior periods, the Company has removed the equity method investment from all prior periods and adjusted its financial statements to reflect its results of operations, financial position and cash flows as if it had consolidated CVSR from the beginning of the financial statement period. As of June 30, 2016, the Company's recast consolidated balance sheet included a net receivable of $67 million related to current litigation with SunPower pursuant to indemnities in the project. The agreement between NRG and the Company for the CVSR Drop Down acquisition specified that all amounts related to the litigation with SunPower were excluded from the acquisition. Accordingly, prior to close of the transaction, the net receivable was transferred to NRG as a net reduction to its ownership interest in CVSR.
The following is the summary of historical net liabilities assumed in connection with the CVSR Drop Down as of September 1, 2016:
|
| | | |
| | CVSR |
| | (In millions) |
| Current assets | $ | 95 |
|
| Property, plant and equipment | 826 |
|
| Non-current assets | 13 |
|
| Total assets | 934 |
|
| | |
Debt (a) | 966 |
|
| Other current and non-current liabilities | 12 |
|
| Total liabilities | 978 |
|
Net liabilities assumed | (44 | ) |
| Accumulated other comprehensive loss | (25 | ) |
| Historical net liabilities assumed | $ | (19 | ) |
(a) Net of deferred financing costs of $5 million.
The Company incurred and expensed acquisition-related transaction costs related to the acquisition of CVSR of $1 million for the year ended December 31, 2016. Since the acquisition date, CVSR has contributed $22 million in operating revenues and a $2 million in net loss to the Company.
2015 Acquisitions
November 2015 Drop Down Assets from NRG
— On November 3, 2015, the Company acquired 75% of the Class B interests of NRG Wind TE Holdco, or the November 2015 Drop Down Assets, which owns a portfolio of 12 wind facilities totaling 814 net MW, from NRG for cash consideration of $209 million, subject to working capital adjustments. In February 2016, NRG made a final working capital payment of $2 million, reducing total cash consideration to $207 million. The Company is responsible for its pro-rata share of non-recourse project debt of $193 million and noncontrolling interest associated with a tax equity structure of $159 million (as of the acquisition date).
The Company funded the acquisition with borrowings from its revolving credit facility. The assets and liabilities transferred to the Company relate to interests under common control by NRG and were recorded at historical cost in accordance with ASC 805-50, Business Combinations - Related Issues.cost. The difference between the cash paid and historical value of the entities' equity was recorded as a distribution from NRG with the offset to noncontrolling interest. Because the transaction constituted a transfer of net assets under common control, the guidance requires retrospective combination of the entities for all periods presented as if the combination has been in effect since the inception of common control.
The Class A interests of NRG Wind TE Holdco are owned by a tax equity investor, or TE Investor, who receives 99% of allocations of taxable income and other items until the flip point, which occurs when the TE Investor obtains a specified return on its initial investment, at which time the allocations to the TE Investor change to 8.53%. The Company generally receives 75% of CAFD until the flip point, at which time the allocations to the Company of CAFD change to 68.60%. If the flip point has not occurred by a specified date, 100% of CAFD is allocated to the TE Investor until the flip point occurs. NRG Wind TE Holdco is a VIE and the Company is the primary beneficiary, through its position as managing member, and consolidates NRG Wind TE Holdco.
The following is a summary of assets and liabilities transferred in connection with the acquisition as of November 3, 2015:
|
| | | |
| | NRG Wind TE Holdco |
| | (In millions) |
| Current assets | $ | 30 |
|
| Property, plant and equipment | 669 |
|
| Non-current assets | 177 |
|
| Total assets | 876 |
|
| | |
| Debt | 193 |
|
| Other current and non-current liabilities | 32 |
|
| Total liabilities | 225 |
|
| Less: noncontrolling interest | 282 |
|
| Net assets acquired | $ | 369 |
|
The following table presents the historical information summary combining the financial information for the November 2015 Drop Down Assets transferred in connection with the acquisition:
| | | | December 31, 2014 | | | |
| | As Previously Reported | | NRG Wind TE Holdco | | As Currently Reported | NRG Wind TE Holdco |
| | | | | | (In millions) |
| Current assets | $ | 590 |
| (a) | $ | 66 |
| | $ | 656 |
| $ | 30 |
|
| Property, plant and equipment | 4,466 |
| | 709 |
| | 5,175 |
| 669 |
|
| Non-current assets | 1,845 |
| (a)(b) | 184 |
| | 2,029 |
| 177 |
|
| Total assets | 6,901 |
| | 959 |
| | 7,860 |
| 876 |
|
| | | | | | | |
| | | | | | | |
| Debt | 4,723 |
| (b) | 198 |
| | 4,921 |
| 193 |
|
| Other current and non-current liabilities | 293 |
| | 21 |
| | 314 |
| 32 |
|
| Total liabilities | 5,016 |
| | 219 |
| | 5,235 |
| 225 |
|
| Net assets | $ | 1,885 |
| | $ | 740 |
| (c) | $ | 2,625 |
| |
| Less: noncontrolling interest | | 282 |
|
| Net assets acquired | | $ | 369 |
|
(a)Retrospectively adjusted to reclassify deferred tax assets in accordance with ASU 2015-17, as further discussed in Note 2, Summary of Significant Accounting Policies.
(b) Retrospectively adjusted to reclassify deferred financing costs in accordance with ASU 2015-03, as further discussed in Note 2, Summary of Significant Accounting Policies.
(c) Net Assets for NRG Wind TE Holdco as of December 31, 2014, includes noncontrolling interest of $199 million attributable to the TE Investor and $135 million attributable to NRG.
|
| | | | | | | | | | | |
| | Year ended December 31, 2014 |
| | As Previously Reported | | NRG Wind TE Holdco | | As Currently Reported |
| | | | | |
| Total operating revenues | $ | 689 |
| | $ | 57 |
| | $ | 746 |
|
| Operating income | 272 |
| | (6 | ) | | 266 |
|
| Net income | 112 |
| | (13 | ) | | 99 |
|
|
| | | | | | | | | | | |
| | Year ended December 31, 2013 |
| | As Previously Reported | | NRG Wind TE Holdco | | As Currently Reported |
| | | | | |
| Total operating revenues | $ | 379 |
| | $ | 8 |
| | $ | 387 |
|
| Operating income | 167 |
| | (9 | ) | | 158 |
|
| Net income | 132 |
| | (9 | ) | | 123 |
|
Supplemental Pro Forma Information
As described above, the Company's acquisition of the November 2015 Drop Down Assets was accounted for as a transfer of entities under common control. The following unaudited supplemental pro forma information represents the results of operations as if the Company had acquired the November 2015 Drop Down Assets on January 1, 2014, including the impact of acquisition accounting with respect to NRG's acquisition of the projects, all of which were acquired by NRG on April 1, 2014, except for Elbow Creek. All net income or losses prior to the Company's acquisition of the projects is reflected as attributable to NRG and, accordingly, no pro forma impact to earnings per Class A and Class C common share was calculated.
|
| | | | |
| (In millions) | | For the year ended December 31, 2014 |
| |
| Operating revenues | | $ | 768 |
|
| Net income | | 101 |
|
Since the acquisition date, the November 2015 Drop Down Assets contributed $14 million in operating revenues and $1 million in net income.
Desert Sunlight — On June 29, 2015, the Company acquired 25% of the membership interest in Desert Sunlight Investment Holdings, LLC, which owns two solar photovoltaic facilities that total 550 MW, located in Desert Center, California from EFS Desert Sun, LLC, an affiliate of GE Energy Financial Services for a purchase price of $285 million. Power generated by the facilities is sold to Southern California Edison and Pacific Gas and Electric under long-term PPAs with approximately 20 years and 25 years of remaining contract life, respectively. The Company accounts for its 25% investment as an equity method investment.
Spring Canyon — On May 7, 2015, the Company acquired a 90.1% interest in Spring Canyon II, a 32 MW wind facility, and Spring Canyon III, a 28 MW wind facility, each located in Logan County, Colorado, from Invenergy Wind Global LLC. The purchase price was funded with cash on hand. Power generated by Spring Canyon II and Spring Canyon III is sold to Platte River Power Authority under long-term PPAs, each with approximately 24 years of remaining contract life.
University of Bridgeport Fuel Cell — On April 30, 2015, the Company completed the acquisition of the University of Bridgeport Fuel Cell project in Bridgeport, Connecticut from FuelCell Energy, Inc. The project added an additional 1.4 MW of thermal capacity to the Company's portfolio, with a 12-year contract, with the option for a 7-year extension. The acquisition is reflected in the Company's Thermal segment.
January 2015 Drop Down Assets from NRG — On January 2, 2015, the Company acquired the following projects from NRG: (i) Laredo Ridge, an 80 MW wind facility located in Petersburg, Nebraska, (ii) Tapestry, which includes Buffalo Bear, a 19 MW wind facility in Buffalo, Oklahoma; Taloga, a 130 MW wind facility in Putnam, Oklahoma; and Pinnacle, a 55 MW wind facility in Keyser, West Virginia, and (iii) Walnut Creek, a 485 MW natural gas facility located in City of Industry, California, for total cash consideration of $489 million, including $9 million for working capital, plus assumed project-level debt of $737 million. The Company funded the acquisition with cash on hand and drawings under its revolving credit facility. The assets and liabilities transferred to the Company relate to interests under common control by NRG and were recorded at historical cost in accordance with ASC 805-50, Business Combinations - Related Issues.cost. The difference between the cash paid and the historical value of the entities' equity of $61 million, as well as $23 million of AOCL, was recorded as a distribution to NRG and reduced the balance of its noncontrolling interest. Since the transaction constituted a transfer of assets under common control, the guidance requires retrospective combination of the entities for all periods presented as if the combination has been in effect since the inception of common control. NRG acquired the majority of EME's assets, including Laredo Ridge, Tapestry and Walnut Creek, on April 1, 2014.
Supplemental Pro Forma Information
As described above, the Company's acquisition of the January 2015 Drop Down Assets was accounted for as a transfer of entities under common control and all periods were retrospectively adjusted to reflect the entities as if they were transferred on the date the entities were under common control, which was April 1, 2014, the date NRG acquired Walnut Creek, Laredo Ridge and Tapestry. The following unaudited supplemental pro forma information represents the results of operations as if the Company had acquired the January 2015 Drop Down Assets on January 1, 2014, including the impact of acquisition accounting with respect to NRG's acquisition of the projects. While the financial statements have been retrospectively adjusted, all net income or losses prior to the Company's acquisition of the projects is reflected as attributable to NRG and accordingly, no pro forma impact to earnings per Class A and Class C common share was calculated.
|
| | | | |
| (In millions) | | For the year ended December 31, 2014 |
| |
| Operating revenues | | $ | 772 |
|
| Net income | | 92 |
|
Since the acquisition date, the January 2015 Drop Down Assets contributed $144 million in operating revenues and $44 million in net income.
2014 Acquisitions
Alta Wind Portfolio Acquisition — On August 12, 2014, the Company acquired 100% of the membership interests of Alta Wind Asset Management Holdings, LLC, Alta Wind Company, LLC, Alta Wind X Holding Company, LLC and Alta Wind XI Holding Company, LLC, which collectively own seven wind facilities that total 947 MW located in Tehachapi, California, and a portfolio of associated land leases, or the Alta Wind Portfolio. Power generated by the Alta Wind Portfolio is sold to Southern California Edison under long-term PPAs with 21 years of remaining contract life for Alta I-V. The Alta Wind X and XI PPAs began in 2016 with a term of 22 years and sold energy and renewable energy credits on a merchant basis during the years ending December 31, 2014,2015 and 2015.2014.
The purchase price for the Alta Wind Portfolio was $923 million, which consisted of a base purchase price of $870 million, as well as a payment for working capital of $53 million, plus the assumption of $1.6 billion of non-recourse project-level debt. In order to fund the purchase price, the Company completed an equity offering of 12,075,000 shares of its Class A common stock at an offering price of $54.00 per share on July 29, 2014, which resulted in net proceeds of $630 million, after underwriting discounts and expenses. In addition, on August 5, 2014, NRG Yield Operating LLC issued $500 million of Senior Notes, which bear interest at a rate of 5.375% and mature in August 2024.
The acquisition was recorded as a business combination under ASC 805-50, with identifiable assets acquired and liabilities assumed provisionally recorded at their estimated fair values on the acquisition date. The accounting for the business combination was completed as of August 11, 2015, at which point the fair values became final. The following table summarizes the provisional
amounts recognized for assets acquired and liabilities assumed as of December 31, 2014, as well as adjustments made through August 11, 2015, when the allocation became final.
The purchase price of $923 million was allocated as follows:
| | | | | Acquisition Date Fair Value at December 31, 2014 | | Measurement period adjustments | | Revised Acquisition Date | | | | | | | | |
| | | (In millions) | | Acquisition Date Fair Value at December 31, 2014 | | Measurement period adjustments | | Revised Acquisition Date |
| Assets | | | | | | | | (In millions) |
| Cash | | $ | 22 |
| | $ | — |
| | $ | 22 |
| | $ | 22 |
| | $ | — |
| | $ | 22 |
|
| Current and non-current assets | | 49 |
| | (2 | ) | | 47 |
| | 49 |
| | (2 | ) | | 47 |
|
| Property, plant and equipment | | 1,304 |
| | 6 |
| | 1,310 |
| | 1,304 |
| | 6 |
| | 1,310 |
|
| Intangible assets | | 1,177 |
| | (6 | ) | | 1,171 |
| | 1,177 |
| | (6 | ) | | 1,171 |
|
| Total assets acquired | | 2,552 |
| | (2 | ) | | 2,550 |
| | 2,552 |
| | (2 | ) | | 2,550 |
|
| | | | | | | | | | | | | |
| Liabilities | | | | | | | | | | | | |
| Debt | | 1,591 |
| | — |
| | 1,591 |
| | 1,591 |
| | — |
| | 1,591 |
|
| Current and non-current liabilities | | 38 |
| | (2 | ) | | 36 |
| | 38 |
| | (2 | ) | | 36 |
|
| Total liabilities assumed | | 1,629 |
| | (2 | ) | | 1,627 |
| | 1,629 |
| | (2 | ) | | 1,627 |
|
| Net assets acquired | | $ | 923 |
| | $ | — |
| | $ | 923 |
| | $ | 923 |
| | $ | — |
| | $ | 923 |
|
The Company incurred and expensed acquisition-related transaction costs related to the acquisition of the Alta Wind Portfolio of $2 million for the year ended December 31, 2014.
June 2014 Drop Down Assets — On June 30, 2014, the Company acquired from NRG: (i) El Segundo, a 550 MW fast-start, gas-fired facility located in Los Angeles County, California; (ii) TA High Desert, a 20 MW solar facility located in Los Angeles County, California; and (iii) Kansas South, a 20 MW solar facility located in Kings County, California. The Company paid total cash consideration of $357 million, which represents a base purchase price of $349 million and $8 million of working capital adjustments. In addition, the acquisition included the assumption of $612 million of project-level debt. The assets and liabilities transferred to the Company relate to interests under common control by NRG and were recorded at historical cost in accordance with ASC 805-50. The difference between the cash proceeds and the historical value of the net assets was recorded as a distribution to NRG and reduced the balance of its noncontrolling interest. Since the transaction constituted a transfer of entities under common control, the guidance requires retrospective combination of the entities for all periods presented as if the combination has been in effect since the beginning of the financial statements period or the inception of common control (if later than the beginning of the financial statements period). Accordingly, the Company prepared its consolidated financial statements to reflect the transfer as if it had taken place from the beginning of the financial statements period.
2013 Acquisitions
Energy Systems — On December 31, 2013, NRG Energy Center Omaha Holdings, LLC, an indirect wholly owned subsidiary of NRG Yield LLC, acquired Energy Systems Company, or Energy Systems, for approximately $120 million. The acquisition was financed using cash on hand. Energy Systems is an operator of steam and chilled water thermal facilities that provides heating and cooling services to nonresidential customers in Omaha, Nebraska. The acquisition was recorded as a business combination under ASC 805, with identifiable assets acquired and liabilities assumed recorded at their fair values. The purchase price was primarily allocated to property, plant and equipment of $60 million, customer relationships of $59 million, and $1 million of working capital.
Note 4 — Property, Plant and Equipment
The Company’s major classes of property, plant, and equipment were as follows:
| | | | December 31, 2015 | | December 31, 2014 | | Depreciable Lives | December 31, 2016 | | December 31, 2015 | | Depreciable Lives |
| | (In millions) | | (In millions) | |
| Facilities and equipment | $ | 5,597 |
| | $ | 5,454 |
| | 2 - 40 Years | $ | 6,215 |
| | $ | 6,480 |
| | 2 - 40 Years |
| Land and improvements | 151 |
| | 150 |
| | 171 |
| | 171 |
| |
Construction in progress | 9 |
| | 9 |
| | 25 |
| | 9 |
| |
| Total property, plant and equipment | 5,757 |
| | 5,613 |
| | 6,411 |
| | 6,660 |
| |
| Accumulated depreciation | (701 | ) | | (438 | ) | | (951 | ) | | (782 | ) | |
| Net property, plant and equipment | $ | 5,056 |
| | $ | 5,175 |
| | $ | 5,460 |
| | $ | 5,878 |
| |
(a) As of December 31, 2016, construction in progress includes $20 million of capital expenditures that relate to prepaid long-term service agreements primarily in the Conventional segment.
Note 5 — Investments Accounted for by the Equity Method and Variable Interest Entities
2017 Drop Down Assets — On February 24, 2017, the Company and NRG entered into a definitive agreement regarding the acquisition of the following facilities: (i) a 16% interest (approximately 31% of NRG's 51% interest) in the Agua Caliente solar farm, one of the NRG ROFO assets, representing ownership of approximately 46 net MW of capacity. Agua Caliente is located in Yuma County, AZ and sells power subject to a 25-year PPA with Pacific Gas and Electric, with 22 years remaining on that contract and (ii) NRG's 50% interests in seven utility-scale solar farms located in Utah representing 265 net MW (based on cash to be distributed) of capacity that were part of NRG's recent acquisition of projects from SunEdison. These assets achieved commercial operations in 2016, sell power subject to 20-year PPAs with PacifiCorp, a subsidiary of Berkshire Hathaway and are part of a tax equity structure with Dominion Solar Projects III, Inc., or Dominion, from which NRG currently receives 50% of cash to be distributed. The Company expects to pay total cash consideration of $130 million and assume non-recourse project debt. The purchase price for the acquisition, which is subject to working capital adjustments to be calculated at close, is expected to be funded with cash on hand. The Company expects to record its interests in the acquired projects as equity method investments.
Equity Method Investments
The following table summarizes the Company's equity method investments as of December 31, 2015:2016:
| | | Name | | Economic Interest | | Investment Balance | | Economic Interest | | Investment Balance |
| | | (In millions) | | (In millions) |
| Desert Sunlight | | 25% | | 291 | | 25% | | $282 |
GenConn(b)(a) | | 50% | | 110 | | 50% | | 106 |
| CVSR | | 48.95% | | 101 | |
Elkhorn Ridge(c) | | 50.3% | | 96 | |
San Juan Mesa(c) | | 56.3% | | 80 | |
NRG DGPV Holdco 1 LLC(d) | | 95% | | 71 | |
Elkhorn Ridge(b) | | | 50.3% | | 85 |
San Juan Mesa(b) | | | 56.3% | | 74 |
NRG DGPV Holdco 1 LLC (c) | | | 95% | | 75 |
NRG DGPV Holdco 2 LLC (c) | | | 95% | | 24 |
NRG RPV Holdco 1 LLC(e)(c) | | 95% | | 58 | | 95% | | 71 |
Avenal(b) | | 50% | | (9) | | 50% | | (7) |
| Total equity investments in affiliates | | | $710 |
(a) GenConn is a variable interest entity.
(b) The Company's interest in GenConn and Avenal increased from 49.95% to 50% on September 30, 2015.
(c) San Juan Mesa and Elkhorn Ridge are part of the Wind TE Wind Holdco tax equity structure, as described below. San Juan Mesa and Elkhorn Ridge are owned 75% and 66.7%, respectively, by Wind TE Wind Holdco. The Company owns 75% of the Class B interests in Wind TE Wind Holdco.
(d)(c) Economic interest based on cash to be distributed. NRG DGPV Holdco 1 LLC, is aNRG DGPV Holdco 2 LLC, and NRG RPV Holdco 1 LLC are tax equity structurestructures and is a VIE.VIEs. The related allocations are described below.
(e) NRG RPV Holdco 1 LLC is a tax equity structure and is a VIE. The related allocations are described below.
As of December 31, 2016 and 2015, the Company had no undistributed earnings from its equity method investments. As of December 31, 2014, the Company had $17$30 million and $39 million, respectively, of undistributed earnings from its equity method investments.
The Company acquired its interest in Desert Sunlight on June 30, 2015, for $285 million, which resulted in a difference between the purchase price and the basis of the acquired assets and liabilities of $171 million. The difference is attributable to the fair value of the property, plant and equipment and power purchase agreements. The Company is amortizing the related basis difference to equity in earnings (losses) over the related useful life of the underlying assets acquired.
Non-recourse project-level debt of unconsolidated affiliates
The Company's pro-rata share of non-recourse debt held by unconsolidated affiliates was approximately $842$453 million as of December 31, 2015.2016.
Avenal — The Company owns a 50% equity interest in Avenal, which consists of three solar PV projects in Kings County, California totaling approximately 45 MWs. Eurus Energy owns the remaining 50% of Avenal. Power generated by the projects is sold under a 20-year PPA. On September 22, 2010, Avenal entered into a $35 million promissory note facility with the Company. Amounts drawn under the promissory note facility accrue interest at 4.5% per annum. Also, on September 22, 2010, Avenal entered into a $209 million financing arrangement with a syndicate of banks, or the Avenal Facility. As of December 31, 2015,2016 and 2014,2015, Avenal had outstanding $143$134 million and $107$143 million, respectively, under the Avenal Facility.
CVSRDesert Sunlight — In 2011, High Plains Ranch II, LLC, the direct owner of CVSR,Desert Sunlight 250 and Desert Sunlight 300 each entered into the CVSR Financing Agreement with the FFB to borrow up to $1.2 billion to fund the coststhree distinct tranches of constructing the solar facility. The CVSR Financing Agreement matures in 2037 and the loans provided by the FFB are guaranteed by the U.S. DOE. Amounts borrowed under the CVSR Financing Agreement accrue interest at a fixed rate based on U.S. Treasury rates plus a spread of 0.375% and are secured by the assets of CVSR.debt. As of December 31, 2016 and 2015, and 2014, $793 million and $815 million, respectively, wereDesert Sunlight had total debt outstanding of $1.1 billion under the loan. Tthree tranches.he U.S. Treasury Department awarded cash grants on the CVSR project of $307 million ($285 million net of sequestration), which is approximately 75% of the cash grant amount for which the Company had applied. The cash grant proceeds were used to pay the outstanding balance of the bridge loan due in February 2014 and the remaining amount was used to pay a portion of the outstanding balance on the bridge loan due in August 2014. The remaining balance of the bridge loan due in August 2014 was paid by SunPower.
GenConn — GenConn has a $237 million project note with an interest rate of 4.73% and a maturity date of July 2041 and a 5-year, $35 million working capital facility that matures in 2018 which can be used to issue letters of credit at an interest rate of 1.875% per annum. As of December 31, 2016 and 2015, $212 million and $220 million, wasrespectively, were outstanding under the note andnote. As of December 31, 2016, $14 million was drawn on the working capital facility. The note is secured by all of the GenConn assets. The Company's maximum exposure to loss is limited to its equity investment in GenConn, which was $106 million as of December 31, 2016.
In March 2015, GenConnNRG DGPV Holdco 2 LLC — On June 30, 2016, NRG DGPV4 Borrower LLC, a direct subsidiary of NRG DGPV Holdco 2 LLC entered into a settlementfinancing agreement relating to a lawsuit it filed againstfund the electrical contractor responsible foracquisition of projects by the design and installation of the 5X and 6X circuits at the GenConn Middletown facility and one of its subcontractors. The results of the settlement agreement are not expected to have a material impact on the Company's results of operations, cash flows or financial position.
Desert Sunlight —Desert Sunlight 250 and Desert Sunlight 300 each entered into three distinct tranches of debt.tax equity fund. As of December 31, 2015, and 2014, Desert Sunlight had total debt2016 there was $21 million outstanding of $1.1 billion and $1.5 billion, respectively, under the three tranches.facility.
The following tables present summarized financial information for the Company's significant equity method investments:
| | | | Year Ended December 31, | Year Ended December 31, |
| | 2015 | | 2014 | | 2013 | 2016 | | 2015 | | 2014 |
| Income Statement Data: | (In millions) | (In millions) |
| CVSR | | | | | | |
| Operating revenues | $ | 83 |
| | $ | 82 |
| | $ | 47 |
| |
| Operating income | 43 |
| | 40 |
| | 22 |
| |
| Net income | 19 |
| | 17 |
| | 4 |
| |
| GenConn | | | | | | | | | | |
| Operating revenues | 78 |
| | 82 |
| | 80 |
| $ | 72 |
| | $ | 78 |
| | $ | 82 |
|
| Operating income | 40 |
| | 40 |
| | 44 |
| 38 |
| | 40 |
| | 40 |
|
| Net income | 28 |
| | 28 |
| | 31 |
| 26 |
| | 28 |
| | 28 |
|
| Desert Sunlight | | | | | | | | | | |
| Operating revenues | 206 |
| | | | | $ | 211 |
| | $ | 206 |
| | |
| Operating income | 124 |
| | | | | 129 |
| | 124 |
| | |
| Net income | 73 |
| | | | | 80 |
| | 73 |
| | |
| | | | | | | | | | | |
| | | | As of December 31, | | | As of December 31, |
| | | | 2015 | | 2014 | | | 2016 | | 2015 |
| Balance Sheet Data: | | | (In millions) | | | (In millions) |
| CVSR | | | | | |
| Current assets | $ | 98 |
| | $ | 173 |
| |
| Non-current assets | 917 |
| | 868 |
| |
| Current liabilities | 33 |
| | 33 |
| |
| Non-current liabilities | 775 |
| | 799 |
| |
| GenConn | GenConn | | | | | GenConn | | | | |
| Current assets | Current assets | | 36 |
| | 33 |
| Current assets | | $ | 36 |
| | $ | 36 |
|
| Non-current assets | Non-current assets | | 416 |
| | 438 |
| Non-current assets | | 389 |
| | 416 |
|
| Current liabilities | Current liabilities | | 16 |
| | 20 |
| Current liabilities | | 16 |
| | 16 |
|
| Non-current liabilities | Non-current liabilities | | 215 |
| | 223 |
| Non-current liabilities | | 196 |
| | 215 |
|
| Desert Sunlight | Desert Sunlight | | | | | Desert Sunlight | | | | |
| Current assets | Current assets | | 310 |
| | | Current assets | | $ | 281 |
| | $ | 310 |
|
| Non-current assets | Non-current assets | | 1,435 |
| | | Non-current assets | | 1,401 |
| | 1,435 |
|
| Current liabilities | Current liabilities | | 82 |
| | | Current liabilities | | 64 |
| | 82 |
|
| Non-current liabilities | Non-current liabilities | | 1,086 |
| | | Non-current liabilities | | 1,043 |
| | 1,086 |
|
Variable Interest Entities, or VIEs
Entities that are Consolidated
NRG Wind TE Holdco — On November 3, 2015, the Company acquired 75% of the Class B interests of NRG Wind TE Holdco, or the November 2015 Drop Down Assets, which owns a portfolio of 12 wind facilities totaling 814 net MW, from NRG for total cash consideration of $209 million, as described in Note 3, Business Acquisitions. In February 2016, NRG made a final working capital payment of $2 million, reducing total cash consideration to $207 million. NRG retained a 25% ownership of the Class B interest. The Class A interests of NRG Wind TE Holdco are owned by a tax equity investor, or TE Investor, who receives 99% of allocations of taxable income and other items until the flip point, which occurs when the TE Investor obtains a specified return on its initial investment, at which time the allocations to the TE Investor change to 8.53%. The Company generally receives 75% of CAFD until the flip point, at which time the allocations to the Company of CAFD change to 68.60%. If the flip point has not occurred by a specified date, 100% of CAFD is allocated to the TE Investor until the flip point occurs. NRG Wind TE Holdco is a VIE and the Company is the primary beneficiary, through its position as managing member, and consolidates NRG Wind TE Holdco. The Company utilizes the HLBV method to determine the net income or loss allocated to the TE Investor noncontrolling interest. Net income or loss attributable to the Class B interests is allocated to NRG's noncontrolling interest based on its 25% ownership interest.
Alta TE Holdco — On June 30, 2015, the Company sold an economic interest in Alta TE Holdco to a financial institution in order to monetize certain cash and tax attributes, primarily PTCs. The financial institution, or Alta Investor, receives 99% of allocations of taxable income and other items until the flip point, which occurs when the Alta Investor obtains a specified return on its initial investment, at which time the allocations to the Alta Investor change to 5%. The Company received 100% of CAFD through December 31, 2015, and subsequently will receive 94.34% until the flip point, at which time the allocations to the Company of CAFD will change to 97.12%, unless the flip point will not have occurred by a specified date, which would result in 100% of CAFD allocated to the Alta Investor until the flip point occurs. Alta TE Holdco is a VIE and the Company is the primary beneficiary through its position as managing member, and therefore consolidates Alta TE Holdco, with the Alta Investor's interest shown as noncontrolling interest. The Company utilizes the HLBV method to determine the net income or loss allocated to the noncontrolling interest. The net proceeds of $119 million arewere reflected as noncontrolling interest in the Company's balance sheet.
Spring Canyon — On May 7, 2015, the Company acquired a 90.1% of the Class B interests in Spring Canyon II, a 32 MW wind facility, and Spring Canyon III, a 28 MW wind facility, each located in Logan County, Colorado, from Invenergy Wind Global LLC. Invenergy owns 9.9% of the Class B interests. Prior to the acquisition date, the projects were financed with a partnership flip tax-equity structure with a financial institution, who owns the Class A interests, to monetize certain cash and tax attributes, primarily PTCs. Until the flip point, the Class A member will receive 34.81% of the cash distributions based on the projects’ production level and the Company and Invenergy will receive 65.19%. After the flip point, cash distributions are allocated 5% to the Class A member and 95% to the Company and Invenergy. Spring Canyon is a VIE and the Company is the primary beneficiary through its position as managing member, and therefore consolidates Spring Canyon. The Class A member and Invenergy's interests are shown as noncontrolling interest. The Company utilizes the HLBV method to determine the net income or loss allocated to the Class A member. Net Incomeincome or loss attributable to the Class B interests is allocated to Invenergy's noncontrolling interest based on its 9.9% ownership interest.
Summarized financial information for the Company's consolidated VIEs consisted of the following as of December 31, 2015:2016:
| | | (In millions) | NRG TE Wind Holdco | | Alta Wind TE Holdco | | Spring Canyon | NRG Wind TE Holdco | | Alta TE Holdco | | Spring Canyon |
| Other current and non-current assets | $ | 204 |
| | $ | 18 |
| | $ | 3 |
| $ | 193 |
| | $ | 17 |
| | $ | 4 |
|
| Property, plant and equipment | 663 |
| | 484 |
| | 104 |
| 441 |
| | 461 |
| | 100 |
|
| Intangible assets | 2 |
| | 287 |
| | — |
| 2 |
| | 274 |
| | — |
|
| Total assets | 869 |
| | 789 |
| | 107 |
| 636 |
| | 752 |
| | 104 |
|
| Current and non-current liabilities | 220 |
| | 10 |
| | 5 |
| 209 |
| | 9 |
| | 6 |
|
| Total liabilities | 220 |
| | 10 |
| | 5 |
| 209 |
| | 9 |
| | 6 |
|
| Noncontrolling interest | 268 |
| | 121 |
| | 70 |
| 139 |
| | 107 |
| | 67 |
|
| Net assets less noncontrolling interests | $ | 381 |
| | $ | 658 |
| | $ | 32 |
| $ | 288 |
| | $ | 636 |
| | $ | 31 |
|
Entities that are not Consolidated
The Company has interests in entities that are considered VIEs under ASC 810, Consolidation, but for which it is not considered the primary beneficiary. The Company accounts for its interests in these entities under the equity method of accounting.
NRG DGPV Holdco 1 LLC — On May 8, 2015, NRG Yield DGPV Holding LLC, a subsidiary of the Company and NRG Renew DG Holdings LLC, a subsidiary of NRG entered into a partnership by forming NRG DGPV Holdco 1 LLC, or DGPV Holdco 1, the purpose of which is to own or purchase solar power generation projects and other ancillary related assets from NRG Renew DG Holdings LLC or its subsidiaries via intermediate funds, including: (i) a tax equity-financed portfolio of 10 recently completed community solar projects representing approximately 8 MW with a weighted average remaining PPA term of 2019 years; and (ii) a tax equity-financed portfolio of approximately 12 commercial photovoltaic systems representing approximately 37 MW with a weighted average remaining PPA term of 19 years. The following illustrates the structure18 years; and (iii) a tax equity-financed portfolio of DGPV Holdco:
As of December 31, 2015, the Company's investment in DGPV Holdco 1 related to the recently completed community solar projects was $17 million. Additionally, as of December 31, 2015, the Company's investment in DGPV Holdco 1 related to theapproximately 3 commercial photovoltaic systems was $55 million, $44 millionrepresenting approximately 1 MW with a weighted average remaining PPA term of which remained payable and is recorded in accounts payable — affiliate on the consolidated balance sheet at December 31, 2015. Both20 years. All of these investments relate to the Company's $100 million commitment to distributed solar projects in partnership with NRG. The Company's maximum exposure to loss is limited to its equity investment.
NRG DGPV Holdco 2 LLC — On February 29, 2016, the Company and NRG entered into an additional partnership by forming NRG DGPV Holdco 2 LLC, or DGPV Holdco 2, to own or purchase solar power generation projects andas well as other ancillary related assets from NRG Renew LLC or its subsidiaries, via intermediate funds.funds including: (i) a tax equity-financed portfolio of 18 projects representing approximately 28 MW with a weighted average remaining PPA term of 21 years; and (ii) a tax equity-financed portfolio of 21 projects representing approximately 18 MW with a weighted average remaining PPA term of 20 years. Under this partnership, the Company committed to fund up to $50 million of capital.
The Company's maximum exposure to loss is limited to its equity investment in DGPV Holdco 1 and DGPV Holdco 2, which was $99 million on a combined basis, of which $14 million was payable to NRG, as of December 31, 2016.
NRG RPV Holdco 1 LLC — On April 9, 2015, NRG Yield RPV Holding LLC, a subsidiary of the Company and NRG Residential Solar Solutions LLC, a subsidiary of NRG entered into a partnership by forming NRG RPV Holdco 1 LLC, or RPV Holdco, that will invest in and holdholds operating portfolios of residential solar assets developed by NRG Home Solar, a subsidiary of NRG,NRG's residential solar business, including: (i) an existing, unlevered portfolio of over 2,200 leases across nine states representing approximately 1715 MW with a weighted average remaining lease term of approximately 17 years;19 years that was acquired outside of the partnership; and (ii) a tax equity-financed portfolio of approximately 5,7005,400 leases representing approximately 4031 MW, with ana weighted average remaining lease term for the existing and new leases of approximately 17 to 2019 years. The following illustrates the structure of RPV Holdco:
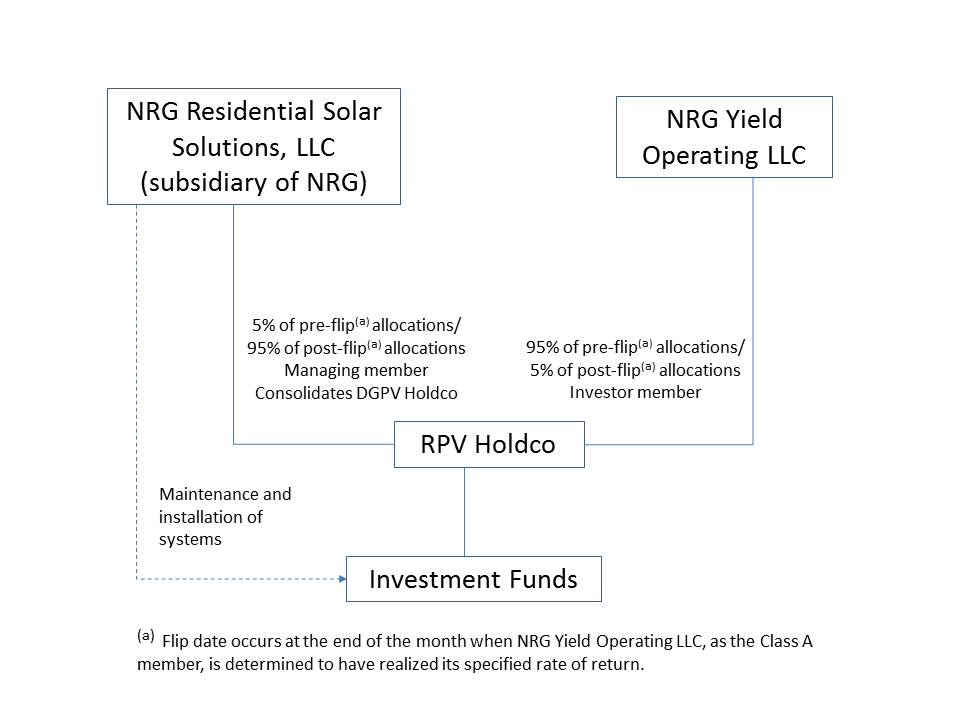
The Company invested $26 million in RPV Holdco in April 2015 relatedIn addition to the existing,acquisition of the unlevered portfolio of leases. Theleases, the Company also invested $36had previously committed to fund up to $150 million of its $150 million commitmentcapital to invest in the tax equity-financed portfolio through December 31, 2015. The Company's maximum exposure to loss is limited to its equity investment.
financed portfolio. On February 29, 2016, the Company and NRG amended the RPV Holdco partnership agreement to reduce the aggregate commitment of $150 million to $100 million in connection with the formation of DGPV Holdco 2. On August 5, 2016, the Company and NRG amended the RPV Holdco partnership agreement to further reduce that capital commitment of $100 million to $60 million in connection with NRG’s change in business model approach in the residential solar business. As of December 31, 2016, the Company had contributed $59 million of this amount.
The Company's maximum exposure to loss is limited to its equity investment, which was $71 million as of December 31, 2016.
Note 6 — Fair Value of Financial Instruments
For cash and cash equivalents, restricted cash, accounts receivable — affiliate, accounts receivable, accounts payable, current portion of accounts payable — affiliate, accrued expenses and other liabilities, the carrying amount approximates fair value because of the short-term maturity of those instruments and are classified as Level 1 within the fair value hierarchy.
The estimated carrying amounts and fair values of the Company’s recorded financial instruments not carried at fair market value are as follows:
|
| | | | | | | | | | | |
| | As of December 31, 2015 | | As of December 31, 2014 |
| | Carrying Amount | | Fair Value | | Carrying Amount | | Fair Value |
| | (In millions) |
| Assets: | | | | | | | |
| Notes receivable, including current portion | 17 |
| | 17 |
| | 21 |
| | 21 |
|
| Liabilities: | | | | | | | |
| Long-term debt, including current portion | 4,863 |
| | 4,745 |
| | 4,985 |
| | 5,071 |
|
The fair value of notes receivable and long-term debt are based on expected future cash flows discounted at market interest rates, or current interest rates for similar instruments and are classified as Level 3 within the fair value hierarchy. |
| | | | | | | | | | | |
| | As of December 31, 2016 | | As of December 31, 2015 |
| | Carrying Amount | | Fair Value | | Carrying Amount | | Fair Value |
| | (In millions) |
| Assets: | | | | | | | |
| Notes receivable, including current portion | 30 |
| | 30 |
| | 47 |
| | 47 |
|
| Liabilities: | | | | | | | |
| Long-term debt, including current portion | 5,770 |
| | 5,769 |
| | 5,656 |
| | 5,538 |
|
Fair Value Accounting under ASC 820
ASC 820 establishes a fair value hierarchy that prioritizes the inputs to valuation techniques used to measure fair value into three levels as follows:
Level 1—quoted prices (unadjusted) in active markets for identical assets or liabilities that the Company has the ability to access as of the measurement date.
Level 2—inputs other than quoted prices included within Level 1 that are directly observable for the asset or liability or indirectly observable through corroboration with observable market data.
Level 3—unobservable inputs for the asset or liability only used when there is little, if any, market activity for the asset or liability at the measurement date.
In accordance with ASC 820, the Company determines the level in the fair value hierarchy within which each fair value measurement in its entirety falls, based on the lowest level input that is significant to the fair value measurement.
The fair value of the Company's publicly-traded long-term debt is based on quoted market prices and is classified as Level 2 within the fair value hierarchy. The fair value of non-publicly traded long-term debt and certain notes receivable of the Company are based on expected future cash flows discounted at market interest rates, or current interest rates for similar instruments with equivalent credit quality and are classified as Level 3 within the fair value hierarchy. The following table presents the level within the fair value hierarchy for long-term debt, including current portion as of December 31, 2016 and 2015:
|
| | | | | | | | | | | | | | | |
| | As of December 31, 2016 | | As of December 31, 2015 |
| | Level 2 | | Level 3 | | Level 2 | | Level 3 |
| | (In millions) |
| Long-term debt, including current portion | $ | 1,455 |
| | $ | 4,314 |
| | $ | 978 |
| | $ | 4,560 |
|
Recurring Fair Value Measurements
The Company records its derivative assets and liabilities at fair market value on its consolidated balance sheet. There were no asset positions as of December 31, 2015. The following table presents assets and liabilities measured and recorded at fair value on the Company's consolidated balance sheets on a recurring basis and their level within the fair value hierarchy:
| | | | As of December 31, 2015 | | As of December 31, 2014 | As of December 31, 2016 | | As of December 31, 2016 | | As of December 31, 2015 |
| | Fair Value (a) | | Fair Value (a) | Fair Value (a) | | Fair Value (a) | | Fair Value (a) |
| (In millions) | Level 2 | | Level 2 | Level 1 | | Level 2 | | Level 2 |
| Derivative assets: | | | | | | | | |
| Commodity contracts | $ | — |
| | $ | 2 |
| $ | 1 |
| | $ | 1 |
| | $ | — |
|
| Interest rate contracts | — |
| | 2 |
| — |
| | 1 |
| | — |
|
| Total assets | $ | — |
| | 4 |
| $ | 1 |
| | $ | 2 |
| | — |
|
| Derivative liabilities: | | | | | | | | |
| Commodity contracts | $ | 2 |
| | 3 |
| $ | — |
| | $ | 1 |
| | 2 |
|
| Interest rate contracts | 98 |
| | 126 |
| — |
| | 71 |
| | 98 |
|
| Total liabilities | $ | 100 |
| | $ | 129 |
| $ | — |
| | $ | 72 |
| | $ | 100 |
|
(a) There were no assets or liabilities classified as Level 1 as of December 31, 2015. There were no assets or liabilities classified Level 3 as of December 31, 2015,2016 and 2014.2015.
Derivative Fair Value Measurements
The Company's contracts are non-exchange-traded and valued using prices provided by external sources. For the Company’s energy markets, management receives quotes from multiple sources. To the extent that multiple quotes are received, the prices reflect the average of the bid-ask mid-point prices obtained from all sources believed to provide the most liquid market for the commodity.
The fair value of each contract is discounted using a risk free interest rate. In addition, a credit reserve is applied to reflect credit risk, which for interest rate swaps, is calculated based on credit default swaps utilizing the bilateral method. For commodities, to the extent that NRG's net exposure under a specific master agreement is an asset, the Company uses the counterparty's default swap rate. If the exposure under a specific master agreement is a liability, the Company uses NRG's default swap rate. For interest rate swaps and commodities, the credit reserve is added to the discounted fair value to reflect the exit price that a market participant would be willing to receive to assume the liabilities or that a market participant would be willing to pay for the assets. As of December 31, 2015,2016, the credit reserve resulted in a $1 million increase in fair value which is a gain in OCI. It is possible that future market prices could vary from those used in recording assets and liabilities and such variations could be material.
Concentration of Credit Risk
In addition to the credit risk discussion as disclosed in Note 2, Summary of Significant Accounting Policies, the following item is a discussion of the concentration of credit risk for the Company's financial instruments. Credit risk relates to the risk of loss resulting from non-performance or non-payment by counterparties pursuant to the terms of their contractual obligations. The Company monitors and manages credit risk through credit policies that include: (i) an established credit approval process; (ii) daily monitoring of counterparties' credit limits; (iii) the use of credit mitigation measures such as margin, collateral, prepayment arrangements, or volumetric limits; (iv) the use of payment netting agreements; and (v) the use of master netting agreements that allow for the netting of positive and negative exposures of various contracts associated with a single counterparty. Risks surrounding counterparty performance and credit could ultimately impact the amount and timing of expected cash flows. The Company seeks to mitigate counterparty risk by having a diversified portfolio of counterparties.
Counterparty credit exposure includes credit risk exposure under certain long-term agreements, including solar and other PPAs. As external sources or observable market quotes are not available to estimate such exposure, the Company estimates the exposure related to these contracts based on various techniques including but not limited to internal models based on a fundamental analysis of the market and extrapolation of observable market data with similar characteristics. Based on these valuation techniques, as of December 31, 20152016, credit risk exposure to these counterparties attributable to the Company's ownership interests was approximately $2.72.6 billion for the next five years. The majority of these power contracts are with utilities with strong credit quality and public utility commission or other regulatory support as further described in Note 12, Segment Reporting.. However, such regulated utility counterparties can be impacted by changes in government regulations, which the Company is unable to predict.
Note 7 — Accounting for Derivative Instruments and Hedging Activities
ASC 815 requires the Company to recognize all derivative instruments on the balance sheet as either assets or liabilities and to measure them at fair value each reporting period unless they qualify for a NPNS exception. The Company may elect to designate certain derivatives as cash flow hedges, if certain conditions are met, and defer the effective portion of the change in fair value of the derivatives to accumulated OCI,OCI/OCL, until the hedged transactions occur and are recognized in earnings. The ineffective portion of a cash flow hedge is immediately recognized in earnings. For derivatives that are not designated as cash flow hedges or do not qualify for hedge accounting treatment, the changes in the fair value will be immediately recognized in earnings. Certain derivative instruments may qualify for the NPNS exception and are therefore exempt from fair value accounting treatment. ASC 815 applies to the Company's energy related commodity contracts and interest rate swaps.
Energy-Related Commodities
To manage the commodity price risk associated with its competitive supply activities and the price risk associated with wholesale power sales, the Company may enter into derivative hedging instruments, namely, forward contracts that commit the Company to sell energy commodities or purchase fuelsfuels/electricity in the future. The objectives for entering into derivatives contracts designated as hedges include fixing the price for a portion of anticipated future electricity sales and fixing the price of a portion of anticipated fuelfuel/electricity purchases for the operation of its subsidiaries. As of December 31, 2015,2016, the Company had forward contracts for the purchase of fuel commodities relating to the forecasted usage of the Company’s district energy centers extending through 2018.2018 and electricity contracts to supply retail power to the Company's district energy centers extending through 2020. At December 31, 2015,2016, these contracts were not designated as cash flow or fair value hedges.
Also, as of December 31, 2015,2016, the Company had other energy-related contracts that did not meet the definition of a derivative instrument or qualified for the NPNS exception and were therefore exempt from fair value accounting treatment as follows:
Power tolling contracts through 2039, and
Natural gas transportation contracts through 2028.
Interest Rate Swaps
The Company is exposed to changes in interest rates through the issuance of variable rate debt. In order to manage interest rate risk, it enters into interest rate swap agreements.
As of December 31, 20152016, the Company had interest rate derivative instruments on non-recourse debt extending through 2031, most of which are designated as cash flow hedges.
Volumetric Underlying Derivative Transactions
The following table summarizes the net notional volume buy/(sell) of the Company's open derivative transactions broken out by commodity as of December 31, 20152016, and 2014:2015:
|
| | | | | | | | | |
| | | | Total Volume |
| | | | December 31, 2015 | | December 31, 2014 |
| Commodity | Units | | (In millions) |
| Natural Gas | MMBtu | | 4 |
| | 2 |
|
| Interest | Dollars | | $ | 1,991 |
| | $ | 3,059 |
|
The decrease in the interest rate position is primarily the result of settling the Alta X and Alta XI interest rate swaps in connection with the repayment of the outstanding project-level debt during the second quarter of 2015, as further described in Note 9, Long-term Debt. |
| | | | | | | | | |
| | | | Total Volume |
| | | | December 31, 2016 | | December 31, 2015 |
| Commodity | Units | | (In millions) |
| Natural Gas | MMBtu | | 3 |
| | 4 |
|
| Interest | Dollars | | $ | 1,839 |
| | $ | 1,991 |
|
Fair Value of Derivative Instruments
There were no derivative asset positions on the balance sheet as of December 31, 2015. The following table summarizes the fair value within the derivative instrument valuation on the balance sheet:
|
| | | | | | | | | | | |
| | Fair Value |
| | Derivative Assets | | Derivative Liabilities |
| | December 31, 2014 | | December 31, 2015 | | December 31, 2014 |
| | (In millions) |
| Derivatives Designated as Cash Flow Hedges: | | | | | |
| Interest rate contracts current | $ | — |
| | $ | 34 |
| | $ | 44 |
|
| Interest rate contracts long-term | 2 |
| | 56 |
| | 57 |
|
| Total Derivatives Designated as Cash Flow Hedges | 2 |
| | 90 |
| | 101 |
|
| Derivatives Not Designated as Cash Flow Hedges: | | | | | |
| Interest rate contracts current | — |
| | 3 |
| | 5 |
|
| Interest rate contracts long-term | — |
| | 5 |
| | 20 |
|
| Commodity contracts current | 2 |
| | 2 |
| | 3 |
|
| Total Derivatives Not Designated as Cash Flow Hedges | 2 |
| | 10 |
| | 28 |
|
| Total Derivatives | $ | 4 |
| | $ | 100 |
| | $ | 129 |
|
|
| | | | | | | | | | | |
| | Fair Value |
| | Derivative Assets | | Derivative Liabilities |
| | December 31, 2016 | | December 31, 2016 | | December 31, 2015 |
| | (In millions) |
| Derivatives Designated as Cash Flow Hedges: | | | | | |
| Interest rate contracts current | $ | — |
| | $ | 26 |
| | $ | 34 |
|
| Interest rate contracts long-term | 1 |
| | 39 |
| | 56 |
|
| Total Derivatives Designated as Cash Flow Hedges | 1 |
| | 65 |
| | 90 |
|
| Derivatives Not Designated as Cash Flow Hedges: | | | | | |
| Interest rate contracts current | — |
| | 2 |
| | 3 |
|
| Interest rate contracts long-term | — |
| | 4 |
| | 5 |
|
| Commodity contracts current | 2 |
| | 1 |
| | 2 |
|
| Total Derivatives Not Designated as Cash Flow Hedges | 2 |
| | 7 |
| | 10 |
|
| Total Derivatives | $ | 3 |
| | $ | 72 |
| | $ | 100 |
|
The Company has elected to present derivative assets and liabilities on the balance sheet on a trade-by-trade basis and does not offset amounts at the counterparty master agreement level. As of December 31, 2016, there was no outstanding collateral paid or received. As of December 31, 2015, there were no offsetting amounts at the counterparty master agreement level or outstanding collateral paid or received. As of December 31, 2014, there was no outstanding collateral paid or received. The following table summarizes the offsetting of derivatives by counterparty master agreement level as of December 31, 2014:2016:
|
| | | | | | | | | | | |
| Gross Amounts Not Offset in the Statement of Financial Position |
| As of December 31, 2016 | Gross Amounts of Recognized Assets/Liabilities | | Derivative Instruments | | Net Amount |
| Commodity contracts: | (In millions) |
| Derivative assets | $ | 2 |
| | $ | — |
| | $ | 2 |
|
| Derivative liabilities | (1 | ) | | — |
| | (1 | ) |
| Total commodity contracts | 1 |
| | — |
| | 1 |
|
| Interest rate contracts: | | | | | |
| Derivative assets | 1 |
| | (1 | ) | | — |
|
| Derivative liabilities | (71 | ) | | 1 |
| | (70 | ) |
| Total interest rate contracts | (70 | ) | | — |
| | (70 | ) |
| Total derivative instruments | $ | (69 | ) | | $ | — |
| | $ | (69 | ) |
|
| | | | | | | | | | | |
| | Gross Amounts Not Offset in the Statement of Financial Position |
| As of December 31, 2014 | Gross Amounts of Recognized Assets/Liabilities | | Derivative Instruments | | Net Amount |
| Commodity contracts: | (In millions) |
| Derivative assets | $ | 2 |
| | $ | — |
| | $ | 2 |
|
| Derivative liabilities | (3 | ) | | — |
| | (3 | ) |
| Total commodity contracts | (1 | ) | | — |
| | (1 | ) |
| Interest rate contracts: | | | | | |
| Derivative assets | 2 |
| | (2 | ) | | — |
|
| Derivative liabilities | (126 | ) | | 2 |
| | (124 | ) |
| Total interest rate contracts | (124 | ) | | — |
| | (124 | ) |
| Total derivative instruments | $ | (125 | ) | | $ | — |
| | $ | (125 | ) |
Accumulated Other Comprehensive Loss
The following table summarizes the effects on the Company’s accumulated OCL balance attributable to interest rate swaps designated as cash flow hedge derivatives, net of tax:
| | | | Year ended December 31, | Year ended December 31, |
| | 2015 | | 2014 | | 2013 | 2016 | | 2015 | | 2014 |
| | (In millions) | (In millions) |
| Accumulated OCL beginning balance | $ | (61 | ) | | $ | — |
| | $ | (48 | ) | $ | (83 | ) | | $ | (76 | ) | | $ | (16 | ) |
| Reclassified from accumulated OCL to income due to realization of previously deferred amounts | 13 |
| | 13 |
| | 13 |
| 13 |
| | 14 |
| | 14 |
|
| Mark-to-market of cash flow hedge accounting contracts | (21 | ) | | (74 | ) | | 35 |
| — |
| | (21 | ) | | (74 | ) |
| Accumulated OCL ending balance, net of income tax benefit of $16, $6 and $1, respectively | $ | (69 | ) | | $ | (61 | ) | | $ | — |
| |
| Accumulated OCL ending balance, net of income tax benefit of $16, $16 and $6, respectively | | $ | (70 | ) | | $ | (83 | ) | | $ | (76 | ) |
| Accumulated OCL attributable to noncontrolling interests | (42 | ) | | (52 | ) | | — |
| (42 | ) | | (56 | ) | | (67 | ) |
| Accumulated OCL attributable to NRG Yield, Inc. | $ | (27 | ) | | $ | (9 | ) | | $ | — |
| $ | (28 | ) | | $ | (27 | ) | | $ | (9 | ) |
| Losses expected to be realized from OCL during the next 12 months, net of income tax benefit of $3 | $ | 13 |
| |
|
| |
|
| $ | 16 |
| | | | |
Amounts reclassified from accumulated OCL into income and amounts recognized in income from the ineffective portion of cash flow hedges are recorded to interest expense. There was no ineffectiveness for the years ended December 31, 2016, 2015 2014 and 2013.2014.
Accounting guidelines require a high degree of correlation between the derivative and the hedged item throughout the period in order to qualify as a cash flow hedge. As of December 31, 2016, the Company's regression analysis for Viento Funding II interest rate swaps, while positively correlated, did not meet the required threshold for cash flow hedge accounting. As a result, the Company de-designated the Viento Funding II cash flow hedges as of December 31, 2016, and will prospectively mark these derivatives to market through the income statement.
Impact of Derivative Instruments on the Statements of OperationsIncome
The Company has interest rate derivative instruments that are not designated as cash flow hedges. The effect of interest rate hedges is recorded to interest expense. For the years ended December 31, 2016, 2015 and 2014 the impact to the consolidated statements of operationsincome was a gain of $2 million, $16 million and a loss of $22 million, respectively.
A portion of the Company’s derivative commodity contracts relates to its Thermal Business for the purchase of fuelfuel/electricity commodities based on the forecasted usage of the thermal district energy centers. Realized gains and losses on these contracts are reflected in the fuel costs that are permitted to be billed to customers through the related customer contracts or tariffs and, accordingly, no gains or losses are reflected in the consolidated statements of operationsincome for these contracts.
CommodityIn 2015 and 2014, commodity contracts also hedgehedged the forecasted sale of power for the Elbow Creek wind facility.until the start of the PPA with NRG Power Marketing LLC, or Power Marketing, with effective date of November 1, 2015. The effect of these commodity hedges iswas recorded to operating revenues. For the years ended December 31, 2015 and 2014, the impact to the consolidated statements of operationsincome was an unrealized loss of $2 million and a gain of $2 million, respectively.
See Note 6, Fair Value of Financial Instruments, for a discussion regarding concentration of credit risk.
Note 8 — Intangible Assets
Intangible Assets — The Company's intangible assets as of December 31, 20152016, and 20142015 primarily reflect intangible assets established from its business acquisitions and are comprised of the following:
PPAs — Established predominantly with the acquisitions of the Alta Wind Portfolio, Walnut Creek, Tapestry and Laredo Ridge, these represent the fair value of the PPAs acquired. These will be amortized, generally on a straight-line basis, over the term of the PPA.
Leasehold Rights — Established with the acquisition of the Alta Wind Portfolio, this represents the fair value of contractual rights to receive royalty payments equal to a percentage of PPA revenue from certain projects. These will be amortized on a straight-line basis.
Customer relationships — Established with the acquisition of NRG Energy Center Phoenix and NRG Energy Center
Omaha, these intangibles represent the fair value at the acquisition date of the businesses' customer base. The customer relationships are amortized to depreciation and amortization expense based on the expected discounted future net cash flows by year.
Customer contracts — Established with the acquisition of NRG Energy Center Phoenix, these intangibles represent the fair value at the acquisition date of contracts that primarily provide chilled water, steam and electricity to its customers. These contracts are amortized to revenues based on expected volumes.
| |
| • | Emission Allowances — These intangibles primarily consist of SO2 and NOx emission allowances established with the El Segundo and Walnut Creek acquisitions. These emission allowances are held-for-use and are amortized to cost of operations, with NOx allowances amortized on a straight-line basis and SO2 allowances amortized based on units of production. |
Development rights — Arising primarily from the acquisition of solar businesses in 2010 and 2011, these intangibles are amortized to depreciation and amortization expense on a straight-line basis over the estimated life of the related project portfolio.
Customer contracts — Established with the acquisition of NRG Energy Center Phoenix, these intangibles represent the fair value at the acquisition date of contracts that primarily provide chilled water, steam and electricity to its customers. These contracts are amortized to revenues based on expected volumes.
Customer relationships — Established with the acquisition of NRG Energy Center Phoenix and NRG Energy Systems, these intangibles represent the fair value at the acquisition date of the businesses' customer base. The customer relationships are amortized to depreciation and amortization expense based on the expected discounted future net cash flows by year.
PPAs — Established predominantly with the acquisitions of the Alta Wind Portfolio, Walnut Creek, Tapestry and Laredo Ridge, these represent the fair value of the PPAs acquired. These will be amortized, generally on a straight-line basis, over the term of the PPA.
Leasehold Rights — Established with the acquisition of the Alta Wind Portfolio, this represents the fair value of contractual rights to receive royalty payments equal to a percentage of PPA revenue from certain projects. These will be amortized on a straight-line basis.
Other — Consists of the acquisition date fair value of the contractual rights to a ground lease for South Trent and to utilize certain interconnection facilities for Blythe, as well as land rights acquired in connection with the acquisition of Elbow Creek.
The following tables summarize the components of intangible assets subject to amortization:
| | | Year ended December 31, 2015 | Emission Allowances | | Development Rights | | Customer Contracts | | Customer Relationships | | PPAs | | Leasehold Rights | | Other | | Total | |
| | | | (In millions) | |
| January 1, 2015 | $ | 16 |
| | $ | 4 |
| | $ | 15 |
| | $ | 66 |
| | $ | 1,269 |
| | $ | 86 |
| | $ | 6 |
| | $ | 1,462 |
| |
| Year ended December 31, 2016 | | PPAs | | Leasehold Rights | | Customer
Relationships | | Customer Contracts | | Emission Allowances | | Development
Rights | | Other | | Total |
| (In millions) | | | | | | | | | | | | | | | | |
| January 1, 2016 | | $ | 1,264 |
| | $ | 86 |
| | $ | 66 |
| | $ | 15 |
| | $ | 15 |
| | $ | 3 |
| | $ | 6 |
| | $ | 1,455 |
|
| Other | (1 | ) | | — |
| | — |
| | — |
| | (6 | ) | | — |
| | — |
| | (7 | ) | — |
| | — |
| | — |
| | — |
| | (6 | ) | | — |
| | — |
| | (6 | ) |
| December 31, 2015 | 15 |
| | 4 |
| | 15 |
| | 66 |
| | 1,263 |
| | 86 |
| | 6 |
| | 1,455 |
| |
| December 31, 2016 | | 1,264 |
| | 86 |
| | 66 |
| | 15 |
| | 9 |
| | 3 |
| | 6 |
| | 1,449 |
|
| Less accumulated amortization | (1 | ) | | (1 | ) | | (6 | ) | | (3 | ) | | (75 | ) | | (5 | ) | | (2 | ) | | (93 | ) | (138 | ) | | (9 | ) | | (4 | ) | | (7 | ) | | (2 | ) | | (1 | ) | | (2 | ) | | (163 | ) |
| Net carrying amount | $ | 14 |
| | $ | 3 |
| | $ | 9 |
| | $ | 63 |
| | $ | 1,188 |
| | $ | 81 |
| | $ | 4 |
| | $ | 1,362 |
| $ | 1,126 |
| | $ | 77 |
| | $ | 62 |
| | $ | 8 |
| | $ | 7 |
| | $ | 2 |
| | $ | 4 |
| | $ | 1,286 |
|
|
| | | | | | | | | | | | | | | | | | | | | | | | | | | | | | | |
| Year ended December 31, 2014 | Emission Allowances | | Development Rights | | Customer Contracts | | Customer Relationships | | PPAs | | Leasehold Rights | | Other | | Total |
| | (In millions) |
| January 1, 2014 | $ | 8 |
| | $ | 4 |
| | $ | 15 |
| | $ | 66 |
| | $ | 14 |
| | $ | — |
| | $ | 6 |
| | $ | 113 |
|
| Acquisition of Alta Wind Portfolio | — |
| | — |
| | — |
| | — |
| | 1,092 |
| | 86 |
| | — |
| | 1,178 |
|
| Transfer of January 2015 Drop Down Assets | 7 |
| | — |
| | — |
| | — |
| | 160 |
| | — |
| | — |
| | 167 |
|
| Other | 1 |
| | — |
| | — |
| | — |
| | 3 |
| | — |
| | — |
| | 4 |
|
| December 31, 2014 | 16 |
| | 4 |
| | 15 |
| | 66 |
| | 1,269 |
| | 86 |
| | 6 |
| | 1,462 |
|
| Less accumulated amortization | — |
| | (1 | ) | | (5 | ) | | (2 | ) | | (26 | ) | | (2 | ) | | (2 | ) | | (38 | ) |
| Net carrying amount | $ | 16 |
| | $ | 3 |
| | $ | 10 |
| | $ | 64 |
| | $ | 1,243 |
| | $ | 84 |
| | $ | 4 |
| | $ | 1,424 |
|
|
| | | | | | | | | | | | | | | | | | | | | | | | | | | | | | | |
| Year ended December 31, 2015 | PPAs | | Leasehold Rights | | Customer Relationships | | Customer Contracts | | Emission Allowances | | Development Rights | | Other | | Total |
| (In millions) | | | | | | | | | | | | | | | |
| January 1, 2015 | $ | 1,270 |
| | $ | 86 |
| | $ | 66 |
| | $ | 15 |
| | $ | 16 |
| | $ | 3 |
| | $ | 6 |
| | $ | 1,462 |
|
| Other | (6 | ) | | — |
| | — |
| | — |
| | (1 | ) | | — |
| | — |
| | (7 | ) |
| December 31, 2015 | 1,264 |
| | 86 |
| | 66 |
| | 15 |
| | 15 |
| | 3 |
| | 6 |
| | 1,455 |
|
| Less accumulated amortization | (75 | ) | | (5 | ) | | (3 | ) | | (6 | ) | | (1 | ) | | (1 | ) | | (2 | ) | | (93 | ) |
| Net carrying amount | $ | 1,189 |
| | $ | 81 |
| | $ | 63 |
| | $ | 9 |
| | $ | 14 |
| | $ | 2 |
| | $ | 4 |
| | $ | 1,362 |
|
The Company recorded amortization expense of $70 million, $55 million $30 million and $4$30 million during the years ended December 31, 2016, 2015 2014 and 2013.2014. Of these amounts, $69 million, $54 million and $29 million for the years ended December 31, 2016, 2015 and 2014, respectively, were recorded as contra-revenue.to contract amortization expense and reduced operating revenues in the consolidated statements of income. The following table presents estimatedCompany estimates the future amortization of the Company's intangible assetsexpense for each ofits intangibles to be $71 million for the next five years:
|
| | | | |
| Year Ended December 31, | | Total |
| | | (In millions) |
| 2016 | | $ | 70 |
|
| 2017 | | 70 |
|
| 2018 | | 71 |
|
| 2019 | | 71 |
|
| 2020 | | 71 |
|
The weighted average amortization period related to the intangibles acquired in the year ended December 31, 2015 was 18 years for other intangible assets.Out-of-market contracts — The out-of-market contract liability represents the out-of-market value of the PPAPPAs for the Blythe solar project and Spring Canyon wind projects and the out-of-market value of the land lease for Alta Wind XI Holding Company, LLC, as of their respective acquisition dates. The Blythe solar project's liability of $5$4 million is recorded to other non-current liabilities on the consolidated balance sheet and is amortized to revenue in the consolidated statements of income on a units-of-production basis over the twenty-year term of the agreement. Spring Canyon's liability of $3 million is recorded to other non-current liabilities and is amortized to revenue on a straight-line basis over the twenty-five year term of the agreement. The Alta Wind XI Holding Company, LLC's liability of $5 million is recorded to other non-current liabilities and is amortized to cost of operations on a straight-line basis over the term of the land lease. At December 31, 2015,2016, accumulated amortization of out-of-market contracts was $3 million and amortization expense was $1 million for the yearyears ended December 31, 2016 and 2015.
Note 9 — Asset Impairments
During the fourth quarter of 2016, as the Company updated its estimated cash flows in connection with the preparation and review of the Company's annual budget, the Company determined that the cash flows for the Elbow Creek and Goat Wind projects located in Texas and the Forward project in Pennsylvania were below the carrying value of the related assets, primarily driven by declining merchant power prices in post-contract periods, and that the assets were considered impaired. These projects were acquired in connection with the acquisition of the November 2015 Drop Down Assets and were recorded in the Renewables segment of the Company. The projects were recorded at historical cost at acquisition date as they were related to interests under common control by NRG. The fair value of the facilities was determined using an income approach by applying a discounted cash flow methodology to the long-term budgets for each respective plant. The income approach utilized estimates of discounted future cash flows, which were Level 3 fair value measurement and include key inputs, such as forecasted power prices, operations and maintenance expense, and discount rates. The Company measured the impairment loss as the difference between the carrying amount and the fair value of the assets and recorded impairment losses of $117 million, $60 million and $6 million for Elbow Creek, Goat Wind, and Forward, respectively.
Note 10 — Long-term Debt
The Company's borrowings, including short term and long term portions consisted of the following:
| | | | December 31, 2015 | | December 31, 2014 | | Interest rate % (a) | | Letters of Credit Outstanding at December 31, 2015 | December 31, 2016 | | December 31, 2015 | | Interest rate % (a) | | Letters of Credit Outstanding at December 31, 2016 |
| | (In millions, except rates) | | | (In millions, except rates) | | |
Convertible Notes, due 2020 (b) | $ | 266 |
| | $ | — |
| | 3.25 | | | |
Convertible Notes, due 2019 (c) | 330 |
| | 326 |
| | 3.5 | | | |
| Senior Notes, due 2024 | 500 |
| | 500 |
| | 5.375 | | | |
| 2026 Senior Notes | | $ | 350 |
| | $ | — |
| | 5.000 | | |
| 2024 Senior Notes | | 500 |
| | 500 |
| | 5.375 | | |
2020 Convertible Notes (b) | | 271 |
| | 266 |
| | 3.250 | | |
2019 Convertible Notes (c) | | 335 |
| | 330 |
| | 3.500 | | |
NRG Yield LLC and NRG Yield Operating LLC Revolving Credit Facility, due 2019 (d) | 306 |
| | — |
| | L+2.75 | | $ | 56 |
| — |
| | 306 |
| | L+2.500 | | $ | 60 |
|
| Project-level debt: | | | | | | | | | | |
| Alpine, due 2022 | 154 |
| | 163 |
| | L+1.75 | | 37 |
| 145 |
| | 154 |
| | L+1.750 | | 37 |
|
| Alta Wind I, lease financing arrangement, due 2034 | 252 |
| | 261 |
| | 7.015 | | 16 |
| 242 |
| | 252 |
| | 7.015 | | 16 |
|
| Alta Wind II, lease financing arrangement, due 2034 | 198 |
| | 205 |
| | 5.696 | | 28 |
| 191 |
| | 198 |
| | 5.696 | | 27 |
|
| Alta Wind III, lease financing arrangement, due 2034 | 206 |
| | 212 |
| | 6.067 | | 28 |
| 198 |
| | 206 |
| | 6.067 | | 27 |
|
| Alta Wind IV, lease financing arrangement, due 2034 | 133 |
| | 138 |
| | 5.938 | | 19 |
| 128 |
| | 133 |
| | 5.938 | | 19 |
|
| Alta Wind V, lease financing arrangement, due 2035 | 213 |
| | 220 |
| | 6.071 | | 31 |
| 206 |
| | 213 |
| | 6.071 | | 30 |
|
| Alta Wind X, due 2021 | — |
| | 300 |
| | L+2.00 | | — |
| |
| Alta Wind XI, due 2021 | — |
| | 191 |
| | L+2.00 | | — |
| |
| Alta Realty Investments, due 2031 | 33 |
| | 34 |
| | 7.00 | | — |
| 31 |
| | 33 |
| | 7.000 | | — |
|
| Alta Wind Asset Management, due 2031 | 19 |
| | 20 |
| | L+2.375 | | — |
| 18 |
| | 19 |
| | L+2.375 | | — |
|
| Avra Valley, due 2031 | 60 |
| | 63 |
| | L+1.75 | | 3 |
| 57 |
| | 60 |
| | L+1.750 | | 3 |
|
| Blythe, due 2028 | 21 |
| | 22 |
| | L+1.625 | | 6 |
| 19 |
| | 21 |
| | L+1.625 | | 6 |
|
| Borrego, due 2025 and 2038 | 72 |
| | 75 |
| | L+ 2.50/5.65 | | 5 |
| 69 |
| | 72 |
| | L+ 2.500/5.650 | | 5 |
|
| CVSR, due 2037 | | 771 |
| | 793 |
| | 2.339 - 3.775 | | — |
|
| CVSR Holdco Notes, due 2037 | | 199 |
| | — |
| | 4.680 | | 13 |
|
| El Segundo Energy Center, due 2023 | 485 |
| | 506 |
| | L+1.625 - L+2.25 | | 82 |
| 443 |
| | 485 |
| | L+1.625 - L+2.250 | | 82 |
|
| Energy Center Minneapolis, due 2017 and 2025 | 108 |
| | 121 |
| | 5.95 -7.25 | | — |
| 96 |
| | 108 |
| | 5.950 -7.250 | | — |
|
| Energy Center Minneapolis Series D Notes, due 2031 | | 125 |
| | — |
| | 3.550 | | — |
|
| Kansas South, due 2031 | 33 |
| | 35 |
| | L+2.00 | | 4 |
| 30 |
| | 33 |
| | L+2.000 | | 4 |
|
| Laredo Ridge, due 2028 | 104 |
| | 108 |
| | L+1.875 | | 10 |
| 100 |
| | 104 |
| | L+1.875 | | 10 |
|
| Marsh Landing, due 2017 and 2023 | 418 |
| | 464 |
| | L+1.75 - L+1.875 | | 22 |
| 370 |
| | 418 |
| | L+1.750 - L+1.875 | | 22 |
|
| PFMG and related subsidiaries financing agreement, due 2030 | 29 |
| | 31 |
| | 6.00 | | — |
| 27 |
| | 29 |
| | 6.000 | | — |
|
| Roadrunner, due 2031 | 40 |
| | 42 |
| | L+1.625 | | 5 |
| 37 |
| | 40 |
| | L+1.625 | | 5 |
|
| South Trent Wind, due 2020 | 62 |
| | 65 |
| | L+1.625 | | 10 |
| 57 |
| | 62 |
| | L+1.625 | | 10 |
|
| TA High Desert, due 2020 and 2032 | 52 |
| | 55 |
| | L+2.50/5.15 | | 8 |
| 49 |
| | 52 |
| | L+2.500/5.150 | | 8 |
|
| Tapestry Wind, due 2021 | 181 |
| | 192 |
| | L+1.625 | | 20 |
| |
| Tapestry, due 2021 | | 172 |
| | 181 |
| | L+1.625 | | 20 |
|
| Viento, due 2023 | 189 |
| | 196 |
| | L+2.75 | | 27 |
| 178 |
| | 189 |
| | L+2.750 | | 27 |
|
| Walnut Creek, due 2023 | 351 |
| | 391 |
| | L+1.625 | | 41 |
| 310 |
| | 351 |
| | L+1.625 | | 41 |
|
| WCEP Holdings, due 2023 | 46 |
| | 46 |
| | L+3.00 | | — |
| 46 |
| | 46 |
| | L+3.000 | | — |
|
| Other | 2 |
| | 3 |
| | various | | — |
| — |
| | 2 |
| | various | | — |
|
| Subtotal project-level debt: | 3,461 |
| | 4,159 |
| | | |
| Subtotal project-level debt | | 4,314 |
| | 4,254 |
| | |
| Total debt | 4,863 |
| | 4,985 |
| | | 5,770 |
| | 5,656 |
| | |
| Less current maturities | 241 |
| | 224 |
| | | 282 |
| | 264 |
| | |
Less deferred financing costs (e) | 60 |
| | 64 |
| | | |
Less deferred financing costs | | 62 |
| | 63 |
| | |
| Total long-term debt | $ | 4,562 |
| | $ | 4,697 |
| | | $ | 5,426 |
| | $ | 5,329 |
| | |
(a) As of December 31, 2015,2016, L+ equals 3 month LIBOR plus x%, except for the NRGAlpine term loan, Marsh Landing term loan, Walnut Creek term loan, and NRG Yield LLC and NRG Yield operatingOperating LLC Revolving Credit Facility, where L+ equals 1 month LIBOR plus x% and Kansas South and Viento, where L+ equals 6 month LIBOR plus x%.
(b) Net of discount of $21$16.5 million and $21.5 million as of December 31, 2015.2016 and 2015, respectively.
(c)Net of discount of $15$10 million and $19$15 million as of December 31, 2015,2016 and December 31, 2014,2015, respectively.
(d) Applicable rate is determined by the Borrower Leverage Ratio, as defined in the credit agreement.
(e) Total net debt reflects the reclassification of deferred financing costs to reduce long-term debt as further described in Note 2, Summary of Significant Accounting Policies.
The financing arrangements listed above contain certain covenants, including financial covenants that the Company is required to be in compliance with during the term of the arrangement. As of December 31, 2015,2016, the Company was in compliance with all of the required covenants.
NRG Yield Operating LLC 2026 Senior Notes
On August 18, 2016, NRG Yield Operating LLC issued $350 million of senior unsecured notes, or the 2026 Senior Notes. The 2026 Senior Notes bear interest at 5.00% and mature on September 15, 2026. Interest on the notes is payable semi-annually on March 15 and September 15 of each year, and interest payments will commence on March 15, 2017. The 2026 Senior Notes are senior unsecured obligations of NRG Yield Operating LLC and are guaranteed by NRG Yield LLC, and by certain of NRG Yield Operating LLC’s wholly owned current and future subsidiaries. A portion of the proceeds of the 2026 Senior Notes were used to repay the Company's revolving credit facility, as described below.
NRG Yield Operating LLC 2024 Senior Notes
On August 5, 2014, NRG Yield Operating LLC issued $500 million of senior unsecured notes, or the 2024 Senior Notes. The Company's pro-rata share2024 Senior Notes bear interest at 5.375% and mature in August 2024. Interest on the notes is payable semi-annually on February 15 and August 15 of non-recourse debt heldeach year. The 2024 Senior Notes are senior unsecured obligations of NRG Yield Operating LLC and are guaranteed by unconsolidated affiliates was approximately $842 million asNRG Yield LLC, and by certain of December 31, 2015.NRG Yield Operating LLC’s wholly owned current and future subsidiaries.
2020 Convertible Senior Notes
On June 29, 2015, theThe Company closed on its offering ofhas outstanding $287.5 million aggregate principal amount of 3.25% Convertible Senior Notes due 2020, or the 2020 Convertible Notes. The 2020 Convertible Notes are convertible, under certain circumstances, into the Company’s Class C common stock, cash or a combination thereof at an initial conversion price of $27.50 per Class C common share, which is equivalent to an initiala conversion rate of approximately 36.3636 shares of Class C common stock per $1,000 principal amount of notes. Interest on the 2020 Convertible Notes is payable semi-annually in arrears on June 1 and December 1 of each year, commencing on December 1, 2015.year. The 2020 Convertible Notes mature on June 1, 2020, unless earlier repurchased or converted in accordance with their terms. Prior to the close of business on the business day immediately preceding December 1, 2019, the 2020 Convertible Notes will be convertible only upon the occurrence of certain events and during certain periods, and thereafter, at any time until the close of business on the second scheduled trading day immediately preceding the maturity date. The 2020 Convertible Notes are guaranteed by NRG Yield Operating LLC and NRG Yield LLC.
The 2020 Convertible Notes are accounted for in accordance with ASC 470-20, Debt with Conversion and Other Options. Under ASC 470-20, issuers of convertible debt instruments that may be settled in cash upon conversion, including partial cash settlement, are required toCompany separately accountaccounts for the liability (debt) and equity (conversion option) components. The applicationcomponents of ACS 470-20 resulted in the recognition of2020 Convertible Notes and recognized $23 million as the value for the equity component in 2015 with the offset to debt discount. The debt discount is amortized to interest expense using the effective interest method over the term of the 2020 Convertible Notes.through June 2020.
As of December 31, 2015,2016, the 2020 Convertible Notes were trading at approximately 86%97% of their face value, resulting in a total market value of $247$278 million compared to a carrying value of $266$271 million. The actual conversion value of the 2020 Convertible Notes is based on the product of the conversion rate and the market price of the Company's Class C common stock, as defined in the Convertible Debt indenture. As of December 31, 2015,2016, the Company's Class C common stock closed at $14.76$15.80 per share, resulting in a pro forma conversion value for the Convertible Notes of approximately $154$165 million.
During the yearyears ended December 31, 2016 and 2015, the Company recorded the following expense in relation to the 2020 Convertible Notes at the effective rate of 5.10%:
| | | (In millions) | | | | 2016 | | 2015 |
| Interest expense at 3.25% coupon rate | | $ | 5 |
| | $ | 9 |
| | $ | 5 |
|
| Debt discount amortization | | 2 |
| | 4 |
| | 2 |
|
| Debt issuance costs amortization | | 1 |
| | 1 |
| | 1 |
|
| | | $ | 8 |
| | $ | 14 |
| | $ | 8 |
|
| | | | | | | |
2019 Convertible Senior Notes
During the first quarter of 2014, theThe Company closed on its offering ofhas outstanding $345 million aggregate principal amount of 3.50% Convertible Notes due 2019, or the 2019 Convertible Notes. Interest on the 2019 Convertible Notes is payable semi-annually in arrears on February 1 and August 1 of each year, commencing on August 1, 2014.year. The 2019 Convertible Notes were convertible, under certain circumstances, into the Company’s Class A common stock, cash or a combination thereof at an initial conversion price of $46.55 per Class A common share, which is equivalent to an initial conversion rate of approximately 21.4822 shares of Class A common stock per $1,000 principal amount of Convertible Notes. In connection with the Recapitalization, effective May 15, 2015, thea conversion rate was adjusted toof approximately 42.9644 shares of Class A common stock per $1,000 principal amount of 2019 Convertible Notes in accordance with the terms of the related indenture. The 2019 Convertible Notes mature on February 1, 2019, unless earlier repurchased or converted in accordance with their terms. Prior to the close of business on the business day immediately preceding August 1, 2018, the 2019 Convertible Notes will be convertible only upon the occurrence of certain events and during certain periods, and thereafter, at any time until the close of business on the second scheduled trading day immediately preceding the maturity date. The 2019 Convertible Notes are guaranteed by NRG Yield Operating LLC and NRG Yield LLC.
The Company separately accounts for the liability (debt) and equity (conversion option) components of the 2019 Convertible Notes are accounted for in accordance with ASC 470-20. The application of ACS 470-20 resulted in the recognition ofand recognized $23 million as the value for the equity component in 2014 with the offset to debt discount. The debt discount is amortized to interest expense using the effective interest method through February 2019.
As of December 31, 20152016, the 2019 Convertible Notes were trading at approximately 92%99.6% of their face value, resulting in a total market value of $319$344 million compared to a carrying value of $330$335 million. The actual conversion value of the 2019 Convertible Notes is based on the product of the conversion rate and the market price of the Company's Class A common stock, as defined in the Convertible Debt indenture. As of December 31, 20152016, the Company's Class A common stock closed at $13.91$15.36 per share, resulting in a pro forma conversion value for the Convertible Notes of approximately $206$228 million.
During the yearyears ended December 31, 20152016, and 2015, the Company recorded the following expense in relation to the 2019 Convertible Notes at the effective rate of 5.00%:
|
| | | | |
| (In millions) | | |
| Interest expense at 3.5% coupon rate | | $ | 12 |
|
| Debt discount amortization | | 4 |
|
| Debt issuance costs amortization | | 2 |
|
| | | $ | 18 |
|
| | | |
NRG Yield Operating LLC Senior Notes
On August 5, 2014, NRG Yield Operating LLC issued $500 million of senior unsecured notes, or the Senior Notes. The Senior Notes bear interest at 5.375% and mature in August 2024. Interest on the notes is payable semi-annually on February 15 and August 15 of each year, and commenced on February 15, 2015. The Senior Notes are senior unsecured obligations of NRG Yield Operating LLC and are guaranteed by NRG Yield LLC, and by certain of NRG Yield Operating LLC’s wholly owned current and future subsidiaries. |
| | | | | | | | |
| (In millions) | | 2016 | | 2015 |
| Interest expense at 3.5% coupon rate | | $ | 12 |
| | $ | 12 |
|
| Debt discount amortization | | 5 |
| | 4 |
|
| Debt issuance costs amortization | | 2 |
| | 2 |
|
| | | $ | 19 |
| | $ | 18 |
|
| | | | | |
NRG Yield LLC and NRG Yield Operating LLC Revolving Credit Facility
In connection with the Company's initial public offering of Class A common stock in July 2013, as further described in Note 1, Nature of Business, NRG Yield LLC and NRG Yield Operating LLC entered into a senior secured revolving credit facility, or the Yield Credit Facility, which was amended on June 26, 2015, to, among other things, increase the availability to $495 million. The Company's revolving credit facility can be used for cash or for the issuance of letters of credit.
On November 3,During 2015, the Company borrowed $209$254 million from the revolving credit facility to finance the acquisition of the November 2015 Drop Down Assets as discussed in Note 3,, Business Acquisitions. On December 14, 2015, the, as well asfund dividend payments and tax equity contributions.
The Company borrowed $45$60 million from the revolving credit facility and repaid $366 million during the year ended December 31, 2016. The Company used its pro rata proceeds of $97.5 million from the CVSR Holdco Financing Arrangement in July 2016, a portion of its proceeds from the issuance of the 2026 Senior Notes in August 2015, as well as its cash on hand to fund dividend payments and tax equity contributions. repay the outstanding borrowings under the revolving credit facility.
As of December 31, 2015, $306 million of2016, there were no outstanding borrowings and $56the Company had $60 million of letters of credit were outstanding.outstanding under the revolving credit facility.
Project - level Debt
El Segundo Credit AgreementEnergy Center Minneapolis LLC Series D Notes
On August 23, 2011,October 31, 2016, NRG West HoldingsEnergy Center Minneapolis LLC, a subsidiary of the Company, received proceeds of $125 million from the issuance of 3.55% Series D notes due October 31, 2031, or West Holdings,the Series D Notes, and entered into a credit agreement with a group of lenders in respect to the El Segundo project, or the El Segundo Credit Agreement. The El Segundo Credit Agreement is comprised of a $540 million two tranche construction loanshelf facility with additional facilities for the anticipated issuance of lettersan additional $70 million of credit or working capital loansnotes at a 4.80% fixed rate. The Series D Notes will be secured by substantially all of the assets of NRG Energy Center Minneapolis LLC. NRG Thermal LLC has guaranteed the indebtedness and its guarantee is secured by the assets of West Holdings.
The two tranche construction loan facility consistsa pledge of the $480 million Tranche A Construction Facility, or the Tranche A Facility, and the $60 million Tranche B Construction Facility, or the Tranche B Facility, bothequity interests in all of which mature in August 2023 and convert to a term loan. On May 29, 2015, NRG West Holdings amended its financing agreement to increase borrowings under the Tranche A facility by $5 million and to reduce the related interest rate to LIBOR plus an applicable margin of 1.625% from May 29, 2015, to August 31, 2017, LIBOR plus an applicable margin of 1.75% from September 1, 2017, to August 31, 2020, and LIBOR plus 1.875% from September 1, 2020, through the maturity date; to reduce the Tranche B loan interest rate to LIBOR plus an applicable margin of 2.250% from May 29, 2015, to August 31, 2017, LIBOR plus 2.375% from September 1, 2017, to August 31, 2020, and LIBOR plus an applicable margin of 2.50% from September 1, 2020, through the maturity date and to reduce the working capital facility by $9 million. The proceeds of the increased borrowing were used to pay costs associated with the refinancing. Further, the amendment resulted in a $7 million loss on debt extinguishment. The Tranche A and Tranche B Facilities amortize based upon a predetermined schedule over the term of the loan with the balance payable at maturity. The construction loan converted to a term loan on January 28, 2014.Thermal LLC’s subsidiaries. NRG Energy Center Minneapolis LLC
The El Segundo Credit Agreement also provides fordistributed the issuance of letters of credit and working capital loans to support the El Segundo project's collateral needs. This includes letter of credit facilities on behalf of El Segundo of up to $90 million in supportproceeds of the PPA, upSeries D Notes to $48 millionNRG Thermal LLC, which in support ofturn distributed the collateral agent, and a working capital facility which permits loans or the issuance of letters of credit of upproceeds to $10 million.
Alta Wind Financing Arrangements
On June 30, 2015,NRG Yield Operating LLC entered into a tax equity financing arrangement through which itto be utilized for general corporate purposes, including potential acquisitions.
CVSR Holdco Notes, due 2037
On July 15, 2016, CVSR Holdco, the indirect owner of the CVSR solar facility, issued $200 million of senior secured notes under the CVSR Holdco Financing Agreement, or 2037 CVSR Holdco Notes, that bear interest at 4.68% and mature on March 31, 2037. Net proceeds were distributed to the Company and NRG based on their respective ownership as of July 15, 2016, and, accordingly, the Company received $119 million in net proceeds asof $97.5 million.
As described in Note 5,3, Investments Accounted for byBusiness Acquisitions, on September 1, 2016, the Equity MethodCompany acquired the remaining 51.05% of CVSR, and Variable Interest Entitiesassumed . These proceeds, as well as proceeds obtained fromadditional debt of $496 million, which represents 51.05% of the June 29, 2015, Yield, Inc. common stock issuance,CVSR project level debt and 51.05% of the 2037 CVSR Holdco Notes. In connection with the retrospective adjustment of prior periods, as described in Note 1, Nature of Business, the Company now consolidates CVSR and the 2020 Convertible Notes issuance, as described above, were utilized to repay all100% of the project indebtedness associated with the Alta Wind X and Alta Wind XI wind facilities outstanding asits debt, consisting of that date. The Company also settled interest rate swaps associated with the$771 million of project level debt for the Alta Wind X and Alta Wind XI wind facilities at a value$200 million of $17 million.2037 CVSR Holdco Notes as of September 1, 2016.
Avenal
On March 18, 2015, Avenal, one of the Company's equity method investments, amended its credit agreement to increase its borrowings by $43 million and to reduce the related interest rate from 6 month LIBOR plus an applicable margin of 2.25% to 6 month LIBOR plus 1.75% from March 18, 2015, through March 17, 2022, 6 month LIBOR plus 2.00% from March 18, 2022, through March 17, 2027, and 6 month LIBOR plus 2.25% from March 18, 2027, through the maturity date. As a result of the credit agreement amendment, the Company received net proceeds of $20 million after fees from its 49.95% ownership in Avenal. Effective September 30, 2015, the Company increased its ownership to 50% by acquiring an additional 0.05% membership interest in Avenal.
Viento
On July 11, 2013, Viento entered into a credit agreement with lenders for a $200 million term loan with a maturity date of July 11, 2023 and a working capital facility in the amount of $9 million. The interest rate is 6 month LIBOR plus 2.75% until July 11, 2017 when it increases to LIBOR plus 3.00%. On July 11, 2021 it increases to LIBOR plus 3.25% through the maturity date. As of December 31, 2015, $189 million was outstanding under the term loan, nothing was outstanding under the working capital facility, and $27 million of letters of credit were issued.
Lease financing arrangements
Alta Wind Holdings (Alta Wind II - V) and Alta I (operating entities) have finance lease obligations issued under lease transactions whereby the respective operating entities sold and leased back undivided interests in specific assets of the project. The sale and related lease transactions are accounted for as financing arrangements as the operating entities have continued involvement with the property. The terms and conditions of each facility lease are substantially similar. Each operating entity makes rental payments as stipulated in the facility lease agreements on a semiannual basis every June 30 and December 30 through the final maturity dates. In addition, the operating entities have a credit agreement with a group of lenders that provides for the issuance of letters of credit to support certain operating and debt service obligations. Certain O&Moperations and maintenance, as well as rent reserve requirements are satisfied by letters of credit issued under the NRG Yield Operating agreement. As of December 31, 2015, $1,0022016, $965 million was outstanding under the finance lease obligations, and $122$119 million of letters of credit were issued under the credit agreement and $19$23 million were issued under the Yield Credit Facility.
Interest Rate Swaps — Project Financings
Many of the Company's project subsidiaries entered into interest rate swaps, intended to hedge the risks associated with interest rates on non-recourse project level debt. These swaps amortize in proportion to their respective loans and are floating for fixed where the project subsidiary pays its counterparty the equivalent of a fixed interest payment on a predetermined notional value and will receive quarterly the equivalent of a floating interest payment based on the same notional value. All interest rate swap payments by the project subsidiary and its counterparty are made quarterly and the LIBOR is determined in advance of each interest period. In connection with the acquisition of the Alta Wind Portfolio in 2015, as described in Note 3, Business Acquisitions, the Company acquired thirty-one additional interest rate swaps, thirty of which were settled during 2015 as discussed above.2015. During 2015, the Company acquired thirty-two additional interest rate swaps in connection with the January 2015 and November 2015 drop downs,Drop Downs, as described in Note 3, Business Acquisitions.
The following table summarizes the swaps, some of which are forward starting as indicated, related to the Company's project level debt as of December 31, 2015.2016:
| | | | | % of Principal | | Fixed Interest Rate | | Floating Interest Rate | | Notional Amount at December 31, 2015
(In millions) | | Effective Date | | Maturity Date | | % of Principal | | Fixed Interest Rate | | Floating Interest Rate | | Notional Amount at December 31, 2016 (In millions) | | Effective Date | | Maturity Date |
| Alpine | | 85 | % | | 2.744 | % | | 3-Month LIBOR | | $ | 122 |
| | various | | December 31, 2029 | | 85 | % | | 2.744 | % | | 3-Month LIBOR | | $ | 115 |
| | various | | December 31, 2029 |
| Alpine | | 85 | % | | 2.421 | % | | 3-Month LIBOR | | 9 |
| | June 24, 2014 | | June 30, 2025 | | 85 | % | | 2.421 | % | | 3-Month LIBOR | | 8 |
| | June 24, 2014 | | June 30, 2025 |
| Avra Valley | | 85 | % | | 2.333 | % | | 3-Month LIBOR | | 51 |
| | November 30, 2012 | | November 30, 2030 | | 85 | % | | 2.333 | % | | 3-Month LIBOR | | 49 |
| | November 30, 2012 | | November 30, 2030 |
| AWAM | | 100 | % | | 2.47 | % | | 3-Month LIBOR | | 19 |
| | May 22, 2013 | | May 15, 2031 | | 100 | % | | 2.47 | % | | 3-Month LIBOR | | 18 |
| | May 22, 2013 | | May 15, 2031 |
| Blythe | | 75 | % | | 3.563 | % | | 3-Month LIBOR | | 16 |
| | June 25, 2010 | | June 25, 2028 | | 75 | % | | 3.563 | % | | 3-Month LIBOR | | 14 |
| | June 25, 2010 | | June 25, 2028 |
| Borrego | | 75 | % | | 1.125 | % | | 3-Month LIBOR | | 9 |
| | April 3, 2013 | | June 30, 2020 | | 75 | % | | 1.125 | % | | 3-Month LIBOR | | 7 |
| | April 3, 2013 | | June 30, 2020 |
| El Segundo | | 75 | % | | 2.417 | % | | 3-Month LIBOR | | 358 |
| | November 30, 2011 | | August 31, 2023 | | 75 | % | | 2.417 | % | | 3-Month LIBOR | | 330 |
| | November 30, 2011 | | August 31, 2023 |
| Kansas South | | 75 | % | | 2.368 | % | | 6-Month LIBOR | | 25 |
| | June 28, 2013 | | December 31, 2030 | | 75 | % | | 2.368 | % | | 6-Month LIBOR | | 23 |
| | June 28, 2013 | | December 31, 2030 |
| Laredo Ridge | | 75 | % | | 2.31 | % | | 3-Month LIBOR | | 83 |
| | March 31, 2011 | | March 31, 2026 | | 75 | % | | 2.31 | % | | 3-Month LIBOR | | 79 |
| | March 31, 2011 | | March 31, 2026 |
| Marsh Landing | | 75 | % | | 3.244 | % | | 3-Month LIBOR | | 387 |
| | June 28, 2013 | | June 30, 2023 | | 75 | % | | 3.244 | % | | 3-Month LIBOR | | 342 |
| | June 28, 2013 | | June 30, 2023 |
| Roadrunner | | 75 | % | | 4.313 | % | | 3-Month LIBOR | | 30 |
| | September 30, 2011 | | December 31, 2029 | | 75 | % | | 4.313 | % | | 3-Month LIBOR | | 28 |
| | September 30, 2011 | | December 31, 2029 |
| South Trent | | 75 | % | | 3.265 | % | | 3-Month LIBOR | | 46 |
| | June 15, 2010 | | June 14, 2020 | | 75 | % | | 3.265 | % | | 3-Month LIBOR | | 43 |
| | June 15, 2010 | | June 14, 2020 |
| South Trent | | 75 | % | | 4.95 | % | | 3-Month LIBOR | | 21 |
| | June 30, 2020 | | June 14, 2028 | | 75 | % | | 4.95 | % | | 3-Month LIBOR | | 21 |
| | June 30, 2020 | | June 14, 2028 |
| Tapestry | | 75 | % | | 2.21 | % | | 3-Month LIBOR | | 163 |
| | December 30, 2011 | | December 21, 2021 | | 75 | % | | 2.21 | % | | 3-Month LIBOR | | 155 |
| | December 30, 2011 | | December 21, 2021 |
| Tapestry | | 50 | % | | 3.57 | % | | 3-Month LIBOR | | 60 |
| | December 21, 2021 | | December 21, 2029 | | 50 | % | | 3.57 | % | | 3-Month LIBOR | | 60 |
| | December 21, 2021 | | December 21, 2029 |
| Viento | | 90 | % | | various |
| | 6-Month LIBOR | | 235 |
| | various | | various | |
| Viento Funding II | | | 90 | % | | various |
| | 6-mo. LIBOR | | 160 |
| | various | | various |
| Viento Funding II | | | 90 | % | | 4.985 | % | | 6-mo. LIBOR | | 65 |
| | July 11, 2023 | | June 30, 2028 |
| Walnut Creek Energy | | 75 | % | | various |
| | 3-Month LIBOR | | 311 |
| | June 28, 2013 | | May 31, 2023 | | 75 | % | | various |
| | 3-Month LIBOR | | 276 |
| | June 28, 2013 | | May 31, 2023 |
| WCEP Holdings | | 90 | % | | 4.003 | % | | 3-Month LIBOR | | 46 |
| | June 28, 2013 | | May 31, 2023 | | 90 | % | | 4.003 | % | | 3-Month LIBOR | | 46 |
| | June 28, 2013 | | May 31, 2023 |
| Total | | | | | | $ | 1,991 |
| | | | | | | $ | 1,839 |
| |
Annual Maturities
Annual payments based on the maturities of the Company's debt, for the years ending after December 31, 2015,2016, are as follows:
| | | | (In millions) | (In millions) |
| 2016 | $ | 241 |
| |
| 2017 | 252 |
| $ | 282 |
|
| 2018 | 260 |
| 292 |
|
| 2019 | 927 |
| 651 |
|
| 2020 | 613 |
| 641 |
|
| 2021 | | 439 |
|
| Thereafter | 2,606 |
| 3,492 |
|
| Total | $ | 4,899 |
| $ | 5,797 |
|
Note 1011 — Earnings Per Share
Basic and diluted earnings per common share areis computed by dividing net income by the weighted average number of common shares outstanding. Shares issued during the year are weighted for the portion of the year that they were outstanding. Diluted earnings per share is computed in a manner consistent with that of basic earnings per share while giving effect to all potentially dilutive common shares that were outstanding during the period.
The number of shares and per share amounts for the prior periods presented below have been retrospectively restated to reflect the Recapitalization as further described in Note 11,12, Stockholders' Equity.
The reconciliation of the Company's basic and diluted earnings per share is shown in the following table:
|
| | | | | | | | | | | | | | | | | | | | | | | |
| | Year Ended December 31, 2015 | | Year Ended December 31, 2014 | | Period from July 23, 2013 to December 31, 2013 |
| | | |
| (In millions, except per share data) | Common Class A | | Common Class C | | Common Class A | | Common Class C | | Common Class A | | Common Class C |
| Basic and diluted earnings per share attributable to NRG Yield, Inc. common stockholders | | | | | | | | | | | |
Net income attributable to NRG Yield, Inc.(a) | $ | 14 |
| | $ | 19 |
| | $ | 8 |
| | $ | 8 |
| | $ | 7 |
| | $ | 7 |
|
| Weighted average number of common shares outstanding | 35 |
| | 49 |
| | 28 |
| | 28 |
| | 23 |
| | 23 |
|
Earnings per weighted average common share — basic and diluted (a) | $ | 0.40 |
| | $ | 0.40 |
| | $ | 0.30 |
| | $ | 0.30 |
| | $ | 0.29 |
| | $ | 0.29 |
|
|
| | | | | | | | | | | | | | | | | | | | | | | |
| | Year Ended December 31, 2016 | | Year Ended December 31, 2015 | | Year Ended December 31, 2014 |
(In millions, except per share data) (a) | Common Class A | | Common Class C | | Common Class A | | Common Class C | | Common Class A | | Common Class C |
| Basic and diluted earnings per share attributable to NRG Yield, Inc. common stockholders | | | | | | | | | | | |
| Net income attributable to NRG Yield, Inc. | $ | 20 |
| | $ | 37 |
| | $ | 14 |
| | $ | 19 |
| | $ | 8 |
| | $ | 8 |
|
| Weighted average number of common shares outstanding — basic and diluted | 35 |
| | 63 |
| | 35 |
| | 49 |
| | 28 |
| | 28 |
|
| Earnings per weighted average common share — basic and diluted | $ | 0.58 |
| | $ | 0.58 |
| | $ | 0.40 |
| | $ | 0.40 |
| | $ | 0.30 |
| | $ | 0.30 |
|
(a) Net income attributable to NRG Yield, Inc. and basic and diluted earnings per share might not recalculate due to presenting values in millions rather than whole dollars.
With respect toThe following table summarizes the Class A common stock, there were a total of 15 million and 12 million anti-dilutiveCompany's outstanding equity instruments forthat are anti-dilutive and were not included in the years ended December 31, 2015, and 2014, respectively, related tocomputation of the 2019 Convertible Notes. With respect to the Class C common stock, there were a total of 5 million anti-dilutive outstanding equity instruments for the year ended December 31, 2015, related to the 2020 Convertible Notes.Company's diluted earnings per share:
|
| | | | | | | | |
| | Year Ended December 31, |
| | 2016 | | 2015 | | 2014 |
| | (In millions of shares) |
| 2019 Convertible Notes - Common Class A | 15 |
| | 15 |
| | 12 |
|
| 2020 Convertible Notes - Common Class C | 10 |
| | 5 |
| | — |
|
Note 1112 — Stockholders' Equity
On July 22, 2013, in connection with its initial public offering, the Company authorized 500,000,000 shares of Class A common stock, of which 22,511,250 were issued to the public and became outstanding. In return for the issuance of these shares, the Company received $468 million, net of underwriting discounts and commissions of $27 million. In addition, the Company authorized 500,000,000 shares of Class B common stock, of which 42,738,750 were issued to NRG concurrently with the initial public offering and became outstanding. The Company utilized $395 million of the proceeds from the issuance of the Class A common stock to acquire a controlling interest in NRG Yield LLC from NRG. Each share of the Class A common stock and the Class B common stock entitles the holder to one vote on all matters.
On July 29, 2014, the Company issued 12,075,000 shares of Class A common stock for net proceeds, after underwriting discount and expenses, of $630 million. The Company utilized the proceeds of the offering to acquire 12,075,000 additional Class A units of NRG Yield LLC.
Recapitalization
On May 5, 2015, the Company's stockholders approved amendments to the Company's certificate of incorporation that adjusted the Company’s capital structure by creating two new classes of capital stock, Class C common stock and Class D common stock, and distributed shares of Class C and Class D common stock to holders of the Company's outstanding Class A and Class B common stock, respectively, through a stock split. The Recapitalization became effective on May 14, 2015.
The Class C common stock and Class D common stock have the same rights and privileges and rank equally, share ratably and are identical in all respects to the shares of Class A common stock and Class B common stock, respectively, as to all matters, except that each share of Class C common stock and Class D common stock is entitled to 1/100th of a vote on all stockholder matters. The par value per share of the Company’s Class A common stock and Class B common stock remains unchanged at $0.01 per share after the effect of the stock split described above. Accordingly, the stock split was accounted for as a stock dividend. The Company recorded a transfer between retained earnings and common stock equal to the par value of each share of Class C common stock and Class D common stock that was issued. The Company also retrospectively adjusted all prior period share and per share amounts in the consolidated financial statements for the effect of the stock dividend, so that all periods are comparable.
Class C Common Stock Issuance
On June 29, 2015, the Company closed on its offering of 28,198,000 shares of Class C common stock, which included 3,678,000 shares of Class C common stock purchased by the underwriters through the exercise of an over-allotment option. Net proceeds to the Company from the sale of the Class C common stock were $599 million, net of underwriting discounts and
commissions of $21 million. The Company utilized the proceeds of the offering to acquire 28,198,000 additional Class C units of NRG Yield LLC and, as a result, it currently owns 53.3% of the economic interests of NRG Yield LLC, with NRG retaining 46.7% of the economic interests of NRG Yield LLC.
Dividends to Class A and Class C common stockholders
The following table lists the dividends paid on the Company's Class A and Class C common stock during the year ended December 31, 2015:2016:
| | | | Fourth Quarter 2015 | | Third Quarter 2015 | | Second Quarter 2015 | | First Quarter 2015 | Fourth Quarter 2016 | | Third Quarter 2016 | | Second Quarter 2016 | | First Quarter 2016 |
| Dividends per Class A share | $ | 0.215 |
| | $ | 0.21 |
| | $ | 0.20 |
| | $ | 0.39 |
| $ | 0.25 |
| | $ | 0.24 |
| | $ | 0.23 |
| | $ | 0.225 |
|
| Dividends per Class C share | $ | 0.215 |
| | $ | 0.21 |
| | $ | 0.20 |
| | N/A |
| $ | 0.25 |
| | $ | 0.24 |
| | $ | 0.23 |
| | $ | 0.225 |
|
Dividends on the Class A and Class C common stock are subject to available capital, market conditions, and compliance with associated laws, regulations and other contractual obligations. The Company expects that, based on current circumstances, comparable cash dividends will continue to be paid in the foreseeable future.
On February 17, 2016,15, 2017, the Company declared a quarterly dividend on its Class A and Class C common stock of $0.225$0.26 per share payable on March 15, 2016,2017, to stockholders of record as of March 1, 2016.2017.
The Company also authorized 10,000,000 shares of preferred stock, par value $0.01 per share. None of the shares of preferred stock have been issued.
Distributions to NRG
The following table lists the distributions paid to NRG during the year ended December 31, 2015:2016:
| | | | Fourth Quarter 2015 | | Third Quarter 2015 | | Second Quarter 2015 | | First Quarter 2015 | Fourth Quarter 2016 | | Third Quarter 2016 | | Second Quarter 2016 | | First Quarter 2016 |
| Distributions per Class B unit | $ | 0.215 |
| | $ | 0.21 |
| | $ | 0.20 |
| | $ | 0.39 |
| $ | 0.25 |
| | $ | 0.24 |
| | $ | 0.23 |
| | $ | 0.225 |
|
| Distributions per Class D unit | $ | 0.215 |
| | $ | 0.21 |
| | $ | 0.20 |
| | N/A |
| $ | 0.25 |
| | $ | 0.24 |
| | $ | 0.23 |
| | $ | 0.225 |
|
The portion of the distributions paid by NRG Yield LLC to NRG is recorded as a reduction to the Company's noncontrolling interest balance. The portion of the distributions paid by NRG Yield LLC to the Company was utilized to fund the dividends to the Class A and Class C common stockholders described above.
On February 17, 2016,15, 2017, NRG Yield LLC declared a quarterly distribution on its Class B and Class D common stock of $0.225$0.26 per unit payable to NRG on March 15, 2016.2017.
During 2016, 2015 and 2014, the Company acquired the Drop Down Assets from NRG, as described in Note 3, Business Acquisitions. The difference between the cash paid and historical value of the CVSR Drop Down of $112 million, as well as $6 million of AOCL, was recorded as a distribution to NRG and reduced the balance of its noncontrolling interest in 2016. The difference between the cash paid and historical value of the January 2015 and November 2015 Drop Down Assets of $109 million, as well as $32 million of AOCL, was recorded as a contribution from NRG and increased the balance of its noncontrolling interest in 2015. The difference between the cash paid and historical value of the June 2014 Drop Down Assets of $113 million was recorded as a distribution to NRG and reduced the balance of its noncontrolling interest in 2014. In addition, as the projects were owned by NRG prior to the Company’s acquisitions, the pre-acquisition earnings of such projects are recorded as attributable to NRG's noncontrolling interest. Prior to the date of acquisition, certain of the projects made distributions to NRG and NRG made contributions into certain projects. These amounts are reflected within the Company’s statement of stockholders’ equity as changes in the noncontrolling interest balance. In addition, NRG maintained a 25% ownership interest in the Class B interests of NRG Wind TE Wind Holdco. This 25% interest is also reflected within the Company’s noncontrolling interest balance.
Note 1213 — Segment Reporting
The Company’s segment structure reflects how management currently operates and allocates resources. The Company's businesses are primarily segregated based on conventional power generation, renewable businesses which consist of solar and wind, and the thermal and chilled water business. The Corporate segment reflects the Company's corporate costs. The Company's chief operating decision maker, its Chief Executive Officer, evaluates the performance of its segments based on operational measures including adjusted earnings before interest, taxes, depreciation and amortization, or Adjusted EBITDA, and CAFD, as well as economic gross margin and net income (loss).
The Company generated more than 10% of its revenues from the following customers for the years ended December 31, 2016, 2015 2014 and 2013:2014:
| | | | 2015 | | 2014 | | 2013 | 2016 | | 2015 | | 2014 |
| Customer | Conventional (%) | | Renewables (%) | | Conventional (%) | | Renewables (%) | | Conventional (%) | | Renewables (%) | Conventional (%) | | Renewables (%) | | Conventional (%) | | Renewables (%) | | Conventional (%) | | Renewables (%) |
| SCE | 25% | | 18% | | 26% | | 9% | | 14% | | 4% | 21% | | 21% | | 23% | | 17% | | 24% | | 7% |
| PG&E | 14% | | 3% | | 16% | | 4% | | 21% | | 7% | 12% | | 11% | | 13% | | 12% | | 15% | | 13% |
| |
| Year ended December 31, 2015 | Year ended December 31, 2016 |
| (In millions) | Conventional Generation |
| Renewables |
| Thermal |
| Corporate |
| Total | Conventional Generation |
| Renewables |
| Thermal |
| Corporate |
| Total |
| Operating revenues | $ | 336 |
|
| $ | 359 |
|
| $ | 174 |
|
| $ | — |
|
| $ | 869 |
| $ | 333 |
|
| $ | 518 |
|
| $ | 170 |
|
| $ | — |
|
| $ | 1,021 |
|
| Cost of operations | 59 |
| | 127 |
| | 126 |
|
| — |
|
| 312 |
| 66 |
| | 126 |
| | 114 |
|
| — |
|
| 306 |
|
| Depreciation and amortization | 81 |
|
| 165 |
|
| 19 |
|
| — |
|
| 265 |
| 80 |
|
| 197 |
|
| 20 |
|
| — |
|
| 297 |
|
| Impairment losses | | — |
| | 183 |
| | — |
| | — |
| | 183 |
|
| General and administrative | — |
|
| — |
|
| — |
|
| 12 |
|
| 12 |
| — |
|
| — |
|
| — |
|
| 16 |
|
| 16 |
|
| Acquisition-related transaction and integration costs | — |
| | — |
| | — |
| | 3 |
| | 3 |
| — |
| | — |
| | — |
| | 1 |
| | 1 |
|
| Operating income (loss) | 196 |
| | 67 |
| | 29 |
| | (15 | ) | | 277 |
| 187 |
| | 12 |
| | 36 |
| | (17 | ) | | 218 |
|
| Equity in earnings of unconsolidated affiliates | 14 |
|
| 21 |
|
| — |
|
| — |
|
| 35 |
| 13 |
|
| 24 |
|
| — |
|
| — |
|
| 37 |
|
| Other income, net | 1 |
| | 1 |
| | — |
| | — |
| | 2 |
| 1 |
| | 2 |
| | — |
| | — |
| | 3 |
|
| Loss on extinguishment of debt | (7 | ) | | (2 | ) | | — |
| | — |
| | (9 | ) | |
| Interest expense | (48 | ) |
| (122 | ) |
| (7 | ) |
| (61 | ) |
| (238 | ) | (48 | ) |
| (141 | ) |
| (7 | ) |
| (78 | ) |
| (274 | ) |
| Income (loss) before income taxes | 156 |
|
| (35 | ) |
| 22 |
|
| (76 | ) |
| 67 |
| 153 |
|
| (103 | ) |
| 29 |
|
| (95 | ) |
| (16 | ) |
| Income tax expense | — |
|
| — |
|
| — |
|
| 12 |
|
| 12 |
| |
| Income tax benefit | | — |
|
| — |
|
| — |
|
| (1 | ) |
| (1 | ) |
| Net Income (Loss) | $ | 156 |
|
| $ | (35 | ) |
| $ | 22 |
|
| $ | (88 | ) |
| $ | 55 |
| $ | 153 |
|
| $ | (103 | ) |
| $ | 29 |
|
| $ | (94 | ) |
| $ | (15 | ) |
| Balance Sheet |
|
|
|
|
|
|
|
|
|
|
|
|
|
|
|
|
|
|
|
|
|
|
|
|
|
|
|
|
| Equity investment in affiliates | $ | 110 |
|
| $ | 688 |
|
| $ | — |
|
| $ | — |
|
| $ | 798 |
| $ | 106 |
|
| $ | 604 |
|
| $ | — |
|
| $ | — |
|
| $ | 710 |
|
Capital expenditures (a) | 4 |
|
| 6 |
|
| 20 |
|
| — |
|
| 30 |
| 7 |
|
| 2 |
|
| 14 |
|
| — |
|
| 23 |
|
| Total Assets | $ | 2,102 |
|
| $ | 5,056 |
|
| $ | 428 |
|
| $ | 189 |
|
| $ | 7,775 |
| $ | 1,993 |
|
| $ | 5,535 |
|
| $ | 426 |
|
| $ | 429 |
|
| $ | 8,383 |
|
(a) Includes accruals.
| | | | Year ended December 31, 2014 | Year ended December 31, 2015 |
| (In millions) | Conventional Generation | | Renewables | | Thermal | | Corporate | | Total | Conventional Generation | | Renewables | | Thermal | | Corporate | | Total |
| Operating revenues | $ | 317 |
| | $ | 234 |
| | $ | 195 |
| | $ | — |
| | $ | 746 |
| $ | 336 |
| | $ | 443 |
| | $ | 174 |
| | $ | — |
| | $ | 953 |
|
| Cost of operations | 55 |
| | 72 |
| | 139 |
| | — |
| | 266 |
| 59 |
| | 136 |
| | 126 |
| | — |
| | 321 |
|
| Depreciation and amortization | 82 |
| | 102 |
| | 18 |
| | — |
| | 202 |
| 81 |
| | 197 |
| | 19 |
| | — |
| | 297 |
|
| General and administrative | — |
| | — |
| | — |
| | 8 |
| | 8 |
| — |
| | — |
| | — |
| | 12 |
| | 12 |
|
| Acquisition-related transaction and integration costs | — |
| | — |
| | — |
| | 4 |
| | 4 |
| — |
| | — |
| | — |
| | 3 |
| | 3 |
|
| Operating income (loss) | 180 |
| | 60 |
| | 38 |
| | (12 | ) | | 266 |
| 196 |
| | 110 |
| | 29 |
| | (15 | ) | | 320 |
|
| Equity in earnings of unconsolidated affiliates | 14 |
| | 11 |
| | — |
| | — |
| | 25 |
| 14 |
| | 12 |
| | — |
| | — |
| | 26 |
|
| Other income, net | — |
| | 2 |
| | — |
| | 1 |
| | 3 |
| 1 |
| | 2 |
| | — |
| | — |
| | 3 |
|
| Loss on debt extinguishment | | (7 | ) | | (2 | ) | | — |
| | — |
| | (9 | ) |
| Interest expense | (53 | ) | | (101 | ) | | (7 | ) | | (30 | ) | | (191 | ) | (48 | ) | | (147 | ) | | (7 | ) | | (61 | ) | | (263 | ) |
| Income (loss) before income taxes | 141 |
| | (28 | ) | | 31 |
| | (41 | ) | | 103 |
| 156 |
| | (25 | ) | | 22 |
| | (76 | ) | | 77 |
|
| Income tax expense | — |
| | — |
| | — |
| | 4 |
| | 4 |
| — |
| | — |
| | — |
| | 12 |
| | 12 |
|
| Net Income (Loss) | $ | 141 |
| | $ | (28 | ) | | $ | 31 |
| | $ | (45 | ) | | $ | 99 |
| $ | 156 |
| | $ | (25 | ) | | $ | 22 |
| | $ | (88 | ) | | $ | 65 |
|
| Balance Sheet | | | | | | | | | | | | | | | | | | |
| Equity investments in affiliates | $ | 114 |
| | $ | 296 |
| | $ | — |
| | $ | — |
| | $ | 410 |
| $ | 110 |
| | $ | 587 |
| | $ | — |
| | $ | — |
| | $ | 697 |
|
Capital expenditures (a) | 6 |
| | — |
| | 7 |
| | — |
| | 13 |
| 4 |
| | 6 |
| | 20 |
| | — |
| | 30 |
|
| Total Assets | $ | 2,169 |
| | $ | 4,790 |
| | $ | 436 |
| | $ | 465 |
| | $ | 7,860 |
| $ | 2,102 |
| | $ | 5,970 |
| | $ | 428 |
| | $ | 189 |
| | $ | 8,689 |
|
(a) Includes accruals. Capital expenditures for Renewables include a sales tax refund received by Alpine in the first quarter of 2014.
| | | | Year ended December 31, 2013 | Year ended December 31, 2014 |
| (In millions) | Conventional Generation | | Renewables | | Thermal | | Corporate | | Total | Conventional Generation | | Renewables | | Thermal | | Corporate | | Total |
| Operating revenues | $ | 138 |
| | $ | 97 |
| | $ | 152 |
| | $ | — |
| | $ | 387 |
| $ | 317 |
| | $ | 316 |
| | $ | 195 |
| | $ | — |
| | $ | 828 |
|
| Cost of operations | 23 |
| | 15 |
| | 110 |
| | — |
| | 148 |
| 55 |
| | 83 |
| | 139 |
| | — |
| | 277 |
|
| Depreciation and amortization | 20 |
| | 39 |
| | 15 |
| | — |
| | 74 |
| 82 |
| | 133 |
| | 18 |
| | — |
| | 233 |
|
| General and administrative | — |
| | — |
| | — |
| | 7 |
| | 7 |
| — |
| | — |
| | — |
| | 8 |
| | 8 |
|
| Acquisition-related transaction and integration costs | | — |
| | — |
| | — |
| | 4 |
| | 4 |
|
| Operating income (loss) | 95 |
| | 43 |
| | 27 |
| | (7 | ) | | 158 |
| 180 |
| | 100 |
| | 38 |
| | (12 | ) | | 306 |
|
| Equity in earnings of unconsolidated affiliates | 16 |
| | 6 |
| | — |
| | — |
| | 22 |
| 14 |
| | 3 |
| | — |
| | — |
| | 17 |
|
| Other income, net | 1 |
| | 2 |
| | — |
| | — |
| | 3 |
| — |
| | 5 |
| | — |
| | 1 |
| | 6 |
|
| Loss on debt extinguishment | | — |
| | (1 | ) | | — |
| | — |
| | (1 | ) |
| Interest expense | (25 | ) | | (20 | ) | | (7 | ) | | — |
| | (52 | ) | (53 | ) | | (126 | ) | | (7 | ) | | (30 | ) | | (216 | ) |
| Income (loss) before income taxes | 87 |
| | 31 |
| | 20 |
| | (7 | ) | | 131 |
| 141 |
| | (19 | ) | | 31 |
| | (41 | ) | | 112 |
|
| Income tax expense | — |
| | — |
| | — |
| | 8 |
| | 8 |
| — |
| | — |
| | — |
| | 4 |
| | 4 |
|
| Net Income (Loss) | $ | 87 |
| | $ | 31 |
| | $ | 20 |
| | $ | (15 | ) | | $ | 123 |
| $ | 141 |
| | $ | (19 | ) | | $ | 31 |
| | $ | (45 | ) | | $ | 108 |
|
Note 1314 — Income Taxes
Effective Tax Rate
The income tax provision consisted of the following amounts:
| | | | Year Ended December 31, | Year Ended December 31, |
| | 2015 | | 2014 | | 2013 | 2016 | | 2015 | | 2014 |
| | (In millions, except percentages) | (In millions, except percentages) |
| Current | | | | | | | | | | |
| U.S. Federal | $ | — |
| | $ | — |
| | $ | — |
| $ | — |
| | $ | — |
| | $ | — |
|
| State | | — |
| | — |
| | — |
|
| Total — current | — |
| | — |
| | — |
| — |
| | — |
| | — |
|
| Deferred | | | | | | | | | | |
| U.S. Federal | 10 |
| | 2 |
| | 14 |
| (1 | ) | | 10 |
| | 2 |
|
| State | 2 |
| | 2 |
| | (6 | ) | — |
| | 2 |
| | 2 |
|
| Total — deferred | 12 |
| | 4 |
| | 8 |
| (1 | ) | | 12 |
| | 4 |
|
| Total income tax expense | $ | 12 |
| | $ | 4 |
| | $ | 8 |
| |
| Total income tax (benefit) expense | | $ | (1 | ) | | $ | 12 |
| | $ | 4 |
|
| Effective tax rate | 17.9 | % | | 3.9 | % | | 6.1 | % | 6.3 | % | | 15.6 | % | | 3.6 | % |
A reconciliation of the U.S. federal statutory rate of 35% to the Company's effective rate is as follows:
|
| | | | | | | | | | | |
| | Year Ended December 31, |
| | 2015 | | 2014 | | 2013 (a) |
| | (In millions, except percentages) |
| Income Before Income Taxes | 67 |
| | 103 |
| | 131 |
|
| Tax at 35% | 23 |
| | 36 |
| | 46 |
|
| State taxes, net of federal benefit | 2 |
| | 1 |
| | (6 | ) |
| Investment tax credits | (1 | ) | | — |
| | — |
|
| Impact of non-taxable partnership earnings | (11 | ) | | (28 | ) | | (32 | ) |
| Production tax credits | (4 | ) | | (6 | ) | | — |
|
| Change in state effective tax rate | — |
| | 1 |
| | — |
|
| Other | 3 |
| | — |
| | — |
|
| Income tax expense | $ | 12 |
| | $ | 4 |
| | $ | 8 |
|
| Effective income tax rate | 17.9 | % | | 3.9 | % | | 6.1 | % |
(a) Represents 34.5% ownership for the period July 22, 2013 through December 31, 2013. |
| | | | | | | | | | | |
| | Year Ended December 31, |
| | 2016 | | 2015 | | 2014 |
| | (In millions, except percentages) |
| Income Before Income Taxes | (16 | ) | | 77 |
| | 112 |
|
| Tax at 35% | (6 | ) | | 27 |
| | 39 |
|
| State taxes, net of federal benefit | — |
| | 2 |
| | 1 |
|
| Investment tax credits | (1 | ) | | (1 | ) | | — |
|
| Impact of non-taxable partnership earnings | 5 |
| | (15 | ) | | (31 | ) |
| Production tax credits, including prior year true-up | 4 |
| | (4 | ) | | (6 | ) |
| Change in state effective tax rate | — |
| | — |
| | 1 |
|
| Other | (3 | ) | | 3 |
| | — |
|
| Income tax (benefit) expense | $ | (1 | ) | | $ | 12 |
| | $ | 4 |
|
| Effective income tax rate | 6.3 | % | | 15.6 | % | | 3.6 | % |
For the years ended December 31, 2016, 2015 2014 and 2013,2014, the overall effective tax rate was different than the statutory rate of 35% primarily due to taxable earnings allocated to NRG resulting from its interest in NRG Yield LLC and production and investment tax credits generated from certain wind facilities.and solar assets, respectively.
The Company currently owns 53.3% of NRG Yield LLC and consolidates the results due to its controlling interest. The Company records NRG's 46.7% ownership as noncontrolling interest in the financial statements. For tax purposes, NRG Yield LLC is treated as a partnership; therefore, the Company and NRG each record their respective share of taxable income or loss.
The temporary differences, which gave rise to the Company's deferred tax assets, consisted of the following:
| | | | As of December 31, | As of December 31, |
| | 2015 | | 2014 | 2016 | | 2015 |
| | (In millions) | (In millions) |
| Deferred tax liabilities: | | | | |
| Investment in projects | | $ | 3 |
| | $ | 27 |
|
| Total deferred tax liabilities | | 3 |
| | 27 |
|
| Deferred tax assets: | | | | | | |
| Investment in projects | $ | — |
| | $ | 47 |
| |
| Production tax credits carryforwards | 10 |
| | 6 |
| 5 |
| | 10 |
|
| Investment tax credits | 1 |
| | — |
| 1 |
| | 1 |
|
| U.S. Federal net operating loss carryforwards | 181 |
| | 74 |
| 226 |
| | 181 |
|
| State net operating loss carryforwards | 5 |
| | 7 |
| 3 |
| | 5 |
|
| Total deferred tax assets | 197 |
| | 134 |
| 235 |
| | 197 |
|
| Deferred tax liabilities: | | | | |
| Investment in projects | $ | 27 |
| | $ | — |
| |
| Total deferred tax liabilities | 27 |
| | — |
| |
| Net non-current deferred tax asset | $ | 170 |
| | $ | 134 |
| |
| Valuation allowance | | $ | (16 | ) | | $ | — |
|
| Total deferred tax assets, net of valuation allowance | | $ | 219 |
| | $ | 197 |
|
| Net deferred noncurrent tax asset | | $ | 216 |
| | $ | 170 |
|
Tax Receivable and Payable
As of December 31, 2015,2016, the Company had a domestic tax receivable of $6 million, which related to federal cash grants for the Borrego project. This amount is fully reserved pending further discussions with the US Treasury Department.
Deferred Tax Assets and Valuation Allowance
Net deferred tax balance — As of December 31, 2015,2016 and 2014,2015, NRG recorded a net deferred tax asset of $170$232 million and $134$170 million, respectively. The Company believes it is more likely than not that the results of future operations will generate sufficient taxable income which includes the future reversal of existing taxable temporary differences to realize deferred tax assets. In arriving at this conclusion to utilize projections of future profit before tax in its estimate of future taxable income, theThe Company considered the profit before tax generated in recent years.years, as well as projections of future earnings and estimates of taxable income in arriving at this conclusion. The Company believes that $16 million, a deferred tax asset, expected to generate a capital loss, for which there are no existing capital gains or available tax planning strategies to utilize the asset in the future may not be realized, resulting in the recording of a valuation allowance.
NOL carryforwards — At December 31, 2015,2016, the Company had domestic NOLs carryforwards for federal income tax purposes of $181$226 million and cumulative state NOLs of $5$3 million tax-effected.
Uncertain Tax Positions
The Company had no identified uncertain tax positions that require evaluation as of December 31, 2015.2016.
Note 1415 — Related Party Transactions
In addition to the transactions and relationships described elsewhere in the notes to the consolidated financial statements, certain subsidiaries of NRG provide services to the Company's project entities. Amounts due to NRG subsidiaries are recorded as accounts payable — affiliate and amounts due to the Company from NRG subsidiaries are recorded as accounts receivable — affiliate in the Company's balance sheet. The disclosures below summarize the Company's material related party transactions with NRG and its subsidiaries that are included in the Company's operating revenues, operating costs and other income and expense.
Power Hedge Contracts by and between Renewable Entities and NRG Texas Power LLC
Elbow Creek and GoatCertain NRG Wind TE Holdco entities, which are subsidiaries in the Company's subsidiaries from RenewableRenewables segment, entered into power hedge contracts with NRG Texas Power LLC, a subsidiary of NRG, and generated $16 million and $12 million and $7 millionof revenues during the years ended December 31, 2015 2014 and 2013,2014, respectively. Included in the revenues for the years ended December 31, 2015, and 2014, are unrealized losses and gains, respectively, on forward contracts with NRG Texas Power LLC hedging the sale of power from the Elbow Creek, wind facility extending through the end of 2015, as further described in Note 7, Accounting for Derivative Instruments and Hedging Activities. Effective October 2015, Elbow Creek entered into a PPA with NRG Power Marketing LLC, or NRG Power Marketing, a wholly-owned subsidiary of NRG, as further described below, and the hedge agreement between Elbow Creek and NRG Texas Power LLC was terminated.
Operations and Maintenance Services (O&M) AgreementsPPA by and between Thermal EntitiesElbow Creek and NRG
OnIn October 1, 2014, NRG2015, Elbow Creek, the Company's subsidiary in the Renewables segment, entered into Plant O&M Services Agreementsa PPA with certain wholly-owned subsidiaries of the Company. NRG provides necessary and appropriate services to operate and maintain the subsidiaries' plant operations, businesses and thermal facilities. NRG is to be reimbursedPower Marketing for the provided services, as well as for all reasonablesale of energy and related expensesenvironmental attributes with the effective date of November 1, 2015, and
expenditures, and payments to third parties for services and materials rendered to or on behalf an expiration date of October 31, 2022. Elbow Creek generated $8 million of revenue during the parties to the agreements. NRG is not entitled to any management fee or mark-up under the agreements. Prior to October 1, 2014, NRG provided the same services to Thermal entities on an informal basis. For the yearsyear ended December 31, 2015, 2014,2016.
PPA by and 2013, total fees incurred underbetween NRG Energy Center Dover LLC and NRG
In February 2016, NRG Energy Center Dover LLC, or NRG Dover, a subsidiary of the agreements were $29 million, $27 million,Company, entered into a PPA with NRG Power Marketing for the sale of energy and $24 million, respectively. There was a balanceenvironmental attributes with an effective date of $29 millionFebruary 1, 2016 and $22 million due to NRG in accounts payable — affiliate asexpiration date of December 31, 2015,2018. NRG Dover generated $5 million of revenue during the year ended December 31, 2016. The agreement in place is in addition to the existing Power Sales and 2014, respectively.Services Agreement described further below.
Power Sales and Services Agreement by and between NRG Energy Center Dover LLC and NRG
NRG Energy Center Dover LLC, or NRG Dover, a subsidiary of the Company is party to a Power Sales and Services Agreement with NRG Power Marketing LLC, or NRG Power Marketing, a wholly-owned subsidiary of NRG.Marketing. The agreement is automatically renewed on a month-to-month basis unless terminated by either party upon at least 30 day written notice. Under the agreement, NRG Power Marketing has the exclusive right to (i) manage, market and sell power, (ii) procure fuel and fuel transportation for operation of the Dover generating facility, to include for purposes other than generating power, (iii) procure transmission services required for the sale of power and (iv) procure and market emissions credits for operation of the Dover generating facility.
In addition, NRG Power Marketing has the exclusive right and obligation to direct the output from the generating facility, in accordance with and to meet the terms of any power sales contracts executed against the power generation of the Dover facility. Under the agreement, NRG Power Marketing pays NRG Dover gross receipts generated through sales, less costs incurred by NRG Power Marketing related to providing such services as transmission and delivery costs, as well as fuel costs. In July 2013, the originally coal-fueled plant was converted to a natural gas facility. For the years ended December 31, 2016, 2015 2014 and 2013,2014, NRG Dover purchased approximately $1 million, $5 million $10 million and $5$10 million, respectively, of natural gas from NRG Power Marketing.Marketing under the Power Sales and Services Agreement.
Energy Marketing Services Agreement by and between NRG Energy Center Minneapolis LLC and NRG
NRG Energy Center Minneapolis LLC, or NRG Minneapolis, a subsidiary of the Company is party to an Energy Marketing Services Agreement with NRG Power Marketing, a wholly-owned subsidiary of NRG.Marketing. The agreement commenced in August 2014 and is automatically renewed annually unless terminated by either party upon at least 90 day written notice prior to the end of any term. Under the agreement, NRG Power Marketing will procure fuel and fuel transportation for the operation of the Minneapolis generating facility. For the years ended December 31, 2016, 2015 and 2014, NRG Minneapolis purchased approximately $7 million, $8 million and $2 million, respectively, of natural gas from NRG Power Marketing.
Operations and Maintenance (O&M) Services Agreements by and between Thermal Entities and NRG
On October 1, 2014, NRG entered into Plant O&M Services Agreements with certain wholly-owned subsidiaries of the Company. NRG provides necessary and appropriate services to operate and maintain the subsidiaries' plant operations, businesses and thermal facilities. NRG is to be reimbursed for the provided services, as well as for all reasonable and related expenses and expenditures, and payments to third parties for services and materials rendered to or on behalf of the parties to the agreements. NRG is not entitled to any management fee or mark-up under the agreements. Prior to October 1, 2014, NRG provided the same services to Thermal entities on an informal basis. For each of the years ended December 31, 2016 and 2015, total fees incurred under the agreements were $29 million. For the year ended December 31, 2014, total fees incurred were $27 million. There was a balance of $20 million and $29 million due to NRG in accounts payable — affiliate as of December 31, 2016, and 2015, respectively. As of December 31, 2016, $11 million of the balance was recorded in the current liabilities of the consolidated balance sheet and $9 million was recorded in non-current liabilities of the consolidated balance sheet.
O&M Services Agreements by and between GenConn and NRG
GenConn incurs fees under two O&M agreements with wholly-owned subsidiaries of NRG. The fees incurred under the agreements were $5 million, $4 million $6 million and $5$6 million for the years ended December 31, 2016, 2015 2014 and 2013,2014, respectively.
O&M Services Agreements by and between El Segundo and NRG El Segundo Operations
El Segundo incurs fees under an O&M agreement with NRG El Segundo Operations, Inc., a wholly-owned subsidiary of NRG. Under the O&M agreement, NRG El Segundo Operations, Inc. manages, operates and maintains the El Segundo facility for an initial term of ten years following the commercial operations date. For each of the years ended December 31, 2016, 2015 and 2014, the costs incurred under the agreement were approximately $4 million. The Company incurred $5 million in costs under the agreement for the year ended December 31, 2013. There was a balance of $1 million due to NRG El Segundo in accounts payable — affiliate as of December 31, 2015,2016 and 2014.
Energy Marketing Services Agreement with NRG Power Marketing LLC
El Segundo was a party to an energy marketing services agreement with NRG Power Marketing LLC to procure fuel and market capacity, energy and ancillary output of the facility prior to the start of the PPA with Southern California Edison. The agreement began in April 2013 and ended at the commercial operations date in August 2013. For the years ended December 31, 2014, and 2013, the Company recorded approximately, $1 million and $12 million, respectively, in costs related to this agreement, of which $9 million was recorded to property, plant and equipment in 2013, with the remaining amount recorded to cost of operations in the Company's statement of operations. There were no costs incurred during the year ended December 31, 2015.
Administrative Services Agreement by and between Marsh Landing and GenOn Energy Services, LLC and related Assignment and Assumption Agreement
Marsh Landing iswas a party to an administrative services agreement with GenOn Energy Services, LLC, a wholly owned subsidiary of NRG, which provides withthrough December 18, 2016. Under the agreement, GenOn Energy Services, LLC provided processing and paying invoicesinvoice payment services on behalf of Marsh Landing. Marsh Landing reimbursesreimbursed GenOn Energy Services, LLC for the amounts paid by it.it paid. The Company reimbursed costs under this agreement of approximately $14 million for the year ended December 31, 2016, and $13 million for the years ended December 31, 2015 and 2014, respectively, and $36 million forrespectively. For the year ended December 31, 2013. For the years ended December 31, 2014, and 2013, $2 million and $29 million, respectively, werewas capitalized. There was a balance of $6$1 million and $4$6 million due to GenOn Energy Services, LLC in accounts payable — affiliate as of December 31, 2016 and 2015, respectively.
Marsh Landing had the right to terminate the agreement for convenience upon thirty days prior written notice. In lieu of a termination of the agreement, Marsh Landing requested that GenOn Energy Services LLC enter into an assignment and 2014, respectively.assumption agreement with NRG West Coast LLC, a wholly owned subsidiary of NRG. The administrative services agreement was assigned to NRG West Coast LLC on December 19, 2016.
Administrative Services Agreement by and between CVSR and NRG
CVSR iswas a party to an administrative services agreement with NRG Energy Services, a wholly-owned subsidiary of NRG, which was subsequently assigned to NRG Renew Operations & Maintenance LLC, or RENOM, on July 15, 2015. The Company reimbursed a total of $4 million and $7 million to NRG Energy Services for the expenses incurred for the years ended December 31, 2015 and 2014, respectively. See below for further discussions of the costs incurred by CVSR under the administrative services agreement with RENOM in 2016.
Administrative Services Agreement by and between the Company and NRG Renew Operations & Maintenance LLC
Various wholly-owned subsidiaries of the Company in the Renewables segment are party to an administrative services agreement with RENOM, a wholly-owned subsidiary of NRG, which provides O&M services on behalf of CVSR. CVSR reimburses NRG Energy Services LLCthese entities. The Company incurred total expenses for these services in the amounts paid by it. CVSR reimbursed costs under this agreementamount of $5$13 million and $7 million for the years ended December 31, 2016 and 2015, respectively. There was a balance of $5 million and $1 million due to RENOM as of December 31, 2016 and 2015, respectively.
O&MServices Agreements by and between Walnut Creek and NRG
Walnut Creek incurs fees under an O&M agreement with NRG Energy Services LLC, a wholly-owned subsidiary of NRG. Under the O&M agreement, NRG Energy Services LLC manages, operates and maintains the Walnut Creek facility and is reimbursed for the services provided. The Company incurred total expenses for these services in the amount of $3 million for each of the years ended December 31, 2016 and 2015 and 2014, respectively.$2 million for the year ended December 31, 2014.
Management Services Agreement by and between the Company and NRG
NRG provides the Company with various operation,operational, management, and administrative services, which include human resources, accounting, tax, legal, information systems, treasury, and risk management, as set forth in the Management Services Agreement. As of December 31, 2015,2016, the base management fee was approximately $7$7.5 million per year, subject to an inflation-based adjustment annually, at an inflation factor based on the year-over-year U.S. consumer price index. The fee is also subject to adjustments following the consummation of future acquisitions and as a result of a change in the scope of services provided under the Management Services Agreement. During the year ended December 31, 2015,2016, the fee was increased by approximately $1$0.5 million per year, primarily in connection withdue to the acquisition of the January 2015CVSR Drop Down. In addition to the base management fee, the Company is also responsible for any expenses that are directly incurred and November 2015 Drop Down Assets.paid for by NRG on behalf of the Company. Costs incurred under this agreement were approximately $10 million, $8 million, and $6 million for the years ended December 31, 2016, 2015, and 2014, andrespectively. There was a balance of $3 million for the period from July 23, 2013 through December 31, 2013. These costs included certain direct expenses incurred byin accounts payable — affiliate due to NRG on behalf of the Company in addition to the base management fee, none of which was payable as of December 31, 2015.2016.
Administrative Services Agreements by and between Wind TE Holdco LLC and NRG
Certain subsidiariesNRG Asset Services LLC, a wholly-owned subsidiary of NRG, have entered into agreements with the Company's project entities to provide operation and maintenance services for the balance of the plants not covered by turbine supplier's maintenance and service agreements for the postwarranty period. The agreements have various terms with provisions for extension until terminated. For the years ended December 31, 2015, and 2014, the costs incurred under the agreements were $5 million and $3 million, respectively.
Certain subsidiaries of NRG provideprovides support services to NRG Wind TE Holdco LLC project entities pursuant to various support services agreements. The agreements provide for administrative and support services and reimbursements of certain insurance, consultant and credit costs. For the years ended December 31, 2016, 2015 and 2014, the costs incurred under the agreements were $2 million, $3 million and $1 million, respectively.
Accounts Payable to NRG Repowering Holdings LLC
During 2013, NRG Repowering Holdings, LLC, a wholly-owned subsidiary of NRG, made payments to BA Leasing BSC, LLC, or BA Leasing, of $18 million, which were expected to be repaid with the proceeds of the cash grant received by BA Leasing with respect to the PFMG DG Solar Projects, in connection with a sale-leaseback arrangement between the PFMG DG Solar Projects and BA Leasing. As of December 31, 2013,2014, PFMG DG Solar Projects had a corresponding receivable for the reimbursement of the cash grant from BA Leasing and related payable to NRG Repowering Holdings, LLC. In the first quarter of 2014, the PFMG DG Solar Projects received $11 million from BA Leasing and reduced the remaining receivable with an offset to the deferred liability recorded in connection with the sale - leaseback arrangement. The PFMG DG Solar Projects utilized the $11 million to repay NRG Repowering Holdings LLC. There was a balance of $7 million in accounts payable — affiliate as of December 31, 2015 which was settled in October 2016 with an offset to noncontrolling interest in the equity section of the consolidated balance sheet.
EPC Agreement by and 2014.between NECP and NRG
On October 31, 2016, NRG Business Services LLC, a subsidiary of NRG, and NECP, a wholly owned subsidiary of the Company, entered into an EPC agreement for the construction of a 73 MWt district energy system for NECP to provide 150 kpph of steam, 6,750 tons of chilled water and 7.5 MW of emergency backup power service to UPMC Mercy. The initial term of the energy services agreement with UPMC Mercy will be for a period of twenty years from the service commencement date. Pursuant to the terms of the EPC agreement, NECP agreed to pay NRG Business Services LLC $79 million, subject to adjustment based upon certain conditions in the EPC agreement, upon substantial completion of the project. The project is expected to reach COD in the first quarter of 2018. On January 5, 2017, the parties amended the EPC Agreement, based on a customer change order, to increase the capacity of the district energy system from 73 MWt to 80 MWt, which also increased the payment from $79 million to $87 million.
112
Note 1516 — Commitments and Contingencies
Operating Lease Commitments
The Company leases certain facilities and equipment under operating leases, some of which include escalation clauses, expiring on various dates through 2048. The effects of these scheduled rent increases, leasehold incentives, and rent concessions are recognized on a straight-line basis over the lease term unless another systematic and rational allocation basis is more representative of the time pattern in which the leased property is physically employed. Lease expense under operating leases was $9$15 million, $8$10 million, and $2$9 million for the years ended December 31, 2016, 2015 and 2014, and 2013, respectively.
Future minimum lease commitments under operating leases for the years ending after December 31, 2015,2016, are as follows:
| | | Period | (In millions) | (In millions) |
| 2016 | $ | 12 |
| |
| 2017 | 9 |
| $ | 9 |
|
| 2018 | 9 |
| 9 |
|
| 2019 | 9 |
| 10 |
|
| 2020 | 8 |
| 9 |
|
| 2021 | | 9 |
|
| Thereafter | 135 |
| 152 |
|
| Total | $ | 182 |
| $ | 198 |
|
Gas and Transportation Commitments
The Company has entered into contractual arrangements to procure power, fuel and associated transportation services. For the years ended December 31, 2016, 2015 2014 and 2013,2014, the Company purchased $32 million, $40 million $55 million, and $40$55 million, respectively, under such arrangements. As further described in Note 1415, Related Party Transactions, these balances include intercompany salespurchases in the amount of $8 million, $13 million, $12 million and $7$12 million, respectively.
As of December 31, 2015,2016, the Company's commitments under such outstanding agreements are estimated as follows:
| | | Period | (In millions) | (In millions) |
| 2016 | $ | 12 |
| |
| 2017 | 6 |
| $ | 13 |
|
| 2018 | 3 |
| 5 |
|
| 2019 | 3 |
| 2 |
|
| 2020 | 3 |
| 3 |
|
| 2021 | | 3 |
|
| Thereafter | 21 |
| 19 |
|
| Total | $ | 48 |
| $ | 45 |
|
Contingencies
The Company's material legal proceedings are described below. The Company believes that it has valid defenses to these legal proceedings and intends to defend them vigorously. The Company records reserves for estimated losses from contingencies when information available indicates that a loss is probable and the amount of the loss, or range of loss, can be reasonably estimated. In addition, legal costs are expensed as incurred. Management assesses such matters based on current information and makes a judgment concerning its potential outcome, considering the normal coursenature of business, the claim, the amount and nature of damages sought and the probability of success. The Company is unable to predict the outcome of the legal proceedings below or reasonably estimate the scope or amount of any associated costs and potential liabilities. As additional information becomes available, management adjusts its assessment and estimates of such contingencies accordingly. Because litigation is subject to various claimsinherent uncertainties and litigations. Management expectsunfavorable rulings or developments, it is possible that the ultimate resolution of the Company's liabilities and contingencies could be at amounts that are different from its currently recorded reserves and that such difference could be material.
In addition to the legal proceedings noted below, the Company and its subsidiaries are party to other litigation or legal proceedings arising in the ordinary course of business. In management's opinion, the disposition of these various litigation itemsordinary course matters will not have a material adverse effect onmaterially adversely affect the Company's consolidated financial position, results of operations, or financial position.cash flows.
113Braun v. NRG Yield, Inc. — On April 19, 2016, plaintiffs filed a putative class action lawsuit against NRG Yield, Inc., the current and former members of its board of directors individually, and other parties in California Superior Court in Kern County, CA. Plaintiffs allege various violations of the Securities Act due to the defendants’ alleged failure to disclose material facts related to low wind production prior to NRG Yield, Inc.'s June 22, 2015 Class C common stock offering. Plaintiffs seek compensatory damages, rescission, attorney’s fees and costs. On August 3, 2016, the court approved a stipulation entered into by the parties. The stipulation provided that the plaintiffs would file an amended complaint by August 19, 2016, which they did on August 18, 2016. The defendants filed demurrers and a motion challenging jurisdiction on October 18, 2016. On February 24, 2017, the court approved the parties' stipulation which provides the plaintiffs' opposition is due on June 15, 2017 and defendants' reply is due on August 14, 2017.
Ahmed v. NRG Energy, Inc. and the NRG Yield Board of Directors — On September 15, 2016, plaintiffs filed a putative class action lawsuit against NRG Energy, Inc., the directors of NRG Yield, Inc., and other parties in the Delaware Chancery Court. The complaint alleges that the defendants breached their respective fiduciary duties with regard to the recapitalization of NRG Yield, Inc. common stock in 2015. The plaintiffs generally seek economic damages, attorney’s fees and injunctive relief. The defendants filed a motion to dismiss the lawsuit on December 21, 2016. Plaintiffs filed their objection to the motion to dismiss on February 15, 2017. Oral argument is scheduled for June 20, 2017.
Note 1617 — Unaudited Quarterly Data
Refer to Note 2, Summary of Significant Accounting Policies, and Note 3, Business Acquisitions, for a description of the effect of unusual or infrequently occurring events during the quarterly periods. Summarized unaudited quarterly financial data is as follows:
|
| | | | | | | | | | | | | | | |
| | Quarter Ended |
| | December 31, | | September 30, (a) | | June 30, (a) | | March 31, (a) |
| | 2015 |
| | (In millions, except per share data) |
| Operating Revenues | $ | 209 |
| | $ | 225 |
| | $ | 235 |
| | $ | 200 |
|
| (As previously reported) | | | | | | | |
| Operating Revenues | N/A |
| | 209 |
| | 217 |
| | 180 |
|
| Change | N/A |
| | 16 |
| | 18 |
| | 20 |
|
| | | | | | | | |
| Operating Income | 66 |
| | 80 |
| | 85 |
| | 46 |
|
| (As previously reported) | | | | | | | |
| Operating Income | N/A |
| | 86 |
| | 87 |
| | 48 |
|
| Change | N/A |
| | (6 | ) | | (2 | ) | | (2 | ) |
| | | | | | | | |
| Net Income (Loss) | 13 |
| | 24 |
| | 38 |
| | (20 | ) |
| (As previously reported) | | | | | | | |
| Net Income (Loss) | N/A |
| | 34 |
| | 41 |
| | (16 | ) |
| Change | N/A |
| | (10 | ) | | (3 | ) | | (4 | ) |
| Net Income (Loss) Attributable to NRG Yield, Inc. | $ | 11 |
| | $ | 17 |
| | $ | 10 |
| | $ | (5 | ) |
| Weighted average number of Class A common shares outstanding - basic and diluted | 35 |
| | 35 |
| | 35 |
| | 35 |
|
Weighted average number of Class C common shares outstanding - basic and diluted (b) | 63 |
| | 63 |
| | 35 |
| | 35 |
|
Earnings (Losses) per Weighted Average Class A and Class C Common Share - Basic and Diluted | $ | 0.12 |
| | $ | 0.18 |
| | $ | 0.15 |
| | $ | (0.07 | ) |
|
| | | | | | | | | | | | | | | |
| | Quarter Ended |
| | December 31, | | September 30, | | June 30, | | March 31, |
| | 2016 |
| | (In millions, except per share data) |
| Operating Revenues | $ | 232 |
| | $ | 272 |
| | $ | 283 |
| | $ | 234 |
|
| Operating (Loss) Income | (99 | ) | | 117 |
| | 128 |
| | 72 |
|
| Net (Loss) Income | (126 | ) | | 47 |
| | 63 |
| | 1 |
|
| | | | | | | | |
| Net (Loss) Income Attributable to NRG Yield, Inc. | $ | (13 | ) | | $ | 33 |
| | $ | 32 |
| | $ | 5 |
|
| Weighted average number of Class A common shares outstanding — basic | 35 |
| | 35 |
| | 35 |
| | 35 |
|
| Weighted average number of Class A common shares outstanding — diluted | 35 |
| | 49 |
| | 49 |
| | 35 |
|
| Weighted average number of Class C common shares outstanding — basic | 63 |
| | 63 |
| | 63 |
| | 63 |
|
| Weighted average number of Class C common shares outstanding — diluted | 63 |
| | 73 |
| | 73 |
| | 63 |
|
| (Loss) Earnings per Weighted Average Class A and Class C Common Share - Basic | (0.14 | ) | | 0.34 |
| | 0.33 |
| | 0.05 |
|
| (Loss) Earnings per Weighted Average Class A Common Share - Diluted | (0.14 | ) | | 0.30 |
| | 0.29 |
| | 0.05 |
|
| (Loss) Earnings per Weighted Average Class C Common Share - Diluted | $ | (0.14 | ) | | $ | 0.32 |
| | $ | 0.31 |
| | $ | 0.05 |
|
(a) The Company's unaudited quarterly financial data was recast for the effect of the November 2015 Drop Down Assets. |
| | | | | | | | | | | | | | | |
| | Quarter Ended |
| | December 31, | | September 30, | | June 30, | | March 31, |
| | 2015 |
| | (In millions, except per share data) |
| Operating Revenues | $ | 224 |
| | $ | 256 |
| | $ | 259 |
| | $ | 214 |
|
| Operating Income | 70 |
| | 101 |
| | 99 |
| | 50 |
|
| Net Income (Loss) | 12 |
| | 32 |
| | 42 |
| | (21 | ) |
| | | | | | | | |
| Net Income (Loss) Attributable to NRG Yield, Inc. | 11 |
| | 17 |
| | 10 |
| | (5 | ) |
| Weighted average number of Class A common shares outstanding - basic and diluted | 35 |
| | 35 |
| | 35 |
| | 35 |
|
| Weighted average number of Class C common shares outstanding - basic and diluted | 63 |
| | 63 |
| | 35 |
| | 35 |
|
| Earnings (Loss) per Weighted Average Class A and Class C Common Share - Basic and Diluted | $ | 0.12 |
| | $ | 0.18 |
| | $ | 0.15 |
| | $ | (0.07 | ) |
|
| | | | | | | | | | | | | | | |
| | Quarter Ended |
| | December 31, (a) | | September 30, (a) | | June 30, (a) | | March 31, (a) |
| | 2014 |
| | (In millions, except per share data) |
| Operating Revenues | $ | 212 |
| | $ | 199 |
| | $ | 194 |
| | $ | 141 |
|
| (As previously reported) | | | | | | | |
| Operating Revenues | 192 |
| | 184 |
| | 173 |
| | 140 |
|
| Change | 20 |
| | 15 |
| | 21 |
| | 1 |
|
| | | | | | | | |
| | | | | | | | |
| Operating Income | 71 |
| | 84 |
| | 60 |
| | 51 |
|
| (As previously reported) | | | | | | | |
| Operating Income | 70 |
| | 84 |
| | 64 |
| | 54 |
|
| Change | 1 |
| | — |
| | (4 | ) | | (3 | ) |
| | | | | | | | |
| | | | | | | | |
| Net Income | 4 |
| | 37 |
| | 35 |
| | 23 |
|
| (As previously reported) | | | | | | | |
| Net Income | 5 |
| | 40 |
| | 41 |
| | 26 |
|
| (Change) | (1 | ) | | (3 | ) | | (6 | ) | | (3 | ) |
| | | | | | | | |
| Net Income Attributable to NRG Yield, Inc. | — |
| | 6 |
| | 6 |
| | 4 |
|
| Weighted average number of Class A and C common shares outstanding - basic and diluted | 35 |
| | 31 |
| | 23 |
| | 23 |
|
| Earnings per Weighted Average Class A and Class C Common Share - Basic and Diluted | $ | 0.01 |
| | $ | 0.10 |
| | $ | 0.13 |
| | $ | 0.09 |
|
(a) The Company's unaudited quarterly financial data was recast for the effect of the November 2015 Drop Down Assets.
Schedule I
NRG Yield, Inc. (Parent)
Condensed Financial Information of Registrant
Condensed Statements of Income
|
| | | | | | | | | | | |
| | Year ended December 31, |
| (In millions) | 2015 | | 2014 (a) | | 2013 (a) |
| | | | | | |
| Total operating expense | $ | 2 |
| | $ | — |
| | $ | — |
|
| Equity earnings in consolidated subsidiaries | 78 |
| | 108 |
| | 77 |
|
| Interest expense | (9 | ) | | (5 | ) | | — |
|
| Total other income, net | 69 |
| | 103 |
| | 77 |
|
| Income Before Income Taxes | 67 |
| | 103 |
| | 77 |
|
| Income tax expense | 12 |
| | 4 |
| | 8 |
|
| Net Income | 55 |
| | 99 |
| | 69 |
|
| Less: Net income attributable to noncontrolling interests | 42 |
| | 48 |
| | 42 |
|
| Less: Pre-acquisition net (loss) income of Drop Down Assets | (20 | ) | | 35 |
| | 14 |
|
| Net Income Attributable to NRG Yield, Inc. | $ | 33 |
| | $ | 16 |
| | $ | 13 |
|
|
| | | | | | | | | | | |
| | Year ended December 31, |
| (In millions) | 2016 | | 2015 | | 2014 |
| | | | | | |
| Total operating expense | $ | 2 |
| | $ | 2 |
| | $ | — |
|
| Equity (loss) earnings in consolidated subsidiaries | (2 | ) | | 88 |
| | 117 |
|
| Interest expense | (12 | ) | | (9 | ) | | (5 | ) |
| Total other (loss) income, net | (14 | ) | | 79 |
| | 112 |
|
| (Loss) Income Before Income Taxes | (16 | ) | | 77 |
| | 112 |
|
| Income tax (benefit) expense | (1 | ) | | 12 |
| | 4 |
|
| Net (Loss) Income | (15 | ) | | 65 |
| | 108 |
|
| Less: Net (loss) income attributable to noncontrolling interests | (82 | ) | | 42 |
| | 48 |
|
| Less: Pre-acquisition net (loss) income of Drop Down Assets | 10 |
| | (10 | ) | | 44 |
|
| Net Income Attributable to NRG Yield, Inc. | $ | 57 |
| | $ | 33 |
| | $ | 16 |
|
(a) Retrospectively adjusted as discussed in Item 15 — Note 1, Nature of Business of the Company's Consolidated Financial Statements.
See accompanying notes to condensed financial statements.
Schedule I
NRG Yield, Inc. (Parent)
Condensed Balance Sheets
|
| | | | | | | |
| | Year ended December 31, |
| | 2015 | | 2014 (a) |
| | (In millions) |
| Assets | | | |
| Current Assets: | | | |
| Cash and cash equivalents | $ | 1 |
| | $ | — |
|
| Noncurrent Assets: | | | |
| Investment in consolidated subsidiaries | 2,434 |
| | 2,475 |
|
| Note receivable - Yield Operating | 618 |
| | 337 |
|
| Deferred income taxes | 170 |
| | 134 |
|
| Total Assets | 3,223 |
| | 2,946 |
|
| | | | |
| Liabilities and Equity | | | |
| | | | |
| Accounts payable — affiliate | 4 |
| | — |
|
| Other current liabilities | 1 |
| | — |
|
| Long-term debt | 586 |
| | 321 |
|
| Total Liabilities | 591 |
| | 321 |
|
| | | | |
| Stockholders' Equity: | | | |
| Preferred stock, $0.01 par value; 10,000,000 shares authorized; none issued | — |
| | — |
|
| Class A, Class B, Class C and Class D common stock, $0.01 par value; 3,000,000,000 shares authorized (Class A 500,000,000, Class B 500,000,000, Class C 1,000,000,000, Class D 1,000,000,000); 182,848,000 shares issued and outstanding (Class A 34,586,250, Class B 42,738,750, Class C 62,784,250, Class D 42,738,750) at December 31, 2015 and 154,650,000 shares issued and outstanding (Class A 34,586,250, Class B 42,738,750, Class C 34,586,250, Class D 42,738,750) at December 31, 2014 | 1 |
| | — |
|
| Additional paid-in capital | 1,855 |
| | 1,240 |
|
| Retained earnings | 12 |
| | 3 |
|
| Accumulated other comprehensive loss | (27 | ) | | (9 | ) |
| Noncontrolling interest | 791 |
| | 1,391 |
|
| Total Stockholders' Equity | 2,632 |
| | 2,625 |
|
| Total Liabilities and Stockholders' Equity | $ | 3,223 |
| | $ | 2,946 |
|
(a) Retrospectively adjusted as discussed in Item 15 — Note 1, Nature of Business of the Company's Consolidated Financial Statements. |
| | | | | | | |
| | Year ended December 31, |
| | 2016 | | 2015 |
| | (In millions) |
| Assets | | | |
| Current Assets: | | | |
| Cash and cash equivalents | $ | 1 |
| | $ | 1 |
|
| Noncurrent Assets: | | | |
| Investment in consolidated subsidiaries | 2,135 |
| | 2,540 |
|
| Note receivable - Yield Operating | 618 |
| | 618 |
|
| Deferred income taxes | 216 |
| | 170 |
|
| Total Assets | 2,970 |
| | 3,329 |
|
| | | | |
| Liabilities and Equity | | | |
| Accounts payable — affiliate | — |
| | 4 |
|
| Other current liabilities | 2 |
| | 1 |
|
| Long-term debt | 598 |
| | 586 |
|
| Total Liabilities | 600 |
| | 591 |
|
| | | | |
| Stockholders' Equity: | | | |
| Preferred stock, $0.01 par value; 10,000,000 shares authorized; none issued | — |
| | — |
|
| Class A, Class B, Class C and Class D common stock, $0.01 par value; 3,000,000,000 shares authorized (Class A 500,000,000, Class B 500,000,000, Class C 1,000,000,000, Class D 1,000,000,000); 182,848,000 shares issued and outstanding (Class A 34,586,250, Class B 42,738,750, Class C 62,784,250, Class D 42,738,750) at December 31, 2016 and 2015 | 1 |
| | 1 |
|
| Additional paid-in capital | 1,879 |
| | 1,855 |
|
| Retained earnings | (2 | ) | | 12 |
|
| Accumulated other comprehensive loss | (28 | ) | | (27 | ) |
| Noncontrolling interest | 520 |
| | 897 |
|
| Total Stockholders' Equity | 2,370 |
| | 2,738 |
|
| Total Liabilities and Stockholders' Equity | $ | 2,970 |
| | $ | 3,329 |
|
See accompanying notes to condensed financial statements.
Schedule I
NRG Yield, Inc. (Parent)
Condensed Statements of Cash Flows
|
| | | | | | | | | | | |
| | Years ended December 31, |
| | 2015 | | 2014 (a) | | 2013 (a) |
| | (In millions) |
| Net Cash Provided by (Used in) Operating Activities | $ | 2 |
| | $ | (1 | ) | | $ | 5 |
|
| Cash Flows from Investing Activities | | | | | |
| Investments in consolidated affiliates | (600 | ) | | (630 | ) | | (468 | ) |
| Increase in notes receivable - affiliate | (281 | ) | | (337 | ) | | — |
|
| Net Cash Used in Investing Activities | (881 | ) |
| (967 | ) | | (468 | ) |
| Cash Flows from Financing Activities | | | | | |
| Proceeds from issuance of debt | 288 |
| | 345 |
| | — |
|
| Proceeds from the issuance of common stock | 599 |
| | 630 |
| | 468 |
|
| Payment of debt issuance costs | (7 | ) | | (7 | ) | | — |
|
| Cash received from Yield LLC for the payment of dividends | 69 |
| | 41 |
| | — |
|
| Payment of dividends | (69 | ) | | (41 | ) | | (5 | ) |
| Net Cash Provided by Financing Activities | 880 |
| | 968 |
| | 463 |
|
| Net Increase in Cash and Cash Equivalents | 1 |
| | — |
| | — |
|
| Cash and Cash Equivalents at Beginning of Period | — |
| | — |
| | — |
|
| Cash and Cash Equivalents at End of Period | $ | 1 |
| | $ | — |
| | $ | — |
|
(a) Retrospectively adjusted as discussed in Note 1, Nature of Business of the Company's Consolidated Financial Statements.
|
| | | | | | | | | | | |
| | Years ended December 31, |
| | 2016 | | 2015 | | 2014 |
| | (In millions) |
| Net Cash (Used in) Provided by Operating Activities | $ | (5 | ) | | $ | 2 |
| | $ | (1 | ) |
| Cash Flows from Investing Activities | | | | | |
| Investments in consolidated affiliates | 5 |
| | (600 | ) | | (630 | ) |
| Increase in notes receivable - affiliate | — |
| | (281 | ) | | (337 | ) |
| Net Cash Provided by (Used in) Investing Activities | 5 |
|
| (881 | ) | | (967 | ) |
| Cash Flows from Financing Activities | | | | | |
| Proceeds from issuance of debt | — |
| | 288 |
| | 345 |
|
| Proceeds from the issuance of common stock | — |
| | 599 |
| | 630 |
|
| Payment of debt issuance costs | — |
| | (7 | ) | | (7 | ) |
| Cash received from Yield LLC for the payment of dividends | 92 |
| | 69 |
| | 41 |
|
| Payment of dividends | (92 | ) | | (69 | ) | | (41 | ) |
| Net Cash Provided by Financing Activities | — |
| | 880 |
| | 968 |
|
| Net (Decrease) Increase in Cash and Cash Equivalents | — |
| | 1 |
| | — |
|
| Cash and Cash Equivalents at Beginning of Period | 1 |
| | — |
| | — |
|
| Cash and Cash Equivalents at End of Period | $ | 1 |
| | $ | 1 |
| | $ | — |
|
See accompanying notes to condensed financial statements.
Schedule I
NRG Yield, Inc. (Parent)
Notes to Condensed Financial Statements
Note 1 — Background and Basis of Presentation
Background
NRG Yield, Inc., is a dividend growth-oriented companyThe Company was formed by NRG as a Delaware corporation on December 20, 2012. The Company used the net proceeds from2012 and closed its initial public offering of Class A common stock on July 22, 2013, to acquire 19,011,250 Class A units of NRG Yield LLC from NRG, as well as 3,500,000 Class A units directly from NRG Yield LLC. At2013. In connection with its initial public offering, the time of the offering, NRG owned 42,738,750 NRG Yield LLC Class B units. NRG Yield LLC, through its wholly owned subsidiary, NRG Yield Operating LLC, is a holder of a portfolio of renewable and conventional generation and thermal infrastructure assets, primarily located in the Northeast, Southwest and California regions of the U.S.
On July 29, 2014, the Company issued 12,075,000Company's shares of Class A common stock for net proceeds, after underwriting discount and expenses, of $630 million. The Company utilizedbegan trading on the proceeds ofNew York Stock Exchange under the offering to acquire 12,075,000 additional Class A units of NRG Yield LLC. Onsymbol “NYLD.”
Effective May 14, 2015, the Company completed a stock split in connection with which each outstanding share of Class A common stock was split into one share of Class A common stock and one share of Class C common stock, and each outstanding share of Class B common stock was split into one share of Class B common stock and one share of Class D common stock. The stock split is referred to as the Recapitalization and all references to share or per share amounts in the accompanying consolidated financial statements and applicable disclosures have been retrospectively adjusted to reflect the Recapitalization. In addition,Following the Recapitalization, the Company's Class A common stock continued trading on June 29, 2015, the Company completedNew York Stock Exchange under the issuance of 28,198,000 shares ofnew ticker symbol "NYLD.A" and the Class C common stock for net proceedsbegan trading under the ticker symbol "NYLD".
NRG, through its holdings of $599 million. See further discussionClass B common stock and Class D common stock, has a 55.1% voting interest in Note 11, Stockholders' Equity to the Company's consolidated financial statements. As a result and as of December 31, 2015, the Company has a 53.3% economic interest inand receives distributions from NRG Yield LLC.
LLC through its ownership of Class B units and Class D units. The holders of the Company's issued and outstanding shares of Class A common stock and Class C common stock are entitled to dividends as declared and have 100%44.9% of economic interestthe voting power in the Company.
The Company is the sole managing member of NRG Yield LLC and operates and controls all of its business and affairs and consolidates the financial results of NRG Yield LLC and its subsidiaries. NRG Yield LLC is a holding company for the companies that directly and indirectly own and operate the Company's business. As of December 31, 2016, the Company and are entitled to dividends. NRG receives its distributions fromhave 53.3% and 46.7% economic interests in NRG Yield LLC, through itsrespectively. As a result of the current ownership of the Class B common stock and Class D common units.stock, NRG continues at the present time to control the Company, and the Company in turn, as the sole managing member of NRG Yield LLC, controls NRG Yield LLC and its subsidiaries.
Basis of Presentation
The condensed parent-only company financial statements have been prepared in accordance with Rule 12-04 of Regulation S-X, as the restricted net assets of NRG Yield, Inc.’s subsidiaries exceed 25% of the consolidated net assets of NRG Yield, Inc. The parent's 100% investment in its subsidiaries has been recorded using the equity basis of accounting in the accompanying condensed parent-only financial statements. These statements should be read in conjunction with the consolidated financial statements and notes thereto of NRG Yield, Inc. As described in Note 1, Nature of Business, to the Company's consolidated financial statements, the Company's historical financial statements previously filed with the SEC have been recast to include the results attributable to the November 2015 Drop Down Assets from the date these entities were under common control, the majority of which were acquired on April 1, 2014.
Note 2 — Long-Term Debt
For a discussion of NRG Yield Inc.’s financing arrangements, see Note 9,10, Long-term Debt, to the Company's consolidated financial statements.
Note 3 — Commitments, Contingencies and Guarantees
See Note 13,14, Income Taxes, and Note 15,16, Commitments and Contingencies, to the Company's consolidated financial statements for a detailed discussion of NRG Yield, Inc.’s commitments and contingencies.
Note 4 — Dividends
Cash distributions paid to NRG Yield, Inc. by its subsidiary, NRG Yield LLC, were $92 million, $69 million, $41 million and $5$41 million for the years ended December 31, 2016, 2015, and 2014, and 2013, respectively.
SCHEDULE II. VALUATION AND QUALIFYING ACCOUNTS
For the Year Ended December 31, 2016
|
| | | | | | | | | | | | | | | |
| | Balance at Beginning of Period | | Charged to Costs and Expenses | | Charged to Other Accounts | | Balance at End of Period |
| | (In millions) |
| Income tax valuation allowance, deducted from deferred tax assets | | | | | | | |
| Year Ended December 31, 2016 | $ | — |
| | $ | — |
| | $ | 16 |
| | $ | 16 |
|
EXHIBIT INDEX
|
| | | | |
| Number | | Description | | Method of Filing |
| 2.1 | | Purchase and Sale Agreement, dated as of May 5, 2014, by and between NRG Gas Development Company, LLC and NRG Yield Operating LLC. | | Incorporated herein by reference to Exhibit 2.1 to the Company’s Current Report on Form 8-K filed on May 9, 2014. |
| 2.2 | | Purchase and Sale Agreement, dated as of May 5, 2014, by and between NRG Solar PV LLC and NRG Yield Operating LLC. | | Incorporated herein by reference to Exhibit 2.2 to the Company’s Current Report on Form 8-K filed on May 9, 2014. |
| 2.3 | | Purchase and Sale Agreement, dated as of May 5, 2014, by and between NRG Solar PV LLC and NRG Yield Operating LLC. | | Incorporated herein by reference to Exhibit 2.3 to the Company’s Current Report on Form 8-K filed on May 9, 2014. |
| 2.4 | | Purchase and Sale Agreement, dated June 3, 2014, by and among NRG Yield, Inc., NRG Yield Operating LLC, Terra-Gen Finance Company, LLC, NTD AWAM Holdings, LLC, CHIPS Alta Wind X Holding Company, LLC and CHIPS Alta Wind XI Holding Company, LLC. | | Incorporated herein by reference to Exhibit 10.1 to the Company’s Current Report on Form 8-K filed on June 9, 2014. |
| 2.5 | | Purchase and Sale Agreement, dated as of November 4, 2014, by and between NRG Wind LLC and NRG Yield Operating LLC. | | Incorporated herein by reference to Exhibit 2.1 to the Company's Current Report on Form 8-K filed on November 7, 2014. |
| 2.6 | | Purchase and Sale Agreement, dated as of November 4, 2014, by and between NRG Arroyo Nogales LLC and NRG Yield Operating LLC. | | Incorporated herein by reference to Exhibit 2.2 to the Company's Current Report on Form 8-K filed on November 7, 2014. |
| 2.7*^ | | Purchase and Sale Agreement, dated as of June 17, 2015, by and between EFS Desert Sun, LLC and NRG Yield Operating LLC. | | Incorporated herein by reference to Exhibit 2.1 to the Company's Quarterly Report on Form 10-Q filed on August 4, 2015. |
| 2.8 | | Purchase and Sale Agreement, dated as of September 17, 2015, by and between NRG Energy Gas & Wind Holdings, Inc. and NRG Yield Operating LLC.
| | Incorporated herein by reference to Exhibit 2.1 to the Company's Current Report on Form 8-K filed on September 21, 2015.
|
| 2.9 | | Purchase and Sale Agreement, dated as of August 8, 2016, between NRG Solar CVSR Holdings 2 LLC and NRG Yield Operating LLC.
| | Incorporated herein by reference to Exhibit 2.1 to the Registrant's Current Report on Form 8-K, filed on August 9, 2016. |
| 3.1 | | Second Amended and Restated Certificate of Incorporation of NRG Yield, Inc., dated as of May 14, 2015.2, 2016. | | Incorporated herein by reference to Exhibit 3.1 to the Company's CurrentQuarterly Report on Form 8-K10-Q filed on May 15, 2015.5, 2016. |
| 3.2 | | Certificate of Correction to Second Amended and Restated Certificate of Incorporation of NRG Yield, Inc., dated as of June 9, 2015. | | Incorporated by reference to Exhibit 3.1 to the Company's Current Report on Form 8-K filed on June 9, 2015. |
3.3 | | Certificate of Correction to Second Amended and Restated Certificate of Incorporation of NRG Yield, Inc., dated as of February 23, 2016. | | Filed herewith. |
3.4 | | Third Amended and Restated Bylaws of NRG Yield, Inc., dated as of February 23, 2016. | | Filed herewith.Incorporated herein by reference to Exhibit 3.4 to the Company's Annual Report on Form 10-K filed on February 29, 2016. |
| 4.1 | | Third Amended and Restated Limited Liability Company Agreement of NRG Yield LLC, dated as of May 14, 2015. | | Incorporated herein by reference to Exhibit 10.4 to the Company's Current Report on Form 8-K filed on May 15, 2015. |
| 4.2 | | Indenture, dated February 11, 2014, among NRG Yield, Inc., NRG Yield Operating LLC and NRG Yield LLC, as Guarantors, and Wilmington Trust, National Association, as trustee, re: the Company’s 3.50% Convertible Senior Notes due 2019. | | Incorporated herein by reference to Exhibit 4.1 to the Company’s Current Report on Form 8-K filed on February 11, 2014. |
| 4.3 | | Form of 3.50% Convertible Senior Note due 2019. | | Incorporated herein by reference to Exhibit 4.2 to the Company’s Current Report on Form 8-K filed on February 11, 2014. |
| 4.4 | | Indenture, dated August 5, 2014, among NRG Yield Operating LLC, the guarantors named therein and Law Debenture Trust Company of New York, as trustee. | | Incorporated herein by reference to Exhibit 4.1 to the Company's Current Report on Form 8-K filed on August 5, 2014. |
| 4.5 | | Form of 5.375% Senior Note due 2024. | | Incorporated herein by reference to Exhibit 4.2 to the Company's Current Report on Form 8-K filed on August 5, 2014. |
|
| | | | |
| 4.6 | | Registration Rights Agreement, dated August 5, 2014, among NRG Yield Operating LLC, the guarantors named therein and Merrill Lynch, Pierce, Fenner & Smith Incorporated, as representative of the initial purchasers. | | Incorporated herein by reference to Exhibit 4.3 to the Company's Current Report on Form 8-K filed on August 5, 2014. |
| 4.7 | | Supplemental Indenture, dated as of November 7, 2014, among NRG Yield Operating LLC, the guarantors named therein and Law Debenture Trust Company of New York. | | Incorporated herein by reference to Exhibit 4.1 to the Company's Current Report on Form 8-K filed on November 13, 2014. |
| 4.8 | | Supplemental Indenture, dated as of February 25, 2015, among NRG Yield Operating LLC, the guarantors named therein and Law Debenture Trust Company of New York. | | Incorporated herein by reference to Exhibit 4.1 to the Company's Current Report on Form 8-K filed on February 27, 2015. |
| 4.9 | | Third Supplemental Indenture, dated as of April 10, 2015, among NRG Yield Operating LLC, NRG Yield LLC, the other guarantors named therein and Law Debenture Trust Company of New York. | | Incorporated herein by reference to Exhibit 4.1 to the Company's Current Report on Form 8-K filed on April 16, 2015. |
| 4.10 | | Fourth Supplemental Indenture, dated as of May 8, 2015, among NRG Yield Operating LLC, the guarantors named therein and Law Debenture Trust Company of New York. | | Incorporated herein by reference to Exhibit 4.1 to the Company's Current Report on Form 8-K filed on May 8, 2015. |
| 4.11 | | Indenture, dated June 29, 2015, among NRG Yield, Inc., NRG Yield Operating LLC and NRG Yield LLC, as Guarantors, and Wilmington Trust, National Association, as Trustee. | | Incorporated herein by reference to Exhibit 4.1 to the Company's Current Report on Form 8-K filed on June 29, 2015. |
| 4.12 | | Form of 3.25% Convertible Senior Note due 2020.
| | Incorporated herein by reference to Exhibit 4.2 to the Company's Current Report on Form 8-K filed on June 29, 2015. |
| 4.13 | | Specimen Class A Common Stock Certificate. | | Incorporated herein by reference to Exhibit 4.1 to the Company's Registration Statement on Form 8-A/A filed on May 8, 2015. |
| 4.14 | | Specimen Class C Common Stock Certificate. | | Incorporated herein by reference to Exhibit 4.2 to the Company's Registration Statement on Form 8-A/A filed on May 8, 2015. |
| 4.15 | | Indenture, dated August 18, 2016, among NRG Yield Operating LLC, the guarantors named therein and Law Debenture Trust Company of New York. | | Incorporated herein by reference to Exhibit 4.1 to the Registrant's Current Report on Form 8-K, filed on August 18, 2016. |
| 4.16 | | Form of 5.000% Senior Note due 2026.
| | Incorporated herein by reference to Exhibit 4.2 to the Registrant's Current Report on Form 8-K, filed on August 18, 2016. |
| 4.17 | | Registration Rights Agreement, dated August 18, 2016, among NRG Yield Operating LLC, the guarantors named therein and J.P. Morgan Securities LLC, as representative of the initial purchasers. | | Incorporated herein by reference to Exhibit 4.3 to the Registrant's Current Report on Form 8-K, filed on August 18, 2016. |
| 10.1 | | Amended and Restated Registration Rights Agreement, dated as of May 14, 2015, by and between NRG Energy, Inc. and NRG Yield, Inc. | | Incorporated herein by reference to Exhibit 10.2 to the Company's Current Report on Form 8-K filed on May 15, 2015. |
| 10.2 | | Amended and Restated Exchange Agreement, dated as of May 14, 2015, by and among NRG Energy, Inc., NRG Yield, Inc. and NRG Yield LLC. | | Incorporated herein by reference to Exhibit 10.1 to the Company's Current Report on Form 8-K filed on May 15, 2015. |
| 10.3 | | Second Amended and Restated Right of First Offer Agreement, dated as of March 12, 2015,February 24, 2017, by and between NRG Energy, Inc. and NRG Yield, Inc. | | Incorporated herein by reference to Exhibit 10.1 to the Company's Current Report on Form 8-K filed on March 12, 2015.Filed herewith. |
| 10.4 | | Management Services Agreement, dated as of July 22, 2013, by and between NRG Energy, Inc., NRG Yield, Inc., NRG Yield LLC and NRG Yield Operating LLC. | | Incorporated herein by reference to Exhibit 10.4 to the Company's Current Report on Form 8-K filed on July 26, 2013. |
| 10.5 | | Trademark License Agreement, dated as of July 22, 2013, by and between NRG Energy, Inc. and NRG Yield, Inc. | | Incorporated herein by reference to Exhibit 10.5 to the Company's Current Report on Form 8-K filed on July 26, 2013. |
| 10.6 | | Loan Guarantee Agreement, dated as of September 30, 2011, by and among High Plains Ranch II, LLC, as borrower, the U.S. Department of Energy, as guarantor, and the U.S. Department of Energy, as loan servicer. | | Incorporated herein by reference to Exhibit 10.8 to the Company's Draft Registration Statement on Form S-1, filed on February 13, 2013. |
| 10.7 | | Operation and Maintenance Agreement, dated as of January 31, 2011, by and amongbetween Avenal Solar Holdings LLC and NRG Energy Services LLC. | | Incorporated herein by reference to Exhibit 10.11 to the Company's Draft Registration Statement on Form S-1filed on February 13, 2013. |
| 10.8 | | Asset Management Agreement, dated as of August 30, 2012, by and amongbetween NRG Solar Avra Valley LLC and NRG Solar Asset Management LLC. | | Incorporated herein by reference to Exhibit 10.12 to the Company's Draft Registration Statement on Form S-1 filed on February 13, 2013. |
|
| | | | |
| 10.9 | | Operation and Maintenance Agreement, dated as of August 1, 2012, by and amongbetween NRG Energy Services LLC and NRG Solar Borrego I LLC. | | Incorporated herein by reference to Exhibit 10.13 to the Company's Draft Registration Statement on Form S-1 filed on February 13, 2013. |
| 10.10 | | Asset Management Agreement, dated as of March 15, 2012, by and amongbetween NRG Solar Alpine LLC and NRG Solar Asset Management LLC. | | Incorporated herein by reference to Exhibit 10.14 to the Company's Draft Registration Statement on Form S-1 filed on February 13, 2013. |
| 10.11 | | Operation and Maintenance Agreement, dated as of September 30, 2011, by and amongbetween NRG Energy Services LLC and High Plains Ranch II, LLC. | | Incorporated herein by reference to Exhibit 10.15 to the Company's Draft Registration Statement on Form S-1 filed on February 13, 2013. |
|
| | | | |
| 10.12 | | Project Administration Agreement, dated as of August 16, 2010, by and amongbetween South Trent Wind LLC and NRG Texas Power LLC. | | Incorporated herein by reference to Exhibit 10.16 to the Company's Draft Registration Statement on Form S-1 filed on February 13, 2013. |
| 10.13 | | Operation and Maintenance Agreement, dated as of April 24, 2009, by and amongbetween GenConn Devon LLC and Devon Power LLC. | | Incorporated herein by reference to Exhibit 10.15 to the Company's Registration Statement on Form S-1 filed on June 7, 2013. |
| 10.14 | | Operation and Maintenance Agreement, dated as of April 24, 2009, by and amongbetween GenConn Middletown LLC and Middletown Power LLC. | | Incorporated herein by reference to Exhibit 10.16 to the Company's Registration Statement on Form S-1 filed on June 7, 2013. |
| 10.15 | | Administrative Services Agreement, dated as of April 2, 2009, by and amongbetween GenOn Energy Services, LLC (formerly Mirant Services, LLC) and NRG Marsh Landing, LLC (formerly Mirant Marsh Landing, LLC. | | Incorporated herein by reference to Exhibit 10.17 to the Company's Registration Statement on Form S-1 filed on June 7, 2013. |
| 10.16† | | NRG Yield, Inc. Amended and Restated 2013 Equity Incentive Plan, dated as of May 14, 2015. | | Incorporated herein by reference to Exhibit 10.5 to the Company's Current Report on Form 8-K filed on May 15, 2015. |
| 10.17 | | Form of Indemnification Agreement. | | Incorporated herein by reference to Exhibit 10.20 to the Company's Registration Statement on Form S-1/A filed on June 21, 2013. |
| 10.18.1 | | Amended and Restated Credit Agreement, dated April 25, 2014, by and among NRG Yield Operating LLC, NRG Yield LLC, Royal Bank of Canada, as Administrative Agent, the lenders party thereto, Royal Bank of Canada, Goldman Sachs Bank USA and Bank of America, N.A., as L/C Issuers and RBC Capital Markets as Sole Left Lead Arranger and Sole Left Lead Book Runner. | | Incorporated by reference to Exhibit 10.1 to the Company’s Current Report on Form 8-K filed on April 28, 2014. |
| 10.18.2 | | First Amendment to Amended & Restated Credit Agreement, dated June 26, 2015, by and among NRG Yield Operating LLC, NRG Yield LLC, Royal Bank of Canada and the Lenders party thereto.
| | Incorporated herein by reference to Exhibit 10.9 to the Company's Quarterly Report on Form 10-Q filed on August 4, 2015.
|
| 10.19.1 | | Credit Agreement, dated as of August 23, 2011, among NRG West Holdings LLC, ING Capital LLC, Union Bank, N.A., Mizuho Corporate Bank, Ltd., RBS Securities Inc., Credit Agricole Corporate and Investment Bank, and each of lenders and issuing banks thereto.* | | Incorporated herein by reference to Exhibit 10.2 to the Company's Quarterly Report on Form 10-Q filed on August 7, 2014. |
| 10.19.2 | | Amendment No. 1 to the Credit Agreement, dated October 7, 2011, by and between NRG West Holdings LLC and Credit Agricole Corporate and Investment Bank. | | Incorporated herein by reference to Exhibit 10.3 to the Company's Quarterly Report on Form 10-Q filed on August 7, 2014. |
| 10.19.3 | | Amendment No. 2 to the Credit Agreement, dated February 29, 2012, by and between NRG West Holdings LLC and Credit Agricole Corporate and Investment Bank. | | Incorporated herein by reference to Exhibit 10.4 to the Company's Quarterly Report on Form 10-Q filed on August 7, 2014. |
| 10.19.4 | | Amendment No. 3 to the Credit Agreement, dated as of January 27, 2014, by and between NRG West Holdings LLC and Credit Agricole Corporate and Investment Bank. | | Incorporated herein by reference to Exhibit 10.6 to the Company's Quarterly Report on Form 10-Q filed on August 4, 2015. |
| 10.19.5 | | Amendment No. 4 to the Credit Agreement and Amendment No. 1 to the Collateral Agreement, dated as of May 16, 2014, by and between NRG West Holdings LLC, El Segundo Energy Center LLC and Credit Agricole Corporate and Investment Bank. | | Incorporated herein by reference to Exhibit 10.7 to the Company's Quarterly Report on Form 10-Q filed on August 4, 2015.
|
| 10.19.6 | | Amendment No. 5 to the Credit Agreement, dated as of May 29, 2015, by and between NRG West Holdings LLC and ING Capital LLC.
| | Incorporated herein by reference to Exhibit 10.8 to the Company's Quarterly Report on Form 10-Q filed on August 4, 2015.
|
| 10.20.1 | | Amended and Restated Credit Agreement, dated July 17, 2014, by and among NRG Marsh Landing LLC, The Royal Bank of Scotland Plc, Deutsche Bank Trust Company Americas and the lenders party thereto. | | Incorporated herein by reference to Exhibit 10.5 to the Company's Quarterly Report on Form 10-Q filed on August 7, 2014. |
|
| | | | |
| 10.20.2 | | First Amendment to the Credit Agreement and Collateral Agency and Intercreditor Agreement, dated July 17, 2014, by and among NRG Marsh Landing LLC, The Royal Bank of Scotland Plc, Deutsche Bank Trust Company Americas and the lenders party thereto. | | Incorporated herein by reference to Exhibit 10.6 to the Company's Quarterly Report on Form 10-Q filed on August 7, 2014. |
| 10.21^ | | Amended and Restated Limited Liability Company Agreement of NRG RPV Holdco 1 LLC, dated as of April 9, 2015.
| | Incorporated herein by reference to Exhibit 10.1 to the Company's Quarterly Report on Form 10-Q filed on August 4, 2015. |
| 10.22^ | | Amended and Restated Limited Liability Company Agreement of NRG DGPV Holdco 1 LLC, dated as of May 8, 2015.
| | Incorporated herein by reference to Exhibit 10.2 to the Company's Quarterly Report on Form 10-Q filed on August 4, 2015. |
| 10.23^ | | Amendment No. 1 to Amended and Restated Limited Liability Company Agreement of NRG RPV Holdco 1 LLC, dated as of March 1, 2016, by and between NRG Yield RPV Holding LLC and NRG Residential Solar Solutions LLC. | | Incorporated herein by reference to Exhibit 10.1 to the Company's Quarterly Report on Form 10-Q filed on May 5, 2016.
| | 10.24^ | | Amendment No. 2 to Amended and Restated Limited Liability Company Agreement of NRG DGPV Holdco 1 LLC, dated as of March 1, 2016, by and among NRG Yield DGPV Holding LLC, NRG Renew DG Holdings LLC and NRG Renew LLC. | | Incorporated herein by reference to Exhibit 10.2 to the Company's Quarterly Report on Form 10-Q filed on May 5, 2016. | | 10.25^ | | Amended and Restated Limited Liability Company Agreement of NRG DGPV Holdco 2 LLC, dated as of March 1, 2016, by and among NRG Yield DGPV Holding LLC, NRG Renew DG Holdings LLC, and NRG Renew LLC. | | Incorporated herein by reference to Exhibit 10.3 to the Company's Quarterly Report on Form 10-Q filed on May 5, 2016.
| | 10.26 | | Amendment No. 2 to Amended and Restated Limited Liability Company Agreement of NRG RPV Holdco 1 LLC, dated as of August 5, 2016, by and between NRG Yield RPV Holding LLC and NRG Residential Solar Solutions LLC. | | Incorporated herein by reference to Exhibit 10.1 to the Company's Quarterly Report on Form 10-Q filed on August 9, 2016.
| | 10.27† | | Employment Agreement, dated as of May 6, 2016, between NRG Yield, Inc. and Christopher S. Sotos. | | Incorporated herein by reference to Exhibit 10.1 to the Registrant's Current Report on Form 8-K/A, filed on August 9, 2016. | | 10.28† | | Form of NRG Yield, Inc. 2013 Equity Incentive Plan Restricted Stock Unit Agreement. | | Incorporated herein by reference to Exhibit 10.1 to the Registrant's Quarterly Report on Form 10-Q, filed on November 4, 2016. | | 10.29† | | NRG Yield, Inc. Annual Incentive Plan for Designated Corporate Officers. | | Filed herewith. | | 10.30† | | NRG Yield, Inc. Executive Change-in-Control and General Severance Plan. | | Filed herewith. | | 21.1 | | Subsidiaries of NRG Yield, Inc. | | Filed herewith. | | 23.1 | | Consent of KPMG LLP. | | Filed herewith. | | 31.1 | | Rule 13a-14(a)/15d-14(a) certification of Mauricio Gutierrez.Christopher S. Sotos. | | Filed herewith. | | 31.2 | | Rule 13a-14(a)/15d-14(a) certification of Kirkland B. Andrews.Chad Plotkin. | | Filed herewith. | | 31.3 | | Rule 13a-14(a)/15d-14(a) certification of David Callen. | | Filed herewith. | | 32 | | Section 1350 Certification. | | FiledFurnished herewith. | | 101 INS | | XBRL Instance Document. | | Filed herewith. | | 101 SCH | | XBRL Taxonomy Extension Schema. | | Filed herewith. | | 101 CAL | | XBRL Taxonomy Extension Calculation Linkbase. | | Filed herewith. | | 101 DEF | | XBRL Taxonomy Extension Definition Linkbase. | | Filed herewith. | | 101 LAB | | XBRL Taxonomy Extension Label Linkbase. | | Filed herewith. | | 101 PRE | | XBRL Taxonomy Extension Presentation Linkbase. | | Filed herewith. |
| | | | | † | | Indicates exhibits that constitute compensatory plans or arrangements. | | * | | This filing excludes schedules pursuant to Item 601(b)(2) of Regulation S-K, which the registrant agrees to furnish supplementary to the Securities and Exchange Commission upon request by the Commission. | | ^ | | Portions of this exhibit have been redacted and are subject to a confidential treatment request filed with the Secretary of the Securities and Exchange Commission pursuant to Rule 24b-2 under the Securities Exchange Act of 1934, as amended.
|
Item 16 — Form 10-K Summary None.
SIGNATURES Pursuant to the requirements of the Securities Exchange Act of 1934, the registrant has duly caused this report to be signed on its behalf by the undersigned thereunto duly authorized. | | | | | | | | NRG YIELD, INC. (Registrant) | | | | | | | | /s/ MAURICIO GUTIERREZCHRISTOPHER S. SOTOS | | | | Mauricio GutierrezChristopher S. Sotos | | | | Interim Chief Executive Officer
(Principal Executive Officer) | | | | Date: February 29, 201628, 2017 | | | | |
POWER OF ATTORNEY Each person whose signature appears below constitutes and appoints David R. Hill and Brian E. Curci, each or any of them, such person's true and lawful attorney-in-fact and agent with full power of substitution and resubstitution for such person and in such person's name, place and stead, in any and all capacities, to sign any and all amendments to this report on Form 10-K, and to file the same with all exhibits thereto, and other documents in connection therewith, with the Securities and Exchange Commission, granting unto said attorneys-in-fact and agents, and each of them, full power and authority to do and perform each and every act and thing necessary or desirable to be done in and about the premises, as fully to all intents and purposes as such person, hereby ratifying and confirming all that said attorneys-in-fact and agents, or any of them or his or their substitute or substitutes, may lawfully do or cause to be done by virtue hereof. In accordance with the Exchange Act, this report has been signed by the following persons on behalf of the registrant in the capacities indicated on February 29, 2016.28, 2017. | | | | | | | Signature | | Title | | Date | /s/ MAURICIO GUTIERREZ CHRISTOPHER S. SOTOS | | Interim President, and Chief Executive Officer and Director | | February 29, 201628, 2017 | Mauricio GutierrezChristopher S. Sotos | | (Principal Executive Officer) | | /s/ KIRKLAND B. ANDREWSCHAD PLOTKIN | | Chief Financial Officer and Director | | February 29, 201628, 2017 | Kirkland B. AndrewsChad Plotkin | | (Principal Financial Officer) | | | /s/ DAVID CALLEN | | Chief Accounting Officer | | February 29, 201628, 2017 | | David Callen | | (Principal Accounting Officer) | | /s/ JOHN CHLEBOWSKIMAURICIO GUTIERREZ | | Chairman of the Board | | February 29, 201628, 2017 | | Mauricio Gutierrez | | | | /s/ KIRKLAND B. ANDREWS | | Director | | February 28, 2017 | | Kirkland B. Andrews | | | | /s/ JOHN CHILLEMI | | Director | | February 28, 2017 | | John Chillemi | | | | /s/ JOHN CHLEBOWSKI | | Director | | February 28, 2017 | | John Chlebowski | | | | /s/ BRIAN FORD | | Director | | February 29, 201628, 2017 | | Brian Ford | | | | /s/ FERRELL MCCLEAN | | Director | | February 29, 201628, 2017 | | Ferrell McClean | | | /s/ CHRISTOPHER SOTOS | | Director | | February 29, 2016 | Christopher Sotos | | |
|