UNITED STATES SECURITIES AND EXCHANGE COMMISSION
Washington, D.C. 20549
Form 10-K
|
| | | | | | | | | | |
x☒ | | ANNUAL REPORT PURSUANT TO SECTION 13 OR 15(d) OF THE SECURITIES EXCHANGE ACT OF 1934 |
| | For the Fiscal Year ended | December 31, 2017.2020 |
| ☐ | | |
o | | TRANSITION REPORT PURSUANT TO SECTION 13 OR 15(d) OF THE SECURITIES EXCHANGE ACT OF 1934 For the Transition period from to . |
Commission File Number: 001-36002
NRG Yield,Clearway Energy, Inc.
(Exact name of registrant as specified in its charter)
| | | | | | | | | | | |
| Delaware | | 46-1777204 |
(State or other jurisdiction
of incorporation or organization) | | (I.R.S. Employer
Identification No.) |
| | |
Delaware
(State or other jurisdiction of incorporation or organization)
| | 46-1777204
(I.R.S. Employer Identification No.)
|
| 300 Carnegie Center, Suite 300 | Princeton | New Jersey | 08540 |
804 Carnegie Center, Princeton, New Jersey
(Address of principal executive offices) | | 08540
(Zip Code) |
(609) 524-4500608-1525
(Registrant’s telephone number, including area code)
Securities registered pursuant to Section 12(b) of the Act:
|
| | | | | | | |
Title of Each Classeach class | Trading Symbol(s) | Name of Exchangeeach exchange on Which Registeredwhich registered |
Class A Common Stock, Class A, par value $0.01 | CWEN.A | New York Stock Exchange |
Class C Common Stock, Class C, par value $0.01 | CWEN | New York Stock Exchange |
Securities registered pursuant to Section 12(g) of the Act:
None
Indicate by check mark if the registrant is a well-known seasoned issuer, as defined in Rule 405 of the Securities Act. Yes x☒ No o☐
Indicate by check mark if the registrant is not required to file reports pursuant to Section 13 or Section 15(d) of the Exchange Act. Yes o☐ No x☒
Indicate by check mark whether the registrant (1) has filed all reports required to be filed by Section 13 or 15(d) of the Securities Exchange Act of 1934 during the preceding 12 months (or for such shorter period that the registrant was required to file such reports), and (2) has been subject to such filing requirements for the past 90 days. Yesx☒Noo ☐
Indicate by check mark whether the registrant has submitted electronically and posted on its corporate Web site, if any, every Interactive Data File required to be submitted and posted pursuant to Rule 405 of Regulation S-T (§232.405 of this chapter) during the preceding 12 months (or for such shorter period that the registrant was required to submit and post such files). Yesx☒Noo
Indicate by check mark if disclosure of delinquent filers pursuant to Item 405 of Regulation S-K (§ 229.405 of this chapter) is not contained herein, and will not be contained, to the best of the registrant's knowledge, in definitive proxy or information statements incorporated by reference in Part III of this Form 10-K or any amendment to this Form 10-K. x ☐
Indicate by check mark whether the registrant is a large accelerated filer, an accelerated filer, a non-accelerated filer, a smaller reporting company or an emerging growth company. See the definitions of "large“large accelerated filer," "accelerated” “accelerated filer," "smaller” “smaller reporting company,"” and "emerging growth company" in Rule 12b-2 of the Exchange Act.
|
| | | | | | | | | | |
Large accelerated filerx | ☒ | Accelerated filero | ☐ |
Non-accelerated filer o | ☐ | Smaller reporting companyo | Emerging Growth Company o
☐ |
| | Emerging growth company | | (Do not check if a smaller reporting company) | | | ☐ |
If an emerging growth company, indicate by check mark if the registrant has elected not to use the extended transition period for complying with any new or revised financial accounting standards provided pursuant to Section 13(a) of the Exchange Act. o☐
Indicate by check mark whether the registrant is a shell company (as defined in Rule 12b-2 of the Act). Yes o☐ No x
Indicate by check mark whether the registrant has filed a report on and attestation to its management's assessment of the effectiveness of its internal control over financial reporting under section 404(b) of the Sarbanes-Oxley Act (15 U.S.C. 7262(b)) by the registered public accounting firm that prepared or issued its audit report.
Yes ☒ No ☐
As of the last business day of the most recently completed second fiscal quarter, the aggregate market value of the common stock of the registrant held by non-affiliates was approximately $1,705,887,079$1,786,941,297 based on the closing sale prices of such shares as reported on the New York Stock Exchange.
Indicate the number of shares outstanding of each of the registrant's classes of common stock as of the latest practicable date.
|
| | | | | | | |
| Class | | Outstanding at January 31, 20182021 |
| Common Stock, Class A, par value $0.01 per share | | 34,586,25034,599,645 |
| Common Stock, Class B, par value $0.01 per share | | 42,738,750 |
| Common Stock, Class C, par value $0.01 per share | | 64,730,51981,635,540 |
| Common Stock, Class D, par value $0.01 per share | | 42,738,750 |
Documents Incorporated by Reference:
Portions of the Registrant's Definitive Proxy Statement relating to its 20182021 Annual Meeting of Stockholders
are incorporated by reference into Part III of this Annual Report on Form 10-K
TABLE OF CONTENTS
Index
|
| | | | |
| GLOSSARY OF TERMS | |
| PART I | |
| Item 1 — Business | |
| Item 1A — Risk Factors | |
| Item 1B — Unresolved Staff Comments | |
| Item 2 — Properties | |
| Item 3 — Legal Proceedings | |
| Item 4 — Mine Safety Disclosures | |
| PART II | |
| Item 5 — Market for Registrant's Common Equity, Related Stockholder Matters and Issuer Purchases of Equity Securities | |
| Item 6 — Selected Financial Data | |
| Item 7 — Management's Discussion and Analysis of Financial Condition and Results of Operations | |
| Item 7A — Quantitative and Qualitative Disclosures About Market Risk | |
| Item 8 — Financial Statements and Supplementary Data | |
| Item 9 — Changes in Disagreements With Accountants on Accounting and Financial Disclosure | |
| Item 9A — Controls and Procedures | |
| Item 9B — Other Information | |
| PART III | |
| Item 10 — Directors, Executive Officers and Corporate Governance | |
| Item 11 — Executive Compensation | |
| Item 12 — Security Ownership of Certain Beneficial Owners and Management and Related Stockholder Matters | |
| Item 13 — Certain Relationships and Related Transactions, and Director Independence | |
| Item 14 — Principal Accounting Fees and Services | |
| PART IV | |
| Item 15 — Exhibits, Financial Statement Schedules | |
| EXHIBIT INDEX | |
| Item 16 — Form 10-K Summary | |
GLOSSARY OF TERMS
When the following terms and abbreviations appear in the text of this report, they have the meanings indicated below:
|
| | | | | | | |
2019 Convertible Notes | | $345 million aggregate principal amount of 3.50% Convertible Notes due 2019 |
| 2020 Convertible Notes | | $287.545 million aggregate principal amount of 3.25% Convertible Notesconvertible notes due 2020, issued by Clearway Energy, Inc., which were repaid on June 1, 2020 |
| 2024 Senior Notes | | $500 million aggregate principal amount of 5.375% unsecured senior notes due 2024, issued by NRG YieldClearway Energy Operating LLC, which were repaid on January 3,2020 |
| 2025 Senior Notes | | $600 million aggregate principal amount of 5.750% unsecured senior notes due 2025, issued by Clearway Energy Operating LLC |
| 2026 Senior Notes | | $350 million aggregate principal amount of 5.00% unsecured senior notes due 2026, issued by NRG YieldClearway Energy Operating LLC |
| 2028 Senior Notes | | $850 million aggregate principal amount of 4.75% unsecured senior notes due 2028, issued by Clearway Energy Operating LLC |
Alta TE HoldcoAdjusted EBITDA | | Alta Wind X-XI TE Holdco LLCA non-GAAP measure, represents earnings before interest, tax, depreciation and amortization adjusted for mark-to-market gains or losses, asset write offs and impairments; and factors which the Company does not consider indicative of future operating performance |
Alta Wind PortfolioARO | | Seven wind facilities that total 947 MW located in Tehachapi, California and a portfolio of associated land leases |
AOCL | | Accumulated Other Comprehensive Loss |
ARO | | Asset Retirement Obligation |
ARRAASC | | American Recovery and Reinvestment Act of 2009 |
ASC | | The FASB Accounting Standards Codification, which the FASB established as the source of
authoritative GAAP
|
| ASU | | Accounting Standards Updates – updates to the ASC |
ATM ProgramPrograms | | At-The-Market Equity Offering ProgramPrograms |
August 2017Bankruptcy Code | | Title 11 of the U.S. Code |
| Bankruptcy Court | | U.S. Bankruptcy Court for the Northern District of California |
Buckthorn Solar Drop Down AssetsAsset | | The remaining 25% interest in NRG Wind TE Holdco, an 814 net MW portfolioBuckthorn Renewables, LLC, which owns 100% of twelve wind projects,Buckthorn Solar Portfolio, LLC, which was acquired by Clearway Energy Operating LLC from NRG on August 1, 2017March 30, 2018 |
Buckthorn SolarCAFD | | The 154 MW Buckthorn Solar project |
Buffalo Bear | | Buffalo Bear, LLC, the operating subsidiary of Tapestry Wind LLC, which owns the Buffalo Bear project |
CAA | | Clean Air Act |
CAFD | | A non-GAAP measure, Cash Available Forfor Distribution which the Company definesis defined as net income before interest expense, income taxes, depreciation and amortization,of December 31, 2020 as Adjusted EBITDA plus cash distributionsdistributions/return of investment from unconsolidated affiliates, adjustments to reflect CAFD generated by unconsolidated investments that were not able to distribute project dividends prior to PG&E's emergence from bankruptcy on July 1, 2020 and subsequent release post-bankruptcy, cash receipts from notes receivable, cash distributions from noncontrolling interests, adjustments to reflect sales-type lease cash payments, less cash distributions to noncontrolling interests, maintenance capital expenditures, pro-rata Adjusted EBITDA from unconsolidated affiliates, cash interest paid, income taxes paid, principal amortization of indebtedness, andWalnut Creek investment payments, changes in prepaid and accrued capacity payments, and adjusted for development expenses. |
| Carlsbad Drop Down | | The acquisition by the Company of the Carlsbad Energy Center, a 527 MW natural gas fired project located in Carlsbad, CA |
CfDCEG | | Contract for DifferencesClearway Energy Group LLC (formerly Zephyr Renewables LLC) |
CFTCCEG Master Services Agreement | | U.S. Commodity Future Trading CommissionMaster Services Agreements entered into as of August 31, 2018 between the Company, Clearway Energy LLC and Clearway Energy Operating LLC, and CEG |
CODCEG ROFO Agreement | | Right of First Offer Agreement, entered into as of August 31, 2018, by and between Clearway Energy Group LLC and Clearway Energy, Inc., and solely for purposes of Section 2.4, GIP III Zephyr Acquisition Partners, L.P., as amended by the First Amendment dated February 14, 2019, the Second Amendment dated August 1, 2019, the Third Amendment dated December 6, 2019 and the Fourth Amendment dated November 2, 2020 |
| Clearway Energy LLC | | The holding company through which the projects are owned by Clearway Energy Group LLC, the holder of Class B and Class D units, and Clearway Energy, Inc., the holder of the Class A and Class C units |
| Clearway Energy Group LLC | | The holder of the Company's Class B and Class D common shares and Clearway Energy LLC's Class B and Class D units |
| Clearway Energy Operating LLC | | The holder of the project assets that are owned by Clearway Energy LLC |
| COD | | Commercial Operation Date |
| Code | | Internal Revenue Code of 1986, as amended |
| Company | | NRG Yield,Clearway Energy, Inc. together with its consolidated subsidiaries |
| | | | | | | | |
| CVSR | | California Valley Solar Ranch |
CVSR Drop Down | | The Company's acquisition from NRG of the remaining 51.05% interest of CVSR Holdco |
CVSR Holdco | | CVSR Holdco LLC, the indirect owner of CVSR |
DGCL | | Delaware General Corporation Law |
DGPV Holdco 1Entities | | NRGCollectively, DGPV Holdco 1, LLC |
| DGPV Holdco 2 and DGPV Holdco 3 |
| DGPV Holdco 1 | | NRG DGPV Holdco 1 LLC |
| DGPV Holdco 2 | | DGPV Holdco 2 LLC |
| DGPV Holdco 3 | | NRG DGPV Holdco 3 LLC |
| Distributed Solar | | Solar power projects, typically less than 20 MW in size, that primarily sell power produced to customers for usage on site, or are interconnected to sell power into the local distribution grid |
| Drop Down Assets | | Collectively, assets under common control acquired by the JuneCompany from NRG from January 1, 2014 Drop Down Assets, January 2015 Drop Down Assets, November 2015 Drop Down Assets, CVSR Drop Down, March 2017 Drop Down Assets,through the period ended August 2017 Drop Down Assets31, 2018 and November 2017 Drop Down Assetsfrom CEG from August 31, 2018 through the period ending December 31, 2020 |
| Economic Gross Margin | | EnergyA non-GAAP measure, energy and capacity revenue, less cost of fuelsfuels. See Item 7 — Management's Discussion and Analysis of Financial Condition and Results of Operations — Management's discussion of the results of operations for the years ended December 31, 2020 and 2019 for a discussion of this measure. |
EDAECP | | Equity Distribution Agreement |
| Energy Center Pittsburgh LLC, a subsidiary of the Company |
| EPA | | United States Environmental Protection Agency |
EGUEPC | | Electric Utility Generating Unit |
El Segundo | | NRG West Holdings LLC, the subsidiary of Natural Gas Repowering LLC, which owns the El Segundo Energy Center project |
EPC | | Engineering, Procurement and Construction |
| ERCOT | | Electric Reliability Council of Texas, the ISO and the regional reliability coordinator of the various electricity systems within Texas |
| EWG | | Exempt Wholesale Generator |
| Exchange Act | | The Securities Exchange Act of 1934, as amended |
| FASB | | Financial Accounting Standards Board |
| FERC | | Federal Energy Regulatory Commission |
| FPA | | Federal Power Act |
| GAAP | | Accounting principles generally accepted in the U.S. |
| GenConn | | GenConn Energy LLC |
| GHG | | Greenhouse gas |
GIPGIM | | Global Infrastructure Management, LLC |
| GIP | | Collectively, Global Infrastructure Partners III-C Intermediate AIV 3, L.P., Global Infrastructure Partners III-A/B AIV 3, L.P., Global Infrastructure Partners III-C Intermediate AIV 2, L.P., Global Infrastructure Partners III-C2 Intermediate AIV, L.P. and GIP III Zephyr Friends & Family, LLC. |
GW | | Gigawatt |
HLBV | | Hypothetical Liquidation at Book Value |
IASB | | International Accounting Standards Board |
IRS | | Internal Revenue Service |
ISO | | Independent System Operator, also referred to as Regional Transmission Organization, or RTO |
ITC | | Investment Tax Credit |
January 2015 Drop Down Assets | | The Laredo Ridge, Tapestry and Walnut Creek projects, which were acquired by Yield Operating LLC from NRG on January 2, 2015 |
June 2014 Drop Down Assets | | The TA High Desert, Kansas South and El Segundo projects, which were acquired by Yield Operating LLC from NRG on June 30, 2014 |
Kansas South | | NRG Solar Kansas South LLC, the operating subsidiary of NRG Solar Kansas South Holdings LLC, which owns the Kansas South project |
KPPH | | 1,000 Pounds Per Hour |
Laredo Ridge | | Laredo Ridge Wind, LLC, the operating subsidiary of Mission Wind Laredo, LLC, which owns the Laredo Ridge project |
LIBOR | | London Inter-Bank Offered Rate |
Management Services Agreement | | Agreement between NRG and the Company for various operational, management and administrative services |
March 2017 Drop Down Assets | | (i) Agua Caliente Borrower 2 LLC, which owns a 16% interest (approximately 31% of NRG's 51% interest) in the Agua Caliente solar farm and (ii) NRG's 100% ownership in the Class A equity interests in the Utah Solar Portfolio (defined below), both acquired by the Company on March 27, 2017 |
Marsh Landing | | NRG Marsh Landing LLC, formerly GenOn Marsh Landing LLC |
May 9, 2017 Form 8-K | | NRG Yield, Inc.'s Current Report on Form 8-K filed with the SEC on May 9, 2017 in connection with NRG Yield Operating LLC's acquisition of the March 2017 Drop Down Assets |
MMBtu | | Million British Thermal Units |
MW | | Megawatt |
MWh | | Saleable megawatt hours, net of internal/parasitic load megawatt-hours |
MWt | | Megawatts Thermal Equivalent |
NECP | | NRG Energy Center Pittsburgh LLC |
NERC | | North American Electric Reliability Corporation |
Net Exposure | | Counterparty credit exposure to NRG Yield, Inc. net of collateral |
NOLs | | Net Operating Losses |
November 2015 Drop Down Assets | | 75% of the Class B interests of NRG Wind TE Holdco, which owns a portfolio of 12 wind facilities totaling 814 net MW, which was acquired by Yield Operating LLC from NRG on November 3, 2015 |
|
| GIP Transaction | | |
November 2017 Drop Down Assets | | 38 MW portfolio of distributed and small utility-scale solar assets, primarily comprised of assets from NRG's Solar Power Partners (SPP) funds, in addition to other projects developed since the acquisition of SPP byOn August 31, 2018, NRG which was acquired by NRG Yield Operating LLC from NRG on November 1, 2017 |
NOx
| | Nitrogen Oxides |
NPNS | | Normal Purchases and Normal Sales |
NRG | | NRG Energy, Inc. |
NRG Power Marketing | | NRG Power Marketing LLC |
NRG ROFO Agreement | | Second Amended and Restated Right of First Offer Agreement between the Company and NRG |
NRG Transaction | | On February 6, 2018, GIP entered into a purchase and sale agreement with NRG for the acquisition of NRG'stransferred its full ownership interest in the Company to Clearway Energy Group LLC and subsequently sold 100% of its interests in Clearway Energy Group LLC, which includes NRG's renewable energy development and operations platform.platform, to an affiliate of GIP. GIP, NRG and the Company also entered into a consent and indemnity agreement in connection with the purchase and sale agreement.agreement, which was signed on February 6, 2018 |
| HLBV | | Hypothetical Liquidation at Book Value |
| IRS | | Internal Revenue Service |
| ISO | | Independent System Operator, also referred to as an RTO |
| ITC | | Investment Tax Credit |
| kWh | | Kilowatt Hour |
| | |
| LIBOR | | London Inter-bank Offered Rate |
| MBTA | | Migratory Bird Treaty Act |
| MMBtu | | Million British Thermal Units |
| MW | | Megawatt |
| MWh | | Saleable megawatt hours, net of internal/parasitic load megawatt-hours |
| MWt | | Megawatts Thermal Equivalent |
| NERC | | North American Electric Reliability Corporation |
| | | | | | | | |
| Net Exposure | | Counterparty credit exposure to Clearway Energy, Inc. net of collateral |
| NOLs | | Net Operating Losses |
NOx | | Nitrogen Oxides |
| NPNS | | Normal Purchases and Normal Sales |
| NRG | | NRG Transformation PlanEnergy, Inc. |
| NRG Power Marketing | | A three-year, three-part improvement plan announcedNRG Power Marketing LLC |
| NRG TSA | | Transition Services Agreement, entered into as of August 31, 2018, by and between NRG on July 12, 2017, which includes exploring strategic alternatives for NRG's renewables platform and its interest in the Company |
NRG Wind TE HoldcoOCI/OCL | | NRG Wind TE Holdco LLC |
NRG Yield, Inc. | | NRG Yield, Inc., together with its consolidated subsidiaries, or the Company |
NRG Yield LLC | | The holding company through which the projects are owned by NRG, the holder of Class B and Class D units, and NRG Yield, Inc., the holder of the Class A and Class C units |
NRG Yield Operating LLC | | The holder of the project assets that belong to NRG Yield LLC |
OCI/OCL | | Other comprehensive income/loss |
| O&M | | Operations and Maintenance |
OSHAPG&E | | Occupational SafetyPacific Gas and Health AdministrationElectric Company |
| PG&E Bankruptcy | | On January 29, 2019, PG&E Corporation and Pacific Gas &and Electric Company filed voluntary petitions for relief under the Bankruptcy Code in the U.S. Bankruptcy Court for the Northern District of California |
PinnaclePJM | | Pinnacle Wind, LLC, the operating subsidiary of Tapestry Wind LLC, which owns the Pinnacle project |
PJM | | PJM Interconnection, LLC |
| PPA | | Power Purchase Agreement |
| PTC | | Production Tax Credit |
| PUCT | | Public Utility Commission of Texas |
| PUHCA | | Public Utility Holding Company Act of 2005 |
| PURPA | | Public Utility Regulatory Policies Act of 1978 |
| QF | | Qualifying Facility under PURPA |
RECRENOM | | Clearway Renewable Energy CertificateOperation & Maintenance LLC |
RecapitalizationROFO | | The adoptionRight of the Company's Second Amended and Restated Certificate of Incorporation which authorized two new classes of common stock, Class C common stock and Class D common stock, and distributed shares of such new classes of common stock to holders of the Company’s outstanding Class A common stock and Class B common stock, respectively, through a stock split on May 14, 2015 First Offer |
ROFO AssetsRPS | | Specified assets subject to sale, as described in the NRG ROFO Agreement |
RPM | | Reliability Pricing Model |
RPS | | Renewable Portfolio Standards |
RPV HoldcoRTO | | NRG RPV Holdco 1 LLC |
RTO | | Regional Transmission Organization |
| SCE | | Southern California Edison |
| SEC | | U.S. Securities and Exchange Commission |
| Senior Notes | | Collectively, the 2024 Senior Notes, andthe 2025 Senior Notes, the 2026 Senior Notes and the 2028 Senior Notes |
SO2 | | Sulfur Dioxide |
SPPSREC | | Solar Power Partners |
| Renewable Energy Credit |
| Tax Act | | |
TA High Desert | | TA-High Desert LLC, the operating subsidiary of NRG Solar Mayfair LLC, which owns the TA High Desert project |
Taloga | | Taloga Wind, LLC, the operating subsidiary of Tapestry Wind LLC, which owns the Taloga project |
Tapestry | | Collection of the Pinnacle, Buffalo Bear and Taloga projects |
Tax Act | | Tax Cuts and Jobs Act of 2017 |
| Thermal Business | | The Company's thermal business, which consists of thermal infrastructure assets that provide steam, hot water and/or chilled water, and in some instances electricity, to commercial businesses, universities, hospitals and governmental units |
| UPMC Thermal Project | | The University of Pittsburgh Medical Center Thermal Project, a 73 MWt district energy system that allows ECP to provide steam, chilled water and 7.5 MW of emergency backup power service to UPMC |
| U.S. | | United States of America |
| U.S. DOE | | U.S. Department of Energy |
| Utah Solar Portfolio | | Collection consists of Four Brothers Solar, LLC, Granite Mountain Holdings, LLC, and Iron Springs Holdings, LLC, which are equity investments owned by Four Brothers Holdings,Capital, LLC, Granite Mountain Renewables,Capital, LLC, and Iron Springs Renewables,Capital, LLC, respectively and are part of the March 2017 Drop Down Assets acquisition that closed on March 27, 2017 |
| Utility Scale Solar | | Solar power projects, typically 20 MW or greater in size (on an alternating current, or AC, basis), that are interconnected into the transmission or distribution grid to sell power at a wholesale level |
| VaR | | Value at Risk |
| VIE | | Variable Interest Entity |
Walnut CreekWind TE Holdco | | NRG Walnut Creek,Wind TE Holdco LLC, the operating subsidiaryan 814 net MW portfolio of WCEP Holdings, LLC, which owns the Walnut Creek projecttwelve wind projects |
PART I
Item 1 — Business
General
NRG Yield,Clearway Energy, Inc., together with its consolidated subsidiaries, or the Company, is a dividend growth-oriented company that has historically served as the primary vehicle through which NRG owns, operatespublicly-traded energy infrastructure investor in and acquiresowner of modern, sustainable and long-term contracted renewable and conventional generation and thermal infrastructure assets. On February 6, 2018,assets across North America. The Company is indirectly owned by Global Infrastructure Partners orIII. Global Infrastructure Management, LLC is an independent fund manager that invests in infrastructure assets in the energy and transport sectors, and Global Infrastructure Partners III is its third equity fund. The Company is sponsored by GIP entered into a purchase and sale agreement with NRG, orthrough GIP's portfolio company, CEG.
The Company is one of the NRG Transaction, for the acquisition of NRG’s full ownership interest in NRG Yield, Inc. and NRG’slargest renewable energy developmentowners in the U.S. with over 4,200 net MW of installed wind and operations platform.
solar generation projects. The Company believes it isalso owns approximately 2,500 net MW of environmentally-sound, highly efficient natural gas generation facilities as well positionedas a portfolio of district energy systems. Through this environmentally-sound, diversified and primarily contracted portfolio, the Company endeavors to be a premier company forprovide its investors seekingwith stable and growing dividend income from a diversified portfolio of lower-risk, high-quality assets. The Company owns a diversified portfolio of contracted renewable and conventional generation and thermal infrastructure assets in the U.S. The Company’s contracted generation portfolio collectively represents 5,118 net MW as of December 31, 2017. Nearly all of these assets sell substantiallyincome.Substantially all of itsthe Company's generation assets are under long-term contractual arrangements for the output pursuant to long-term offtake agreements with creditworthy counterparties.or capacity from these assets. The weighted average remaining contract duration of these offtake agreements was approximately 1513 years as of December 31, 20172020 based on CAFD.
The Company alsoconsolidates the results of Clearway Energy LLC through its controlling interest, with CEG's interest shown as noncontrolling interest in the financial statements. The holders of the Company's outstanding shares of Class A and Class C common stock are entitled to dividends as declared. CEG receives its distributions from Clearway Energy LLC through its ownership of Clearway Energy LLC Class B and Class D units.
As of December 31, 2020, the Company owns thermal infrastructure assets57.61% of the economic interests of Clearway Energy LLC, with an aggregate steam and chilled water capacityCEG retaining 42.39% of 1,319 net MWt and electric generation capacitythe economic interests of 123 net MW. These thermal infrastructure assets provide steam, hot and/or chilled water, and, in some instances, electricity to commercial businesses, universities, hospitals and governmental units in multiple locations, principally through long-term contracts or pursuant to rates regulated by state utility commissions.Clearway Energy LLC.
A complete listing of the Company's interests in facilities, operations and/or projects owned or leased as of December 31, 20172020 can be found in Item 2 — Properties.
History
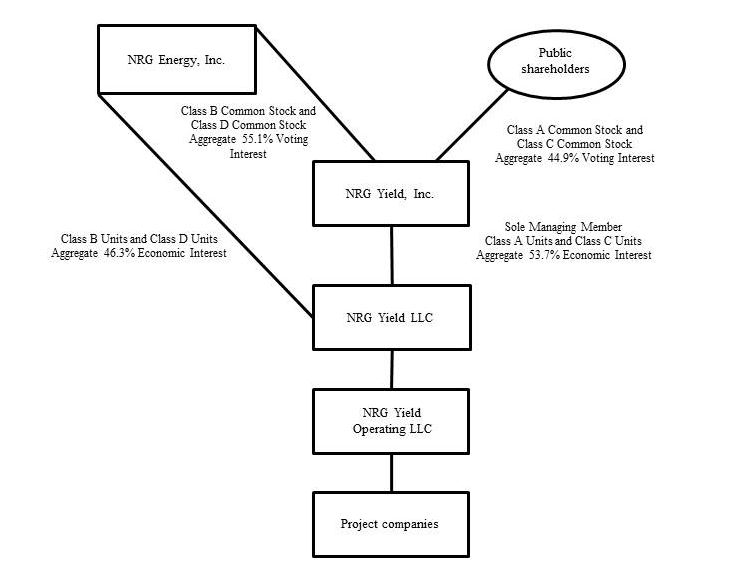
The Company was formed by NRG Energy, Inc., or NRG, as a Delaware corporation on December 20, 2013.2012 by NRG. On August 31, 2018, NRG throughtransferred its holdings of Class B common stock and Class D common stock, has a 55.1% votingfull ownership interest in the Company to CEG, the holder of NRG's renewable energy development and receives distributions from NRG Yield LLC throughoperations platform, and subsequently sold 100% of its ownership of Class B units and Class D units. The holders ofinterest in CEG to GIP, referred to hereinafter as the Company's issued and outstanding shares of Class A common stock and Class C common stock are entitled to dividends as declared and have 44.9% of the voting power in the Company.GIP Transaction.
The Company is the sole managing member of NRG YieldClearway Energy LLC and operates and controls all of its business and affairs and consolidates the financial results of NRG YieldClearway Energy LLC and its subsidiaries. NRG YieldClearway Energy LLC is a holding company for the companies that directly and indirectly own and operate the Company's assets. As of December 31, 2017,2020, the Company and NRG have 53.7% and 46.3%owns 57.61% of the economic interests in NRG Yieldof Clearway Energy LLC, respectively.with CEG retaining 42.39% of the economic interests of Clearway Energy LLC. As a result of the current ownership of the Class B common stock and Class D common stock, NRG continues at the present time to controlCEG controls the Company, and the Company in turn, as the sole managing member of NRG YieldClearway Energy LLC, controls NRG YieldClearway Energy LLC and its subsidiaries.
The diagram below depicts the Company’s organizational structure as of December 31, 2017:2020:
Strategic Sponsorship with Global Infrastructure Partners
On February 6, 2018, Global Infrastructure Partners, or GIP, entered into a purchase and sale agreement with NRG, or the NRG Transaction, for the acquisition of NRG’s full ownership interest in NRG Yield, Inc. and NRG’s renewable energy development and operations platform. The NRG Transaction is subject to certain closing conditions, including customary legal and regulatory approvals. The Company expects the NRG Transaction to close in the second half of 2018.
In connection with the NRG Transaction, the Company entered into a Consent and Indemnity Agreement with NRG and GIP setting forth key terms and conditions of the Company's consent to the NRG Transaction. Key provisions of the Consent and Indemnity Agreement include:
Minimized impact to CAFD from potential change in control costs — No more than $10 million in reduced annual CAFD on a recurring basis that would result from changes in the Company's cost structure or any impact from various consents.
Enhanced ROFO pipeline — Upon closing, the Company will enter into a new ROFO agreement with GIP that adds 550 MW to the current pipeline through the operational 150 MW Langford Wind project and the 400 MW Mesquite Star Wind project which is under development. The NRG ROFO Agreement will be amended to remove the Ivanpah solar facility.
Financial cooperation and support — GIP has arranged a $1.5 billion backstop credit facility to manage any change of control costs associated with the Company's corporate debt. GIP has also committed to provide up to $400 million in financial support, if necessary, for the purchase of the Carlsbad Energy Center.
Voting and Governance Agreement — As part of the NRG Transaction, the parties have agreed to enter into a voting and governance agreement, which would provide that:
the Chief Executive Officer of the Company will at all times be a full-time Company employee appointed by the Board of Directors, or the Board, of the Company;
the parties thereto will use their commercially reasonable efforts to submit to the Company’s stockholders at the Company’s 2019 Annual Meeting of Stockholders a charter amendment to classify the Board into two classes (with the independent directors and directors designated by an affiliate of GIP allocated across the two classes); and
the Board will be expanded to nine members at the closing of the NRG Transaction, comprised at that date of five directors designated by GIP, three independent directors and the Company’s Chief Executive Officer.
Business Strategy
The Company's primary business strategy is to focus on the acquisition and ownership of assets with predictable, long-term cash flows in order that it may be able to increase the cash dividends paid to holders of the Company's Class A and Class C common stock over time without compromising the ongoing stability of the business.
The Company's plan for executing thisits business strategy includes the following key components:
Focus on contracted renewable energy and conventional generation and thermal infrastructure assets. The Company owns and operates utility scale and distributed renewable energy and natural gas-fired generation, thermal and other infrastructure assets with proven technologies, low operating risks and stable cash flows. The Company believes by focusing on this core asset class and leveraging its industry knowledge, it will maximize its strategic opportunities, be a leader in operational efficiency and maximize its overall financial performance.
Growing the business through acquisitions of contracted operating assets. The Company believes that its base of operations and relationship with NRG provideprovides a platform in the conventional and renewable power generation and thermal sectors for strategic growth through cash accretive and tax advantaged acquisitions complementary to its existing portfolio. In addition to acquiring renewable generation, conventional generation and thermal infrastructure assets from third parties where the Company believes its knowledge of the market and operating expertise provides it with a competitive advantage, the Company entered into a Right of First Offer Agreement with NRG, or the NRGCEG ROFO Agreement. Under the NRGCEG ROFO Agreement, NRGCEG has granted the Company and its affiliates a right of first offer on any proposed sale, transfer or other disposition of certain assets of NRGCEG, or the CEG ROFO Assets, until February 24, 2022. NRGAugust 31, 2023. CEG is not obligated to sell the remaining NRGCEG ROFO Assets to the Company and, if offered by NRG,CEG, the Company cannot be sure whether these assets will be offered on acceptable terms, or that the Company will choose to consummate such acquisitions. The Company and CEG work collaboratively in considering new assets to be added under the CEG ROFO
Agreement or to be acquired by the Company outside of the CEG ROFO Agreement. The assets listed in the table below represent the NRGCompany's currently committed investments in projects with CEG and the CEG ROFO Assets:
Committed Investments and CEG ROFO Assets |
| | | | | | |
| Asset | | Fuel Type | | Rated Capacity
(MW)(a) | | COD |
| Agua Caliente | | Solar | | 102 | | 2014 |
| Ivanpah | | Solar | | 196 | | 2013 |
Hawaii(b) | | Solar | | 80 | | 2019 |
Distributed Solar (up to $190 million of equity in distributed solar generation portfolio(s)(b) | | Solar | | various | | various |
Buckthorn Solar(c) | | Solar | | 154 | | 2018 |
Carlsbad (d) | | Conventional | | 527 | | 2018 |
Puente/Mandalay(e) | | Conventional | | Project not expected to move forward |
| Community | | Wind | | Sold to third party |
| Jeffers | | Wind | | Sold to third party |
| Minnesota Portfolio | | Wind | | Sold to third party |
| | | | | | | | | | | | | | | | | | | | | | | | | | | | | | | | |
| Asset | | Technology | | Gross Capacity (MW) | | State | | COD | | Status |
| Pinnacle Repowering | | Wind | | 55 | | WV | | 2021 | | Committed |
Mesquite Sky (a) | | Wind | | 345 | | TX | | 2021 | | Committed |
Black Rock (a) | | Wind | | 110 | | WV | | 2021 | | Committed |
Mililani I (a) | | Solar | | 39 | | HI | | 2022 | | Committed |
Waiawa (a) | | Solar | | 36 | | HI | | 2022 | | Committed |
Daggett (a) | | Solar | | 482 | | CA | | 2022 | | Committed |
| Wildflower | | Solar | | 100 | | MS | | 2023 | | ROFO |
(a)Projects included in a co-investment partnership with Hannon Armstrong Sustainable Infrastructure Capital, Inc (a) Represents the maximum, or rated, electricity generating capacity of the facility in MW multiplied by NRG's percentage ownership interest in the facility as of December 31, 2017.
(b) Hawaii and Distributed Solar are part of the NRG ROFO Agreement. These are not expected to be offered by NRG prior to consummation of the NRG Transaction and, at that time, would become part of a new ROFO Agreement with GIP.
(c) The transaction is expected to close in the first quarter of 2018.
(d) The transaction is expected to close in the fourth quarter of 2018 and is contingent upon the consummation of the NRG Transaction. Reflects capacity per the Power Purchase & Tolling Agreement with San Diego Gas & Electric; actual tested capacity is expected to be 530 MW.
(e) On November 3, 2017, the California Energy Commission suspended the permitting process for the Puente Power Project after two commissioners issued a statement stating their intention to deny the permit. If the CEC formally denies a permit for the Puente Power Project, then the project will not move forward.
Upon closing of the NRG Transaction, the Company will enter into a new ROFO agreement with GIP that adds 550 MW to the current pipeline through the operational 150 MW Langford Wind project and the 400 MW Mesquite Star Wind project which is under development. The NRG ROFO Agreement will be amended to remove the Ivanpah solar facility.
Primary focus on North America.The Company intends to primarily focus its investments in North America (including the unincorporated territories of the U.S.). The Company believes that industry fundamentals in North America present it with significant opportunity to acquire renewable, natural gas-fired generation and thermal infrastructure assets,grow its portfolio without creating significant exposure to currency and sovereign risk. By primarily focusing its efforts on North America, the Company believes it will best leverage its regional knowledge of power markets, industry relationships and skill sets to maximize the performance of the Company.
Maintain sound financial practices to grow the dividend. The Company intends to maintain a commitment to disciplined financial analysis and a balanced capital structure to enable it to increase its quarterly dividend over time and serve the long-term
interests of its stockholders. The Company's financial practices include a risk and credit policy focused on transacting with credit-worthycreditworthy counterparties; a financing policy, which focuses on seeking an optimal capital structure through various capital formation alternatives to minimize interest rate and refinancing risks, ensure stable long-term dividends and maximize value; and a dividend policy that is based on distributing a significant portion of CAFD each quarter that the Company receives from NRG YieldClearway Energy LLC, subject to available capital, market conditions and compliance with associated laws, regulations and other contractual obligations. The Company intends to evaluate various alternatives for financing future acquisitions and refinancing of existing project-level debt, in each case, to reduce the cost of debt, extend maturities and maximize CAFD. The Companybelieves it has additional flexibility to seek alternative financing arrangements, including, but not limited to, debt financings and equity-like instruments.
Competition
Power generation is a capital-intensive business with numerous and diverse industry participants. The Company competes on the basis of the location of its plants and on the basis of contract price and terms of individual projects. Within the power industry, there is a wide variation in terms of the capabilities, resources, nature and identity of the companies with whom the Company competes with depending on the market. Competitors for energy supply are utilities, independent power producers and other providers of distributed generation. The Company also competes to acquire new projects with renewable developers who retain renewable power plant ownership, independent power producers, financial investors and other dividend, growth-oriented companies. Competitive conditions may be substantially affected by capital market conditions and by various forms of energy legislation and regulation considered by federal, state and local legislatures and administrative agencies, including tax policy. Such laws and regulations may substantially increase the costs of acquiring, constructing and operating projects, and it could be difficult for the Company to adapt to and operate under such laws and regulations.
The Company's thermal businessThermal Business has certain cost efficiencies that may form barriers to entry. Generally, there is only one district energy system in a given territory, for which the only competition comes from on-site systems. While the district energy system can usually make an effective case for the efficiency of its services, some building owners nonetheless may opt for on-site systems, either due to corporate policies regarding allocation of capital, unique situations where an on-site system might in fact prove more efficient or because of previously committed capital in systems that are already on-site. Growth in existing district energy systems generally comes from new building construction or existing building conversions within the service territory of the district energy provider.
Competitive Strengths
Stable, high quality cash flows. The Company's facilities have a stable, predictable cash flow profile consisting of predominantly long-life electric generation assets that sell electricity under long-term fixed priced contracts or pursuant to regulated rates with investment grade and certain other credit-worthycreditworthy counterparties. Additionally, theThe Company's facilities have minimal fuel risk. For the Company's conventional assets, fuel is provided by the toll counterparty or the cost thereof is a pass-through cost under the CfD.Contract for Differences. Renewable facilities have no fuel costs, and most of the Company's thermal infrastructure assets have contractual or regulatory tariff mechanisms for fuel cost recovery. The offtake agreements for the Company's conventional and renewable generation facilities have a weighted-average remaining duration, based on CAFD, of approximately 1513 years as of December 31, 2017, based on CAFD,2020, providing long-term cash flow stability. The Company's generation offtake agreements with counterparties for whom credit ratings are available have a weighted-average Moody’s rating of A3Ba1 based on rated capacity under contract. All of the Company's assets are in the U.S. and accordingly have no currency or repatriation risks.
High quality, long-lived assets with low operating and capital requirements. The Company benefits from a portfolio of relatively younger assets, other than thermal infrastructure assets. The Company's assets are comprised of proven and reliable technologies, provided by leading original solar and wind equipment manufacturers such as General Electric, Siemens AG, SunPower Corporation, or SunPower, First Solar Inc., or First Solar, Vestas, Suzlon and Mitsubishi. Given the modern nature of the portfolio, which includes a substantial number of relatively low operating and maintenance cost solar and wind generation assets, the Company expects to achieve high fleet availability and expend modest maintenance-related capital expenditures. Additionally, with the support of services provided by NRG, the Company expects to continue to implement the same rigorous preventative operating and management practices that NRG uses across its fleet of assets.
Significant scale and diversity. The Company owns and operates a large and diverse portfolio of contracted electric generation and thermal infrastructure assets. As of December 31, 2017, the Company's 5,118 net MW contracted generation portfolio benefits from significant diversification in terms of technology, fuel type, counterparty and geography. The Company's thermal business consists of twelve operations, seven of which are district energy centers that provide steam and chilled water to approximately 695 customers, and five of which provide generation. The Company believes its scale and access to best practices across the fleet improves its business development opportunities through enhanced industry relationships, reputation and understanding of regional power market dynamics. Furthermore, the Company's diversification reduces its operating risk profile and reliance on any single market.
Relationship with NRG. The Company believes its relationship with NRG, a leading competitive power generator in the U.S., provides significant benefits to the Company, including access to the significant resources of NRG to support its operational, financial, legal, regulatory and environmental functions.
Relationship with GIP. The Company believes its potential relationship with GIP, should the NRG Transaction be consummated, may provide significant benefits to the Company. GIP is an independent infrastructure fund with over $45 billion in assets under management that invests in infrastructure assets and businesses in both OECD and select emerging market countries. GIP has a strong track record of investment and value creation in the renewable energy sector. Additionally, GIP has extensive experience with publicly traded yield vehicles and development platforms, ranging from Europe's first application of a yield company/development company model to the largest renewable platform in Asia-Pacific.
Environmentally well-positioned portfolio of assets. The Company's portfolio of electric generation assets consists of 3,1734,208 net MW of renewable generation capacity that are non-emitting sources of power generation. The Company's conventional assets consist of the dual fuel-fired GenConn assets as well as the Carlsbad, Marsh Landing and Walnut Creek simple cycle natural gas-fired peaking generation facilities and the El Segundo combined cycle natural gas-fired peaking facility. The Company does not anticipate having to expend any significant capital expenditures in the foreseeable future to comply with current environmental regulations applicable to its generation assets. Taken as a whole, the Company believes its strategy will be a net beneficiary of current and potential environmental legislation and regulatory requirements that may serve as a catalyst for capacity retirements and improve market opportunities for environmentally well-positioned assets like the Company's assets once its current offtake agreements expire.
High quality, long-lived assets with low operating and capital requirements. The Company benefits from a portfolio of relatively younger assets, other than thermal infrastructure assets. The Company's assets are comprised of proven and reliable technologies, provided by leading original solar and wind equipment manufacturers such as General Electric, Siemens AG, SunPower Corporation, or SunPower, First Solar Inc., or First Solar, Vestas, Mitsubishi, Trina Solar, JA Solar and Siemens Gamesa. Given the modern nature of the portfolio, which includes a substantial number of relatively low operating and maintenance cost solar and wind generation assets, the Company expects to achieve high fleet availability and expend modest maintenance-related capital expenditures.
Significant scale and diversity. The Company owns and operates a large and diverse portfolio of electric generation and thermal infrastructure assets. As of December 31, 2020, the Company owns and operates a portfolio of 6,690 net MW of primarily contracted renewable and conventional generation assets which benefit from significant diversification in terms of technology, fuel type, counterparty and geography. The Company's Thermal Business consists of thirteen operations, seven of which are district energy centers that provide steam and chilled water to approximately 695 customers, and six of which provide generation. The Company believes its scale and access to best practices across the fleet improves its business development opportunities through enhanced industry relationships, reputation and understanding of regional power market dynamics. Furthermore, the Company's diversification reduces its operating risk profile and reliance on any single market.
Relationship with GIP and CEG. The Company believes that its relationship with GIP and CEG provides significant benefits. GIM, the manager of GIP, is an independent infrastructure fund manager that invests in infrastructure assets and businesses in both the Organization for Economic Co-operation and Development and select emerging market countries. GIM has a strong track record of investment and value creation in the renewable energy sector. GIM also has extensive experience with publicly traded yield vehicles and development platforms, ranging from Europe's first application of a yield company/development company model to the largest renewable platform in Asia-Pacific. Additionally, the Company believes that CEG provides the Company access to a highly capable renewable development and operations platform that is aligned to support the Company's growth.
Thermal infrastructure business has high entry costs. Significant capital has been invested to construct the Company's thermal infrastructure assets, serving as a barrier to entry in the markets in which such assets operate. As of December 31, 2017, the Company's thermal gross property, plant, and equipment was approximately $473 million. The Company's thermal district energy centers are located in urban city areas, with the chilled water and steam delivery systems located underground. Constructing underground delivery systems in urban areas requires long lead times for permitting, rights of way and inspections and is costly. By contrast, the incremental cost to add new customers in existing markets is relatively low. Once thermal infrastructure is established, the Company believes it has the ability to retain customers over long periods of time and to compete effectively for additional business against stand-alone on-site heating and cooling generation facilities. Installation of stand-alone equipment can require significant modification to a building as well as significant space for equipment and funding for capital expenditures. The Company's system technologies often provide economies of scale in terms of fuel procurement, ability to switch between multiple types of fuel to generate thermal energy, and fuel conversion efficiency.
Segment Review
The following tables summarize the Company's operating revenues, net income (loss) and assets by segment for the years ended December 31, 2017, 20162020, 2019 and 2015,2018, as discussed in Item 15 — Note 13, Segment Reporting, to the Consolidated Financial Statements. All amounts
| | | | | | | | | | | | | | | | | | | | | | | | | | | | | |
| Year ended December 31, 2020 |
| (In millions) | Conventional Generation | | Renewables | | Thermal | | Corporate | | Total |
| Operating revenues | $ | 437 | | | $ | 569 | | | $ | 193 | | | $ | — | | | $ | 1,199 | |
| | | | | | | | | |
| Net income (loss) | 140 | | | (109) | | | 3 | | | (96) | | | (62) | |
| Total assets | 2,575 | | | 7,157 | | | 627 | | | 233 | | | 10,592 | |
| | | | | | | | | | | | | | | | | | | | | | | | | | | | | |
| Year ended December 31, 2019 |
| (In millions) | Conventional Generation | | Renewables | | Thermal | | Corporate | | Total |
| Operating revenues | $ | 346 | | | $ | 485 | | | $ | 201 | | | $ | — | | | $ | 1,032 | |
| | | | | | | | | |
| Net income (loss) | 135 | | | (104) | | | (5) | | | (122) | | | (96) | |
| Total assets | 2,753 | | | 6,186 | | | 633 | | | 128 | | | 9,700 | |
| | | | | | | | | | | | | | | | | | | | | | | | | | | | | |
| Year ended December 31, 2018 |
| (In millions) | Conventional Generation | | Renewables | | Thermal | | Corporate | | Total |
| Operating revenues | $ | 337 | | | $ | 523 | | | $ | 193 | | | $ | — | | | $ | 1,053 | |
| | | | | | | | | |
| Net income (loss) | 135 | | | 86 | | | 29 | | | (196) | | | 54 | |
Policy Incentives
Policy incentives in the U.S. have been recast to include the effect of making the acquisitionsdevelopment of renewable energy projects more competitive by providing credits and other tax benefits for a portion of the Drop Down Assets,development costs. A loss of or reduction in such incentives could decrease the attractiveness of renewable energy projects to developers, including CEG, which were accountedcould reduce the Company's future acquisition opportunities. Such a loss or reduction could also reduce the Company's willingness to pursue or develop certain renewable energy projects due to higher operating costs or decreased revenues under its PPAs.
U.S. federal, state and local governments have established various incentives to support the development of renewable energy projects. These incentives include accelerated tax depreciation, PTCs, ITCs, cash grants, tax abatements and RPS programs. Pursuant to the U.S. federal Modified Accelerated Cost Recovery System, or MACRS, wind and solar projects are generally fully depreciated for as transferstax purposes over a five-year period (before taking into account certain conventions) even though the useful life of entities under common control.such projects is generally much longer than five years. The accounting guidance requires retrospective combinationTax Act also provides the ability for wind and solar projects to claim immediate expensing for property acquired and placed in service after September 27, 2017, and before January 1, 2023.
Owners of utility-scale wind facilities are eligible to claim an income tax credit (the PTC, or an ITC in lieu of the entitiesPTC) upon initially achieving commercial operation. The PTC is determined based on the amount of electricity produced by the wind facility during the first ten years of commercial operation. This incentive was created under the Energy Policy Act of 1992 and has been extended several times. Alternatively, an ITC equal to a percentage of the cost of a wind facility may be claimed in lieu of the PTC. In order to qualify for all periods presented asthe PTC (or ITC in lieu of the PTC), construction of a wind facility must begin before a specified date and the taxpayer must maintain a continuous program of construction or continuous efforts to advance the project to completion. The Internal Revenue Service, or IRS, issued guidance stating that the safe harbor for continuous efforts and continuous construction requirements will generally be satisfied if the combination has beenfacility is placed in effect sinceservice no more than four years after the inceptionyear in which construction of common control. Accordingly, the Company prepared its consolidated financial statementsfacility began. In response to reflect the transfers as if they had taken place fromCOVID-19 pandemic, the IRS extended this safe harbor by one year for facilities that began construction in 2016 or 2017. The IRS also confirmed that retrofitted wind facilities may re-qualify for PTCs or ITCs pursuant to the beginning construction requirement, as long as the cost basis of the financial statements period or from the date the entities were under common control (if later than the beginningnew investment is at least 80% of the financial statements period).facility’s total fair value.
Owners of solar projects are eligible to claim an ITC for new solar projects. Tax credits for qualifying wind and solar projects are subject to the following phase-down schedule.
|
| | | | | | | | | | | | | | | | | | | |
| Year ended December 31, 2017 |
| (In millions) | Conventional Generation |
| Renewables |
| Thermal |
| Corporate |
| Total |
| Operating revenues | $ | 336 |
| | $ | 501 |
| | $ | 172 |
| | $ | — |
| | $ | 1,009 |
|
| Net income (loss) | 120 |
| | 9 |
| | 25 |
| | (177 | ) | | (23 | ) |
| Total assets | 1,897 |
| | 5,811 |
| | 422 |
| | 153 |
| | 8,283 |
|
|
| | | | | | | | | | | | | | | | | | | |
| | Year ended December 31, 2016 |
| (In millions) | Conventional Generation | | Renewables | | Thermal | | Corporate | | Total |
| Operating revenues | $ | 333 |
| | $ | 532 |
| | $ | 170 |
| | $ | — |
| | $ | 1,035 |
|
| Net income (loss) | 153 |
| | (86 | ) | | 29 |
| | (94 | ) | | 2 |
|
| Total assets | 1,993 |
| | 6,114 |
| | 426 |
| | 429 |
| | 8,962 |
|
| | | | | | | | | | | | | | | | | | | | | | | | | | | | | | | | | | | | | | | | | | | | | | | | | | | | | | | | | | | |
| | Year construction of project begins |
| | 2015 | | 2016 | | 2017 | | 2018 | | 2019 | | 2020 | | 2021 | | 2022 | | 2023 | | 2024 |
PTC (a) | 100 | % | | 100 | % | | 80 | % | | 60 | % | | 40 | % | | 60 | % | | 60 | % | | — | % | | — | % | | — | % |
On Shore Wind ITC (b) | 30 | % | | 30 | % | | 24 | % | | 18 | % | | 12 | % | | 18 | % | | 18 | % | | — | % | | — | % | | — | % |
Solar ITC (c) | 30 | % | | 30 | % | | 30 | % | | 30 | % | | 30 | % | | 26 | % | | 26 | % | | 26 | % | | 22 | % | | 10 | % |
|
| | | | | | | | | | | | | | | | | | | |
| | Year ended December 31, 2015 |
| (In millions) | Conventional Generation | | Renewables | | Thermal | | Corporate | | Total |
| Operating revenues | $ | 336 |
| | $ | 458 |
| | $ | 174 |
| | $ | — |
| | $ | 968 |
|
| Net income (loss) | 156 |
| | (18 | ) | | 22 |
| | (88 | ) | | 72 |
|
Government Incentives
Government incentives, including PTCs and ITCs, can enhance the economics(a) Percentage of the Company's generating assetsfull PTC available for wind projects that begin construction during the applicable year.
(b) The Taxpayer Certainty and investments by providing,Disaster Tax Relief Act of 2020 provides for example, loan guarantees, cash grants, favorable tax treatment, favorable depreciation rulesa new 30% ITC for offshore wind projects that begin construction before January 1, 2026.
(c) ITC is limited to 10% for projects not placed in service before January 1, 2026.
RPS, currently in place in certain states and territories, require electricity providers in the state or territory to meet a certain percentage of their retail sales with energy from renewable sources. Additionally, other incentives.states in the U.S. have set renewable energy goals to reduce GHG emissions from historic levels. The Company cannot predictbelieves that these standards and goals will create incremental demand for renewable energy in the effects that the current U.S. presidential administration will have on government incentives.future.
Regulatory Matters
As owners of power plants and participants in wholesale and thermal energy markets, certain of the Company's subsidiaries are subject to regulation by various federal and state government agencies. These agencies include FERC and the PUCT, as well as other public utility commissions in certain states where the Company's assets are located. Each of the Company's U.S. generating facilities qualifies as an EWG or QF. In addition, the Company is subject to the market rules, procedures and protocols of the various ISO and RTO markets in which it participates. Likewise, certain of the CompanyCompany's subsidiaries must also comply with the mandatory reliability requirements imposed by NERC and the regional reliability entities in the regions where the Company operates.has generating facilities subject to NERC's reliability authority.The Company's operations within the ERCOT footprint are not subject to rate regulation by FERC, as they are deemed to operate solely within the ERCOT market and not in interstate commerce. These operations are subject to regulation by PUCT.
FERC
FERC, among other things, regulates the transmission and the wholesale sale of electricity in interstate commerce under the authority of the FPA. The transmission and sale of electric energy occurring wholly within ERCOT is not subject to FERC’s jurisdiction under Sections 203 or 205 of the FPA.jurisdiction. Under existing regulations, FERC determineshas the authority to determine whether an entity owning a generation facility is an EWG, as defined in the PUHCA. FERC also determineshas the authority to determine whether a generation facility meets the ownership and technicalapplicable criteria of a QF under the PURPA. Each of the Company’s non-ERCOTU.S. generating facilities qualifies as either an EWG.EWG or QF.
The FPA gives FERC exclusive rate-making jurisdiction over the wholesale sale of electricity and transmission of electricity in interstate commerce of public utilities (as defined by the FPA). Under the FPA, FERC, with certain exceptions, regulates the owners and operators of facilities used for the wholesale sale of electricity or transmission in interstate commerce as public utilities, and establishesis charged with ensuring that market rules that are just and reasonable.
Public utilities are required to obtain FERC’s acceptance, pursuant to Section 205 of the FPA, of their rate schedules for the wholesale sale of electricity. AllSeveral of the Company's QF generating facilities and all of the Company’s non-QF generating entitiesfacilities located in the U.S. outside of ERCOT make sales of electricity pursuant to market-based rates, as opposed to traditional cost-of-service regulated rates. Every three years FERC will conductconducts a review of the Company’s market basedmarket-based rates of Company public utilities and potential market power onevery three years according to a regional basis.schedule established by FERC.
In accordance with the Energy Policy Act of 2005, FERC has approved the NERC as the national Energy Reliability Organization, or ERO. As the ERO, NERC is responsible for the development and enforcement of mandatory reliability standards for the wholesale electric power system. In addition to complying with NERC requirements, each entity must comply with the requirements of the regional reliability entity for the region in which it is located.
The PURPA was passed in 1978 in large part to promote increased energy efficiency and development of independent power producers. The PURPA created QFs to further both goals, and FERC is primarily charged with administering the PURPA as it applies to QFs. Certain QFs are exempt from regulation, either in whole or in part,certain regulations under the FPA as public utilities.FPA.
The PUHCA provides FERC with certain authority over and access to books and records of public utility holding companies not otherwise exempt by virtue of their ownership of EWGs, QFs, and Foreign Utility Companies. The Company is exempt from many of the accounting, record retention, and reporting requirements of the PUHCA.
Environmental Matters
The Company is subject to a wide range of environmental laws induring the development, construction, ownership and operation of projects.facilities. These existing and future laws generally require that governmental permits and approvals be obtained before construction and maintained during operation of facilities. The Company is also subjectobligated to comply with all environmental laws regardingand regulations applicable within each jurisdiction and required to implement environmental programs and procedures to monitor and control risks associated with the protectionconstruction, operation and decommissioning of wildlife, including migratory birds, eagles, threatened and endangered species.regulated or permitted energy assets. Federal and state environmental laws have historically become more stringent over time, although this trend could change with respect toin the future.
A number of regulations that may affect the Company are either recently effective for 2021 or under review for potential revision or rescission in 2021, including the Affordable Clean Energy (ACE) rule, state solar photovoltaic module (solar panel) disposal and recycling regulations, and federal laws underMigratory Bird Treaty Act, or MBTA, incidental take regulations. Government leaders have also considered proposed MBTA legislation. The Company will evaluate the current U.S. presidential administration.impact of the legislation and regulations as they are revised but cannot fully predict the impact of each until anticipated revisions and legal challenges are resolved. To the extent that proposed legislation and new or revised regulations restrict or otherwise impact the Company's operations, the proposed legislation and regulations could have a negative impact on the Company's financial performance.
Affordable Clean EnergyRule— The attention in recent years on GHG emissions has resulted in federal regulations and state legislative and regulatory action. In October 2015, the EPA finalized the Clean Power Plan, or the CPP, addressingwhich addressed GHG emissions from existing EGUs. On February 9,electric utility steam generating units. The CPP was challenged in court and in 2016 the U.S. Supreme Court stayed the CPP. In 2019, the EPA published the Affordable Clean Energy, or ACE, rule to replace the CPP. The D.C.ACE rule establishes emission guidelines for states to develop plans to address greenhouse gas emissions from existing power plants. The ACE rule also reinforces the states’ broad discretion in establishing and applying emissions standards to new emission sources. However, on January 19, 2021, the U.S. Court of Appeals for the District of Columbia Circuit heard oral argumentissued a judgment vacating and remanding the ACE rule. The CPP is currently expected to become effective in 2021, barring additional action by the Biden Administration or the U.S. Supreme Court. The reimplementation of the CPP, or a potential replacement of the CPP by the Biden Administration with another program regulating GHG emissions could result in increased operating costs or capital expenses for our conventional power generating facilities.
Proposed and Final State Solar Photovoltaic Module Disposal and Recycling Regulations —On October 1, 2015, California enacted SB 489, which authorized California’s Department of Toxic Substances Control ("DTSC") to adopt regulations to designate discarded photovoltaic modules, which are classified as hazardous waste, as universal waste subject to universal waste management. On April 19, 2019, the department proposed regulations that would allow discarded photovoltaic modules to be managed as universal waste. The final regulations were approved by the CA Office of Administrative Law in September 2020 and became effective January 1, 2021. DTSC issued the final regulatory text in April 2020 and the regulations became effective January 1, 2021.
In January 2021, the State of Hawaii issued a public notice of proposed rule changes which amongst other items, include proposed new solar panel universal waste rule. This proposed rule would create a new universal waste category for solar panels and allow solar panel waste management to be conducted under the existing regulatory framework.
Proposed Federal MBTA Incidental Take Legislation and Regulations — On January 15, 2020, the House Natural Resources Committee voted to advance a bill that would reinstate the interpretation that incidental take is prohibited under the MBTA, overriding the Trump-administration Solicitor’s Opinion M-37050 that held the MBTA only applies to intentional takings.The bill also develops a general permitting program that covers incidental take of migratory birds. To the extent that electric generation takes migratory birds, it typically is incidental to its operations.
On January 7, 2021, the U.S. Fish and Wildlife Service (“FWS”) published a final rule codifying the Solicitor’s Opinion M-37050 defining the scope of certain prohibitions under the MBTA.The final rule clarifies that criminal liability for pursuing, hunting, taking, capturing, or killing or attempting to take, capture or kill migratory birds is limited to actions directed at migratory birds, their nests, or their eggs.Under the final rule, these prohibitions do not extend to actions that only incidentally take or kill migratory birds as a result of otherwise lawful activities.However, the final rule and the underlying Solicitor’s Opinion have both been subject to legal challenges.On August 11, 2020, the Southern District Court in New York vacated the Solicitor's Opinion, finding there was not an adequate legal basis for the policy changes articulated in the guidance
document.In addition, on January 19, 2021, environmental groups filed a lawsuit in the U.S. District Court for the Southern District of New York arguing that the FWS’s January 2021 final rule improperly relied on the legal challengesvacated Solicitor’s Opinion, violates the MBTA, and should be vacated. Finally, on January 20, 2021, President Biden issued an executive order to review and consider suspending, revising, or rescinding agency actions taken between January 20, 2017 and January 20, 2021 determined to be inconsistent with certain public health and environmental goals.This includes a review of both the Solicitor’s Opinion and the FWS’s January 2021 final rule.In response to this directive, on February 9, 2021, the FWS delayed the effective date of the January 2021 final rule until March 8, 2021 and requested public comment to inform its review and a potential extended delay. A return to the CPPposition that incidental take is prohibited under the MBTA, or the development of legislation or regulations contrary to the FWS’s January 2021 rule, could increase potential liability and impose additional permitting requirements on our operations.
State Migratory Bird Incidental Take Legislation and Regulations —In 2019, Assembly Member Kalra introduced AB 454 to protect migratory bird species in September 2016. AtCalifornia. This new bill was intended to backstop the EPA's request,MBTA. The bill, which sunsets on January 20, 2025, makes it unlawful to take or possess any migratory bird in California except as provided by pre-2017 federal guidance. The bill was approved by the D.C. Circuit agreed on April 28, 2017 to hold the caseState Legislature and signed into law by Governor Newsom in abeyance. On October 16, 2017, the EPA proposed a rule to repeal the CPP. Accordingly, the Company believes the CPP is not likely to survive.2019.
Customers
The Company sells its electricity and environmental attributes, including RECs, primarily to local utilities under long-term, fixed-price PPAs. During the year ended December 31, 2017,2020, the Company derived approximately 41%34% of its consolidated revenue from Southern California Edison, or SCE, and approximately 23%18% of its consolidated revenue from Pacific Gas and Electric, or PG&E.
EmployeesHuman Capital
The Company employs Christopher Sotos as its President and Chief Executive Officer and Chad Plotkin as its Senior Vice President and Chief Financial Officer. As of December 31, 2017, other than Messrs. Sotos and Plotkin,2020, the Company did not employ anyhad 301 employees, 56 of which are in Corporate and 245 of which are in the Thermal business. The Company also depends upon personnel of CEG for the provision of management, administration, O&M and certain other services at certain of the Company's renewable generation facilities.
The Company focuses on attracting, developing and retaining a team of highly talented and motivated employees. The majorityCompany regularly conducts assessments of its compensation and benefit practices and pay levels to help ensure that staff members are compensated fairly and competitively. The Company devotes extensive resources to staff development and training, including tuition assistance for career-enhancing academic and professional programs. Employee performance is measured in part based on goals that are aligned with the Company's annual objectives. The Company recognizes that its success is based on the talents and dedication of those it employs, and the Company is highly invested in their success. See "Environmental, Social and Governance (ESG)" below for a discussion of the Company's commitment to the health and safety of the Company's employees.
The Company is committed to maintaining a workplace that acknowledges, encourages, and values diversity and inclusion. The Company believes that individual differences, experiences, and strengths enrich the culture and fabric of its organization. Having employees with backgrounds and orientations that reflect a variety of viewpoints and experiences also helps the Company to better understand the needs of its customers and the communities in which it operates.
By leveraging the multitude of backgrounds and perspectives of its team and developing ongoing relationships with diverse vendors, the Company achieves a collective strength that enhances the work place and makes the Company a better business partner for its customers and others with a stake in the Company’s success.
In 2020, the Company launched its Equity, Partnership & Inclusion Council, or EPIC. As part of its commitment, the Company provides education on topics related to diversity, inclusion, and anti-racism. The Company also identified three areas of focus – Our People, Our Product & Customers and Our Purchasing. With the involvement of its employees, EPIC is advancing efforts in each of these areas to identify and implement opportunities for the Company to address equity, partnership and inclusion issues in our business activities.
Our People focuses on education and training; diversity, equity and inclusion policies and recruitment strategies; community and industry partnerships; and maintaining high employee engagement and retention.
Our Product & Customers focuses on identifying and eliminating any sales practices that could have a discriminatory impact and creating program development for low-income customers.
Our Purchasing focuses on establishing a non-discriminatory practices standard for the Company’s suppliers, diverse vendor sourcing and benchmarking.
In addition to the personnel who manageof CEG, the Company relies on other third-party service providers in the daily operations of certain of the Company's renewable and conventional facilities.
Environmental, Social and Governance (ESG)
The Company is committed to engaging with its stakeholders on environmental, social and governance, or ESG, matters in a proactive, holistic and integrated manner. The Company strives to provide recent, credible and comparable data to ESG agencies while engaging institutional investors and investor advocacy organizations around ESG issues. The Company's Corporate Governance, Conflicts and Nominating Committee reviews developing trends and emerging ESG matters, as well as the Company’s strategies, activities policies and communications regarding ESG matters, and makes recommendations to the Company's Board of Directors regarding potential actions by the Company.
The Company has issued $1.1 billion of corporate green bonds under a green bond framework that applies the net proceeds to finance or refinance, in part or in full, new and existing projects and assets meeting certain criteria focused on the supply of energy from renewable resources, including solar energy and wind energy. The Company's projects and alignment of its Green Bond Principles (2018) are reviewed by Sustainalytics, an outside consultant with recognized expertise in ESG research and analysis.
The Company includes safety performance goals in the annual incentive plan for its management and the Company arehad zero fatalities in 2020. In response to the ongoing coronavirus (COVID-19) pandemic, the Company has implemented preventative measures and developed corporate and regional response plans to protect the health and safety of its employees, customers and other business counterparties, while supporting the Company’s suppliers and customers’ operations to the best of NRG or third parties managedits ability in the circumstances. The Company also has modified certain business practices (including discontinuing all non-essential business travel, implementing a temporary work-from-home policy for employees who can execute their work remotely and encouraging employees to adhere to local and regional social distancing, more stringent hygiene and cleaning protocols across the Company’s facilities and operations and self-quarantining recommendations) to support efforts to reduce the spread of COVID-19 and to conform to government restrictions and best practices encouraged by NRG,governmental and their services are providedregulatory authorities. The Company continues to evaluate these measures, response plans and business practices in light of the evolving effects of COVID-19.
As discussed in greater detail above, the Company has focused its diversity, equity and inclusion efforts in three areas – Our People, Our Product & Customers and Our Purchasing – through its launch of EPIC. With the involvement of the Company’s employees, EPIC is advancing efforts in each of these areas to identify and implement opportunities for the Company's benefit under the Management Services AgreementCompany to address equity, partnership and project operations and maintenance agreements with NRG as describedinclusion issues in Item 15 — Note 15, Related Party Transactions, to the Consolidated Financial Statements.its business activities.
Available Information
The Company's annual reports on Form 10-K, quarterly reports on Form 10-Q, current reports on Form 8-K, and amendments to those reports filed or furnished pursuant to section 13(a) or 15(d) of the Exchange Act are available free of charge through the "Investor Relations" section of the Company's website, www.nrgyield.comwww.clearwayenergy.com, as soon as reasonably practicable after they are electronically filed with, or furnished to, the SEC. The Company also routinely posts press releases, presentations, webcasts, and other information regarding the Company on its website. The information posted on the Company's website is not a part of this report.
Item 1A — Risk Factors
Risks Related to the Proposed NRG TransactionSummary of Risk Factors
The Company may not realize the anticipated benefits of the NRG Transaction.
On February 6, 2018, Global Infrastructure Partners, or GIP, entered into a purchase and sale agreement with NRG for the acquisition of NRG’s full ownership interest in the Company and NRG’s renewable energy development and operations platform. Also on February 6, 2018, the Company entered into a consent and indemnity agreement with NRG and GIP in connection with the purchase and sale agreement between NRG and GIP. The consent and indemnity agreement and the purchase and sale agreement are collectively referred to as the NRG Transaction. Consummation of the NRG TransactionCompany’s business is subject to a number of conditions, including receipt of certain contractual consentsnumerous risks and regulatory approvals from certain regulatory agencies, including approval by FERC and approvals from certain state regulatory agencies. While the parties have begun the process of notifying agencies and obtaining regulatory approvals and consents, there is no assurance that the parties will be able to obtain the requisite regulatory approvals or consents to satisfy the closing conditions. Additionally, the NRG Transaction requires the Company’s consent which is conditioned upon a number of items, all of which may not be met on a timely basis, or at all.
If the NRG Transaction is consummated, GIP may exercise substantial influence over the Company’s policies and procedures and exercise substantial influence over the Company’s Board, management and the types of third party acquisitions the Company makes. The Company may not identify future acquisitions or be able to secure financing on attractive terms or at all for future acquisitions and the Company may not realize the anticipated benefits of the financing support to be provided by GIP, which includes a $1.5 billion backstop credit facility to manage any change-of-control costs associated with the Company’s corporate debt and up to $400 millionuncertainties, discussed in financing support for the Company’s acquisition of the Carlsbad Energy Center. Further, GIP may not be able to maintain the Company’s current relationships with customers, counterparties, suppliers, lenders and other third parties. Uncertainty about the effect of the NRG Transaction may negatively affect the Company’s relationship with its counterparties and have a significant impact on the Company’s business. The foregoing risks may adversely affect the Company’s operational performance or limit the Company’s growth prospects, including its ability to grow its dividend per share.
Following the consummation of the NRG Transaction, GIP and its affiliates will control the Company and have the ability to designate a majority of the members of the Company’s Board.
The governance agreements to be entered into among NRG, the Company, GIP and its affiliates in connection with the NRG Transaction provide GIP the ability to designate a majority of the Company’s Board to the Company’s Corporate Governance, Conflicts and Nominating Committee for nomination for election by the Company’s stockholders and also require that the Company and GIP use their commercially reasonable efforts to submit to the Company’s stockholders at the Company’s 2019 Annual Meeting of Stockholders a charter amendment to classify the Company’s Board into two classes (with the independent directors and directors designated by GIP allocated across the two classes). Due to such agreements and GIP's approximate 55.1% combined voting powermore detail in the Company following section. These risks include among others, the completion of the NRG Transaction, the ability of other holders of the Company’s Class A and Class C common stock to exercise control over the corporate governance of the Company will be limited. In addition, due to its approximate 55.1% combined voting power in the Company following the completion of the NRG Transaction, GIP and its affiliates will have a substantial influence on the Company’s affairs and its voting power will constitute a large percentage of any quorum of the Company’s stockholders voting on any matter requiring the approval of the Company’s stockholders, including the classification of the Board of Directors. GIP may hold certain interests that are different from those of the Company or other holders of the Company’s Class A and Class C common stock and there is no assurance that GIP will exercise its control over the Company in a manner that is consistent with the Company’s interests or those of the holders of the Company’s Class A and Class C common stock.key risks:
Risks Related to the Company'sCompany’s Business
•The ongoing coronavirus (COVID-19) outbreak or any other pandemic could adversely affect the Company’s business, financial condition and results of operations.
•Certain facilities are newly constructed and may not perform as expected.
Certain of the Company's conventional and renewable assets are newly constructed. •The ability of these facilities to meet the Company's performance expectations is subject to the risks inherent in newly constructed power generation facilities and the construction of such facilities, including, but not limited to, degradation of equipment in excess of the Company's expectations, system failures, and outages. The failure of these facilities to perform as the Company expects could have a material adverse effect on the Company's business, financial condition, results of operations, cash flows and its ability to pay dividends to holders of the Company's common stock.
Pursuant to the Company's cash dividend policy, the Company intends to distribute a significant amount of the CAFD through regular quarterly distributions and dividends, and the Company's ability to grow and make acquisitions through cash on hand could be limited.
The Company expects to distribute a significant amount of the CAFD each quarter and to rely primarily upon external financing sources, including the issuance of debt and equity securities and, if applicable, borrowings under the Company's revolving credit facility to fund acquisitions and growth capital expenditures. The Company may be precluded from pursuing otherwise attractive acquisitions if the projected short-term cash flow from the acquisition or investment is not adequate to service the capital raised to fund the acquisition or investment, after giving effect to the Company's available cash reserves. To the extent the Company issues additional equity securities in connection with any acquisitions or growth capital expenditures, the payment of dividends on these additional equity securities may increase the risk that the Company will be unable to maintain or increase its per share dividend. The incurrence of bank borrowings or other debt by NRG Yield Operating LLC or by the Company's project-level subsidiaries to finance the Company’s growth strategy will result in increased interest expense and the imposition of additional or more restrictive covenants, which, in turn, may impact the cash distributions the Company receives to distribute to holders of the Company’s common stock.
•The Company may not be able to effectively identify or consummate any future acquisitions on favorable terms, or at all.
The•Counterparties to the Company's business strategy includes growth throughofftake agreements may not fulfill their obligations and, as the acquisitions of additional generation assets (including through corporate acquisitions). This strategy depends on the Company’s ability to successfully identify and evaluate acquisition opportunities and consummate acquisitions on favorable terms. However, the number of acquisition opportunities is limited. In addition,contracts expire, the Company will compete with other companies for these limited acquisition opportunities, which may increase the Company’s cost of making acquisitions or cause the Company to refrain from making acquisitions at all. Some of the Company’s competitors for acquisitions are much larger than the Company with substantially greater resources. These companies maynot be able to pay more for acquisitions and may be able to identify, evaluate, bid for and purchase a greater numberreplace them with agreements on similar terms in light of assets thanincreasing competition in the Company’s financial or human resources permit. Ifmarkets in which the Company is unable to identify and consummate future acquisitions, it will impede the Company’s ability to execute its growth strategy and limit the Company’s ability to increase the amount of dividends paid to holders of the Company’s common stock.operates.
Furthermore, the Company’s ability to acquire future renewable facilities may depend on the viability of renewable assets generally. These assets currently are largely contingent on public policy mechanisms including ITCs, cash grants, loan guarantees, accelerated depreciation, RPS and carbon trading plans. These mechanisms have been implemented at the state and federal levels to support the development of renewable generation, demand-side and smart grid and other clean infrastructure technologies. The availability and continuation of public policy support mechanisms will drive a significant part of the economics and viability of the Company’s growth strategy and expansion into clean energy investments.
•The Company’s ability to effectively consummate future acquisitions will also depend on the Company’s ability to arrange the required or desired financing for acquisitions.
The Company may not have sufficient availability under the Company’s credit facilities or have access to project-level financing on commercially reasonable terms when acquisition opportunities arise. An inability to obtain the required or desired financing could significantly limit the Company’s ability to consummate future acquisitions and effectuate the Company’s growth strategy. If financing is available, utilization of the Company’s credit facilities or project-level financing for all or a portion of the purchase price of an acquisition could significantly increase the Company’s interest expense, impose additional or more restrictive covenants and reduce CAFD. Similarly, the issuance of additional equity securities as consideration for acquisitions could cause significant stockholder dilution and reduce the Company’s dividends if the acquisitions are not sufficiently accretive. The Company’s ability to consummate future acquisitions may also depend on the Company’s ability to obtain any required regulatory approvals for such acquisitions, including, but not limited to, approval by FERC under Section 203 of the FPA.
Finally, the acquisition of companies and assets are subject to substantial risks, including the failure to identify material problems during due diligence (for which the Company may not be indemnified post-closing), the risk of over-paying for assets (or not making acquisitions on an accretive basis) and the ability to retain customers. Further, the integration and consolidation of acquisitions requires substantial human, financial and other resources and, ultimately, the Company's acquisitions may divert management’s attention from the Company's existing business concerns, disrupt the Company's ongoing business or not be successfully integrated. There can be no assurances that any future acquisitions will perform as expected or that the returns from such acquisitions will support the financing utilized to acquire them or maintain them. As a result, the consummation of acquisitions may have a material adverse effect on the Company's business, financial condition, results of operations, cash flows and ability to pay dividends to holders of the Company’s common stock.
•Even if the Company consummates acquisitions that it believes will be accretive to CAFD per share of Class A common stock and Class C common stock, those acquisitions may decrease the CAFD per share of Class A common stock and Class C common stock as a result of incorrect assumptions in the Company’s evaluation of such acquisitions, unforeseen consequences or other external events beyond the Company’s control.
The acquisition of existing generation assets involves the risk of overpaying for such projects (or not making acquisitions on an accretive basis) and failing to retain the customers of such projects. While the Company will perform due diligence on prospective acquisitions, the Company may not discover all potential risks, operational issues or other issues in such generation assets. Further, the integration and consolidation of acquisitions require substantial human, financial and other resources and, ultimately, the Company’s acquisitions may divert the Company’s management’s attention from its existing business concerns, disrupt its ongoing business or not be successfully integrated. Future acquisitions might not perform as expected or the returns from such acquisitions might not support the financing utilized to acquire them or maintain them. A failure to achieve the financial returns the Company expects when it acquires generation assets could have a material adverse effect on the Company’s ability to grow its business and make cash distributions to its Class A and Class C stockholders. Any failure of the Company’s acquired generation assets to be accretive or difficulty in integrating such acquisition into the Company’s business could have a material adverse effect on the Company’s ability to grow its business and make cash distributions to its Class A and Class C stockholders.
•The Company’s indebtedness could adversely affect its ability to raise additional capital to fund the Company’s operations or pay dividends. It could also expose the Companydividends, and its debt may be adversely affected by changes to, the risk of increased interest rates and limit the Company’s ability to react to changes in the economy or the Company’s industry as well as impact the Company’s results of operations, financial condition and cash flows.
As of December 31, 2017, the Company had approximately $5,897 million of total consolidated indebtedness, $4,376 million of which was incurred by the Company's non-guarantor subsidiaries. In addition, the Company’s share of its unconsolidated affiliates’ total indebtedness and letters of credit outstanding as of December 31, 2017, totaled approximately $777 million and $98 million, respectively (calculated as the Company’s unconsolidated affiliates’ total indebtedness as of such date multiplied by the Company’s percentage membership interest in such assets).
The Company’s substantial debt could have important negative consequences on the Company’s financial condition, including:
increasing the Company’s vulnerability to general economic and industry conditions;
requiring a substantial portionreplacement of, the Company’s cash flow from operations to be dedicated to the payment of principal and interest on the Company’s indebtedness, therefore reducing the Company’s ability to pay dividends to holders of the Company’s capital stock (including the Class A and Class C common stock)London Interbank Offered Rate, or to use the Company’s cash flow to fund its operations, capital expenditures and future business opportunities;LIBOR.
limiting the Company’s ability to enter into long-term power sales or fuel purchases which require credit support;
limiting the Company’s ability to fund operations or future acquisitions;
restricting the Company’s ability to make certain distributions with respect to the Company’s capital stock (including the Class A and Class C common stock) and the ability of the Company’s subsidiaries to make certain distributions to it, in light of restricted payment and other financial covenants in the Company’s credit facilities and other financing agreements;
exposing the Company to the risk of increased interest rates because certain of the Company’s borrowings, which may include borrowings under the Company’s revolving credit facility, are at variable rates of interest;
limiting the Company’s ability to obtain additional financing for working capital including collateral postings, capital expenditures, debt service requirements, acquisitions and general corporate or other purposes; and
limiting the Company’s ability to adjust to changing market conditions and placing it at a competitive disadvantage compared to the Company’s competitors who have less debt.
•The Company's revolving credit facility contains financial and other restrictive covenants that limit the Company’s ability to return capital to stockholders or otherwise engage in activities that may be in the Company’s long-term best interests. The Company’s inability to satisfy certain financial covenants could prevent the Company from paying cash dividends, and the Company’s failure to comply with those and other covenants could result in an event of default which, if not cured or waived, may entitle the related lenders to demand repayment or enforce their security interests, which could have a material adverse effect on the Company’s business, financial condition, results of operations and cash flows. In addition, failure to comply with such covenants may entitle the related lenders to demand repayment and accelerate all such indebtedness.
The agreements governing the Company’s project-level financing contain financial and other restrictive covenants that limit the Company’s project subsidiaries’ ability to make distributions to the Company or otherwise engage in activities that may be in the Company’s long-term best interests. The project-level financing agreements generally prohibit distributions from the project entities to the Company unless certain specific conditions are met, including the satisfaction of certain financial ratios. The Company’s inability to satisfy certain financial covenants may prevent cash distributions by the particular project(s) to it and, the Company’s failure to comply with those and other covenants could result in an event of default which, if not cured or waived may entitle the related lenders to demand repayment or enforce their security interests, which could have a material adverse effect on the Company’s business, results of operations and financial condition. In addition, failure to comply with such covenants may entitle the related lenders to demand repayment and accelerate all such indebtedness. If the Company is unable to make distributions from the Company’s project-level subsidiaries, it would likely have a material adverse effect on the Company’s ability to pay dividends to holders of the Company’s common stock.
Letter of credit facilities to support project-level contractual obligations generally need to be renewed after five to seven years, at which time the Company will need to satisfy applicable financial ratios and covenants. If the Company is unable to renew the Company’s letters of credit as expected or replace them with letters of credit under different facilities on favorable terms or at all, the Company may experience a material adverse effect on its business, financial condition, results of operations and cash flows. Furthermore, such inability may constitute a default under certain project-level financing arrangements, restrict the ability of the project-level subsidiary to make distributions to it and/or reduce the amount of cash available at such subsidiary to make distributions to the Company.
In addition, the Company’s ability to arrange financing, either at the corporate level or at a non-recourse project-level subsidiary, and the costs of such capital, are dependent on numerous factors, including:
general economic and capital market conditions;
credit availability from banks and other financial institutions;
investor confidence in the Company, its partners, NRG, as the Company’s principal stockholder (on a combined voting basis) and manager under the Management Services Agreement, or GIP, as successor to NRG's interests in the Company if the NRG Transaction is consummated, and the regional wholesale power markets;
the Company’s financial performance and the financial performance of the Company subsidiaries;
the Company’s level of indebtedness and compliance with covenants in debt agreements;
maintenance of acceptable project credit ratings or credit quality;
cash flow; and
provisions of tax and securities laws that may impact raising capital.
The Company may not be successful in obtaining additional capital for these or other reasons. Furthermore, the Company may be unable to refinance or replace project-level financing arrangements or other credit facilities on favorable terms or at all upon the expiration or termination thereof. The Company's failure, or the failure of any of the Company’s projects, to obtain additional capital or enter into new or replacement financing arrangements when due may constitute a default under such existing indebtedness and may have a material adverse effect on the Company's business, financial condition, results of operations and cash flows.
Certain of the Company's long-term bilateral contracts result from state-mandated procurements and could be declared invalid by a court of competent jurisdiction.
A significant portion of the Company's revenues are derived from long-term bilateral contracts with utilities that are regulated by their respective states, and have been entered into pursuant to certain state programs. Certain long-term contracts that other companies have with state-regulated utilities have been challenged in federal court and have been declared unconstitutional on the grounds that the rate for energy and capacity established by the contracts impermissibly conflicts with the rate for energy and capacity established by FERC pursuant to the FPA. If certain of the Company's state-mandated agreements with utilities are ever held to be invalid, the Company may be unable to replace such contracts, which could have a material adverse effect on the Company's business, financial condition, results of operations and cash flows.
The generationoperation of electric energy from solar and wind energy sourcesgeneration facilities depends heavily on suitable meteorological conditions.
If solar or wind conditions are unfavorable, the Company's electricity generation and revenue from renewable generation facilities may be substantially below the Company's expectations. The electricity produced and revenues generated by a solar or wind energy generation facility is highly dependent on suitable solar or wind conditions, as applicable, and associated weather conditions, which are beyond the Company's control. Furthermore, components of the Company's systems, such as solar panels and inverters, could be damaged by severe weather, such as hailstorms or tornadoes. In addition, replacement and spare parts for key components may be difficult or costly to acquire or may be unavailable. Unfavorable weather and atmospheric conditions could impair the effectiveness of the Company's assets or reduce their output beneath their rated capacity or require shutdown of key equipment, impeding operation of the Company's renewable assets. In addition, climate change may have the long-term effect of changing wind patterns at our projects. Changing wind patterns could cause changes in expected electricity generation. These events could also degrade equipment or components and the interconnection and transmission facilities’ lives or maintenance costs.
Although the Company bases its investment decisions with respect to each renewable generation facility on the findings of related wind and solar studies conducted on-site prior to construction or based on historical conditions at existing facilities, actual climatic conditions at a facility site, particularly wind conditions, may not conform to the findings of these studies and may be affected by variations in weather patterns, including any potential impact of climate change. Therefore, the Company's solar and wind energy facilities may not meet anticipated production levels or the rated capacity of the Company's generation assets, which could adversely affect the business, financial condition, results of operations and cash flows.
Operation of electric generation facilities involves significant risks and hazards customary to the power industry that could have a material adverse effect on the Company's business, financial condition, results of operations and cash flows.
The ongoing operation of the Company's These facilities involves risks that include the breakdown or failure of equipment or processes or performance below expected levels of output or efficiency due to wear and tear, latent defect, design error or operator error or force majeure events, among other things. Operation of the Company's facilities also involves risks that the Company will be unable to transport its products to its customers in an efficient manner due to a lack of transmission capacity. Unplanned outages of generating units, including extensions of scheduled outages due to mechanical failures or other problems, occur from time to time and are an inherent risk of the business. Unplanned outages typically increase operation and maintenance expenses, capital expenditures and may reduce revenues as a result of selling fewer MWh or require the Company to incur significant costs as a result of obtaining replacement power from third parties in the open market to satisfy forwardoperate without long-term power sales obligations. The Company's inability to operate its electric generation assets efficiently, manage capital expenditures and costs and generate earnings and cash flow from the Company's asset-based businesses could have a material adverse effect on the business, financial condition, results of operations and cash flows. While the Company maintains insurance, obtains warranties from vendors and obligates contractors to meet certain performance levels, the proceeds of such insurance, warranties or performance guarantees may not cover the Company's lost revenues, increased expenses or liquidated damages payments should it experience equipment breakdown or non-performance by contractors or vendors.agreements.
Power generation involves hazardous activities, including acquiring, transporting and unloading fuel, operating large pieces of rotating equipment and delivering electricity to transmission and distribution systems.
In addition to natural risks such as earthquake, flood, lightning, hurricane and wind, other hazards, such as fire, explosion, structural collapse and machinery failure are inherent risks in the Company's operations. These and other hazards can cause significant personal injury or loss of life, severe damage to and destruction of property, plant and equipment and contamination of, or damage to, the environment and suspension of operations. The occurrence of any one of these events may result in the Company being named as a defendant in lawsuits asserting claims for substantial damages, including for environmental cleanup costs, personal injury and property damage and fines and/or penalties. The Company maintains an amount of insurance protection that it considers adequate but cannot provide any assurance that the Company's insurance will be sufficient or effective under all circumstances and against all hazards or liabilities to which the Company may be subject. Furthermore, the Company's insurance coverage is subject to deductibles, caps, exclusions and other limitations. A loss for which the Company is not fully insured (which may include a significant judgment against any facility or facility operator) could have a material adverse effect on the Company's business, financial condition, results of operations or cash flows. Further, due to rising insurance costs and changes in the insurance markets, the Company cannot provide any assurance that its insurance coverage will continue to be available at all or at rates or on terms similar to those presently available. Any losses not covered by insurance could have a material adverse effect on the Company's business, financial condition, results of operations and cash flows.
•Maintenance, expansion and refurbishment of electric generation facilities involve significant risks that could result in unplanned power outages or reduced output.
The Company's facilities may require periodic upgrading and improvement. Any unexpected operational or mechanical failure, including failure associated with breakdowns and forced outages, could reduce the Company's facilities' generating capacity below expected levels, reducing the Company's revenues and jeopardizing the Company's ability to pay dividends to holders of its common stock at expected levels or at all. Degradation of the performance of the Company's solar facilities above levels provided for in the related offtake agreements may also reduce the Company's revenues. Unanticipated capital expenditures associated with maintaining, upgrading or repairing the Company's facilities may also reduce profitability.
If the Company makes any major modifications to its conventional power generation facilities, it may be required to install the best available control technology or to achieve the lowest achievable emission rates as such terms are defined under the new source review provisions of the CAA in the future. Any such modifications could likely result in substantial additional capital expenditures. The Company may also choose to repower, refurbish or upgrade its facilities based on its assessment that such activity will provide adequate financial returns. Such facilities require time for development and capital expenditures before commencement of commercial operations, and key assumptions underpinning a decision to make such an investment may prove incorrect, including assumptions regarding construction costs, timing, available financing and future fuel and power prices. These events could have a material adverse effect on the Company's business, financial condition, results of operations and cash flows.
Counterparties to the Company's offtake agreements may not fulfill their obligations and, as the contracts expire, the Company may not be able to replace them with agreements on similar terms in light of increasing competition in the markets in which the Company operates.
A significant portion of the electric power the Company generates is sold under long-term offtake agreements with public utilities or industrial or commercial end-users, with a weighted average remaining duration of approximately 15 years based on CAFD. As of December 31, 2017, the largest customers of the Company's power generation assets, including assets in which the Company has less than a 100% membership interest, were SCE and PG&E, which represented 40% and 23%, respectively, of the net electric generation capacity of the Company's facilities.
If, for any reason, any of the purchasers of power under these agreements are unable or unwilling to fulfill their related contractual obligations or if they refuse to accept delivery of power delivered thereunder or if they otherwise terminate such agreements prior to the expiration thereof, the Company's assets, liabilities, business, financial condition, results of operations and cash flows could be materially and adversely affected. Furthermore, to the extent any of the Company's power purchasers are, or are controlled by, governmental entities, the Company's facilities may be subject to legislative or other political action that may impair their contractual performance.
The power generation industry is characterized by intense competition and the Company's electric generation assets encounter competition from utilities, industrial companies and other independent power producers, in particular with respect to uncontracted output. In recent years, there has been increasing competition among generators for offtake agreements and this has contributed to a reduction in electricity prices in certain markets characterized by excess supply above designated reserve margins. In light of these market conditions, the Company may not be able to replace an expiring or terminated agreement with an agreement on equivalent terms and conditions, including at prices that permit operation of the related facility on a profitable basis. In addition, the Company believes many of its competitors have well-established relationships with the Company's current and potential suppliers, lenders and customers, and have extensive knowledge of its target markets. As a result, these competitors may be able to respond more quickly to evolving industry standards and changing customer requirements than the Company will be able to. Adoption of technology more advanced than the Company's could reduce its competitors' power production costs resulting in their having a lower cost structure than is achievable with the technologies currently employed by the Company and adversely affect its ability to compete for offtake agreement renewals. If the Company is unable to replace an expiring or terminated offtake agreement, the affected facility may temporarily or permanently cease operations. External events, such as a severe economic downturn, could also impair the ability of some counterparties to the Company's offtake agreements and other customer agreements to pay for energy and/or other products and services received.
The Company's inability to enter into new or replacement offtake agreements or to compete successfully against current and future competitors in the markets in which the Company operates could have a material adverse effect on the Company's business, financial condition, results of operations and cash flows.
The Company’s facilities may operate, wholly or partially, without long-term power sales agreements.
The Company’s facilities may operate without long-term power sales agreements for some or all of their generating capacity and output and therefore be exposed to market fluctuations. Without the benefit of long-term power sales agreements for the facilities, the Company cannot be sure that it will be able to sell any or all of the power generated by the facilities at commercially attractive rates or that the facilities will be able to operate profitably. This could lead to less predictable revenues, future impairments of the Company's property, plant and equipment or to the closing of certain of its facilities, resulting in economic losses and liabilities, which could have a material adverse effect on the Company's results of operations, financial condition or cash flows.
A portion of the steam and chilled water produced by the Company's thermal assets is sold at regulated rates, and the revenue earned by the Company's GenConn assets is established each year in a rate case; accordingly, the profitability of these assets is dependent on regulatory approval.
Approximately 378 net MWt of capacity from certain of the Company's thermal assets are sold at rates approved by one or more federal or state regulatory commissions, including the Pennsylvania Public Utility Commission and the California Public Utilities Commission for the thermal assets. Similarly, the revenues related to approximately 380 MW of capacity from the GenConn assets are established each year by the Connecticut Public Utilities Regulatory Authority. While such regulatory oversight is generally premised on the recovery of prudently incurred costs and a reasonable rate of return on invested capital, the rates that the Company may charge, or the revenue that the Company may earn with respect to this capacity are subject to authorization of the applicable regulatory authorities. There can be no assurance that such regulatory authorities will consider all of the costs to have been prudently incurred or that the regulatory process by which rates or revenues are determined will always result in rates or revenues that achieve full recovery of costs or an adequate return on the Company's capital investments. While the Company's rates and revenues are generally established based on an analysis of costs incurred in a base year, the rates the Company is allowed to charge, and the revenues the Company is authorized to earn, may or may not match the costs at any given time. If the Company's costs are not adequately recovered through these regulatory processes, it could have a material adverse effect on the business, financial condition, results of operations and cash flows.
•Supplier and/or customer concentration at certain of the Company's facilities may expose the Company to significant financial credit or performance risks. The Company's operations also depend on key personnel.
The Company often relies on a single contracted supplier or a small number of suppliers for the provision of fuel, transportation of fuel, equipment, technology and/or other services required for the operation of certain facilities. In addition, certain of the Company's suppliers provide long-term warranties with respect to the performance of their products or services. If any of these suppliers cannot perform under their agreements with the Company, or satisfy their related warranty obligations, the Company will need to utilize the marketplace to provide or repair these products and services. There can be no assurance that the marketplace can provide these products and services as, when and where required. The Company may not be able to enter into replacement agreements on favorable terms or at all. If the Company is unable to enter into replacement agreements to provide for fuel, equipment, technology and other required services, it would seek to purchase the related goods or services at market prices, exposing the Company to market price volatility and the risk that fuel and transportation may not be available during certain periods at any price. The Company may also be required to make significant capital contributions to remove, replace or redesign equipment that cannot be supported or maintained by replacement suppliers, which could have a material adverse effect on the business, financial condition, results of operations, credit support terms and cash flows.
In addition, potential or existing customers at the Company’s district energy centers and combined heat and power plants, or the Energy Centers, may opt for on-site systems in lieu of using the Company’s Energy Centers, either due to corporate policies regarding the allocation of capital, unique situations where an on-site system might in fact prove more efficient, because of previously committed capital in systems that are already on-site, or otherwise. At times, the Company relies on a single customer or a few customers to purchase all or a significant portion of a facility's output, in some cases under long-term agreements that account for a substantial percentage of the anticipated revenue from a given facility.
The failure of any supplier to fulfill its contractual obligations to the Company or the Company’s loss of potential or existing customers could have a material adverse effect on its financial results. Consequently, the financial performance of the Company's facilities is dependent on the credit quality of, and continued performance by, the Company's suppliers and vendors and the Company’s ability to solicit and retain customers.
•The Company currently owns, and in the future may acquire, certain assets in which the Company has limited control over management decisions and its interests in such assets may be subject to transfer or other related restrictions.
As described in Item 15 — Note 5, Investments Accounted for by the Equity Method and Variable Interest Entities, the Company has limited control over the operation of certain of its assets, because the Company beneficially owns less than a majority of the membership interests in such assets. The Company may seek to acquire additional assets in which it owns less than a majority of the related membership interests in the future. In these investments, the Company will seek to exert a degree of influence with respect to the management and operation of assets in which it owns less than a majority of the membership interests by negotiating to obtain positions on management committees or to receive certain limited governance rights, such as rights to veto significant actions. However, the Company may not always succeed in such negotiations. The Company may be dependent on its co-venturers to operate such assets. The Company's co-venturers may not have the level of experience, technical expertise, human resources management and other attributes necessary to operate these assets optimally. In addition, conflicts of interest may arise in the future between theCompany and its stockholders, on the one hand, and the Company's co-venturers, on the other hand, where the Company's co-venturers' business interests are inconsistent with the interests of the Company and its stockholders. Further, disagreements or disputes between the Company and its co-venturers could result in litigation, which could increase expenses and potentially limit the time and effort the Company's officers and directors are able to devote to the business.
The approval of co-venturers may also be required for the Company to receive distributions of funds from assets or to sell, pledge, transfer, assign or otherwise convey its interest in such assets, or for the Company to acquire NRG's interests in such co-ventures as an initial matter. Alternatively, the Company's co-venturers may have rights of first refusal or rights of first offer in the event of a proposed sale or transfer of the Company's interests in such assets. These restrictions may limit the price or interest level for interests in such assets, in the event the Company wants to sell such interests.
Furthermore, certain of the Company's facilities are operated by third-party operators, such as First Solar. To the extent that third-party operators do not fulfill their obligations to manage operations of the facilities or are not effective in doing so, the amount of CAFD may be adversely affected.
•The Company's assets are exposed to risks inherent in the use of interest rate swaps and forward fuel purchase contracts and the Company may be exposed to additional risks in the future if it utilizes other derivative instruments.
The Company uses interest rate swaps to manage interest rate risk. In addition, the Company uses forward fuel purchase contracts to hedge its limited commodity exposure with respect to the Company's district energy assets. If the Company elects to enter into such commodity hedges, the related asset could recognize financial losses on these arrangements as a result of volatility in the market values of the underlying commodities or if a counterparty fails to perform under a contract. If actively quoted market prices and pricing information from external sources are not available, the valuation of these contracts would involve judgment or the use of estimates. As a result, changes in the underlying assumptions or use of alternative valuation methods could affect the reported fair value of these contracts. If the values of these financial contracts change in a manner that the Company does not anticipate, or if a counterparty fails to perform under a contract, it could harm the business, financial condition, results of operations and cash flows.
The Company's business is subject to restrictions resulting from environmental, health and safety laws and regulations.
The Company is subject to various federal, state and local environmental and health and safety laws and regulations. In addition, the Company may be held primarily or jointly and severally liable for costs relating to the investigation and clean-up of any property where there has been a release or threatened release of a hazardous regulated material as well as other affected properties, regardless of whether the Company knew of or caused the release. In addition to these costs, which are typically not limited by law or regulation and could exceed an affected property's value, the Company could be liable for certain other costs, including governmental fines and injuries to persons, property or natural resources. Further, some environmental laws provide for the creation of a lien on a contaminated site in favor of the government as security for damages and any costs the government incurs in connection with such contamination and associated clean-up. Although the Company generally requires its operators to undertake to indemnify it for environmental liabilities they cause, the amount of such liabilities could exceed the financial ability of the operator to indemnify the Company. The presence of contamination or the failure to remediate contamination may adversely affect the Company's ability to operate the business.
•The Company does not own all of the land on which its power generation or thermal assets are located, which could result in disruption to its operations.
•The Company does not own all of the land on which its power generation or thermal assets are located and the Company is, therefore, subject to the possibility of less desirable terms and increased costs to retain necessary land use if it does not have valid leases or rights-of-way or if such rights-of-way lapse or terminate. Although the Company has obtained rights to construct and operate these assets pursuant to related lease arrangements, the rights to conduct those activitiesCompany's businesses are subject to certain exceptions,
including the term of the lease arrangement. The Company is also at risk of condemnation on land it owns. The loss of these rights, through the Company's inability to renew right-of-way contracts, condemnation or otherwise, may adversely affect the Company's ability to operate its generationphysical, market and thermal infrastructure assets.
The Company’s use and enjoyment of real property rights for its projects may be adversely affected by the rights of lienholders and leaseholders that are superior to those of the grantors of those real property rights to the Company.
Solar and wind projects generally are, and are likely to be, located on land occupied by the project pursuant to long-term easements and leases. The ownership interests in the land subject to these easements and leases may be subject to mortgages securing loans or other liens (such as tax liens) and other easement and lease rights of third parties (such as leases of oil or mineral rights) that were created prior to the project’s easements and leases. As a result, the project’s rights under these easements or leases may be subject, and subordinate, to the rights of those third parties. The Company performs title searches and obtains title insurance to protect itself against these risks. Such measures may, however, be inadequate to protect the Company against all risk of loss of its rights to use the land on which the wind projects are located, which could have a material adverse effect on the Company’s business, financial condition and results of operations.
The electric generation business is subject to substantial governmental regulation and may be adversely affected by changes in laws or regulations, as well as liability under, or any future inability to comply with, existing or future regulations or other legal requirements.
The Company's electric generation business is subject to extensive U.S. federal, state and local laws and regulations. Compliance with the requirements under these various regulatory regimes may cause the Company to incur significant additional costs, and failure to comply with such requirements could result in the shutdown of the non-complying facility, the imposition of liens, fines, and/or civil or criminal liability. Public utilities under the FPA are required to obtain FERC acceptance of their rate schedules for wholesale sales of electric energy, capacity and ancillary services. Except for generating facilities within the footprint of ERCOT which are regulated by the PUCT, all of the Company’s assets make wholesale sales of electric energy, capacity and ancillary services in interstate commerce and are public utilities for purposes of the FPA, unless otherwise exempt from such status. FERC's orders that grant market-based rate authority to wholesale power marketers reserve the right to revoke or revise that authority if FERC subsequently determines that the seller can exercise market power in transmission or generation, create barriers to entry, or engage in abusive affiliate transactions. In addition, public utilities are subject to FERC reporting requirements that impose administrative burdens and that, if violated, can expose the company to criminal and civil penalties or other risks.
The Company's market-based sales will be subject to certain rules prohibiting manipulative or deceptive conduct, and if any of the Company's generating companies are deemed to have violated those rules, they will be subjecteconomic risks relating to potential disgorgementeffects of profits associated with the violation, penalties, suspension or revocation of market based rate authority. If such generating companies were to lose their market-based rate authority, such companies would be required to obtain FERC's acceptance of a cost-of-service rate schedule and could become subject to the significant accounting, record-keeping, and reporting requirements that are imposed on utilities with cost-based rate schedules. This could have a material adverse effect on the rates the Company is able to charge for power from its facilities.climate change.
Most of the Company's assets are operating as EWGs as defined under the PUHCA, or QFs as defined under the PURPA, as amended, and therefore are exempt from certain regulation under the PUHCA and the PURPA. If a facility fails to maintain its status as an EWG or a QF or there are legislative or regulatory changes revoking or limiting the exemptions to the PUHCA, then the Company may be subject to significant accounting, record-keeping, access to books and records and reporting requirements and failure to comply with such requirements could result in the imposition of penalties and additional compliance obligations.
Substantially all of the Company's generation assets are also subject to the reliability standards promulgated by the designated Electric Reliability Organization (currently the North American Electric Reliability Corporation, or NERC) and approved by FERC. If the Company fails to comply with the mandatory reliability standards, it could be subject to sanctions, including substantial monetary penalties and increased compliance obligations. The Company will also be affected by legislative and regulatory changes, as well as changes to market design, market rules, tariffs, cost allocations, and bidding rules that occur in the existing regional markets operated by RTOs or ISOs, such as PJM. The RTOs/ISOs that oversee most of the wholesale power markets impose, and in the future may continue to impose, mitigation, including price limitations, offer caps, non-performance penalties and other mechanisms to address some of the volatility and the potential exercise of market power in these markets. These types of price limitations and other regulatory mechanisms may have a material adverse effect on the profitability of the Company's generation facilities acquired in the future that sell energy, capacity and ancillary products into the wholesale power markets. The regulatory environment for electric generation has undergone significant changes in the last several years due to state and federal policies affecting wholesale competition and the creation of incentives for the addition of large amounts of new renewable generation and, in some cases, transmission assets. These changes are ongoing and the Company cannot predict the future design of the wholesale power markets or the ultimate effect that the changing regulatory environment will have on the
Company's business. In addition, in some of these markets, interested parties have proposed to re-regulate the markets or require divestiture of electric generation assets by asset owners or operators to reduce their market share. Other proposals to re-regulate may be made and legislative or other attention to the electric power market restructuring process may delay or reverse the deregulation process. If competitive restructuring of the electric power markets is reversed, discontinued, or delayed, the Company's business prospects and financial results could be negatively impacted.
The Company is subject to environmental laws and regulations that impose extensive and increasingly stringent requirements on its operations, as well as potentially substantial liabilities arising out of environmental contamination.
The Company's assets are subject to numerous and significant federal, state and local laws, including statutes, regulations, guidelines, policies, directives and other requirements governing or relating to, among other things: protection of wildlife, including threatened and endangered species; air emissions; discharges into water; water use; the storage, handling, use, transportation and distribution of dangerous goods and hazardous, residual and other regulated materials, such as chemicals; the prevention of releases of hazardous materials into the environment; the prevention, presence and remediation of hazardous materials in soil and groundwater, both on and offsite; land use and zoning matters; and workers' health and safety matters. The Company's facilities could experience incidents, malfunctions and other unplanned events that could result in spills or emissions in excess of permitted levels and result in personal injury, penalties and property damage. As such, the operation of the Company's facilities carries an inherent risk of environmental, health and safety liabilities (including potential civil actions, compliance or remediation orders, fines and other penalties), and may result in the assets being involved from time to time in administrative and judicial proceedings relating to such matters. The Company has implemented environmental, health and safety management programs designed to continually improve environmental, health and safety performance. Environmental laws and regulations have generally become more stringent over time. Significant costs may be incurred for capital expenditures under environmental programs to keep the assets compliant with such environmental laws and regulations. If it is not economical to make those expenditures, it may be necessary to retire or mothball facilities or restrict or modify the Company's operations to comply with more stringent standards. These environmental requirements and liabilities could have a material adverse effect on the business, financial condition, results of operations and cash flows.
•Risks that are beyond the Company's control, including but not limited to acts of terrorism or related acts of war, natural disaster, hostile cyber intrusions or other catastrophic events, could have a material adverse effect on the business, financial condition, results of operations and cash flows.
The Company's generation facilities that were acquired or those that the Company otherwise acquires or constructs and the facilities of third parties on which they rely may be targets of terrorist activities, as well as events occurring in response to or in connection with them, that could cause environmental repercussions and/or result in full or partial disruption of the facilities ability to generate, transmit, transport or distribute electricity or natural gas. Strategic targets, such as energy-related facilities, may be at greater risk of future terrorist activities than other domestic targets. Hostile cyber intrusions, including those targeting information systems as well as electronic control systems used at the generating plants and for the related distribution systems, could severely disrupt business operations and result in loss of service to customers, as well as create significant expense to repair security breaches or system damage.
Furthermore, certain of the Company's power generation thermal assets are located in active earthquake zones in California and Arizona, and certain project companies and suppliers conduct their operations in the same region or in other locations that are susceptible to natural disasters. In addition, California and some of the locations where certain suppliers are located, from time to time, have experienced shortages of water, electric power and natural gas. The occurrence of a natural disaster, such as an earthquake, drought, flood or localized extended outages of critical utilities or transportation systems, or any critical resource shortages, affecting the Company or its suppliers, could cause a significant interruption in the business, damage or destroy the Company's facilities or those of its suppliers or the manufacturing equipment or inventory of the Company's suppliers. Any such terrorist acts, environmental repercussions or disruptions or natural disasters could result in a significant decrease in revenues or significant reconstruction or remediation costs, beyond what could be recovered through insurance policies, which could have a material adverse effect on the business, financial condition, results of operations and cash flows.
•The operation of the Company’s businesses is subject to cyber-based security and integrity risk.
Numerous functions affecting the efficient operation of the Company’s businesses depend on the secure and reliable storage, processing and communication of electronic data and the use of sophisticated computer hardware and software systems. The operation of the Company's generating assets rely on cyber-based technologies and, therefore, subject to the risk that such systems could be the target of disruptive actions, particularly through cyber-attack or cyber intrusion, including by computer hackers, foreign governments and cyber terrorists, or otherwise be compromised by unintentional events. As a result, operations could be interrupted, property could be damaged and sensitive customer information could be lost or stolen, causing the Company to incur significant losses of revenues, other substantial liabilities and damages, costs to replace or repair damaged equipment and
damage to the Company's reputation. In addition, the Company may experience increased capital and operating costs to implement increased security for its cyber systems and generating assets.
Government regulations providing incentives for renewable generation could change at any time and such changes may negatively impact the Company's growth strategy.
The Company's growth strategy depends in part on government policies that support renewable generation and enhance the economic viability of owning renewable electric generation assets. Renewable generation assets currently benefit from various federal, state and local governmental incentives such as ITCs, cash grants in lieu of ITCs, loan guarantees, RPS, programs, modified accelerated cost-recovery system of depreciation and bonus depreciation. In December 2015, the U.S. Congress enacted an extension of the 30% solar ITC so that projects that began construction in 2016 through 2019 will continue to qualify for the 30% ITC. Projects beginning construction in 2020 and 2021 will be eligible for the ITC at the rates of 26% and 22%, respectively. The same legislation also extended the 10-year wind PTC for wind projects that began construction in years 2016 through 2019. Wind projects that begin construction in the years 2018 and 2019 are eligible for PTC at 60% and 40% of the statutory rate per kWh, respectively.
Many states have adopted RPS programs mandating that a specified percentage of electricity sales come from eligible sources of renewable energy. However, the regulations that govern the RPS programs, including pricing incentives for renewable energy, or reasonableness guidelines for pricing that increase valuation compared to conventional power (such as a projected value for carbon reduction or consideration of avoided integration costs), may change. If the RPS requirements are reduced or eliminated, it could lead to fewer future power contracts or lead to lower prices for the sale of power in future power contracts, which could have a material adverse effect on the Company's future growth prospects. Such material adverse effects may result from decreased revenues, reduced economic returns on certain project company investments, increased financing costs, and/or difficulty obtaining financing. Furthermore, the ARRA included incentives to encourage investment in the renewable energy sector, such as cash grants in lieu of ITCs, bonus depreciation and expansion of the U.S. DOE loan guarantee program. It is uncertain what loan guarantees may be made by the U.S. DOE loan guarantee program in the future. In addition, the cash grant in lieu of ITCs program only applies to facilities that commenced construction prior to December 31, 2011, which commencement date may be determined in accordance with the safe harbor if more than 5% of the total cost of the eligible property was paid or incurred by December 31, 2011.
If the Company is unable to utilize various federal, state and local government incentives to acquire additional renewable assets in the future, or the terms of such incentives are revised in a manner that is less favorable to the Company, it may suffer a material adverse effect on the business, financial condition, results of operations and cash flows.
•The Company relies on electric interconnectiondistribution and transmission facilities that it does not own or control and that are subject to transmission constraints within a number of the Company's regions.If these facilities fail to provide the Company with adequate transmission capacity, it may be restricted in its ability to deliver electric power to its customers and may either incur additional costs or forego revenues.
The Company depends on electric interconnection and transmission facilities owned and operated by others to deliver the wholesale power it will sell from its electric generation assets to its customers. A failure or delay in the operation or development of these interconnection or transmission facilities or a significant increase in the cost of the development of such facilities could result in lost revenues. Such failures or delays could limit the amount of power the Company's operating facilities deliver or delay the completion of the Company's construction projects. Additionally, such failures, delays or increased costs could have a material adverse effect on the business, financial condition and results of operations. If a region's power transmission infrastructure is inadequate, the Company's recovery of wholesale costs and profits may be limited. If restrictive transmission price regulation is imposed, the transmission companies may not have a sufficient incentive to invest in expansion of transmission infrastructure. The Company also cannot predict whether interconnection and transmission facilities will be expanded in specific markets to accommodate competitive access to those markets. In addition, certain of the Company's operating facilities' generation of electricity may be curtailed without compensation due to transmission limitations or limitations on the electricity grid's ability to accommodate intermittent electricity generating sources, reducing the Company's revenues and impairing its ability to capitalize fully on a particular facility's generating potential. Such curtailments could have a material adverse effect on the business, financial condition, results of operations and cash flows. Furthermore, economic congestion on transmission networks in certain of the markets in which the Company operates may occur and the Company may be deemed responsible for congestion costs. If the Company were liable for such congestion costs, its financial results could be adversely affected.
•The Company's costs, results of operations, financial condition and cash flows could be adversely impacted by the disruption of the fuel supplies necessary to generate power at its conventional and thermal power generation facilities.
Delivery of fossil fuels to fuel the Company's conventional and thermal generation facilities is dependent upon the infrastructure (including natural gas pipelines) available to serve each such generation facility as well as upon the continuing financial viability of contractual counterparties. As a result, the Company is subject to the risks of disruptions or curtailments in the production of power at these generation facilities if a counterparty fails to perform or if there is a disruption in the fuel delivery infrastructure.
The Company depends on key management employees, the loss of any of which could have a material adverse effect on the Company's financial condition and results of operations.
The Company believes its current operations and future success depend largely on the continued services of the management employees that it employs, in particular Christopher Sotos, the Company’s President and Chief Executive Officer and Chad Plotkin, the Company’s Senior Vice President and Chief Financial Officer. Although the Company currently has access to the resources of NRG, the loss of Mr. Sotos’ or Mr. Plotkin’s services, or other key management personnel employed by the Company in connection with the NRG Transaction or in the future, could have a material adverse effect on the Company’s financial condition and results of operations.
Risks Related to the Company'sCompany’s Relationship with NRGGIP and CEG
NRG
•GIP, through its ownership of CEG, is the Company's controlling stockholder and exercises substantial influence over the Company.The Company is highly dependent on NRG.
NRG owns all of the Company's outstanding Class B and Class D common stock. The Company's outstanding Class B and Class D common stock is entitled to one vote per share and 1/100th of a vote per share, respectively. As a result of its ownership of the Class B and Class D common stock, NRG owns 55.1% of the combined voting power of the Company's common stock as of December 31, 2017. As a result of this ownership, NRG has a substantial influence on the Company's affairs and its voting power will constitute a large percentage of any quorum of the Company's stockholders voting on any matter requiring the approval of the Company's stockholders. Such matters include the election of directors, the adoption of amendments to the Company's restated certificate of incorporation and third amended and restated bylaws and approval of mergers or sale of all or substantially all of its assets. This concentration of ownership may also have the effect of delaying or preventing a change in control of the Company or discouraging others from making tender offers for the Company's shares. In addition, NRG has the right to elect all of the Company's directors. NRG may cause corporate actions to be taken even if their interests conflict with the interests of the Company's other stockholders (including holders of the Company's Class A and Class C common stock). If the NRG Transaction is consummated, GIP will become the Company’s controlling stockholder and, like NRG, will have substantial control and influence over the Company. See the risk factor entitled “Following the consummation of the NRG Transaction, GIP and its affiliates will control the Company and have the ability to designate a majority of the members of the Company’s Board.”CEG.
Furthermore, the Company depends on the management and administration services provided by or under the direction of NRG under the Management Services Agreement. NRG personnel and support staff that provide services to the Company under the Management Services Agreement are not required to, and the Company does not expect that they will, have as their primary responsibility the management and administration of the Company or to act exclusively for the Company and the Management Services Agreement does not require any specific individuals to be provided by NRG. Under the Management Services Agreement, NRG has the discretion to determine which of its employees perform assignments required to be provided to the Company. Any failure to effectively manage the Company's operations or to implement its strategy could have a material adverse effect on the business, financial condition, results of operations and cash flows. The Management Services Agreement will continue in perpetuity, until terminated in accordance with its terms.
The Company also depends upon NRG for the provision of management, administration and certain other services at all of the Company's facilities and contracts with NRG, or its subsidiaries, to procure fuel and sell power for certain of its operating facilities. Any failure by NRG to perform its requirements under these arrangements or the failure by the Company to identify and contract with replacement service providers, if required, could adversely affect the operation of the Company's facilities and have a material adverse effect on the business, financial condition, results of operations and cash flows.
In connection with the proposed NRG Transaction, GIP has agreed to enter into certain agreements with the Company relating to the provision of services and NRG has agreed to enter into certain agreements with the Company relating to transition services and ongoing commercial arrangements. While the provision of transitional services is contemplated under the proposed NRG Transaction, it is uncertain whether, after the transition services end, GIP or its affiliates would continue to provide the same services, or offer the same capabilities and resources, to the Company that the Company currently receives from NRG or whether the Company may have to seek alternative service providers. •The Company may not be able to replicateconsummate future acquisitions from CEG.
•The Company may be unable to terminate the same level of services, capabilities, experience and familiarity with the Company’s business offered by NRG either through GIP or through alternative service providers or on terms or costs similar to those provided by NRG. The loss of services provided by NRG and the benefits offered to the Company through its relationship with NRG, such as management, operational and financing expertise, could have an impact on the Company’s business, financial condition, results of operations and cash flows. See also the risk factor entitled “CEG Master Services Agreement, in certain circumstances.
•If NRGCEG terminates the ManagementCEG Master Services Agreement or defaults in the performance of its obligations under the agreement, or if the transition services to be provided by NRG to the Company in connection with the consummation of the NRG Transaction are inadequate or end, the Company may be unable to contract with a substitute service provider on similar terms, or at all.”
The Company may not be able to consummate future acquisitions from NRG.
Until the NRG Transaction is consummated, if at all, the Company's ability to grow through acquisitions depends, in part, on NRG's ability to identify and present the Company with acquisition opportunities. NRG established the Company to hold and acquire a diversified suite of power generating assets in the U.S. and its territories. Although NRG has agreed to grant the Company a right of first offer with respect to certain power generation assets that NRG may elect to sell in the future, NRG is under no obligation to sell any such power generation assets or to accept any related offer from the Company. In addition, NRG has not agreed to commit any minimum level of dedicated resources for the pursuit of renewable power-related acquisitions. There are a number of factors which could materially and adversely impact the extent to which suitable acquisition opportunities are made available from NRG, including:
the same professionals within NRG's organization that are involved in acquisitions that are suitable for the Company have responsibilities within NRG's broader asset management business, which may include sourcing acquisition opportunities for NRG. Limits on the availability of such individuals will likewise result in a limitation on the availability of acquisition opportunities for the Company; and
in addition to structural limitations, the question of whether a particular asset is suitable is highly subjective and is dependent on a number of factors including an assessment by NRG relating to the Company's liquidity position at the time, the risk profile of the opportunity and its fit with the balance of the Company's then current operations and other factors. If NRG determines that an opportunity is not suitable for the Company, it may still pursue such opportunity on its own behalf, or on behalf of another NRG affiliate.
In making these determinations, NRG may be influenced by factors that result in a misalignment with the Company's interests or conflict of interest.
The departure of some or all of NRG's employees could prevent the Company from achieving its objectives.
The Company depends on the diligence, skill and business contacts of NRG's professionals and the information and opportunities they generate during the normal course of their activities. Furthermore, approximately 24% of NRG's employees at the Company's generation plants are covered by collective bargaining agreements as of December 31, 2017. The Company's future success will depend on the continued service of these individuals, who are not obligated to remain employed with NRG, or otherwise successfully renegotiate their collective bargaining agreements when such agreements expire or otherwise terminate. NRG has experienced departures of key professionals and personnel in the past and may do so if the NRG Transaction is consummated, and the Company cannot predict the impact that any such departures will have on its ability to achieve its objectives. The Management Services Agreement does not require NRG to maintain the employment of any of its professionals or to cause any particular professional to provide services to the Company or on its behalf. The departure of a significant number of NRG's professionals or a material portion of the NRG employees who work at any of the Company's facilities for any reason, or the failure to appoint qualified or effective successors in the event of such departures, could have a material adverse effect on the Company's ability to achieve its objectives.
The Company's organizational and ownership structure may create significant conflicts of interest that may be resolved in a manner that is not in the best interests of the Company or the best interests of holders of its Class A and Class C common stock and that may have a material adverse effect on the business, financial condition, results of operations and cash flows.
The Company's organizational and ownership structure involves a number of relationships that may give rise to certain conflicts of interest between the Company and holders of its Class A and Class C common stock, on the one hand, and NRG, on the other hand. Pursuant to the Management Services Agreement with NRG, certain of the Company's executive officers are shared NRG executives and devote their time to both the Company and NRG as needed to conduct the respective businesses. Although the Company's directors and executive officers owe fiduciary duties to the Company's stockholders, these shared NRG executives have fiduciary and other duties to NRG, which duties may be inconsistent with the Company's best interests and holders of the Company's Class A and Class C common stock. In addition, NRG and its representatives, agents and affiliates have access to the Company's confidential information. Although some of these persons are subject to confidentiality obligations pursuant to confidentiality agreements or implied duties of confidence, the Management Services Agreement does not contain general confidentiality provisions.
Additionally, all of the Company's executive officers continue to have economic interests in NRG and, accordingly, the benefit to NRG from a transaction between the Company and NRG will proportionately inure to their benefit as holders of economic interests in NRG. NRG is a related person under the applicable securities laws governing related person transactions and may have interests which differ from the Company's interests or those of holders of the Class A and Class C common stock, including with respect to the types of acquisitions made, the timing and amount of dividends by the Company, the reinvestment of returns generated by the Company's operations, the use of leverage when making acquisitions and the appointment of outside advisors and service providers. Any material transaction between the Company and NRG will be subject to the Company's related person transaction policy, which will require prior approval of such transaction by the Company's Corporate Governance, Conflicts and Nominating Committee. Those of the Company's executive officers who have economic interests in NRG may be conflicted when advising the Company's Corporate Governance, Conflicts and Nominating Committee or otherwise participating in the negotiation or approval of such transactions. These executive officers have significant project- and industry-specific expertise that could prove beneficial to the Company's decision-making process and the absence of such strategic guidance could have a material adverse effect on the Corporate Governance, Conflicts and Nominating Committee's ability to evaluate any such transaction. Furthermore, the Corporate Governance, Conflicts and Nominating Committee and the Company's related person transaction approval policy may not insulate the Company from derivative claims with respect to related person transactions and the conflicts of interest described in this risk factor. Regardless of the merits of such claims, the Company may be required to expend significant management time and financial resources in the defense thereof. Additionally, to the extent the Company fails to appropriately deal with any such conflicts, it could negatively impact the Company's reputation and ability to raise additional funds and the willingness of counterparties to do business with the Company, all of which could have a material adverse effect on the business, financial condition, results of operations and cash flows.
The Company may be unable or unwilling to terminate the Management Services Agreement.
The Management Services Agreement provides that the Company may terminate the agreement upon 30 days prior written notice to NRG upon the occurrence of any of the following: (i) NRG defaults in the performance or observance of any material term, condition or covenant contained therein in a manner that results in material harm to the Company and the default continues unremedied for a period of 30 days after written notice thereof is given to NRG; (ii) NRG engages in any act of fraud, misappropriation of funds or embezzlement that results in material harm to the Company; (iii) NRG is grossly negligent in the performance of its duties under the agreement and such negligence results in material harm to the Company; or (iv) upon the happening of certain events relating to the bankruptcy or insolvency of NRG. Furthermore, if the Company requests an amendment to the scope of services provided by NRG under the Management Services Agreement and is not able to agree with NRG as to a change to the service fee resulting from a change in the scope of services within 180 days of the request, the Company will be able to terminate the agreement upon 30 days prior notice to NRG. The Company will not be able to terminate the agreement for any other reason, including if NRG experiences a change of control, and the agreement continues in perpetuity, until terminated in accordance with its terms. If NRG's performance does not meet the expectations of investors, and the Company is unable to terminate the Management Services Agreement, the market price of the Class A and Class C common stock could suffer.
If NRG terminates the Management Services Agreement or defaults in the performance of its obligations under the agreement, or if the transition services to be provided by NRG to the Company in connection with the consummation of the NRG Transaction are inadequate or end, the Company may be unable to contract with a substitute service provider on similar terms, or at all.
The Company relies on NRG to provide management services under the Management Services Agreement and has limited executive or senior management personnel independent from NRG. The Management Services Agreement provides that NRG may terminate the agreement upon 180 days prior written notice of termination to the Company if it defaults in the performance or observance of any material term, condition or covenant contained in the agreement in a manner that results in material harm and the default continues unremedied for a period of 30 days after written notice of the breach is given. If NRG terminates the Management Services Agreement or defaults in the performance of its obligations under the agreement, or if the transition services to be provided by NRG to the Company, in the event the NRG Transaction is consummated, are not adequate or end, the Company may be unable to contract with GIP or a substitute service provider on similar terms or at all, and the costs of substituting service providers may be substantial. In addition, in light of NRG's familiarity with the Company's assets, GIP or a substitute service provider may not be able to provide the same level of service due to lack of pre-existing synergies. If the Company cannot locate a service provider that is able to provide substantially similar services as NRG does under the Management Services Agreement on similar terms, it could have a material adverse effect on the business, financial condition, results of operation and cash flows.
The liability of NRG is limited under the Company's arrangements with it and the Company has agreed to indemnify NRG against claims that it may face in connection with such arrangements, which may lead NRG to assume greater risks when making decisions relating to the Company than it otherwise might if acting solely for its own account.
Under the Management Services Agreement, NRG does not assume any responsibility other than to provide or arrange for the provision of the services described in the Management Services Agreement in good faith. In addition, under the Management Services Agreement, the liability of NRG and its affiliates is limited to the fullest extent permitted by law to conduct involving bad faith, fraud, willful misconduct or gross negligence or, in the case of a criminal matter, action that was known to have been unlawful. In addition, the Company has agreed to indemnify NRG to the fullest extent permitted by law from and against any claims, liabilities, losses, damages, costs or expenses incurred by an indemnified person or threatened in connection with the Company's operations, investments and activities or in respect of or arising from the Management Services Agreement or the services provided by NRG, except to the extent that the claims, liabilities, losses, damages, costs or expenses are determined to have resulted from the conduct in respect of which such persons have liability as described above. These protections may result in NRG tolerating greater risks when making decisions than otherwise might be the case, including when determining whether to use leverage in connection with acquisitions. The indemnification arrangements to which NRG is a party may also give rise to legal claims for indemnification that are adverse to the Company and holders of its common stock.
Certain of the Company’s PPAs and project-level financing arrangements include provisions that would permit the counterparty to terminate the contract or accelerate maturity in the event NRG ceases to control or own, directly or indirectly, a majority of the voting power of the Company.
Certain of the Company’s PPAs and project-level financing arrangements contain change in control provisions that provide the counterparty with a termination right or the ability to accelerate maturity in the event of a change of control of the Company without the counterparty's consent. These provisions are triggered in the event NRG ceases to own, directly or indirectly, capital stock representing more than 50% of the voting power of the Company’s capital stock outstanding on such date, or, in some cases, if NRG ceases to be the majority owner, directly or indirectly, of the applicable project subsidiary. As a result, if NRG ceases to control, or in some cases, own a majority of the voting power of the Company, as is contemplated by the NRG Transaction, the counterparties could terminate such contracts or accelerate the maturity of such financing arrangements. Even though the Company’s consent to the NRG Transaction is conditioned upon the receipt of consents from such counterparties, the Company may have to expend significant resources and funds to obtain the consents of such counterparties to the NRG Transaction and there can be no assurance that such counterparties will provide their consents at all. The termination of any of the Company’s PPAs or the acceleration of the maturity of any of the Company’s project-level financing could have a material adverse effect on the Company’s business, financial condition, results of operations and cash flow.
•The Company is a “controlled company," controlled by NRG,GIP, and as a result, is exempt from certain corporate governance requirements that are designed to provide protection to stockholders of companies that are not controlled companies.
AsRisks Related to Regulation
•The Company's business is subject to restrictions resulting from environmental, health and safety laws and regulations.
•The electric generation business is subject to substantial governmental regulation, including environmental laws, and may be adversely affected by changes in laws or regulations, as well as liability under, or any future inability to comply with, existing or future regulations or other legal requirements.
•Government regulations providing incentives for renewable generation could change at any time and such changes may negatively impact the Company's growth strategy.
•The profitability of December 31, 2017, NRG controls 55.1%certain of the Company's combined voting power andThermal assets is abledependent on regulatory approval.
Risks Related to elect all of the Company's board of directors. As a result, the Company is considered a "controlled company" for the purposes of the NYSE listing requirements. Additionally, the Company is expected to continue to be a "controlled company" if the NRG Transaction is consummated. As a "controlled company," the Company is permitted to, and the Company may, opt out of the NYSE listing requirements that would require (i) a majority of the members of the Company's board of directors to be independent, (ii) that the Company establish a compensation committee and a nominating and governance committee, each comprised entirely of independentCommon Stock
directors, or (iii) an annual performance evaluation of the nominating and governance and compensation committees. The NYSE listing requirements are intended to ensure that directors who meet the independence standards are free of any conflicting interest that could influence their actions as directors. While the Company has elected to have a Compensation Committee and a Corporate Governance, Conflicts and Nominating Committee consisting entirely of independent directors and to conduct an annual performance evaluation of these committees, the majority of the members of the Company’s board of directors are not considered independent. Therefore, the Company’s stockholders may not have the same protections afforded to stockholders of companies that are subject to all of the applicable NYSE listing requirements. It is also possible that the interests of NRG or GIP (in the event the NRG Transaction is consummated) may in some circumstances conflict with the Company's interests and the interests of the holders of the Company's Class A and Class C common stock.
Risks Inherent in an Investment in the Company
•The Company may not be able to continue paying comparable or growing cash dividends to holders of its common stock in the future.
The amount of CAFD principally depends upon the amount of cash the Company generates from its operations, which will fluctuate from quarter to quarter based on, among other things:
the level and timing of capital expenditures the Company makes;
the level of operating and general and administrative expenses, including reimbursements to NRG for services provided to the Company in accordance with the Management Services Agreement;
variations in revenues generated by the business, due to seasonality, weather, or otherwise;
debt service requirements and other liabilities;
fluctuations in working capital needs;
the Company's ability to borrow funds and access capital markets;
restrictions contained in the Company's debt agreements (including project-level financing and, if applicable, corporate debt); and
other business risks affecting cash levels.
As a result of all these factors, the Company cannot guarantee that it will have sufficient cash generated from operations to pay a specific level of cash dividends to holders of its Class A or Class C common stock. Furthermore, holders of the Company's Class A or Class C common stock should be aware that the amount of CAFD depends primarily on operating cash flow, and is not solely a function of profitability, which can be affected by non-cash items.
The Company may incur other expenses or liabilities during a period that could significantly reduce or eliminate its CAFD and, in turn, impair its ability to pay dividends to holders of the Company's Class A or Class C common stock during the period. Because the Company is a holding company, its ability to pay dividends on the Company's Class A or Class C common stock is restricted and further limited by the ability of the Company's subsidiaries to make distributions to the Company, including restrictions under the terms of the agreements governing the Company's corporate debt and project-level financing. The project-level financing agreements generally prohibit distributions from the project entities prior to COD and thereafter prohibit distributions to the Company unless certain specific conditions are met, including the satisfaction of financial ratios. The Company's revolving credit facility also restricts the Company's ability to declare and pay dividends if an event of default has occurred and is continuing or if the payment of the dividend would result in an event of default.
NRG Yield LLC's CAFD will likely fluctuate from quarter to quarter, in some cases significantly, due to seasonality. As a result, the Company may cause NRG Yield LLC to reduce the amount of cash it distributes to its members in a particular quarter to establish reserves to fund distributions to its members in future periods for which the cash distributions the Company would otherwise receive from NRG Yield LLC would be insufficient to fund its quarterly dividend. If the Company fails to cause NRG Yield LLC to establish sufficient reserves, the Company may not be able to maintain its quarterly dividend with respect to a quarter adversely affected by seasonality.
Finally, dividends to holders of the Company's Class A or Class C common stock will be paid at the discretion of the Company's board of directors. The Company's board of directors may decrease the level, or entirely discontinue payment, of dividends.
The Company is a holding company and its only material asset is its interest in NRG Yield LLC, and the Company is accordingly dependent upon distributions from NRG Yield LLC and its subsidiaries to pay dividends and taxes and other expenses.
The Company is a holding company and has no material assets other than its ownership of membership interests in NRG Yield LLC, a holding company that has no material assets other than its interest in NRG Yield Operating LLC, whose sole material assets are the project companies. None of the Company, NRG Yield LLC or NRG Yield Operating LLC has any independent means of generating revenue. The Company intends to continue to cause NRG Yield Operating LLC's subsidiaries to make distributions to NRG Yield Operating LLC and, in turn, make distributions to NRG Yield LLC, and, in turn, to make distributions to the Company in an amount sufficient to cover all applicable taxes payable and dividends, if any, declared by the Company. To the extent that the Company needs funds for a quarterly cash dividend to holders of the Company's Class A and Class C common stock or otherwise, and NRG Yield Operating LLC or NRG Yield LLC is restricted from making such distributions under applicable law or regulation or is otherwise unable to provide such funds (including as a result of NRG Yield Operating LLC's operating subsidiaries being unable to make distributions), it could materially adversely affect the Company's liquidity and financial condition and limit the Company's ability to pay dividends to holders of the Company's Class A and Class C common stock.
•Market interest rates and reports of securities analysts may have an effect on the value of the Company's Class A and Class C common stock.
One of the factors that influences the price of shares of the Company's Class A and Class C common stock is the effective dividend yield of such shares (i.e., the yield as a percentage of the then market price of the Company's shares) relative to market interest rates. An increase in market interest rates, which are currently at low levels relative to historical rates but are steadily rising, may lead investors of shares of the Company's Class A and Class C common stock to expect a higher dividend yield and the Company's inability to increase its dividend as a result of an increase in borrowing costs, insufficient CAFD or otherwise, could result in selling pressure on, and a decrease in the market prices of the Company's Class A and Class C common stock as investors seek alternative investments with higher yield.
If the Company is deemed to be an investment company, the Company may be required to institute burdensome compliance requirements and the Company's activities may be restricted, which may make it difficult for the Company to complete strategic acquisitions or effect combinations.
If the Company is deemed to be an investment company under the Investment Company Act of 1940, or the Investment Company Act, the Company's business would be subject to applicable restrictions under the Investment Company Act, which could make it impracticable for the Company to continue its business as contemplated. The Company believes it is not an investment company under Section 3(b)(1) of the Investment Company Act because the Company is primarily engaged in a non-investment company business. The Company intends to conduct its operations so that the Company will not be deemed an investment company. However, if the Company were to be deemed an investment company, restrictions imposed by the Investment Company Act, including limitations on the Company's capital structure and the Company's ability to transact with affiliates, could make it impractical for the Company to continue its business as contemplated.
•Market volatility may affect the price of the Company's Class A and Class C common stock.
The market pricestock, and future issuance of the Company's Class A and Class Cadditional shares of common stock may fluctuate significantly in response to a numbercause dilution of factors, most of which the Company cannot predict or control, including general market and economic conditions, disruptions, downgrades, credit events and perceived problems in the credit markets; actual or anticipated variations in its quarterly operating results or dividends; changes in the Company's investments or asset composition; write-downs or perceived credit or liquidity issues affecting the Company's assets; market perception of NRG or the proposed NRG Transaction, the Company's business and the Company's assets; the Company's level of indebtedness and/or adverse market reaction to any indebtedness that the Company may incur in the future; the Company's ability to raise capital on favorable terms or at all; loss of any major funding source; the termination of the Management Services Agreement or additions or departures of the Company's executive officers or NRG's key personnel; changes in market valuations of similar power generation companies; and speculation in the press or investment community regarding the Company, NRG or the proposed NRG Transaction.investors' ownership interest.
Securities markets in general have experienced extreme volatility that has often been unrelated to the operating performance of particular companies. Any broad market fluctuations may adversely affect the trading price of the Company's Class A and Class C common stock.
Volatility of market conditions may increase certain of the risks the Company faces.
The capital markets in general are often subject to volatility that is unrelated to the operating performance of particular companies. Market volatility can affect the plans and perspectives of various market participants, including operating entities, consumers and financing providers, and may increase uncertainty and heighten some of the risks the Company faces. The Company and other companies may have to adjust their plans and priorities in light of such volatility.
Risks that may increase as a result of market volatility include, but are not limited to, risks related to access to capital and liquidity and risks related to the performance of third parties, including NRG or GIP. The Company has significant relationships with, and in certain areas depends significantly on, NRG. In particular, NRG provides management and operational services and other support. Until the proposed NRG Transaction is consummated, the Company’s growth strategy depends on its ability to identify and acquire additional facilities from NRG and unaffiliated third parties. The Company interacts with or depends on NRG for many third-party acquisition opportunities and for operations and maintenance support on various pending and completed transactions. As a result, the Company’s financial and operating performance and prospects, including the Company’s ability to grow its dividend per share, may be affected by the performance, prospects, and priorities of NRG (including the consummation of the NRG Transaction), and material adverse developments at NRG or changes in its strategic priorities may materially affect the Company's business, financial condition and results of operations.
Furthermore, any significant disruption to the Company’s ability to access the capital markets, or a significant increase in interest rates, could make it difficult for the Company to successfully acquire attractive projects from third parties and may also limit the Company’s ability to obtain debt or equity financing to complete such acquisitions. If the Company is unable to raise adequate proceeds when needed to fund such acquisitions, the ability to grow the Company’s project portfolio may be limited, which could have a material adverse effect on the Company’s ability to implement its growth strategy and, ultimately, its business, financial condition, results of operations and cash flows.
•Provisions of the Company's charter documents or Delaware law could delay or prevent an acquisition of the Company, even if the acquisition would be beneficial to holders of the Company's Class A and Class C common stock, and could make it more difficult to change management.
Provisions of the Company's restated certificate of incorporation and third amended and restated bylaws may discourage, delay or prevent a merger, acquisition or other change in control that holders of the Company's Class A and Class C common stock may consider favorable, including transactions in which such stockholders might otherwise receive a premium for their shares. This is because these provisions may prevent or frustrate attempts by stockholders to replace or remove members of the Company's management. These provisions include:
a prohibition on stockholder action through written consent;
a requirement that special meetings of stockholders be called upon a resolution approved by a majority of the Company's directors then in office;
advance notice requirements for stockholder proposals and nominations; and
the authority of the board of directors to issue preferred stock with such terms as the board of directors may determine.
Section 203 of the DGCL prohibits a publicly held Delaware corporation from engaging in a business combination with an interested stockholder, generally a person that together with its affiliates owns or within the last three years has owned 15% of voting stock, for a period of three years after the date of the transaction in which the person became an interested stockholder, unless the business combination is approved in a prescribed manner. Additionally, the Company's restated certificate of incorporation prohibits any person and any of its associate or affiliate companies in the aggregate, public utility or holding company from acquiring, other than secondary market transactions, an amount of the Company's Class A or Class C common stock sufficient to result in a transfer of control without the prior written consent of the Company's board of directors. Any such change of control, in addition to prior approval from the Company's board of directors, would require prior authorization from FERC. Similar restrictions may apply to certain purchasers of the Company's securities which are holding companies regardless of whether the Company's securities are purchased in offerings by the Company or NRG, in open market transactions or otherwise. A purchaser of the Company's securities which is a holding company will need to determine whether a given purchase of the Company's securities may require prior FERC approval.
Investors may experience dilution of ownership interest due to the future issuance of additional shares of the Company's Class A or Class C common stock.
The Company is in a capital intensive business, and may not have sufficient funds to finance the growth of the Company's business, future acquisitions or to support the Company's projected capital expenditures. As a result, the Company may require additional funds from further equity or debt financings, including tax equity financing transactions, sales under the ATM Program or sales of preferred shares or convertible debt to complete future acquisitions, expansions and capital expenditures and pay the general and administrative costs of the Company's business. In the future, the Company may issue shares under its ATM Program and the Company's previously authorized and unissued securities, resulting in the dilution of the ownership interests of purchasers of the Company's Class A and Class C common stock. Under the Company's restated certificate of incorporation, the Company is authorized to issue 500,000,000 shares of Class A common stock, 500,000,000 shares of Class B common stock, 1,000,000,000 shares of Class C common stock, 1,000,000,000 shares of Class D common stock and 10,000,000 shares of preferred stock with preferences and rights as determined by the Company's board of directors. The potential issuance of additional shares of common stock or preferred stock or convertible debt may create downward pressure on the trading price of the Company's Class A and Class C common stock.
If securities or industry analysts do not publish or cease publishing research or reports about the Company, the Company's business or the Company's market, or if they change their recommendations regarding the Company's Class A and/or Class C common stock adversely, the stock price and trading volume of the Company's Class A and/or Class C common stock could decline.
The trading market for the Company's Class A and Class C common stock is influenced by the research and reports that industry or securities analysts may publish about the Company, the Company's business, the Company's market or the Company's competitors. If any of the analysts who may cover the Company change their recommendation regarding the Company's Class A and/or Class C common stock adversely, or provide more favorable relative recommendations about the Company's competitors, the price of the Company's Class A and/or Class C common stock would likely decline. If any analyst who covers the Company were to cease coverage of the Company or fail to regularly publish reports on the Company, the Company could lose visibility in the financial markets, which in turn could cause the stock price or trading volume of the Company's Class A and/or Class C common stock to decline.
Future sales of the Company's Class A or Class C common stock by NRG may cause the price of the Company's Class A or Class C common stock to fall.
The market price of the Company's Class A or Class C common stock could decline as a result of sales by NRG of such shares (issuable to NRG upon the exchange of some or all of its NRG Yield LLC Class B or Class D units, respectively) in the market, or the perception that these sales could occur.
The market price of the Company's Class A or Class C common stock may also decline as a result of NRG disposing or transferring some or all of the Company's outstanding Class B or Class D common stock, which disposals or transfers would reduce NRG's ownership interest in, and voting control over, the Company, as contemplated by the proposed NRG Transaction. These sales might also make it more difficult for the Company to sell equity securities at a time and price that the Company deems appropriate. NRG and certain of its affiliates have certain demand and piggyback registration rights with respect to shares of the Company's Class A common stock issuable upon the exchange of NRG Yield LLC's Class B units and/or Class C common stock issuable upon the exchange of NRG Yield LLC's Class D units. The presence of additional shares of the Company's Class A and/or Class C common stock trading in the public market, as a result of the exercise of such registration rights, may have a material adverse effect on the market price of the Company's securities.
Risks Related to Taxation
•The Company's future tax liability may be greater than expected if the Company does not generate NOLs sufficient to offset taxable income, if federal, state and local tax authorities challenge certain of the Company’s tax positions and exemptions or if changes in federal, state and local tax laws occur.
•The Company's ability to use NOLs to offset future income may be limited.
•A valuation allowance may be required for the Company's deferred tax assets.
•Distributions to holders of the Company's Class A and Class C common stock may be taxable.
Risks Related to the Company's Business
The ongoing coronavirus (COVID-19) pandemic or any other pandemic could adversely affect the Company’s business, financial condition and results of operations.
The ongoing coronavirus (COVID-19) outbreak, which the World Health Organization declared as a pandemic on March 11, 2020, has reached every region of the world and has resulted in widespread adverse impacts on the global economy. In response, the Company has modified certain business and workforce practices (including discontinuing all non-essential business travel, implementing a temporary work-from-home policy for employees who can execute their work remotely and encouraging employees to adhere to local and regional social distancing, more stringent hygiene and cleaning protocols across the Company’s facilities and operations and self-quarantining recommendations) to conform to government restrictions and best practices encouraged by governmental and regulatory authorities. However, the quarantine of personnel or the inability to access the Company’s facilities or customer sites could adversely affect the Company’s operations. Also, the Company has a limited number of highly skilled employees for some of its operations. If a large proportion of the Company’s employees in those critical positions were to contract COVID-19 at the same time, the Company would rely upon its business continuity plans in an effort to continue operations at its facilities, but there is no certainty that such measures will be sufficient to mitigate the adverse impact to its operations that could result from shortages of highly skilled employees.
There is considerable uncertainty regarding how long the COVID-19 pandemic will persist and affect economic conditions, as well as whether governmental and other measures implemented to try to slow the spread of the virus, such as large-scale travel bans and restrictions, border closures, quarantines, shelter-in-place orders and business and government shutdowns that exist as of the date of this report will be effective or whether new measures will be implemented or reinstated. Restrictions of this nature may cause the Company, its suppliers and other business counterparties to experience operational delays and delays in the delivery of materials and supplies and may cause milestones or deadlines relating to various projects to be missed. As a result, the Company could experience reductions in its sales and corresponding revenues in future periods. In addition, worsening economic conditions could result in the Company’s customers being unable or unwilling to fulfill their contractual obligations over time, or as contracts expire, to replace them with agreements on similar terms, which would impact the Company’s future financial performance. A significant decline in sales for the output the Company generates, whether due to decreases in consumer demand or disruption to its facilities or otherwise, would have a material adverse effect on the Company’s financial expectations, its financial condition, results of operations and cash flows, its ability to make distributions to its stockholders, the market prices of its common stock and its ability to satisfy its debt service obligations.
As of the date of this report, the Company's efforts to respond to the challenges presented by the conditions described above have allowed the Company to minimize the impacts to its business.
Additionally, the effects of COVID-19 or any other pandemic on the global economy could adversely affect the Company’s ability to access the capital and other financial markets, and if so, the Company may need to consider alternative sources of funding for some of its operations and for working capital, which may increase its cost of, as well as adversely impact its access to, capital. These uncertain economic conditions may also result in the inability of the Company’s customers and other counterparties to make payments to the Company, on a timely basis or at all, which could adversely affect the Company’s financial expectations, its financial condition, results of operations and cash flows, its ability to make distributions to its stockholders, the market prices of its common stock and its ability to satisfy its debt service obligations.
The Company cannot predict the full impact that COVID-19 will have on the Company’s financial expectations, its financial condition, results of operations and cash flows, its ability to make distributions to its stockholders, the market prices of its common stock and its ability to satisfy its debt service obligations at this time, due to numerous uncertainties. The ultimate impacts will depend on future developments, including, among others, the ultimate duration and persistence of the pandemic, the consequences of governmental and other measures designed to prevent the spread of the virus, the ability of governments and health care providers to timely distribute available vaccines and the efficacy of such vaccines, the duration of the outbreak, actions taken by governmental actions taken by authorities, customers, suppliers and other third parties, workforce availability and the timing and extent to which normal economic and operating conditions resume.
Certain facilities are newly constructed and may not perform as expected.
Certain of the Company's conventional and renewable assets are newly constructed. The ability of these facilities to meet the Company's performance expectations is subject to the risks inherent in newly constructed power generation facilities and the construction of such facilities, including, but not limited to, degradation of equipment in excess of the Company's expectations, system failures, and outages. The failure of these facilities to perform as the Company expects could have a material adverse effect on the Company's business, financial condition, results of operations, cash flows and its ability to pay dividends to holders of the Company's common stock.
Pursuant to the Company's cash dividend policy, the Company intends to distribute a significant amount of the CAFD through regular quarterly distributions and dividends, and the Company's ability to grow and make acquisitions through cash on hand could be limited.
The Company expects to distribute a significant amount of the CAFD each quarter and to rely primarily upon external financing sources, including the issuance of debt and equity securities and, if applicable, borrowings under the Company's revolving credit facility to fund acquisitions and growth capital expenditures. The Company may be precluded from pursuing otherwise attractive acquisitions if the projected short-term cash flow from the acquisition or investment is not adequate to service the capital raised to fund the acquisition or investment, after giving effect to the Company's available cash reserves. To the extent the Company issues additional equity securities in connection with any acquisitions or growth capital expenditures, the payment of dividends on these additional equity securities may increase the risk that the Company will be unable to maintain or increase its per share dividend. The incurrence of bank borrowings or other debt by Clearway Energy Operating LLC or by the Company's project-level subsidiaries to finance the Company’s growth strategy will result in increased interest expense and the imposition of additional or more restrictive covenants, which, in turn, may impact the cash distributions the Company receives to distribute to holders of the Company’s common stock.
The Company may not be able to effectively identify or consummate any future acquisitions on favorable terms, or at all.
The Company's business strategy includes growth through the acquisitions of additional generation assets (including through corporate acquisitions). This strategy depends on the Company’s ability to successfully identify and evaluate acquisition opportunities and consummate acquisitions on favorable terms. However, the number of acquisition opportunities is limited. In addition, the Company will compete with other companies for these limited acquisition opportunities, which may increase the Company’s cost of making acquisitions or cause the Company to refrain from making acquisitions at all. Some of the Company’s competitors for acquisitions are much larger than the Company with substantially greater resources. These companies may be able to pay more for acquisitions and may be able to identify, evaluate, bid for and purchase a greater number of assets than the Company’s financial or human resources permit. If the Company is unable to identify and consummate future acquisitions, it will impede the Company’s ability to execute its growth strategy and limit the Company’s ability to increase the amount of dividends paid to holders of the Company’s common stock.
Furthermore, the Company’s ability to acquire future renewable facilities may depend on the viability of renewable assets generally. These assets currently are largely contingent on public policy mechanisms including ITCs, cash grants, loan guarantees, accelerated depreciation, RPS and carbon trading plans. These mechanisms have been implemented at the state and federal levels to support the development of renewable generation, demand-side and smart grid and other clean infrastructure technologies. The availability and continuation of public policy support mechanisms will drive a significant part of the economics and viability of the Company’s growth strategy and expansion into clean energy investments.
Counterparties to the Company's offtake agreements may not fulfill their obligations and, as the contracts expire, the Company may not be able to replace them with agreements on similar terms in light of increasing competition in the markets in which the Company operates.
A significant portion of the electric power the Company generates is sold under long-term offtake agreements with public utilities or industrial or commercial end-users, with a weighted average remaining duration, based on CAFD, of approximately 13 years. As of December 31, 2020, the largest customers of the Company's power generation assets, including assets in which the Company has less than a 100% membership interest, were SCE and PG&E, which represented 34% and 18%, respectively, of total consolidated revenues generated by the Company during the year ended December 31, 2020. On July 1, 2020, PG&E emerged from bankruptcy.
If, for any reason, any of the purchasers of power under these agreements are unable or unwilling to fulfill their related contractual obligations or if they refuse to accept delivery of power delivered thereunder or if they otherwise terminate such agreements prior to the expiration thereof, the Company's assets, liabilities, business, financial condition, results of operations and cash flows could be materially and adversely affected. Furthermore, to the extent any of the Company's power purchasers are, or are controlled by, governmental entities, the Company's facilities may be subject to legislative or other political action that may impair their contractual performance.
The power generation industry is characterized by intense competition and the Company's electric generation assets encounter competition from utilities, industrial companies and independent power producers, in particular with respect to uncontracted output. In recent years, there has been increasing competition among generators for offtake agreements and this has contributed to a reduction in electricity prices in certain markets characterized by excess supply above designated reserve margins. In light of these market conditions, the Company may not be able to replace an expiring or terminated agreement with an agreement on equivalent terms and conditions, including at prices that permit operation of the related facility on a profitable basis. In addition, the Company believes many of its competitors have well-established relationships with the Company's current and potential suppliers, lenders and customers, and have extensive knowledge of its target markets. As a result, these competitors may be able to respond more quickly to evolving industry standards and changing customer requirements than the Company will be able to. The adoption of more advanced technology could reduce its competitors' power production costs resulting in their having a lower cost structure than is achievable with the technologies currently employed by the Company and adversely affect its ability to compete for offtake agreement renewals. If the Company is unable to replace an expiring or terminated offtake agreement, the affected facility may temporarily or permanently cease operations. External events, such as a severe economic downturn or force majeure events, could also impair the ability of some counterparties to the Company's offtake agreements and other customer agreements to pay for energy and/or other products and services received.
The Company's inability to enter into new or replacement offtake agreements or to compete successfully against current and future competitors in the markets in which the Company operates could have a material adverse effect on the Company's business, financial condition, results of operations and cash flows.
The Company’s ability to effectively consummate future acquisitions will also depend on the Company’s ability to arrange the required or desired financing for acquisitions.
The Company may not have sufficient availability under the Company’s credit facilities or have access to project-level financing on commercially reasonable terms when acquisition opportunities arise. An inability to obtain the required or desired financing could significantly limit the Company’s ability to consummate future acquisitions and effectuate the Company’s growth strategy. If financing is available, utilization of the Company’s credit facilities or project-level financing for all or a portion of the purchase price of an acquisition could significantly increase the Company’s interest expense, impose additional or more restrictive covenants and reduce CAFD. Similarly, the issuance of additional equity securities as consideration for acquisitions could cause significant stockholder dilution and reduce the Company’s dividends if the acquisitions are not sufficiently accretive. The Company’s ability to consummate future acquisitions may also depend on the Company’s ability to obtain any required regulatory approvals for such acquisitions, including, but not limited to, approval by FERC under Section 203 of the FPA.
Finally, the acquisition of companies and assets are subject to substantial risks, including the failure to identify material problems during due diligence (for which the Company may not be indemnified post-closing), the risk of overpaying for assets (or not making acquisitions on an accretive basis) and the ability to retain customers. Further, the integration and consolidation of acquisitions requires substantial human, financial and other resources and, ultimately, the Company's acquisitions may divert management’s attention from the Company's existing business concerns, disrupt the Company's ongoing business or not be successfully integrated. There can be no assurances that any future acquisitions will perform as expected or that the returns from such acquisitions will support the financing utilized to acquire them or maintain them. As a result, the consummation of acquisitions may have a material adverse effect on the Company's business, financial condition, results of operations, cash flows and ability to pay dividends to holders of the Company’s common stock.
Even if the Company consummates acquisitions that it believes will be accretive to CAFD per share of Class A common stock and Class C common stock, those acquisitions may decrease the CAFD per share of Class A common stock and Class C common stock as a result of incorrect assumptions in the Company’s evaluation of such acquisitions, unforeseen consequences or other external events beyond the Company’s control.
The acquisition of existing generation assets involves the risk of overpaying for such projects (or not making acquisitions on an accretive basis) and failing to retain the customers of such projects. While the Company will perform due diligence on prospective acquisitions, the Company may not discover all potential risks, operational issues or other issues in such generation assets. Further, the integration and consolidation of acquisitions require substantial human, financial and other resources and, ultimately, the Company’s acquisitions may divert the Company’s management’s attention from its existing business concerns, disrupt its ongoing business or not be successfully integrated. Future acquisitions might not perform as expected or the returns from such acquisitions might not support the financing utilized to acquire them or maintain them. A failure to achieve the financial returns the Company expects when it acquires generation assets could have a material adverse effect on the Company’s ability to grow its business and make cash distributions to its Class A and Class C stockholders. Any failure of the Company’s acquired generation assets to be accretive or difficulty in integrating such acquisition into the Company’s business could have a material adverse effect on the Company’s ability to grow its business and make cash
distributions to its Class A and Class C stockholders.
The Company’s indebtedness could adversely affect its ability to raise additional capital to fund the Company’s operations or pay dividends. It could also expose the Company to the risk of increased interest rates and limit the Company’s ability to react to changes in the economy or the Company’s industry as well as impact the Company’s results of operations, financial condition and cash flows.
As of December 31, 2020, the Company had approximately $7,043 million of total consolidated indebtedness, $5,243 million of which was incurred by the Company's non-guarantor subsidiaries. In addition, the Company’s share of its unconsolidated affiliates’ total indebtedness and letters of credit outstanding as of December 31, 2020, totaled approximately $481 million and $59 million, respectively (calculated as the Company’s unconsolidated affiliates’ total indebtedness as of such date multiplied by the Company’s percentage membership interest in such assets).
The Company’s substantial debt could have important negative consequences on the Company’s financial condition, including:
•increasing the Company’s vulnerability to general economic and industry conditions;
•requiring a substantial portion of the Company’s cash flow from operations to be dedicated to the payment of principal and interest on the Company’s indebtedness, therefore reducing the Company’s ability to pay dividends to holders of the Company’s capital stock (including the Class A and Class C common stock) or to use the Company’s cash flow to fund its operations, capital expenditures and future business opportunities;
•limiting the Company’s ability to enter into long-term power sales or fuel purchases which require credit support;
•limiting the Company’s ability to fund operations or future acquisitions;
•restricting the Company’s ability to make certain distributions with respect to the Company’s capital stock (including the Class A and Class C common stock) and the ability of the Company’s subsidiaries to make certain distributions to it, in light of restricted payment and other financial covenants in the Company’s credit facilities and other financing agreements;
•exposing the Company to the risk of increased interest rates because certain of the Company’s borrowings, which may include borrowings under the Company’s revolving credit facility, are at variable rates of interest;
•limiting the Company’s ability to obtain additional financing for working capital including collateral postings, capital expenditures, debt service requirements, acquisitions and general corporate or other purposes; and
•limiting the Company’s ability to adjust to changing market conditions and placing it at a competitive disadvantage compared to the Company’s competitors who have less debt.
The Company's revolving credit facility contains financial and other restrictive covenants that limit the Company’s ability to return capital to stockholders or otherwise engage in activities that may be in the Company’s long-term best interests. The Company’s inability to satisfy certain financial covenants could prevent the Company from paying cash dividends, and the Company’s failure to comply with those and other covenants could result in an event of default which, if not cured or waived, may entitle the related lenders to demand repayment or enforce their security interests, which could have a material adverse effect on the Company’s business, financial condition, results of operations and cash flows. In addition, failure to comply with such covenants may entitle the related lenders to demand repayment and accelerate all such indebtedness.
The agreements governing the Company’s project-level financing contain financial and other restrictive covenants that limit the Company’s project subsidiaries’ ability to make distributions to the Company or otherwise engage in activities that may be in the Company’s long-term best interests. The project-level financing agreements generally prohibit distributions from the project entities to the Company unless certain specific conditions are met, including the satisfaction of certain financial ratios. The Company’s inability to satisfy certain financial covenants may prevent cash distributions by the particular project(s) to it and, the Company’s failure to comply with those and other covenants could result in an event of default which, if not cured or waived may entitle the related lenders to demand repayment or enforce their security interests, which could have a material adverse effect on the Company’s business, results of operations and financial condition. In addition, failure to comply with such covenants may entitle the related lenders to demand repayment and accelerate all such indebtedness. If the Company is unable to make distributions from the Company’s project-level subsidiaries, it would likely have a material adverse effect on the Company’s ability to pay dividends to holders of the Company’s common stock.
Letter of credit facilities to support project-level contractual obligations generally need to be renewed after five to seven years, at which time the Company will need to satisfy applicable financial ratios and covenants. If the Company is unable to renew the Company’s letters of credit as expected or replace them with letters of credit under different facilities on favorable terms or at all, the Company may experience a material adverse effect on its business, financial condition, results of operations and cash flows. Furthermore, such inability may constitute a default under certain project-level financing arrangements, restrict the ability of the project-level subsidiary to make distributions to it and/or reduce the amount of cash available at such subsidiary to make distributions to the Company.
In addition, the Company’s ability to arrange financing, either at the corporate level or at a non-recourse project-level subsidiary, and the costs of such capital, are dependent on numerous factors, including:
•general economic and capital market conditions;
•credit availability from banks and other financial institutions;
•investor confidence in the Company, its partners, GIP, through CEG, as the Company’s principal stockholder (on a combined voting basis) and the regional wholesale power markets;
•the Company’s financial performance and the financial performance of the Company subsidiaries;
•the Company’s level of indebtedness and compliance with covenants in debt agreements;
•maintenance of acceptable project credit ratings or credit quality;
•cash flow; and
•provisions of tax and securities laws that may impact raising capital.
The Company may not be successful in obtaining additional capital for these or other reasons. Furthermore, the Company may be unable to refinance or replace project-level financing arrangements or other credit facilities on favorable terms or at all upon the expiration or termination thereof. The Company's failure, or the failure of any of the Company’s projects, to obtain additional capital or enter into new or replacement financing arrangements when due may constitute a default under such existing indebtedness and may have a material adverse effect on the Company's business, financial condition, results of operations and cash flows.
Changes in the method of determining the London Interbank Offered Rate, or LIBOR, or the replacement of LIBOR with an alternative reference rate, may adversely affect interest expense related to outstanding debt.
Amounts drawn under the Company's revolving credit facility and certain of the Company's project-level debt facilitiescurrently bear interest at rates based on LIBOR. On July 27, 2017, the Financial Conduct Authority in the United Kingdom announced that it would phase out LIBOR as a benchmark by the end of 2021. On November 30, 2020, ICE Benchmark Administration Limited, the administrator of LIBOR, with the support of the United States Federal Reserve and the United Kingdom’s Financial Conduct Authority, announced plans to consult on ceasing publication of USD LIBOR on December 31, 2021 for only the one week and two month USD LIBOR tenors, and on June 30, 2023 for all other USD LIBOR tenors. While this announcement extends the transition period to June 30, 2023, the United States Federal Reserve concurrently issued a statement advising banks to stop new LIBOR issuances by the end of 2021. In light of these recent announcements, the future of LIBOR at this time is uncertain and any changes in the methods by which LIBOR is determined or regulatory activity related to LIBOR’s phase-out could cause LIBOR to perform differently than in the past or cease to exist. While the Company's revolving credit facility includes a mechanism to amend the facilities to reflect the establishment of an alternative rate of interest upon the occurrence of certain events related to the phase-out of LIBOR, many of the Company's project-level debt facilities and swap arrangements do not. The Company has not yet pursued technical amendments or other contractual alternatives to address this matter with respect to all its existing debt facilities and swap arrangements and is continuing to evaluate the impact of LIBOR’s expected replacement. If no such amendments or other contractual alternatives are established on or prior to the phase-out of LIBOR, interest under the Company's revolving credit facility and other project-level debt facilities will bear interest at higher rates based on the prime rate until such amendments or other contractual amendments are established. Even if the Company has entered into interest rate swaps or other derivative instruments for purposes of managing its interest rate exposure or has otherwise amended its interest rate swaps or other derivative instruments to reflect an alternative reference rate, these hedging strategies may not be effective as a result of the replacement or phasing out of LIBOR, and the Company may incur losses as a result. The potential increase in the Company’s interest expense as a result of the phase-out of LIBOR and uncertainty as to the nature of the alternative reference rates could have an adverse effect on the Company's business, financial condition, results of operations and cash flows.
Certain of the Company's long-term bilateral contracts result from state-mandated procurements and could be declared invalid by a court of competent jurisdiction.
A portion of the Company's revenues are derived from long-term bilateral contracts with utilities that are regulated by their respective states, and have been entered into pursuant to certain state programs. Certain long-term contracts that other companies have with state-regulated utilities have been challenged in federal court and have been declared unconstitutional on the grounds that the rate for energy and capacity established by the contracts impermissibly conflicts with the rate for energy and capacity established by FERC pursuant to the FPA. If certain of the Company's state-mandated agreements with utilities are ever held to be invalid or unenforceable due to the financial conditions or other conditions of such utility, the Company may be unable to replace such contracts, which could have a material adverse effect on the Company's business, financial condition, results of operations and cash flows.
The generation of electric energy from solar and wind energy sources depends heavily on suitable meteorological conditions.
If solar or wind conditions are unfavorable, the Company's electricity generation and revenue from renewable generation facilities may be substantially below the Company's expectations. The electricity produced and revenues generated by a solar or wind energy generation facility is highly dependent on suitable solar or wind conditions, as applicable, and associated weather conditions, which are beyond the Company's control. Furthermore, components of the Company's systems, such as solar panels and inverters, could be damaged by severe weather, such as wildfires, hailstorms, tornadoes or freezing temperatures and other winter weather conditions. In addition, replacement and spare parts for key components may be difficult or costly to acquire or may be unavailable. Unfavorable weather and atmospheric conditions could impair the effectiveness of the Company's assets or reduce their output beneath their rated capacity or require shutdown of key equipment, impeding operation of the Company's renewable assets. For example, in February 2021, the Company's wind projects in Texas were unable to operate and experienced outages for a few days as a result of the extreme winter weather conditions. In addition, climate change may have the long-term effect of changing wind patterns at the Company's projects. Changing wind patterns could cause changes in expected electricity generation. These events could also degrade equipment or components and the interconnection and transmission facilities’ lives or maintenance costs.
Although the Company bases its investment decisions with respect to each renewable generation facility on the findings of related wind and solar studies conducted on-site prior to construction or based on historical conditions at existing facilities, actual climatic conditions at a facility site, particularly wind conditions, may not conform to the findings of these studies and may be affected by variations in weather patterns, including any potential impact of climate change. Therefore, the Company's solar and wind energy facilities may not meet anticipated production levels or the rated capacity of the Company's generation assets, which could adversely affect the Company's business, financial condition, results of operations and cash flows.
Operation of electric generation facilities involves significant risks and hazards customary to the power industry that could have a material adverse effect on the Company's business, financial condition, results of operations and cash flows.
The ongoing operation of the Company's facilities involves risks that include the breakdown or failure of equipment or processes or performance below expected levels of output or efficiency due to wear and tear, latent defect, design error or operator error or force majeure events, among other things. Operation of the Company's facilities also involves risks that the Company will be unable to transport its products to its customers in an efficient manner due to a lack of transmission capacity. Unplanned outages of generating units, including extensions of scheduled outages due to mechanical failures or other problems, occur from time to time and are an inherent risk of the business. Unplanned outages typically increase operation and maintenance expenses, capital expenditures and may reduce revenues as a result of selling fewer MWh or require the Company to incur significant costs as a result of obtaining replacement power from third parties in the open market to satisfy forward power sales obligations. The Company's inability to operate its electric generation assets efficiently, manage capital expenditures and costs and generate earnings and cash flow from the Company's asset-based businesses could have a material adverse effect on the Company's business, financial condition, results of operations and cash flows. While the Company maintains insurance, obtains warranties from vendors and obligates contractors to meet certain performance levels, the proceeds of such insurance, warranties or performance guarantees may not cover the Company's lost revenues, increased expenses or liquidated damages payments should it experience equipment breakdown or non-performance by contractors or vendors.
Power generation involves hazardous activities, including acquiring, transporting and unloading fuel, operating large pieces of rotating equipment and delivering electricity to transmission and distribution systems.
In addition to natural risks such as earthquake, flood, lightning, hurricane and wind, other hazards, such as fire, explosion, structural collapse and machinery failure are inherent risks in the Company's operations. These and other hazards can cause significant personal injury or loss of life, severe damage to and destruction of property, plant and equipment and contamination of, or damage to, the environment and suspension of operations. The occurrence of any one of these events may
result in the Company being named as a defendant in lawsuits asserting claims for substantial damages, including for environmental cleanup costs, personal injury and property damage and fines and/or penalties. The Company maintains an amount of insurance protection that it considers adequate but cannot provide any assurance that the Company's insurance will be sufficient or effective under all circumstances and against all hazards or liabilities to which the Company may be subject. Furthermore, the Company's insurance coverage is subject to deductibles, caps, exclusions and other limitations. A loss for which the Company is not fully insured (which may include a significant judgment against any facility or facility operator) could have a material adverse effect on the Company's business, financial condition, results of operations or cash flows. Further, due to rising insurance costs and changes in the insurance markets, the Company cannot provide any assurance that its insurance coverage will continue to be available at all or at rates or on terms similar to those presently available. Any losses not covered by insurance could have a material adverse effect on the Company's business, financial condition, results of operations and cash flows.
Maintenance, expansion and refurbishment of electric generation facilities involve significant risks that could result in unplanned power outages or reduced output.
The Company's facilities may require periodic upgrading and improvement. Any unexpected operational or mechanical failure, including failure associated with breakdowns and forced outages, could reduce the Company's facilities' generating capacity below expected levels, reducing the Company's revenues and jeopardizing the Company's ability to pay dividends to holders of its common stock at expected levels or at all. Degradation of the performance of the Company's solar facilities above levels provided for in the related offtake agreements may also reduce the Company's revenues. Unanticipated capital expenditures associated with maintaining, upgrading or repairing the Company's facilities may also reduce profitability.
If the Company makes any major modifications to its conventional power generation facilities, it may be required to install the best available control technology or to achieve the lowest achievable emission rates as such terms are defined under the new source review provisions of the Clean Air Act in the future. Any such modifications could likely result in substantial additional capital expenditures. The Company may also choose to repower, refurbish or upgrade its facilities based on its assessment that such activity will provide adequate financial returns. Such facilities require time for development and capital expenditures before commencement of commercial operations, and key assumptions underpinning a decision to make such an investment may prove incorrect, including assumptions regarding construction costs, timing, available financing and future fuel and power prices. These events could have a material adverse effect on the Company's business, financial condition, results of operations and cash flows.
The Company’s facilities may operate, wholly or partially, without long-term power sales agreements.
The Company’s facilities may operate without long-term power sales agreements for some or all of their generating capacity and output and therefore be exposed to market fluctuations. Without the benefit of long-term power sales agreements for the facilities, the Company cannot be sure that it will be able to sell any or all of the power generated by the facilities at commercially attractive rates or that the facilities will be able to operate profitably. This could lead to less predictable revenues, future impairments of the Company's property, plant and equipment or to the closing of certain of its facilities, resulting in economic losses and liabilities, which could have a material adverse effect on the Company's results of operations, financial condition or cash flows.
Supplier and/or customer concentration at certain of the Company's facilities may expose the Company to significant financial credit or performance risks.
The Company often relies on a single contracted supplier or a small number of suppliers for the provision of fuel, transportation of fuel, equipment, technology and/or other services required for the operation of certain facilities. In addition, certain of the Company's suppliers provide long-term warranties with respect to the performance of their products or services. If any of these suppliers cannot perform under their agreements with the Company, or satisfy their related warranty obligations, the Company will need to utilize the marketplace to provide or repair these products and services. There can be no assurance that the marketplace can provide these products and services as, when and where required. The Company may not be able to enter into replacement agreements on favorable terms or at all. If the Company is unable to enter into replacement agreements to provide for fuel, equipment, technology and other required services, it would seek to purchase the related goods or services at market prices, exposing the Company to market price volatility and the risk that fuel and transportation may not be available during certain periods at any price. The Company may also be required to make significant capital contributions to remove, replace or redesign equipment that cannot be supported or maintained by replacement suppliers, which could have a material adverse effect on the business, financial condition, results of operations, credit support terms and cash flows.
In addition, potential or existing customers at the Company’s district energy centers and combined heat and power plants, or the Energy Centers, may opt for on-site systems in lieu of using the Company’s Energy Centers, either due to corporate policies regarding the allocation of capital, unique situations where an on-site system might in fact prove more efficient, because of previously committed capital in systems that are already on-site, or otherwise. At times, the Company relies on a single customer or a few customers to purchase all or a significant portion of a facility's output, in some cases under long-term agreements that account for a substantial percentage of the anticipated revenue from a given facility.
The failure of any supplier to fulfill its contractual obligations to the Company or the Company’s loss of potential or existing customers could have a material adverse effect on its financial results. Consequently, the financial performance of the Company's facilities is dependent on the credit quality of, and continued performance by, the Company's suppliers and vendors and the Company’s ability to solicit and retain customers.
The Company currently owns, and in the future may acquire, certain assets in which the Company has limited control over management decisions and its interests in such assets may be subject to transfer or other related restrictions.
As described in Item 15 — Note 5, Investments Accounted for by the Equity Method and Variable Interest Entities, the Company has limited control over the operation of certain of its assets, because the Company beneficially owns less than a majority of the membership interests in such assets. The Company may seek to acquire additional assets in which it owns less than a majority of the related membership interests in the future. In these investments, the Company will seek to exert a degree of influence with respect to the management and operation of assets in which it owns less than a majority of the membership interests by negotiating to obtain positions on management committees or to receive certain limited governance rights, such as rights to veto significant actions. However, the Company may not always succeed in such negotiations. The Company may be dependent on its co-venturers to operate such assets. The Company's co-venturers may not have the level of experience, technical expertise, human resources management and other attributes necessary to operate these assets optimally. In addition, conflicts of interest may arise in the future between theCompany and its stockholders, on the one hand, and the Company's co-venturers, on the other hand, where the Company's co-venturers' business interests are inconsistent with the interests of the Company and its stockholders. Further, disagreements or disputes between the Company and its co-venturers could result in litigation, which could increase expenses and potentially limit the time and effort the Company's officers and directors are able to devote to the business.
The approval of co-venturers may also be required for the Company to receive distributions of funds from assets or to sell, pledge, transfer, assign or otherwise convey its interest in such assets, or for the Company to acquire GIP's or CEG's interests in such co-ventures as an initial matter. Alternatively, the Company's co-venturers may have rights of first refusal or rights of first offer in the event of a proposed sale or transfer of the Company's interests in such assets. These restrictions may limit the price or interest level for interests in such assets, in the event the Company wants to sell such interests.
Furthermore, certain of the Company's facilities are operated by third-party operators. To the extent that third-party operators do not fulfill their obligations to manage operations of the facilities or are not effective in doing so, the amount of CAFD may be adversely affected.
The Company's assets are exposed to risks inherent in the use of interest rate swaps and forward fuel purchase contracts and the Company may be exposed to additional risks in the future if it utilizes other derivative instruments.
The Company uses interest rate swaps to manage interest rate risk. In addition, the Company uses forward fuel purchase contracts to hedge its limited commodity exposure with respect to the Company's district energy assets. If the Company elects to enter into such commodity hedges, the related asset could recognize financial losses on these arrangements as a result of volatility in the market values of the underlying commodities or if a counterparty fails to perform under a contract. If actively quoted market prices and pricing information from external sources are not available, the valuation of these contracts would involve judgment or the use of estimates. As a result, changes in the underlying assumptions or use of alternative valuation methods could affect the reported fair value of these contracts. If the values of these financial contracts change in a manner that the Company does not anticipate, or if a counterparty fails to perform under a contract, it could harm the business, financial condition, results of operations and cash flows.
The Company's business is subject to restrictions resulting from environmental, health and safety laws and regulations.
The Company is subject to various federal, state and local environmental and health and safety laws and regulations. In addition, the Company may be held primarily or jointly and severally liable for costs relating to the investigation and clean-up of any property where there has been a release or threatened release of a hazardous regulated material as well as other affected properties, regardless of whether the Company knew of or caused the release. In addition to these costs, which are typically not limited by law or regulation and could exceed an affected property's value, the Company could be liable for certain other costs, including governmental fines and injuries to persons, property or natural resources. Further, some environmental laws provide for the creation of a lien on a contaminated site in favor of the government as security for damages and any costs the government incurs in connection with such contamination and associated clean-up. Although the Company generally requires its operators to undertake to indemnify it for environmental liabilities they cause, the amount of such liabilities could exceed the financial ability of the operator to indemnify the Company. The presence of contamination or the failure to remediate contamination may adversely affect the Company's ability to operate the business.
The Company does not own all of the land on which its power generation or thermal assets are located, which could result in disruption to its operations.
The Company does not own all of the land on which its power generation or thermal assets are located and the Company is, therefore, subject to the possibility of less desirable terms and increased costs to retain necessary land use if it does not have valid leases or rights-of-way or if such rights-of-way lapse or terminate. Although the Company has obtained rights to construct and operate these assets pursuant to related lease arrangements, the rights to conduct those activities are subject to certain exceptions, including the term of the lease arrangement. The Company is also at risk of condemnation on land it owns. The loss of these rights, through the Company's inability to renew right-of-way contracts, condemnation or otherwise, may adversely affect the Company's ability to operate its generation and thermal infrastructure assets.
The Company’s use and enjoyment of real property rights for its projects may be adversely affected by the rights of lienholders and leaseholders that are superior to those of the grantors of those real property rights to the Company.
Solar and wind projects generally are, and are likely to be, located on land occupied by the project pursuant to long-term easements and leases. The ownership interests in the land subject to these easements and leases may be subject to mortgages securing loans or other liens (such as tax liens) and other easement and lease rights of third parties (such as leases of oil or mineral rights) that were created prior to the project’s easements and leases. As a result, the project’s rights under these easements or leases may be subject, and subordinate, to the rights of those third parties. The Company performs title searches and obtains title insurance to protect itself against these risks. Such measures may, however, be inadequate to protect the Company against all risk of loss of its rights to use the land on which the wind projects are located, which could have a material adverse effect on the Company’s business, financial condition and results of operations.
The Company's businesses are subject to physical, market and economic risks relating to potential effects of climate change.
Climate change creates uncertainty in weather and other environmental conditions, including temperature and precipitation levels, and thus may affect consumer demand for electricity. In addition, the potential physical effects of climate change, such as increased frequency and severity of storms, cloud coverage, precipitation, floods and other climatic events, could disrupt the Company's operations and supply chain, and cause them to incur significant costs in preparing for or responding to these effects. These or other meteorological changes could lead to increased operating costs, capital expenses or power purchase costs.
GHG regulation could increase the cost of electricity generated by fossil fuels, and such increases could reduce demand for the power the Company's conventional assets generate and market. Legislative and regulatory measures to address climate change and GHG emissions are in various phases of discussion or implementation. The EPA regulates GHG emissions from new and modified facilities that are potential major sources of criteria pollutants under the Clean Air Act's Prevention of Significant Deterioration and Title V programs and has adopted regulations that require, among other things, preconstruction and operating permits for certain large stationary sources and the monitoring and reporting of GHGs from certain onshore oil and natural gas production sources on an annual basis.
In addition, in 2015, the U.S., Canada and the U.K. participated in the United Nations Conference on Climate Change, which led to the creation of the Paris Agreement. The Paris Agreement, which was signed by the U.S. in April 2016, requires countries to review and “represent a progression” in their intended nationally determined contributions (which set GHG emission reduction goals) every five years beginning in 2020. In November 2020, the U.S. officially withdrew from the Paris Agreement in November 2020. However, on January 20, 2021, President Biden signed an “Acceptance on Behalf of the United States of America” that will allow the U.S. to rejoin the Paris Agreement.The newly signed acceptance, deposited with the United Nations on January 20, reverses the prior withdrawal.The U.S. officially rejoined the Paris Agreement on February 19,
2021. The U.S. Congress, along with federal and state agencies, has also considered measures to reduce the emissions of GHGs. Legislation or regulation that restricts carbon emissions could increase the cost of environmental compliance for the Company’s conventional assets by requiring the Company to install new equipment to reduce emissions from larger facilities and/or purchase emission allowances. Climate change and GHG legislation or regulation could also delay or otherwise negatively affect efforts to obtain and maintain permits and other regulatory approvals for the Company’s conventional assets’ existing and new facilities, impose additional monitoring and reporting requirements or adversely affect demand for the natural gas we gather, transport and store. Conversely, legislation or regulation that sets a price on or otherwise restricts carbon emissions could also benefit the Company by increasing demand for solar or wind energy sources. In addition, governmental, scientific and public concern over the threat of climate change arising from GHG emissions has resulted in increasing political risks in the U.S, including climate change related pledges made by the Biden Administration. Shortly after taking office in January 2021, President Biden issued a series of executive orders designed to address climate change. Reentry into the Paris Agreement and President Biden's executive orders may result in the development of additional regulations or changes to existing regulations. The effect on the Company of any new legislative or regulatory measures will depend on the particular provisions that are ultimately adopted.
Risks that are beyond the Company's control, including but not limited to acts of terrorism or related acts of war, natural disaster, hostile cyber intrusions or other catastrophic events, could have a material adverse effect on the business, financial condition, results of operations and cash flows.
The Company's generation facilities that were acquired or those that the Company otherwise acquires or constructs and the facilities of third parties on which they rely may be targets of terrorist activities, as well as events occurring in response to or in connection with them, that could cause environmental repercussions and/or result in full or partial disruption of the facilities ability to generate, transmit, transport or distribute electricity or natural gas. Strategic targets, such as energy-related facilities, may be at greater risk of future terrorist activities than other domestic targets. Hostile cyber intrusions, including those targeting information systems as well as electronic control systems used at the generating plants and for the related distribution systems, could severely disrupt business operations and result in loss of service to customers, as well as create significant expense to repair security breaches or system damage.
Furthermore, certain of the Company's power generation and thermal assets are located in active earthquake zones in California and Arizona, and certain project companies and suppliers conduct their operations in the same region or in other locations that are susceptible to natural disasters. In addition, California and some of the locations where certain suppliers are located, from time to time, have experienced shortages of water, electric power and natural gas. The occurrence of a natural disaster, such as an earthquake, wildfire, drought, flood or localized extended outages of critical utilities or transportation systems, or any critical resource shortages, affecting the Company or its suppliers, could cause a significant interruption in the business, damage or destroy the Company's facilities or those of its suppliers or the manufacturing equipment or inventory of the Company's suppliers. Any such terrorist acts, environmental repercussions or disruptions or natural disasters could result in a significant decrease in revenues or significant reconstruction or remediation costs, beyond what could be recovered through insurance policies, which could have a material adverse effect on the business, financial condition, results of operations and cash flows.
The operation of the Company’s businesses is subject to cyber-based security and integrity risk.
Numerous functions affecting the efficient operation of the Company’s businesses depend on the secure and reliable storage, processing and communication of electronic data and the use of sophisticated computer hardware and software systems. The operation of the Company's generating assets relies on cyber-based technologies and has been the target of disruptive actions. Potential disruptive actions could result from cyber-attack or cyber intrusion, including by computer hackers, foreign governments and cyber terrorists, or otherwise be compromised by unintentional events. As a result, operations could be interrupted, property could be damaged and sensitive customer information could be lost or stolen, causing the Company to incur significant losses of revenues, other substantial liabilities and damages, costs to replace or repair damaged equipment and damage to the Company's reputation. In addition, the Company may experience increased capital and operating costs to implement increased security for its cyber systems and generating assets.
The Company relies on electric distribution and transmission facilities that it does not own or control and that are subject to transmission constraints within a number of the Company's regions. If these facilities fail to provide the Company with adequate transmission capacity, it may be restricted in its ability to deliver electric power to its customers and may either incur additional costs or forego revenues.
The Company depends on electric distribution and transmission facilities owned and operated by others to deliver the wholesale power it will sell from its electric generation assets to its customers. A failure or delay in the operation or development of these facilities or a significant increase in the cost of the development of such facilities could result in lost revenues. Such failures or delays could limit the amount of power the Company's operating facilities deliver or delay the completion of the Company's construction projects. Additionally, such failures, delays or increased costs could have a material adverse effect on the business, financial condition and results of operations. If a region's power transmission infrastructure is inadequate, the Company's recovery of wholesale costs and profits may be limited. If restrictive transmission price regulation is imposed, the transmission companies may not have a sufficient incentive to invest in expansion of transmission infrastructure. The Company also cannot predict whether distribution or transmission facilities will be expanded in specific markets to accommodate competitive access to those markets. In addition, certain of the Company's operating facilities' generation of electricity may be curtailed without compensation due to transmission limitations or limitations on the electricity grid's ability to accommodate intermittent and other electricity generating sources, reducing the Company's revenues and impairing its ability to capitalize fully on a particular facility's generating potential. Such curtailments could have a material adverse effect on the business, financial condition, results of operations and cash flows. Furthermore, economic congestion on transmission networks in certain of the markets in which the Company operates may occur and the Company may be deemed responsible for congestion costs. If the Company were liable for such congestion costs, its financial results could be adversely affected.
The Company's costs, results of operations, financial condition and cash flows could be adversely impacted by the disruption of the fuel supplies necessary to generate power at its conventional and thermal power generation facilities.
Delivery of fossil fuels to fuel the Company's conventional and thermal generation facilities is dependent upon the infrastructure (including natural gas pipelines) available to serve each such generation facility as well as upon the continuing financial viability of contractual counterparties. As a result, the Company is subject to the risks of disruptions or curtailments in the production of power at these generation facilities if a counterparty fails to perform or if there is a disruption in the fuel delivery infrastructure.
The Company depends on key personnel, the loss of any of which could have a material adverse effect on the Company's financial condition and results of operations.
The Company believes its current operations and future success depend largely on the continued services of key personnel that it employs. Although the Company currently has access to the resources of CEG, the loss of key personnel employed by the Company could have a material adverse effect on the Company’s financial condition and results of operations.
Risks Related to the Company's Relationships with GIP and CEG
GIP, through its ownership of CEG, is the Company's controlling stockholder and exercises substantial influence over the Company. The Company is highly dependent on GIP and CEG.
GIP, through its ownership of CEG, owns all of the Company's outstanding Class B and Class D common stock. The Company's outstanding Class B and Class D common stock is entitled to one vote per share and 1/100th of a vote per share, respectively. As a result of its ownership of the Class B and Class D common stock, GIP indirectly owns 54.93% of the combined voting power of the Company's common stock as of December 31, 2020. As a result of this ownership, GIP has a substantial influence on the Company's affairs and its voting power will constitute a large percentage of any quorum of the Company's stockholders voting on any matter requiring the approval of the Company's stockholders. Such matters include the election of directors, the adoption of amendments to the Company's amended and restated certificate of incorporation and fourth amended and restated bylaws and approval of mergers or sale of all or substantially all of its assets. This concentration of ownership may also have the effect of delaying or preventing a change in control of the Company or discouraging others from making tender offers for the Company's shares. In addition, GIP has the right to elect all of the Company's directors. GIP may cause corporate actions to be taken even if their interests conflict with the interests of the Company's other stockholders (including holders of the Company's Class A and Class C common stock).
Furthermore, the Company depends on certain services provided by or under the direction of CEG under the CEG Master Services Agreement, including numerous processes related to the Company's internal control over financial reporting. CEG personnel and support staff that provide services to the Company under the CEG Master Services Agreement are not required to, and the Company does not expect that they will, have as their primary responsibility the management and administration of the Company or to act exclusively for the Company and the CEG Master Services Agreement does not require any specific individuals to be provided by CEG. Under the CEG Master Services Agreement, CEG has the discretion to determine which of its employees perform assignments required to be provided to the Company. Any failure to effectively manage the Company's processes related to internal controls over financial reporting, operations or to implement its strategy could have a material adverse effect on the business, financial condition, results of operations and cash flows. The CEG Master Services Agreement will continue in perpetuity, until terminated in accordance with its terms.
The Company also depends upon CEG and NRG for the provision of management, administration, O&M and certain other services at certain of the Company's facilities. Any failure by CEG or NRG to perform its requirements under these arrangements or the failure by the Company to identify and contract with replacement service providers, if required, could adversely affect the operation of the Company's facilities and have a material adverse effect on the business, financial condition, results of operations and cash flows.
GIP and its affiliates control the Company and have the ability to designate a majority of the members of the Company’s Board.
Due to GIP's approximate 54.93% combined voting power in the Company, the ability of other holders of the Company’s Class A and Class C common stock to exercise control over the corporate governance of the Company is limited. GIP and its affiliates have a substantial influence on the Company’s affairs and its voting power constitutes a large percentage of any quorum of the Company’s stockholders voting on any matter requiring the approval of the Company’s stockholders. GIP and its affiliates may hold certain interests that are different from those of the Company or other holders of the Company’s Class A and Class C common stock and there is no assurance that GIP and its affiliates will exercise its control over the Company in a manner that is consistent with the Company’s interests or those of the holders of the Company’s Class A and Class C common stock.
The Company may not be able to consummate future acquisitions from CEG.
The Company's ability to grow through acquisitions depends, in part, on CEG's ability to identify and present the Company with acquisition opportunities. Although CEG has agreed, pursuant to the CEG ROFO Agreement, to grant the Company a right of first offer with respect to certain power generation assets that CEG may elect to sell in the future, CEG is under no obligation to sell any such power generation assets or to accept any related offers from the Company. In addition, CEG has not agreed to commit any minimum level of dedicated resources for the pursuit of renewable power-related acquisitions. There are a number of factors which could materially and adversely impact the extent to which suitable acquisition opportunities are made available from CEG, including that the same professionals within CEG's organization that are involved in acquisitions that are suitable for the Company have responsibilities within CEG's broader asset management business, which may include sourcing acquisition opportunities for CEG. Limits on the availability of such individuals will likewise result in a limitation on the availability of acquisition opportunities for the Company. In making these determinations, CEG may be influenced by factors that result in a misalignment with the Company's interests or conflict of interest.
The Company may be unable to terminate the CEG Master Services Agreement, in certain circumstances.
The CEG Master Services Agreement provides that the Company may terminate the agreement upon 30 days prior written notice to CEG upon the occurrence of any of the following: (i) CEG defaults in the performance or observance of any material term, condition or covenant contained therein in a manner that results in material harm to the Company and the default continues unremedied for a period of 30 days after written notice thereof is given to CEG; (ii) CEG engages in any act of fraud, misappropriation of funds or embezzlement that results in material harm to the Company; (iii) CEG is grossly negligent in the performance of its duties under the agreement and such negligence results in material harm to the Company; or (iv) upon the happening of certain events relating to the bankruptcy or insolvency of CEG. Furthermore, if the Company requests an amendment to the scope of services provided by CEG under the CEG Master Services Agreement and is not able to agree with CEG as to a change to the service fee resulting from a change in the scope of services within 180 days of the request, the Company will be able to terminate the agreement upon 30 days prior notice to CEG. The Company will not be able to terminate the agreement for any other reason, including if CEG experiences a change of control, and the agreement continues in perpetuity, until terminated in accordance with its terms. If CEG's performance does not meet the expectations of investors, and the Company is unable to terminate the CEG Master Services Agreement, the market price of the Class A and Class C common stock could suffer.
If CEG terminates the CEG Master Services Agreement or defaults in the performance of its obligations under the agreement, the Company may be unable to contract with a substitute service provider on similar terms, or at all.
The Company relies on CEG to provide certain services under the CEG Master Services Agreement. The CEG Master Services Agreement provides that CEG may terminate the agreement upon 180 days prior written notice of termination to the Company if the Company defaults in the performance or observance of any material term, condition or covenant contained in the agreement in a manner that results in material harm and the default continues unremedied for a period of 30 days after written notice of the breach is given. If CEG terminates the Management Services Agreement or defaults in the performance of its obligations under the agreement, the Company may be unable to contract with CEG or a substitute service provider on similar terms or at all, and the costs of substituting service providers may be substantial. In addition, in light of CEG's familiarity with the Company's assets, a substitute service provider may not be able to provide the same level of service due to lack of pre-existing synergies.
The liability of CEG is limited under the Company's arrangements with it and the Company has agreed to indemnify CEG against claims that it may face in connection with such arrangements, which may lead CEG to assume greater risks when making decisions relating to the Company than it otherwise might if acting solely for its own account.
Under the CEG Master Services Agreement, CEG does not assume any responsibility other than to provide or arrange for the provision of the services described in the CEG Master Services Agreement in good faith. In addition, under the CEG Master Services Agreement, the liability of CEG and its affiliates is limited to the fullest extent permitted by law to conduct involving bad faith, fraud, willful misconduct or gross negligence or, in the case of a criminal matter, action that was known to have been unlawful. In addition, the Company has agreed to indemnify CEG to the fullest extent permitted by law from and against any claims, liabilities, losses, damages, costs or expenses incurred by an indemnified person or threatened in connection with the Company's operations, investments and activities or in respect of or arising from the CEG Master Services Agreement or the services provided by CEG, except to the extent that the claims, liabilities, losses, damages, costs or expenses are determined to have resulted from the conduct in respect of which such persons have liability as described above. These protections may result in CEG tolerating greater risks when making decisions than otherwise might be the case, including when determining whether to use leverage in connection with acquisitions. The indemnification arrangements to which CEG is a party may also give rise to legal claims for indemnification that are adverse to the Company and holders of its common stock.
Certain of the Company’s PPAs and project-level financing arrangements include provisions that would permit the counterparty to terminate the contract or accelerate maturity in the event GIP or its affiliates ceases to control or own, directly or indirectly, a majority of the voting power of the Company.
Certain of the Company’s PPAs and project-level financing arrangements contain change in control provisions that provide the counterparty with a termination right or the ability to accelerate maturity in the event of a change of control of the Company without the counterparty's consent. These provisions are triggered in the event GIP or its affiliates ceases to own, directly or indirectly, capital stock representing more than 50% of the voting power of the Company’s capital stock outstanding on such date, or, in some cases, if GIP or its affiliates ceases to be the majority owner, directly or indirectly, of the applicable project subsidiary. As a result, if GIP or its affiliates ceases to control, or in some cases, own a majority of the voting power of the Company, the counterparties could terminate such contracts or accelerate the maturity of such financing arrangements. The termination of any of the Company’s PPAs or the acceleration of the maturity of any of the Company’s project-level financing could have a material adverse effect on the Company’s business, financial condition, results of operations and cash flow.
The Company is a “controlled company," controlled by GIP, and as a result, is exempt from certain corporate governance requirements that are designed to provide protection to stockholders of companies that are not controlled companies.
As of December 31, 2020, GIP indirectly controls 54.93% of the Company's combined voting power and is able to elect all of the Company's board of directors. As a result, the Company is considered a "controlled company" for the purposes of the NYSE listing requirements. As a "controlled company," the Company is permitted to, and the Company may, opt out of the NYSE listing requirements that would require (i) a majority of the members of the Company's board of directors to be independent, (ii) that the Company establish a compensation committee and a nominating and governance committee, each comprised entirely of independent directors, or (iii) an annual performance evaluation of the nominating and governance and compensation committees. The NYSE listing requirements are intended to ensure that directors who meet the independence standards are free of any conflicting interest that could influence their actions as directors. While the Company has elected to have a Corporate Governance, Conflicts and Nominating Committee consisting entirely of independent directors and to conduct an annual performance evaluation of this committee, the majority of the members of the Company’s board of directors are not considered independent and the Company's compensation committee is not comprised entirely of independent directors. Therefore, the Company’s stockholders may not have the same protections afforded to stockholders of companies that are subject to all of the applicable NYSE listing requirements. It is also possible that the interests of GIP may in some circumstances conflict with the Company's interests and the interests of the holders of the Company's Class A and Class C common stock.
Risks Related to Regulation
The electric generation business is subject to substantial governmental regulation and may be adversely affected by changes in laws or regulations, as well as liability under, or any future inability to comply with, existing or future regulations or other legal requirements.
The Company's electric generation business is subject to extensive U.S. federal, state and local laws and regulations. Compliance with the requirements under these various regulatory regimes may cause the Company to incur significant additional costs, and failure to comply with such requirements could result in the shutdown of the non-complying facility, the imposition of liens, fines, and/or civil or criminal liability. Public utilities under the FPA are required to obtain FERC acceptance of their rate schedules for wholesale sales of electric energy, capacity and ancillary services. Except for generating facilities located in Hawaii, in Texas within the footprint of ERCOT, or in Puerto Rico, all of the Company’s generating companies are public utilities under the FPA with market-based rate authority unless exempt from FPA public utility rate regulation. FERC's orders that grant market-based rate authority to wholesale power sellers reserve the right to revoke or revise that authority if FERC subsequently determines that the seller can exercise market power in transmission or generation, create barriers to entry, or engage in abusive affiliate transactions. In addition, public utilities are subject to FERC reporting requirements that impose administrative burdens and that, if violated, can expose the company to criminal and civil penalties or other risks.
The Company's market-based sales are subject to certain rules prohibiting manipulative or deceptive conduct, and if any of the Company's generating companies with market-based rate authority are deemed to have violated those rules, they could be subject to potential disgorgement of profits associated with the violation, penalties, suspension or revocation of market based rate authority. If such generating companies were to lose their market-based rate authority, such companies would be required to obtain FERC's acceptance of a cost-of-service rate schedule and could become subject to the significant accounting, record-keeping, and reporting requirements that are imposed on utilities with cost-based rate schedules. This could have a material adverse effect on the rates the Company is able to charge for power from its facilities.
All of the Company's generating assets are operating either as EWGs or FUCOs as defined under the PUHCA, or as QFs as defined under the PURPA, as amended, and therefore are exempt from certain regulation under the PUHCA and the FPA. If a facility fails to maintain its status as an EWG, FUCO, or a QF or there are legislative or regulatory changes revoking or limiting the exemptions to the PUHCA and/or the FPA, then the Company may be subject to significant accounting, record-keeping, access to books and records and reporting requirements, and failure to comply with such requirements could result in the imposition of penalties and additional compliance obligations.
Substantially all of the Company's generation assets are also subject to the reliability standards promulgated by the designated Electric Reliability Organization (currently the North American Electric Reliability Corporation, or NERC) and approved by FERC. If the Company fails to comply with the mandatory reliability standards, it could be subject to sanctions, including substantial monetary penalties and increased compliance obligations. The Company will also be affected by legislative and regulatory changes, as well as changes to market design, market rules, tariffs, cost allocations, and bidding rules that occur in the existing regional markets operated by RTOs or ISOs, such as PJM. The RTOs/ISOs that oversee most of the wholesale power markets impose, and in the future may continue to impose, mitigation, including price limitations, offer caps, non-performance penalties and other mechanisms to address some of the volatility and the potential exercise of market power in these markets. These types of price limitations and other regulatory mechanisms may have a material adverse effect on the profitability of the Company's generation facilities acquired in the future that sell energy, capacity and ancillary products into the wholesale power markets. The regulatory environment for electric generation has undergone significant changes in the last several years due to state and federal policies affecting wholesale competition and the creation of incentives for the addition of large amounts of new renewable generation and, in some cases, transmission assets. These changes are ongoing and the Company cannot predict the future design of the wholesale power markets or the ultimate effect that the changing regulatory environment will have on the Company's business. In addition, in some of these markets, interested parties have proposed to re-regulate the markets or require divestiture of electric generation assets by asset owners or operators to reduce their market share. Other proposals to re-regulate may be made and legislative or other attention to the electric power market restructuring process may delay or reverse the deregulation process. If competitive restructuring of the electric power markets is reversed, discontinued, or delayed, the Company's business prospects and financial results could be negatively impacted.
The Company is subject to environmental laws and regulations that impose extensive and increasingly stringent requirements on its operations, as well as potentially substantial liabilities arising out of environmental contamination.
The Company's assets are subject to numerous and significant federal, state and local laws, including statutes, regulations, guidelines, policies, directives and other requirements governing or relating to, among other things: protection of wildlife, including threatened and endangered species; air emissions; discharges into water; water use; the storage, handling, use, transportation and distribution of dangerous goods and hazardous, residual and other regulated materials, such as chemicals; the prevention of releases of hazardous materials into the environment; the prevention, presence and remediation of hazardous materials in soil and groundwater, both on and offsite; land use and zoning matters; and workers' health and safety matters. The Company's facilities could experience incidents, malfunctions and other unplanned events that could result in spills or emissions in excess of permitted levels and result in personal injury, penalties and property damage. As such, the operation of the Company's facilities carries an inherent risk of environmental, health and safety liabilities (including potential civil actions, compliance or remediation orders, fines and other penalties), and may result in the assets being involved from time to time in administrative and judicial proceedings relating to such matters. The Company has implemented environmental, health and safety management programs designed to continually improve environmental, health and safety performance. Environmental laws and regulations have generally become more stringent over time. Significant costs may be incurred for capital expenditures under environmental programs to keep the assets compliant with such environmental laws and regulations. If it is not economical to make those expenditures, it may be necessary to retire or mothball facilities or restrict or modify the Company's operations to comply with more stringent standards. These environmental requirements and liabilities could have a material adverse effect on the business, financial condition, results of operations and cash flows.
Government regulations providing incentives for renewable generation could change at any time and such changes may negatively impact the Company's growth strategy.
The Company's growth strategy depends in part on government policies that support renewable generation and enhance the economic viability of owning renewable electric generation assets. Renewable generation assets currently benefit from various federal, state and local governmental incentives such as ITCs, cash grants in lieu of ITCs, loan guarantees, RPS, programs, modified accelerated cost-recovery system of depreciation and bonus depreciation. In December 2015, the U.S. Congress enacted an extension of the 30% solar ITC so that projects that began construction in 2016 through 2019 will continue to qualify for the 30% ITC. Projects beginning construction in 2020 and 2021 will be eligible for the ITC at the rates of 26% and 22%, respectively. The same legislation also extended the 10-year wind PTC for wind projects that began construction in 2016 through 2019.Wind projects that began construction in 2018 or 2019 are eligible for PTCS at 60% and 40% of the statutory rate per kWh, respectively. In December 2019, the U.S. Congress extended the 10-year wind PTC for wind projects that begin construction in 2020, and such projects are eligible for PTCs at 60% of the statutory rate per kWh. The same legislation also extended an 18% ITC in lieu of the PTC for wind projects that begin construction in 2020. In December 2020, the Consolidated Appropriations Act, 2021 was signed by the President and extended the solar ITC so that projects that begin construction in 2021 or 2022 will be eligible for the ITC at a rate of 26% and projects beginning construction in 2023 will be eligible for the ITC at a rate of 22%. The same legislation also extended the 10-year wind PTC for wind projects that begin construction in 2021, and such projects are eligible for PTCs at 60% of the statutory rate per kWh or an 18% ITC in lieu of the PTC. The same legislation also added a 30% ITC for offshore wind projects that begin construction prior to January 1, 2026.
Many states have adopted RPS programs mandating that a specified percentage of electricity sales come from eligible sources of renewable energy. However, the regulations that govern the RPS programs, including pricing incentives for renewable energy, or reasonableness guidelines for pricing that increase valuation compared to conventional power (such as a projected value for carbon reduction or consideration of avoided integration costs), may change. If the RPS requirements are reduced or eliminated, it could lead to fewer future power contracts or lead to lower prices for the sale of power in future power contracts, which could have a material adverse effect on the Company's future growth prospects. Such material adverse effects may result from decreased revenues, reduced economic returns on certain project company investments, increased financing costs, and/or difficulty obtaining financing. Furthermore, the American Recovery and Reinvestment Act of 2009 included incentives to encourage investment in the renewable energy sector, such as cash grants in lieu of ITCs, bonus depreciation and expansion of the U.S. DOE loan guarantee program. It is uncertain what loan guarantees may be made by the U.S. DOE loan guarantee program in the future.
If the Company is unable to utilize various federal, state and local government incentives to acquire additional renewable assets in the future, or the terms of such incentives are revised in a manner that is less favorable to the Company, it may suffer a material adverse effect on the business, financial condition, results of operations and cash flows.
A portion of the steam and chilled water produced by the Company's thermal assets is sold at regulated rates, and the revenue earned by the Company's GenConn assets is established each year in a rate case; accordingly, the profitability of these assets is dependent on regulatory approval.
Approximately 451 net MWt of capacity from certain of the Company's thermal assets are sold at rates approved by one or more federal or state regulatory commissions, including the Pennsylvania Public Utility Commission and the California Public Utilities Commission for the thermal assets. Similarly, the revenues related to approximately 380 MW of capacity from the GenConn assets are established each year by the Connecticut Public Utilities Regulatory Authority. While such regulatory oversight is generally premised on the recovery of prudently incurred costs and a reasonable rate of return on invested capital, the rates that the Company may charge, or the revenue that the Company may earn with respect to this capacity are subject to authorization of the applicable regulatory authorities. There can be no assurance that such regulatory authorities will consider all of the costs to have been prudently incurred or that the regulatory process by which rates or revenues are determined will always result in rates or revenues that achieve full recovery of costs or an adequate return on the Company's capital investments. While the Company's rates and revenues are generally established based on an analysis of costs incurred in a base year, the rates the Company is allowed to charge, and the revenues the Company is authorized to earn, may or may not match the costs at any given time. If the Company's costs are not adequately recovered through these regulatory processes, it could have a material adverse effect on the business, financial condition, results of operations and cash flows.
Risks Related to the Company's Common Stock
The Company may not be able to continue paying comparable or growing cash dividends to holders of its common stock in the future.
The amount of CAFD principally depends upon the amount of cash the Company generates from its operations, which will fluctuate from quarter to quarter based on, among other things:
•the level and timing of capital expenditures the Company makes;
•the level of operating and general and administrative expenses, including reimbursements to CEG for services provided to the Company in accordance with the CEG Master Services Agreement;
•variations in revenues generated by the business, due to seasonality, weather, or otherwise;
•debt service requirements and other liabilities;
•fluctuations in working capital needs;
•the Company's ability to borrow funds and access capital markets;
•restrictions contained in the Company's debt agreements (including project-level financing and, if applicable, corporate debt); and
•other business risks affecting cash levels.
As a result of all these factors, the Company cannot guarantee that it will have sufficient cash generated from operations to pay a specific level of cash dividends to holders of its Class A or Class C common stock. Furthermore, holders of the Company's Class A or Class C common stock should be aware that the amount of CAFD depends primarily on operating cash flow, and is not solely a function of profitability, which can be affected by non-cash items.
The Company may incur other expenses or liabilities during a period that could significantly reduce or eliminate its CAFD and, in turn, impair its ability to pay dividends to holders of the Company's Class A or Class C common stock during the period. Because the Company is a holding company, its ability to pay dividends on the Company's Class A or Class C common stock is restricted and further limited by the ability of the Company's subsidiaries to make distributions to the Company, including restrictions under the terms of the agreements governing the Company's corporate debt and project-level financing. For example, as a result of the PG&E Bankruptcy, between early 2019 and mid-2020, certain of the Company's unconsolidated investments were unable to distribute project dividends to the Company. The project-level financing agreements generally prohibit distributions from the project entities prior to COD and thereafter prohibit distributions to the Company unless certain specific conditions are met, including the satisfaction of financial ratios. The Company's revolving credit facility also restricts the Company's ability to declare and pay dividends if an event of default has occurred and is continuing or if the payment of the dividend would result in an event of default.
Clearway Energy LLC's CAFD will likely fluctuate from quarter to quarter, in some cases significantly, due to seasonality. As a result, the Company may cause Clearway Energy LLC to reduce the amount of cash it distributes to its members in a particular quarter to establish reserves to fund distributions to its members in future periods for which the cash distributions the Company would otherwise receive from Clearway Energy LLC would be insufficient to fund its quarterly dividend. If the Company fails to cause Clearway Energy LLC to establish sufficient reserves, the Company may not be able to maintain its quarterly dividend with respect to a quarter adversely affected by seasonality.
Finally, dividends to holders of the Company's Class A or Class C common stock will be paid at the discretion of the Company's board of directors. The Company's board of directors may decrease the level, or entirely discontinue payment, of dividends.
The Company is a holding company and its only material asset is its interest in Clearway Energy LLC, and the Company is accordingly dependent upon distributions from Clearway Energy LLC and its subsidiaries to pay dividends and taxes and other expenses.
The Company is a holding company and has no material assets other than its ownership of membership interests in Clearway Energy LLC, a holding company that has no material assets other than its interest in Clearway Energy Operating LLC, whose sole material assets are the project companies. None of the Company, Clearway Energy LLC or Clearway Energy Operating LLC has any independent means of generating revenue. The Company intends to continue to cause Clearway Energy Operating LLC's subsidiaries to make distributions to Clearway Energy Operating LLC and, in turn, make distributions to Clearway Energy LLC, and, in turn, to make distributions to the Company in an amount sufficient to cover all applicable taxes payable and dividends, if any, declared by the Company. To the extent that the Company needs funds
for a quarterly cash dividend to holders of the Company's Class A and Class C common stock or otherwise, and Clearway Energy Operating LLC or Clearway Energy LLC is restricted from making such distributions under applicable law or regulation or is otherwise unable to provide such funds (including as a result of Clearway Energy Operating LLC's operating subsidiaries being unable to make distributions), it could materially adversely affect the Company's liquidity and financial condition and limit the Company's ability to pay dividends to holders of the Company's Class A and Class C common stock.
Market interest rates may have an effect on the value of the Company's Class A and Class C common stock.
One of the factors that influences the price of shares of the Company's Class A and Class C common stock is the effective dividend yield of such shares (i.e., the yield as a percentage of the then market price of the Company's shares) relative to market interest rates. An increase in market interest rates, which are currently at low levels relative to historical rates, may lead investors of shares of the Company's Class A and Class C common stock to expect a higher dividend yield and the Company's inability to increase its dividend as a result of an increase in borrowing costs, insufficient CAFD or otherwise, could result in selling pressure on, and a decrease in the market prices of the Company's Class A and Class C common stock as investors seek alternative investments with higher yield.
If the Company is deemed to be an investment company, the Company may be required to institute burdensome compliance requirements and the Company's activities may be restricted, which may make it difficult for the Company to complete strategic acquisitions or effect combinations.
If the Company is deemed to be an investment company under the Investment Company Act of 1940, or the Investment Company Act, the Company's business would be subject to applicable restrictions under the Investment Company Act, which could make it impracticable for the Company to continue its business as contemplated. The Company believes it is not an investment company under Section 3(b)(1) of the Investment Company Act because the Company is primarily engaged in a non-investment company business. The Company intends to conduct its operations so that the Company will not be deemed an investment company. However, if the Company were to be deemed an investment company, restrictions imposed by the Investment Company Act, including limitations on the Company's capital structure and the Company's ability to transact with affiliates, could make it impractical for the Company to continue its business as contemplated.
Market volatility may affect the price of the Company's Class A and Class C common stock.
The market price of the Company's Class A and Class C common stock may fluctuate significantly in response to a number of factors, most of which the Company cannot predict or control, including general market and economic conditions, disruptions, downgrades, credit events and perceived problems in the credit markets; actual or anticipated variations in its quarterly operating results or dividends; natural disasters, wildfires and other weather-related events; changes in the Company's investments or asset composition; write-downs or perceived credit or liquidity issues affecting the Company's assets; market perception of GIP or CEG, the Company's business and the Company's assets; the Company's level of indebtedness and/or adverse market reaction to any indebtedness that the Company may incur in the future; the Company's ability to raise capital on favorable terms or at all; loss of any major funding source; changes in market valuations of similar power generation companies; and speculation in the press or investment community regarding the Company, GIP or CEG.
Securities markets in general have experienced extreme volatility that has often been unrelated to the operating performance of particular companies. Any broad market fluctuations may adversely affect the trading price of the Company's Class A and Class C common stock.
Furthermore, any significant disruption to the Company’s ability to access the capital markets, or a significant increase in interest rates, could make it difficult for the Company to successfully acquire attractive projects from third parties and may also limit the Company’s ability to obtain debt or equity financing to complete such acquisitions. If the Company is unable to raise adequate proceeds when needed to fund such acquisitions, the ability to grow the Company’s project portfolio may be limited, which could have a material adverse effect on the Company’s ability to implement its growth strategy and, ultimately, its business, financial condition, results of operations and cash flows.
Provisions of the Company's charter documents or Delaware law could delay or prevent an acquisition of the Company, even if the acquisition would be beneficial to holders of the Company's Class A and Class C common stock, and could make it more difficult to change management.
Provisions of the Company's amended and restated certificate of incorporation and fourth amended and restated bylaws may discourage, delay or prevent a merger, acquisition or other change in control that holders of the Company's Class A and Class C common stock may consider favorable, including transactions in which such stockholders might otherwise receive a premium for their shares. This is because these provisions may prevent or frustrate attempts by stockholders to replace or remove members of the Company's management. These provisions include:
•a prohibition on stockholder action through written consent;
•a requirement that special meetings of stockholders be called upon a resolution approved by a majority of the Company's directors then in office;
•advance notice requirements for stockholder proposals and nominations; and
•the authority of the board of directors to issue preferred stock with such terms as the board of directors may determine.
Section 203 of the Delaware General Corporation Law prohibits a publicly held Delaware corporation from engaging in a business combination with an interested stockholder, generally a person that together with its affiliates owns or within the last three years has owned 15% of voting stock, for a period of three years after the date of the transaction in which the person became an interested stockholder, unless the business combination is approved in a prescribed manner. Additionally, the Company's restated certificate of incorporation prohibits any person and any of its associate or affiliate companies in the aggregate, public utility or holding company from acquiring, other than secondary market transactions, an amount of the Company's Class A or Class C common stock sufficient to result in a transfer of control without the prior written consent of the Company's board of directors. Any such change of control, in addition to prior approval from the Company's board of directors, would require prior authorization from FERC. Similar restrictions may apply to certain purchasers of the Company's securities which are holding companies regardless of whether the Company's securities are purchased in offerings by the Company or NRG, in open market transactions or otherwise. A purchaser of the Company's securities which is a holding company will need to determine whether a given purchase of the Company's securities may require prior FERC approval.
Investors may experience dilution of ownership interest due to the future issuance of additional shares of the Company's Class A or Class C common stock.
The Company is in a capital intensive business, and may not have sufficient funds to finance the growth of the Company's business, future acquisitions or to support the Company's projected capital expenditures. As a result, the Company may require additional funds from further equity or debt financings, including tax equity financing transactions, sales under the ATM Program or sales of preferred shares or convertible debt to complete future acquisitions, expansions and capital expenditures and pay the general and administrative costs of the Company's business. In the future, the Company may issue shares under its ATM Program and the Company's previously authorized and unissued securities, resulting in the dilution of the ownership interests of purchasers of the Company's Class A and Class C common stock. Under the Company's restated certificate of incorporation, the Company is authorized to issue 500,000,000 shares of Class A common stock, 500,000,000 shares of Class B common stock, 1,000,000,000 shares of Class C common stock, 1,000,000,000 shares of Class D common stock and 10,000,000 shares of preferred stock with preferences and rights as determined by the Company's board of directors. The potential issuance of additional shares of common stock or preferred stock or convertible debt may create downward pressure on the trading price of the Company's Class A and Class C common stock.
If securities or industry analysts do not publish or cease publishing research or reports about the Company, the Company's business or the Company's market, or if they change their recommendations regarding the Company's Class A and/or Class C common stock adversely, the stock price and trading volume of the Company's Class A and/or Class C common stock could decline.
The trading market for the Company's Class A and Class C common stock is influenced by the research and reports that industry or securities analysts may publish about the Company, the Company's business, the Company's market or the Company's competitors. If any of the analysts who may cover the Company change their recommendation regarding the Company's Class A and/or Class C common stock adversely, or provide more favorable relative recommendations about the Company's competitors, the price of the Company's Class A and/or Class C common stock would likely decline. If any analyst who covers the Company were to cease coverage of the Company or fail to regularly publish reports on the Company, the Company could lose visibility in the financial markets, which in turn could cause the stock price or trading volume of the Company's Class A and/or Class C common stock to decline.
Future sales of the Company's Class A or Class C common stock by GIP may cause the price of the Company's Class A or Class C common stock to fall.
The market price of the Company's Class A or Class C common stock could decline as a result of sales by GIP of such shares (issuable to GIP upon the exchange of some or all of its Clearway Energy LLC Class B or Class D units, respectively) in the market, or the perception that these sales could occur.
The market price of the Company's Class A or Class C common stock may also decline as a result of GIP disposing or transferring some or all of the Company's outstanding Class B or Class D common stock, which disposals or transfers would reduce GIP's ownership interest in, and voting control over, the Company. These sales might also make it more difficult for the Company to sell equity securities at a time and price that the Company deems appropriate. GIP and certain of its affiliates have certain demand and piggyback registration rights with respect to shares of the Company's Class A common stock issuable upon the exchange of Clearway Energy LLC's Class B units and/or Class C common stock issuable upon the exchange of Clearway Energy LLC's Class D units. The presence of additional shares of the Company's Class A and/or Class C common stock trading in the public market, as a result of the exercise of such registration rights, may have a material adverse effect on the market price of the Company's securities.
Risks Related to Taxation
The Company's future tax liability may be greater than expected if the Company does not generate NOLs sufficient to offset taxable income, if federal, state and local tax authorities challenge certain of the Company’s tax positions and exemptions or if changes in federal, state and local tax laws occur.
The Company expects to generate NOLs and carryforward prior year NOL balances to offset future taxable income. Based on the Company's current portfolio of assets, which include renewable assets that benefit from accelerated tax depreciation deductions and federal tax credits, the Company does not expect to pay significant federal income tax for a period of approximately ten years. While the Company expects these losses will be available as a future benefit, in the event that they are not generated as expected, successfully challenged by the IRS or state and local jurisdictions (in a tax audit or otherwise) or subject to future limitations from a potential change in ownership, as discussed below, the Company's ability to realize these benefits may be limited. In addition, the Company’s ability to realize state and local tax exemptions, including property or sales and use tax exemptions, is subject to various tax laws. If these exemptions are successfully challenged by state and local jurisdictions or if a change in tax law occurs,
the Company’s ability to realize these exemptions could be affected. A reduction in the Company's expected NOLs, a limitation on the Company's ability to use such losses or tax credits, and challenges by tax authorities to the Company’s tax positions may result in a material increase in the Company's estimated future income, sales/use and property tax liability and may negatively impact the Company's liquidity and financial condition.
The Company's ability to use NOLs to offset future income may be limited.
The Company's ability to use NOLs could be substantially limited if the Company is unable to generate future taxable income or were to experience an "ownership change" as defined under Section 382 of the Code. In general, an "ownership change" would occur if the Company's "5-percent shareholders," as defined under Section 382 of the Code, collectively increased their ownership in the Company by more than 50 percentage points over a rolling three-year period. A corporation that experiences an ownership change will generally be subject to an annual limitation on the use of its pre-ownership change deferred tax assets equal to the equity value of the corporation immediately before the ownership change, multiplied by the long-term tax-exempt rate for the month in which the ownership change occurs. Future sales of any class of the Company's common stock by NRG,GIP, as well as future issuances by the Company, could contribute to a potential ownership change.
A valuation allowance may be required for the Company's deferred tax assets.
The Company's expected NOLs and tax credits will be reflected as a deferred tax asset as they are generated until utilized to offset income. Valuation allowances may need to be maintained for deferred tax assets that the Company estimates are more likely than not to be unrealizable, based on available evidence at the time the estimate is made. Valuation allowances related to deferred tax assets can be affected by changes to tax laws, statutory tax rates and future taxable income levels. In the event that the Company was to determine that it would not be able to realize all or a portion of the net deferred tax assets in the future, the Company would reduce such amounts through a charge to income tax expense in the period in which that determination was made, which could have a material adverse impact on the Company's financial condition and results of operations.
Distributions to holders of the Company's Class A and Class C common stock may be taxable.
The amount of distributions that will be treated as taxable for U.S. federal income tax purposes will depend on the amount of the Company's current and accumulated earnings and profits.It is difficult to predict whether the Company will generate earnings or profits as computed for federal income tax purposes in any given tax year.Generally, a corporation's earnings and profits are computed based upon taxable income, with certain specified adjustments.Distributions will constitute ordinary dividend income to the extent paid from the Company's current or accumulated earnings and profits. Distributions in excess of the Company’s current and accumulated earnings and profits andwill constitute a nontaxable return of capital to the extent of a stockholder's basis in his or her Class A or Class C common stock. Distributions in excess of the Company's current and accumulated earnings and profits and in excess of a stockholder's basis will be treated as gain from the sale of the common stock.
For U.S. tax purposes, the Company's distributions to its stockholders in 20172020 and 20162019 are classified for U.S. federal income tax purposes as a nontaxable return of capital and reduction of a U.S. stockholder's tax basis, to the extent of a U.S. stockholder's tax basis in each of the Company's common shares, with any remaining amount being taxed as a capital gain.
CAUTIONARY STATEMENT REGARDING FORWARD-LOOKING INFORMATION
This Annual Report on Form 10-K of NRG Yield,Clearway Energy, Inc., together with its consolidated subsidiaries, or the Company, includes forward-looking statements within the meaning of Section 27A of the Securities Act of 1933, as amended, or the Securities Act, and Section 21E of the Securities Exchange Act of 1934, as amended, or the Exchange Act. The words "believes," "projects," "anticipates," "plans," "expects," "intends," "estimates" and similar expressions are intended to identify forward-looking statements. These forward-looking statements involve known and unknown risks, uncertainties and other factors that may cause the Company's actual results, performance and achievements, or industry results, to be materially different from any future results, performance or achievements expressed or implied by such forward-looking statements. These factors, risks and uncertainties include the factors described under Item 1A — Risk Factors and the following:
•The Company's ability to maintain and grow its quarterly dividend;
•Potential risks related to COVID-19 or any other pandemic;
•Potential risks related to the Company as a result of the NRG Transaction;Company's relationships with GIP and CEG;
•The Company's ability to successfully identify, evaluate and consummate acquisitions from third parties;
•The Company's ability to acquire assets from NRG;GIP or CEG;
•The Company's ability to raise additional capital due to its indebtedness, corporate structure, market conditions or otherwise;
•Changes in law, including judicial decisions;
•Hazards customary to the power production industry and power generation operations such as fuel and electricity price volatility, unusual weather conditions (including wind and solar conditions), catastrophic weather-related or other damage to facilities, unscheduled generation outages, maintenance or repairs, unanticipated changes to fuel supply costs or availability due to higher demand, shortages, transportation problems or other developments, environmental incidents, or electric transmission or gas pipeline system constraints and the possibility that the Company may not have adequate insurance to cover losses as a result of such hazards;
•The Company's ability to operate its businesses efficiently, manage maintenance capital expenditures and costs effectively, and generate earnings and cash flows from its asset-based businesses in relation to its debt and other obligations;
•The willingness and ability of counterparties to the Company's offtake agreements to fulfill their obligations under such agreements;
•The Company's ability to enter into contracts to sell power and procure fuel on acceptable terms and prices as current offtake agreements expire;
•Government regulation, including compliance with regulatory requirements and changes in market rules, rates, tariffs and environmental laws;
•Operating and financial restrictions placed on the Company that are contained in the project-level debt facilities and other agreements of certain subsidiaries and project-level subsidiaries generally, in the NRG YieldClearway Energy Operating LLC amended and restated revolving credit facility, in the indentures governing the Senior Notes and in the indentures governing the Company's convertible notes;
•Cyber terrorism and inadequate cybersecurity, or the occurrence of a catastrophic loss and the possibility that the Company may not have adequate insurance to cover losses resulting from such hazards or the inability of the Company's insurers to provide coverage;
•The Company's ability to engage in successful mergers and acquisitions activity; and
•The Company's ability to borrow additional funds and access capital markets, as well as the Company's substantial indebtedness and the possibility that the Company may incur additional indebtedness going forward.
Forward-looking statements speak only as of the date they were made, and the Company undertakes no obligation to publicly update or revise any forward-looking statements, whether as a result of new information, future events or otherwise. The foregoing review of factors that could cause the Company's actual results to differ materially from those contemplated in any forward-looking statements included in this Annual Report on Form 10-K should not be construed as exhaustive.
Item 1B — Unresolved Staff Comments
None.
Item 2 — Properties
Listed below are descriptions of the Company's interests in facilities, operations and/or projects owned or leased as of December 31, 2017.2020.
| | | | | | | | | | | | | | | | | | | | | | | | | | | | | | | | | | | | | | | | | | | | | | | | | | |
| | | | Capacity | | | | | | | | | | |
| | | | Rated MW | | Net MW(a) | | Owner-ship | | | | | | PPA Terms |
| Assets | | Location | | | | | Fuel | | COD | | Counterparty | | Expiration |
| Conventional | | | | | | | | | | | | | | | | |
| Carlsbad | | Carlsbad, CA | | 527 | | | 527 | | | 100 | % | | Natural Gas | | December 2018 | | San Diego Gas & Electric | | 2038 |
| El Segundo | | El Segundo, CA | | 550 | | | 550 | | | 100 | % | | Natural Gas | | August 2013 | | SCE | | 2023 |
| GenConn Devon | | Milford, CT | | 190 | | | 95 | | | 50 | % | | Natural Gas/Oil | | June 2010 | | Connecticut Light & Power | | 2040 |
| GenConn Middletown | | Middletown, CT | | 190 | | | 95 | | | 50 | % | | Natural Gas/Oil | | June 2011 | | Connecticut Light & Power | | 2041 |
| Marsh Landing | | Antioch, CA | | 720 | | | 720 | | | 100 | % | | Natural Gas | | May 2013 | | PG&E | | 2023 |
| Walnut Creek | | City of Industry, CA | | 485 | | | 485 | | | 100 | % | | Natural Gas | | May 2013 | | SCE | | 2023 |
| Total Conventional | | 2,662 | | | 2,472 | | | | | | | | | | | |
| Utility Scale Solar | | | | | | | | | | | | | | |
| Agua Caliente | | Dateland, AZ | | 290 | | | 46 | | | 16 | % | | Solar | | June 2014 | | PG&E | | 2039 |
| Alpine | | Lancaster, CA | | 66 | | | 66 | | | 100 | % | | Solar | | January 2013 | | PG&E | | 2033 |
| Avenal | | Avenal, CA | | 45 | | | 23 | | | 50 | % | | Solar | | August 2011 | | PG&E | | 2031 |
| Avra Valley | | Pima County, AZ | | 27 | | | 27 | | | 100 | % | | Solar | | December 2012 | | Tucson Electric Power | | 2032 |
| Blythe | | Blythe, CA | | 21 | | | 21 | | | 100 | % | | Solar | | December 2009 | | SCE | | 2029 |
| Borrego | | Borrego Springs, CA | | 26 | | | 26 | | | 100 | % | | Solar | | February 2013 | | San Diego Gas and Electric | | 2038 |
Buckthorn Solar (b) | | Fort Stockton, TX | | 154 | | | 154 | | | 100 | % | | Solar | | July 2018 | | City of Georgetown, TX | | 2043 |
| CVSR | | San Luis Obispo, CA | | 250 | | | 250 | | | 100 | % | | Solar | | October 2013 | | PG&E | | 2038 |
| Desert Sunlight 250 | | Desert Center, CA | | 250 | | | 63 | | | 25 | % | | Solar | | December 2014 | | SCE | | 2034 |
| Desert Sunlight 300 | | Desert Center, CA | | 300 | | | 75 | | | 25 | % | | Solar | | December 2014 | | PG&E | | 2039 |
| Kansas South | | Lemoore, CA | | 20 | | | 20 | | | 100 | % | | Solar | | June 2013 | | PG&E | | 2033 |
Kawailoa (b) | | Oahu, HI | | 49 | | | 24 | | | 48 | % | | Solar | | November 2019 | | Hawaiian Electric Company | | 2041 |
Oahu Solar Projects (b) | | Oahu, HI | | 61 | | | 58 | | | 95 | % | | Solar | | September 2019 | | Hawaiian Electric Company | | 2041 |
| Roadrunner | | Santa Teresa, NM | | 20 | | | 20 | | | 100 | % | | Solar | | August 2011 | | El Paso Electric | | 2031 |
Rosamond Central (b) | | Rosamond, CA | | 192 | | | 96 | | | 50 | % | | Solar | | December 2020 | | Various | | 2035 |
| TA High Desert | | Lancaster, CA | | 20 | | | 20 | | | 100 | % | | Solar | | March 2013 | | SCE | | 2033 |
Utah Solar Portfolio (b) | | Various | | 530 | | | 265 | | | 50 | % | | Solar | | July - September 2016 | | PacifiCorp | | 2036 |
| Total Utility Scale Solar | | 2,321 | | | 1,254 | | | | | | | | | | | |
| Distributed Solar | | | | | | | | | | | | | | |
DGPV Fund Projects (b) | | Various | | 286 | | | 286 | | | 100 | % | | Solar | | September 2015 - March 2019 | | Various | | 2030 - 2044 |
| Solar Power Partners (SPP) Projects | | Various | | 25 | | | 25 | | | 100 | % | | Solar | | June 2008 - June 2012 | | Various | | 2026 - 2037 |
| Other DG Projects | | Various | | 21 | | | 21 | | | 100 | % | | Solar | | December 2010 - October 2015 | | Various | | 2023 - 2039 |
| Total Distributed Solar | | 332 | | | 332 | | | | | | | | | | | |
|
| | | | | | | | | | | | | | | | | | | |
| | | | | Capacity | | | | | | | | | | |
| | | | | Rated MW | | Net MW(a) | | Owner-ship | | | | | | PPA Terms |
| Assets | | Location | | | | | Fuel | | COD | | Counterparty | | Expiration |
| Conventional | | | | | | | | | | | | | | | | |
| El Segundo | | El Segundo, CA | | 550 |
| | 550 |
| | 100 | % | | Natural Gas | | August 2013 | | Southern California Edison | | 2023 |
| GenConn Devon | | Milford, CT | | 190 |
| | 95 |
| | 50 | % | | Natural Gas/Oil | | June 2010 | | Connecticut Light & Power | | 2040 |
| GenConn Middletown | | Middletown, CT | | 190 |
| | 95 |
| | 50 | % | | Natural Gas/Oil | | June 2011 | | Connecticut Light & Power | | 2041 |
| Marsh Landing | | Antioch, CA | | 720 |
| | 720 |
| | 100 | % | | Natural Gas | | May 2013 | | Pacific Gas and Electric | | 2023 |
| Walnut Creek | | City of Industry, CA | | 485 |
| | 485 |
| | 100 | % | | Natural Gas | | May 2013 | | Southern California Edison | | 2023 |
| Total Conventional | | 2,135 |
| | 1,945 |
| | | | | | | | | | |
| Utility Scale Solar | | | | | | | | | | | | | | |
| Agua Caliente | | Dateland, AZ | | 290 |
| | 46 |
| | 16 | % | | Solar | | June 2014 | | Pacific Gas and Electric | | 2039 |
| Alpine | | Lancaster, CA | | 66 |
| | 66 |
| | 100 | % | | Solar | | January 2013 | | Pacific Gas and Electric | | 2033 |
| Avenal | | Avenal, CA | | 45 |
| | 23 |
| | 50 | % | | Solar | | August 2011 | | Pacific Gas and Electric | | 2031 |
| Avra Valley | | Pima County, AZ | | 26 |
| | 26 |
| | 100 | % | | Solar | | December 2012 | | Tucson Electric Power | | 2032 |
| Blythe | | Blythe, CA | | 21 |
| | 21 |
| | 100 | % | | Solar | | December 2009 | | Southern California Edison | | 2029 |
| Borrego | | Borrego Springs, CA | | 26 |
| | 26 |
| | 100 | % | | Solar | | February 2013 | | San Diego Gas and Electric | | 2038 |
| CVSR | | San Luis Obispo, CA | | 250 |
| | 250 |
| | 100 | % | | Solar | | October 2013 | | Pacific Gas and Electric | | 2038 |
| Desert Sunlight 250 | | Desert Center, California | | 250 |
| | 63 |
| | 25 | % | | Solar | | December 2014 | | Southern California Edison | | 2034 |
| Desert Sunlight 300 | | Desert Center, California | | 300 |
| | 75 |
| | 25 | % | | Solar | | December 2014 | | Pacific Gas and Electric | | 2039 |
| Four Brothers Solar | | New Castle/Milford, UT | | 320 |
| | 160 |
| | 50 | % | | Solar | | July 2016 - August 2016 | | PacifiCorp | | 2036 |
| Granite Mountain | | Cedar City, UT | | 130 |
| | 65 |
| | 50 | % | | Solar | | September 2016 | | PacifiCorp | | 2036 |
| Iron Springs | | Cedar City, UT | | 80 |
| | 40 |
| | 50 | % | | Solar | | August 2016 | | PacifiCorp | | 2036 |
| Kansas South | | Lemoore, CA | | 20 |
| | 20 |
| | 100 | % | | Solar | | June 2013 | | Pacific Gas and Electric | | 2033 |
| Roadrunner | | Santa Teresa, NM | | 20 |
| | 20 |
| | 100 | % | | Solar | | August 2011 | | El Paso Electric | | 2031 |
| TA High Desert | | Lancaster, CA | | 20 |
| | 20 |
| | 100 | % | | Solar | | March 2013 | | Southern California Edison | | 2033 |
| Total Utility Scale Solar | | 1,864 |
| | 921 |
| | | | | | | | | | |
| Distributed Solar | | | | | | | | | | | | | | |
| Apple I LLC Projects | | CA | | 9 |
| | 9 |
| | 100 | % | | Solar | | October 2012 - December 2012 | | Various | | 2032 |
| AZ DG Solar Projects | | AZ | | 5 |
| | 5 |
| | 100 | % | | Solar | | December 2010 - January 2013 | | Various | | 2025-2033 |
| SPP Projects | | Various | | 25 |
| | 25 |
| | 100 | % | | Solar | | June 2008 - June 2012 | | Various | | 2026-2037 |
| Other DG Projects | | Various | | 13 |
| | 13 |
| | 100 | % | | Solar | | October 2012 - October 2015 | | Various | | 2023-2039 |
| Total Distributed Solar | | 52 |
| | 52 |
| | | | | | | | | | |
| Wind | | | | | | | | | | | | | | |
| Alta I | | Tehachapi, CA | | 150 |
| | 150 |
| | 100 | % | | Wind | | December 2010 | | Southern California Edison | | 2035 |
| Alta II | | Tehachapi, CA | | 150 |
| | 150 |
| | 100 | % | | Wind | | December 2010 | | Southern California Edison | | 2035 |
| | | | | | | | | | | | | | | | | | | | | | | | | | | | | | | | | | | | | | | | | | | | | | | | | | |
| | | | Capacity | | | | | | | | | | |
| | | | Rated MW | | Net MW(a) | | Owner-ship | | | | | | PPA Terms |
| Assets | | Location | | | | | Fuel | | COD | | Counterparty | | Expiration |
| Wind | | | | | | | | | | | | | | |
| Alta I | | Tehachapi, CA | | 150 | | | 150 | | | 100 | % | | Wind | | December 2010 | | SCE | | 2035 |
| Alta II | | Tehachapi, CA | | 150 | | | 150 | | | 100 | % | | Wind | | December 2010 | | SCE | | 2035 |
| Alta III | | Tehachapi, CA | | 150 | | | 150 | | | 100 | % | | Wind | | February 2011 | | SCE | | 2035 |
| Alta IV | | Tehachapi, CA | | 102 | | | 102 | | | 100 | % | | Wind | | March 2011 | | SCE | | 2035 |
| Alta V | | Tehachapi, CA | | 168 | | | 168 | | | 100 | % | | Wind | | April 2011 | | SCE | | 2035 |
Alta X (b) | | Tehachapi, CA | | 137 | | | 137 | | | 100 | % | | Wind | | February 2014 | | SCE | | 2038 |
Alta XI (b) | | Tehachapi, CA | | 90 | | | 90 | | | 100 | % | | Wind | | February 2014 | | SCE | | 2038 |
| Buffalo Bear | | Buffalo, OK | | 19 | | | 19 | | | 100 | % | | Wind | | December 2008 | | Western Farmers Electric Co-operative | | 2033 |
| Crosswinds | | Ayrshire, IA | | 21 | | | 21 | | | 99 | % | | Wind | | June 2007 | | Corn Belt Power Cooperative | | 2027 |
Elbow Creek (b) | | Howard County, TX | | 122 | | | 122 | | | 100 | % | | Wind | | December 2008 | | Various | | 2029 |
| Elkhorn Ridge | | Bloomfield, NE | | 81 | | | 54 | | | 66.7 | % | | Wind | | March 2009 | | Nebraska Public Power District | | 2029 |
| Forward | | Berlin, PA | | 29 | | | 29 | | | 100 | % | | Wind | | April 2008 | | Constellation NewEnergy, Inc. | | 2022 |
| Goat Wind | | Sterling City, TX | | 150 | | | 150 | | | 100 | % | | Wind | | April 2008/June 2009 | | Dow Pipeline Company | | 2025 |
| Hardin | | Jefferson, IA | | 15 | | | 15 | | | 99 | % | | Wind | | May 2007 | | Interstate Power and Light Company | | 2027 |
Langford (b) | | Christoval, TX | | 160 | | | 160 | | | 100 | % | | Wind | | December 2009/November 2020 | | Goldman Sachs | | 2033 |
| Laredo Ridge | | Petersburg, NE | | 80 | | | 80 | | | 100 | % | | Wind | | February 2011 | | Nebraska Public Power District | | 2031 |
Lookout (b) | | Berlin, PA | | 38 | | | 38 | | | 100 | % | | Wind | | October 2008 | | Southern Maryland Electric Cooperative | | 2030 |
Mesquite Star(b) | | Fisher County, TX | | 419 | | | 210 | | | 50 | % | | Wind | | June 2020 | | Various | | 2032 - 2035 |
| Ocotillo | | Forsan, TX | | 59 | | | 59 | | | 100 | % | | Wind | | November 2008 | | N/A | | |
| Odin | | Odin, MN | | 20 | | | 20 | | | 100 | % | | Wind | | June 2008 | | Missouri River Energy Services | | 2028 |
| Pinnacle | | Keyser, WV | | 55 | | | 55 | | | 100 | % | | Wind | | December 2011 | | Maryland Department of General Services and University System of Maryland | | 2031 |
| San Juan Mesa | | Elida, NM | | 120 | | | 90 | | | 75 | % | | Wind | | December 2005 | | Southwestern Public Service Company | | 2025 |
| Sleeping Bear | | Woodward, OK | | 95 | | | 95 | | | 100 | % | | Wind | | October 2007 | | Public Service Company of Oklahoma | | 2032 |
| South Trent | | Sweetwater, TX | | 101 | | | 101 | | | 100 | % | | Wind | | January 2009 | | AEP Energy Partners | | 2029 |
| Spanish Fork | | Spanish Fork, UT | | 19 | | | 19 | | | 100 | % | | Wind | | July 2008 | | PacifiCorp | | 2028 |
Spring Canyon II (b) | | Logan County, CO | | 32 | | | 31 | | | 90.1 | % | | Wind | | October 2014 | | Platte River Power Authority | | 2039 |
Spring Canyon III (b) | | Logan County, CO | | 28 | | | 26 | | | 90.1 | % | | Wind | | December 2014 | | Platte River Power Authority | | 2039 |
| Taloga | | Putnam, OK | | 130 | | | 130 | | | 100 | % | | Wind | | July 2011 | | Oklahoma Gas & Electric | | 2031 |
Wildorado (b) | | Vega, TX | | 161 | | | 161 | | | 100 | % | | Wind | | April 2007 | | Southwestern Public Service Company | | 2027 |
| Total Wind | | 2,901 | | | 2,632 | | | | | | | | | | | |
|
| | | | | | | | | | | | | | | | | | | |
| | | | | Capacity | | | | | | | | | | |
| | | | | Rated MW | | Net MW(a) | | Owner-ship | | | | | | PPA Terms |
| Assets | | Location | | | | | Fuel | | COD | | Counterparty | | Expiration |
| Alta III | | Tehachapi, CA | | 150 |
| | 150 |
| | 100 | % | | Wind | | February 2011 | | Southern California Edison | | 2035 |
| Alta IV | | Tehachapi, CA | | 102 |
| | 102 |
| | 100 | % | | Wind | | March 2011 | | Southern California Edison | | 2035 |
| Alta V | | Tehachapi, CA | | 168 |
| | 168 |
| | 100 | % | | Wind | | April 2011 | | Southern California Edison | | 2035 |
Alta X (b) | | Tehachapi, CA | | 137 |
| | 137 |
| | 100 | % | | Wind | | February 2014 | | Southern California Edison | | 2038 |
Alta XI (b) | | Tehachapi, CA | | 90 |
| | 90 |
| | 100 | % | | Wind | | February 2014 | | Southern California Edison | | 2038 |
| Buffalo Bear | | Buffalo, OK | | 19 |
| | 19 |
| | 100 | % | | Wind | | December 2008 | | Western Farmers Electric Co-operative | | 2033 |
Crosswinds (b) | | Ayrshire, IA | | 21 |
| | 21 |
| | 99 | % | | Wind | | June 2007 | | Corn Belt Power Cooperative | | 2027 |
Elbow Creek (b) | | Howard County, TX | | 122 |
| | 122 |
| | 100 | % | | Wind | | December 2008 | | NRG Power Marketing LLC | | 2022 |
Elkhorn Ridge (b) | | Bloomfield, NE | | 81 |
| | 54 |
| | 66.7 | % | | Wind | | March 2009 | | Nebraska Public Power District | | 2029 |
Forward (b) | | Berlin, PA | | 29 |
| | 29 |
| | 100 | % | | Wind | | April 2008 | | Constellation NewEnergy, Inc. | | 2022 |
Goat Wind (b) | | Sterling City, TX | | 150 |
| | 150 |
| | 100 | % | | Wind | | April 2008/June 2009 | | Dow Pipeline Company | | 2025 |
Hardin (b) | | Jefferson, IA | | 15 |
| | 15 |
| | 99 | % | | Wind | | May 2007 | | Interstate Power and Light Company | | 2027 |
| Laredo Ridge | | Petersburg, NE | | 80 |
| | 80 |
| | 100 | % | | Wind | | February 2011 | | Nebraska Public Power District | | 2031 |
Lookout (b) | | Berlin, PA | | 38 |
| | 38 |
| | 100 | % | | Wind | | October 2008 | | Southern Maryland Electric Cooperative | | 2030 |
Odin (b) | | Odin, MN | | 20 |
| | 20 |
| | 99.9 | % | | Wind | | June 2008 | | Missouri River Energy Services | | 2028 |
| Pinnacle | | Keyser, WV | | 55 |
| | 55 |
| | 100 | % | | Wind | | December 2011 | | Maryland Department of General Services and University System of Maryland | | 2031 |
San Juan Mesa (b) | | Elida, NM | | 120 |
| | 90 |
| | 75 | % | | Wind | | December 2005 | | Southwestern Public Service Company | | 2025 |
Sleeping Bear (b) | | Woodward, OK | | 95 |
| | 95 |
| | 100 | % | | Wind | | October 2007 | | Public Service Company of Oklahoma | | 2032 |
| South Trent | | Sweetwater, TX | | 101 |
| | 101 |
| | 100 | % | | Wind | | January 2009 | | AEP Energy Partners | | 2029 |
Spanish Fork (b) | | Spanish Fork, UT | | 19 |
| | 19 |
| | 100 | % | | Wind | | July 2008 | | PacifiCorp | | 2028 |
Spring Canyon II (b) | | Logan County, CO | | 32 |
| | 29 |
| | 90.1 | % | | Wind | | October 2014 | | Platte River Power Authority | | 2039 |
Spring Canyon III(b) | | Logan County, CO | | 28 |
| | 25 |
| | 90.1 | % | | Wind | | December 2014 | | Platte River Power Authority | | 2039 |
| Taloga | | Putnam, OK | | 130 |
| | 130 |
| | 100 | % | | Wind | | July 2011 | | Oklahoma Gas & Electric | | 2031 |
Wildorado (b) | | Vega, TX | | 161 |
| | 161 |
| | 100 | % | | Wind | | April 2007 | | Southwestern Public Service Company | | 2027 |
| Total Wind | | 2,263 |
| | 2,200 |
| | | | | | | | | | |
| Thermal Generation | | | | | | | | | | | | | | |
| Dover | | Dover, DE | | 103 |
| | 103 |
| | 100 | % | | Natural Gas | | June 2013 | | NRG Power Marketing LLC |
| 2018 |
| Paxton Creek Cogen | | Harrisburg, PA | | 12 |
| | 12 |
| | 100 | % | | Natural Gas | | November 1986 | | Power sold into PJM markets |
| Princeton Hospital | | Princeton, NJ | | 5 |
| | 5 |
| | 100 | % | | Natural Gas | | January 2012 | | Excess power sold to local utility |
| Tucson Convention Center | | Tucson, AZ | | 2 |
| | 2 |
| | 100 | % | | Natural Gas | | January 2003 | | Excess power sold to local utility |
| University of Bridgeport | | Bridgeport, CT | | 1 |
| | 1 |
| | 100 | % | | Natural Gas | | April 2015 | | University of Bridgeport | | 2034 |
| Total Thermal Generation | | 123 |
| | 123 |
| | | | | | | | | | |
Total NRG Yield, Inc. (c) | | 6,437 |
| | 5,241 |
| | | | | | | | | | |
| | | | | | | | | | | | | | | | | | | | | | | | | | | | | | | | | | | | | | | | | | | | | | | | | | |
| | | | Capacity | | | | | | | | | | |
| | | | Rated MW | | Net MW(a) | | Owner-ship | | | | | | PPA Terms |
| Assets | | Location | | | | | Fuel | | COD | | Counterparty | | Expiration |
| Thermal Generation | | | | | | | | | | | | | | |
| CA Fuel Cell | | Tulare, CA | | 3 | | | 3 | | | 100 | % | | Natural Gas | | May 2018 | | City of Tulare | | 2038 |
| ECP Uptown Campus | | Pittsburgh, PA | | 6 | | | 6 | | | 100 | % | | Natural Gas | | May 2019 | | Duquesne University | | 2029 |
| Energy Center - Pittsburgh | | Pittsburgh, PA | | 7 | | | 7 | | | 100 | % | | Diesel | | January 2019 | | University of Pittsburgh Medical Center | | 2038 |
| Energy Center Caguas | | Caguas, PR | | 3 | | | 3 | | | 100 | % | | Natural Gas | | September 2020 | | Viatris Pharmaceuticals | | 2032 |
| Paxton Creek Cogen | | Harrisburg, PA | | 12 | | | 12 | | | 100 | % | | Natural Gas | | November 1986 | | Power sold into PJM markets |
| Princeton Hospital | | Princeton, NJ | | 5 | | | 5 | | | 100 | % | | Natural Gas | | January 2012 | | Excess power sold to local utility |
| Tucson Convention Center | | Tucson, AZ | | 2 | | | 2 | | | 100 | % | | Natural Gas | | January 2003 | | Excess power sold to local utility |
| University of Bridgeport | | Bridgeport, CT | | 1 | | | 1 | | | 100 | % | | Natural Gas | | April 2015 | | University of Bridgeport | | 2034 |
| Total Thermal Generation | | 39 | | | 39 | | | | | | | | | | | |
| Total Clearway Energy, Inc. | | 8,255 | | | 6,729 | | | | | | | | | | | |
| | | | | | | | | | | | | | | | |
(a)Net capacity represents the maximum, or rated, generating capacity of the facility multiplied by the Company's percentage ownership in the facility as of December 31, 2017.2020.
(b) Projects are part of tax equity arrangements, as further described in Item 15 —Note 2, Summary of Significant Accounting Policies.Policies.
(c) NRG Yield's total generation capacity is net of 6 MWs for noncontrolling interest for Spring Canyon II and III. NRG Yield's generation capacity including this noncontrolling interest was 5,247 MWs.
In addition to the facilities owned or leased in the table above, the Company entered into partnerships to own or purchase solar power generation projects, as well as other ancillary related assets from a related party via intermediate funds. The Company does not consolidate these partnerships and accounts for them as equity method investments. The Company's net interest in these projects is 247 MW based on cash to be distributed. For further discussions, refer to Item 15 — Note 5, Investments Accounted for by the Equity Method and Variable Interest Entities to the Consolidated Financial Statements.
The following table summarizes the Company's thermal steam and chilled water facilities as of December 31, 2017:2020:
| | | | | | | | | | | | | | | | | | | | | | | | | | | | | | | | |
| Name and Location of Facility | | Thermal Energy Customers (steam/chilled water) | | % Owned | | Rated Megawatt
Thermal
Equivalent
Capacity (MWt) | | Net Megawatt Thermal Equivalent Capacity (MWt) (a) | | Generating
Capacity |
| Energy Center Minneapolis, MN | | 100 steam | | 100 | % | | 286 | | 286 | | Steam: 1,075 MMBtu/hr. |
| | 55 chilled water | | 100 | % | | 129 | | 129 | | | Chilled water: 38,700 tons |
| ECP Uptown Campus, PA | | Duquesne University | | 100 | % | | 53 | | 53 | | | Steam: 181 MMBtu/hr. |
| | Duquesne University | | 100 | % | | 24 | | | 24 | | | Chilled water: 5,790 tons |
| Energy Center San Francisco, CA | | 180 steam | | 100 | % | | 133 | | | 133 | | | Steam: 454 MMBtu/hr. |
| Energy Center Omaha, NE | | 60 steam | | 100 | % | | 198 | | 198 | | Steam: 675 MMBtu/hr. |
| | 65 chilled water | | 100 | % | | 99 | | 99 | | Chilled water: 28,000 tons |
| Energy Center Harrisburg, PA | | 115 steam | | 100 | % | | 94 | | 94 | | Steam: 370 MMBtu/hr. |
| | 5 chilled water | | 100 | % | | 14 | | | 14 | | | Chilled water: 3,900 tons |
| Energy Center Phoenix, AZ | | 40 chilled water | | 73 % (b) | | 144 | | 104 | | Chilled water 41,020 tons |
| | | | 24 | % | | 5 | | | 1 | | | Steam: 17 MMBtu/hr. |
| Energy Center Pittsburgh, PA | | 25 steam | | 100 | % | | 118 | | 118 | | Steam: 452 MMBtu/hr. |
| | 30 chilled water | | 100 | % | | 68 | | | 68 | | | Chilled water: 22,224 tons |
| Energy Center San Diego, CA | | 20 chilled water | | 100 | % | | 31 | | | 31 | | | Chilled water: 9,295 tons |
| Energy Center Princeton, NJ | | Princeton HealthCare System | | 100 | % | | 21 | | | 21 | | | Steam: 72 MMBtu/hr. |
| | Princeton HealthCare System | | 100 | % | | 17 | | | 17 | | | Chilled water: 4,700 tons |
| Energy Center Caguas, PR | | Viatris Pharmaceuticals | | 100 | % | | 1 | | | 1 | | | Steam: 4 MMBtu/hr. |
| | Viatris Pharmaceuticals | | 100 | % | | 3 | | | 3 | | | Chilled water: 800 tons |
| Total generating capacity | | | | | | 1,438 | | | 1,394 | | | |
|
| | | | | | | | | | | | |
| Name and Location of Facility | | Thermal Energy Purchaser | | % Owned | | Rated Megawatt
Thermal
Equivalent
Capacity (MWt) | | Net Megawatt
Thermal
Equivalent
Capacity (MWt) | | Generating
Capacity |
| NRG Energy Center Minneapolis, MN | | Approx. 100 steam and 55 chilled water customers | | 100 | | 322
136 |
| | 322
136 |
| | Steam: 1,100 MMBtu/hr.
Chilled water: 38,700 tons |
NRG Energy Center
San Francisco, CA | | Approx. 180 steam customers | | 100 | | 133 |
| | 133 |
| | Steam: 454 MMBtu/hr. |
NRG Energy Center
Omaha, NE | | Approx. 60 steam and 65 chilled water customers | | 100
12(a)
100
0(a) | | 142
73
77
26 |
| | 142
9
77
0 |
| | Steam: 485 MMBtu/hr
Steam: 250 MMBtu/hr
Chilled water: 22,000 tons
Chilled water: 7,250 tons |
| NRG Energy Center Harrisburg, PA | | Approx. 125 steam and 5 chilled water customers | | 100 | | 108
13 |
|
| 108
13 |
| | Steam: 370 MMBtu/hr.
Chilled water: 3,600 tons |
| NRG Energy Center Phoenix, AZ | | Approx. 35 chilled water customers | | 24(a)
100
12(a)
0(a) | | 5 104 14 28 |
| | 1 104 2 0 |
| | Steam: 17 MMBtu/hr
Chilled water: 29,600 tons
Chilled water: 3,920 tons
Chilled water: 8,000 tons |
| NRG Energy Center Pittsburgh, PA | | Approx. 25 steam and 25 chilled water customers | | 100 | | 88
49 |
| | 88
49 |
| | Steam: 302 MMBtu/hr.
Chilled water: 13,874 tons |
NRG Energy Center
San Diego, CA | | Approx. 20 chilled water customers | | 100 | | 31 |
| | 31 |
| | Chilled water: 8,825 tons |
NRG Energy Center
Dover, DE | | Kraft Heinz Company; Proctor and Gamble | | 100 | | 66 |
| | 66 |
| | Steam: 225 MMBtu/hr. |
| NRG Energy Center Princeton, NJ | | Princeton HealthCare System | | 100 | | 21
17 |
| | 21
17 |
| | Steam: 72 MMBtu/hr.
Chilled water: 4,700 tons |
| | | Total Generating Capacity (MWt) | | | | 1,453 |
| | 1,319 |
| | |
(a)Net megawatt thermal equivalent capacity represents the maximum, or rated, generating capacity of the facility multiplied by the Company's percentage ownership in the facility as of December 31, 2020.
(b) Net MWt capacity excludes 13443 MWt available under the right-to-use provisions contained in agreements between twoone of the Company's thermal facilities and certain of its customers.
Other Properties
Through the Management Services Agreement with NRG, the Company utilizes NRG's leased corporate headquarters offices at 804 Carnegie Center, Princeton, New Jersey.
Item 3 — Legal Proceedings
See Item 15 — Note 16, Commitments and Contingencies, to the Consolidated Financial Statements for discussion of the material legal proceedings to which the Company is a party.party or of which any of its properties is subject.
Item 4 — Mine Safety Disclosures
Not applicable.
PART II
Item 5 — Market for Registrant's Common Equity, Related Stockholder Matters and Issuer Purchases of Equity Securities
Market Information, Equity Holders and Dividends
The Company's Class A common stock and Class C common stock are listed on the New York Stock Exchange and trade under the ticker symbols "NYLD.A""CWEN.A" and "NYLD,"CWEN," respectively. The Company's Class B common stock and Class D common stock are not publicly traded.
As of January 31, 2018,2021, there were two holders of record of the Class A common stock, one holder of record of the Class B common stock, twothree holders of record of the Class C common stock and one holder of record of the Class D common stock.
The following table sets forth, for the period indicated, the high and low sales prices, the closing price of the Company's Class A and Class C common stock as reported by the New York Stock Exchange, as well as dividends per common share paid during those periods.
|
| | | | | | | | | | | | | | | |
| Common Stock Price Class A | Fourth Quarter 2017 | | Third Quarter 2017 | | Second Quarter 2017 | | First Quarter 2017 | | Fourth Quarter 2016 | | Third Quarter 2016 | | Second Quarter 2016 | | First Quarter 2016 |
| High | $19.91 | | $19.54 | | $17.84 | | $17.53 | | $16.50 | | $17.78 | | $15.97 | | $14.12 |
| Low | 18.03 | | 16.47 | | 16.08 | | 15.03 | | 13.40 | | 14.93 | | 13.01 | | 9.83 |
| Closing | 18.85 | | 18.97 | | 17.06 | | 17.39 | | 15.36 | | 16.32 | | 15.22 | | 13.57 |
| Dividends Per Common Share | $0.288 | | $0.28 | | $0.27 | | $0.26 | | $0.25 | | $0.24 | | $0.23 | | $0.225 |
| Common Stock Price Class C | | | | | | | | | | | | | | | |
| High | $20.15 | | $20.00 | | $18.35 | | $18.20 | | $17.01 | | $18.56 | | $16.78 | | $14.93 |
| Low | 18.20 | | 16.95 | | 16.45 | | 15.42 | | 13.98 | | 15.33 | | 13.78 | | $10.49 |
| Closing | 18.90 | | 19.30 | | 17.60 | | 17.70 | | 15.80 | | 16.96 | | 15.59 | | $14.24 |
| Dividends Per Common Share | $0.288 | | $0.28 | | $0.27 | | $0.26 | | $0.25 | | $0.24 | | $0.23 | | $0.225 |
On February 15, 2018,12, 2021 the Company declared a quarterly dividend on its Class A and Class C common stock of $0.298$0.324 per share payable on March 15, 2018,2021, to stockholders of record as of March 1, 2018.2021.
The Company's Class A and Class C common stock dividends are subject to available capital, market conditions, and compliance with associated laws and regulations. The Company expects that, based on current circumstances, comparable cash dividends will continue to be paid in the foreseeable future.
Stock Performance Graph
The performance graph below compares the Company's cumulative total stockholder return on the Company's Class A common stock for the period from July 16, 2013 through May 14, 2015, the date of the Recapitalization, and the Company's Class A common stock and Class C common stock from May 15,December 31, 2015 through December 31, 2017,2020, with the cumulative total return of the Standard & Poor's 500 Composite Stock Price Index, or S&P 500, and the Philadelphia Utility Sector Index, or UTY.
The performance graph shown below is being furnished and compares each period assuming that $100 was invested on the initial public offering dateDecember 31, 2015 in each of the Class A common stock of the Company, the Class C common stock of the Company, the stocks included in the S&P 500 and the stocks included in the UTY, and that all dividends were reinvested.
Comparison of Cumulative Total Return
| | | | | | | | | | | | | | | | | | | | | | | | | | | | | | | | | | | |
| | December 31, 2015 | | December 31, 2016 | | December 31, 2017 | | December 31, 2018 | | December 31, 2019 | December 31, 2020 |
| Clearway Energy, Inc. Class A common stock | | $ | 100.00 | | | $ | 117.84 | | | $ | 153.68 | | | $ | 148.04 | | | $ | 175.91 | | $ | 284.42 | |
| Clearway Energy, Inc. Class C common stock | | 100.00 | | | 113.84 | | | 144.49 | | | 141.44 | | | 171.67 | | 286.76 | |
| S&P 500 | | 100.00 | | | 111.96 | | | 136.40 | | | 130.42 | | | 171.49 | | 203.04 | |
| UTY | | 100.00 | | | 117.39 | | | 132.45 | | | 137.10 | | | 173.87 | | 178.61 | |
|
| | | | | | | | | | | | | | | | | | | | | | | |
| | July 16, 2013 | | December 31, 2013 | | December 31, 2014 | | December 31, 2015 | | December 31, 2016 | | December 31, 2017 |
| NRG Yield, Inc. Class A common stock | $ | 100.00 |
| | $ | 183.04 |
| | $ | 222.39 |
| | $ | 137.17 |
| | $ | 161.81 |
| | $ | 211.11 |
|
NRG Yield, Inc. Class C common stock (a) | 100.00 |
| | 183.04 |
| | 222.39 |
| | 144.60 |
| | 164.80 |
| | 209.31 |
|
| S&P 500 | 100.00 |
| | 111.36 |
| | 126.61 |
| | 128.36 |
| | 143.71 |
| | 175.09 |
|
| UTY | 100.00 |
| | 97.77 |
| | 126.06 |
| | 118.18 |
| | 138.73 |
| | 156.52 |
|
(a) Class C common stock price has been indexed to the Class A common stock price from the NRG Yield, Inc. initial public offering date until the Recapitalization, and reflects the Class C common stock Total Return Performance beginning on May 15, 2015.
Item 6 — Selected Financial Data
The following table presents the Company's historical selected financial data which has been recast to include the Drop Down Assets, as if the transfers had taken place from the beginning of the financial statements period, or from the date the respective entities were under common control (if later than the beginning of the financial statements period). The acquisitions are further described in Item 15 — Note 3, Business Acquisitions, to the Consolidated Financial Statements. Additionally, for all periods prior to the initial public offering, the data below reflects the Company's accounting predecessor, or NRG Yield, the financial statements of which were prepared on a ''carve-out'' basis from NRG and are intended to represent the financial results of the contracted renewable energy and conventional generation and thermal infrastructure assets in the U.S. that were acquired by NRG Yield LLC on July 22, 2013. For all periods subsequent to the initial public offering, the datatable below reflects the Company's consolidated financial results.
This historical data should be read in conjunction with the Consolidated Financial Statements and the related notes thereto in Item 15 and Item 7, Management's Discussion and Analysis of Financial Condition and Results of Operations.
| | | | | | | | | | | | | | | | | | | | | | | | | | | | | |
| Fiscal year ended December 31, |
| (In millions, except per share data) | 2020 | | 2019 | | 2018 | | 2017 | | 2016 |
| Statement of Income Data: | | | |
| Operating Revenues | | | | | | | | | |
| Total operating revenues | $ | 1,199 | | | $ | 1,032 | | | $ | 1,053 | | | $ | 1,009 | | | $ | 1,035 | |
| Operating Costs and Expenses | | | | | | | | | |
| Cost of operations | 366 | | | 337 | | | 327 | | | 322 | | | 305 | |
| Depreciation, amortization and accretion | 428 | | | 401 | | | 336 | | | 338 | | | 306 | |
| Impairment losses | 24 | | | 33 | | | — | | | 44 | | | 185 | |
| General and administrative | 34 | | | 29 | | | 20 | | | 19 | | | 16 | |
| Transaction and integration costs | 9 | | | 3 | | | 20 | | | 3 | | | 1 | |
| Development costs | 5 | | | 5 | | | 3 | | | — | | | — | |
| Total operating costs and expenses | 866 | | | 808 | | | 706 | | | 726 | | | 813 | |
| Operating Income | 333 | | | 224 | | | 347 | | | 283 | | | 222 | |
| Other Income (Expense) | | | | | | | | | |
| Equity in earnings of unconsolidated affiliates | 7 | | | 83 | | | 74 | | | 71 | | | 60 | |
| Impairment loss on investment | (8) | | | — | | | — | | | — | | | — | |
| Gain on sale of unconsolidated affiliate | 49 | | | — | | | — | | | — | | | — | |
| Other income, net | 4 | | | 9 | | | 8 | | | 4 | | | 3 | |
| Loss on debt extinguishment | (24) | | | (16) | | | (7) | | | (3) | | | — | |
| Interest expense | (415) | | | (404) | | | (306) | | | (307) | | | (284) | |
| Total other expense, net | (387) | | | (328) | | | (231) | | | (235) | | | (221) | |
| (Loss) Income Before Income Taxes | (54) | | | (104) | | | 116 | | | 48 | | | 1 | |
| Income tax expense (benefit) | 8 | | | (8) | | | 62 | | | 72 | | | (1) | |
| Net (Loss) Income | (62) | | | (96) | | | 54 | | | (24) | | | 2 | |
| Less: Pre-acquisition net income (loss) of Drop Down Assets | — | | | — | | | 4 | | | 7 | | | (4) | |
| Net (Loss) Income Excluding Pre-acquisition Net Income (Loss) of Drop Down Assets | (62) | | | (96) | | | 50 | | | (31) | | | 6 | |
| Less: Net (loss) income attributable to noncontrolling interests | (87) | | | (85) | | | 2 | | | (15) | | | (51) | |
| Net Income (Loss) Attributable to Clearway Energy, Inc. | $ | 25 | | | $ | (11) | | | $ | 48 | | | $ | (16) | | | $ | 57 | |
| Earnings Per Share Attributable to Clearway Energy, Inc. Class A and Class C Common Stockholders | | | | | | | | | |
| Earnings (loss) per Weighted Average Class A and Class C Common Share - Basic and Diluted | $ | 0.22 | | | $ | (0.10) | | | $ | 0.46 | | | $ | (0.16) | | | $ | 0.58 | |
| | | | | | | | | |
| | | | | | | | | |
| Dividends per Class A common share | $ | 1.05 | | | $ | 0.80 | | | $ | 1.258 | | | $ | 1.098 | | | $ | 0.945 | |
| Dividends per Class C common share | $ | 1.05 | | | $ | 0.80 | | | $ | 1.258 | | | $ | 1.098 | | | $ | 0.945 | |
| Other Financial Data: | | | | | | | | | |
| Capital expenditures | $ | 124 | | | $ | 228 | | | $ | 83 | | | $ | 190 | | | $ | 20 | |
| Cash Flow Data: | | | | | | | | | |
| Net cash provided by (used in): | | | | | | | | | |
| Operating activities | $ | 545 | | | $ | 477 | | | $ | 498 | | | $ | 517 | | | $ | 577 | |
| Investing activities | (62) | | | (468) | | | (185) | | | (442) | | | (131) | |
| Financing activities | (435) | | | (175) | | | (46) | | | (257) | | | (202) | |
| Balance Sheet Data: | | | | | | | | | |
| Cash and cash equivalents | $ | 268 | | | $ | 155 | | | $ | 407 | | | $ | 148 | | | $ | 322 | |
| Property, plant and equipment, net | 7,217 | | | 6,063 | | | 5,245 | | | 5,410 | | | 5,579 | |
| Total assets | 10,592 | | | 9,700 | | | 8,500 | | | 8,489 | | | 8,988 | |
| Long-term debt, including current maturities | 6,969 | | | 6,780 | | | 5,982 | | | 5,998 | | | 6,049 | |
| Total liabilities | 7,877 | | | 7,437 | | | 6,276 | | | 6,330 | | | 6,365 | |
| Total stockholders' equity | 2,715 | | | 2,263 | | | 2,224 | | | 2,159 | | | 2,623 | |
|
| | | | | | | | | | | | | | | | | | | |
| | Fiscal year ended December 31, |
| (In millions, except per share data) | 2017 | | 2016 | | 2015 | | 2014 | | 2013 |
| Statement of Income Data: | | | |
| Operating Revenues | | | | | | | | | |
| Total operating revenues | $ | 1,009 |
| | $ | 1,035 |
| | $ | 968 |
| | $ | 844 |
| | $ | 451 |
|
| Operating Costs and Expenses | | | | | | | | | |
| Cost of operations | 326 |
| | 308 |
| | 323 |
| | 279 |
| | 156 |
|
| Depreciation and amortization | 334 |
| | 303 |
| | 303 |
| | 240 |
| | 98 |
|
| Impairment losses | 44 |
| | 185 |
| | 1 |
| | — |
| | — |
|
| General and administrative | 19 |
| | 16 |
| | 12 |
| | 8 |
| | 7 |
|
| Acquisition-related transaction and integration costs | 3 |
| | 1 |
| | 3 |
| | 4 |
| | — |
|
| Total operating costs and expenses | 726 |
| | 813 |
| | 642 |
| | 531 |
| | 261 |
|
| Operating Income | 283 |
| | 222 |
| | 326 |
| | 313 |
| | 190 |
|
| Other Income (Expense) | | | | | | | | | |
| Equity in earnings of unconsolidated affiliates | 71 |
| | 60 |
| | 31 |
| | 22 |
| | 27 |
|
| Other income, net | 4 |
| | 3 |
| | 3 |
| | 6 |
| | 4 |
|
| Loss on debt extinguishment | (3 | ) | | — |
| | (9 | ) | | (1 | ) | | — |
|
| Interest expense | (306 | ) | | (284 | ) | | (267 | ) | | (222 | ) | | (72 | ) |
| Total other expense, net | (234 | ) | | (221 | ) | | (242 | ) | | (195 | ) | | (41 | ) |
| Income Before Income Taxes | 49 |
| | 1 |
| | 84 |
| | 118 |
| | 149 |
|
| Income tax expense (benefit) | 72 |
| | (1 | ) | | 12 |
| | 4 |
| | 8 |
|
| Net (Loss) Income | (23 | ) | | 2 |
| | 72 |
| | 114 |
| | $ | 141 |
|
| Less: Pre-acquisition net income (loss) of Drop Down Assets | 8 |
| | (4 | ) | | — |
| | 50 |
| | 32 |
|
| Net (Loss) Income Excluding Pre-acquisition Net (Loss) Income of Drop Down Assets | (31 | ) | | 6 |
| | 72 |
| | 64 |
| | 109 |
|
| Less: Predecessor income prior to initial public offering on July 22, 2013 | — |
| | — |
| | — |
| | — |
| | 54 |
|
| Less: Net (loss) income attributable to noncontrolling interests | (15 | ) | | (51 | ) | | 39 |
| | 48 |
| | 42 |
|
| Net (Loss) Income Attributable to NRG Yield, Inc. | $ | (16 | ) | | $ | 57 |
| | $ | 33 |
| | $ | 16 |
| | $ | 13 |
|
| Earnings Per Share Attributable to NRG Yield, Inc. Class A and Class C Common Stockholders | | | | | | | | | |
| (Loss) Earnings per Weighted Average Class A and Class C Common Share - Basic and Diluted | $ | (0.16 | ) | | $ | 0.58 |
| | $ | 0.40 |
| | $ | 0.30 |
| | $ | 0.29 |
|
| Dividends per Class A common share | $ | 1.098 |
| | $ | 0.945 |
| | $ | 1.015 |
| | $ | 1.42 |
| | $ | 0.23 |
|
Dividends per Class C common share (a) | $ | 1.098 |
| | $ | 0.945 |
| | 0.625 |
| | N/A |
| | N/A |
|
| Other Financial Data: | | | | | | | | | |
| Capital expenditures | $ | 31 |
| | $ | 20 |
| | $ | 29 |
| | $ | 79 |
| | $ | 790 |
|
| Cash Flow Data: | | | | | | | | | |
| Net cash provided by (used in): | | | | | | | | | |
| Operating activities | $ | 516 |
| | $ | 577 |
| | $ | 425 |
| | $ | 363 |
| | $ | 174 |
|
| Investing activities | (283 | ) | | (131 | ) | | (1,098 | ) | | (760 | ) | | (987 | ) |
| Financing activities | (415 | ) | | (202 | ) | | 354 |
| | 767 |
| | 853 |
|
| Balance Sheet Data (at period end): | | | | | | | | | |
| Cash and cash equivalents | $ | 148 |
| | $ | 322 |
| | $ | 111 |
| | $ | 430 |
| | $ | 60 |
|
| Property, plant and equipment, net | 5,204 |
| | 5,554 |
| | 5,980 |
| | 6,119 |
| | 3,488 |
|
| Total assets | 8,283 |
| | 8,962 |
| | 8,926 |
| | 9,063 |
| | 4,966 |
|
| Long-term debt, including current maturities | 5,837 |
| | 6,049 |
| | 5,660 |
| | 5,811 |
| | 2,916 |
|
| Total liabilities | 6,145 |
| | 6,363 |
| | 6,023 |
| | 6,157 |
| | 3,212 |
|
| Total stockholders' equity | 2,138 |
| | 2,599 |
| | 2,903 |
| | 2,906 |
| | 1,754 |
|
(a)The Company began paying dividends on Class C common stock after the Recapitalization on May 14, 2015.
Item 7 — Management's Discussion and Analysis of Financial Condition and the Results of Operations
The following discussion analyzes the Company's historical financial condition and results of operations, which were recast to include the effect of the Drop Down Assets acquired from NRG. As further discussed in Item 15 — Note 1, Nature of Business, to the Consolidated Financial Statements, the purchases of these assets were accounted for in accordance with ASC 805-50, Business Combinations - Related Issues, whereas the assets and liabilities transferred to the Company relate to interests under common control by NRG and, accordingly, were recorded at historical cost. The difference between the cash proceeds and historical value of the net assets was recorded as a distribution to/from NRG and offset to the noncontrolling interest on the Company's consolidated balance sheet. In accordance with GAAP, the Company prepared its consolidated financial statements to reflect the transfers as if they had taken place from the beginning of the financial statements period, or from the date the entities were under common control (if later than the beginning of the financial statements period). The Company reduces net income attributable to its Class A and Class C common stockholders by the pre-acquisition net income for the Drop Down Assets, as it was not available to the stockholders.
As you read this discussion and analysis, refer to the Company's Consolidated Statements of Operations to this Form 10-K, which present the results of operations for the years ended December 31, 2017, 2016, and 2015.10-K. Also refer to Item 1 — Business and Item 1A — Risk Factors, which include detailed discussions of various items impacting the Company's business, results of operations and financial condition. Discussions of the year ended December 31, 2018 that are not included in this Annual Report on Form 10-K and year-to-year comparisons of the year ended December 31, 2019 and the year ended December 31, 2018 can be found in “Management’s Discussion and Analysis of Financial Condition and the Results of Operations” in Part II, Item 7 of the Company’s Annual Report on Form 10-K for the year ended December 31, 2019.
The discussion and analysis below has been organized as follows:
•Executive Summary, including a description of the business and significant events that are important to understanding the results of operations and financial condition;
•Results of operations, including an explanation of significant differences between the periods in the specific line items of the consolidated statements of operations;
•Financial condition addressing liquidity position, sources and uses of cash, capital resources and requirements, commitments, and off-balance sheet arrangements;
•Known trends that may affect the Company’s results of operations and financial condition in the future; and
•Critical accounting policies which are most important to both the portrayal of the Company's financial condition and results of operations, and which require management's most difficult, subjective or complex judgment.
Executive Summary
Introduction and Overview
Clearway Energy, Inc. together with its consolidated subsidiaries, or the Company, is a publicly-traded energy infrastructure investor in and owner of modern, sustainable and long-term contracted assets across North America. The Company is a dividend growth-oriented companyindirectly owned by Global Infrastructure Partners III. Global Infrastructure Management, LLC is an independent fund manager that has historically served asinvests in infrastructure assets in the primary vehicle through which NRG owns, operatesenergy and acquires contracted renewabletransport sectors, and conventional generation and thermal infrastructure assets.Global Infrastructure Partners III is its third equity fund. The Company believes it is sponsored by GIP through GIP's portfolio company, CEG.
The Company is one of the largest renewable energy owners in the U.S. with over 4,200 net MW of installed wind and solar generation projects. The Company also owns approximately 2,500 net MW of environmentally-sound, highly efficient natural gas-fired generation facilities as well positionedas a portfolio of district energy systems. Through this environmentally-sound, diversified and primarily contracted portfolio, the Company endeavors to be a premier company forprovide its investors seekingwith stable and growing dividend income from a diversified portfolio of lower-risk high-quality assets.
The Company owns a diversified portfolio of contracted renewable and conventional generation and thermal infrastructure assets in the U.S. The Company’s contracted generation portfolio collectively represents 5,118 net MW. Each of these assets sells substantiallyincome.Substantially all of itsthe Company's generation assets are under long-term contractual arrangements for the output pursuant to long-term offtake agreements with creditworthy counterparties.or capacity from these assets. The weighted average remaining contract duration of these offtake agreements was approximately 1513 years as of December 31, 2017,2020 based on CAFD.
Significant Events
Third Party Acquisitions
•On February 10, 2021, the Company reached an agreement to acquire 100% of the equity interests in Mount Storm Holdings I LLC, or Mt Storm, for approximately $96 million subject to certain purchase price adjustments. Mt Storm is a 264 MW wind project located in Grant County, West Virginia. The transaction is subject to customary regulatory approvals.
•On February 3, 2021, the Company acquired an additional 35% equity interest in the Agua Caliente solar project from NRG Energy, Inc. for $202 million. Agua Caliente is a 290 MW solar project located in Dateland, Arizona in which Clearway previously owned a 16% equity interest. The project has a 25-year PPA with PG&E, with approximately 19 years remaining under the agreement. Following the close of the transaction, the Company owns a 51% equity interest in Agua Caliente. The Company alsowill remove its equity method investment and consolidate its interest in Agua Caliente from the date of the acquisition.
Drop Down Transactions
•On January 12, 2021, the Company acquired 100% of CEG's equity interest and a third party investor's minority interest in Rattlesnake Flat, LLC, which owns thermal infrastructurethe Rattlesnake Wind Project, a 160 net MW wind facility located in Adams County, WA which achieved commercial operations in January 2021, for $132 million in cash consideration and expects its net capital commitment to be $119 million after proceeds from a state sales and use tax refund which are expected to be received in 2021.
•On December 21, 2020, subsidiaries of the Company entered into the Lighthouse Partnership Agreements providing for the Company’s co-investment in a 1,204 MW portfolio of renewable energy projects developed by CEG. In addition, the agreements included an amendment of the partnership that owns the 419 MW Mesquite Star wind project, providing the Company with additional project cash flows after the first half of 2031. As described below, the Company had previously acquired an interest in Mesquite Star Pledgor LLC, which was subsequently renamed Lighthouse Renewable Holdco LLC. The 1,204 MW portfolio of renewable energy projects includes:
◦Five geographically diversified wind, solar and solar plus storage assets under development totaling 1,012 MW, and
◦The 192 MW Rosamond Central solar project, located in Kern County, California. On December 21, 2020, the Company acquired 100% of the Class A membership interests of Rosie TargetCo LLC, which consolidates its interest in a tax equity fund that owns the project, for approximately $24 million in cash consideration. Rosie TargetCo LLC is a partnership, whose Class B membership interests are owned by a third party investor. The Company is entitled to a 50% cash equity interest in Rosamond Central through its Class A membership interests.
For the above-mentioned transactions, the Company expects to invest an estimated $215 million in corporate capital by the end of 2022, subject to closing adjustments and the projects achieving certain milestones. The expected net corporate capital includes the $24 million already invested in Rosamond Central in 2020 and the purchase price adjustment received concurrent with the partnership agreement amendment for Mesquite Star.
•On November 20, 2020, the Company acquired from Clearway Renew LLC, a subsidiary of CEG, and a third party investor, 100% of the cash equity interests in Langford Holding LLC, which owns the Langford wind project, for total cash consideration of approximately $64 million. The Langford wind project is a 160 MW wind project located in West Texas which was repowered and achieved commercial operations in November 2020.
•On November 2, 2020, the Company acquired from CEG (i) the Class B membership interests in DGPV Holdco 1, DGPV Holdco 2 and DGPV Holdco 3, or the DGPV Holdco Entities and (ii) an SREC contract for an aggregate steam and chilled water capacity of 1,319 net MWt and electric generation capacity of 123 net MW. These thermal infrastructure assets provide steam, hot water and/or chilled water, and$44 million in some instances electricity, to commercial businesses, universities, hospitals and governmental units in multiple locations, principally through long-term contracts or pursuant to rates regulated by state utility commissions.
Strategic Sponsorshipcash consideration. In connection with Global Infrastructure Partners
On February 6, 2018, Global Infrastructure Partners, or GIP, entered into a purchase and sale agreement with NRG, or the NRG Transaction, for the acquisition of NRG’s full ownershipthe Class B membership interests, the Company consolidated their interest in NRG Yield, Inc.the underlying distributed solar tax equity funds within DGPV Holdco 1 and NRG’sDGPV Holdco 2.The Company had previously consolidated DGPV Holdco 3 effective in May 2020.
•On November 2, 2020, the CEG ROFO Agreement was amended to (i) add the assets comprising the Lighthouse Partnership Agreements from CEG to the ROFO pipeline (ii) memorialize as a ROFO asset the contract related to the monetization of renewable energy developmentcredits associated with assets within the DGPV Holdco Entities, which was acquired at the same time; and operations platform.(iii) extend the third-party negotiation periods for CEG's residual interest in Kawailoa and Oahu assets as well as the assets comprising the cash equity partnership offer from CEG to November 2, 2021.
•On September 1, 2020, the Company, through its indirect subsidiary Mesquite Star HoldCo LLC, acquired the Class A membership interests in Mesquite Star Pledgor LLC from Clearway Renew LLC, a subsidiary of CEG, for $74 million in cash consideration inclusive of a purchase price adjustment received in the fourth quarter of 2020 concurrent with the partnership amendment referenced below. Mesquite Star Pledgor LLC is the primary beneficiary and consolidates its interest in a tax equity fund that owns the Mesquite Star wind project, a 419 MW utility scale wind project located in Fisher County, Texas. A majority of the project’s output is backed by contracts with investment grade counterparties with a 12 year weighted average contract life. As described above, Mesquite Star Pledgor LLC was renamed Lighthouse Renewable Holdco LLC and the Class B membership interests were sold to a third party investor. The NRG Transaction isinvestor and the Company amended the terms of the related partnership and as a result, the Company now consolidates its interest in the Mesquite Star wind project, through its consolidation of Lighthouse Renewable Holdco LLC.
•On April 17, 2020, the Company entered into binding agreements related to the previously announced drop down offer from CEG to enable the Company to acquire and invest in a portfolio of renewable energy projects. The following projects are included in the drop down:
◦CEG's interest in Repowering Partnership II LLC (Repowering 1.0), which the Company acquired on May 11, 2020 for cash consideration of $70 million,
◦100% of the equity interests in Rattlesnake Flat, LLC, which owns the Rattlesnake Wind Project, a 160 net MW wind facility located in Adams County, WA which the company acquired on January 12, 2021 as mentioned above, and
◦On February 26, 2021, the Company, through an indirect subsidiary, entered into an amended partnership agreement with CEG to repower the Pinnacle Wind Project, a 55 net MW wind facility located in Mineral County, WV. The amended agreement commits the Company to invest an estimated $67 million in net corporate capital, subject to certain closing conditions, including customary legaladjustments, and regulatory approvals.no longer requires an additional payment in 2031. The Company expectsexisting Pinnacle Wind power purchase agreements will continue to run through 2031. Commercial operations and corporate capital funding for the NRG TransactionPinnacle Wind Repowering Partnership are expected to closeoccur in the second half of 2018.2021.
In connection withFor the NRG Transaction,above mentioned transactions, the agreements commit the Company to invest an estimated $256 million in net corporate capital, subject to closing adjustments.
Sale of Assets or Investments
•On May 14, 2020, the Company sold its interests in RPV Holdco 1 LLC, or RPV Holdco, to a third party for net proceeds of approximately $75 million. The Company previously accounted for its interest in RPV Holdco as an equity method investment. The sale of the investment resulted in a gain of approximately $49 million.
•On March 3, 2020, the Company through Thermal LLC, sold 100% of its interests in Energy Center Dover and Energy Center Smyrna to DB Energy Assets, LLC for approximately $15 million.
Corporate-Level Financing
•On May 21, 2020, Clearway Energy Operating LLC completed the sale of an additional $250 million aggregate principal amount of the 2028 Senior Notes. The 2028 Senior Notes bear interest at 4.75% and mature on March 15, 2028. Interest on the 2028 Senior Notes is payable semi-annually on March 15 and September 15 of each year, and interest payments commenced on September 15, 2020. The 2028 Senior Notes are unsecured obligations of Clearway Energy Operating LLC and are guaranteed by Clearway Energy LLC and by certain of Clearway Energy Operating LLC's wholly owned current and future subsidiaries. The proceeds from the additional 2028 Senior Notes were used to repay the $45 million outstanding principal amount of the Company's 2020 Convertible Notes on June 1, 2020, as well as to fund the repayment of outstanding borrowings under the Company's revolving credit facility and for general corporate purposes.
Project-Level Financing Activities
•On November 2, 2020, DG-CS Master Borrower LLC, a wholly owned subsidiary of Clearway Energy Operating LLC, entered into a Consent and Indemnity Agreement with NRG and GIP setting forth key terms and conditionsfinancing arrangement, which included the issuance of the Company's consent to the NRG Transaction. Key provisions of the Consent and Indemnity Agreement include:
Minimized impact to CAFD from potential change in control costs — No more than $10a $467 million term loan, as well as $30 million in reduced annual CAFDletters of credit in support of debt service. The notes bear interest at 3.51% and mature on a recurring basis that would resultSeptember 30, 2040. The proceeds from changesthe loan were utilized to repay existing project-level debt outstanding for Chestnut Borrower LLC, Renew Solar CS 4 Borrower LLC, DGPV 4 Borrower LLC and Puma Class B LLC of $107 million, $102 million, $92 million and $73 million respectively and unwind related interest rate swaps in the Company's cost structure or any impact from various consents.
Enhanced ROFO pipeline — Upon closing,amount of $42 million. The remaining proceeds were utilized to pay related fees and expenses and in part to acquire the Company will enter into a new ROFO agreement with GIP that immediately adds 550 MW to the current pipeline. The NRG ROFO Agreement will be amended to remove the Ivanpah solar facility.
Financial cooperation and support — GIP has arranged a $1.5 billion backstop credit facility to manage any change of control costs associated with the Company's corporate debt. GIP has also committed to provide up to $400 million in financial support, if necessary, for the purchase of the Carlsbad Energy Center.
Voting and Governance Agreement — As part of the NRG Transaction, the parties have agreed to enter into a voting and governance agreement, which would provide that:
the Chief Executive Officer of the Company will at all times be a full-time Company employee appointed by the Board of Directors, or the Board, of the Company;
the parties thereto will use their commercially reasonable efforts to submit to the Company’s stockholders at the Company’s 2019 Annual Meeting of Stockholders a charter amendment to classify the Board into two classes (with the independent directors and directors designated by an affiliate of GIP allocated across the two classes); and
the Board will be expanded to nine members at the closing of the NRG Transaction, comprised at that date of five directors designated by GIP, three independent directors and the Company’s Chief Executive Officer.
Significant Events
NRG Transaction
On February 6, 2018, NRG entered into agreements with GIP for the sale of 100% of its interest in NRG Yield, Inc. and its renewable energy development and operations platform. In connection with this, the Company entered into a Consent and Indemnity Agreement with NRG and GIP. For further discussion, refer to Item 1 — Business.
Tax Act
The Tax Act, which was signed into law on December 22, 2017, makes significant changes to the taxation of U.S. businesses. These changes include a permanent reduction to the federal corporate income tax rate which reduced the Company’s net deferred tax asset and net income during 2017 by $68 million.
Drop Down Assets Acquisitions
On February 6, 2018, the Company entered into an agreement with NRG to purchase its interest in Carlsbad Energy Holdings LLC, which indirectly owns the Carlsbad project, a 527 MW natural gas fired project in Carlsbad, CA. The purchase price for the transaction is $365 million in cash consideration, subject to working capital and other adjustments. The transaction is expected to closeClass B membership interests in the fourth quarter of 2018DGPV Holdco Entities and is contingent upon the consummation of the NRG Transaction.
On January 24, 2018, the Company entered into an agreement with NRG to acquire 100% of NRG's ownership interest in Buckthorn Solar for total consideration of $42 million, subject to adjustments, and is expected to close in the first quarter of 2018.
As discussedSREC contract from CEG as further described in Item 15 — Note 3, Business Acquisitions and Dispositions. Concurrent with the refinancing, the projects were transferred under DG-CS Master Borrower LLC and the obligations under the financing arrangement are supported by the Company's interest in the projects. Prior to the Consolidated Financial Statements,acquisition of CEG's Class B membership interests mentioned above, the Company acquiredinvested approximately $10 million in the following:
| |
◦ | On November 1, 2017, a 38 MW solar portfolio primarily comprised of assets from NRG's Solar Power Partners (SPP) funds and other projects developed by NRG, or the November 2017 Drop Down Assets, for cash consideration of $74 million plus assumed non-recourse debt of $26 million. During the quarter ended September 30, 2017, NRG recorded an impairment of $13 million related to the November 2017 Drop Down Assets. |
| |
◦ | On August 1, 2017, the remaining 25% interest in NRG Wind TE Holdco, a portfolio of 12 wind projects, from NRG for total cash consideration of $44 million. The purchase agreement also included potential additional payments to NRG dependent upon actual energy prices for merchant periods beginning in 2027, which were estimated and accrued as contingent consideration in the amount of $8 million as of December 31, 2017. |
| |
◦ | On March 27, 2017, the following entities: Agua Caliente Borrower 2 LLC and NRG's interests in the Utah Solar Portfolio, for cash consideration of $132 million. The Company recorded the acquired interests as equity method investments. The Company also assumed non-recourse debt of $41 million and $287 million on Agua Caliente Borrower 2 LLC and the Utah Solar Portfolio. |
Impairment LossesDG investment partnerships with CEG during 2020, bringing total capital invested in these investment partnerships to $266 million.
During•On September 30, 2020, the fourth quarterAlpine, Blythe and Roadrunner projects were transferred under NIMH Solar LLC, a wholly owned subsidiary of 2017,Clearway Energy Operating LLC. Concurrently, total project-level debt outstanding for Alpine, Blythe and Roadrunner of $158 million was assigned to NIMH Solar LLC. The consolidated facility was amended to a term loan for$193 million, as well as $16 million in letters of credit in support of debt service and project obligations. The term loan bears interest at an annual interest rate of LIBOR, plus an applicable margin of 2.00% per annum through the third anniversary of closing, and 2.125% per annum thereafter through the maturity date in September 2024. As a result of the amendment the Company recorded asset impairment lossesreceived $35 million and the funds were utilized to pay related fees and expenses and along with existing project level cash provided a distribution to Clearway Energy Operating LLC of $31$45 million. The obligations under the financing arrangement are supported by the Company’s interests in the projects.
•On September 1, 2020, Utah Solar Holdings, LLC, or Utah Solar, entered into a financing arrangement, which included the issuance of approximately $296 million in senior secured notes supported by the Company’s interest in the Four Brothers, Granite Mountain and Iron Springs projects, or the Utah projects (previously defined as the Utah Solar Portfolio). The notes bear interest at 3.59% per annum and mature on December 31, 2036. The proceeds from the issuance were utilized to repay existing debt outstanding of approximately $247 million for the Utah projects and to unwind the related interest rate swaps in the amount of $33 million. The remaining proceeds were utilized to pay related fees and expenses, with the remaining $9 million distributed to Clearway Energy Operating LLC.
Black Start Services at Marsh Landing
•As of July 2020, all necessary regulatory approvals were obtained with respect to Elbow Creek and Forward projects from the Renewables segment. For further discussion, referCompany's Marsh Landing project to Management’s discussionprovide black start capability in the greater San Francisco Bay area, which would restart Marsh Landing in the event of a blackout, under a five-year contract with the California Independent System Operator to support their emergency restoration of the resultselectrical grid. The project has commenced construction activities and is expected to achieve commercial operations in the second quarter of operations2021.
Pacific Gas and Electric Company Bankruptcy
•On July 1, 2020, PG&E emerged from bankruptcy and assumed the Company's contracts without modification. In addition, PG&E paid to the Company's applicable projects the portion of the invoices corresponding to the electricity delivered for the years ended December 31, 2017period between January 1 and 2016 andCritical Accounting Policies in this Item 7 below, as well as Item 15 — Note 9, Asset Impairments,January 28, 2019. These invoices related to the Consolidated Financial Statements.pre-petition period services and any payment therefore required the approval by the Bankruptcy Court. Subsequent to PG&E's
Financing Activities
On February 6, 2018, NRG Yield Operating LLC and NRG Yield LLC amendedemergence from bankruptcy the revolving credit facility to modify the change of control provisions to permit the consummation of the NRG Transaction, and also to permit NRG Yield Operating LLC, NRG Yield LLC and certain subsidiaries to incur up to $1.5 billion of unsecured indebtedness in order to repurchase or make other required cash payments, in each case if applicable, with respect to NRG Yield Operating LLC’s outstanding senior notes and NRG Yield's outstanding convertible notes in connectionCompany entered into waiver agreements with the NRG Transaction.
On March 16, 2017, NRG Energy Center Minneapolis LLC, a subsidiarylenders to the respective financing agreements related to the PG&E Bankruptcy and all previously restricted distributions were paid out of distribution reserve accounts at the Company, amendedCompany's subsidiaries affected by the shelf facility of its existing Thermal financing arrangement to allow for the issuance of an additional $10 million of Series F notes at a 4.60% interest rate, or the Series F Notes, increasing the total principal amount of notes available for issuance under the shelf facility to $80 million. The Series F Notes are secured by substantially all of the assets of NRG Energy Center Minneapolis LLC. NRG Thermal LLC has guaranteed the indebtedness and its guarantee is secured by a pledge of the equity interests in all of NRG Thermal LLC’s subsidiaries.PG&E Bankruptcy.
During the year ended December 31, 2017, NRG Yield, Inc. issued 1,921,866 shares of Class C common stock under the ATM Program for gross proceeds of $35 million and incurred commission fees of $346 thousand, as described in Sources of Liquidity in this Item 7.
Environmental Matters and Regulatory Matters
Details of environmental matters and regulatory matters are presented in Item 1 — Business, Regulatory Matters and Item 1A— 1A — Risk Factors. Details of some of this information relate to costs that may impact the Company's financial results.
Trends or Matters Affecting Results of Operations and Future Business Performance
Wind and Solar Resource Availability
The availability of the wind and solar resources affects the financial performance of the wind and solar facilities, which may impact the Company’s overall financial performance. Due to the variable nature of the wind and solar resources, the Company cannot predict the availability of the wind and solar resources and the potential variances from expected performance levels from quarter to quarter. To the extent the wind and solar resources are not available at expected levels, it could have a negative impact on the Company’s financial performance for such periods.
Tax ReformRecent Developments Affecting Industry Conditions and the Company’s Business
The Tax Cuts and Jobs Act of 2017, or the Tax Act, which was signed into law on December 22, 2017, makes significant changesCOVID-19
In response to the taxationongoing coronavirus (COVID-19) pandemic, the Company has implemented preventative measures and developed corporate and regional response plans to protect the health and safety of U.S. businesses. These changes include, but are not limited to a permanent reductionits employees, customers and other business counterparties, while supporting the Company’s suppliers and customers’ operations to the federal corporate income tax rate, changesbest of its ability in the deductibilitycircumstances. The Company also has modified certain business practices (including discontinuing all non-essential business travel, implementing a temporary work-from-home policy for employees who can execute their work remotely and encouraging employees to adhere to local and regional social distancing, more stringent hygiene and cleaning protocols across the Company’s facilities and operations and self-quarantining recommendations) to support efforts to reduce the spread of interest on certain debt obligationsCOVID-19 and limitingto conform to government restrictions and best practices encouraged by governmental and regulatory authorities. The Company continues to evaluate these measures, response plans and business practices in light of the amountevolving effects of NOL availableCOVID-19.
There is considerable uncertainty regarding the extent to offset taxable incomewhich COVID-19 will continue to spread and the extent and duration of governmental and other measures implemented to try to slow the spread of the virus, such as large-scale travel bans and restrictions, border closures, quarantines, shelter-in-place orders and business and government shutdowns. Restrictions of this nature may cause the Company, its suppliers and other business counterparties to experience operational delays and delays in the future.delivery of materials and supplies and may cause milestones or deadlines relating to various projects to be missed.
Operational Matters
Walnut Creek Forced Outage
DuringAs of the first halfdate of 2017, Walnut Creekthis report, the Company has not experienced forced outagesany material financial or operational impacts related to COVID-19. All of the Company’s facilities have remained operational. The Company has experienced a decrease in volumetric sales at certain Thermal locations in part due to mechanical failures of turbine parts that caused downstream damage to several of the plant's Units, primarily Unit 1. The repairs necessary to return Unit 1 to service were completedCOVID-19 related impacts which has not resulted in the second quarter of 2017 and the plant has performed reliably since then. The estimated cost of this outage is approximately $2 million after the recovery of insurance proceeds. Also, during 2017, the Company recorded a loss on disposal of assets of $14 million, in relationany material financial impacts to the Unit 1 forced outage. In the third quarter of 2017, the Company, through Walnut Creek, executed an amendment to the contractual service agreement with the original equipment manufacturer to improve long term reliability. The amendment provides for the original equipment manufacturer to perform all required, currently available and future turbine reliability upgrades, and collateral damage reimbursement rights in exchange for an investment of $15 million that would be paid over the next five years, of which $8 million is expected to be paid in 2018.
El Segundo Forced Outage
In January 2017, the El Segundo Energy Center began a forced outage on Units 5 and 6 due to increasing vibrations on successive operations at Unit 5. In consultation with the Company’s operations and maintenance service provider, a subsidiary of NRG, the Company elected to replace the rotor on Unit 5. Both Unit 5 and 6 returned to service on February 24, 2017. In July 2017, the Company executed a warranty settlement agreement with the original equipment manufacturer that reduced total cost from $12 million to $5 million.
Consolidated Results of Operations
2017 compared to 2016
The following table provides selected financial information: |
| | | | | | | | | | | |
| | Year ended December 31, |
| (In millions) | 2017 | | 2016 | | Change |
| Operating Revenues | | | | | |
| Energy and capacity revenues | $ | 1,078 |
| | $ | 1,104 |
| | $ | (26 | ) |
| Contract amortization | (69 | ) | | (69 | ) | | — |
|
| Total operating revenues | 1,009 |
| | 1,035 |
| | (26 | ) |
| Operating Costs and Expenses | | | | | |
| Cost of fuels | 63 |
| | 61 |
| | 2 |
|
| Emissions credit amortization | — |
| | 6 |
| | (6 | ) |
| Operations and maintenance | 197 |
| | 176 |
| | 21 |
|
| Other costs of operations | 66 |
| | 65 |
| | 1 |
|
| Depreciation and amortization | 334 |
| | 303 |
| | 31 |
|
| Impairment losses | 44 |
| | 185 |
| | (141 | ) |
| General and administrative | 19 |
| | 16 |
| | 3 |
|
| Acquisition-related transaction and integration costs | 3 |
| | 1 |
| | 2 |
|
| Total operating costs and expenses | 726 |
| | 813 |
| | (87 | ) |
| Operating Income | 283 |
| | 222 |
| | 61 |
|
| Other Income (Expense) | | | | |
|
| Equity in earnings of unconsolidated affiliates | 71 |
| | 60 |
| | 11 |
|
| Other income, net | 4 |
| | 3 |
| | 1 |
|
| Loss on debt extinguishment | (3 | ) | | — |
| | 3 |
|
| Interest expense | (306 | ) | | (284 | ) | | (22 | ) |
| Total other expense, net | (234 | ) | | (221 | ) | | (13 | ) |
| Income Before Income Taxes | 49 |
| | 1 |
| | 48 |
|
| Income tax expense (benefit) | 72 |
| | (1 | ) | | 73 |
|
| Net (Loss) Income | (23 | ) | | 2 |
| | (25 | ) |
| Less: Pre-acquisition net income (loss) of Drop Down Assets | 8 |
| | (4 | ) | | 12 |
|
| Net (Loss) Income Excluding Pre-acquisition Net Income of Drop Down Assets | (31 | ) | | 6 |
| | (37 | ) |
| Less: Net (loss) income attributable to noncontrolling interests | (15 | ) | | (51 | ) | | 36 |
|
| Net (Loss) Income Attributable to NRG Yield, Inc. | $ | (16 | ) | | $ | 57 |
| | $ | (73 | ) |
|
| | | | | |
| | Year ended December 31, |
| Business metrics: | 2017 | | 2016 |
Renewables MWh generated/sold (in thousands) (a) | 6,844 |
| | 7,291 |
|
Conventional MWh generated (in thousands) (a)(b) | 1,809 |
| | 1,697 |
|
| Thermal MWt sold (in thousands) | 1,926 |
| | 1,966 |
|
Thermal MWh sold (in thousands) (c) | 35 |
| | 71 |
|
(a) Volumes do not include the MWh generated/sold by the Company's equity method investments.
(b) Volumes generated are not sold as the Conventional facilities sell capacity rather than energy.
(c) MWh sold do not include 72 and 204 MWh generated by NRG Dover, a subsidiary of the Company, under the PPA with NRG Power Marketing during the years ended December 31, 2017 and December 31, 2016, respectively, as further described in Item 15 ��� Note 15, Related Party Transactions, to the Consolidated Financial Statements.
Management’s discussion of the results of operations for the years ended December 31, 2017 and 2016
Gross Margin
The Company calculates gross margin in order to evaluate operating performance as operating revenues less cost of sales, which includes cost of fuel, contract and emission credit amortization and mark-to-market for economic hedging activities.
Economic Gross Margin
In addition to gross margin, the Company evaluates its operating performance using the measure of economic gross margin, which is not a GAAP measure and may not be comparable to other companies’ presentations or deemed more useful than the GAAP information provided elsewhere in this report. Economic gross margin should be viewed as a supplement to and not a substitute for the Company' presentation of gross margin, which is the most directly comparable GAAP measure. Economic gross margin is not intended to represent gross margin.Company. The Company believes that all of its accounts receivable balances as of December 31, 2020 are collectible. The Company will continue to assess collectability based on any future developments.
The Company cannot predict the full impact that COVID-19 will have on the Company’s financial expectations, its financial condition, results of operations and cash flows, its ability to make distributions to its stockholders, the market prices of its common stock and its ability to satisfy its debt service obligations at this time, due to numerous uncertainties. The ultimate impacts will depend on future developments, including, among others, the ultimate geographic spread of the virus, the consequences of governmental and other measures designed to prevent the spread of the virus, the development of effective treatments, the duration of the outbreak, actions taken by governmental authorities, customers, suppliers and other third parties, workforce availability and the timing and extent to which normal economic gross margin is useful to investors as it is a key operational measure reviewed byand operating conditions resume. For additional discussion regarding risks associated with the COVID-19 pandemic, see Part I, Item 1A Risk Factors.
February 2021 Winter Events in Texas
During February 2021, Texas experienced extreme winter weather conditions. Certain of the Company's chief operating decision maker. Economic gross margin is defined as energywind projects were unable to operate and capacity revenue less cost of fuels. Economic gross margin excludes the following components from GAAP gross margin: contract amortization, mark-to-market results, emissions credit amortization and (losses) gains on economic hedging activities. Mark-to-market results consist of unrealized gains and losses on contracts that are not yet settled.
The below tables present the composition of gross margin, as well as the reconciliation to economic gross margin for the years ended December 31, 2017 and 2016:
|
| | | | | | | | | | | | | | | |
| | Conventional | | Renewables | | Thermal | | Total |
| (In millions) | |
| Year ended December 31, 2017 | | | | | | |
|
| Energy and capacity revenues | $ | 341 |
| | $ | 563 |
| | $ | 174 |
| | $ | 1,078 |
|
| Cost of fuels | (1 | ) | | — |
| | (62 | ) | | (63 | ) |
| Contract amortization | (5 | ) | | (62 | ) | | (2 | ) | | (69 | ) |
| Gross margin | 335 |
| | 501 |
| | 110 |
| | 946 |
|
| Contract amortization | 5 |
| | 62 |
| | 2 |
| | 69 |
|
| Economic gross margin | $ | 340 |
| | $ | 563 |
| | $ | 112 |
| | $ | 1,015 |
|
| |
|
| |
|
| |
|
| |
|
| Year ended December 31, 2016 | | | | | | | |
| Energy and capacity revenues | $ | 338 |
| | $ | 594 |
| | $ | 172 |
| | $ | 1,104 |
|
| Cost of fuels | (1 | ) | | — |
| | (60 | ) | | (61 | ) |
| Contract amortization | (5 | ) | | (62 | ) | | (2 | ) | | (69 | ) |
| Emissions credit amortization | (6 | ) | | — |
| | — |
| | (6 | ) |
| Gross margin | 326 |
| | 532 |
| | 110 |
| | 968 |
|
| Contract amortization | 5 |
| | 62 |
| | 2 |
| | 69 |
|
| Emissions credit amortization | 6 |
| | — |
| | — |
| | 6 |
|
| Economic gross margin | $ | 337 |
| | $ | 594 |
| | $ | 112 |
| | $ | 1,043 |
|
Gross margin decreased by $22 million and economic gross margin decreased by $28 million during the year ended December 31, 2017, compared to the same period in 2016, primarily due to:
|
| | | |
| (In millions) | |
| Renewables: | |
| A 7% decrease in volume generated by wind projects, due to lower wind resources at the Alta Wind and NRG Wind TE Holdco projects | $ | (31 | ) |
| Conventional: | |
| Higher revenues due to 2016 higher priced peak season forced outages, as well as additional start-up revenue from Marsh Landing in 2017 | 3 |
|
| Decrease in economic gross margin | $ | (28 | ) |
| Emissions credit amortization of NOx allowances at Walnut Creek and El Segundo in compliance with amendments to the Regional Clean Air Incentives Market program in 2016 | 6 |
|
| Decrease in gross margin | $ | (22 | ) |
Operations and Maintenance Expense
|
| | | | | | | | | | | | | | | |
| | Conventional | | Renewables | | Thermal | | Total |
| (In millions) | |
| Year ended December 31, 2017 | $ | 52 |
| | $ | 97 |
| | $ | 48 |
| | $ | 197 |
|
| Year ended December 31, 2016 | 32 |
| | 96 |
| | 48 |
| | 176 |
|
Operations and maintenance expense increased by $21 million during the year ended December 31, 2017 compared to the same period in 2016,experienced outages due to the forced outages in the Conventional segment.weather conditions. These projects are now operating within expectations. The Company recorded higher operations and maintenance costs in Walnut Creek in connection withcontinues to assess the Unit 1 forced outages that took place in April of 2017, including an increase of loss on disposal of assets of $12 million, as well as higher operations and maintenance costs in El Segundo due to the forced outages in Units 5 and Unit 6 that took place in January 2017. Impairment Losses
The Company recorded impairment losses of $44 million and $185 million for the years ended December 31, 2017 and 2016, respectively.
During the fourth quarter of 2017, as the Company updated its estimated cash flows in connection with the preparation and review of the Company’s annual budget, it was determined that both Elbow Creek and Forward projects were impaired due to the continued declining merchant power prices in the post contract periods. As a result, the Company recorded impairment losses of $26 million and $5 million for the Elbow Creek and Forward projects, respectively.
In addition, in connection with the sale of the November 2017 Drop Down Assets, it was identified that undiscounted cash flows were lower than the book value of certain SPP funds and NRG recorded an impairment expense of $13 million. In accordance with the guidance for transfer of assets under common control, the impairment is reflected in the Company's consolidated statements of operations for the period ended December 31, 2017.
During the fourth quarter of 2016, as the Company updated its estimated cash flows in connection with the preparation and review of the Company's annual budget, it was determined that the cash flows for the Elbow Creek and Goat Wind projects and the Forward project were below the carrying value of the related assets, primarily driven by declining merchant power prices in post-contract periods, and that the assets were considered impaired. The Company recorded impairment losses of $117 million, $60 million and $6 million for Elbow Creek, Goat Wind, and Forward, respectively. The other impairments of $2 millionfull financial exposure related to the projects that were part ofcircumstances, including potential mitigants, ongoing discussions with contractual counterparties, any potential disputes which may result and any state
sponsored solutions to address the November 2017 Drop Down Assets. Since the acquisitionfinancial impacts caused by the circumstances. Based on available information, the Company of the November 2017 Drop Down Assets related to transfer of assets under common control, these impairments were reflectedcurrently estimates a direct cash impact between $20 million and $30 million in the Company's consolidated statements of operations for the period ending December 31, 2016. For further discussion see Item 15 — Note 9, Asset Impairments, to the Consolidated Financial Statements, as well as in Critical Accounting Policies and Estimates in this Item 7.2021.
Equity in Earnings of Unconsolidated Affiliates
Equity in earnings of unconsolidated affiliates increased by $11 million during the year ended December 31, 2017, compared to the same period in 2016, primarily due to higher earnings from the solar partnerships with NRG, as well as acquisition of the Utah Solar Portfolio in November 2016, partially offset by lower earnings from the San Juan Mesa investment.
Interest Expense
Interest expense increased by $22 million during the year ended December 31, 2017 compared to the same period in 2016 due to:
|
| | | |
| | (In millions) |
| Assumption of the Utah Solar Portfolio debt in connection with the March 2017 Drop Down Assets | $ | 14 |
|
| Issuance of the 2026 Senior Notes in the third quarter of 2016 | 11 |
|
| Issuance of new project level debt in the second half of 2016 and 2017 partially offset by the lower principal balances on project level debt in 2017 | 2 |
|
| Higher borrowings in 2016 on the revolving credit facility | (5 | ) |
| | $ | 22 |
|
Income Tax Expense (Benefit)
For the year ended December 31, 2017, the Company recorded an income tax expense of $72 million on pretax income of $49 million. For the same period in 2016, the Company recorded an income tax benefit of $1 million on pretax income of $1 million. For the year ended December 31, 2017, the overall effective tax rate was different than the statutory rate of 35% primarily due to tax expense recorded from the revaluation of the existing net deferred tax asset pursuant to the reduction in the corporate income tax rate to 21% in accordance with the Tax Cuts and Jobs Act.
For the year ended December 31, 2016, the overall effective tax rate was different than the statutory rate of 35% primarily due to taxable earnings allocated to NRG resulting from NRG's interest in NRG Yield LLC and PTCs and ITCs generated from certain wind and solar assets, respectively.
A reconciliation of the U.S. federal statutory rate of 35% to the Company's effective rate is as follows:
|
| | | | | | | |
| | Year Ended December 31, |
| | 2017 | | 2016 |
| | (In millions, except percentages) |
| Income Before Income Taxes | 49 |
| | 1 |
|
| Tax at 35% | 17 |
| | — |
|
| State taxes, net of federal benefit | (3 | ) | | — |
|
| Tax Cuts and Jobs Act - tax rate change | 68 |
| | — |
|
| Investment tax credits | (1 | ) | | (1 | ) |
| Impact of non-taxable partnership earnings | (9 | ) | | (1 | ) |
| Production tax credits, including prior year true-up | (1 | ) | | 4 |
|
| Other | 1 |
| | (3 | ) |
| Income tax expense (benefit) | $ | 72 |
| | $ | (1 | ) |
| Effective income tax rate | 147 | % | | (100 | )% |
The effective income tax rate may vary from period to period depending on, among other factors, the geographic and business mix of earnings and losses and changes in valuation allowances in accordance with ASC 740. These factors and others, including the Company's history of pre-tax earnings and losses, are taken into account in assessing the ability to realize deferred tax assets.
Net (Loss) Income Attributable to Noncontrolling Interests
For the year ended December 31, 2017, the Company had income of $60 million attributable to NRG's interest in the Company and a loss of $75 million attributable to noncontrolling interests with respect to its tax equity financing arrangements and the application of the HLBV method.
For the year ended December 31, 2016, the Company had income of $60 million attributable to NRG's interest in the Company and a loss of $111 million attributable to noncontrolling interests with respect to its tax equity financing arrangements and the application of the HLBV method, which was primarily related to the impairment losses described above.
Consolidated Results of Operations
2016 compared to 2015
The following table provides selected financial information:
| | | | | | | | | | | | | | | | | | |
| | Year ended December 31, |
| (In millions) | 2020 | | 2019 | | 2018 | |
| Operating Revenues | | | | | | |
| Energy and capacity revenues | $ | 1,234 | | | $ | 1,072 | | | $ | 1,084 | | |
| Other revenues | 53 | | | 40 | | | 39 | | |
| Contract amortization | (88) | | | (71) | | | (70) | | |
| Mark-to-market for economic hedges | — | | | (9) | | | — | | |
| Total operating revenues | 1,199 | | | 1,032 | | | 1,053 | | |
| Operating Costs and Expenses | | | | | | |
| Cost of fuels | 73 | | | 74 | | | 74 | | |
| | | | | | |
| Operations and maintenance | 219 | | | 191 | | | 184 | | |
| Other costs of operations | 74 | | | 72 | | | 69 | | |
| Depreciation, amortization and accretion | 428 | | | 401 | | | 336 | | |
| Impairment losses | 24 | | | 33 | | | — | | |
| General and administrative | 34 | | | 29 | | | 20 | | |
| Transaction and integration costs | 9 | | | 3 | | | 20 | | |
| Development costs | 5 | | | 5 | | | 3 | | |
| Total operating costs and expenses | 866 | | | 808 | | | 706 | | |
| Operating Income | 333 | | | 224 | | | 347 | | |
| Other Income (Expense) | | | | | | |
| Equity in earnings of unconsolidated affiliates | 7 | | | 83 | | | 74 | | |
| Impairment loss on investment | (8) | | | — | | | — | | |
| Gain on sale of unconsolidated affiliate | 49 | | | — | | | — | | |
| Other income, net | 4 | | | 9 | | | 8 | | |
| Loss on debt extinguishment | (24) | | | (16) | | | (7) | | |
| Interest expense, net | (415) | | | (404) | | | (306) | | |
| Total other expense, net | (387) | | | (328) | | | (231) | | |
| (Loss) Income Before Income Taxes | (54) | | | (104) | | | 116 | | |
| Income tax expense (benefit) | 8 | | | (8) | | | 62 | | |
| Net (Loss) Income | (62) | | | (96) | | | 54 | | |
| Less: Pre-acquisition net income of Drop Down Assets | — | | | — | | | 4 | | |
| Net (Loss) Income Excluding Pre-acquisition Net Income of Drop Down Assets | (62) | | | (96) | | | 50 | | |
| Less: Net (loss) income attributable to noncontrolling interests | (87) | | | (85) | | | 2 | | |
| Net Income (Loss) Attributable to Clearway Energy, Inc. | $ | 25 | | | $ | (11) | | | $ | 48 | | |
|
| | | | | | | | | | | |
| | Year ended December 31, |
| (In millions) | 2016 | | 2015 | | Change |
| Operating Revenues | | | | | |
| Energy and capacity revenues | $ | 1,104 |
| | $ | 1,024 |
| | $ | 80 |
|
| Contract amortization | (69 | ) | | (54 | ) | | (15 | ) |
| Mark-to-market economic hedging activities | — |
| | (2 | ) | | 2 |
|
| Total operating revenues | 1,035 |
| | 968 |
| | 67 |
|
| Operating Costs and Expenses | | | | | |
| Cost of fuels | 61 |
| | 71 |
| | (10 | ) |
| Emissions credit amortization | 6 |
| | — |
| | 6 |
|
| Operations and maintenance | 176 |
| | 180 |
| | (4 | ) |
| Other costs of operations | 65 |
| | 72 |
| | (7 | ) |
| Depreciation and amortization | 303 |
| | 303 |
| | — |
|
| Impairment losses | 185 |
| | 1 |
| | 184 |
|
| General and administrative | 16 |
| | 12 |
| | 4 |
|
| Acquisition-related transaction and integration costs | 1 |
| | 3 |
| | (2 | ) |
| Total operating costs and expenses | 813 |
| | 642 |
| | 171 |
|
| Operating Income | 222 |
| | 326 |
| | (104 | ) |
| Other Income (Expense) | | | | | |
| Equity in earnings of unconsolidated affiliates | 60 |
| | 31 |
| | 29 |
|
| Other income, net | 3 |
| | 3 |
| | — |
|
| Loss on debt extinguishment | — |
| | (9 | ) | | 9 |
|
| Interest expense | (284 | ) | | (267 | ) | | (17 | ) |
| Total other expense, net | (221 | ) | | (242 | ) | | 21 |
|
| Income Before Income Taxes | 1 |
| | 84 |
| | (83 | ) |
| Income tax (benefit) expense | (1 | ) | | 12 |
| | (13 | ) |
| Net Income | 2 |
| | 72 |
| | (70 | ) |
| Less: Pre-acquisition net loss of Drop Down Assets | (4 | ) | | — |
| | (4 | ) |
| Net Income Excluding Pre-acquisition Net (Loss) Income of Drop Down Assets | 6 |
| | 72 |
| | (66 | ) |
| Less: Net (loss) income attributable to noncontrolling interests | (51 | ) | | 39 |
| | (90 | ) |
| Net Income Attributable to NRG Yield, Inc. | $ | 57 |
| | $ | 33 |
| | $ | 24 |
|
| | | | | | | | | | | | | | | | | |
| Year ended December 31, |
| Business metrics: | 2020 | | 2019 | | 2018 |
Renewables MWh generated/sold (in thousands) (a) | 7,460 | | | 6,584 | | | 7,197 | |
| Thermal MWt sold (in thousands) | 1,927 | | | 2,153 | | | 2,042 | |
| Thermal MWh sold (in thousands) | 68 | | | 176 | | | 48 | |
Conventional MWh generated (in thousands) (a)(b) | 1,475 | | | 1,095 | | | 1,656 | |
| Conventional equivalent availability factor | 94.9 | % | | 94.9 | % | | 94.3 | % |
|
| | | | | |
| | Year ended December 31, |
| Business metrics: | 2016 | | 2015 |
Renewables MWh generated/sold (in thousands) (a) | 7,291 |
| | 6,463 |
|
Conventional MWh generated (in thousands) (a)(b) | 1,697 |
| | 2,487 |
|
| Thermal MWt sold (in thousands) | 1,966 |
| | 1,946 |
|
Thermal MWh sold (in thousands) (c) | 71 |
| | 297 |
|
(a) Volumes do not include the MWh generated/sold by the Company's equity method investments.
(b) Volumes generated are not sold as the Conventional facilities sell capacity rather than energy.
(c) MWh sold do not include 204 MWh generated by NRG Dover, a subsidiary of the Company, under the PPA with NRG Power Marketing during the year ended December 31, 2016, respectively, as further described in Item 15 — Note 15, Related Party Transactions, to the Consolidated Financial Statements.
Management’s discussion of the results of operations for the years ended December 31, 20162020 and 20152019
Gross Margin
The Company calculates gross margin in order to evaluate operating performance as operating revenues less cost of sales, which includes cost of fuel, contract and emission credit amortization and mark-to-market for economic hedging activities.
Economic Gross Margin
In addition to gross margin, the Company evaluates its operating performance using the measure of economic gross margin,Economic Gross Margin, which is not a GAAP measure and may not be comparable to other companies’ presentations or deemed more useful than the GAAP information provided elsewhere in this report. Economic gross marginGross Margin should be viewed as a supplement to and not a substitute for the Company'Company's presentation of gross margin, which is the most directly comparable GAAP measure. Economic gross marginGross Margin is not intended to represent gross margin. The Company believes that economic gross marginEconomic Gross Margin is useful to investors as it is a key operational measure reviewed by the Company's chief operating decision maker. Economic gross marginGross Margin is defined as energy and capacity revenue, plus other revenues, less cost of fuels. Economic gross marginGross Margin excludes the following components from GAAP gross margin: contract amortization, mark-to-market results, emissions credit amortization and (losses) gains on economic hedging activities. Mark-to-market results consist of unrealized gains and losses on contracts that are not yet settled.
The followingbelow tables present the composition of gross margin, as well as the reconciliation to economic gross marginEconomic Gross Margin for the years ended December 31, 20162020 and 2015:2019:
| | | | | | | | | | | | | | | | | | | | | | | | | |
| Conventional | | Renewables | | Thermal | | | | Total |
| (In millions) | |
| Year ended December 31, 2020 | | | | | | | | | |
| Energy and capacity revenues | $ | 461 | | | $ | 609 | | | $ | 164 | | | | | $ | 1,234 | |
| Other revenues | — | | | 21 | | | 32 | | | | | 53 | |
| Cost of fuels | (4) | | | — | | | (69) | | | | | (73) | |
| Contract amortization | (24) | | | (61) | | | (3) | | | | | (88) | |
| | | | | | | | | |
| Gross margin | 433 | | | 569 | | | 124 | | | | | 1,126 | |
| Contract amortization | 24 | | | 61 | | | 3 | | | | | 88 | |
| | | | | | | | | |
| Economic gross margin | $ | 457 | | | $ | 630 | | | $ | 127 | | | | | $ | 1,214 | |
| | | | | | | | | |
| Year ended December 31, 2019 | | | | | | | | | |
| Energy and capacity revenues | $ | 353 | | | $ | 545 | | | $ | 174 | | | | | $ | 1,072 | |
| Other revenues | — | | | 10 | | | 30 | | | | | 40 | |
| Cost of fuels | (2) | | | — | | | (72) | | | | | (74) | |
| Contract amortization | (7) | | | (61) | | | (3) | | | | | (71) | |
| | | | | | | | | |
| Mark-to-market for economic hedging activities | — | | | (9) | | | — | | | | | (9) | |
| Gross margin | 344 | | | 485 | | | 129 | | | | | 958 | |
| Contract amortization | 7 | | | 61 | | | 3 | | | | | 71 | |
| | | | | | | | | |
| Mark-to-market for economic hedging activities | — | | | 9 | | | — | | | | | 9 | |
| Economic gross margin | $ | 351 | | | $ | 555 | | | $ | 132 | | | | | $ | 1,038 | |
|
| | | | | | | | | | | | | | | |
| | Conventional | | Renewables | | Thermal | | Total |
| (In millions) | | | |
| Year ended December 31, 2016 | | | | | | |
|
| Energy and capacity revenues | $ | 338 |
| | $ | 594 |
| | $ | 172 |
| | $ | 1,104 |
|
| Cost of fuels | (1 | ) | | — |
| | (60 | ) | | (61 | ) |
| Contract amortization | (5 | ) | | (62 | ) | | (2 | ) | | (69 | ) |
| Emissions credit amortization | (6 | ) | | — |
| | — |
| | (6 | ) |
| Gross margin | $ | 326 |
| | $ | 532 |
| | $ | 110 |
| | $ | 968 |
|
| Contract amortization | 5 |
| | 62 |
| | 2 |
| | 69 |
|
| Emissions credit amortization | 6 |
| | — |
| | — |
| | 6 |
|
| Economic gross margin | $ | 337 |
| | $ | 594 |
| | $ | 112 |
| | $ | 1,043 |
|
| | | | | | | | |
| Year ended December 31, 2015 | | | | | | | |
| Energy and capacity revenues | $ | 341 |
| | $ | 507 |
| | $ | 176 |
| | $ | 1,024 |
|
| Cost of fuels | (1 | ) | | (1 | ) | | (69 | ) | | (71 | ) |
| Contract amortization | (5 | ) | | (47 | ) | | (2 | ) | | (54 | ) |
| Mark-to-market for economic hedging activities | — |
| | (2 | ) | | — |
| | (2 | ) |
| Gross margin | $ | 335 |
| | $ | 457 |
| | $ | 105 |
| | $ | 897 |
|
| Contract amortization | 5 |
| | 47 |
| | 2 |
| | 54 |
|
| Mark-to-market for economic hedging activities | — |
| | 2 |
| | — |
| | 2 |
|
| Economic gross margin | $ | 340 |
| | $ | 506 |
| | $ | 107 |
| | $ | 953 |
|
Gross margin increased by $71 million and economic gross marginincreased by $90$168 million during the year ended December 31, 2016,2020, compared to the same period in 2015, driven by:2019, primarily due to:
|
| | | |
| Renewables: | (In millions) |
| 26% increase in volume generated at the Alta wind projects, as well as a 7% increase in generation at other Wind projects. Additionally, there was an increase of $4 million in economic gross margin due to the acquisition of Spring Canyon in May 2015 | $ | 61 |
|
| Increase in average price per MWh due to higher pricing in the Alta X and XI PPAs which were effective in January 2016, compared with merchant prices in 2015 | 27 |
|
| Thermal: |
|
| Higher sales volume in 2016 as a result of milder weather in 2015, as well as the completion of a project for a new customer in the second half of the year | 5 |
|
| Conventional: |
|
| Lower revenues at Walnut Creek as a result of forced outages in 2016, partially offset by higher revenues at El Segundo in 2016 as a result of forced outages in 2015 | (3 | ) |
| Increase in economic gross margin | $ | 90 |
|
| Higher contract amortization primarily for the Alta X and XI PPAs, which began in January 2016 | (15 | ) |
| Emissions credit amortization of NOx allowances at Walnut Creek and El Segundo in compliance with amendments to the Regional Clean Air Incentives Market program | (6 | ) |
| Unrealized losses on forward contracts prior to the start of the PPA for Elbow Creek which began October 2015 | 2 |
|
| Increase in gross margin | $ | 71 |
|
| | | | | | | | | | | | | | |
| Segment | | | | (In millions) |
| Conventional | | Increase is due primarily to the acquisition of Carlsbad Energy in December 2019 | | $ | 89 | |
| Renewables | | Increases of $32 million from the consolidation of the DGPV Holdco Entities, increase of $22 million in wind projects primarily related to a $17 million increase due to the completion of the repowering of Elbow Creek and Wildorado, an increase of $21 million due to the Oahu and Kawailoa facilities achieving COD in late 2019 and a $9 million increase due to the prior year outage at CVSR. | | 84 | |
| Thermal | | Decreases of $5 million related to the sale of Dover on March 2, 2020 and $3 million primarily due to decrease in volumetric sales at certain locations related to COVID-19, offset by an increase of $3 million related to the acquisition of the Duquesne University Energy System on May 1, 2019 | | (5) | |
| | | | $ | 168 | |
Operations and Maintenance Expense
|
| | | | | | | | | | | | | | | |
| | Conventional | | Renewables | | Thermal | | Total |
| (In millions) | | | |
| Year ended December 31, 2016 | $ | 32 |
| | $ | 96 |
| | $ | 48 |
| | $ | 176 |
|
| Year ended December 31, 2015 | 30 |
| | 99 |
| | 51 |
| | 180 |
|
Operations and maintenance expense decreasedincreased by $4$28 million during the year ended December 31, 2016,2020 compared to the same period in 2015, driven by:2019, due to a $17 million increase in the Conventional segment primarily related to the acquisition of the Carlsbad Energy Center in December 2019 and an $11 million increase in maintenance primarily related to the consolidation of the DGPV Holdco entities within the Renewables segment.
Depreciation, Amortization and Accretion |
| | | |
| | (In millions) |
| Increase in Conventional segment primarily due to Walnut Creek forced outages in 2016, compared to the forced outages at El Segundo in 2015 | $ | 2 |
|
| Decrease in Renewables segment primarily due to insurance proceeds received at Wildorado in 2016 in connection with a 2014 wind outage claim | (3 | ) |
| Decrease in Thermal segment primarily due to acceleration of maintenance work on thermal facilities into 2015 | (3 | ) |
| | $ | (4 | ) |
Other Costs of Operations
Other costs of operations decreased Depreciation, amortization and accretion expense increased by $7$27 million during the year ended December 31, 2016,2020, compared to the same period in 2015, primarily2019, due to lower assessmentsa $30 million increase in the Conventional segment related to the acquisition of Carlsbad Energy in December 2019 and a $3 million increase in the Thermal segment due primarily to accelerated depreciation related to Duquesne, partially offset by a $6 million decrease in the Renewables segment. In 2019, the Company accelerated depreciation at the Wildorado and Elbow Creek projects, in connection with the repowering activities, which resulted in additional depreciation expense for property taxes at Alta Xthe two projects of $39 million in the prior period. The current period includes incremental depreciation of $33 million consisting of accelerated depreciation of approximately $11 million for the repowering of Pinnacle, additional depreciation of $11 million related to the Oahu and XIKawailoa projects which reached COD in late 2019 and NRG Wind TE Holdco.$11 million of additional depreciation due to the consolidation of the Chestnut and CS4 Funds in May 2020.
General and Administrative ExpensesImpairment Losses
General and administrative expenses increased by $4 The Company recorded impairment losses of $24 million for the year ended December 31, 20162020, primarily related to several wind projects within the Renewables segment, as further described in Item 15 — Note 9, Asset Impairments.
General and Administrative Expenses
General and administrative expenses increased by $5 million for the year ended December 31, 2020 compared to the same period in 2015,2019, primarily due to new executive compensationan increase in 2016,MSA fees charged by CEG and an increase in base management feepersonnel costs.
Transaction and Integration Costs
Transaction and integration expenses increased $6 million for the Management Services Agreement with NRG in connection with the acquisition of the Drop Down Assets.
Impairment Losses
For the year ended December 31, 2016,2020 compared to the Company recorded impairment losses of $185 million,same period in 2019 primarily due to the impairmentsincreased number of property, plantDrop Down transactions.
Equity in Earnings of Unconsolidated Affiliates
Equity in earnings of unconsolidated affiliates decreased by $76 million during the year ended December 31, 2020 compared to the same period in 2019. This change was driven by decreases in HLBV earnings for the DGPV Holdco Entities, as well as HLBV losses for Mesquite Star which was acquired September 1, 2020, partially offset by increases in HLBV earnings for the Desert Sunlight, RPV and equipment for Elbow Creek, Goat Wind, and Forward,Utah investments.
Impairment Loss on Investment
The Company recorded an $8 million impairment loss during the year ended December 31, 2020, related to San Juan Mesa, an equity method investment within the Renewables segment as further described in Item 15 — Note 9, Asset Impairments,.
Gain on Sale of Unconsolidated Affiliate
On May 14, 2020, the Company sold its interests in RPV Holdco 1 LLC to the Consolidated Financial Statements, a third party which resulted in a gain on sale of investment of approximately $49 million, as well as in Critical Accounting Policies and Estimates in this Item 7 below. Because the projects were acquired from NRG and related to interests under common control by NRG, the property, plant and equipment for these assets was recorded at historical cost of $298 million rather than estimated fair value of $132 million at the acquisition date. The three projects were acquired as part of the November 2015 Drop Down Assets. As discussedfurther described in Item 15 — Note 3, Business Acquisitions, the historical cost for November 2015 Drop Down Assets was $369 million for the net assets, which was higher than the fair value paid of $207 million. The difference between the historical cost of net assetsAcquisition and the fair value paid for the November 2015 Drop Down Assets was recorded to noncontrolling interest on the Company’s consolidated balance sheet.Dispositions.
Loss on Debt Extinguishment
AThe Company recorded loss on debt extinguishment of $9 million was recorded for the year ended December 31, 2015, driven by the refinancing of the El Segundo credit facility and the termination of the interest rate swaps for Alta Wind X and XI in connection with the sale of an economic interest in Alta TE Holdco to a financial institution as further described in Item 15 — Note 5, Investments Accounted for by the Equity Method and Variable Interest Entities, to the Consolidated Financial Statements.
Equity in Earnings of Unconsolidated Affiliates
Equity in earnings of unconsolidated affiliates increased by $29$24 million during the year ended December 31, 2016, compared2020, which reflects the write-off of previously deferred debt issance costs, primarily related to the same periodrepayment of debt and related refinancing activities in 2015, primarily due to an increasethe Renewables segment as further described in equity earnings from Desert Sunlight, which was acquired in June 2015, DGPV Holdco 1 and RPV Holdco, partially offset by losses from Elkhorn Ridge.Item 15 — Note 10, Long-term Debt.
Interest Expense
Interest expense increased by $17$11 million during the year ended December 31, 2016,2020 compared to the same period in 2015,2019 primarily due to:
| | | | | | | | |
| | (In millions) |
| Additional interest expense for Carlsbad Energy Center which was acquired on December 5, 2019 | | $ | 27 | |
| Increase in Corporate interest expense due primarily to additional revolver borrowings and the issuance of the additional Senior Notes due 2028 | | 8 | |
| Change in fair value of interest rate swaps | | 6 | |
| Reclassification of earnings previously deferred in Accumulated Other Comprehensive Income to the statement of operations in connection with project-level debt refinancing activities | | (8) | |
| | |
| Decrease in interest expense due to lower principal balances of project level debt primarily related to refinancing, offset slightly by an increase in interest expense related to Oahu and Kawailoa which were capitalized in 2019 and the consolidation of the DGPV Holdco Entities in 2020 | | (22) | |
| | $ | 11 | |
|
| | | |
| (In millions) |
| Amortization of the fair value of interest rate swaps primarily acquired with the January 2015 Drop Down Assets and November 2015 Drop Down Assets | $ | 10 |
|
| Issuance of the 2020 Convertible Notes in the second quarter of 2015 and amortization of the related discount and debt issuance costs | 8 |
|
| Issuance of 2026 Senior Notes in August 2016 | 7 |
|
| Utah Solar Portfolio debt assumed in connection with the March 2017 Drop Down Assets | 6 |
|
| Issuance of 2037 CVSR Holdco Notes in July 2016 | 4 |
|
| Higher revolving credit facility borrowings in 2016 | 2 |
|
| Repricing of project-level financing arrangements and lower principal balances | (20 | ) |
| | $ | 17 |
|
Income Tax Expense (Benefit)
For the year ended December 31, 2016,2020, the Company recorded income tax expense of $8 million on pretax loss of $54 million. For the same period in 2019, the Company recorded an income tax benefit of $1$8 million on pretax incomeloss of $1$104 million. For the same period in 2015, the Company recorded income tax expense of $12 million on pretax income of $84 million. For the yearsyear ended December 31, 2016 and 2015,2020, the overall effective tax rate was different than the statutory rate of 35%21% primarily due to the taxable earnings and losses allocated to NRG resulting from NRG'spartners’ interest in NRG YieldClearway Energy LLC, which includes the effects of applying the hypothetical liquidation at book value, or HLBV, method of accounting for book purposes to certain partnerships.
For the year ended December 31, 2019, the overall effective tax rate was different than the statutory rate of 21% primarily due to the taxable earnings and PTCs and ITCs generated fromlosses allocated to partners’ interest in Clearway Energy LLC, which includes the effects of applying the hypothetical liquidation at book value, or HLBV, method of accounting for book purposes to certain wind and solar assets, respectively.partnerships.
A reconciliation of the U.S. federal statutory rate of 35%21% to the Company's effective rate is as follows:
| | | | | | | | | | | |
| | Year Ended December 31, |
| | 2020 | | 2019 |
| | (In millions, except percentages) |
| | | |
| Loss Before Income Taxes | $ | (54) | | | $ | (104) | |
| Tax at 21% | (11) | | | (22) | |
| State taxes, net of federal benefit | (4) | | | (7) | |
| | | |
| Impact of non-taxable partnership earnings | 24 | | | 24 | |
| Investment tax credits | — | | | (1) | |
| Production tax credits, including prior year true-up | (1) | | | (1) | |
| Rate change | 2 | | | — | |
| Other | (2) | | | (1) | |
| Income tax expense (benefit) | $ | 8 | | | $ | (8) | |
| Effective income tax rate | (14.8) | % | | 7.7 | % |
|
| | | | | | | |
| | |
| | 2016 | | 2015 |
| | |
| Income Before Income Taxes | 1 |
| | 84 |
|
| Tax at 35% | — |
| | 29 |
|
| State taxes, net of federal benefit | — |
| | 2 |
|
| Investment tax credits | (1 | ) | | (1 | ) |
| Impact of non-taxable partnership earnings | (1 | ) | | (17 | ) |
| Production tax credits, including prior year true-up | 4 |
| | (4 | ) |
| Other | (3 | ) | | 3 |
|
| Income tax (benefit) expense | $ | (1 | ) | | $ | 12 |
|
| Effective income tax rate | (100 | )% | | 14 | % |
The effective income tax rate may vary from period to period depending on, among other factors, the geographic and business mix of earnings and losses, earnings and losses allocated to partners' interest in Clearway Energy LLC which includes the effects of applying the HLBV method of accounting for book purposes to certain partnerships, and changes in valuation allowances in accordance with ASC 740. These factors and others, including the Company's history of pre-tax earnings and losses, are taken into account in assessing the ability to realize deferred tax assets.
IncomeNet Loss Attributable to Noncontrolling Interests
For the year ended December 31, 2016,2020, the Company had income of $60$26 million attributable to NRG'sCEG's economic interest in the Company and a lossClearway Energy LLC, offset by losses of $111$20 million attributable to noncontrollingCEG's interests with respect to its tax equity financing arrangements and the application of the HLBV method, which was primarily related to the impairment losses described above.
For the year ended December 31, 2015, the Company had income of $53 million attributable to NRG's interest in the CompanyKawailoa, Oahu and a lossRepowering partnerships and losses of $14$93 million attributable to noncontrolling interests with respect to its tax equity financing arrangements and the application of the HLBV method.
For the year ended December 31, 2019, the Company had a loss of $14 million attributable to CEG's economic interest in Clearway Energy LLC, as well as $21 million of net losses attributable to CEG's interests in the Repowering, Oahu, and Kawailoa partnerships. The Company also recorded a net loss of $57 million attributable to noncontrolling interests with respect to tax equity financing arrangements and the application of the HLBV method, primarily reflecting tax benefits allocated to tax equity investors in periods immediately subsequent to COD. This was partially offset by $7 million of income attributable to a third party's interest in the Kawailoa partnership.
Liquidity and Capital Resources
The Company's principal liquidity requirements are to meet its financial commitments, finance current operations, fund capital expenditures, including acquisitions from time to time, service debt and pay dividends. As a normal part of the Company's business, depending on market conditions, the Company will from time to time consider opportunities to repay, redeem, repurchase or refinance its indebtedness. Changes in the Company's operating plans, lower than anticipated sales, increased expenses, acquisitions or other events may cause the Company to seek additional debt or equity financing in future periods. There can be no guarantee that financing will be available on acceptable terms or at all. Debt financing, if available, could impose additional cash payment obligations and additional covenants and operating restrictions.
Current Liquidity Position
As of December 31, 20172020 and 20162019, the Company's liquidity was approximately $682$894 million and $933$842 million, respectively, comprised of cash, restricted cash and availability under the Company's revolving credit facility.
| | | | | | | | | | | |
| | As of December 31, |
| | 2020 | | 2019 |
| | (In millions) |
| Cash and cash equivalents: | | | |
| Clearway Energy, Inc. and Clearway Energy LLC, excluding subsidiaries | $ | 119 | | | $ | 30 | |
| Subsidiaries | 149 | | | 125 | |
| Restricted cash: | | | |
| Operating accounts | 73 | | | 129 | |
| Reserves, including debt service, distributions, performance obligations and other reserves | 124 | | | 133 | |
| Total cash, cash equivalents and restricted cash | $ | 465 | | | $ | 417 | |
| Revolving credit facility availability | $ | 429 | | | $ | 425 | |
| Total liquidity | $ | 894 | | | $ | 842 | |
|
| | | | | | | |
| | As of December 31, |
| | 2017 | | 2016 |
| | (In millions) |
| Cash and cash equivalents | $ | 148 |
| | $ | 322 |
|
| Restricted cash - operating | 86 |
| | 76 |
|
Restricted cash - reserves | 82 |
| | 100 |
|
| Total | 316 |
| | 498 |
|
| Total credit facility availability | 366 |
| | 435 |
|
| Total liquidity | $ | 682 |
| | $ | 933 |
|
The Company's liquidity includes $168$197 million and $176$262 million of restricted cash balances as of December 31, 20172020 and 20162019, respectively. Restricted cash consists primarily of funds to satisfy the requirements of certain debt arrangements and funds held within the Company's projects that are restricted in their use. Of these funds asAs of December 31, 2017,2020, these restricted funds were comprised of $73 million designated to fund operating expenses, approximately $25$24 million is designated for current debt service payments, $25 million is designated to fund operating expenses and $36 million is designated for distributions to the Company, with the remaining $82$45 million restricted for reserves including debt service, performance obligations and other reserves, as well as capital expenditures. The remaining $55 million is held in distribution reserve accounts.
The Company's various financing arrangements are described in Item 15 —Note 10, Long-term Debt, to the Consolidated Financial Statements.As of December 31, 2017, $552020, the Company had no outstanding borrowings under the revolving credit facility and $66 million of borrowings and $74 million ofin letters of credit wereoutstanding. During the year ended December 31, 2020, the Company borrowed $265 million under the revolving credit facility, and subsequently repaid $265 million utilizing the proceeds from the issuance of additional 2028 Senior Notes, as described below, and cash on hand.The Company had $195 million outstanding under the revolving credit facility.facility and a total of $70 million in letters of credit outstanding as of February 26, 2021.
On July 1, 2020, PG&E emerged from bankruptcy and assumed the Company's contracts without modification. Subsequent to July 1, 2020, the Company collected all remaining receivables due from PG&E for pre-petition periods and received all distributions that were previously restricted from subsidiaries affected by the PG&E Bankruptcy.
Management believes that the Company's liquidity position, cash flows from operations and availability under its revolving credit facility will be adequate to meet the Company's financial commitments; debt service obligations; growth, operating and maintenance capital expenditures; and to fund dividends to holders of the Company's Class A common stock and Class C common stock. Management continues to regularly monitor the Company's ability to finance the needs of its operating, financing and investing activity within the dictates of prudent balance sheet management.
NRG Transaction and Related Liquidity Considerations
On February 6, 2018, NRG entered into agreements for the sale of 100% of its interest in NRG Yield, Inc. and its renewable energy development and operations platform, or the NRG Transaction. In connection with this, the Company entered into a Consent and Indemnity Agreement with NRG and Global Infrastructure Partners. For further discussion of the NRG Transaction and the related ROFO impacts, refer to Item 1 — Business, as well as, Item 15 — Note 1, Nature of Business.
As part of the Consent and Indemnity Agreement, GIP has arranged a $1.5 billion backstop credit facility to manage any change of control costs associated with NRG Yield's corporate debt. In addition, GIP has committed to provide $400 million in financing support for the Carlsbad Energy Center transaction, which would be exercised if necessary.
On February 6, 2018, NRG Yield Operating LLC and NRG Yield LLC amended the revolving credit facility to modify the change of control provisions to permit the consummation of the NRG Transaction, and also to permit NRG Yield Operating LLC, NRG Yield LLC and certain subsidiaries to incur up to $1.5 billion of unsecured indebtedness in order to repurchase or make other required cash payments, in each case if applicable, with respect to NRG Yield Operating LLC’s outstanding senior notes and NRG Yield's outstanding convertible notes in connection with the NRG Transaction.
Credit Ratings
Credit rating agencies rate a firm's public debt securities. These ratings are utilized by the debt markets in evaluating a firm's credit risk. Ratings influence the price paid to issue new debt securities by indicating to the market the Company's ability to pay principal, interest and preferred dividends. Rating agencies evaluate a firm's industry, cash flow, leverage, liquidity and hedge profile, among other factors, in their credit analysis of a firm's credit risk.
The following table summarizes the credit ratings for the Company and its Senior Notes as of December 31, 2017.2020. The ratings outlook is stable.
|
| | | | | | | | | | | | |
| S&P | | Moody's | | |
NRG Yield,Clearway Energy, Inc. | BB | | Ba2 | | |
5.375%5.75% Senior Notes, due 20242025 | BB | | Ba2 | | |
| 5.000% Senior Notes, due 2026 | BB | | Ba2 | | |
| 4.750% Senior Notes, due 2028 | BB | | Ba2 | | |
On February 7, 2018, S&P and Moody's reaffirmed the ratings outlook as stable.
Sources of Liquidity
The Company's principal sources of liquidity include cash on hand, cash generated from operations, proceeds from sales of assets, borrowings under new and existing financing arrangements and the issuance of additional equity and debt securities as appropriate given market conditions. As described in Item 15 —Note 10, Long-term Debt, to the Consolidated Financial Statements, and above in Significant Events During the Year Ended December 31, 2017,the Company's financing arrangements consist of corporate level debt, which includes Senior Notes and the revolving credit facility, the 2019 Convertible Notes, the 2020 Convertible Notes, the 2024 Senior Notes, the 2026 Senior Notes, the ATM ProgramPrograms, and project-level financings for its various assets.
At-the-Market Equity Offering ProgramRevolving Credit Facility
In 2016, NRG Yield, Inc.The Company has a total of $429 million available under the revolving credit facility as of December 31, 2020. The facility will continue to be used for general corporate purposes including financing of future acquisitions and posting letters of credit.
DG-CS Master Borrower LLC
On November 2, 2020, DG-CS Master Borrower LLC, a wholly owned subsidiary of Clearway Energy Operating LLC, entered into an equity distribution agreement, or EDA, with Barclays Capital Inc., Credit Suisse Securities (USA)a financing arrangement, which included the issuance of a $467 million term loan, as well as $30 million in letters of credit in support of debt service. The notes bear interest at 3.51% and mature on September 30, 2040. The proceeds from the loan were utilized to repay existing project-level debt outstanding for Chestnut Borrower LLC, J.P. Morgan SecuritiesRenew Solar CS 4 Borrower LLC, DGPV 4 Borrower LLC and RBC Capital Markets,Puma Class B LLC of $107 million, $102 million, $92 million and $73 million, respectively and unwind related interest rate swaps in the amount of $42 million. The remaining proceeds were utilized to pay related fees and expenses and in part to acquire the Class B membership interests in the DGPV Holdco Entities and an SREC contract from CEG as sales agents. Pursuantfurther described in Item 15 — Note 5, Investments Accounted for by the Equity Method and Variable Interest Entities.
Utah Solar Holdings, LLC
On September 1, 2020, Utah Solar Holdings, LLC, or Utah Solar, entered into a financing arrangement, which included the issuance of approximately $296 million in senior secured notes supported by the Company’s interest in the Four Brothers, Granite Mountain and Iron Springs projects, or the Utah projects (previously defined as the Utah Solar Portfolio). The notes bear interest at 3.59% per annum and mature on December 31, 2036. The proceeds from the issuance were utilized to repay existing debt outstanding of approximately $247 million for the termsUtah projects and to unwind the related interest rate swaps in the amount of $33 million. The remaining proceeds were utilized to pay related fees and expenses, with the remaining $9 million distributed to Clearway Energy Operating LLC.
NIMH Solar LLC
On September 30, 2020, the Alpine, Blythe and Roadrunner projects were transferred under NIMH Solar LLC, a wholly owned subsidiary of Clearway Energy Operating LLC. Concurrently, total project-level debt outstanding for Alpine, Blythe and Roadrunner of $158 million was assigned to NIMH Solar LLC. The consolidated facility was amended to a term loan for$193 million, as well as $16 million in letters of credit in support of debt service and project obligations. The term loan bears annual interest at an annual rate of LIBOR, plus an applicable margin, which is 2.00% per annum through the third anniversary of closing, and 2.125% per annum thereafter through the maturity date in September 2024. As a result of the EDA, NRG Yield, Inc. may offeramendment the Company received $35 million and sell sharesthe funds were utilized to pay related fees and expenses and along with existing project level cash provided a distribution to Clearway Energy Operating LLC of its Class C common stock par value $0.01 per share, from time to time through$45 million. The obligations under the sales agents, as NRG Yield, Inc.’s sales agents forfinancing arrangement are supported by the offer andCompany’s interests in the projects.
2028 Senior Notes
On May 21, 2020, Clearway Energy Operating LLC completed the sale of the shares, up to an additional $250 million aggregate sales price of $150,000,000 through an at-the-market equity offering program, or ATM Program. NRG Yield, Inc. may also sell shares of its Class C common stock to anyprincipal amount of the sales agents,2028 Senior Notes. The 2028 Senior Notes bear interest at 4.75% and mature on March 15, 2028. The net proceeds were utilized to repay the $45 million outstanding principal amount of the Company's 2020 Convertible Notes on June 1, 2020, as principalswell as repay amounts outstanding under the Company’s revolving credit facility and for its own account, at a price agreed upon at the time of sale. general corporate purposes.
ATM Programs
As of December 31, 2017, NRG Yield, Inc. issued 1,921,866 shares of Class C common stock under the ATM Program for gross proceeds of $35 million and incurred commission fees of $346 thousand. At December 31, 2017,2020, approximately $115$126 million of Class C common stock remains available for issuance under the 2020 ATM Program. During the year ended December 31, 2020, the Company sold 2,690,455 shares of Class C common stock for net proceeds of $63 million under the ATM Programs. The Company utilized the proceeds to acquire 2,690,455 Class C units of Clearway Energy LLC. The Company concluded the 2016 ATM program on June 30, 2020.
Thermal FinancingSale of Interest in RPV Holdco 1
On May 14, 2020, the Company sold its interests in RPV Holdco 1 LLC to a third party for net proceeds of approximately $75 million.
Sale of Energy Center Dover LLC and Energy Center Smyrna LLC Assets
On March 16, 2017, NRG3, 2020, the Company, through Thermal LLC, sold 100% of its interests in Energy Center MinneapolisDover LLC a subsidiary of the Company, amended the shelf facility of its existing Thermal financing arrangement to allow for the issuance of an additional $10 million of Series F notes at a 4.60% interest rate, or the Series F Notes, increasing the total principal amount of notes available for issuance under the shelf facility to $80 million. The Series F Notes are secured by substantially all of the assets of NRGand Energy Center Minneapolis LLC. NRG ThermalSmyrna LLC has guaranteed the indebtedness and its guarantee is secured by a pledge of the equity interests in all of NRG Thermal LLC’s subsidiaries.to DB Energy Assets, LLC for approximately $15 million.
Uses of Liquidity
The Company's requirements for liquidity and capital resources, other than for operating its facilities, are categorized as: (i) debt service obligations, as described more fully in Item 15 —Note 10, Long-term Debt, to the Consolidated Financial Statements; (ii) capital expenditures; (iii) acquisitions and investments; and (iv) cash dividends to investors.
Debt Service Obligations
Principal payments on debt as of December 31, 20172020, are due in the following periods:
| | | | | | | | | | | | | | | | | | | | | | | | | | | | | | | | | | | | | | | | | | | |
| Description | 2021 | | 2022 | | 2023 | | 2024 | | 2025 | | There-after | | Total | | |
| (In millions) | | |
| Clearway Energy Operating LLC Senior Notes, due 2025 | — | | | — | | | — | | | — | | | 600 | | | — | | | 600 | | | |
| Clearway Energy Operating LLC Senior Notes, due 2026 | — | | | — | | | — | | | — | | | — | | | 350 | | | 350 | | | |
| Clearway Energy Operating LLC Senior Notes, due 2028 | — | | | — | | | — | | | — | | | — | | | 850 | | | 850 | | | |
| Total Corporate-level debt | — | | | — | | | —�� | | | — | | | 600 | | | 1,200 | | | 1,800 | | | |
| Project-level debt: | | | | | | | | | | | | | | | |
| Alta Wind I-V lease financing arrangements, due 2034 and 2035 | 45 | | | 47 | | | 49 | | | 51 | | | 54 | | | 554 | | | 800 | | | |
| Alta Wind Asset Management LLC | 1 | | | 1 | | | 1 | | | 1 | | | 1 | | | 9 | | | 14 | | | |
| Alta Wind Realty Investments LLC, due 2031 | 2 | | | 2 | | | 2 | | | 2 | | | 2 | | | 15 | | | 25 | | | |
| | | | | | | | | | | | | | | |
| Borrego, due 2024 and 2038 | 3 | | | 3 | | | 3 | | | 3 | | | 3 | | | 42 | | | 57 | | | |
| Buckthorn Solar, due 2025 | 3 | | | 3 | | | 4 | | | 4 | | | 112 | | | — | | | 126 | | | |
| Carlsbad Holdco, due 2038 | 6 | | | 7 | | | 2 | | | 2 | | | 3 | | | 190 | | | 210 | | | |
| Carlsbad Energy Holdings LLC, due 2027 | 20 | | | 21 | | | 22 | | | 23 | | | 25 | | | 45 | | | 156 | | | |
| | | | | | | | | | | | | | | |
| | | | | | | | | | | | | | | |
| Carlsbad Energy Holdings LLC, due 2038 | — | | | — | | | — | | | — | | | — | | | 407 | | | 407 | | | |
| CVSR, due 2037 | 23 | | | 25 | | | 26 | | | 28 | | | 30 | | | 543 | | | 675 | | | |
| CVSR Holdco Notes, due 2037 | 7 | | | 9 | | | 9 | | | 9 | | | 9 | | | 133 | | | 176 | | | |
| DG-CS Master Borrower LLC, due 2040 | 26 | | | 28 | | | 28 | | | 29 | | | 30 | | | 326 | | | 467 | | | |
| Duquesne, due 2059 | — | | | — | | | — | | | — | | | — | | | 95 | | | 95 | | | |
| El Segundo Energy Center, due 2023 | 57 | | | 63 | | | 130 | | | — | | | — | | | — | | | 250 | | | |
| Energy Center Minneapolis Series D, E, F, G, H Notes, due 2025-2037 | — | | | — | | | — | | | — | | | 4 | | | 323 | | | 327 | | | |
| Laredo Ridge, due 2028 | 6 | | | 7 | | | 7 | | | 9 | | | 11 | | | 38 | | | 78 | | | |
| Kawailoa Solar Portfolio LLC, due 2026 | 2 | | | 2 | | | 2 | | | 3 | | | 3 | | | 69 | | | 81 | | | |
| Marsh Landing, due 2023 | 62 | | | 65 | | | 19 | | | — | | | — | | | — | | | 146 | | | |
| NIMH Solar, due 2024 | 14 | | | 14 | | | 14 | | | 149 | | | — | | | — | | | 191 | | | |
| Oahu Solar Holdings LLC, due 2026 | 3 | | | 3 | | | 3 | | | 3 | | | 3 | | | 74 | | | 89 | | | |
| Rosie Class B, due 2027 | 2 | | | 2 | | | 3 | | | 3 | | | 3 | | | 67 | | | 80 | | | |
| | | | | | | | | | | | | | | |
| Tapestry, due 2031 | 10 | | | 11 | | | 11 | | | 12 | | | 13 | | | 86 | | | 143 | | | |
| Utah Solar Holdings, due 2036 | 17 | | | 16 | | | 15 | | | 14 | | | 14 | | | 214 | | | 290 | | | |
| Walnut Creek, due 2023 | 53 | | | 55 | | | 18 | | | — | | | — | | | — | | | 126 | | | |
| WCEP Holdings, LLC due 2023 | 4 | | | 5 | | | 26 | | | — | | | — | | | — | | | 35 | | | |
| Other | 18 | | | 18 | | | 37 | | | 14 | | | 14 | | | 98 | | | 199 | | | |
| Total project-level debt | 384 | | | 407 | | | 431 | | | 359 | | | 334 | | | 3,328 | | | 5,243 | | | |
| Total debt | $ | 384 | | | $ | 407 | | | $ | 431 | | | $ | 359 | | | $ | 934 | | | $ | 4,528 | | | $ | 7,043 | | | |
| | | | | | | | | | | | | | | |
| | | | | | | | | | | | | | | |
|
| | | | | | | | | | | | | | | | | | | | | | | | | | | |
| Description | 2018 | | 2019 | | 2020 | | 2021 | | 2022 | | There-after | | Total |
| | (In millions) |
| NRG Yield, Inc. Convertible Notes, due 2019 | $ | — |
| | $ | 345 |
| | $ | — |
| | $ | — |
| | $ | — |
| | $ | — |
| | $ | 345 |
|
| NRG Yield, Inc. Convertible Notes, due 2020 | — |
| | — |
| | 288 |
| | — |
| | — |
| | — |
| | 288 |
|
| NRG Yield Operating LLC Senior Notes, due 2024 | — |
| | — |
| | — |
| | — |
| | — |
| | 500 |
| | 500 |
|
| NRG Yield Operating LLC Senior Notes, due 2026 | — |
| | — |
| | — |
| | — |
| | — |
| | 350 |
| | 350 |
|
| NRG Yield LLC and NRG Yield Operating LLC Revolving Credit Facility, due 2019 | — |
| | 55 |
| | — |
| | — |
| | — |
| | — |
| | 55 |
|
| Total Corporate-level debt | — |
| | 400 |
| | 288 |
| | — |
| | — |
| | 850 |
| | 1,538 |
|
| Project-level debt: | | | | | | | | | | | | | |
| Agua Caliente Borrower 2, due 2038 | 1 |
| | 1 |
| | 1 |
| | 1 |
| | 1 |
| | 36 |
| | 41 |
|
| Alpine, due 2022 | 8 |
| | 8 |
| | 8 |
| | 8 |
| | 103 |
| | — |
| | 135 |
|
| Alta Wind I - V lease financing arrangements, due 2034 and 2035 | 40 |
| | 41 |
| | 45 |
| | 45 |
| | 47 |
| | 708 |
| | 926 |
|
| CVSR, due 2037 | 26 |
| | 24 |
| | 21 |
| | 23 |
| | 25 |
| | 627 |
| | 746 |
|
| CVSR Holdco Notes, due 2037 | 6 |
| | 6 |
| | 6 |
| | 7 |
| | 9 |
| | 160 |
| | 194 |
|
| El Segundo Energy Center, due 2023 | 48 |
| | 49 |
| | 53 |
| | 57 |
| | 63 |
| | 130 |
| | 400 |
|
| Energy Center Minneapolis, due 2025 | 7 |
| | 11 |
| | 11 |
| | 11 |
| | 11 |
| | 32 |
| | 83 |
|
| Energy Center Minneapolis Series D Notes, due 2031 | — |
| | — |
| | — |
| | — |
| | — |
| | 125 |
| | 125 |
|
| Laredo Ridge, due 2028 | 5 |
| | 5 |
| | 6 |
| | 6 |
| | 7 |
| | 66 |
| | 95 |
|
| Marsh Landing, due 2023 | 55 |
| | 57 |
| | 60 |
| | 62 |
| | 65 |
| | 19 |
| | 318 |
|
| Tapestry, due 2021 | 11 |
| | 11 |
| | 11 |
| | 129 |
| | — |
| | — |
| | 162 |
|
| Utah Solar Portfolio, due 2022 | 12 |
| | 14 |
| | 13 |
| | 13 |
| | 226 |
| | — |
| | 278 |
|
| Viento, due 2023 | 16 |
| | 18 |
| | 16 |
| | 16 |
| | 17 |
| | 80 |
| | 163 |
|
| Walnut Creek, due 2023 | 45 |
|
| 47 |
|
| 49 |
|
| 52 |
|
| 55 |
|
| 19 |
| | 267 |
|
| Other | 26 |
|
| 30 |
|
| 69 |
|
| 25 |
|
| 24 |
|
| 269 |
| | 443 |
|
| Total project-level debt | 306 |
| | 322 |
| | 369 |
| | 455 |
| | 653 |
| | 2,271 |
| | 4,376 |
|
| Total debt | $ | 306 |
| | $ | 722 |
| | $ | 657 |
|
| $ | 455 |
|
| $ | 653 |
|
| $ | 3,121 |
|
| $ | 5,914 |
|
Capital Expenditures
The Company's capital spending program is mainly focused on maintenance capital expenditures, consisting of costs to maintain the assets currently operating, such as costs to replace or refurbish assets during routine maintenance, and growth capital expenditures consisting of costs to construct new assets, costs to complete the construction of assets where construction is in process, and capital expenditures related to acquiring additional thermal customers.
For the years ended December 31, 20172020, 2016,2019, and 2015,2018, the Company used approximately $31$124 million, $20$228 million, and $29$83 million, respectively, to fund capital expenditures, includingmaintenance capital expenditures of $27$23 million,$16 $22 million and $20$36 million, respectively.Growth capital expenditures in 20172020 include $59 million in the Renewables segment, $48 million of which were incurred in primarilyconnection with the repowering of Elbow Creek and Wildorado facilities completed in the first quarter of 2020, $3 million incurred in connection with the Rosamond project, and $8 million incurred in the Oahu Partnership and the Kawailoa Partnership. In addition, the conventional segment incurred growth capital expenditures of $8 million related to the Marsh Landing black start project.The Company also incurred $34 million of growth capital expenditures in the Thermal segment and relate to servicing new customers in district energy centers.connection with various development projects.
Growth capital expenditures in 20162019 include $180 million in the Renewables segment, $157 million of which were incurred in connection with the Repowering Partnership entered by the Company in August 2018, as well as $29 million incurred in the Oahu Partnership and 2015 primarily related to the servicing new customersKawailoa Partnership.
Growth capital expenditures in district energy centers within2018 include $33 million in the ThermalRenewables segment andin connection with the construction of the Company's solar generating assets. TheBuckthorn Solar Drop Down Asset, of which $10 million was incurred by NRG during the construction of Buckthorn Solar prior to its acquisition by the Company develops annual capital spending plans based on projected requirements for maintenance and growth capital.March 30, 2018.
The Company estimates $32$28 million of maintenance capital expenditures for 2018. 2021. These estimates are subject to continuing review and adjustment and actual capital expenditures may vary from these estimates.
Acquisitions and Investments
The Company intends to acquire generation and thermal infrastructure assets developed and constructed by NRG or other third parties in the future,CEG, as well as generation and thermal infrastructure assets from third parties where the Company believes its knowledge of the market and operating expertise provides a competitive advantage, and to utilize such acquisitions as a means to grow its CAFD.
Mt Storm Agreement — On February 24, 2017,10, 2021, the Company amended and restated the ROFO Agreement, expanding the ROFO Assets pipeline with the addition of 234 net MW of utility-scale solar projects, consisting of Buckthorn Solar, a 154 net MW solar facility in Texas, and Hawaii solar projects, which have a combined capacity of 80 net MW.
On February 6, 2018, the Company entered intoreached an agreement with NRG to purchaseacquire 100% of the membershipequity interests in CarlsbadMount Storm Holdings I LLC, or Mt Storm, for approximately $96 million subject to certain purchase price adjustments. Mt Storm is a 264 MW wind project located in Grant County, West Virginia. The transaction is subject to customary regulatory approvals.
Agua Caliente Acquisition — On February 3, 2021, the Company acquired an additional 35% equity interest in the Agua Caliente solar project from NRG Energy, HoldingsInc. for $202 million. Agua Caliente is a 290 MW solar project located in Dateland, Arizona in which the Company previously owned a 16% equity interest. The project has a 25-year PPA with PG&E, with approximately 19 years remaining under the agreement. Following the close of the transaction the Company will own a 51% equity interest in Agua Caliente.
Rattlesnake Drop Down — On January 12, 2021, the Company acquired 100% of CEG's equity interest and a third party investor's minority interest in Rattlesnake Flat, LLC, which indirectly owns the Carlsbad project,Rattlesnake Wind Project, a 527160 net MW natural gas fired projectwind facility located in Carlsbad, CA, pursuant to the ROFO Agreement. The purchase priceAdams County, WA which achieved commercial operations in January 2021, for the transaction is $365$132 million in cash consideration subjectand expects its net capital commitment to customary working capitalbe $119 million after proceeds from a state sales and other adjustments. The transaction isuse tax refund which are expected to close during the fourth quarter of 2018 and is contingent upon the consummationbe received in 2021.
Lighthouse Partnership Agreements— On December 21, 2020, subsidiaries of the NRG Transaction.
On January 24, 2018,Company entered into the Lighthouse Partnership Agreements providing for the Company’s co-investment in a 1,204 MW portfolio of renewable energy projects developed by CEG. In addition, the agreements included an amendment of the partnership that owns the 419 MW Mesquite Star wind project, providing the Company entered intowith additional project cash flows after the first half of 2031. As described below, the Company had previously acquired an agreement with NRG to purchase 100% of NRG's ownership interest in Buckthorn Solar pursuant to the ROFO Agreement for cash considerationMesquite Star Pledgor LLC, which was subsequently renamed Lighthouse Renewable Holdco LLC. The 1,204 MW portfolio of $42 million, subject to other adjustments. renewable energy projects includes:
◦Five geographically diversified wind, solar and solar plus storage assets under development totaling 1,012 MW, and
◦The transaction is expected to close during the first quarter of 2018.
As discussed192 MW Rosamond Central solar project, located in Item 1 — Note 3, Business Acquisitions, the Company completed the following acquisitions in 2017:
November 2017 Drop Down Assets — Kern County, California. On November 1, 2017,December 21, 2020, the Company acquired 100% of the Class A membership interests of Rosie Target Co LLC, which
consolidates its interest in a 38 MW solar portfolio primarily comprised of assets from NRG's Solar Power Partners (SPP) funds and other projects developed by NRG,tax equity fund that owns the project, for $23 million in cash consideration and an additional $1 million adjustment concurrent with the tax equity investor's final funding which was paid in January 2021. Rosie Target Co LLC is a partnership, whose Class B membership interests are owned by a third party investor. The Company is entitled to a 50% cash equity interest in Rosamond Central through its Class A membership interests.
For the above-mentioned transactions, the Company expects to invest an estimated $215 million in corporate capital by the end of $742022, subject to closing adjustments and the projects achieving certain milestones. The expected net corporate capital includes the $24 million including a working capitalalready invested in Rosamond Central in 2020 and the purchase price adjustment of $3 million, plus assumed non-recourse debt of $26 million.received concurrent with the partnership agreement amendment for Mesquite Star.
August 2017Langford Drop Down Assets — On August 1, 2017,November 20, 2020, the Company acquired from Clearway Renew LLC, a subsidiary of CEG, and a third party investor, 100% of the remaining 25% interestcash equity interests in NRG Wind TE Holdco, a portfolio of 12Langford Holding LLC, which owns the Langford wind projects, from NRGproject, for total cash consideration of $44 million, including a working capital adjustment of $3approximately $64 million. The transaction also includes potential additional payments to NRG dependent upon actual energy prices for merchant periods beginningLangford wind project is a 160 MW wind project located in 2027.West Texas which was repowered and achieved commercial operations in November 2020. The investment was funded with existing liquidity.
March 2017 Drop Down Assets DGPV Holdco Residual Interest from CEG — On March 27, 2017,November 2, 2020, the Company acquired the followingClass B membership interests in DGPV Holdco 1, DGPV Holdco 2 and DGPV Holdco 3, or DGPV Holdco Entities, as well as a SREC contract, from NRG: (i) Agua Caliente Borrower 2Renew DG Holdings LLC, which owns a 16%subsidiary of CEG for $44 million in cash consideration. In connection with the acquisition of the Class B membership interests, the Company consolidated their interest (approximately 31% of NRG's 51% interest) in the Agua Calienteunderlying distributed solar farm, onetax equity funds within DGPV Holdco 1 and DGPV Holdco 2. The Company had previously consolidated DGPV Holdco 3 effective in May 2020.
DG Investment Partnerships with CEG — Prior to the acquisition of CEG's Class B membership interests mentioned above, the ROFO Assets, representing ownership ofCompany invested approximately 46 net MW of capacity, and (ii) NRG's$10 million in the DG investment partnerships with CEG during 2020, bringing total capital invested in these investment partnerships to $266 million.
Mesquite Star Drop Down — OnSeptember 1, 2020, the Company, through its indirect subsidiary Mesquite Star HoldCo LLC, acquired the Class A membership interests in seven utility-scale solar farms locatedMesquite Star Pledgor LLC from Clearway Renew LLC, a subsidiary of CEG, for $74 million in Utah, which are partcash consideration inclusive of a purchase price adjustment received in the fourth quarter of 2020 concurrent with the partnership amendment referenced below. Mesquite Star Pledgor LLC is the primary beneficiary and consolidates its interest in a tax equity structurefund that owns the Mesquite Star wind project, a 419 MW utility scale wind project located in Fisher County, Texas. A majority of the project’s output is backed by contracts with Dominion Solar Projects III, Inc., or Dominion, from whichinvestment grade counterparties with a 12 year weighted average contract life. As described above, Mesquite Star Pledgor LLC was renamed Lighthouse Renewable Holdco LLC and the Class B membership interests were sold to a third party investor.The investor and the Company would receive 50%amended the terms of cashthe related partnership and as a result, the Company now consolidates its interest in the Mesquite Star wind project, through its consolidation of Lighthouse Renewable Holdco LLC.
Agreements to be distributed. The Company paid cash considerationAcquire and Invest in a Portfolio of $132 million.
Investment Partnership with NRG
Renewable Energy Projects from CEG — On September 26, 2017,April 17, 2020, the Company entered into an additional partnership with NRG by forming NRG DGPV Holdco 3binding agreements related to the previously announced dropdown offer from CEG to enable the Company to acquire and invest in a portfolio of renewable energy projects. The following projects are included in the drop down agreements.
•CEG's interest in Repowering Partnership II LLC or DGPV Holdco 3, in(Repowering 1.0), which the Company wouldacquired on May 11, 2020 for cash consideration of $70 million,
•100% of the equity interests in Rattlesnake Flat, LLC, which owns the Rattlesnake Wind Project, a 160 net MW wind facility located in Adams County, WA which the company acquired on January 12, 2021 as mentioned above, and
•On February 26, 2021, the Company, through an indirect subsidiary, entered into an amended partnership agreement with CEG to repower the Pinnacle Wind Project, a 55 net MW wind facility located in Mineral County, WV. The amended agreement commits the Company to invest up to $50an estimated $67 million in net corporate capital, subject to closing adjustments, and no longer requires an operating portfolioadditional payment in 2031. The existing Pinnacle Wind power purchase agreements will continue to run through 2031. Commercial operations and corporate capital funding for the Pinnacle Wind Repowering Partnership are expected to occur in the second half of distributed solar assets, primarily comprised of community solar projects, developed by NRG. The Company owns approximately 43 MW of distributed solar capacity, based on cash to be distributed, with a weighted average contract life of approximately 20 years as of December 31, 2017.2021.
DuringFor the year ended December 31, 2017,above mentioned transactions, the agreements commit the Company invested $64to invest an estimated $256 million in distributed generation partnerships with NRG.net corporate capital, subject to closing adjustments.
2020 Convertible Notes
On June 1, 2020, the Company repaid at maturity its outstanding $45 million of 2020 Convertible Notes utilizing the proceeds from the issuance of additional 2028 Senior Notes as described above.
Cash Dividends to Investors
The Company intends to use the amount of cash that it receives from its distributions from NRG YieldClearway Energy LLC to pay quarterly dividends to the holders of its Class A common stock and Class C common stock. NRG YieldClearway Energy LLC intends to distribute to its unit holders in the form of a quarterly distribution all of the CAFD that is generated each quarter less reserves for the prudent conduct of the business, including among others, maintenance capital expenditures to maintain the operating capacity of the assets. CAFD is defined as net income before interest expense, income taxes, depreciation and amortization,Adjusted EBITDA plus cash distributionsdistributions/return of investment from unconsolidated affiliates, adjustments to reflect CAFD generated by unconsolidated investments that were not able to distribute project dividends prior to PG&E's emergence from bankruptcy on July 1, 2020 and subsequent release post-bankruptcy, cash receipts from notes receivable, cash distributions from noncontrolling interests, adjustments to reflect sales-type lease cash payments, less cash distributions to noncontrolling interests, maintenance capital expenditures, pro-rata Adjusted EBITDA from unconsolidated affiliates, cash interest paid, income taxes paid, principal amortization of indebtedness, andWalnut Creek investment payments, changes in prepaid and accrued capacity payments.payments, and adjusted for development expenses. Dividends on the Class A common stock and Class C common stock are subject to available capital, market conditions, and compliance with associated laws, regulations and other contractual obligations. The Company expects that, based on current circumstances, comparable cash dividends will continue to be paid in the foreseeable future.
The following table lists the dividends paid on the Company's Class A common stock and Class C common stock during the year ended December 31, 2017:2020:
| | | | | | | | | | | | | | | | | | | | | | | |
| Fourth Quarter 2020 | | Third Quarter 2020 | | Second Quarter 2020 | | First Quarter 2020 |
| Dividends per Class A share | $ | 0.3180 | | | $ | 0.3125 | | | $ | 0.2100 | | | $ | 0.2100 | |
| Dividends per Class C share | $ | 0.3180 | | | $ | 0.3125 | | | $ | 0.2100 | | | $ | 0.2100 | |
|
| | | | | | | | | | | | | | | |
| | Fourth Quarter 2017 | | Third Quarter 2017 | | Second Quarter 2017 | | First Quarter 2017 |
| Dividends per Class A share | $ | 0.288 |
| | $ | 0.28 |
| | $ | 0.27 |
| | $ | 0.26 |
|
| Dividends per Class C share | $ | 0.288 |
| | $ | 0.28 |
| | $ | 0.27 |
| | $ | 0.26 |
|
On February 15, 2018,12, 2021, the Company declared a quarterly dividend on its Class A and Class C common stock of $0.298$0.324 per share payable on March 15, 2018,2021, to stockholders of record as of March 1, 2018.2021.
Cash Flow Discussion
Year Ended December 31, 20172020 Compared to Year Ended December 31, 2016
The following table reflects the changes in cash flows for the year ended December 31, 2017 compared to 2016:
|
| | | | | | | | | | | |
| Year ended December 31, | 2017 | | 2016 | | Change |
| (In millions) | |
| Net cash provided by operating activities | $ | 516 |
| | $ | 577 |
| | $ | (61 | ) |
| Net cash used in investing activities | (283 | ) | | (131 | ) | | (152 | ) |
| Net cash used in financing activities | (415 | ) | | (202 | ) | | (213 | ) |
Net Cash Provided By Operating Activities
|
| | | |
| Changes to net cash provided by operating activities were driven by: | (In millions) |
| Decrease in operating income adjusted for non-cash items driven by primarily by lower revenues in the Renewables segment in 2017 compared to 2016 | $ | (62 | ) |
| Decrease in working capital driven primarily by the timing of accounts receivable collections, and inventory build up in the Renewables segment in connection with the transition to self operations, as well as higher prepaid expenses in 2017 compared to 2016 | (13 | ) |
| Higher distributions from unconsolidated affiliates primarily due to the acquisition of the Utah Solar Portfolio, which was acquired by the Company in March 2017 and by NRG in November 2016 | 14 |
|
| | $ | (61 | ) |
Net Cash Used In Investing Activities
|
| | | |
| Changes to net cash used in investing activities were driven by: | (In millions) |
| Payments for the acquisition of the March 2017, August 2017, and November 2017 Drop Down Assets in 2017 compared to the payments made for the CVSR Drop Down in 2016 | $ | (173 | ) |
| Higher return of investment from unconsolidated affiliates combined with lower investments primarily in DGPV HoldCo entities in 2017 | 29 |
|
| Higher capital expenditures primarily related to maintenance capital expenditures at Walnut Creek as a result of the forced outages in 2017 | (11 | ) |
| Higher insurance proceeds in 2017 in the Conventional segment compared to the insurance proceeds in 2016 in the Renewables segment | 3 |
|
| | $ | (152 | ) |
Net Cash Used In Financing Activities
|
| | | |
| Changes in net cash used in financing activities were driven by: | (In millions) |
| Higher borrowing in 2016, primarily related to the 2026 Senior Notes and CVSR Holdco Notes due 2037 partially offset by higher repayments of long-term debt in 2017 | $ | (751 | ) |
| Net payments of $306 million under the revolving credit facility in 2016 compared to proceeds of $55 million in 2017 | 361 |
|
| Lower net payments of distributions to NRG for the Drop Down Assets relating to the pre-acquisition period in 2017 compared to 2016 | 164 |
|
| Proceeds from the NRG Yield, Inc. Class C common stock offerings under the ATM Program, net of underwriting discounts and commissions | 34 |
|
| Increase in dividends paid to common stockholders and distributions paid to NRG, primarily driven by a 16% increase in declared dividends and distributions from 2016 to 2017 | (29 | ) |
| Increase in net contributions from noncontrolling interests due to higher production-based payments in 2017 compared to 2016 | 8 |
|
| | $ | (213 | ) |
Year Ended December 31, 2016 Compared to Year Ended December 31, 20152019
The following table reflects the changes in cash flows for the year ended December 31, 20162020 compared to 2015:2019:
| | | Year ended December 31, | 2016 | | 2015 | | Change | Year ended December 31, | 2020 | | 2019 | | Change |
| (In millions) | (In millions) | | (In millions) | |
| Net cash provided by operating activities | $ | 577 |
| | $ | 425 |
| | $ | 152 |
| Net cash provided by operating activities | $ | 545 | | | $ | 477 | | | $ | 68 | |
| Net cash used in investing activities | (131 | ) | | (1,098 | ) | | 967 |
| Net cash used in investing activities | (62) | | | (468) | | | 406 | |
| Net cash (used in) provided by financing activities | (202 | ) | | 354 |
| | (556 | ) | |
| Net cash used in financing activities | | Net cash used in financing activities | (435) | | | (175) | | | (260) | |
Net Cash Provided Byby Operating Activities
|
| | | |
| Changes to net cash provided by operating activities were driven by: | (In millions) |
| Increase in operating income adjusted for non-cash items driven by higher revenues mainly in the Renewables segment in 2016 compared to 2015 | $ | 120 |
|
| Changes in working capital driven primarily by the timing of accounts receivable collections in 2015 compared to 2016 | 34 |
|
| Lower distributions from unconsolidated affiliates | (2 | ) |
| | $ | 152 |
|
| | | | | |
| Changes to net cash provided by operating activities were driven by: | (In millions) |
| Increase in operating income adjusted for non-cash items | $ | 76 | |
| Increase in dividend distributions received from unconsolidated affiliates | 27 | |
| Decrease in working capital driven primarily by the timing of accounts receivable collections and payments of accounts payable | (35) | |
| |
| $ | 68 | |
| |
| |
Net Cash Used In Investing Activities
|
| | | |
| Changes to net cash used in investing activities were driven by: | (In millions) |
| Higher payments for the acquisition of the January 2015 and November 2015 Drop Down Assets in 2015 compared to the payments made for the CVSR Drop Down in 2016 | $ | 621 |
|
| Higher net investments in unconsolidated affiliates in 2015, primarily due to investment in Desert Sunlight | 305 |
|
| Payments to acquire businesses, net of cash acquired, in 2015 | 37 |
|
| Decrease in capital expenditures primarily due to the completion of a project in the Thermal segment in 2015, as well as lower maintenance capital expenditures in 2016 | 9 |
|
| Other | (5 | ) |
| | $ | 967 |
|
| | | | | |
| Changes to net cash used in investing activities were driven by: | (In millions) |
| Decrease in capital expenditures primarily driven by 2019 growth capital expenditures in the Renewables segment related to repowering of Elbow Creek and Wildorado | $ | 104 | |
| Acquisition of Duquesne University District Energy System on May 1, 2019 | 100 | |
| Increase in proceeds received from sale of assets in 2020 primarily due to sale of RPV Holdco, Energy Center Dover LLC and Energy Center Smyrna LLC compared to the proceeds from the sale of HSD Solar in 2019 | 70 | |
| Payments for partnership interests in 2019 | 48 | |
| Decrease in cash paid for Drop Down Assets due to acquisition of Carlsbad in 2019 compared to Drop Down Assets acquired in 2020 | 39 | |
| Increase in net distributions from unconsolidated affiliates in 2020 | 23 | |
| Increase in cash due to consolidation of DGPV Holdco 3 LLC in May 2020 | 17 | |
| Other | 5 | |
| $ | 406 | |
| |
| |
Net Cash (Used In) Provided ByUsed In Financing Activities
| | | | | |
| Changes in net cash used in financing activities were driven by: | (In millions) |
| Decrease in proceeds from issuance of long-term debt net of payments made in 2020 primarily driven by repayments of Renewable project level debt in 2020 partially offset by a reduction in Corporate level debt repayments in 2020 compared to 2019 | $ | (169) | |
| Payment to buy out CEG's noncontrolling interest in Repowering Partnership II LLC on May 11, 2020 | (70) | |
| Increase in dividends paid to common stockholders in 2020 | (56) | |
| Decrease in net proceeds received from issuance of common stock | (38) | |
| Increase in net contributions received from noncontrolling interests in 2020 compared to 2019, primarily from tax equity contributions in Wildorado TE Holdco and Rosie TE Holdco received in 2020 | 73 | |
| |
| |
| |
| $ | (260) | |
| |
| |
|
| | | |
| Changes in net cash provided by financing activities were driven by: | (In millions) |
| Higher payments of distributions to NRG from Drop Down Assets prior to the acquisition dates | $ | (105 | ) |
Proceeds from sale of an economic interest in Alta TE Holdco in 2015, as further described in Item 15 — Note 5, Investments Accounted for by the Equity Method and Variable Interest Entities, compared to lower net contributions from tax equity investors in 2016 | (117 | ) |
| Proceeds from Class C equity offering on June 29, 2015 | (599 | ) |
| Increase in dividends paid to common stockholders, as declared dividends increased 16.3% from 2015 to 2016 | (34 | ) |
| Net repayments of $306 million under the revolving credit facility in 2016 compared to the net borrowings of $306 million in 2015 | (612 | ) |
| Issuance of the Series D Notes in October 2016, 2026 Senior Notes in August 2016, and CVSR Holdco Notes, due 2037 in July 2016, partially offset by lower debt principal payments throughout 2016, compared to 2015 | 913 |
|
| Higher debt issuance costs paid in 2016 | (2 | ) |
| | $ | (556 | ) |
NOLs, Deferred Tax Assets and Uncertain Tax Position Implications, under ASC 740
As of December 31, 2017,2020, the Company has a cumulative federal NOL carry forward balance of $870 million$1.2 billion for financial statement purposes, of which $0.9 billion will begin expiring inbetween 2033 andto 2037 if unutilized. The Company does not anticipate any federal income tax payments for 2018. As2021. Additionally, as of December 31, 2020, the Company has a resultcumulative state NOL carryforward balance of the Company's tax position, and based on current forecasts, the$726 million for financial statement purposes, which will expire between 2023 to 2040 if unutilized. The Company does not anticipate significant income tax payments for state and local jurisdictions in 2018.2021. Based on the Company's current and expected NOL balances generated primarily by accelerated tax depreciation of its property, plant and equipment, the Company does not expect to pay significant federal income tax for a period of approximately ten years inclusive of any NOL generated in 2018 or latercarryovers subject to an 80% limitation against future taxable income for taxable years beginning after 2020 pursuant to the Tax CutsAct as modified by the CARES Act (defined below).
As of December 31, 2020, the Company has an interest disallowance carry forward of $46 million as a result of the proposed §163(j) regulation, which was enacted as part of the Tax Cut and Jobs Act. The disallowed interest deduction has an indefinite carry forward period and any limitations on the utilization of this carry forward have been factored into our valuation allowance analysis.
On March 27, 2020 the Coronavirus Aid, Relief, and Economic Security (CARES) Act, or CARES Act, was signed into law, which includes modifications to the business interest expense disallowance and net operating loss provisions.The Company expects to utilize $39 million of previously disallowed interest expense during 2020 as a result of the modifications. The Company will continue to assess the effects of the CARES Act and ongoing government guidance related to COVID-19 that may be issued, but does not expect the CARES Act to have a material impact on the consolidated financial statements.
On June 29, 2020, governor of California signed Assembly Bill 85, or AB 85, suspending California net operating loss utilization and imposing a cap on the amount of business incentive credits companies can utilize, effective for tax years 2020, 2021, and 2022. After assessing the law change, the Company expects AB 85 to have an immaterial impact on the consolidated financial statements.
The Company is subject to examination by taxing authorities for income tax returns filed in the U.S. federal jurisdiction and various state jurisdictions. The Company is not subject to U.S. federal or state income tax examinations for years prior to 2013.
The Company has no uncertain tax benefits.
Off-Balance Sheet Arrangements
Obligations under Certain Guarantee Contracts
The Company may enter into guarantee arrangements in the normal course of business to facilitate commercial transactions with third parties.
Retained or Contingent Interests
The Company does not have any material retained or contingent interests in assets transferred to an unconsolidated entity.
Obligations Arising Out of a Variable Interest in an Unconsolidated Entity
Variable interest in equity investments — As of December 31, 2017,2020, the Company has several investments with an ownership interest percentage of 50% or less in energy and an energy-related entitiesentity that areis accounted for under the equity method. NRG DGPV Holdco 1 LLC, NRG DGPV Holdco 2 LLC, NRG DGPV Holdco 3 LLC, NRG RPV Holdco 1 LLC and GenConn areis a variable interest entitiesentity for which the Company is not the primary beneficiary. The Company's pro-rata share of non-recourse debt held by unconsolidated affiliates was approximately $777$481 million as of December 31, 2017.2020. This indebtedness may restrict the ability of these subsidiaries to issue dividends or distributions to the Company. See also Item 15 — Note 5, Investments Accounted for by the Equity Method and Variable Interest Entities, to the Consolidated Financial Statements.
Contractual Obligations and Commercial Commitments
The Company has a variety of contractual obligations and other commercial commitments that represent prospective cash requirements in addition to the Company's capital expenditure programs. The following table summarizes the Company's contractual obligations. See Item 15 — Note 10, Long-term Debt,and Note 16, Commitments and Contingencies, and Note 17, Leases to the Consolidated Financial Statements for additional discussion.
|
| | | | | | | | | | | | | | | | | | | | | | | |
| | By Remaining Maturity at December 31, |
| | 2017 | | 2016 |
| Contractual Cash Obligations | Under 1 Year | | 1-3 Years | | 3-5 Years | | Over 5 Years | | Total | | Total |
| | (In millions) |
| Long-term debt (including estimated interest) | $ | 593 |
| | $ | 1,870 |
| | $ | 1,500 |
| | $ | 3,907 |
| | $ | 7,870 |
| | $ | 8,342 |
|
| Operating leases | 9 |
| | 18 |
| | 18 |
| | 151 |
| | 196 |
| | 199 |
|
| Fuel purchase and transportation obligations | 11 |
| | 8 |
| | 6 |
| | 16 |
| | 41 |
| | 45 |
|
Other liabilities (a) | 29 |
| | 45 |
| | 29 |
| | 105 |
| | 208 |
| | 129 |
|
| Total | $ | 642 |
| | $ | 1,941 |
| | $ | 1,553 |
| | $ | 4,179 |
| | $ | 8,315 |
| | $ | 8,715 |
|
| | | | | | | | | | | | | | | | | | | | | | | | | | | | | | | | | | | |
| | By Remaining Maturity at December 31, |
| | 2020 | | 2019 |
| Contractual Cash Obligations | Under
1 Year | | 1-3 Years | | 3-5 Years | | Over
5 Years | | Total | | Total |
| | (In millions) |
| Long-term debt (including estimated interest) | $ | 709 | | | $ | 1,431 | | | $ | 1,809 | | | $ | 5,611 | | | $ | 9,560 | | | $ | 9,021 | |
| Operating leases | 23 | | | 46 | | | 46 | | | 476 | | | 591 | | | 382 | |
| Fuel purchase and transportation obligations | 9 | | | 5 | | | — | | | — | | | 14 | | | 31 | |
Other liabilities (a) | 37 | | | 39 | | | 35 | | | 182 | | | 293 | | | 302 | |
| Total | $ | 778 | | | $ | 1,521 | | | $ | 1,890 | | | $ | 6,269 | | | $ | 10,458 | | | $ | 9,736 | |
(a) Includes water right agreements, service and maintenance agreements, and LTSA commitments.
Fair Value of Derivative Instruments
The Company may enter into fuel purchase contracts and other energy-related financial instruments to mitigate variability in earnings due to fluctuations in spot market prices and to hedge fuel requirements at certain generation facilities. In addition, in order to mitigate interest rate risk associated with the issuance of variable rate debt, the Company enters into interest rate swap agreements.
The tables below disclose the activities of non-exchange traded contracts accounted for at fair value in accordance with ASC 820. Specifically, these tables disaggregate realized and unrealized changes in fair value; disaggregate estimated fair values at December 31, 20172020, based on their level within the fair value hierarchy defined in ASC 820; and indicate the maturities of contracts at December 31, 20172020. For a full discussion of the Company's valuation methodology of its contracts, see Derivative Fair Value Measurements in Item 15 —Note 6, Fair Value of Financial Instruments, to the Consolidated Financial Statements.
| | | | | |
| Derivative Activity (Losses)/Gains | (In millions) |
| Fair value of contracts as of December 31, 2019 | $ | (92) | |
| Contracts realized or otherwise settled during the period | 101 | |
| Contracts added during the period | (80) | |
| |
| Changes in fair value | (101) | |
| Fair value of contracts as of December 31, 2020 | $ | (172) | |
|
| | | |
| Derivative Activity (Losses)/Gains | (In millions) |
| Fair value of contracts as of December 31, 2016 | $ | (76 | ) |
| Contracts realized or otherwise settled during the period | 32 |
|
| Changes in fair value | (2 | ) |
| Fair value of contracts as of December 31, 2017 | $ | (46 | ) |
| | | | | | | | | | | | | | | | | | | | | | | | | | | | | |
| Fair value of contracts as of December 31, 2020 |
| Maturity | | |
| Fair Value Hierarchy (Losses)/Gains | 1 Year or Less | | Greater Than 1 Year to 3 Years | | Greater Than 3 Years to 5 Years | | Greater Than 5 Years | | Total Fair Value |
| (In millions) |
| | | | | | | | | |
| Level 2 | (33) | | | (47) | | | (24) | | | (24) | | | (128) | |
| Level 3 | (5) | | | (8) | | | (10) | | | (21) | | | (44) | |
| Total | $ | (38) | | | $ | (55) | | | $ | (34) | | | $ | (45) | | | $ | (172) | |
|
| | | | | | | | | | | | | | |
| | Fair value of contracts as of December 31, 2017 |
| | Maturity | | |
| Fair Value Hierarchy Losses | 1 Year or Less | | Greater Than 1 Year to 3 Years | | Greater Than 3 Years to 5 Years | | Greater Than 5 Years | | Total Fair Value |
| | (In millions) |
| Level 2 | 16 |
| | 15 |
| | 9 |
| | 6 |
| | 46 |
|
The Company has elected to disclose derivative assets and liabilities on a trade-by-trade basis and does not offset amounts at the counterparty master agreement level. As discussed below in Quantitative and Qualitative Disclosures about Market Risk -Commodity Price Risk, NRG, on behalf of the Company measures the sensitivity of the portfolio to potential changes in market prices using VaR, a statistical model which attempts to predict risk of loss based on market price and volatility. NRG'sThe Company's risk management policy places a limit on one-day holding period VaR, which limits the net open position.
Critical Accounting Policies and Estimates
The Company's discussion and analysis of the financial condition and results of operations are based upon the consolidated financial statements, which have been prepared in accordance with GAAP. The preparation of these financial statements and related disclosures in compliance with GAAP requires the application of appropriate technical accounting rules and guidance as well as the use of estimates and judgments that affect the reported amounts of assets, liabilities, revenues and expenses, and related disclosures of contingent assets and liabilities. The application of these policies necessarily involves judgments regarding future events, including the likelihood of success of particular projects, legal and regulatory challenges and the fair value of certain assets and liabilities. These judgments, in and of themselves, could materially affect the financial statements and disclosures based on varying assumptions, which may be appropriate to use. In addition, the financial and operating environment may also have a significant effect, not only on the operation of the business, but on the results reported through the application of accounting measures used in preparing the financial statements and related disclosures, even if the nature of the accounting policies has not changed.
On an ongoing basis, the Company evaluates these estimates, utilizing historic experience, consultation with experts and other methods the Company considers reasonable. Actual results may differ substantially from the Company's estimates. Any effects on the Company's business, financial position or results of operations resulting from revisions to these estimates are recorded in the period in which the information that gives rise to the revision becomes known.
The Company's significant accounting policies are summarized in Item 15 — Note 2, Summary of Significant Accounting Policies, to the Consolidated Financial Statements. The Company identifies its most critical accounting policies as those that are the most pervasive and important to the portrayal of the Company's financial position and results of operations, and that require the most difficult, subjective and/or complex judgments by management regarding estimates about matters that are inherently uncertain. The Company's critical accounting policies include income taxes and valuation allowance for deferred tax assets, impairment of long lived assets and other intangible assets and acquisition accounting.
| | | | | |
| Accounting Policy | Judgments/Uncertainties Affecting Application |
| |
| |
Accounting Policy | Judgments/Uncertainties Affecting Application |
| |
| |
| |
| Income Taxes and Valuation Allowance for Deferred Tax Assets | Ability to withstand legal challenges of tax authority decisions or appeals |
| Anticipated future decisions of tax authorities |
| Application of tax statutes and regulations to transactions |
| Ability to utilize tax benefits through carry backs to prior periods and carry forwards to future periods |
| Impairment of Long Lived Assets | Recoverability of investments through future operations |
| Regulatory and political environments and requirements |
| Estimated useful lives of assets |
| Operational limitations and environmental obligations |
| Estimates of future cash flows |
| Estimates of fair value |
| Judgment about triggering events |
| Acquisition Accounting | Identification of intangible assets acquired |
| Inputs for fair valuevalues of assets and liabilities acquired |
| Application of variousappropriate fair value methodologies |
Income Taxes and Valuation Allowance for Deferred Tax Assets
As of December 31, 2017,2020, the Company had a valuation allowance of $10 million, reduced from $16 million at December 22, 2017 due to the corporate income tax rate reduction from 35% to 21% in accordance with the Tax Cuts and Jobs Act.$15 million. The valuation allowance is related to a deferred tax asset expected to result in a capital loss for which no existing capital gains or tax planning strategies to utilize the asset in the future are available.available, as well as state net operating losses the Company expects to expire unutilized. Other than for this expected capital loss and state NOL mentioned above, the Company believes it is more likely than not that the results of future operations will generate sufficient taxable income which includes the future reversal of existing taxable temporary differences to realize deferred tax assets. The Company considered the impact of the Tax Cuts and Jobs Act upon timing and future realization of net deferred tax assets, the profit before tax generated in recent years, as well as projections of future earnings and estimates of taxable income in arriving at this conclusion. The realization of deferred tax assets is primarily dependent upon earnings in federal and various state and local jurisdictions. In December 2017, the SEC staff issued Staff Accounting Bulletin No. 118, which addresses how a company may recognize provisional amounts for the effect of the changes related to the Tax Act. Consistent with that guidance, the Company recognized provisional amounts based upon our interpretation of the tax laws and estimates which require significant judgments.
Considerable judgment is required to determine the tax treatment of a particular item that involves interpretations of complex tax laws. The project-level entities, as former subsidiaries of NRG, are no longer subject to federal audit examination for years prior to 2015 but are subject to state and local audit for multiple years in various jurisdictions. The Company is subject to U.S. federal, state, and local income tax examinations for all years beginning in 2013.
Evaluation of Assets for Impairment and Other-Than-Temporary Decline in Value
In accordance with ASC 360, Property, Plant, and Equipment, or ASC 360, property, plant and equipment and certain intangible assets are evaluated for impairment whenever indicators of impairment exist. Examples of such indicators or events are:
•Significant decrease in the market price of a long-lived asset;
•Significant adverse change in the manner an asset is being used or its physical condition;
•Adverse business climate;
•Accumulation of costs significantly in excess of the amount originally expected for the construction or acquisition of an asset;
•Current-period loss combined with a history of losses or the projection of future losses; and
•Change in the Company's intent about an asset from an intent to hold to a greater than 50% likelihood that an asset will be sold or disposed of before the end of its previously estimated useful life.
Recoverability of assets to be held and used is measured by a comparison of the carrying amount of the assets to the future net cash flows expected to be generated by the asset, through considering project specific assumptions for long-term power poolenergy prices, escalated future project operating costs and expected plant operations. If such assets are considered to be impaired, the impairment to be recognized is measured by the amount by which the carrying amount of the assets exceeds the fair value of the assets. The fair value may be determined by factoring in the probability weighting of different courses of action available to the Company as appropriate. Generally, fair value will be determined using valuation techniques such as the present value of expected future cash flows or comparable values determined by transactions in the market. The Company uses its best estimates in making these evaluations and considers various factors, including forward price curves for energy, fuel costs and operating costs. However, actual future market prices and project costs could vary from the assumptions used in the Company's estimates, and the impact of such variations could be material.
Annually, during the fourth quarter, the Company revises its views of powerenergy prices, including the Company's fundamentallong-term view for long-termof power prices, which is primarily informed by present conditions, forecasted generation and operating and capital expenditures, in connection with the preparation of its annual budget.
The Company recorded certain long-lived asset impairments in 2017 and 2016,2020, as described below and in Item 15 — Note 9, Asset Impairments, to the Consolidated Financial Statements, with respect to several wind projects.
During the fourth quarter of 2017, as2020 in the preparation and review of its annual budget, the Company updated its long-term estimates of operating and capital expenditures and revised its assessment of long-term merchant power prices which was primarily informed by present conditions and does not contemplate future policy changes which could impact renewable energy power prices. As a result, the Company updated its estimated future cash flows in connection with the preparation and review of the Company's annual budget, the Company determined that the future cash flows for several wind projects within the Elbow Creek and Forward facilities were belowRenewables segment no longer supported the carrying valuerecoverability of the related assets,long-lived asset. As such, the Company recorded an impairment loss of $24 million, which primarily driven by continued declining merchant power prices in post-contract periods,relates to property, plant, and thatequipment to reflect the assets were considered impaired.at fair market value. The fair value of the facilities waswere determined using an income approach by applying a discounted cash flow methodology to the long-term budgets for each respective plant. The income approach utilizes estimates of discounted future cash flows, which includeincluded key inputs such as forecasted merchant power prices, operations and maintenance expense, and discount rates. The Company measured the impairment loss as the difference between the carrying amount and theresulting fair value of the assets and recorded impairment losses of $26 million and $5 million for Elbow Creek and Forward, respectively.is a Level 3 fair value measurement.
The Company is also required to evaluate its equity method investments to determine whether or not they are impaired. ASC 323, Investments - Equity Method and Joint Ventures, or ASC 323, provides the accounting requirements for these investments. The standard for determining whether an impairment must be recorded under ASC 323 is whether the value is considered to be an other-than-temporary decline in value. The evaluation and measurement of impairments under ASC 323 involves the same uncertainties as described for long-lived assets that the Company owns directly and accounts for in accordance with ASC 360. Similarly, the estimates that the Company makes with respect to its equity method investments are subjective, and the impact of variations in these estimates could be material. Additionally, if the projects in which the Company holds these investments recognize an impairment under the provisions of ASC 360, the Company would record its proportionate share of that impairment loss and would evaluate its investment for an other-than-temporary decline in value under ASC 323. During the fourth quarter of 2020, as the Company updated its estimated cash flows in connection with the preparation and review of the Company's annual budget, the Company determined that there was a significant decrease in the estimated future cash flows for its equity method investment in San Juan Mesa, a facility in the Renewables segment. The decrease in the forecasted cash flows which is primarily driven by a decline in forecasted revenue in future merchant periods, is significant enough to be considered an indication of a decline in value of the investment that is not temporary. The Company concluded there was an other-than-temporary impairment of its investment and recorded an impairment loss of $8 million to reflect the investment at fair market value.
Certain of the Company’s projects have useful lives that extend well beyond the contract period and therefore, management’s view of long-term powerenergy prices in the post-contract periods may have a significant impact on the expected future cash flows for these projects. Accordingly, if management’smanagement lowers its view of long-term powerenergy prices in certain markets, continues to decrease, it is possible that some of the Company’s other long-lived assets may be impaired.
Acquisition Accounting
The Company applies ASC 805, Business Combinations, when accounting for the acquisition of a business,acquisitions, with identifiable assets acquired and liabilities assumed recorded at their estimated fair values on theat acquisition date. The Company completes the accounting for an acquisition when the evaluations are completed to the extent that additional information is obtained about the facts and circumstances that existed asFor many of the acquisition date. The allocationCompany's acquisitions, the Company applies ASC 805-50, which provides that acquisitions of entities under common control are recorded at historical cost, except in the purchase pricecase where the ultimate parent has a different basis, such as when an acquiree did not elect to apply pushdown accounting. In those circumstances, the Company may also be modified uprequired to one year fromrecord its acquired assets and liabilities at fair value. As further described in Item 15 - Note 3, Acquisitions and Dispositions, the date ofCompany recorded the acquisition as more information is obtained about the fair value of assets acquired in the acquisitions of Langford and liabilities assumed. Consideration is measured based onthe DGPV Holdco Entities at GIP's basis which was fair value of the assets transferred to the seller.value.
Significant judgment is required in determining the acquisition date fair value of the assets acquired and liabilities assumed, predominantly with respect to property, plant and equipment, power purchase agreements, asset retirement obligations and other contractual arrangements. Evaluations include numerous inputs including forecasted cash flows that incorporate the specific attributes of each asset including age, useful life, equipment condition and technology, as well as current replacement costs for similar assets. Other key inputs that require judgment include discount rates, comparable market transactions, estimated useful lives and probability of future transactions. The Company evaluates all available information, as well as all appropriate methodologies, when determining the fair value of assets acquired and liabilities assumed in a business combination. In addition, once the appropriate fair values are determined, the Company must determine the remaining useful life for property, plant and equipment and the amortization period and method of amortization for each finite-lived intangible asset.
The Company must apply ASC 805-50, Business Combinations - Related Issues, when it acquires an interest from NRG. The assets and liabilities transferred to the Company related to interests under common control by NRG must be recorded at historical cost, with the difference between the amount paid and the historical value of the related equity recorded as a distribution to or contribution from NRG with the offset to noncontrolling interest. Economics may change in the years subsequent to NRG’s construction or acquisition of certain assets, and although the Company may acquire these assets from NRG based on a different valuation, the Company must record the assets at historical cost. These changes in economics may impact the amount that the Company pays for the assets but will not alter the carrying amount. Accordingly, significant changes in the economics related to these assets may trigger a requirement for impairment testing.
Recent Accounting Developments
See Item 15 — Note 2, Summary of Significant Accounting Policies, to the Consolidated Financial Statements for a discussion of recent accounting developments.
Item 7A — Quantitative and Qualitative Disclosures About Market Risk
The Company is exposed to several market risks in its normal business activities. Market risk is the potential loss that may result from market changes associated with the Company's power generation or with an existing or forecasted financial or commodity transaction. The types of market risks the Company is exposed to are commodity price risk, interest rate risk, liquidity risk, and credit risk.
Commodity Price Risk
Commodity price risks result from exposures to changes in spot prices, forward prices, volatilities, and correlations between various commodities, such as electricity, natural gas and emissions credits. The Company manages the commodity price risk of its merchant generation operations by entering into derivative or non-derivative instruments to hedge the variability in future cash flows from forecasted power sales or purchases of fuel. The portion of forecasted transactions hedged may vary based upon management's assessment of market, weather, operation and other factors. See Item 15 — Note 7, Accounting for Derivative Instruments and Hedging Activities, to the Consolidated Financial Statements for more information.
Based on a sensitivity analysis using simplified assumptions, the impact of a $0.50 per MMBtu increase or decrease in natural gas prices across the term of the derivative contracts would cause no change to the net value of natural gas derivatives, and an increase of $0.50 MMBtu in natural gas prices across the term of the derivative contracts would cause an increase of approximately $1 million to the net value of natural gas derivatives as of December 31, 2020. The impact of a $0.50 per MWh increase or decrease in power prices across the term of the derivative contracts would cause a change of approximately $1$3 million into the net value of power derivatives as of December 31, 2017.2020.
Interest Rate Risk
The Company is exposed to fluctuations in interest rates through its issuance of variable rate debt. Exposures to interest rate fluctuations may be mitigated by entering into derivative instruments known as interest rate swaps, caps, collars and put or call options. These contracts reduce exposure to interest rate volatility and result in primarily fixed rate debt obligations when taking into account the combination of the variable rate debt and the interest rate derivative instrument. NRG's risk management policies allow the Company to reduce interest rate exposure from variable rate debt obligations. See itemItem 15 — Note 7, Accounting for Derivative Instruments and Hedging Activities, to the Consolidated Financial Statements for more information.
Most of the Company's project subsidiaries enter into interest rate swaps, intended to hedge the risks associated with interest rates on non-recourse project level debt. See Item 15 — Note 10, Long-term Debt, to the Consolidated Financial Statements for more information about interest rate swaps of the Company's project subsidiaries.
If all of the above swaps had been discontinued on December 31, 20172020, the Company would have owed the counterparties $50$134 million. Based on the credit ratings of the counterparties, the Company believes its exposure to credit risk due to nonperformance by counterparties to its hedge contracts to be insignificant.
The Company has long-term debt instruments that subject it to the risk of loss associated with movements in market interest rates. As of December 31, 20172020, a 1% change in interest rates would result in an approximately $3$1 million change in market interest expense on a rolling twelve-month basis.
As of December 31, 20172020, the fair value of the Company's debt was $5,930$7,020 million and the carrying value was $5,897$7,048 million. The Company estimates that a 1% decrease in market interest rates would have increased the fair value of its long-term debt by $306$412 million.
Liquidity Risk
Liquidity risk arises from the general funding needs of the Company's activities and in the management of the Company's assets and liabilities.
Counterparty Credit Risk
Credit risk relates to the risk of loss resulting from non-performance or non-payment by counterparties pursuant to the terms of their contractual obligations. The Company monitors and manages credit risk through credit policies that include: (i) an established credit approval process, and (ii) the use of credit mitigation measures such as prepayment arrangements or volumetric limits. Risks surrounding counterparty performance and credit could ultimately impact the amount and timing of expected cash flows. The Company seeks to mitigate counterparty risk by having a diversified portfolio of counterparties. See Item 15 — Note 1, Nature of Business, and Note 6, Fair Value of Financial Instruments, to the Consolidated Financial Statements for more information about concentration of credit risk.
Item 8 — Financial Statements and Supplementary Data
The financial statements and schedules are listed in Part IV, Item 15 of this Form 10-K.
Item 9 — Changes in and Disagreements with Accountants on Accounting and Financial Disclosure
None.
Item 9A — Controls and Procedures
Conclusion Regarding the Effectiveness of Disclosure Controls and Procedures and Internal Control Over Financial Reporting
Under the supervision and with the participation of the Company's management, including its principal executive officer, principal financial officer and principal accounting officer, the Company conducted an evaluation of the effectiveness of the design and operation of its disclosure controls and procedures, as such term is defined in Rules 13a-15(e) or 15d-15(e) of the Exchange Act. Based on this evaluation, the Company's principal executive officer, principal financial officer and principal accounting officer concluded that the disclosure controls and procedures were effective as of the end of the period covered by this reportAnnual Report on Form 10-K.
Changes in Internal Control over Financial Reporting
There were no changes in the Company’s internal control over financial reporting (as such term is defined in Rule 13a-15(f) under the Exchange Act) that occurred induring the fourth quarter of 2017ended December 31, 2020, that materially affected, or are reasonably likely to materially affect, the Company’s internal control over financial reporting.
Inherent Limitations over Internal Controls
The Company's internal control over financial reporting is designed to provide reasonable assurance regarding the reliability of financial reporting and the preparation of consolidated financial statements for external purposes in accordance with GAAP. The Company's internal control over financial reporting includes those policies and procedures that:
1. Pertain to the maintenance of records that, in reasonable detail, accurately and fairly reflect the transactions and dispositions of the Company's assets;
2. Provide reasonable assurance that transactions are recorded as necessary to permit preparation of consolidated financial statements in accordance with GAAP, and that the Company's receipts and expenditures are being made only in accordance with authorizations of its management and directors; and
3. Provide reasonable assurance regarding prevention or timely detection of unauthorized acquisition, use or disposition of the Company's assets that could have a material effect on the consolidated financial statements.
Internal control over financial reporting cannot provide absolute assurance of achieving financial reporting objectives because of its inherent limitations, including the possibility of human error and circumvention by collusion or overriding of controls. Accordingly, even an effective internal control system may not prevent or detect material misstatements on a timely basis. Also, projections of any evaluation of effectiveness to future periods are subject to the risk that controls may become inadequate because of changes in conditions or that the degree of compliance with the policies or procedures may deteriorate.
Management's Report on Internal Control over Financial Reporting
The Company's management is responsible for establishing and maintaining adequate internal control over financial reporting, as such term is defined in Exchange Act Rule 13a-15(f). Under the supervision and with the participation of the Company's management, including its principal executive officer, principal financial officer and principal accounting officer, the Company conducted an evaluation of the effectiveness of its internal control over financial reporting based on the framework in Internal Control — Integrated Framework (2013) issued by the Committee of Sponsoring Organizations of the Treadway Commission. Based on the Company's evaluation under the framework in Internal Control — Integrated Framework (2013), the Company's management concluded that its internal control over financial reporting was effective as of December 31, 2017.2020.
The effectiveness of the Company's internal control over financial reporting as of December 31, 2017,2020, has been audited by KPMG LLP, the Company's independent registered public accounting firm, as stated in its report which is included in this Form 10-K.
REPORT OF INDEPENDENT REGISTERED PUBLIC ACCOUNTING FIRM
To the Stockholders and Board of Directors
NRG Yield,Clearway Energy, Inc.:
Opinion on Internal Control Over Financial Reporting
We have audited NRG Yield,Clearway Energy, Inc. and subsidiaries (the Company) internal control over financial reporting as of December 31, 2017,2020, based on criteria established in Internal Control -– Integrated Framework (2013) issued by the Committee of Sponsoring Organizations of the Treadway Commission. In our opinion, the Company maintained, in all material respects, effective internal control over financial reporting as of December 31, 2017,2020, based on criteria established in Internal Control -– Integrated Framework (2013) issued by the Committee of Sponsoring Organizations of the Treadway Commission.
We also have audited, in accordance with the standards of the Public Company Accounting Oversight Board (United States), (PCAOB), the consolidated balance sheets of the Company as of December 31, 20172020 and 2016,2019, the related consolidated statements of operations, comprehensive income comprehensive (loss)/income,, stockholders’ equity, and cash flows for each of the years in the three-year period ended December 31, 2017,2020, and the related notes and financial statement schedule“schedules (“Schedule I.I- Condensed Financial Information of Registrant” and “Schedule II- Valuation and Qualifying Accounts”) (collectively, the consolidated financial statements), and our report dated March 1, 20182021 expressed an unqualified opinion on those consolidated financial statements.
Basis for Opinion
The Company’s management is responsible for maintaining effective internal control over financial reporting and for its assessment of the effectiveness of internal control over financial reporting, included in the accompanying Management’s Report on Internal Control over Financial Reporting. Our responsibility is to express an opinion on the Company’s internal control over financial reporting based on our audit. We are a public accounting firm registered with the PCAOB and are required to be independent with respect to the Company in accordance with the U.S. federal securities laws and the applicable rules and regulations of the Securities and Exchange Commission and the PCAOB.
We conducted our audit in accordance with the standards of the PCAOB. Those standards require that we plan and perform the audit to obtain reasonable assurance about whether effective internal control over financial reporting was maintained in all material respects. Our audit of internal control over financial reporting included obtaining an understanding of internal control over financial reporting, assessing the risk that a material weakness exists, and testing and evaluating the design and operating effectiveness of internal control based on the assessed risk. Our audit also included performing such other procedures as we considered necessary in the circumstances. We believe that our audit provides a reasonable basis for our opinion.
Definition and Limitations of Internal Control Over Financial Reporting
A company’s internal control over financial reporting is a process designed to provide reasonable assurance regarding the reliability of financial reporting and the preparation of financial statements for external purposes in accordance with generally accepted accounting principles. A company’s internal control over financial reporting includes those policies and procedures that (1) pertain to the maintenance of records that, in reasonable detail, accurately and fairly reflect the transactions and dispositions of the assets of the company; (2) provide reasonable assurance that transactions are recorded as necessary to permit preparation of financial statements in accordance with generally accepted accounting principles, and that receipts and expenditures of the company are being made only in accordance with authorizations of management and directors of the company; and (3) provide reasonable assurance regarding prevention or timely detection of unauthorized acquisition, use, or disposition of the company’s assets that could have a material effect on the financial statements.
Because of its inherent limitations, internal control over financial reporting may not prevent or detect misstatements. Also, projections of any evaluation of effectiveness to future periods are subject to the risk that controls may become inadequate because of changes in conditions, or that the degree of compliance with the policies or procedures may deteriorate.
(signed) KPMG LLP
Philadelphia, Pennsylvania
March 1, 20182021
Item 9B — Other Information
None.
PART III
Item 10 — Information about Directors, Executive Officers and Corporate Governance
Directors
Kirkland B. Andrews Nathaniel Anschuetz, 33, has served as a director since August 2018. Mr. Anschuetz is a Principal at GIP. Prior to joining GIP in 2012, Mr. Anschuetz was an Analyst in the Power & Utilities Coverage Group at Citigroup from June 2010 through June 2012. Mr. Anschuetz is also a member of the Board of Directors of Clearway Energy Group LLC and MAP RE/ES. Mr. Anschuetz graduated with cum laude honors from Columbia College in 2010 with an A.B. in Economics and Operations Research, and a concentration in Sustainable Development. Mr. Anschuetz's financial expertise provides significant value to the Company's formation in December 2012. Mr. Andrews served as the Company's Executive Vice President and Chief Financial Officer from December 2012 to November 2016. Mr. Andrewsboard of directors.
Jonathan Bram, 55, has served as Executive Vice President and Chief Financial OfficerChairman of NRG since September 2011. Prior to joining NRG, he served as Managing Director and Co-Head Investment Banking, Power and Utilities—Americas at Deutsche Bank Securities from June 2009 to September 2011. Prior to this, he served in several capacities at Citigroup Global Markets Inc., including Managing Director, Group Head, North American Power from November 2007 to June 2009, and Head of Power M&A, Mergers and Acquisitions from July 2005 to November 2007. In his banking career, Mr. Andrews led multiple large and innovative strategic, debt, equity and commodities transactions. Mr. Andrews’ extensive investment banking experience, specifically in the energy industry and financial structuring, brings important experience and skills to the Company’s board of directors.
John Chillemi has served as a directordirectors of the Company since May 2016.August 2018. Mr. Chillemi has alsoBram is a Founding Partner of GIP and serves on its Investment and Operating Committees. He leads GIP’s Power industry investment team in North America. Prior to the formation of GIP in 2006, Mr. Bram spent 15 years at Credit Suisse as a Managing Director in the Investment Banking Division, where he served as Executive Vice President, National Business Development of NRG since December 2015. In this role, Mr. Chillemi is responsible for all wholesale generation development activities for NRG across the nation. Prior to December 2015, Mr. Chillemi was Senior Vice President and Regional President, West since NRG’s acquisition of GenOn Energy, Inc., or GenOn, in December 2012. Mr. Chillemi served as the Regional President in California and the West for GenOn from December 2010 to December 2012, and as President and Vice PresidentCo-Head of the West at Mirant Corporation from 2007 December 2010. Mr. Chillemi has 30 years of power industry experience, beginning with Georgia Power in 1986. Mr. Chillemi’s knowledgeGlobal Industrial and Services Group. From 2002 to 2004, he was Chief Operating Officer of the Company’s assets, operationsInvestment Banking Division and businesses bring important experienceprior to that time he was co-head of corporate finance for the 150 person U.S. Energy Group. Mr. Bram represented the firm in raising more than $30 billion of debt and skills to the Company’s board of directors.
John F. Chlebowski equity capital for electric utilities and independent power generators globally. These companies and projects included renewable power facilities that utilized wind, solar, geothermal and hydroelectric technologies. Mr. Bram is the Company's Lead Independent Director and has beenalso a director since July 2013.Mr. Chlebowski served as the Company's Interim Chairmanmember of the Board from December 2015 to May 2016.Mr. Chlebowski had been a director of NRG from December 2003 to July 2013. Mr. ChlebowskiDirectors of Clearway Energy Group LLC and previously served ason the President and Chief Executive Officer of Lakeshore Operating Partners, LLC, a bulk liquid distribution firm, from March 2000 until his retirement in December 2004. From July 1999 until March 2000, Mr. Chlebowski was a senior executive and cofounder of Lakeshore Liquids Operating Partners, LLC, a private venture firm in the bulk liquid distribution and logistics business, and from January 1998 until July 1999, he was a private investor and consultant in bulk liquid distribution. From 1994 until 1997, he was the President and Chief Executive Officer of GATX Terminals Corporation, a subsidiary of GATX Corporation. Prior to that, he served as Vice President of Finance and Chief Financial Officer of GATX Corporation from 1986 to 1994. Mr. Chlebowski served as a director of First Midwest Bancorp Inc. from June 2007 until May 2017. Mr. Chlebowski also served as the Non-Executive Chairman of SemGroup Corporation from December 2009 until January 2017. Mr. Chlebowski also served as a director of Laidlaw International, Inc. from June 2003 until October 2007, SpectraSite, Inc. from June 2004 until August 2005, and Phosphate Resource Partners Limited Partnership from June 2004 until August 2005. Mr. Chlebowski’s extensive leadership and financial expertise, as a result of his position as a former chief executive officer and his service on several boards of Terra-Gen Power, Guacolda Energia, S.A. and Channelview Cogeneration. Mr. Bram holds an A.B. in Economics from Columbia College. Mr. Bram’s significant experience in investment banking for, and investments in, energy and power companies, involved in the restructuring or recovery of their core business, enable him to contributeas well as his leadership role at GIP, provide strong financial and transactional experience to the board of directors' significant managerial, strategic, and financial oversight skills. Furthermore, Mr. Chlebowski’s service on other public boards, notably as a non-executive Chairman, provides valuable insight into the application of various governance principles to the Company’sCompany's board of directors.
Brian R. Ford, 72, has served as a director since July 2013.2013 and Lead Independent Director since January 2019. Mr. Ford was the Chief Executive Officer of Washington Philadelphia Partners, LP, a real estate investment company, from 2008 through 2010. He retired as a partner from Ernst & Young LLP in June 2008 where he had been employed since 1971. Mr. Ford currently serves on the board of various public companies: GulfMark Offshore, Inc., a global provider of marine transportation, since 2009, where he also serves as the chairman of the audit committee and as a member of the governance nominating committee; AmeriGas Propane, Inc., a propane company, since 2013, where he also serves as a member of its audit committee and corporate governance committee;companies, including FS Investment Corporation III,portfolios, a specialty finance company that invests primarily in the debt securities of private U.S. middle-market companies, since 2013, where he also serves as the chairman of the audit committee. He also serves on the boards of Drexel University and BAYADA Home Health. From 2013 to 2020, Mr. Ford served on the board of Drexel University.AmeriGas Propane, Inc., where he also served as a member of its audit and corporate governance committees. Mr. Ford received his B.S. in Economics from Rutgers University. Mr. Ford's extensive experience in accounting and public company matters provides strong financial, audit and accounting skills to the Company's board of directors.
Mauricio Gutierrez Bruce MacLennan, 54, has served as Chairman of the board of directors of the Company since May 2016, and a director since the Company's formation in December 2012.August 2018. Mr. Gutierrez was the Company's Interim PresidentMacLennan is a Partner of GIP and Chief Executive Officer from December 2015 to May 2016serves on its Investment and the Company's Executive Vice President and Chief Operating Officer from December 2012 to December 2015. Mr. Gutierrez has also served as President and Chief Executive Officer of NRG since December 2015. Prior to December 2015, Mr. Gutierrez was the Executive Vice President and Chief Operating Officer of NRG from July 2010 to December 2015. Mr. Gutierrez has been with NRG since August 2004 and served in multiple executive positions within NRG including Executive Vice President - Commercial Operations of NRG from January 2009 to July 2010 and Senior Vice President - Commercial Operations of NRG from March 2008 to January 2009.Committees. Prior to joining NRGGIP at its formation in August 2004,2006, Mr. Gutierrez held various commercial positions within Dynegy, Inc.MacLennan spent eight years at Credit Suisse, where he most recently served as a Director in the Investment Banking Division. Previously, he spent six years at Citibank and Citicorp Securities in New York and Tokyo. Mr. Gutierrez’s knowledgeMacLennan holds an A.B. from Harvard University and an M.B.A. from the Wharton School of the Company’s assets, operationsUniversity of Pennsylvania. He is currently a member of the Board of Directors of Clearway Energy Group LLC and businesses bring importantMAP RE/ES and previously served on the Board of Competitive Power Ventures. Mr. MacLennan’s significant experience in investment banking for, and skillsinvestments in, energy and power companies, as well as his leadership role at GIP, provide strong financial and transactional experience to the Company’sCompany's board of directors.
Ferrell P. McClean, 74, has served as a director since July 2013. Ms. McClean was a Managing Director and the Senior Advisor to the head of the Global Oil & Gas Group in Investment Banking at J.P. Morgan Chase & Co. from 2000 through the end of 2001. She joined J.P. Morgan & Co. Incorporated in 1969 and founded the Leveraged Buyout and Restructuring Group within the Mergers & Acquisitions Group in 1986. From 1991 until 2000, Ms. McClean was a Managing Director and co-headed the Global Energy Group within the Investment Banking Group at J.P. Morgan & Co. She retired as a director of GrafTech International in 2014, El Paso Corporation in 2012 and Unocal Corporation in 2005. Ms. McClean's experience in investment banking for industrial companies as well as her experience and understanding of financial accounting, finance and disclosure matters enables her to provide essential guidance to the Company's board of directors and management team.
Daniel B. More, 64, has served as a director since February 2019. Mr. More has been a Senior Advisor with Guggenheim Securities since October 2015. Mr. Moreretiredas a Managing Director and Global Head of Utility Mergers & Acquisitions of the Investment Banking Division of Morgan Stanley in 2014. He held such position since 1996. Mr. More has been an investment banker since 1978 and has specialized in the utility sector since 1986. Mr. More has served as a director of SJW Group since April 2015. He served as a director of Saeta Yield from February 2015 to June 2018 and served as a director of the New York Independent System Operator from April 2014 until February 2016. Mr. More’s extensive experience in investment banking, including capital raising and strategic initiatives, combined with experience as a director of energy industry companies, provides significant value to the Company's board of directors.
E. Stanley O'Neal, 69, has served as a director since August 2018. Mr. O'Neal served as Chairman of the Board and Chief Executive Officer of Merrill Lynch & Co., Inc. until October 2007. He became Chief Executive Officer of Merrill Lynch in 2002 and was elected Chairman of the Board in 2003. Mr. O’Neal was employed with Merrill Lynch for 21 years, serving as President and Chief Operating Officer from July 2001 to December 2002; President of U.S. Private Client from February 2000 to July 2001; Chief Financial Officer from 1998 to 2000 and Executive Vice President and Co-head of Global Markets and Investment Banking from 1997 to 1998. Before joining Merrill Lynch, Mr. O’Neal was employed at General Motors Corporation where he held a number of financial positions of increasing responsibility. Currently, Mr. O’Neal is chairman of the nominating and governance committee and a member of the committee of Arconic Corp., an aluminum manufacturing company and the former parent company of Alcoa Inc. Mr. O’Neal is also a director and member of the nominating and governance committee of Element Solutions Inc. (formerly Platform Specialty Products Corporation), a global, diversified producer of high technology specialty chemical products and provider of technical services. Mr. O’Neal was a director of General Motors Corporation from 2001 to 2006, chairman of the board of Merrill Lynch & Co., Inc. from 2003 to 2007, and a director of American Beacon Advisors, Inc. (investment advisor registered with the Securities and Exchange Commission) from 2009 to September 2012. Mr. O’Neal’s extensive executive experience, financial expertise and leadership skills enable him to provide unique guidance to the Company's board of directors and management team.
Christopher S. Sotos, 49,has served as President and Chief Executive Officer of the Company since May 2016, and as a director since May 2013. Mr. Sotos hashad also served in various positions at NRG, including most recently as Executive Vice President - Strategy and Mergers and Acquisitions from February 2016 through May 2016 and Senior Vice President - Strategy and Mergers and Acquisitions from November 2012 through February 2016. In this role, he led NRG’s corporate strategy, mergers and acquisitions, strategic alliances and other special projects for NRG. Previously, he served as NRG’s Senior Vice President and Treasurer from March 2008 to September 2012, where he was responsible for all treasury functions, including raising capital, valuation, debt administration and cash management. Mr. Sotos joined NRG in 2004also previously served as a Senior Finance Analyst, following more than nine years in key financial roles within the energy sector and other industries for Houston-based companies such as Koch Capital Markets, Entergy Wholesale Operations and Service Corporation International. Mr. Sotos also serves on the boarddirector of FuelCell Energy, Inc. from September 2014 to April 2019. As President and Chief Executive Officer of the Company, Mr. Sotos provides the Company's Boardboard of directors with management’s perspective regarding the Company’s day to day operations and overall strategic plan. Mr. Sotos also brings strong financial and accounting skills to the Company's Board.board of directors.
Scott Stanley, 64, has served as a director since August 2018. Mr. Stanley has been employed by GIP as an Operating Principal since April 2007, and in August 2018 was appointed as an Operating Partner. Mr. Stanley holds a B.S. in Ceramic Engineering from The Ohio State University and has 39 years of experience in operational roles, including prior assignments with General Electric, Honeywell, and United Technologies Corporation. Working predominantly in the transport sector with GIP, Mr. Stanley has held roles as Chief Operating Officer with London City Airport, Gatwick Airport, and Pacific National and was also on the Board of Directors at Edinburgh Airport. Mr. Stanley is also a member of the Board of Directors of Clearway Energy Group LLC and Italo S.p.A. and previously served on the Board of Directors of Naturgy Energy Group, S.A. Mr. Stanley adds significant operational expertise to the Company's board of directors.
Executive Officers
Christopher S. Sotoshas served as President and Chief Executive Officer of the Company since May 2016, and as a director of the Company since May 2013. For additional biographical information for Mr. Sotos, see above under “Directors.”
Chad Plotkin, 45,has served as the Company's Senior Vice President and Chief Financial Officer since November 2016. From January 2016 until his appointment as Senior Vice President and Chief Financial Officer, of the Company since November 2016. Prior to this appointment, heMr. Plotkin served in various roles at NRG, most recently serving as Senior Vice President, Finance and Strategy, of NRG since January 2016.Strategy. Prior to this, he served in varying capacities at NRG, including as Vice President of Investor Relations of both the Company and NRG from September 2015 to January 2016 and from January 2012 to February 2015 and Vice President of Finance of NRG from February 2015 to September 2015. From October 2007 to January 2012, Mr. Plotkin served in various capacities in the Strategy and Mergers and Acquisitions group of NRG, including as Vice President, beginning in December 2010.
David Callen has served as Vice President and Chief Accounting Officer since March 2015. In this capacity, Mr. Callen is responsible for directing the Company's financial accounting and reporting activities. Mr. Callen also
Kevin P.Malcarney, 54, has served as Senior Vice President, General Counsel and Chief Accounting OfficerCorporate Secretary since May 11, 2018. Mr. Malcarney served as Interim General Counsel of NRG since February 2016 andthe Company from March 16, 2018. Mr. Malcarney was previously Vice President and Chief Accounting Officer from March 2015 to February 2016. Prior to this, Mr. CallenDeputy General Counsel and served as NRG's Vice President, Financial Planning & Analysis from November 2010 to March 2015. He previously served as Director, Finance from October 2007 through October 2010, Director, Financial Reporting from February 2006 through October 2007, and Manager, Accounting Research fromin various other roles at NRG Energy, Inc. since September 2004 through February 2006.2008. Prior to NRG, Mr. Callen was an auditor for KPMG LLP in both New York City and Tel Aviv, Israel, from October 1996 through April 2001.
David R. Hill has served as Executive Vice President and General Counsel since the Company's formation in December 2012. Mr. Hill has served as Executive Vice President and General Counsel of NRG since September 2012. Prior to joining NRG, Mr. Hill was a partner and co-head of Sidley Austin LLP's global energy practice group from February 2009 to August 2012. Prior to joining Sidley Austin, Mr. Hill served as General Counsel of the U.S. Department of Energy from August 2005 to January 2009 and, for the three years prior to that, as Deputy General Counsel for Energy Policy of the U.S. DOE. Prior to his federal government services, Mr. Hill was a partnerMalcarney worked at two major law firms in Washington D.C.Princeton, NJ and Kansas City, Missouri,Philadelphia, PA, and handled a variety of regulatory, litigationmergers and acquisitions, project financing and general corporate matters.
Code of Ethics
The Company has adopted a code of ethics entitled "NRG Yield"Clearway Energy, Inc. Code of Conduct"Business Conduct and Ethics" that applies to all of our directors and officers of the Company.employees, including our Officers (e.g., our CEO, CFO, and Principal Accounting Officer). It may be accessed through the "Corporate Governance" section of the Company's website at http://www.nrgyield.com.www.clearwayenergy.com. The Company also elects to disclose the information required by Form 8-K, Item 5.05, "Amendments to the Registrant's Code of Ethics, or Waiver of a Provision of the Code of Ethics," through the Company's website, and such information will remain available on this website for at least a 12-month period. A copy of the "NRG Yield,"Clearway Energy, Inc. Code of Conduct"Business Conduct and Ethics" is available in print to any stockholder who requests it.
Other information required by this Item will be incorporated by reference to the similarly named section of the Company's Definitive Proxy Statement for its 20182021 Annual Meeting of Stockholders.
Item 11 — Executive Compensation
Information required by this Item will be incorporated by reference to the similarly named section of the Company's Definitive Proxy Statement for its 20182021 Annual Meeting of Stockholders.
Item 12 — Security Ownership of Certain Beneficial Owners and Management and Related Stockholder Matters
Securities Authorized for Issuance under the Clearway Energy, Inc. Amended and Restated 2013 Equity Compensation PlansPlan
| | | | | | | | | | | | | | | | | |
| Plan Category | (a)
Number of Securities
to be Issued Upon
Exercise of
Outstanding Options,
Warrants and Rights | | (b)
Weighted-Average Exercise
Price of Outstanding
Options, Warrants and
Rights | | (c) Number of Securities Remaining Available for Future Issuance Under Equity Compensation Plans (Excluding Securities Reflected in Column (a)) (1) |
| Equity compensation plans approved by security holders - Class A common stock | 19,699 | | | $ | — | | | — |
| Equity compensation plans approved by security holders - Class C common stock | 724,988 | | | — | | | 908,335 | |
| Equity compensation plans not approved by security holders | — | | | N/A | | — | |
| Total | 744,687 | | | $ | — | | | 908,335 | |
|
| | | | | | | | | |
| Plan Category | (a) Number of Securities to be Issued Upon Exercise of Outstanding Options, Warrants and Rights | | (b) Weighted-Average Exercise Price of Outstanding Options, Warrants and Rights | | (c) Number of Securities Remaining Available for Future Issuance Under Equity Compensation Plans (Excluding Securities Reflected in Column (a)) |
| Equity compensation plans approved by security holders - Class A common stock | 29,183 |
| | $ | — |
| | —(1) |
|
| Equity compensation plans approved by security holders - Class C common stock | 332,340 |
| | — |
| | 1,627,506 |
|
| Equity compensation plans not approved by security holders | — |
| | N/A |
| | — |
|
| Total | 361,523 |
| | $ | — |
| | 1,627,506 |
|
(1) Consists of 1,627,506 shares of Class A and Class C common stock issuable under the NRG Yield, Inc. 2013 Equity Incentive Plan. Beginning in May 2015, awards to be granted and associated dividend equivalent rights willto be issued under the Clearway Energy, Inc. Amended and Restated 2013 Equity Incentive Plan convert to Class C common stock upon vesting.
Other information required by this Item will be incorporated by reference to the similarly named section of the Company's Definitive Proxy Statement for its 20182021 Annual Meeting of Stockholders.
Item 13 — Certain Relationships and Related Transactions, and Director Independence
Information required by this Item will be incorporated by reference to the similarly named section of the Company's Definitive Proxy Statement for its 20182021 Annual Meeting of Stockholders.
Item 14 — Principal Accounting Fees and Services
Information required by this Item will be incorporated by reference to the similarly named section of the Company's Definitive Proxy Statement for its 20182021 Annual Meeting of Stockholders.
PART IV
Item 15 — Exhibits, Financial Statement Schedules
(a)(1) Financial Statements
The following consolidated financial statements of NRG Yield,Clearway Energy, Inc. and related notes thereto, together with the reports thereon of KPMG LLP, are included herein:
Consolidated Statements of Operations — Years ended December 31, 2017, 20162020, 2019 and 20152018
Consolidated Statements of Comprehensive (Loss) Income — Years ended December 31, 2017, 20162020, 2019 and 20152018
Consolidated Balance Sheets — As of December 31, 20172020 and 20162019
Consolidated Statements of Cash Flows — Years ended December 31, 2017, 20162020, 2019 and 20152018
Consolidated Statements of Stockholders' Equity — Years ended December 31, 2017, 20162020, 2019 and 20152018
Notes to Consolidated Financial Statements
(a)(2) Financial Statement Schedules
The following schedules of NRG Yield,Clearway Energy, Inc. are filed as part of Item 15 of this report and should be read in conjunction with the Consolidated Financial Statements:
NRG Yield,Schedule I — Clearway Energy, Inc. Financial Statements for the years ended December 31, 2017, 20162020, 2019 and 2015,2018, are included in NRG Yield,Clearway Energy, Inc.'s Annual Report on Form 10-K pursuant to the requirements of Rule 5-04(c) of Regulation S-X
Schedule II — Valuation and Qualifying Accounts
All other schedules for which provision is made in the applicable accounting regulation of the Securities and Exchange Commission are not required under the related instructions or are inapplicable, and therefore, have been omitted
(a)(3) Exhibits: See Exhibit Index submitted as a separate section of this report
(b) Exhibits
See Exhibit Index submitted as a separate section of this report
(c) Not applicable
Report of Independent Registered Public Accounting Firm
To the Stockholders and Board of Directors
NRG Yield,Clearway Energy, Inc.:
Opinion on the ConsolidatedFinancial Statements
We have audited the accompanying consolidated balance sheets of NRG Yield,Clearway Energy, Inc. and subsidiaries (the Company) as of December 31, 20172020 and 2016,2019, the related consolidated statements of operations, comprehensive income (loss)/income,, stockholders’ equity, and cash flows for each of the years in the three‑year period ended December 31, 2017,2020, and the related notes and financial statement schedule “Schedule I. Condensedschedules, (“Schedule I-Condensed Financial Information of Registrant” and “Schedule II-Valuation and Qualifying Accounts”) (collectively, the consolidated financial statements). In our opinion, the consolidated financial statements present fairly, in all material respects, the financial position of the Company as of December 31, 20172020 and 2016,2019, and the results of its operations and its cash flows for each of the years in the three‑year period ended December 31, 2017,2020, in conformity with U.S. generally accepted accounting principles.
We also have audited, in accordance with the standards of the Public Company Accounting Oversight Board (United States) (PCAOB), the Company’s internal control over financial reporting as of December 31, 2017,2020, based on criteria established in Internal Control -– Integrated Framework (2013) issued by the Committee of Sponsoring Organizations of the Treadway Commission, and our report dated March 1, 20182021, expressed an unqualified opinion on the effectiveness of the Company’s internal control over financial reporting.
Changes in Accounting Principle
As discussed in Note 2 to the consolidated financial statements, the Company has changed its method of accounting for Revenue from Contracts with Customers as of January 1, 2018 due to the adoption of Topic 606.
As discussed in Note 2 to the consolidated financial statements, the Company has changed its method of accounting for Leases as of January 1, 2019 due to the adoption of Topic 842.
Basis for Opinion
These consolidated financial statements are the responsibility of the Company’s management. Our responsibility is to express an opinion on these consolidated financial statements based on our audits. We are a public accounting firm registered with the PCAOB and are required to be independent with respect to the Company in accordance with the U.S. federal securities laws and the applicable rules and regulations of the Securities and Exchange Commission and the PCAOB.
We conducted our audits in accordance with the standards of the PCAOB. Those standards require that we plan and perform the audit to obtain reasonable assurance about whether the consolidated financial statements are free of material misstatement, whether due to error or fraud. Our audits included performing procedures to assess the risks of material misstatement of the consolidated financial statements, whether due to error or fraud, and performing procedures that respond to those risks. Such procedures included examining, on a test basis, evidence regarding the amounts and disclosures in the consolidated financial statements. Our audits also included evaluating the accounting principles used and significant estimates made by management, as well as evaluating the overall presentation of the consolidated financial statements. We believe that our audits provide a reasonable basis for our opinion.
Critical Audit Matter
The critical audit matter communicated below is a matter arising from the current period audit of the consolidated financial statements that was communicated or required to be communicated to the audit committee and that: (1) relates to accounts or disclosures that are material to the consolidated financial statements and (2) involved our especially challenging, subjective, or complex judgments. The communication of a critical audit matter does not alter in any way our opinion on the consolidated financial statements, taken as a whole, and we are not, by communicating the critical audit matter below, providing a separate opinion on the critical audit matter or on the accounts or disclosures to which it relates.
Evaluation over the recoverability of certain long-lived assets
As discussed in Note 2 to the consolidated financial statements, long-lived assets that are held and used are reviewed for impairment whenever events or changes in circumstances indicate their carrying value may not be recoverable. Recoverability of assets to be held and used is tested by comparing the carrying amount of the assets to the future net cash flows expected to be generated by the asset, through considering project specific assumptions for long-term energy
prices, escalated future project operating costs, and expected plant operations. An impairment loss is indicated if the total future undiscounted cash flows expected from an asset are less than its carrying value. An impairment charge is measured as the difference between the asset’s carrying value and its fair value.
We identified the evaluation of the recoverability of certain long-lived assets as a critical audit matter. Especially subjective auditor judgment was required to evaluate the long-term energy prices used in the Company’s future undiscounted cash flows. Specifically, for certain asset groups tested for recoverability, the long-term energy prices in the post contracted periods used in the determination of future undiscounted cash flows were challenging to evaluate as small changes to this assumption could have a significant effect on the Company’s assessment of the recoverability of certain long-lived assets.
The following are the primary procedures we performed to address this critical audit matter. We evaluated the design and tested the operating effectiveness of certain internal controls related to the Company’s process to evaluate the recoverability of long-lived assets, including selection of long-term forecasted energy prices used in the determination of future undiscounted cash flows. We involved valuation professionals with specialized skills and knowledge, who assisted in evaluating the long-term energy prices determined by the Company. Specifically, the valuation professionals evaluated the long-term energy prices used by the Company by comparing them to energy price curves prepared by reputable third-party vendors that provide energy price forecasts in the applicable power markets.
(signed) KPMG LLP
We have served as the Company’s auditor since 2012.
Philadelphia, Pennsylvania
March 1, 20182021
NRG YIELD,CLEARWAY ENERGY, INC.
CONSOLIDATED STATEMENTS OF OPERATIONS
| | | | | | | | | | | | | | | | | |
| Year ended December 31, |
| (In millions, except per share amounts) | 2020 | | 2019 | | 2018 |
| Operating Revenues | | | | | |
| Total operating revenues | $ | 1,199 | | | $ | 1,032 | | | $ | 1,053 | |
| Operating Costs and Expenses | | | | | |
| Cost of operations | 366 | | | 337 | | | 327 | |
| Depreciation, amortization and accretion | 428 | | | 401 | | | 336 | |
| Impairment losses | 24 | | | 33 | | | 0 | |
| General and administrative | 34 | | | 29 | | | 20 | |
| Transaction and integration costs | 9 | | | 3 | | | 20 | |
| Development costs | 5 | | | 5 | | | 3 | |
| Total operating costs and expenses | 866 | | | 808 | | | 706 | |
| Operating Income | 333 | | | 224 | | | 347 | |
| Other Income (Expense) | | | | | |
| Equity in earnings of unconsolidated affiliates | 7 | | | 83 | | | 74 | |
| Impairment loss on investment | (8) | | | 0 | | | 0 | |
| Gain on sale of unconsolidated affiliate | 49 | | | 0 | | | 0 | |
| Other income, net | 4 | | | 9 | | | 8 | |
| Loss on debt extinguishment | (24) | | | (16) | | | (7) | |
| Interest expense | (415) | | | (404) | | | (306) | |
| Total other expense, net | (387) | | | (328) | | | (231) | |
| (Loss) Income Before Income Taxes | (54) | | | (104) | | | 116 | |
| Income tax expense (benefit) | 8 | | | (8) | | | 62 | |
| Net (Loss) Income | (62) | | | (96) | | | 54 | |
| Less: Pre-acquisition net income of Drop Down Assets | 0 | | | 0 | | | 4 | |
| Net (Loss) Income Excluding Pre-acquisition Net Income (Loss) of Drop Down Assets | (62) | | | (96) | | | 50 | |
| | | | | |
| Less: Net (loss) income attributable to noncontrolling interests | (87) | | | (85) | | | 2 | |
| Net Income (Loss) Attributable to Clearway Energy, Inc. | $ | 25 | | | $ | (11) | | | $ | 48 | |
| Earnings Per Share Attributable to Clearway Energy, Inc. Class A and Class C Common Stockholders | | | | | |
| Weighted average number of Class A common shares outstanding - basic and diluted | 35 | | | 35 | | | 35 | |
| | | | | |
| Weighted average number of Class C common shares outstanding - basic | 80 | | | 74 | | | 69 | |
| Weighted average number of Class C common shares outstanding - diluted | 81 | | | 74 | | | 69 | |
| Earnings (Loss) per Weighted Average Class A and Class C Common Share - Basic and Diluted | $ | 0.22 | | | $ | (0.10) | | | $ | 0.46 | |
| | | | | |
| | | | | |
| Dividends Per Class A Common Share | $ | 1.05 | | | $ | 0.80 | | | $ | 1.258 | |
| Dividends Per Class C Common Share | $ | 1.05 | | | $ | 0.80 | | | $ | 1.258 | |
|
| | | | | | | | | | | |
| | Year ended December 31, |
| (In millions, except per share amounts) | 2017 | | 2016 (a) | | 2015 (a) |
| Operating Revenues | | | | | |
| Total operating revenues | $ | 1,009 |
| | $ | 1,035 |
| | $ | 968 |
|
| Operating Costs and Expenses | | | | | |
| Cost of operations | 326 |
| | 308 |
| | 323 |
|
| Depreciation and amortization | 334 |
| | 303 |
| | 303 |
|
| Impairment losses | 44 |
| | 185 |
| | 1 |
|
| General and administrative | 19 |
| | 16 |
| | 12 |
|
| Acquisition-related transaction and integration costs | 3 |
| | 1 |
| | 3 |
|
| Total operating costs and expenses | 726 |
| | 813 |
| | 642 |
|
| Operating Income | 283 |
| | 222 |
| | 326 |
|
| Other Income (Expense) | | | | | |
| Equity in earnings of unconsolidated affiliates | 71 |
| | 60 |
| | 31 |
|
| Other income, net | 4 |
| | 3 |
| | 3 |
|
| Loss on debt extinguishment | (3 | ) | | — |
| | (9 | ) |
| Interest expense | (306 | ) | | (284 | ) | | (267 | ) |
| Total other expense, net | (234 | ) | | (221 | ) | | (242 | ) |
| Income Before Income Taxes | 49 |
| | 1 |
| | 84 |
|
| Income tax expense (benefit) | 72 |
| | (1 | ) | | 12 |
|
| Net (Loss) Income | (23 | ) | | 2 |
| | 72 |
|
| Less: Pre-acquisition net income (loss) of Drop Down Assets | 8 |
| | (4 | ) | | — |
|
| Net (Loss) Income Excluding Pre-acquisition Net Income (Loss) of Drop Down Assets | (31 | ) | | 6 |
| | 72 |
|
| Less: Net (loss) income attributable to noncontrolling interests | (15 | ) | | (51 | ) | | 39 |
|
| Net (Loss) Income Attributable to NRG Yield, Inc. | $ | (16 | ) | | $ | 57 |
| | $ | 33 |
|
| Earnings Per Share Attributable to NRG Yield, Inc. Class A and Class C Common Stockholders | | | | | |
| Weighted average number of Class A common shares outstanding - basic and diluted | 35 |
| | 35 |
| | 35 |
|
| Weighted average number of Class C common shares outstanding - basic and diluted | 64 |
| | 63 |
| | 49 |
|
| (Loss) Earnings per Weighted Average Class A and Class C Common Share - Basic and Diluted | $ | (0.16 | ) | | $ | 0.58 |
| | $ | 0.40 |
|
| Dividends Per Class A Common Share | $ | 1.098 |
| | $ | 0.945 |
| | $ | 1.015 |
|
| Dividends Per Class C Common Share | $ | 1.098 |
| | $ | 0.945 |
| | $ | 0.625 |
|
(a) Retrospectively adjusted as discussed in Note 1, Nature of Business.
See accompanying notes to consolidated financial statements.
NRG YIELD,CLEARWAY ENERGY, INC.
CONSOLIDATED STATEMENTS OF COMPREHENSIVE INCOME (LOSS) INCOME
| | | | | | | | | | | | | | | | | |
| Year ended December 31, |
| 2020 | | 2019 | | 2018 |
| (In millions) | |
| Net (Loss) Income | $ | (62) | | | $ | (96) | | | $ | 54 | |
| Other Comprehensive Income (Loss), net of tax | | | | | |
| Unrealized gain on derivatives, net of income tax expense of $0, $1, and $2 | 1 | | 7 | | 22 |
| Other comprehensive income | 1 | | | 7 | | | 22 | |
| Comprehensive (Loss) Income | (61) | | | (89) | | | 76 | |
| Less: Pre-acquisition net income of Drop Down Assets | 0 | | | 0 | | | 4 | |
| Less: Comprehensive (loss) income attributable to noncontrolling interests | (87) | | | (81) | | | 14 | |
| Comprehensive Income (Loss) Attributable to Clearway Energy, Inc. | $ | 26 | | | $ | (8) | | | $ | 58 | |
|
| | | | | | | | | | | |
| | Year ended December 31, |
| | 2017 | | 2016 (a) | | 2015 (a) |
| (In millions) | |
| Net (Loss) Income | $ | (23 | ) | | $ | 2 |
| | $ | 72 |
|
| Other Comprehensive Income (Loss), net of tax | | | | | |
| Unrealized gain (loss) on derivatives, net of income tax (expense) benefit of ($7), $0, and $10 | 10 |
| | 13 |
| | (7 | ) |
| Other comprehensive income (loss) | 10 |
| | 13 |
| | (7 | ) |
| Comprehensive (Loss) Income | (13 | ) | | 15 |
| | 65 |
|
| Less: Pre-acquisition net income (loss) of Drop Down Assets | 8 |
| | (4 | ) | | — |
|
| Less: Comprehensive (loss) income attributable to noncontrolling interests | (5 | ) | | (37 | ) | | 50 |
|
| Comprehensive (Loss) Income Attributable to NRG Yield, Inc. | $ | (16 | ) | | $ | 56 |
| | $ | 15 |
|
(a) Retrospectively adjusted as discussed in Note 1, Nature of Business.
See accompanying notes to consolidated financial statements.
NRG YIELD,CLEARWAY ENERGY, INC.
CONSOLIDATED BALANCE SHEETS
| | | | | | | | | | | |
| December 31, 2020 | | December 31, 2019 |
| ASSETS | (In millions) |
| Current Assets | | | |
| Cash and cash equivalents | $ | 268 | | | $ | 155 | |
| Restricted cash | 197 | | | 262 | |
| Accounts receivable — trade | 143 | | | 116 | |
| Accounts receivable — affiliates | 0 | | | 2 | |
| Inventory | 42 | | | 40 | |
| | | |
| | | |
| | | |
| | | |
| Prepayments and other current assets | 58 | | | 33 | |
| Total current assets | 708 | | | 608 | |
| Property, plant and equipment, net | 7,217 | | | 6,063 | |
| Other Assets | | | |
| Equity investments in affiliates | 741 | | | 1,183 | |
| Intangible assets, net | 1,370 | | | 1,428 | |
| Deferred income taxes | 104 | | | 92 | |
| Derivative instruments | 1 | | | 0 | |
| Right-of-use assets, net | 337 | | | 223 | |
| Other non-current assets | 114 | | | 103 | |
| Total other assets | 2,667 | | | 3,029 | |
| Total Assets | $ | 10,592 | | | $ | 9,700 | |
| LIABILITIES AND STOCKHOLDERS’ EQUITY | | | |
| Current Liabilities | | | |
| Current portion of long-term debt | $ | 384 | | | $ | 1,824 | |
| Accounts payable — trade | 72 | | | 74 | |
| Accounts payable — affiliates | 17 | | | 31 | |
| Derivative instruments | 38 | | | 16 | |
| Accrued interest expense | 44 | | | 41 | |
| Accrued expenses and other current liabilities | 79 | | | 71 | |
| Total current liabilities | 634 | | | 2,057 | |
| Other Liabilities | | | |
| Long-term debt | 6,585 | | | 4,956 | |
| Derivative instruments | 135 | | | 76 | |
| Long-term lease liabilities | 345 | | | 227 | |
| Other non-current liabilities | 178 | | | 121 | |
| Total non-current liabilities | 7,243 | | | 5,380 | |
| Total Liabilities | 7,877 | | | 7,437 | |
| Commitments and Contingencies | 0 | | 0 |
| Stockholders' Equity | | | |
| Preferred stock, $0.01 par value; 10,000,000 shares authorized; NaN issued | 0 | | | — | |
| Class A, Class B, Class C and Class D common stock, $0.01 par value; 3,000,000,000 shares authorized (Class A 500,000,000, Class B 500,000,000, Class C 1,000,000,000, Class D 1,000,000,000); 201,635,990 shares issued and outstanding (Class A 34,599,645, Class B 42,738,750, Class C 81,558,845, Class D 42,738,750) at December 31, 2020 and 198,819,999 shares issued and outstanding (Class A 34,599,645, Class B 42,738,750, Class C 78,742,854, Class D 42,738,750) at December 31, 2019 | 1 | | | 1 | |
| Additional paid-in capital | 1,922 | | | 1,936 | |
| Accumulated deficit | (84) | | | (72) | |
| Accumulated other comprehensive loss | (14) | | | (15) | |
| Noncontrolling interest | 890 | | | 413 | |
| Total Stockholders' Equity | 2,715 | | | 2,263 | |
| Total Liabilities and Stockholders' Equity | $ | 10,592 | | | $ | 9,700 | |
|
| | | | | | | |
| | December 31, 2017 | | December 31, 2016 (a) |
| ASSETS | (In millions) |
| Current Assets | | | |
| Cash and cash equivalents | $ | 148 |
| | $ | 322 |
|
| Restricted cash | 168 |
| | 176 |
|
| Accounts receivable — trade | 95 |
| | 95 |
|
| Inventory | 39 |
| | 39 |
|
| Notes receivable — current | 13 |
| | 16 |
|
| Prepayments and other current assets | 19 |
| | 22 |
|
| Total current assets | 482 |
| | 670 |
|
| Property, plant and equipment, net | 5,204 |
| | 5,554 |
|
| Other Assets | | | |
| Equity investments in affiliates | 1,178 |
| | 1,152 |
|
| Intangible assets, net | 1,228 |
| | 1,303 |
|
| Deferred income taxes | 128 |
| | 216 |
|
| Other non-current assets | 63 |
| | 67 |
|
| Total other assets | 2,597 |
| | 2,738 |
|
| Total Assets | $ | 8,283 |
| | $ | 8,962 |
|
| LIABILITIES AND STOCKHOLDERS’ EQUITY | | | |
| Current Liabilities | | | |
| Current portion of long-term debt | $ | 306 |
| | $ | 323 |
|
| Accounts payable — trade | 27 |
| | 23 |
|
| Accounts payable — affiliate | 48 |
| | 40 |
|
| Derivative instruments | 17 |
| | 33 |
|
| Accrued expenses and other current liabilities | 88 |
| | 86 |
|
| Total current liabilities | 486 |
| | 505 |
|
| Other Liabilities | | | |
| Long-term debt | 5,531 |
| | 5,726 |
|
| Accounts payable — affiliate | — |
| | 9 |
|
| Derivative instruments | 31 |
| | 46 |
|
| Other non-current liabilities | 97 |
| | 77 |
|
| Total non-current liabilities | 5,659 |
| | 5,858 |
|
| Total Liabilities | 6,145 |
| | 6,363 |
|
| Commitments and Contingencies | | | |
| Stockholders' Equity | | | |
| Preferred stock, $0.01 par value; 10,000,000 shares authorized; none issued | — |
| | — |
|
| Class A, Class B, Class C and Class D common stock, $0.01 par value; 3,000,000,000 shares authorized (Class A 500,000,000, Class B 500,000,000, Class C 1,000,000,000, Class D 1,000,000,000); 184,780,837 shares issued and outstanding (Class A 34,586,250, Class B 42,738,750, Class C 64,717,087, Class D 42,738,750) at December 31, 2017 and 182,848,000 shares issued and outstanding (Class A 34,586,250, Class B 42,738,750, Class C 62,784,250, Class D 42,738,750) at December 31, 2016 | 1 |
| | 1 |
|
| Additional paid-in capital | 1,843 |
| | 1,879 |
|
| Accumulated deficit | (69 | ) | | (2 | ) |
| Accumulated other comprehensive loss | (28 | ) | | (28 | ) |
| Noncontrolling interest | 391 |
| | 749 |
|
| Total Stockholders' Equity | 2,138 |
| | 2,599 |
|
| Total Liabilities and Stockholders' Equity | $ | 8,283 |
| | $ | 8,962 |
|
(a) Retrospectively adjusted as discussed in Note 1, Nature of Business.
See accompanying notes to consolidated financial statements.
NRG YIELD,CLEARWAY ENERGY, INC.
CONSOLIDATED STATEMENTS OF CASH FLOWS
|
| | | | | | | | | | | |
| | Year ended December 31, |
| | 2017 | | 2016 (a) | | 2015 (a) |
| Cash Flows from Operating Activities | (In millions) |
| Net (loss) income | $ | (23 | ) | | $ | 2 |
| | $ | 72 |
|
| Adjustments to reconcile net income to net cash provided by operating activities: | | | | | |
| Equity in earnings of unconsolidated affiliates | (71 | ) | | (60 | ) | | (31 | ) |
| Distributions from unconsolidated affiliates | 72 |
| | 58 |
| | 60 |
|
| Depreciation and amortization | 334 |
| | 303 |
| | 303 |
|
| Amortization of financing costs and debt discounts | 25 |
| | 20 |
| | 16 |
|
| Amortization of intangibles and out-of-market contracts | 70 |
| | 76 |
| | 55 |
|
| Loss on debt extinguishment | 3 |
| | — |
| | 9 |
|
| Change in deferred income taxes | 72 |
| | (1 | ) | | 12 |
|
| Impairment losses | 44 |
| | 185 |
| | 1 |
|
| Changes in derivative instruments | (16 | ) | | (15 | ) | | (44 | ) |
| Loss on disposal of asset components | 16 |
| | 6 |
| | 3 |
|
| Cash provided by (used in) changes in other working capital: | | | | | |
| Changes in prepaid and accrued capacity payments | (4 | ) | | (8 | ) | | (12 | ) |
| Changes in other working capital | (6 | ) | | 11 |
| | (19 | ) |
| Net Cash Provided by Operating Activities | 516 |
| | 577 |
|
| 425 |
|
| Cash Flows from Investing Activities | | | | | |
| Acquisition of businesses, net of cash acquired | — |
| | — |
| | (37 | ) |
| Acquisition of Drop Down Assets, net of cash acquired | (250 | ) | | (77 | ) | | (698 | ) |
| Capital expenditures | (31 | ) | | (20 | ) | | (29 | ) |
| Cash receipts from notes receivable | 17 |
| | 17 |
| | 17 |
|
| Return of investment from unconsolidated affiliates | 47 |
| | 28 |
| | 42 |
|
| Investments in unconsolidated affiliates | (73 | ) | | (83 | ) | | (402 | ) |
| Other | 7 |
| | 4 |
| | 9 |
|
| Net Cash Used in Investing Activities | (283 | ) | | (131 | ) |
| (1,098 | ) |
| Cash Flows from Financing Activities | | | | | |
| Net contributions from noncontrolling interests | 13 |
| | 5 |
| | 122 |
|
| Net distributions and return of capital to NRG prior to the acquisition of Drop Down Assets | (20 | ) | | (184 | ) | | (79 | ) |
| Proceeds from the issuance of common stock | 34 |
| | — |
| | 599 |
|
| Payments of dividends and distributions | (202 | ) | | (173 | ) | | (139 | ) |
| Proceeds from the revolving credit facility | 55 |
| | 60 |
| | 551 |
|
| Payments for the revolving credit facility | — |
| | (366 | ) | | (245 | ) |
| Proceeds from issuance of long-term debt | 41 |
| | 740 |
| | 293 |
|
| Payments of debt issuance costs | (4 | ) | | (15 | ) | | (13 | ) |
| Payments for long-term debt | (332 | ) | | (269 | ) | | (735 | ) |
| Net Cash (Used in) Provided by Financing Activities | (415 | ) | | (202 | ) | | 354 |
|
| Net (Decrease) Increase in Cash and Cash Equivalents | (182 | ) | | 244 |
| | (319 | ) |
| Cash, Cash Equivalents and Restricted Cash at Beginning of Period | 498 |
| | 254 |
| | 573 |
|
| Cash, Cash Equivalents and Restricted Cash at End of Period | $ | 316 |
| | $ | 498 |
| | $ | 254 |
|
| | | | | | |
| Supplemental Disclosures | | | | | |
| Interest paid, net of amount capitalized | $ | (297 | ) | | $ | (271 | ) | | $ | (279 | ) |
| Non-cash investing and financing activities: | | | | | |
| Additions to fixed assets for accrued capital expenditures | 4 |
| | 3 |
| | 3 |
|
| Decrease to fixed assets for deferred tax asset | — |
| | — |
| | 19 |
|
| Non-cash adjustment for change in tax basis of assets | (20 | ) | | 44 |
| | 38 |
|
| Non-cash return of capital and distributions to NRG, net of contributions | $ | (2 | ) | | $ | 65 |
| | $ | (9 | ) |
(a) Retrospectively adjusted as discussed in Note 1, Nature of Business.
| | | | | | | | | | | | | | | | | |
| Year ended December 31, |
| 2020 | | 2019 | | 2018 |
| Cash Flows from Operating Activities | (In millions) |
| Net (loss) income | $ | (62) | | | $ | (96) | | | $ | 54 | |
| Adjustments to reconcile net (loss) income to net cash provided by operating activities: | | | | | |
| Equity in earnings of unconsolidated affiliates | (7) | | | (83) | | | (74) | |
| Distributions from unconsolidated affiliates | 61 | | | 34 | | | 70 | |
| Depreciation, amortization and accretion | 428 | | | 401 | | | 335 | |
| Amortization of financing costs and debt discounts | 15 | | | 17 | | | 24 | |
| Amortization of intangibles and out-of-market contracts | 90 | | | 71 | | | 70 | |
| Loss on debt extinguishment | 24 | | | 16 | | | 7 | |
| Reduction in carrying amount of right-of-use assets | 4 | | | 7 | | | 0 | |
| Gain on sale of unconsolidated affiliate | (49) | | | 0 | | | 0 | |
| Impairment losses | 32 | | | 33 | | | 0 | |
| Change in deferred income taxes | 8 | | | (8) | | | 62 | |
| Changes in derivative instruments | 44 | | | 85 | | | (16) | |
| Loss on disposal of asset components | 3 | | | 9 | | | 0 | |
| Cash used in changes in other working capital | | | | | |
| Changes in prepaid and accrued liabilities for tolling agreements | (1) | | | 1 | | | 0 | |
| Changes in other working capital | (45) | | | (10) | | | (34) | |
| Net Cash Provided by Operating Activities | 545 | | | 477 | | | 498 | |
| Cash Flows from Investing Activities | | | | | |
| Acquisitions | 0 | | | (100) | | | (11) | |
| Partnership interest acquisition | 0 | | | (29) | | | 0 | |
| Acquisition of Drop Down Assets, net of cash acquired | (122) | | | (161) | | | (126) | |
| Buyout of Wind TE Holdco noncontrolling interest | 0 | | | (19) | | | 0 | |
| Capital expenditures | (124) | | | (228) | | | (83) | |
| Cash receipts from notes receivable | 0 | | | 0 | | | 13 | |
| Return of investment from unconsolidated affiliates | 79 | | | 56 | | | 45 | |
| Investments in unconsolidated affiliates | (11) | | | (13) | | | (34) | |
| Proceeds from sale of assets | 90 | | | 20 | | | 0 | |
| Consolidation of DGPV Holdco 3 LLC | 17 | | | 0 | | | 0 | |
| | | | | |
| Other | 9 | | | 6 | | | 11 | |
| Net Cash Used in Investing Activities | (62) | | | (468) | | | (185) | |
| Cash Flows from Financing Activities | | | | | |
| Net contributions from noncontrolling interests | 247 | | | 174 | | | 91 | |
| Buyout of Repowering Partnership II LLC noncontrolling interest | (70) | | | 0 | | | 0 | |
| Proceeds from the issuance of common stock | 62 | | | 100 | | | 153 | |
| Payments of dividends and distributions | (211) | | | (155) | | | (238) | |
| Proceeds from the revolving credit facility | 265 | | | 152 | | | 35 | |
| Payments for the revolving credit facility | (265) | | | (152) | | | (90) | |
| Proceeds from issuance of long-term debt | 1,084 | | | 1,215 | | | 827 | |
| Payments of debt issuance costs | (20) | | | (25) | | | (14) | |
| Payments for long-term debt | (1,527) | | | (1,484) | | | (810) | |
| Net Cash Used in Financing Activities | (435) | | | (175) | | | (46) | |
| Net Increase (Decrease) in Cash, Cash Equivalents and Restricted Cash | 48 | | | (166) | | | 267 | |
| Cash, Cash Equivalents and Restricted Cash at Beginning of Period | 417 | | | 583 | | | 316 | |
| Cash, Cash Equivalents and Restricted Cash at End of Period | $ | 465 | | | $ | 417 | | | $ | 583 | |
| | | | | |
| Supplemental Disclosures | | | | | |
| Interest paid, net of amount capitalized | $ | (325) | | | $ | (313) | | | $ | (292) | |
| Non-cash investing and financing activities: | | | | | |
| Reductions to fixed assets for accrued capital expenditures | (18) | | | (2) | | | (15) | |
| Non-cash adjustment for change in tax basis | 21 | | | 28 | | | (7) | |
| Non-cash contributions from CEG, NRG, net of distributions | $ | 6 | | | $ | 36 | | | $ | 38 | |
See accompanying notes to consolidated financial statements.statements
NRG YIELD,CLEARWAY ENERGY, INC.
CONSOLIDATED STATEMENTS OF STOCKHOLDERS' EQUITY
|
| | | | | | | | | | | | | | | | | | | | | | | | | | | |
| (In millions) | Preferred Stock | | Common Stock | | Additional Paid-In Capital | | Retained Earnings | | Accumulated Other Comprehensive Loss | | Noncontrolling Interest | | Total Stockholders' Equity |
Balances at December 31, 2014 (a) | $ | — |
| | $ | — |
| | $ | 1,240 |
| | $ | 3 |
| | $ | (9 | ) | | $ | 1,610 |
| | $ | 2,844 |
|
| Members' equity - Acquired Drop Down Assets | — |
| | — |
| | — |
| | — |
| | — |
| | 62 |
| | 62 |
|
| Balances at December 31, 2014 | — |
| | — |
| | 1,240 |
| | 3 |
| | (9 | ) | | 1,672 |
| | 2,906 |
|
Net income (b) | — |
| | — |
| | — |
| | 33 |
| | — |
| | 39 |
| | 72 |
|
| Unrealized (loss) gain on derivatives, net of tax | — |
| | — |
| | — |
| | — |
| | (18 | ) | | 11 |
| | (7 | ) |
| Payments for January 2015 and November 2015 Drop Down Assets | — |
| | — |
| | — |
| | — |
| | — |
| | (698 | ) | | (698 | ) |
Distributions and returns of capital to NRG, net of contributions, cash (b) | — |
| | — |
| | — |
| | — |
| | — |
| | (79 | ) | | (79 | ) |
Distributions and return of capital to NRG, net of contributions, non-cash (b) | — |
| | — |
| | — |
| | — |
| | — |
| | (9 | ) | | (9 | ) |
| Capital contributions from tax equity investors, cash | — |
| | — |
| | — |
| | — |
| | — |
| | 122 |
| | 122 |
|
| Noncontrolling interest acquired in Spring Canyon acquisition | — |
| | — |
| | — |
| | — |
| | — |
| | 74 |
| | 74 |
|
| Stock-based compensation | — |
| | — |
| | 1 |
| | — |
| | — |
| | — |
| | 1 |
|
| Proceeds from the issuance of Class A common stock | — |
| | 1 |
| | 598 |
| | — |
| | — |
| | — |
| | 599 |
|
| Non-cash adjustment for change in tax basis of property, plant and equipment | — |
| | — |
| | 38 |
| | — |
| | — |
| | — |
| | 38 |
|
| Equity portion of the 2020 Convertible Notes | — |
| | — |
| | 23 |
| | — |
| | — |
| | — |
| | 23 |
|
| Common stock dividends | — |
| | — |
| | (45 | ) | | (24 | ) | | — |
| | (70 | ) | | (139 | ) |
| Balances at December 31, 2015 | $ | — |
| | $ | 1 |
| | $ | 1,855 |
| | $ | 12 |
| | $ | (27 | ) | | $ | 1,062 |
| | $ | 2,903 |
|
Net income (loss) (b) | — |
| | — |
| | — |
| | 57 |
| | — |
| | (51 | ) | | 6 |
|
| Pre-acquisition net loss of acquired Drop Down Assets | — |
| | — |
| | — |
| | — |
| | — |
| | (4 | ) | | (4 | ) |
| Unrealized (loss) gain on derivatives, net of tax | — |
| | — |
| | — |
| | — |
| | (1 | ) | | 14 |
| | 13 |
|
| Payment for CVSR Drop Down Asset | — |
| | — |
| | — |
| | — |
| | — |
| | (77 | ) | | (77 | ) |
| Capital contributions from tax equity investors, net of distributions, cash | — |
| | — |
| | — |
| | — |
| | — |
| | 5 |
| | 5 |
|
Distributions and return of capital to NRG, net of contributions, cash (b) | — |
| | — |
| | — |
| | — |
| | — |
| | (184 | ) | | (184 | ) |
Distributions and return of capital to NRG, net of contributions, non-cash (b) | — |
| | — |
| | — |
| | — |
| | — |
| | 65 |
| | 65 |
|
| Stock-based compensation | — |
| | — |
| | 1 |
| | — |
| | — |
| | — |
| | 1 |
|
| Non-cash adjustment for change in tax basis of property, plant and equipment | — |
| | — |
| | 44 |
| | — |
| | — |
| | — |
| | 44 |
|
| Common stock dividends | — |
| | — |
| | (21 | ) | | (71 | ) | | — |
| | (81 | ) | | (173 | ) |
| Balances as of December 31, 2016 | $ | — |
| | 1 |
| | $ | 1,879 |
| | $ | (2 | ) | | $ | (28 | ) | | $ | 749 |
| | $ | 2,599 |
|
| Net loss | — |
| | — |
| | — |
| | (16 | ) | | — |
| | (15 | ) | | (31 | ) |
| Pre-acquisition net income of acquired Drop Down Assets | — |
| | — |
| | — |
| | — |
| | — |
| | 8 |
| | 8 |
|
| Unrealized gain on derivatives, net of tax | — |
| | — |
| | — |
| | — |
| | — |
| | 10 |
| | 10 |
|
| Cumulative effect of change in accounting principle | — |
| | — |
| | — |
| | 5 |
| | — |
| | — |
| | 5 |
|
| Payments for the March 2017, August 2017 and November 2017 Drop Down Assets | — |
| | — |
| | — |
| | — |
| | — |
| | (250 | ) | | (250 | ) |
| August 2017 Drop Down Assets contingent consideration | — |
| | — |
| | — |
| | — |
| | — |
| | (8 | ) | | (8 | ) |
| Capital contributions from tax equity investors, net of distributions, cash | — |
| | — |
| | — |
| | — |
| | — |
| | 11 |
| | 11 |
|
| Distributions and return of capital to NRG, net of contributions, cash | — |
| | — |
| | — |
| | — |
| | — |
| | (18 | ) | | (18 | ) |
| Distributions and return of capital to NRG, net of contributions, non-cash | — |
| | — |
| | — |
| | — |
| | — |
| | (2 | ) | | (2 | ) |
| Stock-based compensation | — |
| | — |
| | 2 |
| | — |
| | — |
| | — |
| | 2 |
|
| Proceeds from the issuance of Class C Common Stock | — |
| | — |
| | 34 |
| | — |
| | — |
| | — |
| | 34 |
|
| Non-cash adjustment for change in tax basis of assets | — |
| | — |
| | (20 | ) | | — |
| | — |
| | — |
| | (20 | ) |
| Common stock dividends | — |
| | — |
| | (52 | ) | | (56 | ) | | — |
| | (94 | ) | | (202 | ) |
| Balances as of December 31, 2017 | $ | — |
| | 1 |
| | $ | 1,843 |
| | $ | (69 | ) | | $ | (28 | ) | | $ | 391 |
| | $ | 2,138 |
|
(a) As previously reported in the Company's consolidated financial statements for the year ended December 31, 2016, included in the Company's May 9, 2017 Form 8-K.
(b) Retrospectively adjusted as discussed in Note 1, Nature of Business. | | | | | | | | | | | | | | | | | | | | | | | | | | | | | | | | | | | | | | | | | |
| (In millions) | Preferred Stock | | Common Stock | | Additional
Paid-In
Capital | | Accumulated Deficit | | Accumulated
Other
Comprehensive Loss | | Non-controlling
Interest | | Total
Stockholders'
Equity |
| | | | | | | | | | | | | |
| | | | | | | | | | | | | |
| Balances at December 31, 2017 | $ | 0 | | | $ | 1 | | | $ | 1,843 | | | $ | (69) | | | $ | (28) | | | $ | 412 | | | $ | 2,159 | |
| Net income | — | | | — | | | — | | | 48 | | | — | | | 2 | | | 50 | |
| Pre-acquisition net loss of acquired Drop Down Assets | — | | | — | | | — | | | — | | | — | | | 4 | | | 4 | |
| Unrealized gain on derivatives, net of tax | — | | | — | | | — | | | — | | | 10 | | | 12 | | | 22 | |
| | | | | | | | | | | | | |
| Payments for the Buckthorn Solar Drop Down Asset and UPMC | — | | | — | | | 1 | | | — | | | — | | | (53) | | | (52) | |
| Equity component of tendered 2020 Convertible Notes and 2019 Convertible Notes | — | | | — | | | (3) | | | — | | | — | | | 0 | | | (3) | |
| Capital contributions from tax equity investors, net of distributions, cash | — | | | — | | | — | | | — | | | — | | | 106 | | | 106 | |
| Distributions and return of capital to NRG, net of contributions, cash | — | | | — | | | — | | | — | | | — | | | (11) | | | (11) | |
| Distributions and return of capital to NRG, net of contributions, non-cash | — | | | — | | | — | | | — | | | — | | | 38 | | | 38 | |
| Stock-based compensation | — | | | — | | | 4 | | | (1) | | | — | | | — | | | 3 | |
| Proceeds from the issuance of Class C common stock | — | | | — | | | 153 | | | — | | | — | | | — | | | 153 | |
| Non-cash adjustment for change in tax basis of property, plant and equipment | — | | | — | | | (7) | | | — | | | — | | | — | | | (7) | |
| | | | | | | | | | | | | |
| Common stock dividends | — | | | — | | | (94) | | | (36) | | | — | | | (108) | | | (238) | |
| Balances at December 31, 2018 | $ | 0 | | | $ | 1 | | | $ | 1,897 | | | $ | (58) | | | $ | (18) | | | $ | 402 | | | $ | 2,224 | |
| Net loss | — | | | — | | | — | | | (11) | | | — | | | (85) | | | (96) | |
| Unrealized gain on derivatives, net of tax | — | | | — | | | — | | | — | | | 3 | | | 4 | | | 7 | |
| Buyout of Wind TE Holdco non-controlling interest | — | | | — | | | (5) | | | — | | | — | | | (14) | | | (19) | |
| Carlsbad Drop Down | — | | | — | | | — | | | — | | | — | | | (35) | | | (35) | |
| Contributions from tax equity interests, net of distributions, cash | — | | | — | | | — | | | — | | | — | | | 242 | | | 242 | |
| Distributions to CEG, net of contributions, cash | — | | | — | | | — | | | — | | | — | | | (68) | | | (68) | |
| Cumulative effect of change in the accounting principle | — | | | — | | | — | | | (2) | | | — | | | (1) | | | (3) | |
| Contributions from CEG net of distributions, non-cash | — | | | — | | | — | | | — | | | — | | | 36 | | | 36 | |
| Stock-based compensation | — | | | — | | | 3 | | | (1) | | | — | | | — | | | 2 | |
| Proceeds from the issuance of Class C Common Stock | — | | | — | | | 100 | | | — | | | — | | | — | | | 100 | |
| Non-cash adjustment for change in tax basis | — | | | — | | | 28 | | | — | | | — | | | — | | | 28 | |
| Common stock dividends | — | | | — | | | (87) | | | — | | | — | | | (68) | | | (155) | |
| Balances at December 31, 2019 | $ | 0 | | | $ | 1 | | | $ | 1,936 | | | $ | (72) | | | $ | (15) | | | $ | 413 | | | $ | 2,263 | |
| Net income (loss) | — | | | — | | | — | | | 25 | | | — | | | (87) | | | (62) | |
| Unrealized gain on derivatives, net of tax | — | | | — | | | — | | | — | | | 1 | | | — | | | 1 | |
| Contributions from CEG, non-cash | — | | | — | | | — | | | — | | | — | | | 6 | | | 6 | |
| Contributions from CEG, cash | — | | | — | | | — | | | — | | | — | | | 6 | | | 6 | |
| Distributions to noncontrolling interests, non-cash | — | | | — | | | — | | | — | | | — | | | (2) | | | (2) | |
| Contributions from noncontrolling interests, net of distributions, cash | — | | | — | | | — | | | — | | | — | | | 240 | | | 240 | |
| | | | | | | | | | | | | |
| DGPV Drop Down and Consolidation | — | | | — | | | — | | | — | | | — | | | (20) | | | (20) | |
| | | | | | | | | | | | | |
| Mesquite Star Drop Down and Consolidation | — | | | — | | | — | | | — | | | — | | | 361 | | | 361 | |
| Langford Drop Down | — | | | — | | | — | | | — | | | — | | | 76 | | | 76 | |
| Rosamond Central Drop Down | — | | | — | | | — | | | — | | | — | | | 57 | | | 57 | |
| Lighthouse Partnership Yield Protection Agreement | — | | | — | | | (15) | | | — | | | — | | | — | | | (15) | |
| Buyout of Repowering Partnership II LLC non-controlling interest | — | | | — | | | — | | | — | | | — | | | (70) | | | (70) | |
| Stock-based compensation | — | | | — | | | 2 | | | 0 | | | — | | | — | | | 2 | |
| Non-cash adjustment for change in tax basis | — | | | — | | | 21 | | | — | | | — | | | — | | | 21 | |
| Net proceeds from the issuance of common stock under the ATM Programs | — | | | — | | | 62 | | | — | | | — | | | — | | | 62 | |
| Common stock dividends and distributions to CEG | — | | | — | | | (84) | | | (37) | | | — | | | (90) | | | (211) | |
| Balances at December 31, 2020 | $ | 0 | | | $ | 1 | | | $ | 1,922 | | | $ | (84) | | | $ | (14) | | | $ | 890 | | | $ | 2,715 | |
See accompanying notes to consolidated financial statements.
NRG YIELD,CLEARWAY ENERGY, INC.
NOTES TO CONSOLIDATED FINANCIAL STATEMENTS
Note 1 — Nature of Business
The Company was formed by NRG as a Delaware corporation on December 20, 2012 and closed its initial public offering on July 22, 2013. In connectionClearway Energy, Inc., together with its initial public offering,consolidated subsidiaries, or the Company's shares of Class A common stock began trading on the New York Stock Exchange under the symbol “NYLD.”
The Company, is a publicly-traded energy infrastructure investor in and owner of modern, sustainable and long-term contracted assets across North America. On August 31, 2018, NRG Energy, Inc., or NRG, transferred its full ownership interest in the sole managing memberCompany to Clearway Energy Group LLC, or CEG, the holder of NRG Yield LLCNRG's renewable energy development and operatesoperations platform, and controls allsubsequently sold 100% of its business and affairs and consolidatesinterest in CEG to GIP, referred to hereinafter as the financial results of NRG Yield LLC and its subsidiaries. NRG Yield LLC is a holding company for the companies that directly and indirectly own and operate the Company's business.GIP Transaction. As a result of the currentGIP Transaction, GIP indirectly acquired a 45.2% economic interest in Clearway Energy LLC and a 55% voting interest in the Company. GIP is an independent fund manager that invests in infrastructure assets in energy and transport sectors. The Company is sponsored by GIP through its portfolio company, CEG.
The Company is one of the largest renewable energy owners in the U.S. with over 4,200 net MW of installed wind and solar generation projects. The Company also owns approximately 2,500 net MW of environmentally-sound, highly efficient generation facilities as well as a portfolio of district energy systems. Through this environmentally-sound, diversified and primarily contracted portfolio, the Company endeavors to provide its investors with stable and growing dividend income.Substantially all of the Company's generation assets are under long-term contractual arrangements for the output or capacity from these assets.
The Company consolidates the results of Clearway Energy LLC through its controlling interest, with CEG's interest shown as non-controlling interest in the financial statements. The holders of the Company's outstanding shares of Class A and Class C common stock are entitled to dividends as declared. CEG receives its distributions from Clearway Energy LLC through its ownership of theClearway Energy LLC Class B common stock and Class D common stock, NRG continues atunits.
The Company owns 57.61% of the present time to controleconomic interests of Clearway Energy LLC, with CEG retaining 42.39% of the Company, and the Company in turn,economic interests of Clearway Energy LLC as the sole managing member of NRG Yield LLC, controls NRG Yield LLC and its subsidiaries.December 31, 2020. For further discussion, see Note 12, Stockholders' Equity.
The following table represents the structure of the Company as of December 31, 2017:2020:
On July 12, 2017, NRG announced that it had adopted and initiated a three-year, three-part improvement plan, or the NRG Transformation Plan. As part of the NRG Transformation Plan, NRG announced that it is exploring strategic alternatives for its renewables platform and its interest in the Company. NRG, through its holdings of Class B common stock and Class D common stock, has a 55.1% voting interest in the Company and receives distributions from NRG Yield LLC through its ownership of Class B units and Class D units.
On February 6, 2018, Global Infrastructure Partners, or GIP, entered into a purchase and sale agreement with NRG, or the NRG Transaction, for the acquisition of NRG's full ownership interests in the Company and NRG's renewable development and operations platform. The NRG Transaction is subject to certain closing conditions, including customary legal and regulatory approvals. The Company expects the NRG Transaction to close in the second half of 2018. NRG is the Company's controlling stockholder and the Company has been highly dependent on NRG for, among other things, growth opportunities and management and administration services. See Part I, Item 1A, Risk Factors for risks related to the Strategic Sponsorship with GIP and the Company's relationship with NRG.
As of December 31, 2017, the Company's operating assets are comprised of the following projects:
|
| | | | | | | | | | |
| Projects | | Percentage Ownership | | Net Capacity (MW) (a) | | Offtake Counterparty | | Expiration |
| Conventional | | | | | | | | |
| El Segundo | | 100 | % | | 550 |
| | Southern California Edison | | 2023 |
| GenConn Devon | | 50 | % | | 95 |
| | Connecticut Light & Power | | 2040 |
| GenConn Middletown | | 50 | % | | 95 |
| | Connecticut Light & Power | | 2041 |
| Marsh Landing | | 100 | % | | 720 |
| | Pacific Gas and Electric | | 2023 |
| Walnut Creek | | 100 | % | | 485 |
| | Southern California Edison | | 2023 |
| | | | | 1,945 |
| | | | |
| Utility Scale Solar | | | | | | | | |
| Agua Caliente | | 16 | % | | 46 |
| | Pacific Gas and Electric | | 2039 |
| Alpine | | 100 | % | | 66 |
| | Pacific Gas and Electric | | 2033 |
| Avenal | | 50 | % | | 23 |
| | Pacific Gas and Electric | | 2031 |
| Avra Valley | | 100 | % | | 26 |
| | Tucson Electric Power | | 2032 |
| Blythe | | 100 | % | | 21 |
| | Southern California Edison | | 2029 |
| Borrego | | 100 | % | | 26 |
| | San Diego Gas and Electric | | 2038 |
| CVSR | | 100 | % | | 250 |
| | Pacific Gas and Electric | | 2038 |
| Desert Sunlight 250 | | 25 | % | | 63 |
| | Southern California Edison | | 2034 |
| Desert Sunlight 300 | | 25 | % | | 75 |
| | Pacific Gas and Electric | | 2039 |
| Kansas South | | 100 | % | | 20 |
| | Pacific Gas and Electric | | 2033 |
| Roadrunner | | 100 | % | | 20 |
| | El Paso Electric | | 2031 |
| TA High Desert | | 100 | % | | 20 |
| | Southern California Edison | | 2033 |
Utah Solar Portfolio(b)(e) | | 50 | % | | 265 |
| | PacifiCorp | | 2036 |
| | | | | 921 |
| | | | |
| Distributed Solar | | | | | | | | |
| Apple I LLC Projects | | 100 | % | | 9 |
| | Various | | 2032 |
| AZ DG Solar Projects | | 100 | % | | 5 |
| | Various | | 2025-2033 |
| SPP Projects | | 100 | % | | 25 |
| | Various | | 2026-2037 |
| Other DG Projects | | 100 | % | | 13 |
| | Various | | 2023-2039 |
| | | | | 52 |
| | | | |
| Wind | | | | | | | | |
| Alta I | | 100 | % | | 150 |
| | Southern California Edison | | 2035 |
| Alta II | | 100 | % | | 150 |
| | Southern California Edison | | 2035 |
| Alta III | | 100 | % | | 150 |
| | Southern California Edison | | 2035 |
| Alta IV | | 100 | % | | 102 |
| | Southern California Edison | | 2035 |
| Alta V | | 100 | % | | 168 |
| | Southern California Edison | | 2035 |
Alta X (b) | | 100 | % | | 137 |
| | Southern California Edison | | 2038 |
Alta XI (b) | | 100 | % | | 90 |
| | Southern California Edison | | 2038 |
| Buffalo Bear | | 100 | % | | 19 |
| | Western Farmers Electric Co-operative | | 2033 |
Crosswinds (b)(f) | | 99 | % | | 21 |
| | Corn Belt Power Cooperative | | 2027 |
Elbow Creek (b)(f) | | 100 | % | | 122 |
| | NRG Power Marketing LLC | | 2022 |
Elkhorn Ridge (b)(f) | | 66.7 | % | | 54 |
| | Nebraska Public Power District | | 2029 |
Forward (b)(f) | | 100 | % | | 29 |
| | Constellation NewEnergy, Inc. | | 2022 |
Goat Wind (b)(f) | | 100 | % | | 150 |
| | Dow Pipeline Company | | 2025 |
Hardin (b)(f) | | 99 | % | | 15 |
| | Interstate Power and Light Company | | 2027 |
|
| | | | | | | | | | |
| Projects | | Percentage Ownership | | Net Capacity (MW) (a) | | Offtake Counterparty | | Expiration |
| Laredo Ridge | | 100 | % | | 80 |
| | Nebraska Public Power District | | 2031 |
Lookout (b)(f) | | 100 | % | | 38 |
| | Southern Maryland Electric Cooperative | | 2030 |
Odin (b)(f) | | 99.9 | % | | 20 |
| | Missouri River Energy Services | | 2028 |
| Pinnacle | | 100 | % | | 55 |
| | Maryland Department of General Services and University System of Maryland | | 2031 |
San Juan Mesa (b)(f) | | 75 | % | | 90 |
| | Southwestern Public Service Company | | 2025 |
Sleeping Bear (b)(f) | | 100 | % | | 95 |
| | Public Service Company of Oklahoma | | 2032 |
| South Trent | | 100 | % | | 101 |
| | AEP Energy Partners | | 2029 |
Spanish Fork (b)(f) | | 100 | % | | 19 |
| | PacifiCorp | | 2028 |
Spring Canyon II (b) | | 90.1 | % | | 29 |
| | Platte River Power Authority | | 2039 |
Spring Canyon III (b) | | 90.1 | % | | 25 |
| | Platte River Power Authority | | 2039 |
| Taloga | | 100 | % | | 130 |
| | Oklahoma Gas & Electric | | 2031 |
Wildorado (b)(f) | | 100 | % | | 161 |
| | Southwestern Public Service Company | | 2027 |
| | | | | 2,200 |
| | | | |
| Thermal | | | | | | | | |
| NRG Energy Center Dover LLC | | 100 | % | | 103 |
| | NRG Power Marketing LLC | | 2018 |
| Thermal generation | | 100 | % | | 20 |
| | Various | | Various |
| | | | | 123 |
| | | | |
Total net generation capacity(c) | | | | 5,241 |
| | | | |
| | | | | | | | | |
Thermal equivalent MWt(d) | | 100 | % | | 1,319 |
| | Various | | Various |
(a) Net capacity represents the maximum, or rated, generating capacity of the facility multiplied by the Company's percentage ownership in the facility as of December 31, 2017.
(b) Projects are part of tax equity arrangements.
(c) The Company's total generation capacity is net of 6 MWs for noncontrolling interest for Spring Canyon II and III. The Company's generation capacity including this noncontrolling interest was 5,247.
(d) For thermal energy, net capacity represents MWt for steam or chilled water and excludes 134 MWt available under the right-to-use provisions contained in agreements between two of the Company's thermal facilities and certain of its customers.
(e) Represents interests in Four Brothers Solar, LLC, Granite Mountain Holdings, LLC, and Iron Springs Holdings, LLC, all acquired as part of the March 2017 Drop Down Assets acquisition (ownership percentage is based upon cash to be distributed).
(f) Projects are part of NRG Wind TE Holdco portfolio.
In addition to the facilities owned or leased in the table above, the Company entered into partnerships to own or purchase solar power generation projects, as well as other ancillary related assets from a related party via intermediate funds. The Company does not consolidate these partnerships and accounts for them as equity method investments. The Company's net interest in these projects is 247 MW based on cash to be distributed as of December 31, 2017. For further discussions, refer to Note 5, Investments Accounted for by the Equity Method and Variable Interest Entities to the Consolidated Financial Statements.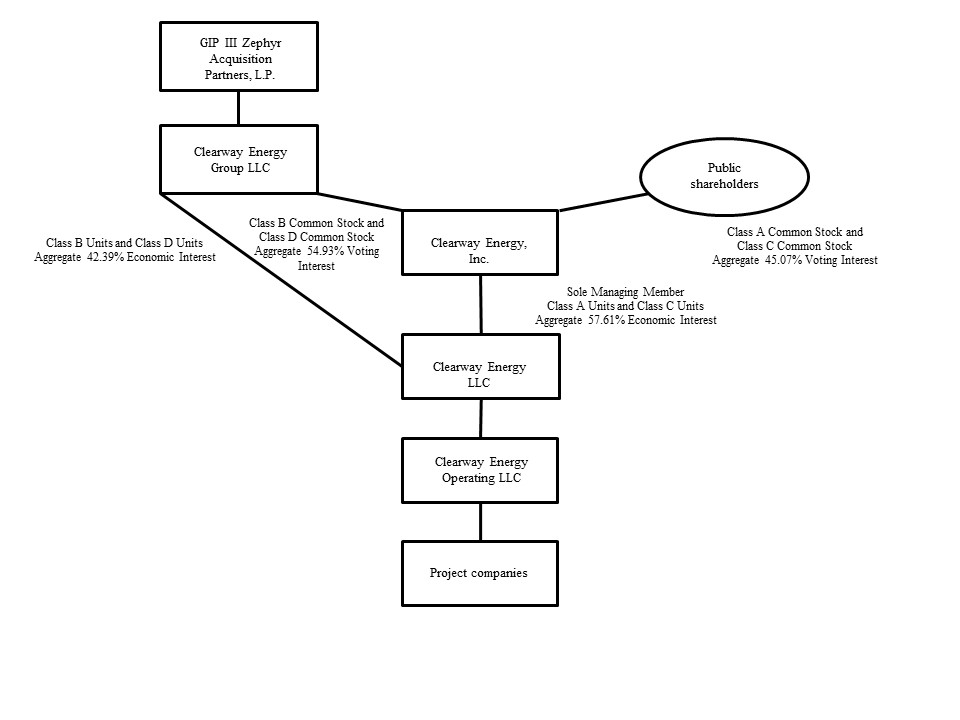
Substantially all of the Company's generation assets are under long-term contractual arrangements for the output or capacity from these assets. The thermal assets are comprised of district energy systems and combined heat and power plants that produce steam, hot water and/or chilled water and, in some instances, electricity at a central plant. Certain district energy systems are subject to rate regulation by state public utility commissions (although they may negotiate certain rates) while the other district energy systems have rates determined by negotiated bilateral contracts.
As described in Note 15, Related Party Transactions to the Consolidated Financial Statements, the Company has a management services agreement with NRG for various services, including human resources, accounting, tax, legal, information systems, treasury, and risk management.
Stockholders' equity represents the equity associated with the Class A and Class C common stockholders, the equity associated with the Class B and Class D common stockholder, NRG, and the third-party interests under certain tax equity arrangements are classified as noncontrolling interest.
During the years ending December 31, 2017 and 2016, the Company completed four acquisitions of Drop Down Assets from NRG. The accounting guidance requires retrospective combination of the entities for all periods presented as if the combination has been in effect from the beginning of the financial statement period or from the date the entities were under common control (if later than the beginning of the financial statement period). For further discussion, see Note 3, Business Acquisitions to the Consolidated Financial Statements.
Note 2 — Summary of Significant Accounting Policies
Basis of Presentation and Principles of Consolidation
The Company's consolidated financial statements have been prepared in accordance with GAAP. The ASC is the source of authoritative GAAP to be applied by nongovernmental entities. In addition, the rules and interpretative releases of the SEC under authority of federal securities laws are also sources of authoritative GAAP for SEC registrants.
The consolidated financial statements include the Company's accounts and operations and those of its subsidiaries in which it has a controlling interest. All significant intercompany transactions and balances have been eliminated in consolidation. The usual condition for a controlling financial interest is ownership of a majority of the voting interests of an entity. However, a controlling financial interest may also exist through arrangements that do not involve controlling voting interests. As such, the Company applies the guidance of ASC 810, Consolidations, or ASC 810, to determine when an entity that is insufficiently capitalized or not controlled through its voting interests, referred to as a variable interest entity, or VIE, should be consolidated.
Cash and Cash Equivalents, and Restricted Cash
Cash and cash equivalents include highly liquid investments with an original maturity of three months or less at the time of purchase. Cash and cash equivalents held at project subsidiaries was $124$149 million and $111$125 million as of December 31, 20172020 and 2016,2019, respectively.
Restricted Cash
The following table provides a reconciliation of cash, cash equivalents and restricted cash reported within the consolidated balance sheets that sum to the total of the same such amounts shown in the statements of cash flows.
| | | | Year Ended December 31, | | Year ended December 31, |
| | 2017 | | 2016 | | 2015 | | 2020 | | 2019 | |
| | (In millions) | | (In millions) |
| Cash and cash equivalents | $ | 148 |
| | $ | 322 |
| | $ | 111 |
| Cash and cash equivalents | $ | 268 | | | $ | 155 | | |
| Restricted cash | 168 |
| | 176 |
| | 143 |
| Restricted cash | 197 | | | 262 | | |
| Cash, cash equivalents and restricted cash shown in the statement of cash flows | 316 |
| | 498 |
| | 254 |
| |
| Cash, cash equivalents and restricted cash shown in the statements of cash flows | | Cash, cash equivalents and restricted cash shown in the statements of cash flows | $ | 465 | | | $ | 417 | | |
Restricted cash consists primarily of funds held to satisfy the requirements of certain debt agreements and funds held within the Company's projects that are restricted in their use. Of these funds asAs of December 31, 2017,2020, these restricted funds comprised of $73 million designated to fund operating expenses, approximately $25$24 million is designated for current debt service payments, $25 million is designated to fund operating expenses and $36 million is designated for distributions to the Company, with the remaining $82$45 million restricted for reserves including debt service, performance obligations and other reserves, as well as capital expenditures. The remaining $55 million is held in distributions reserve accounts.
Accounts Receivable — Trade Receivables and Allowance for Doubtful Accounts
Trade receivablesAccounts receivable — trade are reported on the balance sheet at the invoiced amount adjusted for any write-offs and the allowance for doubtful accounts. The allowance for doubtful accounts is reviewed periodically based on amounts past due and significance. The allowance for doubtful accounts was immaterial as of December 31, 20172020 and 2016.
2019.
Inventory
Inventory consists principally of spare parts and fuel oil. Spare parts inventory is valued at weighted average cost, unless evidence indicates that the weighted average cost will not be recovered with a normal profit in the ordinary course of business. Fuel oil inventory is valued at the lower of weighted average cost or market. The Company removes fuel inventories as they are used in the production of steam, chilled water or electricity. Spare parts inventory are removed when they are used for repairs, maintenance or capital projects.
Property, Plant and Equipment
Property, plant and equipment are stated at cost or, in the case of third party business acquisitions, fair value; however impairment adjustments are recorded whenever events or changes in circumstances indicate that their carrying values may not be recoverable. See Note 3, Business Acquisitions for more information on acquired property, plant and equipment. Significant additions or improvements extending asset lives are capitalized as incurred, while repairs and maintenance that do not improve or extend the life of the respective asset are charged to expense as incurred. Depreciation is computed using the straight-line method over the estimated useful lives. Certain assets and their related accumulated depreciation amounts are adjusted for asset retirements and disposals with the resulting gain or loss included in cost of operations in the consolidated statements of operations. For further discussion of the Company's property, plant and equipment refer to Note 4, Property, Plant and Equipment, to the Consolidated Financial Statements.
Construction in-progress represents cumulative construction costs, including the costs incurred for the purchase of major equipment and engineering costs and capitalized interest. Once the project achieves commercial operation, the Company reclassifies the amounts recorded in construction in progress to facilities and equipment.
Development costs include project development costs, which are expensed in the preliminary stages of a project and capitalized when the project is deemed to be commercially viable. Commercial viability is determined by one or a series of actions including, among others, Board of Director approval pursuant to a formal project plan that subjects the Company to significant future obligations that can only be discharged by the use of a Company asset. When a project is available for operations, capitalized interest and capitalized project development costs are reclassified to property, plant and equipment and depreciated on a straightline basis over the estimated useful life of the project's related assets. Capitalized costs are charged to expense if a project is abandoned or management otherwise determines the costs to be unrecoverable.
Asset Impairments
Long-lived assets that are held and used are reviewed for impairment whenever events or changes in circumstances indicate their carrying values may not be recoverable. Such reviews are performed in accordance with ASC 360. An impairment loss is indicated if the total future estimated undiscounted cash flows expected from an asset are less than its carrying value. An impairment charge is measured by the difference between an asset's carrying amount and fair value with the difference recorded in operating costs and expenses in the statements of operations. Fair values are determined by a variety of valuation methods, including appraisals, sales prices of similar assets and present value techniques. For further discussion of the Company's long-lived asset impairments, refer to Note 9, Asset Impairments, to the Consolidated Financial Statements.
Investments accounted for by the equity method are reviewed for impairment in accordance with ASC 323, Investments-Equity Method and Joint Ventures, which requires that a loss in value of an investment that is an other-than-temporary decline should be recognized. The Company identifies and measures losses in the value of equity method investments based upon a comparison of fair value to carrying value.
Debt Issuance Costs
Debt issuance costs are capitalized and amortized as interest expense on a basis which approximates the effective interest method over the term of the related debt. Debt issuance costs related to the long term debt are presented as a direct deduction from the carrying amount of the related debt in both the current and prior periods. Debt issuance costs related to the senior secured revolving credit facility line of credit are recorded as a non-current asset on the balance sheet and are amortized over the term of the credit facility.
Intangible Assets
Intangible assets represent contractual rights held by the Company. The Company recognizes specifically identifiable intangible assets including power purchase agreements, leasehold improvements,rights, customer relationships, customer contracts and development rights when specific rights and contracts are acquired. These intangible assets are amortized primarily on a straight-line basis. For further discussion of the Company's intangible assets, refer to Note 8, Intangible Assets, to the Consolidated Financial Statements.
Notes ReceivableRevenue Recognition
Notes receivable consistRevenue from Contracts with Customers
On January 1, 2018, the Company adopted the guidance in ASC 606, Revenue from Contracts with Customers, orTopic 606, using the modified retrospective method applied to contracts which were not completed as of receivablesthe adoption date, with no adjustment required to the financial statements upon adoption. Following the adoption of the new standard, the Company’s revenue recognition of its contracts with customers remains materially consistent with its historical practice. The comparative information has not been restated and continues to be reported under the accounting standards in effect for those periods. The Company's policies with respect to its various revenue streams are detailed below. In general, the Company applies the invoicing practical expedient to recognize revenue for the revenue streams detailed below, except in circumstances where the invoiced amount does not represent the value transferred to the customer.
Thermal Revenues
Steam and chilled water revenue is recognized as the Company transfers the product to the customer, based on customer usage as determined by meter readings taken at month-end. Some locations read customer meters throughout the month, and recognize estimated revenue for the period between meter read date and month-end. For thermal contracts, the Company’s performance obligation to deliver steam and chilled water is satisfied over time and revenue is recognized based on the invoiced amount. The Thermal Business subsidiaries collect and remit state and local taxes associated with sales to their customers, as required by governmental authorities. These taxes are presented on a net basis in the income statement.
As contracts for steam and chilled water are long-term contracts, the Company has performance obligations under these contracts that have not yet been satisfied. These performance obligations have transaction prices that are both fixed and variable, and that vary based on the contract duration, customer type, inception date and other contract-specific factors. For the fixed price contracts, the Company cannot accurately estimate the amount of its unsatisfied performance obligations as it will vary based on customer usage, which will depend on factors such as weather and customer activity.
Power Purchase Agreements, or PPAs
The majority of the Company’s revenues are obtained through PPAs or other contractual agreements. Energy, capacity and, where applicable, renewable attributes, from the majority of the Company’s renewable energy assets and certain conventional energy plants is sold through long-term PPAs and tolling agreements to a single counterparty, which is often a utility or commercial customer. The majority of these PPAs are accounted for as leases. Previously ASC 840, and currently, ASC 842, requires the minimum lease payments received to be amortized over the term of the lease and contingent rentals are recorded when the achievement of the contingency becomes probable. Judgment is required by management in determining the economic life of each generating facility, in evaluating whether certain lease provisions constitute minimum payments or represent contingent rent and other factors in determining whether a contract contains a lease and whether the lease is an operating lease or capital lease.
Certain of these leases have no minimum lease payments and all of the rental income under these leases is recorded as contingent rent on an actual basis when the electricity is delivered. The contingent rental income recognized in the years ended December 31, 2020, 2019 and 2018 was $589 million, $537 million and $583 million, respectively. See Note 17, Leases for additional information related to the financingCompany's PPAs accounted for as leases.
Renewable Energy Credits, or RECs
As stated above, renewable energy credits, or RECs, are usually sold through long-term PPAs. Revenue from the sale of required network upgrades. self-generated RECs is recognized when the related energy is generated and simultaneously delivered even in cases where there is a certification lag as it has been deemed to be perfunctory.
In a bundled contract to sell energy, capacity and/or self-generated RECs, all performance obligations are deemed to be delivered at the same time and hence, timing of recognition of revenue for all performance obligations is the same and occurs over time. In such cases, it is often unnecessary to allocate transaction price to multiple performance obligations.
Disaggregated Revenues
The notes issuedfollowing tables represent the Company’s disaggregation of revenue from contracts with respectcustomers for the year ended December 31, 2020, along with the reportable segment for each category:
| | | | | | | | | | | | | | | | | | | | | | | | | |
| Year ended December 31, 2020 |
| (In millions) | Conventional Generation | | Renewables | | Thermal | | | | Total |
Energy revenue(a) | $ | 10 | | | $ | 609 | | | $ | 101 | | | | | $ | 720 | |
Capacity revenue(a) | 451 | | | 0 | | | 63 | | | | | 514 | |
| Other revenues | 0 | | | 21 | | | 32 | | | | | 53 | |
| Contract amortization | (24) | | | (61) | | | (3) | | | | | (88) | |
| | | | | | | | | |
| Total operating revenue | 437 | | | 569 | | | 193 | | | | | 1,199 | |
| Less: Lease revenue | (461) | | | (554) | | | (2) | | | | | (1,017) | |
| Less: Contract amortization | 24 | | | 61 | | | 3 | | | | | 88 | |
| Total revenue from contracts with customers | $ | 0 | | | $ | 76 | | | $ | 194 | | | | | $ | 270 | |
| | | | | | | | | |
(a) See Note 17, Leasesfor the amounts of energy and capacity revenue that relate to network upgradesleases and are accounted for under ASC 842.
The following tables represent the Company’s disaggregation of revenue from contracts with customers for the year ended December 31, 2019, along with the reportable segment for each category:
| | | | | | | | | | | | | | | | | | | | | | | | | |
| Year ended December 31, 2019 |
| (In millions) | Conventional Generation | | Renewables | | Thermal | | | | Total |
Energy revenue(a) | $ | 5 | | | $ | 545 | | | $ | 120 | | | | | $ | 670 | |
Capacity revenue(a) | 348 | | | 0 | | | 54 | | | | | 402 | |
| Other revenues | 0 | | | 10 | | | 30 | | | | | 40 | |
| Contract amortization | (7) | | | (61) | | | (3) | | | | | (71) | |
| Mark-to-market for economic hedges | 0 | | | (9) | | | 0 | | | | | (9) | |
| Total operating revenue | 346 | | | 485 | | | 201 | | | | | 1,032 | |
| Less: Lease revenue | (353) | | | (509) | | | (2) | | | | | (864) | |
| Less: Contract amortization | 7 | | | 61 | | | 3 | | | | | 71 | |
| Total revenue from contracts with customers | $ | 0 | | | $ | 37 | | | $ | 202 | | | | | $ | 239 | |
(a) See Note 17, Leases for the amounts of energy and capacity revenue that relate to leases and are accounted for under ASC 840
The following tables represent the Company’s disaggregation of revenue from contracts with customers for the year ended December 31, 2018, along with the reportable segment for each category:
| | | | | | | | | | | | | | | | | | | | | | | | | |
| Year ended December 31, 2018 |
| (In millions) | Conventional Generation | | Renewables | | Thermal | | | | Total |
Energy revenue(a) | $ | 5 | | | $ | 572 | | | $ | 120 | | | | | $ | 697 | |
Capacity revenue(a) | 337 | | | 0 | | | 50 | | | | | 387 | |
| Other revenues | 0 | | | 13 | | | 26 | | | | | 39 | |
| Contract amortization | (5) | | | (62) | | | (3) | | | | | (70) | |
| | | | | | | | | |
| Total operating revenue | 337 | | | 523 | | | 193 | | | | | 1,053 | |
| Less: Lease revenue | (342) | | | (534) | | | (2) | | | | | (878) | |
| Less: Contract amortization | 5 | | | 62 | | | 3 | | | | | 70 | |
| Total revenue from contracts with customers | $ | 0 | | | $ | 51 | | | $ | 194 | | | | | $ | 245 | |
Contract Amortization
Assets and liabilities recognized from power sales agreements assumed through acquisitions related to the sale of electric capacity and energy in future periods for which the fair value has been determined to be significantly less (more) than market are amortized to revenue over the term of each underlying contract based on actual generation and/or contracted volumes or on a straight-line basis, where applicable.
Contract Balances
The following table reflects the net amount of contract assets and liabilities included on the Company’s balance sheet as of December 31, 2020:
| | | | | | | | | | | | | | | | |
| (In millions) | | December 31, 2020 | | December 31, 2019 | | |
| Accounts receivable, net - Contracts with customers | | $ | 57 | | | $ | 34 | | | |
| Accounts receivable, net - Leases | | 86 | | | 82 | | | |
| Total accounts receivable, net | | $ | 143 | | | $ | 116 | | | |
Derivative Financial Instruments
The Company accounts for derivative financial instruments under ASC 815, Derivatives and Hedging, or ASC 815, which requires the Company to record all derivatives on the balance sheet at fair value unless they qualify for a NPNS exception. Changes in the fair value of non-hedge derivatives are immediately recognized in earnings. Changes in the fair value of derivatives accounted for as hedges, if elected for hedge accounting, are either:
•Recognized in earnings as an offset to the changes in the fair value of the related hedged assets, liabilities and firm commitments; or
•Deferred and recorded as a component of accumulated OCI until the hedged transactions occur and are recognized in earnings.
The Company's primary derivative instruments are interest rate instruments used to mitigate variability in earnings due to fluctuations in interest rates, power purchase or sale contracts used to mitigate variability in earnings due to fluctuations in market prices and fuels purchase contracts used to control customer reimbursable fuel cost. On an ongoing basis, the Company qualitatively assesses the effectiveness of its derivatives that are designated as hedges for accounting purposes in order to determine that each derivative continues to be highly effective in offsetting changes in cash flows of hedged items. If necessary, the Company will perform an analysis to measure the statistical correlation between the derivative and the associated hedged item to determine the effectiveness of such a contract designated as a hedge. The Company will discontinue hedge accounting if it is determined that the hedge is no longer effective. In this case, the gain or loss previously deferred in accumulated OCI would be frozen until the underlying hedged item is delivered unless the transaction being hedged is no longer probable of occurring in which case the amount in OCI would be immediately reclassified into earnings. If the derivative instrument is terminated, the effective portion of this derivative deferred in accumulated OCI will be repaidfrozen until the underlying hedged item is delivered.
Revenues and expenses on contracts that qualify for the NPNS exception are recognized when the underlying physical transaction is delivered. While these contracts are considered derivative financial instruments under ASC 815, they are not recorded at fair value, but on an accrual basis of accounting. If it is determined that a transaction designated as NPNS no longer meets the scope exception, the fair value of the related contract is recorded on the balance sheet and immediately recognized through earnings.
Concentrations of Credit Risk
Financial instruments which potentially subject the Company to concentrations of credit risk consist primarily of accounts receivable, notes receivable and derivative instruments, which are concentrated within entities engaged in the energy and financial industries. These industry concentrations may impact the overall exposure to credit risk, either positively or negatively, in that the customers may be similarly affected by changes in economic, industry or other conditions. In addition, many of the Company's projects have only one customer. See Item 1A, Risk Factors, Risks related to the Company's Business, for a 5-yeardiscussion on the Company’s dependence on major customers. See Note 6, Fair Value of Financial Instruments, for a further discussion of derivative concentrations and Note 13, Segment Reporting, for concentration of counterparties.
Fair Value of Financial Instruments
The carrying amount of cash and cash equivalents, restricted cash, accounts receivable, accounts receivable - affiliate, accounts payable, current portion of account payable - affiliate, and accrued expenses and other current liabilities approximate fair value because of the short-term maturity of these instruments. See Note 6, Fair Value of Financial Instruments, for a further discussion of fair value of financial instruments.
Asset Retirement Obligations
Asset retirement obligations, or AROs, are accounted for in accordance with ASC 410-20, Asset Retirement Obligations, or ASC 410-20. Retirement obligations associated with long-lived assets included within the scope of ASC 410-20 are those for which a legal obligation exists under enacted laws, statutes, and written or oral contracts, including obligations arising under the doctrine of promissory estoppel, and for which the timing and/or method of settlement may be conditional on a future event. ASC 410-20 requires an entity to recognize the fair value of a liability for an ARO in the period in which it is incurred and a reasonable estimate of fair value can be made.
Upon initial recognition of a liability for an ARO, the asset retirement cost is capitalized by increasing the carrying amount of the related long-lived asset by the same amount. Over time, the liability is accreted to its future value, while the capitalized cost is depreciated over the useful life of the related asset. The Company's AROs are primarily related to the future dismantlement of equipment on leased property and environmental obligations related to site closures and fuel storage facilities. The Company records AROs as part of other non-current liabilities on its balance sheet.
The following table represents the balance of ARO obligations as of December 31, 2020 and 2019, along with the additions and accretion related to the Company's ARO obligations for the year ended December 31, 2020:
| | | | | |
| (In millions) | |
| Balance as of December 31, 2019 | $ | 75 | |
| Revisions in estimates for current obligations | 9 | |
| Additions | 26 | |
| |
| Accretion — expense | 7 | |
| Balance as of December 31, 2020 | $ | 117 | |
Guarantees
The Company enters into various contracts that include indemnification and guarantee provisions as a routine part of its business activities. Examples of these contracts include operation and maintenance agreements, service agreements, commercial sales arrangements and other types of contractual agreements with vendors and other third parties, as well as affiliates. These contracts generally indemnify the counterparty for tax, environmental liability, litigation and other matters, as well as breaches of representations, warranties and covenants set forth in these agreements. Because many of the guarantees and indemnities the Company issues to third parties and affiliates do not limit the amount or duration of its obligations to perform under them, there exists a risk that the Company may have obligations in excess of the amounts agreed upon in the contracts mentioned above. For those guarantees and indemnities that do not limit the liability exposure, the Company may not be able to estimate what the liability would be, until a claim is made for payment or performance, due to the contingent nature of these contracts.
Investments Accounted for by the Equity Method
The Company has investments in various energy projects accounted for by the equity method, several of which are VIEs, where the Company is not a primary beneficiary, as described in Note 5, Investments Accounted for by the Equity Method and Variable Interest Entities. The equity method of accounting is applied to these investments in affiliates because the ownership structure prevents the Company from exercising a controlling influence over the operating and financial policies of the projects. Under this method, equity in pre-tax income or losses of the investments is reflected as equity in earnings of unconsolidated affiliates. Distributions from equity method investments that represent earnings on the Company's investment are included within cash flows from operating activities and distributions from equity method investments that represent a return of the Company's investment are included within cash flows from investing activities.
Sale-Leaseback Arrangements
The Company is party to sale-leaseback arrangements that provide for the sale of certain assets to a third party and simultaneous leaseback to the Company. In accordance with ASC 840-40, Sale-Leaseback Transactions, if the seller-lessee retains, through the leaseback, substantially all of the benefits and risks incident to the ownership of the property sold, the sale-leaseback transaction is accounted for as a financing arrangement. An example of this type of continuing involvement would include an option to repurchase the assets or the buyer-lessor having the option to sell the assets back to the Company. This provision is included in most of the Company’s sale-leaseback arrangements. As such, the Company accounts for these arrangements as financings.
Under the financing method, the Company does not recognize as income any of the sale proceeds received from the lessor that contractually constitutes payment to acquire the assets subject to these arrangements. Instead, the sale proceeds received are accounted for as financing obligations and leaseback payments made by the Company are allocated between interest expense and a reduction to the financing obligation. Interest on the financing obligation is calculated using the Company’s incremental borrowing rate at the inception of the arrangement on the outstanding financing obligation. Judgment is required to determine the appropriate borrowing rate for the arrangement and in determining any gain or loss on the transaction that would be recorded either at the end of or over the lease term.
Stock-Based Compensation
The Company accounts for its stock-based compensation in accordance with ASC 718, Compensation — Stock Compensation, or ASC 718. The fair value of the Company's relative performance stock units, or RPSUs, are estimated on the date each facility reached commercialof grant using the Monte Carlo valuation model. The Company uses the Class A and Class C common stock price on the date of grant as the fair value of the Company's restricted stock units, or RSUs. Forfeiture rates are estimated based on an analysis of the Company's historical forfeitures, employment turnover, and expected future behavior. The Company recognizes compensation expense for both graded and cliff vesting awards on a straightline basis over the requisite service period for the entire award. The Company incurred total stock compensation expense of $3 million, $4 million and $3 million for the years ended December 31, 2020, 2019 and 2018, respectively, which was primarily recorded in general and administrative expense on the Company's consolidated statements of operations.
Income TaxesAsset Retirement Obligations
Asset retirement obligations, or AROs, are accounted for in accordance with ASC 410-20, Asset Retirement Obligations, or ASC 410-20. Retirement obligations associated with long-lived assets included within the scope of ASC 410-20 are those for which a legal obligation exists under enacted laws, statutes, and written or oral contracts, including obligations arising under the doctrine of promissory estoppel, and for which the timing and/or method of settlement may be conditional on a future event. ASC 410-20 requires an entity to recognize the fair value of a liability for an ARO in the period in which it is incurred and a reasonable estimate of fair value can be made.
Upon initial recognition of a liability for an ARO, the asset retirement cost is capitalized by increasing the carrying amount of the related long-lived asset by the same amount. Over time, the liability is accreted to its future value, while the capitalized cost is depreciated over the useful life of the related asset. The Company's AROs are primarily related to the future dismantlement of equipment on leased property and environmental obligations related to site closures and fuel storage facilities. The Company records AROs as part of other non-current liabilities on its balance sheet.
The following table represents the balance of ARO obligations as of December 31, 2020 and 2019, along with the additions and accretion related to the Company's ARO obligations for the year ended December 31, 2020:
| | | | | |
| (In millions) | |
| Balance as of December 31, 2019 | $ | 75 | |
| Revisions in estimates for current obligations | 9 | |
| Additions | 26 | |
| |
| Accretion — expense | 7 | |
| Balance as of December 31, 2020 | $ | 117 | |
Guarantees
The Company enters into various contracts that include indemnification and guarantee provisions as a routine part of its business activities. Examples of these contracts include operation and maintenance agreements, service agreements, commercial sales arrangements and other types of contractual agreements with vendors and other third parties, as well as affiliates. These contracts generally indemnify the counterparty for tax, environmental liability, litigation and other matters, as well as breaches of representations, warranties and covenants set forth in these agreements. Because many of the guarantees and indemnities the Company issues to third parties and affiliates do not limit the amount or duration of its obligations to perform under them, there exists a risk that the Company may have obligations in excess of the amounts agreed upon in the contracts mentioned above. For those guarantees and indemnities that do not limit the liability exposure, the Company may not be able to estimate what the liability would be, until a claim is made for payment or performance, due to the contingent nature of these contracts.
Investments Accounted for by the Equity Method
The Company has investments in various energy projects accounted for by the equity method, several of which are VIEs, where the Company is not a primary beneficiary, as described in Note 5, Investments Accounted for by the Equity Method and Variable Interest Entities. The equity method of accounting is applied to these investments in affiliates because the ownership structure prevents the Company from exercising a controlling influence over the operating and financial policies of the projects. Under this method, equity in pre-tax income or losses of the investments is reflected as equity in earnings of unconsolidated affiliates. Distributions from equity method investments that represent earnings on the Company's investment are included within cash flows from operating activities and distributions from equity method investments that represent a return of the Company's investment are included within cash flows from investing activities.
Sale-Leaseback Arrangements
The Company is party to sale-leaseback arrangements that provide for the sale of certain assets to a third party and simultaneous leaseback to the Company. In accordance with ASC 840-40, Sale-Leaseback Transactions, if the seller-lessee retains, through the leaseback, substantially all of the benefits and risks incident to the ownership of the property sold, the sale-leaseback transaction is accounted for as a financing arrangement. An example of this type of continuing involvement would include an option to repurchase the assets or the buyer-lessor having the option to sell the assets back to the Company. This provision is included in most of the Company’s sale-leaseback arrangements. As such, the Company accounts for these arrangements as financings.
Under the financing method, the Company does not recognize as income any of the sale proceeds received from the lessor that contractually constitutes payment to acquire the assets subject to these arrangements. Instead, the sale proceeds received are accounted for as financing obligations and leaseback payments made by the Company are allocated between interest expense and a reduction to the financing obligation. Interest on the financing obligation is calculated using the Company’s incremental borrowing rate at the inception of the arrangement on the outstanding financing obligation. Judgment is required to determine the appropriate borrowing rate for the arrangement and in determining any gain or loss on the transaction that would be recorded either at the end of or over the lease term.
Stock-Based Compensation
The Company accounts for income taxes using the liability methodits stock-based compensation in accordance with ASC 740, Income Taxes, 718, Compensation — Stock Compensation, or ASC 740, which requires that718. The fair value of the Company useCompany's relative performance stock units, or RPSUs, are estimated on the asset and liability methoddate of accounting for deferred income taxes and provide deferred income taxes for all significant temporary differences.
grant using the Monte Carlo valuation model. The Company has two categoriesuses the Class A and Class C common stock price on the date of income tax expense or benefit — current and deferred,grant as follows:
Current income tax expense or benefit consists solelythe fair value of current taxes payable less applicable tax credits, and
Deferred income tax expense or benefit is the change in the net deferred income tax asset or liability, excluding amounts charged or credited to accumulated other comprehensive income.
The Company reports some of its revenues and expenses differently for financial statement purposes than for income tax return purposes, resulting in temporary and permanent differences between the Company's financial statements and income tax returns. The tax effectsrestricted stock units, or RSUs. Forfeiture rates are estimated based on an analysis of such temporary differences are recorded as either deferred income tax assets or deferred income tax liabilities in the Company's consolidated balance sheets. The Company measures its deferred income tax assetshistorical forfeitures, employment turnover, and deferred income tax liabilities using income tax rates that are currently in effect. The Company believes it is more likely than not that the results ofexpected future operations will generate sufficient taxable income which includes the future reversal of existing taxable temporary differences to realize deferred tax assets, net of valuation allowances. In arriving at this conclusion to utilize projections of future profit before tax in its estimate of future taxable income, including the impact of the Tax Cuts and Jobs Act, the Company considered the profit before tax generated in recent years. A valuation allowance is recorded to reduce the net deferred tax assets to an amount that is more-likely-than-not to be realized.
The Company accounts for uncertain tax positions in accordance with ASC 740, which applies to all tax positions related to income taxes. Under ASC 740, tax benefits are recognized when it is more-likely-than-not that a tax position will be sustained upon examination by the authorities. The benefit recognized from a position that has surpassed the more-likely-than-not threshold is the largest amount of benefit that is more than 50% likely to be realized upon settlement.behavior. The Company recognizes interestcompensation expense for both graded and penalties accrued related to uncertain tax benefits ascliff vesting awards on a component of income tax expense.
In accordance with ASC 740 and as discussed further in Note 14, Income Taxes, changes to existing net deferred tax assets or valuation allowances or changes to uncertain tax benefits, are recorded to income tax expense.
NRG Yield, Inc. is included in certain NRG consolidated unitary state tax return filings which is reflected in NRG Yield, Inc.'s state effective tax rate. If NRG Yield, Inc. filed under a separate standalone methodology, there would be an additional state taxstraightline basis over the requisite service period for the entire award. The Company incurred total stock compensation expense of approximately $1$3 million, as of December 31, 2017 due to a change in the NRG Yield, Inc. state effective tax rate.
Revenue Recognition
Thermal Revenues
Steam$4 million and chilled water revenue is recognized based on customer usage as determined by meter readings taken at month-end. Some locations read customer meters throughout the month, and recognize estimated revenue$3 million for the period between meter read date and month-end. The Thermal Business subsidiaries collect and remit state and local taxes associated with sales to their customers, as required by governmental authorities. These taxes are presented on a net basis in the income statement.
Power Purchase Agreements, or PPAs
The majority of the Company’s revenues are obtained through PPAs or other contractual agreements, which are accounted for as operating leases under ASC 840. ASC 840 requires the minimum lease payments received to be amortized over the term of the lease and contingent rentals are recorded when the achievement of the contingency becomes probable. Judgment is required by management in determining the economic life of each generating facility, in evaluating whether certain lease provisions constitute minimum payments or represent contingent rent and other factors in determining whether a contract contains a lease and whether the lease is an operating lease or capital lease.
Certain of these leases have no minimum lease payments and all of the rental income under these leases is recorded as contingent rent on an actual basis when the electricity is delivered. The contingent rental income recognized in the years ended December 31, 2017, 2016,2020, 2019 and 20152018, respectively, which was $559 million, $583 million,primarily recorded in general and $443 million, respectively. These balances include intercompany revenue for Elbow Creek of $8 million for each of the years ended December 31, 2017 and 2016, as further discussed in Note 15 Related Party Transactions.
Derivative Financial Instruments
The Company accounts for derivative financial instruments under ASC 815, Derivatives and Hedging, or ASC 815, which requires the Company to record all derivativesadministrative expense on the balance sheet at fair value unless they qualify for a NPNS exception. Changes in the fair valueCompany's consolidated statements of non-hedge derivatives are immediately recognized in earnings. Changes in the fair value of derivatives accounted for as hedges, if elected for hedge accounting, are either:operations.
Recognized in earnings as an offset to the changes in the fair value of the related hedged assets, liabilities and firm commitments; or
Deferred and recorded as a component of accumulated OCI until the hedged transactions occur and are recognized in earnings.
The Company's primary derivative instruments are power purchase or sale contracts used to mitigate variability in earnings due to fluctuations in market prices, fuels purchase contracts used to control customer reimbursable fuel cost, and interest rate instruments used to mitigate variability in earnings due to fluctuations in interest rates. On an ongoing basis, the Company assesses the effectiveness of all derivatives that are designated as hedges for accounting purposes in order to determine that each derivative continues to be highly effective in offsetting changes in fair values or cash flows of hedged items. Internal analyses that measure the statistical correlation between the derivative and the associated hedged item determine the effectiveness of such a contract designated as a hedge. If it is determined that the derivative instrument is not highly effective as a hedge, hedge accounting will be discontinued prospectively. In this case, the gain or loss previously deferred in accumulated OCI would be frozen until the underlying hedged item is delivered unless the transaction being hedged is no longer probable of occurring in which case the amount in OCI would be immediately reclassified into earnings. If the derivative instrument is terminated, the effective portion of this derivative deferred in accumulated OCI will be frozen until the underlying hedged item is delivered.
Revenues and expenses on contracts that qualify for the NPNS exception are recognized when the underlying physical transaction is delivered. While these contracts are considered derivative financial instruments under ASC 815, they are not recorded at fair value, but on an accrual basis of accounting. If it is determined that a transaction designated as NPNS no longer meets the scope exception, the fair value of the related contract is recorded on the balance sheet and immediately recognized through earnings.
Concentrations of Credit Risk
Financial instruments which potentially subject the Company to concentrations of credit risk consist primarily of accounts receivable, notes receivable and derivative instruments, which are concentrated within entities engaged in the energy and financial industry. These industry concentrations may impact the overall exposure to credit risk, either positively or negatively, in that the customers may be similarly affected by changes in economic, industry or other conditions. In addition, many of the Company's projects have only one customer. However, the Company believes that the credit risk posed by industry concentration is offset by the diversification and creditworthiness of its customer base. See Note 6, Fair Value of Financial Instruments for a further discussion of derivative concentrations and Note 13, Segment Reporting, for concentration of counterparties.
Fair Value of Financial Instruments
The carrying amount of cash and cash equivalents, restricted cash, accounts receivable, accounts receivable - affiliate, accounts payable, current portion of account payable - affiliate, and accrued expenses and other current liabilities approximate fair value because of the short-term maturity of these instruments. See Note 6, Fair Value of Financial Instruments, for a further discussion of fair value of financial instruments.
Asset Retirement Obligations
Asset retirement obligations, or AROs, are accounted for in accordance with ASC 410-20, Asset Retirement Obligations, or ASC 410-20. Retirement obligations associated with long-lived assets included within the scope of ASC 410-20 are those for which a legal obligation exists under enacted laws, statutes, and written or oral contracts, including obligations arising under the doctrine of promissory estoppel, and for which the timing and/or method of settlement may be conditional on a future event. ASC 410-20 requires an entity to recognize the fair value of a liability for an ARO in the period in which it is incurred and a reasonable estimate of fair value can be made.
Upon initial recognition of a liability for an ARO, the asset retirement cost is capitalized by increasing the carrying amount of the related long-lived asset by the same amount. Over time, the liability is accreted to its future value, while the capitalized cost is depreciated over the useful life of the related asset. The Company's AROs are primarily related to the future dismantlement of equipment on leased property and environmental obligations related to site closures and fuel storage facilities. The Company records AROs as part of other non-current liabilities on its balance sheet.
The following table represents the balance of ARO obligations as of December 31, 20172020 and 2016,2019, along with the additions and accretion related to the Company's ARO obligations for the year ended December 31, 2017:2020:
|
| | | |
| | (In millions) |
| Balance as of December 31, 2016 | $ | 49 |
|
| Revisions in estimates for current obligations/Additions | 2 |
|
| Accretion — expense | 4 |
|
| Balance as of December 31, 2017 | $ | 55 |
|
| | | | | |
| (In millions) | |
| Balance as of December 31, 2019 | $ | 75 | |
| Revisions in estimates for current obligations | 9 | |
| Additions | 26 | |
| |
| Accretion — expense | 7 | |
| Balance as of December 31, 2020 | $ | 117 | |
Guarantees
The Company enters into various contracts that include indemnification and guarantee provisions as a routine part of its business activities. Examples of these contracts include operation and maintenance agreements, service agreements, commercial sales arrangements and other types of contractual agreements with vendors and other third parties, as well as affiliates. These contracts generally indemnify the counterparty for tax, environmental liability, litigation and other matters, as well as breaches of representations, warranties and covenants set forth in these agreements. Because many of the guarantees and indemnities the Company issues to third parties and affiliates do not limit the amount or duration of its obligations to perform under them, there exists a risk that the Company may have obligations in excess of the amounts agreed upon in the contracts mentioned above. For those guarantees and indemnities that do not limit the liability exposure, the Company may not be able to estimate what the liability would be, until a claim is made for payment or performance, due to the contingent nature of these contracts.
Investments Accounted for by the Equity Method
The Company has investments in various energy projects accounted for by the equity method, several of which are VIEs, where the Company is not a primary beneficiary, as described in Note 5, Investments Accounted for by the Equity Method and Variable Interest Entities. The equity method of accounting is applied to these investments in affiliates because the ownership structure prevents the Company from exercising a controlling influence over the operating and financial policies of the projects. Under this method, equity in pre-tax income or losses of the investments is reflected as equity in earnings of unconsolidated affiliates. Distributions from equity method investments that represent earnings on the Company's investment are included within cash flows from operating activities and distributions from equity method investments that represent a return of the Company's investment are included within cash flows from investing activities.
Sale LeasebackSale-Leaseback Arrangements
The Company is party to sale-leaseback arrangements that provide for the sale of certain assets to a third party and simultaneous leaseback to the Company. In accordance with ASC 840-40, Sale-Leaseback Transactions, if the seller-lessee retains, through the leaseback, substantially all of the benefits and risks incident to the ownership of the property sold, the sale-leaseback transaction is accounted for as a financing arrangement. An example of this type of continuing involvement would include an option to repurchase the assets or the buyer-lessor having the option to sell the assets back to the Company. This provision is included in most of the Company’s sale-leaseback arrangements. As such, the Company accounts for these arrangements as financings.
Under the financing method, the Company does not recognize as income any of the sale proceeds received from the lessor that contractually constitutes payment to acquire the assets subject to these arrangements. Instead, the sale proceeds received are accounted for as financing obligations and leaseback payments made by the Company are allocated between interest expense and a reduction to the financing obligation. Interest on the financing obligation is calculated using the Company’s incremental borrowing rate at the inception of the arrangement on the outstanding financing obligation. Judgment is required to determine the appropriate borrowing rate for the arrangement and in determining any gain or loss on the transaction that would be recorded either at the end of or over the lease term.
Stock-Based Compensation
The Company accounts for its stock-based compensation in accordance with ASC 718, Compensation — Stock Compensation, or ASC 718. The fair value of the Company's relative performance stock units, or RPSUs, are estimated on the date of grant using the Monte Carlo valuation model. The Company uses the Class A and Class C common stock price on the date of grant as the fair value of the Company's restricted stock units, or RSUs. Forfeiture rates are estimated based on an analysis of the Company's historical forfeitures, employment turnover, and expected future behavior. The Company recognizes compensation expense for both graded and cliff vesting awards on a straightline basis over the requisite service period for the entire award. The Company incurred total stock compensation expense of $3 million, $4 million and $3 million for the years ended December 31, 2020, 2019 and 2018, respectively, which was primarily recorded in general and administrative expense on the Company's consolidated statements of operations.
Income Taxes
The Company accounts for income taxes using the liability method in accordance with ASC 740, Income Taxes, or ASC 740, which requires that the Company use the asset and liability method of accounting for deferred income taxes and provide deferred income taxes for all significant temporary differences.
The Company has two categories of income tax expense or benefit — current and deferred, as follows:
•Current income tax expense or benefit consists solely of current taxes payable less applicable tax credits, and
•Deferred income tax expense or benefit is the change in the net deferred income tax asset or liability, excluding amounts charged or credited to accumulated other comprehensive income.
The Company reports some of its revenues and expenses differently for financial statement purposes than for income tax return purposes, resulting in temporary and permanent differences between the Company's financial statements and income tax returns. The tax effects of such temporary differences are recorded as either deferred income tax assets or deferred income tax liabilities in the Company's consolidated balance sheets. The Company measures its deferred income tax assets and deferred income tax liabilities using income tax rates that are currently in effect. The Company believes it is more likely than not that the results of future operations will generate sufficient taxable income which includes the future reversal of existing taxable temporary differences to realize deferred tax assets, net of valuation allowances. In arriving at this conclusion to utilize projections of future profit before tax in its estimate of future taxable income, including the impact of the Tax Cuts and Jobs Act, the Company considered the profit before tax generated in recent years. A valuation allowance is recorded to reduce the net deferred tax assets to an amount that is more-likely-than-not to be realized.
The Company accounts for uncertain tax positions in accordance with ASC 740, which applies to all tax positions related to income taxes. Under ASC 740, tax benefits are recognized when it is more-likely-than-not that a tax position will be sustained upon examination by the authorities. The benefit recognized from a position that has surpassed the more-likely-than-not threshold is the largest amount of benefit that is more than 50% likely to be realized upon settlement. The Company recognizes interest and penalties accrued related to uncertain tax benefits as a component of income tax expense.
In accordance with ASC 740 and as discussed further in Note 14, Income Taxes, changes to existing net deferred tax assets, valuation allowances, or changes to uncertain tax benefits, are recorded to income tax expense.
Prior to the GIP Transaction, the Company was included in certain NRG consolidated unitary tax return filings which was reflected in the state effective tax rate. For tax returns filed during December 31, 2018, NRG allocated $22 million to the Company in tax-effected state NOLs, driven primarily from losses generated by NRG after the GIP Transaction. The Company expects to be able to utilize these NOLs in future periods.
Following the GIP Transaction, the Company files under a separate standalone methodology, resulting in a higher state effective tax rate due to a larger percentage of activity allocated to high-tax jurisdictions.
Business Combinations
The Company accounts for its business combinations in accordance with ASC 805, Business Combinations, or ASC 805. For third party acquisitions, ASC 805 requires an acquirer to recognize and measure in its financial statements the identifiable assets acquired, the liabilities assumed, and any noncontrolling interest in the acquiree at fair value at the acquisition date. It also recognizes and measures the goodwill acquired or a gain from a bargain purchase in the business combination and determines what information to disclose to enable users of an entity's financial statements to evaluate the nature and financial effects of the business combination. In addition, transaction costs are expensed as incurred. For business acquisitions that relate to entities under common control, ASC 805 requires retrospective combination of the entities for all annual periods presented as if the combination has been in effect from the beginning of the earliest financial statement period ofpresented or from the date the entities were under common control (if later than the beginning of the earliest financial statement period). The difference between the cash paid and historical value of the entities' equity is recorded as a distribution/contribution from/to NRGCEG with the offset to noncontrolling interest. Transaction costs are expensed as incurred.
Use of Estimates
The preparation of consolidated financial statements in accordance with GAAP requires management to make estimates and assumptions. These estimates and assumptions impact the reported amounts of assets and liabilities and disclosures of contingent assets and liabilities as of the date of the consolidated financial statements. They also impact the reported amounts of net earnings during the reporting periods. Actual results could be different from these estimates.
In recording transactions and balances resulting from business operations, the Company uses estimates based on the best information available. Estimates are used for such items as plant depreciable lives, tax provisions, uncollectible accounts, environmental liabilities,AROs, acquisition accounting and legal costs incurred in connection with recorded loss contingencies, among others. In addition, estimates are used to test long-lived assets for impairment and to determine the fair value of impaired assets. As better information becomes available or actual amounts are determinable, the recorded estimates are revised. Consequently, operating results can be affected by revisions to prior accounting estimates.
Tax Equity Arrangements
Certain portions of the Company’s noncontrolling interests in subsidiaries represent third-party interests in the net assets under certain tax equity arrangements, which are consolidated by the Company, that have been entered into to finance the cost of wind facilities eligible for certain tax credits. Additionally, certain portions of the Company’s investments in unconsolidated affiliates reflect the Company’s interests in tax equity arrangements, that are not consolidated by the Company, that have been entered into to finance the cost of distributed solar energy systems, under operating leases or PPAs, that are eligible for certain tax credits. The Company has determined that the provisions in the contractual agreements of these structures represent substantive profit sharing arrangements. Further, the Company has determined that the appropriate methodology for calculating the noncontrolling interest and investment in unconsolidated affiliates that reflects the substantive profit sharing arrangements is a balance sheet approach utilizing the hypothetical liquidation at book value, or HLBV, method. Under the HLBV method, the amounts reported as noncontrolling interests and investment in unconsolidated affiliates represent the amounts the investors to the tax equity arrangements would hypothetically receive at each balance sheet date under the liquidation provisions of the contractual agreements, assuming the net assets of the funding structures were liquidated at their recorded amounts determined in accordance with GAAP. The investors’ interests in the results of operations of the funding structures are determined as the difference in noncontrolling interests and investment in unconsolidated affiliates at the start and end of each reporting period, after taking into account any capital transactions between the structures and the funds’ investors. The calculations utilized to apply the HLBV method include estimated calculations of taxable income or losses for each reporting period.
ReclassificationsReclassification
Certain prior year amounts have been reclassified for comparative purposes.
RecentRecently Adopted Accounting Developments - Adopted in 2017Standards
ASU 2018-02 — In February 2018,March 2020, the FASB issued ASU No. 2018-02, Income Statement - Reporting Comprehensive Income (Topic 220), Reclassification2020-4, Facilitation of Certain Taxthe Effects from Accumulated Other Comprehensive Income, of Reference Rate Reform on Financial Reporting. The amendments provide for optional expedients and exceptions for applying GAAP to contracts, hedging relationships and other transactions affected by reference rate reform if certain criteria is met. These amendments apply only to contracts that reference LIBOR or ASU No. 2018-02. Prior to ASU 2018-02, GAAP required the remeasurement of deferred tax assets and liabilities as a result of a change in tax laws or ratesanother reference rate expected to be presented in net income from continuing operations, even in situations in which the related income tax effectsdiscontinued because of items in accumulated other comprehensive income were originally recognized in other comprehensive income. As a result, such items, referred to as stranded tax effects, did not reflect the appropriate tax rate. Under ASU No. 2018-02, entities are permitted, but not required, to reclassify from accumulated other comprehensive income to retained earnings those stranded tax effects resulting from the Tax Act. ASU No. 2018-02reference rate reform. The guidance is effective for all entities for fiscal years beginning afteras of March 12, 2020 through December 15, 2018, and interim
periods within those fiscal years. Early adoption is permitted.31, 2022. The Company intends to apply the amendments to all its eligible contract modifications where applicable during the reference rate reform period. As of December 31, 2020, the Company has not elected any optional expedients provided in the standard.
Effective January 1, 2019, the Company adopted ASU No. 2016-02, Leases (Topic 842), or Topic 842 using the modified retrospective transition method. The Company elected available practical expedients permitted under the transition guidance within the new standard, effective December 31, 2017. Aswhich among other items, allowed the Company to carry forward its historical lease classification and not reassess existing leases under the new definition of a resultlease in ASC 842. In addition, the Company also elected to account for lease and non-lease components as a single lease component. The adoption of the adoption, the Company reclassified $5 million from accumulated other comprehensive loss to retained earningsstandard resulted in the recording of operating lease liabilities of $165 million and related ROU assets of $159 million. There was no impact to the Company’s consolidated balance sheets asstatement of operations or cash flows.
Recently Issued Accounting Standards Not Yet Adopted
In December 31, 2017.
ASU 2017-12 — In August 2017,2019, the FASB issued ASU No. 2017-12, Derivatives and Hedging2019-12, Income Taxes (Topic 815), Targeted Improvements to740): Simplifying the Accounting for Hedging Activities, or ASU No. 2017-12. ASU No. 2017-12 amends ASU No. 2016-15.Income Taxes. The amendments ofin this ASU No. 2016-15 were issued to simplify the accounting for income taxes by removing certain exceptions to the general principles in Topic 740, Income Taxes. The amendments also improve consistent application of hedge accounting guidance and more closely aligning financial reportingsimplify GAAP for hedging relationships with economic resultsother areas of an entity's risk management activities. The issues addressedTopic 740 by ASU No. 2017-12 include but are not limited to alignment of risk management activitiesclarifying and financial reporting, risk component hedging, accounting for the hedged item in fair value hedges of interest rate risk, recognition and presentation of the effects of hedging instruments, amounts excluded from the assessment of hedge effectiveness, and other simplifications of hedge accountingamending existing guidance. The amendments of ASU No. 2017-12 areguidance is effective for fiscal years beginning after December 15, 2018, and interim periods therein. EarlyJanuary 1, 2021, with early adoption is permitted in any interim period andpermitted. The Company does not expect the effect of the adoption shouldnew guidance to be reflected asmaterial on its consolidated financial statements.
Note 3 — Acquisitions and Dispositions
2021 Acquisitions
Rattlesnake Drop Down — On January 12, 2021, the Company acquired 100% of CEG's equity interest and a third party investor's minority interest in Rattlesnake Flat, LLC, which owns the Rattlesnake Wind Project, a 160 net MW wind facility located in Adams County, WA for $132 million in cash consideration.
Agua Caliente Acquisition — On February 3, 2021, the Company acquired an additional 35% equity interest in the Agua Caliente solar project from NRG Energy, Inc. for $202 million. Agua Caliente is a 290 MW solar project located in Dateland, Arizona in which Clearway previously owned a 16% equity interest. The project has a 25-year PPA with PG&E, with approximately 19 years remaining under the agreement. Following the close of the beginning oftransaction, the fiscal year of adoption. The Company early adopted ASU No. 2017-12 during the fourth quarter 2017. The adoption of ASU No. 2017-12 did not haveowns a material impact on our consolidated results of operations, cash flows, and statement of financial position.
ASU 2016-18 — In November 2016, the FASB issued ASU No. 2016-18, Statement of Cash Flows (Topic 230), Restricted Cash, or ASU No. 2016-18. The amendments of ASU No. 2016-18 require an entity to include amounts generally described as restricted cash and restricted cash equivalents with cash and cash equivalents when reconciling the beginning of period and end of period total amounts on the statement of cash flows. The amendments of ASU No. 2016-18 are effective for annual reporting periods beginning after December 15, 2017, and interim periods within those annual periods. Early adoption is permitted and the adoption of ASU No. 2016-18 will be applied retrospectively. The Company early adopted ASU No. 2016-18 during the second quarter of 2017. Net cash flows used51% equity interest in investing activities for the year ended December 31, 2016 decreased by $33 million. The sum of Company's cash and cash equivalents and restricted cash reported within the consolidated balance sheet as of December 31, 2016 equals the beginning balances of cash, cash equivalents and restricted cash shown in the consolidated statement of cash flows for the year ended December 31, 2017. The sum of Company's cash and cash equivalents and restricted cash reported within the consolidated balance sheet as of December 31, 2017 equals to the ending balances of cash, cash equivalents and restricted cash shown in the consolidated statement of cash flows for the year ended December 31, 2017.
Recent Accounting Developments - Not Yet Adopted
ASU 2016-02 — In February 2016, the FASB issued ASU No. 2016-02, Leases (Topic 842), or Topic 842, with the objective to increase transparency and comparability among organizations by recognizing lease assets and lease liabilities on the balance sheet and to improve financial reporting by expanding the related disclosures. The guidance in Topic 842 provides that a lessee that may have previously accounted for a lease as an operating lease under current GAAP should recognize the assets and liabilities that arise from a lease on the balance sheet. In addition, Topic 842 expands the required quantitative and qualitative disclosures with regards to lease arrangements.Agua Caliente. The Company will adopt the standard effective January 1, 2019remove its equity method investment and expects to elect certain of the practical expedients permitted, including the expedient that permits the Company to retainconsolidate its existing lease assessment and classification. The Company is currently working through an adoption plan and evaluating the anticipated impact on the Company's results of operations, cash flows and financial position. While the Company is currently evaluating the impact the new guidance will have on its financial position and results of operations, the Company expects to recognize lease liabilities and right of use assets. The extent of the increase to assets and liabilities associated with these amounts remains to be determined pending the Company’s review of its existing lease contracts and service contracts which may contain embedded leases. While this review is stillinterest in process, the Company believes the adoption of Topic 842 may be material to its financial statements. The Company is continuing to monitor potential changes to Topic 842 that have been proposed by the FASB and will assess any necessary changes to the implementation as the guidance is updated.
ASU 2014-09 — In May 2014, the FASB issued ASU No. 2014-09, RevenueAgua Caliente from Contracts with Customers (Topic 606), or Topic 606, which was further amended through various updates issued by the FASB thereafter. The amendments of ASU No. 2014-09 completed the joint effort between the FASB and the IASB, to develop a common revenue standard for GAAP and IFRS, and to improve financial reporting. The guidance under Topic 606 provides that an entity should recognize revenue to depict the transfer of goods or services to customers in an amount that reflects the consideration to which the entity expects to be entitled to in exchange for the goods or services provided and establishes a five step model to be applied by an entity in evaluating its contracts with customers. The Company has elected the practical expedient available under Topic 606 for measuring progress toward complete satisfaction of a performance obligation and for disclosure requirements of remaining performance obligations. The practical expedient allows an entity to recognize revenue in the amount to which the entity has the right to invoice such that the entity has a right to the consideration in an amount that corresponds directly with the value to the customer for performance completed to date by the entity. The majority of the Company's revenues are obtained through PPAs, which are currently accounted for as operating leases. In connection with the implementation of Topic 842, as described above, the Company expects to elect
certain of the practical expedients permitted, including the expedient that permits the Company to retain its existing lease assessment and classification. The Company adopted the standard effective January 1, 2018 under the modified retrospective transition method. As leases are excluded from the scope of Topic 606, the adoption of Topic 606 at the date of initial application will not have a material impact on the Company's financial statements. The adoption of Topic 606 also includes additional disclosure requirements beginning in the first quarter of 2018. As a significant portion of the Company’s revenue is generated through operating leases, the majority of the new required disclosures will not be relevant or material to the Company.acquisition.
Note 3 — Business Acquisitions
20172020 Acquisitions
November 2017Langford Drop Down Assets — On November 1, 2017,20, 2020, the Company acquired 100% of the Class B membership interest in Langford Holding LLC from CEG for $55 million as well as a 38minority interest from a third party investor for $9 million. Langford Holding LLC indirectly consolidates its interest in the Langford wind project as further described in Note 5, Investments Accounted for by the Equity Method and Variable Interest Entities. The Langford project is a 160 MW solar portfolio primarily comprised of assets from NRG's Solar Power Partners (SPP) fundswind project located in West Texas which achieved repowering commercial operations in November 2020. The Langford operations are included in the Company's Renewables segment and other projects developed by NRG, for cash consideration of $74 million, including working capital adjustments of $3 million, plus assumed non-recourse debt of $26 million.
The purchase price for the November 2017 Drop Down Assetsacquisition was funded with cash on hand. The acquisition was determined to be an asset acquisition and not a business combination, therefore the Company consolidated the financial information for Langford on a prospective basis. The membership interests acquired by the Company relate to interests under common control by GIP and were recorded at historical cost, which reflects GIP's basis recorded at fair value. The difference between the cash paid of $64 million and the historical value of the Company's acquired interests of $21 million was recorded as an adjustment to noncontrolling interest.
The following is a summary of assets and liabilities transferred in connection with the acquisition as of November 20, 2020:
| | | | | | | | |
| (In millions) | | Langford |
| Current Assets | | $ | 4 | |
| Property, plant and equipment, net | | 138 | |
| Other non-current assets | | 15 | |
| Total assets | | 157 | |
| | |
| Other current and non-current liabilities | | 17 | |
| Total liabilities | | 17 | |
| Noncontrolling interests | | 119 | |
| Net assets less noncontrolling interests | | $ | 21 | |
Rosamond Central Drop Down — On December 21, 2020, Rosamond Solar Investment LLC, a subsidiary of the Company, acquired 100% of the Class A membership interests of Rosie TargetCo LLC from Renew Development HoldCo LLC, a subsidiary of CEG, for $23 million in cash consideration and an additional $1 million adjustment concurrent with the tax equity investor's final funding which was paid in January 2021. Rosie Target Co LLC is the primary beneficiary and consolidates its interest in a tax equity fund that owns the 192 MW Rosamond Central solar project, located in Kern County, California as further described in Note 5, Investments Accounted for by the Equity Method and Variable Interest Entities. The Rosamond Central operations are included in the Company's Renewables segment. The acquisition was determined to be an asset acquisition and not a business combination, and therefore, the Company consolidated the financial information for Rosamond Central on a prospective basis. The membership interests acquired by the Company relate to interests under common control by GIP and were recorded at historical cost. The difference between the cash paid of $24 million and the historical value of the Company's acquired interests of $28 million was recorded as an adjustment to noncontrolling interest.
The following is a summary of assets and liabilities transferred in connection with the acquisition as of December 21, 2020:
| | | | | | | | |
| (In millions) | | Rosamond Central |
| Current Assets | | $ | 49 | |
| Property, plant and equipment, net | | 246 | |
| | |
| Other non-current assets | | 1 | |
| Total assets | | 296 | |
| | |
| Long-term debt | | 205 | |
| Other current and non-current liabilities | | 11 | |
| Total liabilities | | 216 | |
| Noncontrolling interests | | 52 | |
| Net assets less noncontrolling interests | | $ | 28 | |
Mesquite Star Drop Down — OnSeptember 1, 2020, the Company, through its indirect subsidiary Lighthouse Renewable Class A LLC, acquired the Class A membership interests in Lighthouse Renewable Holdco LLC (formerly Mesquite Star Pledgor LLC) from Clearway Renew LLC, a subsidiary of CEG, for $74 million in cash consideration inclusive of a purchase price adjustment received in the fourth quarter of 2020 concurrent with the partnership amendment referenced below. Lighthouse Renewable Holdco LLC indirectly owns 100% of the Class B membership interests in Mesquite Star Tax Equity Holdco LLC, a tax equity partnership that it consolidates as the primary beneficiary, and owns the Mesquite Star wind project, a 419 MW utility scale wind project located in Fisher County, Texas. A majority of the project’s output is backed by contracts with investment grade counterparties with a 12 year weighted average contract life. The Mesquite Star operations are reflected in the Company's Renewables segment and the acquisition was funded with cash on hand. The Company initially recorded its interest in Lighthouse Renewable Class A LLC as an equity method investment. The membership interests acquired by the Company relate to interests under common control by GIP and were recorded at historical cost. The difference between the $74 million cash paid and the historical value of the Company's acquired interests of $83 million was recorded as an adjustment to noncontrolling interest.
On December 21, 2020, Clearway Renew LLC sold the Class B membership interest in Lighthouse Renewable Holdco LLC to a third party investor as further described in Note 5, Investments Accounted for by the Equity Method and Variable Interest Entities. The investor and the Company amended the terms of the related partnership and as a result, the Company now consolidates its interest in the Mesquite Star wind project, through its consolidation of Lighthouse Renewable Holdco LLC. The membership interests acquired by the Company relate to interests under common control by GIP and were recorded at historical cost. The difference between the carrying value of the Company's equity method investment of $58 million and the historical value of the net assets consolidated for Mesquite Star of $63 million was recorded as an adjustment to noncontrolling interest.
The following table shows the balances that were consolidated effective on December 21, 2020:
| | | | | |
| (In millions) | Mesquite Star |
| Current assets | $ | 22 | |
| Property, plant and equipment, net | 443 | |
| Other non-current assets | 31 | |
| Total assets | 496 | |
| |
| Other current and non-current liabilities | 87 | |
| Total liabilities | 87 | |
| Noncontrolling interests and redeemable noncontrolling interests | 346 | |
| Net assets less noncontrolling interests | $ | 63 | |
DG Residual Interest and SREC Contract Drop Down — On November 2, 2020, the Company acquired the Class B membership interests in DGPV Holdco 1, DGPV Holdco 2 and DGPV Holdco 3, or DGPV Holdco Entities, from Renew DG Holdings LLC, a subsidiary of CEG, for approximately $20 million in cash consideration and an SREC contract for approximately $24 million in cash consideration. The Company previously held the Class A membership interests in the DGPV Holdco Entities and accounted for its interests in DGPV Holdco 1 and DGPV Holdco 2 as equity method investments, while DGPV Holdco 3 was consolidated by the Company effective May 29, 2020 as further described in Note 5, Investments Accounted for by the Equity Method and Variable Interest Entities. Subsequent to the acquisition of the remaining interests in the DGPV Holdco Entities, the Company transferred its interests to DG-CS Master Borrower LLC, and issued debt that was utilized to repay existing project-level debt outstanding and unwind interest rate swaps for certain of the tax equity arrangements related to the underlying project funds, as further described in Note 10, Long-term Debt. The acquired SREC contract is a contract to receive incremental cash flows related to renewable energy credits from certain underlying solar projects. The membership interests acquired by the Company relate to interests under common control by GIP and were recorded at historical cost, which reflects GIP's basis recorded at fair value. The difference between the cash paid for the residual interest of the DGPV Holdco Entities and the historical value of the net assets consolidated less the carrying value of the equity method investments was recorded as an adjustment to noncontrolling interest.
The following table shows the balances that were consolidated:
| | | | | | | | | | | |
| November 2, 2020 | | May 29, 2020 |
| (In millions) | DGPV Holdco 1 and 2 (a) | | DGPV Holdco 3 (b) |
| Current assets | $ | 29 | | | $ | 32 | |
| Property, plant and equipment, net | 324 | | | 331 | |
| Intangible assets, net | 19 | | | 1 | |
| Other non-current assets | 52 | | | 37 | |
| Total assets | 424 | | | 401 | |
| | | |
| Long-term debt | 160 | | | 206 | |
| Other current and non-current liabilities | 54 | | | 84 | |
| Total liabilities | 214 | | | 290 | |
| Noncontrolling interests and redeemable noncontrolling interests | 5 | | | 6 | |
| Net assets less noncontrolling interests | $ | 205 | | | $ | 105 | |
(a)Includes DGPV 1, LLC, DGPV 2, LLC, CA Fund, LLC, DGPV 4 Borrower LLC and Puma Class B LLC
(b) Includes Renew Solar CS4 Fund LLC and Chestnut Fund LLC
The fair value of property, plant and equipment determined at GIP's acquisition date was determined primarily based on an income method using discounted cash flows and validated using a cost approach based on the replacement cost of the assets less economic depreciation. This methodology was utilized as the forecasted cash flows incorporate specific attributes of each asset including age, useful life, equipment condition and technology. The fair value of intangible assets was determined utilizing a variation of the income approach determined by discounting incremental cash flows associated with the contracts to present value. Primary assumptions utilized included estimates of generation, contractual prices, operating expenses and the weighted average cost of capital reflective of a market participant. These assumptions are considered to be a Level 3 measurement as defined in ASC 820, as they utilize inputs that are not observable in the market.
2019 Acquisitions
Duquesne University District Energy System Acquisition — On May 1, 2019, the Company, through its indirect subsidiary ECP Uptown Campus LLC, acquired the Duquesne University district energy system, totaling 87 combined MWt, located in Pittsburgh, PA. As part of the acquisition, Duquesne University entered into a 40-year Energy Services Agreement through which ECP Uptown Campus LLC will fulfill the university's electricity, chilled water and steam requirements in exchange for monthly capacity payments. The Duquesne University District Energy System operations are reflected in the Company's Thermal segment. The total investment for the project was approximately $107 million.
Carlsbad Drop Down— On December 6, 2019, the Company acquired 100% of GIP's membership interests in CBAD Holdings, LLC, which indirectly owns Carlsbad Energy Center LLC, a 527 MW natural gas fired power project located in Carlsbad, California, or the Carlsbad Drop Down Asset. The project has a 20-year power purchase and tolling agreement with San Diego Gas and Electric Company, which expires in 2038. The purchase price for the Carlsbad Drop Down was $184 million in cash, plus assumption of $803 million in project level financing including non-recourse senior notes, as further described in Note 10, Long-term Debt. The acquisition was funded with proceeds from the Clearway Energy, Inc. equity issuance, as described in Note 12, Stockholders' Equity, as well as borrowings from the Company's revolving credit facility. The Carlsbad acquisition is the result of the Company having elected its option to purchase Carlsbad pursuant to the ROFO agreement, as amended, by and among the Company, CEG and GIP. The Carlsbad operations are reflected in the Company's Conventional segment. The assets and liabilities transferred to the Company relate to interests under common control by GIP and were recorded at historical cost in accordance with ASC 805-50, Business Combinations - Related Issues. The difference between the cash paid and the historical value of the entities' equity was recorded as a distribution to GIP and decreased the balance of its noncontrolling interest. The acquisition was determined to be an asset acquisition and not a business combination, therefore the Company consolidated the financial information for Carlsbad on a prospective basis.
The following is a summary of assets and liabilities transferred in connection with the acquisition as of December 6, 2019:
| | | | | | | | |
| (In millions) | | CBAD Holdings, LLC |
| Current Assets | | $ | 36 | |
| Property, plant and equipment, net | | 572 | |
| Intangible assets, net | | 337 | |
| Other non-current assets | | 51 | |
| Total assets | | 996 | |
| | |
Debt(a) | | 791 | |
Other current and non-current liabilities(b) | | 56 | |
| Total liabilities | | 847 | |
| Net assets acquired | | $ | 149 | |
(a)Excludes net debt issuance costs of $12 million.
(b) Other current liabilities and non-current liabilities include a contingent liability of $5 million assumed by the Company during the acquisition.
2018 Acquisitions
UPMC Thermal Project Asset Acquisition— On June 19, 2018, upon reaching substantial completion, the Company acquired from NRG the UPMC Thermal Project for cash consideration of $84 million. In addition, the Company had a payable of $4 million to NRG as of December 31, 2018, $3 million of which was paid in January 2019 upon final completion of the project pursuant to the EPC agreement, and $1 million was paid in January 2020. The project added 73 MWt of thermal equivalent capacity and 7.5 MW of emergency backup electrical capacity to the Company's portfolio. The UPMC Thermal project operations are reflected in the Company's Thermal segment. The acquisition was funded with the proceeds from the sale of the Series E and Series F Notes. The assets transferred to the Company relate to interests under common control by NRG and were recorded at historical costbook value in accordance with ASC 805-50, Business Combinations - Related Issues. The difference between the cash paidpurchase price and historicalbook value of the entities' equityassets was recorded as a contribution fromdistribution to NRG and increaseddecreased the balance of its noncontrolling interest. BecauseThe acquisition was determined to be an asset acquisition and not a business combination, therefore the transaction constituted a transfer of net assets under common control, the guidance requires retrospective combination of the entities for all periods presented as if the combination has been in effect since the inception of common control.
The following is a summary of assets and liabilities transferred in connection with the acquisition of the November 2017 Drop Down Assets as of November 1, 2017:
|
| | | |
| | (In millions) |
| Assets: | |
| Current assets | $ | 7 |
|
| Property, plant and equipment | 83 |
|
| Non-current assets | 12 |
|
| Total assets | 102 |
|
| Liabilities: | |
Debt (Current and non-current) (a) | 23 |
|
| Other current and non-current liabilities | 3 |
|
| Total liabilities assumed | 26 |
|
| Net assets acquired | $ | 76 |
|
(a)Net of $3 million of net debt issuance costs.
The following tables present a summary of the Company's historical information combiningCompany consolidated the financial information for the November 2017 Drop Down Assets transferred in connection with the acquisition:UPMC Thermal project on a prospective basis.
|
| | | | | | | | | | | | | | | | | | | | | | | |
| | Year ended December 31, 2016 | | Year ended December 31, 2015 |
| | As Previously Reported (a) | | November 2017 Drop Down Assets | | As Currently Reported | | As Previously Reported (a) | | November 2017 Drop Down Assets | | As Currently Reported |
| (In millions) | | | | | | | | | | | |
| Total operating revenues | $ | 1,021 |
| | $ | 14 |
| | $ | 1,035 |
| | $ | 953 |
| | $ | 15 |
| | $ | 968 |
|
| Operating income | 218 |
| | 4 |
| | 222 |
| | 320 |
| | 6 |
| | 326 |
|
| Net income | 2 |
| | — |
| | 2 |
| | 70 |
| | 2 |
| | 72 |
|
(a)As previously reported in the May 9, 2017 Form 8-K filed in connection with the March 2017 Drop Down completed on March 27, 2017.
|
| | | | | | | | | | | |
| | As of December 31, 2016 |
| (In millions) | As Previously Reported (a) | | November 2017 Drop Down Assets | | As Currently Reported |
| Assets: | | | | | |
| Current assets | $ | 656 |
| | $ | 14 |
| | $ | 670 |
|
| Property, plant and equipment | 5,460 |
| | 94 |
| | 5,554 |
|
| Non-current assets | 2,720 |
| | 18 |
| | 2,738 |
|
| Total assets | 8,836 |
| | 126 |
| | 8,962 |
|
| Liabilities: | | | | | |
| Debt | 5,987 |
| | 62 |
| | 6,049 |
|
| Other current and non-current liabilities | 310 |
| | 4 |
| | 314 |
|
| Total liabilities | 6,297 |
| | 66 |
| | 6,363 |
|
| Net assets | $ | 2,539 |
| | $ | 60 |
| | $ | 2,599 |
|
(a)As previously reported in the May 9, 2017 Form 8-K filed in connection with the March 2017 Drop Down completed on March 27, 2017.
Since the acquisition date, the November 2017 Drop Down Assets have contributed $1 million in operating revenues to the Company.
August 2017 Drop Down Assets Central CA Fuel Cell 1, LLC — On August 1, 2017,April 18, 2018, the Company acquired the remaining 25% interestCentral CA Fuel Cell 1, LLC project in NRG Wind TE Holdco, a portfolio of 12 wind projects,Tulare, California from NRGFuelCell Energy Finance, Inc. for total cash consideration of $44 million, including working capital adjustment of $3$11 million. The purchase agreementproject added 2.8 MW of thermal capacity to the Company's portfolio, with a 20-year PPA contract with the City of Tulare. The operations of Central CA Fuel Cell are reflected in the Company's Thermal segment.
Buckthorn Solar Drop Down Asset — On March 30, 2018, the Company acquired 100% of NRG's interests in Buckthorn Renewables, LLC, which owns a 154 MW construction-stage utility-scale solar generation project located in Texas, or the Buckthorn Solar Drop Down Asset, for cash consideration of $42 million. The Company also included potential additional paymentsassumed non-recourse debt of $183 million and non-controlling interest of $19 million attributable to NRG dependent upon actual energy prices for merchant periods beginning in 2027, which were estimatedthe Class A member. The Company converted $132 million of non-recourse debt to a term loan and accrued as contingent considerationthe remainder of the outstanding debt was paid down with the contribution from
the Class A member in the amount of $8$80 million as of September 30, 2017.
upon the project reaching substantial completion in May 2018. The Company originally acquired 75% of NRG Wind TE Holdco on November 3, 2015, or November 2015purchase price for the Buckthorn Solar Drop Down Assets, which were consolidatedAsset was funded with 25% ofcash on hand and borrowings from the net assets recorded as noncontrolling interest.Company's revolving credit facility. The assets and liabilities transferred to the Company related to interests under common control by NRG and were recorded at historical cost in accordance with ASC 805-50, Business Combination - Related Issues. As the Company had reflected NRG's 25% ownership of NRG Wind TE Holdco in noncontrolling interest, the difference between the cash paid of $44 million, net of the contingent consideration of $8 million, and the historical value of the remaining 25% of $87 million as of July 31, 2017, was recorded as an adjustment to NRG's noncontrolling interest. Since the transaction constituted a transfer of entities under common control, the accounting guidance requires retrospective combination of the entities for all periods presented as if the combination has been in effect from the beginning of the financial statement period or from the date the entities were under common control (if later than the beginning of the financial statement period).
The Class A interests of NRG Wind TE Holdco are owned by a tax equity investor, or TE Investor, who receives 99% of allocations of taxable income and other items until the flip point, which occurs when the TE Investor obtains a specified return on its initial investment, at which time the allocations to the TE Investor change to 8.53%. The Company generally receives 100% of CAFD until the flip point, at which time the allocations to the Company of CAFD change to 91.47%. If the flip point has not occurred by a specified date, 100% of CAFD is allocated to the TE Investor until the flip point occurs. NRG Wind TE Holdco is a VIE and the Company is the primary beneficiary, through its position as managing member, and consolidates NRG Wind TE Holdco.
March 2017 Drop Down Assets — On March 27, 2017, the Company acquired the following interests from NRG: (i) Agua Caliente Borrower 2 LLC, which owns a 16% interest (approximately 31% of NRG's 51% interest) in the Agua Caliente solar farm, one of the ROFO Assets, representing ownership of approximately 46 net MW of capacity and (ii) NRG's interests in the Utah Solar Portfolio. Agua Caliente is located in Yuma County, AZ and sells power subject to a 25-year PPA with Pacific Gas and Electric, with 22 years remaining on that contract. The seven utility-scale solar farms in the Utah Solar Portfolio are owned by the following entities: Four Brothers Capital, LLC, Iron Springs Capital, LLC, and Granite Mountain Capital, LLC. These utility-scale solar farms achieved commercial operations in 2016, sell power subject to 20-year PPAs with PacifiCorp, a subsidiary of Berkshire Hathaway and are part of a tax equity structure with Dominion Solar Projects III, Inc., or Dominion, through which the Company is entitled to receive 50% of cash to be distributed, as further described below. The Company paid cash consideration of $132 million, including $2 million of working capital. The acquisition of the March 2017 Drop Down Assets was funded with cash on hand. The Company recorded the acquired interests as equity method investments. The Company also assumed non-recourse debt of $41 million and $287 million on Agua Caliente Borrower 2 LLC and the Utah Solar Portfolio, respectively, as
further described in Note 10, Long-term Debt, as well as its pro-rata share of non-recourse project-level debt of Agua Caliente Solar LLC.
The assets and liabilities transferred to the Company relate to interests under common control by NRG and were recorded at historical cost in accordance with ASC 805-50, Business Combination - Related Issues. The difference between the cash paid and the historical value of the entities' equity of $8 million was recorded as an adjustment to NRG's noncontrolling interest. Since the transaction constituted a transfer of entities under common control, the accounting guidance requires retrospective combination of the entities for all periods presented as if the combination has been in effect from the beginning of the financial statement period or from the date the entities were under common control (if later than the beginning of the financial statement period). Accordingly, in connection with the retrospective adjustment of prior periods, the Company adjusted its financial statements to reflect its results of operations, financial position and cash flows as if it recorded its interests in the Agua Caliente Borrower 2 LLC on January 1, 2016, and its interests in the Utah Solar Portfolio on November 2, 2016.
The following is a summary of assets and liabilities transferred in connection with the acquisition of the March 2017 Drop Down Assets as of March 27, 2017:
|
| | | |
| | (In millions) |
| Assets: | |
| Cash | $ | 6 |
|
| Equity investment in projects | 456 |
|
| Total assets acquired | 462 |
|
| Liabilities: | |
Debt (Current and non-current) (a) | 320 |
|
| Other current and non-current liabilities | 3 |
|
| Total liabilities assumed | 323 |
|
| Net assets acquired | $ | 139 |
|
(a)Net of $8 million of debt issuance costs.
2016 Acquisitions
CVSR Drop Down — Prior to September 1, 2016, the Company had a 48.95% interest in CVSR, which was accounted for as an equity method investment.On September 1, 2016, the Company acquired from NRG the remaining 51.05% interest of CVSR Holdco LLC, which indirectly owns the CVSR solar facility, or the CVSR Drop Down, for total cash consideration of $78.5 million, plus an immaterial working capital adjustment. The acquisition was funded with cash on hand. The Company also assumed additional debt of $496 million, which represents 51.05% of the CVSR project level debt and 51.05% of the notes issued under the CVSR Holdco Financing Agreement, as of the closing date. The acquisition was funded with cash on hand.
The assets and liabilities transferred to the Company relate to interests under common control by NRG and were recorded at historical cost in accordance with ASC 805-50, Business Combinations - Related Issues. The difference between the cash paid and historical value of the CVSR Drop Down of $112 million, as well as $6 million of AOCL, was recorded as a distribution to NRG with the offset to noncontrolling interest. Because the transaction constituted a transfer of net assets under common control, the guidance requires retrospective combination of the entities for all periods presented as if the combination has been in effect since the inception of common control. In connection with the retrospective adjustment of prior periods, the Company now consolidates CVSR and 100% of its debt, consisting of $771 million of project level debt and $200 million of notes issued under the CVSR Holdco Financing Agreement as of September 1, 2016. In addition, the Company has removed the equity method investment from all prior periods and adjusted its financial statements to reflect its results of operations, financial position and cash flows as if it had consolidated CVSR from the beginning of the financial statement period.
2015 Acquisitions
November 2015 Drop Down Assets from NRG — On November 3, 2015, the Company acquired the November 2015 Drop Down Assets, a portfolio of 12 wind facilities totaling 814 net MW, from NRG for cash consideration of $207 million. The Company was responsible for its pro-rata share of non-recourse project debt of $193 million and noncontrolling interest associated with a tax equity structure of $159 million (as of the acquisition date).
The Company funded the acquisition with borrowings from its revolving credit facility. The assets and liabilities transferred to the Company relate to interests under common control by NRG and were recorded at historical cost.Issues. The difference between the cash paid and historical value of the entities' equity was recorded as a distribution from NRG with the offset to noncontrolling interest.
Desert Sunlight — On June 29, 2015, the Company acquired 25% of the membership interest in Desert Sunlight Investment Holdings, LLC, which owns two solar photovoltaic facilities that total 550 MW, located in Desert Center, California from EFS Desert Sun, LLC, an affiliate of GE Energy Financial Services for a purchase price of $285 million. Power generated by the facilities is sold to Southern California Edison and Pacific Gas and Electric under long-term PPAs with approximately 20 years and 25 years of remaining contract life, respectively. The Company accounts for its 25% investment as an equity method investment.
Spring Canyon — On May 7, 2015, the Company acquired a 90.1% interest in Spring Canyon II, a 32 MW wind facility, and Spring Canyon III, a 28 MW wind facility, each located in Logan County, Colorado, from Invenergy Wind Global LLC. The purchase price was funded with cash on hand. Power generated by Spring Canyon II and Spring Canyon III is sold to Platte River Power Authority under long-term PPAs, each with approximately 24 years of remaining contract life.
University of Bridgeport Fuel Cell— On April 30, 2015, the Company completed the acquisition of the University of Bridgeport Fuel Cell project in Bridgeport, Connecticut from FuelCell Energy, Inc. The project added an additional 1.4 MW of thermal capacity to the Company's portfolio, with a 12-year contract, with the option for a 7-year extension. The acquisition is reflected in the Company's Thermal segment.
January 2015 Drop Down Assets from NRG — On January 2, 2015, the Company acquired the following projects from NRG: (i) Laredo Ridge, an 80 MW wind facility located in Petersburg, Nebraska, (ii) Tapestry, which includes Buffalo Bear, a 19 MW wind facility in Buffalo, Oklahoma; Taloga, a 130 MW wind facility in Putnam, Oklahoma; and Pinnacle, a 55 MW wind facility in Keyser, West Virginia, and (iii) Walnut Creek, a 485 MW natural gas facility located in City of Industry, California, for total cash consideration of $489 million, including $9 million for working capital, plus assumed project-level debt of $737 million. The Company funded the acquisition with cash on hand and drawings under its revolving credit facility. The assets and liabilities transferred to the Company relate to interests under common control by NRG and were recorded at historical cost. The difference between the cash paid and the historical value of the entities' equity of $61 million, as well as $23 million of AOCL, was recorded as a distribution to NRG and reduceddecreased the balance of its noncontrolling interest. Since the transaction constituted a transfer of net asset under common control, the guidance required retrospective combination of the entities for all periods presented as if the combination had been in effect since the inception of common control. The project sells power under a 25-year PPA to the City of Georgetown, Texas, which commenced in July 2018. The operations of the Buckthorn project are reflected in the Company's Renewables segment.
2020 Dispositions
Sale of RPV Holdco 1 LLC — On May 14, 2020, the Company sold its interests in RPV Holdco 1 LLC to a third party for net proceeds of approximately $75 million. The Company previously accounted for its interest in RPV Holdco 1 LLC as an equity method investment. The sale of the investment resulted in a gain of approximately $49 million. Sale of Energy Center Dover LLC and Energy Center Smyrna LLC Assets — On March 3, 2020, the Company, through Clearway Thermal LLC, sold 100% of its interests in Energy Center Dover LLC and Energy Center Smyrna LLC to DB Energy Assets, LLC for cash proceeds of approximately $15 million.
2019 Dispositions
Sale of HSD Solar Holdings, LLC Assets — On October 8, 2019, the Company, through HSD Solar Holdings, LLC, or HSD, sold 100% of its interests in certain distributed generation solar facilities totaling 6 MW to the offtaker under the PPA, for cash consideration of $20 million, as a result of the offtaker exercising its right to purchase the project pursuant to the PPA. In conjunction with the sale, the Company repaid in full the non-recourse lease financing associated with the HSD projects. The repaid amount was net of cash released at closing and totaled $23 million.
Note 4 — Property, Plant and Equipment
The Company’s major classes of property, plant, and equipment were as follows:
| | | | | | | | | | | | | | | | | |
| December 31, 2020 | | December 31, 2019 | | Depreciable Lives |
| (In millions) | | |
| Facilities and equipment | $ | 9,254 | | | $ | 7,676 | | | 2 - 45 Years |
| Land and improvements | 224 | | | 173 | | | |
Construction in progress (a) | 62 | | | 94 | | | |
| Total property, plant and equipment | 9,540 | | | 7,943 | | | |
| Accumulated depreciation | (2,323) | | | (1,880) | | | |
| Net property, plant and equipment | $ | 7,217 | | | $ | 6,063 | | | |
|
| | | | | | | | | |
| | December 31, 2017 | | December 31, 2016 | | Depreciable Lives |
| | (In millions) | | |
| Facilities and equipment | $ | 6,289 |
| | $ | 6,339 |
| | 2 - 45 Years |
| Land and improvements | 166 |
| | 167 |
| | |
Construction in progress (a) | 34 |
| | 24 |
| | |
| Total property, plant and equipment | 6,489 |
| | 6,530 |
| | |
| Accumulated depreciation | (1,285 | ) | | (976 | ) | | |
| Net property, plant and equipment | $ | 5,204 |
| | $ | 5,554 |
| | |
(a) As of December 31, 20172020 and 2016,2019, construction in progress includes $24$14 million and $20$10 million of capital expenditures that relate to prepaid long-term service agreements in the Conventional segment, respectively.
Depreciation expense related to property, plant and equipment during the years ended December 31, 2020, 2019 and 2018 was $420 million, $395 million and $330 million, respectively. The Company accelerated depreciation of the Pinnacle wind project in connection with the repowering project in 2020, which resulted in additional depreciation expense in the amount of $9 million. The Company accelerated depreciation of the Wildorado Wind and Elbow Creek projects in connection with the repowering project in 2019, which resulted in additional depreciation expense in the amount of $54 million.
The Company recorded long-lived asset impairments during the yearsyear ended December 31, 20172020 and 2016,December 31, 2019, as further described inNote 9, Asset Impairments.
Note 5 — Investments Accounted for by the Equity Method and Variable Interest Entities
Equity Method Investments
The following table summarizes the Company's equity method investmentsmaximum exposure to loss as of December 31, 2017:2020 is limited to its equity investment in the unconsolidated entities, as further summarized in the table below:
| | | | | | | | | | | | | | |
| Name | | Economic Interest | | Investment Balance |
| | | | (In millions) |
Utah Solar Portfolio (a) | | 50% | | $ | 255 | |
| Desert Sunlight | | 25% | | 244 | |
Agua Caliente Solar(b) | | 16% | | 83 | |
GenConn(c) | | 50% | | 90 | |
| San Juan Mesa | | 75% | | 33 | |
| Elkhorn Ridge | | 66.7% | | 38 | |
| Avenal | | 50% | | (2) | |
| | | | $ | 741 | |
| | | | |
| | | | |
|
| | | | |
| Name | | Economic Interest | | Investment Balance |
| | | | | (In millions) |
Utah Solar Portfolio (a) | | 50% | | $345 |
| Desert Sunlight | | 25% | | 272 |
GenConn(b) | | 50% | | 102 |
| Agua Caliente Borrower 2 | | 16% | | 92 |
Elkhorn Ridge(c) | | 66.7% | | 73 |
San Juan Mesa(c) | | 75% | | 66 |
NRG DGPV Holdco 1 LLC (d) | | 95% | | 76 |
NRG DGPV Holdco 2 LLC (d) | | 95% | | 61 |
NRG DGPV Holdco 3 LLC (d) | | 99% | | 39 |
NRG RPV Holdco 1 LLC(d) | | 95% | | 58 |
| Avenal | | 50% | | (6) |
| Total equity investments in affiliates | | | | $1,178 |
(a) Economic interest based on cash to be distributed. Four Brothers Solar, LLC, Granite Mountain Holdings, LLC and Iron Springs Holdings, LLC are tax equity structures and VIEs. The related allocations are described below.
(b)On February 3, 2021, the Company acquired an additional 35% equity interest in Agua Caliente Solar and following the close of the transaction owns 51% equity interests in Agua Caliente and will remove its equity method investment and consolidate its interest from the date of the acquisition.
(c) GenConn is a variable interest entity.
(c) San Juan Mesa and Elkhorn Ridge are part of the Wind TE Holdco tax equity structure, as described below. San Juan Mesa and Elkhorn Ridge are owned 75% and 66.7%, respectively, by Wind TE Holdco. The Company owns 100% of the Class B interests in Wind TE Holdco.
(d) Economic interest based on cash to be distributed. NRG DGPV Holdco 1 LLC, NRG DGPV Holdco 2 LLC, NRG DGPV Holdco 3 LLC and NRG RPV Holdco 1 LLC are tax equity structures and VIEs. The related allocations are described below.As of December 31, 20172020 and 2016,2019, the Company had $57$10 million and $51$138 million respectively, of undistributed earnings from its equity method investments.
The Company acquired its interest in Desert Sunlight on June 30, 2015, for $285 million, which resulted in a difference between the purchase price and the basis of the acquired assets and liabilities of $171 million. The difference is attributable to the fair value of the property, plant and equipment and power purchase agreements. In addition, the difference between the basis of the acquired assets and liabilities and the purchase price for the Utah Solar Portfolio (Four Brothers Solar, LLC, Granite Mountain Holdings, LLC and Iron Springs Holdings, LLC) of $106 million is attributable to the fair value of the property, plant and equipment. The Company is amortizing the related basis differences to equity in earnings (losses) over the related useful life of the underlying assets acquired.
Non-recourse project-level debt of unconsolidated affiliates
The Company's pro-rata share of non-recourse debt held by unconsolidated affiliates was $777$481 million as of December 31, 2017.
2020.
The following tables present summarized financial information for the Company's significant equity method investments:
| | | | | | | | | | | | | | | | | |
| Year Ended December 31, |
| 2020 | | 2019 | | 2018 |
| Income Statement Data: | (In millions) |
| GenConn | | | | | |
| Operating revenues | $ | 60 | | | $ | 60 | | | $ | 65 | |
| Operating income | 26 | | | 27 | | | 32 | |
| Net income | 17 | | | 17 | | | 22 | |
| Desert Sunlight | | | | | |
| Operating revenues | 209 | | | 205 | | | 208 | |
| Operating income | 142 | | | 123 | | | 129 | |
| Net income | 88 | | | 58 | | | 84 | |
| | | | | |
| | | | | |
| | | | | |
| | | | | |
| | | | | |
| | | | | |
| | | | | |
| | | | | |
| | | | | |
| | | | | |
| | | | | |
| | | | | |
Other(a) | | | | | |
| Operating revenues | 299 | | | 318 | | | 332 | |
| Operating income | 138 | | | 110 | | | 126 | |
| Net income | $ | 60 | | | $ | 50 | | | $ | 86 | |
| | | As of December 31, |
| | | 2020 | | 2019 |
| Balance Sheet Data: | | | (In millions) |
| GenConn | | | | |
| Current assets | | $ | 40 | | | $ | 37 | |
| Non-current assets | | 344 | | | 342 | |
| Current liabilities | | 17 | | | 16 | |
| Non-current liabilities | | 185 | | | 176 | |
| Desert Sunlight | | | | |
| Current assets | | 132 | | | 209 | |
| Non-current assets | | 1,244 | | | 1,296 | |
| Current liabilities | | 71 | | | 545 | |
| Non-current liabilities | | 921 | | | 484 | |
| | | | |
| | | | |
| | | | |
| | | | |
| | | | |
| | | | |
| | | | |
| | | | |
| | | | |
| | | | |
| | | | |
| | | | |
| | | | |
| | | | |
| | | | |
| | | | |
| | | | |
Other (a) | | | | |
| Current assets | | 177 | | | 279 | |
| Non-current assets | | 2,201 | | | 3,412 | |
| Current liabilities | | 114 | | | 809 | |
| Non-current liabilities | | 700 | | | 500 | |
| Redeemable noncontrolling interest | | $ | 0 | | | $ | (1) | |
|
| | | | | | | | | | | | |
| | Year Ended December 31, |
| | 2017 | | 2016 | | 2015 |
| Income Statement Data: | (In millions) |
| GenConn | | | | | |
| Operating revenues | $ | 71 |
| | $ | 72 |
| | $ | 78 |
|
| Operating income | 36 |
| | 38 |
| | 40 |
|
| Net income | 26 |
| | 26 |
| | 28 |
|
| Desert Sunlight | | | | | |
| Operating revenues | 207 |
| | 211 |
| | 206 |
|
| Operating income | 127 |
| | 129 |
| | 124 |
|
| Net income | 80 |
| | 80 |
| | 73 |
|
Utah Solar Portfolio (a) | | | | | |
| Operating revenues | 75 |
| | 13 |
| | — |
|
| Operating income (loss) | 18 |
| | (6 | ) | | (1 | ) |
| Net income (loss) | 18 |
| | (6 | ) | | (1 | ) |
DGPV entities (b) | | | | | |
| Operating revenues | 37 |
| | 14 |
| | 1 |
|
| Operating income | 7 |
| | 2 |
| | — |
|
| Net loss | (3 | ) | | — |
| | — |
|
| RPV Holdco | | | | | |
| Operating revenues | 16 |
| | 13 |
| | 4 |
|
| Operating income | 3 |
| | 2 |
| | (6 | ) |
| Net income (loss) | $ | 3 |
| | $ | 2 |
| | $ | (6 | ) |
| | | | As of December 31, |
| | | | 2017 | | 2016 |
| Balance Sheet Data: | | | (In millions) |
| GenConn | | | | |
| Current assets | | $ | 38 |
| | $ | 36 |
|
| Non-current assets | | 374 |
| | 389 |
|
| Current liabilities | | 18 |
| | 16 |
|
| Non-current liabilities | | 189 |
| | 196 |
|
| Desert Sunlight | | | | |
| Current assets | | 133 |
| | 281 |
|
| Non-current assets | | 1,350 |
| | 1,401 |
|
| Current liabilities | | 64 |
| | 64 |
|
| Non-current liabilities | | 1,003 |
| | 1,043 |
|
Utah Solar Portfolio (a) | | | | |
| Current assets | | 13 |
| | 20 |
|
| Non-current assets | | 1,090 |
| | 1,105 |
|
| Current liabilities | | 5 |
| | 14 |
|
| Non-current liabilities | | 24 |
| | 38 |
|
DGPV entities (b) | | | | |
| Current assets | | 74 |
| | 44 |
|
| Non-current assets | | 671 |
| | 562 |
|
| Current liabilities | | 83 |
| | 112 |
|
| Non-current liabilities | | 216 |
| | 23 |
|
| Redeemable Noncontrolling Interest | | 44 |
| | 28 |
|
| RPV Holdco | | | | |
| Current assets | | 3 |
| | 15 |
|
| Non-current assets | | 183 |
| | 191 |
|
| Current liabilities | | — |
| | 11 |
|
| Non-current liabilities | | 7 |
| | 7 |
|
| Redeemable Noncontrolling Interest | | $ | 16 |
| — |
| $ | — |
|
(a) Includes Agua Caliente, Elkhorn Ridge, Utah Solar Portfolio, was acquired by NRG on November 2, 2016.
(b) IncludesSan Juan Mesa, DGPV Holdco 1, DGPV Holdco 2 and DGPV Holdco 3. DGPV Holdco 1, DGPV Holdco 2 and DGPV Holdco 3. were consolidated by the Company during 2020 and are therefore excluded from the summarized balance sheet data as of December 31, 2020.
Variable Interest Entities, or VIEs
Entities that are Consolidated
NRG Wind TEThe Company has a controlling financial interest in certain entities which have been identified as VIEs under ASC 810, Consolidations, or ASC 810. These arrangements are primarily related to tax equity arrangements entered into with third parties in order to monetize certain tax credits associated with wind and solar facilities and are further described below.
DGPV Holdco 3 Consolidation —DGPV Holdco 3 LLC or DGPV Holdco 3 owned approximately 113 MW of Distributed Solar capacity, based on cash to be distributed, with a weighted average remaining contract life of approximately 21 years. On May 29, 2020, the final construction projects for DGPV Holdco 3 were placed in service which resulted in a reconsideration event for consolidation of the entity. Upon the reconsideration event, the Company determined that it was the primary beneficiary of DGPV Holdco 3, as it is entitled to 99% of allocations of income and cash distributions from the entity. As such, effective on May 29, 2020, the Company consolidates DGPV Holdco 3, and records the interest owned by CEG as noncontrolling interest. DGPV Holdco 3 owns an interest in two tax equity funds with tax equity investors, both of which are consolidated by DGPV Holdco 3, and the interests owned by the tax equity investors are shown as noncontrolling interests. The Company removed its equity method investment in DGPV Holdco 3 of $155 million as of May 29, 2020 and recorded the difference between the net assets consolidated and the investment balance as a reduction to noncontrolling interests. The Company acquired CEG's interest in DGPV Holdco 3 on November 2, 2020 as further described in Note 3, Acquisitions and Dispositions and below.
Prior to the reconsideration event described above, the Company invested $10 million of cash in DGPV Holdco 3 during the first half of 2020.
DGPV Tax Equity Funds — As described in Note 3, Business Acquisitions and Dispositions, on August 1, 2017,November 2, 2020, the Company acquired the Class B membership interests in DGPV Holdco 1, DGPV Holdco 2 and DGPV Holdco 3, or the DGPV Holdco Entities, from NRGRenew DG Holdings LLC, a subsidiary of CEG. The Company previously held the remaining 25% interestClass A membership interests in NRG Wind TE Holdco. NRG Wind TEthe DGPV Holdco Entities and accounted for its interests in DGPV Holdco 1 and DGPV Holdco 2 as equity method investments, while DGPV Holdco 3 was consolidated by the Company effective May 29, 2020 as further described above. Concurrent with the acquisition, the Company transferred its interests to DG-CS Master Borrower LLC. Effective with the acquisition of the Class B membership interests of the DGPV Holdco Entities, the Company consolidates all of the DGPV Holdco Entities, including DG-CS Master Borrower LLC, and its subsidiaries, which consist of 7 projects including six tax equity funds that collectively own approximately 172 distributed solar projects with a combined 286 MW of capacity. Each of the six tax equity funds is a VIE, where the Company is the primary beneficiary and consolidates the fund, with the tax equity investor's interest shown as noncontrolling interest or redeemable noncontrolling interest. The Company utilizes the HLBV method to determine its share of the income or losses in the investees. The Company removed its equity method investments in DGPV Holdco 1 and DGPV Holdco 2 of $144 million as of November 2, 2020 and recorded the difference between the net assets consolidated and the investment balance as a reduction to noncontrolling interests.
Langford Tax Equity Partnership, LLC — As described in Note 3, Acquisitions and Dispositions, on November 20, 2020, the Company acquired 100% of the Class B membership interest in Langford Holding LLC from CEG for $55 million as well as 100% of the Class A membership interests in Langford Holding LLC from a third party investor for $9 million. Langford Holding LLC owns 100% of the membership interests in Langford Class B Holdco LLC, which owns 100% of the Class B interest in Langford Tax Equity Partnership LLC, which indirectly owns 100% of the interest in a 160 MW wind project. Langford Tax Equity Partnership LLC is a variable interest entity. The Company is the primary beneficiary, through its position as managing member, and indirectly consolidates NRGLangford Tax Equity Partnership LLC, through Langford Class B Holdco LLC. The Class A member is a tax equity investor whose interest is reflected as noncontrolling interest on the Company's consolidated balance sheet. The project achieved repowering COD in November 2020. The Company utilizes the HLBV method for income or loss allocation to the tax equity investor's noncontrolling interest.
Lighthouse Partnership Arrangements
Lighthouse Renewable Holdco LLC — As described in Note 3, Acquisitions and Dispositions, onSeptember 1, 2020, the Company, through its indirect subsidiary Lighthouse Renewable Class A LLC, acquired the Class A membership interests in Lighthouse Renewable Holdco LLC (formerly Mesquite Star Pledgor LLC) from Clearway Renew LLC, a subsidiary of CEG. Lighthouse Renewable Holdco LLC is a VIE and at the time of the acquisition the Company was not the primary beneficiary. Accordingly, the Company recorded the acquired interest as an equity method investment.
On December 21, 2020, CEG sold its Class B membership interest in Lighthouse Renewable Holdco LLC to a third-party investor which resulted in a reconsideration event for consolidation of the entity. Upon the reconsideration event, the Company determined that it was the primary beneficiary of Lighthouse Renewable Holdco LLC. As such, effective on
December 21, 2020, the Company consolidates Lighthouse Renewable Holdco LLC, and shows the Class B interests owned by the third party investor as noncontrolling interests on the Company’s consolidated balance sheet. Through its Class A membership interests, the Company receives 50.01% of income and distributable cash. In addition, Lighthouse Renewable Holdco LLC holds the Class B interests in a tax equity fund, Mesquite Star Tax Equity Holdco LLC, that holds the Mesquite Star project. The tax equity investor's interest is shown as noncontrolling interest. The HLBV method is utilized to allocate the income or losses of Mesquite Star Tax Equity Holdco LLC.
Rosie TargetCo LLC — As described in Note 3, Acquisitions and Dispositions, on December 21, 2020, the Company acquired 100% of CEG's Class A membership interests of Rosie TargetCo LLC which owns 100% interest in Rosie Class B LLC, which in turn owns 100% of the Class B membership interest of Rosie TE Holdco LLC. The Company consolidates Rosie TargetCo LLC as a VIE as the Company is the primary beneficiary, through its role as managing member. The Class B membership interest of Rosie TargetCo LLC is owned by a third-party investor and is reflected as noncontrolling interest on the Company’s consolidated balance sheet. Through its Class A membership interests in Rosie TargetCo LLC, the Company receives 50% of income and distributable cash. Rosie TargetCo indirectly consolidates Rosie TE Holdco LLC, which is also a VIE. The tax equity investor's interest is shown as noncontrolling interest. The HLBV method is utilized to allocate the income or losses of Rosie TE Holdco LLC.
Yield Protection Agreement — In connection with the Lighthouse Partnership Agreements, the Company entered into an agreement which provides for a reallocation of cash distributions to the third-party investor in order to ensure that the investor achieves a target return. The agreement provides for the reallocation of up to 80% of cash distributed to the Company's Class A members beginning after the 15th year of the arrangement. The Company is accounting for this agreement as a guarantee and has recorded the fair value of its estimated liability under the arrangement of $15 million as a non-current liability with a corresponding offset to additional paid-in capital.
Kawailoa Partnership — On August 31, 2018, the Company entered into an agreement with Clearway Renew LLC, a subsidiary of CEG, to acquire the Class A membership interests in the Kawailoa Solar Partnership LLC, or Kawailoa Partnership, for $9 million in cash consideration. The purpose of the partnership is to own, finance, operate, and maintain the Kawailoa Solar project, a 49 MW utility-scale solar generation project, an indirect subsidiary of the Kawailoa Partnership, located in Oahu, Hawaii. The Kawailoa Solar project is contracted to sell power under a 22-year PPA with Hawaiian Electric Company, or HECO. The Kawailoa Solar project is 51% owned by the Kawailoa Partnership, with the remaining 49% owned by a third-party investor. The Kawailoa Partnership consolidates the Kawailoa Solar project through its controlling majority interest. On May 7, 2019, the Company made an initial capital contribution of $2 million, which represents 20% of its total anticipated capital contributions. The Company assumed non-recourse debt of $120 million, as further described in Note 10, Long-term Debt, and non-controlling interests attributable to third parties in the amount of $21 million. Effective May 1, 2019, the Company, as a Class A member, is the primary beneficiary through its position as managing member and consolidates Kawailoa Partnership. Allocations of income and taxable items are equal to the distributions of available cash, which is currently 95% to the Company and 5% to Clearway Renew LLC. The Company's acquisition of the Class A membership interests in the Kawailoa Partnership was accounted for as a transfer of assets under common control and was recorded at historical cost in accordance with ASC 805-50, Business Combinations — Related Issues. The difference between the cash paid and payable recorded and the historical value of the assets was recorded as a distribution to CEG and decreased the balance of its noncontrolling interest.
Upon reaching COD in November of 2019, the Kawailoa Solar project's fixed assets were placed in service and began to depreciate. On December 22, 2019, Kawailoa Solar Holdings LLC, a tax equity fund, received its final equity contribution of $61 million. The proceeds were utilized to repay the ITC bridge loan in the amount of $57 million, and the construction debt was converted to term debt (and upsized, with an additional $5 million drawn). Distributions were paid to the third-party investor and Clearway Renew LLC, funded by the excess of the tax equity investment and the term loan upsizing above the amount of the bridge loan repayment and related fees. On December 27, 2019, the Company made its substantial completion contribution of $7 million into the Kawailoa Partnership, which was also utilized to make a distribution to Clearway Renew LLC. In addition, the Company started applying HLBV to allocate income attributable to the tax equity investor during the fourth quarter of 2019.
Oahu Partnership — On August 31, 2018, the Company entered into an agreement with Clearway Renew LLC, a subsidiary of CEG, to acquire the Class A membership interests in the Zephyr Oahu Partnership LLC, or Oahu Partnership, for $20 million in cash consideration. The purpose of the partnership is to own, finance, operate, and maintain the Oahu Solar projects, which consist of Lanikuhana and Waipio, utility-scale solar generation projects with rated capacity of 15 MW and 46 MW, respectively, the indirect subsidiaries of the Oahu Partnership, located in Oahu, Hawaii. The Oahu Solar projects are contracted to sell power under a 22-year PPA with HECO. The Oahu Partnership consolidates the Oahu Solar projects through its controlling majority interest. On March 8, 2019, the Company made an initial capital contribution of $4 million, which represents 20% of its total anticipated capital contributions. The Company also assumed non-recourse debt of $143 million, as
further described in Note 10, Long-term Debt, and $18 million of non-controlling interest attributable to a tax equity investor's initial contribution. Effective March 8, 2019, the Company, as a Class A member, is the primary beneficiary through its position as managing member and consolidates Oahu Partnership. Allocations of income and taxable items are equal to the distributions of available cash, which is currently 95% to the Company and 5% to Clearway Renew LLC. The Company's acquisition of the Class A membership interests in the Oahu Partnership was accounted for as a transfer of assets under common control and was recorded at historical cost in accordance with ASC 805-50, Business Combinations - Related Issues. The difference between the cash paid and payable recorded and the historical value of the assets was recorded as a contribution from CEG and increased the balance of its noncontrolling interest.
Upon reaching COD in September 2019, the Oahu Solar projects' fixed assets were placed in service and began to depreciate. On November 12, 2019, the tax equity investor made its final tax-equity contribution of $71 million and the proceeds were utilized to repay the related ITC bridge loan in the amount of $67 million, and the construction loan was converted to term debt. The Company paid the remaining 80% of the equity commitment in the amount of $16 million to Clearway Renew LLC when the Oahu Solar projects reached certain milestones in December 2019. In addition, the Company started applying HLBV to allocate income attributable to the tax equity investor during the third quarter of 2019.
Wind TE Holdco — As of December 31, 2018, Wind TE Holdco was a VIE and the Company, as the holder of Class B shares and the primary beneficiary through its position as managing member consolidated Wind TE Holdco. The Class A interestsshares of NRG Wind TE Holdco arewere owned by a tax equity investor, orwho received 99% of allocations of taxable income and other items.
On January 2, 2019, the Company bought out 100% of the Class A membership interests from the TE Investor, who receivesfor cash consideration of $19 million. The Company recorded the difference between the value of the interest bought and the cash received to equity and allocated it between non-controlling interest and additional paid in capital based on the economic ownership interest between CEG and public interest as of January 2, 2019.
Repowering Partnership II LLC — On August 30, 2018, Wind TE Holdco, an indirect subsidiary of the Company, formed Repowering Partnership LLC with Clearway Renew LLC, an indirect subsidiary of CEG, in order to facilitate the repowering of wind facilities of two of its indirect subsidiaries, Elbow Creek Wind Project LLC, or Elbow Creek, and Wildorado Wind LLC, or Wildorado Wind. Wind TE Holdco contributed its interests in the two facilities and Clearway Renew LLC contributed a turbine supply agreement, including title to certain components that qualify for production tax credits. Wind TE Holdco is the managing member of the partnership and consolidates the entity, which is a VIE. Clearway Renew LLC is initially entitled to allocations of 21% of income, which is reflected in Wind TE Holdco’s noncontrolling interests.
On June 14, 2019, Repowering Partnership LLC was replaced with Repowering Partnership II LLC as the owner of the Elbow Creek and Wildorado Wind projects, as well as Repowering Partnership Holdco LLC, which concurrently entered into a financing agreement for construction debt commitment totaling $352 million, as further described in Note 10, Long-term Debt.
Repowering of the Elbow Creek project was completed and on November 26, 2019, a third party tax equity investor purchased 100% of the Class A membership interests in Elbow Creek Repowering Tax Equity Holdco LLC, or Elbow TE Holdco for $89 million pursuant to a membership interest purchase agreement dated June 14, 2019. The Company also contributed $4 million. In connection with the completion of the Elbow Creek repowering, the construction loan of $93 million was repaid with the proceeds from the combined proceeds from the tax equity investor and the Company. The Company began applying HLBV during the fourth quarter to allocate income between the partners of Elbow TE Holdco.In connection with the closing, the allocations of income at Repowering Partnership II LLC (which indirectly consolidates both projects) changed to 59.63% for Wind TE Holdco LLC (the Company member) and 40.37% for CWSP Wildorado Elbow Holding LLC (the CEG member).In addition, approximately half of the repowered Wildorado equipment was placed in service in December 2019, with the remaining equipment being placed in service in January of 2020. In connection with repowering of the projects, the Company revised the remaining useful life of the property, plant and equipment that was replaced, resulting in additional expense of $54 million during the year ended December 31, 2019 related to accelerated depreciation.
On February 7, 2020, a third party tax equity investor purchased 100% of the Class A membership interests in Wildorado TE Holdco, for $148 million. In addition, the Company contributed $112 million to Wildorado TE Holdco. The combined proceeds were used to repay construction debt under the Repowering Partnership Holdco credit agreement, as described in Note 10, Long-term Debt. The third party tax equity investor, or Wildorado Investor, will receive 99% of allocations of taxable income and other items until the flip point, which occurs when the TEWildorado Investor obtains a specified return on its initial investment, at whichor the last day of the PTC period, whichever occurs sooner. At such time, the allocations to the TEWildorado Investor will change to 8.53%5%. Until such time, the Wildorado Investor will receive a variable percentage of cash distributions. Wildorado TE Holdco is a VIE and the Repowering Partnership II LLC is the primary beneficiary through its position as managing member. As a result, the Company consolidates Wildorado TE Holdco, with the Wildorado Investor's interest shown as noncontrolling interest. In connection with
the Wildorado TE Holdco closing, the allocations of income at Repowering Partnership II LLC changed to 60.14% for Wind TE Holdco LLC (the Company member) and 39.86% for CWSP Wildorado Elbow Holding LLC (the CEG member).
On May 11, 2020, the Company acquired CEG's interest in Repowering Partnership II LLC, for cash consideration of $70 million. Repowering Partnership II LLC is no longer a VIE and subsequent to the acquisition, is a wholly-owned subsidiary of the Company. Repowering Partnership II LLC continues to own interests in two VIEs, Wildorado Repowering Tax Equity Holdco LLC, or Wildorado TE Holdco, and Elbow Creek Repowering Tax Equity Holdco LLC, or Elbow Creek TE Holdco. The Company generally receives 100%removed the related noncontrolling interest balance of CAFD until$8 million and recorded the flip point, at which timedifference between the allocationscash paid and the noncontrolling interest balance removed as a reduction to the Company of CAFD change to 91.47%. If the flip point has not occurred by a specified date, 100% of CAFD is allocated to the TE Investor until the flip point occurs. noncontrolling interests. The Company utilizes the HLBV method to determine the net income or loss allocated to the TE Investortax equity noncontrolling interest.
Buckthorn Renewables, LLC — On March 30, 2018, the Company acquired 100% of NRG’s interest in a 154 MW construction-stage utility-scale solar generation project, Buckthorn Renewables, LLC, which owns 100% interest in Buckthorn Solar Portfolio, LLC, which in turn owns 100% of the Class B membership interests in Buckthorn Holdings, LLC. Buckthorn Holdings, LLC is a tax equity fund, which is a variable interest entity that is consolidated by Buckthorn Solar Portfolio, LLC. The Company is the primary beneficiary, through its position as managing member, and indirectly consolidates Buckthorn Holdings, LLC through Buckthorn Solar Portfolio, LLC. The Class A member is a tax equity investor who made its initial contribution of $19 million on March 30, 2018, which is reflected as noncontrolling interest on the Company’s consolidated balance sheet. The project achieved substantial completion in May 2018, at which time the remaining tax equity contributions of $80 million were funded. The Company utilizes the HLBV method for income or loss allocation to the tax equity investor's noncontrolling interest.
Alta TE Holdco — On June 30, 2015, the Company sold an economic interest in Alta TE Holdco to a financial institution in order to monetize certain cash and tax attributes, primarily PTCs. The financial institution, or Alta Investor, receives 99% of allocations of taxable income and other items until the flip point, which occurs when the Alta Investor obtains a specified return on its initial investment, at which time the allocations to the Alta Investor change to 5%. The Company receives 94.34% until the flip point, at which time the allocations to the Company of CAFD will change to 97.12%, unless the flip point will not have occurred by a specified date, which would result in 100% of CAFD allocated to the Alta Investor until the flip point occurs. Alta TE Holdco is a VIE and the Company is the primary beneficiary through its position as managing member, and therefore consolidates Alta TE Holdco, with the Alta Investor's interest shown as noncontrolling interest. The Company utilizes the HLBV method to determine the net income or loss allocated to the noncontrolling interest.
Spring Canyon — The Company holds a 90.1% of the Class B interests in Spring Canyon II, a 32 MW wind facility, and Spring Canyon III, a 28 MW wind facility, each located in Logan County, Colorado, and Invenergy Wind Global LLC owns 9.9% of the Class B interests. The projects are financed with a partnership flip tax-equity structure with a financial institution, who owns the Class A interests, to monetize certain cash and tax attributes, primarily PTCs. Until the flip point, the Class A member receives a variable percentage of cash distributions based on the projects’ production level during the prior year. The Class A member received 34.81% of the cash distributions and the Company and Invenergy received 65.19% during the period ended December 31, 2017. After the flip point, cash distributions are allocated 5% to the Class A member and 95% to the Company and Invenergy. Spring Canyon is a VIE and the Company is the primary beneficiary through its position as managing member, and therefore consolidates Spring Canyon. The Class A member and Invenergy's interests are shown as noncontrolling interest. The Company utilizes the HLBV method to determine the net income or loss allocated to the Class A member. Net income or loss attributable to the Class B interests is allocated to Invenergy's noncontrolling interest based on its 9.9% ownership interest.
Summarized financial information for the Company's consolidated VIEs consisted of the following as of December 31, 2017:2020:
| | | | | | | | | | | | | | | | | | | | | | | | | | | | | | | | | | | | | | | | | | | | | | | | | | | | | | | | | | | |
| (In millions) | Oahu
Solar Partnership | | Kawailoa Partnership | | Wildorado TE Holdco | | DGPV Funds(a) | | Lighthouse Renewable Holdco LLC | | Rosie TargetCo LLC | | Langford TE Partnership LLC | | Alta TE Holdco | | Buckthorn Renewables, LLC | | Other (b) |
| Other current and non-current assets | $ | 23 | | | $ | 21 | | | $ | 14 | | | $ | 105 | | | $ | 48 | | | $ | 40 | | | $ | 15 | | | $ | 56 | | | $ | 2 | | | $ | 21 | |
| Property, plant and equipment | 179 | | | 141 | | | 240 | | | 778 | | | 444 | | | 258 | | | 138 | | | 356 | | | 210 | | | 184 | |
| Intangible assets | 0 | | | 0 | | | 0 | | | 2 | | | 0 | | | 0 | | | 2 | | | 225 | | | 0 | | | 1 | |
| Total assets | 202 | | | 162 | | | 254 | | | 885 | | | 492 | | | 298 | | | 155 | | | 637 | | | 212 | | | 206 | |
| Current and non-current liabilities | 122 | | | 111 | | | 11 | | | 77 | | | 82 | | | 118 | | | 18 | | | 44 | | | 9 | | | 33 | |
| Total liabilities | 122 | | | 111 | | | 11 | | | 77 | | | 82 | | | 118 | | | 18 | | | 44 | | | 9 | | | 33 | |
| Noncontrolling interest | 14 | | | 31 | | | 123 | | | 4 | | | 347 | | | 150 | | | 108 | | | 33 | | | 58 | | | 99 | |
| Net assets less noncontrolling interests | $ | 66 | | | $ | 20 | | | $ | 120 | | | $ | 804 | | | $ | 63 | | | $ | 30 | | | $ | 29 | | | $ | 560 | | | $ | 145 | | | $ | 74 | |
| | | | | | | | | | | | | | | | | | | |
| | | | | | | | | | | | | | | | | | | |
| | | | | | | | | | | | | | | | | | | |
|
| | | | | | | | | | | |
| (In millions) | NRG Wind TE Holdco | | Alta TE Holdco | | Spring Canyon |
| Other current and non-current assets | $ | 172 |
| | $ | 17 |
| | $ | 2 |
|
| Property, plant and equipment | 376 |
| | 436 |
| | 95 |
|
| Intangible assets | 2 |
| | 262 |
| | — |
|
| Total assets | 550 |
| | 715 |
| | 97 |
|
| Current and non-current liabilities | 197 |
| | 9 |
| | 5 |
|
| Total liabilities | 197 |
| | 9 |
| | 5 |
|
| Noncontrolling interest | 9 |
| | 93 |
| | 60 |
|
| Net assets less noncontrolling interests | $ | 344 |
| | $ | 613 |
| | $ | 32 |
|
(b)Other is comprised of Crosswinds, Hardin, Elbow Creek Holdco and Spring Canyon projects
Entities that are not Consolidated
The Company has interests in entities that are considered VIEs under ASC 810, Consolidation, but for which it is not considered the primary beneficiary. The Company accounts for its interests in these entities under the equity method of accounting.
Utah Solar Portfolio Assets —As described in Note 3, Business Acquisitions, as part of the March 2017 Drop Down Assets acquisition, the Company The company acquired from NRG 100% of the Class A equity interests in the Utah Solar Portfolio from NRG. The portfolio comprised of Four Brothers Solar, LLC, Granite Mountain Holdings, LLC, and Iron Springs Holdings, LLC. The Class B interests of the Utah Solar Portfolio are owned by a tax equity investor, or TE Investor, who receives 99% of allocations of taxable income and other items until the flip point, which occurs whenon the TE Investor obtains a specified returnlast day of the calendar month on which the Class B member does not have an agreed upon adjusted capital account deficit, but not prior to the 10th day after the five year anniversary of the last project to achieve its initial investment,placed in service date, at which time the allocations to the TE Investor change to 50%. The Company generally receives 50% of distributable cash throughout the term of the tax-equity arrangements. The three entities comprising the Utah Solar Portfolio are VIEs. As the Company is not the primary beneficiary, the Company uses the equity method of accounting to account for its interests in the Utah Solar Portfolio. The Company utilizes the HLBV method to determine its share of the income or losses in the investees.
NRG DGPV Holdco 1 LLC — The Company and NRG are parties to the NRG DGPV Holdco 1 LLC partnership, or DGPV Holdco 1, the purpose of which is to own or purchase solar power generation projects and other ancillary related assets from NRG Renew LLC or its subsidiaries via intermediate funds. The Company owns approximately 47 MW of distributed solar capacity, based on cash to be distributed, with a weighted average contract life of 18 years. Under this partnership, the Company committed to fund up to $100 million of capital.
NRG DGPV Holdco 2 LLC — The Company and NRG are parties to the NRG DGPV Holdco 2 LLC partnership, or DGPV Holdco 2, the purpose of which is to own or hold solar power generation projects as well as other ancillary related assets from NRG Renew LLC or its subsidiaries. The Company owns approximately 113 MW of distributed solar capacity, based on cash to be distributed, with a weighted average contract life of 21 years. Under this partnership, the Company committed to fund up to $60 million of capital.
NRG DGPV Holdco 3 LLC— On September 26, 2017, the Company entered into an additional partnership with NRG by forming NRG DGPV Holdco 3 LLC, or DGPV Holdco 3, in which the Company would invest up to $50 million in an operating portfolio of distributed solar assets, primarily comprised of community solar projects, developed by NRG. The Company owns approximately 43 MW of distributed solar capacity, based on cash to be distributed, with a weighted average contract life of approximately 20 years as of December 31, 2017.
The Company's maximum exposure to loss is limited to its equity investment in DGPV Holdco 1, DGPV Holdco 2 and DGPV Holdco 3, which was $176 million on a combined basis.
NRG RPV Holdco 1 LLC — The Company and NRG are parties to the NRG RPV Holdco 1 LLC partnership, or RPV Holdco, the purpose of which is to hold operating portfolios of residential solar assets developed by NRG's residential solar business, including: (i) an existing, unlevered portfolio of over 2,200 leases across nine states representing approximately 14 MW, based on cash to be distributed, with a weighted average remaining lease term of approximately 15 years that was acquired outside of the partnership; and (ii) a tax equity-financed portfolio of approximately 5,400 leases representing approximately 30 MW, based on cash to be distributed, with a weighted average remaining lease term for the existing and new leases of approximately 18 years. The Company has fully funded the partnership as of December 31, 2017.
The Company's maximum exposure to loss is limited to its equity investment, which was $58 million as of December 31, 2017.
Note 6 — Fair Value of Financial Instruments
Fair Value Accounting under ASC 820
ASC 820 establishes a fair value hierarchy that prioritizes the inputs to valuation techniques used to measure fair value into three levels as follows:
•Level 1—quoted prices (unadjusted) in active markets for identical assets or liabilities that the Company has the ability to access as of the measurement date.
•Level 2—inputs other than quoted prices included within Level 1 that are directly observable for the asset or liability or indirectly observable through corroboration with observable market data.
•Level 3—unobservable inputs for the asset or liability only used when there is little, if any, market activity for the asset or liability at the measurement date.
In accordance with ASC 820, the Company determines the level in the fair value hierarchy within which each fair value measurement in its entirety falls, based on the lowest level input that is significant to the fair value measurement.
For cash and cash equivalents, restricted cash, accounts receivable — affiliate, accounts receivable, accounts payable, current portion of accounts payable — affiliate, accrued expenses and other liabilities, the carrying amount approximates fair value because of the short-term maturity of those instruments and are classified as Level 1 within the fair value hierarchy.
The estimated carrying amounts and fair values of the Company’s recorded financial instruments not carried at fair market value are as follows:
| | | | | | | | | | | | | | | | | | | | | | | |
| As of December 31, 2020 | | As of December 31, 2019 |
| Carrying Amount | | Fair Value | | Carrying Amount | | Fair Value |
| (In millions) |
| | | | | | | |
| | | | | | | |
| Liabilities: | | | | | | | |
Long-term debt, including current portion (a) | $ | 7,048 | | | $ | 7,020 | | | $ | 6,858 | | | $ | 6,957 | |
|
| | | | | | | | | | | | | | | |
| | As of December 31, 2017 | | As of December 31, 2016 |
| | Carrying Amount | | Fair Value | | Carrying Amount | | Fair Value |
| | (In millions) |
| Assets: | | | | | | | |
| Notes receivable, including current portion | $ | 13 |
| | $ | 13 |
| | $ | 30 |
| | $ | 30 |
|
| Liabilities: | | | | | | | |
| Long-term debt, including current portion | $ | 5,897 |
| | $ | 5,930 |
| | $ | 6,122 |
| | $ | 6,121 |
|
Fair Value Accounting under ASC 820
ASC 820 establishes(a) Excludes net debt issuance costs, which are recorded as a fair value hierarchy that prioritizes the inputsreduction to valuation techniques used to measure fair value into three levels as follows:
Level 1—quoted prices (unadjusted) in active markets for identical assets or liabilities that the Company has the ability to access as of the measurement date.
Level 2—inputs other than quoted prices included within Level 1 that are directly observable for the asset or liability or indirectly observable through corroboration with observable market data.
Level 3—unobservable inputs for the asset or liability only used when there is little, if any, market activity for the asset or liability at the measurement date.
In accordance with ASC 820, the Company determines the level in the fair value hierarchy within which each fair value measurement in its entirety falls, basedlong-term debt on the lowest level input that is significant to the fair value measurement.Company's consolidated balance sheets.
The fair value of the Company's publicly-traded long-term debt is based on quoted market prices and is classified as Level 2 within the fair value hierarchy. The fair value of debt securities, non-publicly traded long-term debt and certain notes receivable of the Company are based on expected future cash flows discounted at market interest rates, or current interest rates for similar instruments with equivalent credit quality and are classified as Level 3 within the fair value hierarchy. The following table presents the level within the fair value hierarchy for long-term debt, including current portion as of December 31, 20172020 and 2016:2019:
|
| | | | | | | | | | | | | | | |
| | As of December 31, 2017 | | As of December 31, 2016 |
| | Level 2 | | Level 3 | | Level 2 | | Level 3 |
| | (In millions) |
| Long-term debt, including current portion | $ | 1,502 |
| | $ | 4,428 |
| | $ | 1,455 |
| | $ | 4,666 |
|
| | | | | | | | | | | | | | | | | | | | | | | |
| As of December 31, 2020 | | As of December 31, 2019 |
| Level 2 | | Level 3 | | Level 2 | | Level 3 |
| | (In millions) |
| Long-term debt, including current portion | $ | 1,905 | | | $ | 5,115 | | | $ | 1,736 | | | $ | 5,221 | |
| | | | | | | |
Recurring Fair Value Measurements
The Company records its derivative assets and liabilities at fair market value on its consolidated balance sheet. The following table presents assets and liabilities measured and recorded at fair value on the Company's consolidated balance sheets on a recurring basis and their level within the fair value hierarchy:
| | | | | | | | | | | | | | | | | | | | | | | | | |
| | | As of December 31, 2020 | | As of December 31, 2020 | | As of December 31, 2019 | | As of December 31, 2019 |
| | | Fair Value | | Fair Value (a) | | Fair Value (a) | | Fair Value (a) |
| (In millions) | | | Level 2 | | Level 3 | | Level 2 | | Level 3 |
| Derivative assets | | | | | | | | | |
| | | | | | | | | |
| Interest rate contracts | | | $ | 1 | | | $ | 0 | | | $ | 0 | | | $ | 0 | |
Other financial instruments (b) | | | 0 | | | 29 | | | 0 | | | 0 | |
| Total assets | | | $ | 1 | | | $ | 29 | | | $ | 0 | | | $ | 0 | |
| Derivative liabilities | | | | | | | | | |
| Commodity contracts | | | $ | 0 | | | $ | 44 | | | $ | 0 | | | $ | 9 | |
| Interest rate contracts | | | 129 | | | 0 | | | 83 | | | 0 | |
| Total liabilities | | | $ | 129 | | | $ | 44 | | | $ | 83 | | | $ | 9 | |
|
| | | | | | | | | | | | |
| | As of December 31, 2017 | | As of December 31, 2016 |
| | | Fair Value (a) | | Fair Value (a) | | Fair Value (a) |
| (In millions) | | Level 2 | | Level 1 | | Level 2 |
| Derivative assets: | | | | | | |
| Commodity contracts | | $ | 1 |
| | $ | 1 |
| | $ | 1 |
|
| Interest rate contracts | | 1 |
| | — |
| | 1 |
|
| Total assets | | $ | 2 |
| | 1 |
| | 2 |
|
| Derivative liabilities: | | | | | | |
| Commodity contracts | | $ | 1 |
| | — |
| | 1 |
|
| Interest rate contracts | | 47 |
| | — |
| | 78 |
|
| Total liabilities | | $ | 48 |
| | $ | — |
| | $ | 79 |
|
(a) There were no derivative assets classified as Level 1, or Level 3 and no liabilities classified as Level 1 as of December 31, 2017. There were2020 and no derivative assets classified as Level 1, Level 2 or Level 3 and no liabilities classified as Level 31 as of December 31, 20172019.
(b) SREC contract acquired on November 2, 2020.
The following table reconciles the beginning and 2016.ending balances for instruments that are recognized at fair value in the condensed consolidated financial statements using significant unobservable inputs:
| | | | | | | | | | | | | | | | | | |
| | | | Year ended December 31, |
| | | | | | 2020 | | 2019 |
| (In millions) | | | | Fair Value Measurement Using Significant Unobservable Inputs (Level 3) |
| Beginning balance | | | | | | $ | (9) | | | $ | 0 | |
| Total losses for the period included in earnings | | | | | | 0 | | | (3) | |
| Purchases | | | | | | (6) | | | (6) | |
| Ending balance | | | | | | $ | (15) | | | $ | (9) | |
| Change in unrealized losses included in earnings for derivatives held as of December 31, | | | | | | $ | 1 | | | $ | (3) | |
Derivative and Financial Instruments Fair Value Measurements
The Company's contracts are non-exchange-traded and valued using prices provided by external sources. For the Company’s energy markets,contracts, management receives quotes from multiple sources.uses quoted observable forward prices. To the extent that multiple quotesobservable forward prices are received,not available, the quoted prices reflect the average of the bid-ask mid-pointforward prices obtained from all sources believedthe prior year, adjusted for inflation. As of December 31, 2020, contracts valued with prices provided by models and other valuation techniques make up 25% of derivative liabilities and 100% of other financial instruments.
The Company’s significant positions classified as Level 3 include physical power executed in illiquid markets. The significant unobservable inputs used in developing fair value include illiquid power tenors and location pricing, which is derived by extrapolating pricing and as a basis to provideliquid locations. The tenor pricing and basis spread are based on observable market data when available or derived from historic prices and forward market prices from similar observable markets when not available.
The following table quantifies the most liquid market forsignificant unobservable inputs used in developing the commodity.fair value of the Company's Level 3 positions as of December 31, 2020:
| | | | | | | | | | | | | | | | | | | | | | | |
| December 31, 2020 |
| Fair Value | | Input/Range |
| Assets | Liabilities | Valuation Technique | Significant Unobservable Input | Low | High | Weighted Average |
| (In millions) | | | | |
| Power Contracts | $ | — | | $ | (44) | | Discounted Cash Flow | Forward Market Price (per MWh) | $ | 8.64 | | $ | 42.37 | | $ | 17.93 | |
| Other Financial Instruments | $ | 29 | | — | | Discounted Cash Flow | Forecast annual generation levels of certain DG solar facilities | 80,872 MWh | 131,374 MWh | 126,063 MWh |
The following table provides sensitivity of fair value measurements to increases/(decreases) in significant unobservable inputs as of December 31, 2020:
| | | | | | | | | | | |
| Significant Observable Input | Position | Change In Input | Impact on Fair Value Measurement |
| Forward Market Price Power | Buy | Increase/(Decrease) | Higher/(Lower) |
| Forward Market Price Power | Sell | Increase/(Decrease) | Lower/(Higher) |
| Forecast Generation Level | Sell | Increase/(Decrease) | Higher/(Lower) |
The fair value of each contract is discounted using a risk freerisk-free interest rate. In addition, a credit reserve is applied to reflect credit risk, which is, for interest rate swaps, is calculated based on credit default swaps utilizingusing the bilateral method. For commodities, to the extent that NRG's net exposurethe Net Exposure under a specific master agreement is an asset, the Company uses the counterparty'scounterparty’s default swap rate. If the exposureNet Exposure under a specific master agreement is a liability, the Company uses NRG'sa proxy of its own default swap rate. For interest rate swaps and commodities, the credit reserve is added to the discounted fair value to reflect the exit price that a market participant would be willing to receive to assume the liabilities or that a market participant would be willing to pay for the assets. As of December 31, 2017,2020, the creditnon-performance reserve resultedwas a $6 million gain recorded primarily to interest expense in a $1 million increase in fair value in interest expense.the consolidated statement of operations. It is possible that future market prices could vary from those used in recording assets and liabilities and such variations could be material.
Concentration of Credit Risk
In addition to the credit risk discussion as disclosed in Note 2, Summary of Significant Accounting Policies, the following item is a discussion of the concentration of credit risk for the Company's financial instruments. Credit risk relates to the risk of loss resulting from non-performance or non-payment by counterparties pursuant to the terms of their contractual obligations. The Company monitors and manages credit risk through credit policies that include: (i) an established credit approval process; (ii) daily monitoring of counterparties' credit limits;limits on as needed basis; (iii) as applicable, the use of credit mitigation measures such as margin, collateral, prepayment arrangements, or volumetric limits; (iv) the use of payment netting agreements; and (v) the use of master netting agreements that allow for the netting of positive and negative exposures of various contracts associated with a single counterparty. Risks surrounding counterparty performance and credit could ultimately impact the amount and timing of expected cash flows. The Company seeks to mitigate counterparty risk by having a diversified portfolio of counterparties.
Counterparty credit exposure includes credit risk exposure under certain long-term agreements, including solar and other PPAs. As external sources or observable market quotes are not available to estimate such exposure, the Company estimates the exposure related to these contracts based on various techniques including but not limited to internal models based on a fundamental analysis of the market and extrapolation of observable market data with similar characteristics. Based on these valuation techniques, as of December 31, 2017, credit risk exposure to these counterparties attributable to the Company's ownership interests was approximately $2.7 billion for the next five years. The majority of these power contracts are with utilities with strong credit quality and public utility commission or other regulatory support. support. However, such regulated utility counterparties can be impacted by changes in government regulations or adverse financial conditions, which the Company is unable to predict.
Note 7 — Accounting for Derivative Instruments and Hedging Activities
ASC 815 requires the Company to recognize all derivative instruments on the balance sheet as either assets or liabilities and to measure them at fair value each reporting period unless they qualify for a NPNS exception. The Company may elect to designate certain derivatives as cash flow hedges, if certain conditions are met, and defer the change in fair value of the derivatives to accumulated OCI/OCL, until the hedged transactions occur and are recognized in earnings. For derivatives that are not designated as cash flow hedges or do not qualify for hedge accounting treatment, the changes in the fair value will be immediately recognized in earnings. Certain derivative instruments may qualify for the NPNS exception and are therefore exempt from fair value accounting treatment. ASC 815 applies to the Company's energy related commodity contracts and interest rate swaps.
Energy-Related CommoditiesInterest Rate Swaps
To manageThe Company enters into interest rate swap agreements in order to hedge the commodity price risk associated with its competitive supply activities and the price risk associated with wholesale power sales, the Company may enter into derivative hedging instruments, namely, forward contracts that commit the Company to sell energy commodities or purchase fuels/electricity in the future. The objectives for entering into derivatives contracts designated as hedges include fixing the price for a portionvariability of anticipatedexpected future electricity sales and fixing the price of a portion of anticipated fuel/electricity purchases for the operation of its subsidiaries.cash interest payments. As of December 31, 2017,2020, the Company had forward contracts forinterest rate derivative instruments on non-recourse debt extending through 2044, a portion of which were designated as cash flow hedges. Under the purchase of fuel commodities relatinginterest rate swap agreements, the Company pays a fixed rate and the counterparties to the forecasted usageagreements pay a variable interest rate.
Energy Related Commodities
As of December 31, 2020, the Company’s district energy centersCompany had energy-related derivative instruments extending through 2020 and electricity contracts to supply retail power to the Company's district energy centers extending through 2020.2032. At December 31, 2017,2020, these contracts were not designated as cash flow or fair value hedges.
Also, as of December 31, 2017, the Company had other energy-related contracts that did not meet the definition of a derivative instrument or qualified for the NPNS exception and were therefore exempt from fair value accounting treatment as follows:
Power tolling contracts through 2039, and
Natural gas transportation contracts through 2028.
Interest Rate Swaps
The Company is exposed to changes in interest rates through the issuance of variable rate debt. In order to manage interest rate risk, it enters into interest rate swap agreements.
As of December 31, 2017, the Company had interest rate derivative instruments on non-recourse debt extending through 2036, a portion of which are designated as cash flow hedges.
Volumetric Underlying Derivative Transactions
The following table summarizes the net notional volume buy/(sell) of the Company's open derivative transactions broken out by commodity as of December 31, 20172020 and 2016:2019:
|
| | | | | | | | | |
| | | | Total Volume |
| | | | December 31, 2017 | | December 31, 2016 |
| Commodity | Units | | (In millions) |
| Natural Gas | MMBtu | | 2 |
| | 3 |
|
| Interest | Dollars | | $ | 1,940 |
| | $ | 2,090 |
|
| | | | | | | | | | | | | | | | | |
| | | Total Volume |
| | | December 31, 2020 | | December 31, 2019 |
| Commodity | Units | | (In millions) |
| Natural Gas | MMBtu | | 1 | | | 2 | |
| Power | MWh | | (8) | | | (2) | |
| Interest | Dollars | | $ | 1,600 | | | $ | 1,788 | |
| | | | | |
| | | | | |
Fair Value of Derivative Instruments
The following table summarizes the fair value within the derivative instrument valuation on the balance sheet:
| | | | | | | | | | | | | | | | | | |
| | | Fair Value |
| | | Derivative Assets (a) | | Derivative Liabilities |
| | December 31, 2020 | | December 31, 2020 | | December 31, 2019 |
| | (In millions) |
| Derivatives Designated as Cash Flow Hedges: | | | | | | |
| Interest rate contracts current | | $ | 0 | | | $ | 8 | | | $ | 3 | |
| Interest rate contracts long-term | | 0 | | | 15 | | | 11 | |
| Total Derivatives Designated as Cash Flow Hedges | | $ | 0 | | | $ | 23 | | | $ | 14 | |
| Derivatives Not Designated as Cash Flow Hedges: | | | | | | |
| Interest rate contracts current | | 0 | | | 25 | | | 13 | |
| Interest rate contracts long-term | | 1 | | | 81 | | | 56 | |
| Commodity contracts current | | 0 | | | 5 | | | 0 | |
Commodity contracts long-term | | 0 | | | 39 | | | 9 | |
| Total Derivatives Not Designated as Cash Flow Hedges | | 1 | | | 150 | | | 78 | |
| Total Derivatives | | $ | 1 | | | $ | 173 | | | $ | 92 | |
|
| | | | | | | | | | | | | | | |
| | Fair Value |
| | Derivative Assets (a) | | Derivative Liabilities |
| | December 31, 2017 | | December 31, 2016 | | December 31, 2017 | | December 31, 2016 |
| | (In millions) |
| Derivatives Designated as Cash Flow Hedges: | | | | | | | |
| Interest rate contracts current | $ | — |
| | $ | — |
| | $ | 4 |
| | $ | 26 |
|
| Interest rate contracts long-term | 1 |
| | 1 |
| | 9 |
| | 39 |
|
| Total Derivatives Designated as Cash Flow Hedges | 1 |
| | 1 |
| | 13 |
| | 65 |
|
| Derivatives Not Designated as Cash Flow Hedges: | | | | | | | |
| Interest rate contracts current | — |
| | — |
| | 12 |
| | 6 |
|
| Interest rate contracts long-term | — |
| | — |
| | 22 |
| | 7 |
|
| Commodity contracts current | 1 |
| | 2 |
| | 1 |
| | 1 |
|
| Total Derivatives Not Designated as Cash Flow Hedges | 1 |
| | 2 |
| | 35 |
| | 14 |
|
| Total Derivatives | $ | 2 |
| | $ | 3 |
| | $ | 48 |
| | $ | 79 |
|
(a)There were no derivative assets as of December 31, 2019. (a) Derivative Asset balances classified as current are included within the prepayments and other current assets line item of the Consolidated Balance Sheet. Derivative Asset balances classified as long-term are included within the other non-current assets line item of the Consolidated Balance Sheet.
The Company has elected to present derivative assets and liabilities on the balance sheet on a trade-by-trade basis and does not offset amounts at the counterparty master agreement level. As of December 31, 20172020 and 2016,2019, there was no outstanding collateral paid or received. The following tables summarize the offsetting of derivatives by counterparty master agreement level:
| | | | | | | | | | | | | | | | | |
| Gross Amounts Not Offset in the Statement of Financial Position |
| As of December 31, 2020 | Gross Amounts of Recognized Assets/Liabilities | | Derivative Instruments | | Net Amount |
| Commodity contracts | (In millions) |
| | | | | |
| Derivative liabilities | (44) | | | 0 | | | (44) | |
| Total commodity contracts | (44) | | | 0 | | | (44) | |
| Interest rate contracts | | | | | |
| Derivative assets | $ | 1 | | | $ | 0 | | | $ | 1 | |
| Derivative liabilities | (129) | | | 0 | | | (129) | |
| Total interest rate contracts | (128) | | | 0 | | | (128) | |
| Total derivative instruments | $ | (172) | | | $ | 0 | | | $ | (172) | |
|
| | | | | | | | | | | |
| Gross Amounts Not Offset in the Statement of Financial Position |
| As of December 31, 2017 | Gross Amounts of Recognized Assets/Liabilities | | Derivative Instruments | | Net Amount |
| Commodity contracts: | (In millions) |
| Derivative assets | $ | 1 |
| | $ | — |
| | $ | 1 |
|
| Derivative liabilities | (1 | ) | | — |
| | (1 | ) |
| Total commodity contracts | — |
| | — |
| | — |
|
| Interest rate contracts: | | | | | |
| Derivative assets | 1 |
| | (1 | ) | | — |
|
| Derivative liabilities | (47 | ) | | 1 |
| | (46 | ) |
| Total interest rate contracts | (46 | ) | | — |
| | (46 | ) |
| Total derivative instruments | $ | (46 | ) | | $ | — |
| | $ | (46 | ) |
|
| | | | | | | | | | | |
| | Gross Amounts Not Offset in the Statement of Financial Position |
| As of December 31, 2016 | Gross Amounts of Recognized Assets/Liabilities | | Derivative Instruments | | Net Amount |
| Commodity contracts: | (In millions) |
| Derivative assets | $ | 2 |
| | $ | — |
| | $ | 2 |
|
| Derivative liabilities | (1 | ) | | — |
| | (1 | ) |
| Total commodity contracts | 1 |
| | — |
| | 1 |
|
| Interest rate contracts: | | | | | |
| Derivative assets | 1 |
| | (1 | ) | | — |
|
| Derivative liabilities | (78 | ) | | 1 |
| | (77 | ) |
| Total interest rate contracts | (77 | ) | | — |
| | (77 | ) |
| Total derivative instruments | $ | (76 | ) | | $ | — |
| | $ | (76 | ) |
| | | | | | | | | | | | | | | | | |
| Gross Amounts Not Offset in the Statement of Financial Position |
| As of December 31, 2019 | Gross Amounts of Recognized Assets/Liabilities | | Derivative Instruments | | Net Amount |
| Commodity contracts | (In millions) |
| | | | | |
| Derivative liabilities | (9) | | | (1) | | | (10) | |
| Total commodity contracts | (9) | | | (1) | | | (10) | |
| Interest rate contracts | | | | | |
| | | | | |
| Derivative liabilities | (83) | | | 1 | | | (82) | |
| Total interest rate contracts | (83) | | | 1 | | | (82) | |
| Total derivative instruments | $ | (92) | | | $ | 0 | | | $ | (92) | |
Accumulated Other Comprehensive Loss
The following table summarizes the effects on the Company’s accumulated OCL balance attributable to interest rate swaps designated as cash flow hedge derivatives, net of tax:
| | | | Year ended December 31, | | Year ended December 31, |
| | 2017 | | 2016 | | 2015 | | 2020 | | 2019 | | 2018 |
| | (In millions) | | (In millions) |
| Accumulated OCL beginning balance | $ | (70 | ) | | $ | (83 | ) | | $ | (76 | ) | Accumulated OCL beginning balance | $ | (31) | | | $ | (38) | | | $ | (60) | |
| Reclassified from accumulated OCL to income due to realization of previously deferred amounts | 10 |
| | 13 |
| | 14 |
| Reclassified from accumulated OCL to income due to realization of previously deferred amounts | 8 | | | 16 | | | 14 | |
| Mark-to-market of cash flow hedge accounting contracts | — |
| | — |
| | (21 | ) | Mark-to-market of cash flow hedge accounting contracts | (7) | | | (9) | | | 8 | |
| Accumulated OCL ending balance, net of income tax benefit of $9, $16 and $16, respectively | $ | (60 | ) | | $ | (70 | ) | | $ | (83 | ) | |
| Accumulated OCL ending balance, net of income tax benefit of $5, $6 and $7, respectively | | Accumulated OCL ending balance, net of income tax benefit of $5, $6 and $7, respectively | $ | (30) | | | $ | (31) | | | $ | (38) | |
| Accumulated OCL attributable to noncontrolling interests | (32 | ) | | (42 | ) | | (56 | ) | Accumulated OCL attributable to noncontrolling interests | (16) | | | (16) | | | (20) | |
| Accumulated OCL attributable to NRG Yield, Inc. | $ | (28 | ) | | $ | (28 | ) | | $ | (27 | ) | |
| Losses expected to be realized from OCL during the next 12 months, net of income tax benefit of $2 | $ | 13 |
| | | | | |
| Accumulated OCL attributable to Clearway Energy, Inc. | | Accumulated OCL attributable to Clearway Energy, Inc. | $ | (14) | | | $ | (15) | | | $ | (18) | |
| Losses expected to be realized from OCL during the next 12 months, net of income tax benefit of $4 | | Losses expected to be realized from OCL during the next 12 months, net of income tax benefit of $4 | $ | (9) | | | | | |
Amounts reclassified from accumulated OCL into income are recorded to interest expense.
Accounting guidelines require a high degree of correlation between the derivative and the hedged item throughout the period in order to qualify as a cash flow hedge. As of December 31, 2016, the Company's regression analysis for Viento Funding II interest rate swaps, while positively correlated, did not meet the required threshold for cash flow hedge accounting. As a result, the Company de-designated the Viento Funding II cash flow hedges as of December 31, 2016, and will prospectively mark these derivatives to market through the income statement.
The Company's regression analysis for Marsh Landing, Walnut Creek and Avra Valley interest rate swaps, while positively correlated, no longer contain matching terms for cash flow hedge accounting. As a result, the Company voluntarily de-designated the Marsh Landing, Walnut Creek and Avra Valley cash flow hedges as of April 28, 2017, and will prospectively mark these derivatives to market through the income statement.
Impact of Derivative Instruments on the Statements of Income
The Company has interest rate derivative instruments that are not designated as cash flow hedges. The effect of interest rate hedges is recorded to interest expense. For the years ended December 31, 2017, 20162020, 2019 and 20152018 the impact to the consolidated statements of income was a gain of $7 million, loss of $2$38 million, a loss of $65 million and a gain of $17$15 million, respectively.
The Company has long-term power hedge derivatives, for which changes in fair value are recorded in operating income. For the years ended December 31, 2020 and 2019 the impact to the consolidated statements of income was a loss of $4 million and a loss of $9 million, respectively. There were no long-term power hedge derivatives outstanding during 2018.
A portion of the Company’s derivative commodity contracts relates to its Thermal Business for the purchase of fuel/electricity commodities based on the forecasted usage of the thermal district energy centers. Realized gains and losses on these contracts are reflected in the costs that are permitted to be billed to customers through the related customer contracts or tariffs and, accordingly, no gains or losses are reflected in the consolidated statements of incomeoperations for these contracts.
In 2015, commodity contracts also hedged the forecasted sale of power for the Elbow Creek until the start of the PPA with NRG Power Marketing LLC, or Power Marketing, with effective date of November 1, 2015. The effect of these commodity hedges was recorded to operating revenues. For the year ended December 31, 2015, the impact to the consolidated statements of income was an unrealized loss of $2 million.
See Note 6, Fair Value of Financial Instruments, for a discussion regarding concentration of credit risk.
Note 8 — Intangible Assets
Intangible Assets — The Company's intangible assets as of December 31, 20172020 and 20162019 primarily reflect intangible assets established from its business acquisitions and are comprised of the following:
•PPAs — Established predominantly with the acquisitions of the Alta Wind Portfolio, Walnut Creek, Tapestry, and Laredo Ridge theseand Carlsbad Energy Center. These represent the fair value of the PPAs acquired. These are amortized generally on a straight-line basis, over the term of the PPA.
•Leasehold Rights —Established with the acquisition of the Alta Wind Portfolio, this represents the fair value of
contractual rights to receive royalty payments equal to a percentage of PPA revenue from certain projects. These are
amortized as a reduction to operating revenue on a straight-line basis.basis over the term of the PPAs.
•Customer relationships — Established with the acquisition of NRGEnergy Center Omaha and Energy Center Phoenix, and NRG Energy Center Omaha, these intangibles represent the fair value at the acquisition date of the businesses' customer base. The customer relationships related to Energy Center Omaha are amortized as a reduction to depreciation and amortization expense based onoperating revenue, which approximates the expected discounted future net cash flows by year.
•Customer contracts — Established with the acquisition of NRG Energy Center Phoenix,these intangibles represent the fair value at the acquisition date of contracts that primarily provide chilled water, steam and electricity to its customers. These contracts are amortized to revenues based on expected volumes.
| |
• | Emission Allowances — These intangibles primarily consist of SO2 and NOx•Emission Allowances —These intangibles primarily consist of SO2 and NOx emission allowances established with the El Segundo, and Walnut Creek and Carlsbad Energy Center acquisitions. These emission allowances are held-for-use and are amortized to cost of operations, with NOx allowances amortized on a straight-line basis and SO2 allowances amortized based on units of production. |
Development rights — Arising primarily from the acquisition of solar businesses in 2010 and 2011, these intangibles are amortized to depreciation and amortization expensecost of operations, with NOx allowances amortized on a straight-line basis over the estimated lifeand SO2 allowances amortized based on units of the related project portfolio.
production. •Other — Consists primarily of a) the acquisition date fair value of the contractual rights to a ground lease for South Trent and to utilize certain interconnection facilities for Blythe, as well as land rights acquired in connection with the acquisition of Elbow Creek.
Creek and Langford Wind and b) development rights related to certain solar businesses acquired in 2010 and 2011.The following tables summarize the components of intangible assets subject to amortization:
| | | | | | | | | | | | | | | | | | | | | | | | | | | | | | | | | | | | | | | | | | | |
| Year ended December 31, 2020 | PPAs | | Leasehold Rights | | Customer
Relationships | | Customer Contracts | | Emission Allowances | | | | Other | | Total |
| (In millions) | | | | | | | | | | | | | | | |
| January 1, 2020 | $ | 1,630 | | | $ | 86 | | | $ | 66 | | | $ | 15 | | | $ | 17 | | | | | $ | 8 | | | $ | 1,822 | |
| | | | | | | | | | | | | | | |
| Consolidation of DGPV Holdco Entities | 23 | | | 0 | | | 0 | | | 0 | | | 0 | | | | | 0 | | | 23 | |
| | | | | | | | | | | | | | | |
| Other | 8 | | | 0 | | | 0 | | | 0 | | | 0 | | | | | 4 | | | 12 | |
| December 31, 2020 | $ | 1,661 | | | $ | 86 | | | $ | 66 | | | $ | 15 | | | $ | 17 | | | | | $ | 12 | | | $ | 1,857 | |
| Less accumulated amortization | (431) | | | (26) | | | (11) | | | (11) | | | (3) | | | | | (5) | | | (487) | |
| Net carrying amount | $ | 1,230 | | | $ | 60 | | | $ | 55 | | | $ | 4 | | | $ | 14 | | | | | $ | 7 | | | $ | 1,370 | |
|
| | | | | | | | | | | | | | | | | | | | | | | | | | | | | | | |
| Year ended December 31, 2017 | PPAs | | Leasehold Rights | | Customer
Relationships | | Customer Contracts | | Emission Allowances | | Development
Rights | | Other | | Total |
| (In millions) | | | | | | | | | | | | | | | |
| January 1, 2017 | $ | 1,286 |
| | $ | 86 |
| | $ | 66 |
| | $ | 15 |
| | $ | 9 |
| | $ | 3 |
| | $ | 6 |
| | $ | 1,471 |
|
Asset impairments (a) | (6 | ) | | — |
| | — |
| | — |
| | — |
| | — |
| | — |
| | (6 | ) |
| December 31, 2017 | 1,280 |
| | 86 |
| | 66 |
| | 15 |
| | 9 |
| | 3 |
| | 6 |
| | 1,465 |
|
| Less accumulated amortization | (205 | ) | | (13 | ) | | (5 | ) | | (8 | ) | | (3 | ) | | (1 | ) | | (2 | ) | | (237 | ) |
| Net carrying amount | $ | 1,075 |
| | $ | 73 |
| | $ | 61 |
| | $ | 7 |
| | $ | 6 |
| | $ | 2 |
| | $ | 4 |
| | $ | 1,228 |
|
| | | | | | | | | | | | | | | | | | | | | | | | | | | | | | | | | | | | | | | | | | | |
| Year ended December 31, 2019 | PPAs | | Leasehold Rights | | Customer Relationships | | Customer Contracts | | Emission
Allowances | | | | Other | | Total |
| (In millions) | | | | | | | | | | | | | | | |
| January 1, 2019 | $ | 1,280 | | | $ | 86 | | | $ | 66 | | | $ | 15 | | | $ | 9 | | | | | $ | 8 | | | $ | 1,464 | |
| Acquisition of Carlsbad | 350 | | | 0 | | | 0 | | | 0 | | | 8 | | | | | 0 | | | 358 | |
| | | | | | | | | | | | | | | |
| December 31, 2019 | $ | 1,630 | | | $ | 86 | | | $ | 66 | | | $ | 15 | | | $ | 17 | | | | | $ | 8 | | | $ | 1,822 | |
| Less accumulated amortization | (347) | | | (22) | | | (9) | | | (10) | | | (2) | | | | | (4) | | | (394) | |
| Net carrying amount | $ | 1,283 | | | $ | 64 | | | $ | 57 | | | $ | 5 | | | $ | 15 | | | | | $ | 4 | | | $ | 1,428 | |
(a)$6 million of asset impairments relate to one of the November 2017 Drop Down Assets that was recorded by NRG during the quarter ended September 30, 2017, as further described in Note 9, Asset Impairments.
|
| | | | | | | | | | | | | | | | | | | | | | | | | | | | | | | |
| Year ended December 31, 2016 | PPAs | | Leasehold Rights | | Customer Relationships | | Customer Contracts | | Emission Allowances | | Development Rights | | Other | | Total |
| (In millions) | | | | | | | | | | | | | | | |
| January 1, 2016 | $ | 1,286 |
| | $ | 86 |
| | $ | 66 |
| | $ | 15 |
| | $ | 15 |
| | $ | 3 |
| | $ | 6 |
| | $ | 1,477 |
|
| Other | — |
| | — |
| | — |
| | — |
| | (6 | ) | | — |
| | — |
| | (6 | ) |
| December 31, 2016 | 1,286 |
| | 86 |
| | 66 |
| | 15 |
| | 9 |
| | 3 |
| | 6 |
| | 1,471 |
|
| Less accumulated amortization | (143 | ) | | (9 | ) | | (4 | ) | | (7 | ) | | (2 | ) | | (1 | ) | | (2 | ) | | (168 | ) |
| Net carrying amount | $ | 1,143 |
| | $ | 77 |
| | $ | 62 |
| | $ | 8 |
| | $ | 7 |
| | $ | 2 |
| | $ | 4 |
| | $ | 1,303 |
|
The Company recorded amortization expense of $71 million during each of years ended December 31, 2017 and 2016, and $56$91 million during the year ended December 31, 2015. Of these amounts, $70 million for each of the years ended December 31, 2017 and 2016, and $552020, $73 million for the year ended December 31, 2015,2019 and $71 million for the year ended December 31, 2018. Of these amounts, $88 million for the year ended December 31, 2020 and $72 million for the year ended December 31, 2019 and $70 million for the year ended December 31, 2018, were recorded to contract amortization expense and reduced operating revenues in the consolidated statements of operations. The Company estimates the future amortization expense for its intangibles to be $71 million for the next five years through 2022.
| | | | | | |
| (In millions) | |
| | |
| 2021 | $ | 91 | | |
| 2022 | 91 | | |
| 2023 | 88 | | |
| 2024 | 85 | | |
| 2025 | $ | 84 | | |
Out-of-market contracts
Note 9 — Asset Impairments
2020 Impairment Losses
During the fourth quarter of 2020 in the preparation and review of its annual budget, the Company updated its long-term estimates of operating and capital expenditures and revised its assessment of long-term merchant power prices which was primarily informed by present conditions and does not contemplate future policy changes, which could impact renewable energy power prices. As a result, the Company updated its estimated future cash flows and determined that the future cash flows for several wind projects within the Renewables segment no longer supported the recoverability of the related long-lived asset. As such, the Company recorded an impairment loss of $24 million, which primarily relates to property, plant, and equipment to reflect the assets at fair market value. The out-of-market contract liability represents the out-of-marketfair value of the PPAs forfacilities were determined using an income approach by applying a discounted cash flow methodology to the Blythe solar project and Spring Canyon wind projects and the out-of-market value of the land lease for Alta Wind XI, LLC, as of their respective acquisition dates. The Blythe solar project's liability of $7 million was recorded to other non-current liabilities on the consolidated balance sheet and is amortized to revenue in the consolidated statements of income on a units-of-production basis over the twenty-year term of the agreement. Spring Canyon's liability of $3 million was recorded to other non-current liabilities and is amortized to revenue on a straight-line basis over the twenty-five year term of the agreement. The Alta Wind XI, LLC's liability of $5 million was recorded to other non-current liabilities and is amortized as a reduction to cost of operations on a straight-line basis over the thirty-four year term of the land lease. At December 31, 2017, accumulated amortization of out-of-market contracts was $4 million and amortization expense was $1 millionlong-term budgets for each respective plant. The income approach included key inputs such as forecasted merchant power prices, operations and maintenance expense, and discount rates. The resulting fair value is a Level 3 fair value measurement.
Additionally, during the fourth quarter of the years ended December 31, 2017 and 2016.
Note 9 — Asset Impairments
During the quarter ended December 31, 2017,2020, as the Company updated its estimated cash flows in connection with the preparation and review of the Company's annual budget, the Company determined that there was a significant decrease in the estimated future cash flows for Elbow Creek,its equity method investment in San Juan Mesa, a facility in the Renewables segment located in Texas, andElida, New Mexico. The decrease in the Forward project, locatedforecasted cash flows which is primarily driven by a decline in Pennsylvania, were below the carryingforecasted revenue in future merchant periods, is significant enough to be considered an indication of a decline in value of the investment that is not temporary. The Company concluded there was an other-than-temporary impairment of its investment and recorded an impairment loss of $8 million to reflect the investment at fair market value. The resulting fair value is a Level 3 fair value measurement.
2019 Impairment Losses
The Company recorded an impairment loss of $19 million related assets, primarily drivento a facility in the Thermal segment during the second quarter of 2019. The impairment was triggered by continued declining merchant power pricesa potential sale negotiation with a third party which resulted in post-contract periods,signing the purchase and that the assets were considered impaired.sale agreement in September, as further described in Note 3, Acquisitions and Dispositions. The fair value of the facilitiesfacility was determined using an income approach by applying a discounted cash flow methodology to the long-term budgets for each respective plant. The income approach utilized estimates of discounted future cash flows, which were Level 3 fair value measurement and include key inputs, such as forecasted power prices, operations and maintenance expense, and discount rates. The Company measured the impairment loss as the difference between the carrying amount and the fair value of the assets and recorded impairment losses of $26 million and $5 million for Elbow Creek and Forward, respectively.assets.
Additionally, during the quarter ended September 30, 2017, in connection with the preparation of the model for sale of the November 2017 Drop Down Assets, it was identified that undiscounted cash flows were lower than the book value of certain SPP funds and NRG recorded an impairment expense of $13 million, $8 million of which relates to property, plant, and equipment and $5 million to PPAs, as described in Note 8, Intangible Assets. In accordance with the guidance for transfer of assets under common control, the impairment is reflected in the pre-acquisition net income of Drop Down Assets of the Company's consolidated statements of operations for the period ended December 31, 2017.
During the fourth quarter of 2016,2019, as a result of the preparation and review of its annual budget and assessment of long-term merchant power prices, the Company updated its estimated future cash flows in connection with the preparation and review of the Company's annual budget, the Company determined that the future cash flows for several wind projects within the Elbow Creek and Goat Wind projects andRenewables segment no longer supported the Forward project were below the carrying valuerecoverability of the related assets, primarily driven by declining merchant power prices in post-contract periods, and thatlong-lived asset. As such, the Company recorded an impairment loss of $14 million to reflect the assets were considered impaired. These projects were acquired in connection with the acquisition of the November 2015 Drop Down Assets and were recorded as part of the Renewables segment of the Company. The projects were recorded at historical cost at acquisition date as they were related to interests under common control by NRG.fair market value. The fair value of the facilities was determined using an income approach by applying a discounted cash flow methodology to the long-term budgets for each respective plant. The income approach utilized estimates of discounted future cash flows, which were Level 3 fair value measurement and includeincluded key inputs such as forecasted merchant power prices, operations and maintenance expense, and discount rates. The Company measured the impairment loss as the difference between the carrying amount and theresulting fair value of the assets and recorded impairment losses of $117 million, $60 million and $6 million for Elbow Creek, Goat Wind, and Forward, respectively.is a Level 3 fair value measurement.
Other Impairments — During the fourth quarters of 2016 and 2015, NRG recorded impairment losses of approximately $2 million and $1 million, respectively, related to the projects that were part of the November 2017 Drop Down Assets. Since the acquisition by the Company of the November 2017 Drop Down Assets related to transfer of assets under common control, these impairments were reflected in the Company's consolidated statements of operations for the periods ending December 31, 2016 and 2015.
Note 10 — Long-term Debt
The Company's borrowings, including short term and long term portions consisted of the following:
| | | | | | | | | | | | | | | | | | | | | | | |
| December 31, 2020 | | December 31, 2019 | | Interest rate % (a) | | Letters of Credit Outstanding at December 31, 2020 |
| (In millions, except rates) | | |
| 2020 Convertible Notes | 0 | | | 45 | | | 3.250 | | | |
| 2024 Senior Notes | 0 | | | 88 | | | 5.375 | | | |
| 2025 Senior Notes | 600 | | | 600 | | | 5.750 | | | |
| 2026 Senior Notes | 350 | | | 350 | | | 5.000 | | | |
| 2028 Senior Notes | 850 | | | 600 | | | 4.750 | | | |
Clearway Energy LLC and Clearway Energy Operating LLC Revolving Credit Facility, due 2023 (b) | 0 | | | 0 | | | L+1.50 | | $ | 66 | |
| Project-level debt: | | | | | | | |
Alpine, due 2022(e) | 0 | | | 119 | | | L+2.00 | | 0 | |
| Alta Wind I-V lease financing arrangements, due 2034 and 2035 | 800 | | | 844 | | | 5.696- 7.015 | | 44 | |
| Alta Wind Asset Management LLC, due 2031 | 14 | | | 15 | | | L+2.50 | | 0 | |
| Alta Wind Realty Investments LLC, due 2031 | 25 | | | 27 | | | 7.000 | | 0 | |
| Borrego, due 2024 and 2038 | 57 | | | 60 | | | Various | | 4 | |
| Buckthorn Solar, due 2025 | 126 | | | 129 | | | L+1.750 | | 22 | |
| Carlsbad Holdco, due 2038 | 210 | | | 216 | | | 4.210 | | | 4 | |
| Carlsbad Energy Holdings LLC, due 2027 | 156 | | | 175 | | | L+1.625 | | 63 | |
| Carlsbad Energy Holdings LLC, due 2038 | 407 | | | 407 | | | 4.120 | | — | |
| CVSR, due 2037 | 675 | | | 696 | | | 2.339 - 3.775 | | 0 | |
| CVSR Holdco Notes, due 2037 | 176 | | | 182 | | | 4.680 | | | 13 | |
| DG-CS Master Borrower LLC, due 2040 | 467 | | | 0 | | | 3.510 | | | 30 | |
| Duquesne, due 2059 | 95 | | | 95 | | | 4.620 | | | 0 | |
| El Segundo Energy Center, due 2023 | 250 | | | 303 | | | L+1.875 - L+2.500 | | 138 | |
| Energy Center Minneapolis Series D, E, F, G, H Notes, due 2025-2037 | 327 | | | 328 | | | various | | 0 | |
| Laredo Ridge, due 2028 | 78 | | | 84 | | | L+2.125 | | 10 | |
| Kawailoa Solar Portfolio LLC, due 2026 | 81 | | | 82 | | | L+1.375 | | 14 | |
| Marsh Landing, due 2023 | 146 | | | 206 | | | L+2.125 | | 27 | |
| NIMH Solar, due 2024 | 191 | | | 0 | | | L+2.00 | | 11 | |
| Oahu Solar Holdings LLC, due 2026 | 89 | | | 91 | | | L+1.375 | | 10 | |
| Repowering Partnership Holdco LLC, due 2020 | 0 | | | 228 | | | L+0.85 | | 0 | |
| Rosie Class B LLC, due 2027 | 80 | | | 0 | | | L+1.75 | | 19 | |
| Tapestry, due 2031 | 143 | | | 156 | | | L+1.375 | | 17 | |
| Utah Solar Holdings, due 2036 | 290 | | | 0 | | | 3.590 | | | 11 | |
| Utah Solar Portfolio, due 2022 | 0 | | | 254 | | | L+1.625 | | 0 | |
| Walnut Creek, due 2023 | 126 | | | 175 | | | L+1.75 | | 73 | |
| WCEP Holdings, LLC, due 2023 | 35 | | | 39 | | | L+3.00 | | 0 | |
Other(c) | 199 | | | 264 | | | various | | 50 | |
| Subtotal project-level debt | 5,243 | | | 5,175 | | | | | |
| Total debt | 7,043 | | | 6,858 | | | | | |
| Less current maturities | (384) | | | (1,824) | | | | | |
| Less net debt issuance costs | (79) | | | (78) | | | | | |
Add premiums (d) | 5 | | | 0 | | | | | |
| Total long-term debt | $ | 6,585 | | | $ | 4,956 | | | | | |
|
| | | | | | | | | | | | | | |
| | December 31, 2017 | | December 31, 2016 | | Interest rate % (a) | | Letters of Credit Outstanding at December 31, 2017 |
| | (In millions, except rates) | | |
| 2026 Senior Notes | $ | 350 |
| | $ | 350 |
| | 5.000 |
| | |
| 2024 Senior Notes | 500 |
| | 500 |
| | 5.375 |
| | |
| 2020 Convertible Notes | 288 |
| | 288 |
| | 3.250 |
| | |
| 2019 Convertible Notes | 345 |
| | 345 |
| | 3.500 |
| | |
NRG Yield LLC and NRG Yield Operating LLC Revolving Credit Facility, due 2019 (b) | 55 |
| | — |
| | L+2.500 |
| | $ | 74 |
|
| Project-level debt: | | | | | | | |
| Agua Caliente Borrower 2, due 2038 | 41 |
| | — |
| | 5.430 |
| | 17 |
|
| Alpine, due 2022 | 135 |
| | 145 |
| | L+1.750 |
| | 16 |
|
| Alta Wind I - V lease financing arrangements, due 2034 and 2035 | 926 |
| | 965 |
| | 5.696 - 7.015 |
| | 119 |
|
| CVSR, due 2037 | 746 |
| | 771 |
| | 2.339 - 3.775 |
| | — |
|
| CVSR Holdco Notes, due 2037 | 194 |
| | 199 |
| | 4.680 |
| | 13 |
|
| El Segundo Energy Center, due 2023 | 400 |
| | 443 |
| | L+1.75 - L+2.375 |
| | 102 |
|
| Energy Center Minneapolis, due 2025 | 83 |
| | 96 |
| | 5.950 | % | | — |
|
| Energy Center Minneapolis Series D Notes, due 2031 | 125 |
| | 125 |
| | 3.550 |
| | — |
|
| Laredo Ridge, due 2028 | 95 |
| | 100 |
| | L+1.875 |
| | 10 |
|
| Marsh Landing, due 2023 | 318 |
| | 370 |
| | L+1.875 |
| | 22 |
|
| Tapestry, due 2021 | 162 |
| | 172 |
| | L+1.625 |
| | 20 |
|
| Utah Solar Portfolio, due 2022 | 278 |
| | 287 |
| | various |
| | 13 |
|
| Viento, due 2023 | 163 |
| | 178 |
| | L+3.00 |
| | 27 |
|
| Walnut Creek, due 2023 | 267 |
| | 310 |
| | L+1.625 |
| | 41 |
|
| Other | 443 |
| | 505 |
| | various |
| | 38 |
|
| Subtotal project-level debt | 4,376 |
| | 4,666 |
| | | | |
| Total debt | 5,914 |
| | 6,149 |
| | | | |
| Less current maturities | (306 | ) | | (323 | ) | | | | |
| Less net debt issuance costs | (60 | ) | | (73 | ) | | | | |
Less discounts(c) | $ | (17 | ) | | $ | (27 | ) | | | | |
| Total long-term debt | $ | 5,531 |
| | $ | 5,726 |
| | | | |
(a)As of December 31, 2017,2020, L+ equals 3 month LIBOR plus x%, except for Viento,Rosie Class B, due 20232027 where L+ equals 61 month LIBOR plus 3.00%.x%
(b) Applicable rate is determined by the borrower leverage ratio, as defined in the credit agreement.agreement
(c) Discounts December 31, 2019 includes Blythe and Roadrunner debt outstanding of $14 million and $28 million, respectively which were transferred to NIMH in the third quarter of 2020, as described below
(d) Premiums relate to the 2019 Convertible2028 Senior Notes and 2020 Convertible Notes.
The financing arrangements listed above contain certain covenants, including financial covenants that the Company is required to be in compliance with during the term of the respective arrangement. As of December 31, 2017,2020, the Company was in compliance with all of the required principal, interest, sinking fund and redemption covenants.
NRG YieldClearway Energy LLC and Clearway Energy Operating LLC 2026Revolving Credit Facility
On December 20, 2019, the Company entered into the Fifth Amendment to Amended and Restated Credit Agreement to provide for an increase of 0.50x to the borrower leverage ratio, as defined in the Amended and Restated Credit Agreement, for the last two fiscal quarters of 2020 and to implement certain other technical modifications.
As of December 31, 2020, the Company had 0 outstanding borrowings under the revolving credit facility and $66 million in letters of credit outstanding. During the year ended December 31, 2020, the Company borrowed $265 million under the revolving credit facility, and subsequently repaid $265 million utilizing the proceeds from the issuance of additional 2028 Senior Notes, as described below, and cash on hand.The Company had $195 million outstanding under the revolving credit facility and a total of $70 million in letters of credit outstanding as of February 26, 2021.
2028 Senior Notes
On August 18, 2016, NRG Yield Operating LLC issued $350May 21, 2020, the Company completed the issuance of an additional $250 million in aggregate principal amount of senior unsecured notes, or the 2026its 4.750% Senior Notes.Notes due 2028. The 20262028 Senior Notes bear interest at 5.00%4.75% and mature on SeptemberMarch 15, 2026.2028. Interest on the notes2028 Senior Notes is payable semi-annually on March 15 and September 15 of each year.year, and interest payments will commence on September 15, 2020. The 20262028 Senior Notes are senior unsecured obligations of NRG YieldClearway Energy Operating, LLC and are guaranteed by NRG YieldClearway Energy, LLC and by certain of NRG YieldClearway Energy Operating LLC’s wholly owned current and future subsidiaries. A portionThe notes were issued at a price of the102% of par plus accrued interest from December 11, 2019. The net proceeds of the 2026 Senior Notes were usedutilized to repay the $45 million outstanding principal amount of the Company's 2020 Convertible Notes on June 1, 2020, as well as to repay amounts outstanding under the Company’s revolving credit facility during 2016, as described below.and for general corporate purposes.
2020 Convertible Senior Notes
TheOn December 11, 2019, the Company has outstanding $288completed the sale of $600 million aggregate principal amount of 3.25% Convertiblethe Senior Notes due 2020, or2028. The proceeds from the 2028 Senior Notes were partially used to repay the 2024 Senior Notes, as further described below.
2020 Convertible Notes. Notes
The 2020 Convertible Notes are convertible, under certain circumstances, intomatured on June 1, 2020 and the Company’s Class C common stock, cash or a combination thereof at an initial conversion price of $27.50 per Class C common share, which is equivalent to a conversion rate of approximately 36.3636 shares of Class C common stock per $1,000Company repaid the outstanding principal amount of notes. Interest on$45 million. The repayment was funded by the 2020 Convertible Notes is payable semi-annually in arrears on June 1 and December 1 of each year. Prior to the close of business on the business day immediately preceding December 1, 2019, the 2020 Convertible Notes will be convertible only upon the occurrence of certain events and during certain periods, and thereafter, at any time until the close of business on the second scheduled trading day immediately preceding the maturity date. The 2020 Convertible Notes are guaranteed by NRG Yield Operating LLC and NRG Yield LLC.
The Company separately accounts for the liability (debt) and equity (conversion option) componentsissuance of the 2020 Convertible Notes and recognized $23 million as the value for the equity component in 2015 with the offset to debt discount. The debt discount is amortized to interest expense using the effective interest method through June 2020.2028 Senior Notes.
As of December 31, 2017, the 2020 Convertible Notes were trading at approximately 98.8% of their face value, resulting in a total market value of $284 million compared to a carrying value of $276 million. The actual conversion value of the 2020 Convertible Notes is based on the product of the conversion rate and the market price of the Company's Class C common stock, as defined in the 2020 Convertible Notes indenture. As of December 31, 2017, the Company's Class C common stock closed at $18.90 per share, resulting in a pro forma conversion value for the 2020 Convertible Notes of approximately $198 million.
2019 Convertible2024 Senior Notes Redemption
TheOn January 3, 2020, the Company has outstanding $345redeemed the $88 million aggregate principal amount of 3.50%the 2024 Senior Notes that remained outstanding following the Company's tender offer for the 2024 Senior Notes in December 2019. The redemption was effectuated at a premium of 102.7% for a total consideration of $90 million and as a result, the Company recorded a loss on debt extinguishment in the amount of $3 million, which also included the write off of previously deferred financing fees related to the 2024 Senior Notes.
2024 Senior Notes Tender Offer
On December 13, 2019, the Company repurchased an aggregate principal amount of $412 million or 82.4%, of the 2024 Senior Notes as part of the previously cash tender offer announced on December 11, 2019. Concurrently with the launch of the tender offer, the Company exercised its right to optionally redeem any 2024 Senior Notes not validly tendered and purchased in the tender offer, pursuant to the terms of the indenture governing the 2024 Senior Notes. The redemption of the Senior Notes due 2024 in December were effectuated at a premium of 103% for a total consideration of $424 million and as a result, the Company recorded a loss on extinguishment in the amount of $12 million. In addition, the Company recorded a $2 million debt extinguishment loss in connection with the write off of the deferred financing fees related to the 2024 Senior Notes.
2019 Convertible Notes due 2019, or the 2019 Convertible Notes.
The 2019 Convertible Notes were convertible, under certain circumstances, into the Company’s Class A common stock, cash or a combination thereof at a conversion rate was of approximately 42.9644 shares of Class A common stock per $1,000 principal amount of 2019 Convertible Notes in accordance with the terms of the related indenture. The 2019 Convertible Notes maturematured on February 1, 2019 unless earlierand the Company paid off the remaining balance of an aggregate principal amount of $170 million. In January 2019, the Company repurchased or converted in accordance with their terms. Prior to the closean aggregate principal amount of business on the business day immediately preceding August 1, 2018, the 2019 Convertible Notes will be convertible only upon the occurrence of certain events and during certain periods, and thereafter, at any time until the close of business on the second scheduled trading day immediately preceding the maturity date. The 2019 Convertible Notes are guaranteed by NRG Yield Operating LLC and NRG Yield LLC.
The Company separately accounts for the liability (debt) and equity (conversion option) components$50 million of the 2019 Convertible Notes and recognized $23in open market transactions. The Company repurchased an aggregate principal amount of $125 million as the value for the equity component in 2014 with the offset to debt discount. The debt discount is amortized to interest expense using the effective interest method through February 2019.
As of December 31, 2017, the 2019 Convertible Notes were trading at approximately 100.9% of their face value, resulting in a total market value of $348 million compared to a carrying value of $340 million. The actual conversion value of the 2019 Convertible Notes is based onduring 2018.
Project level Debt
PG&E Bankruptcy
On July 1, 2020, PG&E emerged from bankruptcy and assumed the productCompany's contracts without modification. In addition, PG&E paid to the Company's applicable projects the portion of the conversion rateinvoices corresponding to the electricity delivered
between January 1 and January 28, 2019. These invoices related to the market pricepre-petition period services and any payment therefore required the approval of the Company's Class A common stock, as defined in the Convertible Debt indenture. As of December 31, 2017, the Company's Class A common stock closed at $18.85 per share, resulting in a pro forma conversion value for the Convertible Notes of approximately $279 million.
During each year ended December 31, 2017 and 2016,Bankruptcy Court. Subsequent to PG&E's emergence from bankruptcy, the Company recordedentered into waiver agreements with the following expenses in relationlenders to the respective financing agreements related to the PG&E Bankruptcy.
Rosamond Central (Rosie Class B LLC)
On December 21, 2020 and 2019 Convertible Notes on a combined basis at the effective rates of 5.10% and 5.00%, respectively:
|
| | | | | |
| (In millions) | | | |
Interest expense (a) | | $ | 21 |
| |
| Debt discount amortization | | 9 |
| |
| Debt issuance costs amortization | | 3 |
| |
| | | $ | 33 |
| |
(a) Interest expense is calculated using coupon rate of 3.25% and 3.5% for 2020 and 2019 Convertible Notes, respectively.
NRG Yield LLC and NRG Yield Operating LLC Revolving Credit Facility
The Company borrowed $55 million from the revolving credit facility during the year ended December 31, 2017 for general corporate needs as well as to fund dividend payments.
The Company used its proceeds of $97.5 million from the CVSR Holdco Financing Arrangement, a portion of its proceeds from the issuance of the 2026 Senior Notes, as well as its cash on hand to repay the outstanding borrowings under the revolving credit facility during the year ended December 31, 2016.
On February 6, 2018, NRG Yield Operating LLC and NRG Yield LLC amended the revolving credit facility to modify the "change of control" provisions to permit the consummation of the NRG Transaction, and also to permit NRG Yield Operating LLC, NRG Yield LLC and certain subsidiaries to incur up to $1.5 billion of unsecured indebtedness in order to repurchase or make other required cash payments, in each case if applicable, with respect to NRG Yield Operating LLC’s outstanding senior notes and NRG Yield's outstanding convertible notes in connection with the NRG Transaction.
Project - level Debt
November 2017 Drop Down Assets Debt
As part of the November 2017 Drop Down acquisition of Rosie TargetCo LLC, as further descried in Note 3, Acquisitions and Dispositions, the Company assumed non-recourse debtthe Amended and Restated Financing Agreement, which provided for a construction loan of $26up to $91 million, relatinga cash equity bridge loan of up to certain SPP funds.$24 million and an investment tax credit loan of up to $132 million.
On December 31, 2020, Rosie Class B, LLC converted the construction loan to a $80 million term loan and repaid the investment tax credit loan of $130 million, utilizing tax equity funding. The assumed debt consistedterm loan bears annual interest at a rate of LIBOR plus an applicable margin, which is 1.75% per annum through the third anniversary of the following: a) a term loan under a credit agreement with a bank, with aconversion, and 2.00% per annum thereafter through the maturity date of December 31, 20382027. In addition, Rosie Class B LLC is party to several letter of credit facility agreements, not to exceed $23 million. As of December 31, 2020, a total of $19 million in letters of credit were outstanding.
Repowering Partnership Holdco LLC, due 2020
On June 14, 2019, as part of the Repowering Partnership, the Company entered into a financing agreement for non-recourse debt for a total commitment amount of $352 million related to the construction for the repowering activities at Wildorado and Elbow Creek. The debt consisted of a construction loan at an interest rate of 4.69%LIBOR plus 0.85%. The Company borrowings were utilized to repay $109 million of the outstanding balance, including accrued interest, under the Viento financing agreement, to reimburse Clearway Renew LLC for previous contributions into the Repowering Partnership and pay construction invoices. On November 26, 2019, the construction loan of $93 million related to the repowering activities at Elbow Creek was repaid with the proceeds from the tax equity investor. On February 7, 2020, the construction loan of $260 million related to the repowering activities at Wildorado was repaid with the proceeds from the tax equity investor.
Consolidation of DGPV Holdco 3
Upon consolidation of DGPV Holdco 3, as described in Note 5, Investments Accounted for by the Equity Method and Variable Interest Entities, the Company consolidates additional non-recourse debt for certain subsidiaries as further described below.
Renew CS4 Borrower LLC, or CS4 Borrower, a consolidated subsidiary of DGPV Holdco 3, is party to a credit agreement for construction loans up to $97 million, an investment tax credit bridge loan, or ITC bridge loan, for up to $90 million and letter of credit facilities up to $5 million. The construction loan and the ITC bridge loan both have an interest rate of LIBOR plus an applicable margin of 2.00% per annum. As of June 30, 2020, all construction loans were converted to term loans and the ITC bridge loans were repaid in connection with tax equity funding. The term loan was repaid on November 2, 2020 with the proceeds of the term loan issued by DG-CS Master Borrower LLC, as described below.
Chestnut Borrower LLC, a consolidated subsidiary of DGPV Holdco 3, is party to a credit agreement for term loans of up to $120 million and letters of credit of up to $8 million. The loans were repaid on November 2, 2020 with the proceeds of the term loan issued by DG-CS Master Borrower LLC, as described below
DG-CS Master Borrower LLC
On November 2, 2020, DG-CS Master Borrower LLC, a wholly owned subsidiary of Clearway Energy Operating LLC, entered into a financing arrangement, which included the issuance of a $467 million term loan, as well as $30 million in letters of credit in support of debt service. The term loan bears interest at 3.51% and mature on September 30, 2040. The proceeds from the loan were utilized to repay existing project-level debt outstanding for Chestnut Borrower LLC, Renew Solar CS 4 Borrower LLC, DGPV 4 Borrower LLC and Puma Class B LLC of $107 million, $102 million, $92 million and $73 million, respectively and unwind related interest rate swaps in the amount of $42 million. The remaining proceeds were utilized to pay related fees and expenses and in part to acquire the Class B membership interests in the DGPV Holdco Entities and an SREC contract from CEG as further described in Note 5, Investments Accounted for by the Equity Method and Variable Interest Entities. Concurrent with the refinancing, the projects were transferred under DG-CS Master Borrower LLC and the obligations under the financing arrangement are supported by the Company's interest in the projects.
Utah Solar Holdings, LLC
On September 1, 2020, Utah Solar Holdings, LLC, or Utah Solar, entered into a financing arrangement, which included the issuance of approximately $296 million in senior secured notes supported by the Company’s interest in the Utah projects (Four Brothers, Granite Mountain and Iron Springs, previously defined as the Utah Solar Portfolio), as well as $16 million in letters of credit in support of debt service obligations. The notes bear interest at 3.59% per annum and mature on December 31, 2036. The proceeds from the issuance were utilized to repay existing debt outstanding of approximately $247 million for the Utah projects and to unwind the related interest rate swaps in the amount of $33 million. The remaining proceeds were utilized to pay related fees and expenses, with the remaining $9 million distributed to Clearway Energy Operating LLC.
NIMH Solar LLC
On September 30, 2020, the Alpine, Blythe and Roadrunner projects were transferred under NIMH Solar LLC, a wholly owned subsidiary of Clearway Energy Operating LLC. Concurrently, total project-level debt outstanding for Alpine, Blythe and Roadrunner of $158 million was assigned to NIMH Solar LLC. The consolidated facility was amended to a term loan for$193 million, as well as $16 million in letters of credit in support of debt service and project obligations. The term loan bears annual interest rate of LIBOR, plus an applicable margin, which is 2.00% per annum through the third anniversary of closing, and 2.125% per annum thereafter through the maturity date in September 2024. As a result of the amendment the Company received $35 million which was utilized to pay related fees and expenses and along with existing project level cash, provided a distribution to Clearway Energy Operating LLC of $45 million. The obligations under the financing arrangement are supported by the Company’s interests in the projects.
Carlsbad Drop Down Asset Debt
On December 6, 2019, as part of the Carlsbad Drop Down acquisition, as further described in Note 3, Acquisitions and Dispositions, the Company assumed $803 million of senior secured, non-recourse notes related to Carlsbad Holdco LLC and Carlsbad Energy Holding LLC. The Carlsbad Holdco LLC notes bear an interest rate of 4.21%, and are fully amortizing over 19 years. In addition, Carlsbad Holdco LLC is party to a letter of credit facility agreement with the issuing banks for an aggregate principal amount not to exceed $10 million. Fees on the unused commitment are 0.65%.
Carlsbad Energy Holdings LLC is party to a note payable agreement with financial institutions for the issuance of up to $407 million of senior secured notes that bear interest at a rate of 4.12%, and mature on October 31, 2038. Carlsbad Energy Holdings LLC is also party to a term loan agreement with issuing banks for an aggregate principal amount of $194 million at an issuance rate of LIBOR plus an applicable margin of 1.625% until February 25, 2022, 1.750% until February 25, 2025, and 1.875% until maturity. Fees on the unused commitment are 0.50%. upon completion of the project. The agreement also includes a letter of credit supporting debt service requirementsfacility with an aggregate principal amount not to exceed $83 million, and a letter of credit in support of the PPA; b) and financing obligation in connectionworking capital loan facility with a sale-leaseback transaction with a bank for a period through March 31, 2032. The company will accrete the financing obligation over the lease term based on the lease's implicit interest rate of 8%.an aggregate principal amount not to exceed $4 million.
Agua Caliente Borrower 2 due 2038Debt Repayment
On February 17, 2017,October 21, 2019, the Company, through Agua Caliente Borrower 1 2 LLC, an indirect subsidiary of NRG, and Agua Caliente Borrower 2 LLC, issued $130repaid $40 million of senior securedthe outstanding notes under the Agua Caliente Borrower 1 LLCbalance, including accrued interest and Agua Caliente Borrower 2 LLC financing agreement, or Agua Caliente Holdco Financing Agreement, that bear interest at 5.43% and mature on December 31, 2038. As described in Note 3, Business Acquisitions, on March 27, 2017, the Company acquired Agua Caliente Borrower 2 LLC from NRG as part of the March 2017 Drop Down Assets acquisition and assumed NRG's portion of senior secured notespremiums, issued under the Agua Caliente Holdco Financing Agreement. Agua Caliente Borrower 2 LLC holds $41 million of the Agua Caliente Holdco debtThe repayment was funded with Company's existing liquidity.
Duquesne University
OnMay 1, 2019, as of December 31, 2017. The debt is joint and several with respect to Agua Caliente Borrower 1 LLC and Agua Caliente Borrower 2 LLC and is secured by the equity interests of each borrower in the Agua Caliente solar facility.
Utah Solar Portfolio, due 2022
As part of the March 2017 Drop Down AssetsDuquesne University district energy system acquisition, ECP Uptown Campus LLC issued non-recourse debt of $95 million, excluding financing fees. The debt consists of senior notes at an interest rate of 4.62% that mature onMay 1, 2059. Interest on the notes are payable semi-annually in arrears. The proceeds of the debt, along with cash on hand, were utilized to fund the purchase price of the acquisition.
Oahu Solar Holdings LLC
Due to the Company consolidating the Oahu Partnership, as further described in Note 5, Investments Accounted for by the Equity Method and Variable Interest Entities, the Company assumed non-recourse debt of $287$143 million relatingrelated to the UtahOahu Solar PortfolioHoldings, LLC. The debt consists of a construction loan and an ITC bridge loan with a total commitment amount of $162 million, both at an interest rate of LIBOR plus 2.625%1.375%. TheOn November 13, 2019, $90 million of non-recourse debt matures on December 16, 2022. The $287 million consistedwas converted to a term loan with an expected maturity of $222 million outstanding atNovember 2026, and the time of NRG's acquisitionremainder of the Utahnon-recourse debt was repaid with the final contribution from the tax equity investor of $67 million upon the project reaching substantial completion. Interest on the term loan is payable quarterly in arrears.
Kawailoa Solar Portfolio on November 2, 2016, andLLC
additional borrowings of $65 million, net of debt issuance costs, incurred during 2016. The Company holds $278 million of the Utah Solar Portfolio debt as of December 31, 2017.
Thermal Financing
On October 31, 2016, NRG Energy Center Minneapolis LLC, a subsidiary of the Company, received proceeds of $125 million from the issuance of 3.55% Series D notes due October 31, 2031, or the Series D Notes, and entered into a shelf facility for the anticipated issuance of an additional $70 million of Series E notes at a 4.80% fixed rate. The Series D Notes will be secured by substantially all of the assets of NRG Energy Center Minneapolis LLC. NRG Thermal LLC has guaranteed the indebtedness and its guarantee is secured by a pledge of the equity interests in all of NRG Thermal LLC’s subsidiaries. NRG Energy Center Minneapolis LLC distributed the proceeds of the Series D Notes to NRG Thermal LLC, which in turn distributed the proceeds to NRG Yield Operating LLC to be utilized for general corporate purposes, including potential acquisitions.
On March 16, 2017, NRG Energy Center Minneapolis LLC, a subsidiary of NRG Thermal LLC, amended the shelf facility of its existing Thermal financing arrangement to allow for the issuance of an additional $10 million of Series F notes at a 4.60% interest rate, or Series F Notes, increasing the total principal amount of notes available for issuance under the shelf facility to $80 million. The Series E and Series F Notes will be secured by substantially all of the assets of NRG Energy Center Minneapolis LLC. NRG Thermal LLC has guaranteed the indebtedness and its guarantee is secured by a pledge of the equity interests in all of NRG Thermal LLC’s subsidiaries.
CVSR Holdco Notes, due 2037
On July 15, 2016, CVSR Holdco, the indirect owner of the CVSR solar facility, issued $200 million of senior secured notes under the CVSR Holdco Financing Agreement, or 2037 CVSR Holdco Notes, that bear interest at 4.68% and mature on March 31, 2037. Net proceeds were distributedDue to the Company and NRG based on their respective ownershipconsolidating the Kawailoa Partnership, as of July 15, 2016, and, accordingly, the Company received net proceeds of $97.5 million.
As described in Note 3, Business Acquisitions, on September 1, 2016, the Company acquired the remaining 51.05% of CVSR, and assumed additional debt of $496 million, which represents 51.05% of the CVSR project level debt and 51.05% of the 2037 CVSR Holdco Notes. In connection with the retrospective adjustment of prior periods, asfurther described in Note 1, Nature of Business5, Investments Accounted for by the Equity Method and Variable Interest Entities, the Company now consolidates CVSRassumed non-recourse debt of $120 million related to Kawailoa Solar Portfolio, LLC. The debt consists of a construction loan and 100%an ITC bridge loan, with a total commitment amount of its debt, consisting$137 million both at an interest rate of $771LIBOR plus 1.375%. On December 23, 2019, $82 million of non-recourse debt was converted to a term loan with an expected maturity of December 2026, and the remainder of the non-recourse debt was repaid with the final contribution from the tax equity investor of $57 million upon the project level debt and $200reaching substantial completion. Interest on the term loan is payable quarterly in arrears.
South Trent Refinancing
On June 14, 2019, the Company, through South Trent Wind LLC, refinanced $49 million of 2037 CVSR Holdco Notes asnon-recourse debt due 2020 at an interest rate of September 1, 2016.LIBOR plus 1.625% by issuing $46 million of new non-recourse financing due 2028 at an interest rate of LIBOR plus 1.350%.
Tapestry Refinancing
On April 29, 2019, the Company, through Tapestry Wind LLC, refinanced $147 million of non-recourse debt due 2021 at interest rate of LIBOR plus 1.75% by issuing $164 million of new non-recourse financing due 2031 at an interest rate of LIBOR plus 1.375%.
Interest Rate Swaps — Project Financings
Many of the Company's project subsidiaries entered into interest rate swaps, intended to hedge the risks associated with interest rates on non-recourse project level debt. These swaps amortize in proportion to their respective loans and are floating for a fixed rate where the project subsidiary pays its counterparty the equivalent of a fixed interest payment on a predetermined notional value and will receive quarterly the equivalent of a floating interest payment based on the same notional value. All interest rate swap payments by the project subsidiary and its counterparty are made quarterly and the LIBOR is determined in advance of each interest period.
The following table summarizes the swaps, some of which are forward starting as indicated, related to the Company's project level debt as of December 31, 2017:2020:
| | | | | | | | | | | | | | | | | | | | | | | | | | | | | | | | | | | | | | |
| | % of Principal | | Fixed Interest Rate | | Floating Interest Rate | | Notional Amount at December 31, 2020 (In millions) | | Effective Date | | Maturity Date |
| Avra Valley | | 87 | % | | 2.33 | % | | 3-Month LIBOR | | 38 | | | November 30, 2012 | | November 30, 2030 |
| Alta Wind Asset Management | | 100 | % | | 2.47 | % | | 3-Month LIBOR | | 14 | | | May 22, 2013 | | May 15, 2031 |
| Borrego | | 100 | % | | 0.476 | % | | 3-Month LIBOR | | 13 | | | June 30, 2020 | | December 31, 2024 |
| Buckthorn Solar | | 82 | % | | Various | | 3-Month LIBOR | | 103 | | | February 28, 2018 | | December 31, 2041 |
| Carlsbad | | 100 | % | | Various | | 3-Month LIBOR | | 156 | | | Various | | September 30, 2027 |
| El Segundo | | 100 | % | | Various | | 3-Month LIBOR | | 250 | | | Various | | Various |
| Kansas South | | 75 | % | | 2.368 | % | | 6-Month LIBOR | | 17 | | | June 28, 2013 | | December 31, 2030 |
| Kawailoa Solar | | 94 | % | | Various | | 3-Month LIBOR | | 76 | | | November 30, 2019 | | October 31, 2040 |
| Laredo Ridge | | 100 | % | | Various | | 3-Month LIBOR | | 78 | | | December 17, 2014 | | December 31, 2028 |
| Marsh Landing | | 100 | % | | Various | | 3-Month LIBOR | | 146 | | | June 28, 2013 | | June 30, 2023 |
| NIMH Solar LLC | | 100 | % | | Various | | 3-Month LIBOR | | 191 | | | September 30, 2020 | | Various |
| Oahu Solar | | 96 | % | | Various | | 3-Month LIBOR | | 86 | | | November 30, 2019 | | October 31, 2040 |
| Rosie Class B | | 95 | % | | 1.446 | % | | 3-Month LIBOR | | 76 | | | December 31, 2020 | | July 29, 2044 |
| South Trent | | 90 | % | | 3.847 | % | | 3-Month LIBOR | | 35 | | | June 14, 2019 | | June 30, 2028 |
| Tapestry | | 75 | % | | Various | | 3-Month LIBOR | | 107 | | | Various | | Various |
| Tapestry | | 50 | % | | 3.57 | % | | 3-Month LIBOR | | 12 | | | December 21, 2021 | | December 21, 2029 |
| Viento Funding II | | 100 | % | | 3.03 | % | | 6-Month LIBOR | | 33 | | | Various | | Various |
| Viento Funding II | | 100 | % | | 4.985 | % | | 6-Month LIBOR | | 21 | | | July 11, 2023 | | June 30, 2028 |
| Walnut Creek Energy | | 90 | % | | 3.543 | % | | 3-Month LIBOR | | 114 | | | June 28, 2013 | | May 31, 2023 |
| WCEP Holdings | | 100 | % | | 4.003 | % | | 3-Month LIBOR | | 34 | | | June 28, 2013 | | May 31, 2023 |
| Total | | | | | | | | $ | 1,600 | | | | | |
|
| | | | | | | | | | | | | | | | |
| | | % of Principal | | Fixed Interest Rate | | Floating Interest Rate | | Notional Amount at December 31, 2017 (In millions) | | Effective Date | | Maturity Date |
| Alpine | | 85 | % | | various |
| | 3-Month LIBOR | | $ | 115 |
| | various | | various |
| Avra Valley | | 85 | % | | 2.333 | % | | 3-Month LIBOR | | 46 |
| | November 30, 2012 | | November 30, 2030 |
| AWAM | | 100 | % | | 2.47 | % | | 3-Month LIBOR | | 17 |
| | May 22, 2013 | | May 15, 2031 |
| Blythe | | 75 | % | | 3.563 | % | | 3-Month LIBOR | | 13 |
| | June 25, 2010 | | June 25, 2028 |
| Borrego | | 75 | % | | 1.125 | % | | 3-Month LIBOR | | 5 |
| | April 3, 2013 | | June 30, 2020 |
| El Segundo | | 75 | % | | various |
| | 3-Month LIBOR | | 340 |
| | various | | various |
| Kansas South | | 75 | % | | 2.368 | % | | 6-Month LIBOR | | 21 |
| | June 28, 2013 | | December 31, 2030 |
| Laredo Ridge | | 75 | % | | 2.31 | % | | 3-Month LIBOR | | 75 |
| | March 31, 2011 | | March 31, 2026 |
| Marsh Landing | | 75 | % | | 3.244 | % | | 3-Month LIBOR | | 295 |
| | June 28, 2013 | | June 30, 2023 |
| Roadrunner | | 75 | % | | 4.313 | % | | 3-Month LIBOR | | 26 |
| | September 30, 2011 | | December 31, 2029 |
| South Trent | | 75 | % | | 3.265 | % | | 3-Month LIBOR | | 40 |
| | June 15, 2010 | | June 14, 2020 |
| South Trent | | 75 | % | | 4.95 | % | | 3-Month LIBOR | | 21 |
| | June 30, 2020 | | June 14, 2028 |
| Tapestry | | 75 | % | | 2.21 | % | | 3-Month LIBOR | | 146 |
| | December 30, 2011 | | December 21, 2021 |
| Tapestry | | 50 | % | | 3.57 | % | | 3-Month LIBOR | | 60 |
| | December 21, 2021 | | December 21, 2029 |
| Utah Solar Portfolio | | 80 | % | | various |
| | 1-Month LIBOR | | 223 |
| | various | | September 30, 2036 |
| Viento Funding II | | 90 | % | | various |
| | 6-Month LIBOR | | 148 |
| | various | | various |
| Viento Funding II | | 90 | % | | 4.985 | % | | 6-Month LIBOR | | 65 |
| | July 11, 2023 | | June 30, 2028 |
| Walnut Creek Energy | | 75 | % | | various |
| | 3-Month LIBOR | | 239 |
| | June 28, 2013 | | May 31, 2023 |
| WCEP Holdings | | 90 | % | | 4.003 | % | | 3-Month LIBOR | | 45 |
| | June 28, 2013 | | May 31, 2023 |
| Total | | | | | | | | $ | 1,940 |
| | | | |
Annual Maturities
Annual payments based on the maturities of the Company's debt, for the years ending after December 31, 2017,2020, are as follows:
| | | | | |
| | (In millions) |
| 2021 | $ | 384 | |
| 2022 | 407 | |
| 2023 | 431 | |
| 2024 | 359 | |
| 2025 | 934 | |
| Thereafter | 4,528 | |
| Total | $ | 7,043 | |
|
| | | |
| | (In millions) |
| 2018 | $ | 306 |
|
| 2019 | 722 |
|
| 2020 | 657 |
|
| 2021 | 455 |
|
| 2022 | 653 |
|
| Thereafter | 3,121 |
|
| Total | $ | 5,914 |
|
Note 11 — Earnings (Loss) Earnings Per Share
Basic earnings per common share is computed by dividing net income by the weighted average number of common shares outstanding. Shares issued during the year are weighted for the portion of the year that they were outstanding. Diluted earnings per share is computed in a manner consistent with that of basic earnings per share while giving effect to all potentially dilutive common shares that were outstanding during the period.
The number of shares and per share amounts for the period ended December 31, 2015 have been retrospectively restated to reflect the Recapitalization as further described in Note 12, Stockholders' Equity.
The reconciliation of the Company's basic and diluted (loss) earnings per share is shown in the following table:
| | | | | | | | | | | | | | | | | | | | | | | | | | | | | | | | | | | |
| Year Ended December 31, |
| 2020 | | 2019 | | 2018 |
(In millions, except per share data) (a) | Common Class A | | Common Class C | | Common Class A | | Common Class C | | Common Class A | | Common Class C |
| Basic and diluted earnings (loss) per share attributable to Clearway Energy, Inc. common stockholders | | | | | | | | | | | |
| Net income (loss) attributable to Clearway Energy, Inc. | $ | 7 | | | $ | 18 | | | $ | (4) | | | $ | (7) | | | $ | 16 | | | $ | 32 | |
| Weighted average number of common shares outstanding — basic | 35 | | | 80 | | | 35 | | | 74 | | | 35 | | | 69 | |
| Weighted average number of common shares outstanding — diluted | 35 | | | 81 | | | 35 | | | 74 | | | 35 | | | 69 | |
| Earnings (loss) per weighted average common share — basic and diluted | $ | 0.22 | | | $ | 0.22 | | | $ | (0.10) | | | $ | (0.10) | | | $ | 0.46 | | | $ | 0.46 | |
| | | | | | | | | | | |
| | | | | | | | | | | |
| | | | | | | | | | | |
| | | | | | | | | | | |
|
| | | | | | | | | | | | | | | | | | | | | | | |
| | Year Ended December 31, 2017 | | Year Ended December 31, 2016 | | Year Ended December 31, 2015 |
(In millions, except per share data) (a) | Common Class A | | Common Class C | | Common Class A | | Common Class C | | Common Class A | | Common Class C |
| Basic and diluted (loss) earnings per share attributable to NRG Yield, Inc. common stockholders | | | | | | | | | | | |
| Net (loss) income attributable to NRG Yield, Inc. | $ | (6 | ) | | $ | (10 | ) | | $ | 20 |
| | $ | 37 |
| | $ | 14 |
| | $ | 19 |
|
| Weighted average number of common shares outstanding — basic and diluted | 35 |
| | 64 |
| | 35 |
| | 63 |
| | 35 |
| | 49 |
|
| (Loss) Earnings per weighted average common share — basic and diluted | $ | (0.16 | ) | | $ | (0.16 | ) | | $ | 0.58 |
| | $ | 0.58 |
| | $ | 0.40 |
| | $ | 0.40 |
|
(a) Net income (loss) income attributable to NRG Yield,Clearway Energy, Inc. and basic and diluted earnings (loss) earnings per share might not recalculate due to presenting values in millions rather than whole dollars.
The following table summarizes the Company's outstanding equity instruments that are anti-dilutive and were not included in the computation of the Company's diluted earnings per share:
| | | | | | | | | | | | | | | | | |
| | Year Ended December 31, |
| | 2020 | | 2019 | | 2018 |
| | (In millions of shares) |
| 2019 Convertible Notes - Common Class A | 0 | | | 0 | | | 9 | |
| 2020 Convertible Notes - Common Class C | 0 | | | 2 | | | 8 | |
|
| | | | | | | | |
| | Year Ended December 31, |
| | 2017 | | 2016 | | 2015 |
| | (In millions of shares) |
| 2019 Convertible Notes - Common Class A | 15 |
| | 15 |
| | 15 |
|
| 2020 Convertible Notes - Common Class C | 10 |
| | 10 |
| | 5 |
|
Note 12 — Stockholders' Equity
On July 22, 2013, in connection with its initial public offering, the Company authorized 500,000,000 shares of2019 Class A common stock, of which 22,511,250 were issued to the public and became outstanding. In addition, the Company authorized 500,000,000 shares of Class B common stock, of which 42,738,750 were issued to NRG concurrently with the initial public offering and became outstanding. C Common Stock Issuance
The Company utilized proceeds from the issuancesold a total of the Class A common stock to acquire a controlling interest in NRG Yield LLC from NRG. Each share of the Class A common stock and the Class B common stock entitles the holder to one vote on all matters.
In 2014, the Company issued 12,075,0005,405,405 shares of Class A common stock and used the proceeds to acquire 12,075,000 additional Class A units of NRG Yield LLC.
Recapitalization
On May 5, 2015, the Company's stockholders approved amendments to the Company's certificate of incorporation that adjusted the Company’s capital structure by creating two new classes of capital stock, Class C common stock and Class D common stock, and distributed sharesfor net proceeds of $100 million on December 2, 2019. The Company utilized the proceeds of the offering to acquire 5,405,405 Class C and Class D common stock to holdersunits of the Company's outstanding Class A and Class B common stock, respectively, through a stock split. The Recapitalization became effective on May 14, 2015.Clearway Energy LLC.
The Company also retrospectively adjusted all prior period share and per share amounts in the consolidated financial statements for the effect of the stock dividend, so that all periods are comparable.
2018 Class C Common Stock Issuance
On June 29, 2015, the Company closed on its offering of 28,198,000September 27, 2018, Clearway Energy, Inc. issued and sold 3,916,449 shares of Class C common stock which included 3,678,000 sharesfor net proceeds of Class C common stock purchased by the underwriters through the exercise of an over-allotment option. Net proceeds to the Company from the sale of the Class C common stock were $599 million, net of underwriting discounts and commissions of $21$75 million. The Company utilized the proceeds of the offering to acquire 28,198,000 additional3,916,449 Class C units of NRG YieldClearway Energy LLC.
At-the-Market Equity Offering Program, or the ATM ProgramPrograms
NRG Yield,On August 6, 2020, Clearway Energy, Inc. is party toentered into an equity distribution agreement with Credit Suisse Securities (USA) LLC, Goldman Sachs & Co. LLC, Morgan Stanley & Co. LLC and UBS Securities LLC, as sales agents. Pursuant to the terms of the equity distribution agreement, Clearway Energy, Inc. may offer and sell shares of its Class C common stock from time to time through the sales agents up to an aggregate sales price of $150 million through an at-the-market equity offering program, or the 2020 ATM Program.
On August 9, 2016, Clearway Energy, Inc. entered into an equity distribution agreement, or EDA, with Barclays Capital Inc., Credit Suisse Securities (USA) LLC, J.P. Morgan Securities LLC and RBC Capital Markets, LLC, as sales agents. Pursuant to the terms of the equity distribution agreement NRG Yield,Clearway Energy, Inc. may offer, offered and sellsold shares of its Class C common stock par value $0.01 per share, from time to time through the sales agents up to an aggregate sales price of $150 million through an at-the-market equity offering program, or the 2016 ATM Program. NRG Yield, Inc. may also sell shares of its Class C common stock to any of the sales agents, as principals for its own account, at a price agreed upon at the time of sale.
As of December 31, 2017, Yield, Inc. issued 1,921,866June 30, 2020, the Company had completed the issuance of shares of Class C common stock totaling $150 million in gross proceeds under the 2016 ATM Program.
The following table summarizes Class C common stock shares sold under the ATM Program for gross proceeds of $35 million andPrograms during the year end December 31, 2020 :
| | | | | | | | | | | |
| Number of shares
sold | | Gross Proceeds from the sale of shares(a) (in millions) |
| 2020 ATM Program | 940,790 | | | $ | 24 | |
| 2016 ATM Program | 1,749,665 | | | 39 | |
| Total Class C common stock sold during the year ended December 31, 2020 | 2,690,455 | | | $ | 63 | |
(a) The Company incurred commission fees of $346 thousand. At$0.6 million during the year ended December 31, 2017,2020.
As of December 31, 2020, approximately $115$126 million of Class C common stock remains available for issuance under the 2020 ATM Program.
As a resultThe Company utilized the proceeds of the Company's sale of shares of Class C common stocksales under the ATM Program, the public shareholders of Class A andPrograms to acquire 2,690,455 Class C common stock increased their economicunits of Clearway Energy LLC and, voting interests in NRG Yield, Inc. to 53.7%, and 44.9%, respectively,as a result, as of December 31, 2017.2020 the Company owned 57.61% of the economic interests of Clearway Energy LLC, with CEG retaining 42.39% of the economic interests of Clearway Energy LLC.
Dividends to Class A and Class C common stockholders
The following table lists the dividends paid on the Company's Class A and Class C common stock during the year ended December 31, 2017:2020:
| | | | Fourth Quarter 2017 | | Third Quarter 2017 | | Second Quarter 2017 | | First Quarter 2017 | | Fourth Quarter 2020 | | Third Quarter 2020 | | Second Quarter 2020 | | First Quarter 2020 |
| Dividends per Class A share | $ | 0.288 |
| | $ | 0.28 |
| | $ | 0.27 |
| | $ | 0.26 |
| Dividends per Class A share | $ | 0.3180 | | | $ | 0.3125 | | | $ | 0.2100 | | | $ | 0.2100 | |
| Dividends per Class C share | $ | 0.288 |
| | $ | 0.28 |
| | $ | 0.27 |
| | $ | 0.26 |
| Dividends per Class C share | $ | 0.3180 | | | $ | 0.3125 | | | $ | 0.2100 | | | $ | 0.2100 | |
Dividends on the Class A and Class C common stock are subject to available capital, market conditions, and compliance with associated laws, regulations and other contractual obligations. The Company expects that, based on current circumstances, comparable cash dividends will continue to be paid in the foreseeable future.
On February 15, 2018,12, 2021, the Company declared a quarterly dividend on its Class A and Class C common stock of $0.298$0.324 per share payable on March 15, 2018,2021, to stockholders of record as of March 1, 2018.2021.
The Company also authorized 10,000,000 shares of preferred stock, par value $0.01$0.01 per share. None of the shares of preferred stock have been issued.
Distributions/Contributions to/from NRG
Distributions to CEG
The following table lists the distributions paid to NRGCEG during the year ended December 31, 2017:2020 on Clearway Energy LLC's Class B and D units:
| | | | | | | | | | | | | | | | | | | | | | | |
| Fourth Quarter 2020 | | Third Quarter 2020 | | Second Quarter 2020 | | First Quarter 2020 |
| Distributions per Class B unit | $ | 0.3180 | | | $ | 0.3125 | | | $ | 0.2100 | | | $ | 0.2100 | |
| Distributions per Class D unit | $ | 0.3180 | | | $ | 0.3125 | | | $ | 0.2100 | | | $ | 0.2100 | |
|
| | | | | | | | | | | | | | | |
| | Fourth Quarter 2017 | | Third Quarter 2017 | | Second Quarter 2017 | | First Quarter 2017 |
| Distributions per Class B unit | $ | 0.288 |
| | $ | 0.28 |
| | $ | 0.27 |
| | $ | 0.26 |
|
| Distributions per Class D unit | $ | 0.288 |
| | $ | 0.28 |
| | $ | 0.27 |
| | $ | 0.26 |
|
The portion of the distributions paid by NRG YieldClearway Energy LLC to NRGCEG is recorded as a reduction to the Company's noncontrolling interest balance. The portion of the distributions paid by NRG YieldClearway Energy LLC to the Company was utilized to fund the dividends to the Class A and Class C common stockholders described above.
On February 15, 2018, NRG Yield12, 2021, Clearway Energy LLC declared a quarterly distribution on its Class B and Class D common stockunits of $0.298$0.324 per unit payable to NRGCEG on March 15, 2018.2021.
During 2017, 2016, and 2015, the Company acquired the Drop Down Assets from NRG, as described in Note 3, Business Acquisitions. The difference between the cash paid and historical value of the acquired Drop Down Assets was recorded as a distribution to/contribution from NRG with the offset to noncontrolling interest. As the projects were owned by NRG prior to the Drop Down Assets acquisitions, the pre-acquisition income (loss) of such projects are recorded as attributable to NRG's noncontrolling interest. Prior to the date of acquisition, certain of the projects made distributions to NRG and NRG made contributions into certain projects. These amounts are reflected within the Company’s statement of stockholders’ equity as changes in the noncontrolling interest balance.
Note 13 — Segment Reporting
The Company’s segment structure reflects how management currently operates and allocates resources. The Company's businesses are segregated based on conventional power generation, renewable businesses which consist of solar and wind, and the thermal and chilled water business. The Corporate segment reflects the Company's corporate costs.costs and includes eliminating entries. The Company's chief operating decision maker, its Chief Executive Officer, evaluates the performance of its segments based on operational measures including adjusted earnings before interest, taxes, depreciation and amortization, or Adjusted EBITDA, and CAFD, as well as economic gross marginEconomic Gross Margin and net income (loss).
The Company generated more than 10% of its revenues from the following customers for the years ended December 31, 2017, 20162020, 2019 and 2015:2018:
| | | | | | | | | | | | | | | | | | | | | | | | | | | | | | | | | | | |
| 2020 | | 2019 | | 2018 |
| Customer | Conventional | | Renewables | | Conventional | | Renewables | | Conventional | | Renewables |
| SCE | 18% | | 16% | | 21% | | 19% | | 20% | | 20% |
| PG&E | 10% | | 8% | | 12% | | 10% | | 12% | | 11% |
|
| | | | | | | | | | | |
| | 2017 | | 2016 | | 2015 |
| Customer | Conventional (%) | | Renewables (%) | | Conventional (%) | | Renewables (%) | | Conventional (%) | | Renewables (%) |
| SCE | 21% | | 20% | | 21% | | 21% | | 22% | | 17% |
| PG&E | 12% | | 11% | | 12% | | 11% | | 12% | | 12% |
| | | | | | | | | | | | | | | | | | | | | | | | | | | | | |
| Year ended December 31, 2020 |
| (In millions) | Conventional Generation | | Renewables | | Thermal | | Corporate (a) | | Total |
| Operating revenues | $ | 437 | | | $ | 569 | | | $ | 193 | | | $ | 0 | | | $ | 1,199 | |
| Cost of operations | 90 | | | 147 | | | 131 | | | (2) | | | 366 | |
| Depreciation, amortization and accretion | 132 | | | 264 | | | 32 | | | 0 | | | 428 | |
| Impairment losses | 0 | | | 24 | | | 0 | | | 0 | | | 24 | |
| General and administrative | 0 | | | 0 | | | 3 | | | 31 | | | 34 | |
| Transaction and integration costs | 0 | | | 0 | | | 0 | | | 9 | | | 9 | |
| Development costs | 0 | | | 0 | | | 5 | | | 0 | | | 5 | |
| Operating income (loss) | 215 | | | 134 | | | 22 | | | (38) | | | 333 | |
| Equity in earnings (losses) of unconsolidated affiliates | 8 | | | (1) | | | 0 | | | 0 | | | 7 | |
| Impairment loss on investment | 0 | | | (8) | | | 0 | | | 0 | | | (8) | |
| Gain on sale of unconsolidated affiliates | 0 | | | 0 | | | 0 | | | 49 | | | 49 | |
| Other income, net | 1 | | | 3 | | | 0 | | | 0 | | | 4 | |
| Loss on debt extinguishment | 0 | | | (21) | | | 0 | | | (3) | | | (24) | |
| Interest expense, net | (84) | | | (216) | | | (19) | | | (96) | | | (415) | |
| Income (loss) before income taxes | 140 | | | (109) | | | 3 | | | (88) | | | (54) | |
| Income tax benefit | 0 | | | 0 | | | 0 | | | 8 | | | 8 | |
| Net Income (Loss) | 140 | | | (109) | | | 3 | | | (96) | | | (62) | |
| | | | | | | | | |
| Net Income (Loss) Attributable to Clearway Energy, Inc. | $ | 140 | | | $ | 3 | | | $ | 3 | | | $ | (121) | | | $ | 25 | |
| Balance Sheet | | | | | | | | | |
| Equity investment in affiliates | $ | 90 | | | $ | 651 | | | $ | 0 | | | $ | 0 | | | $ | 741 | |
Capital expenditures (b) | 12 | | | 44 | | | 50 | | | 0 | | | 106 | |
| Total Assets | $ | 2,575 | | | $ | 7,157 | | | $ | 627 | | | $ | 233 | | | $ | 10,592 | |
|
| | | | | | | | | | | | | | | | | | | |
| Year ended December 31, 2017 |
| (In millions) | Conventional Generation |
| Renewables |
| Thermal |
| Corporate |
| Total |
| Operating revenues | $ | 336 |
|
| $ | 501 |
|
| $ | 172 |
|
| $ | — |
|
| $ | 1,009 |
|
| Cost of operations | 77 |
| | 133 |
| | 116 |
|
| — |
|
| 326 |
|
| Depreciation and amortization | 103 |
|
| 210 |
|
| 21 |
|
| — |
|
| 334 |
|
| Impairment losses | — |
| | 44 |
| | — |
| | — |
| | 44 |
|
| General and administrative | — |
|
| — |
|
| — |
|
| 19 |
|
| 19 |
|
| Acquisition-related transaction and integration costs | — |
| | — |
| | — |
| | 3 |
| | 3 |
|
| Operating income (loss) | 156 |
| | 114 |
| | 35 |
| | (22 | ) | | 283 |
|
| Equity in earnings of unconsolidated affiliates | 12 |
|
| 59 |
|
| — |
|
| — |
|
| 71 |
|
| Other income, net | 1 |
| | 2 |
| | — |
| | 1 |
| | 4 |
|
| Loss on debt extinguishment | — |
| | (3 | ) | | — |
| | — |
| | (3 | ) |
| Interest expense | (49 | ) |
| (163 | ) |
| (10 | ) |
| (84 | ) |
| (306 | ) |
| Income (loss) before income taxes | 120 |
|
| 9 |
|
| 25 |
|
| (105 | ) |
| 49 |
|
| Income tax expense | — |
|
| — |
|
| — |
|
| 72 |
|
| 72 |
|
| Net Income (Loss) | $ | 120 |
|
| $ | 9 |
|
| $ | 25 |
|
| $ | (177 | ) |
| $ | (23 | ) |
| Balance Sheet |
|
|
|
|
|
|
|
|
|
|
|
|
|
|
| Equity investment in affiliates | $ | 102 |
|
| $ | 1,076 |
|
| $ | — |
|
| $ | — |
|
| $ | 1,178 |
|
Capital expenditures (a) | 15 |
|
| 4 |
|
| 16 |
|
| — |
|
| 35 |
|
| Total Assets | $ | 1,897 |
|
| $ | 5,811 |
|
| $ | 422 |
|
| $ | 153 |
|
| $ | 8,283 |
|
(a) Includes accruals.eliminations
(b) Includes accruals
| | | | | | | | | | | | | | | | | | | | | | | | | | | | | |
| Year ended December 31, 2019 |
| (In millions) | Conventional Generation | | Renewables | | Thermal | | Corporate | | Total |
| Operating revenues | $ | 346 | | | $ | 485 | | | $ | 201 | | | $ | 0 | | | $ | 1,032 | |
| Cost of operations | 60 | | | 143 | | | 134 | | | 0 | | | 337 | |
| Depreciation, amortization and accretion | 103 | | | 271 | | | 27 | | | 0 | | | 401 | |
| Impairment losses | 0 | | | 14 | | | 19 | | | 0 | | | 33 | |
| General and administrative | 0 | | | 1 | | | 3 | | | 25 | | | 29 | |
| Transaction and integration costs | 0 | | | 0 | | | 0 | | | 3 | | | 3 | |
| Development costs | 0 | | | 0 | | | 5 | | | 0 | | | 5 | |
| Operating income (loss) | 183 | | | 56 | | | 13 | | | (28) | | | 224 | |
| Equity in earnings of unconsolidated affiliates | 9 | | | 74 | | | 0 | | | 0 | | | 83 | |
| Other income, net | 2 | | | 6 | | | 0 | | | 1 | | | 9 | |
| Loss on debt extinguishment | 0 | | | (1) | | | 0 | | | (15) | | | (16) | |
| Interest expense, net | (59) | | | (239) | | | (18) | | | (88) | | | (404) | |
| Income (loss) before income taxes | 135 | | | (104) | | | (5) | | | (130) | | | (104) | |
| Income tax benefit | 0 | | | 0 | | | 0 | | | (8) | | | (8) | |
| Net Income (Loss) | 135 | | | (104) | | | (5) | | | (122) | | | (96) | |
| | | | | | | | | |
| Net Income (Loss) Attributable to Clearway Energy, Inc. | $ | 135 | | | $ | (33) | | | $ | (5) | | | $ | (108) | | | $ | (11) | |
| Balance Sheet | | | | | | | | | |
| Equity investments in affiliates | $ | 94 | | | $ | 1,089 | | | $ | 0 | | | $ | 0 | | | $ | 1,183 | |
Capital expenditures (a) | 4 | | | 185 | | | 34 | | | 0 | | | 223 | |
| Total Assets | $ | 2,753 | | | $ | 6,186 | | | $ | 633 | | | $ | 128 | | | $ | 9,700 | |
|
| | | | | | | | | | | | | | | | | | | |
| | Year ended December 31, 2016 |
| (In millions) | Conventional Generation | | Renewables | | Thermal | | Corporate | | Total |
| Operating revenues | $ | 333 |
| | $ | 532 |
| | $ | 170 |
| | $ | — |
| | $ | 1,035 |
|
| Cost of operations | 66 |
| | 128 |
| | 114 |
| | — |
| | 308 |
|
| Depreciation and amortization | 80 |
| | 203 |
| | 20 |
| | — |
| | 303 |
|
| Impairment losses | — |
| | 185 |
| | — |
| | — |
| | 185 |
|
| General and administrative | — |
| | — |
| | — |
| | 16 |
| | 16 |
|
| Acquisition-related transaction and integration costs | — |
| | — |
| | — |
| | 1 |
| | 1 |
|
| Operating income (loss) | 187 |
| | 16 |
| | 36 |
| | (17 | ) | | 222 |
|
| Equity in earnings of unconsolidated affiliates | 13 |
| | 47 |
| | — |
| | — |
| | 60 |
|
| Other income, net | 1 |
| | 2 |
| | — |
| | — |
| | 3 |
|
| Interest expense | (48 | ) | | (151 | ) | | (7 | ) | | (78 | ) | | (284 | ) |
| Income (loss) before income taxes | 153 |
| | (86 | ) | | 29 |
| | (95 | ) | | 1 |
|
| Income tax benefit | — |
| | — |
| | — |
| | (1 | ) | | (1 | ) |
| Net Income (Loss) | $ | 153 |
| | $ | (86 | ) | | $ | 29 |
| | $ | (94 | ) | | $ | 2 |
|
| Balance Sheet | | | | | | | | | |
| Equity investments in affiliates | $ | 106 |
| | $ | 1,046 |
| | $ | — |
| | $ | — |
| | $ | 1,152 |
|
Capital expenditures (a) | 7 |
| | 2 |
| | 14 |
| | — |
| | 23 |
|
| Total Assets | $ | 1,993 |
| | $ | 6,114 |
| | $ | 426 |
| | $ | 429 |
| | $ | 8,962 |
|
(a) Includes accruals.
| | | | | | | | | | | | | | | | | | | | | | | | | | | | | |
| Year ended December 31, 2018 |
| (In millions) | Conventional Generation | | Renewables | | Thermal | | Corporate | | Total |
| Operating revenues | $ | 337 | | | $ | 523 | | | $ | 193 | | | $ | 0 | | | $ | 1,053 | |
| Cost of operations | 61 | | | 139 | | | 127 | | | 0 | | | 327 | |
| Depreciation, amortization and accretion | 102 | | | 211 | | | 23 | | | 0 | | | 336 | |
| | | | | | | | | |
| General and administrative | 0 | | | 0 | | | 1 | | | 19 | | | 20 | |
| Transaction and integration costs | 0 | | | 0 | | | 0 | | | 20 | | | 20 | |
| Development costs | 0 | | | 0 | | | 2 | | | 1 | | | 3 | |
| Operating income (loss) | 174 | | | 173 | | | 40 | | | (40) | | | 347 | |
| Equity in earnings of unconsolidated affiliates | 11 | | | 63 | | | 0 | | | 0 | | | 74 | |
| Other income, net | 1 | | | 4 | | | 1 | | | 2 | | | 8 | |
| Loss on debt extinguishment | 0 | | | 0 | | | 0 | | | (7) | | | (7) | |
| Interest expense, net | (51) | | | (154) | | | (12) | | | (89) | | | (306) | |
| Income (loss) before income taxes | 135 | | | 86 | | | 29 | | | (134) | | | 116 | |
| Income tax expense | 0 | | | 0 | | | 0 | | | 62 | | | 62 | |
| Net Income (Loss) | 135 | | | 86 | | | 29 | | | (196) | | | 54 | |
| | | | | | | | | |
| Net Income (Loss) Attributable to Clearway Energy, Inc. | $ | 135 | | | $ | 186 | | | $ | 29 | | | $ | (302) | | | $ | 48 | |
|
| | | | | | | | | | | | | | | | | | | |
| | Year ended December 31, 2015 |
| (In millions) | Conventional Generation | | Renewables | | Thermal | | Corporate | | Total |
| Operating revenues | $ | 336 |
| | $ | 458 |
| | $ | 174 |
| | $ | — |
| | $ | 968 |
|
| Cost of operations | 59 |
| | 138 |
| | 126 |
| | — |
| | 323 |
|
| Depreciation and amortization | 81 |
| | 203 |
| | 19 |
| | — |
| | 303 |
|
| Impairment losses | — |
| | 1 |
| | — |
| | — |
| | 1 |
|
| General and administrative | — |
| | — |
| | — |
| | 12 |
| | 12 |
|
| Acquisition-related transaction and integration costs | — |
| | — |
| | — |
| | 3 |
| | 3 |
|
| Operating income (loss) | 196 |
| | 116 |
| | 29 |
| | (15 | ) | | 326 |
|
| Equity in earnings of unconsolidated affiliates | 14 |
| | 17 |
| | — |
| | — |
| | 31 |
|
| Other income, net | 1 |
| | 2 |
| | — |
| | — |
| | 3 |
|
| Loss on debt extinguishment | (7 | ) | | (2 | ) | | — |
| | — |
| | (9 | ) |
| Interest expense | (48 | ) | | (151 | ) | | (7 | ) | | (61 | ) | | (267 | ) |
| Income (loss) before income taxes | 156 |
| | (18 | ) | | 22 |
| | (76 | ) | | 84 |
|
| Income tax expense | — |
| | — |
| | — |
| | 12 |
| | 12 |
|
| Net Income (Loss) | $ | 156 |
| | $ | (18 | ) | | $ | 22 |
| | $ | (88 | ) | | $ | 72 |
|
Note 14 — Income Taxes
Effective Tax Rate
The income tax provision consisted of the following amounts:
| | | | | | | | | | | | | | | | | |
| | Year Ended December 31, |
| | 2020 | | 2019 | | 2018 |
| | (In millions) |
| | | | | |
| | | | | |
| | | | | |
| | | | | |
| Deferred | | | | | |
| U.S. Federal | $ | 7 | | | $ | (4) | | | $ | 28 | |
| State | 1 | | | (4) | | | 34 | |
| Total — deferred | 8 | | | (8) | | | 62 | |
| Total income tax expense (benefit) | $ | 8 | | | $ | (8) | | | $ | 62 | |
| | | | | |
|
| | | | | | | | | | | |
| | Year Ended December 31, |
| | 2017 | | 2016 | | 2015 |
| | (In millions, except percentages) |
| Current | | | | | |
| U.S. Federal | $ | — |
| | $ | — |
| | $ | — |
|
| State | — |
| | — |
| | — |
|
| Total — current | — |
| | — |
| | — |
|
| Deferred | | | | | |
| U.S. Federal | 75 |
| | (1 | ) | | 10 |
|
| State | (3 | ) | | — |
| | 2 |
|
| Total — deferred | 72 |
| | (1 | ) | | 12 |
|
| Total income tax expense (benefit) | $ | 72 |
| | $ | (1 | ) | | $ | 12 |
|
A reconciliation of the U.S. federal statutory rate of 35%21% to the Company's effective rate is as follows:
| | | | | | | | | | | | | | | | | |
| | Year Ended December 31, |
| | 2020 | | 2019 | | 2018 |
| | (In millions, except percentages) |
| Income Before Income Taxes | $ | (54) | | | $ | (104) | | | $ | 116 | |
| Tax at 21% | (11) | | | (22) | | | 24 | |
| State taxes, net of federal benefit | (4) | | | (7) | | | 8 | |
| Deferred state rate change due to deconsolidation from NRG | 0 | | | 0 | | | 20 | |
| | | | | |
| Impact of non-taxable equity earnings | 24 | | | 24 | | | 8 | |
| Investment tax credits | 0 | | | (1) | | | (3) | |
| Production tax credits, including prior year true-up | (1) | | | (1) | | | (1) | |
| Valuation allowance adjustment | 0 | | | 0 | | | 3 | |
| Rate Change | 2 | | | 0 | | | 0 | |
| Other | (2) | | | (1) | | | 3 | |
| Income tax expense (benefit) | $ | 8 | | | $ | (8) | | | $ | 62 | |
| Effective income tax rate | (14.8) | % | | 7.7 | % | | 53.4 | % |
|
| | | | | | | | | | | |
| | Year Ended December 31, |
| | 2017 | | 2016 | | 2015 |
| | (In millions, except percentages) |
| Income Before Income Taxes | $ | 49 |
| | $ | 1 |
| | $ | 84 |
|
| Tax at 35% | 17 |
| | — |
| | 29 |
|
| State taxes, net of federal benefit | (3 | ) | | — |
| | 2 |
|
| Tax Cuts and Jobs Act - tax rate change | 68 |
| | — |
| | — |
|
| Investment tax credits | (1 | ) | | (1 | ) | | (1 | ) |
| Impact of non-taxable partnership earnings | (9 | ) | | (1 | ) | | (17 | ) |
| Production tax credits, including prior year true-up | (1 | ) | | 4 |
| | (4 | ) |
| Other | 1 |
| | (3 | ) | | 3 |
|
| Income tax expense (benefit) | $ | 72 |
| | $ | (1 | ) | | $ | 12 |
|
| Effective income tax rate | 147 | % | | (100 | )% | | 14 | % |
For the year ended December 31, 2017,2020, the overall effective tax rate was different than the statutory rate of 35%21% primarily due to tax expense recorded from the revaluationtaxable earnings and losses allocated to partners’ interest in Clearway Energy LLC, which includes the effects of the existing net deferred tax asset pursuant to the reduction in the corporate income tax rate to 21% in accordance with the Tax Cuts and Jobs Act. In December 2017, the SEC staff issued Staff Accounting Bulletin No. 118, which addresses how a company may recognize provisional amountsapplying HLBV method of accounting for the effectbook purposes of the changes related to the Tax Act. Consistent with that guidance, the Company recognized provisional amounts based upon our interpretation of the tax laws and estimates which require significant judgments.certain partnerships.
For the yearsyear ended December 31, 2016 and 2015,2019, the overall effective tax rate was different than the statutory rate of 35%21% primarily due to the taxable earnings and losses allocated to NRG resulting from itspartners’ interest in NRG YieldClearway Energy LLC, and production and investmentwhich includes the effects of applying HLBV method of accounting for book purposes of certain partnerships.
For the year ended December 31, 2018, the overall effective tax credits generated from certain wind and solar assets, respectively.
The Company currently owns 53.7%rate was different than the statutory rate of NRG Yield LLC and consolidates the results21% primarily due to its controlling interest. The Company records NRG's 46.3% ownershiphigher state income tax rate following the Company’s separation from NRG, as noncontrollingwell as taxable earnings and losses allocated to partners’ interest in Clearway Energy LLC, which includes the financial statements. effects of applying HLBV method of accounting for book purposes of certain partnerships. In 2018, the Company completed the accounting for all of the income tax effects related to the Tax Cuts and Jobs Act, which resulted in no material adjustments in 2018 to the provisional amounts recorded in 2017.
For tax purposes, NRG YieldClearway Energy LLC is treated as a partnership; therefore, the Company and NRGCEG each record their respective share of taxable income or loss.
The temporary differences, which gave rise to the Company's deferred tax assets, consisted of the following:
| | | | | | | | | | | |
| | As of December 31, |
| | 2020 | | 2019 |
| | (In millions) |
| Deferred tax liabilities: | | | |
| Investment in projects | $ | 226 | | | $ | 227 | |
| Total deferred tax liabilities | 226 | | | 227 | |
| Deferred tax assets: | | | |
| | | |
| | | |
| Interest expense disallowance carryforward - Investment in Projects | 11 | | | 50 | |
| Production tax credits | 9 | | | 9 | |
| Investment tax credits | 5 | | | 5 | |
| U.S. Federal net operating loss carryforwards | 260 | | | 215 | |
| Capital loss carryforwards | 12 | | | 12 | |
| State net operating loss carryforwards | 48 | | | 43 | |
| Total deferred tax assets | 345 | | | 334 | |
| Valuation allowance | (15) | | | (15) | |
| Total deferred tax assets, net of valuation allowance | 330 | | | 319 | |
| Net deferred noncurrent tax asset | $ | 104 | | | $ | 92 | |
|
| | | | | | | |
| | As of December 31, |
| | 2017 | | 2016 |
| | (In millions) |
| Deferred tax liabilities: | | | |
| Investment in projects | $ | 70 |
| | $ | 19 |
|
| Total deferred tax liabilities | 70 |
| | 19 |
|
| Deferred tax assets: | | | |
| Production tax credits carryforwards | 7 |
| | 5 |
|
| Investment tax credits | 1 |
| | 1 |
|
| U.S. Federal net operating loss carryforwards | 183 |
| | 226 |
|
| Capital loss carryforwards | 10 |
| | 16 |
|
| State net operating loss carryforwards | 7 |
| | 3 |
|
| Total deferred tax assets | 208 |
| | 251 |
|
| Valuation allowance | $ | (10 | ) | | $ | (16 | ) |
| Total deferred tax assets, net of valuation allowance | $ | 198 |
| | $ | 235 |
|
| Net deferred noncurrent tax asset | $ | 128 |
| | $ | 216 |
|
The primary driver for the decreaseincrease in the net deferred tax asset from $216$92 million to $128$104 million is the revaluation of the ending balance utilizing a 21% corporate income tax rate pursuant to the Tax Cuts and Jobs Act as of December 22, 2017.31, 2020, is the increase in federal and state NOLs, partially offset by utilization of the interest disallowance carryforward. As discussed in Note 2, Summary of Significant Accounting Policies, NRG allocated $22 million to the Company in tax-effected state NOLs, which was recorded as a non-cash adjustments to the consolidated statements of stockholders’ equity for the year ended December 31, 2019.
Tax Receivable and Payable
As of December 31, 2017,2020, the Company has no current or long term tax receivable or payable to be recorded.
Deferred Tax Assets and Valuation Allowance
Net deferred tax balance — As of December 31, 20172020 and 2016, NRG2019, the Company recorded a net deferred tax asset of $138$104 million and $232$92 million, respectively. The Company believes it is more likely than not that the results of future operations will generate sufficient taxable income which includes the future reversal of existing taxable temporary differences to realize deferred tax assets. The Company considered the profit before tax generated in recent years, as well as projections of future earnings and estimates of taxable income in arriving at this conclusion. The Company believes that $10$15 million, a deferred tax asset, expected to generate a capital loss, for which there are no existing capital gains or available tax planning strategies to utilize the asset in the future may not be realized, resulting in the recording of a valuation allowance.
NOL carryforwards — AtAs of December 31, 2017,2020, the Company had domestic NOLs carryforwards for federal income tax purposes of $183$260 million and cumulative state NOLs of $7$48 million tax-effected.
Interest disallowance carryforward — As of December 31, 2020, the Company has a deferred tax asset of $11 million related to disallowed interest expense under the proposed IRC §163(j) regulation.
The disallowed interest deduction has an indefinite carry forward period and any limitations on the utilization of this carryforward have been factored into the valuation allowance analysis.
Uncertain Tax Positions
The Company had no0 identified uncertain tax positions that require evaluation as of December 31, 2017.2020.
Note 15 — Related Party Transactions
In addition to the transactions and relationships described elsewhere in the notes to the consolidated financial statements, certain subsidiaries of NRGCEG provide services to the Company's project entities. Amounts due to NRGCEG subsidiaries are recorded as accounts payable — affiliate- affiliates and amounts due to the Company from NRGCEG subsidiaries are recorded as accounts receivable — affiliate- affiliates in the Company's balance sheet. The disclosures below summarize the Company's material related party transactions with NRGCEG and its subsidiaries that are included in the Company's operating revenues and operating costs.
Power Hedge Contracts byAs discussed in Note 1, Nature of Business, on August 31, 2018, NRG sold 100% of its interest in CEG to GIP, and between Renewable Entitiesas a result, CEG and NRG Texas Power LLC
Certain NRG Wind TE Holdco entities, whichits subsidiaries are subsidiaries in the Renewables segment, entered into power hedge contracts with NRG Texas Power LLC, a subsidiary of NRG, and generated $16 million of revenueconsidered related parties during the year ended December 31, 2015. Effective October 2015, Elbow Creek entered into a PPA2020 and December 31, 2019, and NRG and its subsidiaries were considered related parties during the first eight months of the year ended December 31, 2018.
Related Party Transactions with NRG Power MarketingCEG entities
O&M Services Agreements by and between the Company and Clearway Renewable Operation & Maintenance LLC
Various wholly-owned subsidiaries of the Company in the Renewables segment are party to administrative services agreements with Clearway Renewable Operation & Maintenance LLC, or NRG Power Marketing,RENOM, a wholly-owned subsidiary of NRG,CEG, which provides operation and maintenance, or O&M, services to these subsidiaries. The Company incurred total expenses for these services of $37 million and $31 million for the year ended December 31, 2020 and 2019, respectively. The Company incurred total expenses of $11 million for the period from September 1, 2018 to December 31, 2018. There was a balance of $10 million and $7 million due to RENOM as further described below, of December 31, 2020 and 2019, respectively.
Administrative Services Agreements by and between the Company and CEG
Various wholly-owned subsidiaries of the Company are parties to administrative services agreements with Clearway Asset Services and Clearway Solar Asset Management, two wholly-owned subsidiaries of CEG, which provide various administrative services to the Company's subsidiaries. The Company incurred expenses under these agreements of $10 million and $7 million for the year ended December 31, 2020 and 2019, respectively. The Company incurred expenses under these agreements of $3 million for the period from September 1, 2018 to December 31, 2018. There was a balance of $2 million and $1 million due to CEG as of December 31, 2020 and 2019, respectively.
CEG Master Services Agreements
The Company is a party to Master Services Agreements with CEG, or MSAs, pursuant to which CEG and certain of its affiliates or third party service providers provide certain services to the Company, including operational and administrative services, which include human resources, information systems, external affairs, accounting, procurement and risk management services,and the hedge agreementCompany provides certain services to CEG, including accounting, internal audit, tax and treasury services, in exchange for the payment of fees in respect of such services. The Company incurred net expenses of $2 million and $1 million under these agreements for the year ended December 31, 2020 and 2019, respectively.
Related Party Transactions with NRG entities prior to the GIP Transaction
The following transactions relate to the period prior to sale of NRG's interest in CEG to GIP on August 31, 2018 and therefore were considered to be related party transactions for all the periods prior to August 31, 2018:
O&M Services Agreements by and between Elbow Creekthe Company and NRG Texas PowerRenew Operation & Maintenance LLC was terminated.
Various wholly-owned subsidiaries of the Company in the Renewables segment were party to administrative services agreements with NRG Renew Operation & Maintenance LLC, or RENOM, formerly wholly-owned subsidiary of NRG, which provided O&M, services to these subsidiaries. The Company incurred total expenses for these services of $29 million for the eight months ended August 31, 2018.
Administrative Services Agreements by and between the Company and NRG
Various wholly-owned subsidiaries of the Company were parties to administrative services agreements with Clearway Asset Services (formerly NRG Asset Services) and Clearway Solar Asset Management (formerly NRG Solar Asset Management), two wholly-owned subsidiaries of CEG, which provided various administrative asset services to the Company's subsidiaries prior to GIP Transaction. The Company reimbursed costs under this agreement of $6 million for the eight months ended August 31, 2018.
Power Purchase Agreements (PPAs) between the Company and NRG Power Marketing
Elbow Creek and Dover arewere parties to PPAs with NRG Power Marketing and generate revenue under the PPAs, which arewere recorded to operating revenues in the Company's consolidated statements of operations. For the yearseight months ended DecemberAugust 31, 20172018, Elbow Creek and 2016, Elbow CreekDover, collectively, generated revenues of $8 million each year, and Dover generated revenues of $4 million and $5 million, respectively.million.
Energy Marketing Services Agreement by and between Thermal entities and NRG Power Marketing
NRG Energy Center Dover LLC, NRG Energy Center Minneapolis, NRG Energy Center Phoenix LLC and NRG Energy Center Paxton LLC, or Thermal entities, arewere parties to Energy Marketing Services Agreements with NRG Power Marketing, a wholly-owned subsidiary of NRG. Under the agreements, NRG Power Marketing procuresprocured fuel and fuel transportation for the operation of Thermal entities. TheFor the eight months ended August 31, 2018, the Thermal entities purchased a total of $9$7 million of natural gas during each of the years ended December 31, 2017 and 2016. During the year ended December 31, 2015 total purchases of natural gas under the agreement were $13 million.from NRG Power Marketing.
Operation and Maintenance (O&M) Services Agreements by and between the Company's subsidiaries and NRG
Certain of the Company's subsidiaries are party to O&M Services Agreements with NRG, pursuant to which NRG subsidiaries provide necessary and appropriate services to operate and maintain the subsidiaries' plant operations, businesses and thermal facilities. NRG is reimbursed for the provided services, as well as for all reasonable and related expenses and expenditures, and payments to third parties for services and materials rendered to or on behalf of the parties to the agreements. NRG is not entitled to any management fee or mark-up under the agreements. The fees incurred under this agreementthese agreements were $39$27 million for the yeareight months ended DecemberAugust 31, 2017, and $36 million for each year ended December 31, 2016 and 2015.2018.
The Company had $13 million due to NRG for the services performed during the year ended December 31, 2017 under the O&M Agreements, $5 million of which was paid off as of March 1, 2018. The Company had $22 million due to NRG for the services performed during the year ended December 31, 2016 under the O&M Agreements.
O&MServices Agreements by and between GenConn and NRG
GenConn incurs fees under two O&M agreements with wholly-owned subsidiaries of NRG. TheFor the eight months ended August 31, 2018, the aggregate fees incurred under the agreements were $5 million each year for the years ended December 31, 2017 and 2016, and $4 million for the year ended December 31, 2015.million.
Administrative Services Agreement by and between Marsh Landing and NRG West Coast LLC
On December 19, 2016, Marsh Landing entered intois a party to an administrative services agreement with NRG West Coast LLC, a wholly owned subsidiary of NRG. The administrative services agreement was previously between Marsh Landing and GenOn Energy Services, LLC, a wholly-owned subsidiary of NRG and was subsequently assigned to and assumed by NRG West Coast LLC. The Company reimbursed costs under this agreement of approximately $15 million, $14 million and $13$11 million for the yearseight months ended DecemberAugust 31, 2017, 20162018.
Project Administrative Services Agreement by and 2015, respectively. There was a balance of $1 million due tobetween ESEC and NRG West Coast LLC
During 2018, ESEC, NRG West Coast LLC in accounts payable — affiliate as of December 31, 2017 and 2016.
Administrative Services Agreements by and between the Company and NRG Renew Operation & Maintenance LLC
Various wholly-owned subsidiaries of the Company in the Renewables segment are party to administrative services agreements with NRG Renew Operation & MaintenancePower Marketing LLC, or RENOM, a wholly-owned subsidiaryPML, entered into confirmation agreements under the Project Administration Services Agreement between ESEC and NRG West Coast LLC, whereby PML purchased California Carbon Allowances which ESEC could subsequently purchase for the purposes of NRG, which provides O&M services toESEC’s compliance with the California Cap-and-Trade Program. ESEC reimbursed costs under these subsidiaries. The Company incurred total expenses for these services in the amountagreements of $23 million, $13 million and $7$11 million for the yearseight months ended DecemberAugust 31, 2017, 2016 and 2015, respectively. There was a balance of $5 million due to RENOM as of December 31, 2017 and 2016.
2018.
Management Services Agreement by and between the Company and NRG
Prior to the GIP Transaction, NRG providesprovided the Company with various operational, management, and administrative services, which include human resources, accounting, tax, legal, information systems, treasury and risk management, as set forth in the Management Services Agreement. As of December 31, 2017, the base management fee was approximately $8.5 million per year, subject to an inflation-based adjustment annually, at an inflation factor based on the year-over-year U.S. consumer price index. The fee is also subject to adjustments following the consummation of future acquisitions and as a result of a change in the scope of services providedcosts incurred under the Management Services Agreement. During the year ended December 31, 2017, the fee was increased by approximately $1 million per year, primarily due to the acquisition of the March 2017, August 2017 and November 2017 Drop Down Assets, as further described in Note 3, Business Acquisitions. In addition to the base management fee, the Company is also responsible for anyAgreement included certain direct expenses that are directly incurred and paid for by NRG on behalf of the Company.Company in addition to the base management fee. Costs incurred under this agreement were approximately $10 million for each of the years ended December 31, 2017 and 2016, and $8$7 million for the yeareight months ended DecemberAugust 31, 2015. There was2018.
On August 31, 2018, in connection with the consummation of the GIP Transaction, the Clearway Energy, Inc. entered into a balance of $4 million in accounts payable — affiliate due toTermination Agreement with Clearway Energy LLC, Clearway Energy Operating LLC and NRG terminating the Management Services Agreement, dated as of December 31, 2017, whichJuly 22, 2013, by and among the Company, paid offClearway Energy LLC, Clearway Energy Operating LLC and NRG. Concurrently with entering into the Termination Agreement on August 31, 2018, the Company entered into a Transition Services Agreement with NRG, or the NRG TSA, as further described below.
Subsequent to the GIP Transaction, the Company entered into the NRG TSA, pursuant to which NRG or certain of its affiliates began providing transitional services to the Company following the consummation of the GIP Transaction, in January 2018.exchange for the payment of a fee in respect of such services. Expenses related to the NRG TSA are recorded in acquisition-related transaction and integration costs in the consolidated statements of operations.
EPC Agreement by and between NECPECP and NRG
On October 31, 2016, NRG Business Services LLC, a subsidiary of NRG, and NECP,Energy Center Pittsburgh LLC, or ECP, a wholly owned subsidiary of the Company, entered into an EPC agreement for the construction of a 73 MWt district energy system for NECPECP to provide 150 kpphpph of steam, 6,750 tons of chilled water and 7.5 MW of emergency backup power service to UPMC Mercy. The initial term of the energy services agreement with UPMC Mercy will be for a period of twenty years from the service commencement date. Pursuant toOn June 19, 2018, as discussed in Note 3, Acquisitions and Dispositions, ECP purchased the terms of the EPC agreement, NECP agreed to payUPMC Thermal Project assets from NRG Business Services LLC $79for cash consideration of $84 million, subject to adjustment basedworking capital adjustments. The Company paid an additional $3 million to NRG upon certain conditions in the EPC agreement, upon substantialfinal completion of the project. The project is expected to reach COD in the first half of 2018. As of December 31, 2017, the parties made a number of amendmentsJanuary 2019 pursuant to the EPC Agreement, based on customer change orders, to increase the capacity of the district energy system from 73 MWt to 80 MWt, which also increased the payment from $79 million to $88 million.agreement.
Note 16 — Commitments and Contingencies
Operating Lease Commitments
The Company leases certain facilities and equipment under operating leases, some of which include escalation clauses, expiring on various dates through 2048. The effects of these scheduled rent increases, leasehold incentives, and rent concessions are recognized on a straight-line basis over the lease term unless another systematic and rational allocation basis is more representative of the time pattern in which the leased property is physically employed. Lease expense under operating leases was $17 million, $15 million, and $10 million for the years ended December 31, 2017, 2016 and 2015, respectively.
The Company's future minimum lease commitments under operating leases are $9 million for each of the years ending December 31, 2018 through 2022, and $151 million thereafter.
Gas and Transportation Commitments
The Company has entered into contractual arrangements to procure power, fuel and associated transportation services. For the years ended December 31, 2017, 20162020, 2019 and 2015,2018, the Company purchased $34 million, $32 million, $38 million, and $40$39 million, respectively, under such arrangements. As further described in Note 15, Related Party Transactions, these purchases include intercompany transactions through August 31, 2018 between certain Thermal entities and NRG Power Marketing under the Energy Marketing Services Agreements in the amount of $9 million for each of the years ended December 31, 2017 and 2016. Total intercompany purchases of natural gas under the agreement were $13$7 million for the yeareight months ended DecemberAugust 31, 2015.
As of December 31, 2017,2020, the Company's commitments under such outstanding agreements are estimated as follows:
| | | Period | (In millions) | Period | (In millions) |
| 2018 | $ | 11 |
| |
| 2019 | 5 |
| |
| 2020 | 3 |
| |
| 2021 | 3 |
| 2021 | $ | 9 | |
| 2022 | 3 |
| 2022 | 3 | |
| 2023 | | 2023 | 2 | |
| 2024 | | 2024 | 0 | |
| 2025 | | 2025 | 0 | |
| Thereafter | 16 |
| Thereafter | 0 | |
| Total | $ | 41 |
| Total | $ | 14 | |
Contingencies
The Company's material legal proceedings are described below. The Company believes that it has valid defenses to these legal proceedings and intends to defend them vigorously. The Company records reserves for estimated losses from contingencies when information available indicates that a loss is probable and the amount of the loss, or range of loss, can be reasonably estimated. As applicable, the Company has established an adequate reserve for the matters discussed below. In addition, legal costs are expensed as incurred. Management assesses such matters based on current information and makes a judgment concerning its potential outcome, considering the nature of the claim, the amount and nature of damages sought and the probability of success. The Company is unable to predict the outcome of the legal proceedings below or reasonably estimate the scope or amount of any associated costs and potential liabilities. As additional information becomes available, management adjusts its assessment and estimates of such contingencies accordingly. Because litigation is subject to inherent uncertainties and unfavorable rulings or developments, it is possible that the ultimate resolution of the Company's liabilities and contingencies could be at amounts that are different from its currently recorded reserves and that such difference could be material.
In addition to the legal proceedings noted below, the Company and its subsidiaries are party to other litigation or legal proceedings arising in the ordinary course of business. In management's opinion, the disposition of these ordinary course matters will not materially adversely affect the Company's consolidated financial position, results of operations, or cash flows.
Braun v. NRG Yield, Inc. — Nebraska Public Power District Litigation
On January 11, 2019, Nebraska Public Power District, or NPPD, sent written notice to certain of the Company’s subsidiaries which own the Laredo Ridge and Elkhorn Ridge wind projects alleging an event of default under each of the PPAs between NPPD and the projects. NPPD alleges that the Company moved forward with certain transactions without obtaining the consent of NPPD. NPPD threatened to terminate the applicable PPAs by February 11, 2019 if the alleged default was not cured. The Company filed a motion for a temporary restraining order and preliminary injunction in the U.S. District Court for the District of Nebraska relating to the Laredo Ridge project, and a similar motion in the District Court of Knox County, Nebraska for the Elkhorn Ridge project, to enjoin NPPD from taking any actions related to the PPAs. On February 19, 2019, the U.S. District Court in the Laredo Ridge matter approved a stipulation between the parties to provide for an injunction preventing NPPD from terminating the PPA pending disposition of the litigation. On February 26, 2019, the Knox County District Court approved a similar stipulation relating to the Elkhorn Ridge project. On April 19, 2016, plaintiffs13, 2020, the U.S. District Court granted the wind projects' motion for summary judgment and permanently enjoined NPPD from terminating the PPAs in reliance on the alleged events of default. The U.S. District Court decision was appealed by NPPD on May 11, 2020 and the case in the Knox County District Court remains pending, but has been stayed pending the outcome of the U.S. District Court case. Argument before the U.S. Court of Appeals for the Eight Circuit is scheduled for March 18, 2021. The Company believes the allegations of NPPD are meritless and the Company is vigorously defending its rights under the PPAs.
Buckthorn Solar Litigation
On October 8, 2019, the City of Georgetown, Texas, or Georgetown, filed a putative class action lawsuit against NRG Yield, Inc.,petition in the currentDistrict Court of Williamson County, Texas naming Buckthorn Westex, LLC, the Company’s subsidiary that owns the Buckthorn Westex solar project, as the defendant, alleging fraud by nondisclosure and former membersbreach of its board of directors individually,contract in connection with the project and other parties in California Superior Court in Kern County, CA. Plaintiffs allege various violationsthe PPA, and seeking (i) rescission and/or cancellation of the Securities ActPPA, (ii) declaratory judgment that the alleged breaches constitute an event of default under the PPA entitling Georgetown to terminate, and (iii) recovery of all damages, costs of court, and attorneys’ fees. On November 15, 2019, Buckthorn Westex filed an original answer and counterclaims (i) denying Georgetown’s claims, (ii) alleging Georgetown has breached its contracts with Buckthorn Westex by failing to pay amounts due, and (iii) seeking relief in the form of (x) declaratory judgment that Georgetown’s alleged failure to pay amounts due constitute breaches of and an event of default under the PPA and that Buckthorn did not commit any events of default under the PPA, (y) recovery of costs, expenses, interest, and attorneys’ fees, and (z) such other relief to which it is entitled at law or in equity. Buckthorn Westex believes the allegations of Georgetown are meritless, and Buckthorn Westex is vigorously defending its rights under the PPA.
Note 17— Leases
Accounting for Leases
The Company evaluates each arrangement at inception to determine if it contains a lease. Substantially all of the Company’s leases are operating leases.
Lessee
The Company records its operating lease liabilities at the present value of the lease payments over the lease term at lease commencement date. Lease payments include fixed payment amounts, as well as variable rate payments based on an index initially measured at lease commencement date. Variable payments, including payments based on future performance and based on index changes, are recorded as the expense is incurred. The Company determines the relevant lease term by evaluating whether renewal and termination options are reasonably certain to be exercised. The Company uses its incremental borrowing rate to calculate the present value of the lease payments, based on information available at the lease commencement date.
The Company’s leases consist of land leases for numerous operating asset locations, real estate leases and equipment leases. The terms and conditions for these leases vary by the type of underlying asset.
Lease expense for the year ended December 31, 2020 and December 31, 2019 was comprised of the following:
| | | | | | | | | | | | | | |
| (In millions) | | December 31, 2020 | | December 31, 2019 |
| Operating lease cost - Fixed | | $ | 19 | | | $ | 13 | |
| | | | |
| Operating lease cost - Variable | | 9 | | | 8 | |
| Total lease cost | | $ | 28 | | | $ | 21 | |
Operating lease information as of December 31, 2020 and 2019 was as follows:
| | | | | | | | | | | | | | |
| (In millions, except term and rate) | | December 31, 2020 | | December 31, 2019 |
ROU Assets - operating leases, net (a) | | $ | 337 | | | $ | 223 | |
| | | | |
Short-term lease liability - operating leases (b) | | $ | 8 | | | $ | 7 | |
Long-term lease liability - operating leases (a) | | 345 | | | 227 | |
| Total lease liability | | $ | 353 | | | $ | 234 | |
| | | | |
| Weighted average remaining lease term (in years) | | 25 | | 25 |
| Weighted average discount rate | | 4.3 | % | | 4.4 | % |
| | | | |
| Cash paid for operating leases | | $ | 19 | | | $ | 15 | |
(a) Increase in ROU Assets and lease liabilities is primarily due to the defendants’ alleged failure to disclose material facts related to low wind production prior to NRG Yield, Inc.'s June 22, 2015 Class C common stock offering. Plaintiffs seek compensatory damages, rescission, attorney’s feesacquisition of Drop Down Assets, as further described in Note 3, Acquisitions and costs. The defendants filed objections and a motion challenging jurisdiction on October 18, 2016. On December 1, 2017,Dispositions
(b) Short-term lease liability balances are included within the parties agreed to a stipulation which provides the plaintiffs' opposition is due on March 6, 2018 and the defendants' reply is due on May 4, 2018.
Ahmed v. NRG Energy, Inc. and the NRG Yield Board of Directors — On September 15, 2016, plaintiffs filed a putative class action lawsuit against NRG Energy, Inc., the directors of NRG Yield, Inc.,accrued expenses and other parties in the Delaware Chancery Court. The complaint alleges that the defendants breached their respective fiduciary duties with regard to the recapitalization of NRG Yield, Inc. common stock in 2015. The plaintiffs generally seek economic damages, attorney’s fees and injunctive relief. The defendants filed a motion to dismiss the lawsuit on December 21, 2016. Plaintiffs filed their objection to the motion to dismiss on February 15, 2017. The defendants' reply was filed on March 24, 2017. The court heard oral argument on the defendants' motion to dismiss on June 20, 2017. On September 7, 2017, the court requested additional briefing which the parties provided on September 21, 2017. On December 11, 2017, the court dismissed the lawsuit with prejudice, thereby ending the case.
GenOn Noteholders' Lawsuit — On December 13, 2016, certain indenture trustees for an ad hoc group of holders, or the Noteholders,current liabilities line item of the GenOn Energy, Inc., or GenOn, 7.875% Senior Notes due 2017, 9.500% Notes due 2018, and 9.875% Notes dueconsolidated balance sheets as of December 31, 2020 and December 31, 2019
Maturities of operating lease liabilities as of December 31, 2020 are as follows:
| | | | | | | | |
| (In millions) | | |
| 2021 | | $ | 23 | |
| 2022 | | 23 | |
| 2023 | | 23 | |
| 2024 | | 23 | |
| 2025 | | 23 | |
| Thereafter | | 476 | |
| Total lease payments | | 591 | |
| Less imputed interest | | (238) | |
| Total lease liability - operating leases | | $ | 353 | |
Oahu Solar Lease Agreements
The Oahu Solar projects are party to various land lease agreements with a wholly owned subsidiary of CEG. The projects are leasing the GenOn Americas Generation, LLC 8.50% Senior Notes due 2021land for a period of 35 years, with the ability to renew the lease for 2 additional five year periods. The Company has a lease liability of $20 million and 9.125% Senior Notes due 2031, along with certain$21 million as of the Noteholders, filed a complaint in the Superior CourtDecember 31, 2020 and 2019 and corresponding right-of-use asset of the State of Delaware against NRG$18 million and GenOn alleging certain claims$19 million related to the Services Agreement between NRGleases as of December 31, 2020 and GenOn. On April 30, 2017, the Noteholders filed an amended complaint that asserts additional claims of fraudulent transfer, insider preference and breach of fiduciary duties. In addition to NRG and GenOn, the amended complaint names NRG Yield LLC and certain current and former officers and directors of GenOn as defendants. The plaintiffs, among other things, generally seek return of all monies paid under the Services Agreement and any other damages that the court deems appropriate. On April 28, 2017, the bondholders filed an amended complaint adding the GenOn directors and officers as defendants and asserting claims that they breached certain fiduciary duties. Plaintiffs specifically allege that the transfer of Marsh Landing to NRG Yield LLC constituted a fraudulent transfer. On June 12, 2017, certain GenOn entities, NRG and certain holders of the GenOn and GenOn Americas Generation, LLC senior notes entered into a restructuring support2019.
Rosamond Lease Agreement
The Rosamond Central project is party to a land lease agreement with a wholly owned subsidiary of CEG. The project is leasing the land for a period of 35 years, with the ability to renew the lease for 2 additional five year periods. The Company has a lease liability of $12 million as of December 31, 2020 and lock-up agreement. corresponding right-of-use asset of $11 million related to the lease as of December 31, 2020.
Lessor
The majority of the Company’s revenue is obtained through PPAs or other contractual agreements that are accounted for as leases. These leases are comprised of both fixed payments and variable payments contingent upon volumes or performance metrics. The terms of the leases are further described in Item 2 — Properties of this Form 10-K. Many of the leases have renewal options at the end of the lease term. Termination may be allowed under specific circumstances in the lease arrangements, such as under an event of default. All but one of the Company’s leases are operating leases. The remaining lease met the criteria of a sales-type lease and the impact of this sales-type lease to the consolidated financial statements was immaterial. Certain of these leases have both lease and non-lease components, and the Company allocates the transaction price to the components based on standalone selling prices.
The following amounts of energy and capacity revenue are related to the Company’s operating leases.
| | | | | | | | | | | | | | | | | | | | | | | | | | |
| | | | | | | | |
| | Conventional Generation | | Renewables | | Thermal | | Total |
| December 31, 2020 | | (In millions) |
| Energy revenue | | $ | 10 | | | $ | 554 | | | $ | 2 | | | $ | 566 | |
| Capacity revenue | | 451 | | | 0 | | | 0 | | | 451 | |
| Operating revenue | | $ | 461 | | | $ | 554 | | | $ | 2 | | | $ | 1,017 | |
| | | | | | | | | | | | | | | | | | | | | | | | | | |
| | | | | | | | |
| | Conventional Generation | | Renewables | | Thermal | | Total |
| December 31, 2019 | | (In millions) |
| Energy revenue | | $ | 5 | | | $ | 509 | | | $ | 2 | | | $ | 516 | |
| Capacity revenue | | 348 | | | 0 | | | 0 | | | 348 | |
| Operating revenue | | $ | 353 | | | $ | 509 | | | $ | 2 | | | $ | 864 | |
Minimum future rent payments for the remaining periods related to the Conventional segment operating leases were as follows as of December 31, 2020:
| | | | | |
| (In millions) | |
| 2021 | $ | 444 | |
| 2022 | 450 | |
| 2023 | 259 | |
| 2024 | 106 | |
| 2025 | 107 | |
| Thereafter | 1,498 | |
| Total lease payments | $ | 2,864 | |
Property, plant and equipment, net related to the Company’s operating leases were as follows:
| | | | | | | | | | | |
| (In millions) | December 31, 2020 | | December 31, 2019 |
| Property, plant and equipment | $ | 7,201 | | | $ | 6,942 | |
| Accumulated depreciation | (1,964) | | | (1,649) | |
| Net property, plant and equipment | $ | 5,237 | | | $ | 5,293 | |
Energy Center Caguas Sales-Type Lease Agreement
On December 14, 2017, a settlement agreement wasNovember 1, 2018, the Company, through its indirect subsidiary Energy Center Caguas LLC, entered into between GenOn and NRGan Energy Services Agreement (ESA) for its Viatris (formerly Mylan) facility in Puerto Rico. The ESA was determined to be a sales-type lease, as the present value of the lease payments is greater than substantially all of the fair value of the facility. As a result, upon the service commencement date of the contract, the Company recorded a lease receivable of approximately $12 million which should ultimately resolve this lawsuit.represents the net present value of the lease investment. The Company is permitted to receive approximately $1 million per year in fixed payments under the ESA, which expires in September 2032 based upon a service commencement date in September 2020, with options to extend the term for 2 additional five year periods upon mutual agreement of the parties.
Minimum future rent payments for the remaining periods related to the Thermal segment sales-type lease were as follows as of December 31, 2020: | | | | | |
| (In millions) | |
| 2021 | $ | 1 | |
| 2022 | 1 | |
| 2023 | 1 | |
| 2024 | 1 | |
| 2025 | 1 | |
| Thereafter | 9 | |
| Total sales-type lease payments | $ | 14 | |
Note 1718 — Unaudited Quarterly Data
Refer to Note 2, Summary of Significant Accounting Policies, and Note 3, Business Acquisitions, for a description of the effect of unusual or infrequently occurring events during the quarterly periods. Below is summarized unaudited quarterly financial data which includesfor the results of the November 2017 Drop Down Assets Acquisitionperiods ending December 31, 2020 and its impact on every quarter of the 2017 and 2016 results, which were recast to include the November 2017 Drop Down Assets, where applicable:2019.
| | | | | | | | | | | | | | | | | | | | | | | |
| | Quarter Ended |
| | December 31, | | September 30, | | June 30, | | March 31, |
| | 2020 |
| (In millions, except per share data) |
| Operating Revenues | $ | 280 | | | $ | 332 | | | $ | 329 | | | $ | 258 | |
| | | | | | | |
| | | | | | | |
| | | | | | | |
| | | | | | | |
| Operating Income | 28 | | | 123 | | | 130 | | | 52 | |
| | | | | | | |
| | | | | | | |
| | | | | | | |
| | | | | | | |
| Net (Loss) Income | (73) | | | 42 | | | 76 | | | (107) | |
| | | | | | | |
| | | | | | | |
| | | | | | | |
| | | | | | | |
| Net (Loss) Income Attributable to Clearway Energy, Inc. | $ | (25) | | | $ | 32 | | | $ | 47 | | | $ | (29) | |
| Weighted average number of Class A common shares outstanding — basic and diluted | 35 | | | 35 | | | 35 | | | 35 | |
| | | | | | | |
| Weighted average number of Class C common shares outstanding — basic and diluted | 81 | | | 81 | | | 80 | | | 79 | |
| | | | | | | |
| (Loss) Earnings per Weighted Average Common Share Basic and Diluted | $ | (0.20) | | | $ | 0.27 | | | $ | 0.41 | | | $ | (0.26) | |
| | | | | | | |
| | | | | | | |
| | | | | | | |
| | | | | | | |
| | | | | | | |
| | | | | | | | | | | | | | | | | | | | | | | |
| | Quarter Ended |
| December 31, | | September 30, | | June 30, | | March 31, |
| | 2019 |
| (In millions, except per share data) |
| Operating Revenues | $ | 235 | | | $ | 296 | | | $ | 284 | | | $ | 217 | |
| | | | | | | |
| | | | | | | |
| | | | | | | |
| | | | | | | |
| Operating Income | 6 | | | 90 | | | 87 | | | 41 | |
| | | | | | | |
| | | | | | | |
| | | | | | | |
| | | | | | | |
| Net (Loss) Income | (48) | | | 35 | | | (36) | | | (47) | |
| | | | | | | |
| | | | | | | |
| | | | | | | |
| | | | | | | |
| Net (Loss) Income Attributable to Clearway Energy, Inc. | $ | (6) | | | $ | 39 | | | $ | (24) | | | $ | (20) | |
| Weighted average number of Class A common shares outstanding — basic | 35 | | | 35 | | | 35 | | | 35 | |
| Weighted average number of Class A common shares outstanding — diluted | 35 | | | 35 | | | 35 | | | 35 | |
| Weighted average number of Class C common shares outstanding — basic | 75 | | | 73 | | | 73 | | | 73 | |
| Weighted average number of Class C common shares outstanding — diluted | 75 | | | 75 | | | 73 | | | 73 | |
| (Loss) Earnings per Weighted Average Common Share Basic and Diluted | $ | (0.06) | | | $ | 0.36 | | | $ | (0.22) | | | $ | (0.18) | |
| | | | | | | |
| | | | | | | |
|
| | | | | | | | | | | | | | | |
| | Quarter Ended |
| | December 31, | | September 30, | | June 30, | | March 31, |
| | 2017 |
| | (In millions, except per share data) |
| Operating Revenues | $ | 231 |
| | $ | 269 |
| | $ | 288 |
| | $ | 221 |
|
| | | | | | | | |
| Operating Revenues (as previously reported) | N/A |
| | 265 |
| | 284 |
| | 218 |
|
| Change | N/A |
| | 4 |
| | 4 |
| | 3 |
|
| | | | | | | | |
| Operating Income | 19 |
| | 85 |
| | 124 |
| | 55 |
|
| | | | | | | | |
| Operating Income (as previously reported) | N/A |
| | 95 |
| | 122 |
| | 54 |
|
| Change | N/A |
| | (10 | ) | | 2 |
| | 1 |
|
| | | | | | | | |
| Net (Loss) Income | (98 | ) | | 30 |
| | 47 |
| | (2 | ) |
| | | | | | | | |
| Net Income (Loss) (as previously reported) | N/A |
| | 41 |
| | 45 |
| | (1 | ) |
| Change | N/A |
| | (11 | ) | | 2 |
| | (1 | ) |
| | | | | | | | |
| Net (Loss) Income Attributable to NRG Yield, Inc. | $ | (70 | ) | | $ | 29 |
| | $ | 28 |
| | $ | (3 | ) |
| Weighted average number of Class A common shares outstanding — basic | 35 |
| | 35 |
| | 35 |
| | 35 |
|
| Weighted average number of Class A common shares outstanding — diluted | 35 |
| | 49 |
| | 49 |
| | 35 |
|
| Weighted average number of Class C common shares outstanding — basic | 65 |
| | 64 |
| | 63 |
| | 63 |
|
| Weighted average number of Class C common shares outstanding — diluted | 65 |
| | 75 |
| | 74 |
| | 63 |
|
| (Loss) Earnings per Weighted Average Class A and Class C Common Share - Basic | (0.71 | ) | | 0.30 |
| | 0.29 |
| | (0.03 | ) |
| (Loss) Earnings per Weighted Average Class A Common Share - Diluted | (0.71 | ) | | 0.27 |
| | 0.26 |
| | (0.03 | ) |
| (Loss) Earnings per Weighted Average Class C Common Share - Diluted | $ | (0.71 | ) | | $ | 0.29 |
| | $ | 0.28 |
| | $ | (0.03 | ) |
|
| | | | | | | | | | | | | | | |
| | Quarter Ended |
| | December 31, | | September 30, | | June 30, | | March 31, |
| | 2016 |
| | (In millions, except per share data) |
| Operating Revenues | $ | 235 |
| | $ | 276 |
| | $ | 287 |
| | $ | 237 |
|
| | | | | | | | |
| Operating Revenues (as previously reported) | 232 |
| | 272 |
| | 283 |
| | 234 |
|
| Change | 3 |
| | 4 |
| | 4 |
| | 3 |
|
| | | | | | | | |
| Operating (Loss) Income | (100 | ) | | 119 |
| | 130 |
| | 73 |
|
| | | | | | | | |
| Operating (Loss) Income (as previously reported) | (99 | ) | | 117 |
| | 128 |
| | 72 |
|
| Change | (1 | ) | | 2 |
| | 2 |
| | 1 |
|
| | | | | | | | |
| Net (Loss) Income | (115 | ) | | 51 |
| | 65 |
| | 1 |
|
| | | | | | | | |
| Net (Loss) Income (as previously reported) | (114 | ) | | 50 |
| | 64 |
| | 2 |
|
| (Change) | (1 | ) | | 1 |
| | 1 |
| | (1 | ) |
| | | | | | | | |
| Net (Loss) Income Attributable to NRG Yield, Inc. | $ | (13 | ) | | $ | 33 |
| | $ | 32 |
| | $ | 5 |
|
| Weighted average number of Class A common shares outstanding — basic | 35 |
| | 35 |
| | 35 |
| | 35 |
|
| Weighted average number of Class A common shares outstanding — diluted | 35 |
| | 49 |
| | 49 |
| | 35 |
|
| Weighted average number of Class C common shares outstanding — basic | 63 |
| | 63 |
| | 63 |
| | 63 |
|
| Weighted average number of Class C common shares outstanding — diluted | 63 |
| | 73 |
| | 73 |
| | 63 |
|
| (Loss) Earnings per Weighted Average Class A and Class C Common Share - Basic | (0.14 | ) | | 0.34 |
| | 0.33 |
| | 0.05 |
|
| (Loss) Earnings per Weighted Average Class A Common Share - Diluted | (0.14 | ) | | 0.30 |
| | 0.29 |
| | 0.05 |
|
| (Loss) Earnings per Weighted Average Class C Common Share - Diluted | $ | (0.14 | ) | | $ | 0.32 |
| | $ | 0.31 |
| | $ | 0.05 |
|
Schedule I
NRG Yield,Clearway Energy, Inc. (Parent)
Condensed Financial Information of Registrant
Condensed Statements of Operations
| | | | | | | | | | | | | | | | | |
| Year ended December 31, |
| (In millions) | 2020 | | 2019 | | 2018 |
| Total operating costs and expenses | $ | 2 | | | $ | 2 | | | $ | 1 | |
| Equity in (losses) earnings of consolidated subsidiaries | (52) | | | (101) | | | 135 | |
| Loss on debt extinguishment | 0 | | | 0 | | | (7) | |
| Interest expense | 0 | | | (1) | | | (11) | |
| Total other (expense) income, net | (52) | | | (102) | | | 117 | |
| (Loss) Income Before Income Taxes | (54) | | | (104) | | | 116 | |
| Income tax expense (benefit) | 8 | | | (8) | | | 62 | |
| Net (Loss) Income | (62) | | | (96) | | | 54 | |
| Less: Pre-acquisition net income of Drop Down Assets | 0 | | | 0 | | | 4 | |
| Less: Net (loss) income attributable to noncontrolling interests | (87) | | | (85) | | | 2 | |
| Net Income (Loss) Attributable to Clearway Energy, Inc. | $ | 25 | | | $ | (11) | | | $ | 48 | |
|
| | | | | | | | | | | |
| | Year ended December 31, |
| (In millions) | 2017 | | 2016 (a) | | 2015 (a) |
| | | | | | |
| Total operating expense | $ | 1 |
| | $ | 2 |
| | $ | 2 |
|
| Equity earnings in consolidated subsidiaries | 62 |
| | 15 |
| | 95 |
|
| Interest expense | (12 | ) | | (12 | ) | | (9 | ) |
| Total other income, net | 50 |
| | 3 |
| | 86 |
|
| Income Before Income Taxes | 49 |
| | 1 |
| | 84 |
|
| Income tax expense (benefit) | 72 |
| | (1 | ) | | 12 |
|
| Net (Loss) Income | (23 | ) | | 2 |
| | 72 |
|
| Less: Pre-acquisition net income (loss) of Drop Down Assets | 8 |
| | (4 | ) | | — |
|
| Less: Net (loss) income attributable to noncontrolling interests | (15 | ) | | (51 | ) | | 39 |
|
| Net (Loss) Income Attributable to NRG Yield, Inc. | $ | (16 | ) | | $ | 57 |
| | $ | 33 |
|
(a) Retrospectively adjusted as discussed in Note 1, Nature of Business.
See accompanying notes to condensed financial statements.
Schedule I
NRG Yield,Clearway Energy, Inc. (Parent)
Condensed Balance Sheets
| | | | | | | | | | | |
| December 31, | | December 31, |
| 2020 | | 2019 |
| ASSETS | (In millions) |
| | | |
| Current Assets | | | |
| Cash and cash equivalents | $ | 0 | | | $ | 3 | |
| Accounts receivable — affiliates | 3 | | | 2 | |
| Note receivable - Clearway Energy Operating LLC | 1 | | | 44 | |
| | | |
| Other Assets | | | |
| Investment in consolidated subsidiaries | 2,612 | | | 2,173 | |
| | | |
| | | |
| Deferred income taxes | 104 | | | 92 | |
| Total Assets | $ | 2,720 | | | $ | 2,314 | |
| LIABILITIES AND STOCKHOLDERS' EQUITY | | | |
| Current Liabilities | | | |
| Current portion of long-term debt | 0 | | | 44 | |
| | | |
| Other current liabilities | 0 | | | 1 | |
| Other Liabilities | | | |
| | | |
| Other non-current liabilities | 5 | | | 6 | |
| Total Liabilities | 5 | | | 51 | |
| | | |
| Stockholders' Equity | | | |
| Preferred stock, $0.01 par value; 10,000,000 shares authorized; NaN issued | 0 | | | 0 | |
| Class A, Class B, Class C and Class D common stock, $0.01 par value; 3,000,000,000 shares authorized (Class A 500,000,000, Class B 500,000,000, Class C 1,000,000,000, Class D 1,000,000,000); 201,635,990 shares issued and outstanding (Class A 34,599,645, Class B 42,738,750, Class C 81,558,845 Class D 42,738,750) at December 31, 2020 and 1,198,819,999 shares issued and outstanding (Class A 34,599,645, Class B 42,738,750, Class C 78,742,854, Class D 42,738,750) at December 31, 2019 | 1 | | | 1 | |
| Additional paid-in capital | 1,922 | | | 1,936 | |
| Accumulated deficit | (84) | | | (72) | |
| Accumulated other comprehensive loss | (14) | | | (15) | |
| Noncontrolling interest | 890 | | | 413 | |
| Total Stockholders' Equity | 2,715 | | | 2,263 | |
| Total Liabilities and Stockholders' Equity | $ | 2,720 | | | $ | 2,314 | |
|
| | | | | | | |
| | December 31, | | December 31, |
| | 2017 | | 2016 (a) |
| ASSETS | (In millions) |
| | | | |
| Current Assets | | | |
| Cash and cash equivalents | $ | 2 |
| | $ | 1 |
|
| Other Assets | | | |
| Investment in consolidated subsidiaries | 2,008 |
| | 2,364 |
|
| Note receivable - Yield Operating | 618 |
| | 618 |
|
| Deferred income taxes | 128 |
| | 216 |
|
| Total Assets | $ | 2,756 |
| | $ | 3,199 |
|
| LIABILITIES AND STOCKHOLDERS' EQUITY | | | |
| Liabilities | | | |
| Other current liabilities | 2 |
| | 2 |
|
| Long-term debt | 610 |
| | 598 |
|
| Other non-current liabilities | 6 |
| | — |
|
| Total Liabilities | 618 |
| | 600 |
|
| | | | |
| Stockholders' Equity | | | |
| Preferred stock, $0.01 par value; 10,000,000 shares authorized; none issued | — |
| | — |
|
| Class A, Class B, Class C and Class D common stock, $0.01 par value; 3,000,000,000 shares authorized (Class A 500,000,000, Class B 500,000,000, Class C 1,000,000,000, Class D 1,000,000,000); 184,780,837 shares issued and outstanding (Class A 34,586,250, Class B 42,738,750, Class C 64,717,087, Class D 42,738,750) at December 31, 2017 and 182,848,000 shares issued and outstanding (Class A 34,586,250, Class B 42,738,750, Class C 62,784,250, Class D 42,738,750) at December 31, 2016 | 1 |
| | 1 |
|
| Additional paid-in capital | 1,843 |
| | 1,879 |
|
| Accumulated deficit | (69 | ) | | (2 | ) |
| Accumulated other comprehensive loss | (28 | ) | | (28 | ) |
| Noncontrolling interest | 391 |
| | 749 |
|
| Total Stockholders' Equity | 2,138 |
| | 2,599 |
|
| Total Liabilities and Stockholders' Equity | $ | 2,756 |
| | $ | 3,199 |
|
(a) Retrospectively adjusted as discussed in Note 1, Nature of Business.
See accompanying notes to condensed financial statements.
Schedule I
NRG Yield,Clearway Energy, Inc. (Parent)
Condensed Statements of Cash Flows
| | | | | | | | | | Years ended December 31, |
| | Years ended December 31, | | 2020 | | 2019 | | 2018 |
| | 2017 | | 2016 | | 2015 | | (In millions) |
| | (In millions) | |
| Net Cash (Used in) Provided by Operating Activities | $ | — |
| | $ | (5 | ) | | $ | 2 |
| Net Cash (Used in) Provided by Operating Activities | $ | (3) | | | $ | (5) | | | $ | 3 | |
| Cash Flows from Investing Activities | | | | | | Cash Flows from Investing Activities | |
| Investments in consolidated affiliates | (33 | ) | | 5 |
| | (600 | ) | Investments in consolidated affiliates | (59) | | | (87) | | | (150) | |
| Increase in notes receivable - affiliate | — |
| | — |
| | (281 | ) | |
| Net Cash (Used in) Provided by Investing Activities | (33 | ) |
| 5 |
| | (881 | ) | |
| Cash advances for notes receivable - affiliate | | Cash advances for notes receivable - affiliate | (3) | | | 0 | | | 0 | |
| Cash received from notes receivable - affiliate | | Cash received from notes receivable - affiliate | 45 | | | 215 | | | 359 | |
| Net Cash Provided by (Used in) Investing Activities | | Net Cash Provided by (Used in) Investing Activities | (17) | | | 128 | | | 209 | |
| Cash Flows from Financing Activities | | | | | | Cash Flows from Financing Activities | |
| Proceeds from issuance of debt | — |
| | — |
| | 288 |
| |
| | Payments for long-term debt | | Payments for long-term debt | (45) | | | (220) | | | (367) | |
| Proceeds from the issuance of common stock | 34 |
| | — |
| | 599 |
| Proceeds from the issuance of common stock | 62 | | | 100 | | | 153 | |
| Payment of debt issuance costs | — |
| | — |
| | (7 | ) | |
| Cash received from Yield LLC for the payment of dividends | 108 |
| | 92 |
| | 69 |
| |
| | Cash received from Clearway Energy LLC for the payment of dividends | | Cash received from Clearway Energy LLC for the payment of dividends | 121 | | | 87 | | | 130 | |
| Payment of dividends | (108 | ) | | (92 | ) | | (69 | ) | Payment of dividends | (121) | | | (87) | | | (130) | |
| Net Cash Provided by Financing Activities | 34 |
| | — |
| | 880 |
| |
| Net Increase in Cash and Cash Equivalents | 1 |
| | — |
| | 1 |
| |
| Net Cash (Used in) Provided by Financing Activities | | Net Cash (Used in) Provided by Financing Activities | 17 | | | (120) | | | (214) | |
| Net (Decrease) Increase in Cash and Cash Equivalents | | Net (Decrease) Increase in Cash and Cash Equivalents | (3) | | | 3 | | | (2) | |
| Cash and Cash Equivalents at Beginning of Period | 1 |
| | 1 |
| | — |
| Cash and Cash Equivalents at Beginning of Period | 3 | | | 0 | | | 2 | |
| Cash and Cash Equivalents at End of Period | $ | 2 |
| | $ | 1 |
| | $ | 1 |
| Cash and Cash Equivalents at End of Period | $ | 0 | | | $ | 3 | | | $ | 0 | |
|
See accompanying notes to condensed financial statements.
Schedule I
NRG Yield,Clearway Energy, Inc. (Parent)
Notes to Condensed Financial Statements
Note 1 — Background and Basis of Presentation
Background
The Company was formed by NRG as a Delaware corporation on December 20, 2012 and closed its initial public offering on July 22, 2013. In connectionClearway Energy, Inc., together with its initial public offering, the Company's shares of Class A common stock began trading on the New York Stock Exchange under the symbol “NYLD.”
Effective May 14, 2015,consolidated subsidiaries, or the Company, completedis a stock splitpublicly-traded energy infrastructure investor in connection with which each outstanding shareand owner of Class A common stock was split into one sharemodern, sustainable and long-term contracted assets across North America. On August 31, 2018, NRG Energy, Inc., or NRG, transferred its full ownership interest in the Company to Clearway Energy Group LLC, or CEG, the holder of Class A common stockNRG's renewable energy development and one shareoperations platform, and subsequently sold 100% of Class C common stock, and each outstanding share of Class B common stock was split into one share of Class B common stock and one share of Class D common stock. The stock split isits interest in CEG to Global Infrastructure Partners III, or GIP, referred to hereinafter as the RecapitalizationNRG Transaction. As a result of the NRG Transaction, GIP indirectly acquired a 45.2% economic interest in Clearway Energy LLC and all references to share or per share amounts in the accompanying consolidated financial statements and applicable disclosures have been retrospectively adjusted to reflect the Recapitalization. Following the Recapitalization, the Company's Class A common stock continued trading on the New York Stock Exchange under the new ticker symbol "NYLD.A" and the Class C common stock began trading under the ticker symbol "NYLD".
NRG, through its holdings of Class B common stock and Class D common stock, has a 55.1%55% voting interest in the Company. GIP is an independent fund manager that invests in infrastructure assets in energy and transport sectors. The Company is sponsored by GIP through GIP's portfolio company, Clearway Energy Group.
The Company is one of the largest renewable energy owners in the U.S. with over 4,200 net MW of installed wind and receives distributionssolar generation projects. The Company also owns approximately 2,500 net MW of environmentally-sound, highly efficient generation facilities as well as a portfolio of district energy systems. Through this environmentally-sound, diversified and primarily contracted portfolio, the Company endeavors to provide its investors with stable and growing dividend income.Substantially all of the Company's generation assets are under long-term contractual arrangements for the output or capacity from NRG Yieldthese assets.
The Company consolidates the results of Clearway Energy LLC through its ownership of Class B units and Class D units.controlling interest, with CEG's interest shown as noncontrolling interest in the financial statements. The holders of the Company's issued and outstanding shares of Class A common stock and Class C common stock are entitled to dividends as declareddeclared. CEG receives its distributions from Clearway Energy LLC through its ownership of Clearway Energy LLC Class B and have 44.9% of the voting power in the Company.Class D units.
The Company is the sole managing member of NRG Yield LLC and operates and controls all of its business and affairs and consolidates the financial results of NRG Yield LLC and its subsidiaries. NRG Yield LLC is a holding company for the companies that directly and indirectly own and operate the Company's business. As of December 31, 2017, the Company and NRG have 53.7% and 46.3% economic interests in NRG Yield LLC, respectively. As a result of the current ownershipClass C common stock issuance under the ATM Programs during the twelve months ended December 31, 2020, the Company owns 57.61% of the Class B common stock and Class D common stock, NRG continues ateconomic interests of Clearway Energy LLC, with CEG retaining 42.39% of the present time to control the Company, and the Company in turn,economic interests of Clearway Energy LLC as the sole managing member of NRG Yield LLC, controls NRG Yield LLC and its subsidiaries.December 31, 2020.
Basis of Presentation
The condensed parent-only company financial statements have been prepared in accordance with Rule 12-04 of Regulation S-X, as the restricted net assets of NRG Yield,Clearway Energy, Inc.’s subsidiaries exceed 25% of the consolidated net assets of NRG Yield,Clearway Energy, Inc. The parent's 100% investment in its subsidiaries has been recorded using the equity basis of accounting in the accompanying condensed parent-only financial statements. These statements should be read in conjunction with the consolidated financial statements and notes thereto of NRG Yield,Clearway Energy, Inc.
During the years endingOn December 31, 2017 and 2016,6, 2019, the Company completed four acquisitionsacquired 100% of GIP's membership interests in CBAD Holdings, LLC, which indirectly owns Carlsbad Energy Center LLC, a 527 megawatt natural gas fired power project located in Carlsbad, California, or the Carlsbad Drop Down Assets from NRG.Asset. The accounting guidance requires retrospective combination ofassets transferred to the entities for all periods presented as if the combination has been in effect from the beginning of the financial statement period or from the date the entities wereCompany relate to interests under common control (if later thanby GIP and were recorded at book value in accordance with ASC 805-50, Business Combinations - Related Issues. The difference between the beginningpurchase price and book value of the assets was recorded as a distribution to CEG and decreased the balance of its noncontrolling interest. The acquisition was determined to be an asset acquisition and not a business combination, therefore no recast of the historical financial statement period).information was deemed necessary. For further discussion, see Note 3, Business Acquisitions and Dispositions to the Consolidated Financial Statements.
Note 2 — Long-Term Debt
For a discussion of NRG YieldClearway Energy, Inc.’s financing arrangements, see Note 10, Long-term Debt, to the Company's consolidated financial statements.
Note 3 — Commitments, Contingencies and Guarantees
See Note 14, Income Taxes, and Note 16, Commitments and Contingencies, to the Company's consolidated financial statements for a detailed discussion of NRG Yield,Clearway Energy, Inc.’s commitments and contingencies.
Note 4 — Dividends
Cash distributions paid to NRG Yield,Clearway Energy, Inc. by its subsidiary, NRG YieldClearway Energy LLC, were $108$121 million, $92$87 million, and $69$130 million for the years ended December 31, 2017, 2016,2020, 2019, and 2015,2018, respectively.
SCHEDULE II. VALUATION AND QUALIFYING ACCOUNTS
For the Years Ended December 31, 20172020, 2019, and 20162018
|
| | | | | | | | | | | | | | | |
| | Balance at Beginning of Period | | Charged to Costs and Expenses | | Charged to Other Accounts | | Balance at End of Period |
| | (In millions) |
| Income tax valuation allowance, deducted from deferred tax assets | | | | | | | |
| Year Ended December 31, 2017 | $ | 16 |
| | $ | (6 | ) | | $ | — |
| | $ | 10 |
|
| Year Ended December 31, 2016 | $ | — |
| | $ | — |
| | $ | 16 |
| | $ | 16 |
|
| | | | | | | | | | | | | | | | | | | | | | | | | |
| Balance at
Beginning of
Period | | Charged to
Costs and
Expenses | | Charged to
Other Accounts | | | | Balance at
End of Period |
| | (In millions) |
| Income tax valuation allowance, deducted from deferred tax assets | | | | | | | | | |
| Year Ended December 31, 2020 | $ | 15 | | | $ | 0 | | | $ | 0 | | | | | $ | 15 | |
| Year Ended December 31, 2019 | 15 | | | 0 | | | 0 | | | | | 15 | |
| Year Ended December 31, 2018 | 10 | | | 5 | | | 0 | | | | | 15 | |
EXHIBIT INDEX
|
| | | | | | | | | | | | | | | | |
| Number | | Description | | Method of Filing | |
2.12.1* | | | | Incorporated herein by reference to Exhibit 2.1 to the Company’s Current Report on Form 8-K filed on May 9, 2014. |
2.2 | | | | Incorporated herein by reference to Exhibit 2.2 to the Company’s Current Report on Form 8-K filed on May 9, 2014. |
2.3 | | | | Incorporated herein by reference to Exhibit 2.3 to the Company’s Current Report on Form 8-K filed on May 9, 2014. |
2.4 | | Purchase and Sale Agreement, dated June 3, 2014, by and among NRG Yield, Inc., NRG Yield Operating LLC, Terra-Gen Finance Company, LLC, NTD AWAM Holdings, LLC, CHIPS Alta Wind X Holding Company, LLC and CHIPS Alta Wind XI Holding Company, LLC. | | Incorporated herein by reference to Exhibit 10.1 to the Company’s Current Report on Form 8-K filed on June 9, 2014. |
2.5 | | | | Incorporated herein by reference to Exhibit 2.1 to the Company's Current Report on Form 8-K filed on November 7, 2014. |
2.6 | | | | Incorporated herein by reference to Exhibit 2.2 to the Company's Current Report on Form 8-K filed on November 7, 2014. |
2.7*^ | | | | Incorporated herein by reference to Exhibit 2.1 to the Company's Quarterly Report on Form 10-Q filed on August 4, 2015. |
2.8 | |
| | Incorporated herein by reference to Exhibit 2.1 to the Company's Current Report on Form 8-K filed on September 21, 2015.
|
2.9 | |
| | Incorporated herein by reference to Exhibit 2.1 to the Registrant's Current Report on Form 8-K, filed on August 9, 2016. |
2.10* | | | | Filed herewith.Incorporated herein by reference to Exhibit 2.10 to the Company's Annual Report on Form 10-K, filed on March 1, 2018. | |
3.12.2* | | | | Incorporated herein by reference to Exhibit 2.1 to the Company's Current Report on Form 8-K, filed on December 9, 2019. | |
| 2.3 | | | | Incorporated herein by reference to Exhibit 2.1 to the Company's Current Report on Form 8-K, filed on November 20, 2020. | |
| 3.1 | | | | Incorporated herein by reference to Exhibit 3.1 to the Company's QuarterlyCurrent Report on Form 10-Q filed on May 5, 2016.4, 2020. | |
| 3.2 | | | | Incorporated herein by reference to Exhibit 3.43.2 to the Company's AnnualCurrent Report on Form 10-K8-K filed on February 29, 2016.September 5, 2018. | |
| 4.1 | | | | Incorporated herein by reference to Exhibit 10.410.6 to the Company's Current Report on Form 8-K filed on May 15, 2015.September 5, 2018. | |
| 4.2 | | Indenture, dated February 11, 2014, among NRG Yield, Inc., NRG Yield Operating LLC and NRG Yield LLC, as Guarantors, and Wilmington Trust, National Association, as trustee, re: the Company’s 3.50% Convertible Senior Notes due 2019. | | Incorporated herein by reference to Exhibit 4.1 to the Company’s Current Report on Form 8-K filed on February 11, 2014. | |
| 4.3 | | | | Incorporated herein by reference to Exhibit 4.2 to the Company’s Current Report on Form 8-K filed on February 11, 2014. | |
| 4.4 | | | | Incorporated herein by reference to Exhibit 4.1 to the Company's Current Report on Form 8-K filed on August 5, 2014. | |
| 4.5 | | | | Incorporated herein by reference to Exhibit 4.2 to the Company's Current Report on Form 8-K filed on August 5, 2014. |
|
| | | | |
| 4.6 | | | | Incorporated herein by reference to Exhibit 4.3 to the Company's Current Report on Form 8-K filed on August 5, 2014. | |
| 4.7 | | | | Incorporated herein by reference to Exhibit 4.1 to the Company's Current Report on Form 8-K filed on November 13, 2014. | |
| 4.8 | | | | Incorporated herein by reference to Exhibit 4.1 to the Company's Current Report on Form 8-K filed on February 27, 2015. | |
| 4.9 | | | | Incorporated herein by reference to Exhibit 4.1 to the Company's Current Report on Form 8-K filed on April 16, 2015. | |
| 4.10 | | | | Incorporated herein by reference to Exhibit 4.1 to the Company's Current Report on Form 8-K filed on May 8, 2015. | |
| 4.11 | | | | Incorporated herein by reference to Exhibit 4.1 to the Company's Current Report on Form 8-K filed on June 29, 2015. | |
| 4.12 | |
| | Incorporated herein by reference to Exhibit 4.2 to the Company's Current Report on Form 8-K filed on June 29, 2015. | |
| 4.13 | | | | Incorporated herein by reference to Exhibit 4.14.13 to the Company's Registration StatementAnnual Report on Form 8-A/A10-K filed on May 8, 2015.February 28, 2019. | |
| | | | | | | | | | | | | | | | | |
| 4.14 | | | | Incorporated herein by reference to Exhibit 4.24.14 to the Company's Registration StatementAnnual Report on Form 8-A/A10-K filed on May 8, 2015.February 28, 2019. | |
| 4.15 | | | | Incorporated herein by reference to Exhibit 4.1 to the Registrant's Current Report on Form 8-K, filed on August 18, 2016. | |
| 4.16 | |
| | Incorporated herein by reference to Exhibit 4.2 to the Registrant's Current Report on Form 8-K, filed on August 18, 2016. | |
| 4.17 | | | | Incorporated herein by reference to Exhibit 4.3 to the Registrant's Current Report on Form 8-K, filed on August 18, 2016. | |
| 4.18 | |
| | Incorporated herein by reference to Exhibit 4.1 to NRG YieldClearway Energy LLC's Current Report on Form 8-K, filed on January 31, 2018.
| |
| 4.19 | |
| | Incorporated herein by reference to Exhibit 4.2 to NRG YieldClearway Energy LLC's Current Report on Form 8-K, filed on January 31, 2018. | |
10.14.20 | | | | Incorporated herein by reference to Exhibit 4.1 to the Company's Current Report on Form 8-K filed on June 12, 2018. | |
| 4.21 | | | | Incorporated herein by reference to Exhibit 4.2 to the Company's Current Report on Form 8-K filed on June 12, 2018. | |
| 4.22 | | | | Incorporated herein by reference to Exhibit 4.3 to the Company's Quarterly Report on Form 10-Q filed on August 2, 2018. | |
| 4.23 | | | | Incorporated herein by reference to Exhibit 4.4 to the Company's Quarterly Report on Form 10-Q filed on August 2, 2018. | |
| 4.24 | | | | Incorporated herein by reference to Exhibit 4.1 to the Company's Current Report on Form 8-K filed on September 6, 2018. | |
| 4.25 | | | | Incorporated herein by reference to Exhibit 4.2 to the Company's Current Report on Form 8-K filed on September 6, 2018. | |
| 4.26 | | | | Incorporated herein by reference to Exhibit 4.1 to the Company's Current Report on Form 8-K filed on October 2, 2018. | |
| 4.27 | |
| | Incorporated herein by reference to Exhibit 4.2 to the Company's Current Report on Form 8-K filed on October 2, 2018. | |
| 4.28 | | | | Incorporated herein by reference to Exhibit 4.3 to the Company's Current Report on Form 8-K filed on October 2, 2018. | |
| 4.29 | | | | Incorporated herein by reference to Exhibit 4.1 to the Company's Current Report on Form 8-K filed on October 31, 2018. | |
| 4.30 | | | | Incorporated herein by reference to Exhibit 4.2 to the Company's Current Report on Form 8-K filed on October 31, 2018.
| |
| 4.31 | | | | Incorporated herein by reference to Exhibit 4.3 to the Company's Current Report on Form 8-K filed on October 31, 2018.
| |
| | | | | | | | | | | | | | | | | |
| 4.32 | | | | Incorporated herein by reference to Exhibit 4.1 to the Company's Current Report on Form 8-K filed on December 12, 2018. | |
| 4.33 | | | | Incorporated herein by reference to Exhibit 4.2 to the Company's Current Report on Form 8-K filed on December 12, 2018. | |
| 4.34 | | | | Incorporated herein by reference to Exhibit 4.3 to the Company's Current Report on Form 8-K filed on December 12, 2018.
| |
| 4.35 | | | | Incorporated herein by reference to Exhibit 4.1 to the Company's Current Report on Form 8-K filed on September 12, 2019. | |
| 4.36 | | | | Incorporated herein by reference to Exhibit 4.2 to the Company's Current Report on Form 8-K filed on September 12, 2019. | |
| 4.37 | |
| | Incorporated herein by reference to Exhibit 4.3 to the Company's Current Report on Form 8-K filed on September 12, 2019.
| |
| 4.38 | | | | Incorporated herein by reference to Exhibit 4.1 to the Company's Current Report on Form 8-K filed on November 22, 2019. | |
| 4.39 | | | | Incorporated herein by reference to Exhibit 4.2 to the Company's Current Report on Form 8-K filed on November 22, 2019. | |
| 4.40 | |
| | Incorporated herein by reference to Exhibit 4.3 to the Company's Current Report on Form 8-K filed on November 22, 2019.
| |
| 4.41 | | | | Incorporated herein by reference to Exhibit 4.1 to the Company's Current Report on Form 8-K filed on December 12, 2019. | |
| 4.42 | | | | Incorporated herein by reference to Exhibit 4.2 to the Company's Current Report on Form 8-K filed on December 12, 2019.
| |
| 4.43 | | | | Filed herewith. | |
| 4.44 | | | | Incorporated herein by reference to Exhibit 4.1 to the Company’s Current Report on Form 8-K filed on January 8, 2020. | |
| 4.45 | | | | Incorporated herein by reference to Exhibit 4.2 to the Company’s Current Report on Form 8-K filed on January 8, 2020. | |
| 4.46 | | | | Incorporated herein by reference to Exhibit 4.3 to the Company’s Current Report on Form 8-K filed on January 8, 2020. | |
| | | | | | | | | | | | | | | | | |
| 4.47 | | | | Incorporated herein by reference to Exhibit 4.1 to the Company’s Current Report on Form 8-K filed on March 3, 2020. | |
| 4.48 | | | | Incorporated herein by reference to Exhibit 4.2 to the Company’s Current Report on Form 8-K filed on March 3, 2020. | |
| 4.49 | | | | Incorporated herein by reference to Exhibit 4.3 to the Company’s Current Report on Form 8-K filed on March 3, 2020. | |
| 4.50 | | | | Incorporated herein by reference to Exhibit 4.1 to the Company's Current Report on Form 8-K filed on July 21, 2020. | |
| 4.51 | | | | Incorporated herein by reference to Exhibit 4.2 to the Company's Current Report on Form 8-K filed on July 21, 2020. | |
| 4.52 | | | | Incorporated herein by reference to Exhibit 4.3 to the Company's Current Report on Form 8-K filed on July 21, 2020. | |
| 4.53 | | | | Incorporated herein by reference to Exhibit 4.1 to the Company's Current Report on Form 8-K filed on August 20, 2020. | |
| 4.54 | | | | Incorporated herein by reference to Exhibit 4.2 to the Company's Current Report on Form 8-K filed on August 20, 2020. | |
| 4.55 | | | | Incorporated herein by reference to Exhibit 4.3 to the Company's Current Report on Form 8-K filed on August 20, 2020. | |
| 4.56 | | | | Incorporated herein by reference to Exhibit 4.1 to the Company's Current Report on Form 8-K filed on November 19, 2020. | |
| 4.57 | | | | Incorporated herein by reference to Exhibit 4.2 to the Company's Current Report on Form 8-K filed on November 19, 2020. | |
| 4.58 | | | | Incorporated herein by reference to Exhibit 4.3 to the Company's Current Report on Form 8-K filed on November 19, 2020. | |
| 4.59 | | | | Incorporated herein by reference to Exhibit 4.1 to the Company's Current Report on Form 8-K filed on December 4, 2020. | |
| 4.60 | | | | Incorporated herein by reference to Exhibit 4.2 to the Company's Current Report on Form 8-K filed on December 4, 2020. | |
| | | | | | | | | | | | | | | | | |
| 4.61 | | | | Incorporated herein by reference to Exhibit 4.3 to the Company's Current Report on Form 8-K filed on December 4, 2020. | |
| 4.62 | | | | Incorporated herein by reference to Exhibit 4.1 to the Company's Current Report on Form 8-K filed on December 29, 2020. | |
| 4.63 | | | | Incorporated herein by reference to Exhibit 4.2 to the Company's Current Report on Form 8-K filed on December 29, 2020. | |
| 4.64 | | | | Incorporated herein by reference to Exhibit 4.3 to the Company's Current Report on Form 8-K filed on December 29, 2020. | |
| 4.65 | | | | Incorporated herein by reference to Exhibit 4.1 to the Company's Current Report on Form 8-K filed on February 5, 2021. | |
| 4.66 | | | | Incorporated herein by reference to Exhibit 4.2 to the Company's Current Report on Form 8-K filed on February 5, 2021. | |
| 4.67 | | | | Incorporated herein by reference to Exhibit 4.3 to the Company's Current Report on Form 8-K filed on February 5, 2021. | |
| 10.1 | | | | Incorporated herein by reference to Exhibit 10.1 to the Company's Current Report on Form 8-K filed on September 5, 2018. | |
| 10.2 | | | | Incorporated herein by reference to Exhibit 10.2 to the Company's Current Report on Form 8-K filed on May 15, 2015.September 5, 2018. | |
10.210.3.1 | | | | Incorporated herein by reference to Exhibit 10.3 to the Company's Current Report on Form 8-K filed on September 5, 2018. | |
| 10.3.2 | | | | Incorporated herein by reference to Exhibit 10.1 to the Company's Current Report on Form 8-K filed on May 15, 2015.February 14, 2019. | |
10.310.3.3 | | | | Incorporated herein by reference to Exhibit 10.1 to the Company's Quarterly Report on Form 10-Q filed on August 6, 2019. | |
| 10.3.4 | | | | Incorporated herein by reference to Exhibit 10.310.1 to the Company's AnnualCurrent Report on Form 10-K8-K filed on February 28, 2017.December 9, 2019. | |
10.410.3.5 | | | | Incorporated herein by reference to Exhibit 10.1 to the Company's Quarterly Report on Form 10-Q filed on November 5, 2020. | |
| 10.4 | | | | Incorporated herein by reference to Exhibit 10.4 to the Company's Current Report on Form 8-K filed on July 26, 2013.September 5, 2018. | |
| 10.5 | | | | Incorporated herein by reference to Exhibit 10.5 to the Company's Current Report on Form 8-K filed on July 26, 2013. |
|
| | | September 5, 2018. | |
| 10.6 | | Loan GuaranteeTransition Services Agreement, dated as of September 30, 2011,August 31, 2018, by and among High Plains Ranch II, LLC, as borrower, the U.S. Department ofbetween NRG Yield, Inc. and NRG Energy, as guarantor, and the U.S. Department of Energy, as loan servicer.Inc. | | Incorporated herein by reference to Exhibit 10.8 to the Company's Draft Registration Statement on Form S-1, filed on February 13, 2013. |
| 10.7 | | | | Incorporated herein by reference to Exhibit 10.11 to the Company's Draft Registration Statement on Form S-1filed on February 13, 2013. |
10.8 | | | | Incorporated herein by reference to Exhibit 10.12 to the Company's Draft Registration Statement on Form S-1 filed on February 13, 2013. |
10.9 | | | | Incorporated herein by reference to Exhibit 10.13 to the Company's Draft Registration Statement on Form S-1 filed on February 13, 2013. |
10.10 | | | | Incorporated herein by reference to Exhibit 10.14 to the Company's Draft Registration Statement on Form S-1 filed on February 13, 2013. |
10.11 | | | | Incorporated herein by reference to Exhibit 10.15 to the Company's Draft Registration Statement on Form S-1 filed on February 13, 2013. |
10.12 | | | | Incorporated herein by reference to Exhibit 10.16 to the Company's Draft Registration Statement on Form S-1 filed on February 13, 2013. |
10.13 | | | | Incorporated herein by reference to Exhibit 10.15 to the Company's Registration Statement on Form S-1 filed on June 7, 2013. |
10.14 | | | | Incorporated herein by reference to Exhibit 10.16 to the Company's Registration Statement on Form S-1 filed on June 7, 2013. |
10.15 | | | | Incorporated herein by reference to Exhibit 10.17 to the Company's Registration Statement on Form S-1 filed on June 7, 2013. |
10.16† | | | | Incorporated herein by reference to Exhibit 10.5 to the Company's Current Report on Form 8-K filed on May 15, 2015.September 5, 2018. | |
| | | | | | | | | | | | | | | | | |
10.1710.7 | | | | Incorporated herein by reference to Exhibit 10.2010.9 to the Company's Registration StatementCurrent Report on Form S-1/A8-K filed on June 21, 2013.September 5, 2018. | |
10.18.110.9† | | | | Incorporated herein by reference to Exhibit 10.9 to the Company's Annual Report on Form 10-K filed on February 28, 2019. | |
| 10.10 | | | | Incorporated herein by reference to Exhibit 10.10 to the Company's Annual Report on Form 10-K filed on February 28, 2019. | |
| 10.11.1 | | Amended and Restated Credit Agreement, dated April 25, 2014, by and among NRG Yield Operating LLC, NRG Yield LLC, Royal Bank of Canada, as Administrative Agent, the lenders party thereto, Royal Bank of Canada, Goldman Sachs Bank USA and Bank of America, N.A., as L/C Issuers and RBC Capital Markets as Sole Left Lead Arranger and Sole Left Lead Book Runner. | | Incorporated herein by reference to Exhibit 10.1 to the Company’s Current Report on Form 8-K filed on April 28, 2014. | |
10.18.210.11.2 | | | | Incorporated herein by reference to Exhibit 10.9 to the Company's Quarterly Report on Form 10-Q filed on August 4, 2015.
| |
10.18.310.11.3 | | | | Incorporated herein by reference to Exhibit 10.1 to the Company's Current Report on Form 8-K filed on February 12, 2018. |
10.19.1 | | Credit Agreement, dated as of August 23, 2011, among NRG West Holdings LLC, ING Capital LLC, Union Bank, N.A., Mizuho Corporate Bank, Ltd., RBS Securities Inc., Credit Agricole Corporate and Investment Bank, and each of lenders and issuing banks thereto.* | | Incorporated herein by reference to Exhibit 10.2 to the Company's Quarterly Report on Form 10-Q filed on August 7, 2014. |
10.19.2 | | | | Incorporated herein by reference to Exhibit 10.3 to the Company's Quarterly Report on Form 10-Q filed on August 7, 2014. |
10.19.3 | | | | Incorporated herein by reference to Exhibit 10.4 to the Company's Quarterly Report on Form 10-Q filed on August 7, 2014. |
|
| | | | |
10.19.410.11.4 | | | | Incorporated herein by reference to Exhibit 10.6 to the Company's Quarterly Report on Form 10-Q filed on August 4, 2015. |
10.19.5 | | | | Incorporated herein by reference to Exhibit 10.7 to the Company's Quarterly Report on Form 10-Q filed on August 4, 2015.
|
10.19.6 | |
| | Incorporated herein by reference to Exhibit 10.8 to the Company's Quarterly Report on Form 10-Q filed on August 4, 2015.
|
10.20.1 | | Amended and Restated Credit Agreement and Administrative Agent Resignation and Appointment Agreement, dated July 17, 2014,as of April 30, 2018, by and among NRG Marsh LandingYield Operating LLC, TheNRG Yield LLC, the guarantors party thereto, Royal Bank of Scotland Plc, DeutscheCanada, as Resigning Administrative Agent, JPMorgan Chase Bank, Trust Company AmericasN.A., as Successor Administrative Agent, and the lenders party thereto. | | Incorporated herein by reference to Exhibit 10.5 to the Company's Quarterly Report on Form 10-Q filed on August 7, 2014. |
10.20.2 | | | | Incorporated herein by reference to Exhibit 10.6 to the Company's Quarterly Report on Form 10-Q filed on August 7, 2014. |
10.21^ | |
| | Incorporated herein by reference to Exhibit 10.1 to the Company's Quarterly Report on Form 10-Q filed on August 4, 2015. |
10.22^ | | | | Incorporated herein by reference to Exhibit 10.2 to the Company's Quarterly Report on Form 10-Q filed on August 4, 2015. |
10.23^ | | | | Incorporated herein by reference to Exhibit 10.1 to the Company's Quarterly Report on Form 10-Q filed on May 5, 2016.
3, 2018. | |
10.24^10.11.5 | | Fourth Amendment No. 2 to Amended and Restated Limited Liability CompanyCredit Agreement, of NRG DGPV Holdco 1 LLC, dated as of March 1, 2016,November 30, 2018, by and among NRG Yield DGPV HoldingClearway Energy Operating LLC, NRG Renew DG HoldingsClearway Energy LLC, the guarantors party thereto, JPMorgan Chase Bank, N.A., as administrative agent, and NRG Renew LLC.the lenders party thereto. | | Incorporated herein by reference to Exhibit 10.2 to the Company's Quarterly Report on Form 10-Q filed on May 5, 2016. |
10.25^ | | | | Incorporated herein by reference to Exhibit 10.3 to the Company's Quarterly Report on Form 10-Q filed on May 5, 2016.
|
10.26 | | | | Incorporated herein by reference to Exhibit 10.1 to the Company's QuarterlyCurrent Report on Form 10-Q8-K filed on August 9, 2016.
December 6, 2018. | |
10.27†10.11.6 | | | | Incorporated herein by reference to Exhibit 10.1 to the Company's Current Report on Form 8-K filed on December 23, 2019.
| |
| 10.12† | | | | Incorporated herein by reference to Exhibit 10.1 to the Company's Current Report on Form 8-K/A, filed on August 9, 2016. | |
10.28†10.13† | | | | Filed herewith.Incorporated herein by reference to Exhibit 10.28 to the Company's Annual Report on Form 10-K filed on March 1, 2018. | |
10.29†10.14† | | | | Filed herewith. |
10.30† | | | | Filed herewith. |
10.31† | | | | Filed herewith. |
10.32† | | | | Incorporated herein by reference to Exhibit 10.2910.22 to the Company's Annual Report on Form 10-K filed on February 28, 2017.2019. | |
10.33†10.15† | | | | Incorporated herein by reference to Exhibit 10.23 to the Company's Annual Report on Form 10-K filed on February 28, 2019. | |
| 10.16† | | | | Incorporated herein by reference to Exhibit 10.24 to the Company's Annual Report on Form 10-K filed on February 28, 2019. | |
| 10.17† | | | | Incorporated herein by reference to Exhibit 10.25 to the Company's Annual Report on Form 10-K filed on February 28, 2019. | |
| 10.18† | | | | Incorporated herein by reference to Exhibit 10.26 to the Company's Annual Report on Form 10-K filed on March 2, 2020. | |
|
| | | | |
10.34^10.20† | | | | Filed herewith.
| |
| 10.21^ | | Consent and Indemnity Agreement, dated as of February 6, 2018, by and among NRG Energy, Inc., NRG Repowering Holdings LLC, NRG Yield, Inc., and GIP III Zephyr Acquisition Partners, L.P., and NRG Yield Operating LLC (solely with respect to Sections E.5, E.6 and G.12). | | Filed herewith.Incorporated by reference to Exhibit 10.34 to the Company's Annual Report on Form 10-K, filed on March 1, 2018. | |
21.110.22 | | | | Incorporated herein by reference to Exhibit 10.30 to the Company's Annual Report on Form 10-K filed on February 28, 2019. | |
| 10.23 | | Amended and Restated Exchange Agreement, dated as of May 14, 2015, by and among NRG Energy, Inc., NRG Yield, Inc., and NRG Yield LLC and, pursuant to a joinder thereto, dated as of August 31, 2018, Zephyr Renewables LLC. | | Incorporated herein by reference to Exhibit 10.1 to the Company's Current Report on Form 8-K filed on May 15, 2015. | |
| 10.24 | | | | Incorporated herein by reference to Exhibit 10.2 to the Company's Current Report on Form 8-K filed on May 15, 2015. | |
| 10.25*^ | | | | Incorporated herein by reference to Exhibit 10.1 to the Company's Current Report on Form 8-K filed on April 20, 2020. | |
| 10.26*^ | | | | Incorporated herein by reference to Exhibit 10.2 to the Company's Current Report on Form 8-K filed on April 20, 2020. | |
| 10.27*^ | | | | Incorporated herein by reference to Exhibit 10.3 to the Company's Current Report on Form 8-K filed on April 20, 2020. | |
| 10.28†* | | | | Incorporated herein by reference to Exhibit 10.1 to the Company's Current Report on Form 8-K filed on December 22, 2020. | |
| 10.29†* | | | | Incorporated herein by reference to Exhibit 10.2 to the Company's Current Report on Form 8-K filed on December 22, 2020. | |
| 10.30†* | | | | Incorporated herein by reference to Exhibit 10.3 to the Company's Current Report on Form 8-K filed on December 22, 2020. | |
| 10.31*^ | | | | Filed herewith. | |
| 21.1 | | | | Filed herewith. | |
| 23.1 | | | | Filed herewith. | |
31.124.1 | | | | Included on the signature page of this Annual Report on Form 10-K. | |
| 31.1 | | | | Filed herewith. | |
| 31.2 | | | | Filed herewith. | |
| 31.3 | | | | Filed herewith. | |
| 32 | | | | Furnished herewith. | |
| 101 INS | | Inline XBRL Instance Document. | | Filed herewith. | |
| 101 SCH | | Inline XBRL Taxonomy Extension Schema. | | Filed herewith. | |
| 101 CAL | | Inline XBRL Taxonomy Extension Calculation Linkbase. | | Filed herewith. | |
| 101 DEF | | Inline XBRL Taxonomy Extension Definition Linkbase. | | Filed herewith. | |
| 101 LAB | | Inline XBRL Taxonomy Extension Label Linkbase. | | Filed herewith. | |
| | | | | | | | | | | | | | | | | |
| 101 PRE | | Inline XBRL Taxonomy Extension Presentation Linkbase. | | Filed herewith. | |
| 104 | | Cover Page Interactive Data File (the cover page interactive date file does not appear in Exhibit 104 because its Inline XBRL tags are embedded within the Inline XBRL document) | | | |
|
| | | | | | | |
| † | | Indicates exhibits that constitute compensatory plans or arrangements. |
| * | | This filing excludes schedules pursuant to Item 601(b)(2) of Regulation S-K, which the registrant agrees to furnish supplementary to the Securities and Exchange Commission upon request by the Commission. |
| ^ | | Portions ofInformation in this exhibit haveidentified by the mark “[***]” is confidential and has been redacted and are subject to a confidential treatment request filed with the Secretary of the Securities and Exchange Commissionexcluded pursuant to Rule 24b-2 underItem 601(b)(10)(iv) of Regulation S-K because it (i) is not material and (ii) would likely cause competitive harm to the Securities Exchange Act of 1934, as amended.
Registrant if disclosed.
|
Item 16 — Form 10-K Summary
None.
SIGNATURES
Pursuant to the requirements of Section 13 or 15(d) of the Securities Exchange Act of 1934, the registrant has duly caused this report to be signed on its behalf by the undersigned thereunto duly authorized.
|
| | | | | | | | | | | | | |
| NRG YIELD,CLEARWAY ENERGY, INC.
(Registrant)
| |
| | |
| /s/ CHRISTOPHER S. SOTOS | |
| Christopher S. Sotos | |
| Chief Executive Officer (Principal Executive Officer) | |
|
Date: March 1, 20182021 | | |
|
POWER OF ATTORNEY
Each person whose signature appears below constitutes and appoints David R. HillChristopher S. Sotos, Kevin P. Malcarney and Brian E. Curci,Michael A. Brown, each or any of them, such person's true and lawful attorney-in-fact and agent with full power of substitution and resubstitution for such person and in such person's name, place and stead, in any and all capacities, to sign any and all amendments to this report on Form 10-K, and to file the same with all exhibits thereto, and other documents in connection therewith, with the Securities and Exchange Commission, granting unto said attorneys-in-fact and agents, and each of them, full power and authority to do and perform each and every act and thing necessary or desirable to be done in and about the premises, as fully to all intents and purposes as such person, hereby ratifying and confirming all that said attorneys-in-fact and agents, or any of them or his or their substitute or substitutes, may lawfully do or cause to be done by virtue hereof.
In accordance withPursuant to the requirements of the Securities Exchange Act of 1934, this report has been signed below by the following persons on behalf of the registrant and in the capacities indicatedand on March 1, 2018.
|
| | | | | | | | | | | | | |
| Signature | | Title | | Date |
| /s/ CHRISTOPHER S. SOTOS | | President, Chief Executive Officer and Director | | March 1, 20182021 |
| Christopher S. Sotos | | (Principal Executive Officer) | |
| /s/ CHAD PLOTKIN | | Chief Financial Officer | | March 1, 20182021 |
| Chad Plotkin | | (Principal Financial Officer) | |
/s/ DAVID CALLENSARAH RUBENSTEIN | | ChiefVice President, Accounting Officer& Controller | | March 1, 20182021 |
David CallenSarah Rubenstein | | (Principal Accounting Officer) | |
/s/ MAURICIO GUTIERREZJONATHAN BRAM | | Chairman of the Board | | March 1, 20182021 |
Mauricio GutierrezJonathan Bram | | |
/s/ KIRKLAND B. ANDREWSNATHANIEL ANSCHUETZ | | Director | | March 1, 20182021 |
Kirkland B. AndrewsNathaniel Anschuetz | | |
/s/ JOHN CHILLEMI | | Director | | March 1, 2018 |
John Chillemi | | |
/s/ JOHN CHLEBOWSKI | | Director | | March 1, 2018 |
John Chlebowski | | |
| /s/ BRIAN FORD | | Director | | March 1, 20182021 |
| Brian Ford | | |
| /s/ BRUCE MACLENNAN | | Director | | March 1, 2021 |
| Bruce MacLennan | | |
| /s/ FERRELL MCCLEAN | | Director | | March 1, 20182021 |
| Ferrell McClean | | |
| /s/ DANIEL B. MORE | | Director | | March 1, 2021 |
| Daniel B. More | | |
| /s/ E. STANLEY O'NEAL | | Director | | March 1, 2021 |
| E. Stanley O'Neal | | |
| /s/ SCOTT STANLEY | | Director | | March 1, 2021 |
| Scott Stanley | | |