| PAGE | ||||||
| PART I | ||||||
| Item 1. | Business | |||||
| Item 1A. | Risk Factors | |||||
| Item 1B. | Unresolved Staff Comments | |||||
| Item 2. | Properties | |||||
| Item 3. | Legal Proceedings | |||||
| Item 4. | Mine Safety Disclosures | |||||
| PART II | ||||||
| Item 5. | Market for the Registrant’s Common Equity, Related Stockholder Matters and Issuer Purchases of Equity Securities | |||||
| Item 6. | Selected Financial Data | |||||
| Item 7. | Management’s Discussion and Analysis of Financial Condition and Results of Operation | |||||
| Item 7A. | Quantitative and Qualitative Disclosures about Market Risk | |||||
| Item 8. | Financial Statements and Supplementary Data | |||||
| Item 9. | Changes in and Disagreements with Accountants on Accounting and Financial Disclosure | |||||
| Item 9A. | Controls and Procedures | |||||
| Item 9B. | Other Information | |||||
| PART III | ||||||
| Item 10. | Directors, Executive Officers and Corporate Governance | |||||
| Item 11. | Executive Compensation | |||||
| Item 12. | Security Ownership of Certain Beneficial Owners and Management and Related Stockholder Matters | |||||
| Item 13. | Certain Relationships and Related Transactions, and Director Independence | |||||
| Item 14. | Principal Accountant Fees and Services | |||||
| PART IV | ||||||
| Item 15. | Exhibits and Financial Statement Schedules | |||||
| �� | Signatures | |||||
| 2 |
Forward-Looking Statements
This Annual Report on Form 10-K contains forward-looking statements within the meaning of the federal securities law. Statements in this report that are not strictly historical are forward-looking and based upon current expectations that may differ materially from actual results. These forward-looking statements, identified by words such as “will”, “expect”, “believe” and “prospects”, involve risks and uncertainties that could cause actual results to differ materially from those anticipated by the statement made herein. These risks and uncertainties include, but are not limited to, general economic trends and changes in interest rates, increased competition, regulatory or legislative developments affecting the financial industry generally or Nicolet Bankshares, Inc. specifically, changes in consumer demand for financial services, the possibility of unforeseen events affecting the industry generally or Nicolet Bankshares, Inc. specifically, the uncertainties associated with newly developed or acquired operations and market disruptions. Nicolet Bankshares, Inc. undertakes no obligation to release revisions to these forward-looking statements publicly to reflect events or circumstances after the date hereof or to reflect the occurrence of unforeseen events, except as required to be reported under the rules and regulations of the Securities and Exchange Commission (“SEC”).
PART I
| ITEM 1. | BUSINESS |
General
Nicolet Bankshares, Inc. (individually referred to herein as the “Parent Company” and together with all its subsidiaries collectively referred to herein as “Nicolet,” the “Company,” “we,” “us” or “our”) is a registered bank holding company under the Bank Holding Company Act of 1956, as amended, and under the bank holding company laws of the State of Wisconsin.
Nicolet is a Wisconsin corporation, originally incorporated on April 5, 2000 as Green Bay Financial Corporation, a Wisconsin corporation, to serve as the holding company for and the sole shareholder of Nicolet National Bank. It amended and restated its articles of incorporation and changed its name to Nicolet Bankshares, Inc. on March 14, 2002. It subsequently became the holding company for Nicolet Nationalthe Bank upon the completion of the bank’sBank’s reorganization into a holding company structure on June 6, 2002.
Nicolet conducts operations through its wholly owned subsidiary, Nicolet National Bank, a commercial bank which was organized in 2000 as a national bank under the laws of the United States and opened for business, in Green Bay, Brown County, Wisconsin, on November 1, 2000 (referred to herein as “Nicolet National Bank,” or the “Bank”). Structurally, Nicolet also wholly owns a registered investment advisory firm, Brookfield Investment Partners, LLC. (“Brookfield”), that principally provides investment strategy and transactional services to select community banks, wholly owns ana registered investment subsidiary of the Bankadvisory firm, Nicolet Advisory Services, LLC (“Nicolet Advisory”), that is based in Nevada,conducts brokerage and financial advisory services primarily to individual consumers, and entered into a joint venture that provides for 50% ownership of the building in which Nicolet is headquartered. Structurally, the Bank wholly owns an investment subsidiary based in Nevada, wholly owns a subsidiary in Green Bay that provides a web-based investment management platform for financial advisor trades and related activity, and the Bank owns 99.2% of United Financial Services, Inc (“UFS Inc.”) which in turn owns 50.2% of UFS, LLC, a data processing services company located in Grafton, Wisconsin (collectively referred to herein as “UFS”). These subsidiaries are closely related to or incidental to the business of banking and none are individually or collectively significant to Nicolet’s financial position or results.
The Bank is a full-service community bank, offering traditional banking products and services, and wealth managementtrust and brokerage products and services, to businesses and individuals in the markets it serves, delivered through a branch network serving northeast and central Wisconsin communities and Menominee, Michigan, as well as through on-line and mobile banking capabilities.
Nicolet’s profitability is significantly dependent upon net interest income (interest income earned on loans and other interest-earning assets such as investments, net of interest expense on deposits and other borrowed funds), and noninterest income sources (including but not limited to service charges on deposits, trust and brokerage fees, and mortgage fee income from sales of residential mortgages into the secondary market), offset by the level of the provision for loan losses, noninterest expenses (largely employee compensation and overhead expenses tied to processing and operating the Bank’s business), and income taxes. For
| 3 |
Since its opening in late 2000, Nicolet has supplemented its organic growth with the year endedDecember 2003 purchase of a branch and deposits in Menominee, Michigan, the July 2010 purchase of 4 branches and deposits in Brown County, the April 2013 merger transaction with Mid-Wisconsin Financial Services, Inc. (“Mid-Wisconsin”), the August 2013 acquisition of selected assets and liabilities of Bank of Wausau through a transaction with the Federal Deposit Insurance Corporation (“FDIC”) (the latter two collectively referred to as the “2013 acquisitions”), and two transactions completed in the first half of 2016 (collectively the “2016 acquisitions”) consisting of a private transaction to hire a select group of financial advisors and to purchase their respective books of business and operating platform completed on April 1, 2016 and the merger transaction with Baylake Corp. (“Baylake”) consummated on April 29, 2016.
On November 4, 2016, Nicolet announced the signing of an Agreement and Plan of Merger with First Menasha Bancshares, Inc. (“First Menasha” (OTCQX: FMBJ)) pursuant to which First Menasha will merge with and into Nicolet. As of December 31, 2014, Nicolet earned net income2016, First Menasha had total assets of $9.9$465 million, loans of $365 million, deposits of $383 million and after $0.2 milliontotal stockholders’ equity of preferred stock dividends, net income available$47 million. The merger with First Menasha is expected to common shareholders was $9.7 million or $2.25 per diluted common share.
Products and Services Overview
Nicolet’s principal business is banking, consisting of lending and deposit gathering, as well as ancillary banking-related products and services, to businesses and individuals of the communities it serves, and the operational support to deliver, fund and manage such banking products and services. Additionally, through the Bank offersand Nicolet Advisory, trust, brokerage and other investment management services for individuals and retirement plan services for business customers.customers are offered. Nicolet delivers its products and services principally through 2336 bank branch locations, on-line banking, mobile banking and an interactive website. Nicolet’s call center also services customers.
Nicolet offers a variety of loans, deposits and related services to business customers (especially small and medium-sized businesses and professional concerns), including but not limited to: business checking and other business deposit products and cash management services, international banking services, business loans, lines of credit, commercial real estate financing, construction loans, agricultural real estate or production loans, and letters of credit, as well as retirement plan services. Similarly, Nicolet offers a variety of banking products and services to consumers, including but not limited to: residential mortgage loans and mortgage refinancing, home equity loans and lines of credit, residential construction loans, personal loans, checking, savings and money market accounts, various certificates of deposit and individual retirement accounts, safe deposit boxes, and personal brokerage, trust and fiduciary services. Nicolet also provides on-line services including commercial, retail and trust on-line banking, automated bill payment, mobile banking deposits and account access, remote deposit capture, and telephone banking, and other services such as wire transfers, courier services, debit cards, credit cards, pre-paid gift cards, direct deposit, official bank checks and U.S. Savingssavings bonds.
Lending is critical to Nicolet’s balance sheet and earnings potential. Nicolet seeks creditworthy borrowers principally within the geographic area of its branch locations. As a community bank with experienced commercial lenders and residential mortgage lenders, the Bank’s primary lending function is to make commercial loans [consisting(consisting of commercial, industrial, and business loans and lines of credit, owner-occupied commercial real estate (“owner-occupied CRE”), and agricultural (“AG”) production and real estate loans]; commercial real estate (“CRE”) loans [consisting of investment real estate loans (“CRE investment”), AG real estate, and construction and land development loans]loans); residential real estate loans (consisting of residential first lien mortgages, junior lien mortgages, home equity loans and lines of credit, and to a lesser degree residential construction loans); and other loans, mainly consumer in nature. As of December 31, 2014,2016, Nicolet’s loan portfolio mix was as follows:
| Loan category | % of Total Loans | ||||
| Commercial & industrial | % | ||||
| Owner-occupied CRE | % | ||||
| AG production | % | ||||
| Total commercial loans | 53 | % | |||
| AG real estate | % | ||||
| CRE investment | % | ||||
| Construction & land development | % | ||||
| Total CRE loans | % | ||||
| Residential construction | 1 | % | |||
| Residential first mortgages | % | ||||
| Residential junior mortgages | 6 | % | |||
| Total residential real estate loans | % | ||||
| Other | 1 | % | |||
| 4 |
Lending involves credit risk. Nicolet has and follows extensive loan policies and procedures to standardize processes, meet compliance requirements and prudently manage underwriting, credit and other risks. Credit risk is further controlled and monitored through active asset quality management including the use of lending standards, thorough review of current and potential borrowers through Nicolet’s underwriting process, close relationships with and regular check-ins with borrowers, and active asset quality administration. For further discussion of credit risk management, see “Management’s Discussion and Analysis of Financial Condition and Results of Operation,” under Part II, Item 7.
Employees
At December 31, 2014,2016, Nicolet had approximately 280480 full-time equivalent employees. None of our employees are represented by unions.
Market Area and Competition
The Bank is a full-service community bank, providing a full range of traditional commercial and retail banking services, as well as wealth management services throughout northeastern and central Wisconsin and the upper peninsula of Michigan. Nicolet markets its services to owner-managed companies, the individual owners of these businesses, and other residents of its market area, which at December 31, 20142016 is through 2336 branches located within 1011 Wisconsin counties (Brown, Door, Outagamie, Kewaunee, Marinette, Taylor, Clark, Marathon, Oneida, Price Vilas, and Eau Claire)Vilas) and in Menominee, Michigan. Based on deposit market share data published by the FDIC as of June 30, 2014,2016, the Bank ranks in the top three of market share for Brown, Door, Kewaunee, Taylor and Clark counties and in the top five for Menominee, Marinette and Price counties.
The financial services industry is highly competitive. Nicolet competes for loans, deposits and wealth management or financial services in all its principal markets. Nicolet competes directly with other bank and nonbank institutions located within our markets (some that may have an established customer base or name recognition), internet-based banks, out-of-market banks that advertise or otherwise serve its markets, money market and other mutual funds, brokerage houses, mortgage companies, insurance companies or other commercial entities that offer financial services products. Competition involves efforts to retain current or procure new customers, obtain new loans and deposits, increase the scope and type of products or services offered, and offer competitive interest rates paid on deposits or earned on loans, as well as to deliver other aspects of banking competitively. Many of Nicolet’s competitors may enjoy competitive advantages, including greater financial resources, broader geographic presence, more accessible branches or more advanced technologic delivery of products or services, more favorable pricing alternatives and lower origination or operating costs.
We believe our competitive pricing, personalized service and community engagement enable us to effectively compete in our markets. Nicolet employs seasoned banking and wealth management professionals with experience in its market areas and who are active in their communities. Nicolet’s emphasis on meeting customer needs in a relationship-focused manner, combined with local decision making on extensions of credit, distinguishes Nicolet from its competitors, particularly in the case of large financial institutions. Nicolet believes it further distinguishes itself by providing a range of products and services characteristic of a large financial institution while providing the personalized service, real conversation, and convenience characteristic of a local, community bank.
Supervision and Regulation
Set forth below is an explanation of the major pieces of legislation and regulation affecting the banking industry and how that legislation and regulation affects Nicolet’s actions.business. The following summary is qualified by reference to the statutory and regulatory provisions discussed. Changes in applicable laws or regulations may have a material effect on the business and prospects of Nicolet or Nicolet Nationalthe Bank, and legislative changes and the policies of various regulatory authorities may significantly affect their operations. We cannot predict the effect that fiscal or monetary policies, or new federal or state legislation may have on the future business and earnings of Nicolet or the Bank.
The Dodd-Frank Wall Street Reform and Consumer Protection Act (the “Dodd-Frank Act”), enacted in 2010, contains a comprehensive set of provisions designed to govern the practices and oversight of financial institutions and other participants in the financial markets. The Dodd-Frank Act made extensive changes in the regulation of financial institutions and their holding companies.
Uncertainty remains as to the ultimate impact of the Dodd-Frank Act, which could have a material adverse impact on the financial services industry as a whole or on Nicolet’s and the Bank’s business, results of operations, and financial condition. Many aspects of the Dodd-Frank Act are in the process of being implemented while other aspects remain subject to further rulemaking. These regulations are scheduled to take effect over several years, making it difficult to anticipate the overall financial impact on Nicolet, Nationalits customers or the financial industry more generally. However, full implementation of the Dodd-Frank Act would likely increase the regulatory burden, compliance costs and interest expense for Nicolet and the Bank. Some of the rules that have been adopted to comply with the Dodd-Frank Act’s mandates are discussed below.
| 5 |
Regulation of Nicolet
Because Nicolet owns all of the capital stock of Nicolet Nationalthe Bank, it is a bank holding company under the federal Bank Holding Company Act of 1956, as amended (the “Bank Holding Company Act”). As a result, Nicolet is primarily subject to the supervision, examination, and reporting requirements of the Bank Holding Company Act and the regulations of the Board of Governors of the Federal Reserve System (the “Federal Reserve”). As a bank holding company located in Wisconsin, the Wisconsin Department of Financial Institutions (the “WDFI”) also regulates and monitors all significant aspects of its operations.
Acquisitions of Banks
. The Bank Holding Company Act requires every bank holding company to obtain the prior approval of the Federal Reserve before:| acquiring direct or indirect ownership or control of any voting shares of any bank if, after the acquisition, the bank holding company will directly or indirectly own or control more than 5% of the bank’s voting shares; |
| acquiring all or substantially all of the assets of any bank; or |
| merging or consolidating with any other bank holding company. |
Additionally, Thethe Bank Holding Company Act provides that the Federal Reserve may not approve any of these transactions if it would result in or tend to create a monopoly, substantially lessen competition, or otherwise function as a restraint of trade, unless the anti-competitive effects of the proposed transaction are clearly outweighed by the public interest in meeting the convenience and needs of the community to be served. The Federal Reserve is also required to consider the financial and managerial resources and future prospects of the bank holding companies and banks involved in the transaction and the convenience and needs of the community to be served. The Federal Reserve’s consideration of financial resources generally focuses on capital adequacy, which is discussed below.
Under Thethe Bank Holding Company Act, if adequately capitalized and adequately managed, Nicolet or any other bank holding company located in Wisconsin may purchase a bank located outside of Wisconsin. Conversely, an adequately capitalized and adequately managed bank holding company located outside of Wisconsin may purchase a bank located inside Wisconsin. In each case, however, restrictions may be placed on the acquisition of a bank that has only been in existence for a limited amount of time or will result in specified concentrations of deposits.
Change in Bank Control
.Subject to various exceptions,Permitted Activities
. The Bank Holding Company Act has generally prohibited a bank holding company from engaging in activities other than banking or managing or controlling banks or other permissible subsidiaries and from acquiring or retaining direct or indirect control of any company engaged in any activities other than those determined by the Federal Reserve to be closely related to banking or managing or controlling banks as to be a proper incident thereto. Provisions of the Gramm-Leach-Bliley Act have expanded the permissible activities of a bank holding company that qualifies as a financial holding company to engage in activities that are financial in nature or incidental or complementary to financial activities. Those activities include, among other activities, certain insurance, advisory and security activities.Nicolet meets the qualification standards applicable to financial holding companies, and elected to become a financial holding company in 2008. In2008.In order to remain a financial holding company, Nicolet must continue to be considered well managed and well capitalized by the Federal Reserve, and Nicolet Nationalthe Bank must continue to be considered well managed and well capitalized by the OCCOffice of the Comptroller of the Currency (the “OCC”) and have at least a “satisfactory” rating under the Community Reinvestment Act.
Support of Subsidiary Institutions
. Under Federal Reserve policy and the Dodd-FrankIn addition, any capital loans made by Nicolet to Nicolet Nationalthe Bank will be repaid only after Nicolet Nationalthe Bank’s deposits and various other obligations are repaid in full.
Capital Adequacy
. Nicolet is subject to capital requirements applied on a consolidated basis, which are substantially similar to those required of| 6 |
Dividend Restrictions
. Under Federal Reserve policies, bank holding companies may pay cash dividends on common stock only out of income available over the past year if prospective earnings retention is consistent with theRegulation of the Treasury (the “Treasury”) underBank
Because the Small Business Lending Fund (the “SBLF”) on September 1, 2011, it became subject to certain contractual limitations on the payment of dividends. These limitations require, among other things, that (1) all dividends for the SBLF Preferred Stock be paid before other dividends can be paid and (2) no dividends on or repurchases of Nicolet common stock will be permitted if the payment or dividends would result in a reduction of Nicolet’s Tier 1 capital from the level on the SBLF closing date by more than 10%.
Branching.
National banks are required by the National Bank Act to adhere to branching laws applicable to state banks in the states in which they are located. Under Wisconsin law and the Dodd-Frank Act, and with the prior approval of the OCC,Capital Adequacy.
Banks and bank holding companies, as regulated institutions, are required to maintain minimum levels of capital. The Federal ReserveIn addition to thesethe minimum risk-based capital and leverage ratios, the Basel III final rule requires that all banking organizations must maintain a “capital conservation buffer” consisting of CET1 in an amount equal to 2.5% of risk-weighted assets in order to avoid restrictions on their ability to make capital distributions and to pay certain discretionary bonus payments to executive officers. In order to avoid those restrictions, the capital conservation buffer effectively increases the minimum CET1 capital, Tier 1 capital, and total capital ratios for U.S. banking organizations to 7.0%, 8.5%, and 10.5%, respectively. Banking organizations with capital levels that fall within the buffer will be required to limit dividends, share repurchases or redemptions (unless replaced within the same calendar quarter by capital instruments of equal or higher quality), and discretionary bonus payments. The capital conservation buffer is phased in over a 5-year period beginning January 1, 2016.
| Adequately Capitalized Requirement, effective January 1, 2015 | Well-Capitalized Requirement, effective January 1,2015 | Well-Capitalized with Buffer, fully phased in 2019 | |
| Leverage | 4.0% | 5.0% | 5.0% |
| CET1 | 4.5% | 6.5% | 7.0% |
| Tier 1 | 6.0% | 8.0% | 8.5% |
| Total Capital | 8.0% | 10.0% | 10.5% |
The following table presents the Basel III final rule requires thatrisk-based and leverage capital requirements applicable to the Bank:
| Adequately Capitalized Requirement | Well-Capitalized Requirement | Well-Capitalized with Buffer, fully phased in 2019 | |
| Leverage | 4.0% | 5.0% | 5.0% |
| CET1 | 4.5% | 6.5% | 7.0% |
| Tier 1 | 6.0% | 8.0% | 8.5% |
| Total Capital | 8.0% | 10.0% | 10.5% |
Although capital instruments such as trust preferred securities and cumulative preferred shares were required by the Dodd-Frank Act to be phased-out of Tier 1 capital by January 1, 2016, for certain larger banking organizations, that had $15 billion or more in total consolidated assets as of December 31, 2009 andNicolet’s trust preferred securities are permanently grandfathersgrandfathered as Tier 1 capital such instruments issued by these smaller entities prior to May 19, 2010 (provided they do not exceed 25 percent25% of Tier 1 capital). Nicolet’s trust preferred securities are grandfathered under this provision.
The Basel III final rule provides banking organizations under $250 billion in total consolidated assets or under $10 billion in foreign exposures with a one-time “opt-out” right to continue excluding Accumulated Other Comprehensive Income from CET1 capital. The election to opt-out must be made on the banking organization’s first Call Report filed after January 1, 2015. Nicolet intends to elect to opt-out to continue excluding Accumulated Other Comprehensive Income from its regulatory capital.
| 7 |
The OCC also considers interest rate risk (arising when the interest rate sensitivity of the Bank’s assets does not match the sensitivity of its liabilities or its off-balance-sheet position) in the evaluation of the bank’s capital adequacy. Banks with excessive interest rate risk exposure are required to hold additional amounts of capital against their exposure to losses resulting from that risk. Through the risk-weighting of assets, the regulators also require banks to incorporate market risk components into their risk-based capital. Under these market risk requirements, capital is allocated to support the amount of market risk related to a bank’s lending and trading activities.
The Bank’s capital categories are determined solely for the purpose of applying the “prompt corrective action” rules described below and they are not necessarily an accurate representation of its overall financial condition or prospects for other purposes. Failure to meet capital guidelines could subject a bank or bank holding company to a variety of enforcement remedies, including issuance of a capital directive, the termination of deposit insurance by the FDIC, a prohibition on accepting brokered deposits, and certain other restrictions on its business. See “Prompt Corrective Action” below.
Prompt Corrective Action.The Federal Deposit Insurance Corporation Improvement Act of 1991 (“FDICIA”) establishes a system of prompt corrective action to resolve the problems of undercapitalized financial institutions. Under this system, the federal banking regulators have established five capital categories: well capitalized, adequately capitalized, undercapitalized, significantly undercapitalized, and critically undercapitalized, in which all institutions are placed. The federal banking agencies have also specified by regulation the relevant capital levels for each category.
A “well-capitalized” bank is one that is not required to meet and maintain a specific capital level for any capital measure, pursuant to any written agreement, order, capital directive, or prompt corrective action directive, and has a total risk-based capital ratio of at least 10%, a Tier 1 risk-based capital ratio of at least 8%, a common equity Tier 1 capital ratio of at least 6.5%, and a Tier 1 leverage ratio of at least 5%. Generally, a classification as well capitalized will meetplace a bank outside of the regulatory zone for purposes of prompt corrective action. However, a well-capitalized bank may be reclassified as “adequately capitalized” based on criteria other than capital, if the federal regulator determines that a bank is in an unsafe or exceedunsound condition, or is engaged in unsafe or unsound practices, which requires certain remedial action.
As of December 31, 2016, the newBank satisfied the requirements of “well-capitalized” under the regulatory framework for prompt corrective action. See Note 19, “Regulatory Capital Requirements and Restrictions of Dividends,” in the Notes to continueConsolidated Financial Statements, under Part II, Item 8, for Nicolet and the Bank regulatory capital ratios.
As a bank’s capital position deteriorates, federal banking regulators are required to be classified as well-capitalized under Basel III astake various mandatory supervisory actions and are authorized to take other discretionary actions with respect to institutions in the three undercapitalized categories: undercapitalized, significantly undercapitalized, and critically undercapitalized. The severity of January 1, 2015.
FDIC Insurance Assessments.
Commercial Real Estate Lending.
| · | total reported loans for construction, land development and other land represent 100% or more of the institution’s total capital, or |
| · | total commercial real estate loans represent 300% or more of the institution’s total capital, and the outstanding balance of the institution’s commercial real estate loan portfolio has increased by 50% or more. |
At December 31, 2014 Nicolet National2016 the Bank’s commercial real estate lending levels are below the guidance levels noted above.
Enforcement Powers
.The Financial Institution Reform Recovery and Enforcement Act (“FIRREA”) expanded and increased civil and criminal penalties available for use by the federal regulatory agencies against depository institutions and certain “institution-affiliated parties.” Institution-affiliated parties primarily include management, employees, and agents of a financial institution, as well as independent contractors and consultants such as attorneys and accountants and others who participate in the conduct of the financial institution’s affairs. These practices can include the failure of an institution to timely file required reports or the filing of false or misleading information or the submission of inaccurate reports. Civil penalties may be as high as| 8 |
Community Reinvestment Act.
The Community Reinvestment Act requires that, in connection with examinations of financial institutions within their respective jurisdictions, the federal banking agencies evaluate the record of each financial institution in meeting the credit needs of its local community, including low- and moderate-income neighborhoods. These facts are also considered in evaluating mergers, acquisitions, and applications to open a branch or facility. Failure to adequately meet these criteria could impose additional requirements and limitations onPayment
of Dividends. Statutory and regulatory limitations apply toThe Bank is required by federal law to obtain prior approval of the OCC for payments of dividends if the total of all dividends declared by Nicolet Nationalthe Bank in any year will exceed (1) the total of Nicolet Nationalthe Bank’s net profits for that year, plus (2) Nicolet Nationalthe Bank’s retained net profits of the preceding two years, less any required transfers to surplus. The payment of dividends may also be affected by other factors, such as the requirement to maintain adequate capital above regulatory guidelines or any conditions or restrictions that may be imposed by regulatory authorities.
Transactions with Affiliates and Insiders
.USA PatriotPATRIOT Act
Customer Protection
.Consumer Financial Protection Bureau.
The Dodd-Frank Act centralized responsibility for consumer financial protection including implementing, examining and enforcing compliance with federal consumer financial laws with the Consumer Financial Protection Bureau (the “CFPB”). Depository institutions with less than $10 billion in assets, such asUDAP and UDAAP.
| 9 |
Mortgage Reform.
The CFPB has adopted final rules implementing minimum standards for the origination of residential mortgages, including standards regarding aAvailable Information
Nicolet became a public reporting company under Section 15(d) of the Securities Exchange Act of 1934, as amended (the “Exchange Act”) on March 26, 2013, when Nicolet’s registration statement related to its acquisition of Mid-Wisconsin Financial Services, Inc. (Registration Statement on Form S-4, “Regis.Regis. No. 333-186401”)333-186401) became effective. Nicolet registered its common stock under Section 12(b) of the Exchange Act on February 24, 2016 in connection with listing on the Nasdaq Capital Market. Nicolet files annual, quarterly, and current reports, and other information with the SEC. These filings are available to the public on the Internet at the SEC’s website atwww.sec.gov. Shareholders may also read and copy any document that we file at the SEC’s public reference rooms located at 100 F Street, NE, Washington, DC 20549. Shareholders may call the SEC at 1-800-SEC-0330 for further information on the public reference room.
Nicolet’s internet address iswww.nicoletbank.com. We make available free of charge on or through our website our annual report on Form 10-K, quarterly reports on Form 10-Q, current reports on Form 8-K, and amendments to those reports filed or furnished pursuant to Section 13(a) or 15(d) of the Securities Exchange Act of 1934 as soon as reasonably practicable after we electronically file such material with, or furnish it to, the SEC.
| ITEM 1A. | RISK FACTORS |
An investment in our common stock involves risks. If any of the following risks, or other risks which have not been identified or which we may believe are immaterial or unlikely, actually occur,occurs, our business, financial condition and results of operations could be harmed. In such a case, the trading price of our common stock could decline, and you could lose all or part of your investment. The risks discussed below also include forward-looking statements, and our actual results may differ substantially from those discussed in these forward-looking statements.
Risks Relating to Nicolet’s Business
Nicolet may not be able to sustain its historical rate of growth, or may encounter issues associated with its growth, either of which could adversely affect our financial condition, results of operations, and share price.
We have grown over the past several years and intend to continue to pursue a significant growth strategy for our business. Our prospects must be considered in light of the risks, expenses and difficulties frequently encountered by companies in significant growth stages of development. We may not be able to further expand our market presence in existing markets or to enter new markets successfully, nor can we guarantee that any such expansion would not adversely affect our results of operations. Failure to manage growth effectively could have a material adverse effect on the business, future prospects, financial condition or results of our operations, and could adversely affect our ability to successfully implement business strategies. Also, if such growth occurs more slowly than anticipated or declines, our operating results could be materially adversely affected.
Our ability to grow successfully will depend on a variety of factors including the continued availability of desirable business opportunities, the competitive responses from other financial institutions in our market areas and the ability to manage our growth. While we believe we have the management resources and internal systems in place to manage future growth successfully, there can be no assurance that growth opportunities will be available or that any growth will be managed successfully. In addition, our recent growth may distort some of our historical financial ratios and statistics.
As part of our growth strategy, we regularly evaluate merger and acquisition opportunities and conduct due diligence activities related to possible transactions with other financial institutions and financial services companies. As a result, negotiations may take place and future mergers or acquisitions involving cash, debt, or equity securities may occur at any time. We seek merger or acquisition partners that are culturally similar, have experienced management, and possess either significant market presence or have potential for improved profitability through financial management, economies of scale, or expanded services.
As noted above in Item 1, Business, Nicolet completed its acquisition of Baylake on April 29, 2016, and completed the hiring of a select group of financial advisors and purchase of their respective books of business and operating platform on April 1, 2016. In addition, on November 4, 2016, we announced the signing of a definitive merger agreement pursuant to which Nicolet will acquire First Menasha. As evidenced by our pending acquisition of First Menasha, we intend to continue pursuing a growth strategy for our business through attractive acquisition opportunities.
| 10 |
Acquiring other banks, businesses, or branches involves potential adverse impact to our financial results and various other risks commonly associated with acquisitions, including, among other things, difficulty in estimating the value of the target company, payment of a premium over book and market values that may dilute our tangible book value and earnings per share in the short and long term, potential exposure to unknown or contingent liabilities of the target company, exposure to potential asset quality issues of the target company, potential volatility in reported income as goodwill impairment losses could occur irregularly and in varying amounts, difficulty and expense of integrating the operations and personnel of the target company, inability to realize the expected revenue increases, cost savings, increases in geographic or product presence, and / or other projected benefits, potential disruption to our business, potential diversion of our management’s time and attention, and the possible loss of key employees and customers of the target company.
As a community bank, Nicolet’s success depends upon local and regional economic conditions and has different lending risks than larger banks.
We provide services to our local communities. Our ability to diversify economic risks is limited by our own local markets and economies. We lend primarily to individuals and small- to medium-sized businesses, which may expose us to greater lending risks than those of banks lending to larger, better-capitalized businesses with longer operating histories.
We manage our credit exposure through careful monitoring of loan applicants and loan concentrations in particular industries, and through loan approval and review procedures. We have established an evaluation process designed to determine the adequacy of our allowance for loan losses. While this evaluation process uses historical and other objective information, the classification of loans and the establishment of loan losses is an estimate based on experience, judgment and expectations regarding borrowers and economic conditions, as well as regulator judgments. We can make no assurance that our loan loss reserves will be sufficient to absorb future loan losses or prevent a material adverse effect on its business, profitability or financial condition.
The core industries in our market area are manufacturing, wholesaling, paper, packaging, food production and processing, agriculture, forest products, retail, service, and businesses supporting the general building industry. The area has a broad range of diversified equipment manufacturing services related to these core industries and others. The residential and commercial real estate markets throughout these areas depend primarily on the strength of these core industries. A material decline in any of these sectors will affect the communities we serve and could negatively impact our financial results and have a negative impact on profitability.
If the communities in which we operate do not grow or if the prevailing economic conditions locally or nationally are less favorable than we have assumed, our ability to maintain our low volume of non-performing loans and other real estate owned and implement our business strategies may be adversely affected and our actual financial performance may be materially different from our projections.
Nicolet may experience increased delinquencies and credit losses, which could have a material adverse effect on our capital, financial condition, results of operations, and share price.
Our success depends to a significant extent upon the quality of our assets, particularly loans. In originating loans, there is a substantial likelihood that we will experience credit losses. The risk of loss will vary with, among other things, general economic conditions, the type of loan, the creditworthiness of the borrower over the term of the loan, and, in the case of a collateralized loan, the quality of the collateral for the loan.
Our loan customers may not repay their loans according to the terms of these loans, and the collateral securing the payment of these loans may be insufficient to assure repayment. As a result, we may experience significant loan losses, which could have a material adverse effect on our operating results. Management makes various assumptions and judgments about the collectability of our loan portfolio, including the creditworthiness of our borrowers and the value of the real estate and other assets serving as collateral for the repayment of many of our loans. We maintain an allowance for loan losses in an attempt to cover any loan losses that may occur. In determining the size of the allowance, we rely on an analysis of our loan portfolio based on historical loss experience, volume and types of loans, trends in classification, volume and trends in delinquencies and non-accruals, national and local economic conditions, and other pertinent information.
If management’s assumptions are wrong, our current allowance may not be sufficient to cover future loan losses, and we may need to make adjustments to allow for different economic conditions or adverse developments in our loan portfolio. Material additions to our allowance would materially decrease net income. We expect our allowance to continue to fluctuate; however, given current and future market conditions, we can make no assurance that our allowance will be adequate to cover future loan losses.
In addition, the market value of the real estate securing our loans as collateral continues tocould be adversely affected by the slow economy and unfavorable changes in economic conditions in our market areas and could be further adversely affected in the future.areas. As of December 31, 2014,2016, approximately 40% of our loans were secured by commercial-based real estate, 3% of loans were secured by agriculture-based real estate, and 25%26% of our loans receivable were secured by residential real estate. Any sustained period of increased payment delinquencies, foreclosures, or losses caused by adverse market and economic conditions, including another downturn in the real estate market, in our markets could adversely affect the value of our assets, revenues, results of operations, and financial condition.
| 11 |
Nicolet is subject to extensive regulation that could limit or restrict our activities, which could have a material adverse effect on our results of operations or share price.
We operate in a highly regulated industry and are subject to examination, supervision, and comprehensive regulation by various regulatory agencies. Our compliance with these regulations, including compliance with regulatory commitments, is costly and restricts certain of our activities, including the declaration and payment of cash dividends to stockholders, mergers and acquisitions, investments, loans and interest rates charged, interest rates paid on deposits, and locations of offices. We are also subject to capitalization guidelines established by our regulators, which require us to maintain adequate capital to support our growth and operations.
The laws and regulations applicable to the banking industry have recently changed and may continue to change, and we cannot predict the effects of these changes on our business and profitability. Some or all of the changes, including the new rulemaking authority granted to the newly-created CFPB, may result in greater reporting requirements, assessment fees, operational restrictions, capital requirements, and other regulatory burdens for us, and many of our competitors that are not banks or bank holding companies may remain free from such limitations. This could affect our ability to attract and maintainretain depositors, to offer competitive products and services, and to expand our business. Because government regulation greatly affects the business and financial results of all commercial banks and bank holding companies, the cost of compliance could adversely affect our ability to operate profitably.
Congress may consider additional proposals to substantially change the financial institution regulatory system and to expand or contract the powers of banking institutions, bank holding companies and bankfinancial holding companies. Such legislation may change existing banking statutes and regulations, as well as the current operating environment significantly. If enacted, such legislation could increase or decrease the cost of doing business, limit or expand our permissible activities, or affect the competitive balance among banks, savings associations, credit unions, and other financial institutions. We cannot predict whether new legislation will be enacted and, if enacted, the effect that it, or any regulations, would have on our business, financial condition, or results of operations.
Nicolet’s profitability is sensitive to changes in the interest rate environment.
As a financial institution, our earnings significantly depend on net interest income, which is the difference between the interest income that we earn on interest-earning assets, such as investment securities and loans, and the interest expense that we pay on interest-bearing liabilities, such as deposits and borrowings. Therefore, any change in general market interest rates, including changes in federal fiscal and monetary policies, affects us more than non-financial institutions and can have a significant effect on our net interest income and total income. Our assets and liabilities may react differently to changes in overall market rates or conditions because there may be mismatches between the repricing or maturity characteristics of the assets and liabilities. As a result, an increase or decrease in market interest rates could have material adverse effects on our net interest margin and results of operations.
In addition, we cannot predict whether interest rates will continue to remain at present levels, or the timing of any anticipated changes. Changes in interest rates may cause significant changes, up or down, in our net interest income. Depending on our portfolio of loans and investments, our results of operations may be adversely affected by changes in interest rates. If there is a substantial increase in interest rates, our investment portfolio is at risk of experiencing price declines that may negatively impact our total capital position through changes in other comprehensive income. In addition, any significant increase in prevailing interest rates could adversely affect our mortgage banking business because higher interest rates could cause customers to request fewer refinancingsrefinancing and purchase money mortgage originations.
We rely on other companies to provide key components of our business infrastructure.
Third party vendors provide key components of our business infrastructure such as internet connections, network access and core application processing. While we have selected these third party vendors carefully, we do not control their actions. Any problems caused by these third parties, including as a result of their not providing us their services for any reason or their performing their services poorly, could adversely affect our ability to deliver products and services to our customers and otherwise to conduct our business. Replacing these third party vendors could also entail significant delay and expense.
Negative publicity could damage our reputation.
Reputation risk, or the risk to our earnings and capital from negative public opinion, is inherent in our business. Negative public opinion could adversely affect our ability to keep and attract customers and expose us to adverse legal and regulatory consequences. Negative public opinion could result from our actual or alleged conduct in any number of activities, including lending or foreclosure practices, corporate governance, regulatory compliance, mergers and acquisitions, and disclosure, sharing or inadequate protection of customer information, and from actions taken by government regulators and community organizations in response to that conduct.
| 12 |
Competition in the banking industry is intense and Nicolet faces strong competition from larger, more established competitors.
The banking business is highly competitive, and we experience strong competition from many other financial institutions. We compete with commercial banks, credit unions, savings and loan associations, mortgage banking firms, consumer finance companies, securities brokerage firms, insurance companies, money market funds, and other financial institutions that operate in our primary market areas and elsewhere.
We compete with these institutions both in attracting deposits and in making loans. In addition, we have to attract our customer base from other existing financial institutions and from new residents. Many of our competitors are well-established, much larger financial institutions. While we believe we can and do successfully compete with these other financial institutions in its markets, we may face a competitive disadvantage as compared to large national or regional banks as a result of our smaller size and relative lack of geographic diversification.
Although we compete by concentrating our marketing efforts in our primary market area with local advertisements, personal contacts, and greater flexibility in working with local customers, we can give no assurance that this strategy will be successful.
Nicolet continually encounters technological change and we may have fewer resources than our competition to continue to invest in technological improvements; as well,improvements, and Nicolet’s information systems may experience an interruption or breach in security.
The banking and financial services industry is undergoing rapid technological changes, with frequent introductions of new technology-driven products and services. In addition to better serving customers, the effective use of technology increases efficiency and enables financial institutions to reduce costs. Our future success will depend, in part, upon our ability to address the needs of our customers by using technology to provide products and services that enhance customer convenience, as well as create additional efficiencies in operations. Many of our competitors have greater resources to invest in technological improvements, and we may not be able to effectively implement new technology-driving products and services, which could reduce our ability to effectively compete.
In addition, we rely heavily on communications and information systems to conduct our business. Any failure, interruption or breach in security of these systems could result in failures or disruptions in customer relationship management, general ledger, deposit, loan functionality and the effective operation of other systems. While we have policies and procedures designed to prevent or limit the effect of a failure, interruption or security breach of our information systems, there can be no assurance that any such failures, interruptions or security breaches will not occur or, if they do occur, that they will be adequately addressed. The occurrence of any failures, interruptions or security breaches of our information systems could damage our reputation, result in a loss of customer business, subject us to additional regulatory scrutiny, or expose us to civil litigation and possible financial liability, any of which could have a material adverse effect on our financial condition and results of operations.
Risks Related to Ownership of Nicolet’s Common Stock
Our stock price can be volatile.
Stock price volatility may make it more difficult for you to sell your common stock when you want and at prices you find attractive. Our stock price can fluctuate widely in response to a variety of factors including, among other things:
General market fluctuations, industry factors, and general economic and political conditions and events, such as economic slowdowns or recessions, interest rate changes, or credit loss trends, could also cause our stock price to decrease regardless of our operating results.
Nicolet has not historically paid dividends to our common shareholders, and we cannot guarantee that weit will pay dividends to such shareholders in the future.
The holders of our common stock receive dividends if and when declared by the Nicolet board of directors out of legally available funds. Nicolet’s board of directors has not declared a dividend on the common stock since our inception in 2000 and does not expect to do so in the foreseeable future. Any future determination relating to dividend policy will be made at the discretion of Nicolet’s board of directors and will depend on a number of factors, including the company’s future earnings, capital requirements, financial condition, future prospects, regulatory restrictions and other factors that the board of directors may deem relevant.
Our principal business operations are conducted through Nicolet Nationalthe Bank. Cash available to pay dividends to our shareholders is derived primarily, if not entirely, from dividends paid by Nicolet Nationalthe Bank. The ability of Nicolet Nationalthe Bank to pay dividends to us, as well as our ability to pay dividends to our shareholders, is subject to and limited by certain legal and regulatory restrictions.restrictions, as well as contractual restrictions related to our junior subordinated debentures. Further, any lenders making loans to us may impose financial covenants that may be more restrictive than regulatory requirements with respect to the payment of dividends by us. There can be no assurance of whether or when we may pay dividends in the future.
Nicolet may need to raise additional capital in the future including through proposed increased minimum capital thresholds established by our regulators as part of their implementation of Basel III, but that capital may not be available when it is needed or may be dilutive to our shareholders.
We are required by federal and state regulatory authorities to maintain adequate capital levels to support our operations. New regulations implementing the Basel III capital standards require financial institutions to maintain higher capital ratios and place a greater emphasis on common equity as a component of Tier 1 capital. In order to support our operations and comply with regulatory standards, we may need to raise capital in the future. Our ability to raise additional capital will depend on conditions in the capital markets at that time, which are outside our control, and on our financial performance. Accordingly, we cannot assure you of our ability to raise additional capital, if needed, on favorable terms. The capital and credit markets have experienced significant volatility in recent years. In some cases, the markets have produced downward pressure on stock prices and credit availability for certain issuers without regard to those issuers’ underlying financial strength. If current levels of volatility worsen, our ability to raise additional capital may be disrupted. If we cannot raise additional capital when needed, our results of operations and financial condition may be adversely affected, and our banking regulators may subject us to regulatory enforcement action, including receivership. In addition, the issuance of additional shares of our equity securities will dilute the economic ownership interest of our common and preferred shareholders.
Nicolet’s directors and executive officers own a significant portion of our common stock and can influence stockholdershareholder decisions.
Our directors and executive officers, as a group, beneficially owned approximately 24%14% of our fully diluted issued and outstanding common stock as of December 31, 2014.2016. As a result of their ownership, our directors and executive officers have the ability, if they voted their shares in concert, to influence the outcome of all matters submitted to our shareholders for approval, including the election of directors.
Holders of Nicolet’s subordinated debentures have rights that are senior to those of its common stockholders.
We have supported our continued growth by issuing trust preferred securities and accompanying junior subordinated debentures.debentures and by assuming the trust preferred securities and accompanying junior subordinated debentures issued by companies we have acquired. As of December 31, 2014,2016, we had outstanding trust preferred securities and associated junior subordinated debentures with an aggregate par principal amount of approximately $16.5$32.6 million.
We have unconditionally guaranteed the payment of principal and interest on our trust preferred securities. Also, the junior debentures issued to the special purpose trusts that relate to those trust preferred securities are senior to our common stock. As a result, we must make payments on the junior subordinated debentures before we can pay any
| 14 |
Because Nicolet is a regulated bank holding company, your ability to obtain “control” or to act in concert with others to obtain control over Nicolet without the prior consent of the Federal Reserve or other applicable bank regulatory authorities is limited and may subject you to regulatory oversight.
Nicolet is a bank holding company and, as such, is subject to significant regulation of its business and operations. In addition, under the provisions of the Bank Holding Company Act and the Change in Bank Control Act, certain regulatory provisions may become applicable to individuals or groups who are deemed by the regulatory authorities to “control” Nicolet or our subsidiary bank. The Federal Reserve and other bank regulatory authorities have very broad interpretive discretion in this regard and it is possible that the Federal Reserve or some other bank regulatory authority may, whether through a merger or through subsequent acquisition of Nicolet’s shares, deem one or more of Nicolet’s shareholders to control or to be acting in concert for purposes of gaining or exerting control over Nicolet. Such a determination may require a shareholder or group of shareholders, among other things, to make voluminous regulatory filings under the Change in Bank Control Act, including disclosure to the regulatory authorities of significant amounts of confidential personal or corporate financial information. In addition, certain groups or entities may also be required to either register as a bank holding company under the Bank Holding Company Act, becoming themselves subject to regulation by the Federal Reserve under that Act and the rules and regulations promulgated thereunder, which may include requirements to materially limit other operations or divest other business concerns, or to divest immediately their investments in Nicolet.
In addition, these limitations on the acquisition of our stock may generally serve to reduce the potential acquirers of our stock or to reduce the volume of our stock that any potential acquirer may be able to acquire. These restrictions may serve to generally limit the liquidity of our stock and, consequently, may adversely affect its value.
We are an emerging growth company and we cannot be certain if the reduced disclosure requirements applicable to emerging growth companies will make our common stock less attractive.
We are an “emerging growth company,” as defined in the Jumpstart Our Business Startups Act of 2012 (the “JOBS Act”), and we have taken advantage of certain exemptions from various reporting requirements that are applicable to other public companies that are not emerging growth companies, including, but not limited to, reduced disclosure obligations regarding executive compensation in our periodic reports and proxy statements, and exemptions from the requirements of holding a nonbinding advisory vote on executive compensation and shareholder approval of any golden parachute payments not previously approved. In addition, even if we comply with the greater obligations of public companies that are not emerging growth companies, we may avail ourselves of the reduced requirements applicable to emerging growth companies from time to time in the future, so long as we are an emerging growth company. We will remain an emerging growth company for up to five years following the first sale of our common stock pursuant to an effective registration statement filed under the Securities Act, though we may cease to be an emerging growth company earlier under certain circumstances, including if, before the end of such five years, we are deemed to be a large accelerated filer under the rules of the SEC (which depends on, among other things, having a market value of common stock held by non-affiliates in excess of $700 million) or if our total annual gross revenues equal or exceed $1 billion in a fiscal year. We cannot predict if investors will find our common stock less attractive because we will rely on these exemptions. If some investors find our common stock less attractive as a result, there may be a less active trading market for our common stock and our stock price may be more volatile.
Nicolet’s securities are not FDIC insured.
Our securities are not savings or deposit accounts or other obligations of Nicolet Nationalthe Bank, and are not insured by the Deposit Insurance Fund, or any other agency or private entity and are subject to investment risk, including the possible loss of some or all of the value of your investment.
| 15 |
ITEM 1B. UNRESOLVED STAFF COMMENTS
None.
| ITEM 2. | PROPERTIES |
The corporate headquarters of both Nicolet and Nicolet Nationalthe Bank is located at 111 North Washington Street, Green Bay, Wisconsin. IncludingAt year-end 2016, including the main office, Nicolet Nationalthe Bank operates 23 owned or leasedoperated 36 bank branch locations, noted below, most28 of which are owned and eight that are leased. In addition, we have one leased location solely related to Nicolet Advisory. Most of the offices are free-standing, newer buildings that provide adequate access, customer parking, and drive-through and/or ATM services. The properties are in good condition and considered adequate for present and near term requirements. In addition, Nicolet owns or leases other real property that, when considered in aggregate, is not significant to its financial position. No property listed below asNone of the owned isproperties are subject to a mortgage or similar encumbrance.
Four of the leased locations involve related parties.directors, executive officers, or direct relatives of a director or executive officer, each with lease terms that management considers arms-length. For additional disclosure, see Note 15,17, “Related Party Transactions,” of the Notes to Consolidated Financial Statements under Part II, Item 8.
During the fourth quarter of 2016, six bank branch locations were closed and are not included in the numbers above. An additional two branch locations are expected to be closed in March 2017.
| ITEM 3. | LEGAL PROCEEDINGS |
We and our subsidiaries may be involved from time to time in various routine legal proceedings incidental to our respective businesses. Neither we nor any of our subsidiaries are currently engaged in any legal proceedings that are expected to have a material adverse effect on our results of operations or financial position.
| ITEM 4. | MINE SAFETY DISCLOSURES |
Not applicable.
| 16 |
| ITEM 5. | MARKET FOR THE REGISTRANT’S COMMON EQUITY, RELATED STOCKHOLDER MATTERS AND ISSUER PURCHASES OF EQUITY SECURITIES |
Nicolet registered its common stock under Section 12(b) of the Exchange Act on February 24, 2016, in connection with listing on the Nasdaq Capital Market, and trades under the symbol “NCBS”. Prior to February 24, 2016, Nicolet’s common stock iswas traded on the Over-The-Counter Markets (“OTCQB”OTCBB”), also under the symbol “NCBS”. The common stock was authorized to commence trading on the OTCQB on April 26, 2013, with the first trade completed on May 12, 2013. Prior to such trading, there was no established market forvolume of Nicolet’s common stock. Although the common stock is currently traded on the OTCQB, the trading volume is less than that of banks with larger market capitalizations.capitalizations, even though Nicolet has improved accessibility to its common stock first through the OTCBB and more recently through its listing on Nasdaq. As of February 28, 2015,2017, Nicolet had approximately 6602,400 shareholders of record.
The following table sets forth the high and low sales prices (beginning February 24, 2016) or the high and low bid prices (prior to February 24, 2016) and quarter end closing prices of Nicolet’s common stock as reported by Nasdaq and the OTCQBOTCBB for the periods indicated on or after April 26, 2013. High and low prices noted for the periods prior to April 26, 2013 represent sales prices for the common stock, to the extent known by management.
For The Quarter Ended | ||||||||||||
| High Bid Prices | Low Bid Prices | Closing Sales Prices | ||||||||||
| December 31, 2014 | $ | 25.00 | $ | 23.10 | $ | 25.00 | ||||||
| September 30, 2014 | 24.74 | 22.35 | 23.20 | |||||||||
| June 30, 2014 | 27.25 | 19.05 | 24.55 | |||||||||
| March 31, 2014 | 19.44 | 16.51 | 19.44 | |||||||||
| December 31, 2013 | $ | 17.00 | $ | 15.71 | $ | 16.54 | ||||||
| September 30, 2013 | 17.00 | 15.77 | 16.51 | |||||||||
| June 30, 2013 | 17.50 | 15.80 | 16.50 | |||||||||
| March 31, 2013 | 16.50 | 16.50 | 16.50 | |||||||||
For The Quarter Ended
| High Sales/Bid Prices | Low Sales/ Bid Prices | Closing Sales Prices | ||||||||||
| December 31, 2016 | $ | 48.00 | $ | 37.21 | $ | 47.69 | ||||||
| September 30, 2016 | 39.91 | 35.63 | 38.35 | |||||||||
| June 30, 2016 | 47.00 | 33.72 | 38.08 | |||||||||
| March 31, 2016 | 38.91 | 30.51 | 38.85 | |||||||||
| December 31, 2015 | $ | 32.49 | $ | 30.60 | $ | 31.79 | ||||||
| September 30, 2015 | 34.75 | 30.80 | 32.00 | |||||||||
| June 30, 2015 | 31.50 | 27.00 | 30.80 | |||||||||
| March 31, 2015 | 27.50 | 25.00 | 27.50 | |||||||||
Nicolet has not paid dividends on its common stock since its inception in 2000, nor does it currently have any plans to pay dividends on Nicolet common stock in the foreseeable future. Any cash dividends paid by Nicolet on its common stock must comply with applicable Federal Reserve policies and with certain contractual limitations on the payment of dividends related to the SBLF, both described further in “Business—Regulation of Nicolet—Dividend Restrictions.” Nicolet NationalThe Bank is also subject to regulatory restrictions on the amount of dividends it is permitted to pay to Nicolet as further described in “Business—Regulation of Nicolet Nationalthe Bank – Payment of Dividends” and in Note 17,19, “Regulatory Capital Requirements and Restrictions onof Dividends,” in the Notes to Consolidated Financial Statements under Part II, Item 8.
Following are Nicolet’s monthly common stock purchases during the fourth quarter of 2016.
| Total Number of Shares Purchased | Average Price Paid per Share | Total Number of Shares Purchased as Part of Publicly Announced Plans or Programs | Maximum Number of Shares that May Yet Be Purchased Under the Plans or Programs | |||||||||||||
| (#) | ($) | (#) | (#) | |||||||||||||
| Period | ||||||||||||||||
| October 1 – October 31, 2016 | 52,485 | $ | 38.82 | 48,687 | 281,000 | |||||||||||
| November 1– November 30, 2016 | 3,070 | $ | 42.73 | — | 281,000 | |||||||||||
| December 1 – December 31, 2016 | — | — | — | 281,000 | ||||||||||||
| Total | 55,555 | $ | 39.03 | 48,687 | 281,000 | |||||||||||
(a) During the fourth quarter of 2016, the Company repurchased 4,198 and 2,340 shares for minimum tax withholding settlements on restricted stock and net settlements of stock options, respectively. These purchases do not count against the maximum number of shares that may yet be purchased under the board of directors approveddirectors’ authorization.
(b) During early 2014, a resolution authorizing acommon stock repurchase program whereby Nicolet may utilizewas approved which authorized, with subsequent modifications through January 2017, the use of up to $12$30 million to purchaserepurchase up to 625,0001,050,000 shares of its outstanding common stock. The common stock from time to time in the open market or block transactions as market conditions warrant or in private transactions. Through December 31, 2014, $5.6repurchase program has no expiration date. During 2016 and 2015, Nicolet spent $4.4 million was usedand $4.2 million to repurchase and cancel 257,291114,914 and 146,404 shares, respectively, at a weighted average price per share of $37.98 and $28.35, respectively, including commissions. Since the commencement of the common stock repurchase program through December 31, 2016, Nicolet has used $14.2 million to repurchase and cancel 518,609 shares at a weighted average price of $21.95 per share of $27.31 including commissions. Given the pending merger with First Menasha, Nicolet has suspended its repurchase program.
| 17 |
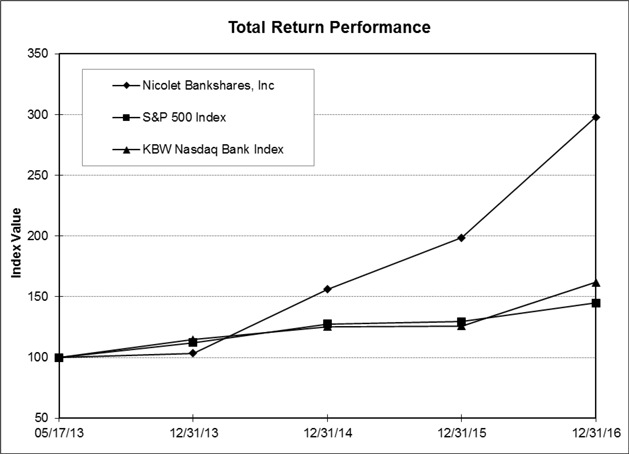
Performance Graph
The following graph shows the cumulative stockholder return on our common stock for the period of May 17, 2013 to December 31, 2016, compared with the KBW NASDAQ Bank Index and the S&P 500 Index. The graph assumes a $100 investment on May 17, 2013, the date Nicolet began trading on the OTCBB.
| Period Ending | |||||
| Index | 05/17/13 | 12/31/13 | 12/31/14 | 12/31/15 | 12/31/16 |
| Nicolet Bankshares, Inc. | 100.00 | 103.38 | 156.25 | 198.69 | 298.06 |
| S&P 500 Index | 100.00 | 112.30 | 127.67 | 129.43 | 144.91 |
| KBW Nasdaq Bank Index | 100.00 | 114.66 | 125.40 | 126.02 | 161.95 |
| ITEM 6. | SELECTED FINANCIAL DATA |
The selected consolidated financial data presented as of December 31, 20142016 and 20132015 and for each of the years in the two-yearthree-year period ended December 31, 20142016 is derived from the audited consolidated financial statements and related notes included in this report and should be read in conjunction with “Management’s Discussion and Analysis of Financial Condition and Results of Operations.” The selected consolidated financial data as of December 31, 2012, 2011 and 2010for all other periods shown is derived from audited consolidated financial statements that are not required to be included in this report.
| 18 |
EARNINGS SUMMARY AND SELECTED FINANCIAL DATA
| (In thousands, except per share data) | At and for the year ended December 31, | |||||||||||||||||||
| 2016 | 2015 | 2014 | 2013 | 2012 | ||||||||||||||||
| Results of operations: | ||||||||||||||||||||
| Interest income | $ | 75,467 | $ | 48,597 | $ | 48,949 | $ | 43,196 | $ | 28,795 | ||||||||||
| Interest expense | 7,334 | 7,213 | 7,067 | 6,292 | 6,530 | |||||||||||||||
| Net interest income | 68,133 | 41,384 | 41,882 | 36,904 | 22,265 | |||||||||||||||
| Provision for loan losses | 1,800 | 1,800 | 2,700 | 6,200 | 4,325 | |||||||||||||||
| Net interest income after provision for loan losses | 66,333 | 39,584 | 39,182 | 30,704 | 17,940 | |||||||||||||||
| Other income | 26,674 | 17,708 | 14,185 | 25,736 | 10,744 | |||||||||||||||
| Other expense | 64,942 | 39,648 | 38,709 | 36,431 | 24,062 | |||||||||||||||
| Income before income taxes | 28,065 | 17,644 | 14,658 | 20,009 | 4,622 | |||||||||||||||
| Income tax expense | 9,371 | 6,089 | 4,607 | 3,837 | 1,529 | |||||||||||||||
| Net income | 18,694 | 11,555 | 10,051 | 16,172 | 3,093 | |||||||||||||||
| Net income attributable to noncontrolling interest | 232 | 127 | 102 | 31 | 57 | |||||||||||||||
| Net income attributable to Nicolet Bankshares, Inc. | 18,462 | 11,428 | 9,949 | 16,141 | 3,036 | |||||||||||||||
| Preferred stock dividends and discount accretion | 633 | 212 | 244 | 976 | 1,220 | |||||||||||||||
| Net income available to common shareholders | $ | 17,829 | $ | 11,216 | $ | 9,705 | $ | 15,165 | $ | 1,816 | ||||||||||
| Earnings per common share: | ||||||||||||||||||||
| Basic | $ | 2.49 | $ | 2.80 | $ | 2.33 | $ | 3.81 | $ | 0.53 | ||||||||||
| Diluted | 2.37 | 2.57 | 2.25 | 3.80 | 0.53 | |||||||||||||||
| Weighted average common shares outstanding: | ||||||||||||||||||||
| Basic | 7,158 | 4,004 | 4,165 | 3,977 | 3,440 | |||||||||||||||
| Diluted | 7,514 | 4,362 | 4,311 | 3,988 | 3,442 | |||||||||||||||
| Year-End Balances: | ||||||||||||||||||||
| Loans | $ | 1,568,907 | $ | 877,061 | $ | 883,341 | $ | 847,358 | $ | 552,601 | ||||||||||
| Allowance for loan losses | 11,820 | 10,307 | 9,288 | 9,232 | 7,120 | |||||||||||||||
| Investment securities available for sale, at fair value | 365,287 | 172,596 | 168,475 | 127,515 | 55,901 | |||||||||||||||
| Total assets | 2,300,879 | 1,214,439 | 1,215,285 | 1,198,803 | 745,255 | |||||||||||||||
| Deposits | 1,969,986 | 1,056,417 | 1,059,903 | 1,034,834 | 616,093 | |||||||||||||||
| Other debt | 1,000 | 15,412 | 21,175 | 39,538 | 39,190 | |||||||||||||||
| Junior subordinated debentures | 24,732 | 12,527 | 12,328 | 12,128 | 6,186 | |||||||||||||||
| Subordinated notes | 11,885 | 11,849 | - | - | - | |||||||||||||||
| Common equity | 275,947 | 97,301 | 86,608 | 80,462 | 52,933 | |||||||||||||||
| Stockholders’ equity | 275,947 | 109,501 | 111,008 | 104,862 | 77,333 | |||||||||||||||
| Book value per common share | 32.26 | 23.42 | 21.34 | 18.97 | 15.45 | |||||||||||||||
| Average Balances: | ||||||||||||||||||||
| Loans | $ | 1,346,304 | $ | 883,904 | $ | 859,256 | $ | 753,284 | $ | 521,209 | ||||||||||
| Interest-earning assets | 1,723,600 | 1,083,967 | 1,084,408 | 913,104 | 614,252 | |||||||||||||||
| Total assets | 1,934,770 | 1,185,921 | 1,191,348 | 997,372 | 674,222 | |||||||||||||||
| Deposits | 1,641,894 | 1,021,155 | 1,028,336 | 830,884 | 545,896 | |||||||||||||||
| Interest-bearing liabilities | 1,307,471 | 851,957 | 892,872 | 756,606 | 511,572 | |||||||||||||||
| Common equity | 217,432 | 90,787 | 84,033 | 70,737 | 52,135 | |||||||||||||||
| Stockholders’ equity | 226,265 | 112,012 | 108,433 | 95,137 | 76,535 | |||||||||||||||
| Financial Ratios: | ||||||||||||||||||||
| Return on average assets | 0.95 | % | 0.96 | % | 0.84 | % | 1.62 | % | 0.45 | % | ||||||||||
| Return on average equity | 8.16 | % | 10.20 | % | 9.18 | % | 16.97 | % | 3.97 | % | ||||||||||
| Return on average common equity | 8.20 | % | 12.35 | % | 11.55 | % | 21.44 | % | 3.48 | % | ||||||||||
| Average equity to average assets | 11.69 | % | 9.45 | % | 9.10 | % | 9.54 | % | 11.35 | % | ||||||||||
| Net interest margin | 4.01 | % | 3.88 | % | 3.89 | % | 4.06 | % | 3.67 | % | ||||||||||
| Stockholders’ equity to assets | 11.99 | % | 9.02 | % | 9.13 | % | 8.75 | % | 10.38 | % | ||||||||||
| Net loan charge-offs to average loans | 0.02 | % | 0.09 | % | 0.31 | % | 0.54 | % | 0.60 | % | ||||||||||
| Nonperforming loans to total loans | 1.29 | % | 0.40 | % | 0.61 | % | 1.21 | % | 1.27 | % | ||||||||||
| Nonperforming assets to total assets | 0.97 | % | 0.32 | % | 0.61 | % | 1.02 | % | 0.97 | % | ||||||||||
| 19 |
| EARNINGS SUMMARY AND SELECTED FINANCIAL DATA | ||||||||||||||||||||
| (In thousands, except per share data) | At and for the year ended December 31, | |||||||||||||||||||
| 2014 | 2013 | 2012 | 2011 | 2010 | ||||||||||||||||
| Results of operations: | ||||||||||||||||||||
| Interest income | $ | 48,949 | $ | 43,196 | $ | 28,795 | $ | 29,830 | $ | 31,420 | ||||||||||
| Interest expense | 7,067 | 6,292 | 6,530 | 8,383 | 11,291 | |||||||||||||||
| Net interest income | 41,882 | 36,904 | 22,265 | 21,447 | 20,129 | |||||||||||||||
| Provision for loan losses | 2,700 | 6,200 | 4,325 | 6,600 | 8,500 | |||||||||||||||
| Net interest income after provision for loan losses | 39,182 | 30,704 | 17,940 | 14,847 | 11,629 | |||||||||||||||
| Other income | 14,185 | 25,736 | 10,744 | 8,444 | 8,968 | |||||||||||||||
| Other expense | 38,709 | 36,431 | 24,062 | 21,443 | 19,316 | |||||||||||||||
| Income before income taxes | 14,658 | 20,009 | 4,622 | 1,848 | 1,281 | |||||||||||||||
| Income tax expense | 4,607 | 3,837 | 1,529 | 318 | 136 | |||||||||||||||
| Net income | 10,051 | 16,172 | 3,093 | 1,530 | 1,145 | |||||||||||||||
| Net income attributable to noncontrolling interest | 102 | 31 | 57 | 40 | 35 | |||||||||||||||
| Net income attributable to Nicolet Bankshares, Inc. | 9,949 | 16,141 | 3,036 | 1,490 | 1,110 | |||||||||||||||
| Preferred stock dividends and discount accretion | 244 | 976 | 1,220 | 1,461 | 985 | |||||||||||||||
| Net income available to common equity | $ | 9,705 | $ | 15,165 | $ | 1,816 | $ | 29 | $ | 125 | ||||||||||
| Earnings per common share: | ||||||||||||||||||||
| Basic | $ | 2.33 | $ | 3.81 | $ | 0.53 | $ | 0.01 | $ | 0.04 | ||||||||||
| Diluted | 2.25 | 3.80 | 0.53 | 0.01 | 0.04 | |||||||||||||||
| Weighted average common shares outstanding: | ||||||||||||||||||||
| Basic | 4,165 | 3,977 | 3,440 | 3,469 | 3,452 | |||||||||||||||
| Diluted | 4,311 | 3,988 | 3,442 | 3,488 | 3,481 | |||||||||||||||
| Year-End Balances: | ||||||||||||||||||||
| Loans | $ | 883,341 | $ | 847,358 | $ | 552,601 | $ | 472,489 | $ | 513,761 | ||||||||||
| Allowance for loan losses | 9,288 | 9,232 | 7,120 | 5,899 | 8,635 | |||||||||||||||
| Investment securities available for sale, at fair value | 168,475 | 127,515 | 55,901 | 56,759 | 52,388 | |||||||||||||||
| Total assets | 1,215,285 | 1,198,803 | 745,255 | 678,249 | 674,754 | |||||||||||||||
| Deposits | 1,059,903 | 1,034,834 | 616,093 | 551,536 | 558,464 | |||||||||||||||
| Other debt | 21,175 | 39,538 | 39,190 | 39,506 | 39,972 | |||||||||||||||
| Junior subordinated debentures | 12,328 | 12,128 | 6,186 | 6,186 | 6,186 | |||||||||||||||
| Common equity | 86,608 | 80,462 | 52,933 | 51,623 | 50,417 | |||||||||||||||
| Stockholders’ equity | 111,008 | 104,862 | 77,333 | 76,023 | 65,620 | |||||||||||||||
| Book value per common share | 21.34 | 18.97 | 15.45 | 14.83 | 14.57 | |||||||||||||||
| Average Balances: | ||||||||||||||||||||
| Loans | $ | 859,256 | $ | 753,284 | $ | 521,209 | $ | 503,362 | $ | 499,193 | ||||||||||
| Interest-earning assets | 1,084,408 | 913,104 | 614,252 | 582,486 | 603,182 | |||||||||||||||
| Total assets | 1,191,348 | 997,372 | 674,222 | 642,353 | 653,710 | |||||||||||||||
| Deposits | 1,028,336 | 830,884 | 545,896 | 522,297 | 530,682 | |||||||||||||||
| Interest-bearing liabilities | 892,872 | 756,606 | 511,572 | 500,895 | 524,461 | |||||||||||||||
| Common equity | 84,033 | 70,737 | 52,135 | 50,968 | 51,661 | |||||||||||||||
| Stockholders’ equity | 108,433 | 95,137 | 76,535 | 69,284 | 66,923 | |||||||||||||||
| Financial Ratios: | ||||||||||||||||||||
| Return on average assets | 0.84 | % | 1.62 | % | 0.45 | % | 0.23 | % | 0.17 | % | ||||||||||
| Return on average equity | 9.18 | % | 16.97 | % | 3.97 | % | 2.15 | % | 1.66 | % | ||||||||||
| Return on average common equity | 11.55 | % | 21.44 | % | 3.48 | % | 0.06 | % | 0.24 | % | ||||||||||
| Average equity to average assets | 9.10 | % | 9.54 | % | 11.35 | % | 10.79 | % | 10.22 | % | ||||||||||
| Net interest margin | 3.89 | % | 4.06 | % | 3.67 | % | 3.75 | % | 3.39 | % | ||||||||||
| Stockholders’ equity to assets | 9.13 | % | 8.75 | % | 10.38 | % | 11.21 | % | 9.73 | % | ||||||||||
| Net loan charge-offs to average loans | 0.31 | % | 0.54 | % | 0.60 | % | 1.85 | % | 1.22 | % | ||||||||||
| Nonperforming loans to total loans | 0.61 | % | 1.21 | % | 1.27 | % | 2.01 | % | 2.10 | % | ||||||||||
| Nonperforming assets to total assets | 0.61 | % | 1.02 | % | 0.97 | % | 1.49 | % | 1.81 | % | ||||||||||
| ITEM 7. | MANAGEMENT’S DISCUSSION AND ANALYSIS OF FINANCIAL CONDITION AND RESULTS OF OPERATION |
The following discussion is management’s analysis to assist in the understanding and evaluation of the consolidated financial condition and results of operations of Nicolet. It should be read in conjunction with the consolidated financial statements and footnotes and the selected financial data presented elsewhere in this report.
The detailed financial discussion that follows focuses on 20142016 results compared to 2013.2015. See “2015 Compared to 2014” for the summary comparing 2015 and 2014 results. Some tabular information is shown for trends of three years or for five years as required under SEC regulations.
Overview
Nicolet is a bank holding company headquartered in Green Bay, Wisconsin, providing a diversified range of traditional commercial and retail banking services, as well as wealth management services, to individuals, business owners, and businesses in its market area primarily through, as of year-end 2016, the 2336 bank branch offices of its banking subsidiary, Nicolet Nationalthe Bank, located within 1011 Wisconsin counties (Brown, Door, Outagamie, Kewaunee, Marinette, Taylor, Clark, Marathon, Oneida, Price Vilas and Eau Claire)Vilas) and in Menominee, Michigan.
Nicolet’s primary revenue sources are net interest income, representing interest income from loans and other interest earninginterest-earning assets such as investments, less interest expense on deposits and other borrowings, and noninterest income, including, among others, trust and brokerage fees, service charges on deposit accounts, secondary mortgage income and other fees or revenue from financial services provided to customers or ancillary to loans and deposits. Business volumes and pricing drive revenue potential and tend to be influenced by overall economic factors, including market interest rates, business spending, consumer confidence, economic growth and competitive conditions within the marketplace.
As previously noted in Item 1, Business, Nicolet has used acquisitions as part of its growth strategy. Nicolet’s 2016 acquisitions (described in detail in Note 2, “Acquisitions,” of the Notes to Consolidated Financial Statements under Part II, Item 8) included the transformative stock-for-stock merger with Baylake (announced in September 2015 and consummated on April 29, 2016) which nearly doubled the size of the Bank, provided opportunity for economies of scale, and added Door County and Kewaunee County to the footprint. On April 1, 2016, Nicolet completed a smaller but strategically important transaction to hire a select group of financial advisors and to purchase their respective books of business and operating platform, enhancing the leadership and growth of the wealth management business. In November 2016 Nicolet signed a definitive merger agreement with First Menasha; this acquisition, subject to First Menasha shareholder approval, regulatory approvals and other customary closing conditions, is expected to close in April of 2017 and would position Nicolet as the lead-local community bank in the Fox Valley area of Wisconsin.
2016 was a year for continued execution on growth, capital management and performance. At December 31, 2014, total2016, Nicolet had assets were $1.2of $2.3 billion, up only 1% over year end 2013, but with an improved asset mix. Since year end 2013, loans grew 4% to $883 million (predominantly in commercial and industrial loans and lines of credit) and securities available for sale grew 32% to $168 million, both funded mainly by higher$1.6 billion, deposits which grew 2% to $1.06of $2.0 billion and continued deploymenttotal stockholders’ equity of cash.$276 million, representing increases over December 31, 2015 of 89%, 79%, 86% and 152%, in assets, loans, deposits and total equity, respectively. This balance sheet growth was predominantly attributable to the merger with Baylake, which added assets of $1.0 billion, loans of $0.7 billion, deposits of $0.8 billion, core deposit intangible of $17 million and goodwill of $66 million (as of the consummation date and based on estimated fair values), for a total purchase price of $164 million, including the issuance of 4.3 million shares of Nicolet common stock and assumption of outstanding Baylake equity awards. Asset quality wasremained strong, despite some elevation in nonperforming assets resulting from assets acquired in the Baylake merger, with net charge offs to average loans of 0.31%0.02% for 20142016 and nonperforming assets to assets of 0.61%0.97% at December 31, 2014,2016, reflecting successfuldiligent integration of acquired loans acquiredand continuing sound credit practices. Common equity increased in 2016 predominantly from new equity issued in the 2016 acquisitions. Nicolet redeemed $12.2 million (half) of its 2013 acquisitionsoutstanding preferred stock in September 2015 and the ongoing strengthremaining half in September 2016, as part of its capital plan and partially motivated by the adjustment of the core loan portfoliopreferred stock dividend rate from 1% to 9% effective March 1, 2016. Nicolet also repurchased $4.4 million of common stock in 2016 under its common stock repurchase program. As further capital management, Nicolet closed seven branches in 2016 that were in close proximity to other Nicolet branches, one concurrent with the Baylake merger, one in October and credit practices.five in December 2016.
Net income attributable to Nicolet was $18.5 million for 2016, 62% higher than 2015, and after preferred stock dividends, diluted earnings per common share was $2.37, compared to $2.57 for 2015. The 8% decline in diluted earnings per share was largely attributable to the 72% increase in diluted weighted average shares and higher preferred stock dividends ($0.6 million for 2016 versus $0.2 million for 2015). Return on average assets of 0.84%0.95% and return on average common equity of 11.55% indicates solid8.20% for 2016, reflect favorable performance traction in 2014. As partlight of its capital management, Nicolet beganabsorbing merger and has been executing on a common stock repurchase program in 2014. For 2015, Nicolet remains focused on organic loan growth, comprehensive balance sheet managementintegration costs and revenue maximization in its markets, and continues to evaluate acquisition opportunities for strategic growth.new shares from the 2016 acquisitions.
| 20 |
Evaluation of financial performance and average balances between 20142016 and 2013 will be2015 was impacted in general from the timing of Nicolet’s 2013 acquisition ofthe two distressed financial institutions –2016 acquisitions. Since the predominantly stock-for-stock merger with Mid-Wisconsin consummated in April 2013balances and the smaller FDIC-assisted acquisition of Bank of Wausau completed in August 2013 (collectively the “2013 acquisitions”). Combined, as of their respective acquisition dates, these transactions added 12 branch locations to Nicolet’s footprint and approximately $483 million in assets, $284 million in loans and $388 million in deposits. Since the results of operations of boththe acquired entities prior to consummation are appropriately not included in the accompanying consolidated financial statements until their consummation dates, income statement results and average balances for 2013 include2016 included partial yearperiod contributions from the 20132016 acquisitions versus a full yearno contribution in 2014. Notably, 2013 includes2015. The inclusion of the Baylake balance sheet (at about 83% of Nicolet’s pre-merger asset size) and operational results for approximately 8eight months in 2016 analytically explains most of Mid-Wisconsin operations and 5 months of Bank of Wausau operations, which analytically could reasonably explain roughly 20% increasesthe increase in certain average balances and income statement linesline items between 20142016 and 2013;2015, while the financial advisory business acquisition primarily impacts the brokerage fee income, personnel expense and as well,certain other expense line items. In addition, the 20132016 acquisitions recorded $11.9 millionand the pending First Menasha transaction impacted pre-tax net income by inclusion of non-recurring bargain purchase gains and $1.9 million of direct pre-tax merger expenses which net after tax contributed $9.7of approximately $0.8 million in 2015 ($0.1 million in third quarter and $0.7 million in fourth quarter), and $1.3 million in 2016 ($0.4 million, $0.4 million, $0.1 million and $0.4 million in first through fourth quarters, respectively), along with a $1.7 million lease termination charge in second quarter 2016 related to 2013’s $16.1 million net income.a Nicolet branch closed concurrent with the Baylake merger.
For 2017, Nicolet’s focus will remain on the consummation and integration of its pending First Menasha acquisition, efficiencies from increased scale, and organic growth in our expanded markets and in brokerage services. The First Menasha transaction is a cash and stock transaction, subject to proration procedures and other terms and limitations as outlined in the definitive merger agreement. It is on target for an April 2017 consummation subject to customary closing conditions, including approvals by regulators and by First Menasha shareholders. Based upon the financial results as of December 31, 2016, the combined company would have approximately $2.8 billion in assets, $1.9 billion in loans and $2.4 billion in deposits, prior to any purchase accounting fair value marks. Appropriately, the transaction will not be included in Nicolet’s financial position or financial results until its consummation date in 2017. At year-end 2016 Nicolet had plans to close three of its branches in 2017, two in March (one outlier branch and one in close proximity to another Nicolet branch) and one concurrent upon consummation of the pending First Menasha transaction (which will bring in five new branch locations).
| 21 |
Performance Summary
Net income attributable to Nicolet was $9.9$18.5 million for 2014,2016, and after $0.6 million of preferred stock dividends, net income available to common shareholders was $17.9 million, or $2.37 per diluted common share. Comparatively, 2015 net income attributable to Nicolet was $11.4 million, and after $0.2 million of preferred stock dividends, net income available to common shareholders was $9.7$11.2 million or $2.25$2.57 per diluted common share. Comparatively, 2013Between the years, net income increased 62%, predominantly due to inclusion of results from the 2016 acquisitions, and diluted earnings per common share decreased 8%, largely attributable to a 72% increase in diluted weighted average shares and higher preferred stock dividends. Return on average assets was $16.1 million,0.95% and after $1.0 million0.96% for 2016 and 2015, respectively, while return on average common equity was 8.20% for 2016 and 12.35% for 2015, with the 2016 ratios absorbing higher merger and integration costs and new shares from the 2016 acquisitions. Book value per common share was $32.26 at December 31, 2016, up 38% over $23.42 at December 31, 2015. Affecting total capital and the amount of preferred stock dividends net income available to common shareholders was $15.1 million or $3.80 per diluted common share for 2013. As noted above,between the 2013 acquisitions impacted 2013 net income most directly from inclusionyears were the rate on and amount of non-recurring bargain purchase gains and direct merger expenses, which after tax accounted for $9.7 million ofpreferred stock outstanding. Beginning March 1, 2016, the $16.1 million net income in 2013. Beginning in the fourth quarter of 2013 Nicolet qualified for a 1% annual dividend rate on its preferred stock issuedmoved from 1% to 9% in accordance with contractual terms. In advance of such increase, Nicolet redeemed $12.2 million (half) of its then outstanding preferred stock in September 2015 and redeemed the Treasury relatedremaining half in September 2016, eliminating preferred stock and preferred dividends going forward.
As previously noted under the Overview section, the timing of the 2016 Baylake merger analytically explains most of the increase in certain average balances and income statement line items, while the timing of the financial advisors acquisition mostly impacts brokerage fee income, personnel expense and certain other expense between 2016 and 2015.
Net Interest Income
Net interest income in the consolidated statements of income (which excludes any taxable equivalent adjustments) was $41.9$68.1 million in 2014,2016, up 13%64.6% compared to $36.9$41.4 million in 2013.2015. Taxable equivalent adjustments (adjustments to bring tax-exempt interest to a level that would yield the same after-tax income had that been subject to a 34% tax rate) were $795,000$1.9 million for 20142016 and $608,000$1.1 million for 2013,2015, resulting in taxable equivalent net interest income of $42.7$70.0 million for 20142016 and $37.5$42.5 million for 2013.
Taxable equivalent net interest income is a non-GAAP measure, but is a preferred industry measurement of net interest income (and its use in calculating a net interest margin) as it enhances the comparability of net interest income arising from taxable and tax-exempt sources.
Net interest income is the primary source of Nicolet’s revenue, and is the difference between interest income on earning assets, such as loans and investment securities, and interest expense on interest-bearing liabilities, such as deposits and other borrowings. Net interest income is directly impacted by the sensitivity of the balance sheet to changes in interest rates and by the amount, mix and composition of interest earninginterest-earning assets and interest-bearing liabilities, including characteristics such as the fixed or variable nature of the financial instruments, contractual maturities, and repricing frequencies.
Tables 1, 2, and 3 present information to facilitate the review and discussion of selected average balance sheet items, taxable equivalent net interest income, interest rate spread and net interest margin.
| 23 |
Table 1: Average Balance Sheet and Net Interest Income Analysis — Taxable-Equivalent Basis
(dollars in thousands)
| Years Ended December 31, | ||||||||||||||||||||||||||||||||||||
| 2016 | 2015 | 2014 | ||||||||||||||||||||||||||||||||||
| Average Balance | Interest | Average Rate | Average Balance | Interest | Average Rate | Average Balance | Interest | Average Rate | ||||||||||||||||||||||||||||
| ASSETS | ||||||||||||||||||||||||||||||||||||
| Earning assets | ||||||||||||||||||||||||||||||||||||
| Loans (1)(2)(3) | $ | 1,346,304 | $ | 69,687 | 5.11 | % | $ | 883,904 | $ | 45,745 | 5.12 | % | $ | 859,256 | $ | 46,206 | 5.32 | % | ||||||||||||||||||
| Investment securities | ||||||||||||||||||||||||||||||||||||
| Taxable | 159,421 | 3,029 | 1.90 | % | 75,069 | 1,460 | 1.94 | % | 83,692 | 1,606 | 1.92 | % | ||||||||||||||||||||||||
| Tax-exempt (2) | 131,250 | 3,292 | 2.51 | % | 87,609 | 2,083 | 2.38 | % | 55,678 | 1,463 | 2.63 | % | ||||||||||||||||||||||||
| Other interest-earning assets | 86,625 | 1,327 | 1.53 | % | 37,385 | 443 | 1.18 | % | 85,782 | 469 | 0.55 | % | ||||||||||||||||||||||||
| Total interest-earning assets | 1,723,600 | $ | 77,335 | 4.44 | % | 1,083,967 | $ | 49,731 | 4.54 | % | 1,084,408 | $ | 49,744 | 4.54 | % | |||||||||||||||||||||
| Cash and due from banks | 40,474 | 25,172 | 39,954 | |||||||||||||||||||||||||||||||||
| Other assets | 170,696 | 76,782 | 66,986 | |||||||||||||||||||||||||||||||||
| Total assets | $ | 1,934,770 | $ | 1,185,921 | $ | 1,191,348 | ||||||||||||||||||||||||||||||
| LIABILITIES AND STOCKHOLDERS’ EQUITY | ||||||||||||||||||||||||||||||||||||
| Interest-bearing liabilities | ||||||||||||||||||||||||||||||||||||
| Savings | $ | 193,933 | $ | 221 | 0.11 | % | $ | 126,894 | $ | 305 | 0.24 | % | $ | 110,969 | $ | 274 | 0.25 | % | ||||||||||||||||||
| Interest-bearing demand | 325,383 | 1,786 | 0.55 | % | 204,844 | 1,703 | 0.83 | % | 207,121 | 1,541 | 0.74 | % | ||||||||||||||||||||||||
| MMA | 451,373 | 599 | 0.13 | % | 250,500 | 557 | 0.22 | % | 265,693 | 711 | 0.27 | % | ||||||||||||||||||||||||
| Core time deposits | 259,730 | 2,220 | 0.85 | % | 197,862 | 2,211 | 1.12 | % | 226,112 | 2,348 | 1.04 | % | ||||||||||||||||||||||||
| Brokered deposits | 28,329 | 318 | 1.12 | % | 29,431 | 414 | 1.41 | % | 38,319 | 468 | 1.22 | % | ||||||||||||||||||||||||
| Total interest-bearing deposits | 1,258,748 | 5,144 | 0.41 | % | 809,531 | 5,190 | 0.64 | % | 848,214 | 5,342 | 0.63 | % | ||||||||||||||||||||||||
| Other interest-bearing liabilities | 48,723 | 2,190 | 4.44 | % | 42,426 | 2,023 | 4.72 | % | 44,658 | 1,725 | 3.81 | % | ||||||||||||||||||||||||
| Total interest-bearing liabilities | 1,307,471 | 7,334 | 0.56 | % | 851,957 | 7,213 | 0.84 | % | 892,872 | 7,067 | 0.79 | % | ||||||||||||||||||||||||
| Noninterest-bearing demand | 383,146 | 211,624 | 180,122 | |||||||||||||||||||||||||||||||||
| Other liabilities | 17,888 | 10,328 | 9,921 | |||||||||||||||||||||||||||||||||
| Total equity | 226,265 | 112,012 | 108,433 | |||||||||||||||||||||||||||||||||
| Total liabilities and stockholders’ equity | $ | 1,934,770 | $ | 1,185,921 | $ | 1,191,348 | ||||||||||||||||||||||||||||||
| Net interest income and rate spread | $ | 70,001 | 3.88 | % | $ | 42,518 | 3.70 | % | $ | 42,677 | 3.75 | % | ||||||||||||||||||||||||
| Net interest margin | 4.01 | % | 3.88 | % | 3.89 | % | ||||||||||||||||||||||||||||||
| Years Ended December 31, | ||||||||||||||||||||||||||||||||||||
| 2014 | 2013 | 2012 | ||||||||||||||||||||||||||||||||||
Average Balance | Interest | Average Rate | Average Balance | Interest | Average Rate | Average Balance | Interest | Average Rate | ||||||||||||||||||||||||||||
| ASSETS | ||||||||||||||||||||||||||||||||||||
| Earning assets | ||||||||||||||||||||||||||||||||||||
Loans | $ | 859,256 | $ | 46,206 | 5.32 | % | $ | 753,284 | $ | 41,119 | 5.40 | % | $ | 521,209 | $ | 27,280 | 5.17 | % | ||||||||||||||||||
| Investment securities | ||||||||||||||||||||||||||||||||||||
Taxable | 83,692 | 1,606 | 1.92 | % | 76,016 | 1,107 | 1.46 | % | 21,963 | 625 | 2.85 | % | ||||||||||||||||||||||||
Tax-exempt | 55,678 | 1,463 | 2.63 | % | 31,989 | 1,234 | 3.86 | % | 26,396 | 1,247 | 4.73 | % | ||||||||||||||||||||||||
| Other interest-earning assets | 85,782 | 469 | 0.55 | % | 51,815 | 344 | 0.66 | % | 44,684 | 233 | 0.52 | % | ||||||||||||||||||||||||
| Total interest-earning assets | 1,084,408 | $ | 49,744 | 4.54 | % | 913,104 | $ | 43,804 | 4.75 | % | 614,252 | $ | 29,385 | 4.73 | % | |||||||||||||||||||||
Cash and due from banks | 39,954 | 22,178 | 15,628 | |||||||||||||||||||||||||||||||||
Other assets | 66,986 | 62,090 | 44,342 | |||||||||||||||||||||||||||||||||
Total assets | $ | 1,191,348 | $ | 997,372 | $ | 674,222 | ||||||||||||||||||||||||||||||
| LIABILITIES AND STOCKHOLDERS’ EQUITY | ||||||||||||||||||||||||||||||||||||
| Interest-bearing liabilities | ||||||||||||||||||||||||||||||||||||
Savings | $ | 110,969 | $ | 274 | 0.25 | % | $ | 79,164 | $ | 216 | 0.27 | % | $ | 33,046 | $ | 151 | 0.46 | % | ||||||||||||||||||
Interest-bearing demand | 207,121 | 1,541 | 0.74 | % | 154,991 | 1,251 | 0.81 | % | 90,666 | 888 | 0.98 | % | ||||||||||||||||||||||||
MMA | 265,693 | 711 | 0.27 | % | 222,299 | 780 | 0.35 | % | 167,196 | 780 | 0.47 | % | ||||||||||||||||||||||||
Core time deposits | 226,112 | 2,348 | 1.04 | % | 195,226 | 1,776 | 0.91 | % | 133,814 | 2,373 | 1.77 | % | ||||||||||||||||||||||||
Brokered deposits | 38,319 | 468 | 1.22 | % | 41,029 | 370 | 0.90 | % | 40,203 | 511 | 1.27 | % | ||||||||||||||||||||||||
| Total interest-bearing deposits | 848,214 | 5,342 | 0.63 | % | 692,709 | 4,393 | 0.63 | % | 464,925 | 4,703 | 1.01 | % | ||||||||||||||||||||||||
| Other interest-bearing liabilities | 44,658 | 1,725 | 3.81 | % | 63,897 | 1,899 | 2.93 | % | 46,647 | 1,827 | 3.85 | % | ||||||||||||||||||||||||
| Total interest-bearing liabilities | 892,872 | 7,067 | 0.79 | % | 756,606 | 6,292 | 0.83 | % | 511,572 | 6,530 | 1.27 | % | ||||||||||||||||||||||||
| Noninterest-bearing demand | 180,122 | 138,175 | 80,971 | |||||||||||||||||||||||||||||||||
Other liabilities | 9,921 | 7,454 | 5,144 | |||||||||||||||||||||||||||||||||
Total equity | 108,433 | 95,137 | 76,535 | |||||||||||||||||||||||||||||||||
| Total liabilities and stockholders’ equity | $ | 1,191,348 | $ | 997,372 | $ | 674,222 | ||||||||||||||||||||||||||||||
| Net interest income and rate spread | $ | 42,677 | 3.75 | % | $ | 37,512 | 3.92 | % | $ | 22,855 | 3.46 | % | ||||||||||||||||||||||||
Net interest margin | 3.89 | % | 4.06 | % | 3.67 | % | ||||||||||||||||||||||||||||||
| (1) | Nonaccrual loans are included in the daily average loan balances outstanding. |
| (2) | The yield on tax-exempt loans and tax-exempt investment securities is computed on a tax-equivalent basis using a federal tax rate of 34% and adjusted for the disallowance of interest expense. |
| (3) | Interest income includes loan fees of |
| 24 |
Table 2: Volume/Rate Variance — Taxable-Equivalent Basis
(dollars in thousands)
| 2016 Compared to 2015 Increase (decrease) Due to Changes in | 2015 Compared to 2014 Increase (decrease) Due to Changes in | ||||||||||||||||||||||
| Volume | Rate* | Net(1) | Volume | Rate* | Net(1) | ||||||||||||||||||
| Earning assets | |||||||||||||||||||||||
| Loans (2) | $ | 24,046 | $ | (104 | ) | $ | 23,942 | $ | 1,307 | $ | (1,768 | ) | $ | (461 | ) | ||||||||
| Investment securities: | |||||||||||||||||||||||
| Taxable | 1,603 | (34 | ) | 1,569 | (156 | ) | 10 | (146 | ) | ||||||||||||||
| Tax-exempt (2) | 1,089 | 120 | 1,209 | 770 | (150 | ) | 620 | ||||||||||||||||
| Other interest-earning assets | 665 | 219 | 884 | (50 | ) | 24 | (26 | ) | |||||||||||||||
| Total interest-earning assets | $ | 27,403 | $ | 201 | $ | 27,604 | $ | 1,871 | $ | (1,884 | ) | $ | (13 | ) | |||||||||
| Interest-bearing liabilities | |||||||||||||||||||||||
| Savings deposits | $ | 118 | $ | (202 | ) | $ | (84 | ) | $ | 38 | $ | (7 | ) | $ | 31 | ||||||||
| Interest-bearing demand | 786 | (703 | ) | 83 | (17 | ) | 179 | 162 | |||||||||||||||
| MMA | 327 | (285 | ) | 42 | (39 | ) | (115 | ) | (154 | ) | |||||||||||||
| Core time deposits | 599 | (590 | ) | 9 | (308 | ) | 171 | (137 | ) | ||||||||||||||
| Brokered deposits | (15 | ) | (81 | ) | (96 | ) | (119 | ) | 65 | (54 | ) | ||||||||||||
| Total interest-bearing deposits | 1,815 | (1,861 | ) | (46 | ) | (445 | ) | 293 | (152 | ) | |||||||||||||
| Other interest-bearing liabilities | 344 | (177 | ) | 167 | 403 | (105 | ) | 298 | |||||||||||||||
| Total interest-bearing liabilities | 2,159 | (2,038 | ) | 121 | (42 | ) | 188 | 146 | |||||||||||||||
| Net interest income | $ | 25,244 | $ | 2,239 | $ | 27,483 | $ | 1,913 | $ | (2,072 | ) | $ | (159 | ) | |||||||||
2014 Compared to 2013 Increase (decrease) Due to Changes in | 2013 Compared to 2012 Increase (decrease) Due to Changes in | |||||||||||||||||||||||
| Volume | Rate* | Net(1) | Volume | Rate* | Net(1) | |||||||||||||||||||
| Earning assets | ||||||||||||||||||||||||
Loans (2) | $ | 5,681 | $ | (594 | ) | $ | 5,087 | $ | 12,532 | $ | 1,307 | $ | 13,839 | |||||||||||
| Investment securities | ||||||||||||||||||||||||
Taxable | 153 | 346 | 499 | 760 | (278 | ) | 482 | |||||||||||||||||
Tax-exempt (2) | 710 | (481 | ) | 229 | 238 | (251 | ) | (13 | ) | |||||||||||||||
Other interest-earning assets | 120 | 5 | 125 | 89 | 22 | 111 | ||||||||||||||||||
Total interest-earning assets | $ | 6,664 | $ | (724 | ) | $ | 5,940 | $ | 13,619 | $ | 800 | $ | 14,419 | |||||||||||
| Interest-bearing liabilities | ||||||||||||||||||||||||
Savings deposits | $ | 80 | $ | (22 | ) | $ | 58 | $ | 145 | $ | (80 | ) | $ | 65 | ||||||||||
Interest-bearing demand | 394 | (104 | ) | 290 | 541 | (178 | ) | 363 | ||||||||||||||||
MMA | 136 | (205 | ) | (69 | ) | 220 | (220 | ) | - | |||||||||||||||
Core time deposits | 303 | 269 | 572 | 831 | (1,428 | ) | (597 | ) | ||||||||||||||||
Brokered deposits | (26 | ) | 124 | 98 | 10 | (151 | ) | (141 | ) | |||||||||||||||
Total interest-bearing deposits | 887 | 62 | 949 | 1,747 | (2,057 | ) | (310 | ) | ||||||||||||||||
Other interest-bearing liabilities | (140 | ) | (34 | ) | (174 | ) | 433 | (361 | ) | 72 | ||||||||||||||
Total interest-bearing liabilities | 747 | 28 | 775 | 2,180 | (2,418 | ) | (238 | ) | ||||||||||||||||
Net interest income | $ | 5,917 | $ | (752 | ) | $ | 5,165 | $ | 11,439 | $ | 3,218 | $ | 14,657 | |||||||||||
| * | Nonaccrual loans are included in the daily average loan balances outstanding. |
| (1) | The change in interest due to both rate and volume has been allocated in proportion to the relationship of dollar amounts of change in each. |
| (2) | The yield on tax-exempt loans and tax-exempt investment securities is computed on a tax-equivalent basis using a federal tax rate of 34% adjusted for the disallowance of interest expense. |
Table 3: Interest Rate Spread, Margin and Average Balance Mix — Taxable-Equivalent Basis
(dollars in thousands)
| Years Ended December 31, | ||||||||||||||||||||||||||||||||||||
| 2016 Average | 2015 Average | 2014 Average | ||||||||||||||||||||||||||||||||||
| Balance | % of Earning Assets | Yield/Rate | Balance | % of Earning Assets | Yield/Rate | Balance | % of Earning Assets | Yield/Rate | ||||||||||||||||||||||||||||
| Total loans | $ | 1,346,304 | 78.1 | % | 5.11 | % | $ | 883,904 | 81.5 | % | 5.12 | % | $ | 859,256 | 79.2 | % | 5.32 | % | ||||||||||||||||||
| Securities and other earning assets | 377,296 | 21.9 | % | 2.03 | % | 200,063 | 18.5 | % | 1.99 | % | 225,152 | 20.8 | % | 1.57 | % | |||||||||||||||||||||
| Total interest-earning assets | $ | 1,723,600 | 100.0 | % | 4.44 | % | $ | 1,083,967 | 100.0 | % | 4.54 | % | $ | 1,084,408 | 100.0 | % | 4.54 | % | ||||||||||||||||||
| Interest-bearing liabilities | $ | 1,307,471 | 75.9 | % | 0.56 | % | $ | 851,957 | 78.6 | % | 0.84 | % | $ | 892,872 | 82.3 | % | 0.79 | % | ||||||||||||||||||
| Noninterest-bearing funds, net | 416,129 | 24.1 | % | 232,010 | 21.4 | % | 191,536 | 17.7 | % | |||||||||||||||||||||||||||
| Total funds sources | $ | 1,723,600 | 100.0 | % | 0.41 | % | $ | 1,083,967 | 100.0 | % | 0.64 | % | $ | 1,084,408 | 100.0 | % | 0.65 | % | ||||||||||||||||||
| Interest rate spread | 3.88 | % | 3.70 | % | 3.75 | % | ||||||||||||||||||||||||||||||
| Contribution from net free funds | 0.13 | % | 0.18 | % | 0.14 | % | ||||||||||||||||||||||||||||||
| Net interest margin | 4.01 | % | 3.88 | % | 3.89 | % | ||||||||||||||||||||||||||||||
| 25 |
| Years Ended December 31, | ||||||||||||||||||||||||||||||||||||
| 2014 | 2013 | 2012 | ||||||||||||||||||||||||||||||||||
| % of | % of | % of | ||||||||||||||||||||||||||||||||||
| Average | Earning | Average | Earning | Average | Earning | |||||||||||||||||||||||||||||||
| Balance | Assets | Yield/Rate | Balance | Assets | Yield/Rate | Balance | Assets | Yield/Rate | ||||||||||||||||||||||||||||
| Total loans | $ | 859,256 | 79.2 | % | 5.32 | % | $ | 753,284 | 82.5 | % | 5.40 | % | $ | 521,209 | 84.9 | % | 5.17 | % | ||||||||||||||||||
Securities and other earning assets | 225,152 | 20.8 | % | 1.57 | % | 159,820 | 17.5 | % | 1.68 | % | 93,043 | 15.1 | % | 2.26 | % | |||||||||||||||||||||
| Total interest-earning assets | $ | 1,084,408 | 100 | % | 4.54 | % | $ | 913,104 | 100.0 | % | 4.75 | % | $ | 614,252 | 100.0 | % | 4.73 | % | ||||||||||||||||||
| Interest-bearing liabilities | $ | 892,872 | 82.3 | % | 0.79 | % | $ | 756,606 | 82.9 | % | 0.83 | % | $ | 511,572 | 83.3 | % | 1.27 | % | ||||||||||||||||||
Noninterest-bearing funds, net | 191,536 | 17.7 | % | 156,498 | 17.1 | % | 102,680 | 16.7 | % | |||||||||||||||||||||||||||
| Total funds sources | $ | 1,084,408 | 100.0 | % | 0.65 | % | $ | 913,104 | 100.0 | % | 0.69 | % | $ | 614,252 | 100.0 | % | 1.06 | % | ||||||||||||||||||
| Interest rate spread | 3.75 | % | 3.92 | % | 3.46 | % | ||||||||||||||||||||||||||||||
Contribution from net free funds | 0.14 | % | 0.14 | % | 0.21 | % | ||||||||||||||||||||||||||||||
| Net interest margin | 3.89 | % | 4.06 | % | 3.67 | % | ||||||||||||||||||||||||||||||
Comparison of 20142016 versus 2013
Taxable-equivalent net interest income was $42.7$70.0 million for 2014,2016, up $5.2$27.5 million or 14%64.6%, compared to 2013. The increase in taxable-equivalent2015. Between 2016 and 2015, volume variances were favorable, driven by the addition of Baylake net interest-earning assets, and rate variances were favorable, predominantly from lower cost of funds between the years. Net favorable volume variances added $25.2 million to net interest income was predominantly volume related, given the timing of the 2013 acquisitions. Taxable equivalent(with $24.0 million due to higher average loan balances and $3.4 million due to higher average investment securities and other interest-earning assets balances combined, offset by $2.2 million less net interest income increased $5.9 million (or 14%) between 2013 and 2014 driven mainly by loans (including $5.7 million from higher loan volumes offsetaverage interest-bearing liability balances), while net rate variances were favorable increasing net interest income by $0.6$2.2 million (with $2.0 million from lower loan yields). Interest expense increased by $0.8funding costs, predominantly deposits, and $0.2 million (or 12%) between the two periods mainly due to time deposits (including $0.3 million more expense from volume and $0.3 million more from rate) and an increase in interest-bearing demand deposits ($0.4 million more expense from volume offset by $0.1 million less expense from rate)improved net earning asset rates, predominantly other interest earning assets).
The taxable-equivalent net interest margin was 3.89%4.01% for 2014, down 172016, up 13 bps from 2013, with improvement2015, aided by an 18 bps increase in the cost of funds at 0.79% (down 4 bps), more thaninterest spread offset partly by a lower earning asset yield of 4.54% (down 21 bps) and no change incontribution from net free funds. In general, there has been and will be underlying downward margin pressure as assets mature in this prolonged low-rate environment, with current reinvestment rates substantially lower than previous rates and less opportunity to offset such with similar changes in the already low cost of funds; however, in both 2014 and 2013 such pressure was partially mitigated by the favorable income from acquired loans.
The earning asset yield was down 10 bps between 2016 and 2015, mainly due to the earning asset mix, including the acquired Baylake mix having a lower proportion of loans. Loans represented 78% of average earning assets and yielding 5.32%yielded 5.11% for 2014,2016, compared to 83%82% and 5.40%5.12%, respectively, for 2013.2015. The 8 bps1 bp decline in loan yield between the years was largelyprimarily due to twothe addition of lower-yielding Baylake loans in 2016 and downward pressure on rates of new and renewing loans in the 2016 competitive rate environment, partially offset by $3.9 million higher aggregate discount accretion on acquired loans fully resolved at approximately $1 million above their carrying values during the third quarter of 2013. The 21 bps decline in earning asset yield was also impacted by a higher mix of non-loan earning assets, which earn much less than loans.between 2016 and 2015. All other interest earninginterest-earning assets combined represented 21%22% of average earning assets and yielded 1.57%2.03% versus 18% and 1.68%1.99%, respectively, for 2013. A higher proportion of low-earning cash was the main reason for the 112015. This 4 bps declineincrease in the non-loan yield was driven by higher yields on investments partially offset by lower returns on higher levels of earning cash between the years.
Nicolet’s cost of funds continued its favorable decline during the low-rate environment, at 0.79%was 0.56% for 2014, 42016, 28 bps lower than 2013. The average cost of0.84% for 2015, driven primarily by lower rates on deposit funding. Average interest-bearing deposits (which represent over 90%represented 96% of average interest-bearing liabilities for both years)2016 and 95% for 2015) cost 0.41% for 2016, 23 bps lower than 2015. The cost of interest-bearing deposits decreased as a result of a higher proportion of balances carried in lower-rate transaction accounts (77.1% for 2016 compared to 71.9% for 2015), was 0.63% for both years, withas well as rate decreases initiated on certain deposit products in December 2015, lower cost of funds on acquired balances and a favorable fair value interest mark on acquired CDs. Deposit rate varianceschanges included decreases in all deposit categories excludingsavings, interest bearing demand, and money market accounts of 13 bps, 28 bps, and 9 bps, respectively, as well as decreases in rates on core time deposits and brokered deposits. Lower-costing transactional deposits (savings, checkingof 27 bps and MMA) saw rate declines in response to reductions made across products between the years while overall29 bps, respectively. Other interest-bearing liabilities balances continued to rise. Average brokered deposit balances decreased(comprised of short- and long-term borrowings) increased $6.3 million while their cost increaseddecreased to 1.22% (versus 0.90%4.44% (down 28 bps from 4.72% in 2013)2015) as a portion of the lower rate balanceshigher cost advances matured and were not replaced. Similarly other interest-bearing liabilities balances decreased while their cost increased to 3.81% (from 2.93% in 2013) mainly from lower raterenewed, certain acquired advances that were paid backoff in the quarter acquired, and not renewed.
Average interest-earning assets were $1.1$1.7 billion for 2014, $1712016, $639.6 million, or 19%59% higher than 2013, led by2015, consisting of a $106$462.4 million increase in average loans (up 14%52.3% to $859$1.3 billion and representing 78% of interest-earning assets), a $128.0 million increase in investment securities (up 78.7% to $290.7 million and representing 79%17% of interest earninginterest-earning assets), and a $31$49.2 million increase, or 131.7% higher in average investments (up 29% to $139 million and representing 13% of earning assets), both partially influenced by the size and timing of the acquisitions in 2013.
Average interest-bearing liabilities were $893 million,$1.3 billion, up $136$455.5 million or 18% over 2013,53.5% from 2015, led by a $156interest-bearing deposits, while the mix of interest-bearing deposits and other interest-bearing liabilities remained relatively unchanged at 96% and 4% for 2016 compared to 95% and 5% for 2015. Between 2016 and 2015, average total deposits were up $620.7 million or 60.8%, with interest-bearing deposits up $449.2 million and noninterest-bearing deposits up $171.5 million. Average other interest-bearing liabilities were up $6.3 million (to $48.7 million), led by an $8.2 million increase in interest-bearing deposits (up 22% to $848junior subordinated debt, a $6.1 million representing 95% of interest-bearing liabilities)net increase in low-costing repurchase agreements (both acquired with the 2016 Baylake merger), and a $19$2.6 million decreaseincrease in subordinated notes which were procured in the first half of 2015, offset by decreases in average balances of all other interest-bearing liabilities (to $45 million), both partially influenced by the size and timing of the acquisitions in 2013 and the use of stable deposits to pay down other wholesale funding.borrowings.
| 26 |
Provision for Loan Losses
The provision for loan losses in 20142016 was $2.7$1.8 million, compared to $6.2exceeding $0.3 million in 2013. The lowerof net charge offs. Comparatively, 2015 provision in 2014 was due to steady improvement during 2014 in levels of loans in nonperforming, delinquent, and classified status. Netnet charge offs were $2.6 million in 2014 and $4.1 million in 2013 (which includes the $1.8 million charge off related toand $0.8 million, respectively. The consistent provision in 2016 was reflective of the grain credit noted above). Asset quality trends remained strong.continued loan portfolio quality. At December 31, 2014,2016, the ALLL was $9.3$11.8 million or 1.05%0.75% of loans compared to $9.2$10.3 million or 1.09%1.18% of loans at December 31, 2013. With continued improvements2015. The decline in asset quality trends,this ratio was due to recording the decrease inBaylake loan portfolio at fair value with no carryover of its allowance at the ALLL as a percenttime of loans was the result of an increasing originated loan balance. No ALLL has been recorded on acquired loans since acquisition or at December 31, 2014, since the remaining pool discounts exceed the required amount calculated based on the actual charge off experience in the acquired loan portfolio.
Nonperforming loans were $5.4$20.3 million (or 0.61%1.29% of total loans) at December 31, 2014 compared to $10.32016, up from $3.5 million (or 1.21%0.40% of total loans) at December 31, 2013.2015. The reductionincrease in nonperforming loans was the result of a continued commitment to work distressed assets to resolution, particularly acquired nonaccrualthe acquisition of the Baylake loan portfolio with higher nonperforming loans. Of the $16.7$37.5 million nonaccrualpurchase credit impaired (“PCI”) loans initially acquired in the 2016 acquisitions ($20.8 million) and 2013 acquisitions $4.3($16.7 million), $20.0 million remain included in the $5.4$20.3 million of nonaccruals at December 31, 2014,2016, compared to $9.5$2.9 million included in the $10.3$3.5 million of nonaccruals at December 31, 2013.
The provision for loan losses is predominantly a function of Nicolet’s methodology and judgment as to qualitative and quantitative factors used to determine the adequacy of the ALLL. The adequacy of the ALLL is affected by changes in the size and character of the loan portfolio, changes in levels of impaired and other nonperforming loans, historical losses and delinquencies in each portfolio segment, the risk inherent in specific loans, concentrations of loans to specific borrowers or industries, existing and future economic conditions, the fair value of underlying collateral, and other factors which could affect potential credit losses. For additional information regarding asset quality and the ALLL, see “Balance Sheet Analysis — Loans,” and “— Allowance for Loan and Lease Losses” and “—Nonperforming Assets.”
Noninterest Income
Table 4: Noninterest Income
(dollars in thousands)
| Years ended December 31, | 2014 Compared to 2013 | |||||||||||||||
| 2014 | 2013 | $ Change | % Change | |||||||||||||
| Service charges on deposit accounts | $ | 2,128 | $ | 1,793 | $ | 335 | 18.7 | % | ||||||||
| Trust services fee income | 4,569 | 4,028 | 541 | 13.4 | ||||||||||||
| Mortgage income | 1,926 | 2,336 | (410 | ) | (17.6 | ) | ||||||||||
| Brokerage fee income | 631 | 477 | 154 | 32.3 | ||||||||||||
| Bank owned life insurance (“BOLI”) | 933 | 825 | 108 | 13.1 | ||||||||||||
| Rent income | 1,239 | 1,036 | 203 | 19.6 | ||||||||||||
| Investment advisory fees | 440 | 348 | 92 | 26.4 | ||||||||||||
| Gain on sale or writedown of assets, net | 539 | 1,669 | (1,130 | ) | (67.7 | ) | ||||||||||
| Bargain purchase gains (“BPG”) | - | 11,915 | (11,915 | ) | N/M | |||||||||||
| Other income | 1,780 | 1,309 | 471 | 36.0 | ||||||||||||
| Total noninterest income | $ | 14,185 | $ | 25,736 | $ | (11,551 | ) | (44.9 | )% | |||||||
| Noninterest income without BPG | $ | 14,185 | $ | 13,821 | $ | 364 | 2.6 | % | ||||||||
| Noninterest income without BPG and net gains | $ | 13,646 | $ | 12,152 | $ | 1,494 | 12.3 | % | ||||||||
| Years ended December 31, | Change From Prior Year | |||||||||||||||||||||||||||
| 2016 | 2015 | 2014 | $ Change 2016 | % Change 2016 | $ Change 2015 | % Change 2015 | ||||||||||||||||||||||
| Service charges on deposit accounts | $ | 3,571 | $ | 2,348 | $ | 2,128 | $ | 1,223 | 52.1 | % | $ | 220 | 10.3 | % | ||||||||||||||
| Mortgage income, net | 5,494 | 3,258 | 1,926 | 2,236 | 68.6 | 1,332 | 69.2 | |||||||||||||||||||||
| Trust services fee income | 5,435 | 4,822 | 4,569 | 613 | 12.7 | 253 | 5.5 | |||||||||||||||||||||
| Brokerage fee income | 3,624 | 670 | 631 | 2,954 | 440.9 | 39 | 6.2 | |||||||||||||||||||||
| Bank owned life insurance (“BOLI”) | 1,284 | 996 | 933 | 288 | 28.9 | 63 | 6.8 | |||||||||||||||||||||
| Rent income | 1,090 | 1,156 | 1,239 | (66 | ) | (5.7 | ) | (83 | ) | (6.7 | ) | |||||||||||||||||
| Investment advisory fees | 452 | 408 | 440 | 44 | 10.8 | (32 | ) | (7.3 | ) | |||||||||||||||||||
| Gain on sale or write-down of assets, net | 54 | 1,726 | 539 | (1,672 | ) | (96.9 | ) | 1,187 | 220.2 | |||||||||||||||||||
| Other income | 5,670 | 2,324 | 1,780 | 3,346 | 144.0 | 544 | 30.6 | |||||||||||||||||||||
| Total noninterest income | $ | 26,674 | $ | 17,708 | $ | 14,185 | $ | 8,966 | 50.6 | % | $ | 3,523 | 24.8 | % | ||||||||||||||
| Noninterest income without net gains | $ | 26,620 | $ | 15,982 | $ | 13,646 | $ | 10,638 | 66.6 | % | $ | 2,336 | 17.1 | % | ||||||||||||||
| Included in Other income: | ||||||||||||||||||||||||||||
| Debit and credit card interchange income | 3,167 | 1,566 | 1,220 | 1,601 | 102.2 | 346 | 28.4 | |||||||||||||||||||||
Comparison of 20142016 versus 2013
Noninterest income for 2016 was $14.2$26.7 million for 2014 (including $0.5$0.1 million of net gain on sale or writedownwrite-down of assets), up $9.0 million or 50.6%, compared to $25.7$17.7 million for 20132015 (including $13.6$1.7 million of combined net gain on sale or writedownwrite-down of assets and BPG)assets). Removing these net gains from both periods, noninterest income was up $1.5$10.6 million or 12.3%66.6%, with increases in all line items, except mortgagerental income, aided largely due to increased business from Nicolet’s expanded size, timing ofby the 20132016 acquisitions and improved market performance.
Service charges on deposit accounts for 20142016 were $2.1$3.6 million, up $0.3$1.2 million or 18.7%52.1% over 2013, given2015, resulting predominantly from higher overdraft activity and the higher number of transaction accounts and increased deposit activity. Most notably, personal non-sufficient funds fees were up $0.2 million over 2013, whilefrom the remaining $0.1 million increase was due to higher service-charges and other fees.Baylake merger correspondingly increasing service charges.
| 27 |
Mortgage income represents net gains received from the sale of residential real estate loans service-released and service-retained into the secondary market, capitalized gains on MSRs, servicing fees, offsetting MSR amortization, valuation changes if any, and to a smallsmaller degree some related income. Residential refinancing activity and new purchase activity vary with movements in mortgage rates, changes in mortgage regulation, and the impact of economic conditions on consumers. SecondaryThe mortgage market continued strong in 2016, with secondary mortgage production of $254 million, up 47% from 2015’s production of $173 million. Net mortgage income was $92$5.5 million for 2014, down 30.8% from 2013’s production of $133 million. Mortgage income was $1.9 million for 2014, down $0.42016, up $2.2 million or 17.6%68.6%, compared to $2.3$3.3 million for 2013, as a result of lower production offset partly by better sales pricing.
Trust service fees were $4.6$5.4 million for 2014,2016, up $0.5$0.6 million or 13.4%12.7% over 2013. In addition to a full year of income2015, benefitting from new net business on the larger base of customers acquired and trust assets added from Mid-Wisconsin, there was market improvement over last year onsteadily increasing assets under management, on which trust fees are based. Similarly, brokeragewhile minimally impacted by the Baylake merger. Brokerage fees were $0.6$3.6 million for 2016, up $0.2$3.0 million or 32.3%440.9% over 2013, mainly from increased legacy2015. The increase in brokerage business market improvements, andwas directly related to a lesser degree from a full yearthe 2016 financial advisor business acquisition in the beginning of the 2013 acquisitions.
BOLI income was $0.9$1.3 million, up $0.3 million or 28.9% over 2015 while average BOLI balances increased 48% to $41 million for 2016. BOLI investments of $25.4 million were added at acquisition in the Baylake merger at a lower overall earning rate, followed by the surrender of $21.5 million of acquired BOLI in June 2016 and the reinvestment of $20.0 million in September 2016.
Net gain on sale or write-down of assets in 2016 was $0.1 million, down $1.6 million or 13.1% over 2013, as96.9% compared to $1.7 million in 2015. The 2016 activity consisted mainly of a result$0.5 million other-than-temporary impairment loss on an other investment security and $0.6 million in net gains from the sale of the $4.3OREO. The 2015 activity consisted of $0.6 million BOLI acquired with Mid-Wisconsinnet gains on sales of equity securities and $2.8$1.1 million new BOLI purchased in June 2014 in this lower rate environment, bringing the average BOLI investment to $25.7net gains on OREO sales and other assets.
Other income was $5.7 million, up 16.7% over 2013. Rent income, investment advisory fees and other income combined were $3.5 million for 2014, up $0.8$3.3 million or 28.4%144.0% over 2013,2015, with the majority of the increase due to ancillary fees tied to deposit-related products, most particularly debit and credit card interchange fees, (up $0.3up $1.6 million aidedor 102.2% on higher volume and activity, and income from equity in part byUFS, a full year of activity from the 2013 acquisitions but also greater volume related to a popular checking product design), check orders, check cashing and wire fee income.
Noninterest Expense
Table 5: Noninterest Expense
(dollars in thousands)
| Years ended December 31, | 2014 Compared to 2013 | |||||||||||||||
| 2014 | 2013 | $ Change | % Change | |||||||||||||
Salaries and employee benefits | $ | 21,472 | $ | 19,615 | $ | 1,857 | 9.5 | % | ||||||||
Occupancy, equipment and office | 7,086 | 6,407 | 679 | 10.6 | ||||||||||||
| Business development and marketing | 2,267 | 2,348 | (81 | ) | (3.4 | ) | ||||||||||
Data processing | 3,178 | 2,477 | 701 | 28.3 | ||||||||||||
FDIC assessments | 715 | 700 | 15 | 2.1 | ||||||||||||
| Core deposit intangible amortization | 1,209 | 1,111 | 98 | 8.8 | ||||||||||||
Other expense | 2,782 | 3,773 | (991 | ) | (26.3 | ) | ||||||||||
Total noninterest expense | $ | 38,709 | $ | 36,431 | $ | 2,278 | 6.3 | % | ||||||||
| Years ended December 31, | Change From Prior Year | |||||||||||||||||||||||||||
| 2016 | 2015 | 2014 | $ Change 2016 | % Change 2016 | $ Change 2015 | % Change 2015 | ||||||||||||||||||||||
| Personnel | $ | 34,030 | $ | 22,523 | $ | 21,472 | $ | 11,507 | 51.1 | % | $ | 1,051 | 4.9 | % | ||||||||||||||
| Occupancy, equipment and office | 10,276 | 6,928 | 7,086 | 3,348 | 48.3 | (158 | ) | (2.2 | ) | |||||||||||||||||||
| Business development and marketing | 3,488 | 2,244 | 2,267 | 1,244 | 55.4 | (23 | ) | 1.0 | ||||||||||||||||||||
| Data processing | 6,370 | 3,565 | 3,178 | 2,805 | 78.7 | 387 | 12.2 | |||||||||||||||||||||
| FDIC assessments | 911 | 615 | 715 | 296 | 48.1 | (100 | ) | (14.0 | ) | |||||||||||||||||||
| Intangibles amortization | 3,458 | 1,027 | 1,209 | 2,431 | 236.7 | (182 | ) | (15.1 | ) | |||||||||||||||||||
| Other expense | 6,409 | 2,746 | 2,782 | 3,663 | 133.4 | (36 | ) | (1.3 | ) | |||||||||||||||||||
| Total noninterest expense | $ | 64,942 | $ | 39,648 | $ | 38,709 | $ | 25,294 | 63.8 | % | $ | 939 | 2.4 | % | ||||||||||||||
| Non-personnel expenses | $ | 30,912 | $ | 17,125 | $ | 17,237 | $ | 13,787 | 80.5 | % | $ | (112 | ) | (0.6 | )% | |||||||||||||
Comparison of 20142016 versus 2013
Total noninterest expense was $38.7$64.9 million for 2014, an increase of $2.32016 (which included $1.3 million direct merger-related expense and a non-recurring $1.7 million lease termination charge), compared to $39.6 million for 2015 (which included $0.8 million merger-related expenses). Removing these noted merger-related expenses and lease charge from both years, noninterest expense was up approximately $23.1 million or 6.3%59%, over 2013; however, excluding $1.9 million of non-recurring merger-based expenses (of which $1 million was in personnel and $0.9 million was in other expense) incurred in 2013, expenses were up 12.1%. The increase in almost all line items was predominantly due tocommensurate with the larger operating base fromand timing of the 20132016 acquisitions. Additionally, the $2.4 million increase in intangibles amortization was exclusively attributable to the 2016 acquisitions being included forand $0.2 million in other expenses was related to the in-process implementation of a fullcustomer relationship management system. Cost saves anticipated with the Baylake merger began to be realized by year end 2016, due to more efficient processes and elimination of duplicative efforts in 2014, net of cost efficiency efforts made during 2014.
Personnel expense (including salaries, brokerage variable pay, overtime, cash and equity incentives, and employee benefits expensebenefit and payroll-related expenses) was $21.5$34.0 million for 2014,2016, up $1.9$11.5 million or 9.5%51.1% over 2013 (or up 14.8% over 2013 excluding2015. In addition to merit increases, higher overtime and higher incentives and equity award costs between the $1 million merger-based expense, such as stay bonusesyears, salaries and severance costs), whilebenefits increased largely due to the 48% increase in average full-time equivalent employees (“FTE” employees) grew 10.1% betweenfrom the years (2842016 acquisitions (415 for 2014 versus 258 for 2013)2016). Total personal costs were largely impacted by a full year of the larger workforce (including commensurate increasesThe six branch closures that occurred in payroll taxes and employer 401k match), rising health insurance costs, and merit increases between the years.fourth quarter 2016 should produce some cost savings in 2017.
| 28 |
Occupancy, equipment and office expense increased $0.7was $10.3 million for 2016, up $3.3 million or 10.6%, most notably impacted by a full year of the 2013 acquisitions, including certain infrastructure integration costs which carried over into 2014, but offset by efficiencies and lower one time signage, postage, and functional costs associated48.3% from 2015, in line with the acquisitions.
Business development and marketing expense was flat (down $0.1 million) compared to 2013,$3.5 million for 2016, up $1.2 million or 55.4%, with increases from the full year of activity offset by a reduction in higher initial costs incurred in the newly acquiredspending on promotional materials, media advertising, and donations as emphasis was focused on expanded and new markets.
Data processing expenses, which are primarily volume-based, were $6.4 million for 2016, up $0.7$2.8 million or 28.3%78.7% over 2013,2015, in line with the increase ina higher number of accounts and volumes processed due to the 2016 acquisitions, an increase in the core processing rate charged and fullhigher integration of systems.
FDIC assessments were flat (up approximately $15,000) comparedhigher between the years mostly due to 2013, with the increasean increased assessment base in assets (on which assessments are based) offset by a more favorable rate charged in 2014.2016. The intangibles amortization increased to $3.5 million, up $2.4 million or 236.7%, fully attributable to new core deposit intangible (“CDI”) amortization increased $0.1and customer list intangible balances added from the 2016 acquisitions.
Other expense was $6.4 million for 2016, up $3.7 million or 8.8%133.4%, attributable mainly to a full year of the CDI recorded in the Mid-Wisconsin transaction.
Income Taxes
Income tax expense was $4.6$9.4 million for 20142016 and $3.8$6.1 million for 2013.2015. The effective tax rates were 31.4%33.4% for 20142016 and 19.2%34.5% for 2013. Significantly impacting2015. Impacting tax expense and the effective tax rate for 2013both 2016 and 2015 was the tax free nature of the Mid-Wisconsin merger, whereby tax expense was not directly charged on the $9.5 million BPG. The $2.4 million BPG from the Bank of Wausau acquisition was taxable. Tax expense for 2014 includes a $0.5 million tax benefit recorded to the deferred tax asset in the second quarter due to the increased ability to utilize net operating losses under the Internal Revenue Code section 382 following the one-year evaluation period related to the acquisition. In addition to the 2013 impact of the tax free BPG, these tax rates are also influenced by the amount of income before tax and the mix of tax-exempt income each year, and to a smaller degree by the non-deductibility of certain merger-related costs. The net deferred tax asset was $5.8$10.9 million at December 31, 20142016 compared to $6.1$5.2 million at the end of 2013.2015. The basic principles for accounting for income taxes require that deferred income taxes be analyzed to determine if a valuation allowance is required. A valuation allowance is required if it is more likely than not that some portion of the deferred tax asset will not be realized. At December 31, 20142016 and 2013,2015, no valuation allowance was determined to be necessary.
BALANCE SHEET ANALYSIS
Loans
Nicolet services a diverse customer base throughout Northernnortheastern and central Wisconsin and in Menominee, Michigan including the following industries: manufacturing, wholesaling, paper, packaging, food production and processing, agriculture, forest products, retail, service, and businesses supporting the general building industry. It continues to concentrate its efforts in originating loans in its local markets and assisting its current loan customers. It actively utilizes government loan programs such as those provided by the U.S. Small Business Administration to help customers weather current economic conditions and position their businesses for the future.
Nicolet’s primary lending function is to make 1) commercial loans, consisting of commercial, industrial and industrial business loans and lines of credit, and owner-occupied CRE loans and AG production and real estate loans; 2) CRE loans, consisting of commercialCRE investment loans, AG real estate, loans and construction and land development loans; 3) residential real estate loans, including residential first mortgages, residential junior mortgages (such as home equity loans and lines), and to a lesser degree residential construction loans; and 4) retail and other loans.
Total loans were $1.6 billion at December 31, 2016, an increase of $691.8 million, or 78.9%, compared to total loans of $877 million at December 31, 2014, an increase2015; however, excluding the $691 million loans added at acquisition in 2016, loans were essentially unchanged (up 0.1%) with underlying organic growth replacing acquired loan runoff. Combined, loans acquired in the 2013 and 2016 acquisitions at their respective acquisition dates totaled $974 million, and had a combined outstanding balance of $36$667 million or 4%, compared to total gross loans of $847and $137 million at December 31, 2013. Loans acquired in 2013 totaled $284 million at the time of acquisition2016 and had an outstanding balance of $182 million and $224 million at December 31, 2014 and 2013,2015, respectively, given amortization, refinances, and payoffs. Loan growth in 2014 had to absorb this $42 million reduction in acquired loans resulting in organic growth of $78 million or 9% between December 31, 2014 and 2013. The 2014 growth was predominately in commercial and industrial loans. The overall mix of loans remained relatively stable with modest reductions in commercial real estate offset primarily by increases in commercial & industrial, agriculture, and first mortgage loans.
| 29 |
Table 6: Loan Composition
As of December 31,
(dollars in thousands)
| 2014 | 2013 | 2012 | 2011 | 2010 | ||||||||||||||||||||||||||
| Amount | % of Total | Amount | % of Total | Amount | % of Total | Amount | % of Total | Amount | % of Total | |||||||||||||||||||||
| Commercial & industrial | $ | 289,379 | 32.7 | % | $ | 253,674 | 29.9 | % | $ | 197,301 | 35.7 | % | $ | 153,810 | 32.6 | % | $ | 170,898 | 33.3 | % | ||||||||||
Owner-occupied CRE | 182,574 | 20.7 | 187,476 | 22.1 | 106,888 | 19.3 | 110,094 | 23.3 | 120,943 | 23.5 | ||||||||||||||||||||
AG production | 14,617 | 1.6 | 14,256 | 1.7 | 215 | 0.1 | 201 | 0.0 | 21 | 0.0 | ||||||||||||||||||||
AG real estate | 42,754 | 4.8 | 37,057 | 4.4 | 11,354 | 2.1 | 1,085 | 0.2 | 2,179 | 0.5 | ||||||||||||||||||||
CRE investment | 81,873 | 9.3 | 90,295 | 10.7 | 76,618 | 13.9 | 66,577 | 14.1 | 63,839 | 12.4 | ||||||||||||||||||||
| Construction & land development | 44,114 | 5.0 | 42,881 | 5.1 | 21,791 | 3.9 | 24,774 | 5.2 | 31,464 | 6.1 | ||||||||||||||||||||
| Residential construction | 11,333 | 1.3 | 12,535 | 1.5 | 7,957 | 1.4 | 9,363 | 2.0 | 8,893 | 1.7 | ||||||||||||||||||||
| Residential first mortgage | 158,683 | 18.0 | 154,403 | 18.2 | 85,588 | 15.5 | 56,392 | 11.9 | 56,533 | 11.0 | ||||||||||||||||||||
| Residential junior mortgage | 52,104 | 5.9 | 49,363 | 5.8 | 39,352 | 7.1 | 42,699 | 9.0 | 46,621 | 9.1 | ||||||||||||||||||||
Retail & other | 5,910 | 0.7 | 5,418 | 0.6 | 5,537 | 1.0 | 7,494 | 1.7 | 12,370 | 2.4 | ||||||||||||||||||||
Total loans | $ | 883,341 | 100.0 | % | $ | 847,358 | 100.0 | % | $ | 552,601 | 100.0 | % | $ | 472,489 | 100.0 | % | $ | 513,761 | 100.0 | % | ||||||||||
| 2016 | 2015 | 2014 | 2013 | 2012 | ||||||||||||||||||||||||||||||||||||
| Amount | % of Total | Amount | % of Total | Amount | % of Total | Amount | % of Total | Amount | % of Total | |||||||||||||||||||||||||||||||
| Commercial & industrial | $ | 428,270 | 27.3 | % | $ | 294,419 | 33.6 | % | $ | 289,379 | 32.7 | % | $ | 253,674 | 29.9 | % | $ | 197,301 | 35.7 | % | ||||||||||||||||||||
| Owner-occupied CRE | 360,227 | 23.0 | 185,285 | 21.1 | 182,574 | 20.7 | 187,476 | 22.1 | 106,888 | 19.3 | ||||||||||||||||||||||||||||||
| AG production | 34,767 | 2.2 | 15,018 | 1.7 | 14,617 | 1.6 | 14,256 | 1.7 | 215 | 0.1 | ||||||||||||||||||||||||||||||
| AG real estate | 45,234 | 2.9 | 43,272 | 4.9 | 42,754 | 4.8 | 37,057 | 4.4 | 11,354 | 2.1 | ||||||||||||||||||||||||||||||
| CRE investment | 195,879 | 12.5 | 78,711 | 9.0 | 81,873 | 9.3 | 90,295 | 10.7 | 76,618 | 13.9 | ||||||||||||||||||||||||||||||
| Construction & land development | 74,988 | 4.8 | 36,775 | 4.2 | 44,114 | 5.0 | 42,881 | 5.1 | 21,791 | 3.9 | ||||||||||||||||||||||||||||||
| Residential construction | 23,392 | 1.5 | 10,443 | 1.2 | 11,333 | 1.3 | 12,535 | 1.5 | 7,957 | 1.4 | ||||||||||||||||||||||||||||||
| Residential first mortgage | 300,304 | 19.1 | 154,658 | 17.6 | 158,683 | 18.0 | 154,403 | 18.2 | 85,588 | 15.5 | ||||||||||||||||||||||||||||||
| Residential junior mortgage | 91,331 | 5.8 | 51,967 | 5.9 | 52,104 | 5.9 | 49,363 | 5.8 | 39,352 | 7.1 | ||||||||||||||||||||||||||||||
| Retail & other | 14,515 | 0.9 | 6,513 | 0.8 | 5,910 | 0.7 | 5,418 | 0.6 | 5,537 | 1.0 | ||||||||||||||||||||||||||||||
| Total loans | $ | 1,568,907 | 100.0 | % | $ | 877,061 | 100.0 | % | $ | 883,341 | 100.0 | % | $ | 847,358 | 100.0 | % | $ | 552,601 | 100.0 | % | ||||||||||||||||||||
As noted above, year-end 2016 loans combined) versus retail loan (i.e. residential real estate and other retail loans) mix basis, year-end 2014 was 74.1%were broadly 73% commercial-based and 25.9%27% retail-based compared to 74% commercial-based and 26% retail-based at December 31, 2014 versus 73.9% and 26.1%, respectively, for year-end 2013.2015. Commercial-based loans are considered to have more inherent risk of default than retail-based loans, in part because the commercial balance per borrower is typically larger than that for retail-based loans, implying higher potential losses on an individual customer basis.
Commercial and industrial loans consist primarily of commercial loans to small businesses and, to a lesser degree, to municipalities within a diverse range of industries. The credit risk related to commercial and industrial loans is largely influenced by general economic conditions and the resulting impact on a borrower’s operations, or on the value of underlying collateral, if any. Commercial and industrial loans increased $36 million since year end 2013. Commercial and industrial loans continue to be the largest segment of Nicolet’s portfolio and increasedbut decreased to 32.7%27.3% of the portfolio at year end 20142016, due to the 2016 acquired loan mix, compared to 29.9%33.6% of the total portfolio at year end 2013.2015. This continues to be a strong growth area for Nicolet.
Owner-occupied CRE loans fellincreased to 20.7%23.0% of loans at year end 20142016 compared to 22.1%21.1% of loans at year end 2013.2015. This category primarily consists of loans within a diverse range of industries secured by business real estate that is occupied by borrowers who operate their businesses out of the underlying collateral and who may also have commercial and industrial loans. The credit risk related to owner-occupied CRE loans is largely influenced by general economic conditions and the resulting impact on a borrower’s operations, or on the value of underlying collateral. The total decrease of $5 million between year ends was predominately from a $17 million decrease in acquired balances offset by a $12 million increase in originated loans.
Agricultural production and agricultural real estate loans consist of loans secured by farmland and related farming operations. The credit risk related to agricultural loans is largely influenced by the prices farmers can get for their production and/or the underlying value of the farmland. The $6 million increase in these portfolios between year ends was driven by a $9 million increase in originated balances offset by a $3 million reduction in acquired balances. Agriculture is more prevalent in our acquired markets, offering a growth area for Nicolet. In total, theseThese loans increased minimallydecreased to 6.4% from 6.1%5.1% of total loans at December 31, 2014 and 2013, respectively.
The CRE investment loan classification primarily includes commercial-based mortgage loans that are secured by non-owner occupied, nonfarm/nonresidential real estate properties, and multi-family residential properties. Lending in this segment has been focused on loans that are secured by commercial income-producing properties as opposed to speculative real estate development. From December 31, 20132015 to December 31, 2014,2016, these loans decreased $8 million. At December 31, 2014 CRE investment loans represented 9.3%increased $117.2 million, and grew to represent 12.5% of loans, due to the 2016 acquired loan mix, compared to 10.7%9.0% a year ago.
Loans in the construction and land development portfolio represent 5.0%represented 4.8% of total loans at year end 20142016 compared to 4.2% at year-end 2015. Construction and suchland development loans provide financing for the development of commercial income properties, multi-family residential development, and land designated for future development. Nicolet controls the credit risk on these types of loans by making loans in familiar markets, reviewing the merits of individual projects, controlling loan structure, and monitoring the progress of projects through the analysis of construction advances. Credit risk is managed by employing sound underwriting guidelines, lending primarily to borrowers in local markets, periodically evaluating the underlying collateral, and formally reviewing the borrower’s financial soundness and relationships on an ongoing basis. Lending in this area remained steady both in total dollars and as a percentage of the portfolio compared between year ends.
| 30 |
On a combined basis, Nicolet’s residential real estate loans represent 25.2%represented 26.4% of total loans at year end 20142016 compared to 25.5%24.7% of total loans at year end 2013.2015. Residential first mortgage loans include conventional first-lien home mortgages. Residential junior mortgage real estate loans consist of home equity lines and term loans secured by junior mortgage liens. Across the industry, home equities involve loans that are often in second or junior lien positions, but Nicolet has secured many of these types of loans in a first lien position, further mitigating the portfolio risks. Nicolet has not experienced significant losses in its residential real estate loans; however, residential real estate, if declines in market values in the residential real estate markets worsen, particularly in Nicolet’s market area, the value of collateral securing its real estate loans could decline, which could cause an increase in the provision for loan losses. As part of its management of originating residential mortgage loans, the vast majority of Nicolet’s long-term, fixed-rate residential real estate mortgage loans are sold in the secondary market with or without retaining the servicing rights. Nicolet’s mortgage loans have historically had low net charge off rates and held mortgages typically are of high quality.
Loans in the retail and other classification represent less than 1% of the total loan portfolio, and include predominantly short-term and other personal installment loans not secured by real estate. Credit risk is primarily controlled by reviewing the creditworthiness of the borrowers, monitoring payment histories, and taking appropriate collateral and/or guaranty positions. The loan balances in this portfolio remained relatively unchanged between year-end 2014 and 2013 and the portfolio has remained stable as a percent of total loans.
Factors that are important to managing overall credit quality are sound loan underwriting and administration, systematic monitoring of existing loans and commitments, effective loan review on an ongoing basis, early problem loan identification and remedial action to minimize losses, an adequate ALLL, and sound nonaccrual and charge-off policies. An active credit risk management process is used for commercial loans to further ensure that sound and consistent credit decisions are made. The credit management process is regularly reviewed and the process has been modified over the past several years to further strengthen the controls.
The loan portfolio is widely diversified by types of borrowers, industry groups, and market areas. Significant loan concentrations are considered to exist for a financial institution when there are amounts loaned to multiple numbers of borrowers engaged in similar activities that would cause them to be similarly impacted by economic or other conditions. At December 31, 2014,2016, no significant industry concentrations existed in Nicolet’s portfolio in excess of 25% of total loans. Nicolet has also developed guidelines to manage its exposure to various types of concentration risks.
Table 7: Loan Maturity Distribution
The following table presents the maturity distribution of the loan portfolio at December 31, 2014:
(dollars in thousands)
| Loan Maturity | ||||||||||||||||
| One Year or Less | Over One Year to Five Years | Over Five Years | Totals | |||||||||||||
| Commercial & industrial | $ | 204,858 | $ | 195,715 | $ | 27,697 | $ | 428,270 | ||||||||
| Owner-occupied CRE | 82,939 | 216,394 | 60,894 | 360,227 | ||||||||||||
| AG production | 18,203 | 13,033 | 3,531 | 34,767 | ||||||||||||
| AG real estate | 11,909 | 31,520 | 1,805 | 45,234 | ||||||||||||
| CRE investment | 33,283 | 131,153 | 31,443 | 195,879 | ||||||||||||
| Construction & land development | 29,259 | 38,298 | 7,431 | 74,988 | ||||||||||||
| Residential construction | 23,014 | 378 | - | 23,392 | ||||||||||||
| Residential first mortgage | 12,020 | 49,654 | 238,630 | 300,304 | ||||||||||||
| Residential junior mortgage | 27,486 | 19,649 | 44,196 | 91,331 | ||||||||||||
| Retail & other | 6,728 | 6,900 | 887 | 14,515 | ||||||||||||
| Total loans | $ | 449,699 | $ | 702,694 | $ | 416,514 | $ | 1,568,907 | ||||||||
| Percent by maturity distribution | 29 | % | 45 | % | 26 | % | 100 | % | ||||||||
| Fixed rate | $ | 201,722 | $ | 602,674 | $ | 214,519 | $ | 1,018,915 | ||||||||
| Floating rate | 247,977 | 100,020 | 201,995 | 549,992 | ||||||||||||
| Total | $ | 449,699 | $ | 702,694 | $ | 416,514 | $ | 1,568,907 | ||||||||
| 31 |
| Loan Maturity | ||||||||||||||||
One Year or Less | Over One Year to Five Years | Over Five Years | Totals | |||||||||||||
Commercial & industrial | $ | 135,307 | $ | 146,330 | $ | 7,742 | $ | 289,379 | ||||||||
Owner-occupied CRE | 34,226 | 127,699 | 20,649 | 182,574 | ||||||||||||
AG production | 5,620 | 8,997 | - | 14,617 | ||||||||||||
AG real estate | 11,908 | 27,817 | 3,029 | 42,754 | ||||||||||||
CRE investment | 22,767 | 50,113 | 8,993 | 81,873 | ||||||||||||
Construction & land development | 18,725 | 22,176 | 3,213 | 44,114 | ||||||||||||
Residential construction | 11,053 | 280 | - | 11,333 | ||||||||||||
Residential first mortgage | 16,115 | 33,676 | 108,892 | 158,683 | ||||||||||||
Residential junior mortgage | 7,496 | 27,296 | 17,312 | 52,104 | ||||||||||||
Retail & other | 2,701 | 3,209 | - | 5,910 | ||||||||||||
Total loans | $ | 265,918 | $ | 447,593 | $ | 169,830 | $ | 883,341 | ||||||||
Percent by maturity distribution | 30 | % | 51 | % | 19 | % | 100 | % | ||||||||
Fixed rate | $ | 109,500 | $ | 345,366 | $ | 81,027 | $ | 535,893 | ||||||||
Floating rate | 156,418 | 102,227 | 88,803 | 347,448 | ||||||||||||
| Total | $ | 265,918 | $ | 447,593 | $ | 169,830 | $ | 883,341 | ||||||||
Allowance for Loan Losses
In addition to the discussion that follows, accounting policies behind loans and the allowance for loan losses are described in Note 1, “Nature of Business and Significant Accounting Policies,” and additional disclosures are included in Note 4, “Loans and Allowance for Loan Losses,” in the Notes to Consolidated Financial Statements, under Part II, Item 8.
Credit risks within the loan portfolio are inherently different for each loan type as described under “Balance Sheet Analysis-Loans.”��� Credit risk is controlled and monitored through the use of lending standards, a thorough review of potential borrowers, and on-going review of loan payment performance. Active asset quality administration, including early problem loan identification and timely resolution of problems, aids in the management of credit risk and minimization of loan losses.
The ALLL is established through a provision for loan losses charged to expense to appropriately provide for potential credit losses in the existing loan portfolio. Loans are charged against the ALLL when management believes that the collection of principal is unlikely. The level of the ALLL represents management’s estimate of an amount of reserves that provides for estimated probable credit losses in the loan portfolio at the balance sheet date. To assess the ALLL, an allocation methodology is applied by Nicolet which focuses on evaluation of qualitative and environmental factors, including but not limited to: (i) evaluation of facts and issues related to specific loans; (ii) management’s ongoing review and grading of the loan portfolio; (iii) consideration of historical loan loss and delinquency experience on each portfolio segment; (iv) trends in past due and nonperforming loans; (v) the risk characteristics of the various loan segments; (vi) changes in the size and character of the loan portfolio; (vii) concentrations of loans to specific borrowers or industries; (viii) existing and forecasted economic conditions; (ix) the fair value of underlying collateral; and (x) other qualitative and quantitative factors which could affect potential credit losses. Nicolet’s methodology reflects guidance by regulatory agencies to all financial institutions.
Management allocates the ALLL by pools of risk within each loan portfolio segment. The allocation methodology consists of the following components. First, a specific reserve for the estimated shortfall is established for all loans determined to be impaired. The specific reserve in the ALLL is equal to the aggregate collateral or discounted cash flow shortfall calculated from the impairment analyses. Loans measured for impairment include nonaccrual loans, non-performing troubled debt-restructurings (“restructured loans”), or other loans determined to be impaired by management. Second, management allocates ALLL with historical loss rates by loan segment. The loss factors applied in the methodology are periodically re-evaluated and adjusted to reflect changes in historical loss levels on an annual basis. Lastly, management allocates ALLL to the remaining loan portfolio using the qualitative factors mentioned above. Consideration is given to those current qualitative or environmental factors that are likely to cause estimated credit losses as of the evaluation date to differ from the historical loss experience of each loan segment.
Management performs ongoing intensive analyses of its loan portfolio to allow for early identification of customers experiencing financial difficulties, maintains prudent underwriting standards, understands the economy in its markets, and considers the trend of deterioration in loan quality in establishing the level of the ALLL.
Consolidated net income and stockholders’ equity could be affected if management’s estimate of the ALLL necessary to cover expected losses is subsequently materially different, requiring a change in the level of provision for loan losses to be recorded. While management uses currently available information to recognize losses on loans, future adjustments to the ALLL may be necessary based on newly received appraisals, updated commercial customer financial statements, rapidly deteriorating customer cash flow, and changes in economic conditions that affect Nicolet’s customers. As an integral part of their examination process, federal regulatory agencies also review the ALLL. Such agencies may require additions to the ALLL or may require that certain loan balances be charged-off or downgraded into criticized loan categories when their credit evaluations differ from those of management based on their judgments about information available to them at the time of their examination.
At December 31, 2014,2016, the ALLL was $9.3$11.8 million compared to $9.2$10.3 million at December 31, 2013.2015. The increase was a result of a 2014the 2016 provision of $2.7$1.8 million exceeding 20142016 net charge offs of $2.6$0.3 million. Comparatively, the 20132015 provision for loan losses was $6.2$1.8 million and 20132015 net charge offs were $4.1$0.8 million. For the acquired loan portfolio, $0.3 million was provided to cover $0.3 million of net charge offs compared to $2.2 million of provision to cover $2.2 million of net charge offs in 2013 (which included one loan of $1.8 million related to a charge off on a fully resolved grain credit acquired with Mid-Wisconsin that was not marked initially at acquisition). Net charge offs as a percent of average loans were 0.31%0.02% in 20142016 compared to 0.54%0.09% in 2013.2015. Loans charged off are subject to continuous review, and specific efforts are taken to achieve maximum recovery of principal, accrued interest, and related expenses. The level of the provision for loan losses is directly correlated to the assessment of the adequacy of the allowance, including, but not limited to, consideration of the amount of net charge-offs, loan growth, levels of nonperforming loans, and trends in the risk profile of the loan portfolio.
| 32 |
The ratio of the ALLL as a percentage of period-end loans was 1.05%0.75% and 1.09%1.18% at December 31, 20142016 and 2015, respectively. The ALLL to loans ratio is impacted by the accounting treatment of the 2016 and 2013 respectively, withacquisitions, which combined at their acquisition dates added no ALLL to the decrease attributablenumerator and $974 million of loans into the denominator at their then estimated fair values ($691 million in 2016 and $283 million in 2013), net of applicable discounts for credit quality. Such acquired loans combined have declined since their acquisition dates to $667 million and $137 million outstanding at December 31, 2016 given amortization, refinances and payoffs. However, since their acquisition, the performance trends of acquired loans have been evolving and evaluated. As events have occurred in the acquired loan portfolio, beginning in mid-2015, an ALLL was provided directly for this portfolio (especially the 2013 acquired loans), reflecting an increase in period endrisk as acquired credits age and several larger and other loans migrate to a watch or worse loan grades. Therefore, the provision for loan losses and net charge offs for 2016 were $1.0 million and $0.2 million, respectively, for acquired loans, and continued improvement in asset quality measures. Since$0.8 million and $0.1 million, respectively, for originated loans. Comparatively, the provision for loan losses and net charge offs for 2015, were $1.7 million and $0.1 million, respectively, for acquired loans, are recorded at their estimated fair value at the acquisition dates, no ALLL was initially recorded at acquisition while $284and $0.1 million was added to loans at acquisition.and $0.7 million, respectively, for originated loans. At December 31, 2014 $9.3 million of2016, the ALLL was reserved against$11.8 million (or 0.75% of total loans), with $2.4 million for acquired loans (0.36% of acquired loans) and $9.4 million for originated loans (representing 1.32%(1.05% of originated loans). In particular, see additional disclosures in Note 4, “Loans and zero was reserved against acquired loans.
Table 8: Loan Loss Experience
For the Years Ended December 31,
(dollars in thousands)
| 2014 | 2013 | 2012 | 2011 | 2010 | ||||||||||||||||
| Allowance for loan losses (ALLL): | ||||||||||||||||||||
Beginning balance | $ | 9,232 | $ | 7,120 | $ | 5,899 | $ | 8,635 | $ | 6,232 | ||||||||||
| Loans charged off: | ||||||||||||||||||||
Commercial & industrial | 1,923 | 574 | 295 | 2,553 | 1,217 | |||||||||||||||
Owner-occupied CRE | 470 | 1,936 | 1,328 | 428 | 292 | |||||||||||||||
AG production | — | — | — | — | — | |||||||||||||||
AG real estate | — | — | — | — | — | |||||||||||||||
CRE investment | — | 992 | 305 | 181 | 53 | |||||||||||||||
Construction & land development | 12 | 319 | 713 | 5,243 | 4,335 | |||||||||||||||
Residential construction | — | — | 396 | 42 | — | |||||||||||||||
Residential first mortgage | 218 | 156 | 265 | 488 | 167 | |||||||||||||||
Residential junior mortgage | 81 | 190 | 166 | 459 | 136 | |||||||||||||||
Retail & other | 39 | 71 | 39 | 7 | 92 | |||||||||||||||
Total loans charged off | 2,743 | 4,238 | 3,507 | 9,401 | 6,292 | |||||||||||||||
| Recoveries of loans previously charged off: | ||||||||||||||||||||
Commercial & industrial | 55 | 40 | 36 | 23 | 116 | |||||||||||||||
Owner-occupied CRE | 17 | 85 | 300 | 3 | 5 | |||||||||||||||
AG production | — | — | — | — | — | |||||||||||||||
AG real estate | — | — | — | — | — | |||||||||||||||
CRE investment | 14 | — | 27 | — | 33 | |||||||||||||||
Construction & land development | — | 15 | 22 | 28 | — | |||||||||||||||
Residential construction | — | — | — | — | — | |||||||||||||||
Residential first mortgage | 2 | 8 | 11 | 10 | 40 | |||||||||||||||
Residential junior mortgage | 1 | 1 | 6 | 1 | — | |||||||||||||||
Retail & other | 10 | 1 | 1 | — | 1 | |||||||||||||||
Total recoveries | 99 | 150 | 403 | 65 | 195 | |||||||||||||||
Total net charge offs | 2,644 | 4,088 | 3,104 | 9,336 | 6,097 | |||||||||||||||
Provision for loan losses | 2,700 | 6,200 | 4,325 | 6,600 | 8,500 | |||||||||||||||
Ending balance of ALLL | $ | 9,288 | $ | 9,232 | $ | 7,120 | $ | 5,899 | $ | 8,635 | ||||||||||
| Ratios: | ||||||||||||||||||||
ALLL to total loans at December 31 | 1.05 | % | 1.09 | % | 1.29 | % | 1.25 | % | 1.68 | % | ||||||||||
| ALLL to net charge offs for the year ended December 31 | 351.3 | % | 225.8 | % | 229.4 | % | 63.2 | % | 141.6 | % | ||||||||||
| Net charge offs to average loans for the year ended December 31 | 0.31 | % | 0.54 | % | 0.60 | % | 1.85 | % | 1.22 | % | ||||||||||
| 2016 | 2015 | 2014 | 2013 | 2012 | ||||||||||||||||
| Allowance for loan losses (ALLL): | ||||||||||||||||||||
| Beginning balance | $ | 10,307 | $ | 9,288 | $ | 9,232 | $ | 7,120 | $ | 5,899 | ||||||||||
| Loans charged off: | ||||||||||||||||||||
| Commercial & industrial | 279 | 374 | 1,923 | 574 | 295 | |||||||||||||||
| Owner-occupied CRE | 108 | 229 | 470 | 1,936 | 1,328 | |||||||||||||||
| AG production | — | — | — | — | — | |||||||||||||||
| AG real estate | — | — | — | — | — | |||||||||||||||
| CRE investment | — | 50 | — | 992 | 305 | |||||||||||||||
| Construction & land development | — | — | 12 | 319 | 713 | |||||||||||||||
| Residential construction | — | — | — | — | 396 | |||||||||||||||
| Residential first mortgage | 80 | 84 | 218 | 156 | 265 | |||||||||||||||
| Residential junior mortgage | 57 | 111 | 81 | 190 | 166 | |||||||||||||||
| Retail & other | 60 | 35 | 39 | 71 | 39 | |||||||||||||||
| Total loans charged off | 584 | 883 | 2,743 | 4,238 | 3,507 | |||||||||||||||
| Recoveries of loans previously charged off: | ||||||||||||||||||||
| Commercial & industrial | 26 | 36 | 55 | 40 | 36 | |||||||||||||||
| Owner-occupied CRE | 5 | 4 | 17 | 85 | 300 | |||||||||||||||
| AG production | — | — | — | — | — | |||||||||||||||
| AG real estate | — | — | — | — | — | |||||||||||||||
| CRE investment | 221 | 17 | 14 | — | 27 | |||||||||||||||
| Construction & land development | — | — | — | 15 | 22 | |||||||||||||||
| Residential construction | — | — | — | — | — | |||||||||||||||
| Residential first mortgage | 31 | 20 | 2 | 8 | 11 | |||||||||||||||
| Residential junior mortgage | 8 | 12 | 1 | 1 | 6 | |||||||||||||||
| Retail & other | 6 | 13 | 10 | 1 | 1 | |||||||||||||||
| Total recoveries | 297 | 102 | 99 | 150 | 403 | |||||||||||||||
| Total net charge offs | 287 | 781 | 2,644 | 4,088 | 3,104 | |||||||||||||||
| Provision for loan losses | 1,800 | 1,800 | 2,700 | 6,200 | 4,325 | |||||||||||||||
| Ending balance of ALLL | $ | 11,820 | $ | 10,307 | $ | 9,288 | $ | 9,232 | $ | 7,120 | ||||||||||
| Ratios: | ||||||||||||||||||||
| ALLL to total loans at December 31 | 0.75 | % | 1.18 | % | 1.05 | % | 1.09 | % | 1.29 | % | ||||||||||
| ALLL to net charge offs for the year ended December 31 | 4,118.5 | % | 1,319.7 | % | 351.3 | % | 225.8 | % | 229.4 | % | ||||||||||
| Net charge offs to average loans for the year ended December 31 | 0.02 | % | 0.09 | % | 0.31 | % | 0.54 | % | 0.60 | % | ||||||||||
The allocation of the ALLL for each of the past five years is based on Nicolet’s estimate of loss exposure by category of loans and is shown in Table 9.
| 33 |
As a commercial bank, Nicolet continues to carry the largest allocation of ALLL against commercial & industrial loans (the largest loan type at roughly 27% of loans at year-end 2016 and 34% of loans at year-end 2015) of $3.9 million (or 33.2% of ALLL) and $3.7 million (or 36.2% of ALLL) at December 31, 2016 and 2015, respectively. While the balances of construction & land development loans have been relatively steady (at 4% to 5% of loans at year-end 2016 and 2015), the category carries higher historical loss rates, which are improving with better current loan performance and granularity; hence, the allocation was $0.8 million to represent 6.5% of ALLL at December 31, 2016, compared to 14.0% at year-end 2015. With less allocated to construction & land development, allocations increased to other loan types that would be more affected by management’s growing concerns that the recent period of economic recovery is slowing in light of current economic data and events that pressure collateral values or businesses’ and consumers’ ability to perform on loans. Management allocated additional amounts in 2016 to owner-occupied CRE (up $1.0 million to $2.9 million, or 24.3% of ALLL), residential first and junior mortgages (up $0.5 million combined, and representing 19.0% of ALLL combined), and CRE investment (up $0.3 million, representing 9.5% of ALLL). The remaining allocated ALLL balances were consistent with changes in outstanding loan balances at December 31, 2016.
Table 9: Allocation of the Allowance for Loan Losses
As of December 31,
(dollars in thousands)
| 2016 | % of Loan Type to Total Loans | 2015 | % of Loan Type to Total Loans | 2014 | % of Loan Type to Total Loans | 2013 | % of Loan Type to Total Loans | 2012 | % of Loan Type to Total Loans | |||||||||||||||||||||||||||||||
| ALLL allocation | ||||||||||||||||||||||||||||||||||||||||
| Commercial & industrial | $ | 3,919 | 27.3 | % | $ | 3,721 | 33.6 | % | $ | 3,191 | 32.7 | % | $ | 1,798 | 29.9 | % | $ | 1,969 | 35.7 | % | ||||||||||||||||||||
| Owner-occupied CRE | 2,867 | 23.0 | 1,933 | 21.1 | 1,230 | 20.7 | 766 | 22.1 | 1,069 | 19.3 | ||||||||||||||||||||||||||||||
| AG production | 150 | 2.2 | 85 | 1.7 | 53 | 1.6 | 18 | 1.7 | — | 0.1 | ||||||||||||||||||||||||||||||
| AG real estate | 285 | 2.9 | 380 | 4.9 | 226 | 4.8 | 59 | 4.4 | — | 2.1 | ||||||||||||||||||||||||||||||
| CRE investment | 1,124 | 12.5 | 785 | 9.0 | 511 | 9.3 | 505 | 10.7 | 337 | 13.9 | ||||||||||||||||||||||||||||||
| Construction & land development | 774 | 4.8 | 1,446 | 4.2 | 2,685 | 5.0 | 4,970 | 5.1 | 2,580 | 3.9 | ||||||||||||||||||||||||||||||
| Residential construction | 304 | 1.5 | 147 | 1.2 | 140 | 1.3 | 229 | 1.5 | 137 | 1.4 | ||||||||||||||||||||||||||||||
| Residential first mortgage | 1,784 | 19.1 | 1,240 | 17.6 | 866 | 18.0 | 544 | 18.2 | 685 | 15.5 | ||||||||||||||||||||||||||||||
| Residential junior mortgage | 461 | 5.8 | 496 | 5.9 | 337 | 5.9 | 321 | 5.8 | 312 | 7.1 | ||||||||||||||||||||||||||||||
| Retail & other | 152 | 0.9 | 74 | 0.8 | 49 | 0.7 | 22 | 0.6 | 31 | 1.0 | ||||||||||||||||||||||||||||||
| Total ALLL | $ | 11,820 | 100.0 | % | $ | 10,307 | 100.0 | % | $ | 9,288 | 100.0 | % | $ | 9,232 | 100.0 | % | $ | 7,120 | 100.0 | % | ||||||||||||||||||||
| ALLL category as a percent of total ALLL: | ||||||||||||||||||||||||||||||||||||||||
| Commercial & industrial | 33.2 | % | 36.2 | % | 34.4 | % | 19.5 | % | 27.7 | % | ||||||||||||||||||||||||||||||
| Owner-occupied CRE | 24.3 | 18.8 | 13.2 | 8.3 | 15.0 | |||||||||||||||||||||||||||||||||||
| AG production | 1.3 | 0.8 | 0.6 | 0.2 | — | |||||||||||||||||||||||||||||||||||
| AG real estate | 2.4 | 3.7 | 2.4 | 0.6 | — | |||||||||||||||||||||||||||||||||||
| CRE investment | 9.5 | 7.6 | 5.5 | 5.5 | 4.7 | |||||||||||||||||||||||||||||||||||
| Construction & land development | 6.5 | 14.0 | 28.9 | 53.8 | 36.2 | |||||||||||||||||||||||||||||||||||
| Residential construction | 2.6 | 1.4 | 1.5 | 2.5 | 1.9 | |||||||||||||||||||||||||||||||||||
| Residential first mortgage | 15.1 | 12.0 | 9.3 | 5.9 | 9.6 | |||||||||||||||||||||||||||||||||||
| Residential junior mortgage | 3.9 | 4.8 | 3.6 | 3.5 | 4.4 | |||||||||||||||||||||||||||||||||||
| Retail & other | 1.2 | 0.7 | 0.6 | 0.2 | 0.5 | |||||||||||||||||||||||||||||||||||
| Total ALLL | 100.0 | % | 100.0 | % | 100.0 | % | 100.0 | % | 100.0 | % | ||||||||||||||||||||||||||||||
| 2014 | % of Loan Type to Total Loans | 2013 | % of Loan Type to Total Loans | 2012 | % of Loan Type to Total Loans | 2011 | % of Loan Type to Total Loans | 2010* | % of Loan Type to Total Loans | |||||||||||||||||
| ALLL allocation | ||||||||||||||||||||||||||
| Commercial & industrial | $ | 3,191 | 32.7 | % | $ | 1,798 | 29.9 | % | $ | 1,969 | 35.7 | % | $ | 1,965 | 32.6 | % | $ | 4,572 | 33.3 | % | ||||||
| Owner-occupied CRE* | 1,230 | 20.7 | 766 | 22.1 | 1,069 | 19.3 | 347 | 23.3 | 556 | 23.5 | ||||||||||||||||
| AG production | 53 | 1.6 | 18 | 1.7 | — | 0.1 | — | — | — | — | ||||||||||||||||
| AG real estate | 226 | 4.8 | 59 | 4.4 | — | 2.1 | — | 0.2 | — | 0.5 | ||||||||||||||||
| CRE investment | 511 | 9.3 | 505 | 10.7 | 337 | 13.9 | 393 | 14.1 | 209 | 12.4 | ||||||||||||||||
| Construction & land development | 2,685 | 5.0 | 4,970 | 5.1 | 2,580 | 3.9 | 2,035 | 5.2 | 2,165 | 6.1 | ||||||||||||||||
| Residential construction* | 140 | 1.3 | 229 | 1.5 | 137 | 1.4 | 311 | 2.0 | 285 | 1.7 | ||||||||||||||||
| Residential first mortgage | 866 | 18.0 | 544 | 18.2 | 685 | 15.5 | 405 | 11.9 | 304 | 11.0 | ||||||||||||||||
| Residential junior mortgage* | 337 | 5.9 | 321 | 5.8 | 312 | 7.1 | 419 | 9.0 | 482 | 9.1 | ||||||||||||||||
| Retail & other | 49 | 0.7 | 22 | 0.6 | 31 | 1.0 | 24 | 1.7 | 62 | 2.4 | ||||||||||||||||
| Total ALLL | $ | 9,288 | 100.0 | % | $ | 9,232 | 100.0 | % | $ | 7,120 | 100.0 | % | $ | 5,899 | 100.0 | % | $ | 8,635 | 100.0 | % | ||||||
| ALLL category as a percent of total ALLL: | ||||||||||||||||||||||||||
| Commercial & industrial | 34.4 | % | 19.5 | % | 27.7 | % | 33.3 | % | 53.0 | % | ||||||||||||||||
| Owner-occupied CRE | 13.2 | 8.3 | 15.0 | 5.9 | 6.4 | |||||||||||||||||||||
| AG production | 0.6 | 0.2 | — | — | — | |||||||||||||||||||||
| AG real estate | 2.4 | 0.6 | — | — | — | |||||||||||||||||||||
| CRE investment | 5.5 | 5.5 | 4.7 | 6.6 | 2.4 | |||||||||||||||||||||
| Construction & land development | 28.9 | 53.8 | 36.2 | 34.5 | 25.1 | |||||||||||||||||||||
| Residential construction | 1.5 | 2.5 | 1.9 | 5.3 | 3.3 | |||||||||||||||||||||
| Residential first mortgage | 9.3 | 5.9 | 9.6 | 6.9 | 3.5 | |||||||||||||||||||||
| Residential junior mortgage | 3.6 | 3.5 | 4.4 | 7.1 | 5.6 | |||||||||||||||||||||
| Retail & other | 0.6 | 0.2 | 0.5 | 0.4 | 0.7 | |||||||||||||||||||||
| Total ALLL | 100.0 | % | 100.0 | % | 100.0 | % | 100.0 | % | 100.0 | % | ||||||||||||||||
Nonperforming Assets
As part of its overall credit risk management process, management has been committed to an aggressive problem loan identification philosophy. This philosophy has been implemented through the ongoing monitoring and review of all pools of risk in the loan portfolio to ensure that problem loans are identified early and the risk of loss is minimized.
| 34 |
Nonperforming loans are considered one indicator of potential future loan losses. Nonperforming loans are defined as nonaccrual loans, including those defined as impaired under current accounting standards, and loans 90 days or more past due but still accruing interest. Loans are generally placed on nonaccrual status when contractually past due 90 days or more as to interest or principal payments. Additionally, whenever management becomes aware of facts or circumstances that may adversely impact the collectability of principal or interest on loans, it is management’s practice to place such loans on nonaccrual status immediately. Nonaccrual loans were $5.4$20.3 million (consisting of $1.1$0.3 million originated loans and $4.3$20.0 million acquired loans) at December 31, 20142016, up $16.8 million, compared to $10.3$3.5 million (consisting of $0.8$0.6 million originated loans and $9.5$2.9 million acquired loans) at December 31, 2013. Nonperforming2015. OREO was $2.1 million at December 31, 2016, up $1.7 million, compared to $0.4 million at December 31, 2015. Consequently, nonperforming assets (i.e. nonperforming loans plus OREO) were $7.4$22.3 million at December 31, 20142016, up $18.4 million, compared to $12.3$3.9 million at December 31, 2013.2015, with the increase attributable to the 2016 acquisitions adding nonaccrual loans and OREO was flat at $2.0 million at December 31, 2014 and 2013.properties, plus the transfer into OREO at December 31, 2014 included $0.5 million of bank owned premises which was moved to OREOproperties that are no longer in anticipation of sale.use. Nonperforming assets as a percent of total assets were 0.61%increased to 0.97% at December 31, 20142016 compared to 1.02%0.32% at December 31, 2013 with the decrease attributable to resolutions of acquired nonaccrual balances.
The level of potential problem loans is another predominant factor in determining the relative level of risk in the loan portfolio and in determining the adequacy of the ALLL. Potential problem loans are generally defined by management to include loans rated as Substandard by management but that are in performing status; however, there are circumstances present which might adversely affect the ability of the borrower to comply with present repayment terms. The decision of management to include performing loans in potential problem loans does not necessarily mean that Nicolet expects losses to occur, but that management recognizes a higher degree of risk associated with these loans. The loans that have been reported as potential problem loans are predominantly commercial-based loans covering a diverse range of businesses and real estate property types. Potential problem loans totaled $5.4$12.6 million and $18.7$9.2 million, and represented 0.6%0.8% and 2.2%1.0% of total outstanding loans at December 31, 20142016 and 2013,2015, respectively. Potential problem loans require a heightened management review of the pace at which a credit may deteriorate, the duration of asset quality stress, and uncertainty around the magnitude and scope of economic stress that may be felt by Nicolet’s customers and on underlying real estate values.
Table 10: Nonperforming Assets
As of December 31,
(dollars in thousands)
| 2014 | 2013 | 2012 | 2011 | 2010 | ||||||||||||||||
| Nonaccrual loans: | ||||||||||||||||||||
Commercial & industrial | $ | 171 | $ | 68 | $ | 784 | $ | 1,744 | $ | 3,715 | ||||||||||
Owner-occupied CRE | 1,667 | 1,087 | 1,960 | 934 | 1,092 | |||||||||||||||
AG production | 21 | 11 | — | — | — | |||||||||||||||
AG real estate | 392 | 448 | — | — | — | |||||||||||||||
CRE investment | 911 | 4,631 | — | 716 | 130 | |||||||||||||||
Construction & land development | 934 | 1,265 | 2,560 | 3,367 | 3,331 | |||||||||||||||
Residential construction | — | — | — | 1,480 | 1,380 | |||||||||||||||
Residential first mortgage | 1,155 | 2,365 | 1,580 | 1,129 | 595 | |||||||||||||||
Residential junior mortgage | 141 | 262 | — | 105 | 55 | |||||||||||||||
Retail & other | — | 129 | 142 | 1 | 5 | |||||||||||||||
Total nonaccrual loans considered impaired | 5,392 | 10,266 | 7,026 | 9,476 | 10,303 | |||||||||||||||
Accruing loans past due 90 days or more | — | — | — | — | 500 | |||||||||||||||
Total nonperforming loans | 5,392 | 10,266 | 7,026 | 9,476 | 10,803 | |||||||||||||||
Commercial real estate owned | 697 | 935 | 71 | 139 | 228 | |||||||||||||||
| Construction & land development real estate owned | 139 | 854 | 17 | 427 | 1,140 | |||||||||||||||
Residential real estate owned | 630 | 198 | 105 | 75 | 75 | |||||||||||||||
Bank property real estate owned | 500 | — | — | — | — | |||||||||||||||
OREO | 1,966 | 1,987 | 193 | 641 | 1,443 | |||||||||||||||
Total nonperforming assets | $ | 7,358 | $ | 12,253 | $ | 7,219 | $ | 10,117 | $ | 12,246 | ||||||||||
Performing troubled debt restructurings | 3,777 | 3,970 | — | — | — | |||||||||||||||
| Ratios | ||||||||||||||||||||
Nonperforming loans to total loans | 0.6 | % | 1.2 | % | 1.3 | % | 2.0 | % | 2.1 | % | ||||||||||
Nonperforming assets to total loans plus OREO | 0.8 | % | 1.4 | % | 1.3 | % | 2.1 | % | 2.4 | % | ||||||||||
Nonperforming assets to total assets | 0.61 | % | 1.02 | % | 0.97 | % | 1.49 | % | 1.81 | % | ||||||||||
ALLL to nonperforming loans | 172.3 | % | 89.9 | % | 101.3 | % | 62.3 | % | 79.9 | % | ||||||||||
ALLL to total loans | 1.05 | % | 1.09 | % | 1.29 | % | 1.25 | % | 1.68 | % | ||||||||||
| 2016 | 2015 | 2014 | 2013 | 2012 | ||||||||||||||||
| Nonaccrual loans: | ||||||||||||||||||||
| Commercial & industrial | $ | 358 | $ | 204 | $ | 171 | $ | 68 | $ | 784 | ||||||||||
| Owner-occupied CRE | 2,894 | 951 | 1,667 | 1,087 | 1,960 | |||||||||||||||
| AG production | 9 | 13 | 21 | 11 | — | |||||||||||||||
| AG real estate | 208 | 230 | 392 | 448 | — | |||||||||||||||
| CRE investment | 12,317 | 1,040 | 911 | 4,631 | — | |||||||||||||||
| Construction & land development | 1,193 | 280 | 934 | 1,265 | 2,560 | |||||||||||||||
| Residential construction | 260 | — | — | — | — | |||||||||||||||
| Residential first mortgage | 2,990 | 674 | 1,155 | 2,365 | 1,580 | |||||||||||||||
| Residential junior mortgage | 56 | 141 | 141 | 262 | — | |||||||||||||||
| Retail & other | — | — | — | 129 | 142 | |||||||||||||||
| Total nonaccrual loans considered impaired | 20,285 | 3,533 | 5,392 | 10,266 | 7,026 | |||||||||||||||
| Accruing loans past due 90 days or more | — | — | — | — | — | |||||||||||||||
| Total nonperforming loans | 20,285 | 3,533 | 5,392 | 10,266 | 7,026 | |||||||||||||||
| Commercial & industrial | 64 | — | — | — | — | |||||||||||||||
| Commercial real estate owned | 304 | 52 | 697 | 935 | 71 | |||||||||||||||
| Construction & land development real estate owned | 623 | — | 139 | 854 | 17 | |||||||||||||||
| Residential real estate owned | 29 | — | 630 | 198 | 105 | |||||||||||||||
| Bank property real estate owned | 1,039 | 315 | 500 | — | — | |||||||||||||||
| OREO | 2,059 | 367 | 1,966 | 1,987 | 193 | |||||||||||||||
| Total nonperforming assets | $ | 22,344 | $ | 3,900 | $ | 7,358 | $ | 12,253 | $ | 7,219 | ||||||||||
| Performing troubled debt restructurings | — | — | 3,777 | 3,970 | — | |||||||||||||||
| Ratios | ||||||||||||||||||||
| Nonperforming loans to total loans | 1.29 | % | 0.40 | % | 0.61 | % | 1.21 | % | 1.27 | % | ||||||||||
| Nonperforming assets to total loans plus OREO | 1.42 | % | 0.44 | % | 0.83 | % | 1.44 | % | 1.31 | % | ||||||||||
| Nonperforming assets to total assets | 0.97 | % | 0.32 | % | 0.61 | % | 1.02 | % | 0.97 | % | ||||||||||
| ALLL to nonperforming loans | 58.3 | % | 291.7 | % | 172.3 | % | 89.9 | % | 101.3 | % | ||||||||||
| ALLL to total loans | 0.75 | % | 1.18 | % | 1.05 | % | 1.09 | % | 1.29 | % | ||||||||||
Table 11 shows the approximate gross interest that would have been recorded if the loans accounted for on a nonaccrual basis forat the years ended as indicatedend of each year shown had performed in accordance with their original terms, in contrast to the amount of interest income that was included in interest income on such loans for the period. The interest income recognized generally includes cash interest received and potentially includes prior nonaccrual interest on acquired loans which existed at acquisition and was subsequently collected.
| 35 |
Table 11: Foregone Loan Interest
For the Years Ended December 31,
(dollars in thousands)
| 2014 | 2013 | 2012 | ||||||||||
Interest income in accordance with original terms | $ | 654 | $ | 1,062 | $ | 1,008 | ||||||
Interest income recognized | (667 | ) | (699 | ) | (236 | ) | ||||||
Reduction (increase) in interest income | $ | (13 | ) | $ | 363 | $ | 772 | |||||
| 2016 | 2015 | 2014 | ||||||||||
| Interest income in accordance with original terms | $ | 1,979 | $ | 429 | $ | 709 | ||||||
| Interest income recognized | (1,789 | ) | (416 | ) | (667 | ) | ||||||
| Reduction in interest income | $ | 190 | $ | 13 | $ | 42 | ||||||
Investment Securities Portfolio
The investment securities portfolio is intended to provide Nicolet with adequate liquidity, flexible asset/liability management and a source of stable income. The portfolio is structured with minimal credit exposure to Nicolet. All securities are classified as available for sale (“AFS”) and are carried at fair value.
Table 12: Investment Securities Portfolio
As of December 31,
(dollars in thousands)
| 2014 | 2013 | |||||||||||||||||||||||
Amortized Cost | Fair Value | % of Total | Amortized Cost | Fair Value | % of Total | |||||||||||||||||||
| U.S. Government sponsored enterprises | $ | 1,025 | $ | 1,039 | 1 | % | $ | 2,062 | $ | 2,057 | 2 | % | ||||||||||||
| State, county and municipals | 102,472 | 102,776 | 61 | % | 54,594 | 55,039 | 43 | % | ||||||||||||||||
| Mortgage-backed securities | 61,497 | 61,677 | 37 | % | 68,642 | 67,879 | 53 | % | ||||||||||||||||
Corporate debt securities | 220 | 220 | - | % | 220 | 220 | - | % | ||||||||||||||||
Equity securities | 1,571 | 2,763 | 1 | % | 905 | 2,320 | 2 | % | ||||||||||||||||
Total securities AFS | $ | 166,785 | $ | 168,475 | 100 | % | $ | 126,423 | $ | 127,515 | 100 | % | ||||||||||||
| 2016 | 2015 | 2014 | ||||||||||||||||||||||||||||||||||
| Amortized Cost | Fair Value | %of Total | Amortized Cost | Fair Value | % of Total | Amortized Cost | Fair Value | %of Total | ||||||||||||||||||||||||||||
| U.S. Government sponsored enterprises | $ | 1,981 | $ | 1,963 | 1 | % | $ | 287 | $ | 294 | - | % | $ | 1,025 | $ | 1,039 | 1 | % | ||||||||||||||||||
| State, county and municipals | 191,721 | 187,243 | 51 | % | 104,768 | 105,021 | 61 | % | 102,472 | 102,776 | 61 | % | ||||||||||||||||||||||||
| Mortgage-backed securities | 161,309 | 159,129 | 44 | % | 61,600 | 61,464 | 36 | % | 61,497 | 61,677 | 37 | % | ||||||||||||||||||||||||
| Corporate debt securities | 12,117 | 12,169 | 3 | % | 1,140 | 1,140 | 1 | % | 220 | 220 | - | % | ||||||||||||||||||||||||
| Equity securities | 2,631 | 4,783 | 1 | % | 3,196 | 4,677 | 2 | % | 1,571 | 2,763 | 1 | % | ||||||||||||||||||||||||
| Total securities AFS | $ | 369,759 | $ | 365,287 | 100 | % | $ | 170,991 | $ | 172,596 | 100 | % | $ | 166,785 | $ | 168,475 | 100 | % | ||||||||||||||||||
At December 31, 2014,2016, the total carrying value of investment securities was $168$365.3 million, up $41from $172.6 million or 32% fromat December 31, 2013, reflecting deployment2015, and represented 15.9% and 14.2% of cash from steady deposit growthtotal assets at December 31, 2016 and 2015, respectively. The $192.7 million increase since December 31, 2015 was largely attributable to securities acquired in 2014.the 2016 acquisitions which added a higher proportion of mortgage-backed securities and corporate debt securities. At December 31, 2014,2016, the securities portfolio did not contain securities of any single issuer, including any securities issued by a state or political subdivision that were payable from and secured by the same source of revenue or taxing authority where the aggregate carrying value of such securities exceeded 10% of shareholders’stockholders’ equity.
In addition to AFS securities, Nicolet had other investments of $8$17.5 million and $8.1 million at December 31, 20142016 and 2013,2015, respectively, consisting of capital stock in the Federal Reserve, Federal Agricultural Mortgage Corporation, and the FHLB (required as members of the Federal Reserve Bank System and the FHLB System), and to a lesser degree equity investments in other private companies. The FHLB and Federal Reserve investments are “restricted” in that they can only be sold back to the respective institutions or another member institution at par, and are thus not liquid, have no ready market or quoted market value, and are carried at cost. The remaining investments have no quoted market prices, and are carried at cost less other than temporarily impaired (“OTTI”) charges, if any. These other investments are evaluated periodically for impairment, considering financial condition and other available relevant information. A $0.5 million OTTI charge was recorded in fourth quarter 2016 related to a private company equity investment based on circumstances arising at year end which management determined would likely impact the future earning capacity of the underlying operating company. There were no OTTI charges recorded in 20142015 or 2013.2014.
| 36 |
Table 13: Investment Securities Portfolio Maturity Distribution
As of December 31, 2014
(dollars in thousands)
| Within One Year | After One but Within Five Years | After Five but Within Ten Years | After Ten Years | Mortgage- related and Equity Securities | Total Amortized Cost | Total Fair Value | ||||||||||||||||||||||||||||||||||||||||||||||
| Amount | Yield | Amount | Yield | Amount | Yield | Amount | Yield | Amount | Yield | Amount | Yield | Amount | ||||||||||||||||||||||||||||||||||||||||
| U.S. Government sponsored enterprises | $ | — | — | % | $ | 1,981 | 2.9 | % | $ | — | — | % | $ | — | — | % | $ | — | — | % | $ | 1,981 | 2.9 | % | $ | 1,963 | ||||||||||||||||||||||||||
| State and county municipals | 9,833 | 2.4 | $ | 74,168 | 2.7 | % | 106,416 | 2.7 | 1,304 | 3.2 | — | — | 191,721 | 2.7 | 187,243 | |||||||||||||||||||||||||||||||||||||
| Mortgage-backed securities | — | — | — | — | — | — | — | — | 161,309 | 3.1 | 161,309 | 3.1 | 159,129 | |||||||||||||||||||||||||||||||||||||||
| Corporate debt securities | — | — | 5,139 | 6.5 | — | — | 6,978 | 5.4 | — | — | 12,117 | 5.9 | 12,169 | |||||||||||||||||||||||||||||||||||||||
| Equity securities | — | — | — | — | — | — | — | — | 2,631 | 3.7 | 2,631 | 3.7 | 4,783 | |||||||||||||||||||||||||||||||||||||||
| Total amortized cost | $ | 9,833 | 2.4 | % | $ | 81,288 | 2.9 | % | $ | 106,416 | 2.7 | % | $ | 8,282 | 5.1 | % | $ | 163,940 | 3.1 | % | $ | 369,759 | 3.0 | % | $ | 365,287 | ||||||||||||||||||||||||||
| Total fair value and carrying value | $ | 9,835 | $ | 80,847 | $ | 102,401 | $ | 8,292 | $ | 163,912 | $ | 365,287 | ||||||||||||||||||||||||||||||||||||||||
| 3 | % | 22 | % | 28 | % | 2 | % | 45 | % | 100 | % | |||||||||||||||||||||||||||||||||||||||||
Within One Year | After One but Within Five Years | After Five but Within Ten Years | After Ten Years | Mortgage- related and Equity Securities | Total Amortized Cost | Total Fair Value | ||||||||||||||||||||||||||||||||||||||||
| Amount | Yield | Amount | Yield | Amount | Yield | Amount | Yield | Amount | Yield | Amount | Yield | Amount | ||||||||||||||||||||||||||||||||||
| U.S. Government sponsored enterprises | $ | 502 | 2.8 | % | $ | 145 | 1.5 | % | $ | 378 | 2.0 | % | — | — | — | — | % | $ | 1,025 | 2.3 | % | $ | 1,039 | |||||||||||||||||||||||
| State and county municipals | $ | 4,512 | 2.8 | % | $ | 92,371 | 2.5 | % | $ | 5,025 | 3.2 | % | $ | 564 | 4.4 | % | $ | — | — | % | $ | 102,472 | 2.6 | % | $ | 102,776 | ||||||||||||||||||||
| Mortgage-backed securities | — | — | — | — | — | — | — | — | 61,497 | 3.3 | % | $ | 61,497 | 3.3 | % | $ | 61,677 | |||||||||||||||||||||||||||||
| Corporate debt securities | — | — | — | — | — | — | $ | 220 | 2.0 | % | — | — | $ | 220 | 2.0 | % | $ | 220 | ||||||||||||||||||||||||||||
| Equity securities | — | — | — | — | — | — | — | — | 1,571 | 6.2 | % | $ | 1,571 | 6.2 | % | $ | 2,763 | |||||||||||||||||||||||||||||
| Total amortized cost | $ | 5,014 | 2.8 | % | $ | 92,516 | 2.5 | % | $ | 5,403 | 3.1 | % | $ | 784 | 3.7 | % | $ | 63,068 | 3.4 | % | $ | 166,785 | 2.9 | % | $ | 168,475 | ||||||||||||||||||||
| Total fair value and carrying value | $ | 5,038 | $ | 92,771 | $ | 5,430 | $ | 796 | $ | 64,440 | $ | 168,475 | ||||||||||||||||||||||||||||||||||
| (1) | The yield on tax-exempt investment securities is computed on a tax-equivalent basis using a federal tax rate of 34% adjusted for the disallowance of interest expense. |
Deposits
Deposits represent Nicolet’s largest source of funds. Nicolet competes with other bank and nonbank institutions for deposits, as well as with a growing number of non-deposit investment alternatives available to depositors, such as mutual funds, money market funds, annuities, and other brokerage investment products. Challenges to deposit growth include competitive deposit product features, price changes on deposit products given movements in the rate environment and other competitive pricing pressures, and customer preferences regarding higher-costing deposit products or non-deposit investment alternatives.
Table 14: Deposits
At December 31,
(dollars in thousands)
| 2014 | 2013 | |||||||||||||||
| Amount | % of Total | Amount | % of Total | |||||||||||||
Demand | $ | 203,502 | 19.2 | % | $ | 171,321 | 16.6 | % | ||||||||
Money market and NOW accounts | 494,945 | 46.7 | % | 492,499 | 47.6 | % | ||||||||||
Savings | 120,258 | 11.3 | % | 97,601 | 9.4 | % | ||||||||||
Time | 241,198 | 22.8 | % | 273,413 | 26.4 | % | ||||||||||
Total | $ | 1,059,903 | 100.0 | % | $ | 1,034,834 | 100.0 | % | ||||||||
| 2016 | 2015 | 2014 | ||||||||||||||||||||||
| Amount | % of Total | Amount | % of Total | Amount | % of Total | |||||||||||||||||||
| Demand | $ | 482,300 | 24.5 | % | $ | 226,554 | 21.5 | % | $ | 203,502 | 19.2 | % | ||||||||||||
| Money market and NOW accounts | 964,509 | 49.0 | 486,677 | 46.1 | 494,945 | 46.7 | ||||||||||||||||||
| Savings | 221,282 | 11.2 | 136,733 | 12.9 | 120,258 | 11.3 | ||||||||||||||||||
| Time | 301,895 | 15.3 | 206,453 | 19.5 | 241,198 | 22.8 | ||||||||||||||||||
| Total | $ | 1,969,986 | 100.0 | % | $ | 1,056,417 | 100.0 | % | $ | 1,059,903 | 100.0 | % | ||||||||||||
Total deposits were $1.1$2.0 billion at December 31, 2014, up $252016, an increase of $914 million or 2%86.5% over December 31, 2013. On2015; however, excluding the impact of $822 million deposits added at acquisition in 2016, deposits grew 8.7%. As brokered deposits are not significant, customer-based deposits continue to grow organically from stable customer relationships. Total average deposits for the year, total deposits2016 were $1.0$1.6 billion, an increase of $197$621 million or 24%60.8% over 2013. As noted2015. On average, the mix of deposits changed between 2016 and 2015, with 2016 carrying more demand (i.e. non-interest bearing) deposits, money market and NOW accounts, and less in Table 1, average brokered deposits decreased 7% as maturing deposits were not renewedsavings and the predominant deposit increase remains organic growth with stable customer relationships, though brokered deposits remain an available source of funding.time deposits.
| 37 |
Table 15: Average Deposits
For the Years Ended December 31,
(dollars in thousands)
| 2014 | 2013 | |||||||||||||||
| Amount | % of Total | Amount | % of Total | |||||||||||||
Demand | $ | 180,122 | 17.5 | % | $ | 138,175 | 16.7 | % | ||||||||
| Money market and NOW accounts | 472,814 | 46.0 | % | 377,290 | 45.4 | % | ||||||||||
Savings | 110,969 | 10.8 | % | 79,164 | 9.5 | % | ||||||||||
Time | 264,431 | 25.7 | % | 236,255 | 28.4 | % | ||||||||||
Total | $ | 1,028,336 | 100.0 | % | $ | 830,884 | 100.0 | % | ||||||||
| 2016 Average | 2015 Average | 2014 Average | ||||||||||||||||||||||
| Amount | % of Total | Amount | % of Total | Amount | % of Total | |||||||||||||||||||
| Demand | $ | 383,146 | 23.4 | % | $ | 211,624 | 20.7 | % | $ | 180,122 | 17.5 | % | ||||||||||||
| Money market and NOW accounts | 776,756 | 47.3 | 455,344 | 44.6 | 472,814 | 46.0 | ||||||||||||||||||
| Savings | 193,933 | 11.8 | 126,894 | 12.4 | 110,969 | 10.8 | ||||||||||||||||||
| Time | 288,059 | 17.5 | 227,293 | 22.3 | 264,431 | 25.7 | ||||||||||||||||||
| Total | $ | 1,641,894 | 100.0 | % | $ | 1,021,155 | 100.0 | % | $ | 1,028,336 | 100.0 | % | ||||||||||||
Table 16: Maturity Distribution of Certificates of Deposit of $100,000 or More
At December 31,
(dollars in thousands)
| 2014 | 2013 | |||||||
3 months or less | $ | 11,134 | $ | 19,932 | ||||
Over 3 months through 6 months | 7,632 | 11,825 | ||||||
Over 6 months through 12 months | 15,783 | 23,739 | ||||||
Over 12 months | 41,855 | 34,960 | ||||||
Total | $ | 76,404 | $ | 90,456 | ||||
| 2016 | 2015 | 2014 | ||||||||||
| 3 months or less | $ | 19,058 | $ | 6,856 | $ | 11,134 | ||||||
| Over 3 months through 6 months | 11,428 | 5,733 | 7,632 | |||||||||
| Over 6 months through 12 months | 31,569 | 19,319 | 15,783 | |||||||||
| Over 12 months | 59,208 | 58,934 | 41,855 | |||||||||
| Total | $ | 121,263 | $ | 90,842 | $ | 76,404 | ||||||
Other Funding Sources
Other funding sources which may include short-term borrowings (mostly federal funds purchased or repurchase agreements)(zero at December 31, 2016 and 2015) and long-term borrowings (notes payable and junior subordinated debentures), were $34(totaling $37.6 million and $52$39.8 million at December 31, 20142016 and 2013, respectively.2015, respectively). Short-term borrowings consisted solelyconsist mainly of customer repurchase agreements totaling $7maturing in less than nine months or federal funds purchased. Long-term borrowings include notes payable (consisting of FHLB advances and a joint venture note, prior to its refinance in 2016 from an outside lender to the Bank subsequently requiring elimination in consolidation), junior subordinated debentures (largely qualifying as Tier 1 capital for regulatory purposes given their long maturity dates, even though they are redeemable in whole or in part at par), and subordinated debt (issued in 2015 with 10-year maturities, callable on or after the fifth anniversary date of their respective issuance dates, and qualifying as Tier 2 capital for regulatory purposes). Notes payable declined $14.4 million to $1.0 million at December 31, 2013 and zero at December 31, 2014. Notes payable are long-term borrowings consisting2016, given the elimination of athe joint venture note and repayments of FHLB advances totaling $21during 2016. Junior subordinated debentures increased $12.2 million to $24.7 million at year end 2016, attributable to acquired Baylake debentures at fair value. Subordinated debt increased $0.1 million to $11.9 million at December 31, 2014, down $11 million from December 31, 2013 attributable to scheduled principal payments2016, given amortization of capitalized issuance costs. The interest on the joint venture note payable and non-renewal of maturing FHLB advances. See Note 8, “Notes Payable,” of the Notes to Consolidated Financial Statements, under Item 8, for additional details. All notes payable acquired in the Mid-Wisconsin acquisition were paid off prior to June 30, 2013. Additionalall long-term borrowings areis current, and while the various junior subordinated debentures with carrying values of $12 million at December 31, 2014 and 2013. Further discussion on the junior subordinated debentures is included in Note 9, “Junior Subordinated Debentures” of the Notes to Consolidated Financial Statements under Item 8. These debentures, one existing since July 2004 and one acquired in the 2013 Mid-Wisconsin transaction, mature in July 2034 and December 2035, respectively, though both may be calledare callable at par plus any accrued but unpaid interest. Thereinterest, there are no current plans to redeem these debentures early. At December 31, 2014See Note 9, “Notes Payable,” Note 10, “Junior Subordinated Debentures”, and 2013, $12 millionNote 11, “Subordinated Notes” of trust preferred securities qualify as Tier 1 capital.
Additional funding sources consist of a $10 million available and unused line of credit at the holding company, $75$143 million of available and unused federalFederal funds purchased lines, and available total borrowing capacity at the FHLB of $65$181 million of which $11.5$9.0 million was used at December 31, 2014.
Off-Balance Sheet Obligations
As of December 31, 20142016, 2015 and 2013,2014, Nicolet had the following lending-related commitments that did not appear on its balance sheet:
Table 17: Commitments
At December 31,
(dollars in thousands)
| 2016 | 2015 | 2014 | ||||||||||
| Commitments to extend credit — fixed and variable rate | $ | 554,980 | $ | 302,591 | $ | 269,648 | ||||||
| Financial letters of credit — fixed rate | 12,444 | 2,610 | 2,996 | |||||||||
| Standby letters of credit — fixed rate | 4,898 | 4,314 | 3,629 | |||||||||
| 38 |
| 2014 | 2013 | |||||||
Commitments to extend credit — Fixed and variable rate | $ | 269,648 | $ | 234,930 | ||||
Financial letters of credit — fixed rate | 2,996 | 2,493 | ||||||
Standby letters of credit — fixed rate | 3,629 | 3,878 | ||||||
These commitments to extend credit are agreements to lend to a customer as long as there is no violation of any condition established in the contract. The commitments generally have fixed expiration dates or other termination clauses and may require payment of a fee. Since many of the commitments are expected to expire without being drawn upon, the total commitment amounts do not necessarily represent future cash requirements. Further discussion of these commitments is included in Note 14,16, “Commitments and Contingencies” of the Notes to Consolidated Financial Statements, under Part II, Item 8.
Contractual Obligations
Nicolet is party to various contractual obligations requiring the use of funds as part of its normal operations. The table below outlines principal amounts and timing of these obligations, excluding amounts due for interest, if applicable. Most of these obligations are routinely refinanced into similar replacement obligations. However, renewal of these obligations is dependent on itsthe ability to offerprocure competitive interest rates, liquidity needs, or availability of collateral for pledging purposes supporting the long-term advances.
Table 18: Contractual Obligations
As of December 31,
| Maturity by Years | ||||||||||||||||||||
| Total | 1 or less | 1-3 | 3-5 | Over 5 | ||||||||||||||||
| Junior subordinated debentures | $ | 12,328 | $ | — | $ | — | $ | — | $ | 12,328 | ||||||||||
| Joint venture note | 9,675 | 263 | 9,412 | — | — | |||||||||||||||
| FHLB borrowings | 11,500 | 5,500 | 5,000 | 1,000 | — | |||||||||||||||
| Total long-term borrowing obligations | $ | 33,503 | $ | 5,763 | $ | 14,412 | $ | 1,000 | $ | 12,328 | ||||||||||
| Maturity by Years | ||||||||||||||||||||
| Total | 1 or less | 1-3 | 3-5 | Over 5 | ||||||||||||||||
| Junior subordinated debentures | $ | 24,732 | $ | — | $ | — | $ | — | $ | 24,732 | ||||||||||
| Subordinated notes | 11,885 | — | — | — | 11,885 | |||||||||||||||
| Notes payable | 1,000 | — | 1,000 | — | — | |||||||||||||||
| Operating leases | 3,781 | 685 | 1,329 | 1,085 | 682 | |||||||||||||||
| Total long-term contractual obligations | $ | 41,398 | $ | 685 | $ | 2,329 | $ | 1,085 | $ | 37,299 | ||||||||||
Liquidity
Liquidity management refers to the ability to ensure that cash is available in a timely and cost-effective manner to meet cash flow requirements of depositors and borrowers and to meet other commitments as they fall due, including the ability to pay dividends to shareholders, service debt, invest in subsidiaries, repurchase common stock, and satisfy other operating requirements.
Funds are available from a number of basic banking activity sources including, but not limited to, the core deposit base; amortization, repayment and maturity of loans; maturing investments and investments sales; and procurement of brokered deposits. All investment securities are classified as available for sale and are reported at fair value on the consolidated balance sheet. Approximately 21%At December 31, 2016, approximately 8.3% of the $168$365.3 million investment securities portfolio on hand at December 31, 2014carrying value was pledged to secure public deposits and short-term borrowings, and repurchase agreements, as applicable, and for other purposes as required by law. Other funding sources available include the ability to procure short-term borrowings, federal funds purchased, and long-term borrowings.
Dividends from Nicolet Nationalthe Bank represent a significant source of cash flow for the Parent Company. The Bank is required by federal law to obtain prior approval of the OCC for payments of dividends if the total of all dividends declared by the Bank in any year will exceed certain thresholds, as more fully described in “Business—Regulation of the Bank – Payment of Dividends” and in Note 1719, “Regulatory Capital Requirements and Restrictions on Dividends,” in the Notes to the Consolidated Financial Statements under Part II, Item B.8. Management does not believe that regulatory restrictions on dividends from the Bank will adversely affect its ability to meet its cash obligations.
Cash and cash equivalents at December 31, 20142016 and 20132015 were approximately $69$129.1 million and $147$83.6 million, respectively. The increased cash and cash equivalents for 2016 when compared to historical levels was predominantly due to strong customer deposit growth as Nicolet continuesgrowth. The $45.5 million increase in cash and cash equivalents since year end 2015 included $24.7 million net cash provided by operating activities and $51.5 million from investing activities (mostly due to buildthe net cash acquired with the 2016 acquisitions, offset partly by net investment purchase activity), exceeding the $30.7 million net cash used in financing activities (primarily from reductions in short-term and long-term borrowings, common stock repurchases and preferred stock redemption exceeding cash inflow from strong customer relationships in all of the markets served, followed by greater deployment of that cash in 2014 than in 2013 into loans and investments.deposit growth). Nicolet’s liquidity resources were sufficient as of December 31, 20142016 to fund loans, accommodate deposit trends and cycles, and to meet other cash needs as necessary.
| 39 |
Interest Rate Sensitivity Management
A reasonable balance between interest rate risk, credit risk, liquidity risk and maintenance of yield, is highly important to Nicolet’s business success and profitability. As an ongoing part of its financial strategy and risk management, Nicolet attempts to understand and manage the impact of fluctuations in market interest rates on its net interest income. The consolidated balance sheet consists mainly of interest-earning assets (loans, investments and cash) which are primarily funded by interest-bearing liabilities (deposits and other borrowings). Such financial instruments have varying levels of sensitivity to changes in market rates of interest. Market rates are highly sensitive to many factors beyond our control, including but not limited to general economic conditions and policies of governmental and regulatory authorities. Our operating income and net income depends,depend, to a substantial extent, on “rate spread” (i.e., the difference between the income earned on loans, investments and other earning assets and the interest expense paid to obtain deposits and other funding liabilities).
Asset-liability management policies establish guidelines for acceptable limits on the sensitivity to changes in interest rates on earnings and market value of assets and liabilities. Such policies are set and monitored by management and the board of director’sdirectors’ Asset and Liability Committee.
To understand and manage the impact of fluctuations in market interest rates on net interest income, Nicolet measures its overall interest rate sensitivity through a net interest income analysis, which calculates the change in net interest income in the event of hypothetical changes in interest rates under different scenarios versus a baseline scenario. Such scenarios can involve static balance sheets, balance sheets with projected growth, parallel (or non-parallel) yield curve slope changes, immediate or gradual changes in market interest rates, and one-year or longer time horizons. The simulation modeling uses assumptions involving market spreads, prepayments of rate-sensitive instruments, renewal rates on maturing or new loans, deposit retention rates, and other assumptions.
The following analysis assessed the impact on net interest income in the event of a gradual +/-100 bps and +/-200 bps decreasechange in market rates (parallel to the change in prime rate) over a one-year time horizon to a static (flat) balance sheet. The interest rate scenarios are used for analytical purposes only and do not necessarily represent management’s view of future market interest rate movements. Based on financial data at December 31, 2014,2016, the projected changes in net interest income over a one-year time horizon, versus the baseline, was -2.7%-1.7%, -1.0%-0.8%, -1.0%-0.6% and -1.6%-1.1% for the -200, -100, +100 and +200 bps scenarios, respectively; such results are within Nicolet’s guidelines of not greater than -15% for +/- 100 bps and not greater than -20% for +/- 200 bps.
Actual results may differ from these simulated results due to timing, magnitude and frequency of interest rate changes, as well as changes in market conditions and their impact on customer behavior and management strategies.
Capital
Management regularly reviews the adequacy of its capital to ensure that sufficient capital is available for current and future needs and is in compliance with regulatory guidelines and actively reviews capital strategies in light of perceived business risks associated with current and prospective earning levels, liquidity, asset quality, economic conditions in the markets served, and level of returns available to shareholders. Management intends to maintain an optimal capital and leverage mix for growth and for shareholder return.
Capital balances and changes in capital are presented in the Consolidated Statements of Changes in Stockholders’ Equity in Part II, Item 8 and are described in Note 12,14, “Stockholders’ Equity,” and a summary of Nicolet’s and Nicolet National Bank’s regulatory capital amounts and ratios as of December 31, 2014for Nicolet and 2013the Bank are presented in Note 17,19, “Regulatory Capital Requirements and Restrictions of Dividends” of the Notes to Consolidated Financial Statements under Part II, Item 8.
The most notable capital-related actions in 2016 were: 1) on February 24, 2016, Nicolet’s common stock moved off the OTCBB and began trading on the Nasdaq Capital Market under the trading symbol “NCBS”, 2) the April 2016 issuance of common stock in connection with the Baylake merger and acquisition of a financial advisor business, 3) the September 2016 redemption of the final $12.2 million of its preferred stock, 4) common stock repurchases, and 5) the closure of 7 branches during 2016. The most notable capital-related actions in 2015 were: 1) the issuance of $12 million in 5% fixed rate, 10-year subordinated debt during the first half of 2015 (which qualifies as Tier 2 regulatory capital), 2) the September 2015 partial redemption of $12.2 million, or half, of its preferred stock at par, 3) common stock repurchases, and 3) the August 2015 sale of two outlying branches and accompanying loans and deposits.
On April 29, 2016, in connection with its acquisition of Baylake, Nicolet issued 4,344,243 shares of its common stock for consideration of $163.3 million, and recorded $1.2 million consideration for assumed stock options. Approximately $0.3 million of common stock issuance expenses related to the transaction were incurred and charged against additional paid in capital. In connection with the financial advisor business acquisition that completed April 1, 2016, Nicolet issued $2.6 million in common stock consideration.
Nicolet participated in the Small Business Lending Fund (“SBLF”) beginning in September 2011. The Company received $24.4 million for the issuance of 24,400 shares of Non-cumulative Perpetual Preferred Stock, Series C, with $1,000 per share liquidation value. The preferred stock qualified as Tier 1 capital for regulatory purposes and provided capital and liquidity for Nicolet’s small business lending, potential acquisition opportunities and defensive capital for the uncertain economic environment. Nicolet paid an annual dividend rate of 5% from initial funding through September 30, 2013, paid 1% thereafter through February 29, 2016, and paid 9% from March 1, 2016 through the date of redemption in September 2016. Nicolet redeemed $12.2 million (half) of its preferred stock in September 2015 and the remaining half in September 2016, as part of its capital plan and partially motivated by the adjustment of the preferred stock dividend rate to 9%.
| 40 |
As a result of the foregoing, Nicolet’s total capital was $275.9 million (100% common equity) at December 31, 2014, Nicolet’s capital structure includes $24.42016, compared to $109.5 million (or 22%)at year-end 2015 (comprised of $12.2 million or 11% preferred equity and $97.3 million or 89% common equity). The $166.4 million increase in total equity since year end 2015 was dominated by the equity issued in relation to the 2016 acquisitions as noted above and $18.5 million of net income, exceeding the preferred stock redemption, common stock repurchases, a $3.7 million other comprehensive loss (related to market value declines in the investment portfolio given rate movements at year end 2016), $0.6 million of preferred stock dividends and $86.6 million (or 78%) of commonother net activity in stock equity. Beginningcompensation and equity award activity in the fourth quarter of 2013, given growth in qualifying small business loans, Nicolet qualified for a 1% annual dividend rate on its preferred stock issued to the Treasury related to its participation in the SBLF, compared to the previous 5% annual rate paid by Nicolet, resulting in the $0.7 million reduction in preferred stock dividend between 2014 and 2013.
Common equity to total assets at December 31, 2014 of 7.13% increased2016 was 12.0%, up from 6.71%8.0% at December 31, 20132015, and continues to reflect capacity to capitalize on opportunities. Book value per common share increased to $32.26 at year end 2016, up 37.7% over $23.42 at year end 2015. Common shares outstanding more than doubled from a year ago, to 8.55 million at December 31, 2016 from 4.15 million at December 31, 2015, predominantly attributable to the 2016 acquisitions.
Nicolet’s regulatory capital ratios remain strong and well above minimum regulatory ratios. At December 31, 2016, Nicolet’s Total, Tier 1, Common Equity Tier 1 (“CET1”) risk-based ratios and its leverage ratio were 13.9%, 12.6%, 11.3% and 10.3%, respectively, compared to the minimum regulatory requirements of 8.0%, 6.0%, 4.5% and 4.0%, respectively. Also, at December 31, 2016, the Bank’s Total, Tier 1, CETI and leverage ratios were 12.2%, 11.5%, 11.5% and 9.4%, respectively, and qualify the Bank as well-capitalized under the prompt-corrective action framework with hurdles of 10.0%, 8.0%, 6.5% and 5.0%, respectively. This strong base of capital has allowed Nicolet to be opportunistic in the current environment and in strategic growth.
Nicolet has demonstrated the ability to raise capital efficiently directly related to acquisition transactions. Further, Nicolet’s investors have demonstrated a strong commitment to capital, providing common capital when needed, with the two most recent examples being a December 2008 private placement raising $9.5 million in common capital as we entered the economic crisis and the April 2013 private placement raising $2.9 million in common capital alongside the predominately stock-for-stock Mid-Wisconsin merger which added $9.7 million in common capital. Book value per common share increased to $21.34 at year end 2014 from $18.97 at year end 2013 aided by retained earningsIn managing capital for optimal return, we evaluate capital sources and share reductions. Duringuses, pricing and availability of our stock in the market, and alternative uses of capital (such as the level of organic growth or acquisition opportunities) in light of strategic plans. In early 2014, a common stock repurchase program was authorized to use up toand with subsequent modifications (the latest being January 17, 2017 for an additional $12 million to repurchase up to 625,000250,000 more shares of common stock), the Board has authorized the use of up to $30 million to repurchase up to 1,050,000 shares of Nicolet common stock as an alternative use of capital. In 2014, $5.6During 2016, $4.4 million was used to repurchase 257,291 commonand cancel 114,914 shares at a weighted average price of $21.95 per share of $37.98 including commissions.
A source of income and funds for Nicolet as the parent company of Nicolet Nationalthe Bank are dividends from the Bank. Dividends declared by the Bank that exceed the retained net income for the most current year plus retained net income for the preceding two years must be approved by federal regulatory agencies. During the third quarter of 2016, the Bank requested approval from the regulatory agencies to a pay a $15 million special dividend out of Bank surplus and it was approved. The Bank paid dividends to the parent company of $35.5 million (which includes the special dividend) in 2016 and $11.0 million in 2015. At December 31, 2014,2016, the Bank could pay dividends of approximately $8.8$1.1 million more without seeking regulatory approval. During 2014,
In July 2013, the Federal Reserve Board and the OCC issued final rules implementing the Basel III regulatory capital framework and related Dodd-Frank Act changes. The final rules took effect for Nicolet and the Bank paid $9 millionon January 1, 2015, subject to a transition period for certain parts of dividendsthe rules. See Part I, Item 1, “Business”, “- Supervision and Regulation”, for additional information. The rules permitted certain banking organizations to retain, through a one-time election, the parent company,existing treatment for accumulated other comprehensive income. Nicolet and paid no dividends during 2013.
Effects of Inflation
The effect of inflation on a financial institution differs significantly from the effect on an industrial company. While a financial institution’s operating expenses, particularly salary and employee benefits, are affected by general inflation, the asset and liability structure of a financial institution consists largely of monetary items. Monetary items, such as cash, investments, loans, deposits and deposits,other borrowings, are those assets and liabilities which are or will be converted into a fixed number of dollars regardless of changes in prices. As a result, changes in interest rates have a more significant impact on a financial institution’s performance than does general inflation. For additional information regarding interest rates and changes in net interest income see “Interest Rate Sensitivity Management.” Inflation may have impacts on the Bank’s customers, on businesses and consumers and their ability or willingness to invest, save or spend, and perhaps on their ability to repay loans. As such, there would likely be impacts on the general appetite of banking products and the credit health of the Bank’s customer base.
| 41 |
Fourth Quarter 20142016 Results
Nicolet recorded net income of $2.4$6.1 million for the fourth quarter of 2014,2016, compared to net income of $1.0$2.8 million for the fourth quarter of 2013.2015. Net income available to common equity for the fourth quarter of 20142016 was $2.4$6.1 million, or $0.55$0.68 for diluted earnings per common share, compared to $0.9$2.8 million, or $0.22,$0.64, respectively for the fourth quarter of 2013.2015. Between the comparable quarters, net income available to common was up 118%, while diluted weighted average shares were up 105%, resulting in a 6% increase in diluted earnings per share. See Table 19 for selected quarterly information.
Taxable equivalent net interest income for the fourth quarter of 20142016 was $10.8$20.6 million, similarcompared to $10.7$11.0 million for the same quarter of 2013.2015. Positive changes from balance sheet volume added $9.3 million to net interest income and mix improvements were nearly offset by unfavorablepredominantly due to the Baylake merger, while favorable changes in rates.rates added $0.3 million to net interest income (the net of $0.4 million less interest income from lower earning asset yields and $0.7 million less interest expense on lower cost of funds). The net interest margin between the comparable quarters was down 16up 4 bps to 3.83%4.05% in the fourth quarter of 2014,2016, comprised of an 18a 10 bps lowerhigher interest rate spread (to 3.68%3.93%, as the yield on earning assets declined 17decreased by 25 bps and the rate on interest-bearing liabilities increased 1decreased by 35 bps) offset byand a 2 bps higher contribution from net free funds.
Average earning assets were $2.0 billion for the fourth quarter of 2016 compared to $1.1 billion for the fourth quarter of 2014, an increase of $0.1 billion from the fourth quarter of 2013,2015, with average loans up $19 million(up $676 million) and nonloan earning assets (up $250 million) representing 78% and 22% of average earning assets (including increases in commerciallow-earning cash at 3% of earning assets), respectively, compared to fourth quarter 2015’s mix of 82% loans and residential mortgages, of $6 million and $13 million, respectively) and investments up $32 million.18% nonloan earning assets (with cash at 1%). On the funding side, average interest-bearing deposits were up $37$643 million, average demand deposits increased $32$252 million and average short and long-term funding balances decreased (down $27$3 million combined).
The provision for loan losses decreased $1.6was $0.5 million between the comparablefor both fourth quarter periods. The provision was $0.7 million,periods, while net charge offs were $1.4$0.1 million for the fourth quarter of 2014, which included one charge-off of $1.3 million on a commercial credit that was being monitored and provided for during the year. For the fourth quarter of 2013, the provision was $2.3 million, while net charge offs were $2.2 million, which included one net charge off of $1.8 million on a fully resolved grain credit acquired with Mid-Wisconsin that was not marked initially at acquisition.
Noninterest income for the fourth quarter of 20142016 increased $0.4$3.3 million (12%(73%) to $3.9$7.9 million versus the fourth quarter of 2013.2015. Net mortgage income increased $0.4loss on sale and write-down of assets was $0.5 million for fourth quarter 2016 due to an OTTI charge on a private company equity investment, compared to net gains of $0.7 million for fourth quarter 2015 attributable to OREO (with a large gain on sale of an OREO property partly offset by a write-down on a bank premise OREO), for a $1.2 million unfavorable variance between quarters. Other increases across line items were primarily commensurate with the larger volumes due to the year-over-year increase in2016 acquisitions, but notably brokerage fee income increased $1.4 million, mortgage loan production. All remainingincome, net increased $1.2 million, service charges on deposits increased $0.5 million, trust fees increased $0.2 million and other noninterest income categories on a combined basis were unchanged from the fourth quarter of 2013.
On a comparable quarter basis, noninterest expense decreased $0.2increased $8.1 million (2%(79%) to $10.1$18.4 million in the fourth quarter of 2014. Personnel expense increased $0.32016 (which included $0.4 million (5%) frommerger-based expenses) over the fourth quarter of 2013, primarily the net2015 (including $0.7 million merger based expenses). Personnel expense of higher health insurance benefits offset partly by lower salaries expense (with fewer average FTE employees, offsetting merit increases between the years). All remaining noninterest expense categories on a combined basis were down $0.4$9.3 million, compared toincreased $3.8 million (68%) over the fourth quarter of 20132015, primarily from cost control efforts, despite $0.5due to merit increases and the larger workforce after the 2016 acquisitions (with full-time equivalent employees up 71% between December 31, 2016 and 2015). All nonpersonnel expense categories combined were up $4.3 million, ofprimarily commensurate with the larger operating base after the 2016 acquisitions, but most notably intangibles amortization up $1.0 million fully attributable to the acquisitions, data processing up $1.0 million on larger volumes and a rate increase, and occupancy, equipment and office costs relatedcombined up $1.3 million given the expanded footprint, additional integration and communication costs to a fourth quarter 2014 debit card fraud event.
For the fourth quarter of 2014,2016, Nicolet recognized income tax expense of $1.2$2.9 million, compared to income tax expense of $0.5$1.6 million for the fourth quarter of 2013.2015. The change in income tax was primarily due to the level of pretax income between the comparable quarters. The effective tax rate was 32.6%32.4% for the fourth quarter of 2014,2016 (including higher levels of non-taxable income from BOLI, investment securities, and other equity investment holdings), compared to an effective tax rate of 31.1%36.5% for the fourth quarter of 2013.2015.
| 42 |
Selected Quarterly Financial Data
The following is selected financial data summarizing the results of operations for each quarter in the years ended December 31, 20142016 and 2013.
Table 19: Selected Quarterly Financial Data
(dollars in thousands, except per share data)
| 2016 Quarter Ended | ||||||||||||||||
| December 31, | September 30, | June 30, | March 31, | |||||||||||||
| Interest income | $ | 21,892 | $ | 22,795 | $ | 18,351 | $ | 12,429 | ||||||||
| Interest expense | 1,868 | 1,891 | 1,885 | 1,690 | ||||||||||||
| Net interest income | 20,024 | 20,904 | 16,466 | 10,739 | ||||||||||||
| Provision for loan losses | 450 | 450 | 450 | 450 | ||||||||||||
| Noninterest income | 7,894 | 8,532 | 6,370 | 3,878 | ||||||||||||
| Noninterest expense | 18,386 | 19,019 | 17,519 | 10,018 | ||||||||||||
| Net income attributable to Nicolet Bankshares, Inc. | 6,087 | 6,464 | 3,257 | 2,654 | ||||||||||||
| Net income available to common shareholders | 6,087 | 6,217 | 2,983 | 2,542 | ||||||||||||
| Basic earnings per common share* | 0.71 | 0.72 | 0.41 | 0.61 | ||||||||||||
| Diluted earnings per common share* | 0.68 | 0.69 | 0.39 | 0.57 | ||||||||||||
| 2015 Quarter Ended | ||||||||||||||||
| December 31, | September 30, | June 30, | March 31, | |||||||||||||
| Interest income | $ | 12,463 | $ | 11,859 | $ | 11,531 | $ | 12,744 | ||||||||
| Interest expense | 1,812 | 1,842 | 1,818 | 1,741 | ||||||||||||
| Net interest income | 10,651 | 10,017 | 9,713 | 11,003 | ||||||||||||
| Provision for loan losses | 450 | 450 | 450 | 450 | ||||||||||||
| Noninterest income | 4,559 | 4,185 | 4,894 | 4,070 | ||||||||||||
| Noninterest expense | 10,273 | 9,849 | 9,724 | 9,802 | ||||||||||||
| Net income attributable to Nicolet Bankshares, Inc. | 2,819 | 2,594 | 2,935 | 3,080 | ||||||||||||
| Net income available to common shareholders | 2,789 | 2,534 | 2,874 | 3,019 | ||||||||||||
| Basic earnings per common share* | 0.70 | 0.64 | 0.72 | 0.75 | ||||||||||||
| Diluted earnings per common share* | 0.64 | 0.58 | 0.66 | 0.70 | ||||||||||||
*Cumulative quarterly per share performance may not equal annual per share totals due to the effects of the amount and timing of capital increases. When computing earnings per share for an interim period, the denominator is based on the weighted average shares outstanding during the interim period, and not on an annualized weighted average basis. Accordingly, the sum of the quarters' earnings per share data will not necessarily equal the year to date earnings per share data.
2015 Compared to 2014
2015 was a year for balance sheet and capital management, with continued focus on financial performance and acquisitions. At December 31, 2015, Nicolet had assets of $1.2 billion, loans of $877 million and deposits of $1.1 billion. Net income attributed to Nicolet was $11.4 million for 2015, 15% higher than 2014, and after preferred stock dividends, diluted earnings per common share was $2.57, 14% higher than 2014. Earnings for 2015 were especially characterized by steady return over an improved mix of average interest-earning assets with slightly lower aggregate discount accretion on acquired loans between the years, strong secondary mortgage income, net gains on sales of investments and other real estate owned (“OREO”), and expense management, while also accommodating costs related to the pending Baylake merger. Strong asset quality metrics resulted in a lower 2015 loan loss provision than for 2014. As part of its active capital management, Nicolet sold two outlying branches in August 2015, issued $12 million of subordinated debt in the first half of 2015, redeemed $12.2 million of its preferred stock in September 2015 at par, and continued to repurchase its common stock until September 2015. As a result, total equity was $110 million at December 31, 2015, with preferred equity down $12 million and common equity up $11 million net (from retained earnings and issued common equity exceeding common stock repurchases for the year) compared to year end 2014. Return on average assets of 0.96% and return on average common equity of 12.35% indicates solid performance traction in 2015.
| 43 |
| 2014 Quarter Ended | ||||||||||||||||
| December 31, | September 30, | June 30, | March 31, | |||||||||||||
Interest income | $ | 12,264 | $ | 12,623 | $ | 12,329 | $ | 11,733 | ||||||||
Interest expense | 1,751 | 1,730 | 1,833 | 1,753 | ||||||||||||
Net interest income | 10,513 | 10,893 | 10,496 | 9,980 | ||||||||||||
Provision for loan losses | 675 | 675 | 675 | 675 | ||||||||||||
Noninterest income | 3,900 | 3,645 | 2,880 | 3,760 | ||||||||||||
Noninterest expense | 10,114 | 9,523 | 9,484 | 9,588 | ||||||||||||
Net income | 2,416 | 2,765 | 2,554 | 2,214 | ||||||||||||
Net income available to common shareholders | 2,355 | 2,704 | 2,493 | 2,153 | ||||||||||||
Basic earnings per common share | 0.58 | 0.66 | 0.59 | 0.51 | ||||||||||||
Diluted earnings per common share | 0.55 | 0.63 | 0.58 | 0.50 | ||||||||||||
| 2013 Quarter Ended | ||||||||||||||||
| December 31, | September 30, | June 30, | March 31, | |||||||||||||
Interest income | $ | 12,240 | $ | 13,437 | $ | 10,358 | $ | 7,161 | ||||||||
Interest expense | 1,709 | 1,634 | 1,540 | 1,409 | ||||||||||||
Net interest income | 10,531 | 11,803 | 8,818 | 5,752 | ||||||||||||
Provision for loan losses | 2,275 | 1,975 | 975 | 975 | ||||||||||||
Noninterest income | 3,472 | 5,742 | 13,766 | 2,756 | ||||||||||||
Noninterest expense | 10,281 | 10,224 | 9,586 | 6,340 | ||||||||||||
Net income | 982 | 2,947 | 11,457 | 755 | ||||||||||||
Net income available to common shareholders | 921 | 2,642 | 11,152 | 450 | ||||||||||||
Basic earnings per common share | 0.22 | 0.62 | 2.79 | 0.13 | ||||||||||||
Diluted earnings per common share | 0.22 | 0.62 | 2.78 | 0.13 | ||||||||||||
Net income attributable to Nicolet was $11.4 million for 2015, and after $0.2 million of preferred stock dividends, net income available to common shareholders was $11.2 million, or $2.57 per diluted common share. Comparatively, 2014 net income attributable to Nicolet was $9.9 million, and after $0.2 million of preferred stock dividends, net income available to common shareholders was $9.7 million or $2.25 per diluted common share. Between the years, net income increased 14.9% and diluted earnings per common share increased 14.2%. Return on average assets improved to 0.96% for 2015, compared to 0.84% for 2014. Return on average common equity was 12.35% for 2015, compared to 11.55% for 2014. Book value per common share was $23.42 at December 31, 2015, up 9.7% over $21.34 at December 31, 2014.
As part of its capital management, Nicolet sold two outlying branches in August 2015 (at that time reducing deposits by $34 million, loans by $13 million, fixed assets by $1 million and cash by $20 million), issued $12 million of 5% fixed-rate, 10-year subordinated debt in the first half of 2015 (increasing its regulatory Tier 2 capital), redeemed $12.2 million or half of its then outstanding SBLF Series C Preferred Stock in September 2015 at par (reducing total capital, regulatory Tier 1 capital, and the future cost of capital), and used $4.2 million to repurchase 146,404 common shares at a weighted average per share price of $28.35 including commissions.
Other key factors behind the results were:
| 44 |
Critical Accounting Policies
The consolidated financial statements of Nicolet are prepared in conformity with U.S. generally accepted accounting principles (“GAAP”) and follow general practices within the industry in which it operates. This preparation requires management to make estimates, assumptions and judgments that affect the amounts reported in the consolidated financial statements and accompanying notes. These estimates, assumptions and judgments are based on information available as of the date of the consolidated financial statements; accordingly, as this information changes, actual results could differ from the estimates, assumptions and judgments reflected in the consolidated financial statements. Certain policies inherently have a greater reliance on the use of estimates, assumptions and judgments and, as such, have a greater possibility of producing results that could be materially different than originally reported. Estimates that are particularly susceptible to significant change include the valuation of loans acquired in the 2013 and 2016 acquisitions, as well as the determination of the allowance for loan losses and income taxes and, therefore, are critical accounting policies. The critical accounting policies are discussed directly with Nicolet’s Audit Committee.
Business Combinations and Valuation of Loans Acquired in Business Combinations
We account for acquisitions under FASBFinancial Accounting Standards Board (“FASB”) ASC Topic 805,Business Combinations, which requires the use of the acquisition method of accounting. Assets acquired and liabilities assumed in a business combination are recorded at estimated fair value on their purchase date. As provided for under GAAP, management has up to 12 months following the date of the acquisition to finalize the fair values of acquired assets and assumed liabilities, where it was not possible to estimate the acquisition date fair value upon consummation. Management finalized the fair values of acquired assets and assumed liabilities within this 12-month period and management currently considers such values to be the Day 1 Fair Values.Values for the 2016 acquisitions, but management may revise the Day 1 Fair Values for the 2016 acquisitions through April 2017. This was completed for the Mid-Wisconsin transaction during the second quarter of 20142013 and was completed for the Bank of Wausau transaction in the third quarter of 2014.
In particular, the valuation of acquired loans involves significant estimates, assumptions and judgment based on information available as of the acquisition date. Substantially all loans acquired in the transaction are evaluated either individually or in pools of loans with similar characteristics; and since the estimated fair value of acquired loans includes a credit consideration, no carryover of any previously recorded allowance for loan losses is recorded at acquisition. A number of factors are considered in determining the estimated fair value of purchased loans including, among other things, the remaining life of the acquired loans, estimated prepayments, estimated loss ratios, estimated value of the underlying collateral, estimated holding periods, contractual interest rates compared to market interest rates, and net present value of cash flows expected to be received.
In determining the Day 1 Fair Values of acquired loans, management calculates a nonaccretable difference (the credit mark component of the acquired loans) and an accretable difference (the market rate or yield component of the acquired loans). The nonaccretable difference is the difference between the undiscounted contractually required payments and the undiscounted cash flows expected to be collected in accordance with management’s determination of the Day 1 Fair Values. Subsequent decreases to the expected cash flows will generally result in a provision for loan losses. Subsequent increases in cash flows will result in a reversal of the provision for loan losses to the extent of prior charges and then an adjustment to accretable yield, and nonaccretable difference which would have a positive impact on interest income.
The accretable yield on acquired loans is the difference between the expected cash flows and the initial investment in the acquired loans. The accretable yield is recognized into earnings using the effective yield method over the term of the loans. Management separately monitors the acquired loan portfolio and periodically reviews loans contained within this portfolio against the factors and assumptions used in determining the Day 1 Fair Values.
| 45 |
Allowance for Loan Losses
The allowance for loan losses is a reserve for estimated credit losses on individually evaluated loans determined to be impaired as well as estimated credit losses inherent in the loan portfolio. Actual credit losses, net of recoveries, are deducted from the ALLL. Loans are charged off when management believes that the collectability of the principal is unlikely. Subsequent recoveries, if any, are credited to the ALLL. A provision for loan losses, which is a charge against earnings, is recorded to bring the ALLL to a level that, in management’s judgment, is adequate to absorb probable losses in the loan portfolio. Management’s evaluation process used to determine the appropriateness of the ALLL is subject to the use of estimates, assumptions, and judgment. The evaluation process involves gathering and interpreting many qualitative and quantitative factors which could affect probable credit losses. Because interpretation and analysis involves judgment, current economic or business conditions can change, and future events are inherently difficult to predict, the anticipated amount of estimated loan losses and therefore the appropriateness of the ALLL could change significantly.
The allocation methodology applied by Nicolet is designed to assess the appropriateness of the ALLL and includes allocations for specifically identified impaired loans and loss factor allocations for all remaining loans, with a component primarily based on historical loss rates and a component primarily based on other qualitative factors. The methodology includes evaluation and consideration of several factors, such as, but not limited to, management’s ongoing review and grading of loans, facts and issues related to specific loans, historical loan loss and delinquency experience, trends in past due and nonaccrual loans, existing risk characteristics of specific loans or loan pools, the fair value of underlying collateral, current economic conditions and other qualitative and quantitative factors which could affect potential credit losses. While management uses the best information available to make its evaluation, future adjustments to the allowance may be necessary if there are significant changes in economic conditions or circumstances underlying the collectability of loans. Because each of the criteria used is subject to change, the allocation of the ALLL is made for analytical purposes and is not necessarily indicative of the trend of future loan losses in any particular loan category. The total allowance is available to absorb losses from any segment of the loan portfolio. Management believes the ALLL is appropriate at December 31, 2014.2016. The allowance analysis is reviewed by the board of directors on a quarterly basis in compliance with regulatory requirements. In addition, various regulatory agencies periodically review the ALLL. These agencies may require Nicolet to make additions to the ALLL based on their judgments of collectability based on information available to them at the time of their examination.
Income taxes
The assessment of income tax assets and liabilities involves the use of estimates, assumptions, interpretation, and judgment concerning certain accounting pronouncements and federal and state tax codes. There can be no assurance that future events, such as court decisions or positions of federal and state taxing authorities, will not differ from management’s current assessment, the impact of which could be significant to the consolidated results of operations and reported earnings.
Nicolet files a consolidated federal income tax return and a combined state income tax return (both of which include Nicolet and its wholly owned subsidiaries). Accordingly, amounts equal to tax benefits of those companies having taxable federal losses or credits are reimbursed by the companies that incur federal tax liabilities. Amounts provided for income tax expense are based on income reported for financial statement purposes and do not necessarily represent amounts currently payable under tax laws. Deferred income tax assets and liabilities are computed annually for differences between the financial statement and tax bases of assets and liabilities that will result in taxable or deductible amounts in the future based on enacted tax law rates applicable to the periods in which the differences are expected to affect taxable income. As changes in tax laws or rates are enacted, deferred tax assets and liabilities are adjusted through provision for income tax expense. Valuation allowances are established when it is more likely than not that a portion of the full amount of the deferred tax asset will not be realized. In assessing the ability to realize deferred tax assets, management considers the scheduled reversal of deferred tax liabilities, projected future taxable income and tax planning strategies. Nicolet may also recognize a liability for unrecognized tax benefits from uncertain tax positions. Unrecognized tax benefits represent the differences between a tax position taken or expected to be taken in a tax return and the benefit recognized and measured in the financial statements. Penalties related to unrecognized tax benefits are classified as income tax expense.
| 46 |
Future Accounting Pronouncements
Recent accounting pronouncements adopted are included in Note 1, “Nature of Business and Significant Accounting Policies” of the Notes to Consolidated Financial Statements.
In January 2015,December 2016, the Financial Accounting Standards Board (“FASB”) issued updated guidance toAccounting Standards Update (“ASU”) 2016-19 Technical Corrections and Improvementsintended to make changes to clarify the Accounting Standards Codification or correct unintended application of guidance that is not expected to have a significant effect on current accounting practice. The ASU is effective for annual periods, including interim periods within those annual periods, beginning after December 15, 2016. The impact of the new guidance is not expected to have a material impact on the Company’s consolidated financial statements.
In March 2016, the FASB issued an amendmentupdated guidance to eliminate from U.S. GAAP the concept of extraordinary items. Presently, an event or transaction is presumedASU 2015-09: Stock Compensation Improvements to be an ordinaryEmployee Share-Based Payment Activity intended to simplify and usual activityimprove several aspects of the reporting entity unless evidence clearly supports its classification as an extraordinary item. If an event or transaction meets the criteriaaccounting for extraordinary classification, an entity is required to segregate the extraordinary item from the results of ordinary operations and show the item separately inshare-based payment transactions, including the income tax consequences, classification of such awards as either equity or liabilities and classification on the statement net of tax, after income from continuing operations. This amendedcash flows. The updated guidance will prohibit separate disclosure of extraordinary items in the income statement. This amendment is effective for interim and annual reporting periods beginning after December 15, 2016, with early adoption permitted. The Company is currently assessing the impact of the new guidance on its consolidated financial statements.
In June 2016, the FASB issued ASU 2016-13,Financial Instruments – Credit Losses (Topic 326): Measurement of Credit Losses on Financial Instruments intended to improve the financial reporting by requiring timelier recording of credit losses on loans and other financial instruments held by financial institutions and other organizations. The ASU requires the measurement of all expected credit losses for financial assets held at the reporting date based on historical experience, current conditions, and reasonable and supportable forecasts. Financial institutions and other organizations will now use forward-looking information to better inform their credit loss estimates. The ASU is effective for SEC filers for fiscal years, and interim periods within those fiscal years, beginning after December 15, 2015. The Company intends2019. Entities should apply the amendment by means of a cumulative-effect adjustment to adopt the accounting standard during the first quarter of 2016 with no material impact anticipated.
In June 2014,August 2016, the FASB issued an amendmentASU 2016-15,Statement of Cash Flows (Topic 230): Classification of Certain Cash Receipts to the stock compensation accounting guidance to clarify that a performance target that affects vesting of a share-based paymentaddress diversity in how certain cash receipts and that could be achieved after the requisite service period be treated as a performance condition. As such, the performance target should not be reflected in estimating the grant-date fair value of the award. Compensation cost should be recognizedcash payments are presented and classified in the period in which it becomes probable that the performance target will be achieved and should represent the compensation cost attributable to the period(s) for which the requisite service has already been rendered. This amendment is effective for annual reporting periods, including interim periods within those annual periods, beginning after December 15, 2015. The Company intends to adopt the accounting standard during the first quarterstatement of 2016 with no material impact anticipated.
In May 2014, the FASB issued an amendment to clarify the principles for recognizing revenue and to develop a common revenue standard. The standard outlines a single comprehensive model for entities to use in accounting for revenue arisingASU 2014-09,Revenue from contractsContracts with customers and supersedes most current revenue recognition guidance, including industry-specific guidance. Customers (Topic 606).The core principle of the revenue modelguidance is that “anan entity recognizesshould recognize revenue to depict the transfer of promised goods orand services to customers in an amount that reflects the consideration to which the entity expects to be entitled in exchange for those goods orand services.” The standard applies to all contracts with customers except those that are within the scope of other topics in In August 2015, the FASB Codification.issued an amendment to defer the effective date for all entities by one year. The standard also requires significantly expanded disclosures about revenue recognition. The amendmentupdated guidance is effective for annual reporting periods beginning after December 15, 2016 (including2017, including interim reporting periods within those periods). Early applicationthat reporting period. The Company is currently assessing the impact of the new guidance on its consolidated financial statements. Since a significant number of business transactions are not subject to the guidance, it is not permitted. The Company intendsexpected to adopt the accounting standard during the first quarter of 2017 and is currently evaluating thehave a significant impact on itsour financial statements.
In January 2014,February 2016, the FASB issued an amendment to clarify that an in substance repossession or foreclosure occurs, and a creditor is considered to have received physical possession of residential real estate property collateralizing a consumer mortgage loan, upon either the creditor obtaining legal title to the residential real estate property upon completion of a foreclosure or the borrower conveying all interest in the residential real estate property to the creditor to satisfy that loan through completion of a deed in lieu of foreclosure or through a similar agreement. In addition, the amendments require interim and annual disclosure of both the amount of foreclosed residential real estate property held by the creditor and the recorded investment in consumer mortgage loans collateralized by residential real estate property that are in the process of foreclosure in accordance with local requirementsASU 2016-02,Leases (Topic 842).The core principle of the applicable jurisdiction. This amendmentguidance is a lessee should recognize the assets and liabilities that arise from leases. The recognition, measurement, and presentation of expenses and cash flows arising from a lease by a lessee primarily will depend on its classification as a finance or operating lease. However, unlike current GAAP which requires only capital leases to be recognized on the balance sheet, the new standard will require both types of leases to be recognized on the balances sheet. The updated guidance is effective for fiscal years, and interimannual reporting periods within those years, beginning after December 15, 2014.2018. Early adoptionapplication is permitted. The Company intends to adoptis currently assessing the accounting standard during the first quarter of 2015 with no material impact anticipated.
ITEM 7A. QUANTITATIVE AND QUALITATIVE DISCLOSURES ABOUT MARKET RISK For additional disclosure, see section, “Interest Rate Sensitivity Management,” of the Management’s Discussion and Analysis of Financial Condition and Results of Operation under Part II, Item 7.
Nature of Banking Activities and Subsidiaries: Nicolet Bankshares, Inc. (the “Company” or “Nicolet”) was incorporated on April 5, 2000. Effective June 6, 2002, Nicolet Bankshares, Inc. received approval to become a one-bank holding company owning 100% of the common stock of Nicolet National Bank (the “Bank”).During 2004, the Company entered into a joint venture, Nicolet Joint Ventures, LLC (the “JV”), with a real estate development and investment firm (the “Firm”) in connection with the selection and development of a site for a new headquarters facility. The Firm is considered a related party, as one of its principals is a Board member and shareholder of the Company. The JV involves a 50% ownership by the Company. See Note During 2008, the Company purchased 100% of Brookfield Investment Partners, LLC (“Brookfield Investments”), an investment advisory firm that provides investment strategy and transactional services to financial institutions. Goodwill of $0.8 million was recorded in conjunction with this purchase. In 2013, the Company consummated its acquisition of Mid-Wisconsin Financial Services, Inc. (“Mid-Wisconsin”), whereby In 2013, the Company acquired selected assets and assumed During late 2016, the Company capitalized Nicolet Advisory Services, LLC (“Nicolet Advisory”), a wholly owned registered investment advisor subsidiary to provide brokerage and investment advisory services to customers. In 2016, the Company consummated its acquisition of Baylake Corp. (“Baylake”), whereby Baylake was merged with and into the Company, and Baylake Bank, Baylake’s wholly owned commercial bank subsidiary serving northeast Wisconsin, was merged with and into the Bank. Goodwill of $65.5 million was recorded in conjunction with this purchase. In 2016, the Company in a private transaction hired a select group of financial advisors and purchased their respective books of business and their operating platform. Goodwill of $0.4 million was recorded in conjunction with this purchase. Collectively, the Baylake and financial advisory transactions are referred to as “the 2016 acquisitions.” See Note 2 for additional disclosures. Through its acquisition of Baylake, the Bank owns a 49.8% indirect interest in United Financial Services, LLC (“UFS, LLC”), a data processing service and e-banking entity, through its 99.2% ownership of United Financial Services, Inc. (“UFS, Inc.”). Collectively, UFS, Inc. and UFS, LLC are referred to as “UFS”. The investment in UFS is carried in other assets under the equity method of accounting, and the Bank’s pro rata share of UFS income is included in noninterest income. Income in equity of UFS recognized by the Bank was $1.0 million for the year ended December 31, 2016. Amounts paid to UFS for data processing services by the Bank were $1.6 million and $0.9 million in 2016 and 2015, respectively. Loans to UFS were $0.2 million at December 31, 2016 compared to none at the end of 2015. The carrying value of the Bank’s investment in UFS was $8.3million at December 31, 2016. Principles of Consolidation: The consolidated financial statements of the Company include the accounts of the Bank, Brookfield Investments, Nicolet Advisory and the JV. The consolidated financial statements have been prepared in conformity with accounting principles generally accepted in the United States of America (“U.S. GAAP”) and conform to general practices within the banking industry. All significant intercompany accounts and transactions have been eliminated in the consolidated financial statements. Results of operations of companies purchased, if any, are included from the date of acquisition.
NICOLET BANKSHARES, INC. AND SUBSIDIARIES
Operating Segment:The consolidated income of the Company is derived principally from the Bank, which conducts lending (primarily commercial-based loans, as well as residential and consumer loans) and deposit gathering (including other banking- and deposit-related products and services, such as ATMs, safe deposit boxes, check-cashing, wires, and debit cards) to businesses, consumers and governmental units principally in its trade area of northeastern and central Wisconsin, and Menominee, Michigan, trust Use of Estimates : Preparation of financial statements in conformity with U.S. GAAP requires management to make estimates and assumptions that affect the amounts reported in the consolidated financial statements and accompanying disclosures. These estimates are based on management’s best knowledge of current events and actions the Company may undertake in the future. Estimates are used in accounting for, among other items, determination of the allowance for loan losses, valuation of loans in acquisition transactions, useful lives for depreciation and amortization, fair value of financial instruments, other-than-temporary impairment of investments, valuation of deferred tax assets, uncertain income tax positions and contingencies. Estimates that are particularly susceptible to significant change for the Company include the determination of the allowance for loan losses, determination and assessment of deferred tax assets and liabilities, and the valuation of loans acquired in the 2013 and 2016 acquisitions; therefore, these are critical accounting policies. Management does not anticipate any material changes to estimates in the near term. Factors that may cause sensitivity to the aforementioned estimates include but are not limited to: external market factors such as market interest rates and employment rates, changes to operating policies and procedures, and changes in applicable banking or tax regulations.Actual results may ultimately differ from estimates, although management does not generally believe such differences would materially affect the consolidated financial statements in any individual reporting period presented. Business Combinations: The Company accounts for business combinations under the acquisition method of accounting in accordance with Accounting Standards Codification (“ASC”) 805,Business Combinations (“ASC 805”). The Company recognizes the full fair value of the assets acquired and liabilities assumed and immediately expenses transaction costs. There is no separate recognition of the acquired allowance for loan losses on the acquirer’s balance sheet as credit related factors are incorporated directly into the fair value of the net tangible and intangible assets acquired. If the amount of consideration exceeds the fair value of assets purchased less the fair value of liabilities assumed, goodwill is recorded. Alternatively, if the amount by which the fair value of assets purchased exceeds the fair value of liabilities assumed and consideration paid, a gain (“bargain purchase gain”) is recorded. Fair values are subject to refinement for up to one year after the closing date of an acquisition as information relative to closing date fair values becomes available. Results of operations of the acquired business are included in the statement of income from the effective date of the acquisition. Additional information regarding acquisitions is provided in Note 2.Cash and Cash Equivalents : For purposes of the consolidated statements of cash flows, cash and cash equivalents include cash and due from banks, federal funds sold, and interest-earning deposits in other banks with original maturities of less than 90 days, if any. The Bank maintains amounts in due from banks which, at times, may exceed federally insured limits. Management monitors these correspondent relationships. The Bank has not experienced any losses in such accounts. The Bank may have restrictions on cash and due from banks as it is required to maintain certain vault cash and reserve balances with the Federal Reserve Bank to meet specific reserve requirements. There was no reserve balance required with the Federal Reserve Bank at December 31,2015. Securities Available for Sale (“AFS”) : Securities classified as AFS are those securities that the Company intends to hold for an indefinite period of time, but not necessarily to maturity. Any decision to sell a security classified as AFS would be based on various factors, including significant movements in interest rates, changes in the maturity mix of the Company’s assets and liabilities, liquidity needs, regulatory capital considerations, and other similar factors. Securities classified as AFS are carried at fair value, with unrealized gains or losses, net of related deferred income taxes, reported as increases or decreases in accumulated other comprehensive income.
NICOLET BANKSHARES, INC. AND SUBSIDIARIES
Securities Available For Sale (“AFS”) (Continued) Realized gains or losses on securities sales (using the specific identification method) and declines in value judged to be other-than-temporary are included in the consolidated statements of income under Management evaluates investment securities for other-than-temporary impairment on at least an annual basis. A decline in the market value of any investment below amortized cost that is deemed other-than-temporary is charged to earnings for the decline in value deemed to be credit related and a new cost basis in the security is established. The decline in value attributed to non-credit related factors considered temporary in nature is recognized in other comprehensive income. In evaluating other-than-temporary impairment, management considers the length of time and extent to which the fair value has been less than cost, and the financial condition and near-term prospects of the issuer for a period sufficient to allow for any anticipated recovery in fair value in the near term. Other Investments : As a member of the Federal Reserve Bank System, Federal Agricultural Mortgage Corporation, and theLoans Held for Sale :Mortgage Servicing Rights (“MSRs”): If the Company sells originated residential mortgages into the secondary market and retains the right to service the loans sold, then a
NICOLET BANKSHARES, INC. AND SUBSIDIARIES
Loans and Allowance for Loan Losses (“ALLL”) – Originated Loans : Loans that management has the intent and ability to hold for the foreseeable future or until maturity or payoff are carried at their principal amount outstanding, net of deferred loan fees and costs. Interest income is accrued on the unpaid principal balance using the simple interest method. The accrual of interest income on loans is discontinued when, in the opinion of management, there is reasonable doubt as to the borrower’s ability to meet payment of interest or principal when due. Loans are generally placed on nonaccrual status when contractually past due 90 days or more as to interest or principal, though may be placed in such status earlier based on the circumstances. Loans past due 90 days or more may continue on accrual only when they are well secured and/or in process of collection or renewal. When interest accrual is discontinued, all previously accrued but uncollected interest is reversed against current period interest income. Except in very limited circumstances, cash collections on nonaccrual loans are credited to the loan receivable balance and no interest income is recognized on those loans until the principal balance is paid in full. Accrual of interest may be resumed when the customer is current on all principal and interest payments and has been paying on a timely basis for a period of time.Management considers a loan to be impaired when it is probable the Company will be unable to collect all contractual principal and interest payments due in accordance with the terms of the loan agreement. For determining the adequacy of the ALLL, all material loans in nonaccrual status are evaluated for impairment, together with additional loans having impairment risk characteristics. For this purpose, management has defined “material” to be a credit relationship of more than $250,000. The ALLL is a reserve for estimated credit losses on individually evaluated loans determined to be impaired as well as estimated credit losses inherent in the loan portfolio. Actual credit losses, net of recoveries, are deducted from the ALLL. Loans are charged off when management believes that the collectability of the principal is unlikely. Subsequent recoveries, if any, are credited to the ALLL. A provision for loan losses, which is a charge against earnings, is recorded to bring the ALLL to a level that, in management’s judgment, is adequate to absorb probable losses in the loan portfolio. The allocation methodology applied by the Company is designed to assess the appropriateness of the ALLL and includes allocations for specifically identified impaired loans and loss factor allocations for all remaining loans, with a component primarily based on historical loss rates and a component primarily based on other qualitative factors. Impaired loans are individually assessed and are measured based on the present value of expected future cash flows discounted at the loan’s effective interest rate or, as a practical expedient, at the loan’s observable market price or the fair value of the collateral if the loan is collateral dependent. Loans that are determined not to be impaired are collectively evaluated for impairment, stratified by type and allocated loss ranges based on the Company’s actual historical loss ratios for each strata, and adjustments are also provided for certain current environmental and qualitative factors. An internal loan review function rates loans using a grading system based on nine different categories. Loans with grades of seven or higher (“classified loans”) represent loans with a greater risk of loss and may be assigned allocations for loss based on specific review of the weaknesses observed in the individual credits if classified as impaired. Classified loans are constantly monitored by the loan review function to ensure early identification of any deterioration. The total allowance is available to absorb losses from any segment of the loan portfolio. Management believes the ALLL is appropriate at December 31, In addition, various regulatory agencies periodically review the ALLL. These agencies may require the Company to make additions to the ALLL based on their judgments of collectability based on information available to them at the time of their examination.
NICOLET BANKSHARES, INC. AND SUBSIDIARIES
Loans and ALLL – Acquired Loans: The loans purchased in the 2013 and 2016 acquisitions were acquired loans. Acquired loans are recorded at their estimated fair value at the acquisition date, and are initially classified as either purchase credit impaired (“PCI”) loans (i.e. loans that reflect credit deterioration since origination and it is probable at acquisition that the Company will be unable to collect all contractually required payments) or purchased non-impaired loans (i.e. “performing acquired loans”).PCI loans are accounted for under the accounting guidance for loans and debt securities acquired with deteriorated credit quality, found in FASB ASC Topic 310-30,Receivables—Loans and Debt Securities Acquired with Deteriorated Credit Quality Performing acquired loans are accounted for under FASB ASC Topic 310-20,Receivables—Nonrefundable Fees and Other Costs. Performance of certain loans may be monitored and based on management’s assessment of the cash flows and other facts available, portions of the accretable difference may be delayed or suspended if management deems appropriate. The Company’s policy for determining when to discontinue accruing interest on performing acquired loans and the subsequent accounting for such loans is essentially the same as the policy for originated loans described above. An ALLL is calculated using a methodology similar to that described for originated loans. Performing acquired loans are subsequently evaluated for any required allowance at each reporting date. Such required allowance for each loan pool is compared to the remaining fair value discount for that pool. If greater, the excess is recognized as an addition to the allowance through a provision for loan losses. If less than the discount, no additional allowance is recorded. Charge-offs and losses first reduce any remaining fair value discount for the loan pool and once the discount is depleted, losses are applied against the allowance established for that pool. For PCI loans after acquisition, cash flows expected to be collected are recast for each loan periodically as determined appropriate by management. If the present value of expected cash flows for a loan is less than its carrying value, impairment is reflected by an increase in the ALLL and a charge to the provision for loan losses. If the present value of the expected cash flows for a loan is greater than its carrying value, any previously established ALLL is reversed and any remaining difference increases the accretable yield which will be taken into income over the remaining life of the loan. Loans which were considered troubled debt restructurings by Mid-Wisconsin and Baylake prior to the Credit-Related Financial Instruments : In the ordinary course of business the Company has entered into financial instruments consisting of commitments to extend credit, financial letters of credit, and standby letters of credit. Financial letters of credit are issued specifically to facilitate commerce and typically result in the commitment being drawn on when the underlying transaction is consummated between the customer and the third party, while standby letters of credit generally are contingent upon the failure of the customer to perform according to the terms of the underlying contract with the third party. Such financial instruments are recorded in the consolidated financial statements when they are funded.Transfers of Financial Assets : Transfers of financial assets, primarily in loan participation activities, are accounted for as sales only when control over the assets has been surrendered. Control over transferred assets is deemed to be surrendered when (1) the assets have been isolated from the Company, (2) the transferee obtains the right (free of conditions that constrain it from taking advantage of the right) to pledge or exchange the transferred assets, and (3) the Company does not maintain effective control over the transferred assets through an agreement to repurchase them before their maturity or the ability to unilaterally cause the holder to return assets.
NICOLET BANKSHARES, INC. AND SUBSIDIARIES
Premises and Equipment : Premises and equipment are stated at cost less accumulated depreciation and amortization. Premises and equipment acquired in the 2013 and 2016 acquisitions were recorded at estimated fair value on theEstimated useful lives of new premises and equipment generally range as follows:
Other Real Estate Owned (“OREO”) : OREO acquired through partial or total satisfaction of loansGoodwill and Customer relationships were acquired in the financial advisor business acquisition in 2016. The customer list intangibles have finite lives and are amortized on a straight-line basis to expense over their initial weighted average life of approximately 12 years as of acquisition. Management periodically reviews the carrying value of its long-lived and intangible assets to determine if any impairment has occurred or whether changes in circumstances have occurred that would require a revision to the remaining useful life, in which case an impairment charge would be recorded as an expense in the period of impairment. In making such determination, management evaluates whether there are any adverse qualitative factors indicating that an impairment may exist, as well as the performance, on an undiscounted basis, of the underlying operations or assets which give rise to the intangible. The Company’s annual assessments indicated no impairment charge on goodwill or Bank-owned Life Insurance (“BOLI”): The Company owns BOLI on certain executives and employees. BOLI balances are recorded at their cash surrender values. Changes in the cash surrender values are included inShort-term Borrowings : Short-term borrowings consist primarily of overnight Federal funds purchased and securities sold under agreements to repurchase (“repos”), or other short-term borrowing arrangements. Repos are with commercial deposit customers, and are treated as financing activities carried at the amounts that will be subsequently repurchased as specified in the respective agreements. Repos generally mature within one to four days from the transaction date. The Company may be required to provide additional collateral based on the fair value of the underlying securities. There were no outstanding agreements at December 31,
NICOLET BANKSHARES, INC. AND SUBSIDIARIES
Stock-based Compensation Plans: Share-based payments to employees, including grants of restricted stock or stock options, are valued at fair value of the award on the date of grant and expensed on a straight-line basis as compensation expense over the applicable vesting period.A Black-Scholes model is utilized to estimate the fair value of stock options and the market price of the Company’s stock at the date of grant is used to estimate the value of restricted stock awards.
Income Taxes : The Company files a consolidated federal income tax return and a combined state income tax return (both of which include the Company and its wholly owned subsidiaries). Accordingly, amounts equal to tax benefits of those companies having taxable federal losses or credits are reimbursed by the companies that incur federal tax liabilities.Amounts provided for income tax expense are based on income reported for financial statement purposes and do not necessarily represent amounts currently payable under tax laws. Deferred income tax assets and liabilities are computed annually for differences between the financial statement and tax bases of assets and liabilities that will result in taxable or deductible amounts in the future based on enacted tax rates applicable to the periods in which the differences are expected to affect taxable income. As changes in tax laws or rates are enacted, deferred tax assets and liabilities are adjusted through the provision for income taxes. Valuation allowances are established when it is more likely than not that a portion of the full amount of the deferred tax asset will not be realized. In assessing the ability to realize deferred tax assets, management considers the scheduled reversal of deferred tax liabilities, projected future taxable income and tax planning strategies. At acquisition, deferred taxes were evaluated in respect to the acquired assets and assumed liabilities (including the acquired net operating losses), and a net deferred tax asset was recorded. Certain limitations within the provisions of the tax code are placed on the amount of net operating losses which can be utilized as part of acquisition accounting rules and were incorporated into the calculation of the deferred tax asset. In addition, a portion of the fair market value discounts on PCI loans which resolved in the first twelve months after the acquisition were disallowed under provisions of the tax code. The Company may also recognize a liability for unrecognized tax benefits from uncertain tax positions. Unrecognized tax benefits represent the differences between a tax position taken or expected to be taken in a tax return and the benefit recognized and measured in the consolidated financial statements. At December 31,
NICOLET BANKSHARES, INC. AND SUBSIDIARIES
Earnings Earnings per common share and related information are summarized as follows:
There were no options to purchase shares that were excluded from the calculation of diluted earnings per share at December 31, 2016. Options to purchase approximately Treasury Stock : Treasury stock is accounted for at cost on a first-in-first-out basis. It is the Company’s generalComprehensive Income : Accounting principles generally require that recognized revenue, expenses, gains and losses be included in net income. Certain changes in assets and liabilities, such as unrealized gains and losses on AFS securities, bypass the statement of income and instead are reported in accumulated other comprehensive income, as a separate component of the equity section of the balance sheet. Realized gains or losses are reclassified to current period income. Changes in these items, along with net income, are components of comprehensive income. The Company presents comprehensive income in a separate consolidated statement of comprehensive income.Reclassifications : Certain amounts in theRecent Accounting Developments Adopted :operations.
NICOLET BANKSHARES, INC. AND SUBSIDIARIES
On April closed one of its Brown County locations at the time of the merger, and closed an additional six branches in the fourth quarter of 2016, bringing the Bank’s footprint to 36 branches as of December 31, 2016. The purpose of the merger was for strategic reasons beneficial to the Company. The acquisition is consistent with its plan to drive growth value. Pursuant to the terms of the Merger Agreement, $164.2 million. The Company accounted for the transaction under the acquisition method of accounting, and thus, the financial position and results of operations of The
NICOLET BANKSHARES, INC. AND SUBSIDIARIES
The following unaudited pro forma information presents the results of operations for the year ended December 31,
During the first quarter of 2016, Nicolet agreed in a private transaction to hire a select group of financial advisors and purchase their respective books of business, as well as their operating platform, to enhance the leadership and future growth of the Company’s wealth management business. The transaction was effected in phases and completed April 1, 2016. The Company paid $4.9 million total initial consideration, including $0.8 million cash, $2.6 million of Nicolet common stock, and recorded a $1.5 million earn-out liability payable to one principal in the future (which may require adjustment based on change in initial business purchased over a period, but not contingent upon the principal’s employment). The Company initially recorded $0.4 million of goodwill, $0.2 million of fixed assets, and $4.3 million of customer relationship intangibles (a portion amortizing straight-line over 10 years and a portion over 15 years). The transaction will impact the income statement primarily within brokerage income, personnel expense, and intangibles amortization. NOTE 3. SECURITIES AVAILABLE FOR SALE Amortized costs and fair values of securities AFS are summarized as follows:
NICOLET BANKSHARES, INC. AND SUBSIDIARIES
The current fair value and associated unrealized losses on investments in debt and equity securities with unrealized losses at December 31,
At December 31, fourth quarter of 2016 compared to none in 2015 and 2014. The amortized cost and fair value of AFS securities
NICOLET BANKSHARES, INC. AND SUBSIDIARIES
AFS securities with a carrying value of Proceeds from sales of AFS securities available for sale during 2016, 2015 and 2014
The loan composition as of December 31 is summarized as follows:
As a further breakdown, loans as of December 31 are summarized by originated and acquired as follows:
NICOLET BANKSHARES, INC. AND SUBSIDIARIES
Practically all of the Company’s loans, commitments, financial letters of credit, and standby letters of credit have been granted to customers in the Company’s market area. Although the Company has a diversified loan portfolio, the credit risk in the loan portfolio is largely influenced by general economic conditions and trends of the counties and markets in which the debtors operate, and the resulting impact on the operations of borrowers or on the value of underlying collateral, if any. The ALLL represents management’s estimate of probable and inherent credit losses in the Company’s loan portfolio at the balance sheet date. In general, estimating the amount of the ALLL is a function of a number of factors, including but not limited to changes in the loan portfolio, net charge-offs, trends in past due and impaired loans, and the level of potential problem loans, all of which may be susceptible to significant change. To the extent actual outcomes differ from management estimates, additional provisions for loan losses could be required that could adversely affect our earnings or financial position in future periods. Allocations to the ALLL may be made for specific loans but the entire ALLL is available for any loan that, in management’s judgment, should be charged-off or for which an actual loss is realized. The allocation methodology used by the Company includes specific allocations for impaired loans evaluated individually for impairment based on collateral values and for the remaining loan portfolio collectively evaluated for impairment primarily based on historical loss rates and other qualitative factors. Loan charge-offs and recoveries are based on actual amounts charged-off or recovered by loan category. Management allocates the ALLL by pools of risk within each loan portfolio. The following tables present the balance and summary of activity in the ALLL in total as of December 31:
NICOLET BANKSHARES, INC. AND SUBSIDIARIES Notes to Consolidated Financial Statements
The following tables present the balance and activity in the ALLL by portfolio segment and the recorded investment in loans by portfolio segment based on the impairment method as of December 31,
NICOLET BANKSHARES, INC. AND SUBSIDIARIES
As a further breakdown, the December 31,
There was no ALLL allocated to individually evaluated loans at December 31, 2016, therefore the table reflecting the ALLL between individually evaluated loans and collectively evaluated loans was omitted.
NICOLET BANKSHARES, INC. AND SUBSIDIARIES
The following tables present the balance and activity in the ALLL by portfolio segment and the recorded investment in loans by portfolio segment based on the impairment method as of December 31,
NICOLET BANKSHARES, INC. AND SUBSIDIARIES
As a further breakdown, the December 31,
NICOLET BANKSHARES, INC. AND SUBSIDIARIES
The following table presents nonaccrual loans by portfolio segment as of December 31,
As a further breakdown, nonaccrual loans as of December 31,
NICOLET BANKSHARES, INC. AND SUBSIDIARIES
The following tables present past due loans by portfolio segment as of December 31,
2016:
As a further breakdown, past due loans as of December 31,
NICOLET BANKSHARES, INC. AND SUBSIDIARIES Notes to Consolidated Financial Statements
The following table presents past due loans by portfolio segment as of December 31,
2015:
As a further breakdown, past due loans as of December 31,
NICOLET BANKSHARES, INC. AND SUBSIDIARIES Notes to Consolidated Financial Statements
A description of the loan risk categories used by the Company follows: 1-4 Pass: Credits exhibit adequate cash flows, appropriate management and financial ratios within industry norms and/or are supported by sufficient collateral. Some credits in these rating categories may require a need for monitoring but elements of concern are not severe enough to warrant an elevated rating. 5 Watch: Credits with this rating are adequately secured and performing but are being monitored due to the presence of various short term weaknesses which may include unexpected, short term adverse financial performance, managerial problems, potential impact of a decline in the entire industry or local economy and delinquency issues. Loans to individuals or loans supported by guarantors with marginal net worth or collateral may be included in this rating category. 6 Special Mention: Credits with this rating have potential weaknesses that, without the Company’s attention and correction may result in deterioration of repayment prospects. These assets are considered Criticized Assets. Potential weaknesses may include adverse financial trends for the borrower or industry, repeated lack of compliance with Company requests, increasing debt to net worth, serious management conditions and decreasing cash flow. 7 Substandard: Assets with this rating are characterized by the distinct possibility the Company will sustain some loss if deficiencies are not corrected. All foreclosures, liquidations, and non-accrual loans are considered to be categorized in this rating, regardless of collateral sufficiency. 8 Doubtful: Assets with this rating exhibit all the weaknesses as one rated Substandard with the added characteristic that such weaknesses make collection or liquidation in full highly questionable. 9 Loss: Assets in this category are considered uncollectible. Pursuing any recovery or salvage value is impractical but does not preclude partial recovery in the future.
NICOLET BANKSHARES, INC. AND SUBSIDIARIES Notes to Consolidated Financial Statements
The following tables present loans by loan grade as of December 31:
NICOLET BANKSHARES, INC. AND SUBSIDIARIES Notes to Consolidated Financial Statements
The following table presents impaired loans as of December 31,
There were no originated impaired loans as of December 31, 2016. All loans in the table above were acquired loans. The following table presents impaired loans as of December 31,
NICOLET BANKSHARES, INC. AND SUBSIDIARIES Notes to Consolidated Financial Statements
As a further breakdown, impaired loans as of December 31,
Interest income of In April 2016, the Baylake merger added PCI loans at a fair value of $20.8 million, net of an initial $13.9 million non-accretable mark. Combining the 2013 and 2016 acquisitions, total PCI loans acquired in
NICOLET BANKSHARES, INC. AND SUBSIDIARIES Notes to Consolidated Financial Statements
Troubled Debt Restructurings At December 31,
Premises and equipment, less accumulated depreciation and amortization, is summarized as follows as of December 31:
Depreciation and amortization expense amounted to $3.2 million in 2016, $2.4 million in 2015, and $2.3 million in At December 31,
NICOLET BANKSHARES, INC. AND SUBSIDIARIES
During the second quarter of 2016, a $1.7 million lease termination liability and charge to other expense was recorded due to the closure of a branch, concurrent with the consummation date of the Baylake merger. Payments are expected to continue to the lessor for the remainder of the lease term. Since the remaining lease payments have been recognized against earnings, the remaining lease payments were excluded from the above table. Total rent expense under leases totaled $0.8 million in 2016, $0.8 million in 2015, and $0.9 million in
A summary of goodwill and other intangibles, as well as the MSR asset, which is included in other assets in the consolidated balance sheets, at December 31 is as follows:
Management periodically reviews the carrying value of its long-lived and intangible assets to determine if any impairment has occurred, in which case an impairment charge would be recorded as an expense in the period of impairment, or whether changes in circumstances have occurred that would require a revision to the remaining useful life which would impact expense prospectively. In making such determination, management evaluates whether there are any adverse qualitative factors indicating that an impairment may exist, as well as the performance, on an undiscounted basis, of the underlying operations or assets which give rise to the intangible. The Company’s annual assessments indicated no impairment charge on goodwill or other intangibles was required for 2016 or 2015. Goodwill: Goodwill was $66.7 million at December 31, 2016 and $0.8 million at December 31, 2015. There were additions to the carrying amount of goodwill in Other intangible assets: Other intangible assets, consisting of core deposit intangibles (related to branch or bank acquisitions) and customer list intangibles (related to the customer relationships acquired in the 2016 financial advisor business acquisition), are amortized over their estimated finite lives. Due to the 2016 acquisitions, there was an addition to the core deposit intangibles and to customer list intangibles. See Note 2 for additional information on the 2016 acquisitions.
NICOLET BANKSHARES, INC. AND SUBSIDIARIES Notes to Consolidated Financial Statements
Mortgage servicing rights: A summary of the MSR asset, which is included in other assets in the consolidated balance sheets, for the periods indicated is as follows:
The Company periodically evaluates its mortgage servicing rights asset for impairment. As of December 31, 2016, the Company’s assessment does not indicate an impairment on the MSR asset carrying value. The following table shows the estimated future amortization expense for amortizing intangible assets. The projections are based on existing asset balances, the current interest rate environment and prepayment speeds as of the December 31, 2016. The actual amortization expense the Company recognizes in any given period may be significantly different depending upon acquisition or sale activities, changes in interest rates, prepayment speeds, market conditions, regulatory requirements and events or circumstances that indicate the carrying amount of an asset may not be recoverable.
NICOLET BANKSHARES, INC. AND SUBSIDIARIES
A summary of OREO, which is included in other assets in the consolidated balance sheets, for the periods indicated is as follows:
Brokered deposits were At December 31,
The aggregate amount of time deposits, each with a minimum denomination of $250,000, was
The Company had the following notes payable as of December 31:
At the completion of the construction of the Company’s headquarters building in 2005 and as part of a joint venture investment related to the building, the Company and the other joint venture partners guaranteed a In April of 2016, this note was refinanced with the Bank and is therefore eliminated through the consolidation process. The FHLB advances bear fixed rates, require interest-only monthly payments, and
NICOLET BANKSHARES, INC. AND SUBSIDIARIES Notes to Consolidated Financial Statements
The following table shows the maturity schedule of the notes payable as of December 31,
2016.
The Company has a $10 million line of credit with a third party bank, bearing a variable rate of interest based on one-month LIBOR plus a margin, but subject to a floor rate, with quarterly payments of interest only. At December 31,
At December 31, In July 2004, Nicolet Bankshares Statutory Trust I (the “Nicolet Trust”) issued $6.0 million of guaranteed preferred beneficial interests (“trust preferred securities”) in the Company’s junior subordinated deferrable interest debentures that qualify as Tier 1 capital under Federal Reserve Board guidelines. All of the common securities of the Nicolet Trust are owned by the Company. The proceeds from the common securities and trust preferred securities were used by the Nicolet Trust to purchase $6.2 million of junior subordinated debentures (the “debentures”) of the Company. The trust preferred securities and debentures pay an 8% fixed rate. The proceeds received by the Company from the sale of the debentures were used for general purposes, primarily to provide capital to the Bank. The Company has the right to redeem the debentures, in whole or in part, on or after July 15, 2009. If the debentures are redeemed prior to maturity, the redemption price will be the principal amount and any accrued but unpaid interest. The maturity date of the debentures, if not redeemed, is July 15, 2034. Interest on the debentures is current. In April 2013, as part of the Mid-Wisconsin acquisition, the Company assumed $10.3 million of junior subordinated debentures issued in December 2005 by Mid-Wisconsin, related to $10.0 million of trust preferred securities issued by a statutory trust, whose common securities were wholly owned by Mid-Wisconsin. These trust preferred securities and debentures mature on December 15, 2035 and have a floating rate of the three-month LIBOR plus 1.43%, adjusted quarterly. The interest rates were As part of the 2016 acquisition of Baylake, the Company assumed $16.6 million of junior subordinated debentures related to $16.1 million of issued trust preferred securities. The trust preferred securities and the debentures mature on September 30, 2036 and have a floating rate of three-month LIBOR plus 1.35% adjusted quarterly. Interest on these debentures is current. The interest rate was 2.35% as of December 31, 2016. The debentures may be redeemed on any interest payment date at par in part or in full, on or after June 30, 2011. At acquisition in April 2016 the debentures were recorded at fair value of $11.8 million, with the discount being accreted to interest expense over the remaining life of the debentures. At December 31, 2016, the carrying value of these junior debentures was $12.0 million. The debentures represent the sole asset of the respective statutory trusts. The statutory trusts are not included in the consolidated financial statements. The net effect of all the documents entered into with the trust preferred securities is that the Company, through payment on its debentures, is liable for the distributions and other payments required on the trust preferred securities.
NICOLET BANKSHARES, INC. AND SUBSIDIARIES Notes to Consolidated Financial Statements
On February 17, April 28, and June 29, 2015, the Company placed an aggregate of $12 million in subordinated Notes in private placements with certain accredited investors. All Notes were issued with 10-year maturities, have a fixed annual interest rate of 5% payable quarterly, are callable on or after the fifth anniversary of their respective issuances dates, and qualify for Tier 2 capital for regulatory purposes. The Company elected to early adopt ASU 2015-03,Simplifying the Presentation of Debt Issuance Costs, which requires debt issuance costs to be presented in the balance sheet as a direct deduction from the associated debt liability. The $180,000 debt issuance costs associated with the $12 million Notes are being amortized on a straight line basis over the first five years, representing the no-call periods, as additional interest expense. As of December 31, 2016 and 2015, $115,000 and $151,000, respectively, of unamortized debt issuance costs remain and are reflected as a deduction to the carrying value of the outstanding debt, respectively.
The Company sponsors The Company sponsors a 401(k) savings plan under which eligible employees may choose to save up to 100% of salary compensation on either a pre-tax or after-tax basis, subject to certain IRS limits. Under the plan, the Company matches 100% of participating employee contributions up to 6% of the participant’s gross compensation. The Company contribution vests over five years. The Company can make additional annual discretionary profit sharing contributions, as determined by the Board of Directors. During
NICOLET BANKSHARES, INC. AND SUBSIDIARIES Notes to Consolidated Financial Statements
At December 31, The Company’s 2002 Stock Incentive Plan initially covered 125,000 shares of the Company’s common stock. The Company, with subsequent shareholder approval, revised this plan to allow for 450,000 additional shares in 2005 and 600,000 additional shares in 2008. A total of 1,175,000 shares have been reserved for potential stock options under the 2002 Plan. The Company also adopted, with subsequent shareholder approval, the 2011 Long Term Incentive Plan covering up to 500,000 shares of the Company’s common stock. The Company, with subsequent shareholder approval, revised this plan to allow for 1,000,000 additional shares in 2016. A total of 1,500,000 shares have been reserved for potential stock-based awards. This plan provides for certain stock-based awards such as, but not limited to, stock options, stock appreciation rights and restricted common stock, as well as cash performance awards. As part of the 2016 Baylake acquisition, the Company assumed sponsorship of the Baylake Corp. 2010 Equity Incentive Plan and also assumed 91,701 stock options issued under such plan. The Company amended the plan to rename it the Nicolet Bankshares, Inc. 2010 Equity Incentive Plan and to provide that no further awards may be granted under this plan. In general, for stock options granted the exercise price will not be less than the fair market value of the Company’s common stock on the date of grant, the options will become exercisable based upon vesting terms determined by the committee, and the options will expire ten years after the date of grant. In general, for restricted stock granted the shares are issued at the fair market value of the Company’s common stock on the date of grant, are restricted as to transfer, but are not restricted as to dividend payments or voting rights, and the transfer restrictions lapse over time, depending upon vesting terms provided for in the grant and contingent upon continued employment. As of December 31, Activity of the Stock Incentive Plans is summarized in the following tables:
*The terms of the stock option agreements permit having a number of shares of stock withheld, the fair market value of which as of the date of exercise is sufficient to satisfy the exercise price and/or tax withholding requirements, and accordingly 10,244 shares and 167,779 shares were surrendered in 2016 and 2015, respectively, and no shares surrendered in 2014.
NICOLET BANKSHARES, INC. AND SUBSIDIARIES Notes to Consolidated Financial Statements
Options outstanding at December 31, and a weighted average exercise price of $19.97. Intrinsic value represents the amount by which the fair market value of the underlying stock exceeds the exercise price of the stock options. The total intrinsic value of options exercised in
*The terms of the restricted stock agreements permit the surrender of shares to the Company upon vesting in order to satisfy applicable tax withholding at the minimum statutory withholding rate, and The Company recognized
During 2014, a common stock repurchase program was authorized to use up to $12 million to repurchase up to 625,000 shares of Nicolet common stock as an alternative use of capital. On On On April 29, 2016, in connection with its acquisition of Baylake, the Company issued 4,344,243 shares of its common stock for consideration of $163.3 million, and recorded $1.2 million consideration for assumed stock options. Approximately $0.3 million of common stock issuance expenses related to the transaction were incurred and charged against additional paid in capital. In connection with the financial advisor business acquisition that completed April 1, 2016, the Company issued $2.6 million in common stock consideration. On February 24, 2016, Nicolet’s common stock moved off the OTCBB and began trading on the Nasdaq Capital Market, also under the trading symbol of “NCBS.”
NICOLET BANKSHARES, INC. AND SUBSIDIARIES Notes to Consolidated Financial Statements
The current and deferred amounts of income tax expense were as follows:
The differences between the income tax expense recognized and the amount computed by applying the statutory federal income tax rate to the income before income taxes, less noncontrolling interest, for the years ended December 31,
The net deferred tax asset includes the following amounts of deferred tax assets and liabilities at December 31:
A valuation allowance is required if it is more likely than not that some portion of the deferred tax asset will not be realized. At December 31,
NICOLET BANKSHARES, INC. AND SUBSIDIARIES Notes to Consolidated Financial Statements
At December 31, 2016, the Company
The Company is party to financial instruments with off-balance-sheet risk in the normal course of business to meet the financing needs of its customers. These financial instruments include commitments to extend credit, financial guarantees, and standby letters of credit. They involve, to varying degrees, elements of credit risk in excess of amounts recognized on the consolidated balance sheets. The Company’s exposure to credit loss in the event of nonperformance by the other party to the financial instruments for commitments to extend credit and standby letters of credit is represented by the contractual notional amount of those instruments. The Company uses the same credit policies in making commitments and issuing letters of credit as they do for on-balance-sheet instruments. A summary of the contract or notional amount of the Company’s exposure to off-balance-sheet risk as of December 31 is as follows:
Commitments to extend credit are agreements to lend to a customer as long as there is no violation of any condition established in the contract. Commitments generally have fixed expiration dates or other termination clauses and may require payment of a fee. Since many of the commitments are expected to expire without being drawn upon, the total commitment amounts do not necessarily represent future cash requirements. Credit card commitments are generally unsecured. Financial and standby letters of credit are conditional commitments issued to guarantee the performance of a customer to a third party. Financial letters of credit are issued specifically to facilitate commerce and typically result in the commitment being drawn on when the underlying transaction is consummated between the customer and the third party, while standby letters of credit generally are contingent upon the failure of the customer to perform according to the terms of the underlying contract with the third party. Both of these guarantees are primarily issued to support public and private borrowing arrangements and, generally, have terms of one year or less. The credit risk involved in issuing letters of credit is essentially the same as that involved in extending loan facilities to customers. The Company holds collateral, which may include accounts receivable, inventory, property, equipment, and income-producing properties, supporting those commitments if deemed necessary. For standby letters of credit, in the event the customer does not perform in accordance with the terms of the agreement with the third-party, the Company would be required to fund the commitment. The maximum potential amount of future payments the Company could be required to make is represented by the contractual amount. If the commitment is funded, the Company would be entitled to seek recovery from the customer. At December 31, The Company has federal funds accommodations with other financial institutions where funds may be borrowed on a short-term basis at the market rate in effect at the time of the borrowing. The total federal funds accommodations as of December 31, In the normal course of business, the Company is involved in various legal proceedings. In the opinion of management, any liability resulting from such proceedings would not have a material adverse effect on the consolidated financial statements.
NICOLET BANKSHARES, INC. AND SUBSIDIARIES Notes to Consolidated Financial Statements
The Company conducts transactions, in the normal course of business, with its directors and officers, including companies in which they have a beneficial interest. It is the Company’s policy to comply with federal regulations that require that these transactions with directors and executive officers be made on substantially the same terms as those prevailing at the time made for comparable transactions to other persons. Related party loans totaled approximately During 2004, the Company entered into a joint venture (50% ownership by the Company) with the Firm in connection with the building of the Company’s new headquarters facility. The Firm is considered a related party, as one of its principals is a Board member and shareholder of the Company. During 2016, 2015 and 2014, the Bank incurred approximately $1.1 million, $1.2 million and $1.2 million, respectively, in rent expense to the joint venture. In August 2011, the Company opened a new branch location in a facility which is leased from an entity owned by the Firm on terms considered by management to be arms-length and incurred less than $120,000 annually of rent expense on this facility during 2016, 2015, and 2014. In February 2016, the Company entered into a lease agreement for a location owned by a relative of a management team member. The building is to be used by a subsidiary of the Company on terms considered to be arms-length and incurred less than $120,000 of lease expense for the partial year. This amount is expected to exceed $120,000 in future years based on a full year of lease expense. This same individual received approximately $420,000 for his services to the Company during 2016. In addition, a payment of approximately $400,000 was made to another relative of the management team member for his services to the Company. Components of the net gain on sale or
The Company (on a consolidated basis) and the Bank are subject to various regulatory capital requirements administered by the federal banking agencies. Failure to meet minimum capital requirements can initiate certain mandatory and possibly additional discretionary actions by regulators that, if undertaken, could have a direct material effect on the Company and Bank’s financial statements. Under capital adequacy guidelines and the regulatory framework for prompt corrective action, the Company and Bank must meet specific capital guidelines that involve quantitative measures of their assets, liabilities and certain off-balance-sheet items as calculated under regulatory accounting practices. The capital amounts and classification are also subject to qualitative judgments by the regulators about components, risk-weightings, and other factors. Prompt corrective action provisions are not applicable to bank holding companies.
NICOLET BANKSHARES, INC. AND SUBSIDIARIES Notes to Consolidated Financial Statements
Quantitative measures established by regulation to ensure capital adequacy require the Company and Bank to maintain minimum amounts and ratios of Total, As of December 31, The Company’s and the Bank’s actual regulatory capital amounts and ratios as of December 31,
NICOLET BANKSHARES, INC. AND SUBSIDIARIES Notes to Consolidated Financial Statements
A source of income and funds for the Company are dividends from the Bank. Dividends declared by the Bank that exceed the retained net income for the most current year plus retained net income for the preceding two years must be approved by Federal regulatory agencies. During the third quarter of 2016, the Bank requested approval from the regulatory agencies to pay a $15 million special dividend from Bank surplus and it was approved. At December 31,
As provided for by accounting standards, the Company records and/or discloses financial instruments on a fair value basis. These financial assets and financial liabilities are measured at fair value in three levels, based on the markets in which the assets and liabilities are traded and the observability of the assumptions used to determine fair value. These levels are: Level 1 - quoted market prices in active markets for identical assets or liabilities that a company has the ability to access at the measurement date; Level 2 - inputs other than quoted prices included in Level 1 that are observable for the asset or liability, either directly or indirectly; Level 3 – significant unobservable inputs for the asset or liability, which are typically based on an entity’s own assumptions, as there is little, if any, related market activity. In instances where the fair value measurement is based on inputs from different levels, the level within which the entire fair value measurement will be categorized is based on the lowest level input that is significant to the fair value measurement in its entirety; this assessment of the significance of an input requires management judgment. Disclosure of the fair value of financial instruments, whether recognized or not recognized in the consolidated balance sheet, is required for those instruments for which it is practicable to estimate that value, with the exception of certain financial instruments and all nonfinancial instruments as provided for by the accounting standards. For financial instruments recognized at fair value in the consolidated balance sheets, the fair value disclosure requirements also apply. Fair value (i.e. the price that would be received in an orderly transaction that is not a forced liquidation or distressed sale at the measurement date), among other things, is based on exit price versus entry price, should include assumptions about risk such as nonperformance risk in liability fair values, and is a market-based measurement versus an entity-specific measurement. The following table presents the balances of assets and liabilities measured at fair value on a recurring basis for the periods presented:
NICOLET BANKSHARES, INC. AND SUBSIDIARIES Notes to Consolidated Financial Statements
The following table presents the changes in Level 3 assets measured at fair value on a recurring basis during the years ended December 31:
The following is a description of the valuation methodologies used by the Company for the items noted in the tables above. Where quoted market prices on securities exchanges are available, the investment is classified as Level 1. Level 1 investments primarily include exchange-traded equity securities available for sale. If quoted market prices are not available, fair value is generally determined using prices obtained from independent pricing vendors who use pricing models (with typical inputs including benchmark yields, reported trades for similar securities, issuer spreads or relationship to other benchmark quoted securities), or discounted cash flows, and are classified as Level 2. Examples of these investments include mortgage-related securities and obligations of state, county and municipals. Finally, in certain cases where there is limited activity or less transparency around inputs to the estimated fair value, investments are classified within Level 3 of the hierarchy. Examples of these include The following table presents the Company’s collateral-dependent impaired loans and OREO measured at fair value on a nonrecurring basis as of December 31,
The following is a description of the valuation methodologies used by the Company for the items noted in the table above, including the general classification of such instruments in the fair value hierarchy. For individually evaluated impaired loans, the amount of impairment is based upon the present value of expected future cash flows discounted at the loan’s effective interest rate, the estimated fair value of the underlying collateral for collateral-dependent loans, or the estimated liquidity of the note. For OREO, the fair value is based upon the estimated fair value of the underlying collateral adjusted for the expected costs to sell.
NICOLET BANKSHARES, INC. AND SUBSIDIARIES Notes to Consolidated Financial Statements
The Company is required under accounting guidance to report the fair value of all financial instruments in the consolidated balance sheets, including those financial instruments carried at cost. The carrying amounts and estimated fair values of the
Not all the financial instruments listed in the table above are subject to the disclosure provisions of ASC 820, as certain assets and liabilities result in their carrying value approximating fair value. These include cash and cash equivalents,
NICOLET BANKSHARES, INC. AND SUBSIDIARIES Notes to Consolidated Financial Statements
Certificates of deposits in other banks: Fair values are estimated using discounted cash flow analysis based on current interest rates being offered by instruments with similar terms and represents a Level 2 measurement.Securities AFS and other investments : Fair values for securities are based on quoted market prices on securities exchanges, when available, which is considered a Level 1 measurement. If quoted market prices are not available, fair value is generally determined using pricing models widely used in the industry, quoted market prices of securities with similar characteristics, or discounted cash flows, which is considered a Level 2 measurement, and Level 3 was deemed appropriate for auction rate securities (for which there has been no liquid market since 2008) and corporate debt securities which include trust preferred security instruments. The corporate debt securities were acquired in the Mid-Wisconsin acquisition and valued based on a discounted cash flow analysis and the underlying credit quality of the issuer. The fair value approximates the cost at acquisition. For other investments, the carrying amount of Federal Reserve Bank, Bankers Bank, Farmer Mac, and FHLB stock is a reasonably accepted fair value estimate given their restricted nature. Fair value is the redeemable (carrying) value based on the redemption provisions of the instruments which is considered a Level 2 measurement. The carrying amount of the remaining other investments (particularly common stocks of companies or other banks that are not publicly traded) approximates their fair value, determined primarily by analysis of company financial statements and recent capital issuances of the respective companies or banks, if any and represents a Level 3 measurement.Loans held for sale: The fair value estimation process for the loans held for sale portfolio is segregated by loan type. The estimated fair value was based on what secondary markets are currently offering for portfolios with similar characteristics and represents a Level 2 measurement.Loans, net : For variable-rate loans that reprice frequently and with no significant change in credit risk or other optionality, fair values are based on carrying values. Fair values for all other loans are estimated by discounting contractual cash flows using estimated market discount rates, which reflect the credit and interest rate risk inherent in the loan. Collateral-dependent impaired loans are included in loans, net. The fair value of loans is considered to be a Level 3 measurement due to internally developed discounted cash flow measurements.MSR asset: To estimate the fair value of the MSR asset, the underlying serviced loan pools are stratified by interest rate tranche and term of the loan, and a valuation model is used to calculate the present value of expected future cash flows for each stratum. When the carrying value of the MSR asset related to a stratum exceeds its fair value, the stratum is recorded at fair value, generally through a valuation allowance. The valuation model incorporates assumptions that market participants would use in estimating future net servicing income, such as costs to service, a discount rate, ancillary income, default rates and losses, and prepayment speeds. Although some of these assumptions are based on observable market data, other assumptions are based on unobservable estimates of what market participants would use to measure fair value. As a result, the fair value measurement of mortgage servicing rights is considered a Level 3 measurement and represents an income approach to fair value. Deposits : The fair value of deposits with no stated maturity (such as demand deposits, savings, interest and non-interest checking, and money market accounts) is, by definition, equal to the amount payable on demand at the reporting date. Fair values for fixed-rate certificates of deposit are estimated using a discounted cash flow calculation that applies interest rates currently being offered in the market place on certificates of similar remaining maturities. Use of internal discounted cash flows provides a Level 3 fair value measurement.Notes payable : The fair value of the FHLB advances is obtained from the FHLB which uses a discounted cash flow analysis based on current market rates of similar maturity debt securities and represents a Level 2 measurement. The fair values of remaining notes payable are estimated using discounted cash flow analysis based on current interest rates being offered by instruments with similar terms and credit quality which represents a Level 2 measurement.Junior subordinated debentures : The fair values of junior subordinated debentures are estimated based on an evaluation of current interest rates being offered by instruments with similar terms and credit quality. Since the market for these instruments is limited, the internal evaluation represents a Level 3 measurement.
NICOLET BANKSHARES, INC. AND SUBSIDIARIES Notes to Consolidated Financial Statements
Subordinated notes: The fair values of subordinated notes are estimated based on an evaluation of current interest rates being offered by instruments with similar terms and credit quality. Since the market for these instruments is limited, the internal evaluation represents a Level 3 measurement. Off-balance-sheet instruments : The estimated fair value of letters of credit at December 31,2015. Limitations : Fair value estimates are made at a specific point in time, based on relevant market information and information about the financial instrument. These estimates do not reflect any premium or discount that could result from offering for sale at one time the Company’s entire holdings of a particular financial instrument. Fair value estimates may not be realizable in an immediate settlement of the instrument. In some instances, there are no quoted market prices for the Company’s various financial instruments, in which case fair values may be based on estimates using present value or other valuation techniques, or based on judgments regarding future expected loss experience, current economic conditions, risk characteristics of the financial instruments, or other factors. Those techniques are significantly affected by the assumptions used, including the discount rate and estimate of future cash flows. Subsequent changes in assumptions could significantly affect the estimates.
NICOLET BANKSHARES, INC. AND SUBSIDIARIES Notes to Consolidated Financial Statements
Condensed parent company only financial statements of Nicolet Bankshares, Inc. follow:
NICOLET BANKSHARES, INC. AND SUBSIDIARIES Notes to Consolidated Financial Statements
On
On November 4, 2016 Nicolet announced the signing of a

REPORT OF INDEPENDENT REGISTERED PUBLIC ACCOUNTING FIRM To the Board of Directors and Stockholders Nicolet Bankshares, Inc. Green Bay, Wisconsin We have audited the accompanying consolidated balance sheets ofNicolet Bankshares, We conducted our audits in accordance with the standards of the Public Company Accounting Oversight Board (United States). Those standards require that we plan and perform the audits to obtain reasonable assurance about whether the consolidated financial statements are free of material misstatement and whether effective internal control over financial reporting was maintained in all material respects. Our audits of the consolidated financial statements included examining, on a test basis, evidence supporting the amounts and disclosures in the consolidated financial statements, assessing the accounting principles used and significant estimates made by management, and evaluating the overall financial statement presentation. Our audit of internal control over financial reporting included obtaining an understanding of internal control over financial reporting, assessing the risk that a material weakness exists, and testing and evaluating the design and operating effectiveness of internal control based on the assessed risk. Our audits also included performing such other procedures as we considered necessary in the circumstances. We believe that our audits provide a reasonable basis for our opinions. A company’s internal control over financial reporting is a process designed to provide reasonable assurance regarding the reliability of financial reporting and the preparation of consolidated financial statements for external purposes in accordance with generally accepted accounting principles. A company’s internal control over financial reporting includes those policies and procedures that (a) pertain to the maintenance of records that, in reasonable detail, accurately and fairly reflect the transactions and dispositions of the assets of the company; (b) provide reasonable assurance that transactions are recorded as necessary to permit preparation of consolidated financial statements in accordance with generally accepted accounting principles, and that receipts and expenditures of the company are being made only in accordance with authorizations of management and directors of the company; and (c) provide reasonable assurance regarding prevention or timely detection of unauthorized acquisition, use or disposition of the company’s assets that could have a material effect on the consolidated financial statements.
Because of its inherent limitations, internal control over financial reporting may not prevent or detect misstatements. Also, projections of any evaluation of effectiveness to future periods are subject to the risk that controls may become inadequate because of changes in conditions, or that the degree of compliance with the policies or procedures may deteriorate. In our opinion, the consolidated financial statements referred to above present fairly, in all material respects, the financial position of Nicolet Bankshares, Inc. and subsidiaries as of December 31, 
Atlanta, Georgia March 10, 2017
None. ITEM 9A. CONTROLS AND PROCEDURES As of the end of the period covered by this report, management, under the supervision, and with the participation, of our Chief Executive Officer and President and Chief Financial Officer, evaluated the effectiveness of the design and operation of our disclosure controls and procedures pursuant to Exchange Act Rule 13a-15. Based upon, and as of the date of such evaluation, the Chief Executive Officer and President and the Chief Financial Officer concluded that our disclosure controls and procedures were effective in timely alerting them to material information relating to Nicolet that is required to be included in Nicolet’s periodic filings with the SEC. During the fourth quarter of Because of its inherent limitations, internal control over financial reporting may not prevent or detect misstatements. Also projections of any evaluation of effectiveness to future periods are subject to the risk that controls may become inadequate because of changes in conditions, or that the degree of compliance with the policies or procedures may deteriorate Management’s Annual Report on Internal Control Over Financial Reporting Management is responsible for establishing and maintaining adequate internal control over financial reporting. The Company’s internal control over financial reporting is a process designed to provide reasonable assurance regarding the reliability of financial reporting and the preparation of the Company’s financial statements for external purposes in accordance with generally accepted accounting principles. Internal control over financial reporting is defined in Rules 13a-15(f) and 15d-15(f) promulgated under the Securities Exchange Act of 1934, as amended (the “Exchange Act”). As of December 31, Porter Keadle Moore, LLC, the independent registered public accounting firm that audited the consolidated financial statements of the Company included in this Annual Report on Form 10-K, has issued an attestation report on the effectiveness of the Company’s internal control over financial reporting as of December 31, ITEM 9B. OTHER INFORMATION None. PART III
Code of Ethics The Company has adopted a Code of Ethics that applies to its senior financial officers. A copy is available, without charge, upon telephonic or written request addressed to Ann K. Lawson, Chief Financial Officer, Nicolet Bankshares, Inc., 111 North Washington Street, Green Bay, Wisconsin 54301, telephone (920) 430-1400. The remaining information required in Part III, Item 10 is incorporated by reference to the registrant’s definitive proxy statement for the 2017 Annual Meeting of Shareholders.
The information required in
Shareholders.
Equity Compensation Plan Information
(1) Includes stock. (2) The weighted average exercise price relates only to the exercise of outstanding options included in column (a). The remaining information required in Part III, Item 12 is incorporated by reference to the registrant’s definitive proxy statement for the 2017 Annual Meeting of
Shareholders.
The information required in Part III, Item 13 is Shareholders.
The
PART IV
| |||||||||||||||||||||||||||||||||||||||||||||||||||||||||||||||||||||||||||||||||||||||||||||||||||||||||||||||||||||||||||||||||||||||||||||||||||||||||||||||||||||||||||||||||||||||||||||||||||||||||||||||||||||||||||||||||||||||||||||||||||||||||||||||||||||||||||||||||||||||||||||||||||||||||||||||||||||||||||||||||||||||||||||||||||||||||||||||||||||||||||||||||||||||||||||||||||||||||||||||||||||||||||||||||||||||||||||||||||||||||||||||||||||||||||||||||||||||||||||||||||||||||||||||||||||||||||||||||||||||||||||||||||||||||||||||||||||||||||||||||||||||||||||||||||||||||||||||||||||||||||||||||||||||||||||||||||||||||||||||||||||||||||||||||||||||||||||||||||||||||||||||||||||||||||||||||||||||||||||||||||||||||||||||||||||||||||||||||||||||||||||||||||||||||||||||||||||||||||||||||||||||||||||||||||||||||||||||||||||||||||||||||||||||||||||||||||||||||||||||||||||||||||||||||||||||||||||||||||||||||||||||||||||||||||||||||||||||||||||||||||||||||||||||||||||||||||||||||||||||