UNITED STATES
SECURITIES AND EXCHANGE COMMISSION
Washington, D.C. 20549
Form 10-K
| | | | | | | | | | | | | | |
| (Mark One) | | | | |
| ☑ | | ANNUAL REPORT PURSUANT TO SECTION 13 OR 15(d) OF THE SECURITIES
EXCHANGE ACT OF 1934 |
| | For the fiscal year ended | January 29, 2021February 3, 2023 | |
| or |
| ☐ | | TRANSITION REPORT PURSUANT TO SECTION 13 OR 15(d) OF THE SECURITIES
EXCHANGE ACT OF 1934 |
For the transition period from to |
Commission File Number: 001-37867
Dell Technologies Inc.
(Exact name of registrant as specified in its charter)
| | | | | | | | |
| Delaware | | 80-0890963 |
| (State or other jurisdiction of incorporation or organization) | | (I.R.S. Employer Identification No.) |
One Dell Way, Round Rock, Texas 78682
(Address of principal executive offices) (Zip Code)
1-800-289-3355
(Registrant’s telephone number, including area code)
Securities registered pursuant to Section 12(b) of the Act:
| | | | | | | | |
| Title of each class | Trading Symbol(s) | Name of each exchange on which registered |
| Class C Common Stock, par value of $0.01 per share | DELL | New York Stock Exchange |
Securities registered pursuant to Section 12(g) of the Act: None
Indicate by check mark if the registrant is a well-known seasoned issuer, as defined in Rule 405 of the Securities Act. Yes þ No ¨
Indicate by check mark if the registrant is not required to file reports pursuant to Section 13 or Section 15(d) of the Act. Yes ¨ No þ
Indicate by check mark whether the registrant (1) has filed all reports required to be filed by Section 13 or 15(d) of the Securities Exchange Act of 1934 during the preceding 12 months (or for such shorter period that the registrant was required to file such reports), and (2) has been subject to such filing requirements for the past 90 days. Yes þ No ¨
Indicate by check mark whether the registrant has submitted electronically every Interactive Data File required to be submitted pursuant to Rule 405 of Regulation S-T during the preceding 12 months (or for such shorter period that the registrant was required to submit such files). Yes þ No ¨
Indicate by check mark whether the registrant is a large accelerated filer, an accelerated filer, a non-accelerated filer, a smaller reporting company, or an emerging growth company. See the definitions of “large accelerated filer,” “accelerated filer,” “smaller reporting company,” and “emerging growth company” in Rule 12b-2 of the Exchange Act.
| | | | | | | | | | | | | | | | | |
| Large accelerated filer | ☑ | | | Accelerated filer | ☐ |
| Non-accelerated filer | ☐ | | | Smaller reporting company | ☐ |
| | | | Emerging growth company | ☐ |
If an emerging growth company, indicate by check mark if the registrant has elected not to use the extended transition period for complying with any new or revised financial accounting standards provided pursuant to Section 13(a) of the Exchange Act. ☐
Indicate by check mark whether the registrant has filed a report on and attestation to its management’s assessment of the effectiveness of its internal control over financial reporting under Section 404(b) of the Sarbanes-Oxley Act (15 U.S.C. 7262(b)) by the registered public accounting firm that prepared or issued its audit report. ☑
If securities are registered pursuant to Section 12(b) of the Act, indicate by check mark whether the financial statements of the registrant included in the filing reflect the correction of an error to previously issued financial statements. ☐
Indicate by check mark whether any of those error corrections are restatements that required a recovery analysis of incentive-based compensation received by any of the registrant’s executive officers during the relevant recovery period pursuant to §240.10D-1(b). ☐
Indicate by check mark whether the registrant is a shell company (as defined in Rule 12b-2 of the Act). Yes ☐ No þ
As of July 31, 2020,29, 2022, the last business day of the registrant’s most recently completed second fiscal quarter, the aggregate market value of the shares of the registrant’s common stock held by non-affiliates was approximately $15.1$11.4 billion (based on the closing price of $59.83$45.06 per share of Class C Common Stock reported on the New York Stock Exchange on that date).
As of March 23, 2021,27, 2023, there were 762,667,390731,204,853 shares of the registrant’s common stock outstanding, consisting of 276,565,287257,374,103 outstanding shares of Class C Common Stock, 384,416,886378,480,523 outstanding shares of Class A Common Stock, and 101,685,21795,350,227 outstanding shares of Class B Common Stock.
DOCUMENTS INCORPORATED BY REFERENCE
The information required by Part III of this report, to the extent not set forth herein, is incorporated by reference from the registrant’s proxy statement relating to its annual meeting of stockholders to be held in 2021.2023. The proxy statement will be filed with the Securities and Exchange Commission within 120 days after the end of the fiscal year to which this report relates.
CAUTIONARY NOTE REGARDING FORWARD-LOOKING STATEMENTS
This report contains “forward-looking statements” within the meaning of Section 27A of the Securities Act of 1933 and Section 21E of the Securities Exchange Act of 1934. The words “may,” “will,” “anticipate,” “estimate,” “expect,” “intend,” “plan,” “aim,” “seek,” and similar expressions as they relate to us or our management are intended to identify these forward-looking statements. All statements by us regarding our expected financial position, revenues, cash flows and other operating results, business strategy, legal proceedings future responses to and effects of the coronavirus disease 2019 (“COVID-19”), and similar matters are forward-looking statements. Our expectations expressed or implied in these forward-looking statements may not turn out to be correct. Our results could be materially different from our expectations because of various risks, including the risks discussed in “Part I — Item 1A — Risk Factors” and in our other periodic and current reports filed with the Securities and Exchange Commission (“SEC”). Any forward-looking statement speaks only as of the date as of which such statement is made, and, except as required by law, we undertake no obligation to update any forward-looking statement after the date as of which such statement was made, whether to reflect changes in circumstances or our expectations, the occurrence of unanticipated events, or otherwise.
DELL TECHNOLOGIES INC.
TABLE OF CONTENTS
Unless the context indicates otherwise, references in this report to “we,” “us,” “our,” the “Company,” and “Dell Technologies” mean Dell Technologies Inc. and its consolidated subsidiaries, references to “Dell” mean Dell Inc. and Dell Inc.’s consolidated subsidiaries, and references to “EMC” mean EMC Corporation and EMC Corporation’s consolidated subsidiaries.
Our fiscal year is the 52- or 53-week period ending on the Friday nearest January 31. We refer to our fiscal years ended February 3, 2023, January 28, 2022, and January 29, 2021 January 31, 2020,as “Fiscal 2023,” “Fiscal 2022,” and February 1, 2019 as “Fiscal 2021,” “Fiscal 2020,” and “Fiscal 2019,” respectively. Fiscal 2021,2023 included 53 weeks, while Fiscal 2020,2022 and Fiscal 20192021 each included 52 weeks.
PART I
ITEM 1 — BUSINESS
BusinessCompany Overview
Dell Technologies helps organizations and individuals build their digital futurefutures and individuals transform how they work, live, and play. We provide customers with one of the industry’s broadest and most innovative technology and servicessolutions portfolio for the data era, spanning bothincluding traditional infrastructure and extending to multi-cloud technologies. We continue to seamlessly deliverenvironments. Our differentiated and holistic information technology (“IT”)IT solutions benefit our results and enable us to our customers, which has driven significantcapture revenue growth and share gains.as customer spending priorities evolve.
Dell Technologies’ integrated solutions help customers modernize their IT infrastructure, manage and operate in a multi-cloudmulticloud world, address workforce transformation, and provide critical solutions that keep people and organizations connected, which has proven even more important in this current time of disruption caused by the coronavirus pandemic.connected. We are helping customers accelerate their digital transformations to improve and strengthen business and workforce productivity. With our extensive portfolio and our commitment to innovation, we offer secure, integrated solutions that extend from the edge to the core to the cloud, and we are at the forefront of the software-defined and cloud native infrastructure era. As further evidence of our commitment to innovation, in Fiscal 2021 we announced our plan to evolve and expand our IT as-a-Service and cloud offerings through Apex. Apex will provide our customers with greater flexibility to scale IT to meet their evolving business needs and budgets.solutions.
Dell Technologies’ end-to-end portfolio isTechnologies operates globally in approximately 180 countries, supported by a world-class organization with unmatched size and scale. We operate globally in 180 countries across key functional areas, including technology and product development, marketing, sales, financial services, and global services. We have a number of durable competitive advantages that provide a critical foundation for our success. Our go-to-market engine includes a 39,000-person31,000-person direct sales force and a global network of over 200,000approximately 240,000 channel partners. We employ approximately 35,000 full-time service and support professionals and maintain approximately 2,200 vendor-managed service centers. We also manage a world-class supply chain at significant scale with approximately $77 billion in annual procurement expenditures and over 725 parts distribution centers.
We further strengthen customer relationships through our financing offerings provided by Dell Financial Services and its affiliates (“DFS”) offer customer paymentand our flexible consumption models, including utility, subscription, and as-a-Service models, which we continue to expand under Dell APEX. These offerings enable our customers to pay over time and provide them with financial flexibility and enables synergies across the business. DFS funded $9 billion of originations in Fiscal 2021 and maintains a $10 billion global portfolio of high-quality financing receivables. We employ 34,000 full-time service and support professionals and maintain more than 2,400 vendor-managed service centers. We manage a world-class supply chain that drives long-term growth and operating efficiencies, with approximately $70 billion in annual procurement expenditures and over 750 parts distribution centers. Together, these elements provide a critical foundation for our success.to meet their changing technological requirements.
Class V TransactionVision and Strategy
On December 28, 2018, we completed a transaction (“Class V transaction”)Our vision is to become the most essential technology company for the data era. We help customers address their evolving IT needs and their broader digital transformation objectives as they embrace today’s multicloud world. We intend to execute our vision by focusing on two strategic priorities:
•Grow and modernize our core offerings in the markets in which we paid $14.0 billion in cash and issued 149,387,617 shares of our Class C Common Stock to holders of our Class V Common Stock in exchange for all outstanding shares of Class V Common Stock. The non-cash consideration portion of the Class V transaction totaled $6.9 billion. As a result of the Class V transaction, the tracking stock feature of Dell Technologies’ capital structure was terminated. The Class C Common Stock is traded on the New York Stock Exchange.predominantly compete
VMware, Inc. Ownership•Pursue attractive new growth opportunities such as Edge, Telecom, data management, and as-a-Service consumption models
On July 15, 2020, we announced thatWe believe we are exploring potential alternatives with respectuniquely positioned in the data and multicloud era and that our results will continue to benefit from our ownership in VMware, Inc., including a potential spin-offdurable competitive advantages. We intend to continue to execute our business model and position our company for long-term success while balancing liquidity, profitability, and growth and keeping our purpose at the forefront of our decision-making: to create technologies that ownership interest to Dell Technologies’ stockholders. Although this process is currently only at an exploratory stage, we believe a spin-off could benefit both Dell Technologies’ and VMware, Inc.’s stockholders by simplifying capital structures and enhancing strategic flexibility, while still maintaining a mutually beneficial strategic and commercial partnership. Any potential spin-off would not occur prior to September 2021. Other strategic options include maintaining the status quo with respect to our ownership interest in VMware, Inc.drive human progress.
The IT industry is rapidly evolving with demand for simpler, more agile solutions as companies leverage multiple clouds across their increasingly complex IT environments. To meet our customer needs, we continue to invest in research and development, sales, and other key areas of our business to deliver superior products and solutions capabilities and to drive long-term sustainable growth.
Business Model Transformation
Our customers are seeking new and innovative models that address how they consume our solutions. In part, customers are looking to remove unnecessary cost and complexity, align solution offerings to their business needs, and provide consistent operations throughout their IT enterprise.
We offer options including as-a-Service, subscription, utility, leases, loans, and immediate pay models designed to match customers' consumption and financing preferences. We believe these options are particularly advantageous for our customers during times of economic uncertainty as they provide financial flexibility to further enable them to procure our solutions.
These offerings typically result in multiyear agreements which generate recurring revenue streams over the term of the arrangement. We expect that these offerings will further strengthen our customer relationships and provide a foundation for growth in recurring revenue. We define recurring revenue as revenue recognized that is primarily related to hardware and software maintenance as well as subscription, as-a-Service, usage-based offerings, and operating leases.
As we pursue our strategy of modernizing our core business solutions, we continue to evolve and build momentum across our family of as-a-Service offerings under Dell APEX.
Products and Services
We design, develop, manufacture, market, sell, and support a wide range of comprehensive and integratedIT solutions, products, and services. We are organized into the followingtwo business units which are also our reportable segments:segments, referred to as Infrastructure Solutions Group;Group and Client Solutions Group; and VMware.Group.
•Infrastructure Solutions Group (“ISG”) — ISG enables theour customers’ digital transformation of ourwith solutions that address the fundamental shift to multicloud environments, machine learning, artificial intelligence, and data analytics. ISG enables customers through our trusted multi-cloudto simplify, streamline, and big data solutions, which are built upon a modern data center infrastructure. ISG works with customers in the area of hybrid cloud deployment with the goal of simplifying, streamlining, and automatingautomate their cloud operations. ISG solutions are built for multi-cloudmulticloud environments and are optimized to run cloud native workloads in both public and private clouds, as well as traditional on-premise workloads.
Our comprehensive portfolio of advanced storage solutionsportfolio includes traditional storage solutions as well as next-generation storage solutions, (such asincluding all-flash arrays, scale-out file, object platforms, hyper-converged infrastructure, and software-defined solutions).storage. We have simplified our storage portfolio to ensure that we deliver the technology needed for our customers’ digital transformation. Weand continue to make enhancements to our storage solutions offerings andthat we expect that these offerings, including our new PowerStore storage array released in May 2020, will drive long-term improvements in the business.
Our server portfolio includes high-performance rack, blade, and tower and hyperscaleservers. Our servers optimized forare designed with the capability to run high value workloads across customers’ IT environments, including artificial intelligence, and machine learning, and edge workloads. Our networking portfolio helps our business customers transform and modernize their infrastructure, mobilize and enrich end-user experiences, and accelerate business applications and processes.
Our strengths in server, storage, and virtualization software solutions enableallow us to offer leading converged and hyper-converged solutions, allowingenabling our customers to accelerate their IT transformation by acquiringwith scalable integrated IT solutions instead of building and assembling their own IT platforms. ISG also offers attached software, peripherals, and services, including configuration, support and deployment, configuration, and extended warranty services.warranties.
Approximately half of ISG revenue is generated by sales to customers in the Americas, with the remaining portion derived from sales to customers in the Europe, Middle East, and Africa region (“EMEA”) and the Asia-Pacific and Japan region (“APJ”).
•Client Solutions Group (“CSG”) — CSG includes branded hardware (such asPCs including notebooks, desktops, workstations, and notebooks)workstations and branded peripherals (such asincluding displays and projectors),docking stations, as well as third-party software and peripherals. CSG also includes services offerings, including support and deployment, configuration, and extended warranties. Our computing devicesCSG offerings are designed with our commercial and consumer customers’ needs in mind and we seek to optimize performance, reliability, manageability, design, and security. In addition to our traditional hardware business, we have a
Our commercial portfolio of thin client offerings that we believe will allow us to benefit from the growth trends in cloud computing. Forprovides our customers that are seekingwith solutions centered around flexibility to simplify client lifecycle management, Dell PCaddress their complex needs such as a Service offering combines hardware, software, lifecycle services,IT modernization, hybrid work transformation, and financing into one all-encompassing solution that provides predictable pricing per seat per month. CSG also offers attached software, peripherals,other critical needs. Within our high-end consumer offerings, we provide our customers’ with powerful performance, processing, and services, including support and deployment, configuration, and extended warranty services.end-user experiences.
Approximately half of CSG revenue is generated by sales to customers in the Americas, with the remaining portion derived from sales to customers in EMEA and APJ.
•VMware— The VMware reportable segment (“VMware”) reflects the operationsOur “other businesses,” described below, primarily consists of our resale of standalone offerings of VMware, Inc. (NYSE: VMW) within(individually and together with its subsidiaries, “VMware”), referred to as “VMware Resale,” and offerings of SecureWorks Corp. (“Secureworks”). These businesses are not classified as reportable segments, either individually or collectively.
•VMware Resale consists of our sale of standalone VMware offerings. Under our Commercial Framework Agreement with VMware discussed in this report, Dell Technologies. Technologies continues to act as a key channel partner for VMware, reselling VMware’s offerings to our customers. This partnership is intended to facilitate mutually beneficial growth for both Dell Technologies and VMware.
VMware works with customers in the areas of hybrid and multi-cloud,multicloud, modern applications, networking, security, and digital workspaces, helping customers manage their IT resources across private clouds and complex multi-cloud,multicloud, multi-device environments. VMware’s portfolio supports and addresses the key IT priorities of customers: accelerating their cloud journey, migrating and modernizing their applications, empowering digital workspaces, transforming networking, and embracing intrinsic security. VMware enables its customers to digitally transform their operations as they ready their applications, infrastructure, and employees for constantly evolving business needs.
During the third quarter of Fiscal 2020, VMware, Inc. completed the acquisition of Carbon Black, Inc. (“Carbon Black”), a developer of cloud-native endpoint protection.
On December 30, 2019, VMware, Inc. completed its acquisition of Pivotal Software, Inc. (“Pivotal”). Before the transaction, Pivotal was a majority-owned subsidiary of Dell Technologies through EMC and VMware, Inc. Pivotal provides a leading cloud-native platform that makes software development and IT operations a strategic advantage for
customers. Pivotal’s cloud-native platform, Pivotal Cloud Foundry, accelerates and streamlines software development by reducing the complexity of building, deploying, and operating new cloud-native applications, and modernizing legacy applications. With the acquisition, which aligns key software assets, VMware, Inc. builds on a comprehensive development platform with Kubernetes.
The purchase of the controlling interest in Pivotal from Dell Technologies was accounted for as a transaction between entities under common control. This transaction required retrospective combination of the VMware, Inc. and Pivotal entities for all periods presented, as if the combination had been in effect since the inception of common control on the date of the EMC merger transaction in September 2016. Dell Technologies now reports Pivotal results within the VMware reportable segment, and the historical segment results were recast to reflect this change. Pivotal results were previously reported within Other businesses. See Note 19 of the Notes to the Consolidated Financial Statements included in this report for the recast of segment results.
Approximately half of VMware revenue is generated by sales to customers in the United States.
Our other businesses, described below, consist of product and service offerings of SecureWorks Corp. (“Secureworks”), Virtustream, and Boomi, each of which is majority-owned by Dell Technologies. These businesses are not classified as reportable segments, either individually or collectively, as the results of the businesses are not material to our overall results and the businesses do not meet the criteria for reportable segments.
•Secureworks (NASDAQ: SCWX) is a leading global cybersecurity provider of intelligence-driven informationtechnology-driven security solutions singularly focused on protecting its clients from cyberattacks.customers by outpacing and outmaneuvering the adversary. The solutions offered by Secureworks enable organizations of varying size and complexity to fortify their cyber defenses to prevent security breaches, detect malicious activity, in near real time, prioritize and respond rapidly towhen a security incidents,breach occurs, and predictidentify emerging threats.
•Virtustream offers cloud software and infrastructure-as-a-service solutions that enable customersOur offerings are continually evolving in response to migrate, run, and manage mission-critical applications in cloud-based IT environments.
•Boomi specializes in cloud-based integration, connecting information between existing on-premise and cloud-based applications to ensure business processes are optimized, data is accurate and workflow is reliable.
On February 18, 2020, Dell Technologies announced its entry intocustomer needs. As a definitive agreement with a consortiumresult, reclassifications of investors to sell RSA Security, which provides cybersecurity solutions. On September 1, 2020, the parties closed the transaction. At the completion of the sale, we received total cash consideration of approximately $2.082 billion, resulting in a pre-tax gain on sale of $338 million. The Company ultimately recorded a $21 million loss net of taxes. The transaction is intended to further simplify our product portfolio and corporate structure. Prior to the divestiture, RSA Security’s operating results were included within Other businesses.
We believe the collaboration, innovation, and coordination of the operations and strategies across all segments of our business, as well as our differentiated go-to-market model, will continue to drive revenue synergies. Through our coordinated research and development activities, we are able to jointly engineer leading innovative solutions that incorporate the distinct set of hardware, software,certain products and services across all segments of our business.
See Note 19 of the Notes to the Consolidated Financial Statements includedsolutions in this report for more information aboutmajor product categories may be required. For further discussion regarding our reportable segments.
Seesegments, see “Part II — Item 7 — Management’s Discussion and Analysis of Financial Condition and Results of Operations — Results—Results of Operations — Business Unit Results” for a discussionand Note 19 of our reportable segment operating results.the Notes to the Consolidated Financial Statements included in this report.
Dell Financial Services
DFS supports our businesses by offering and arranging various financing options and services for our customers primarily in North America, Europe, Australia, and New Zealand.globally. DFS originates, collects, and services customer receivables primarily related to the purchase or use of our product, software, and services solutions. We also arrange financing for some of our customers in various countries where DFS does not currently operate as a captive. DFScaptive entity. We further strengthens ourstrengthen customer relationships through its flexible consumption models, including utility, subscription, and as-a-Service models, which enable us to offer our customers the option to pay over time and, in certain cases, based on utilization,to provide them with financial flexibility to meet their changing technological requirements. The
originations in Fiscal 2023 and maintains an $11 billion global portfolio of high-quality financing receivables. The results of these operations are allocated to our segments based on the underlying product or service financed.financed and may be impacted by, among other items, changes in the interest rate environment and the translation of those changes to pricing. For additional information about our financing arrangements, see Note 46 of the Notes to the Consolidated Financial Statements included in this report.
Research and Development
We focus on developing scalable technology solutions that incorporate desirable features and capabilities at competitive prices. We employ a collaborative approach to product design and development in which our engineers, with direct customer input, design innovative solutions and work with a global network of technology companies to architect new system designs, influence the direction of future development, and integrate new technologies into our products. products and solutions. Through our collaborative, customer-focused approach to innovation, we strive to deliver new and relevant products to the market quickly and efficiently.
Our team of software engineers isare focused on developing the next generation of solutions for newinnovative solutions. Our software simplifies the complex through automation, increasingly leveraging artificial intelligence and innovative technologies.machine-learning technology. Most of our research and development (“R&D”) expenditures represent costs to develop the software that powers ourthese solutions. This software simplifies the complex through automation, increasingly leveraging artificial intelligence and machine learning technology.
We manage our R&D spending by targeting those innovations and solutions that we believe are most valuable to our customers and by relying on the capabilities of our strategic relationships. Our customer base includesWe have a growing numberglobal R&D presence, with total R&D expenses of service providers, such as cloud service providers, software-as-a-service companies, consumer webtech providers,$2.8 billion, $2.6 billion, and telecommunications companies.$2.5 billionfor Fiscal 2023, Fiscal 2022, and Fiscal 2021, respectively. These service providers turninvestments reflect our commitment to Dell Technologies forR&D activities that ultimately support our advanced solutions that enable efficient service delivery at cloud scale. Throughgoal to help our collaborative, customer-focused approachcustomers build their digital future and to innovation, we strive to deliver new and relevant products to the market quickly and efficiently.transform IT.
Additionally, we invest in early-stage, privately-held companies that develop software, hardware, and other technologies or provide services supporting our technologies. We manage our investments through our venture capital investment arm, Dell Technologies Capital.
VMware represents a significant portion of our R&D activities and has assembled an experienced group of developers with expertise in software-defined data centers, hybrid and multiple public clouds, the modernization, migration and management of applications, networking, security, and digital workspaces. VMware also has strong ties to leading academic institutions around the world and invests in joint research with those institutions. Product development efforts are prioritized through a combination of engineering-driven innovation and customer- and market-driven feedback.
Dell Technologies has a global R&D presence, with total R&D expenses of $5.3 billion, $5.0 billion, and $4.6 billion, for Fiscal 2021, Fiscal 2020, and Fiscal 2019, respectively. These investments reflect our commitment to R&D activities that ultimately support our mission to help our customers build their digital future and to transform IT.
Manufacturing and Materials
We own manufacturing facilities located in the United States, Malaysia, China, Brazil, India, Poland, and Ireland. See “Item 2 — Properties” for information about our manufacturing and distribution facilities.
We also utilize contract manufacturers throughout the world to manufacture or assemble our products under the Dell Technologies brand as part of our strategy to enhance our variable cost structure and to achieve our goals of generating cost efficiencies, delivering products faster, better serving our customers, and enhancing our world-class supply chain.
When using contract manufacturers, we purchase components from suppliers and subsequently sell those components to the manufacturer. Our manufacturing process consists of assembly, software installation, functional testing, and quality control. We conduct operations utilizing a formal, documented quality management system to ensure that our products and services satisfy customer needs and expectations. Testing and quality control are also applied to components, parts, sub-assemblies, and systems obtained from third-party suppliers.
Our quality management system is maintained through the testing of components, sub-assemblies, software, and systems at various stages in the manufacturing process. Quality control procedures also include a burn-in period for completed units after assembly, ongoing production reliability audits, failure tracking for early identification of production and component problems, and processing of information from customers obtained through services and support programs. This system is certified to the ISO 9001 International Standard that includes most of our global sites and organizations that design, manufacture, and service our products.
Our order fulfillment, manufacturing, and test facilities in Massachusetts, North Carolina, and Ireland are also certified to the ISO 9001 International Standard for quality management systems, the ISO 14001 International Standard for environmental management systems, the ISO 45001 International Standard for health and also have achieved OHSAS 18001 certification, an international standardsafety management systems, and the ISO 50001 International Standard for facilities with world-class safety and healthenergy management systems. These internationally-recognized endorsements of ongoing quality, environmental, health and environmentalsafety, and energy management are among the highest levels of certifications
available. We also have implemented Lean Six Sigmaprograms and 7S (Customer, Safety, Quality, Delivery, Cost, Team, and Green) methodologies to ensure that the quality of our designs, manufacturing, test processes, and supplier relationships isare continually improved.
We maintain a robust Supplier Code of Conduct, actively manage recycling processes for our returned products, and are certified by the Environmental Protection Agency as a Smartway Transport Partner.
We purchase materials, supplies, product components, and products from a large number of qualified suppliers. In some cases, where multiple sources of supply are not available, we rely on a single source or a limited number of sources of supply if we believe it is advantageous to do so because of performance, quality, support, delivery, capacity, or price considerations. We believe that any disruption that may occur because of our dependence on single- or limited-source vendors would not disproportionately disadvantage us relative to our competitors. See “Item 1A — Risk Factors — Risks Relating to Our Business and Our Industry — Reliance on vendors for products and components, many of which are single-source or limited-source suppliers, could harm our business by adversely affecting product availability, delivery, reliability, and cost” for information about the risks associated with Dell Technologies’ use of single- or limited-source suppliers.
Geographic Operations
Our global corporate headquarters is located in Round Rock, Texas. We have operations and conduct business in many countries located in the Americas, Europe, the Middle East, Asia, and other geographic regions. To increase our global presence,reach, we continue to focus on emerging markets outside of the United States, Western Europe, Canada, and Japan. We continue to view these geographical markets, which include the vast majority of the world’s population, as a long-term growth opportunity. Accordingly, we pursue the development of technology solutions that meet the needs of these markets. Our expansion in emerging markets creates additional complexity in coordinating the design, development, procurement, manufacturing, distribution, and support of our product and services offerings. For information about the amount of net revenue we generated from our operations outside of the United States during the last three fiscal years, see Note 19 of the Notes to the Consolidated Financial Statements included in this report.
Seasonality
Our sales arecan be affected by seasonal trends. Among the trends with the most significant effect onWithin ISG, our operating results,storage sales to government customers (particularly the U.S. government) generally are typically stronger in our thirdfourth fiscal quarter,quarter. Our sales within the Americas are typically stronger in the second and fourth fiscal quarters, with sales in Europe,EMEA typically stronger during the Middle East and Africa are often weaker in our third fiscal quarter, and sales to consumers are typically strongest during our fourth fiscal quarter. Historical seasonal patterns may not continue in the future and have been impacted by, and may continue to be impacted by, the COVID-19 pandemic, the changing macroeconomic environment, and our mix of business.
Competition
We operate in an industry in which there are rapid technological advances in hardware, software, and services offerings. We face ongoing product and price competition in all areas of our business, including from both branded and generic competitors. We compete based on our ability to offer customers competitive, scalable, and integrated solutions that provide the most current and desired product and services features at a competitive price. We closely monitor market pricing, and solutions trends, including the effect of foreign exchange rate movements, in an effort to provide the best value for our customers. We believe that our strong relationships with our customers and channel partners allow us to respond quickly to changing customer needs and other macroeconomic factors.
We also face competition from non-traditional IT companies, such as cloud serviceincluding large Infrastructure-as-a-Service providers, also known as hyperscalers, that often buy their infrastructure directly from original design manufacturers. Competitive pressures could increase if customers choose to move applicationexisting workloads to cloud service providers away from traditional or private data centers.these Infrastructure-as-a-Service providers.
The markets in which we compete are comprised of largespan countries around the world with customers that range from the world’s largest corporations to small and small companies across all areas of our business.medium-sized businesses to consumers and also includes government and not-for-profit organizations. We believe that new businesses will continue to enter these markets and develop technologies that, if successfully commercialized, may compete with our products and services. Moreover, current competitors may enter into new strategic relationships with new or existing competitors, which may further increase the competitive pressures. See “Item 1A — Risk Factors — Risks Relating to Our Business and Our Industry” for information about our competitive risks.
Sales and Marketing
Our sales and marketing efforts are organized around the evolving needs of our customers, and our marketing initiatives reflect this focus.customers. Our unified global sales and marketing team createshas created a salesgo-to-market organization that is customer-focused, collaborative, and innovative. OWe generally organize our go-to-market operations with a focus on geographic and customer segments which encompass large gur customers include large globallobal and national enterprises, public institutions that include government,governmental agencies, educational institutions, healthcare organizations, and law enforcement agencies, small and medium-sized businesses, and consumers.
Go-to-market strategy — We sell products and services directly to customers and through other sales channels, which include value-added resellers, system integrators, distributors, and retailers. We continuemanage our many channels to pursueoffer a unified customer experience.
We believe our direct business strategy, whichmodel is a significant competitive advantage and emphasizes direct communication with customers, thereby allowing us to refine our products and marketing programs for specific customer groups. and enabling us to successfully navigate environments with constrained supply chains.
In addition to our direct business model, we rely onuse our network of channel partners to sell our products and services, enabling us to efficiently serve a greater number of customers. The Dell Technologies partner program contributes to the development of
channel sales by providing appropriate incentives for revenueto encourage sales generation. We also provide our channel partnersfacilitate access to third-party financing to help our channel partners manage their working capital. We believe that building long-term relationships with our channel partners enhances our ability to deliver an excellenta high-quality customer experience. During Fiscal 2021,2023, our other sales channels contributed overgenerated approximately 50% of our net revenue.
Large enterprises and public institutions — For large enterprises and public institutions, we maintain a field sales force throughout the world. Dedicated account teams, which include technical sales specialists, form long-term relationships to provide our largest customers with a single source of assistance, develop tailored solutions for these customers, position the capabilities of Dell Technologies, and provide us with customer feedback. For these customers, we offer several programs designed to provide single points of contact and accountability with dedicated account managers, special pricing, and consistent service and support programs. We also maintain specific sales and marketing programs targeting federal, state, and local governmental agencies, as well as healthcare and educational customers.
Small and medium-sized business and consumers — We market our products and services to small and medium-sized businesses and consumers through various advertising media. To react quickly to our customers’ needs, we track our Net Promoter Score, a customer loyalty metric that is widely used across various industries. Net Promoter Score is a trademark of Satmetrix Systems, Inc., Bain & Company, Inc., and Fred Reichheld. We also engage with customers through our social media communities on our website and in external social media channels.
Product Backlog
Product backlog represents the value of unfulfilled manufacturing orders.orders and is included as a component of remaining performance obligations to the extent we determine that the manufacturing orders are non-cancelable. Our business model generally gives us the ability to optimize product backlog at any point in time, for example,by such actions as expediting shipping or prioritizing customer orders towardfor products that have shorter lead times. Because productWe ended Fiscal 2022 with elevated backlog at any point in time may notlevels as a result of industry-wide constraints in the generationsupply of any predictable amount of net revenue in any subsequent period,limited-source components. During Fiscal 2023, we do not believe productlowered our backlog to be a meaningful indicator of future net revenue. Product backlog is includedlevels across both CSG and ISG as a component of remaining performance obligation to the extent we determine that the manufacturing orders are non-cancelable.supply positions improved and demand declined.
Patents, Trademarks, and Licenses
As of January 29, 2021,February 3, 2023, we held a worldwide portfolio of 21,87620,693 granted patents and 10,108 pending patent applications. Of those, VMware, Inc. held 5,230 granted patents and 3,1548,045 pending patent applications. We continue to obtain new patents through our ongoing research and development activities. The inventions claimed in our patents and patent applications cover aspects of our current and possible future offerings, computer system andsystems, software products, manufacturing processes, and related technologies. We also hold licenses to use numerous third-party patents. Although we use our patented inventions and license some of them to others, we are not substantially dependent on any single patent or group of related patents. Our product and process patents may establish barriers to entry, and we anticipate that our worldwide patent portfolio will continue to be of value in negotiating intellectual property rights with others in the industry.
We have used, registered, or applied to register certain trademarks and copyrights in the United States and in other countries. We believe that Dell Technologies, DELL, Dell EMC, VMware, Alienware, Secureworks, Pivotal, and VirtustreamSecureworks word marks and logo marks in the United States are material to our operations.
We have entered into software licensing agreements with other companies. We also license certain technology and intellectual property from third parties for use in our offerings and processes, and license some of our technologies and intellectual property to third parties.
Government Regulation
Our business is subject to regulation by various U.S. federal and state governmental agencies and other governmental agencies. Such regulation includes the activities of the U.S. Federal Communications Commission; the anti-trust regulatory activities of the U.S. Federal Trade Commission, the U.S. Department of Justice, and the European Union; the consumer protection laws and financial services regulation of the U.S. Federal Trade Commission and various stateU.S. governmental agencies; the export regulatory activities of the U.S. Department of Commerce and the U.S. Department of the Treasury; the import regulatory activities of the U.S. Customs and Border Protection; the product safety regulatory activities of the U.S. Consumer Product Safety Commission and the U.S. Department of Transportation; the health information privacy and security requirements of the U.S. Department of Health and Human Services; and the environmental, employment and labor, and other regulatory activities of a variety of governmental authorities in each of the countries in which we conduct business.
Our operations are subject to a variety of environmental, performance, and safety regulations in all areas in which we conduct business. Product design and procurement operations must comply with new and future requirements relating to climate change laws and regulations, materials composition, sourcing, radiated emissions, energy efficiency and collection, recycling, treatment, transportation, and disposal of electronics products, including restrictions on mercury, lead, cadmium, lithium metal, lithium ion, and other substances. Operations may also become subject to new or emergent standards relating to climate change laws and regulations. The costsamount and timing of costs under environmental and safety laws are difficult to predict. We were not assessed any material environmental fines, nor did we have any material environmental remediation or other environmental costs, during Fiscal 2021.2023.
We and our subsidiaries are subject to various anti-corruption laws that prohibit improper payments or offers of payments to foreign governments and their officials for the purpose of obtaining or retaining business, and are also subject to export controls, customs regulations, economic sanctions laws, including those currently imposed on Russia, and embargoes imposed by the U.S. government. Violations of the U.S. Foreign Corrupt Practices Act or other anti-corruption laws or export control, customs, or economic sanctions laws and regulations may result in severe criminal or civil sanctions and penalties.
We are subject to provisions of the Dodd-Frank Wall Street Reform and Consumer Protection Act intended to improve transparency and accountability concerning the supply of minerals originating from the conflict zones of the Democratic Republic of the Congo or adjoining countries. We incur costs to comply with the disclosure requirements of this law and other costs relating to the sourcing and availability of minerals used in our products.
Environmental, Social, Impact and SustainabilityGovernance
Dell Technologies is committed to driving human progress by putting our technology and expertise to work where it can do the most good for both people and the planet. AllWe recognize that all of our stakeholders — shareholders, customers, suppliers, employees, and communities — as well as the environment and society, — are essential to our business.
Dell Technologies launched its Social Impact Planis committed to progressing towards the goals set forth in our plan for 2030 (theand beyond (our “2030 Plan”Goals”) in November 2019.. Our goals under the 2030 PlanGoals represent an extension of our purpose as a company — to create technologies that drive human progress. We are using these goals to build our social impact strategies over the next decade. TheOur 2030 Plan hasGoals have four critical areas of focus:
•Advancing Sustainability — We believe we have a responsibility to protect and enrich our planet together with our customers, suppliers, and communities. Dell Technologies willWe continue workingto prioritize sustainability across our business ecosystem, valuing natural resources and minimizingseeking to minimize our impact. With the power of our global supply chain, Dell Technologies has the scale and responsibility to drivepursues the highest standards of sustainability and ethical practices.
•Cultivating Inclusion — We view diversity and inclusion as a business imperative that will enable us to build and empower our future workforce.workforce and we strive to cultivate inclusion for our team members, customers, and communities. It is essential that our workforce be fully representative of the diversity in our global customer base. DiversityFurther, we believe that diversity of leadership increases innovation and ensures that company decisions reflect a wide variety of perspectives.
•Transforming Lives — We believe our scale, support, and the innovative application of our portfolio can play an important role in advancing fundamental human rights and addressing complex societal challenges, including improving health, education, and economic opportunities for the underserved. We endeavor to harness the power of technology to create a future that is capable of fully realizing human potential.
•Upholding Ethics and Data Privacy — Ethics and privacy play a critical role in establishing a strong foundation for positive social impact. We are committed to ensuring that new talent and existing team members align with our ethical culture. We will continue to invest in our advanced privacy governance and risk-management technology. And we willtechnology and continue seeking to select, evaluate, and do business with third parties who share our level of dedication to ethics and privacy.
Dell Technologies is measuring itsmeasures progress against each of theour 2030 social impact goalsGoals in our annually released social impact reports. The Dell Technologies Social Impact Plan for 2030 and annual social impact reports are available on the social impact reporting page of our website.
Climate Change
At Dell Technologies, we believe that by addressing climate change, we are demonstrating our commitment to protect our planet and the community. We have a responsibility to manage the greenhouse gas emissions associated with our direct and indirect footprint, and technology plays an important role in this undertaking. We aim to achieve net zero greenhouse gas emissions across Scopes 1, 2, and 3 by 2050.
Human Capital Management
Powered byWe are a diverse workforce, we create solutions that harnessteam with unique perspectives, united in our purpose, our strategy, and amplify technology in the most meaningful ways.our culture. Our goal is to ensure that Dell Technologies is a compelling destination where team membersemployees of different backgrounds feel valued, engaged, and inspired to do their best work. Through our ongoing diversity and inclusion efforts, flexible workplace transformation programs,working environments, training and development offerings, and health and wellness resources for our team members,employees, we are striving toward this goal — to attract, develop, and retain an empowered workforce for maximum impact internallyworkforce. We believe the success of our commitment is demonstrated through our employee tenure and externally for our customersrecognition by Newsweek as America’s Most Loved Workplace of 2022 and communities.by Forbes in its ranking of the 2022 World’s Best Employers.
As of January 29, 2021,February 3, 2023, we had approximately 158,000 total full-time133,000 employees, approximately 34,00032% of whom were employees of VMware, Inc. In comparison, as of January 31, 2020, we had approximately 165,000 total full-time employees, approximately 31,000 of whom were employees of VMware, Inc. As of January 29, 2021, approximately 36% of our full-time employees were located in the United StatesStates. As a result of rapidly evolving macroeconomic conditions during Fiscal 2023, we took certain measures to reduce cost, including limiting external hiring. Further, subsequent to the close of Fiscal 2023, we announced to our employees reorganizations and other actions to align our investments more closely with our previously discussed strategic and customer priorities. These actions will reduce our employee population by approximately 5%. We are committed to supporting those impacted as they transition to their next opportunities. Despite these difficult decisions, we continue to make investments and focused efforts to develop and empower our employees and attract and retain talent.
Diversity and InclusionWe seek to support our culture in four key focus areas:
Diversity and Inclusion — At Dell Technologies, we believe diversity is power. Within our 2030 Plan, described above, one critical area of focus — cultivating inclusion — highlights how our human capital resources are vital to our social impact and long-term success. We are making stridesCultivating inclusion is a core component of our culture, and we believe that closing the diversity gap is critical to increase gendermeeting future talent needs and ethnic diversity throughout Dell Technologies.ensuring that new perspectives reflect our global customer base. We still have work to do, and are committed to providing transparency into our progress via annual Dell Technologies Diversity & Inclusion Reports. Weequal employment opportunity for all and upholding ethics and integrity in all we do and will continue to champion forpursue inclusive policies that support women, members of the LGBTQ+ community, people with different abilities, and other underrepresented groups. Our goal is to build a workforce that champions racial equity, values different backgrounds and celebrates unique perspectives by:full-spectrum diversity.
•building and attractingAs of February 3, 2023, excluding employees of Secureworks, the future workforce to createoverall representation of employees who self-identify as women was approximately 35%. Of our global people leaders, 29% self-identified as women. We define people leaders as employees in a workplace that is accessible, equitable and attractive to a diverse talent pipeline;management level or executive position.
•developingAs of the same date, our U.S. employee base was composed of employees who self-identified with the following races and retaining an empowered workforce to foster an internal community that is engaged, productiveethnicities: 63% as White or Caucasian; 15% as Asian; 10% as Hispanic or Latino; 6% as Black or African American; 2% with two or more races; and innovative;1% with additional groups (including American Indian, Alaska Native, Native Hawaiian or Other Pacific Islander). Approximately 3% of our U.S. employee base did not self-report or specify race and ethnicity status. Of our U.S. people leaders, 12% self-identified as Hispanic or Latino or as Black or African American.
•scaling for maximum impact to develop stronger customer alliances and an external community that recognizes, respects and embraces our shared value.
To serve tomorrow’s customers well, we need more students of all genders and backgrounds studying STEM (science, technology, engineering, and math) today. We cannot fill our talent pipeline without closing the diversity gap. As the composition of the workforce evolves, we recognize that companies embracing diversity and inclusion are experiencing
greater innovation, productivity, engagement, and employee satisfaction — along with better business performancesatisfaction. We are committed to increasing gender and ethnic diversity throughout Dell Technologies and, as part of our 2030 Plan, have goals focused on this objective. We seek to achieve the following diversity goals within our workforce (excluding employees of Secureworks):
•.By 2030, 50% of our global workforce and 40% of our global people leaders will be those who self-identify as women.
Dell Technologies Diversity & Inclusion Reports are available on the social impact reporting page•By 2030, 25% of our website.U.S. workforce and 15% of our U.S. people leaders will be those who self-identify as Black or African American or as Hispanic or Latino.
Our Culture and Benefits
We seek to meet these goals by:
•building and attracting the future workforce by investing in innovative recruiting and hiring programs intended to attract the best talent possible and address the global technology talent gap; and
•developing and retaining our current team members through a supportive corporate culture focused on equity of access to career advancement and upskilling programs.
Achievement Through Learning, Development, and Total Rewards — We offer a competitive and comprehensive benefits package and strive to provide the best choice and value at the best cost. Our culturecomprehensive rewards programs are designed to attract, reward, and retain high-quality talent and to inspire employees to be their best and do their best work for our customers and the growth of our business. We recognize and reward performance through awards aligned with business strategy and individual objectives while supporting team members’ mental, physical, and financial health, and promoting workplace flexibility and connection. Further, Dell Technologies’ focus on cultivating inclusion is definedan important component of our total rewards philosophy: We believe that equal pay is a business imperative and we are committed to it.
We provide a multitude of programs to support employees’ career growth and development through a centralized experience called “Build Your Career.” Through this program, we offer formal training options, individualized development programs and sponsorship, tools for 360-degree feedback, mentoring, networking, stretch assignments, and growth opportunities. Our tools and resources are designed to empower and inspire employees to direct their own career paths and build a portfolio of transferable skills for success in the technology industry. Our internal Career Hub supports employee growth by our values.providing personalized development suggestions, such as mentors and job opportunities, that align with their skills and development goals. We workare committed to building a diverse leadership pipeline with a broad spectrum of skills, including the ability to lead with integrity and lead by acknowledging the importance of relationships, drive, judgment, vision, optimism, humility,inspire others.
Balance and selflessness Wellness — itWork flexibility is part of our Culture Code. Itculture and remains a significant priority for us. We have built tools and a culture that provide choice and flexibility to employees, the majority of whom work in a hybrid environment. Dell’s global Connected Workplace program allows eligible employees to choose from a variety of flexible work arrangement options that best meet their needs. This program provides technologies to support employees to excel and progress regardless of their physical location.
We support our employees’ wellness through a comprehensive approach focused on mental, physical, and financial health, flexibility, and connection. We provide wellness resources to help employees and their families develop and sustain healthy habits. We further support employee wellness via regular communications, virtual live and on-demand educational sessions, counseling and support services, fitness and wellness challenges, voluntary progress tracking, and other incentives.
Connection and Engagement — We believe that employee feedback is who we are. Ouran important part of our culture matters in how we run the business, how we go to market, and how we treatdrive our strategy. Through our annual Tell Dell survey, employees can confidentially voice their perceptions of the Company and our leadership, culture, and inclusiveness so that we can continue to improve the employee experience. We drive further employee engagement and connection through a variety of initiatives including, but not limited to, our team members.member listening strategy and our Employee Resource Groups (“ERGs”). We have a total of 13 unique ERGs that cultivate inclusion and bring many collective voices together for a greater business impact. Our ERGs also provide personal and professional development through networking opportunities, mentoring, volunteerism, and community involvement.
Human Rights
At Dell Technologies, upholding and advancing respect for the fundamental human rights of all people is core to our business strategy, purpose, and commitment to drive human progress and create a positive and lasting social impact. We believe everyone deserves to be treated equally with dignity and respect, and we are committed to responsible, ethical, inclusive, and sustainable business practices. We believe in winning with integrity, and we leverageuse training and technology and deploy state-of-the-art tools to assist our team members in applying the principles of integrity and compliance as part of everyday business transactions, activities, and decisions.
We seek to create a professional environment where everyone can grow and thrive, and provide a multitude of programs to enhance team members’ career growth and development. We offer formal training options, individualized development programs and sponsorship, tools for 360-degree feedback, mentoring, networking, stretch assignments, and growth opportunities. Our programs are designed to empower and inspire team members to direct their own career paths and build a portfolio of valuable skills for success in the technology industry. We are committed to building a diverse leadership pipeline with a broad spectrum of skills, including the ability to lead with integrity and inspire others. We believe our ability to innovate and cultivate breakthrough thinking is an engine for growth, success, and progress.
We also recognize that the workplace is changing, how people work is changing, and the impact of COVID-19 has only accelerated the “do anything from anywhere” workforce. Dell Technologies offers various flexible work solutions, including our Connected Workplace program, which allows eligible team members to choose from a wide variety of flexible work arrangement options that best meet their needs. Work flexibility is part of our culture, and a recent employee survey indicated that team members strongly believe flexible work arrangements contribute positively to our performance as a company. Our Connected Workplace program is now available in 83 countries across the globe.
During the challenges of the past year, the health and wellness of our team members across the globe has never been more important. We offer a highly competitive and comprehensive benefits package, and strive to provide the best choice and value at the best cost. Additionally, wellness resources are available online through the Dell Wellness Hub to help employees and their families develop and sustain healthy habits. Dell Wellness Hub provides a relevant, personalized, and fun experience that is tailored to each individual’s interests in one easy and convenient place, including physical, mental, and financial wellbeing. We further encourage a focus on wellness via regular communications, virtual live and on-demand educational sessions, voluntary progress tracking, wellness challenges, and other incentives.
Supply Chain Resources
We manage our responsible business practices in one of the world’s largest supply chains. Our supply chain has always demonstrated high standards of responsibility and integrity, and we continue our efforts to drive responsible manufacturing our stakeholders can trust. Our supply chainchains, which involves hundreds of thousands of people around the world. We continue our efforts to drive responsible manufacturing through robust assurance practices, including human rights due diligence and environmental stewardship. We recognize that looking after the wellbeing of people in our supply chain is important and have set goals for our work in this area, including:
•providing healthy work environments where people can thrive;environments;
•delivering future-ready skills development for employees in our supply chain; and
•continuing our engagement with the people who make our products.
We support supplier employees at all levels with training on key topics, including forced labor and health and safety, and we continue to work with suppliers to deliver training directly to employees via their mobile phones. Through this program,initiative, Dell Technologies covers the cost of developing training modules and shares training costs with suppliers who deliver them.
Dell Technologies continuesworks to make significant progress to help ensure that we and our suppliers manufacture our products responsibly. Dell Technologies has one of the largestresponsibly, in part through our social and environmental responsibility assurance programs in the technology sector, both in terms of number ofprogram. Through risk assessments and audits and the program’s reach across the supply chain. Through these audits,conducted under this program, we are ableseek to monitor a supplier factory’sfactories’ adherence to the Responsible Business Alliance (“RBA”) Code of Conduct. Audits are conducted by third-party auditors that have been trained and certified by the RBA. AuditsThe audits cover topics across five areas: labor, including risks of forced labor and weekly working hours; employee health and safety; environment; ethics; and management systems. Through our audit program, we aim to identify and solve concerns in our supply chain, and seek continuouscontinual improvements to address issues and enable suppliers to build their own in-house capabilities. We supplement our audits with targeted assessments of suppliers when we identify opportunities to drive further improvements.
Dell Technologies Supply Chain Sustainability Progress Reports areOur supply chain sustainability progress is available through annual reporting on the social impact reporting page of our website.
Corporate Information
We are a holding company that conducts our operations through subsidiaries.
We were incorporated in the state of Delaware on January 31, 2013 under the name Denali Holding Inc. in connection with Dell’s going-private transaction, which was completed in October 2013. We changed our name to Dell Technologies Inc. on August 25, 2016. The mailing address of our principal executive offices is One Dell Way, Round Rock, Texas 78682. Our telephone number is 1-800-289-3355.
Our website address is www.delltechnologies.com. We make available free of charge through our website our annual report on Form 10-K, quarterly reports on Form 10-Q, and current reports on Form 8-K, and all amendments to those reports, as soon as reasonably practicable after we electronically file such material with, or furnish it to, the SEC. The contents ofinformation on, or accessible through, our website referred to above and the contents ofor any other website we refer to herein arein this report is not a part of, and is not incorporated by reference into, this annual report on Form 10-K.report.
Information about our Executive Officers
The following table sets forth, as of March 5, 2021,4, 2023, information about our executive officers, who are appointed by our boardBoard of directors.Directors.
| | | | | | | | | | | | | | |
| Name | | Age | | Position |
| Michael S. Dell | | 5658 | | Chief Executive Officer and Chairman |
| Jeffrey W. Clarke | | 5860 | | ChiefCo-Chief Operating Officer and Vice Chairman |
| Allison Dew | | 5153 | | Chief Marketing Officer |
| Howard D. Elias | | 6365 | | Chief Customer Officer and President, Services and Digital |
| Richard J. Rothberg | | 59 | | General Counsel |
| Jennifer D. Saavedra, Ph.D. | | 5153 | | Chief Human Resources Officer |
Richard J. Rothberg | | 57 | | General Counsel |
| William F. Scannell | | 5860 | | President, Global Sales and Customer Operations |
| Thomas W. Sweet | | 6163 | | Chief Financial Officer |
| Anthony Charles Whitten | | 46 | | Co-Chief Operating Officer |
Michael S. Dell — Mr. Dell serves as Chairman of the Board and Chief Executive Officer of Dell Technologies. Mr. Dell served as Chief Executive Officer of Dell Inc., a wholly-owned subsidiary of Dell Technologies, from 1984 until July 2004 and resumed that role in January 2007. In 1998, Mr. Dell formed MSD Capital, L.P., a private investment firm, for the purpose of managing his and his family’s investments, and, in 1999, he and his wife established the Michael & Susan Dell Foundation to provide philanthropic support to a variety of global causes. HeMr. Dell is an honorary member of the Foundation Board of the World Economic Forum and is an executive committee member of the International Business Council. He serves as a member of the Technology CEO Council and is a member of the Business Roundtable. He also serves on the advisory board of Tsinghua University’s School of Economics and Management in Beijing, China, on the governing board of the Indian School of Business in Hyderabad, India, and as a board member of Catalyst, Inc., a non-profit organization that promotes inclusive workplaces for women. In June 2014, Mr. Dell was named the United Nations Foundation’s first Global Advocate for Entrepreneurship. Mr. Dell is also Chairman of the Board of Directors of VMware, Inc., a cloud infrastructure and digital workspace technology company that was formerly a public majority-owned subsidiary of Dell Technologies, and Non-Executive Chairman of SecureWorks Corp., a public majority-owned subsidiary of Dell Technologies. Mr. Dell was a board member of Pivotal Software, Inc., formerly a public majority-owned subsidiary of Dell Technologies that provides a leading cloud-native platform, from September 2016 until it was merged with VMware, Inc. in December 2019.
Jeffrey W. Clarke — Mr. Clarke serves as ChiefCo-Chief Operating Officer and Vice Chairman of Dell Technologies, responsible for running day-to-day business operations, shaping the Company’s strategic agenda, and aligningsetting priorities across the Dell Technologies executive leadership team. In partnership with Mr. Whitten, Mr. Clarke overseesdirects the Company’s operations,Infrastructure Solutions Group and the Client Solutions Group and manages Global Operations, including its global manufacturing, procurement, and supply chain activities. Additionally, Mr. Clarke oversees the engineering, design, development,chain. He is also responsible for setting long-term strategy and sales of the Infrastructure Solutions Group across servers, storage, data protection,leads planning for emerging technology areas such as Cloud, Edge, Telecom, and networking products. He also oversees the engineering, design, development, and sales of the Client Solutions Group, including computer desktops, notebooks, workstations, cloud client computing, and end-user computing software solutions.as-a-Service. Mr. Clarke has served as Co-Chief Operating Officer since August 2021, Chief Operating Officer sincefrom December 2019 to August 2021 and Vice Chairman, Products and Operations since September 2017, before which he served as Vice Chairman and President, Operations and Client Solutions with Dell Technologies and, previously, Dell, since January 2009. From January 2003 until January 2009, Mr. Clarke served as Senior Vice President, Business Product Group. From November 2001 to January 2003, Mr. Clarke served as Vice President and General Manager, Relationship Product Group. In 1995, Mr. Clarke became the director of desktop development. Mr. Clarke joined Dell in 1987 as a quality engineer and has
and has served in a variety of other engineering and management roles. Prior toBefore joining Dell Technologies, Mr. Clarke served as a reliability and product engineer at Motorola, Inc.Inc, a global technology company.
Allison Dew — Ms. Dew serves as the Chief Marketing Officer of Dell Technologies. In this role, in which she has served since March 2018, Ms. Dew is directly responsible for the global marketing organization, strategy, and all aspects of Dell Technologies’ marketing efforts, including brand and creative, product marketing, communications, digital, and field and channel marketing. Since joining Dell Technologies in 2008, Ms. Dew has been instrumental in Dell Technologies’ marketing transformation, leading an emphasis on data-driven marketing, customer understanding, and integrated planning. Most recently, prior to her current position, Ms. Dew led marketing for the Dell Technologies Client Solutions Group from December 2013 to March 2018. Before joining Dell Technologies, Ms. Dew served in various marketing leadership roles at Microsoft Corporation, a global technology company. Ms. Dew also worked in both a regional advertising agencyfirm in Tokyo, Japan and and an independent multicultural agency in New York.
Howard D. Elias — Mr. Elias serves as Chief Customer Officer and President, Services and Digital at Dell Technologies. He leads a global organization devoted to customer advocacy and oversees global support, deployment, consulting, education, managed services, services sales, the IT organization, and Virtustream.strategic partnerships. He is executive sponsor for more than a dozen of Dell Technologies’ largest enterprise accounts and is responsible for setting and driving strategy to enable and accelerate the mission-critical business transformations of customers and Dell’s own global operations. Mr. Elias previously served as President and Chief Operating Officer, EMC Global Enterprise Services from January 2013 until EMC’s acquisition by Dell Technologies in September 2016, and was President and Chief Operating Officer, EMC Information Infrastructure and Cloud Services from September 2009 to January 2013. In these roles, Mr. Elias was responsible for setting the strategy, driving the execution, and creating the best practices for services that enabled the digital transformation and data center modernization of EMC’s customers. Mr. Elias also had responsibility at EMC for leading the integration of the Dell and EMC businesses, including overseeing the cross-functional teams that drove all facets of integration planning. Previously, Mr. Elias was EMC’s Executive Vice President, Global Marketing and Corporate Development, responsible for all marketing, sales enablement, technology alliances, corporate development, and new ventures. Mr. Elias was also a co-founder and served on the board of managers for the Virtual Computing Environment Company, now part of Dell Technologies’ converged platform division. Before joining EMC, Mr. Elias served in various capacities at Hewlett-Packard Company, a provider of information technology products, services, and solutions for enterprise customers, most recently as Senior Vice President of Business Management and Operations for the Enterprise Systems Group. Mr. Elias currently serves as chairman of TEGNA Inc., a media and digital business company, and is a member of the Massachusetts Business Roundtable.
Jennifer D. Saavedra, Ph.D. — Dr. Saavedra is Dell Technologies' Chief Human Resources Officer. In this role, Dr. Saavedra leads Dell’s Global Human Resources and Facilities function and accelerates the performance and growth of the company through its culture and its people. Dr. Saavedra previously served as Dell’s Senior Vice President, Human Resources – Sales from December 2019 to March 2021 and as Dell’s Senior Vice President, Human Resources – Talent and Culture from November 2017 to December 2019. Dr. Saavedra joined Dell in 2005 and has served in many key leadership roles throughout the Human Resources organization, including talent development and culture, business partner, strategy, and learning and development. Before joining Dell in 2005, Dr. Saavedra served as a Human Resources consultant to private and public companies. Dr. Saavedra also serves on the executive board for the Black Networking Alliance at Dell Technologies.
Richard J. Rothberg — Mr. Rothberg serves as General Counsel and Secretary for Dell Technologies. In this role, in which he has served since November 2013, Mr. Rothberg oversees the global legal department and manages government affairs, compliance, and ethics. He is also responsible for global security. Mr. Rothberg joined Dell in 1999 and has served in critical leadership roles throughout the legal department. He served as Vice President of Legal, supporting Dell’s businesses in the Europe, Middle East, and Africa region before moving to Singapore in 2008 as Vice President of Legal for the Asia-Pacific and Japan region. Mr. Rothberg returned to the United States in 2010 to serve as Vice President of Legal for the North America and Latin America regions. In this role, he was lead counsel for sales and operations in the Americas and for the enterprise solutions, software, and end-user computing business units. He also led the government affairs organization worldwide. Before joining Dell, Mr. Rothberg served nearly eight years at Caterpillar Inc., an equipment manufacturing company, in senior legal roles in Nashville, Tennessee and Geneva, Switzerland. Mr. Rothberg was also an attorney for IBM Credit Corporation and at Rogers & Wells, a law firm.
William F. Scannell — Mr. Scannell serves as President, Global Sales and Customer Operations for Dell Technologies, leadingheading the global go-to-market organization.organization, including Channel, OEM, Global Alliances, and Specialty Sales. In this role, in which he has served since February 2020, Mr. Scannell is responsible for global go-to-market strategy and driving shareglobal growth by delivering Dell Technologies’ solutions to organizations in established and revenue growth for the Company’s products, services, and solutionsnew markets in approximately 180 countries around the world. countries. Mr. Scannell previously served as President, Global Enterprise Sales and Customer Operations for Dell Technologies from September 2017 to January 2020, leading the global go-to-market organization serving enterprise customers. In this role, Mr. Scannell led the Dell Technologies sales teams to deliver innovative and practical technology solutions to large enterprises and public institutions worldwide. Prior to joining Dell Technologies, Mr. Scannell served as President, Global Sales and Customer Operations at EMC Corporation.EMC. In this role, to which he was appointed in July 2012 after overseeing customer operations in the Americas and EMEA, Mr. Scannell focused on driving coordination and teamwork among EMC’s business unit sales forces, as well as building and maintaining relationships with EMC’s largest global accounts, global alliance partners, and global channel partners. Mr. Scannell began his career as an EMC sales representative in 1986, becoming country manager of Canada in 1988. Shortly thereafter, his responsibilities expanded to include the United States and Latin America. In 1999, Mr. Scannell moved to London to oversee EMC’s business across all of Europe, Middle East, and Africa. He then managed worldwide sales in 2001 and 2002 before being appointed Executive Vice President in 2007.
Thomas W. Sweet — Mr. Sweet serves as Chief Financial Officer of Dell Technologies. In this role, in which he has served since January 2014, he is responsible for all aspects of the Company’s finance function, including accounting, financial planning and analysis, tax, treasury, and investor relations, as well as global business operations, Dell Financial Services and Dell Technologies Capital, and Boomi.Capital. He also co-leadsleads corporate strategy, partnering closely with the Chief Operating Officeroffice of the CEO to develop and execute a long-term growth strategy that creates value for Dell Technologies stakeholders. From May 2007 to January 2014, Mr. Sweet served in a variety of finance leadership roles for Dell, including as Vice President of Corporate Finance, Controller, and Chief Accounting Officer, with responsibility for global accounting, tax, treasury, and investor relations, as well as for global finance services. Mr. Sweet was responsible for external financial reporting for more than five years when Dell Inc. was a publicly-traded company. Prior to this service, he served in a variety of finance leadership positions, including as Vice President responsible for overall finance activities within the corporate business, education, government, and healthcare business units of Dell. Mr. Sweet also has served as the head of internal audit and in a number of sales leadership roles in education and corporate business units since joining Dell in 1997. Prior to joining Dell, Mr. Sweet was Vice President, Accounting and Finance, for Telos Corporation, a provider of security solutions. Before that, heHe previously spent 13 years with Price Waterhouse LLP (now PricewaterhouseCoopers LLP), a firm specializing in accounting, assurance, tax, and consulting services, in a variety of roles primarily focused on providing audit and accounting services to the technology industry. Mr. Sweet serves on the Board of Directors of Trimble Inc., an industrial technology company.
Anthony Charles Whitten — Mr. Whitten is Co-Chief Operating Officer for Dell Technologies, responsible for managing day-to-day business operations, shaping the Company’s strategic agenda and setting priorities across the Dell Technologies executive leadership team. In partnership with Mr. Clarke, Mr. Whitten directs the Infrastructure Solutions Group and the Client Solutions Group and manages Global Operations, including manufacturing, procurement, and supply chain. He is also responsible for setting long-term strategy and leads planning for emerging technology areas such as Cloud, Edge, Telecom, and as-a-Service. Mr. Whitten joined Dell Technologies in August 2021 from Bain & Company (“Bain”), a management consulting company, where he served as the managing partner of Bain Southwest and was a two-time elected member of Bain’s Board of Directors. During his 22-year tenure at Bain, Mr. Whitten supported hundreds of clients across the globe on strategy, company transformation, M&A and capital markets strategy. In the last decade of his career at Bain, he focused exclusively on the technology sector and was intimately involved in shaping the long-term strategy of Dell Technologies. Under his leadership of Bain’s Southwest region, the business more than doubled, was perennially a top Bain office in employee satisfaction, and was recognized in 2020 and 2021 by Fortune Magazine as one of the best workplaces in Texas.
Recent Developments —On February 26, 2023, Mr. Sweet, notified the Company of his decision to retire from his position as Chief Financial Officer, in which position he served as the Company’s principal financial officer, effective as of August 4, 2023.
On March 2, 2023, the Board of Directors appointed Yvonne McGill, who currently serves as the Company’s Corporate Controller, as the Company’s Chief Financial Officer, to succeed Mr. Sweet in that position and as the Company’s principal financial officer, effective as of August 5, 2023.
Ms. McGill, age 56, has served as the Company’s Corporate Controller since February 2020, where she has responsibility for accounting, tax, treasury, and investor relations. Previously, Ms. McGill served as Chief Financial Officer and Senior Vice President, Infrastructure Solutions Group, from March 2018 to February 2020, and Senior Vice President, Global Financial Planning and Analysis, from August 2015 to March 2020. Since joining Dell in 1997, Ms. McGill served in various other finance leadership roles, including heading finance for the Company’s Asia-Pacific, Japan and China region. Before beginning her service with Dell, Ms. McGill worked at ManTech International Corporation, a company providing technology solutions and services to U.S. intelligence, defense and federal civilian agencies, and Price Waterhouse LLP (now PricewaterhouseCoopers LLP), a firm specializing in accounting, assurance, tax, and consulting services. Ms. McGill serves on the board of directors of Applied Materials, Inc., an international materials engineering company.
ITEM 1A — RISK FACTORS
Our business, operating results, financial condition, and prospects are subject to a variety of significant risks, many of which are beyond our control. The following is a description of some of the important risk factors that may cause our actual results in future periods to differ substantially from those we currently expect or seek. The risks described below are not the only risks we face. There are additional risks and uncertainties not currently known to us or that we currently deem to be immaterial that also may materially adversely affect our business, operating results, financial condition, or prospects.
Risks Relating to Our Business and Our Industry
The COVID-19 pandemicAdverse global economic conditions may harm our business and result in reduced net revenue and profitability.
The COVID-19 pandemicAs a global company with customers operating in a broad range of businesses and associated containment measures have causedindustries, our performance is affected by global economic conditions and financial disruptions globally, affecting regions in which we sell ourthe demand for technology products and services in international markets. Adverse economic conditions may negatively affect customer demand, and could result in which we conduct our business operations. We are unable to predictpostponed or decreased spending amid customer concerns over unemployment or slowing demand for their products, reduced asset values, volatile energy costs, geopolitical issues, the full impact the pandemic may have on our results of operations, financial condition, liquidity, and cash flows due to numerous uncertainties, including the progression of the pandemic, governmental and other responses, vaccine availability and cost of credit, and the timingstability and solvency of financial institutions, financial markets, businesses, local and state governments, and sovereign nations. Weak or unstable global economic recovery. We are also unableconditions, including those attributable to predictinternational conflicts, such as the extent ofconflict in Ukraine, international trade protection measures and disputes, such as those between the impact of the pandemic on our customers, suppliers,United States and other partners, which could materially adversely affect demand for our products and services and our results of operations and financial condition.
During Fiscal 2021, COVID-19 disruptions contributed to a weakening of the demand environment for our ISG products and services, which reduced ISG net revenue from the prior year. Our business was adversely affected by supply constraintsChina, or public health issues, such as those resulting from the pandemic that affected the timingcoronavirus disease 19 (“COVID-19”), also could harm our business by contributing to product shortages or delays, supply chain disruptions, insolvency of shipments of certain products in desired quantities or configurations. We also experiencedkey suppliers, customer and counterparty insolvencies, increased freight rates as a result of limits on air freight capacity.
Measures taken to contain the COVID-19 pandemic, such as travel restrictions, quarantines, shelter-in-place,product costs and shutdowns, have affectedassociated price increases, reduced global sales, and will continue to affect our workforce and operations, and those of our vendors, suppliers, and partners. Restrictionsother adverse effects on our operations or workforce, or similar limitations for others, may affectoperations. Any such effects could have a negative impact on our ability to meet customer demand.
We have takennet revenue and will continue to take risk mitigation actions that we believe are in the best interests of our employees, customers, suppliers, and other partners. Work-from-home and other measures introduce additional operational risks, including heightened cybersecurity risks. These measures may not be sufficient to mitigate the risks posed by the virus, and illness and workforce disruptions could lead to unavailability of key personnel and impair our ability to perform critical functions.
The COVID-19 pandemic may continue to cause disruption and volatility in the global debt and capital markets, which may increase our cost of capital and adversely affect our access to capital.
To the extent the COVID-19 pandemic adversely affects our business, results of operations, and financial condition, it also may have the effect of exacerbating the other risks discussed in this “Risk Factors” section. Developments related to the COVID-19 pandemic have been unpredictable, and additional impacts and risks may arise that we are not aware of or are not able to respond to in an effective manner.profitability.
Competitive pressures may adversely affect our industry unit share position, revenue, and profitability.
We operate in an industry in which there are rapid technological advances in hardware, software, and services offerings. As a result, we face aggressive productoffering and price competition from both branded and generic competitors. We compete based on our ability to offer to our customers integrated solutions that provide desired product and services features at a competitive price. Our competitors may provide productsofferings that are less costly, perform better, or include additional features. Further, our productoffering portfolios may quickly become outdated or our market share may quickly erode. Efforts to balance the mix of products and services to optimize profitability, liquidity, and growth may put pressure on our industry position.
As the technology industry continues to expand, there may be new and increased competition in different geographic regions. The generally low barriers to entry into the technology industry increase the potential for challenges from new competitors. Competition also may intensify from an increase in optionsalternatives for mobile and cloud computing solutions. In addition, companies with which we have strategic alliances may become competitors in other product areas, or current competitors may enter into new strategic relationships with new or existing competitors, all of which may further increase competitive pressures.
Reliance on vendors for products and components, many of which are single-source or limited-source suppliers, could harm our business by adversely affecting product availability, delivery, reliability, and cost.
We maintain several single-source or limited-source supplier relationships, including relationships with third-party software providers, either because multiple sources are not readily available or because the relationships are advantageous due to performance, quality, support, delivery, capacity, or price considerations. A delay in the supply of a critical single- or limited-source product or component may prevent the timely shipment of the related product in desired quantities or configurations. In addition, we may not be able to replace the functionality provided by third-party software currently offered with our products if that software becomes obsolete, defective, or incompatible with future product versions or is not adequately maintained or updated. Even where multiple sources of supply are available, qualification of the alternative suppliers and establishment of reliable supplies could result in delays and a possible loss of sales, which could harm our operating results.
We obtain many products and all of our components from third-party vendors, many of which are located outside of the United States. In addition, significant portions of our products are assembled by contract manufacturers, primarily in various locations in Asia. A significant concentration of such outsourced manufacturing is performed by only a few contract manufacturers, often in single locations. We sell components to these contract manufacturers and generate large non-trade accounts
receivables, an arrangement that would present a risk of uncollectibility if the financial condition of a contract manufacturer should deteriorate.
Although these relationships generate cost efficiencies, they limit our direct control over production. The increasing reliance on vendors subjects us to a greater risk of shortages and reduced control over delivery schedules of components and products, as well as a greater risk of increases in product and component costs. We experienced some of these adverse effects in Fiscal 2023, Fiscal 2022, and Fiscal 2021 as a result of continued impacts of the COVID-19.
We may experience additional supply shortages and price increases caused by changes to raw material availability, manufacturing capacity, labor shortages, public health issues, tariffs, trade disputes and protectionist measures, natural catastrophes or the effects of climate change (such as extreme weather conditions, sea level rise, drought, flooding, and wildfires), and significant changes in the financial condition of our suppliers. Because we maintain minimal levels of component and product inventories, a disruption in component or product availability could harm our ability to satisfy customer needs. In addition, defective parts and products from these vendors could reduce product reliability and harm our reputation.
If we fail to achieve favorable pricing from vendors, our profitability could be adversely affected.
Our profitability is affected by our ability to achieve favorable pricing from vendors and contract manufacturers, including through negotiations for vendor rebates, marketing funds, and other vendor funding received in the normal course of business. Because these supplier negotiations are continual and reflect the evolving competitive environment, the variability in timing and amount of incremental vendor discounts and rebates can affect our profitability. The vendor programs may change periodically, potentially resulting in adverse profitability trends if we cannot adjust pricing or variable costs. An inability to establish a cost and product advantage, or determine alternative means to deliver value to customers, may adversely affect our revenue and profitability.
Adverse global economic conditionsWe may harmnot achieve the intended benefits of our business and result in reduced net revenue and profitability.continuing strategic relationship with VMware.
As a global company with customers operating in a broad rangeOn November 1, 2021, upon completion of the VMware Spin-off, the businesses of VMware were separated from our remaining businesses, and industries,we and VMware entered into various agreements that govern our performance is affected by global economic conditionscurrent relationship. Among those agreements, a commercial framework agreement provides a framework under which we and VMware are continuing our strategic relationship, particularly with respect to projects we and VMware believe have the demand for technology products and services in international markets. Adverse economic conditionspotential to accelerate the growth of the industry, product, service, or platform that may negatively affect customer demand, and could result in postponedprovide one or decreased spending amid customer concerns over unemployment, reduced asset values, volatile energy costs, geopolitical issues,both of our companies with a strategic market opportunity. We may not obtain the availability and costbenefits we seek from a continuation of credit, andour strategic relationship with VMware under the stability and solvency of financial institutions, financial markets, businesses, local and state governments, and sovereign nations. Weak or unstable global economic conditions, including due to international trade protection measures and disputes, such as those between the United States and China, or due to public health issues, such as the outbreak of COVID-19 discussed above, also could harm our business by contributing to product shortages or delays, supply chain disruptions, insolvency of key suppliers, customer and counterparty insolvencies, increased product costs and associated price increases, reduced global sales,commercial framework agreement and other adverse effects onarrangements. In addition to a potential for business disruption, the VMware Spin-off could cause our operations. Any such effectscustomers to delay or defer decisions to purchase products or renew contracts, or cause them to end their relationships with us, which could have a negative impactmaterial adverse effect on our net revenue and profitability.business, financial condition, results of operations, or cash flows.
The results of operations of our business units may be adversely affected if we fail to successfully execute our strategy.
Our strategy involves enabling the digital transformation of our customers while leading in the core infrastructure markets in which we compete. Accordingly, we must continue to expand our customer base through direct sales, new distribution channels, continued development of new growth businesses, further development of relationships with resellers, and augmentation of selected business areas through targeted acquisitions and other commercial arrangements. As we reach more customers through new distribution channels and expanded reseller relationships, we may fail to effectively manage effectively the increasingly difficult tasks of inventory management and demand forecasting. Our ability to implement this strategy depends on efficiently transitioning sales capabilities, successfully adding to the breadth of our solutions capabilities through selective acquisitions of other businesses, and effective management of the consequences of these strategic initiatives. If we are unable to meet these challenges, our results of operations could be adversely affected.
We are organized into threetwo business units consisting of ISG and CSG and VMware whichthat are each important components of our strategy. ISG consists ofoffers a portfolio of storage, server, and networking solutions and faces intense competition from existing on-premises competitors and increasing competitive pressures from public cloudInfrastructure-as-a-Service providers. Accordingly, we couldexpect we will be required to make additional investments to combat such competitive pressures and drive future growth. Such pressures could result in the erosion of revenue and operating income and adversely affect ISG’s results of operations. To address an industry trend toward hybrid-computing models, we have developed and continue to develop traditional, converged, and hyper-converged infrastructure solutions. ISG’s results of operations could be adversely affected if such solutions are not adopted by our customers or potential customers, or if customers move rapidly to adopt public cloud solutions.
CSG largely relies on sales of desktops, workstations, and notebooks. Revenue from CSG absorbs our overhead costs and allows for scaled procurement. CSG faces risk and uncertainties from fundamental changes in the personal computer (“PC”) market, including a decline in worldwide revenues for desktops, workstations, and notebooks, and lower shipment forecasts for these products due to a general lengthening of the replacement cycle. Any reduced demand for PC products or a significant increase in competition could cause our operating income to fluctuate and adversely impact CSG’s results of operations.
The success of the VMware business unit depends increasingly on customer acceptance of VMware’s newer products and services. VMware’s solutions are primarily based on server virtualization and related compute technologies used for virtualizing on-premises data center servers, which form the foundation for private cloud computing. As the market for server virtualization continues to mature, the rate of growth in license sales of products such as VMware’s vSphere has declined. The VMware business unit has been increasingly directing its product development and marketing efforts toward products and services that enable businesses to utilize virtualization as the foundation for private, public, hybrid and multi-cloud-based computing, and mobile computing. To the extent that VMware’s newer offerings are adopted by customers more slowly than the rate of decrease in revenue growth in the established server virtualization offerings, this segment’s revenue growth rates may slow materially or its revenue may decline, and VMware may fail to realize returns on its investments in new initiatives.
If our cost efficiency measures are not successful, we may become less competitive.
We continue to focus on minimizing operating expenses through cost improvements and simplification of our corporate structure. We may experience delays or unanticipated costs in implementing our cost efficiency plans, which could prevent the timely or full achievement of expected cost efficiencies and adversely affect our competitive position.
Our inability to manage solutions and product and services transitions in an effective manner could reduce the demand for our solutions, products, and services, and negatively affect the profitability of our operations.
Continuing improvements in technology result in the frequent introduction of new solutions, products, and services, improvements in product performance characteristics, and short product life cycles. If we fail to effectively manage effectively transitions to new solutions and offerings, the products and services associated with such offerings and customer demand for our solutions, products, and services could diminish, and our profitability could suffer.
We increasingly source new products and transition existing products through our contract manufacturers and manufacturing outsourcing relationships to generate cost efficiencies and better serve our customers. The success of product transitions depends on a number of factors, including the availability of sufficient quantities of components at attractive costs.an acceptable cost. Product
transitions also present execution uncertainties and risks, including the risk that new or upgraded products may have quality problems or other defects.
Failure to deliver high-quality products, software, and services could lead to loss of customers and diminished profitability.
We must identify and address quality issues associated with itsour products, software, and services, many of which include third-party components. Although quality testing is performed regularly to detect quality problems and implement required solutions, failure to identify and correct significant product quality issues before the sale of such products to customers could result in lower sales, increased warranty or replacement expenses, and reduced customer confidence, which could harm our operating results.
Cyber attacks orCyber-attacks and other security incidents that disrupt our operations or result in the breach or other compromise of proprietary or confidential information about us or our workforce, customers, or other third parties could disrupt our business, harm our reputation, cause us to lose clients and expose us to costly regulatory enforcement and litigation.
We routinely manage, store, transmit and otherwise process large amounts of proprietary information and confidential data, including sensitive and personally identifiable information, relating to our operations, products, and our customers. We face numerous and evolving cyber risksthreats of increasingsignificant scale, volume, severity, and volume.complexity, making it increasingly difficult to defend against security incidents successfully or to implement adequate preventative measures.
Despite our internal controls and significant and ongoing investment in security measures, criminal or other unauthorized threat actors, including nation states or state-sponsored organizations, may be able to penetrate our security measures,defenses, breach our information technology systems, misappropriate or compromise confidential and proprietary information of our company andor our customers, cause system disruptions and shutdowns, or introduce ransomware, malware, or vulnerabilities into our products, systems, and networks or those of our customers and partners. Employees, contractors, or other insiders may introduce vulnerabilities into our environments or otherwise may seek to misappropriate our intellectual property and proprietary information. Hardware and operating system software and applications that we produce or procure from third parties may contain defects in design or manufacture or other problems that unexpectedly could interfere with the operation of our products. The shift to work-from-home and flexible work arrangements resulting fromfollowing the COVID-19 pandemic may also increase our vulnerability, as employees and contractors of our company and third-party providers are working remotely and using home networks that may pose a significant risk to network, data, and cyber security. In addition, our business may be adversely affected by cyber-attacks and data thefts resulting from ongoing wars and geopolitical conflicts. In the past, we have experienced security incidents, including the unauthorized activity on our network attempting to extract Dell.com customer information we disclosed in November 2018.
The costs to address cyber risks, both before and after a security incident, could be significant, regardless of whether incidents result from an attack on us directly or on third-party vendors upon which we rely. CyberattacksOur customers, partners, and third-party vendors continue to experience security incidents of varying severity, including, but not limited to, increased ransomware attacks, network intrusions, and unauthorized data exfiltration, which have directly and indirectly impacted our operations in the past. Targeted cyber-attacks or those that may result from a security incident directed at a third-party vendor could compromise our internal systems, products, services, and productsofferings, and the systems of our customers, resulting in interruptions, delays, or
cessation of service that could disrupt business operations for us and our customers. Our proactive measures and remediation efforts may not be successful or timely. Any actual or perceived security vulnerabilities in our products or services, or those of third parties we sell, could lead to loss of existing or potential customers, and may impede our sales, manufacturing, distribution, outsourcing services, information technology solutions, and other critical functions and offerings. In addition, breaches of our security measures, including through the use and the unapproved dissemination of proprietary information or sensitive or confidential data about us, our customers, or other third parties, could impair our intellectual property rights and expose us, our customers, or such other third parties to a risk of loss or misuse of such information or data. Any such incidents also could also subject us to government investigations and regulatory enforcement actions, litigation, potential liability, and damage to our brand and reputation, or otherwise harm our business and operations.
Hardware, software, and applications that we produce or procure from third parties also may contain defects in design or manufacture or other deficiencies, including security vulnerabilities that could interfere with the operation or security of our products, services, and offerings. In the event of a security vulnerability or other flaws in third-party components or software code, we may have to rely on multiple third parties to mitigate vulnerabilities. Such mitigation techniques may be ineffective or may result in adverse performance, system instability or data loss, and may not always be available, or available on a timely basis. Any actual or perceived security vulnerabilities in our products or services, or those of third-party products we sell, could lead to loss of existing or potential customers, and may impede our sales, manufacturing, distribution, outsourcing services, information technology solutions, and other critical functions and offerings. Failure to prevent or promptly mitigate security vulnerabilities may adversely affect our brand and reputation and subject us to government investigations, regulatory enforcement actions, litigation and potential liability resulting from our inability to fulfill our contractual obligations to our customers and partners.
As a global enterprise, we are subject to an increasing number of laws and regulations in the United States and numerous other countries relating to the collection, use, residency, transfer, and protection of data, including customer data, and other data.sensitive, confidential, and proprietary information. Our ability to execute transactions and to process and use personal information and other data in the conduct of our business, the operation of our products and offers, and the provision of services to our customers subjects us to complianceincreased obligations to comply with applicable laws and regulations and may require us to notify regulators, customers, employees, or other individuals or entitiesthird parties of aour data processing and data transfer activities, as well as provide notification and disclosure of security incident orincidents and data or privacy breach.breaches. The rapid evolution and increased adoption of artificial intelligence (“AI”) technologies and our obligations to comply with emerging AI laws and regulations may require us to develop additional AI-specific governance programs. We continue to incur significant expenditures to comply with mandatory privacy, security, data protection and securitylocalization requirements and controls imposed by law, regulation, industry standards and contractual obligations. Despite such expenditures, we may face regulatory and other legal actions, including potential liability or the inability to conduct business or sell our products or offers in a specific jurisdiction, in the event of a security incident or data or privacy breach or perceived or actual non-compliance with such regulatory requirements and controls.
WeFailure to successfully execute on strategic initiatives including acquisitions, divestitures or cost saving measures may not successfully implementnegatively impact our acquisition strategy, which could result in unforeseen operating difficulties and increased costs.future results.
We make strategic acquisitions of other companies as part of our growth strategy. We could experience unforeseen operating difficulties in integrating the businesses, technologies, services, products, personnel, or operations of acquired companies, especially if we are unable to retain the key personnel of an acquired company. Further, future acquisitions may result in a delay or reduction of sales for both us and the acquired company because of customer uncertainty about the continuity and effectiveness of solutions offered by either company and may disrupt our existing business by diverting resources and significant management attention that otherwise would be focused on development of the existing business. Acquisitions also may negatively affect our relationships with strategic partners if the acquisitions are seen as bringing us into competition with such partners.
To complete an acquisition, we may be required to use substantial amounts of cash, engage in equity or debt financings, or enter into credit agreements to secure additional funds. Such debt financings could involve restrictive covenants that might limit our capital-raising activities and operating flexibility. Further, an acquisition may negatively affect our results of operations because it may expose us to unexpected liabilities, require the incurrence of charges and substantial indebtedness or other liabilities, have adverse tax consequences, result in acquired in-process research and development expenses, or in the future require the amortization, write-down, or impairment of amounts related to deferred compensation, goodwill, and other intangible assets, or fail to generate a financial return sufficient to offset acquisition costs.
In addition, we periodically divest businesses, including businesses that are no longer a part of our strategic plan. These divestitures similarly require significant investment of time and resources, may disrupt our business and distract management from other responsibilities, and may result in losses on disposition or continued financial involvement in the divested business,
including through indemnification or other financial arrangements, for a period following the transaction, which could adversely affect our financial results.
We continue to focus on minimizing operating expenses through cost improvements and simplification of our corporate structure. Cost saving measures and reorganizations, such as those we announced in February 2023, and divestitures may result in workforce reduction and consolidation of facilities. As a result of these actions, we may experience a loss of continuity, loss of accumulated knowledge, disruptions to our operations and inefficiency during transitional periods. These actions could also impact employee retention. We may experience delays or unanticipated costs in implementing our cost efficiency plans, which could prevent the timely or full achievement of expected cost efficiencies and adversely affect our competitive position.
Our ability to generate substantial non-U.S. net revenue is subject to additional risks and uncertainties.
Sales outside the United States accounted for approximately half of our consolidated net revenue for Fiscal 2021.2023. Our future growth rates and success are substantially dependent on the continued growth of our business outside of the United States. Our international operations face many risks and uncertainties, including varied local economic and labor conditions; political instability; public health issues; changes in the U.S. and international regulatory environments; the impacts of trade protection measures, including increases in tariffs and trade barriers due to the current geopolitical climate and changes and instability in government policies and international trade arrangements, which could adversely affect our ability to conduct business in non-U.S. markets; changes in tax laws (including U.S. taxes on foreign operations);laws; potential theft or other compromise of our technology, data, or intellectual property; copyright levies; and volatility in foreign currency exchange rates. Our international operations could suffer as a result of the withdrawal of the United Kingdom from the European Union, commonly referred to as Brexit, including as a result of modification of trade, immigration, and commercial regulation. We could incur additional operating costs, or sustain supply chain disruptions, due to any such changes. Any of these factors could negatively affect our international business results and growth prospects.
Our profitability may be adversely affected by changes in the mix of products and services, customers, or geographic sales, and by seasonal sales trends.
Our overall profitability for any period may be adversely affected by changes in the mix of products and services, customers, or geographic markets reflected in sales for that period, and by seasonal trends. Profit margins vary among products, services, customers, and geographic markets. For example, our services offerings generally have a higher profit margin than consumer products. In addition, parts of our business are subject to seasonal sales trends. Among the trends with the most significant impact onWithin ISG, our operating results,storage sales to government customers (particularly the U.S. federal government) generally are typically stronger in our thirdfourth fiscal quarter,quarter. Our sales within the Americas are typically stronger in the second and fourth fiscal quarters, while our sales in Europe, the Middle East and Africa are often weaker in our third fiscal quarter, and sales to consumersEMEA are typically strongeststronger during ourthe fourth fiscal quarter.
We may lose revenue opportunities and experience gross margin pressure if sales channel participants fail to perform as expected.
We rely on value-added resellers, system integrators, distributors, and retailers as sales channels to complement our direct sales organization in order to reach more end-users. FutureOur future operating results depend on the performance of sales channel participants and on our success in maintaining and developing these relationships. RevenueOur revenue and gross margins could be negatively affected if the financial condition or operations of channel participants weaken as a result of adverse economic conditions or other business challenges, or if uncertainty regarding the demand for our products causes channel participants to reduce their orders for these products. Further, some channel participants may consider the expansion of our direct sales initiatives to conflict with their business interests as distributors or resellers of our products, which could lead them to reduce their investment in the distribution and sale of such products, or to cease all sales of our products.
Our financial performance could suffer from reduced access to the capital markets by us or some of our customers.
We may access debt and capital sources to provide financing for customers and to obtain funds for general corporate purposes, including working capital, acquisitions, capital expenditures, and funding of customer receivables. In addition, we maintain customer financing relationships with some companies that rely on access to the debt and capital markets to meet significant funding needs. Any inability of these companies to access such markets could compel us to self-fund transactions with such companies or to forgo customer financing opportunities, which could harm our financial performance. The debt and capital markets may experience extreme volatility and disruption from time to time, in the future, which could result in higher credit spreads in such markets and higher funding costs for us. Deterioration in our business performance, a credit rating downgrade, volatility in the securitization markets, changes in financial services regulation, or adverse changes in the economy could lead to reductions in the availability of debt financing. In addition, these events could limit our ability to continue asset securitizations or other forms of financing from debt or capital sources, reduce the amount of financing receivables that we originate, or negatively
affect the costs or terms on which we may be able to obtain capital. Any of these developments could adversely affect our net revenue, profitability, and cash flows.
If the value of our goodwill or intangible assets is materially impaired, our results of operations and financial condition could be materially and adversely affected.
As of January 29, 2021,February 3, 2023, our goodwill and intangible assets, net had a combined carrying value of $55.3$26.1 billion, representing approximately 45%29% of our total consolidated assets. We periodically evaluate goodwill and intangible assets, net to determine whether all or a portion of their carrying values may be impaired, in which case an impairment charge may be necessary. The value of goodwill may be materially and adversely affected if businesses that we acquire perform in a manner that is inconsistent with our assumptions at the time of acquisition. In addition, from time to time we divest businesses, and any such divestiture could result in significant asset impairment and disposition charges, including those related to goodwill and intangible assets, net. Any future evaluations resulting in an impairment of goodwill or intangible assets, net could materially and adversely affect our results of operations and financial condition in the period in which the impairment is recognized.
Weak economic conditions and additional regulation could harm our financial services activities.
Our financial services activities areprimarily through DFS can be negatively affected by adverse economic conditions that contribute to loan delinquencies and defaults. An increase in loan delinquencies and defaults would result in greater net credit losses, which may require us to increase our reserves for customer receivables.
In addition, the implementation of new financial services regulations,regulation, or the application of existing financial services regulation, in countries where we conduct our financial services and related supporting activities, could unfavorably affect the profitability and cash flows of our consumer financing activities.
We are subject to counterparty default risks.
We have numerous arrangements with financial institutions that include cash and investment deposits, interest rate swap contracts, foreign currency option contracts, and forward contracts. As a result, we are subject to the risk that the counterparty to one or more of these arrangements will default, either voluntarily or involuntarily, on its performance under the terms of the arrangement. In times of market distress, a counterparty may default rapidly and without notice, and we may be unable to take
action to cover its exposure, either because of lack of contractual ability to do so or because market conditions make it difficult to take effective action. If one of our counterparties becomes insolvent or files for bankruptcy, our ability eventually to recover any losses suffered as a result of that counterparty’s default may be limited by the impaired liquidity of the counterparty or the applicable legal regime governing the bankruptcy proceeding. In the event of such a default, we could incur significant losses, which could harm our business and adversely affect our results of operations and financial condition.
Our performance and business could suffer if our contracts for ISG services and solutions fail to produce revenue at expected levels due to exercise of customer rights under the contracts, inaccurate estimation of costs, or customer defaults in payment.
We offer our ISG customers a range of consumption models for our services and solutions, including as-a-service,as-a-Service, utility, leases, or immediate pay models, all designed to match customers’ consumption preferences. These solutions generally are multiyear agreements that typically result in recurring revenue streams over the term of the arrangement. Our financial results and growth depend, in part, on customers continuing to purchase our services and solutions over the contract life on the agreed terms. The contracts allow customers to take actions that may adversely affect our recurring revenue and profitability. These actions include terminating a contract if our performance does not meet specified services levels, requesting rate reductions, reducing the use of our services and solutions or terminating a contract early upon payment of agreed fees. In addition, we estimate the costs of delivering the services and solutions at the outset of the contract. If we fail to estimate such costs accurately and actual costs significantly exceed estimates, we may incur losses on the contracts. We also are subject to the risk of loss under the contracts as a result of a default, voluntarily or involuntarily, in payment by the customer, whether because of financial weakness or other reasons.
Loss of government contracts could harm our business.
Contracts with U.S. federal, state, and local governments and with foreign governments are subject to future funding that may affect the extension or termination of programs and to the right of such governments to terminate contracts for convenience or non-appropriation. There is pressure on governments, both domestically and internationally, to reduce spending. Funding reductions or delays could adversely affect public sector demand for our products and services. In addition, if we violate legal or regulatory requirements, the applicable government could suspend or disbar us as a contractor, which would unfavorably affect our net revenue and profitability.
Our business could suffer if we do not develop and protect our proprietary intellectual property or obtain or protect licenses to intellectual property developed by others on commercially reasonable and competitive terms.
If we or our suppliers are unable to develop or protect desirable technology or technology licenses, we may be prevented from marketing products, may have to market products without desirable features, or may incur substantial costs to redesign products. We also may have to defend or enforce legal actions or pay damages if we are found to have violated the intellectual property of other parties. Although our suppliers might be contractually obligated to obtain or protect such licenses and indemnify us against related expenses, those suppliers could be unable to meet their obligations. We invest in research and development and obtain additional intellectual property through acquisitions, but those activities do not guarantee that we will develop or obtain intellectual property necessary for profitable operations. Costs involved in developing and protecting rights in intellectual property may have a negative impact on our business. In addition, our operating costs could increase because of copyright levies or similar fees by rights holders and collection agencies in European and other countries.
Infrastructure disruptions could harm our business.
We depend on our information technology and manufacturing infrastructure to achieve our business objectives. Natural disasters, manufacturing failures, telecommunications system failures, or defective or improperly installed new or upgraded business management systems could lead to disruptions in this infrastructure. Portions of our IT infrastructure, including those provided by third parties, also may experience interruptions, delays, or cessations of service, or produce errors in connection with systems integration or migration work. Such disruptions may adversely affect our ability to receive or process orders, manufacture and ship products in a timely manner, or otherwise conduct business in the normal course. Further, portions of our services business involve the processing, storage, and transmission of data, which also would be negatively affected by such an event. Disruptions in our infrastructure could lead to loss of customers and revenue, particularly during a period of heavy demand for our products and services. We also could incur significant expense in repairing system damage and taking other remedial measures.
Failure to hedge effectively our exposure to fluctuations in foreign currency exchange rates and interest rates could adversely affect our financial condition and results of operations.
We utilize derivative instruments to hedge our exposure to fluctuations in foreign currency exchange rates and interest rates. Some of these instruments and contracts may involve elements of market and credit risk in excess of the amounts recognized in our financial statements. Global economic events, including trade disputes, economic sanctions and emerging market volatility, and associated uncertainty maycould cause currencies to fluctuate, which may contribute to variations in our sales of products and services in various jurisdictions. If we are not successful in monitoring our foreign exchange exposures and conducting an effective hedging program, our foreign currency hedging activities may not offset the impact of fluctuations in currency exchange rates on our future results of operations and financial position.
Adverse legislative or regulatory tax changes, the expiration of tax holidays or favorable tax rate structures, or unfavorable outcomes in tax audits and other tax compliance matters could result in an increase in our tax expense or our effective income tax rate.
Changes in tax laws (including any future U.S. Treasury notices or regulations related to the Tax Cuts and Jobs Act that was signed into law on December 22, 2017) could adversely affect our operations and profitability. In recent years, numerous legislative, judicial, and administrative changes have been made to tax laws applicable to us and similar companies. The Organisation for Economic Co-operation and Development (the “OECD”), an international association of 3738 countries, including the United States, has issued guidelines that change long-standing tax principles. The OECD guidelines may introduce tax uncertainty as countries amend their tax laws to adopt certain parts of the guidelines. Additional changes to tax laws are likely to occur, and such changes may adversely affect our tax liability.
Portions of our operations are subject to a reduced tax rate or are free of tax under various tax holidays that expire in whole or in part from time to time. Many of these holidays may be extended when certain conditions are met, or may be terminated if certain conditions are not met.met or as a result of changes in tax legislation. If the tax holidays are not extended, if tax legislation changes, or if we fail to satisfy the conditions of the reduced tax rate, our effective tax rate would be affected. Our effective tax rate also could be impacted if our geographic sales mixdistribution of earnings changes. In addition, any actions by us to repatriate non-U.S. earnings for which we have not previously provided for U.S. taxes may affect the effective tax rate.
We are continually under audit in various tax jurisdictions. We may not be successful in resolving potential tax claims that arise from these audits. A final determination of tax audits or disputes may differ from what is reflected in our historical income tax provisions or benefits and accruals. An unfavorable outcome in certain of these matters could result in a substantial increase in our tax expense. In addition, our provision for income taxes could be adversely affected by changes in the valuation of deferred tax assets.
Our profitability could suffer from anydeclines in fair value or impairment of our portfolio investments.
We invest a significant portion of available funds in a portfolio consisting primarily of both equity and debt securities of various types and maturities pending the deployment of these funds in our business. Our earnings performance could suffer from anyequity investments consist of strategic investments in both marketable and non-marketable securities. Investments in marketable securities are measured at fair value on a recurring basis. We have elected to apply the measurement alternative for non-marketable securities. Under the alternative, we measure investments without readily determinable fair values at cost, less impairment, of our investments.adjusted by observable price changes. Our portfoliodebt securities generally are classified as available-for-saleheld to maturity and are recorded in our financial statements at fair value. If any such investments experienceamortized cost. Our earnings performance could suffer from declines in market price and it is determined that such declines are other than temporary, we may have to recognize in earnings the decline in the fair market value or impairment of such investments below their cost or carrying value.our investments.
Unfavorable results of legal proceedings could harm our business and result in substantial costs.
We are involved in various claims, suits, investigations, and legal proceedings that arise from time to time in the ordinary course of business as well as those that arose in connection with the Class V transaction, including those described elsewhere in this report.or otherwise. Additional legal claims or regulatory matters affecting us and our subsidiaries may arise in the future and could involve stockholder, consumer, regulatory, compliance, intellectual property, antitrust, tax, and other issues on a global basis. Litigation is inherently unpredictable. Regardless of the merits of a claim, litigation may be both time-consuming and disruptive to our business. We could incur judgments or enter into settlements of claims that could adversely affect our operating results or cash flows in a particular period. Even if we are not named a party to a particular suit, we may be subject to indemnification obligations to the named parties that could subject us to liability for damages or other amounts payable as a result of such judgments or settlements. In addition, our business, operating results, and financial condition could be adversely affected if any infringement or other intellectual property claim made against us by any third party is successful, or
if we fail to develop non-infringing technology or license the proprietary rights on commercially reasonable terms and conditions.
Expectations relating to environmental, social and governance (ESG) considerations expose us to potential liabilities, increased costs, reputational harm, and other adverse effects on our business.
Many governments, regulators, investors, employees, customers, and other stakeholders are increasingly focused on environmental, social and governance (“ESG”) considerations relating to businesses, including climate change and greenhouse gas emissions, human and civil rights, and diversity and inclusion. We make statements about our environmental, social and governance goals and initiatives through our SEC filings, our annual ESG report, our other non-financial reports, information provided on our website, press statements and other communications. Responding to these ESG considerations and implementation of these goals and initiatives involves risks and uncertainties, requires investments, and depends in part on third-party performance or data that is outside our control. We cannot guarantee that we will achieve our announced ESG goals and initiatives. In addition, some stakeholders may disagree with our goals and initiatives. Any failure, or perceived failure, by us to achieve our goals, further our initiatives, adhere to our public statements, comply with federal, state, or international ESG laws and regulations, or meet evolving and varied stakeholder expectations and standards could result in legal and regulatory proceedings against us and materially adversely affect our business, reputation, results of operations, and financial condition.
Compliance requirements of current or future environmental and safety laws, human rights laws, or other laws may increase costs, expose us to potential liability and otherwise harm our business.
Our operations are subject to environmental and safety regulations in all areas in which we conduct business. Product design and procurement operations must comply with new and future requirements relating to climate change laws and regulations,
materials composition, sourcing, energy efficiency and collection, recycling, treatment, transportation, and disposal of electronics products, including restrictions on mercury, lead, cadmium, lithium metal, lithium ion, and other substances. If we fail to comply with applicable rules and regulations regarding the transportation, source, use, and sale of such regulated substances, we could be subject to liability. The costs and timing of costs under environmental and safety laws are difficult to predict, but could have an adverse impact on our business.
In addition, we and our subsidiaries are subject to various anti-corruption laws that prohibit improper payments or offers of payments to foreign governments and their officials for the purpose of obtaining or retaining business, and are also subject to export controls, customs, economic sanctions laws, including those currently imposed on Russia, and embargoes imposed by the U.S. government. Violations of the U.S. Foreign Corrupt Practices Act or other anti-corruption laws or export control, customs, or economic sanctions laws may result in severe criminal or civil sanctions and penalties, and we and our subsidiaries may be subject to other liabilities whichthat could have a material adverse effect on our business, results of operations, and financial condition.
We are subject to various human rights laws, including provisions of the Dodd-Frank Wall Street Reform and Consumer Protection Act intended to improve transparency and accountability concerning the supply of minerals originating from the conflict zones of the Democratic Republic of the Congo or adjoining countries. We incur costs to comply with the disclosure requirements of this law and other costs relating to the sourcing and availability of minerals used in our products. Further, we may face reputational harm if our customers or other stakeholders conclude that we are unable to sufficiently verify the origins of the minerals used in our products.
ArmedNatural disasters, terrorism, armed hostilities, terrorism, natural disasters, climate change, or public health issues could harm our business.
ArmedNatural disasters, terrorism or armed hostilities, terrorism, natural disasters, climate changesuch as the war between Russia and Ukraine, or public health issues, such as those resulting from the COVID-19 pandemic, whether in the United States or in other countries, could cause damage or disruption to us or our suppliers and customers, or could create political or economic instability, any of which impacts could harm our business. For example, tornadoes in Tennessee, wildfires in California, and typhoons in the Phillipines disrupted our operations in those areas in recent periods. Any such events in the future could cause a decrease in demand for our products, make it difficult or impossible to deliver products or for suppliers to deliver components, and create delays and inefficiencies in our supply chain.
The COVID-19 pandemic negatively impacted the global economy, disrupted global supply chains, created significant volatility and disruption in financial markets, and, at times, increased unemployment levels. In addition, the pandemic resulted in temporary closures of many businesses and the institution of various lockdown orders and sheltering in place requirements around the world. The effects of COVID-19 adversely impacted aspects of our business over the last three fiscal years. The full impact of COVID-19 or any other widespread public health issue on our financial condition and results of operations will depend on the duration and scope of an outbreak (including the emergence or re-emergence of variants and their transmissibility, and the success of vaccination programs and treatments), its impact on our consumers and our partners, how quickly normal economic conditions, operations, and the demand for our services and products can resume, and any permanent behavioral changes which the pandemic or other public health issue may cause. These conditions and impacts are highly uncertain and cannot be predicted.
Global climate change, and legal, regulatory, or market measures to address climate change, may negatively affect our business, operations, and financial results.
We are subject to risks associated with the long-term effects of climate change on the technologyglobal economy and on the IT industry in particular. The physical risks associated with climate change include the adverse effects of carbon dioxide and other greenhouse gases on global temperatures, weather patterns, and the global economy are unclear. Climatefrequency and severity of natural disasters. Extreme weather and natural disasters within or outside the United States could make it more difficult and costly for us to manufacture and deliver our products to our customers, obtain production materials from our suppliers, or perform other critical corporate functions. For example, tornadoes in Tennessee, wildfires in California, and typhoons in the Philippines disrupted our operations in those areas in recent periods.
The increasing concern over climate change could also result in transition risks such as shifting customer preferences or regulatory changes. Changing customer preferences may result in increased demands regarding our solutions, products, and services, including the use of packaging materials and other components in our products and their environmental impact on sustainability. These demands may cause us to incur additional costs or make other changes to other operations to respond to such demands, which could adversely affect our financial results. If we fail to manage transition risks, including such demands,
in an effective manner, customer demand for our solutions, products, and services could diminish, and our profitability could suffer.
The increasing concern over climate change could result in certain typesnew domestic or international legal requirements for us to reduce greenhouse gas emissions and other environmental impacts of natural disasters occurring more frequentlyour operations, improve our energy efficiency, or with more intensity. Such eventsundertake sustainability measures that exceed those we currently pursue. Any such regulatory requirements could affectcause disruptions in the manufacture of our ability to provide servicesproducts and solutions to our customers and could result in reductionsincreased procurement, production, and distribution costs. Our reputation and brand could be harmed if we fail, or are seen as having failed, to respond responsibly and effectively to changes in sales, earnings, or productivity resulting from such potential impacts as production delays or limitations, adverse effects on distributors, supply chain disruptions,legal and reduced accessregulatory measures adopted to facilities.address climate change.
We are highly dependent on the services of Michael S. Dell, our Chief Executive Officer, and our success depends on the abilityloss of, or our inability to continue to attract, retain, and motivate, key employees.executive talent and other employees in this highly competitive market could harm our business.
We are highly dependent on the services of Michael S. Dell, our founder, Chief Executive Officer, and largest stockholder. If we lose the services of Mr. Dell, we may not be able to locate a suitable or qualified replacement, and we may incur additional expenses to recruit a replacement, which could severely disrupt our business and growth. Further, we rely on key personnel, including other members of our executive leadership team, to support our business and increasingly complex product and services offerings. WeOur experienced executives are supported by employees in our U.S. and international operations who are highly skilled in product development, manufacturing, sales, and other functions critical to our future growth and profitability.If we lose the services of Mr. Dell or other key personnel, we may not be able to locate suitable or qualified replacements, and we may incur additional expenses to recruit replacements, which could severely disrupt our business and growth.We face intensive competition, both within and outside of our industry, in retaining and hiring individuals with the requisite expertise.As a result of this competition, we may be unable to continue to attract, retain, and motivate suitably qualified individuals at acceptable compensation levels who have the key professional,managerial, operational, and technical marketing,knowledge and staff resources needed.
experience to meet our needs.
Our level ofWe have outstanding indebtedness and may incur additional debt in the future, which could adversely affect our financial condition.
While we continue to prioritize debt paydown as part of our overall capital allocation strategy, our level of indebtedness requires significant interest and other debt service payments. As of January 29, 2021,February 3, 2023, we and our subsidiaries had approximately $48.5$29.6 billion aggregate principal amount of indebtedness. As of the same date, we and our subsidiaries also had an additional $5.5$6.0 billion available for borrowing under our revolving credit facilities.
Our levelfacility and $5.0 billion of indebtedness could have important consequences, including the following:
•we must useavailability under our commercial paper program. Although continued debt paydown is part of our overall capital allocation strategy, a significantsubstantial portion of our cash flow from operations is used to paymake interest and principal on our senior credit facilities, our senior secured and senior unsecured notes, and our other indebtedness,debt service payments, which reduces funds available to us for other purposes such as working capital, capital expenditures, other general corporate purposes, and potential acquisitions;
•our ability to refinance suchacquisitions. Our indebtedness or to obtain additional financing for working capital, capital expenditures, acquisitions, or other general corporate purposes may be impaired;
•we are exposed to fluctuations in interest rates because our senior credit facilities have variable rates of interest;
•our level of indebtedness may be greater than that of some of our competitors, which may put us at a competitive disadvantage andcould also reduce our flexibility in responding to current and changing industry and financial market conditions; and
•weconditions. We may be unableable to comply with financialincur significant additional secured and other restrictive covenants inunsecured indebtedness under the terms of our senior credit facilities, our senior notes, and other indebtedness that limitexisting debt, which generally do not restrict our ability to incur additional unsecured debt make investments and sell assets, which could result in an event of default that, if not cured or waived, would have an adverse effect oncontain significant exceptions to the covenant restricting our business and prospects and could force it into bankruptcy or liquidation.ability to incur additional secured debt.
We and our subsidiaries may be able to incur substantial additional indebtedness in the future, subject to the restrictions contained in our and our subsidiaries’ credit facilities and the indentures that govern the senior notes. If new indebtedness is added to the debt levels of us and our subsidiaries, the related risks that we now face could intensify. Our ability to access additional funding under existing revolving credit facilities will depend upon, among other factors, the absence of a default under any such facility, including any default arising from a failure to comply with the related covenants. If we are unable to comply with our covenants under our revolving credit facilities, our liquidity may be adversely affected.
From time to time, when we believe it is advantageous to do so, we may seek to reduce leverage by repaying or retiring certain of our indebtedness before the maturity dates of such indebtedness. We may be unable to generate operating cash flows and other cash necessary to achieve a level of debt reduction that will significantly enhance our credit quality and reduce the risks associated with our indebtedness.
As of January 29, 2021, approximately $11.3 billion of our debt was variable-rate indebtedness and a 100 basis point increase in interest rates would have resulted in an increase of approximately $93 million in annual interest expense on such indebtedness. Our ability to meet our expenses, to remain in compliance with our covenants under our debt instruments and to make future principal and interest payments in respect of our indebtedness depends on, among other factors, our operating performance, competitive developments, and financial market conditions, all of which are significantly affected by financial, business, economic, and other factors. We are not able to control many of these factors.
Our current outstanding variable-rate indebtedness uses the London Interbank Offered Rate (“LIBOR”) as a benchmark for establishing the interest rate. LIBOR is the subject of recent national, international, and other regulatory guidance and proposals for reform. As result of these reforms, LIBOR is expected to be phased out starting on January 1, 2022 for the one-week and two-month USD LIBOR settings and starting on July 1, 2023 for the remaining USD LIBOR settings. Alternatives to LIBOR may perform differently than in the past. We are in the process of amending relevant agreements based on LIBOR, but we cannot predict what alternative index will be negotiated with our counterparties. As a result, our interest expense could increase and our available cash flow for general corporate requirements may be adversely affected. In addition, uncertainty as to the nature of a potential discontinuance, modification, alternative reference rates or other reforms may materially adversely
affect the trading market for securities linked to such benchmarks. We, however, cannot predict the timing of these developments or their impact on our indebtedness or financial condition.
Our financial performance is affected by the financial performance of VMware, Inc.
We consolidate the financial results of VMware, Inc., a publicly traded subsidiary, in our results of operations. Certain adjustments and eliminations are required to reconcile VMware, Inc.’s standalone financial results to the VMware reportable segment financial results consolidated in our results of operations. Such adjustments and eliminations primarily consist of intercompany sales and allocated expenses, as well as expenses that are excluded from the VMware reportable segment, such as amortization of intangible assets, stock-based compensation expense, severance, and integration and acquisition-related costs. For the fiscal year ended January 29, 2021, VMware reportable segment net revenue accounted for 13% of Dell Technologies’ total reportable segment net revenue, and VMware reportable segment operating income accounted for 33% of Dell Technologies’ total reportable segment operating income. As a result, our financial performance is affected by the financial performance of VMware, Inc. and by the risks and uncertainties that could materially adversely affect VMware, Inc.’s business, operating results, financial condition or prospects. See Note 19 of the Notes to the Consolidated Financial Statements included in this report for a reconciliation of reportable segment results to consolidated results.
Risks Relating to Ownership of Our Class C Common Stock
Our multi-class common stock structure with different voting rights may adversely affect the trading price of the Class C Common Stock.
Each share of our Class A Common Stock and each share of our Class B Common Stock has ten votes, while each share of our Class C Common Stock has one vote. Because of these disparate voting rights, Michael Dell and the Susan Lieberman Dell Separate Property Trust (the “MD stockholders”) and certain investment funds affiliated with Silver Lake Partners (the “SLP stockholders”) collectively held common stock representing approximately 94.8%95.2% of the total voting power of our outstanding common stock as of January 29, 2021.February 3, 2023. The limited ability of holders of the Class C Common Stock to influence matters requiring stockholder approval may adversely affect the market price of the Class C Common Stock.
In addition, in 2017,recent years, FTSE Russell and S&P Dow Jones changed their eligibility criteria to exclude new companies with multiple classes of shares of common stock from being added to certain stock indices. FTSE Russell instituted a requirement that new and, beginning in September 2022, existing constituents of its indices have greater than 5% of their voting rights in the hands of public stockholders, as calculated by FTSE Russell, whereas S&P Dow Jones announced that companies with multiple
share classes, such as Dell Technologies, will not be eligible for inclusion in the S&P 500, S&P MidCap 400, and S&P SmallCap 600, which together make up the S&P Composite 1500. Other major stock indices might adopt similar requirements in the future. FTSE Russell’s determination may change at any time. Under the current criteria, at a minimum, our multi-class capital structure makes itour Class C Common Stock ineligible for inclusion in thespecified S&P Dow Jones indices, including those making up the S&P Composite 1500, and, as a result, mutual funds, exchange-traded funds, and other investment vehicles that track these indices will not invest in the Class C Common Stock. It is unclear what effect, if any, exclusion from any indices will havehas on the valuations of the affected publicly-traded companies. It is possible that such policies may depress the valuations of public companies excluded from such indices compared to valuations of companies that are included.
Future sales, or the perception of future sales, of a substantial amount of shares of the Class C Common Stock could depress the trading price of the Class C Common Stock.
Sales of a substantial number of shares of the Class C Common Stock in the public market, or the perception that these sales may occur, could adversely affect the market price of the Class C Common Stock, which could make it more difficult for investors to sell their shares of Class C Common Stock at a time and price that they consider appropriate. These sales, or the possibility that these sales may occur, also could impair our ability to sell equity securities in the future at a time and at a price we deem appropriate, and our ability to use Class C Common Stock as consideration for acquisitions of other businesses, investments, or other corporate purposes. As of January 29, 2021,February 3, 2023, we had a total of approximately 266242 million shares of Class C Common Stock outstanding.
As of January 29, 2021,February 3, 2023, the 383,724,977378,224,977 outstanding shares of Class A Common Stock held by the MD stockholders and the 101,685,21795,350,227 outstanding shares of Class B Common Stock held by the SLP stockholders are convertible into shares of Class C
Common Stock at any time on a one-to-one basis. Although the MD stockholders and the SLP stockholders generally are subject to agreements that restrict their sale or other transfer of common stock until June 27, 2021, thereafter suchSuch shares, upon any conversion into shares of Class C Common Stock, will be eligible for resale in the public market pursuant to Rule 144 under the Securities Act of 1933 (the “Securities Act”), subject to volume, mannercompliance with conditions of sale, and other limitations under Rule 144.
In addition, as of January 29, 2021, weWe have entered into a registration rights agreement with holders of 383,724,977378,224,977 outstanding shares of Class A Common Stock (which are convertible into the same number of shares of Class C Common Stock), holders of all of the 101,685,21795,350,227 outstanding shares of Class B Common Stock (which are convertible into the same number of shares of Class C Common Stock), and holders of 17,531,449approximately 6,000,000 outstanding shares of Class C Common Stock, pursuant to which we granted such holders and their permitted transferees shelf, demand and/or piggyback registration rights with respect to such shares. Registration of those shares under the Securities Act would permit such holders to sell the shares into the public market.
Further, as of January 29, 2021, we had 38,176,604February 3, 2023, 52,112,831 shares of Class C Common Stock that may be issuedwere issuable upon the exercise, vesting, or settlement of outstanding stock options, restricted stock units, or deferred stock units under our stock incentive plans,plan, all of which would have been, upon issuance, eligible for sale in the public market, subject where applicable to expiration or waiver of contractual transfer restrictions,compliance with Rule 144, and an additional 31,650,56228,075,072 shares of Class C Common Stock that have beenwere authorized and reserved for issuance pursuant to potential future awards under the stock incentive plans.plan. We also may issue additional stock options in the future that may be exercised for additional shares of Class C Common Stock and additional restricted stock units or deferred stock units that may vest. We expect that all shares of Class C Common Stock issuable with respect to such awards will be registered under one or more registration statements on Form S-8 under the Securities Act and available for sale in the open market.
We do not presently intend to pay cash dividends on the Class C Common Stock.
We do not presently intend to pay cash dividends on the Class C Common Stock. Accordingly, investors may have to rely on sales of the Class C Common Stock after price appreciation, which may never occur, as the only way to realize any gains on their investment in the Class C Common Stock.
We are controlled by the MD stockholders, who, together with the SLP stockholders, collectively own a substantial majority of our common stock and are able to effectively control our actions, including approval of mergers and other significant corporate transactions.
By reason of their ownership of Class A Common Stock possessing a majority of the aggregate votes entitled to be cast by holders of all outstanding shares of our common stock voting together as a single class, the MD stockholders have the ability to approve any matter submitted to the vote of all of the outstanding shares of the common stock voting together as a single class.
Through their control, the MD stockholders are able to control our actions, including actions related to the election of our directors and directors of our subsidiaries, (including VMware, Inc. and its subsidiaries), amendments to our organizational documents, and the approval of significant corporate transactions, including mergers and sales of substantially all of our assets that our stockholders may deem advantageous. For example, although our bylaws provide that the number of directors will be fixed by resolution of the boardBoard of directors,Directors, our stockholders may adopt, amend, or repeal the bylaws in accordance with the Delaware General Corporation Law. Through their control, the MD stockholders therefore may amend our bylaws to change the number of directors (within the limits of the certificate of incorporation), notwithstanding any determination by the boardBoard of directorsDirectors regarding board size.
Further, as of January 29, 2021,February 3, 2023, the MD stockholders and the SLP stockholders collectively beneficially owned 65.2%67.0% of our outstanding common stock. This concentration of ownership together with the disparate voting rights of our common stock may delay or deter possible changes in control of Dell Technologies, which may reduce the value of an investment in the Class C Common Stock. So long as the MD stockholders and the SLP stockholders continue to own common stock representing a significant amount of the combined voting power of our outstanding common stock, even if such amount is, individually or in the aggregate, less than 50%, such stockholders will continue to be able to strongly influence our decisions.
In addition, the MD stockholders and the SLP stockholders, respectively, have the right to nominate a number of individuals for election as Group I Directors (who constitute all but one of our directors), which is equal to the percentage of the total voting power for the regular election of directors beneficially owned by the MD stockholders or by the SLP stockholders multiplied by the number of directors then on the boardBoard of directorsDirectors who are not members of the audit committee, rounded up to the nearest whole number. Further, so long as the MD
stockholders or the SLP stockholders each beneficially own at least 5% of all outstanding shares of the common stock entitled to vote generally in the election of directors, each of the MD stockholders or the SLP stockholders, as applicable, are entitled to nominate at least one individual for election as a Group I Director.
The MD stockholders, the MSD Partners stockholders, and the SLP stockholders and their respective affiliates may have interests that conflict with the interests of other stockholders or those of Dell Technologies.
In the ordinary course of their business activities, the MD stockholders, certain investment funds affiliated with an investment firm formed by principals of the firm that manages the capital of Michael Dell and his family (the “MSD Partners stockholders”), and the SLP stockholders and their respective affiliates may engage in activities in which their interests conflict with our interests or those of other stockholders. Our certificate of incorporation provides that none of the MD stockholders, the MSD Partners stockholders, the SLP stockholders, nor any of their respective affiliates or any director or officer of the Company who is also a director, officer, employee, managing director, or other affiliate (other than Michael Dell) have any duty to refrain from engaging, directly or indirectly, in the same business activities or similar business activities or lines of business in which we operate. The MD stockholders, the MSD Partners stockholders, and the SLP stockholders also may pursue acquisition opportunities that may be complementary to our business and, as a result, those acquisition opportunities may not be available to us. In addition, such stockholders may have an interest in pursuing acquisitions, divestitures, and other transactions that, in their judgment, could enhance the value of their investment in Dell Technologies, even though such transactions might involve risks to other stockholders.
Because we are a “controlled company” within the meaning of NYSEthe rules of the New York Stock Exchange and, as a result, qualify for, and rely on, exemptions from certain corporate governance requirements, holders of Class C Common Stock do not have the same protections afforded to stockholders of companies that are subject to such requirements.
We are a “controlled company” within the meaning of NYSEthe rules of the New York Stock Exchange (the “NYSE”) because the MD stockholders hold common stock representing more than 50% of the voting power in the election of directors. As a controlled company, we may elect not to comply with certain corporate governance requirements under NYSE rules, including the requirements that we have a board composed of a majority of “independent directors,” as defined under NYSE rules, and that we have a compensation committee and a nominating/corporate governance committee each composed entirely of independent directors. Although we currently maintain a board composed of a majority of independent directors, we currently utilize the exemptions relating to committee composition and expect to continue to utilize those exemptions. As a result, none of the committees of the boardBoard of directors,Directors, other than the audit committee, consists entirely of independent directors. Further, we may decide in the future to change our board membership so that the board is not composed of a majority of independent directors. Accordingly, holders of Class C Common Stock do not have the same protections afforded to stockholders of companies that are subject to all of the NYSE’s corporate governance requirements.
Our certificate of incorporation designates a state court of the State of Delaware orand the U.S. federal district court for the District of Delawarecourts as the sole and exclusive forum for certain types of legal actions and proceedings that may be initiated by our stockholders, which could limit the ability of the holders of Class C Common Stock to obtain a favorable judicial forum for disputes with us or with our directors, officers, or controlling stockholders.
Our certificate of incorporation contains provisions requiring an exclusive forum for specified types of legal actions and proceedings.
Under our certificate of incorporation, unless we consent in writing to the selection of an alternative forum, the sole and exclusive forum will be, to the fullest extent permitted by law, a state court located within the State of Delaware (or, if no state court located within the State of Delaware has jurisdiction, the federal district court for the District of Delaware) for:
•any derivative action or proceeding brought on our behalf;
•any action asserting a claim of breach of a fiduciary duty owed by any director or officer or stockholder of Dell Technologies to us or our stockholders;
•any action asserting a claim against Dell Technologies or any director or officer or stockholder of Dell Technologies arising pursuant to any provision of the Delaware General Corporation Law or of our certificate of incorporation or bylaws; or
•any action asserting a claim against us or any director or officer or stockholder of Dell Technologies governed by our internal affairs doctrine.
The foregoing Delaware exclusive forum provision does not apply to suits brought to enforce any liability or duty created by the Exchange Act or the rules or regulations thereunder, or any other claim over which the federal district courts of the United States have exclusive jurisdiction.
In addition to the Delaware exclusive forum provision, our certification of incorporation contains a provision stating that, unless we consent in writing to the selection of an alternative forum, the federal courts of the United States shall be the exclusive forum for the resolution of any complaint asserting a cause of action arising under the Securities Act.
These provisions of our certificate of incorporation could limit the ability of the holders of the Class C Common Stock to obtain a favorable judicial forum for disputes with us or with our directors, officers, or controlling stockholders, which may discourage such lawsuits against us and our directors, officers, and stockholders.Alternatively, if a court were to find these provisions of our organizational documents inapplicable to, or unenforceable in respect of, one or more of the specified types of actions or proceedings, we may incur additional costs associated with resolving such matters in other jurisdictions, which could adversely affect our business, financial condition, and results of operations.
The choice of forum provision is intendedWe may not continue to applypay dividends or to pay dividends at the fullest extent permitted by law to the above-specified types of actions and proceedings, including, to the extent permitted by the federal securities laws, to lawsuits asserting both the above-specified claims and claims under the federal securities laws. Application of the choice of forum provision may be limitedsame rate as announced in some instances by applicable law. Section 27 of the Securities Exchange Act of 1934 (the “Exchange Act”) creates exclusive federal jurisdiction over all suits brought to enforce any duty or liability created by the Exchange Act or the rules and regulations thereunder. As a result, the choice of forum provision will not apply to actions arising under the Exchange Act or the rules and regulations thereunder. Section 22 of the Securities Act creates concurrent jurisdiction for federal and state courts over suits brought to enforce any duty or liability created by the Securities Act or the rules and regulations thereunder, subject to a limited exception for certain “covered class actions.” There is uncertainty, particularly in light of current litigation, as to whether a court would enforce the choice of forum provision with respect to claims under the Securities Act. Our stockholders will not be deemed, by operation of the choice of forum provision, to have waived claims arising under the federal securities laws and the rules and regulations thereunder.March 2023.
Our payment of dividends, as well as the rate at which we pay dividends, is solely at the discretion of our Board of Directors. Further, dividend payments, if any, are subject to our financial results and the availability of statutory surplus to pay dividends. These factors could result in a change to our current dividend policy.
ITEM 1B — UNRESOLVED STAFF COMMENTS
None.
ITEM 2 — PROPERTIES
Our principal executive offices and global headquarters are located at One Dell Way, Round Rock, Texas.
As of January 29, 2021,February 3, 2023, as shown in the following table, we owned or leased 30.721.3 million square feet of office, manufacturing, and warehouse space worldwide:
| | | | | | | | | | | | | Owned | | Leased |
| | Owned | | Leased | | | | |
| | (in millions) | | (in millions) |
| U.S. facilities | U.S. facilities | 9.9 | | | 4.8 | | U.S. facilities | 8.1 | | | 1.5 | |
| International facilities | International facilities | 4.5 | | | 11.5 | | International facilities | 4.4 | | | 7.3 | |
| Total (a) | Total (a) | 14.4 | | | 16.3 | | Total (a) | 12.5 | | | 8.8 | |
____________________
(a) Includes 2.93.5 million square feet of subleased or vacant space.
As of January 29, 2021,February 3, 2023, our facilities consisted of business centers, which include facilities that contain operations for sales, technical support, administrative, and support functions; manufacturing operations; and research and development centers. For additional information about our facilities, including the location of certain facilities, see “Item 1 — Business — Manufacturing and Materials.”
Because of the interrelation of the products and services offered in each of our segments, we generally do not designate our properties to any segment. With limited exceptions, each property is used at least in part by allboth of our segments, and we retain the flexibility to make future use of each of the properties available to each of the segments. Of our properties as of January 29, 2021, approximately 6.2 million square feet of space that house executive and administrative offices, research and development, sales and marketing functions, and data centers were used solely by our VMware segment.
We believe that our existing properties are suitable and adequate for our current needs, and weneeds. We will continue to assess our facilities requirements considering the increased numberas part of employees who are adopting flexible work arrangements under our Connected Workplace programs. This evolution may result in an overall reduction in square footage of our facilities over the next three fiscal years.normal business operations.
ITEM 3 — LEGAL PROCEEDINGS
The information required by this Item 3 is incorporated herein by reference to the information set forth under the caption “Legal Matters” in Note 1012 of the Notes to the Consolidated Financial Statements included in “Part II — Item 8 — Financial Statements and Supplementary Data.”
ITEM 4 — MINE SAFETY DISCLOSURES
Not applicable.
PART II
ITEM 5 — MARKET FOR REGISTRANT’S COMMON EQUITY, RELATED STOCKHOLDER MATTERS AND ISSUER PURCHASES OF EQUITY SECURITIES
Market for Class C Common Stock
Our Class C Common Stock is listed and traded on the New York Stock Exchange under the symbol “DELL.” The Class C Common Stock began trading on the NYSE on a regular-way basis on December 28, 2018.
In connection with the completion of the Class V transaction described under “Part I — Item 1 — Business — Class V Transaction,” our Class V Common Stock, which had been traded on the NYSE since the completion of the EMC merger transaction on September 7, 2016, ceased trading on the NYSE prior to the opening of trading on December 28, 2018.
There is no public market for our Class A Common Stock or Class B Common Stock. No shares of our Class D Common Stock were outstanding as of January 29, 2021.February 3, 2023.
Holders
As of March 23, 2021,27, 2023, there were 4,4253,982 holders of record of our Class C Common Stock, eightsix holders of record of our Class A Common Stock, and six holders of record of our Class B Common Stock. The number of record holders does not include individuals or entities that beneficially own shares of any class of our common stock, but whose shares are held of record by a broker, bank, or other nominee.
Dividends
Since the listingDuring Fiscal 2023, our Board of Directors adopted a dividend policy providing for our Class C Common Stock on the NYSE on December 28, 2018, the Company has not paid or declaredpayment of quarterly cash dividends on its common stock. The Company does not currently intend to pay cash dividends on itsour common stock at a rate of $0.33 per share per fiscal quarter beginning in the foreseeable future. Any future determination to declare cash dividends will be made atfirst quarter of Fiscal 2023. During Fiscal 2023, the discretion ofCompany paid the Company’s board of directors and will depend upon the Company’s results of operations, financial condition and business prospects, limitations on the payment of dividends under the Company’s certificate of incorporation, the terms of its indebtedness and applicable law, and such other factors as the board of directors may deem relevant.following dividends:
Sales of Unregistered Securities | | | | | | | | | | | | | | | | | | | | | | | | | | |
| Declaration Date | | Record Date | | Payment Date | | Dividend per Share | | Amount (in millions) |
| February 24, 2022 | | April 20, 2022 | | April 29, 2022 | | $ | 0.33 | | | $ | 248 | |
| June 7, 2022 | | July 20, 2022 | | July 29, 2022 | | $ | 0.33 | | | $ | 242 | |
| September 6, 2022 | | October 19, 2022 | | October 28, 2022 | | $ | 0.33 | | | $ | 238 | |
| December 6, 2022 | | January 25, 2023 | | February 3, 2023 | | $ | 0.33 | | | $ | 236 | |
DuringOn March 2, 2023, we announced that the fourthBoard of Directors approved a 12% increase in the quarterly dividend rate to a rate of $0.37 per share per fiscal quarter beginning in the first quarter of Fiscal 2021, we issued2024.
The dividend policy and the declaration and payment of each quarterly cash dividend will be subject to employees a totalthe continuing determination by the Board of 12,658 sharesDirectors that the policy and the declaration of dividends thereunder are in the Class C Common Stock for an aggregate purchase pricebest interests of approximately $194 thousand pursuantour stockholders and are in compliance with applicable law. The Board of Directors retains the power to exercises of stock options granted undermodify, suspend, or cancel the Dell Inc. Amendeddividend policy in any manner and Restated 2002 Long-Term Incentive Plan. The foregoing transactions were effected without registration in reliance on the exemption from registration under the Securities Act of 1933 afforded by Rule 701 thereunder as transactions pursuant to compensatory benefit plansat any time that it may deem necessary or contracts relating to compensation as provided under such rule.appropriate.
Purchases of Equity Securities
The following table presents information with respect to our purchases of Class C Common Stock during the fourth quarter of Fiscal 2023.
| | | | | | | | | | | | | | | | | | | | | | | |
| Period | Total Number of Shares Purchased | | Weighted Average Price Paid per Share | | Total Number of Shares Purchased as Part of Publicly Announced Programs | | Approximate Dollar Value of Shares that May Yet Be Purchased Under the Programs |
| | | | | | | |
| |
| (in millions, except per share amounts) |
| Repurchases from October 29, 2022 to November 25, 2022 | 2.0 | | | $ | 40.18 | | | 2.0 | | | $ | 1,562 | |
| Repurchases from November 26, 2022 to December 30, 2022 | 1.0 | | | $ | 41.70 | | | 1.0 | | | $ | 1,521 | |
| Repurchases from December 31, 2022 to February 3, 2023 | 0.7 | | | $ | 40.79 | | | 0.7 | | | $ | 1,493 | |
| Total | 3.7 | | | | | 3.7 | | | |
Effective as of September 23, 2021, our Board of Directors approved our current stock repurchase program with no established expiration date under which we may repurchase from time to time, through open market purchases, block trades, or accelerated or other structured share purchases, up to $5 billion of shares of Class C Common Stock, exclusive of any fees, commissions, or other expenses related to such repurchases.
Stock Performance Graph
Class C Common Stock
The following graph compares the cumulative total return on the Company’s Class C Common Stock for the period from December 28, 2018, the date on which the Class C Common Stock began trading on the NYSE, through January 29, 2021,February 3, 2023, with the total return over the same period on the S&P 500 Index and the S&P 500 Systems SoftwareInformation Technology Index. The graph assumes that $100 was invested on December 28, 2018 in the Class C Common Stock and in each of the foregoing indices and assumes reinvestment of dividends, if any. The comparisons in the graph are based on historical data.
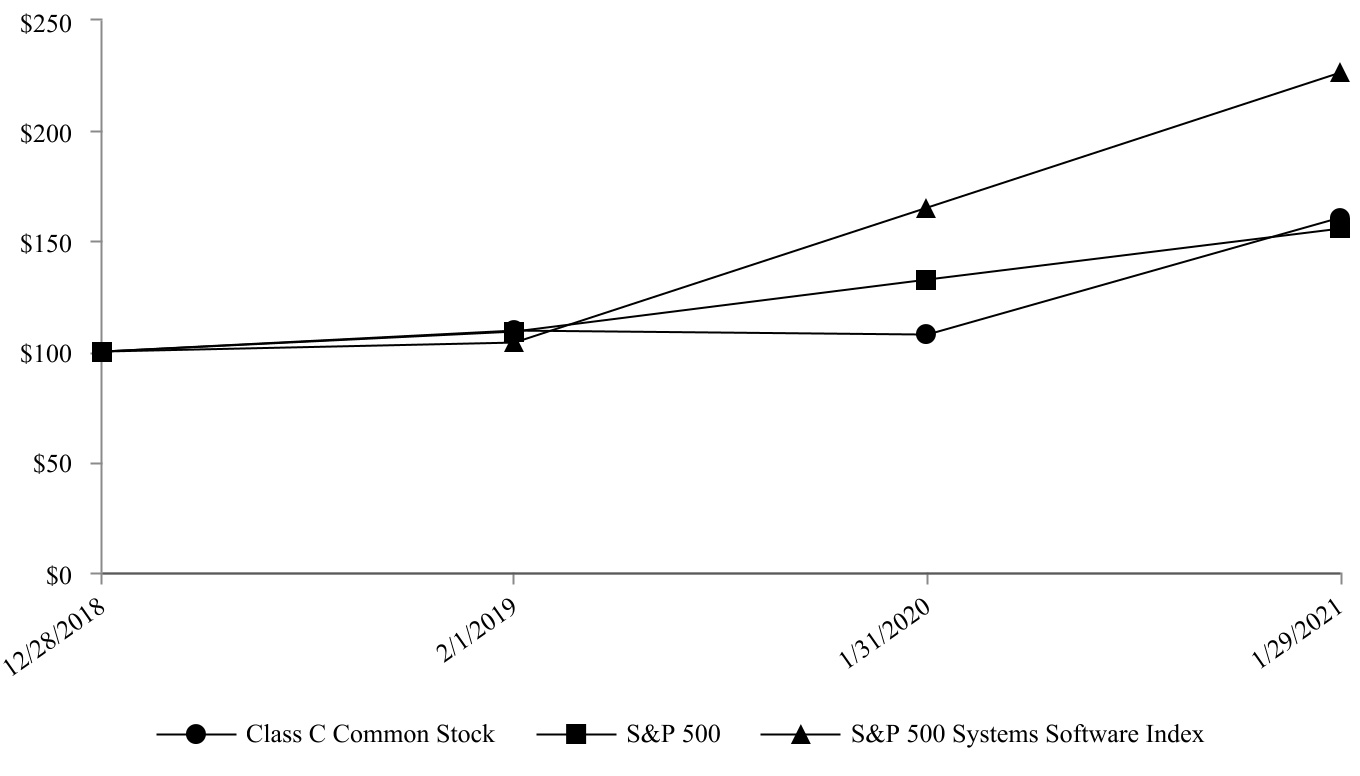
| | | | | | | | | | | | | | | | | | | | | | | | | | |
| | December 28, 2018 | | February 1, 2019 | | January 31, 2020 | | January 29, 2021 |
| Class C Common Stock | | $100.00 | | $109.29 | | $107.35 | | $160.44 |
| S&P 500 | | $100.00 | | $109.06 | | $132.57 | | $155.44 |
| S&P 500 Systems Software Index | | $100.00 | | $104.13 | | $164.89 | | $226.05 |
Class V Common Stock
The following graph compares the cumulative total return on the Company’s Class V Common Stock for the period from September 7, 2016 through December 27, 2018, the last date on which the Class V Common Stock traded on the NYSE, with the total return over the same period on the S&P 500 Index and the S&P 500 Systems Software Index. The graph assumes that $100 was invested on September 7, 2016 in the Class V Common Stock and in each of the foregoing indices and assumes reinvestment of dividends, if any. The comparisons in the graph are based on historical data.
| | | | | | | | | | | | | | | | | | | | | | | | | | |
| | September 7, 2016 | | February 3, 2017 | | February 2, 2018 | | December 27, 2018 |
| Class V Common Stock | | $100.00 | | $134.06 | | $147.71 | | $166.67 |
| S&P 500 | | $100.00 | | $105.94 | | $129.92 | | $119.92 |
| S&P 500 Systems Software Index | | $100.00 | | $108.32 | | $153.56 | | $166.55 |
| | | | | | | | | | | | | | | | | | | | | | | | | | | | | | | | | | | | | | |
| | December 28, 2018 | | February 1, 2019 | | January 31, 2020 | | January 29, 2021 | | January 28, 2022 | | February 3, 2023 |
| Class C Common Stock | | $100.00 | | $109.29 | | $107.35 | | $160.44 | | $244.72 | | $189.76 |
| S&P 500 Index | | $100.00 | | $109.06 | | $132.57 | | $155.44 | | $188.08 | | $178.39 |
| S&P 500 Information Technology Index | | $100.00 | | $108.63 | | $157.71 | | $216.26 | | $266.26 | | $240.39 |
| S&P 500 Systems Software Index | | $100.00 | | $104.13 | | $164.89 | | $226.05 | | $300.81 | | $258.99 |
The preceding stock performance graphsgraph shall not be deemed to be incorporated by reference by means of any general statement incorporating by reference this annual reportAnnual Report on Form 10-K into any filing under the Securities Act of 1933 or the Securities Exchange Act of 1934, except to the extent that Dell Technologies specifically incorporates such information by reference, and shall not otherwise be deemed filed under such Acts.
ITEM 6 — SELECTED FINANCIAL DATA
Data responsive to Item 6 have not been presented in accordance with the Company’s early compliance with amendments to Item 301 of Regulation S-K that became effective on February 10, 2021.
ITEM 7 — MANAGEMENT’S DISCUSSION AND ANALYSIS OF FINANCIAL CONDITION AND RESULTS OF OPERATIONS
This management’s discussion and analysis should be read in conjunction with the audited Consolidated Financial Statements and accompanying Notes included in this Annual Report on Form 10-K. This section of this Form 10-K generally discusses Fiscal 20212023 and Fiscal 20202022 items and presents year-to-year comparisons between Fiscal 2023 and Fiscal 2022 results. Discussion of Fiscal 2021 items and year-to-year comparisons between Fiscal 20212022 and Fiscal 2020. Discussions of Fiscal 2019 items and year-to-year comparisons between Fiscal 2020 and Fiscal 20192021 results that are not included in this Form 10-K can be foundare presented in “Part II — Item 7 — Management’s Discussion and Analysis of Financial Condition and Results of Operations” of the Company’s Annual Report on Form 10-K for the fiscal year ended January 31, 2020,28, 2022, as filed with the SEC on March 27, 2020,24, 2022, which is available free of charge on the SEC’s website at www.sec.gov and on our Investor Relations website at investors.delltechnologies.com.
In addition to historical financial information, the following discussion contains forward-looking statements that reflect our plans, estimates, and beliefs, and that are subject to numerous risks and uncertainties. Our actual results may differ materially from those expressed or implied in any forward-looking statements.
Unless otherwise indicated, all results presented are prepared in a manner that complies, in all material respects, with generally accepted accounting principles generally accepted in the United States of America (“GAAP”). Additionally, unlessUnless otherwise indicated, all changes identified for the current-period results represent comparisons to results for the prior corresponding fiscal period.
Unless the context indicates otherwise, references in this report to “we,” “us,” “our,” the “Company,” and “Dell Technologies” mean Dell Technologies Inc. and its consolidated subsidiaries, references to “Dell” mean Dell Inc. and Dell Inc.’s consolidated subsidiaries, and references to “EMC” mean EMC Corporation and EMC Corporation’s consolidated subsidiaries.
On November 1, 2021, the Company completed its spin-off of VMware, Inc. (individually and together with its consolidated subsidiaries, “VMware”). In accordance with applicable accounting guidance, the results of VMware, excluding Dell's resale of VMware offerings, are presented as discontinued operations in the Consolidated Statements of Income and, as such, have been excluded from both continuing operations and segment results for all periods prior to the spin-off. The Consolidated Statements of Cash Flows are presented on a consolidated basis for both continuing operations and discontinued operations for all periods presented.
Our fiscal year is the 52- or 53-week period ending on the Friday nearest January 31. We refer to our fiscal years ended February 3, 2023, January 28, 2022, and January 29, 2021 January 31, 2020,as “Fiscal 2023,” “Fiscal 2022,” and February 1, 2019 as “Fiscal 2021,” “Fiscal 2020,”respectively. Fiscal 2023 included 53 weeks, while Fiscal 2022 and “Fiscal 2019,” respectively. All fiscal years presentedFiscal 2021 each included 52 weeks.
INTRODUCTION
Company Overview
Dell Technologies helps organizations and individuals build their digital futurefutures and individuals transform how they work, live, and play. We provide customers with one of the industry’s broadest and most innovative technology and servicessolutions portfolio for the data era, spanning bothincluding traditional infrastructure and emergingextending to multi-cloud technologies. We continue to seamlessly deliverenvironments. Our differentiated and holistic IT solutions benefit our results and enable us to our customers, which has driven significantcapture revenue growth and share gains.as customer spending priorities evolve.
Dell Technologies’ integrated solutions help customers modernize their IT infrastructure, manage and operate in a multi-cloudmulticloud world, address workforce transformation, and provide critical solutions that keep people and organizations connected, which has proven even more important in this current time of disruption caused by the coronavirus pandemic.connected. We are helping customers accelerate their digital transformations to improve and strengthen business and workforce productivity. With our extensive portfolio and our commitment to innovation, we offer secure, integrated solutions that extend from the edge to the core to the cloud, and we are at the forefront of the software-defined and cloud native infrastructure era. As further evidence of our commitment to innovation, in Fiscal 2021 we announced our plan to evolve and expand our IT as-a-Service and cloud offerings through Apex. Apex will provide our customers with greater flexibility to scale IT to meet their evolving business needs and budgets.solutions.
Dell Technologies’ end-to-end portfolio isTechnologies operates globally in approximately 180 countries, supported by a world-class organization with unmatched size and scale. We operate globally in 180 countries across key functional areas, including technology and product development, marketing, sales, financial services, and global services. We have a number of durable competitive advantages that provide a critical foundation for our success. Our go-to-market engine includes a 39,000-person31,000-person direct sales force and a global network of over 200,000approximately 240,000 channel partners. Dell Financial Services and its affiliates (“DFS”) offer customer payment flexibility and enables synergies across the business. DFS funded $9 billion of originations in Fiscal 2021 and maintains a $10 billion global portfolio of high-quality financing receivables. We employ 34,000approximately 35,000 full-time service and support professionals and maintain more than 2,400approximately 2,200 vendor-managed service centers. We manage a world-class supply chain that drives long-term growth and operating efficiencies, with approximately $70 billion in annual procurement expenditures and over 750 parts distribution centers. Together, these elements provide a critical foundation for our success.
manage a world-class supply chain at significant scale with approximately $77 billion in annual procurement expenditures and over 725 parts distribution centers.
We further strengthen customer relationships through our financing offerings provided by Dell Financial Services and its affiliates (“DFS”) and our flexible consumption models, including utility, subscription, and as-a-Service models, which we continue to expand under Dell APEX. These offerings enable our customers to pay over time and provide them with financial flexibility to meet their changing technological requirements.
Our Vision and Strategy
Our vision is to become the most essential technology company for the data era. We help customers address their evolving IT needs and their broader digital transformation objectives as they embrace today’s multicloud world. We intend to execute our vision by focusing on two strategic priorities:
•Grow and modernize our core offerings in the markets in which we predominantly compete
•Pursue attractive new growth opportunities such as Edge, Telecom, data management, and as-a-Service consumption models
We believe we are uniquely positioned in the data and multicloud era and that our results will continue to benefit from our durable competitive advantages. We intend to continue to execute our business model and position our company for long-term success while balancing liquidity, profitability, and growth and keeping our purpose at the forefront of our decision-making: to create technologies that drive human progress.
The IT industry is rapidly evolving with demand for simpler, more agile solutions as companies leverage multiple clouds across their increasingly complex IT environments. To meet our customer needs, we continue to invest in research and development, sales, and other key areas of our business to deliver superior products and solutions capabilities and to drive long-term sustainable growth.
Products and Services
We design, develop, manufacture, market, sell, and support a wide range of comprehensive and integrated solutions, products, and services. We are organized into the followingtwo business units, referred to as Infrastructure Solutions Group and Client Solutions Group, which are our reportable segments: Infrastructure Solutions Group; Client Solutions Group; and VMware.segments.
•Infrastructure Solutions Group (“ISG”) — ISG enables theour customers’ digital transformation of ourwith solutions that address the fundamental shift to multicloud environments, machine learning, artificial intelligence, and data analytics. ISG helps customers through our trusted multi-cloudsimplify, streamline, and big data solutions, which are built upon a modern data center infrastructure. ISG works with customers in the area of hybrid cloud deployment with the goal of simplifying, streamlining, and automatingautomate cloud operations. ISG solutions are built for multi-cloudmulticloud environments and are optimized to run cloud native workloads in both public and private clouds, as well as traditional on-premise workloads.
Our comprehensive portfolio of advanced storage solutionsportfolio includes traditional storage solutions as well as next-generation storage solutions, (such asincluding all-flash arrays, scale-out file, object platforms, hyper-converged infrastructure, and software-defined solutions).storage. We have simplified our storage portfolio to ensure that we deliver the technology needed for our customers’ digital transformation. Weand continue to make enhancements to our storage solutions offerings andthat we expect that these offerings, including our new PowerStore storage array released in May 2020, will drive long-term improvements in the business.
Our server portfolio includes high-performance rack, blade, and tower and hyperscaleservers. Our servers optimized forare designed with the capability to run high value workloads across customers’ IT environments, including artificial intelligence, and machine learning, and edge workloads. Our networking portfolio helps our business customers transform and modernize their infrastructure, mobilize and enrich end-user experiences, and accelerate business applications and processes.
Our strengths in server, storage, and virtualization software solutions enableallow us to offer leading converged and hyper-converged solutions, allowingenabling our customers to accelerate their IT transformation by acquiringwith scalable integrated IT solutions instead of building and assembling their own IT platforms. ISG also offers attached software, peripherals and services, including configuration, and support and deployment, configuration, and extended warranty services.deployment.
Approximately half of ISG revenue is generated by sales to customers in the Americas, with the remaining portion derived from sales to customers in the Europe, Middle East, and Africa region (“EMEA”) and the Asia-Pacific and Japan region (“APJ”).
•Client Solutions Group (“CSG”) — CSG includes branded hardware (such asPCs including notebooks, desktops, workstations, and notebooks)workstations and branded peripherals (such asincluding displays and projectors),docking stations, as well as third-party software and peripherals. CSG also includes services offerings, including support and deployment, configuration, and extended warranties. Our computing devicesCSG offerings are designed with our commercial and consumer customers’ needs in mind and we seek to optimize performance, reliability, manageability, design, and security. In addition to our traditional hardware business, we have a
Our commercial portfolio of thin client offerings that we believe will allow us to benefit from the growth trends in cloud computing. Forprovides our customers that are seekingwith solutions centered around flexibility to simplify client lifecycle management, Dell PCaddress their complex needs such as a Service offering combines hardware, software, lifecycle services,IT modernization, hybrid work transformation, and financing into one all-encompassing solution that provides predictable pricing per seat per month. CSG also offers attached software, peripherals,other critical needs. Within our high-end consumer offerings, we provide our customers with powerful performance, processing, and services, including support and deployment, configuration, and extended warranty services.end-user experiences.
Approximately half of CSG revenue is generated by sales to customers in the Americas, with the remaining portion derived from sales to customers in EMEA and APJ.
•VMware— The VMware reportable segment (“VMware”) reflects the operationsOur “other businesses,” described below, primarily consists of our resale of standalone offerings of VMware, Inc. (NYSE: VMW) within(individually and together with its subsidiaries, “VMware”), referred to as “VMware Resale,” and offerings of SecureWorks Corp. (“Secureworks”). These businesses are not classified as reportable segments, either individually or collectively.
•VMware Resale consists of our sale of standalone VMware offerings. Under our Commercial Framework Agreement with VMware discussed in this report, Dell Technologies. Technologies continues to act as a key channel partner for VMware, reselling VMware’s offerings to our customers. This partnership is intended to facilitate mutually beneficial growth for both Dell Technologies and VMware.
VMware works with customers in the areas of hybrid and multi-cloud,multicloud, modern applications, networking, security, and digital workspaces, helping customers manage their IT resources across private clouds and complex multi-cloud,multicloud, multi-device environments. VMware’s portfolio supports and addresses the key IT priorities of customers: accelerating their cloud journey, migrating and modernizing their applications, empowering digital workspaces, transforming networking, and embracing intrinsic security. VMware enables its customers to digitally transform their operations as they ready their applications, infrastructure, and employees for constantly evolving business needs.
During the third quarter of Fiscal 2020, VMware, Inc. completed its acquisition of Carbon Black, Inc. (“Carbon Black”), a developer of cloud-native endpoint protection.
On December 30, 2019, VMware, Inc. completed its acquisition of Pivotal, Inc. (“Pivotal”). Before the transaction, Pivotal was a majority-owned subsidiary of Dell Technologies through EMC and VMware, Inc. Pivotal provides a leading cloud-native platform that makes software development and IT operations a strategic advantage for customers. Pivotal’s cloud-native platform, Pivotal Cloud Foundry, accelerates and streamlines software development by reducing the complexity of building, deploying and operating new cloud-native applications, and modernizing legacy applications. With the acquisition, which aligns key software assets, VMware, Inc. builds on a comprehensive development platform with Kubernetes.
Dell Technologies now reports Pivotal results within the VMware reportable segment, and the historical segment results were recast to reflect this change. Pivotal results were previously reported within Other businesses. See Note 19 of the Notes to the Consolidated Financial Statements included in this report for the recast of segment results.
Approximately half of VMware revenue is generated by sales to customers in the United States.
Our other businesses, described below, consist of product and service offerings of Secureworks, Virtustream, and Boomi, each of which is majority-owned by Dell Technologies. These businesses are not classified as reportable segments, either individually or collectively, as the results of the businesses are not material to our overall results and the businesses do not meet the criteria for reportable segments.
•Secureworks (NASDAQ: SCWX) is a leading global cybersecurity provider of intelligence-driven informationtechnology-driven security solutions singularly focused on protecting its clients from cyber attacks.customers by outpacing and outmaneuvering the adversary. The solutions offered by Secureworks enable organizations of varying size and complexity to fortify their cyber defenses to prevent security breaches, detect malicious activity, in near real time, prioritize and respond rapidly towhen a security incidentsbreach occurs, and predictidentify emerging threats.
•Virtustream offers cloud software and infrastructure-as-a-service solutions that enable customers to migrate, run, and manage mission-critical applications in cloud-based IT environments. Beginning in the first quarter of Fiscal 2019, Virtustream results are reported within other businesses, rather than within ISG. This change in reporting structure did not impact our previously reported consolidated financial results, but our prior period segment results have been recast to reflect the change.
•Boomi specializes in cloud-based integration, connecting information between existing on-premise and cloud-based applications to ensure business processes are optimized, data is accurate and workflow is reliable.
On February 18, 2020, we announced our entry into a definitive agreement with a consortium of investors to sell RSA Security, which provides cybersecurity solutions. On September 1, 2020, the parties closed the transaction. At the completion of the sale, we received total cash consideration of approximately $2.082 billion, resulting in a pre-tax gain on sale of $338 million. The Company ultimately recorded a $21 million loss net of taxes. The transaction was intended to further simplify our product portfolio and corporate structure. Prior to the divestiture, RSA Security’s operating results were included within Other businesses. See Note 1 of the Notes to the Consolidated Financial Statements included in this report for more information about this transaction.
We believe the collaboration, innovation, and coordination of the operations and strategies across all segments of our business, as well as our differentiated go-to-market model, will continue to drive revenue synergies. Through our coordinated research and development activities, we are able to jointly engineer leading innovative solutions that incorporate the distinct set of hardware, software, and services across all segments of our business.
Our products and services offerings are continually evolving in response to industry dynamics.customer needs. As a result, reclassifications of certain products and services solutions in major product categories may be required. For further discussion regarding our current reportable segments, see “Results of Operations — Business Unit Results” and Note 19 of the Notes to the Consolidated Financial Statements included in this report.
Dell Financial Services
DFS supports our businesses by offering and arranging various financing options and services for our customers primarily in North America, Europe, Australia, and New Zealand.globally. DFS originates, collects, and services customer receivables primarily related to the purchase or use of our product, software, and services solutions. We also arrange financing for some of our customers in various countries where DFS does not currently operate as a captive. DFScaptive entity. We further strengthens ourstrengthen customer
relationships through its flexible consumption models, including utility, subscription, and as-a-Service models, which enable us to offer our customers the option to pay over time and, in certain cases, based on utilization,to provide them with financial flexibility to meet their changing technological requirements. DFS funded $9.7 billion of originations in Fiscal 2023 and maintains an $11 billion global portfolio of high-quality financing receivables. The results of these operations are allocated to our segments based on the underlying product or service financed.financed and may be impacted by, among other items, changes in the interest rate environment and the translation of those changes to pricing. For additional information about our financing arrangements, see Note 46 of the Notes to the Consolidated Financial Statements included in this report.
Product Backlog
Product backlog represents the value of unfulfilled manufacturing orders and is included as a component of remaining performance obligations to the extent we determine that the manufacturing orders are non-cancelable. Our business model generally gives us the ability to optimize product backlog at any point in time, such as by expediting shipping or prioritizing customer orders for products that have shorter lead times.
Recent Transactions
Spin-Off of VMware, Inc. — On November 1, 2021, we completed our spin-off of VMware by means of a special stock dividend (the “VMware Spin-off”). The VMware Spin-off was effectuated pursuant to a Separation and Distribution Agreement, dated as of April 14, 2021, between Dell Technologies and VMware. As part of the transaction, VMware paid a special cash dividend, pro rata, to each holder of VMware common stock in an aggregate amount equal to $11.5 billion, of which Dell Technologies received $9.3 billion.
In connection with and upon completion of the VMware Spin-off, we entered into a Commercial Framework Agreement (the “CFA”) with VMware, which provides the framework under which we and VMware continue our commercial relationship. Pursuant to the CFA, we continue to act as a distributor of VMware’s standalone products and services and purchase such products and services for resale to customers. We also continue to integrate VMware’s products and services with Dell Technologies’ offerings and sell them to customers. The results of such operations are presented as continuing operations within our Consolidated Statements of Income for all periods presented.
The results of VMware, excluding Dell's resale of VMware offerings, are presented as discontinued operations in the Consolidated Statements of Income and, as such, have been excluded from both continuing operations and segment results for Fiscal 2021 and Fiscal 2022. The Consolidated Statements of Cash Flows are presented on a consolidated basis for both continuing operations and discontinued operations. See Note 3 of the Notes to the Consolidated Financial Statements included in this report for additional information about the VMware Spin-off.
Boomi Divestiture —On October 1, 2021, we completed the sale of Boomi, Inc. (“Boomi”) and certain related assets for a total cash consideration of approximately $4.0 billion, resulting in a pre-tax gain on sale of $4.0 billion. The Company ultimately recorded a $3.0 billion gain, net of $1.0 billion in tax expense.
RSA Divestiture — On September 1, 2020, we completed the sale of RSA Security LLC (“RSA Security”) for total cash consideration of approximately $2.1 billion, resulting in a pre-tax gain on sale of $338 million. The Company ultimately recorded a $21 million loss net of taxes.
Prior to the divestitures, the operating results of Boomi and RSA Security were included within other businesses and did not qualify for presentation as discontinued operations.
Relationship with VMware
VMware is considered to be a related party of the Company as a result of Michael Dell’s ownership interests in both Dell Technologies and VMware and Mr. Dell’s continued service as Chairman and Chief Executive Officer of Dell Technologies and as Chairman of the Board of VMware, Inc. Following the completion of the VMware Spin-off, the majority of transactions that occur between Dell Technologies and VMware consist of Dell Technologies’ purchase of VMware products and services for resale, either on a standalone basis or as a part of integrated offerings. For more information regarding related party transactions with VMware, see Note 21 of the Notes to the Consolidated Financial Statements included in this report.
Strategic Investments and Acquisitions
As part of our strategy, we will continue to evaluate opportunities for strategic investments through our venture capital investment arm, Dell Technologies Capital, with a focus on emerging technology areas that are relevant to all segments of our business and that will complement our existing portfolio of solutions. Our investment areas include storage, software-defined networking, management and orchestration, security, machine learning and artificial intelligence, Big Data and analytics, cloud, Internet of Things (“IoT”),edge computing, and software development operations. The technologies or products these companies have under development are typically in the early stages and may never have commercial value, which could result in a loss of a substantial part of our investment in the companies.
During Fiscal 2023, we recognized a net loss of $206 million on our strategic investments, which was generally in line with overall public equity market declines. As of February 3, 2023 and January 28, 2022, we held strategic investments in non-marketable securities of $1.3 billion and $1.4 billion, respectively. See Note 5 of the Notes to the Consolidated Financial Statements included in this report for additional information.
In addition to these investments, we also may make disciplined acquisitions targeting businesses that advance our strategic objectives. As of January 29, 2021objectives and January 31, 2020, Dell Technologies held strategic investments of $1.4 billion and $0.9 billion, respectively.accelerate our innovation agenda.
Business Trends and Challenges
COVID-19 Pandemic and ResponseFiscal 2023 Significant Developments — In March 2020, the World Health Organization (“WHO”) declared the outbreak of the COVID-19During Fiscal 2023, we continued to execute against our strategy and performed well in a pandemic. This declaration was followed by significant governmental measures implementedchallenging macroeconomic environment, generating net revenue and operating income growth. We benefited from our holistic offerings across IT infrastructure as customer spending priorities changed and we saw a shift in the United Statesmix of our net revenue towards ISG.
As the fiscal year progressed, we experienced rapidly evolving macroeconomic conditions which impacted the overall demand environment, the availability and globally,cost of components and logistics, and the foreign currency environment. In response to these conditions, we took certain measures intended to mitigate impacts to our operations, profitability, and liquidity while continuing to proactively address our customers’ demands. Such measures included disciplined pricing as well as, beginning in the second fiscal quarter, actions to decrease operating expenses, including travel banslimiting both discretionary spending and, restrictions, shelter-in-place orders, limitationsas announced on February 6, 2023, a decision to reduce our workforce by approximately 5% to align our investments more closely with our previously discussed strategic and closures of non-essential businesses, and social distancing requirements in efforts to slow down and control the spread of the virus.customer priorities.
The healthchange in the macroeconomic environment had the greatest effect on CSG, which was impacted by industry-wide demand declines beginning in the first half of Fiscal 2023 that worsened throughout the remainder of the year. Such dynamics impacted CSG net revenue growth when compared to Fiscal 2022, during which we experienced continued strong demand as a result of global economic recovery. Within ISG, demand for our employees,server offerings began to moderate in the second quarter of Fiscal 2023, with a decline beginning in the third fiscal quarter as customers business partners, and communities remains our primary focus. During Fiscal 2021, we took numerous actionsexercised caution in response to COVID-19, includingthe macroeconomic conditions.
The impact of the macroeconomic environment caused a swift implementationshift in component availability as the year progressed. For the first half of Fiscal 2023, we continued to be affected by industry-wide constraints in the supply of limited-source components, primarily within ISG. These constraints began to diminish during the third quarter of Fiscal 2023, primarily as a result of the aforementioned declines in the overall demand environment as well as improving supply positions. As a result, during Fiscal 2023, we lowered our business continuity plans. Our crisis management team is actively engagedbacklog across both CSG and ISG from previously elevated levels.
In addition to respondimpacts to changesboth supply and demand, our input costs, which include logistics and component costs, were also impacted throughout the fiscal year. Component costs were deflationary for Fiscal 2023. Although logistics costs remained elevated during the first half of Fiscal 2023, we experienced a significant reduction in our environment quickly and effectively, andthese costs during the second half of Fiscal 2023 as we began to ensuresee declining rate costs coupled with a reduction in the need to utilize expedited shipments. We expect that our ongoing response activities are aligned with recommendationslogistics costs will continue to decline as we enter Fiscal 2024.
We expect that the macroeconomic environment will continue to impact our consolidated financial results in Fiscal 2024. We currently anticipate a decline in net revenue for the full fiscal year, notably in the first half of the WHO and the U.S. Centers for Disease Control and Prevention, and with governmental regulations. We are adjusting restrictions previously implemented as new information becomes available, governmental regulations are updated, and vaccines become more widely distributed. Most of our employees were previously equipped with remote work capabilities over the past several years,year, which enabled us to quickly establish a work-from-home posture for the majority of our employees. Further, we implemented pandemic-specific protocols for our essential employees whose jobs require them to be on-site or with customers. We are deploying return-to-site processes in certain regions basedmay put pressure on ongoing assessments of local conditions by our management team.operating margins. We will continue to actively monitor regional conditionsglobal events and utilize remote work practicesmake prudent decisions to ensure the health and safety ofnavigate this environment. We believe our employees, customers, and business partners.durable competitive advantages continue to position us for long-term success.
During Fiscal 2021, we worked closely with our customers and business partners to support them as they expanded their own remote work solutions and contingency plans and to help them access our products and services remotely. Our agility, our breadth, and our scale will continue to benefit us in serving our customers and business partners during this period of accelerated digital transformation and uncertainty relating to the effects of COVID-19. Notable actions we have taken to date include the following:
•Our global sales teams embraced a new selling process and are successfully supporting our customers and partners remotely.
•We are helping to address our customers’ cash flow requirements by expanding our as-a-service and financing offerings.
•Our close relationships and ability to connect directly with our customers through our e-commerce business have enabled us to quickly meet the immediate demands of the new work- and learn-from-home environments.
•The strength, scale, and resiliency of our global supply chain have afforded us flexibility to manage through this challenging period. We adapted to events unfolding real-time by applying predictive analytics to model a variety of outcomes to respond quickly to the changing environment. We optimized our global supply chain footprint to maximize factory uptime, for both Dell Technologies and our suppliers, by working through various local governmental regulations and mandates. During this period, we established robust safety measures to protect the health and safety of our essential team members.
•Supply ChainWe continue to drive innovation— Dell Technologies maintains single-source and excellencelimited-source supplier relationships for certain components because the relationships are advantageous in engineering with a largely remote workforce. Engineersthe areas of performance, quality, support, delivery, capacity, and product teams delivered several critical solutions during Fiscal 2021, including cloud updates and key client product refreshes, as well as the May 2020 launch of the PowerStore midrange storage solution.price considerations.
During Fiscal 2021, we took precautionary measures to increase our cash position and preserve financial flexibility. We also took a series of prudent steps to manage expenses and preserve liquidity that included, among others, global hiring limitations, reductions in consulting and contractor costs and facilities-related costs, global travel restrictions, and temporary suspension of the Dell 401(k) match program for U.S. employees.
In the fourth quarter of Fiscal 2021, we began toreinstate selected employee-related compensation benefits, which we expect will put pressure on operating income in Fiscal 2022. Effective January 1, 2021, we resumed the Dell 401(k) match program for U.S. employees. We will continue to invest in long-term projects, while focusing on operating expense controls in certain areas of the business. All of these actions are aligned with our strategy, which remains unchanged, of focusing on gaining market share, integrating and innovating across the Dell Technologies portfolio, and strengthening our capital structure.
We saw unique demand dynamics during Fiscal 2021. In CSG, strong demand was driven by the imperative for remote work and remote learning solutions, as business, government, and education customers sought to maintain productivity in the midst of COVID-19. In ISG, the demand environment weakened as enterprise customers shifted their investments towards remote work and business continuity solutions. For additional information about impacts of COVID-19 on our operations, see “Results of Operations—Consolidated Results” and “—Business Unit Results.”
Although we continue to experience some uncertainty in the global markets as a result of the ongoing COVID-19 pandemic, we see opportunities to create value and grow in Fiscal 2022 in the midst of resilient demand for our IT solutions driven by a technology-enabled world. We will continue to actively monitor global events and pursue prudent decisions to navigate in this uncertain and ever-changing environment.
Dell Technologies Vision and Innovation — Our vision is to be the essential technology company for the data era and a leader in end-user computing, software-defined data center solutions, data management, virtualization, IoT, and cloud software. We believe that our results will benefit from an integrated go-to-market strategy, including enhanced coordination across all segments of our business, and from our differentiated products and solutions capabilities. We intend to continue to execute on our business model and seek to balance liquidity, profitability, and growth to position our company for long-term success.
We are seeing an accelerated rate of change in the IT industry. We seek to address our customers’ evolving needs and their broader digital transformation objectives as they embrace the hybrid multi-cloud environment of today. Currently for many customers, a top digital priority is to build stable and resilient remote operational capabilities. We are seeing demand for simpler, more agile IT across multiple clouds. The pandemic has accelerated the introduction and adoption of new technologies to ensure productivity and collaboration from anywhere. In light of this rapid pace of innovation, we continue to invest in research and development, sales, and other key areas of our business to deliver superior products and solutions capabilities and to drive long-term sustainable growth.
ISG — We expect that ISG will continue to be impacted by the changing nature of the IT infrastructure market and competitive environment. The overall server demand environment was down for Fiscal 2021 and continues to exhibit variability across international regions. However, we expect ISG will benefit from forecasted improvements to the macroeconomic environment as we move through Fiscal 2022. We will continue to be selective in determining whether to pursue certain large hyperscale and other server transactions as we drive for balanced growth and profitability. With our scale and strong solutions portfolio, we believe we are well-positioned to respond to ongoing competitive dynamics. We continue to focus on customer base expansion and lifetime value of customer relationships.
Cloud-native applications are expected to continue as a primary growth driver in the infrastructure market. We believe the complementary cloud solutions across our business position us to meet these demands for our customers. The unprecedented data growth throughout all industries is generating continued demand for our storage solutions and services. We benefit by offering solutions that address the emerging trends of enterprises deploying software-defined storage, hyper-converged infrastructure, and modular solutions based on server-centric architectures. These trends are changing the way customers are consuming our traditional storage offerings. We continue to expand our offerings in external storage arrays, which incorporate flexible, cloud-based functionality. Through our research and development efforts, we are developing new solutions in this rapidly changing industry that we believe will enable us to continue to provide superior solutions to our customers.
CSG — Our CSG offerings are an important element of our strategy, generating strong cash flow and opportunities for cross-selling of complementary solutions. During Fiscal 2021, CSG demand was strong in certain product lines, particularly for notebooks and gaming systems, while demand for commercial desktops decreased. These demand dynamics were driven by the imperative for remote work and remote learning solutions, as business, government, and education customers sought to maintain productivity in the midst of COVID-19. We continue to deploy Dell PC as-a-Service offerings for customers who are seeking simplified solutions and lifecycle management with predictable pricing through DFS. We expect that the CSG demand environment will continue to be cyclical.
We anticipate continued strong CSG demand in Fiscal 2022, particularly in the first half of the fiscal year, in line with industry demand forecasts, although the cost environment will continue to fluctuate depending on supplier capacity and demand for certain components. We remain committed to our long-term strategy for CSG and will continue to innovate across the portfolio, while benefiting from consolidation trends that are occurring in the markets in which we compete. Competitive dynamics will continue to be a factor in our CSG business as we seek to balance profitability and growth.
Recurring Revenue and Consumption Models— Our customers are interested in new and innovative models that address how they consume our solutions. We offer options that include as-a-service, utility, leases, and immediate pay models, all designed to match customers’ consumption and financing preferences. Our multiyear agreements typically result in recurring revenue streams over the term of the arrangement. During Fiscal 2021, we announced our intention to continue to evolve and expand our IT as-a-Service and cloud offerings through Apex. We expect that our flexible consumption models and as-a-service offerings will further strengthen our customer relationships and provide a foundation for growth in recurring revenue.
Supply Chain — During Fiscal 2020, we recognized benefits to our CSG and ISG operating results from significant component cost declines. During Fiscal 2021, component costs continued to decline in the aggregate, but at a lower rate than in Fiscal 2020. We expect the deflationary trends in the overall component cost environment to taper off and then shift to inflationary during the first half of Fiscal 2022. Component cost trends are dependent on the strength or weakness of actual end userend-user demand and supply dynamics, which will continue to evolve and ultimately impact the translation of the cost environment to pricing and operating results.
Dell Technologies maintains limited-source supplier relationships for certain components, because the relationships are advantageous in the areasWe anticipate that overall costs of performance, quality, support, delivery, capacity, and price considerations. In recent periods, we have been impacted by component supply constraints in certain product offerings, some of which resulted from COVID-19 driven demand patterns. Delays in the supply of limited-source components, including as a result of COVID-19, are affecting the timing of shipments of certain products in desired quantities or configurations. Additionally, we have experienced increased freight costs for expedited shipments of components and rate increases in the freight network as air capacity remains constrained. We expect elevated freight costs to continue to put pressure on operating resultsour key commodities will remain deflationary through the first half of Fiscal 2022.2024. We expect this favorability to be partially offset by the impacts of industry-wide price increases of certain processors that will affect our cost of net revenue beginning in Fiscal 2024.
Macroeconomic Risks and UncertaintiesForeign Currency Exposure — The impacts of trade protection measures, including increases in tariffs and trade barriers, and changes in government policies and international trade arrangements may affect our ability to conduct business in some non-U.S. markets. We monitor and seek to mitigate these risks with adjustments to our manufacturing, supply chain, and distribution networks.
We manage our business on a U.S. dollar basis. However, we have a large global presence, generating approximately half of our net revenue from sales to customers outside of the United States during Fiscal 2021,2023, Fiscal 2020,2022, and Fiscal 2019.2021. As a result, our revenueoperating results can be, and particularly in recent periods have been, impacted by fluctuations in foreign currency exchange rates. We utilize a comprehensive hedging strategy intended to mitigate the impact of foreign currency volatility over time, and we adjust pricing when possible to further minimize foreign currency impacts.
Ukraine War — We are monitoring and responding to effects of the ongoing war in Ukraine. When Russia invaded Ukraine, we made the decision to not sell, service, or support products in Russia, Belarus, and restricted regions of Ukraine. Operations in Russia and Ukraine accounted for less than 1% of net revenue in Fiscal 2022. During Fiscal 2023, we recognized $171 million in costs associated with exiting our business in Russia, primarily related to asset impairments and other exit related costs. We have resumed product sales to non-sanctioned areas in Ukraine. We are focused on providing products and support to Ukrainian customers as they rebuild infrastructure and restore businesses and the financial sector.
The war and the related economic sanctions are impacting markets worldwide. Our business may be adversely affected by effects of the war and such sanctions, including supply chain disruptions, product shipping delays, macroeconomic impacts resulting from the exclusion of Russian financial institutions from the global banking system, volatility in foreign exchange rates and interest rates, inflationary pressures, and heightened cybersecurity and data theft threats. The full impact of the war on our business operations and financial performance will depend on future developments. We will continue to monitor and assess the related restrictions and other effects and pursue prudent decisions for our team members, customers, and business.
COVID-19 Pandemic and Response— We continue to monitor the COVID-19 pandemic and variants of the coronavirus, as well as the impact the pandemic has on our employees, customers, business partners, and communities. We will continue to actively monitor global events and pursue prudent decisions to navigate in this uncertain and ever-changing environment.
Inflation Reduction Act— During the third quarter of Fiscal 2023, the Inflation Reduction Act of 2022 (the “2022 Act”) was enacted into law. The statute includes a 15% corporate alternative minimum tax on adjusted financial statement income which is effective for Fiscal 2024. The new law also imposes a 1% excise tax on share repurchases, which is effective for repurchases made after December 31, 2022. We do not expect the 2022 Act to have a material impact on our consolidated financial statements or on our capital allocation decisions. We will continue to evaluate the law’s impact as further information becomes available.
Other Macroeconomic Risks and Uncertainties — The impacts of trade protection measures, including increases in tariffs and trade barriers, changes in government policies and international trade arrangements, and geopolitical issues may affect our ability to conduct business in some non-U.S. markets. We monitor and seek to mitigate these risks with adjustments to our manufacturing, supply chain, and distribution networks.
ISG— We expect that ISG will continue to be impacted by the changing nature of the IT infrastructure market and competitive environment. With our scale and strong solutions portfolio, we believe we are well-positioned to respond to ongoing competitive dynamics.
Through our collaborative, customer-focused approach to innovation, we strive to deliver new and relevant solutions and software to our customers quickly and efficiently. We continue to focus on customer base expansion and lifetime value of customer relationships. Our customer base includes a growing number of service providers, such as cloud service providers, Software-as-a-Service companies, consumer webtech providers, and telecommunications companies. These service providers turn to Dell Technologies for our advanced solutions that enable efficient infrastructure and service delivery at cloud scale.
While we are anticipating challenges in the demand environment as a result of customer caution in response to macroeconomic conditions, we expect that data growth will continue to generate long-term demand for our storage solutions and services. Cloud native applications are expected to continue to be a key trend in the infrastructure market. We benefit from offering solutions that address the emerging trends of enterprises deploying software-defined storage, hyper-converged infrastructure, and modular solutions based on server-centric architectures. These trends are changing the way customers are consuming our storage offerings. We continue to expand our offerings in external storage arrays, which incorporate flexible, cloud-based functionality. Our storage business is subject to seasonal trends which we expect to continue.
We anticipate that ISG will benefit from the continued expansion of, and advances in, Artificial Intelligence (“AI”). Through our server and storage offerings, as well as our AI validated design solutions, we are well positioned to capture growth and support our customers needs. We continue to optimize and enhance our offerings to run high value and transformational workloads, such as AI.
CSG — Our CSG offerings are an important element of our strategy, generating strong cash flow and opportunities for cross-selling of complementary solutions. Within CSG, we are focused on commercial and high-end consumer computing devices as we believe they are the most stable and profitable segments of the PC market. Competitive dynamics continue to be a factor in our CSG business and continue to impact pricing and operating results.
We expect industry-wide demand will remain a challenge as we begin Fiscal 2024. We remain committed to our long-term CSG strategy and will continue to make investments to innovate across the portfolio. We expect that the CSG demand environment will continue to be subject to seasonal trends.
Recurring Revenue and Consumption Models— Our customers are seeking new and innovative models that address how they consume our solutions. In part, customers are looking to remove unnecessary cost and complexity, align solution offerings to their business needs, and provide consistent operations throughout their IT enterprise.
We offer options including as-a-Service, subscription, utility, leases, loans, and immediate pay models designed to match customers' consumption and financing preferences. We believe these options are particularly advantageous for our customers during times of economic uncertainty as they provide customers with financial flexibility to further enable them to procure our solutions.
These offerings typically result in multiyear agreements which generate recurring revenue streams over the term of the arrangement. We expect that these offerings will further strengthen our customer relationships and provide a foundation for growth in recurring revenue. We define recurring revenue as revenue recognized that is primarily related to hardware and software maintenance as well as subscription, as-a-Service, usage-based offerings, and operating leases.
Key Performance Metrics
Our key performance metrics areinclude net revenue, operating income, adjusted EBITDA, and cash flows from operations, which are discussed elsewhere in this management’s discussion and analysis.
Class V Transaction
On December 28, 2018, we completed a transaction (“Class V transaction”) in which we paid $14.0 billion in cash and issued 149,387,617 shares of our Class C Common Stock to holders of our Class V Common Stock in exchange for all outstanding shares of Class V Common Stock. The non-cash consideration portion of the Class V transaction totaled $6.9 billion. As a result of the Class V transaction, the tracking stock feature of Dell Technologies’ capital structure was terminated. The Class C Common Stock is traded on the New York Stock Exchange. See Note 1 of the Notes to the Consolidated Financial Statements included in this report for more information about the Class V transaction.
VMware, Inc. Ownership
On July 15, 2020, we announced that we are exploring potential alternatives with respect to our ownership in VMware, Inc., including a potential spin-off of that ownership interest to Dell Technologies’ stockholders. Although this process is currently only at an exploratory stage, we believe a spin-off could benefit both Dell Technologies’ and VMware, Inc.’s stockholders by simplifying capital structures and enhancing strategic flexibility, while still maintaining a mutually beneficial strategic and commercial partnership. Any potential spin-off would not occur prior to September 2021. Other strategic options include maintaining the status quo with respect to our ownership interest in VMware, Inc.
NON-GAAP FINANCIAL MEASURES
In this management’s discussion and analysis, we use supplemental measures of our performance which are derived from our consolidated financial information but which are not presented in our consolidated financial statements prepared in accordance with GAAP. These non-GAAP financial measures include non-GAAP product net revenue; non-GAAP services net revenue; non-GAAP net revenue; non-GAAP product gross margin; non-GAAP services gross margin; non-GAAP gross margin; non-GAAP operating expenses; non-GAAP operating income; non-GAAP net income; earnings before interest and other, net, taxes, depreciation, and amortization (“EBITDA”); and adjusted EBITDA. The non-GAAP financial measures are not meant to be considered as indicators of performance in isolation from or as a substitute for net revenue, gross margin, operating expenses, operating income, or net income from continuing operations prepared in accordance with GAAP, and should be read only in conjunction with financial information presented on a GAAP basis.
Effective in the first quarter of Fiscal 2023, non-GAAP product net revenue, services net revenue, and net revenue no longer differ from the most comparable GAAP financial measures. Such non-GAAP financial measures are provided below for all periods presented to show the impact of purchase accounting adjustments on such financial measures in prior periods.
We use non-GAAP financial measures to supplement financial information presented on a GAAP basis. Management considers these non-GAAP measures in evaluating our operating trends and performance. Moreover, we believe these non-GAAP financial measures provide our stakeholders with useful and transparent information to help them evaluate our operating results by facilitating an enhanced understanding of our operating performance and enabling them to make more meaningful period to period comparisons. There are limitations to the use of the non-GAAP financial measures presented in this report. Our non-GAAP financial measures may not be comparable to similarly titled measures of other companies. Other companies, including companies in our industry, may calculate non-GAAP financial measures differently than we do, limiting the usefulness of those measures for comparative purposes.
Non-GAAP product net revenue, non-GAAP services net revenue, non-GAAP net revenue, non-GAAP product gross margin, non-GAAP services gross margin, non-GAAP gross margin, non-GAAP operating expenses, non-GAAP operating income, and non-GAAP net income, as defined by us, exclude amortization of intangible assets, the impact of purchase accounting, transaction-related expenses, stock-based compensation expense, other corporate expenses and, for non-GAAP net income, fair value adjustments on equity adjustments and an aggregate adjustment for income taxes. As the excluded items have a material impact on our financial results, our management compensates for this limitation by relying primarily on our GAAP results and using non-GAAP financial measures supplementally or for projections when comparable GAAP financial measures are not available. The non-GAAP financial measures are not meant to be considered as indicators of performance in isolation from or as a substitute for net revenue, gross margin, operating expenses, operating income, or net income prepared in accordance with GAAP, and should be read only in conjunction with financial information presented on a GAAP basis.
Reconciliations of each non-GAAP financial measure to its most directly comparable GAAP financial measure are presented below. We encourage you to review the reconciliations in conjunction with the presentation of the non-GAAP financial measures for each of the periods presented. The discussion below includes information on each of the excluded items as well as our reasons for excluding them from our non-GAAP results. In future fiscal periods, we may exclude such items and may incur income and expenses similar to these excluded items. Accordingly, the exclusion of these items and other similar items in our non-GAAP presentation should not be interpreted as implying that these items are non-recurring, infrequent, or unusual.
The following is a summary of the items excluded from the most comparable GAAP financial measures to calculate our non-GAAP financial measures:
•Amortization of Intangible Assets — Amortization of intangible assets primarily consists of amortization of customer relationships, developed technology, and trade names. In connection with our acquisition by merger of EMC, on September 7, 2016, referred to as the EMC“EMC merger transaction,” and the acquisition of Dell Inc. by Dell Technologies Inc. on October 29, 2013,, referred to as the going-private“going-private transaction,” all of the tangible and intangible assets and liabilities of EMC and Dell Inc. and its consolidated subsidiaries, respectively, were accounted for and recognized at fair value on the transaction dates. Accordingly, for the periods presented, amortization of intangible assets represents amortization associated with intangible assets recognized in connection with the EMC merger transaction and the going-private transaction. Amortization charges for purchased intangible assets are significantly impacted by the timing and magnitude of our acquisitions, and these charges may vary in amount from period to period. We exclude these charges for purposes of calculating the non-GAAP financial measures presented below to facilitate a more meaningful evaluationan enhanced understanding of our current operating performance and comparisonsprovide more meaningful period to our past operating performance.
•Impact of Purchase Accounting — The impact of purchase accounting includes purchase accounting adjustments primarily related to the EMC merger transaction and, to a lesser extent, the going-private transaction recorded under the acquisition method of accounting in accordance with the accounting guidance for business combinations. This guidance prescribes that the purchase price be allocated to assets acquired and liabilities assumed based on the estimated fair value of such assets and liabilities on the date of the transaction. Accordingly, all of the assets and liabilities acquired in the EMC merger transaction and the going-private transactionsuch transactions were accounted for and recognized at fair value as of the respective transaction dates, and the fair value adjustments are being amortizedcontinue to amortize over the estimated useful lives in the periods following the transactions. The fair value adjustments that are still amortizing primarily relate to deferred revenue, inventory, and property, plant, and equipment. Although purchase accounting adjustments and related amortization of those adjustments are reflected in our GAAP results, we evaluate the operating results of the underlying businesses on a non-GAAP basis, after removing such adjustments. We believe that excluding the impact of purchase accounting provides results that are useful infor purposes of calculating the non-GAAP financial measures presented below facilitates an enhanced understanding of our current operating performance and provides more meaningful comparisonsperiod to our past operating performance.period comparisons.
•Transaction-relatedTransaction-Related (Income) Expenses — Transaction-related expenses typically consist of acquisition, integration, and divestiture related costs, as well as the costs incurred in the Class V transaction,VMware Spin-off, and are expensed as incurred. These expenses primarily represent costs for legal, banking, consulting, and advisory services. During Fiscal 2022, this category includes $1.5 billion in debt extinguishment fees primarily associated with the early retirement of certain senior notes. See Note 8 of the Notes to the Consolidated Financial Statements included in this report for additional information on our debt activity. From time to time, this category also may include transaction-related gains onincome related to divestitures of businesses or asset sales. During Fiscal 2021,2022, we recognized a pre-tax gain of $120 million$4.0 billion on the sale of certain intellectual property assetsBoomi and during Fiscal 2021, we recognized a pre-tax gain of $338 million on the sale of RSA Security. During Fiscal 2020, transaction expenses included various acquisition costs that primarily consisted of costs of VMware, Inc.’s acquisitions of Carbon Black and Pivotal. During Fiscal 2019, we incurred expenses of approximately $316 million for the completion of the Class V transaction, approximately $116 million for customer evaluation units, and approximately $100 million for manufacturing and engineering inventory. We exclude these items for purposes of calculating the non-GAAP financial measures presented below to facilitate a more meaningful evaluationan enhanced understanding of our current operating performance and comparisonsprovide more meaningful period to our past operating performance.period comparisons.
•Stock-based Compensation Expense — Stock-based compensation expense consists of equity awards granted based on the estimated fair value of those awards at grant date. We estimate the fair value of service-based stock options using the Black-Scholes valuation model. To estimate the fair value of performance-based awards containing a market condition, we use the Monte Carlo valuation model. For all other share-based awards, the fair value is generally based on the closing price of the Class C Common Stock as reported on the NYSE on the date of grant. Although stock-based compensation is an important aspect of the compensation of our employees and executives, the fair value of the stock-based awards may bear little resemblance to the actual value realized upon the vesting or future exercise of the related stock-based awards. We believe that excluding stock-based compensation expense for purposes of calculating the non-GAAP financial measures presented below facilitates a more meaningful evaluationan enhanced understanding of our current operating performance and comparisonsprovides more meaningful period to our past operating performance. See Note 16 of the Notes to the Consolidated Financial Statements included in this report for additional information on equity award issuances.period comparisons.
•Other Corporate Expenses — Other corporate expenses consist of impairment charges, incentive charges related to equity investments, severance, facility action, payroll taxes associated with stock-based compensation, and other costs. Virtustream non-cash pre-tax asset impairment chargesDuring Fiscal 2023, other corporate expenses includes $0.9 billion of $619 millionnet expense recognized within interest and $190 million were recognizedother, net, in Fiscal 2020 and Fiscal 2019, respectively. This category also includesconnection with an agreement to settle the derecognition of a $237 million previously accrued litigation loss as a result of a jury verdict in January 2020 against VMware, Inc. in a patent litigation matter. In December 2020, the United States District Court of the District of Delaware set aside the jury verdict and ordered a new trial.Class V transaction litigation. See Note 1012 of the Notes to the Consolidated Financial Statements included in this report for more information about this patent litigation matter. Severance costs are primarily related to severance and benefits for employees terminated pursuant to cost savings initiatives. We continueDuring Fiscal 2023, other corporate expenses includes $0.5 billion in costs primarily associated with our strategic workforce reduction announced subsequent to integrate ownedthe close of Fiscal 2023. See Note 20 of the Notes to the Consolidated Financial Statements included in this report for information about our severance costs. Further, during Fiscal 2023, other corporate expenses includes $0.2 billion in costs associated with exiting our business in Russia, primarily related to asset impairments and leased facilities and may incur additional costs as we seek opportunities for operational efficiencies.other exit related costs. Other corporate expenses vary from period to period and are significantly impacted by the timing and nature of these events. Therefore, although we may incur these types of expenses in the future, we believe that eliminating these charges for purposes of calculating the non-GAAP financial measures presented below facilitates a more meaningful evaluationan enhanced understanding of our current operating performance and comparisonsprovides more meaningful period to our past operating performance.period comparisons.
•Fair Value Adjustments on Equity Investments — Fair value adjustments on equity investments primarily consistsconsist of the gain (loss) on strategic investments, which includes the recurring fair value adjustments of investments in publicly-traded companies, as well as those in privately-held companies, which are adjusted for observable price changes and to a lesser extent, any potential impairments. During Fiscal 2021, this category included an unrealized net gain of $396 million related to one of our strategic investments. See Note 34 of the Notes to the Consolidated Financial Statements included in this report for additional information on our strategic investment activity. Given the volatility in the ongoing adjustments to the valuation of these strategic investments, we believe that excluding these gains and losses for purposes of calculating non-GAAP net income presented below facilitates a more meaningful evaluationan enhanced understanding of our current operating performance and comparisonsprovides more meaningful period to our past operating performance.period comparisons.
•Aggregate Adjustment for Income Taxes — The aggregate adjustment for income taxes is the estimated combined income tax effect for the adjustments described above, as well as an adjustment for discrete tax items. Due to the variability in recognition of discrete tax items from period to period, we believe that excluding these benefits or charges for purposes of calculating non-GAAP net income facilitates a more meaningful evaluationan enhanced understanding of our current operating performance and comparisonsprovides more meaningful period to our past operating performance.period comparisons. The tax effects are determined based on the tax jurisdictions where the above items were incurred. See Note 1113 of the Notes to the Consolidated Financial Statements included in this report for additional information on our income taxes.
The following table presents a reconciliation of each non-GAAP financial measure to the most directly comparable GAAP measure for the periods indicated:
| | | | | | | | | | | | | | | | | | | | | | | | | | | | | | | | | | | |
| | | Fiscal Year Ended |
| | | | | | | | January 29,
2021 | | % Change | | January 31,
2020 | | % Change | | February 1,
2019 |
| | | | | | | (in millions, except percentages) |
| Product net revenue | | | | | | | $ | 69,911 | | | — | % | | $ | 69,918 | | | (1) | % | | $ | 70,707 | |
| Non-GAAP adjustments: | | | | | | | | | | | | | | | |
| Impact of purchase accounting | | | | | | | 8 | | | | | 19 | | | | | 61 | |
| Non-GAAP product net revenue | | | | | | | $ | 69,919 | | | — | % | | $ | 69,937 | | | (1) | % | | $ | 70,768 | |
| | | | | | | | | | | | | | | |
| Services net revenue | | | | | | | $ | 24,313 | | | 9 | % | | $ | 22,236 | | | 12 | % | | $ | 19,914 | |
| Non-GAAP adjustments: | | | | | | | | | | | | | | | |
| Impact of purchase accounting | | | | | | | 157 | | | | | 328 | | | | | 642 | |
| Non-GAAP services net revenue | | | | | | | $ | 24,470 | | | 8 | % | | $ | 22,564 | | | 10 | % | | $ | 20,556 | |
| | | | | | | | | | | | | | | |
| Net revenue | | | | | | | $ | 94,224 | | | 2 | % | | $ | 92,154 | | | 2 | % | | $ | 90,621 | |
| Non-GAAP adjustments: | | | | | | | | | | | | | | | |
| Impact of purchase accounting | | | | | | | 165 | | | | | 347 | | | | | 703 | |
| Non-GAAP net revenue | | | | | | | $ | 94,389 | | | 2 | % | | $ | 92,501 | | | 1 | % | | $ | 91,324 | |
| | | | | | | | | | | | | | | |
| Product gross margin | | | | | | | $ | 14,564 | | | (5) | % | | $ | 15,393 | | | 20 | % | | $ | 12,818 | |
| Non-GAAP adjustments: | | | | | | | | | | | | | | | |
| Amortization of intangibles | | | | | | | 1,503 | | | | | 2,081 | | | | | 2,883 | |
| Impact of purchase accounting | | | | | | | 14 | | | | | 28 | | | | | 78 | |
| Transaction-related (income) expenses | | | | | | | — | | | | | (5) | | | | | 210 | |
| Stock-based compensation expense | | | | | | | 24 | | | | | 10 | | | | | 27 | |
| Other corporate expenses | | | | | | | 17 | | | | | 16 | | | | | 5 | |
| Non-GAAP product gross margin | | | | | | | $ | 16,122 | | | (8) | % | | $ | 17,523 | | | 9 | % | | $ | 16,021 | |
| | | | | | | | | | | | | | | |
| Services gross margin | | | | | | | $ | 14,853 | | | 10 | % | | $ | 13,540 | | | 11 | % | | $ | 12,235 | |
| Non-GAAP adjustments: | | | | | | | | | | | | | | | |
| Amortization of intangibles | | | | | | | (1) | | | | | — | | | | | — | |
| Impact of purchase accounting | | | | | | | 157 | | | | | 325 | | | | | 642 | |
| Transaction-related expenses | | | | | | | — | | | | | — | | | | | 3 | |
| Stock-based compensation expense | | | | | | | 170 | | | | | 119 | | | | | 64 | |
| Other corporate expenses | | | | | | | 45 | | | | | 56 | | | | | 57 | |
| Non-GAAP services gross margin | | | | | | | $ | 15,224 | | | 8 | % | | $ | 14,040 | | | 8 | % | | $ | 13,001 | |
| | | | | | | | | | | | | | | | | | | | | | | | | | | | | | | | | | | |
| | | Fiscal Year Ended |
| | | | | | | | January 29,
2021 | | % Change | | January 31,
2020 | | % Change | | February 1,
2019 |
| | | | | | | (in millions, except percentages) |
| Gross margin | | | | | | | $ | 29,417 | | | 2 | % | | $ | 28,933 | | | 15 | % | | $ | 25,053 | |
| Non-GAAP adjustments: | | | | | | | | | | | | | | | |
| Amortization of intangibles | | | | | | | 1,502 | | | | | 2,081 | | | | | 2,883 | |
| Impact of purchase accounting | | | | | | | 171 | | | | | 353 | | | | | 720 | |
| Transaction-related (income) expenses | | | | | | | — | | | | | (5) | | | | | 213 | |
| Stock-based compensation expense | | | | | | | 194 | | | | | 129 | | | | | 91 | |
| Other corporate expenses | | | | | | | 62 | | | | | 72 | | | | | 62 | |
| Non-GAAP gross margin | | | | | | | $ | 31,346 | | | (1) | % | | $ | 31,563 | | | 9 | % | | $ | 29,022 | |
| | | | | | | | | | | | | | | |
| Operating expenses | | | | | | | $ | 24,273 | | | (8) | % | | $ | 26,311 | | | 4 | % | | $ | 25,244 | |
| Non-GAAP adjustments: | | | | | | | | | | | | | | | |
| Amortization of intangibles | | | | | | | (1,891) | | | | | (2,327) | | | | | (3,255) | |
| Impact of purchase accounting | | | | | | | (42) | | | | | (58) | | | | | (100) | |
| Transaction-related expenses | | | | | | | (257) | | | | | (290) | | | | | (537) | |
| Stock-based compensation expense | | | | | | | (1,415) | | | | | (1,133) | | | | | (827) | |
| Other corporate expenses | | | | | | | (120) | | | | | (1,088) | | | | | (357) | |
| Non-GAAP operating expenses | | | | | | | $ | 20,548 | | | (4) | % | | $ | 21,415 | | | 6 | % | | $ | 20,168 | |
| | | | | | | | | | | | | | | |
| Operating income | | | | | | | $ | 5,144 | | | 96 | % | | $ | 2,622 | | | NM | | $ | (191) | |
| Non-GAAP adjustments: | | | | | | | | | | | | | | | |
| Amortization of intangibles | | | | | | | 3,393 | | | | | 4,408 | | | | | 6,138 | |
| Impact of purchase accounting | | | | | | | 213 | | | | | 411 | | | | | 820 | |
| Transaction-related expenses | | | | | | | 257 | | | | | 285 | | | | | 750 | |
| Stock-based compensation expense | | | | | | | 1,609 | | | | | 1,262 | | | | | 918 | |
| Other corporate expenses | | | | | | | 182 | | | | | 1,160 | | | | | 419 | |
| Non-GAAP operating income | | | | | | | $ | 10,798 | | | 6 | % | | $ | 10,148 | | | 15 | % | | $ | 8,854 | |
| | | | | | | | | | | | | | | |
| Net income (loss) | | | | | | | $ | 3,505 | | | (37) | % | | $ | 5,529 | | | 354 | % | | $ | (2,181) | |
| Non-GAAP adjustments: | | | | | | | | | | | | | | | |
| Amortization of intangibles | | | | | | | 3,393 | | | | | 4,408 | | | | | 6,138 | |
| Impact of purchase accounting | | | | | | | 213 | | | | | 411 | | | | | 820 | |
| Transaction-related (income) expenses | | | | | | | (201) | | | | | 285 | | | | | 824 | |
| Stock-based compensation expense | | | | | | | 1,609 | | | | | 1,262 | | | | | 918 | |
| Other corporate expenses | | | | | | | 74 | | | | | 1,160 | | | | | 419 | |
| Fair value adjustments on equity investments | | | | | | | (582) | | | | | (194) | | | | | (342) | |
| Aggregate adjustment for income taxes | | | | | | | (1,248) | | | | | (6,772) | | | | | (1,369) | |
| Non-GAAP net income | | | | | | | $ | 6,763 | | | 11 | % | | $ | 6,089 | | | 16 | % | | $ | 5,227 | |
____________________
NM Not meaningful | | | | | | | | | | | | | | | | | | | | | | | | | | | | | | | | | | | |
| | | Fiscal Year Ended |
| | | | | | | | February 3,
2023 | | % Change | | January 28,
2022 | | % Change | | January 29,
2021 |
| | | | | | | | | | | | | | | |
| | | | | | | (in millions, except percentages) |
| Product net revenue | | | | | | | $ | 79,250 | | | (1) | % | | $ | 79,830 | | | 18 | % | | $ | 67,744 | |
| Non-GAAP adjustments: | | | | | | | | | | | | | | | |
| Impact of purchase accounting | | | | | | | — | | | | | — | | | | | 2 | |
| Non-GAAP product net revenue | | | | | | | $ | 79,250 | | | (1) | % | | $ | 79,830 | | | 18 | % | | $ | 67,746 | |
| | | | | | | | | | | | | | | |
| Services net revenue | | | | | | | $ | 23,051 | | | 8 | % | | $ | 21,367 | | | 13 | % | | $ | 18,926 | |
| Non-GAAP adjustments: | | | | | | | | | | | | | | | |
| Impact of purchase accounting | | | | | | | — | | | | | 32 | | | | | 104 | |
| Non-GAAP services net revenue | | | | | | | $ | 23,051 | | | 8 | % | | $ | 21,399 | | | 12 | % | | $ | 19,030 | |
| | | | | | | | | | | | | | | |
| Net revenue | | | | | | | $ | 102,301 | | | 1 | % | | $ | 101,197 | | | 17 | % | | $ | 86,670 | |
| Non-GAAP adjustments: | | | | | | | | | | | | | | | |
| Impact of purchase accounting | | | | | | | — | | | | | 32 | | | | | 106 | |
| Non-GAAP net revenue | | | | | | | $ | 102,301 | | | 1 | % | | $ | 101,229 | | | 17 | % | | $ | 86,776 | |
| | | | | | | | | | | | | | | |
| Product gross margin | | | | | | | $ | 13,221 | | | 5 | % | | $ | 12,606 | | | 11 | % | | $ | 11,313 | |
| Non-GAAP adjustments: | | | | | | | | | | | | | | | |
| Amortization of intangibles | | | | | | | 414 | | | | | 598 | | | | | 853 | |
| Impact of purchase accounting | | | | | | | 2 | | | | | 3 | | | | | 5 | |
| | | | | | | | | | | | | | | |
| Stock-based compensation expense | | | | | | | 52 | | | | | 48 | | | | | 23 | |
| Other corporate expenses | | | | | | | 32 | | | | | 6 | | | | | 17 | |
| Non-GAAP product gross margin | | | | | | | $ | 13,721 | | | 3 | % | | $ | 13,261 | | | 9 | % | | $ | 12,211 | |
| | | | | | | | | | | | | | | |
| Services gross margin | | | | | | | $ | 9,465 | | | 2 | % | | $ | 9,285 | | | 5 | % | | $ | 8,827 | |
| Non-GAAP adjustments: | | | | | | | | | | | | | | | |
| | | | | | | | | | | | | | | |
| Impact of purchase accounting | | | | | | | — | | | | | 32 | | | | | 104 | |
| | | | | | | | | | | | | | | |
| Stock-based compensation expense | | | | | | | 100 | | | | | 85 | | | | | 52 | |
| Other corporate expenses | | | | | | | 141 | | | | | 21 | | | | | 39 | |
| Non-GAAP services gross margin | | | | | | | $ | 9,706 | | | 3 | % | | $ | 9,423 | | | 4 | % | | $ | 9,022 | |
| | | | | | | | | | | | | | | | | | | | | | | | | | | | | | | | | | | |
| | | Fiscal Year Ended |
| | | | | | | | February 3,
2023 | | % Change | | January 28,
2022 | | % Change | | January 29,
2021 |
| | | | | | | | | | | | | | | |
| | | | | | | (in millions, except percentages) |
| Gross margin | | | | | | | $ | 22,686 | | | 4 | % | | $ | 21,891 | | | 9 | % | | $ | 20,140 | |
| Non-GAAP adjustments: | | | | | | | | | | | | | | | |
| Amortization of intangibles | | | | | | | 414 | | | | | 598 | | | | | 853 | |
| Impact of purchase accounting | | | | | | | 2 | | | | | 35 | | | | | 109 | |
| | | | | | | | | | | | | | | |
| Stock-based compensation expense | | | | | | | 152 | | | | | 133 | | | | | 75 | |
| Other corporate expenses | | | | | | | 173 | | | | | 27 | | | | | 56 | |
| Non-GAAP gross margin | | | | | | | $ | 23,427 | | | 3 | % | | $ | 22,684 | | | 7 | % | | $ | 21,233 | |
| | | | | | | | | | | | | | | |
| Operating expenses | | | | | | | $ | 16,915 | | | (2) | % | | $ | 17,232 | | | 5 | % | | $ | 16,455 | |
| Non-GAAP adjustments: | | | | | | | | | | | | | | | |
| Amortization of intangibles | | | | | | | (556) | | | | | (1,043) | | | | | (1,280) | |
| Impact of purchase accounting | | | | | | | (42) | | | | | (32) | | | | | (35) | |
| Transaction-related expenses | | | | | | | (22) | | | | | (273) | | | | | (124) | |
| Stock-based compensation expense | | | | | | | (779) | | | | | (675) | | | | | (412) | |
| Other corporate expenses | | | | | | | (726) | | | | | (310) | | | | | (320) | |
| Non-GAAP operating expenses | | | | | | | $ | 14,790 | | | (1) | % | | $ | 14,899 | | | 4 | % | | $ | 14,284 | |
| | | | | | | | | | | | | | | |
| Operating income | | | | | | | $ | 5,771 | | | 24 | % | | $ | 4,659 | | | 26 | % | | $ | 3,685 | |
| Non-GAAP adjustments: | | | | | | | | | | | | | | | |
| Amortization of intangibles | | | | | | | 970 | | | | | 1,641 | | | | | 2,133 | |
| Impact of purchase accounting | | | | | | | 44 | | | | | 67 | | | | | 144 | |
| Transaction-related expenses | | | | | | | 22 | | | | | 273 | | | | | 124 | |
| Stock-based compensation expense | | | | | | | 931 | | | | | 808 | | | | | 487 | |
| Other corporate expenses | | | | | | | 899 | | | | | 337 | | | | | 376 | |
| Non-GAAP operating income | | | | | | | $ | 8,637 | | | 11 | % | | $ | 7,785 | | | 12 | % | | $ | 6,949 | |
| | | | | | | | | | | | | | | |
| | | | | | | | | | | | | | | |
| | | | | | | | | | | | | | | |
| | | | | | | | | | | | | | | |
| | | | | | | | | | | | | | | |
| | | | | | | | | | | | | | | |
| | | | | | | | | | | | | | | |
| | | | | | | | | | | | | | | |
| | | | | | | | | | | | | | | |
| | | | | | | | | | | | | | | |
| | | | | | | | | | | | | | | |
| Net income (loss) from continuing operations | | | | | | | $ | 2,422 | | | (51) | % | | $ | 4,942 | | | 120 | % | | $ | 2,245 | |
| Non-GAAP adjustments: | | | | | | | | | | | | | | | |
| Amortization of intangibles | | | | | | | 970 | | | | | 1,641 | | | | | 2,133 | |
| Impact of purchase accounting | | | | | | | 44 | | | | | 67 | | | | | 144 | |
| Transaction-related (income) expenses | | | | | | | (16) | | | | | (2,143) | | | | | (332) | |
| Stock-based compensation expense | | | | | | | 931 | | | | | 808 | | | | | 487 | |
| Other corporate expenses | | | | | | | 1,812 | | | | | 337 | | | | | 268 | |
| Fair value adjustments on equity investments | | | | | | | 206 | | | | | (572) | | | | | (427) | |
| Aggregate adjustment for income taxes | | | | | | | (642) | | | | | (156) | | | | | (772) | |
| Non-GAAP net income | | | | | | | $ | 5,727 | | | 16 | % | | $ | 4,924 | | | 31 | % | | $ | 3,746 | |
In addition to the above measures, we also use EBITDA and adjusted EBITDA to provide additional information for evaluation of our operating performance. Adjusted EBITDA excludes purchase accounting adjustments related to the EMC merger transaction and the going-private transaction, acquisition, integration, and divestiture related costs, impairment charges, and severance, facility action, and other costs, and stock-based compensation expense. We believe that, due to the non-operational nature of the purchase accounting entries, it is appropriate to exclude these adjustments.
As is the case with the non-GAAP measures presented above, users should consider the limitations of using EBITDA and adjusted EBITDA, including the fact that those measures do not provide a complete measure of our operating performance. EBITDA and adjusted EBITDA do not purport to be alternatives to net income (loss)from continuing operations as measures of operating performance or to cash flows from operating activities as a measure of liquidity. In particular, EBITDA and adjusted EBITDA are not intended to be a measure of free cash flow available for management’s discretionary use, as these measures do not consider certain cash requirements, such as working capital needs, capital expenditures, contractual commitments, interest payments, tax payments, and other debt service requirements.
The following table presents a reconciliation of EBITDA and adjusted EBITDA to net income (loss)from continuing operations for the periods indicated:
| | | | Fiscal Year Ended | | | Fiscal Year Ended |
| | | January 29,
2021 | | % Change | | January 31,
2020 | | % Change | | February 1,
2019 | | | February 3,
2023 | | % Change | | January 28,
2022 | | % Change | | January 29,
2021 |
| | | | (in millions, except percentages) | | | | | | | | | | | |
| Net income (loss) | | $ | 3,505 | | | (37) | % | | $ | 5,529 | | | 354 | % | | $ | (2,181) | | |
| | | | | (in millions, except percentages) |
| Net income from continuing operations | | Net income from continuing operations | | $ | 2,422 | | | (51) | % | | $ | 4,942 | | | 120 | % | | $ | 2,245 | |
| Adjustments: | Adjustments: | | | Adjustments: | | |
| Interest and other, net (a) | Interest and other, net (a) | | 1,474 | | | 2,626 | | | 2,170 | | Interest and other, net (a) | | 2,546 | | | (1,264) | | | 1,339 | |
| Income tax expense (benefit) (b) | | 165 | | | (5,533) | | | (180) | | |
| Income tax expense (benefit) | | Income tax expense (benefit) | | 803 | | | 981 | | | 101 | |
| Depreciation and amortization | Depreciation and amortization | | 5,390 | | | 6,143 | | | 7,746 | | Depreciation and amortization | | 3,156 | | | 3,547 | | | 3,867 | |
| EBITDA | EBITDA | | $ | 10,534 | | | 20 | % | | $ | 8,765 | | | 16 | % | | $ | 7,555 | | EBITDA | | $ | 8,927 | | | 9 | % | | $ | 8,206 | | | 9 | % | | $ | 7,552 | |
| | EBITDA | EBITDA | | $ | 10,534 | | | 20 | % | | $ | 8,765 | | | 16 | % | | $ | 7,555 | | EBITDA | | $ | 8,927 | | | 9 | % | | $ | 8,206 | | | 9 | % | | $ | 7,552 | |
| Adjustments: | Adjustments: | | | Adjustments: | | |
| Stock-based compensation expense | Stock-based compensation expense | | 1,609 | | | 1,262 | | | 918 | | Stock-based compensation expense | | 931 | | | 808 | | | 487 | |
| Impact of purchase accounting (c) | | 165 | | | 347 | | | 704 | | |
| Transaction-related expenses (d) | | 257 | | | 285 | | | 722 | | |
| Other corporate expenses (e) | | 182 | | | 1,128 | | | 397 | | |
| Impact of purchase accounting | | Impact of purchase accounting | | — | | | 36 | | | 106 | |
| Transaction-related expenses | | Transaction-related expenses | | 22 | | | 273 | | | 124 | |
| Other corporate expenses | | Other corporate expenses | | 899 | | | 337 | | | 376 | |
| Adjusted EBITDA | Adjusted EBITDA | | $ | 12,747 | | | 8 | % | | $ | 11,787 | | | 14 | % | | $ | 10,296 | | Adjusted EBITDA | | $ | 10,779 | | | 12 | % | | $ | 9,660 | | | 12 | % | | $ | 8,645 | |
____________________
(a)See “Results of Operations — Interest and Other, Net” for more information on the components of interest and other, net.
(b)See Note 11 of the Notes to the Consolidated Financial Statements included in this report for additional information on discrete tax items.
(c)This amount includes the non-cash purchase accounting adjustments related to the EMC merger transaction and the going-private transaction.
(d)Transaction-related expenses consist of acquisition, integration, and divestiture related costs, as well as the costs incurred in the Class V transaction.
(e)
Other corporate expenses includes impairment charges, severance, facility action, and other costs.
RESULTS OF OPERATIONS
Consolidated Results
The following table summarizes our consolidated results for the periods indicated. Unless otherwise indicated, all changes identified for the current period results represent comparisons to results for the prior corresponding fiscal period.
| | | | | | | | | | | | | | | | | | | | | | | | | | | | | | | | | | | | | | | | | | | | | Fiscal Year Ended |
| | | Fiscal Year Ended | | | February 3, 2023 | | January 28, 2022 | | January 29, 2021 |
| | | | January 29, 2021 | | January 31, 2020 | | February 1, 2019 | | | Dollars | | % of
Net Revenue | | %
Change | | Dollars | | % of
Net Revenue | | %
Change | | Dollars | | % of
Net Revenue |
| | | | Dollars | | % of
Net Revenue | | %
Change | | Dollars | | % of
Net Revenue | | %
Change | | Dollars | | % of
Net Revenue | | | | | | | | | | | | | | | | | |
| | | (in millions, except percentages) | | | (in millions, except percentages) |
| Net revenue: | Net revenue: | | | Net revenue: | | |
| Products | Products | | $ | 69,911 | | | 74.2 | % | | — | % | | $ | 69,918 | | | 75.9 | % | | (1) | % | | $ | 70,707 | | | 78.0 | % | Products | | $ | 79,250 | | | 77.5 | % | | (1) | % | | $ | 79,830 | | | 78.9 | % | | 18 | % | | $ | 67,744 | | | 78.2 | % |
| Services | Services | | 24,313 | | | 25.8 | % | | 9 | % | | 22,236 | | | 24.1 | % | | 12 | % | | 19,914 | | | 22.0 | % | Services | | 23,051 | | | 22.5 | % | | 8 | % | | 21,367 | | | 21.1 | % | | 13 | % | | 18,926 | | | 21.8 | % |
| Total net revenue | Total net revenue | | $ | 94,224 | | | 100.0 | % | | 2 | % | | $ | 92,154 | | | 100.0 | % | | 2 | % | | $ | 90,621 | | | 100.0 | % | Total net revenue | | $ | 102,301 | | | 100.0 | % | | 1 | % | | $ | 101,197 | | | 100.0 | % | | 17 | % | | $ | 86,670 | | | 100.0 | % |
| Gross margin: | Gross margin: | | | Gross margin: | | |
| Products (a) | Products (a) | | $ | 14,564 | | | 20.8 | % | | (5) | % | | $ | 15,393 | | | 22.0 | % | | 20 | % | | $ | 12,818 | | | 18.1 | % | Products (a) | | $ | 13,221 | | | 16.7 | % | | 5 | % | | $ | 12,606 | | | 15.8 | % | | 11 | % | | $ | 11,313 | | | 16.7 | % |
| Services (b) | Services (b) | | 14,853 | | | 61.1 | % | | 10 | % | | 13,540 | | | 60.9 | % | | 11 | % | | 12,235 | | | 61.4 | % | Services (b) | | 9,465 | | | 41.1 | % | | 2 | % | | 9,285 | | | 43.5 | % | | 5 | % | | 8,827 | | | 46.6 | % |
| Total gross margin | Total gross margin | | $ | 29,417 | | | 31.2 | % | | 2 | % | | $ | 28,933 | | | 31.4 | % | | 15 | % | | $ | 25,053 | | | 27.6 | % | Total gross margin | | $ | 22,686 | | | 22.2 | % | | 4 | % | | $ | 21,891 | | | 21.6 | % | | 9 | % | | $ | 20,140 | | | 23.2 | % |
| Operating expenses | Operating expenses | | $ | 24,273 | | | 25.7 | % | | (8) | % | | $ | 26,311 | | | 28.6 | % | | 4 | % | | $ | 25,244 | | | 27.8 | % | Operating expenses | | $ | 16,915 | | | 16.6 | % | | (2) | % | | $ | 17,232 | | | 17.0 | % | | 5 | % | | $ | 16,455 | | | 18.9 | % |
| Operating income (loss) | | $ | 5,144 | | | 5.5 | % | | 96 | % | | $ | 2,622 | | | 2.8 | % | | NM | | $ | (191) | | | (0.2) | % | |
| Net income (loss) | | $ | 3,505 | | | 3.7 | % | | (37) | % | | $ | 5,529 | | | 6.0 | % | | 354 | % | | $ | (2,181) | | | (2.4) | % | |
| Net income (loss) attributable to Dell Technologies Inc. | | $ | 3,250 | | | 3.4 | % | | (30) | % | | $ | 4,616 | | | 5.0 | % | | 300 | % | | $ | (2,310) | | | (2.5) | % | |
| Operating income | | Operating income | | $ | 5,771 | | | 5.6 | % | | 24 | % | | $ | 4,659 | | | 4.6 | % | | 26 | % | | $ | 3,685 | | | 4.3 | % |
| Net income from continuing operations | | Net income from continuing operations | | $ | 2,422 | | | 2.4 | % | | (51) | % | | $ | 4,942 | | | 4.9 | % | | 120 | % | | $ | 2,245 | | | 2.6 | % |
| | Non-GAAP Information | | | |
| | Non-GAAP Financial Information | | Non-GAAP Financial Information | |
| | | | Fiscal Year Ended |
| | | Fiscal Year Ended | | | February 3, 2023 | | January 28, 2022 | | January 29, 2021 |
| | | January 29, 2021 | | January 31, 2020 | | February 1, 2019 | | | Dollars | | % of Non-GAAP
Net Revenue | | %
Change | | Dollars | | % of Non-GAAP
Net Revenue | | %
Change | | Dollars | | % of Non-GAAP Net Revenue |
| | | Dollars | | % of Non-GAAP Net Revenue | | %
Change | | Dollars | | % of Non-GAAP Net Revenue | | %
Change | | Dollars | | % of Non-GAAP Net Revenue | | | | | | | | | | | | | | | | | |
| | | (in millions, except percentages) | | | (in millions, except percentages) |
| Non-GAAP net revenue: | Non-GAAP net revenue: | | | Non-GAAP net revenue: | | |
| Products | Products | | $ | 69,919 | | | 74.1 | % | | — | % | | $ | 69,937 | | | 75.6 | % | | (1) | % | | $ | 70,768 | | | 77.5 | % | Products | | $ | 79,250 | | | 77.5 | % | | (1) | % | | $ | 79,830 | | | 78.9 | % | | 18 | % | | $ | 67,746 | | | 78.1 | % |
| Services | Services | | 24,470 | | | 25.9 | % | | 8 | % | | 22,564 | | | 24.4 | % | | 10 | % | | 20,556 | | | 22.5 | % | Services | | 23,051 | | | 22.5 | % | | 8 | % | | 21,399 | | | 21.1 | % | | 12 | % | | 19,030 | | | 21.9 | % |
| Total non-GAAP net revenue | Total non-GAAP net revenue | | $ | 94,389 | | | 100.0 | % | | 2 | % | | $ | 92,501 | | | 100.0 | % | | 1 | % | | $ | 91,324 | | | 100.0 | % | Total non-GAAP net revenue | | $ | 102,301 | | | 100.0 | % | | 1 | % | | $ | 101,229 | | | 100.0 | % | | 17 | % | | $ | 86,776 | | | 100.0 | % |
| Non-GAAP gross margin: | Non-GAAP gross margin: | | | Non-GAAP gross margin: | | |
| Products (a) | Products (a) | | $ | 16,122 | | | 23.1 | % | | (8) | % | | $ | 17,523 | | | 25.1 | % | | 9 | % | | $ | 16,021 | | | 22.6 | % | Products (a) | | $ | 13,721 | | | 17.3 | % | | 3 | % | | $ | 13,261 | | | 16.6 | % | | 9 | % | | $ | 12,211 | | | 18.0 | % |
| Services (b) | Services (b) | | 15,224 | | | 62.2 | % | | 8 | % | | 14,040 | | | 62.2 | % | | 8 | % | | 13,001 | | | 63.2 | % | Services (b) | | 9,706 | | | 42.1 | % | | 3 | % | | 9,423 | | | 44.0 | % | | 4 | % | | 9,022 | | | 47.4 | % |
| Total non-GAAP gross margin | Total non-GAAP gross margin | | $ | 31,346 | | | 33.2 | % | | (1) | % | | $ | 31,563 | | | 34.1 | % | | 9 | % | | $ | 29,022 | | | 31.8 | % | Total non-GAAP gross margin | | $ | 23,427 | | | 22.9 | % | | 3 | % | | $ | 22,684 | | | 22.4 | % | | 7 | % | | $ | 21,233 | | | 24.5 | % |
| Non-GAAP operating expenses | Non-GAAP operating expenses | | $ | 20,548 | | | 21.8 | % | | (4) | % | | $ | 21,415 | | | 23.2 | % | | 6 | % | | $ | 20,168 | | | 22.1 | % | Non-GAAP operating expenses | | $ | 14,790 | | | 14.5 | % | | (1) | % | | $ | 14,899 | | | 14.7 | % | | 4 | % | | $ | 14,284 | | | 16.5 | % |
| Non-GAAP operating income | Non-GAAP operating income | | $ | 10,798 | | | 11.4 | % | | 6 | % | | $ | 10,148 | | | 11.0 | % | | 15 | % | | $ | 8,854 | | | 9.7 | % | Non-GAAP operating income | | $ | 8,637 | | | 8.4 | % | | 11 | % | | $ | 7,785 | | | 7.7 | % | | 12 | % | | $ | 6,949 | | | 8.0 | % |
| Non-GAAP net income | Non-GAAP net income | | $ | 6,763 | | | 7.2 | % | | 11 | % | | $ | 6,089 | | | 6.6 | % | | 16 | % | | $ | 5,227 | | | 5.7 | % | Non-GAAP net income | | $ | 5,727 | | | 5.6 | % | | 16 | % | | $ | 4,924 | | | 4.9 | % | | 31 | % | | $ | 3,746 | | | 4.3 | % |
| EBITDA | EBITDA | | $ | 10,534 | | | 11.2 | % | | 20 | % | | $ | 8,765 | | | 9.5 | % | | 16 | % | | $ | 7,555 | | | 8.3 | % | EBITDA | | $ | 8,927 | | | 8.7 | % | | 9 | % | | $ | 8,206 | | | 8.1 | % | | 9 | % | | $ | 7,552 | | | 8.7 | % |
| Adjusted EBITDA | Adjusted EBITDA | | $ | 12,747 | | | 13.5 | % | | 8 | % | | $ | 11,787 | | | 12.7 | % | | 14 | % | | $ | 10,296 | | | 11.3 | % | Adjusted EBITDA | | $ | 10,779 | | | 10.5 | % | | 12 | % | | $ | 9,660 | | | 9.5 | % | | 12 | % | | $ | 8,645 | | | 10.0 | % |
____________________
(a)Product gross margin percentages representand non-GAAP product gross margin percentages are calculated as a percentage of product net revenue and non-GAAP product net revenue, respectively.
(b) Services gross margin and non-GAAP services gross margin percentages represent non-GAAP product gross margin as a percentage of non-GAAP product net revenue.
(b)Services gross margin percentages represent services gross marginare calculated as a percentage of services net revenue and non-GAAP services gross margin percentages represent non-GAAP services gross margin as a percentage of non-GAAP services net revenue.
NM Not meaningfulrevenue, respectively.
Non-GAAP product net revenue, non-GAAP services net revenue, non-GAAP net revenue, non-GAAP product gross margin, non-GAAP services gross margin, non-GAAP gross margin, non-GAAP operating expenses, non-GAAP operating income, non-GAAP net income, EBITDA, and adjusted EBITDA are not measurements of financial performance prepared in accordance with GAAP. Non-GAAP financial measures as a percentage of revenue are calculated based on non-GAAP net revenue. See “Non‑GAAP Financial Measures” for additional information about these non-GAAP financial measures, including our reasons for including these measures, material limitations with respect to the usefulness of the measures, and a reconciliation of each non-GAAP financial measure to the most directly comparable GAAP financial measure.
Overview
During Fiscal 2021,2023, our net revenue and non-GAAP net revenue both increased 2% as we benefited from the strength of our broad technology solutions portfolio, which helped us navigate market volatility and competitive pressures, particularly due to the COVID-19 environment. The increases1%, driven by an increase in net revenue and non-GAAP net revenue were attributable to increasesfor ISG which was mostly offset by a decline in net revenue in CSG and VMware, which were partially offset by declines infor CSG. ISG net revenue. The increase inrevenue increased primarily as a result of continued net revenue growth within both our servers and networking and storage offerings. CSG net revenue wasdecreased as a result of a decrease in units sold due to an overall decline in the demand environment.
During Fiscal 2023, our operating income increased 24% to $5.8 billion, primarily driven by growth in consumer solutionsISG operating income and continued strong demandthe favorable impact of a decrease in amortization of intangible assets. Growth in ISG operating income for commercial notebooks,Fiscal 2023 was driven by both our server and networking and storage offerings. The increase in operating income was partially offset by lower demand for commercial desktops. VMwarea decline in CSG operating income as well as the unfavorable impact of an increase in other corporate expenses. CSG operating income declined during the period principally driven by our consumer offerings. During Fiscal 2023, our non-GAAP operating income increased 11% to $8.6 billion due to the same ISG and CSG dynamics discussed above.
For Fiscal 2023, operating income as a percentage of net revenue increased due100 basis points to growth5.6% principally driven by improvement in salesgross margin as percentage of subscriptions and software-as-a-service offerings and software maintenance. ISG net revenue decreasedcoupled with a decrease in operating expenses as a percentage of net revenue. Gross margin as a percentage of net revenue increased primarily due to a weaker demand environment as customers continued to direct their investments towards remote work and business continuity solutions. Although we continue to experience some uncertainty as a result of a shift in mix towards ISG. The decline in operating expense as a percentage of net revenue was driven by disciplined cost management and the ongoing COVID-19 pandemic, wefavorable impact of a decrease in the amortization of intangible assets, partially offset by the unfavorable impact of an increase in other corporate expenses. Non-GAAP operating income as a percentage of net revenue increased 70 basis points to 8.4% during Fiscal 2023, driven by the same gross margin and disciplined cost management dynamics discussed above.
Cash provided by operating activities was $3.6 billion and $10.3 billion during Fiscal 2023 and Fiscal 2022, respectively. During Fiscal 2022, $3.2 billion of the $10.3 billion total represented cash provided by operating activities attributable to VMware, Inc. Cash provided by operating activities during Fiscal 2023 declined primarily as a result of unfavorable working capital dynamics as compared to Fiscal 2022. Working capital was primarily impacted by a shift in mix of the business, the timing of purchases and payments to vendors during a declining demand environment, and linearity of sales during the fourth quarter of Fiscal 2023. See “Liquidity, Cash Requirements, and Market Conditions” for further information on our cash flow metrics.
We continue to see opportunities to create value and grow in Fiscal 2022 in the midst of resilientresponse to long-term demand for our IT solutions driven by a technology-enabled world. We have demonstrated our ability to adjust as needed to changing market conditions with complementary solutions across allboth segments of our business, an agile workforce, and the strength of our global supply chain. As we continue to innovate and modernize our core offerings, we believe that Dell Technologies is well-positioned for long-term profitable growth.
During Fiscal 2021, our operating income increased 96% to $5.1 billion, primarily due to increases in net revenue and operating income for CSG and VMware. Operating income during Fiscal 2021 also benefited from lower selling, general, and administrative expenses as we realized the benefit of cost reduction initiatives. We also realized a decrease in amortization of intangible assets and other corporate expenses, most notably resulting from the absence of Virtustream impairment charges of $619 million recognized in Fiscal 2020 and the derecognition of a VMware, Inc. patent litigation accrual in Fiscal 2021 of $237 million, which was initially recognized in Fiscal 2020. These benefits were partially offset by a decrease in operating income for ISG.
Amortization of intangible assets, stock-based compensation expense, and other corporate expenses that impacted operating income totaled $5.2 billion and $6.8 billion for Fiscal 2021 and Fiscal 2020, respectively. Excluding these adjustments, and the impact of purchase accounting and transaction-related expenses, our non-GAAP operating income increased 6% to $10.8 billion during Fiscal 2021. The increase in non-GAAP operating income for Fiscal 2021 was due to increases in net revenue and operating income for CSG and VMware, which were partially offset by a decrease in operating income for ISG.
Cash provided by operating activities was $11.4 billion and $9.3 billion during Fiscal 2021 and Fiscal 2020, respectively. Our record cash flow from operations in Fiscal 2021 was due to strong profitability, revenue growth, and working capital dynamics. COVID-19 impacts to working capital normalized by the end of Fiscal 2021. See “Market Conditions, Liquidity, Capital Commitments, and Contractual Cash Obligations” for further information on our cash flow metrics.
Net Revenue
During Fiscal 2021,2023, our net revenue and non-GAAPincreased 1%, primarily driven by growth within ISG net revenue both increased 2%. The increases in net revenue and non-GAAP net revenue were primarily attributable to increasesthat was mostly offset by a decline in net revenue for CSG and VMware, which were partially offset by declines in ISG net revenue.CSG. See “Business Unit Results” for further information.
•Product Net Revenue — Product net revenue includes revenue from the sale of hardware products and software licenses. During Fiscal 2021, both2023, our product net revenue decreased 1%, primarily due to a decline in CSG product net revenue, which was partially offset by growth in ISG product net revenue. CSG product net revenue decreased primarily as a result of a decline in consumer product net revenue and, non-GAAPto a lesser extent, commercial product net revenue. These declines were both driven by a decrease in units sold, partially offset by an increase in average selling prices. ISG product net revenue remained flat, primarily due to a decrease in product net revenue for ISG, whichgrowth was offsetdriven by an increase in product net revenue for CSG.from both our server and networking and storage offerings.
•Services Net Revenue — Services net revenue includes revenue from our services offerings and support services related to hardware products and software licenses. During Fiscal 2021, services net revenue and non-GAAP2023, services net revenue increased 9% and 8%, respectively. These increases were primarily attributable to increasesdriven principally by strength in services net revenue for CSG third-party softwarehardware support and maintenance and VMwarethird-party software support and maintenance, primarily associated with commercial offerings sold in particular, increases in subscription-based licenses.prior periods. A
substantial portion of services net revenue is derived from offerings that have been deferred over a period of time, and, as a result, reported services net revenue growth rates will be different than reported product net revenue growth rates.
From a geographical perspective, net revenue generated by sales to customersincreased in the Americas and EMEA both increasedregions and decreased in the APJ region during Fiscal 2021 due to strong CSG performance. These increases were partially offset by declines in net revenue generated by sales to customers in APJ as a result of a weaker demand environment.2023.
Gross Margin
During Fiscal 2021, our2023, gross margin and non-GAAP gross margin increased 2%4% to $29.4$22.7 billion as the favorable impact of aand 3% to $23.4 billion, respectively. The increases were driven by growth in ISG gross margin increase for VMware and a decrease in amortization of intangible assets werewhich was partially offset by gross margin decreases for ISG and other businesses. Thea decline in CSG gross margin of other businesses was driven by the divestiture of RSA Security on September 1, 2020.margin.
During Fiscal 2021,2023, our gross margin percentage decreased 20and non-GAAP gross margin percentages increased 60 basis points to 31.2%, as a result of a shift in product mix due to strong CSG sales, as well as decreases in gross margin percentages for ISG22.2% and CSG. The decline was partially offset by a decrease in amortization of intangible assets.
Our gross margin for Fiscal 2021 and Fiscal 2020 included the impact of amortization of intangibles and purchase accounting adjustments of $1.7 billion and $2.4 billion, respectively. Excluding these costs, and transaction-related expenses, stock-based compensation expense, and other corporate expenses, non-GAAP gross margin for Fiscal 2021 decreased 1% to $31.3 billion. The decrease in our non-GAAP gross margin due to gross margin decreases for ISG and other businesses was partially offset by a gross margin increase for VMware. The decline in gross margin of other businesses was driven by the divestiture of RSA Security.
Non-GAAP gross margin percentage decreased 9050 basis points to 33.2%. The decrease in our non-GAAP gross margin percentage was attributable22.9%, respectively, primarily due to a shift in product mix due to strong CSG sales, as well as decreases in gross margin percentages fortowards our ISG and CSG.offerings.
•ProductsProduct Gross Margin — During Fiscal 2021, product gross margin decreased 5% to $14.6 billion and non-GAAP product gross margin decreased 8% to $16.1 billion. The decreases in2023, product gross margin and non-GAAP product gross margin increased 5% to $13.2 billion and 3% to $13.7 billion, respectively. These increases were driven primarily driven by a shift in product mix due to strong CSG sales, as well as a decreasegrowth in ISG product net revenue. These unfavorable impactsgross margin due to growth in product net revenue for both our server and networking and storage offerings. The increases in ISG product gross margin were partially offset by declines in CSG product gross margin primarily due to a decrease in amortization of intangibles.product net revenue for our consumer offerings and, to a lesser extent, a decrease in product net revenue for our commercial offerings.
During Fiscal 2021,2023, product gross margin percentage decreased 120 basis points to 20.8% and non-GAAP product gross margin percentage decreased 200percentages increased 90 basis points to 23.1%. The decreases in product gross margin percentage16.7% and non-GAAP product gross margin percentage were70 basis points to 17.3%, respectively, primarily attributable to a shift in product mix due to strong CSG sales, as well as decreases in product gross margin percentages fortowards our ISG and CSG.offerings.
•Services Gross Margin — During Fiscal 2021,2023, services gross margin increased 10% to $14.9 billion primarily due to growth in VMware software maintenance. Services gross margin also benefited from growth in CSG third-party software and maintenance, in particular, from an increase in subscription-based licenses, as well as from a decrease in purchase accounting adjustments. Excluding purchase accounting adjustments, transaction-related expenses, stock-based compensation expense, and other corporate expenses, non-GAAP services gross margin increased 8%2% to $15.2$9.5 billion as a result of the same CSG and VMware3% to $9.7 billion, respectively. The increases were primarily driven by growth drivers discussed above.
Services gross margin percentage increased 20 basis points to 61.1% primarily due to the favorable impact of a decrease in purchase accounting and an increase in VMware services gross margin percentage. These favorable impacts were partially offset by a decrease in CSG services gross margin, which was partially offset by a decline in other businesses services gross margin. CSG services gross margin increased as a result of growth within hardware support and maintenance, primarily associated with commercial offerings sold in prior periods, while other businesses services gross margin declined due to the impact of the divestiture of Boomi in Fiscal 2022.
During Fiscal 2023, services gross margin percentage decreased 240 basis points to 41.1%. The decrease was driven by a decline in services gross margin percentage for ISG, due to a productshift in mix of services delivered, coupled with a shift withinin mix towards CSG services net revenue and the impact of the Boomi divestiture during Fiscal 2022. Further, the unfavorable impact of an increase in other corporate expenses contributed to entry-level commercial notebooks.the decline. Non-GAAP services gross margin percentage remained flat at 62.2% primarily duedecreased 190 basis points to an increase in VMware services gross margin percentage, offset42.1% and was driven by a decrease inthe same ISG, CSG, services gross margin percentage.
Vendor Programs and Settlements
Our gross margin is affected by our ability to achieve competitive pricing with our vendors and contract manufacturers, including through our negotiation of a variety of vendor rebate programs to achieve lower net costs for the various components we include in our products. Under these programs, vendors provide us with rebates or other discounts from the list prices for the components, which are generally elements of their pricing strategy. We account for vendor rebates and other discounts as a reduction in cost of net revenue. We manage our costs on a total net cost basis, which includes supplier list prices reduced by vendor rebates and other discounts.
The terms and conditions of our vendor rebate programs are largely based on product volumes and are generally negotiated either at the beginning of the annual or quarterly period, depending on the program. The timing and amount of vendor rebates and other discounts we receive under the programs may vary from period to period, reflecting changes in the competitive environment. We monitor our component costs and seek to address the effects of any changes to terms that might arise under our vendor rebate programs. Our gross margins for Fiscal 2021,2023 and for Fiscal 2020, and Fiscal 20192022 were not materially affected by any changes to the terms of our vendor rebate programs, as the amounts we received under these programs were generally stable relative to our total net cost.
We are not aware of any significant changes to our vendor pricing or rebate programs that maywill materially impact our results in the near term. While we anticipate that the impact of industry-wide price increases of certain processors will impact our cost of net revenue beginning in Fiscal 2024, we are also experiencing cost deflation on component parts as a result of overall demand softness. We will continue to take pricing actions to balance profitability and growth while actively addressing our customers’ demands.
Operating Expenses
The following table presents information regarding our operating expenses for the periods indicated:
| | | | | | | | | | | | | | | | | | | | | | | | | | | | | | | | | | | | | | | | | | | | | Fiscal Year Ended |
| | | Fiscal Year Ended | | | February 3, 2023 | | January 28, 2022 | | January 29, 2021 |
| | | January 29, 2021 | | January 31, 2020 | | February 1, 2019 | | | Dollars | | % of Net Revenue | | %
Change | | Dollars | | % of Net Revenue | | %
Change | | Dollars | | % of Net Revenue |
| | | Dollars | | % of
Net Revenue | | %
Change | | Dollars | | % of
Net Revenue | | %
Change | | Dollars | | % of
Net Revenue | | | | | | | | | | | | | | | | | |
| | | (in millions, except percentages) | | | (in millions, except percentages) |
| Operating expenses: | Operating expenses: | | | Operating expenses: | | |
| Selling, general, and administrative | Selling, general, and administrative | | $ | 18,998 | | | 20.1 | % | | (11) | % | | $ | 21,319 | | | 23.2 | % | | 3 | % | | $ | 20,640 | | | 22.7 | % | Selling, general, and administrative | | $ | 14,136 | | | 13.9 | % | | (4) | % | | $ | 14,655 | | | 14.5 | % | | 5 | % | | $ | 14,000 | | | 16.1 | % |
| Research and development | Research and development | | 5,275 | | | 5.6 | % | | 6 | % | | 4,992 | | | 5.4 | % | | 8 | % | | 4,604 | | | 5.1 | % | Research and development | | 2,779 | | | 2.7 | % | | 8 | % | | 2,577 | | | 2.5 | % | | 5 | % | | 2,455 | | | 2.8 | % |
| Total operating expenses | Total operating expenses | | $ | 24,273 | | | 25.7 | % | | (8) | % | | $ | 26,311 | | | 28.6 | % | | 4 | % | | $ | 25,244 | | | 27.8 | % | Total operating expenses | | $ | 16,915 | | | 16.6 | % | | (2) | % | | $ | 17,232 | | | 17.0 | % | | 5 | % | | $ | 16,455 | | | 18.9 | % |
| | | | Fiscal Year Ended | | | Fiscal Year Ended |
| | | January 29, 2021 | | January 31, 2020 | | February 1, 2019 | | | February 3, 2023 | | January 28, 2022 | | January 29, 2021 |
| | | Dollars | | % of Non-GAAP Net Revenue | | %
Change | | Dollars | | % of Non-GAAP Net Revenue | | %
Change | | Dollars | | % of Non-GAAP Net Revenue | | | Dollars | | % of Net Revenue | | %
Change | | Dollars | | % of Net Revenue | | %
Change | | Dollars | | % of Non-GAAP Net Revenue |
| | | (in millions, except percentages) | | | | | | | | | | | | | | | | | |
| | | | (in millions, except percentages) |
| Non-GAAP operating expenses | Non-GAAP operating expenses | | $ | 20,548 | | | 21.8 | % | | (4) | % | | $ | 21,415 | | | 23.2 | % | | 6 | % | | $ | 20,168 | | | 22.1 | % | Non-GAAP operating expenses | | $ | 14,790 | | | 14.5 | % | | (1) | % | | $ | 14,899 | | | 14.7 | % | | 4 | % | | $ | 14,284 | | | 16.5 | % |
During Fiscal 2021,2023, total operating expenses decreased 8% primarily due to2% driven by a decrease in selling, general, and administrative expenses, partially offset by an increase in research and development expenses. Our operating expenses include the impact of purchase accounting, amortization of intangible assets, transaction-related expenses, stock-based compensation expense, and other corporate expenses. In aggregate, these items totaled $3.7 billion and $4.9 billion in Fiscal 2021 and Fiscal 2020, respectively. Excluding these costs, total non-GAAP operating expenses decreased 4% for Fiscal 2021.
•Selling, General, and Administrative — Selling, general, and administrative (“SG&A”) expenses decreased 11%4% during Fiscal 2021.2023, primarily due to decreases in amortization of intangible assets and outside services expenses which were partially offset by an increase in employee compensation and benefits. The decreasedecline in SG&A expensesoutside services expense was partlyprimarily attributable to measures takenexpenses incurred in Fiscal 2022, principally related to the VMware Spin-off, that did not reoccur in Fiscal 2023. Employee compensation and benefits increased primarily as a result of the COVID-19 pandemic, which included global hiring limitations, reductionscosts incurred in consulting and contractor costs and facilities-related costs, global travel restrictions, and suspension of the Dell 401(k) match program for U.S. employees, as well as a decrease in amortization of intangible assets. Additionally during Fiscal 2021, SG&A expenses benefited from the absence of Virtustream pre-tax impairment charges of $619 million recognized in Fiscal 2020 and from the derecognition of a VMware, Inc. patent litigation accrual in Fiscal 2021 of $237 million, which was initially recognized in Fiscal 2020.connection with our strategic workforce reduction.
Effective January 1, 2021, the Dell 401(k) match program for U.S. employees was reinstated. We expect that operating expenses will increase in Fiscal 2022 as we reinstate selected employee-related compensation benefits. We continue to invest in long-term projects, while focusing on operating expense controls in certain areas of the business.
•Research and Development — Research and development (“R&D”) expenses are primarily composed of personnel-related expenses related toincurred in connection with product development. R&D expenses asincreased 8% during Fiscal 2023 driven by an increase in employee compensation and benefits expense.
As a percentage of net revenue, for Fiscal 2021 and Fiscal 2020 were approximately 5.6% and 5.4%, respectively. R&D expenses as a percentage of net revenue increased duringfor Fiscal 2021 primarily due to an increase in compensation-related expense, including stock-based compensation expense, driven by VMware. As our industry continues to change2023 and as the needs of our customers evolve, weFiscal 2022 were 2.7% and 2.5%, respectively. We intend to supportcontinue supporting R&D initiatives to innovate and introduce new and enhanced solutions into the market.
During Fiscal 2023, non-GAAP operating expenses decreased 1% principally due to continued disciplined cost management.
We continue to make selective investments designed to enable growth, marketing, and R&D, while balancing our efforts to drive cost efficiencies in the business. We also expect to continue to makemaking investments in support of our own digital transformation to modernize and streamline our IT operations.
Operating Income
During Fiscal 2021,2023, our operating income increased 96%24% to $5.1$5.8 billion, primarily due to increasesdriven by growth in net revenue andISG operating income for CSG and VMware. Operating income during Fiscal 2021 also benefited from lower selling, general, and administrative expenses as we realized the benefitfavorable impact of cost reduction initiatives. We also realized a decrease in amortization of intangible assetsassets. Growth in ISG operating income for Fiscal 2023 was driven by both our server and other corporate expenses, most notably resulting from the absence of Virtustream impairment charges of $619 million recognizednetworking and storage offerings. The increase in Fiscal 2020 and the derecognition of a VMware, Inc. patent litigation accrual in Fiscal 2021 of $237 million, whichoperating income was initially recognized in Fiscal 2020. These benefits were partially offset by a decreasedecline in CSG operating income for ISG.
Incoupled with the fourth quarterunfavorable impact of Fiscal 2021, we began to reinstate selected employee-related compensation benefits, which we expect will put pressure onan increase in other corporate expenses. CSG operating income indeclined during the period principally driven by our consumer offerings. During Fiscal 2022. We will continue to invest in long-term projects, while focusing on operating expense controls in certain areas of the business.
Amortization of intangible assets, stock-based compensation expense, and other corporate expenses that impacted operating income totaled $5.2 billion and $6.8 billion for Fiscal 2021 and Fiscal 2020, respectively. Excluding these adjustments, and the impact of purchase accounting and transaction-related expenses,2023, our non-GAAP operating income increased 6%11% to $10.8$8.6 billion duringdriven by the same ISG and CSG dynamics discussed above.
For Fiscal 2021. The increase in non-GAAP2023, operating income for Fiscal 2021 was due to increases inas a percentage of net revenue and operating income for CSG and VMware, which were partially offsetincreased 100 basis points to 5.6% principally driven by improvement in gross margin as percentage of net revenue coupled with a decrease in operating expenses as a percentage of net revenue. Gross margin as a percentage of net revenue increased primarily as a result of a shift in mix towards ISG. The decline in operating expense as a percentage of net revenue was driven by disciplined cost management and the favorable impact of a decrease in both the amortization of intangible assets, partially offset by the unfavorable impact of an increase in other corporate expenses. Non-GAAP operating income for ISG.as a percentage of net revenue increased 70 basis points to 8.4% during Fiscal 2023, driven by the same gross margin and disciplined cost management dynamics discussed above.
Interest and Other, Net
The following table presents information regarding interest and other, net for the periods indicated:
| | | | | | | | | | | | | | | | | | | | Fiscal Year Ended |
| | | Fiscal Year Ended | | | February 3, 2023 | | January 28, 2022 | | January 29, 2021 |
| | | | January 29, 2021 | | January 31, 2020 | | February 1, 2019 | | | | | | | |
| | | | (in millions) | | | (in millions) |
| Interest and other, net: | Interest and other, net: | | | | | | Interest and other, net: | | | | | |
| Investment income, primarily interest | Investment income, primarily interest | | $ | 54 | | | $ | 160 | | | $ | 313 | | Investment income, primarily interest | | $ | 100 | | | $ | 42 | | | $ | 47 | |
| Gain on strategic investments, net | | 582 | | | 194 | | | 342 | | |
| Gain (loss) on investments, net | | Gain (loss) on investments, net | | (206) | | | 569 | | | 425 | |
| Interest expense | Interest expense | | (2,389) | | | (2,675) | | | (2,488) | | Interest expense | | (1,222) | | | (1,542) | | | (2,052) | |
| Foreign exchange | Foreign exchange | | (127) | | | (162) | | | (206) | | Foreign exchange | | (265) | | | (221) | | | (160) | |
| Gain on disposition of businesses and assets | | Gain on disposition of businesses and assets | | — | | | 3,968 | | | 458 | |
| Debt extinguishment fees | | Debt extinguishment fees | | — | | | (1,572) | | | (158) | |
| Legal settlement, net | | Legal settlement, net | | (894) | | | — | | | — | |
| Other | Other | | 406 | | | (143) | | | (131) | | Other | | (59) | | | 20 | | | 101 | |
| Total interest and other, net | Total interest and other, net | | $ | (1,474) | | | $ | (2,626) | | | $ | (2,170) | | Total interest and other, net | | $ | (2,546) | | | $ | 1,264 | | | $ | (1,339) | |
|
During Fiscal 2021,2023, the change in interest and other, net was favorableunfavorable by $1,152 million, primarily due$3.8 billion. The unfavorable change was attributable to a $396 million net gain on the fair value adjustment of one of our strategic investments and a pre-tax gain of $338 million$4.0 billion on the sale of RSA Security reflectedBoomi recognized during Fiscal 2022, $0.9 billion of net expense recognized in OtherFiscal 2023 in connection with an agreement to settle the table above. InterestClass V transaction litigation, and other, net also benefited fromthe impact of fair value adjustments on our non-marketable strategic investments portfolio. These factors were partially offset by a decrease in interest expense due to debt paydowns overextinguishment fees, as we incurred $1.6 billion in Fiscal 2022 primarily associated with the periodsearly retirement of certain senior notes, and a gain of $120 million recognized from the sale of certain intellectual property assets.reduction in interest expense.
Income and Other Taxes
The following table presents information regarding our income and other taxes for the periods indicated:
| | | | | | | | | | | | | | | | | |
| Fiscal Year Ended |
| January 29, 2021 | | January 31, 2020 | | February 1, 2019 |
| (in millions, except percentages) |
| Income (loss) before income taxes | $ | 3,670 | | | $ | (4) | | | $ | (2,361) | |
| Income tax expense (benefit) | $ | 165 | | | $ | (5,533) | | | $ | (180) | |
| Effective income tax rate | 4.5 | % | | 138325.0 | % | | 7.6 | % |
| | | | | | | | | | | | | | | | | | | | | | | | |
| | | | Fiscal Year Ended |
| | | | | | | | February 3, 2023 | | January 28, 2022 | | January 29, 2021 |
| | | | | | | | | | | | |
| | (in millions, except percentages) |
| Income before income taxes | | | | | | | | $ | 3,225 | | | $ | 5,923 | | | $ | 2,346 | |
| Income tax expense | | | | | | | | $ | 803 | | | $ | 981 | | | $ | 101 | |
| Effective income tax rate | | | | | | | | 24.9 | % | | 16.6 | % | | 4.3 | % |
For Fiscal 20212023 and Fiscal 2020, our effective income tax rates were 4.5% on pre-tax income of $3,670 million and 138325.0% on pre-tax losses of $4 million, respectively. The change in2022, our effective income tax rate was 24.9% and 16.6%, respectively, with the change being primarily driven by discrete items in those years. Our effective tax items andrate for the Fiscal 2023 includes the impact of a change$0.9 billion expense recognized in our jurisdictional mix of income.
For Fiscal 2021,connection with an agreement to settle the Class V transaction litigation. In comparison, our effective income tax rate for Fiscal 2022 includes discrete tax benefits of $746 million related to an audit settlement, $159 million related to stock-based compensation, and $59 million from an intra-entity asset transfer of certain of Pivotal’s intellectual property to an Irish subsidiary that was completed by VMware, Inc. Our effective income tax rate also includes discrete tax expense of $359 million$1.0 billion on a pre-tax gain of $4.0 billion related to the divestiture of RSA SecurityBoomi during Fiscal 2021. For Fiscal 2020,the period, as well as tax benefits of $367 million on $1.6 billion of debt extinguishment fees and $244 million related to the restructuring of certain legal entities.
Other changes to our effective income tax rate includes discreterates for Fiscal 2023 as compared to Fiscal 2022 were attributable to the tax impact of foreign operations, which included the impacts of a higher jurisdictional mix of income in lower tax jurisdictions and higher tax benefits from foreign-derived intangible income offset by the impact of $4.9 billion related to similar intra-entity asset transfers. Thethe capitalization of research and development costs under the Tax Cuts and Jobs Act. Under the Tax Cuts and Jobs Act, which was enacted on December 22, 2017, research and development costs incurred for tax benefityears beginning after December 31, 2021 must be capitalized and amortized ratably over five or 15 years for each intra-entity asset transfer was recorded as a deferred tax asset inpurposes, depending on where the period of transaction and represents the book and tax basis difference on the transferred assets measured based on the applicable Irish statutory tax rate. We expect to be able to realize the deferred tax assets resulting from these intra-entity asset transfers. Our effective income tax rate for Fiscal 2020 also includes discrete tax benefits of $351 million related to stock-based compensation, $305 million related to an audit settlement, and $95 million related to Virtustream impairment charges.research activities were conducted.
Our effective income tax rate can fluctuate depending on the geographic distribution of our worldwide earnings, as our foreign earnings are generally taxed at lower rates than in the United States. The differences between our effective income tax raterates and the U.S. federal statutory rate of 21% principally result from the geographical distribution of income, differences between the book and tax treatment of certain items, and the discrete tax items describeddiscussed above. In certain jurisdictions, our tax rate is significantly less than the applicable statutory rate as a result of tax holidays. The majority of our foreign income that is subject to these tax holidays and lower tax rates is attributable to Singapore China, and Malaysia.China. A significant portion of these income tax benefits relates to a tax holiday that will be effective until January 31, 2029. Our other tax holidays will expire in whole or in part during Fiscal 20222030 through Fiscal 2030.2031. Many of these tax holidays and reduced tax rates may be extended when certain conditions are met or may be terminated early if certain conditions are not met.met or as a result of changes in tax legislation. As of January 29, 2021,February 3, 2023, we were not aware of any matters of noncompliance related toor enacted tax legislative changes affecting these tax holidays.
For further discussion regarding tax matters, including the status of income tax audits, see Note 11 of the Notes to the Consolidated Financial Statements included in this report.
Net Income
During Fiscal 2021, net income decreased 37% to $3.5 billion. The decrease in net income during Fiscal 2021 was primarily due to lower discrete tax benefits, which was partially offset by an increase in operating income.
Net income for Fiscal 2021 and Fiscal 2020 included amortization of intangible assets, the impact of purchase accounting, transaction-related expenses, stock-based compensation expense, other corporate expenses, fair value adjustments on equity investments, and discrete tax items. Excluding these costs and the related tax impacts, non-GAAP net income increased 11% to $6.8 billion during Fiscal 2021. The increase in non-GAAP net income during Fiscal 2021 was primarily attributable to an increase in non-GAAP operating income.
Non-controlling Interests
During Fiscal 2021, net income attributable to non-controlling interests was $255 million, and consisted of net income or loss attributable to our non-controlling interests in VMware, Inc. and Secureworks. During Fiscal 2020, net income attributable to non-controlling interests was $913 million, and consisted of net income or loss attributable to our non-controlling interests in VMware, Inc., Pivotal, and Secureworks. Pivotal was acquired by VMware, Inc. on December 30, 2019 and, as a result, we no longer have a separate non-controlling interest in Pivotal. The decrease in net income attributable to non-controlling interests in Fiscal 2021 was driven by lower discrete tax benefits for VMware, Inc. For more information about our non-controlling interests, see Note 13 of the Notes to the Consolidated Financial Statements included in this report.
See “Introduction – Business Trends and Challenges – Inflation Reduction Act” for a discussion of recent tax legislation.
Net Income Attributable to Dell Technologies Inc.from Continuing Operations
Net income from continuing operations was $2.4 billion and $4.9 billion for Fiscal 2023 and Fiscal 2022, respectively. The decrease was principally attributable to Dell Technologies Inc. representsan unfavorable change in interest and other, net, partially offset by an increase in operating income.
Non-GAAP net income was $5.7 billion and an adjustment$4.9 billion for non-controlling interests. Net income attributable to Dell Technologies Inc. was $3.3 billion in Fiscal 2021, compared to $4.6 billion in2023 and Fiscal 2020.2022, respectively. The decrease in net income attributable to Dell Technologies Inc. during Fiscal 2021increase was primarily attributable to an increase in non-GAAP operating income and a decrease in net income for the period.
Business Unit Results
Our reportable segments are based on the followingISG and CSG business units: ISG, CSG, and VMware.units. A description of our three business units is provided under “Introduction.” See Note 19 of the Notes to the Consolidated Financial Statements included in this report for a reconciliation of net revenue and operating income by reportable segment to consolidated net revenue and consolidated operating income (loss), respectively.
Infrastructure Solutions Group
The following table presents net revenue and operating income attributable to ISG for the periods indicated:
| | | | | | | | | | | | | | | | | | | | | | | | | | | | | | Fiscal Year Ended |
| | | Fiscal Year Ended | | | February 3, 2023 | | % Change | | January 28, 2022 | | % Change | | January 29, 2021 |
| | | | January 29, 2021 | | % Change | | January 31, 2020 | | % Change | | February 1, 2019 | | | | | | | | | | | |
| | | (in millions, except percentages) | | | (in millions, except percentages) |
| Net revenue: | Net revenue: | | | Net revenue: | | |
| Servers and networking | Servers and networking | | $ | 16,497 | | (4) | % | | $ | 17,127 | | (14) | % | | $ | 19,953 | Servers and networking | | $ | 20,398 | | 14 | % | | $ | 17,901 | | 8 | % | | $ | 16,592 |
| Storage | Storage | | 16,091 | | (4) | % | | 16,842 | | — | % | | 16,767 | Storage | | 17,958 | | 9 | % | | 16,465 | | — | % | | 16,410 |
| Total ISG net revenue | Total ISG net revenue | | $ | 32,588 | | (4) | % | | $ | 33,969 | | (7) | % | | $ | 36,720 | Total ISG net revenue | | $ | 38,356 | | 12 | % | | $ | 34,366 | | 4 | % | | $ | 33,002 |
| | Operating income: | Operating income: | | | Operating income: | | |
| ISG operating income | ISG operating income | | $ | 3,776 | | (6) | % | | $ | 4,001 | | (4) | % | | $ | 4,151 | ISG operating income | | $ | 5,045 | | 35 | % | | $ | 3,736 | | — | % | | $ | 3,753 |
| % of segment net revenue | % of segment net revenue | | 11.6 | % | | 11.8 | % | | 11.3 | % | % of segment net revenue | | 13.2 | % | | 10.9 | % | | 11.4 | % |
Net Revenue — During Fiscal 2021,2023, ISG net revenue decreased 4% due to decreases in sales of serversincreased 12%, driven by strength across both server and networking and storage. ISG net revenue decreased primarily due to a weaker demand environment, as customers shifted their investments toward remote work and business continuity solutions.storage offerings.
Revenue from the sales of servers and networking decreased 4%increased 14% during Fiscal 2021,2023, primarily driven by a declinean increase in demandaverage selling price of our PowerEdge servers dueserver offerings, the effect of which was partially offset by a decrease in units sold. The average selling price for our server offerings increased as a result of richer configurations and continued pricing discipline in response to the broader macroeconomic environment, including the effects of COVID-19.environment.
StorageDuring Fiscal 2023, storage revenue decreased 4% during Fiscal 2021 primarilyincreased 9% due to declines in demand for our core storage solutions offerings, partially offset by increased demand for converged and hyper-converged infrastructure solutions. We continue to make enhancements tocontinued strength across the majority of our storage solutions offerings and expect that these offerings, including our new PowerStore storage array released in May 2020, will drive long-term improvements in the business.offerings.
ISG customers are interested in new and innovative models that address how they consume our solutions. We offer options that include as-a-service,as-a-Service, subscription, utility, leases, and immediate pay models allwhich are designed to match customers’ consumption and financing preferences. Our multiyear agreements typically result in recurring revenue streams over the term of the arrangement. We expect that our flexible consumption models and as-a-serviceas-a-Service offerings through Dell APEX will further strengthen our customer relationships and provide a foundation for growth in recurring revenue.
From a geographical perspective, net revenue attributable to ISG decreasedincreased in all regionsthe Americas and EMEA and, to a lesser extent, in APJ during Fiscal 2021, driven by a weaker demand environment as a result of pervasive global COVID-19 disruptions.2023.
Operating Income — During Fiscal 2021,2023, ISG operating income as a percentage of net revenue decreased 20increased 230 basis points to 11.6%. The decline in ISG operating income percentage during Fiscal 2021 was driven by13.2% principally due to a decrease in ISG gross margin percentage from higher server configuration costs, increased freight costs, and lower benefits from component cost deflation. During Fiscal 2021, ISG component costs remained deflationary in the aggregate, but to a lesser degree relative to Fiscal 2020. The decline in ISG gross margin percentage in Fiscal 2021 was partially offset by a decrease in ISG operating expenses as a percentage of net revenue as we realized the benefit ofthat resulted from strong revenue growth coupled with disciplined cost reduction initiatives.management.
Client Solutions Group
The following table presents net revenue and operating income attributable to CSG for the periods indicated:
| | | | | | | | | | | | | | | | | | | | | | | | | | | | | | Fiscal Year Ended |
| | | Fiscal Year Ended | | | February 3, 2023 | | % Change | | January 28, 2022 | | % Change | | January 29, 2021 |
| | | January 29, 2021 | | % Change | | January 31, 2020 | | % Change | | February 1, 2019 | | | | | | | | | | | |
| | | | (in millions, except percentages) | | | (in millions, except percentages) |
| Net revenue: | Net revenue: | | | Net revenue: | | |
| Commercial | Commercial | | $ | 35,396 | | 3 | % | | $ | 34,277 | | 11 | % | | $ | 30,893 | Commercial | | $ | 45,556 | | — | % | | $ | 45,576 | | 29 | % | | $ | 35,423 |
| Consumer | Consumer | | 12,959 | | 12 | % | | 11,561 | | (6) | % | | 12,303 | Consumer | | 12,657 | | (20) | % | | 15,888 | | 23 | % | | 12,964 |
| Total CSG net revenue | Total CSG net revenue | | $ | 48,355 | | 5 | % | | $ | 45,838 | | 6 | % | | $ | 43,196 | Total CSG net revenue | | $ | 58,213 | | (5) | % | | $ | 61,464 | | 27 | % | | $ | 48,387 |
| | Operating income: | Operating income: | | | Operating income: | | |
| CSG operating income | CSG operating income | | $ | 3,352 | | 7 | % | | $ | 3,138 | | 60 | % | | $ | 1,960 | CSG operating income | | $ | 3,824 | | (12) | % | | $ | 4,365 | | 31 | % | | $ | 3,333 |
| % of segment net revenue | % of segment net revenue | | 6.9 | % | | 6.8 | % | | 4.5 | % | % of segment net revenue | | 6.6 | % | | 7.1 | % | | 6.9 | % |
Net Revenue — During Fiscal 2021,2023, CSG net revenue increaseddecreased 5%, driven by a decline in units sold as deteriorating macroeconomic conditions led to an overall decline in demand industry-wide. The impact of the decline in units sold was partially offset by an increase in the average selling prices of our offerings. We continue to take necessary actions to manage pricing while also balancing competitive pressures, profitability, and growth.
Consumer net revenue decreased 20% during Fiscal 2023, primarily due to a decrease in units sold, which was only partially offset by the effect of an increase in the average selling price of our consumer offerings.
During Fiscal 2023, commercial and consumer notebook sales, partiallynet revenue remained flat as the effect of an increase in the average selling price of our commercial offerings was entirely offset by a decrease in commercial desktop sales. Much of this demand was driven by the imperative for remote work and remote learning solutions, as business, government, and education customers sought to maintain productivity in the midst of COVID-19.units sold.
Commercial revenue increased 3% during Fiscal 2021 due to an increase in commercial notebooks sales, and particularly for entry-level commercial notebooks driven by customers in education and state and local government. The increases were partially offset by lower sales of commercial desktops.
Consumer revenue increased 12% during Fiscal 2021 due to increases inOur average selling prices across all consumer productfor our CSG offerings increased during Fiscal 2023 primarily as a result of a shift in mix towards our commercial offerings coupled with continued strong demand for consumer notebooksricher configurations and high-end and gaming systems.the impact of attached offerings.
From a geographical perspective, net revenue attributable to CSG increasedremained flat in the Americas and decreased in both EMEA and APJ during Fiscal 2021. These increases were partially offset by a decline in net revenue attributable to CSG in APJ during the period.2023.
Operating Income — During Fiscal 2021,2023, CSG operating income as a percentage of net revenue increased 10decreased 50 basis points to 6.9%. This increase was primarily attributable to a decrease in CSG operating expenses as a percentage of revenue, as we realized the benefit of cost reduction initiatives. This benefit was mostly offset by a decrease in CSG gross margin percentage driven by a shift in product mix to entry-level commercial notebooks and lower component cost deflation relative to pricing.
VMware
The following table presents net revenue and operating income attributable to VMware for the periods indicated. During Fiscal 2020, the Company reclassified Pivotal operating results from other businesses to the VMware reportable segment. Prior period results were recast to conform with the current period presentation.
| | | | | | | | | | | | | | | | | | | | | | | | | | | | | | | | | | | |
| | | Fiscal Year Ended |
| | | | | | | January 29, 2021 | | % Change | | January 31, 2020 | | % Change | | February 1, 2019 |
| | | | | | | (in millions, except percentages) |
| Net revenue: | | | | | | | | | | | | | | | |
| VMware net revenue | | | | | | | $ | 11,873 | | 9 | % | | $ | 10,905 | | 12 | % | | $ | 9,741 |
| | | | | | | | | | | | | | | |
| Operating income: | | | | | | | | | | | | | | | |
| VMware operating income | | | | | | | $ | 3,571 | | 16 | % | | $ | 3,081 | | 5 | % | | $ | 2,926 |
| % of segment net revenue | | | | | | | 30.1 | % | | | | 28.3 | % | | | | 30.0 | % |
Net Revenue— VMware net revenue, inclusive of Pivotal, primarily consists of revenue from the sale of software licenses under perpetual licenses and subscription and software-as-a-service (“SaaS”) offerings, as well as related software maintenance services, support, training, consulting services, and hosted services. VMware net revenue during Fiscal 2021 increased 9%6.6%, primarily due to growth in sales of subscriptions and SaaS offerings, as well as an increase in sales of software maintenance services. Growth in sales of subscriptions and SaaS offerings was primarily driven by increased demand for hybrid cloud offerings and digital workspaces. Software maintenance revenue benefited from maintenance contracts sold in previous periods.
From a geographical perspective, approximately half of VMware net revenue during Fiscal 2021 was generated by sales to customers in the United States. VMware net revenue for Fiscal 2021 increased in both the United States and internationally.
Operating Income— During Fiscal 2021, VMware operating income as a percentage of net revenue increased 180 basis points to 30.1%. The increase was primarily driven by a decrease in VMware selling, general, and administrative expenses as a percentage of net revenue, which increased as we benefited from decreased travel-related costs resulting from travel restrictions imposeda result of a decline in response toCSG net revenue that outpaced the COVID-19 pandemic. While the COVID-19 pandemic has not had a significant adverse financial impact on VMware operations to date, there continues to be significant uncertainty regarding the economic effectsimpacts of the COVID-19 pandemic and the extent to which it may have a negative impact on VMware’s sales and results of operations in Fiscal 2022.cost management measures.
OTHER BALANCE SHEET ITEMS
Accounts Receivable
We sell products and services directly to customers and through a variety of sales channels, including retail distribution. Our accounts receivable, net, was $12.8$12.5 billion and $12.5$12.9 billion as of January 29, 2021February 3, 2023 and January 31, 2020,28, 2022, respectively. We maintain an allowance for expected credit losses to cover receivables that may be deemed uncollectible. The allowance for expected credit losses is an estimate based on an analysis of historical loss experience, current receivables aging, and management’s assessment of current conditions and its reasonable and supportable expectation of future conditions, as well as specific identifiable customer accounts that are deemed at risk. Our analysis includes assumptions regarding the impact of COVID-19 and continued market volatility, which is highly uncertain and subject to significant judgment. Given this uncertainty, our allowance for expected credit losses in future periods may vary from our current estimates. As of January 29, 2021February 3, 2023 and January 31, 2020,28, 2022, the allowance for expected credit losses was $104$78 million and $94$90 million, respectively. Allowance for expected credit losses of trade receivables as of January 29, 2021 includes the impact of adoption of the new current expected credit losses (“CECL”) standard, which was adopted as of February 1, 2020 using the modified retrospective method. Based on our assessment, we believe that we are adequately reserved for expected credit losses. We will continue to monitorare monitoring the impact of current economic conditions and the aging of our accounts receivable on our expected losses and have not experienced deterioration in delinquency or loss rates. We will continue to take actions, where necessary, to reduce our exposure to credit losses.
Dell Financial Services and Financing Receivables
DFS supports Dell Technologies by offering and arrangingWe offer or arrange various financing options and services for our customers globally, including through captive financing operations in North America, Europe, Australia, and New Zealand.operations. DFS originates, collects, and services customer receivables primarily related to the purchase of our product, software, and service solutions. DFSWe further strengthens ourstrengthen customer relationships through its flexible consumption models, including utility, subscription, and as-a-Service models, which enable us to offer our customers the option to pay over time and, in certain cases, based on utilization, to provide them with financial flexibility to meet their changing technological requirements. We have historically seen an increasing interest in our various financing options during times of macroeconomic uncertainty. New financing originations were $8.9$9.7 billion,, $8.5 billion, and $7.3$8.9 billion for Fiscal 2021,2023, Fiscal 2020,2022, and Fiscal 2019,2021, respectively.
Pursuant to the current lease accounting standard effective February 2, 2019, new DFSOur leases are generally classified as sales-type leases direct financing leases, or operating leases. Amounts due from lessees under sales-type leases or direct financing leases are recorded as part of financing receivables, with interest income recognized over the contract term. On commencement of sales-type leases, we typically qualify forthe Company recognizes profit up-front, and amounts due from the customer under the lease contract are recognized as financing receivables. Interest income is recognized as net product revenue recognition. On originationsover the term of the lease. Upon origination of operating leases, we record equipment under operating leases, classified as property, plant, and equipment, andequipment. Over the contract term of an operating lease, we recognize rental revenue and depreciation expense, classified as cost of net revenue, over the contract term. Direct financing leases are immaterial. Leases that commenced prior to the effective date of the current lease accounting standard continue to be accounted for under previous lease accounting guidance.revenue.
As of January 29, 2021February 3, 2023 and January 31, 2020,28, 2022, our financing receivables, net were $10.5$10.9 billion and $10.6 billion, respectively$9.7 billion, respectively.. We maintain an allowance to cover expected financing receivable credit losses and evaluate credit loss expectations based on our total portfolio. Allowance for expected credit losses of financing receivables as of January 29, 2021 includes the impact of adoption of the CECL standard referred to above. Our analysis includes assumptions regarding the impact of COVID-19 and continued market volatility, which is highly uncertain and subject to significant judgment. Given this uncertainty, our allowance for expected credit losses in future periods may vary from our current estimates. For Fiscal 2021,2023, Fiscal 2020,2022, and Fiscal 2019,2021, the principal charge-off rate for our financing receivables portfolio was 0.5%, 0.6% and 0.7%, 1.0%, and 1.2%, respectively. The credit quality of our financing receivables has improved in recent years as the mix of high-quality commercial accounts in our portfolio has continued to increase. We continue to monitor broader economic indicators and their potential impact on future credit loss performance. We have an extensive process to manage our exposure to customer credit risk, including active management of credit lines and our collection activities. We also sell selected fixed-term financing receivables without recourse to unrelated third parties on a periodic basis, primarily to manage certain concentrations of customer credit exposure. Based on our assessment of the customer financing receivables, we believe that we are adequately reserved.
We retain a residual interest in equipment leased under our lease programs. As of January 29, 2021February 3, 2023 and January 31, 2020,28, 2022, the residual interest recorded as part of financing receivables was $424$142 million and $582$217 million, respectively. The decline in residual interest was principally attributable to a corresponding increase in originations of operating leases. The amount of the residual interest is established at the inception of the lease based upon estimates of the value of the equipment at the end of the lease term using historical studies, industry data, and future value-at-risk demand valuation methods. On a quarterly basis, we assess the carrying amount of our recorded residual values for impairment.expected losses. Generally, expected losses as a result of residual value risk on equipment under lease isare not considered to be significant primarily because of the existence of a secondary market with respect to the equipment. The
Further, the lease agreement also clearly defines applicable return conditions and remedies for non-compliance to ensure that the leased equipment will be in good operating condition upon return. Model changes and updates, as well as market strength and product acceptance, are monitored and adjustments are made to residual values in accordance with the significance of any such changes. To mitigate our exposure, we work closely with customers and dealers to manage the sale of returned assets. No material impairmentexpected losses were recorded related to residual assets during Fiscal 20212023 and Fiscal 2020.2022.
As of January 29, 2021February 3, 2023 and January 31, 2020,28, 2022, equipment under operating leases, net was $1.3$2.2 billion and $0.8$1.7 billion, respectively. Based on triggering events, weWe assess the carrying amount of the equipment under operating leases recorded for impairment.impairment whenever events or circumstances may indicate that an impairment has occurred. No material impairment losses were recorded related to such equipment during Fiscal 20212023, Fiscal 2022, and Fiscal 2020.2021.
DFS offerings are initially funded through cash on hand at the time of origination, most of which is subsequently replaced with third-partyasset-backed financing. For DFS offerings which qualify as sales-type leases, the initial funding of financing receivables is reflected as an impact to cash flows from operations, and is largely subsequently offset by cash proceeds from financing.
For DFS operating leases, which have increased under the current lease accounting standard, the initial funding is classified as a capital expenditure and reflected as an impact to cash flows used in investing activities.
See Note 46 of the Notes to the Consolidated Financial Statements included in this report for additional information about our financing receivables and the associated allowances, and equipment under operating leases.
Off-Balance Sheet Arrangements
As of January 29, 2021, we had no off-balance sheet arrangements that have or are reasonably likely to have a current or future material effect on our financial condition or results of operations.
LIQUIDITY, CASH REQUIREMENTS, AND MARKET CONDITIONS LIQUIDITY, CAPITAL COMMITMENTS, AND CONTRACTUAL CASH OBLIGATIONS
Market Conditions
We regularly monitor economic conditions and associated impacts on the financial markets and our business. We consistently evaluate the financial health of our supplier base, carefully manage customer credit, diversify counterparty risk, and monitor the concentration risk of our cash and cash equivalents balances globally. We routinely monitor our financial exposure to borrowers and counterparties.
We monitor credit risk associated with our financial counterparties using various market credit risk indicators such as credit ratings issued by nationally recognized credit rating agencies and changes in market credit default swap levels. We perform periodic evaluations of our positions with these counterparties and may limit exposure to any one counterparty in accordance with our policies. We monitor and manage these activities depending on current and expected market developments.
We use derivative instruments to hedge certain foreign currency exposures. We use forward contracts and purchased options designated as cash flow hedges to protect against the foreign currency exchange rate risks inherent in our forecasted transactions denominated in currencies other than the U.S. dollar. In addition, we primarily use forward contracts and may use purchased options to hedge monetary assets and liabilities denominated in a foreign currency. See Note 7 of the Notes to the Consolidated Financial Statements included in this report for more information about our use of derivative instruments.
We are exposed to interest rate risk related to our variable-rate debt portfolio. In the normal course of business, we follow established policies and procedures to manage this risk, including monitoring of our asset and liability mix. As a result, we do not anticipate any material losses from interest rate risk.
The impact of any credit adjustments related to our use of counterparties on our Consolidated Financial Statements included in this report has been immaterial.
Liquidity and Capital Resources
To support our ongoing business operations, weWe rely on operating cash flows, which are impacted by trends in the demand environment, as our primary source of liquidity.liquidity for our ongoing business operations. We monitor the efficiency of our balance sheet to ensure that we have adequate liquidity to support our business and strategic initiatives. In addition to internally generated cash, we have access to otherother capital sources to finance our strategic initiatives and fund growth in our financing operations. Our strategy is to deploy capital from any potential source, whether internally generated cash or debt, depending on the adequacy and availability of that source of capital and whether it can be accessed in a cost-effective manner.
The following table presents our cash and cash equivalents as well as our available borrowings as of the dates indicated:
| | | | | | | | | | | |
| January 29, 2021 | | January 31, 2020 |
| (in millions) |
| Cash and cash equivalents, and available borrowings: | | | |
| Cash and cash equivalents (a) | $ | 14,201 | | | $ | 9,302 | |
| Remaining available borrowings under revolving credit facilities (b) | 5,467 | | | 5,972 | |
| Total cash, cash equivalents, and available borrowings | $ | 19,668 | | | $ | 15,274 | |
____________________
(a) Of the $14.2 billion of cash and cash equivalents as of January 29, 2021, $4.7 billion was held by VMware, Inc.
(b) Of the $5.5 billion of remaining available borrowings under revolving credit facilities, $1.0 billion was attributable to the VMware Revolving Credit Facility.
Our revolving credit facilities as of January 29, 2021 include the Revolving Credit Facility. The Revolving Credit Facility has a maximum capacity of $4.5 billion, and available borrowings under this facility are reduced by draws on the facility and outstanding letters of credit. As of January 29, 2021, there were no borrowings outstanding under the facility and remaining available borrowings totaled approximately $4.5 billion. We may regularly use our available borrowings from our Revolving Credit Facility on a short-term basis for general corporate purposes.
The VMware Revolving Credit Facility has a maximum capacity of $1.0 billion. As of January 29, 2021, $1.0 billion was available under the VMware Revolving Credit Facility. None of the net proceeds of borrowings under the VMware Revolving Credit Facility will be made available to support the operations or satisfy any corporate purposes of Dell Technologies, other than the operations and corporate purposes of VMware, Inc. and VMware, Inc.’s subsidiaries.
See Note 6 of the Notes to the Consolidated Financial Statements included in this report for additional information about each of the foregoing revolving credit facilities.
We believe that our current cash and cash equivalents, together with cash that will be provided by future operations and borrowings expected to be available under our revolving credit facilities,facility and commercial paper program, will be sufficient over at least the next twelve months and for the foreseeable future thereafterto fundmeet our material cash requirements, including funding of our operations, debt service requirementsdebt-related payments, capital expenditures, and maturities,other corporate needs. Our cash and cash equivalent balances will be impacted in the near-term as a result of certain non-recurring cash outflows, including payment of the Class V transaction litigation settlement.
As part of our overall capital expenditures,allocation strategy, we intend to drive growth while maintaining our investment grade rating and focusing on returning capital to our stockholders through both share repurchase programs and dividend payments.
The following table presents our cash and cash equivalents as well as our available borrowings as of the dates indicated:
| | | | | | | | | | | |
| February 3, 2023 | | January 28, 2022 |
| | | |
| (in millions) |
| Cash and cash equivalents, and available borrowings: | | | |
| Cash and cash equivalents | $ | 8,607 | | | $ | 9,477 | |
| Remaining available borrowings under 2021 Revolving Credit Facility | 5,999 | | | 4,969 | |
| Total cash, cash equivalents, and available borrowings | $ | 14,606 | | | $ | 14,446 | |
During Fiscal 2023, cash and cash equivalents decreased by $0.9 billion, primarily as a result of the return of capital to our stockholders through share repurchases and otherdividend payments, and capital expenditures, partially offset by cash flows from operations and net cash proceeds from the issuance of senior notes.
As of February 3, 2023, our 2021 Revolving Credit Facility had a maximum capacity of $6.0 billion. Available borrowings under this facility are reduced by draws on the facility and outstanding letters of credit. As of February 3, 2023, there were no borrowings outstanding under the facility and remaining available borrowings totaled approximately $6.0 billion. The 2021 Revolving Credit Facility also acts as a backstop to provide liquidity support for our commercial paper program.
During Fiscal 2023, we established a commercial paper program under which we may issue unsecured notes in a maximum aggregate face amount of $5.0 billion outstanding at any time, with maturities up to 397 days from the date of issue. As of February 3, 2023, we had no outstanding borrowings under the program.
We may regularly use our available borrowings from the 2021 Revolving Credit Facility and issuances under the commercial paper program on a short-term basis for general corporate needs.purposes. See Note 8 of the Notes to the Consolidated Financial Statements included in this report for additional information about our debt.
During Fiscal 2023, we entered into a factoring arrangement with a third-party financial institution to sell certain high-quality trade accounts receivable on a non-recourse basis. We may elect to factor trade accounts receivable from time to time as part of our overall liquidity and working capital management strategy.
Debt
The following table presents our outstanding debt as of the dates indicated:
| | | | | | | | | | | | | | | | | | February 3, 2023 | | Change | | January 28, 2022 |
| | January 29, 2021 | | Increase (Decrease) | | January 31, 2020 | | | | | | |
| | (in millions) | | (in millions) |
| Core debt | Core debt | | Core debt | |
| Senior Secured Credit Facilities and First Lien Notes | $ | 24,777 | | | $ | (4,887) | | | $ | 29,664 | | |
| Unsecured Notes and Debentures | 1,352 | | | — | | | 1,352 | | |
| Senior Notes | Senior Notes | 2,700 | | | — | | | 2,700 | | Senior Notes | $ | 18,300 | | | $ | 2,000 | | | $ | 16,300 | |
| EMC Notes | 1,000 | | | (600) | | | 1,600 | | |
| Legacy Notes and Debentures | | Legacy Notes and Debentures | 952 | | | — | | | 952 | |
| | DFS allocated debt | DFS allocated debt | (666) | | | 829 | | | (1,495) | | DFS allocated debt | (1,196) | | | (63) | | | (1,133) | |
| Total core debt | Total core debt | 29,163 | | | (4,658) | | | 33,821 | | Total core debt | 18,056 | | | 1,937 | | | 16,119 | |
| DFS related debt | DFS related debt | | DFS related debt | |
| DFS debt | DFS debt | 9,666 | | | 1,901 | | | 7,765 | | DFS debt | 10,290 | | | 644 | | | 9,646 | |
| DFS allocated debt | DFS allocated debt | 666 | | | (829) | | | 1,495 | | DFS allocated debt | 1,196 | | | 63 | | | 1,133 | |
| Total DFS related debt | Total DFS related debt | 10,332 | | | 1,072 | | | 9,260 | | Total DFS related debt | 11,486 | | | 707 | | | 10,779 | |
| Margin Loan Facility and other | 4,235 | | | 151 | | | 4,084 | | |
| Debt of public subsidiary | | |
| VMware Notes | 4,750 | | | 750 | | | 4,000 | | |
| VMware Term Loan Facility | — | | | (1,500) | | | 1,500 | | |
| Total public subsidiary debt | 4,750 | | | (750) | | | 5,500 | | |
| Other | | Other | 325 | | | (12) | | | 337 | |
| Total debt, principal amount | Total debt, principal amount | 48,480 | | | (4,185) | | | 52,665 | | Total debt, principal amount | 29,867 | | | 2,632 | | | 27,235 | |
| Carrying value adjustments | Carrying value adjustments | (496) | | | 113 | | | (609) | | Carrying value adjustments | (279) | | | 2 | | | (281) | |
| Total debt, carrying value | Total debt, carrying value | $ | 47,984 | | | $ | (4,072) | | | $ | 52,056 | | Total debt, carrying value | $ | 29,588 | | | $ | 2,634 | | | $ | 26,954 | |
During Fiscal 2021, theThe outstanding principal amount of our debt decreased by $4.2increased $2.6 billion from January 28, 2022 to $48.5$29.9 billion as of January 29, 2021,February 3, 2023, driven primarily driven by the issuance of $2.0 billion principal amount of senior notes and, to a lesser extent, net repayments of core debt and VMware, Inc. debt, partially offset by a net increase in DFS debt.activity.
We define core debt as the total principal amount of our debt, less DFS related debt our Margin Loan Facility and other debt, and public subsidiary debt. Our core debt was $29.2$18.1 billion and $33.8$16.1 billion as of January 29, 2021February 3, 2023 and January 31, 2020,28, 2022, respectively. The decreaseincrease in our core debt during Fiscal 20212023 was primarily driven by the issuance of $2.0 billion principal repayments. Proceedsamount of $2.082 billion fromsenior notes. We intend to utilize the saleproceeds of RSA Security in Fiscal 2021 were usedsuch senior notes to pay down corerepay the 5.45% senior notes due June 2023 and to utilize the remaining proceeds for general corporate purposes, including repayment of other debt. See Note 68 of the Notes to the Consolidated Financial Statements included in this report for moreadditional information about our debt.
We will continue to prioritize debt paydown as part of our overall capital allocation strategy, including $1.5 billion of scheduled maturities due in Fiscal 2022. Subsequent to January 29, 2021, we repaid $400 million principal amount of our 4.625% Unsecured Notes due April 2021 and $600 million principal amount of our 5.875% Senior Notes due June 2021.
During Fiscal 2021, we issued an additional $1.9 billion, net, in DFS debt to support the expansion of its financing receivables portfolio. DFS related debt primarily represents debt from our securitization and structured financing programs. The majority of DFS debt represents borrowings under securitization programs and structured financing programs, for which ourOur risk of loss under these programs is limited to transferred lease and loan payments and associated equipment, and under whichas the credit holders have no recourse to Dell Technologies.
To fund expansion of the DFS business, we balance the use of the securitization and structured financing programs with other sources of liquidity. We approximate the amount of our debt used to fund the DFS business by applying a 7:1 debt to equitydebt-to-equity ratio to the sum of our financing receivables balance and equipment under our DFS operating leases, net. The debt to equitydebt-to-equity ratio is based on the underlying credit quality of the assets. See Note 4 of the Notes to the Consolidated Financial Statements included in this report for more information about our DFS debt.
As of January 29, 2021 and January 31, 2020, margin loan and other debt primarily consisted of the $4.0 billion Margin Loan Facility.
Public subsidiary debt represents VMware, Inc. indebtedness. The decrease in debt of public subsidiary during Fiscal 2021 was driven by principal repayments by VMware, Inc. VMware, Inc. and its respective subsidiaries are unrestricted subsidiaries for purposes of the core debt of Dell Technologies. Neither Dell Technologies nor any of its subsidiaries, other than VMware, Inc., is obligated to make payment on the VMware Notes. None of the net proceeds of the VMware Notes are made available to support the operations or satisfy any corporate purposes of Dell Technologies, other than the operations and corporate purposes of VMware, Inc. and its subsidiaries. See Note 6 of the Notes to the Consolidated Financial Statements included in this report for moreadditional information about VMware, Inc.our DFS debt.
We have made steady progress in paying down core debt. We believe we will continue to be able to make our debt principal and interest payments, including the short-term maturities, from existing and expected sources of cash, primarily from operating cash flows. Cash used for debt principal and interest payments may include short-term borrowings under our commercial paper program, our revolving credit facilities. We will continue to focus on paying down core debt.facility, or other borrowings. Under our variable-rate debt, we could experience variations in our future interest expense from potential fluctuations in applicable reference rates, or from possible fluctuations in the level of DFS debt required to meet future demand for customer financing.
We orhave made steady progress in paying down debt and we will continue to pursue deleveraging over the long-term as an important component of our affiliates or their related persons, atoverall capital allocation strategy. At our or their sole discretion, we may purchase, redeem, prepay, refinance, or otherwise retire any amount of our outstanding indebtedness under the terms of such indebtedness at any time and from time to time, in open market or negotiated transactions with the holders of such indebtedness or otherwise, as we consider appropriate in light of market conditions exist.and other relevant factors.
Cash Flows
The following table presents a summary of our Consolidated Statements of Cash Flows for the periods indicated:
| | | | | | | | | | | | | | | | | | Fiscal Year Ended |
| | Fiscal Year Ended | | February 3, 2023 | | January 28, 2022 | | January 29, 2021 |
| | | January 29, 2021 | | January 31, 2020 | | February 1, 2019 | | | | | | |
| | (in millions) | | (in millions) |
| Net change in cash from: | Net change in cash from: | | Net change in cash from: | |
| Operating activities | Operating activities | $ | 11,407 | | | $ | 9,291 | | | $ | 6,991 | | Operating activities | $ | 3,565 | | | $ | 10,307 | | | $ | 11,407 | |
| Investing activities | Investing activities | (460) | | | (4,686) | | | 3,389 | | Investing activities | (3,024) | | | 1,306 | | | (460) | |
| Financing activities | Financing activities | (5,950) | | | (4,604) | | | (14,329) | | Financing activities | (1,625) | | | (16,609) | | | (5,950) | |
| Effect of exchange rate changes on cash, cash equivalents, and restricted cash | Effect of exchange rate changes on cash, cash equivalents, and restricted cash | 36 | | | (90) | | | (189) | | Effect of exchange rate changes on cash, cash equivalents, and restricted cash | (104) | | | (106) | | | 36 | |
| Change in cash, cash equivalents, and restricted cash | Change in cash, cash equivalents, and restricted cash | $ | 5,033 | | | $ | (89) | | | $ | (4,138) | | Change in cash, cash equivalents, and restricted cash | $ | (1,188) | | | $ | (5,102) | | | $ | 5,033 | |
Cash flows for both Fiscal 2022 and Fiscal 2021 are inclusive of cash flows attributable to VMware, Inc. Effective November 1, 2021, as a result of the VMware Spin-off, cash flows ceased to include cash flows attributable to VMware, Inc. See “Introduction” and Note 1 and Note 3 of the Notes to the Consolidated Financial Statements included in this report for additional information regarding the VMware Spin-off.
Operating Activities — Cash provided by operating activities was $11.4 billion and $9.3$3.6 billion during Fiscal 2021 and2023 compared to $10.3 billion during Fiscal 2020, respectively. Our record cash flow from operations in2022. Cash provided by operating activities for Fiscal 2021 was due2022 included $3.2 billion attributable to strong profitability, revenue growth, and working capital dynamics. COVID-19 impacts to working capital normalized by the end of Fiscal 2021.VMware, Inc.
The decline in cash provided by operating activities was primarily attributable to unfavorable working capital dynamics as compared to Fiscal 2022. Working capital was primarily impacted by a shift in mix of the business, the timing of purchases and payments to vendors during a declining demand environment, and linearity of sales during the fourth quarter of Fiscal 2023.
Investing Activities — Investing activities primarily consist of cash used to fund capital expenditures for property, plant, and equipment inclusive of equipment under DFS operating leases and equipment used to support our as-a-Service offerings (collectively “revenue generating assets”). Additional activities include capitalized software development costs, acquisitions and divestitures, strategic investments, and the maturities, sales, and purchases of investments. During Fiscal 2023, cash used in investing activities was $3.0 billion and was primarily applied to capital expenditures.
Cash provided by investing activities was $1.3 billion during Fiscal 2022, primarily driven by net cash proceeds related to the divestiture of Boomi, which was partially offset by cash used for capital expenditures.
Financing Activities — Financing activities primarily consist of the proceeds and repayments of debt and return of capital to our stockholders. Cash used in financing activities was $1.6 billion during Fiscal 2023 and primarily consisted of repurchases of common stock, inclusive of payments to settle employee tax withholding on stock-based compensation, and the payment of quarterly dividends. The effects of these activities were partially offset by net cash proceeds from debt issuances, primarily related to the issuance of senior notes. See Note 8 of the Notes to the Consolidated Financial Statements included in this report for additional information regarding our debt.
Cash used in financing activities was $16.6 billion during Fiscal 2022 and primarily consisted of debt repayments and associated debt extinguishment fees, as well as cash transferred to VMware in connection with the VMware Spin-off. The effect of these activities was partially offset by cash proceeds from the issuance of senior notes by Dell Technologies and VMware.
DFS Cash Flow Impacts— DFS offerings are initially funded through cash on hand at the time of origination, most of which is subsequently replaced with third-partyasset-backed financing. For DFS offerings that qualify as sales-type leases, the initial funding of financing receivables is reflected as an impact to cash flows from operations and is largely subsequently offset by cash proceeds from financing. For
DFS operating leases, which have increased under the current lease accounting standard, the initial funding is classified as a capital expenditure and reflected as cash flows used in investing activities. DFS new financing originations were $8.9$9.7 billion, $8.5 billion, and $8.5$8.9 billion during Fiscal 20212023, Fiscal 2022, and Fiscal 2020,2021, respectively. As of January 29, 2021,February 3, 2023, DFS had $10.5$10.9 billion of total net financing receivables and $1.3$2.2 billion of equipment under DFS operating leases, net.
Investing Activities — Investing activities primarily consistTable of cash used to fund capital expenditures for property, plant, and equipment, which includes equipment under DFS operating leases, capitalized software development costs, strategic investments, acquisitions of businesses, and the maturities, sales, and purchases of investments. During Fiscal 2021, cash used in investing activities was $460 million and was primarily driven by capital expenditures and cash used in acquisition of businesses, largely offset by net cash proceeds from the divestiture of RSA Security. In comparison, cash used in investing activities was $4.7 billion during Fiscal 2020 and was primarily driven by capital expenditures and acquisitions of businesses.ContentsFinancing Activities — Financing activities primarily consist of the proceeds and repayments of debt, cash used to repurchase common stock, and proceeds from the issuance of common stock. Cash used in financing activities of $6.0 billion during Fiscal 2021 primarily consisted of debt repayments and repurchases of common stock by our public subsidiaries, partially offset by cash proceeds from the issuances of multiple series of First Lien Notes and VMware Notes. In comparison, cash used in financing activities of $4.6 billion during Fiscal 2020 primarily consisted of net repayments of debt and repurchases of common stock by our public subsidiaries, primarily related to VMware Inc.’s acquisition of Pivotal.
Capital Commitments
Capital Expenditures — DuringWe spent $3.0 billion and $2.8 billion during Fiscal 20212023 and Fiscal 2020, we spent $1.8 billion and $2.2 billion,2022, respectively, on property, plant, and equipment. Theseequipment and capitalized software development costs. Of total expenditures were incurred in connection with our global expansion effortsduring Fiscal 2023 and infrastructure investments made to support future growth, and theFiscal 2022, funding of equipment under DFS operating leases. During Fiscal 2021 and Fiscal 2020, funding of equipment under DFS operating leases was $0.7revenue generating assets totaled $1.5 billion and $0.9$1.3 billion, respectively. Product demand, product mix, and the use of contract manufacturers, as well asand ongoing investments in operating and information technology infrastructure influence the level and prioritization of our capital expenditures. Aggregate capital expenditures for Fiscal 20222024 are currently expected to total between $2.4$2.9 billion and $2.6$3.1 billion, of which approximately $0.8$1.8 billion isare expected for equipment under DFS operating leases.to relate to revenue generating assets.
Repurchases of Common Stock
Dell TechnologiesRepurchases of Common Stock Repurchases by Dell Technologies
On February 24, 2020,— Effective as of September 23, 2021, our boardBoard of directorsDirectors approved a stock repurchase program with no fixed expiration date under which we are authorized to repurchase up to $1.0$5 billion of shares of our Class C Common Stock over a 24-month period expiring on February 28, 2022, of which approximately $760 million remained available as of January 29, 2021.Stock. During Fiscal 2021,2023, we repurchased approximately 662 million shares of Class C Common Stock under this program for a total purchase price of approximately $240 million. During$2.8 billion.
Dividend Payments
Dividend Payments— On February 24, 2022, we announced that our Board of Directors adopted a dividend policy providing for our payment of quarterly cash dividends on our common stock at a rate of $0.33 per share per fiscal quarter beginning in the first quarter of Fiscal 2021, we suspended activity under our stock repurchase program.2023. During Fiscal 2020, Dell Technologies Common Stock repurchases were immaterial.2023, the Company paid the following dividends:
VMware, Inc. Class A Common Stock Repurchases by VMware, Inc. | | | | | | | | | | | | | | | | | | | | | | | | | | |
| Declaration Date | | Record Date | | Payment Date | | Dividend per Share | | Amount (in millions) |
| February 24, 2022 | | April 20, 2022 | | April 29, 2022 | | $ | 0.33 | | | $ | 248 | |
| June 7, 2022 | | July 20, 2022 | | July 29, 2022 | | $ | 0.33 | | | $ | 242 | |
| September 6, 2022 | | October 19, 2022 | | October 28, 2022 | | $ | 0.33 | | | $ | 238 | |
| December 6, 2022 | | January 25, 2023 | | February 3, 2023 | | $ | 0.33 | | | $ | 236 | |
On May 29, 2019, VMware, Inc.’s boardMarch 2, 2023, we announced that the Board of directors authorizedDirectors approved a 12% increase in the repurchasequarterly dividend rate to a rate of up to $1.5 billion$0.37 per share per fiscal quarter beginning in the first quarter of VMware, Inc.’s Class A common stock through January 29, 2021. On July 15, 2020, VMware, Inc.’s board of directors extended authorization of VMware, Inc.’s existing repurchase program and authorized the repurchase of up to an additional $1.0 billion of VMware, Inc.’s Class A common stock through January 28, 2022. As of January 29, 2021, the cumulative authorized amount remaining for stock repurchases was $1.1 billion.Fiscal 2024.
During Fiscal 2021, VMware, Inc. repurchased 6.9 million shares of its Class A common stock in the open market for approximately $945 million. During Fiscal 2020, VMware, Inc. repurchased 7.7 million shares of its Class A common stock in the open market for approximately $1.3 billion, of which approximately $0.2 billion impacted Dell Technologies’ accumulated deficit balance as of January 31, 2020 as a result of the full depletion of VMware, Inc.’s additional paid-in capital balance in the same period.
Contractual Cash Obligations
The following table presents a summary of our contractual cash obligations as of January 29, 2021:February 3, 2023:
| | | Payments Due by Fiscal Year | | Payments Due by Fiscal Year |
| | Total | | 2022 | | 2023-2024 | | 2025-2026 | | Thereafter | | Total | | 2024 | | 2025-2026 | | 2027-2028 | | Thereafter |
| | (in millions) | | (in millions) |
| Contractual cash obligations: | Contractual cash obligations: | | Contractual cash obligations: | |
| Principal payments on long-term debt: | | |
| Principal payments on debt: | | Principal payments on debt: | |
Core debt | Core debt | $ | 29,829 | | | $ | 1,475 | | | $ | 7,264 | | | $ | 7,388 | | | $ | 13,702 | | Core debt | $ | 19,252 | | | $ | 1,000 | | | $ | 2,000 | | | $ | 6,750 | | | $ | 9,502 | |
DFS debt | DFS debt | 9,666 | | | 4,888 | | | 4,061 | | | 717 | | | — | | DFS debt | 10,290 | | | 5,400 | | | 3,747 | | | 1,143 | | | — | |
| Margin Loan Facility and other | 4,235 | | | 11 | | | 4,184 | | | 16 | | | 24 | | |
| VMware Notes | 4,750 | | | — | | | 1,500 | | | 750 | | | 2,500 | | |
| Total principal payments on long-term debt | 48,480 | | | 6,374 | | | 17,009 | | | 8,871 | | | 16,226 | | |
| Other | | Other | 325 | | | 177 | | | 140 | | | 8 | | | — | |
| Total principal payments on debt | | Total principal payments on debt | 29,867 | | | 6,577 | | | 5,887 | | | 7,901 | | | 9,502 | |
| Interest | Interest | 13,966 | | | 1,911 | | | 3,256 | | | 2,368 | | | 6,431 | | Interest | 9,173 | | | 1,250 | | | 2,014 | | | 1,345 | | | 4,564 | |
| Purchase obligations | Purchase obligations | 5,878 | | | 4,885 | | | 922 | | | 52 | | | 19 | | Purchase obligations | 4,383 | | | 3,460 | | | 617 | | | 298 | | | 8 | |
| Operating leases | Operating leases | 2,652 | | | 472 | | | 769 | | | 436 | | | 975 | | Operating leases | 966 | | | 260 | | | 362 | | | 206 | | | 138 | |
| Tax obligations | Tax obligations | 164 | | | 19 | | | 84 | | | 61 | | | — | | Tax obligations | 144 | | | 36 | | | 108 | | | — | | | — | |
| Contractual cash obligations | Contractual cash obligations | $ | 71,140 | | | $ | 13,661 | | | $ | 22,040 | | | $ | 11,788 | | | $ | 23,651 | | Contractual cash obligations | $ | 44,533 | | | $ | 11,583 | | | $ | 8,988 | | | $ | 9,750 | | | $ | 14,212 | |
____________________
(a) Contractual cash obligations associated with core debt exclude DFS allocated debt.
(b) DFS debt primarily represents debt from our securitization and structured financing programs.
Principal Payments on Long-Term Debt — Our expected principal cash payments on borrowings are exclusive of discounts and premiums. We have outstanding long-term notes with varying maturities. For additional information about our debt, see Note 6 and Note 8 of the Notes to the Consolidated Financial Statements included in this report.
Interest — Of the total cash obligations for interest presented in the table above, the amounts related to our DFS debt were expected to be $105$185 million in Fiscal 2022, $482024, $89 million in Fiscal 2023-2024,2025-2026, and $1 million in Fiscal 2025-2026.2027-2028. See Note 6 and Note 8 of the Notes to the Consolidated Financial Statements included in this report for further discussion of our debt and related interest expense.
Purchase Obligations — Purchase obligations are defined as contractual obligations to purchase goods or services that are enforceable and legally binding on us. These obligations specify all significant terms, including fixed or minimum quantities to be purchased; fixed, minimum, or variable price provisions; and the approximate timing of the transaction. Purchase obligations do not include contracts that may be canceled without penalty.
We utilize several suppliers to manufacture sub-assemblies for our products. Our efficient supply chain management allows us to enter into flexible and mutually beneficial purchase arrangements with our suppliers in order to minimize inventory risk. Consistent with industry practice, we acquire raw materials or other goods and services, including product components, by issuing to suppliers authorizations to purchase based on our projected demand and manufacturing needs. These purchase orders are typically fulfilled within 30 days and are entered into during the ordinary course of business in order to establish best pricing and continuity of supply for our production. Purchase orders are not included in purchase obligations, as they typically represent our authorization to purchase rather than binding purchase obligations.
Operating Leases — We lease property and equipment, manufacturing facilities, and office space under non-cancelable leases. Certain of these leases obligate us to pay taxes, maintenance, and repair costs. See Note 57 of the Notes to the Consolidated Financial Statements included in this report for additional information about our leasing transactions in which we are the lessee.
Tax Obligations — Tax obligations represent a one-time mandatory deemed repatriation tax on undistributed earnings of foreign subsidiaries. Excluded from the table above are $1.4$1.3 billion in additional liabilities associated with uncertain tax positions as of January 29, 2021.February 3, 2023. We are unable to reliably estimate the expected payment dates for any liabilities for uncertain tax positions. See Note 1113 of the Notes to the Consolidated Financial Statements included in this report for more information on these tax matters.
Market Conditions
We regularly monitor economic conditions and associated impacts on the financial markets and our business. We consistently evaluate the financial health of our supplier base, carefully manage customer credit, diversify counterparty risk, and monitor the concentration risk of our cash and cash equivalents balances globally. We routinely monitor our financial exposure to borrowers and counterparties.
We monitor credit risk associated with our financial counterparties using various market credit risk indicators such as credit ratings issued by nationally recognized credit rating agencies and changes in market credit default swap levels. We perform periodic evaluations of our positions with these counterparties and may limit exposure to any one counterparty in accordance with our policies. We monitor and manage these activities depending on current and expected market developments.
We use derivative instruments to hedge certain foreign currency exposures. We use forward contracts and purchased options designated as cash flow hedges to protect against the foreign currency exchange rate risks inherent in our forecasted transactions denominated in currencies other than the U.S. dollar. In addition, we primarily use forward contracts and may use purchased options to hedge monetary assets and liabilities denominated in a foreign currency. See Note 9 of the Notes to the Consolidated Financial Statements included in this report for additional information about our use of derivative instruments.
We are exposed to interest rate risk related to our variable-rate debt portfolio. In the normal course of business we follow established policies and procedures to manage this risk, including monitoring of our asset and liability mix and the use of derivative instruments. As a result, we do not anticipate any material losses from interest rate risk.
Summarized Guarantor Financial Information
As discussed in Note 8 of the Notes to the Consolidated Financial Statements included in this report, Dell International L.L.C. and EMC Corporation (the “Issuers”), both of which are wholly-owned subsidiaries of Dell Technologies Inc., completed private offerings of multiple series of senior secured notes issued on June 1, 2016, March 20, 2019, and April 9, 2020 (the “Senior Notes”). In June 2021, the Issuers completed an exchange offer and issued $18.4 billion aggregate principal amount of registered senior notes under the Securities Act of 1933 in exchange for the same principal amount and substantially identical terms of the Senior Notes. The aggregate principal amount of unregistered Senior Notes remaining outstanding following the settlement of the exchange offer was approximately $0.1 billion. During Fiscal 2022, the tangible and intangible assets of the Issuers and guarantors that secured obligations under the Senior Notes were released as collateral. As a result, the Senior Notes became fully unsecured. In addition, all guarantees of the Senior Notes by subsidiaries of Dell Inc. were released.
On January 24, 2023, the Issuers completed a public offering of unsecured senior notes (together with the Senior Notes, the “Registered Senior Notes”) in the aggregate principal amount of $2.0 billion. The unsecured senior notes were sold pursuant to a shelf registration statement.
Guarantees — The Registered Senior Notes are guaranteed on a joint and several unsecured basis by Dell Technologies Inc. and its wholly-owned subsidiaries, Denali Intermediate, Inc. and Dell Inc. (collectively, the “Guarantors”).
Basis of Preparation of the Summarized Financial Information — The tables below are summarized financial information provided in conformity with Rule 13-01 of the SEC’s Regulation S-X. The summarized financial information of the Issuers and Guarantors (collectively, the “Obligor Group”) is presented on a combined basis, excluding intercompany balances and transactions between entities in the Obligor Group. The Obligor Group’s amounts due from, amounts due to, and transactions with Non-Obligor Subsidiaries and VMware, Inc. and its consolidated subsidiaries (the “Related Party”) have been presented separately. The Obligor Group’s investment balances in Non-Obligor Subsidiaries have been excluded.
The following table presents summarized results of operations information for the Obligor Group for the period indicated:
| | | | | |
| Fiscal Year Ended |
| February 3, 2023 |
| (in millions) |
| Net revenue (a) | $ | 10,327 | |
| Gross margin (b) | 4,517 | |
| Operating income (c) | 1,203 | |
| Interest and other, net (d) | (3,284) | |
| Loss before income taxes | $ | (2,081) | |
| Net loss attributable to Obligor Group | $ | (1,720) | |
____________________
(a) Includes net revenue from services provided and product sales to Non-Obligor Subsidiaries of $841 million and $171 million, respectively.
(b) Includes cost of net revenue from resale of solutions purchased from Non-Obligor Subsidiaries and the Related Party of $1,034 million and $491 million, respectively. Includes costs of net revenue from shared services provided by Non-Obligor Subsidiaries of $634 million.
(c) Includes operating expenses from shared services provided by Non-Obligor Subsidiaries of $22 million.
(d) Includes interest expense on inter-company loan payables of $1,379 million.
The following table presents summarized balance sheet information for the Obligor Group as of the dates indicated:
| | | | | | | | | | | |
| February 3, 2023 | | January 28, 2022 |
| | | |
| (in millions) |
| | | |
| ASSETS |
| Current assets | $ | 2,972 | | | $ | 3,106 | |
| Intercompany receivables | 595 | | | 988 | |
| Due from related party, net | 312 | | | 59 | |
| Short-term intercompany loan receivables | 227 | | | — | |
| Total current assets | 4,106 | | | 4,153 | |
| Due from related party, net | 440 | | | 710 | |
| Goodwill and intangible assets | 14,818 | | | 15,399 | |
| Other non-current assets | 3,009 | | | 2,810 | |
| Total assets | $ | 22,373 | | | $ | 23,072 | |
| LIABILITIES |
| Current liabilities | $ | 6,611 | | | $ | 4,625 | |
| | | |
| Due to related party | 110 | | | 192 | |
| Total current liabilities | 6,721 | | | 4,817 | |
| Long-term debt | 17,996 | | | 17,001 | |
| Intercompany loan payables | 38,896 | | | 37,509 | |
| Other non-current liabilities | 3,891 | | | 3,473 | |
| Total liabilities | $ | 67,504 | | | $ | 62,800 | |
Critical Accounting Policies and Estimates
We prepare our financial statements in conformity with GAAP, which requires certain estimates, assumptions, and judgments to be made that may affect our Consolidated Statements of Financial Position and Consolidated Statements of Income (Loss).Income. Accounting policies that have a significant impact on our Consolidated Financial Statements are described in Note 2 of the Notes to the Consolidated Financial Statements included in this report. The accounting estimates and assumptions discussed in this section are those that we consider to be the most critical. We consider an accounting policy to be critical if the nature of the estimate or assumption is subject to a material level of judgment and if changes in those estimates or assumptions are reasonably likely to materially impact our Consolidated Financial Statements. We have discussed the development, selection, and disclosure of our critical accounting policies with the Audit Committee of our boardBoard of directors.Directors.
Revenue Recognition — We sell a wide portfolio of products and services offerings to our customers. Our agreements have varying requirementsterms and conditions depending on the goods and services being sold, the rights and obligations conveyed, and the legal jurisdiction of the arrangement. While most of our agreements have standard terms and conditions, more complex agreements may contain nonstandard terms and conditions. There are significant judgements in interpreting agreements to determine the appropriate accounting for nonstandard terms and conditions.
Our contracts with customers often include multiple performance obligations for various distinct goods and services such as hardware, software licenses, support and maintenance agreements, and other service offerings and solutions. We use significant judgment to assess whether these promises are distinct performance obligations that should be accounted for separately. In certain hardware solutions, the hardware is highly interdependent on, and interrelated with, the embedded software. In these offerings, the hardware and software licenses are accounted for as a single performance obligation.
The transaction price reflects the amount of consideration to which we expect to be entitled in exchange for transferring goods or services to the customer. If the consideration promised in a contract includes a variable amount, we estimate the amount to which we expect to be entitled using either the expected value or most likely amount method. Estimates are updated each reporting period as the variability is resolved or if additional information becomes available. Generally, volume discounts, rebates, and sales returns reduce the transaction price. When we determine the transaction price, we only include amounts that are not subject to significant future reversal.
When a contract includes multiple performance obligations, the transaction price is allocated to each performance obligation in proportion to the standalone selling price (“SSP”) of each performance obligation.
Judgment is required when determining the SSP of our performance obligations. If the observable price is available, we utilize that price for the SSP. If the observable price is not available, the SSP must be estimated. We estimate SSP by considering multiple factors, including, but not limited to, pricing practices, internal costs, and profit objectives as well as overall market conditions, which include geographic or regional specific factors, competitive positioning, and competitor actions. Our SSP estimates rely, in part, on company pricing trends. Market conditions could impact the selling price in the current period which may not be reflective of trends, and could lead to revenue timing, classification, and segment differences when compared to similar contracts in other periods. SSP for our performance obligations is periodically reassessed.
Business Combinations — We allocateFor transactions that involve a third party, the purchase priceCompany evaluates whether it is acting as the principal or the agent in the transaction. This determination requires significant judgement and impacts the amount and timing of acquired companiesrevenue recognized. If the Company determines that it controls a good or service before it is transferred to the identifiable assets acquired and liabilities assumed, which are measured based on acquisition date fair value. Goodwillcustomer, the Company is measuredacting as the excessprincipal and recognizes revenue at the gross amount of consideration transferred over the net amounts of the identifiable tangible and intangible assets acquired and the liabilities assumed at the acquisition date. The allocation of the purchase price requires usit is entitled to make significant estimates and assumptions, including fair value estimates, to determine the fair value of assets acquired and liabilities assumed and the related useful lives of the acquired assets, when applicable, as of the acquisition date. Although we believe the assumptions and estimates we have made are reasonable, they are based in part on historical experience and information obtained from the management ofcustomer. Indicators that the acquired companies and are inherently uncertain. Examples of critical estimates used in valuing certain of the intangible assets we have acquiredCompany controls a good or may acquire in the futureservice before transferring to a customer include, but are not limited to:to, the Company being the primary obligor to the customer, establishing its own pricing, and having inventory and credit risks.
•future expected cash flows from sales, maintenance agreements, and acquired developed technologies;
•the acquired company’s trade name and customer relationships as well as assumptions about the period of time the acquired trade name and customer relationships will continue to be used in the combined company’s product portfolio; and
•discount rates used to determine the present value of estimated future cash flows.
These estimates are inherently uncertain and unpredictable, and if different estimates were used, the purchase price for the acquisition could be allocated to the acquired assets and assumed liabilities differently from the allocation that we have made. Additionally, unanticipated events and circumstances may occur, which may affect the accuracy or validity of such assumptions, estimates, or actual results.
Goodwill and Indefinite-Lived Intangible Assets Impairment Assessments — Goodwill and indefinite-lived intangible assets are tested for impairment annually during the third fiscal quarter and whenever events or circumstances may indicate that an impairment has occurred.
To determine whether goodwill is impaired, we first assess certain qualitative factors. Qualitative factors that may be assessed include, but are not limited to, macroeconomic conditions, industry and market considerations, cost factors, overall financial performance, or other relevant company-specific events. Based on this assessment, if it is determined more likely than not that the fair value of a goodwill reporting unit is less than its carrying amount, we perform thea quantitative analysis of the goodwill impairment test. Alternatively, we may bypass the qualitative assessment and perform a quantitative impairment test.
Significant judgment is exercised in the identification of goodwill reporting units, assignment of assets and liabilities to goodwill reporting units, assignment of goodwill to reporting units, and determination of the fair value of each goodwill reporting unit. The fair value of each of our goodwill reporting units is generally estimated using a combination of public company multiples and discounted cash flow methodologies, and then compared to the carrying value of each goodwill reporting unit. The discounted cash flow and public company multiples methodologies require significant judgment, including estimation of future revenues, gross margins, and operating expenses, which are dependent on internal forecasts, current and anticipated economic conditions and trends, selection of market multiples through assessment of the reporting unit’s performance relative to peer competitors, the estimation of the long-term revenue growth rate and discount rate of our business, and the determination of our weighted average cost of capital. Changes in these estimates and assumptions could materially affect the fair value of the goodwill reporting unit, potentially resulting in a non-cash impairment charge.
The fair value of the indefinite-lived trade namesintangible assets is generally estimated using discounted cash flow methodologies. The discounted cash flow methodology requiresmethodologies require significant judgment, including estimation of future revenue, the estimation of the long-term revenue growth rate of our business, and the determination of the our weighted average cost of capital and royalty rates. Changes in these estimates and assumptions could materially affect the fair value of the indefinite-lived intangible assets, potentially resulting in a non-cash impairment charge.
For more information about our goodwill and intangible assets, see Note 10 of the Notes to the Consolidated Financial Statements included in this report.
Income Taxes — We are subject to income tax in the United States and numerous foreign jurisdictions. Significant judgments are required in determining the consolidated provision for income taxes. We calculate a provision for income taxes using the asset and liability method, under which deferred tax assets and liabilities are recognized by identifying the temporary differences arising from the different treatment of items for tax and accounting purposes. We account for the tax impact of including Global Intangible Low-Taxed Income (GILTI) in U.S. taxable income as a period cost. We provide related valuation allowances for deferred tax assets, where appropriate. Significant judgment is required in determining any valuation allowance against deferred tax assets. In assessing the need for a valuation allowance, we consider all available evidence for each jurisdiction, including past operating results, estimates of future taxable income, and the feasibility of ongoing tax planning strategies. In the event we determine that all or part of the net deferred tax assets are not realizable in the future, we will make an adjustment to the valuation allowance that would be charged to earnings in the period such determination is made.
Significant judgment is also required in evaluating our uncertain tax positions. Although we believe our tax return positions are sustainable, we recognize tax benefits from uncertain tax positions in the financial statements only when it is more likely than not that the positions will be sustained upon examination, including resolution of any related appeals or litigation processes, based on the technical merits and a consideration of the relevant taxing authority’s administrative practices and precedents. To the extent that the final tax outcome of these matters is different from the amounts recorded, such differences will impact the provision for income taxes in the period in which such determination is made. The provision for income taxes includes the impact of reserve provisions and changes to reserves that are considered appropriate, as well as the related net interest and penalties. We believe we have provided adequate reserves for all uncertain tax positions.
Legal and Other Contingencies — The outcomes of legal proceedings and claims brought against us are subject to significant uncertainty. An estimated loss from a loss contingency such as a legal proceeding or claim is accrued by a charge to income if it is probable that an asset has been impaired or a liability has been incurred and the amount of the loss can be reasonably estimated. In determining whether a loss should be accrued, we evaluate, among other factors, the degree of probability of an unfavorable outcome and the ability to make a reasonable estimate of the amount of loss. ChangesSignificant judgement is required in determining whether a loss should be accrued, and changes in these factors could materially impact our consolidated financial statements.
Inventories — We state our inventory at the lower of cost or net realizable value. We record a write-down for inventories of components and products, including third-party products held for resale, which have become obsolete or are in excess of anticipated demand or net realizable value. We perform a detailed review of inventory each fiscal quarter that considers multiple factors, including demand forecasts, product life cycle status, product development plans, current sales levels, product pricing, and component cost trends. The industries in which we compete are subject to demand changes. If future demand or market conditions for our products are less favorable than forecasted or if unforeseen technological changes negatively impact the utility of component inventory, we may be required to record additional write-downs, which would adversely affect our gross margin.
Recently Issued Accounting Pronouncements
See Note 2 of the Notes to the Consolidated Financial Statements included in this report for a summary of recently issued accounting pronouncements that are applicable to our Consolidated Financial Statements.
ITEM 7A — QUANTITATIVE AND QUALITATIVE DISCLOSURES ABOUT MARKET RISK
Dell Technologies is exposed to a variety of market risks, including risks associated with foreign currency exchange rate fluctuations, interest rate changes affecting its variable-rate debt, and changes in the market value of equity investments. In the normal course of business, Dell Technologies employs established policies and procedures to manage these risks.
Foreign Currency Risk
During Fiscal 2021 and Fiscal 2020,2023, the principal foreign currencies in which Dell Technologies transacted business were the Euro, Chinese Renminbi, Japanese Yen, British Pound, Indian Rupee, and CanadianAustralian Dollar. The objective of Dell Technologies in managing its exposures to foreign currency exchange rate fluctuations is to reduce the impact of adverse fluctuations associated with foreign currency exchange rate changes on earnings and cash flows. Accordingly, Dell Technologies utilizes foreign currency option contracts and forward contracts to hedge its exposure on forecasted transactions and firm commitments for certain currencies. Dell Technologies monitors its foreign currency exchange exposures to ensure the overall effectiveness of its foreign currency hedge positions. However, there can be no assurance that the foreign currency hedging activities will continue to substantially offset the impact of fluctuations in currency exchange rates on Dell Technologies’ results of operations and financial position in the future.
Based on the outstanding foreign currency hedge instruments of Dell Technologies, which include designated and non-designated instruments, there was a maximum potential one-day loss in fair value at a 95% confidence level of approximately $1537 million as of January 29, 2021February 3, 2023 and $24$16 million as of January 31, 202028, 2022 using a Value-at-Risk (“VAR”) model. By using market implied rates and incorporating volatility and correlation among the currencies of a portfolio, the VAR model simulates 10,000 randomly generated market prices and calculates the difference between the fifth percentile and the average as the Value-at-Risk. The VAR model is a risk estimation tool and is not intended to represent actual losses in fair value that could be incurred. Additionally, as Dell Technologies utilizes foreign currency instruments for hedging forecasted and firmly committed transactions, a loss in fair value for those instruments is generally offset by increases in the value of the underlying exposure.
Interest Rate Risk
Dell Technologies is primarily exposed to interest rate risk related to its variable-rate debt portfolio.portfolio and fixed-rate debt which has been converted to variable-rate debt through the use of derivative instruments. As of February 3, 2023, the majority of this risk exposure is related to DFS borrowings.
Variable-Rate Debt — As of January 29, 2021, Dell Technologies’ variable-rateDFS debt consisted of $6.3 billion of outstandingrepresents borrowings under its Senior Secured Credit Facilities, $4.0 billionsecuritization programs and structured financing programs that facilitate the funding of outstanding borrowings under its Margin Loan Facility,leases, loans, and $1.0 billion of unhedged outstanding DFS borrowings.other alternative payment structures. Amounts outstanding under these facilities generally bear interest at variable rates equal to applicable margins plus specified base rates or LIBOR-based rates. Accordingly, Interest expense on such borrowings is recognized within interest and other, net whereas interest income on the underlying assets is recognized to net revenue over time. The Company uses interest rate swaps to hedge the variability in cash flows related to the interest rate payments on such borrowings. These contracts are not designated for hedge accounting and mark-to-market adjustments are recognized immediately within interest and other, net.
Dell TechnologiesTechnologies’ interest rate risk exposure is exposedlimited to market risk based on fluctuations in interest rates on unhedged borrowings under the facilities where we do not mitigate the interest rate risk through the use of interest rate swaps.
As of January 29, 2021, outstandingFebruary 3, 2023, borrowings under the Senior Secured Creditexposed to interest rate fluctuations were $5 billion, relative to total borrowings of $29.6 billion, and Margin Loan facilities accrued interest at an annual rate between 1.90%2.49% and 2.75%, whereas unhedged DFS borrowings accrued interest at an annual rate between 1.26% and 4.17%6.58%.
Based on the variable-ratethis debt outstanding as of January 29, 2021,February 3, 2023, a 100 basis point increase in interest rates would have resulted in an increase of approximately $93$50 million in annual interest expense. For more information about our debt, see Note 6 of the Notes to the Consolidated Financial Statements included in this report.
By comparison, as of January 31, 2020, Dell Technologies had $8.928, 2022, borrowings exposed to interest rate fluctuations were $3.8 billion relative to total borrowings of outstanding borrowings under its Senior Secured Credit Facilities, $4.0$27 billion, of outstanding borrowings under its Margin Loan Facility, $1.5 billion of outstanding DFS borrowings, and $1.5 billion outstanding under the VMware Term Loan Facility.accrued interest at an annual rate between (1.5)% and 4.1%. Based on this variable-rate debt outstanding as of January 31, 2020,28, 2022, a 100 basis point increase in interest rates would have resulted in an increase of approximately $160$38 million in annual interest expense.
For more information about our debt and use of derivative instruments, see Note 6, Note 8, and Note 9 of the Notes to the Consolidated Financial Statements included in this report.
Transition from LIBOR to Alternative Reference Rates — The London Interbank Offered Rate (“LIBOR”) is the subject of recent regulatory guidance and proposals for reform. As a result of these reforms, the ICE Benchmark Administration Limited, the administrator of LIBOR, ceased publication for the one-week and two-month USD LIBOR settings on December 31, 2021 and is expected to begin phasing out the remaining USD LIBOR settings on July 1, 2023. We have completed identification of impacted financial instruments and contracts and have been working to transition such contracts linked to LIBOR to alternative reference rates.
Equity Price Risk
Strategic Investments — Our strategic investments include early-stage, privately-held companies that are considered to be in the start-up or development stages and are inherently risky. The technologies or products these companies have under development are typically in the early stages and may never materialize, which could result in a loss of a substantial part of our initial investment in the companies. We account forrecord these investments at cost, minusless impairment, if any, plus or minus changes resulting fromadjusted for observable price changes in orderly transactions for the identical or a similar security of the same issuer.changes. The evaluation is based on information provided by these companies, which are not subject to the same disclosure obligations as U.S. publicly-traded companies, and as such, the basis for these evaluations is subject to the timing and accuracy of the data provided. The carrying valueDuring Fiscal 2023, we recognized a net loss of $206 million on our strategic investments, without readily determinable fair valueswhich was $990 million and $852 million asgenerally in line with overall public equity market declines. As of January 29, 2021February 3, 2023 and January 31, 2020,28, 2022, we held strategic investments in non-marketable securities of $1.3 billion and $1.4 billion, respectively.
See Note 5 of the Notes to the Consolidated Financial Statements included in this report for additional information.
ITEM 8 — FINANCIAL STATEMENTS AND SUPPLEMENTARY DATA
Index
Report of Independent Registered Public Accounting Firm
To the Board of Directors and Stockholders of Dell Technologies Inc.
Opinions on the Financial Statements and Internal Control over Financial Reporting
We have audited the accompanying consolidated statements of financial position of Dell Technologies Inc.and its subsidiaries (the “Company”) as of January 29, 2021 February 3, 2023and January 31, 2020, 28, 2022,and the related consolidatedstatements of income, (loss), of comprehensive income, (loss), of stockholders'stockholders’ equity (deficit) and of cash flows for each of the three years in the period ended January 29, 2021,February 3, 2023, including the related notes (collectively referred to as the “consolidated financial statements”).We also have audited the Company's internal control over financial reporting as of January 29, 2021,February 3, 2023, based on criteria established in Internal Control - Integrated Framework(2013)issued by the Committee of Sponsoring Organizations of the Treadway Commission (COSO).
In our opinion, the consolidated financial statements referred to above present fairly, in all material respects, the financial position of the Company as of January 29, 2021 February 3, 2023and January 31, 2020,28, 2022, and the results of itsoperations and itscash flows for each of the three years in the period ended January 29, 2021February 3, 2023 in conformity with accounting principles generally accepted in the United States of America. Also in our opinion, the Company maintained, in all material respects, effective internal control over financial reporting as of January 29, 2021,February 3, 2023, based on criteria established in Internal Control - Integrated Framework(2013)issued by the COSO.
Change in Accounting Principle
As discussed in Note 2 to the consolidated financial statements, the Company changed the manner in which it accounts for leases as of February 2, 2019.
Basis for Opinions
The Company's management is responsible for these consolidated financial statements, for maintaining effective internal control over financial reporting, and for its assessment of the effectiveness of internal control over financial reporting, included in Management’s Annual Report on Internal Control Over Financial Reporting appearing under Item 9A. Our responsibility is to express opinions on the Company’s consolidated financial statements and on the Company's internal control over financial reporting based on our audits. We are a public accounting firm registered with the Public Company Accounting Oversight Board (United States) (PCAOB) and are required to be independent with respect to the Company in accordance with the U.S. federal securities laws and the applicable rules and regulations of the Securities and Exchange Commission and the PCAOB.
We conducted our audits in accordance with the standards of the PCAOB. Those standards require that we plan and perform the audits to obtain reasonable assurance about whether the consolidated financial statements are free of material misstatement, whether due to error or fraud, and whether effective internal control over financial reporting was maintained in all material respects.
Our audits of the consolidated financial statements included performing procedures to assess the risks of material misstatement of the consolidated financial statements, whether due to error or fraud, and performing procedures that respond to those risks. Such procedures included examining, on a test basis, evidence regarding the amounts and disclosures in the consolidated financial statements. Our audits also included evaluating the accounting principles used and significant estimates made by management, as well as evaluating the overall presentation of the consolidated financial statements. Our audit of internal control over financial reporting included obtaining an understanding of internal control over financial reporting, assessing the risk that a material weakness exists, and testing and evaluating the design and operating effectiveness of internal control based on the assessed risk. Our audits also included performing such other procedures as we considered necessary in the circumstances. We believe that our audits provide a reasonable basis for our opinions.
Definition and Limitations of Internal Control over Financial Reporting
A company’s internal control over financial reporting is a process designed to provide reasonable assurance regarding the reliability of financial reporting and the preparation of financial statements for external purposes in accordance with generally accepted accounting principles. A company’s internal control over financial reporting includes those policies and procedures that (i) pertain to the maintenance of records that, in reasonable detail, accurately and fairly reflect the transactions and dispositions of the assets of the company; (ii) provide reasonable assurance that transactions are recorded as necessary to permit preparation of financial statements in accordance with generally accepted accounting principles, and that receipts and expenditures of the company are being made only in accordance with authorizations of management and directors of the company; and (iii) provide reasonable assurance regarding prevention or timely detection of unauthorized acquisition, use, or disposition of the company’s assets that could have a material effect on the financial statements.
Because of its inherent limitations, internal control over financial reporting may not prevent or detect misstatements. Also, projections of any evaluation of effectiveness to future periods are subject to the risk that controls may become inadequate because of changes in conditions, or that the degree of compliance with the policies or procedures may deteriorate.
Critical Audit Matters
The critical audit mattersmatter communicated below are mattersis a matter arising from the current period audit of the consolidated financial statements that werewas communicated or required to be communicated to the audit committee and that (i) relaterelates to accounts or disclosures that are material to the consolidated financial statements and (ii) involved our especially challenging, subjective, or complex judgments. The communication of critical audit matters does not alter in any way our opinion on the consolidated financial statements, taken as a whole, and we are not, by communicating the critical audit mattersmatter below, providing a separate opinionsopinion on the critical audit mattersmatter or on the accounts or disclosures to which they relate.it relates.
Revenue Recognition- Identification of Performance Obligations in Revenue Contracts
As described in Notes 2 and 19 to the consolidated financial statements, the Company’s contracts with customers often include the promise to transfer multiple goods and services to a customer. Distinct promises within a contract are referred to as performance obligations and are accounted for as separate units of account. Management assesses whether each promised good or service is distinct for the purpose of identifying the performance obligations in the contract. This assessment involves subjective determinations and requires management to make judgments about the individual promised goods or services and whether such goods or services are separable from the other aspects of the contractual relationship. The Company’s performance obligations include various distinct goods and services such as hardware, software licenses, support and maintenance agreements, and other service offerings and solutions. For the year ended January 29, 2021,February 3, 2023, a significant portion of the $32.6$38.4 billion Infrastructure Solutions Group (“ISG”) and $11.9 billion VMware reportable segment net revenues relate to contracts with multiple performance obligations.
The principal considerations for our determination that performing procedures relating to the identification of performance obligations in revenue contracts is a critical audit matter are the significant judgment by management in identifying performance obligations in revenue contracts, which in turn led to a high degree of auditor judgment, subjectivity and effort in performing procedures to evaluate whether performance obligations in revenue contracts were appropriately identified by management.
Addressing the matter involved performing procedures and evaluating audit evidence in connection with forming our overall opinion on the consolidated financial statements. These procedures included testing the effectiveness of controls relating to the revenue recognition process, including controls related to the proper identification of performance obligations in revenue contracts. These procedures also included, among others, testing the completeness and accuracy of management’s identification of performance obligations by examining revenue contracts on a test basis.
Goodwill and Indefinite-lived Trade Names Impairment Assessments
As described in Note 8 to the consolidated financial statements, the Company’s consolidated goodwill and indefinite-lived trade names balances were $40.8 billion and $3.8 billion as of January 29, 2021, respectively. The goodwill associated with the Infrastructure Solutions Group (“ISG”) goodwill reporting unit represents a portion of the total goodwill balance. Goodwill and indefinite-lived intangible assets are tested for impairment annually during the third fiscal quarter and whenever events or circumstances may indicate that an impairment has occurred. Management performs a quantitative goodwill impairment test to measure the fair value of each goodwill reporting unit relative to its carrying amount, and to determine the amount of goodwill impairment loss to be recognized, if any. The fair value of the goodwill reporting units are generally estimated using a combination of public company multiples and discounted cash flow methodologies which require significant judgment, including estimation of future revenues, gross margins and operating expenses, which are dependent on internal forecasts, current and anticipated economic conditions and trends, selection of market multiples through assessment of the reporting unit’s performance relative to peer competitors, the estimation of the long-term revenue growth rate and discount rate of the Company’s business, and the determination of the Company’s weighted average cost of capital. The fair value of the indefinite-lived trade names is generally estimated using discounted cash flow methodologies. The discounted cash flow methodology requires significant judgment, including estimation of future revenue, the estimation of the long-term revenue growth rate of the Company’s business and the determination of the Company’s weighted average cost of capital and royalty rates.
The principal considerations for our determination that performing procedures relating to goodwill and indefinite-lived trade names impairment assessments is a critical audit matter are the significant judgment by management when developing the fair value measurement of the ISG reporting unit and certain of its indefinite-lived trade names, which in turn led to a high degree of auditor judgment, subjectivity and effort in performing procedures and evaluating audit evidence related to management’s selection of market multiples and cash flow projections, including significant assumptions related to the estimation of future revenues, gross margins and operating expenses. In addition, the audit effort involved the use of professionals with specialized skill and knowledge to assist in evaluating the audit evidence obtained from these procedures.
Addressing the matter involved performing procedures and evaluating audit evidence in connection with forming our overall opinion on the consolidated financial statements. These procedures included testing the effectiveness of controls relating to management’s goodwill and indefinite-lived trade names impairment assessments, including controls over the fair value of the ISG reporting unit and indefinite-lived trade names. These procedures also included, among others, testing management’s process for developing the fair value estimates, evaluating the appropriateness of the public company multiples and discounted cash flow methodologies, testing completeness and accuracy of underlying data used in the methodologies, and evaluating the reasonableness of management’s selection of market multiples, and significant assumptions used by management in estimating the fair value of the ISG reporting unit and certain of the indefinite-lived trade names related to the estimation of future revenues, gross margins and operating expenses. Evaluating the assumptions related to the estimation of future revenues, gross margins and operating expenses involved evaluating whether assumptions used by management were reasonable considering the past performance of the ISG reporting unit and certain of the indefinite-lived trade names, consistency with third-party industry data, and whether the assumptions were consistent with evidence obtained in other areas of the audit. Professionals with specialized skill and knowledge were used to assist in the evaluation of the Company’s public company multiples and discounted cash flow methodologies and the significant assumption related to the selection of market multiples used.
/s/ PricewaterhouseCoopers LLP
Austin, Texas
March 26, 202130, 2023
We have served as the Company’s auditor since 1986.
DELL TECHNOLOGIES INC.
CONSOLIDATED STATEMENTS OF FINANCIAL POSITION
(in millions)
| | | | | | | | | | | |
| January 29, 2021 | | January 31, 2020 |
| ASSETS |
| Current assets: | | | |
| Cash and cash equivalents | $ | 14,201 | | | $ | 9,302 | |
| | | |
| Accounts receivable, net of allowance of $104 and $94 (Note 20) | 12,788 | | | 12,484 | |
| Short-term financing receivables, net of allowance of $228 and $109 (Note 4) | 5,155 | | | 4,895 | |
| Inventories | 3,402 | | | 3,281 | |
| Other current assets | 8,021 | | | 6,906 | |
| Total current assets | 43,567 | | | 36,868 | |
| Property, plant, and equipment, net | 6,431 | | | 6,055 | |
| Long-term investments | 1,624 | | | 864 | |
| Long-term financing receivables, net of allowance of $93 and $40 (Note 4) | 5,339 | | | 4,848 | |
| Goodwill | 40,829 | | | 41,691 | |
| Intangible assets, net | 14,429 | | | 18,107 | |
| Other non-current assets | 11,196 | | | 10,428 | |
| Total assets | $ | 123,415 | | | $ | 118,861 | |
| LIABILITIES, REDEEMABLE SHARES, AND STOCKHOLDERS’ EQUITY |
| Current liabilities: | | | |
| Short-term debt | $ | 6,362 | | | $ | 7,737 | |
| Accounts payable | 21,696 | | | 20,065 | |
| Accrued and other | 9,549 | | | 9,773 | |
| Short-term deferred revenue | 16,525 | | | 14,881 | |
| Total current liabilities | 54,132 | | | 52,456 | |
| Long-term debt | 41,622 | | | 44,319 | |
| Long-term deferred revenue | 14,276 | | | 12,919 | |
| Other non-current liabilities | 5,360 | | | 5,383 | |
| Total liabilities | 115,390 | | | 115,077 | |
| Commitments and contingencies (Note 10) | 0 | | 0 |
| Redeemable shares (Note 17) | 472 | | | 629 | |
| Stockholders’ equity (deficit): | | | |
| Common stock and capital in excess of $0.01 par value (Note 14) | 16,849 | | | 16,091 | |
| Treasury stock at cost | (305) | | | (65) | |
| Accumulated deficit | (13,751) | | | (16,891) | |
| Accumulated other comprehensive loss | (314) | | | (709) | |
| Total Dell Technologies Inc. stockholders’ equity (deficit) | 2,479 | | | (1,574) | |
| Non-controlling interests | 5,074 | | | 4,729 | |
| Total stockholders’ equity | 7,553 | | | 3,155 | |
| Total liabilities, redeemable shares, and stockholders’ equity | $ | 123,415 | | | $ | 118,861 | |
| | | | | | | | | | | |
| February 3, 2023 | | January 28, 2022 |
| ASSETS |
| Current assets: | | | |
| Cash and cash equivalents | $ | 8,607 | | | $ | 9,477 | |
| Accounts receivable, net of allowance of $78 and $90 | 12,482 | | | 12,912 | |
| Due from related party, net | 378 | | | 131 | |
| Short-term financing receivables, net of allowance of $142 and $142 (Note 6) | 5,281 | | | 5,089 | |
| Inventories | 4,776 | | | 5,898 | |
| Other current assets | 10,827 | | | 11,526 | |
| Total current assets | 42,351 | | | 45,033 | |
| Property, plant, and equipment, net | 6,209 | | | 5,415 | |
| Long-term investments | 1,518 | | | 1,839 | |
| Long-term financing receivables, net of allowance of $59 and $47 (Note 6) | 5,638 | | | 5,522 | |
| Goodwill | 19,676 | | | 19,770 | |
| Intangible assets, net | 6,468 | | | 7,461 | |
| Due from related party, net | 440 | | | 710 | |
| Other non-current assets | 7,311 | | | 6,985 | |
| Total assets | $ | 89,611 | | | $ | 92,735 | |
| LIABILITIES AND STOCKHOLDERS’ EQUITY |
| Current liabilities: | | | |
| Short-term debt | $ | 6,573 | | | $ | 5,823 | |
| Accounts payable | 18,598 | | | 27,143 | |
| Due to related party | 2,067 | | | 1,414 | |
| Accrued and other | 8,874 | | | 7,578 | |
| Short-term deferred revenue | 15,542 | | | 14,261 | |
| Total current liabilities | 51,654 | | | 56,219 | |
| Long-term debt | 23,015 | | | 21,131 | |
| Long-term deferred revenue | 14,744 | | | 13,312 | |
| Other non-current liabilities | 3,223 | | | 3,653 | |
| Total liabilities | $ | 92,636 | | | $ | 94,315 | |
| Commitments and contingencies (Note 12) | | | |
| Stockholders’ equity (deficit): | | | |
| Common stock and capital in excess of $0.01 par value (Note 15) | 8,424 | | | 7,898 | |
| Treasury stock at cost | (3,813) | | | (964) | |
| Accumulated deficit | (6,732) | | | (8,188) | |
| Accumulated other comprehensive loss | (1,001) | | | (431) | |
| Total Dell Technologies Inc. stockholders’ equity (deficit) | (3,122) | | | (1,685) | |
| Non-controlling interests | 97 | | | 105 | |
| Total stockholders’ equity (deficit) | (3,025) | | | (1,580) | |
| Total liabilities and stockholders’ equity | $ | 89,611 | | | $ | 92,735 | |
The accompanying notes are an integral part of these Consolidated Financial Statements.
DELL TECHNOLOGIES INC.
CONSOLIDATED STATEMENTS OF INCOME (LOSS)
(in millions, except per share amountsStatements).
| | | | | | | | | | | | | | | | | |
| Fiscal Year Ended |
| | January 29, 2021 | | January 31, 2020 | | February 1, 2019 |
| Net revenue: | | | | | |
| Products | $ | 69,911 | | | $ | 69,918 | | | $ | 70,707 | |
| Services | 24,313 | | | 22,236 | | | 19,914 | |
| Total net revenue | 94,224 | | | 92,154 | | | 90,621 | |
| Cost of net revenue: | | | | | |
| Products | 55,347 | | | 54,525 | | | 57,889 | |
| Services | 9,460 | | | 8,696 | | | 7,679 | |
| Total cost of net revenue | 64,807 | | | 63,221 | | | 65,568 | |
| Gross margin | 29,417 | | | 28,933 | | | 25,053 | |
| Operating expenses: | | | | | |
| Selling, general, and administrative | 18,998 | | | 21,319 | | | 20,640 | |
| Research and development | 5,275 | | | 4,992 | | | 4,604 | |
| Total operating expenses | 24,273 | | | 26,311 | | | 25,244 | |
| Operating income (loss) | 5,144 | | | 2,622 | | | (191) | |
| Interest and other, net | (1,474) | | | (2,626) | | | (2,170) | |
| Income (loss) before income taxes | 3,670 | | | (4) | | | (2,361) | |
| Income tax expense (benefit) | 165 | | | (5,533) | | | (180) | |
| Net income (loss) | 3,505 | | | 5,529 | | | (2,181) | |
| Less: Net income attributable to non-controlling interests | 255 | | | 913 | | | 129 | |
| Net income (loss) attributable to Dell Technologies Inc. | $ | 3,250 | | | $ | 4,616 | | | $ | (2,310) | |
| | | | | |
| Earnings (loss) per share attributable to Dell Technologies Inc. — basic: | | |
| Dell Technologies Common Stock | $ | 4.37 | | | $ | 6.38 | | | |
| Class V Common Stock | | | | | $ | 6.01 | |
| DHI Group | | | | | $ | (6.02) | |
| | | | | |
| Earnings (loss) per share attributable to Dell Technologies Inc. — diluted: | | |
| Dell Technologies Common Stock | $ | 4.22 | | | $ | 6.03 | | | |
| Class V Common Stock | | | | | $ | 5.91 | |
| DHI Group | | | | | $ | (6.04) | |
The accompanying notes are an integral part of these Consolidated Financial Statements.
DELL TECHNOLOGIES INC.
CONSOLIDATED STATEMENTS OF COMPREHENSIVE INCOME (LOSS)
(in millions)
| | | | | | | | | | | | | | | | | |
| Fiscal Year Ended |
| January 29, 2021 | | January 31, 2020 | | February 1, 2019 |
| Net income (loss) | $ | 3,505 | | | $ | 5,529 | | | $ | (2,181) | |
| | | | | |
| Other comprehensive income (loss), net of tax | | | | | |
| Foreign currency translation adjustments | 528 | | | (226) | | | (631) | |
| Available-for-sale investments: | | | | | |
| Change in unrealized gains | 0 | | | 0 | | | 2 | |
| Reclassification adjustment for net losses realized in net loss | 0 | | | 0 | | | 43 | |
| Net change in market value of investments | 0 | | | 0 | | | 45 | |
| Cash flow hedges: | | | | | |
| Change in unrealized (losses) gains | (200) | | | 269 | | | 299 | |
| Reclassification adjustment for net gains included in net income (loss) | 100 | | | (226) | | | (225) | |
| Net change in cash flow hedges | (100) | | | 43 | | | 74 | |
| Pension and other postretirement plans: | | | | | |
| Recognition of actuarial net losses from pension and other postretirement plans | (38) | | | (60) | | | (21) | |
| Reclassification adjustments for net losses from pension and other postretirement plans | 5 | | | 1 | | | 0 | |
| Net change in actuarial net losses from pension and other postretirement plans | (33) | | | (59) | | | (21) | |
| | | | | |
| Total other comprehensive income (loss), net of tax expense (benefit) of $(18), $(14), and $14, respectively | 395 | | | (242) | | | (533) | |
| Comprehensive income (loss), net of tax | 3,900 | | | 5,287 | | | (2,714) | |
| Less: Net income attributable to non-controlling interests | 255 | | | 913 | | | 129 | |
| Less: Other comprehensive income attributable to non-controlling interests | 0 | | | 0 | | | 6 | |
| Comprehensive income (loss) attributable to Dell Technologies Inc. | $ | 3,645 | | | $ | 4,374 | | | $ | (2,849) | |
The accompanying notes are an integral part of these Consolidated Financial Statements.
DELL TECHNOLOGIES INC.
CONSOLIDATED STATEMENTS OF CASH FLOWSINCOME
(in millions, except per share amounts)
| | | | | | | | | | | | | | | | | | | | | |
| | | Fiscal Year Ended |
| | | | | | February 3, 2023 | | January 28, 2022 | | January 29, 2021 |
| Net revenue: | | | | | | | | | |
| Products | | | | | $ | 79,250 | | | $ | 79,830 | | | $ | 67,744 | |
| Services | | | | | 23,051 | | | 21,367 | | | 18,926 | |
| Total net revenue | | | | | 102,301 | | | 101,197 | | | 86,670 | |
| Cost of net revenue (a): | | | | | | | | | |
| Products | | | | | 66,029 | | | 67,224 | | | 56,431 | |
| Services | | | | | 13,586 | | | 12,082 | | | 10,099 | |
| Total cost of net revenue | | | | | 79,615 | | | 79,306 | | | 66,530 | |
| Gross margin | | | | | 22,686 | | | 21,891 | | | 20,140 | |
| Operating expenses: | | | | | | | | | |
| Selling, general, and administrative | | | | | 14,136 | | | 14,655 | | | 14,000 | |
| Research and development | | | | | 2,779 | | | 2,577 | | | 2,455 | |
| Total operating expenses | | | | | 16,915 | | | 17,232 | | | 16,455 | |
| Operating income | | | | | 5,771 | | | 4,659 | | | 3,685 | |
| Interest and other, net | | | | | (2,546) | | | 1,264 | | | (1,339) | |
| Income before income taxes | | | | | 3,225 | | | 5,923 | | | 2,346 | |
| Income tax expense | | | | | 803 | | | 981 | | | 101 | |
| Net income from continuing operations | | | | | 2,422 | | | 4,942 | | | 2,245 | |
| Income from discontinued operations, net of income taxes (Note 3) | | | | | — | | | 765 | | | 1,260 | |
| Net income | | | | | 2,422 | | | 5,707 | | | 3,505 | |
| Less: Net loss attributable to non-controlling interests | | | | | (20) | | | (6) | | | (4) | |
| Less: Net income attributable to non-controlling interests of discontinued operations | | | | | — | | | 150 | | | 259 | |
| Net income attributable to Dell Technologies Inc. | | | | | $ | 2,442 | | | $ | 5,563 | | | $ | 3,250 | |
| | | | | | | | | |
| Earnings per share attributable to Dell Technologies Inc. — basic: |
| Continuing operations | | | | | $ | 3.33 | | | $ | 6.49 | | | $ | 3.02 | |
| Discontinued operations | | | | | $ | — | | | $ | 0.81 | | | $ | 1.35 | |
| | | | | | | | | |
| Earnings per share attributable to Dell Technologies Inc. — diluted: |
| Continuing operations | | | | | $ | 3.24 | | | $ | 6.26 | | | $ | 2.93 | |
| Discontinued operations | | | | | $ | — | | | $ | 0.76 | | | $ | 1.29 | |
| | | | | | | | | |
| (a) Includes related party cost of net revenue as follows (Note 21): |
| Products | | | | | $ | 1,634 | | | $ | 1,577 | | | $ | 1,493 | |
| Services | | | | | $ | 3,065 | | | $ | 2,487 | | | $ | 1,848 | |
The accompanying notes are an integral part of these Consolidated Financial Statements.
DELL TECHNOLOGIES INC.
CONSOLIDATED STATEMENTS OF COMPREHENSIVE INCOME
(in millions)
| | | | | | | | | | | | | | | | | |
| | Fiscal Year Ended |
| | January 29, 2021 | | January 31, 2020 | | February 1, 2019 |
| Cash flows from operating activities: | | | | | |
| Net income (loss) | $ | 3,505 | | | $ | 5,529 | | | $ | (2,181) | |
| Adjustments to reconcile net income (loss) to net cash provided by operating activities: | | | | | |
| Depreciation and amortization | 5,390 | | | 6,143 | | | 7,746 | |
| Stock-based compensation expense | 1,609 | | | 1,262 | | | 918 | |
| Deferred income taxes | (399) | | | (6,339) | | | (1,331) | |
| Other, net | (88) | | | 938 | | | 756 | |
| Changes in assets and liabilities, net of effects from acquisitions and dispositions: | | | | | |
| Accounts receivable | (396) | | | (286) | | | (1,104) | |
| Financing receivables | (728) | | | (1,329) | | | (1,302) | |
| Inventories | (243) | | | 311 | | | (1,445) | |
| Other assets and liabilities | (1,656) | | | (1,559) | | | 564 | |
| Accounts payable | 1,598 | | | 894 | | | 952 | |
| Deferred revenue | 2,815 | | | 3,727 | | | 3,418 | |
| Change in cash from operating activities | 11,407 | | | 9,291 | | | 6,991 | |
| Cash flows from investing activities: | | | | | |
| Purchases of investments | (338) | | | (181) | | | (925) | |
| Maturities and sales of investments | 169 | | | 497 | | | 6,612 | |
| Capital expenditures and capitalized software development costs | (2,082) | | | (2,576) | | | (1,497) | |
| Acquisition of businesses and assets, net | (424) | | | (2,463) | | | (971) | |
| Divestitures of businesses and assets, net | 2,187 | | | (3) | | | 130 | |
| Other | 28 | | | 40 | | | 40 | |
| Change in cash from investing activities | (460) | | | (4,686) | | | 3,389 | |
| Cash flows from financing activities: | | | | | |
| Dividends paid to VMware, Inc.’s public stockholders | 0 | | | 0 | | | (2,134) | |
| Proceeds from the issuance of common stock | 452 | | | 658 | | | 805 | |
| Repurchases of parent common stock | (241) | | | (8) | | | (14,075) | |
| Repurchases of subsidiary common stock | (1,363) | | | (3,547) | | | (415) | |
| Proceeds from debt | 16,391 | | | 20,481 | | | 13,045 | |
| Repayments of debt | (20,919) | | | (22,117) | | | (11,451) | |
| Other | (270) | | | (71) | | | (104) | |
| Change in cash from financing activities | (5,950) | | | (4,604) | | | (14,329) | |
| Effect of exchange rate changes on cash, cash equivalents, and restricted cash | 36 | | | (90) | | | (189) | |
| Change in cash, cash equivalents, and restricted cash | 5,033 | | | (89) | | | (4,138) | |
| Cash, cash equivalents, and restricted cash at beginning of the period | 10,151 | | | 10,240 | | | 14,378 | |
| Cash, cash equivalents, and restricted cash at end of the period | $ | 15,184 | | | $ | 10,151 | | | $ | 10,240 | |
| Income tax paid | $ | 1,421 | | | $ | 1,414 | | | $ | 747 | |
| Interest paid | $ | 2,279 | | | $ | 2,500 | | | $ | 2,347 | |
| | | | | | | | | | | | | | | | | | | | | |
| | | Fiscal Year Ended |
| | | | | February 3, 2023 | | January 28, 2022 | | January 29, 2021 |
| Net income | | | | | $ | 2,422 | | | $ | 5,707 | | | $ | 3,505 | |
| | | | | | | | | |
| Other comprehensive income (loss), net of tax | | | | | | | | | |
| Foreign currency translation adjustments | | | | | (222) | | | (385) | | | 528 | |
| | | | | | | | | |
| | | | | | | | | |
| | | | | | | | | |
| | | | | | | | | |
| Cash flow hedges: | | | | | | | | | |
| Change in unrealized gains (losses) | | | | | 354 | | | 374 | | | (200) | |
| Reclassification adjustment for net (gains) losses included in net income | | | | | (705) | | | (158) | | | 100 | |
| Net change in cash flow hedges | | | | | (351) | | | 216 | | | (100) | |
| Pension and other postretirement plans: | | | | | | | | | |
| Recognition of actuarial net gains (losses) from pension and other postretirement plans | | | | | 1 | | | 37 | | | (38) | |
| Reclassification adjustments for net losses from pension and other postretirement plans | | | | | 1 | | | 7 | | | 5 | |
| Net change in actuarial net gains (losses) from pension and other postretirement plans | | | | | 2 | | | 44 | | | (33) | |
| | | | | | | | | |
| Total other comprehensive income (loss), net of tax expense (benefit) of $(17), $30 and $(18), respectively | | | | | (571) | | | (125) | | | 395 | |
| Comprehensive income, net of tax | | | | | 1,851 | | | 5,582 | | | 3,900 | |
| Less: Net income (loss) attributable to non-controlling interests | | | | | (20) | | | 144 | | | 255 | |
| Less: Other comprehensive loss attributable to non-controlling interests | | | | | (1) | | | — | | | — | |
| Comprehensive income attributable to Dell Technologies Inc. | | | | | $ | 1,872 | | | $ | 5,438 | | | $ | 3,645 | |
| | | | | | | | | |
| | | | | | | | | |
| | | | | | | | | |
The accompanying notes are an integral part of these Consolidated Financial Statements.
DELL TECHNOLOGIES INC.
CONSOLIDATED STATEMENTS OF CASH FLOWS
(in millions; continued on next page)
| | | | | | | | | | | | | | | | | |
| | Fiscal Year Ended |
| | February 3, 2023 | | January 28, 2022 | | January 29, 2021 |
| Cash flows from operating activities: | | | | | |
| Net income | $ | 2,422 | | | $ | 5,707 | | | $ | 3,505 | |
| Adjustments to reconcile net income to net cash provided by operating activities: | | | | | |
| Depreciation and amortization | 3,156 | | | 4,551 | | | 5,390 | |
| Stock-based compensation expense | 931 | | | 1,622 | | | 1,609 | |
| Deferred income taxes | (717) | | | (365) | | | (399) | |
| Other, net (a) | 961 | | | (3,130) | | | (88) | |
| Changes in assets and liabilities, net of effects from acquisitions and dispositions: | | | | | |
| Accounts receivable | 113 | | | (2,193) | | | (396) | |
| Financing receivables | (461) | | | (241) | | | (728) | |
| Inventories | 875 | | | (2,514) | | | (243) | |
| Other assets and liabilities | 973 | | | (1,948) | | | (1,656) | |
| Due from/to related party, net | 649 | | | 479 | | | — | |
| Accounts payable | (8,546) | | | 5,742 | | | 1,598 | |
| Deferred revenue | 3,209 | | | 2,597 | | | 2,815 | |
| Change in cash from operating activities | 3,565 | | | 10,307 | | | 11,407 | |
| Cash flows from investing activities: | | | | | |
| Purchases of equity and other investments | (94) | | | (256) | | | (162) | |
| Purchases of held-to-maturity investments | (14) | | | (158) | | | (176) | |
| Maturities and sales of equity and other investments | 116 | | | 513 | | | 169 | |
| Capital expenditures and capitalized software development costs | (3,003) | | | (2,796) | | | (2,082) | |
| Acquisition of businesses and assets, net | (70) | | | (16) | | | (424) | |
| Divestitures of businesses, net | — | | | 3,957 | | | 2,187 | |
| Other | 41 | | | 62 | | | 28 | |
| Change in cash from investing activities | (3,024) | | | 1,306 | | | (460) | |
| Cash flows from financing activities: | | | | | |
| Dividends paid by VMware, Inc. to non-controlling interests | — | | | (2,240) | | | — | |
| Proceeds from the issuance of common stock | 5 | | | 334 | | | 452 | |
| Repurchases of parent common stock (b) | (3,272) | | | (663) | | | (241) | |
| Repurchases of subsidiary common stock | (9) | | | (1,175) | | | (1,363) | |
| Net transfer of cash, cash equivalents, and restricted cash to VMware, Inc. | — | | | (5,052) | | | — | |
| Payments of dividends to stockholders | (964) | | | — | | | — | |
| | | | | |
| Proceeds from debt | 12,479 | | | 20,425 | | | 16,391 | |
| Repayments of debt | (9,825) | | | (26,723) | | | (20,919) | |
| Debt-related costs and other, net | (39) | | | (1,515) | | | (270) | |
| Change in cash from financing activities | (1,625) | | | (16,609) | | | (5,950) | |
| | | | | |
| | | | | |
____________________
(a) During the fiscal year ended January 28, 2022, other, net, includes $4.0 billion pre-tax gain on the sale of Boomi.
(b) Common stock repurchases are inclusive of employee tax withholding on stock-based compensation.
The accompanying notes are an integral part of these Consolidated Financial Statements.
DELL TECHNOLOGIES INC.
CONSOLIDATED STATEMENTS OF CASH FLOWS
(continued; in millions)
| | | | | | | | | | | | | | | | | |
| | Fiscal Year Ended |
| | February 3, 2023 | | January 28, 2022 | | January 29, 2021 |
| Effect of exchange rate changes on cash, cash equivalents, and restricted cash | (104) | | | (106) | | | 36 | |
| Change in cash, cash equivalents, and restricted cash | (1,188) | | | (5,102) | | | 5,033 | |
| Cash, cash equivalents, and restricted cash at beginning of the period, including cash attributable to discontinued operations | 10,082 | | | 15,184 | | | 10,151 | |
| Cash, cash equivalents, and restricted cash at end of the period, including cash attributable to discontinued operations | 8,894 | | | 10,082 | | | 15,184 | |
| Less: Cash, cash equivalents, and restricted cash attributable to discontinued operations | — | | | — | | | 4,770 | |
| Cash, cash equivalents, and restricted cash from continuing operations | $ | 8,894 | | | $ | 10,082 | | | $ | 10,414 | |
| Income tax paid | $ | 1,208 | | | $ | 1,257 | | | $ | 1,421 | |
| Interest paid | $ | 1,169 | | | $ | 1,825 | | | $ | 2,279 | |
The accompanying notes are an integral part of these Consolidated Financial Statements.
DELL TECHNOLOGIES INC.
CONSOLIDATED STATEMENTS OF STOCKHOLDERS’ EQUITY (DEFICIT)
(in millions; continued on next page)
| | | Common Stock and Capital in Excess of Par Value | | Treasury Stock | | | Common Stock and Capital in Excess of Par Value | | Treasury Stock | |
| | DHI Group | | Class V Common Stock | | DHI Group | | Class V Common Stock | | | | | | |
| | Issued Shares | | Amount | | Issued Shares | | Amount | | Shares | | Amount | | Shares | | Amount | | Accumulated Deficit | | Accumulated Other Comprehensive Income/(Loss) | | Dell Technologies
Stockholders’ Equity (Deficit) | | Non-Controlling Interests | | Total Stockholders’ Equity (Deficit) | | Issued Shares | | Amount | | Shares | | Amount | | Accumulated Deficit | | Accumulated Other Comprehensive Income/(Loss) | | Dell Technologies
Stockholders’ Equity (Deficit) | | Non-Controlling Interests | | Total Stockholders’ Equity (Deficit) |
| Balances as of February 2, 2018 | 571 | | | $ | 9,848 | | | 223 | | | $ | 10,041 | | | 1 | | | $ | (16) | | | 24 | | | $ | (1,424) | | | $ | (6,860) | | | $ | 130 | | | $ | 11,719 | | | $ | 5,766 | | | $ | 17,485 | | |
| Adjustment for adoption of accounting standards (Note 2) | — | | | — | | | — | | | — | | | — | | | — | | | — | | | — | | | 58 | | | (58) | | | — | | | (5) | | | (5) | | |
| Net income (loss) | — | | | — | | | — | | | — | | | — | | | — | | | — | | | — | | | (2,310) | | | — | | | (2,310) | | | 129 | | | (2,181) | | |
| Balances as of January 31, 2020 | | Balances as of January 31, 2020 | 745 | | | $ | 16,091 | | | 2 | | | $ | (65) | | | $ | (16,891) | | | $ | (709) | | | $ | (1,574) | | | $ | 4,729 | | | $ | 3,155 | |
| Adjustment for adoption of accounting standards | | Adjustment for adoption of accounting standards | — | | | — | | | — | | | — | | | (110) | | | — | | | (110) | | | — | | | (110) | |
| Net income | | Net income | — | | | — | | | — | | | — | | | 3,250 | | | — | | | 3,250 | | | 255 | | | 3,505 | |
| Foreign currency translation adjustments | Foreign currency translation adjustments | — | | | — | | | — | | | — | | | — | | | — | | | — | | | — | | | — | | | (631) | | | (631) | | | — | | | (631) | | Foreign currency translation adjustments | — | | | — | | | — | | | — | | | — | | | 528 | | | 528 | | | — | | | 528 | |
| Investments, net change | — | | | — | | | — | | | — | | | — | | | — | | | — | | | — | | | — | | | 39 | | | 39 | | | 6 | | | 45 | | |
| Cash flow hedges, net change | Cash flow hedges, net change | — | | | — | | | — | | | — | | | — | | | — | | | — | | | — | | | — | | | 74 | | | 74 | | | — | | | 74 | | Cash flow hedges, net change | — | | | — | | | — | | | — | | | — | | | (100) | | | (100) | | | — | | | (100) | |
| Pension and other post-retirement | Pension and other post-retirement | — | | | — | | | — | | | — | | | — | | | — | | | — | | | — | | | — | | | (21) | | | (21) | | | — | | | (21) | | Pension and other post-retirement | — | | | — | | | — | | | — | | | — | | | (33) | | | (33) | | | — | | | (33) | |
| Issuance of common stock | 150 | | | 6,845 | | | — | | | — | | | — | | | — | | | — | | | — | | | (6,872) | | | — | | | (27) | | | — | | | (27) | | |
| Issuance of common stock, net of shares repurchased for employee tax withholding | | Issuance of common stock, net of shares repurchased for employee tax withholding | 16 | | | 178 | | | — | | | — | | | — | | | — | | | 178 | | | — | | | 178 | |
| Stock-based compensation expense | Stock-based compensation expense | — | | | 99 | | | — | | | — | | | — | | | — | | | — | | | — | | | — | | | — | | | 99 | | | 819 | | | 918 | | Stock-based compensation expense | — | | | 462 | | | — | | | — | | | — | | | — | | | 462 | | | 1,147 | | | 1,609 | |
| Treasury stock repurchases | Treasury stock repurchases | — | | | — | | | — | | | — | | | 1 | | | (47) | | | — | | | — | | | — | | | — | | | (47) | | | — | | | (47) | | Treasury stock repurchases | — | | | — | | | 6 | | | (240) | | | — | | | — | | | (240) | | | — | | | (240) | |
| Revaluation of redeemable shares | Revaluation of redeemable shares | — | | | (812) | | | — | | | — | | | — | | | — | | | — | | | — | | | — | | | — | | | (812) | | | — | | | (812) | | Revaluation of redeemable shares | — | | | 157 | | | — | | | — | | | — | | | — | | | 157 | | | — | | | 157 | |
| Repurchase of Class V Common Stock | — | | | — | | | (223) | | | (10,041) | | | — | | | — | | | (24) | | | 1,424 | | | (5,365) | | | — | | | (13,982) | | | — | | | (13,982) | | |
| Impact from equity transactions of non-controlling interests | Impact from equity transactions of non-controlling interests | — | | | 134 | | | — | | | — | | | — | | | — | | | — | | | — | | | — | | | — | | | 134 | | | (1,892) | | | (1,758) | | Impact from equity transactions of non-controlling interests | — | | | (39) | | | — | | | — | | | — | | | — | | | (39) | | | (1,057) | | | (1,096) | |
| Balances as of February 1, 2019 | 721 | | | $ | 16,114 | | | 0 | | | $ | 0 | | | 2 | | | $ | (63) | | | 0 | | | $ | 0 | | | $ | (21,349) | | | $ | (467) | | | $ | (5,765) | | | $ | 4,823 | | | $ | (942) | | |
| | Balances as of January 29, 2021 | | Balances as of January 29, 2021 | 761 | | | $ | 16,849 | | | 8 | | | $ | (305) | | | $ | (13,751) | | | $ | (314) | | | $ | 2,479 | | | $ | 5,074 | | | $ | 7,553 | |
The accompanying notes are an integral part of these Consolidated Financial Statements.
DELL TECHNOLOGIES INC.
CONSOLIDATED STATEMENTS OF STOCKHOLDERS’ EQUITY (DEFICIT)
(in millions; continued on next page)
| | | | | | | | | | | | | | | | | | | | | | | | | | | | | | | | | | | | | | | | | | | | | | | | | | | | | |
| Common Stock and Capital in Excess of Par Value | | Treasury Stock | | | | | | | | | | |
| | | | | | | | | | | | | | | | | |
| Issued Shares | | Amount | | Shares | | Amount | | Accumulated Deficit | | Accumulated Other Comprehensive Income/(Loss) | | Dell Technologies
Stockholders’ Equity (Deficit) | | Non-Controlling Interests | | Total Stockholders’ Equity (Deficit) |
| Balances as of January 29, 2021 | 761 | | | $ | 16,849 | | | 8 | | | $ | (305) | | | $ | (13,751) | | | $ | (314) | | | $ | 2,479 | | | $ | 5,074 | | | $ | 7,553 | |
| | | | | | | | | | | | | | | | | |
| Net income | — | | | — | | | — | | | — | | | 5,563 | | | — | | | 5,563 | | | 144 | | | 5,707 | |
| Foreign currency translation adjustments | — | | | — | | | — | | | — | | | — | | | (385) | | | (385) | | | — | | | (385) | |
| Cash flow hedges, net change | — | | | — | | | — | | | — | | | — | | | 216 | | | 216 | | | — | | | 216 | |
| Pension and other post-retirement | — | | | — | | | — | | | — | | | — | | | 44 | | | 44 | | | — | | | 44 | |
| Issuance of common stock, net of shares repurchased for employee tax withholding | 16 | | | 22 | | | — | | | — | | | — | | | — | | | 22 | | | — | | | 22 | |
| Stock-based compensation expense | — | | | 777 | | | — | | | — | | | — | | | — | | | 777 | | | 845 | | | 1,622 | |
| Treasury stock repurchases | — | | | — | | | 12 | | | (659) | | | — | | | — | | | (659) | | | — | | | (659) | |
| Revaluation of redeemable shares | — | | | 472 | | | — | | | — | | | — | | | — | | | 472 | | | — | | | 472 | |
| Impact from equity transactions of non-controlling interests | — | | | (60) | | | — | | | — | | | — | | | — | | | (60) | | | (823) | | | (883) | |
| Dividends paid by VMware, Inc. to non-controlling interests | — | | | — | | | — | | | — | | | — | | | — | | | — | | | (2,240) | | | (2,240) | |
| Spin-off of VMware, Inc. | — | | | (10,162) | | | — | | | — | | | — | | | 8 | | | (10,154) | | | (2,895) | | | (13,049) | |
| | | | | | | | | | | | | | | | | |
| Balances as of January 28, 2022 | 777 | | | $ | 7,898 | | | 20 | | | $ | (964) | | | $ | (8,188) | | | $ | (431) | | | $ | (1,685) | | | $ | 105 | | | $ | (1,580) | |
The accompanying notes are an integral part of these Consolidated Financial Statements.
DELL TECHNOLOGIES INC.
CONSOLIDATED STATEMENTS OF STOCKHOLDERS’ EQUITY (DEFICIT)
(continued; in millions)
| | | | | | | | | | | | | | | | | | | | | | | | | | | | | | | | | | | | | | | | | | | | | | | | | | | | | |
| Common Stock and Capital in Excess of Par Value | | Treasury Stock | | | | | | | | | | |
| Dell Technologies Common Stock (a) | | | | | | | | | | |
| Issued Shares | | Amount | | Shares | | Amount | | Accumulated Deficit | | Accumulated Other Comprehensive Income/(Loss) | | Dell Technologies
Stockholders’ Equity (Deficit) | | Non-Controlling Interests | | Total Stockholders’ Equity (Deficit) |
| Balances as of February 1, 2019 | 721 | | | $ | 16,114 | | | 2 | | | $ | (63) | | | $ | (21,349) | | | $ | (467) | | | $ | (5,765) | | | $ | 4,823 | | | $ | (942) | |
| Adjustment for adoption of accounting standards (Note 2) | — | | | — | | | — | | | — | | | 3 | | | — | | | 3 | | | — | | | 3 | |
| Net income | — | | | — | | | — | | | — | | | 4,616 | | | — | | | 4,616 | | | 913 | | | 5,529 | |
| Foreign currency translation adjustments | — | | | — | | | — | | | — | | | — | | | (226) | | | (226) | | | — | | | (226) | |
| | | | | | | | | | | | | | | | | |
| Cash flow hedges, net change | — | | | — | | | — | | | — | | | — | | | 43 | | | 43 | | | 0 | | | 43 | |
| Pension and other post-retirement | — | | | — | | | — | | | — | | | — | | | (59) | | | (59) | | | — | | | (59) | |
| Issuance of common stock | 24 | | | 345 | | | — | | | — | | | 0 | | | — | | | 345 | | | — | | | 345 | |
| Stock-based compensation expense | — | | | 225 | | | — | | | — | | | — | | | — | | | 225 | | | 1,037 | | | 1,262 | |
| Treasury stock repurchases | — | | | — | | | 0 | | | (2) | | | — | | | — | | | (2) | | | — | | | (2) | |
| Revaluation of redeemable shares | — | | | 567 | | | — | | | — | | | — | | | — | | | 567 | | | — | | | 567 | |
| Impact from equity transactions of non-controlling interests | — | | | (1,160) | | | — | | | — | | | (161) | | | — | | | (1,321) | | | (2,044) | | | (3,365) | |
| Balances as of January 31, 2020 | 745 | | | $ | 16,091 | | | 2 | | | $ | (65) | | | $ | (16,891) | | | $ | (709) | | | $ | (1,574) | | | $ | 4,729 | | | $ | 3,155 | |
_________________
(a) See Note 14 of the Notes to the Consolidated Financial Statements for additional information on Dell Technologies Common Stock.
The accompanying notes are an integral part of these Consolidated Financial Statements.
DELL TECHNOLOGIES INC.
CONSOLIDATED STATEMENTS OF STOCKHOLDERS’ EQUITY (DEFICIT)
(continued; in millions)
| | | | | | | | | | | | | | | | | | | | | | | | | | | | | | | | | | | | | | | | | | | | | | | | | | | | | |
| Common Stock and Capital in Excess of Par Value | | Treasury Stock | | | | | | | | | | |
| Dell Technologies Common Stock (a) | | | | | | | | | | |
| Issued Shares | | Amount | | Shares | | Amount | | Accumulated Deficit | | Accumulated Other Comprehensive Income/(Loss) | | Dell Technologies
Stockholders’ Equity (Deficit) | | Non-Controlling Interests | | Total Stockholders’ Equity (Deficit) |
| Balances as of January 31, 2020 | 745 | | | $ | 16,091 | | | 2 | | | $ | (65) | | | $ | (16,891) | | | $ | (709) | | | $ | (1,574) | | | $ | 4,729 | | | $ | 3,155 | |
| Adjustment for adoption of accounting standards (Note 2) | — | | | — | | | — | | | — | | | (110) | | | — | | | (110) | | | — | | | (110) | |
| Net income | — | | | — | | | — | | | — | | | 3,250 | | | — | | | 3,250 | | | 255 | | | 3,505 | |
| Foreign currency translation adjustments | — | | | — | | | — | | | — | | | — | | | 528 | | | 528 | | | — | | | 528 | |
| Cash flow hedges, net change | — | | | — | | | — | | | — | | | — | | | (100) | | | (100) | | | 0 | | | (100) | |
| Pension and other post-retirement | — | | | — | | | — | | | — | | | — | | | (33) | | | (33) | | | — | | | (33) | |
| Issuance of common stock | 16 | | | 178 | | | — | | | — | | | 0 | | | — | | | 178 | | | — | | | 178 | |
| Stock-based compensation expense | — | | | 462 | | | — | | | — | | | — | | | — | | | 462 | | | 1,147 | | | 1,609 | |
| Treasury stock repurchases | — | | | — | | | 6 | | | (240) | | | — | | | — | | | (240) | | | — | | | (240) | |
| Revaluation of redeemable shares | — | | | 157 | | | — | | | — | | | — | | | — | | | 157 | | | — | | | 157 | |
| Impact from equity transactions of non-controlling interests | — | | | (39) | | | — | | | — | | | 0 | | | — | | | (39) | | | (1,057) | | | (1,096) | |
| | | | | | | | | | | | | | | | | |
| Balances as of January 29, 2021 | 761 | | | $ | 16,849 | | | 8 | | | $ | (305) | | | $ | (13,751) | | | $ | (314) | | | $ | 2,479 | | | $ | 5,074 | | | $ | 7,553 | |
_________________
(a) See Note 14 of the Notes to the Consolidated Financial Statements for additional information on Dell Technologies Common Stock. | | | | | | | | | | | | | | | | | | | | | | | | | | | | | | | | | | | | | | | | | | | | | | | | | | | | | |
| Common Stock and Capital in Excess of Par Value | | Treasury Stock | | | | | | | | | | |
| | | | | | | | | | | | | | | | | |
| Issued Shares | | Amount | | Shares | | Amount | | Accumulated Deficit | | Accumulated Other Comprehensive Income/(Loss) | | Dell Technologies
Stockholders’ Equity (Deficit) | | Non-Controlling Interests | | Total Stockholders’ Equity (Deficit) |
| Balances as of January 28, 2022 | 777 | | | $ | 7,898 | | | 20 | | | $ | (964) | | | $ | (8,188) | | | $ | (431) | | | $ | (1,685) | | | $ | 105 | | | $ | (1,580) | |
| | | | | | | | | | | | | | | | | |
| Net income (loss) | — | | | — | | | — | | | — | | | 2,442 | | | — | | | 2,442 | | | (20) | | | 2,422 | |
| Dividends and dividend equivalents declared ($1.32 per common share) | — | | | — | | | — | | | — | | | (986) | | | — | | | (986) | | | — | | | (986) | |
| Foreign currency translation adjustments | — | | | — | | | — | | | — | | | — | | | (221) | | | (221) | | | (1) | | | (222) | |
| Cash flow hedges, net change | — | | | — | | | — | | | — | | | — | | | (351) | | | (351) | | | — | | | (351) | |
| Pension and other post-retirement | — | | | — | | | — | | | — | | | — | | | 2 | | | 2 | | | — | | | 2 | |
| Issuance of common stock, net of shares repurchased for employee tax withholding | 21 | | | (383) | | | — | | | — | | | — | | | — | | | (383) | | | — | | | (383) | |
| Stock-based compensation expense | — | | | 895 | | | — | | | — | | | — | | | — | | | 895 | | | 36 | | | 931 | |
| Treasury stock repurchases | — | | | — | | | 62 | | | (2,849) | | | — | | | — | | | (2,849) | | | — | | | (2,849) | |
| Impact from equity transactions of non-controlling interests | — | | | 14 | | | — | | | — | | | — | | | — | | | 14 | | | (23) | | | (9) | |
| | | | | | | | | | | | | | | | | |
| Balances as of February 3, 2023 | 798 | | | $ | 8,424 | | | 82 | | | $ | (3,813) | | | $ | (6,732) | | | $ | (1,001) | | | $ | (3,122) | | | $ | 97 | | | $ | (3,025) | |
The accompanying notes are an integral part of these Consolidated Financial Statements.
DELL TECHNOLOGIES INC.
NOTES TO THE CONSOLIDATED FINANCIAL STATEMENTS
Recently Issued Accounting Pronouncements
NOTE 1 — BASIS OF PRESENTATION
References in these Notes to the Consolidated Financial Statements to the “Company” or “Dell Technologies” mean Dell Technologies Inc. individually and together with its consolidated subsidiaries.
Basis of Presentation — These Consolidated Financial Statements have been prepared in accordance with accounting principles generally accepted in the United States of America (“GAAP”).
Unless the context indicates otherwise, references in these Notes to the Consolidated Financial Statements to “VMware” mean the VMware reportable segment, which reflects the operations of VMware, Inc. (NYSE: VMW) within Dell Technologies.
RSA Security Divestiture — On February 18, 2020, Dell Technologies announced its entry into a definitive agreement with a consortium led by Symphony Technology Group, Ontario Teachers’ Pension Plan Board and AlpInvest Partners to sell RSA Security. On September 1, 2020, the parties closed the transaction. At the completion of the sale, the Company received total cash consideration of approximately $2.082 billion, resulting in a pre-tax gain on sale of $338 million within Interest and other, net on the Consolidated Statements of Income (Loss). The Company ultimately recorded a $21 million loss, net of $359 million in tax expense due to the relatively low tax basis for the assets sold, particularly goodwill. The transaction included the sale of RSA Archer, RSA NetWitness Platform, RSA SecurID, RSA Fraud and Risk Intelligence, and RSA Conference and was intended to further simplify Dell Technologies’ product portfolio and corporate structure. Prior to the divestiture, RSA Security’s operating results were included within Other businesses and did not qualify for presentation as a discontinued operation.
VMware, Inc. Acquisition of Pivotal — On December 30, 2019, VMware, Inc. completed its acquisition of Pivotal Software, Inc. (“Pivotal”) from the Company by merger (the “Pivotal acquisition”), with Pivotal surviving the merger as a wholly-owned subsidiary of VMware, Inc. Each outstanding share of Pivotal’s Class A common stock (other than shares held by Pivotal stockholders who properly exercised their appraisal rights under Delaware law) was converted into the right to receive $15.00 in cash, without interest, and each outstanding share of Pivotal’s Class B common stock was converted into the right to receive 0.0550 of a share of Class B common stock of VMware, Inc. Dell Technologies, which held all outstanding shares of Pivotal’s Class B common stock, received approximately 7.2 million shares of Class B common stock of VMware, Inc. in the transaction. As of the transaction date, Pivotal’s Class A common stock (NYSE: PVTL) ceased to be listed and traded on the New York Stock Exchange (“NYSE”).
Due to the Company’s ownership of a controlling interest in Pivotal, the Company and VMware, Inc. accounted for the acquisition of the controlling interest in Pivotal as a transaction by entities under common control, and, consequently, the transaction had no net effect to the Company’s consolidated financial statements. Subsequent to the Pivotal acquisition, Pivotal operates as a wholly-owned subsidiary of VMware, Inc. and Dell Technologies reports Pivotal results within the VMware reportable segment. Prior to the Pivotal acquisition, Pivotal results were reported within Other businesses. This change in Pivotal segment classification was reflected retrospectively and is presented in Note 19 of the Notes to the Consolidated Financial Statements.
Class V Transaction —On December 28, 2018, the Company completed a transaction, referred to as the “Class V transaction,” pursuant to an Agreement and Plan of Merger (the “Merger Agreement”), dated as of July 1, 2018 and amended as of November 14, 2018, between Dell Technologies and Teton Merger Sub Inc. (“Merger Sub”), a Delaware corporation and wholly-owned subsidiary of Dell Technologies. Pursuant to the Merger Agreement, Merger Sub was merged with and into Dell Technologies (the “Merger”), with Dell Technologies continuing as the surviving corporation.
Dell Technologies completed the Class V transaction following approval of the transaction by its stockholders at a special meeting held on December 11, 2018. Dell Technologies paid $14.0 billion in cash and issued 149,387,617 shares of its Class C Common Stock in connection with the Class V transaction. The non-cash consideration portion of the Class V transaction totaled $6.9 billion. The Class C Common Stock began trading on the NYSE on a when-issued basis as of the opening of trading on December 26, 2018 and on a regular-way basis as of the opening of trading on December 28, 2018. The Class V Common Stock ceased trading on the NYSE prior to the opening of trading on December 28, 2018.
The Class V Common Stock was a class of common stock intended to track the economic performance of a portion of the Company’s interest in the Class V Group, which consisted solely of VMware, Inc. common stock held by the Company. As a result of the Class V transaction, pursuant to which all outstanding shares of Class V Common Stock ceased to be outstanding, the tracking stock feature of the Company’s capital structure was terminated. The Class C Common Stock issued to former holders of the Class V Common Stock represents an interest in the Company’s entire business and, unlike the Class V Common Stock, is not intended to track the performance of any distinct assets or business. The Company’s amended and restated certificate of incorporation that went into effect as of the effective time of the Merger (the “Effective Time”) prohibits the Company from issuing shares of Class V Common Stock.
At the Effective Time, each outstanding share of Class V Common Stock was exchanged for either (a) $120.00 in cash, without interest, subject to a cap of $14.0 billion on the aggregate cash consideration, or (b) 1.8066 shares of Class C Common Stock. The exchange ratio was calculated based on the aggregate amount of cash elections, as well as the aggregate volume-weighted average price per share of Class V Common Stock on the NYSE (as reported on Bloomberg) of $104.8700 for the period of 17 consecutive trading days that began on November 28, 2018 and ended on December 21, 2018.
The aggregate cash consideration and the fees and expenses incurred in connection with the Class V transaction were funded with proceeds of $3.67 billion from new term loans under the Company’s senior secured credit facilities, proceeds of a margin loan financing in an aggregate principal amount of $1.35 billion, proceeds of the Company’s pro-rata portion, in the amount of $8.87 billion, of a special $11 billion cash dividend paid by VMware, Inc. in connection with the Class V transaction, and cash on hand at Dell Technologies and its subsidiaries. See Note 62 of the Notes to the Consolidated Financial Statements for information about the debt incurred by the Company to finance the Class V transaction.
The Merger and the Class V transaction have been accounted for as a hybrid liability and equity transaction involving the repurchase of outstanding common stock, with the consideration consisting of a variable combination of cash and shares. Upon settlement, the accounting for the Class V transaction reflected that the outstanding Class V Common Stock was canceled and exchanged for shares of Class C Common Stock or $120.00 per share in cash or combination of cash and shares, depending on each holder’s election and subject to proration of the cash elections. The variable nature of the cash obligation to repurchase the shares of Class V Common Stock required the Company to settle a portion of the shares in exchange for cash and therefore was accounted for as a financial instrument with an immaterial mark-to-market adjustment for the change in fair value from the date of the stockholder meeting at which the Company’s stockholders voted to approve the Class V transaction to the election deadline by which holders of Class V Common Stock elected the form of consideration for which they exchanged their shares.
EMC Merger Transaction — On September 7, 2016, the Company completed its acquisition of EMC Corporation (“EMC”) by merger (the “EMC merger transaction”). The consolidated results of EMC are included in Dell Technologies’ consolidated results presented in these financial statements.
NOTE 2ITEM 7A — DESCRIPTION OF BUSINESSQUANTITATIVE AND SUMMARY OF SIGNIFICANT ACCOUNTING POLICIESQUALITATIVE DISCLOSURES ABOUT MARKET RISK
Dell Technologies is exposed to a variety of market risks, including risks associated with foreign currency exchange rate fluctuations, interest rate changes affecting its variable-rate debt, and changes in the market value of equity investments. In the normal course of business, Dell Technologies employs established policies and procedures to manage these risks.
Foreign Currency Risk
During Fiscal 2023, the principal foreign currencies in which Dell Technologies transacted business were the Euro, Chinese Renminbi, Japanese Yen, British Pound, Indian Rupee, and Australian Dollar. The objective of Dell Technologies in managing its exposures to foreign currency exchange rate fluctuations is to reduce the impact of adverse fluctuations associated with foreign currency exchange rate changes on earnings and cash flows. Accordingly, Dell Technologies utilizes foreign currency option contracts and forward contracts to hedge its exposure on forecasted transactions and firm commitments for certain currencies. Dell Technologies monitors its foreign currency exchange exposures to ensure the overall effectiveness of its foreign currency hedge positions. However, there can be no assurance that the foreign currency hedging activities will continue to substantially offset the impact of fluctuations in currency exchange rates on Dell Technologies’ results of operations and financial position in the future.
DescriptionBased on the outstanding foreign currency hedge instruments of Business Dell Technologies, which include designated and non-designated instruments, there was a maximum potential one-day loss in fair value at— a 95% confidence level of approximately $37 million as of February 3, 2023 and $16 million as of January 28, 2022 using a Value-at-Risk (“VAR”) model. By using market implied rates and incorporating volatility and correlation among the currencies of a portfolio, the VAR model simulates 10,000 randomly generated market prices and calculates the difference between the fifth percentile and the average as the Value-at-Risk. The CompanyVAR model is a leading global end-to-end technology providerrisk estimation tool and is not intended to represent actual losses in fair value that offerscould be incurred. Additionally, as Dell Technologies utilizes foreign currency instruments for hedging forecasted and firmly committed transactions, a broad rangeloss in fair value for those instruments is generally offset by increases in the value of comprehensive and integrated solutions, which include servers and networking products, storage products, cloud solutions products, desktops, notebooks, services, software, and third-party software and peripherals.the underlying exposure.
The Company’s fiscal year is the 52- or 53-week period ending on the Friday nearest January 31. The fiscal years ended January 29, 2021, January 31, 2020, and February 1, 2019 were 52-week periods.Interest Rate Risk
Principles of Consolidation — These Consolidated Financial Statements include the accounts of Dell Technologies is primarily exposed to interest rate risk related to its variable-rate debt portfolio and its wholly-owned subsidiaries, as well asfixed-rate debt which has been converted to variable-rate debt through the accountsuse of VMware, Inc. and SecureWorks Corp. (“Secureworks”), eachderivative instruments. As of whichFebruary 3, 2023, the majority of this risk exposure is majority-owned by Dell Technologies. All intercompany transactions have been eliminated.related to DFS borrowings.
DFS debt represents borrowings under securitization programs and structured financing programs that facilitate the funding of leases, loans, and other alternative payment structures. Amounts outstanding under these facilities generally bear interest at variable rates equal to applicable margins plus specified base rates. Interest expense on such borrowings is recognized within interest and other, net whereas interest income on the underlying assets is recognized to net revenue over time. The Company also consolidates Variable Interest Entities ("VIEs")uses interest rate swaps to hedge the variability in cash flows related to the interest rate payments on such borrowings. These contracts are not designated for hedge accounting and mark-to-market adjustments are recognized immediately within interest and other, net.
Dell Technologies’ interest rate risk exposure is limited to fluctuations in interest rates on unhedged borrowings where it has been determined thatwe do not mitigate the Company isinterest rate risk through the primary beneficiaryuse of the applicable entities’ operations. interest rate swaps.
As of February 3, 2023, borrowings exposed to interest rate fluctuations were $5 billion, relative to total borrowings of $29.6 billion, and accrued interest at an annual rate between 2.49% and 6.58%. Based on this debt outstanding as of February 3, 2023, a 100 basis point increase in interest rates would have resulted in an increase of approximately $50 million in annual interest expense.
By comparison, as of January 28, 2022, borrowings exposed to interest rate fluctuations were $3.8 billion relative to total borrowings of $27 billion, and accrued interest at an annual rate between (1.5)% and 4.1%. Based on this debt outstanding as of January 28, 2022, a 100 basis point increase in interest rates would have resulted in an increase of approximately $38 million in annual interest expense.
For each VIE, the primary beneficiary is the party that has both the power to direct the activities that most significantly impact the VIE's economic performancemore information about our debt and the obligation to absorb losses or the right to receive benefitsuse of the VIE that could potentially be significant to such VIE. In evaluating whether the Company is the primary beneficiary of each entity, the Company evaluates its power to direct the most significant activities of the VIE by considering the purposederivative instruments, see Note 6, Note 8, and design of each entity and the risks each entity was designed to create and pass through to its respective variable interest holders. The Company also evaluates its economic interests in each of the VIEs. See Note 49 of the Notes to the Consolidated Financial Statements for more information regarding consolidated VIEs.included in this report.
Use of Estimates — The preparation of financial statements in accordance with GAAP requires management to make estimates and assumptions that affect the amounts reported in the Consolidated Financial Statements and the accompanying Notes. Management has considered the actual and potential impacts of the coronavirus disease 2019 (“COVID-19”) pandemic on the Company’s critical and significant accounting estimates. Actual results could differ materially from those estimates.
Cash and Cash Equivalents — All highly liquid investments, including credit card receivables due from banks, with original maturities of 90 days or less at date of purchase, are reported at fair value and are considered to be cash equivalents. All other investments not considered to be cash equivalents are separately categorized as investments.
Investments — All equity and other securities are recorded as long-term investments in the Consolidated Statements of Financial Position.
Strategic investments in publicly-traded companies are recorded at fair value based on quoted prices in active markets. Strategic investments in privately-held companies without readily determinable fair values are recorded at cost, less impairment, and are adjusted for observable price changes. Fair value measurements and impairments for strategic investments are recognized in interest and other, net in the Consolidated Statements of Income (Loss). In evaluating equity investments without readily determinable fair values for impairment or observable price changes, the Company uses inputs that include pre- and post-money valuations of recent financing events and the impact of those events on its fully diluted ownership percentages, as well as other available information regarding the issuer’s historical and forecasted performance.
Allowance for Expected Credit Losses — The Company recognizes an allowance for losses on accounts receivable in an amount equal to the current expected credit losses. The estimation of the allowance is based on an analysis of historical loss experience, current receivables aging, and management’s assessment of current conditions and reasonable and supportable expectation of future conditions, as well as an assessment of specific identifiable customer accounts considered at risk or uncollectible. The Company assesses collectibility by pooling receivables where similar characteristics exist and evaluates receivables individually when specific customer balances no longer share those risk characteristics and are considered at risk or uncollectible. The expense associated with the allowance for expected credit losses is recognized in selling, general, and administrative expenses.
The Company’s policy for estimating this allowance is based on an expected loss model and reflects the adoption of the new accounting standard related to current expected credit losses in the most recent fiscal year. See “Recently Adopted Accounting Pronouncements” in this Note 2 for more information. In prior periods, this allowance was estimated using an incurred loss model, which did not require the consideration of forward-looking information and conditions in the reserve calculation.
Transition from LIBOR to Alternative Reference Rates — The London Interbank Offered Rate (“LIBOR”) is the subject of recent regulatory guidance and proposals for reform. As a result of these reforms, the ICE Benchmark Administration Limited, the administrator of LIBOR, ceased publication for the one-week and two-month USD LIBOR settings on December 31, 2021 and is expected to begin phasing out the remaining USD LIBOR settings on July 1, 2023. We have completed identification of impacted financial instruments and contracts and have been working to transition such contracts linked to LIBOR to alternative reference rates.
Equity Price Risk
Accounting for Operating Leases as a LesseeStrategic Investments — In its ordinary course of business,Our strategic investments include early-stage, privately-held companies that are considered to be in the Company enters into leases as a lessee for office buildings, warehouses, employee vehicles,start-up or development stages and equipment.are inherently risky. The Company determines if an arrangement is a leasetechnologies or contains a lease at inception. Operating leasesproducts these companies have under development are typically in the early stages and may never materialize, which could result in a loss of a substantial part of our initial investment in the recognition of right of use (“ROU”) assetscompanies. We record these investments at cost, less impairment, adjusted for observable price changes. The evaluation is based on information provided by these companies, which are not subject to the same disclosure obligations as U.S. publicly-traded companies, and lease liabilities onas such, the Consolidated Statements of Financial Position. ROU assets representbasis for these evaluations is subject to the right to use an underlying asset for the lease termtiming and lease liabilities represent the obligation to make lease payments arising from the lease, measured on a discounted basis. At lease inception, the lease liability is measured at the present valueaccuracy of the lease payments over the lease term. The operating lease ROU asset equals the lease liability adjusted for any initial direct costs, prepaid or deferred rent,data provided. During Fiscal 2023, we recognized a net loss of $206 million on our strategic investments, which was generally in line with overall public equity market declines. As of February 3, 2023 and lease incentives. The Company uses the implicit rate when readily determinable. As mostJanuary 28, 2022, we held strategic investments in non-marketable securities of the leases do not provide an implicit rate, the Company uses its incremental borrowing rate based on the information available at the commencement date to determine the present value of lease payments. Incremental borrowing rates used to determine the present value of lease payments were derived by reference to the Company’s secured-debt yields corresponding to the lease commencement date.$1.3 billion and $1.4 billion, respectively.
The lease term may include options to extend or to terminate the lease that the Company is reasonably certain to exercise. Lease expense is recognized on a straight-line basis over the lease term in most instances. The Company has elected not to record leases with an initial term of 12 months or less on the Consolidated Statements of Financial Position. Lease expense on such leases is recognized on a straight-line basis over the lease term. The Company does not generate material sublease income and has no material related party leases. The Company’s lease agreements do not contain any material residual value guarantees or material restrictive covenants.
The Company’s office building agreements contain costs such as common area maintenance and other executory costs that are variable in nature. Variable lease costs are expensed as incurred. The Company combines lease and non-lease components, such as common area and other maintenance costs, in calculating the ROU assets and lease liabilities for its office buildings and employee vehicles. Under certain service agreements with third-party logistics providers, the Company directs the use of the inventory within the warehouses and, therefore, controls the assets. The warehouses and some of the equipment used are considered embedded leases. The Company accounts for the lease and non-lease components separately. The lease components consist of the warehouses and some of the equipment, such as conveyor belts. The non-lease components consist of services and other shared equipment, such as material handling and transportation. The Company allocates the consideration to the lease and non-lease components using their relative standalone values. See Note 5 of the Notes to the Consolidated Financial Statements included in this report for additional information.
Accounting for Leases as a Lessor — The Company’s wholly-owned subsidiary Dell Financial Services and its affiliates (“DFS”) act as a lessor to provide equipment financing to customers through a variety of lease arrangements (“DFS leases”). Subsequent to the adoption of amended accounting guidance for leasing transactions (the “current lease standard”), new DFS leases are classified as sales-type leases, direct financing leases, or operating leases. Direct financing leases under the current lease standard are immaterial. Leases that commenced prior to the adoption of the current lease standard were not reassessed or restated pursuant to the practical expedients elected and continue to be accounted for under previous lease accounting guidance.
The Company also offers alternative payment structures and “as-a-service” offerings that are assessed to determine whether an embedded lease arrangement exists. The Company accounts for those contracts as a lease arrangement under the current lease standard if it is determined that the contract contains an identified asset and that control of that asset has transferred to the customer.
When a contract includes lease and non-lease components, the Company allocates consideration under the contract to each component based on relative standalone selling price and subsequently assesses lease classification for each lease component within a contract. DFS provides lessees with the option to extend the lease or purchase the underlying asset at the end of the lease term, which is considered when evaluating lease classification. In general, DFS’s lease arrangements do not have variable payment terms and are typically non-cancelable.
On commencement of sales-type leases, the Company recognizes profit up-front, and amounts due from the customer under the lease contract are recognized as financing receivables on the Consolidated Statements of Financial Position. Interest income is recognized as Net revenue over the term of the lease based on the effective interest method. The Company has elected not to include sales and other taxes collected from the lessee as part of lease revenue.
All other leases that do not meet the definition of a sales-type lease or direct financing lease are classified as operating leases. The underlying asset in an operating lease arrangement is carried at depreciated cost as “Equipment under operating leases” within Property, plant, and equipment, net on the Consolidated Statements of Financial Position. Depreciation is calculated using the straight-line method over the term of the underlying lease contract and is recognized as Cost of net revenue. The depreciable basis is the original cost of the equipment less the estimated residual value of the equipment at the end of the lease term. The residual value is based upon estimates of the value of the equipment at the end of the lease term using historical studies, industry data, and future value-at-risk demand valuation methods. The Company recognizes operating lease income to product revenue on a straight-line basis over the lease term and expenses deferred initial direct costs on the same basis. Impairment of equipment under operating leases is assessed on the same basis as other long-lived assets.
See Note 4 of the Notes to the Consolidated Financial Statements for more information regarding the Company’s lessor arrangements.
Financing ReceivablesITEM 8 — Financing receivables are presented net of allowance for losses and consist of customer receivables and residual interest. Gross customer receivables includes amounts due from customers under revolving loans, fixed-term loans, fixed-term sales-type or direct financing leases, and accrued interest. The Company has two portfolios, consisting of (i) fixed-term leases and loans and (ii) revolving loans, and assesses risk at the portfolio level to determine the appropriate allowance levels. The portfolio segments are further segregated into classes based on products, customer type, and credit risk evaluation: (i) Revolving — Dell Preferred Account (“DPA”); (ii) Revolving — Dell Business Credit (“DBC”); and (iii) Fixed-term — Consumer and Commercial. Fixed-term leases and loans are offered to qualified small and medium-sized businesses, large commercial accounts, governmental organizations, and educational entities. Fixed-term loans are also offered to qualified individual consumers. Revolving loans are offered under private label credit financing programs. The DPA revolving loan programs are primarily offered to individual consumers and the DBC revolving loan programs are primarily offered to small and medium-sized business customers. FINANCIAL STATEMENTS
The Company retains a residual interest in equipment leased under its fixed-term lease programs. The amount of the residual interest is established at the inception of the lease based upon estimates of the value of the equipment at the end of the lease term using historical studies, industry data, and future value-at-risk demand valuation methods.
Allowance for Financing Receivables Losses — The Company recognizes an allowance for losses on financing receivables, including both the lease receivable and unguaranteed residual, in an amount equal to the probable losses net of recoveries. The allowance for losses on the lease receivable is determined based on various factors, including lifetime expected losses determined using macroeconomic forecast assumptions and management judgments applicable to and through the expected life of the portfolios as well as past due receivables, receivable type, and customer risk profile. Both fixed and revolving receivable loss rates are affected by macroeconomic conditions, including the level of gross domestic product (“GDP”) growth, the level of commercial capital equipment investment, unemployment rates, and the credit quality of the borrower.
Generally, expected credit losses as a result of residual value risk on equipment under lease are not considered to be significant primarily because of the existence of a secondary market with respect to the equipment. The lease agreement also clearly defines applicable return conditions and remedies for non-compliance, to ensure that the leased equipment will be in good operating condition upon return. Model changes and updates, as well as market strength and product acceptance, are monitored and adjustments are made to residual values in accordance with the significance of any such changes.
When an account is deemed to be uncollectible, customer account principal and interest are charged off to the allowance for losses. While the Company does not generally place financing receivables on non-accrual status during the delinquency period, accrued interest is included in the allowance for loss calculation and, therefore, the Company is adequately reserved in the event of charge off. Recoveries on receivables previously charged off as uncollectible are recorded to the allowance for financing receivables losses. The expense associated with the allowance for financing receivables losses is recognized as cost of net revenue.
The Company’s policy for estimating this allowance is based on an expected loss model and reflects the adoption of the new accounting standard related to current expected credit losses in the most recent fiscal year. See “Recently Adopted Accounting Pronouncements” in this Note 2 for more information. In prior periods, this allowance was estimated using an incurred loss model, which did not require the consideration of forward-looking information and conditions in the reserve calculation.
Asset Securitization — The Company transfers certain U.S. and European customer loan and lease payments and associated equipment to Special Purpose Entities (“SPEs”) that meet the definition of a Variable Interest Entity (“VIE”) and are consolidated into the Consolidated Financial Statements. These SPEs are bankruptcy-remote legal entities with separate assets and liabilities. The purpose of the SPEs is to facilitate the funding of customer loan and lease payments and associated equipment in the capital markets. These SPEs have entered into financing arrangements with multi-seller conduits that, in turn, issue asset-backed debt securities in the capital markets. The asset securitizations in the SPEs are accounted for as secured borrowings. See Note 4 of the Notes to the Consolidated Financial Statements for additional information on the impact of the consolidation.
Inventories — Inventories are stated at the lower of cost or net realizable value, with cost being determined on a first-in, first-out basis. Adjustments to reduce the cost of inventory to its net realizable value are made, if required, for estimated excess, obsolescence, or impaired balances. At the point of the loss recognition, a new, lower cost basis for that inventory is established, and subsequent changes in facts and circumstances do not result in the restoration or increase in that newly established cost basis.
Property, Plant, and Equipment — Property, plant, and equipment are carried at depreciated cost. Depreciation is determined using the straight-line method over the shorter of the estimated economic lives of the assets or the lease term, as applicable. The estimated useful lives of the Company’s property, plant, and equipment are generally as follows:Index
| | | | | |
| Estimated Useful LifePage |
| 3-5 years |
| Term of underlying lease contract76 |
| 10-30 years or term of underlying land lease |
| Shorter of 5-20 years or lease term |
| 3-5 |
| |
| |
| |
| |
| |
| |
| |
| |
| |
| |
| |
| |
| |
| |
| |
| |
| |
| |
| |
| |
| |
| |
| |
| |
| |
Gains or losses related to retirements or dispositions of fixed assets are recognized in the period during which the retirement or disposition occurs.
Capitalized Software Development Costs — Software development costs related to the development of new product offerings are capitalized subsequent to the establishment of technological feasibility, which is demonstrated by the completion of a detailed program design or working model, if no program design is completed. The Company amortizes capitalized costs on a straight-line basis over the estimated useful lives of the products, which generally range from two to four years.
As of January 29, 2021 and January 31, 2020, capitalized software development costs were $610 million and $679 million, respectively, and are included in other non-current assets, net in the accompanying Consolidated Statements of Financial Position. Amortization expense for the fiscal years ended January 29, 2021, January 31, 2020, and February 1, 2019 was $315 million, $273 million, and $211 million, respectively.
The Company capitalizes certain internal and external costs to acquire or create internal use software which are incurred subsequent to the completion of the preliminary project stage. Development costs are generally amortized on a straight-line basis over five years. Costs associated with maintenance and minor enhancements to the features and functionality of the Company’s internal use software, including its website are expensed as incurred.
Impairment of Long-Lived Assets — The Company reviews long-lived assets for impairment when events or changes in circumstances indicate the carrying amount of an asset may not be recoverable. The Company assesses the recoverability of the assets based on the undiscounted future cash flows expected from the use and eventual disposition of the asset. If the carrying amount of the asset is determined not to be recoverable, a write-down to fair value is recorded. Fair values are determined based on quoted market values, discounted cash flows, or external appraisals, as applicable. Long-lived assets to be disposed of are reported at the lower of carrying amount or fair value less costs to sell.
Report of Independent Registered Public Accounting Firm
To the Board of Directors and Stockholders of Dell Technologies Inc.
Opinions on the Financial Statements and Internal Control over Financial Reporting
We have audited the accompanying consolidated statements of financial position of Dell Technologies Inc.and its subsidiaries (the “Company”) as of February 3, 2023and January 28, 2022,and the related consolidatedstatements of income, of comprehensive income, of stockholders’ equity (deficit) and of cash flows for each of the three years in the period ended February 3, 2023, including the related notes (collectively referred to as the “consolidated financial statements”).We also have audited the Company's internal control over financial reporting as of February 3, 2023, based on criteria established in Internal Control - Integrated Framework(2013)issued by the Committee of Sponsoring Organizations of the Treadway Commission (COSO).
In our opinion, the consolidated financial statements referred to above present fairly, in all material respects, the financial position of the Company as of February 3, 2023and January 28, 2022, and the results of itsoperations and itscash flows for each of the three years in the period ended February 3, 2023 in conformity with accounting principles generally accepted in the United States of America. Also in our opinion, the Company maintained, in all material respects, effective internal control over financial reporting as of February 3, 2023, based on criteria established in Internal Control - Integrated Framework(2013)issued by the COSO.
Basis for Opinions
The Company's management is responsible for these consolidated financial statements, for maintaining effective internal control over financial reporting, and for its assessment of the effectiveness of internal control over financial reporting, included in Management’s Annual Report on Internal Control Over Financial Reporting appearing under Item 9A. Our responsibility is to express opinions on the Company’s consolidated financial statements and on the Company's internal control over financial reporting based on our audits. We are a public accounting firm registered with the Public Company Accounting Oversight Board (United States) (PCAOB) and are required to be independent with respect to the Company in accordance with the U.S. federal securities laws and the applicable rules and regulations of the Securities and Exchange Commission and the PCAOB.
We conducted our audits in accordance with the standards of the PCAOB. Those standards require that we plan and perform the audits to obtain reasonable assurance about whether the consolidated financial statements are free of material misstatement, whether due to error or fraud, and whether effective internal control over financial reporting was maintained in all material respects.
Our audits of the consolidated financial statements included performing procedures to assess the risks of material misstatement of the consolidated financial statements, whether due to error or fraud, and performing procedures that respond to those risks. Such procedures included examining, on a test basis, evidence regarding the amounts and disclosures in the consolidated financial statements. Our audits also included evaluating the accounting principles used and significant estimates made by management, as well as evaluating the overall presentation of the consolidated financial statements. Our audit of internal control over financial reporting included obtaining an understanding of internal control over financial reporting, assessing the risk that a material weakness exists, and testing and evaluating the design and operating effectiveness of internal control based on the assessed risk. Our audits also included performing such other procedures as we considered necessary in the circumstances. We believe that our audits provide a reasonable basis for our opinions.
Definition and Limitations of Internal Control over Financial Reporting
A company’s internal control over financial reporting is a process designed to provide reasonable assurance regarding the reliability of financial reporting and the preparation of financial statements for external purposes in accordance with generally accepted accounting principles. A company’s internal control over financial reporting includes those policies and procedures that (i) pertain to the maintenance of records that, in reasonable detail, accurately and fairly reflect the transactions and dispositions of the assets of the company; (ii) provide reasonable assurance that transactions are recorded as necessary to permit preparation of financial statements in accordance with generally accepted accounting principles, and that receipts and expenditures of the company are being made only in accordance with authorizations of management and directors of the company; and (iii) provide reasonable assurance regarding prevention or timely detection of unauthorized acquisition, use, or disposition of the company’s assets that could have a material effect on the financial statements.
Business Combinations — The assets and liabilitiesBecause of acquired businessesits inherent limitations, internal control over financial reporting may not prevent or detect misstatements. Also, projections of any evaluation of effectiveness to future periods are recorded at their fair values atsubject to the daterisk that controls may become inadequate because of acquisition. The excess of the purchase price over the fair value of the tangible and intangible assets acquired and the liabilities assumed is recorded as goodwill. During the measurement period, which expires one year from the acquisition date, if new information is obtained about facts and circumstances that existed as of the acquisition date, cumulative changes in conditions, or that the estimated fair valuesdegree of compliance with the net assets recordedpolicies or procedures may change the amount of the purchase price allocable to goodwill. If material, the amount will be adjusted in the reporting period in which the adjustment amount is determined. See Note 8 of the Notes to the Consolidated Financial Statements for more information on business combinations.deteriorate.
In-process research and development costs are recorded at fair value as an indefinite-lived intangible asset and assessed for impairment thereafter until completion, at which point the asset is amortized over its expected useful life. All acquisition costs are expensed as incurred, and the results of operations of acquired businesses are included in the Consolidated Financial Statements from the acquisition date.
Intangible Assets Including Goodwill — Identifiable intangible assets with finite lives are amortized over their estimated useful lives. Definite-lived intangible assets are reviewed for impairment when events and circumstances indicate the asset may be impaired. Goodwill and indefinite-lived intangible assets are tested for impairment annually during the third fiscal quarter and whenever events or circumstances indicate that an impairment may have occurred.
Foreign Currency Translation — The majority of the Company’s international sales are made by international subsidiaries, some of which have the U.S. Dollar as their functional currency. The Company’s subsidiaries that do not use the U.S. Dollar as their functional currency translate assets and liabilities at current exchange rates in effect at the balance sheet date. Revenue and expenses from these international subsidiaries are translated using either the monthly average exchange rates in effect for the period in which the activity was recognized or the specific daily exchange rate associated with the date the transactions actually occur. Foreign currency translation adjustments are included as a component of accumulated other comprehensive income (loss) (“OCI”) in stockholders’ equity (deficit).
Local currency transactions of international subsidiaries that have the U.S. Dollar as their functional currency are remeasured into U.S. Dollars using the current rates of exchange for monetary assets and liabilities and historical rates of exchange for nonmonetary assets and liabilities. Gains and losses from remeasurement of monetary assets and liabilities are included in interest and other, net on the Consolidated Statements of Income (Loss). See Note 20 of the Notes to the Consolidated Financial Statements for amounts recognized from remeasurement during the periods presented.
Hedging Instruments — The Company uses derivative financial instruments, primarily forward contracts, options, and swaps, to hedge certain foreign currency and interest rate exposures. The relationships between hedging instruments and hedged items, as well as the risk management objectives and strategies for undertaking hedge transactions, are formally documented. The Company does not use derivatives for speculative purposes. All derivative instruments are recognized as either assets or liabilities in the Consolidated Statements of Financial Position and are measured at fair value.Critical Audit Matters
The Company’s hedge portfolio includes non-designated derivativescritical audit matter communicated below is a matter arising from the current period audit of the consolidated financial statements that was communicated or required to be communicated to the audit committee and derivatives designated as cash flow hedges. For derivative instrumentsthat (i) relates to accounts or disclosures that are designated as cash flow hedges,material to the Company assesses hedge effectiveness atconsolidated financial statements and (ii) involved our especially challenging, subjective, or complex judgments. The communication of critical audit matters does not alter in any way our opinion on the onset of the hedge, then performs qualitative assessments at regular intervals throughout the life of the derivative. The gain or loss on cash flow hedges is recorded in accumulated other comprehensive income (loss),consolidated financial statements, taken as a separate component of stockholders’ equity (deficit),whole, and reclassified into earnings in the period during which the hedged transaction is recognized in earnings. For derivatives thatwe are not, designated as hedges or do not qualify for hedge accounting treatment,by communicating the Company recognizes the change in the instrument’s fair value currently in earnings ascritical audit matter below, providing a component of interest and other, net.
Cash flows from derivative instruments are presented in the same categoryseparate opinion on the Consolidated Statements of Cash Flows as the cash flows from the underlying hedged items. See Note 7 of the Notes to the Consolidated Financial Statements for a description of the Company’s derivative financial instrument activities.
Revenue Recognition — The Company sells a wide portfolio of products and services to its customers. The Company’s agreements have varying requirements dependingcritical audit matter or on the goods and services being sold, the rights and obligations conveyed, and the legal jurisdiction of the arrangement.accounts or disclosures to which it relates.
Revenue is recognized for these arrangements based on the following five steps:Recognition - Identification of Performance Obligations in Revenue Contracts
(1) Identify the contract with a customer. The Company evaluates factsAs described in Notes 2 and circumstances regarding sales transactions in order to identify contracts with its customers. An agreement must meet all of the following criteria to qualify as a contract eligible for revenue recognition under the model: (i) the contract must be approved by all parties who are committed to perform their respective obligations; (ii) each party’s rights regarding the goods and services to be transferred19 to the customer can be identified; (iii)consolidated financial statements, the payment terms for the goods and services can be identified; (iv) the customer has the ability and intent to pay and it is probable that the Company will collect substantially all of the consideration to which it will be entitled; and (v) the contract must have commercial substance. Judgment is used in determining the customer’s ability and intent to pay, which is based upon various factors, including the customer’s historical payment experience or customer credit and financial information.
(2) Identify the performance obligations in the contract. The Company’s contracts with customers often include the promise to transfer multiple goods and services to thea customer. Distinct promises within a contract are referred to as “performance obligations”performance obligations and are accounted for as separate units of account. The CompanyManagement assesses whether each promised good or service is distinct for the purpose of identifying the performance obligations in the contract. This assessment involves subjective determinations and requires management to make judgments about the individual promised goods or services and whether such goods or services are separable from the other aspects of the contractual relationship. Promised goods and services are considered distinct provided that: (i) the customer can benefit from the good or service either on its own or together with other resources that are readily available to the customer (that is, the good or service is capable of being distinct); and (ii) the Company’s promise to transfer the good or service to the customer is separately identifiable from other promises in the contract (that is, the promise to transfer the good or service is distinct within the context of the contract). The Company’s performance obligations include various distinct goods and services such as hardware, software licenses, support and maintenance agreements, and other service offerings and solutions. Promised goods and services are explicitly identified inFor the Company’s contracts and may be sold onyear ended February 3, 2023, a standalone basis or bundled as partsignificant portion of a combined solution. In certain hardware solutions, the hardware is highly interdependent on, and interrelated with, the embedded software. In these offerings, the hardware and software licenses are accounted for as a single performance obligation.
(3) Determine the transaction price. The transaction price reflects the amount of consideration$38.4 billion Infrastructure Solutions Group (“ISG”) reportable segment net revenues relate to which the Company expects to be entitled in exchange for transferring goods or services to the customer. If the consideration promised in a contract includes a variable amount, the Company estimates the amount to which it expects to be entitled using either the expected value or most likely amount method. Generally, volume discounts, rebates, and sales returns reduce the transaction price. In determining the transaction price, the Company only includes amounts that are not subject to significant future reversal.
(4) Allocate the transaction price to performance obligations in the contract. When a contract includes multiple performance obligations, the transaction price is allocated to each performance obligation in an amount that depicts the consideration to which the Company expects to be entitled in exchange for transferring the promised goods or services. For contracts with multiple performance obligations, the transaction price is allocated in proportion to the standalone selling price (“SSP”) of each performance obligation.obligations.
The bestprincipal considerations for our determination that performing procedures relating to the identification of performance obligations in revenue contracts is a critical audit matter are the significant judgment by management in identifying performance obligations in revenue contracts, which in turn led to a high degree of auditor judgment, subjectivity and effort in performing procedures to evaluate whether performance obligations in revenue contracts were appropriately identified by management.
Addressing the matter involved performing procedures and evaluating audit evidence in connection with forming our overall opinion on the consolidated financial statements. These procedures included testing the effectiveness of SSP iscontrols relating to the observable pricerevenue recognition process, including controls related to the proper identification of performance obligations in revenue contracts. These procedures also included, among others, testing the completeness and accuracy of management’s identification of performance obligations by examining revenue contracts on a good or service whentest basis.
/s/ PricewaterhouseCoopers LLP
Austin, Texas
March 30, 2023
We have served as the Company sells that good or service separately Company’s auditor since 1986.
DELL TECHNOLOGIES INC.
CONSOLIDATED STATEMENTS OF FINANCIAL POSITION
(in similar circumstances to similar customers. If a directly observable price is available,millions) | | | | | | | | | | | |
| February 3, 2023 | | January 28, 2022 |
| ASSETS |
| Current assets: | | | |
| Cash and cash equivalents | $ | 8,607 | | | $ | 9,477 | |
| Accounts receivable, net of allowance of $78 and $90 | 12,482 | | | 12,912 | |
| Due from related party, net | 378 | | | 131 | |
| Short-term financing receivables, net of allowance of $142 and $142 (Note 6) | 5,281 | | | 5,089 | |
| Inventories | 4,776 | | | 5,898 | |
| Other current assets | 10,827 | | | 11,526 | |
| Total current assets | 42,351 | | | 45,033 | |
| Property, plant, and equipment, net | 6,209 | | | 5,415 | |
| Long-term investments | 1,518 | | | 1,839 | |
| Long-term financing receivables, net of allowance of $59 and $47 (Note 6) | 5,638 | | | 5,522 | |
| Goodwill | 19,676 | | | 19,770 | |
| Intangible assets, net | 6,468 | | | 7,461 | |
| Due from related party, net | 440 | | | 710 | |
| Other non-current assets | 7,311 | | | 6,985 | |
| Total assets | $ | 89,611 | | | $ | 92,735 | |
| LIABILITIES AND STOCKHOLDERS’ EQUITY |
| Current liabilities: | | | |
| Short-term debt | $ | 6,573 | | | $ | 5,823 | |
| Accounts payable | 18,598 | | | 27,143 | |
| Due to related party | 2,067 | | | 1,414 | |
| Accrued and other | 8,874 | | | 7,578 | |
| Short-term deferred revenue | 15,542 | | | 14,261 | |
| Total current liabilities | 51,654 | | | 56,219 | |
| Long-term debt | 23,015 | | | 21,131 | |
| Long-term deferred revenue | 14,744 | | | 13,312 | |
| Other non-current liabilities | 3,223 | | | 3,653 | |
| Total liabilities | $ | 92,636 | | | $ | 94,315 | |
| Commitments and contingencies (Note 12) | | | |
| Stockholders’ equity (deficit): | | | |
| Common stock and capital in excess of $0.01 par value (Note 15) | 8,424 | | | 7,898 | |
| Treasury stock at cost | (3,813) | | | (964) | |
| Accumulated deficit | (6,732) | | | (8,188) | |
| Accumulated other comprehensive loss | (1,001) | | | (431) | |
| Total Dell Technologies Inc. stockholders’ equity (deficit) | (3,122) | | | (1,685) | |
| Non-controlling interests | 97 | | | 105 | |
| Total stockholders’ equity (deficit) | (3,025) | | | (1,580) | |
| Total liabilities and stockholders’ equity | $ | 89,611 | | | $ | 92,735 | |
The accompanying notes are an integral part of these Consolidated Financial Statements.
DELL TECHNOLOGIES INC.
CONSOLIDATED STATEMENTS OF INCOME
(in millions, except per share amounts)
| | | | | | | | | | | | | | | | | | | | | |
| | | Fiscal Year Ended |
| | | | | | February 3, 2023 | | January 28, 2022 | | January 29, 2021 |
| Net revenue: | | | | | | | | | |
| Products | | | | | $ | 79,250 | | | $ | 79,830 | | | $ | 67,744 | |
| Services | | | | | 23,051 | | | 21,367 | | | 18,926 | |
| Total net revenue | | | | | 102,301 | | | 101,197 | | | 86,670 | |
| Cost of net revenue (a): | | | | | | | | | |
| Products | | | | | 66,029 | | | 67,224 | | | 56,431 | |
| Services | | | | | 13,586 | | | 12,082 | | | 10,099 | |
| Total cost of net revenue | | | | | 79,615 | | | 79,306 | | | 66,530 | |
| Gross margin | | | | | 22,686 | | | 21,891 | | | 20,140 | |
| Operating expenses: | | | | | | | | | |
| Selling, general, and administrative | | | | | 14,136 | | | 14,655 | | | 14,000 | |
| Research and development | | | | | 2,779 | | | 2,577 | | | 2,455 | |
| Total operating expenses | | | | | 16,915 | | | 17,232 | | | 16,455 | |
| Operating income | | | | | 5,771 | | | 4,659 | | | 3,685 | |
| Interest and other, net | | | | | (2,546) | | | 1,264 | | | (1,339) | |
| Income before income taxes | | | | | 3,225 | | | 5,923 | | | 2,346 | |
| Income tax expense | | | | | 803 | | | 981 | | | 101 | |
| Net income from continuing operations | | | | | 2,422 | | | 4,942 | | | 2,245 | |
| Income from discontinued operations, net of income taxes (Note 3) | | | | | — | | | 765 | | | 1,260 | |
| Net income | | | | | 2,422 | | | 5,707 | | | 3,505 | |
| Less: Net loss attributable to non-controlling interests | | | | | (20) | | | (6) | | | (4) | |
| Less: Net income attributable to non-controlling interests of discontinued operations | | | | | — | | | 150 | | | 259 | |
| Net income attributable to Dell Technologies Inc. | | | | | $ | 2,442 | | | $ | 5,563 | | | $ | 3,250 | |
| | | | | | | | | |
| Earnings per share attributable to Dell Technologies Inc. — basic: |
| Continuing operations | | | | | $ | 3.33 | | | $ | 6.49 | | | $ | 3.02 | |
| Discontinued operations | | | | | $ | — | | | $ | 0.81 | | | $ | 1.35 | |
| | | | | | | | | |
| Earnings per share attributable to Dell Technologies Inc. — diluted: |
| Continuing operations | | | | | $ | 3.24 | | | $ | 6.26 | | | $ | 2.93 | |
| Discontinued operations | | | | | $ | — | | | $ | 0.76 | | | $ | 1.29 | |
| | | | | | | | | |
| (a) Includes related party cost of net revenue as follows (Note 21): |
| Products | | | | | $ | 1,634 | | | $ | 1,577 | | | $ | 1,493 | |
| Services | | | | | $ | 3,065 | | | $ | 2,487 | | | $ | 1,848 | |
The accompanying notes are an integral part of these Consolidated Financial Statements.
DELL TECHNOLOGIES INC.
CONSOLIDATED STATEMENTS OF COMPREHENSIVE INCOME
(in millions)
| | | | | | | | | | | | | | | | | | | | | |
| | | Fiscal Year Ended |
| | | | | February 3, 2023 | | January 28, 2022 | | January 29, 2021 |
| Net income | | | | | $ | 2,422 | | | $ | 5,707 | | | $ | 3,505 | |
| | | | | | | | | |
| Other comprehensive income (loss), net of tax | | | | | | | | | |
| Foreign currency translation adjustments | | | | | (222) | | | (385) | | | 528 | |
| | | | | | | | | |
| | | | | | | | | |
| | | | | | | | | |
| | | | | | | | | |
| Cash flow hedges: | | | | | | | | | |
| Change in unrealized gains (losses) | | | | | 354 | | | 374 | | | (200) | |
| Reclassification adjustment for net (gains) losses included in net income | | | | | (705) | | | (158) | | | 100 | |
| Net change in cash flow hedges | | | | | (351) | | | 216 | | | (100) | |
| Pension and other postretirement plans: | | | | | | | | | |
| Recognition of actuarial net gains (losses) from pension and other postretirement plans | | | | | 1 | | | 37 | | | (38) | |
| Reclassification adjustments for net losses from pension and other postretirement plans | | | | | 1 | | | 7 | | | 5 | |
| Net change in actuarial net gains (losses) from pension and other postretirement plans | | | | | 2 | | | 44 | | | (33) | |
| | | | | | | | | |
| Total other comprehensive income (loss), net of tax expense (benefit) of $(17), $30 and $(18), respectively | | | | | (571) | | | (125) | | | 395 | |
| Comprehensive income, net of tax | | | | | 1,851 | | | 5,582 | | | 3,900 | |
| Less: Net income (loss) attributable to non-controlling interests | | | | | (20) | | | 144 | | | 255 | |
| Less: Other comprehensive loss attributable to non-controlling interests | | | | | (1) | | | — | | | — | |
| Comprehensive income attributable to Dell Technologies Inc. | | | | | $ | 1,872 | | | $ | 5,438 | | | $ | 3,645 | |
| | | | | | | | | |
| | | | | | | | | |
| | | | | | | | | |
The accompanying notes are an integral part of these Consolidated Financial Statements.
DELL TECHNOLOGIES INC.
CONSOLIDATED STATEMENTS OF CASH FLOWS
(in millions; continued on next page)
| | | | | | | | | | | | | | | | | |
| | Fiscal Year Ended |
| | February 3, 2023 | | January 28, 2022 | | January 29, 2021 |
| Cash flows from operating activities: | | | | | |
| Net income | $ | 2,422 | | | $ | 5,707 | | | $ | 3,505 | |
| Adjustments to reconcile net income to net cash provided by operating activities: | | | | | |
| Depreciation and amortization | 3,156 | | | 4,551 | | | 5,390 | |
| Stock-based compensation expense | 931 | | | 1,622 | | | 1,609 | |
| Deferred income taxes | (717) | | | (365) | | | (399) | |
| Other, net (a) | 961 | | | (3,130) | | | (88) | |
| Changes in assets and liabilities, net of effects from acquisitions and dispositions: | | | | | |
| Accounts receivable | 113 | | | (2,193) | | | (396) | |
| Financing receivables | (461) | | | (241) | | | (728) | |
| Inventories | 875 | | | (2,514) | | | (243) | |
| Other assets and liabilities | 973 | | | (1,948) | | | (1,656) | |
| Due from/to related party, net | 649 | | | 479 | | | — | |
| Accounts payable | (8,546) | | | 5,742 | | | 1,598 | |
| Deferred revenue | 3,209 | | | 2,597 | | | 2,815 | |
| Change in cash from operating activities | 3,565 | | | 10,307 | | | 11,407 | |
| Cash flows from investing activities: | | | | | |
| Purchases of equity and other investments | (94) | | | (256) | | | (162) | |
| Purchases of held-to-maturity investments | (14) | | | (158) | | | (176) | |
| Maturities and sales of equity and other investments | 116 | | | 513 | | | 169 | |
| Capital expenditures and capitalized software development costs | (3,003) | | | (2,796) | | | (2,082) | |
| Acquisition of businesses and assets, net | (70) | | | (16) | | | (424) | |
| Divestitures of businesses, net | — | | | 3,957 | | | 2,187 | |
| Other | 41 | | | 62 | | | 28 | |
| Change in cash from investing activities | (3,024) | | | 1,306 | | | (460) | |
| Cash flows from financing activities: | | | | | |
| Dividends paid by VMware, Inc. to non-controlling interests | — | | | (2,240) | | | — | |
| Proceeds from the issuance of common stock | 5 | | | 334 | | | 452 | |
| Repurchases of parent common stock (b) | (3,272) | | | (663) | | | (241) | |
| Repurchases of subsidiary common stock | (9) | | | (1,175) | | | (1,363) | |
| Net transfer of cash, cash equivalents, and restricted cash to VMware, Inc. | — | | | (5,052) | | | — | |
| Payments of dividends to stockholders | (964) | | | — | | | — | |
| | | | | |
| Proceeds from debt | 12,479 | | | 20,425 | | | 16,391 | |
| Repayments of debt | (9,825) | | | (26,723) | | | (20,919) | |
| Debt-related costs and other, net | (39) | | | (1,515) | | | (270) | |
| Change in cash from financing activities | (1,625) | | | (16,609) | | | (5,950) | |
| | | | | |
| | | | | |
____________________
(a) During the Company will utilize that price forfiscal year ended January 28, 2022, other, net, includes $4.0 billion pre-tax gain on the SSP. If a directly observable price is not available, the SSP must be estimated. sale of Boomi.
(b) Common stock repurchases are inclusive of employee tax withholding on stock-based compensation.
The Company estimates SSP by considering multiple factors, including, but not limited to, pricing practices, internal costs, and profit objectives as well as overall market conditions, which include geographic or regional specific factors, competitive positioning, and competitor actions.accompanying notes are an integral part of these Consolidated Financial Statements.
DELL TECHNOLOGIES INC.
CONSOLIDATED STATEMENTS OF CASH FLOWS
(continued; in millions)
| | | | | | | | | | | | | | | | | |
| | Fiscal Year Ended |
| | February 3, 2023 | | January 28, 2022 | | January 29, 2021 |
| Effect of exchange rate changes on cash, cash equivalents, and restricted cash | (104) | | | (106) | | | 36 | |
| Change in cash, cash equivalents, and restricted cash | (1,188) | | | (5,102) | | | 5,033 | |
| Cash, cash equivalents, and restricted cash at beginning of the period, including cash attributable to discontinued operations | 10,082 | | | 15,184 | | | 10,151 | |
| Cash, cash equivalents, and restricted cash at end of the period, including cash attributable to discontinued operations | 8,894 | | | 10,082 | | | 15,184 | |
| Less: Cash, cash equivalents, and restricted cash attributable to discontinued operations | — | | | — | | | 4,770 | |
| Cash, cash equivalents, and restricted cash from continuing operations | $ | 8,894 | | | $ | 10,082 | | | $ | 10,414 | |
| Income tax paid | $ | 1,208 | | | $ | 1,257 | | | $ | 1,421 | |
| Interest paid | $ | 1,169 | | | $ | 1,825 | | | $ | 2,279 | |
The accompanying notes are an integral part of these Consolidated Financial Statements.
DELL TECHNOLOGIES INC.
CONSOLIDATED STATEMENTS OF STOCKHOLDERS’ EQUITY (DEFICIT)
(in millions; continued on next page)
| | | | | | | | | | | | | | | | | | | | | | | | | | | | | | | | | | | | | | | | | | | | | | | | | | | | | |
| Common Stock and Capital in Excess of Par Value | | Treasury Stock | | | | | | | | | | |
| | | | | | | | | | | | | | | | | |
| Issued Shares | | Amount | | Shares | | Amount | | Accumulated Deficit | | Accumulated Other Comprehensive Income/(Loss) | | Dell Technologies
Stockholders’ Equity (Deficit) | | Non-Controlling Interests | | Total Stockholders’ Equity (Deficit) |
| Balances as of January 31, 2020 | 745 | | | $ | 16,091 | | | 2 | | | $ | (65) | | | $ | (16,891) | | | $ | (709) | | | $ | (1,574) | | | $ | 4,729 | | | $ | 3,155 | |
| Adjustment for adoption of accounting standards | — | | | — | | | — | | | — | | | (110) | | | — | | | (110) | | | — | | | (110) | |
| Net income | — | | | — | | | — | | | — | | | 3,250 | | | — | | | 3,250 | | | 255 | | | 3,505 | |
| Foreign currency translation adjustments | — | | | — | | | — | | | — | | | — | | | 528 | | | 528 | | | — | | | 528 | |
| Cash flow hedges, net change | — | | | — | | | — | | | — | | | — | | | (100) | | | (100) | | | — | | | (100) | |
| Pension and other post-retirement | — | | | — | | | — | | | — | | | — | | | (33) | | | (33) | | | — | | | (33) | |
| Issuance of common stock, net of shares repurchased for employee tax withholding | 16 | | | 178 | | | — | | | — | | | — | | | — | | | 178 | | | — | | | 178 | |
| Stock-based compensation expense | — | | | 462 | | | — | | | — | | | — | | | — | | | 462 | | | 1,147 | | | 1,609 | |
| Treasury stock repurchases | — | | | — | | | 6 | | | (240) | | | — | | | — | | | (240) | | | — | | | (240) | |
| Revaluation of redeemable shares | — | | | 157 | | | — | | | — | | | — | | | — | | | 157 | | | — | | | 157 | |
| Impact from equity transactions of non-controlling interests | — | | | (39) | | | — | | | — | | | — | | | — | | | (39) | | | (1,057) | | | (1,096) | |
| | | | | | | | | | | | | | | | | |
| Balances as of January 29, 2021 | 761 | | | $ | 16,849 | | | 8 | | | $ | (305) | | | $ | (13,751) | | | $ | (314) | | | $ | 2,479 | | | $ | 5,074 | | | $ | 7,553 | |
The accompanying notes are an integral part of these Consolidated Financial Statements.
DELL TECHNOLOGIES INC.
CONSOLIDATED STATEMENTS OF STOCKHOLDERS’ EQUITY (DEFICIT)
| | | | | | | | | | | | | | | | | | | | | | | | | | | | | | | | | | | | | | | | | | | | | | | | | | | | | |
| Common Stock and Capital in Excess of Par Value | | Treasury Stock | | | | | | | | | | |
| | | | | | | | | | | | | | | | | |
| Issued Shares | | Amount | | Shares | | Amount | | Accumulated Deficit | | Accumulated Other Comprehensive Income/(Loss) | | Dell Technologies
Stockholders’ Equity (Deficit) | | Non-Controlling Interests | | Total Stockholders’ Equity (Deficit) |
| Balances as of January 29, 2021 | 761 | | | $ | 16,849 | | | 8 | | | $ | (305) | | | $ | (13,751) | | | $ | (314) | | | $ | 2,479 | | | $ | 5,074 | | | $ | 7,553 | |
| | | | | | | | | | | | | | | | | |
| Net income | — | | | — | | | — | | | — | | | 5,563 | | | — | | | 5,563 | | | 144 | | | 5,707 | |
| Foreign currency translation adjustments | — | | | — | | | — | | | — | | | — | | | (385) | | | (385) | | | — | | | (385) | |
| Cash flow hedges, net change | — | | | — | | | — | | | — | | | — | | | 216 | | | 216 | | | — | | | 216 | |
| Pension and other post-retirement | — | | | — | | | — | | | — | | | — | | | 44 | | | 44 | | | — | | | 44 | |
| Issuance of common stock, net of shares repurchased for employee tax withholding | 16 | | | 22 | | | — | | | — | | | — | | | — | | | 22 | | | — | | | 22 | |
| Stock-based compensation expense | — | | | 777 | | | — | | | — | | | — | | | — | | | 777 | | | 845 | | | 1,622 | |
| Treasury stock repurchases | — | | | — | | | 12 | | | (659) | | | — | | | — | | | (659) | | | — | | | (659) | |
| Revaluation of redeemable shares | — | | | 472 | | | — | | | — | | | — | | | — | | | 472 | | | — | | | 472 | |
| Impact from equity transactions of non-controlling interests | — | | | (60) | | | — | | | — | | | — | | | — | | | (60) | | | (823) | | | (883) | |
| Dividends paid by VMware, Inc. to non-controlling interests | — | | | — | | | — | | | — | | | — | | | — | | | — | | | (2,240) | | | (2,240) | |
| Spin-off of VMware, Inc. | — | | | (10,162) | | | — | | | — | | | — | | | 8 | | | (10,154) | | | (2,895) | | | (13,049) | |
| | | | | | | | | | | | | | | | | |
| Balances as of January 28, 2022 | 777 | | | $ | 7,898 | | | 20 | | | $ | (964) | | | $ | (8,188) | | | $ | (431) | | | $ | (1,685) | | | $ | 105 | | | $ | (1,580) | |
(5) Recognize revenue when (or as) the performance obligation is satisfied. Revenue is recognized when obligations under the terms of the contract with the Company’s customer are satisfied. Revenue is recognized either over time or at a point in time, depending on when the underlying products or services are transferred to the customer. Revenue is recognized at a point in time for products upon transfer of control. Revenue is recognized over time for support and deployment services, software support, software-as-a-service (“SaaS”), and infrastructure-as-a-service (“IaaS”). Revenue is recognized either over time or at a point in time for professional services and training depending on the nature of the offering to the customer.
The Company reports revenue netaccompanying notes are an integral part of any revenue-based taxes assessed by governmental authorities that are imposed on and concurrently with specific revenue-producing transactions.
The Company has elected the following practical expedients:
•The Company does not account for significant financing components if the period between revenue recognition and when the customer pays for the product or service will be one year or less.
•The Company recognizes revenue equal to the amount it has a right to invoice when the amount corresponds directly with the value to the customer of the Company’s performance to date.
•The Company does not account for shipping and handling activities as a separate performance obligation, but rather as an activity performed to transfer the promised good.
The following summarizes the nature of revenue recognized and the manner in which the Company accounts for sales transactions.
Products
Product revenue consists of revenue from sales of hardware products, including notebooks and desktop PCs, servers, storage hardware, and other hardware-related devices, as well as revenue from software license sales, including non-essential software applications and third-party software licenses.
Revenue from sales of hardware products is recognized when control has transferred to the customer, which typically occurs when the hardware has been shipped to the customer, risk of loss has transferred to the customer, the Company has a present right to payment, and customer acceptance has been satisfied. Customer acceptance is satisfied if acceptance is obtained from the customer, if all acceptance provisions lapse, or if the Company has evidence that all acceptance provisions will be, or have been, satisfied. Revenue from software license sales is generally recognized when control has transferred to the customer, which is typically upon shipment, electronic delivery, or when the software is available for download by the customer. For certain software arrangements in which the customer is granted a right to additional unspecified future software licenses, the Company’s promise to the customer is considered a stand-ready obligation in which the transfer of control and revenue recognition will occur over time.
Services
Services revenue consists of revenue from sales of support services, including hardware support that extends beyond the Company’s standard warranties, software maintenance, and installation; professional services; training; SaaS; and IaaS. Revenue associated with undelivered performance obligations is deferred and recognized when or as control is transferred to the customer. Revenue from fixed-price support or maintenance contracts sold for both hardware and software is recognized on a straight-line basis over the period of performance because the Company is required to provide services at any given time. Other services revenue is recognized when the Company performs the services and the customer receives and consumes the benefits.these Consolidated Financial Statements.
OtherDELL TECHNOLOGIES INC.
CONSOLIDATED STATEMENTS OF STOCKHOLDERS’ EQUITY (DEFICIT)
Revenue from leasing arrangements is not subject to the revenue standard for contracts with customers and remains separately accounted for under existing lease accounting guidance. The Company records operating lease rental revenue as product revenue on a straight-line basis over the lease term. The Company records revenue from the sale of equipment under sales-type leases as product revenue(continued; in an amount equal to the present value of minimum lease payments at the inception of the lease. Sales-type leases also produce financing income, which is included in products net revenue in the Consolidated Statements of Income (Loss) and is recognized at effective rates of return over the lease term. The Company also offers qualified customers fixed-term loans and revolving credit lines for the purchase of products and services offered by the Company. Financing income attributable to these loans is recognized in products net revenue on an accrual basis.
Disaggregation of Revenuemillions — The Company’s revenue is presented on a disaggregated basis on the Consolidated Statements of Income (Loss) and in Note 19 of the Notes to the Consolidated Financial Statements based on an evaluation of disclosures outside of the financial statements, information regularly reviewed by the chief operating decision maker for evaluating the financial performance of operating segments, and other information that is used to evaluate the Company’s financial performance or make resource allocations. This information includes revenue from products and services, revenue from reportable segments, and revenue by major product categories within the segments.)
Contract Assets — Contract assets are rights to consideration in exchange for goods or services that the Company has transferred to a customer when such a right is conditional on something other than the passage of time. Such amounts have been insignificant to date.
Contract Liabilities — Contract liabilities primarily consist of deferred revenue. Deferred revenue is recorded when the Company has a right to invoice or payments have been received for undelivered products or services, or in situations where revenue recognition criteria have not been met. Deferred revenue primarily includes amounts received in advance for extended warranty services and software maintenance. Revenue is recognized on these items when the revenue recognition criteria are met, generally resulting in ratable recognition over the contract term. The Company also has deferred revenue related to undelivered hardware and professional services, consisting of installations and consulting engagements, which are recognized when the Company’s performance obligations under the contract are completed. See Note 9 of the Notes to the Consolidated Financial Statements for additional information about deferred revenue.
Costs to Obtain a Contract —The Company capitalizes incremental direct costs to obtain a contract, primarily sales commissions and employer taxes related to commission payments, if the costs are deemed to be recoverable. The Company has elected, as a practical expedient, to expense as incurred costs to obtain a contract equal to or less than one year in duration. Capitalized costs are deferred and amortized over the period of contract performance or the estimated life of the customer relationship, if renewals are expected, and are typically amortized over an average period of three to seven years. Amortization expense is recognized on a straight-line basis and included in selling, general, and administrative expenses in the Consolidated Statements of Income (Loss). | | | | | | | | | | | | | | | | | | | | | | | | | | | | | | | | | | | | | | | | | | | | | | | | | | | | | |
| Common Stock and Capital in Excess of Par Value | | Treasury Stock | | | | | | | | | | |
| | | | | | | | | | | | | | | | | |
| Issued Shares | | Amount | | Shares | | Amount | | Accumulated Deficit | | Accumulated Other Comprehensive Income/(Loss) | | Dell Technologies
Stockholders’ Equity (Deficit) | | Non-Controlling Interests | | Total Stockholders’ Equity (Deficit) |
| Balances as of January 28, 2022 | 777 | | | $ | 7,898 | | | 20 | | | $ | (964) | | | $ | (8,188) | | | $ | (431) | | | $ | (1,685) | | | $ | 105 | | | $ | (1,580) | |
| | | | | | | | | | | | | | | | | |
| Net income (loss) | — | | | — | | | — | | | — | | | 2,442 | | | — | | | 2,442 | | | (20) | | | 2,422 | |
| Dividends and dividend equivalents declared ($1.32 per common share) | — | | | — | | | — | | | — | | | (986) | | | — | | | (986) | | | — | | | (986) | |
| Foreign currency translation adjustments | — | | | — | | | — | | | — | | | — | | | (221) | | | (221) | | | (1) | | | (222) | |
| Cash flow hedges, net change | — | | | — | | | — | | | — | | | — | | | (351) | | | (351) | | | — | | | (351) | |
| Pension and other post-retirement | — | | | — | | | — | | | — | | | — | | | 2 | | | 2 | | | — | | | 2 | |
| Issuance of common stock, net of shares repurchased for employee tax withholding | 21 | | | (383) | | | — | | | — | | | — | | | — | | | (383) | | | — | | | (383) | |
| Stock-based compensation expense | — | | | 895 | | | — | | | — | | | — | | | — | | | 895 | | | 36 | | | 931 | |
| Treasury stock repurchases | — | | | — | | | 62 | | | (2,849) | | | — | | | — | | | (2,849) | | | — | | | (2,849) | |
| Impact from equity transactions of non-controlling interests | — | | | 14 | | | — | | | — | | | — | | | — | | | 14 | | | (23) | | | (9) | |
| | | | | | | | | | | | | | | | | |
| Balances as of February 3, 2023 | 798 | | | $ | 8,424 | | | 82 | | | $ | (3,813) | | | $ | (6,732) | | | $ | (1,001) | | | $ | (3,122) | | | $ | 97 | | | $ | (3,025) | |
The Company periodically reviewsaccompanying notes are an integral part of these deferred costs to determine whether events or changes in circumstances have occurred that could impact the carrying value or period of benefit of the deferred sales commissions. There were no material impairment losses for deferred costs to obtain a contract during the fiscal years ended January 29, 2021, January 31, 2020, and February 1, 2019.
Deferred costs to obtain a contract as of January 29, 2021 and January 31, 2020 were $1.8 billion and $1.6 billion, respectively. Deferred costs to obtain a contract are classified as current assets and other non-current assets on the Consolidated Statements of Financial Position, based on when the expense is expected to be recognized. Amortization of costs to obtain a contract during the fiscal years ended January 29, 2021, January 31, 2020, and February 1, 2019 was $768 million, $675 million, and $517 million, respectively.
Standard Warranty Liabilities — The Company records warranty liabilities for estimated costs of fulfilling its obligations under standard limited hardware and software warranties at the time of sale. The liability for standard warranties is included in accrued and other current and other non-current liabilities in the Consolidated Statements of Financial Position. The specific warranty terms and conditions vary depending upon the product sold and the country in which the Company does business, but generally includes technical support, parts, and labor over a period ranging from one to three years. Factors that affect the Company’s warranty liability include the number of installed units currently under warranty, historical and anticipated rates of warranty claims on those units, and cost per claim to satisfy the Company’s warranty obligation. The anticipated rate of warranty claims is the primary factor impacting the estimated warranty obligation. The other factors are less significant due to the fact that the average remaining aggregate warranty period of the covered installed base is approximately 18 months, repair parts are generally already in stock or available at pre-determined prices, and labor rates are generally arranged at preestablished amounts with service providers. Warranty claims are relatively predictable based on historical experience of failure rates. If actual results differ from the estimates, the Company revises its estimated warranty liability. Each quarter, the Company reevaluates its estimates to assess the adequacy of its recorded warranty liabilities and adjusts the amounts as necessary.
Vendor Rebates and Settlements — The Company may receive consideration from vendors in the normal course of business. Certain of these funds are rebates of purchase price paid and others are related to reimbursement of costs incurred by the Company to sell the vendor’s products. The Company recognizes a reduction of cost of goods sold if the funds are determined to be a reduction of the price of the vendor’s products. If the consideration is a reimbursement of costs incurred by the Company to sell or develop the vendor’s products, then the consideration is classified as a reduction of such costs, most often operating expenses, in the Consolidated Statements of Income (Loss). In order to be recognized as a reduction of operating expenses, the reimbursement must be for a specific, incremental, and identifiable cost incurred by the Company in selling the vendor’s products or services.
In addition, the Company may settle commercial disputes with vendors from time to time. Claims for loss recoveries are recognized when a loss event has occurred, recovery is considered probable, the agreement is finalized, and collectibility is assured. Amounts received by the Company from vendors for loss recoveries are generally recorded as a reduction of cost of goods sold.
Loss Contingencies — The Company is subject to the possibility of various losses arising in the ordinary course of business. The Company considers the likelihood of loss or impairment of an asset or the incurrence of a liability, as well as the Company’s ability to reasonably estimate the amount of loss, in determining loss contingencies. An estimated loss contingency is accrued when it is probable that an asset has been impaired or a liability has been incurred and the amount of loss can be reasonably estimated. The Company regularly evaluates current information available to determine whether such accruals should be adjusted and whether new accruals are required.
Shipping Costs — The Company’s shipping and handling costs are included in cost of net revenue in the Consolidated Statements of Income (Loss).
Selling, General, and Administrative — Selling expenses include items such as sales salaries and commissions, marketing and advertising costs, contractor services, and allowance for expected credit losses. Advertising costs are expensed as incurred in selling, general, and administrative expenses in the Consolidated Statements of Income (Loss). For the fiscal years ended January 29, 2021, January 31, 2020, and February 1, 2019, advertising expenses were $1.3 billion, $1.3 billion, and $1.1 billion, respectively. General and administrative expenses include items for the Company’s administrative functions, such as finance, legal, human resources, and information technology support. These functions include costs for items such as salaries and benefits and other personnel-related costs, maintenance and supplies, outside services, intangible asset amortization, and depreciation expense.
Research and Development — Research and development (“R&D”) costs are expensed as incurred. R&D costs include salaries and benefits and other personnel-related costs associated with product development. Also included in R&D expenses are infrastructure costs, which consist of equipment and material costs, facilities-related costs, and depreciation expense.
DELL TECHNOLOGIES INC.
Income Taxes — Deferred tax assets and liabilities are recorded based on the difference between the financial statement and tax basis of assets and liabilities using enacted tax rates in effect for the year in which the differences are expected to reverse. The Company calculates a provision for income taxes using the asset and liability method, under which deferred tax assets and liabilities are recognized by identifying the temporary differences arising from the different treatment of items for tax and accounting purposes. The Company accounts for the tax impact of including Global Intangible Low-Taxed Income (GILTI) in U.S. taxable income as a period cost. The Company provides valuation allowances for deferred tax assets, where appropriate. In assessing the need for a valuation allowance, the Company considers all available evidence for each jurisdiction, including past operating results, estimates of future taxable income, and the feasibility of ongoing tax planning strategies. In the event the Company determines that all or part of the net deferred tax assets are not realizable in the future, the Company will make an adjustment to the valuation allowance that will be charged to earnings in the period in which such a determination is made.
The accounting guidance for uncertainties in income tax prescribes a comprehensive model for the financial statement recognition, measurement, presentation, and disclosure of uncertain tax positions taken or expected to be taken in income tax returns. The Company recognizes a tax benefit from an uncertain tax position in the financial statements only when it is more likely than not that the position will be sustained upon examination, including resolution of any related appeals or litigation processes, based on the technical merits and a consideration of the relevant taxing authority’s administrative practices and precedents.
Stock-Based Compensation — The Company measures stock-based compensation expense for all share-based awards granted based on the estimated fair value of those awards at grant date. The Company estimates the fair value of service-based stock options using the Black-Scholes valuation model. To estimate the fair value of performance-based awards containing a market condition, the Company uses the Monte Carlo valuation model. The fair value of all other share-based awards is based on the closing price of the Class C Common Stock as reported on the NYSE on the date of grant.
The compensation cost of service-based stock options, restricted stock, and restricted stock units is recognized net of any estimated forfeitures on a straight-line basis over the employee requisite service period. Compensation cost for performance-based awards is recognized on a graded accelerated basis net of estimated forfeitures over the requisite service period. Forfeiture rates are estimated at grant date based on historical experience and adjusted in subsequent periods for differences in actual forfeitures from those estimates. See Note 16 of the Notes to the Consolidated Financial Statements for further discussion of stock-based compensation.
Recently Issued Accounting Pronouncements
See Note 2 of the Notes to the Consolidated Financial Statements included in this report for a summary of recently issued accounting pronouncements that are applicable to our Consolidated Financial Statements.
ITEM 7A — QUANTITATIVE AND QUALITATIVE DISCLOSURES ABOUT MARKET RISK
Dell Technologies is exposed to a variety of market risks, including risks associated with foreign currency exchange rate fluctuations, interest rate changes affecting its variable-rate debt, and changes in the market value of equity investments. In the normal course of business, Dell Technologies employs established policies and procedures to manage these risks.
Foreign Currency Risk
During Fiscal 2023, the principal foreign currencies in which Dell Technologies transacted business were the Euro, Chinese Renminbi, Japanese Yen, British Pound, Indian Rupee, and Australian Dollar. The objective of Dell Technologies in managing its exposures to foreign currency exchange rate fluctuations is to reduce the impact of adverse fluctuations associated with foreign currency exchange rate changes on earnings and cash flows. Accordingly, Dell Technologies utilizes foreign currency option contracts and forward contracts to hedge its exposure on forecasted transactions and firm commitments for certain currencies. Dell Technologies monitors its foreign currency exchange exposures to ensure the overall effectiveness of its foreign currency hedge positions. However, there can be no assurance that the foreign currency hedging activities will continue to substantially offset the impact of fluctuations in currency exchange rates on Dell Technologies’ results of operations and financial position in the future.
Based on the outstanding foreign currency hedge instruments of Dell Technologies, which include designated and non-designated instruments, there was a maximum potential one-day loss in fair value at a 95% confidence level of approximately $37 million as of February 3, 2023 and $16 million as of January 28, 2022 using a Value-at-Risk (“VAR”) model. By using market implied rates and incorporating volatility and correlation among the currencies of a portfolio, the VAR model simulates 10,000 randomly generated market prices and calculates the difference between the fifth percentile and the average as the Value-at-Risk. The VAR model is a risk estimation tool and is not intended to represent actual losses in fair value that could be incurred. Additionally, as Dell Technologies utilizes foreign currency instruments for hedging forecasted and firmly committed transactions, a loss in fair value for those instruments is generally offset by increases in the value of the underlying exposure.
Interest Rate Risk
Dell Technologies is primarily exposed to interest rate risk related to its variable-rate debt portfolio and fixed-rate debt which has been converted to variable-rate debt through the use of derivative instruments. As of February 3, 2023, the majority of this risk exposure is related to DFS borrowings.
DFS debt represents borrowings under securitization programs and structured financing programs that facilitate the funding of leases, loans, and other alternative payment structures. Amounts outstanding under these facilities generally bear interest at variable rates equal to applicable margins plus specified base rates. Interest expense on such borrowings is recognized within interest and other, net whereas interest income on the underlying assets is recognized to net revenue over time. The Company uses interest rate swaps to hedge the variability in cash flows related to the interest rate payments on such borrowings. These contracts are not designated for hedge accounting and mark-to-market adjustments are recognized immediately within interest and other, net.
Dell Technologies’ interest rate risk exposure is limited to fluctuations in interest rates on unhedged borrowings where we do not mitigate the interest rate risk through the use of interest rate swaps.
As of February 3, 2023, borrowings exposed to interest rate fluctuations were $5 billion, relative to total borrowings of $29.6 billion, and accrued interest at an annual rate between 2.49% and 6.58%. Based on this debt outstanding as of February 3, 2023, a 100 basis point increase in interest rates would have resulted in an increase of approximately $50 million in annual interest expense.
By comparison, as of January 28, 2022, borrowings exposed to interest rate fluctuations were $3.8 billion relative to total borrowings of $27 billion, and accrued interest at an annual rate between (1.5)% and 4.1%. Based on this debt outstanding as of January 28, 2022, a 100 basis point increase in interest rates would have resulted in an increase of approximately $38 million in annual interest expense.
For more information about our debt and use of derivative instruments, see Note 6, Note 8, and Note 9 of the Notes to the Consolidated Financial Statements included in this report.
Transition from LIBOR to Alternative Reference Rates — The London Interbank Offered Rate (“LIBOR”) is the subject of recent regulatory guidance and proposals for reform. As a result of these reforms, the ICE Benchmark Administration Limited, the administrator of LIBOR, ceased publication for the one-week and two-month USD LIBOR settings on December 31, 2021 and is expected to begin phasing out the remaining USD LIBOR settings on July 1, 2023. We have completed identification of impacted financial instruments and contracts and have been working to transition such contracts linked to LIBOR to alternative reference rates.
Equity Price Risk
Strategic Investments — Our strategic investments include early-stage, privately-held companies that are considered to be in the start-up or development stages and are inherently risky. The technologies or products these companies have under development are typically in the early stages and may never materialize, which could result in a loss of a substantial part of our initial investment in the companies. We record these investments at cost, less impairment, adjusted for observable price changes. The evaluation is based on information provided by these companies, which are not subject to the same disclosure obligations as U.S. publicly-traded companies, and as such, the basis for these evaluations is subject to the timing and accuracy of the data provided. During Fiscal 2023, we recognized a net loss of $206 million on our strategic investments, which was generally in line with overall public equity market declines. As of February 3, 2023 and January 28, 2022, we held strategic investments in non-marketable securities of $1.3 billion and $1.4 billion, respectively.
See Note 5 of the Notes to the Consolidated Financial Statements included in this report for additional information.
ITEM 8 — FINANCIAL STATEMENTS
Index
Report of Independent Registered Public Accounting Firm
To the Board of Directors and Stockholders of Dell Technologies Inc.
Opinions on the Financial Statements and Internal Control over Financial Reporting
We have audited the accompanying consolidated statements of financial position of Dell Technologies Inc.and its subsidiaries (the “Company”) as of February 3, 2023and January 28, 2022,and the related consolidatedstatements of income, of comprehensive income, of stockholders’ equity (deficit) and of cash flows for each of the three years in the period ended February 3, 2023, including the related notes (collectively referred to as the “consolidated financial statements”).We also have audited the Company's internal control over financial reporting as of February 3, 2023, based on criteria established in Internal Control - Integrated Framework(2013)issued by the Committee of Sponsoring Organizations of the Treadway Commission (COSO).
In our opinion, the consolidated financial statements referred to above present fairly, in all material respects, the financial position of the Company as of February 3, 2023and January 28, 2022, and the results of itsoperations and itscash flows for each of the three years in the period ended February 3, 2023 in conformity with accounting principles generally accepted in the United States of America. Also in our opinion, the Company maintained, in all material respects, effective internal control over financial reporting as of February 3, 2023, based on criteria established in Internal Control - Integrated Framework(2013)issued by the COSO.
Basis for Opinions
The Company's management is responsible for these consolidated financial statements, for maintaining effective internal control over financial reporting, and for its assessment of the effectiveness of internal control over financial reporting, included in Management’s Annual Report on Internal Control Over Financial Reporting appearing under Item 9A. Our responsibility is to express opinions on the Company’s consolidated financial statements and on the Company's internal control over financial reporting based on our audits. We are a public accounting firm registered with the Public Company Accounting Oversight Board (United States) (PCAOB) and are required to be independent with respect to the Company in accordance with the U.S. federal securities laws and the applicable rules and regulations of the Securities and Exchange Commission and the PCAOB.
We conducted our audits in accordance with the standards of the PCAOB. Those standards require that we plan and perform the audits to obtain reasonable assurance about whether the consolidated financial statements are free of material misstatement, whether due to error or fraud, and whether effective internal control over financial reporting was maintained in all material respects.
Our audits of the consolidated financial statements included performing procedures to assess the risks of material misstatement of the consolidated financial statements, whether due to error or fraud, and performing procedures that respond to those risks. Such procedures included examining, on a test basis, evidence regarding the amounts and disclosures in the consolidated financial statements. Our audits also included evaluating the accounting principles used and significant estimates made by management, as well as evaluating the overall presentation of the consolidated financial statements. Our audit of internal control over financial reporting included obtaining an understanding of internal control over financial reporting, assessing the risk that a material weakness exists, and testing and evaluating the design and operating effectiveness of internal control based on the assessed risk. Our audits also included performing such other procedures as we considered necessary in the circumstances. We believe that our audits provide a reasonable basis for our opinions.
Definition and Limitations of Internal Control over Financial Reporting
A company’s internal control over financial reporting is a process designed to provide reasonable assurance regarding the reliability of financial reporting and the preparation of financial statements for external purposes in accordance with generally accepted accounting principles. A company’s internal control over financial reporting includes those policies and procedures that (i) pertain to the maintenance of records that, in reasonable detail, accurately and fairly reflect the transactions and dispositions of the assets of the company; (ii) provide reasonable assurance that transactions are recorded as necessary to permit preparation of financial statements in accordance with generally accepted accounting principles, and that receipts and expenditures of the company are being made only in accordance with authorizations of management and directors of the company; and (iii) provide reasonable assurance regarding prevention or timely detection of unauthorized acquisition, use, or disposition of the company’s assets that could have a material effect on the financial statements.
Because of its inherent limitations, internal control over financial reporting may not prevent or detect misstatements. Also, projections of any evaluation of effectiveness to future periods are subject to the risk that controls may become inadequate because of changes in conditions, or that the degree of compliance with the policies or procedures may deteriorate.
Critical Audit Matters
The critical audit matter communicated below is a matter arising from the current period audit of the consolidated financial statements that was communicated or required to be communicated to the audit committee and that (i) relates to accounts or disclosures that are material to the consolidated financial statements and (ii) involved our especially challenging, subjective, or complex judgments. The communication of critical audit matters does not alter in any way our opinion on the consolidated financial statements, taken as a whole, and we are not, by communicating the critical audit matter below, providing a separate opinion on the critical audit matter or on the accounts or disclosures to which it relates.
Revenue Recognition - Identification of Performance Obligations in Revenue Contracts
As described in Notes 2 and 19 to the consolidated financial statements, the Company’s contracts with customers often include the promise to transfer multiple goods and services to a customer. Distinct promises within a contract are referred to as performance obligations and are accounted for as separate units of account. Management assesses whether each promised good or service is distinct for the purpose of identifying the performance obligations in the contract. This assessment involves subjective determinations and requires management to make judgments about the individual promised goods or services and whether such goods or services are separable from the other aspects of the contractual relationship. The Company’s performance obligations include various distinct goods and services such as hardware, software licenses, support and maintenance agreements, and other service offerings and solutions. For the year ended February 3, 2023, a significant portion of the $38.4 billion Infrastructure Solutions Group (“ISG”) reportable segment net revenues relate to contracts with multiple performance obligations.
The principal considerations for our determination that performing procedures relating to the identification of performance obligations in revenue contracts is a critical audit matter are the significant judgment by management in identifying performance obligations in revenue contracts, which in turn led to a high degree of auditor judgment, subjectivity and effort in performing procedures to evaluate whether performance obligations in revenue contracts were appropriately identified by management.
Addressing the matter involved performing procedures and evaluating audit evidence in connection with forming our overall opinion on the consolidated financial statements. These procedures included testing the effectiveness of controls relating to the revenue recognition process, including controls related to the proper identification of performance obligations in revenue contracts. These procedures also included, among others, testing the completeness and accuracy of management’s identification of performance obligations by examining revenue contracts on a test basis.
/s/ PricewaterhouseCoopers LLP
Austin, Texas
March 30, 2023
We have served as the Company’s auditor since 1986.
DELL TECHNOLOGIES INC.
CONSOLIDATED STATEMENTS OF FINANCIAL POSITION
(in millions) | | | | | | | | | | | |
| February 3, 2023 | | January 28, 2022 |
| ASSETS |
| Current assets: | | | |
| Cash and cash equivalents | $ | 8,607 | | | $ | 9,477 | |
| Accounts receivable, net of allowance of $78 and $90 | 12,482 | | | 12,912 | |
| Due from related party, net | 378 | | | 131 | |
| Short-term financing receivables, net of allowance of $142 and $142 (Note 6) | 5,281 | | | 5,089 | |
| Inventories | 4,776 | | | 5,898 | |
| Other current assets | 10,827 | | | 11,526 | |
| Total current assets | 42,351 | | | 45,033 | |
| Property, plant, and equipment, net | 6,209 | | | 5,415 | |
| Long-term investments | 1,518 | | | 1,839 | |
| Long-term financing receivables, net of allowance of $59 and $47 (Note 6) | 5,638 | | | 5,522 | |
| Goodwill | 19,676 | | | 19,770 | |
| Intangible assets, net | 6,468 | | | 7,461 | |
| Due from related party, net | 440 | | | 710 | |
| Other non-current assets | 7,311 | | | 6,985 | |
| Total assets | $ | 89,611 | | | $ | 92,735 | |
| LIABILITIES AND STOCKHOLDERS’ EQUITY |
| Current liabilities: | | | |
| Short-term debt | $ | 6,573 | | | $ | 5,823 | |
| Accounts payable | 18,598 | | | 27,143 | |
| Due to related party | 2,067 | | | 1,414 | |
| Accrued and other | 8,874 | | | 7,578 | |
| Short-term deferred revenue | 15,542 | | | 14,261 | |
| Total current liabilities | 51,654 | | | 56,219 | |
| Long-term debt | 23,015 | | | 21,131 | |
| Long-term deferred revenue | 14,744 | | | 13,312 | |
| Other non-current liabilities | 3,223 | | | 3,653 | |
| Total liabilities | $ | 92,636 | | | $ | 94,315 | |
| Commitments and contingencies (Note 12) | | | |
| Stockholders’ equity (deficit): | | | |
| Common stock and capital in excess of $0.01 par value (Note 15) | 8,424 | | | 7,898 | |
| Treasury stock at cost | (3,813) | | | (964) | |
| Accumulated deficit | (6,732) | | | (8,188) | |
| Accumulated other comprehensive loss | (1,001) | | | (431) | |
| Total Dell Technologies Inc. stockholders’ equity (deficit) | (3,122) | | | (1,685) | |
| Non-controlling interests | 97 | | | 105 | |
| Total stockholders’ equity (deficit) | (3,025) | | | (1,580) | |
| Total liabilities and stockholders’ equity | $ | 89,611 | | | $ | 92,735 | |
The accompanying notes are an integral part of these Consolidated Financial Statements.
DELL TECHNOLOGIES INC.
CONSOLIDATED STATEMENTS OF INCOME
(in millions, except per share amounts)
| | | | | | | | | | | | | | | | | | | | | |
| | | Fiscal Year Ended |
| | | | | | February 3, 2023 | | January 28, 2022 | | January 29, 2021 |
| Net revenue: | | | | | | | | | |
| Products | | | | | $ | 79,250 | | | $ | 79,830 | | | $ | 67,744 | |
| Services | | | | | 23,051 | | | 21,367 | | | 18,926 | |
| Total net revenue | | | | | 102,301 | | | 101,197 | | | 86,670 | |
| Cost of net revenue (a): | | | | | | | | | |
| Products | | | | | 66,029 | | | 67,224 | | | 56,431 | |
| Services | | | | | 13,586 | | | 12,082 | | | 10,099 | |
| Total cost of net revenue | | | | | 79,615 | | | 79,306 | | | 66,530 | |
| Gross margin | | | | | 22,686 | | | 21,891 | | | 20,140 | |
| Operating expenses: | | | | | | | | | |
| Selling, general, and administrative | | | | | 14,136 | | | 14,655 | | | 14,000 | |
| Research and development | | | | | 2,779 | | | 2,577 | | | 2,455 | |
| Total operating expenses | | | | | 16,915 | | | 17,232 | | | 16,455 | |
| Operating income | | | | | 5,771 | | | 4,659 | | | 3,685 | |
| Interest and other, net | | | | | (2,546) | | | 1,264 | | | (1,339) | |
| Income before income taxes | | | | | 3,225 | | | 5,923 | | | 2,346 | |
| Income tax expense | | | | | 803 | | | 981 | | | 101 | |
| Net income from continuing operations | | | | | 2,422 | | | 4,942 | | | 2,245 | |
| Income from discontinued operations, net of income taxes (Note 3) | | | | | — | | | 765 | | | 1,260 | |
| Net income | | | | | 2,422 | | | 5,707 | | | 3,505 | |
| Less: Net loss attributable to non-controlling interests | | | | | (20) | | | (6) | | | (4) | |
| Less: Net income attributable to non-controlling interests of discontinued operations | | | | | — | | | 150 | | | 259 | |
| Net income attributable to Dell Technologies Inc. | | | | | $ | 2,442 | | | $ | 5,563 | | | $ | 3,250 | |
| | | | | | | | | |
| Earnings per share attributable to Dell Technologies Inc. — basic: |
| Continuing operations | | | | | $ | 3.33 | | | $ | 6.49 | | | $ | 3.02 | |
| Discontinued operations | | | | | $ | — | | | $ | 0.81 | | | $ | 1.35 | |
| | | | | | | | | |
| Earnings per share attributable to Dell Technologies Inc. — diluted: |
| Continuing operations | | | | | $ | 3.24 | | | $ | 6.26 | | | $ | 2.93 | |
| Discontinued operations | | | | | $ | — | | | $ | 0.76 | | | $ | 1.29 | |
| | | | | | | | | |
| (a) Includes related party cost of net revenue as follows (Note 21): |
| Products | | | | | $ | 1,634 | | | $ | 1,577 | | | $ | 1,493 | |
| Services | | | | | $ | 3,065 | | | $ | 2,487 | | | $ | 1,848 | |
The accompanying notes are an integral part of these Consolidated Financial Statements.
DELL TECHNOLOGIES INC.
CONSOLIDATED STATEMENTS OF COMPREHENSIVE INCOME
(in millions)
| | | | | | | | | | | | | | | | | | | | | |
| | | Fiscal Year Ended |
| | | | | February 3, 2023 | | January 28, 2022 | | January 29, 2021 |
| Net income | | | | | $ | 2,422 | | | $ | 5,707 | | | $ | 3,505 | |
| | | | | | | | | |
| Other comprehensive income (loss), net of tax | | | | | | | | | |
| Foreign currency translation adjustments | | | | | (222) | | | (385) | | | 528 | |
| | | | | | | | | |
| | | | | | | | | |
| | | | | | | | | |
| | | | | | | | | |
| Cash flow hedges: | | | | | | | | | |
| Change in unrealized gains (losses) | | | | | 354 | | | 374 | | | (200) | |
| Reclassification adjustment for net (gains) losses included in net income | | | | | (705) | | | (158) | | | 100 | |
| Net change in cash flow hedges | | | | | (351) | | | 216 | | | (100) | |
| Pension and other postretirement plans: | | | | | | | | | |
| Recognition of actuarial net gains (losses) from pension and other postretirement plans | | | | | 1 | | | 37 | | | (38) | |
| Reclassification adjustments for net losses from pension and other postretirement plans | | | | | 1 | | | 7 | | | 5 | |
| Net change in actuarial net gains (losses) from pension and other postretirement plans | | | | | 2 | | | 44 | | | (33) | |
| | | | | | | | | |
| Total other comprehensive income (loss), net of tax expense (benefit) of $(17), $30 and $(18), respectively | | | | | (571) | | | (125) | | | 395 | |
| Comprehensive income, net of tax | | | | | 1,851 | | | 5,582 | | | 3,900 | |
| Less: Net income (loss) attributable to non-controlling interests | | | | | (20) | | | 144 | | | 255 | |
| Less: Other comprehensive loss attributable to non-controlling interests | | | | | (1) | | | — | | | — | |
| Comprehensive income attributable to Dell Technologies Inc. | | | | | $ | 1,872 | | | $ | 5,438 | | | $ | 3,645 | |
| | | | | | | | | |
| | | | | | | | | |
| | | | | | | | | |
The accompanying notes are an integral part of these Consolidated Financial Statements.
DELL TECHNOLOGIES INC.
CONSOLIDATED STATEMENTS OF CASH FLOWS
(in millions; continued on next page)
| | | | | | | | | | | | | | | | | |
| | Fiscal Year Ended |
| | February 3, 2023 | | January 28, 2022 | | January 29, 2021 |
| Cash flows from operating activities: | | | | | |
| Net income | $ | 2,422 | | | $ | 5,707 | | | $ | 3,505 | |
| Adjustments to reconcile net income to net cash provided by operating activities: | | | | | |
| Depreciation and amortization | 3,156 | | | 4,551 | | | 5,390 | |
| Stock-based compensation expense | 931 | | | 1,622 | | | 1,609 | |
| Deferred income taxes | (717) | | | (365) | | | (399) | |
| Other, net (a) | 961 | | | (3,130) | | | (88) | |
| Changes in assets and liabilities, net of effects from acquisitions and dispositions: | | | | | |
| Accounts receivable | 113 | | | (2,193) | | | (396) | |
| Financing receivables | (461) | | | (241) | | | (728) | |
| Inventories | 875 | | | (2,514) | | | (243) | |
| Other assets and liabilities | 973 | | | (1,948) | | | (1,656) | |
| Due from/to related party, net | 649 | | | 479 | | | — | |
| Accounts payable | (8,546) | | | 5,742 | | | 1,598 | |
| Deferred revenue | 3,209 | | | 2,597 | | | 2,815 | |
| Change in cash from operating activities | 3,565 | | | 10,307 | | | 11,407 | |
| Cash flows from investing activities: | | | | | |
| Purchases of equity and other investments | (94) | | | (256) | | | (162) | |
| Purchases of held-to-maturity investments | (14) | | | (158) | | | (176) | |
| Maturities and sales of equity and other investments | 116 | | | 513 | | | 169 | |
| Capital expenditures and capitalized software development costs | (3,003) | | | (2,796) | | | (2,082) | |
| Acquisition of businesses and assets, net | (70) | | | (16) | | | (424) | |
| Divestitures of businesses, net | — | | | 3,957 | | | 2,187 | |
| Other | 41 | | | 62 | | | 28 | |
| Change in cash from investing activities | (3,024) | | | 1,306 | | | (460) | |
| Cash flows from financing activities: | | | | | |
| Dividends paid by VMware, Inc. to non-controlling interests | — | | | (2,240) | | | — | |
| Proceeds from the issuance of common stock | 5 | | | 334 | | | 452 | |
| Repurchases of parent common stock (b) | (3,272) | | | (663) | | | (241) | |
| Repurchases of subsidiary common stock | (9) | | | (1,175) | | | (1,363) | |
| Net transfer of cash, cash equivalents, and restricted cash to VMware, Inc. | — | | | (5,052) | | | — | |
| Payments of dividends to stockholders | (964) | | | — | | | — | |
| | | | | |
| Proceeds from debt | 12,479 | | | 20,425 | | | 16,391 | |
| Repayments of debt | (9,825) | | | (26,723) | | | (20,919) | |
| Debt-related costs and other, net | (39) | | | (1,515) | | | (270) | |
| Change in cash from financing activities | (1,625) | | | (16,609) | | | (5,950) | |
| | | | | |
| | | | | |
____________________
(a) During the fiscal year ended January 28, 2022, other, net, includes $4.0 billion pre-tax gain on the sale of Boomi.
(b) Common stock repurchases are inclusive of employee tax withholding on stock-based compensation.
The accompanying notes are an integral part of these Consolidated Financial Statements.
DELL TECHNOLOGIES INC.
CONSOLIDATED STATEMENTS OF CASH FLOWS
(continued; in millions)
| | | | | | | | | | | | | | | | | |
| | Fiscal Year Ended |
| | February 3, 2023 | | January 28, 2022 | | January 29, 2021 |
| Effect of exchange rate changes on cash, cash equivalents, and restricted cash | (104) | | | (106) | | | 36 | |
| Change in cash, cash equivalents, and restricted cash | (1,188) | | | (5,102) | | | 5,033 | |
| Cash, cash equivalents, and restricted cash at beginning of the period, including cash attributable to discontinued operations | 10,082 | | | 15,184 | | | 10,151 | |
| Cash, cash equivalents, and restricted cash at end of the period, including cash attributable to discontinued operations | 8,894 | | | 10,082 | | | 15,184 | |
| Less: Cash, cash equivalents, and restricted cash attributable to discontinued operations | — | | | — | | | 4,770 | |
| Cash, cash equivalents, and restricted cash from continuing operations | $ | 8,894 | | | $ | 10,082 | | | $ | 10,414 | |
| Income tax paid | $ | 1,208 | | | $ | 1,257 | | | $ | 1,421 | |
| Interest paid | $ | 1,169 | | | $ | 1,825 | | | $ | 2,279 | |
The accompanying notes are an integral part of these Consolidated Financial Statements.
DELL TECHNOLOGIES INC.
CONSOLIDATED STATEMENTS OF STOCKHOLDERS’ EQUITY (DEFICIT)
(in millions; continued on next page)
| | | | | | | | | | | | | | | | | | | | | | | | | | | | | | | | | | | | | | | | | | | | | | | | | | | | | |
| Common Stock and Capital in Excess of Par Value | | Treasury Stock | | | | | | | | | | |
| | | | | | | | | | | | | | | | | |
| Issued Shares | | Amount | | Shares | | Amount | | Accumulated Deficit | | Accumulated Other Comprehensive Income/(Loss) | | Dell Technologies
Stockholders’ Equity (Deficit) | | Non-Controlling Interests | | Total Stockholders’ Equity (Deficit) |
| Balances as of January 31, 2020 | 745 | | | $ | 16,091 | | | 2 | | | $ | (65) | | | $ | (16,891) | | | $ | (709) | | | $ | (1,574) | | | $ | 4,729 | | | $ | 3,155 | |
| Adjustment for adoption of accounting standards | — | | | — | | | — | | | — | | | (110) | | | — | | | (110) | | | — | | | (110) | |
| Net income | — | | | — | | | — | | | — | | | 3,250 | | | — | | | 3,250 | | | 255 | | | 3,505 | |
| Foreign currency translation adjustments | — | | | — | | | — | | | — | | | — | | | 528 | | | 528 | | | — | | | 528 | |
| Cash flow hedges, net change | — | | | — | | | — | | | — | | | — | | | (100) | | | (100) | | | — | | | (100) | |
| Pension and other post-retirement | — | | | — | | | — | | | — | | | — | | | (33) | | | (33) | | | — | | | (33) | |
| Issuance of common stock, net of shares repurchased for employee tax withholding | 16 | | | 178 | | | — | | | — | | | — | | | — | | | 178 | | | — | | | 178 | |
| Stock-based compensation expense | — | | | 462 | | | — | | | — | | | — | | | — | | | 462 | | | 1,147 | | | 1,609 | |
| Treasury stock repurchases | — | | | — | | | 6 | | | (240) | | | — | | | — | | | (240) | | | — | | | (240) | |
| Revaluation of redeemable shares | — | | | 157 | | | — | | | — | | | — | | | — | | | 157 | | | — | | | 157 | |
| Impact from equity transactions of non-controlling interests | — | | | (39) | | | — | | | — | | | — | | | — | | | (39) | | | (1,057) | | | (1,096) | |
| | | | | | | | | | | | | | | | | |
| Balances as of January 29, 2021 | 761 | | | $ | 16,849 | | | 8 | | | $ | (305) | | | $ | (13,751) | | | $ | (314) | | | $ | 2,479 | | | $ | 5,074 | | | $ | 7,553 | |
The accompanying notes are an integral part of these Consolidated Financial Statements.
DELL TECHNOLOGIES INC.
CONSOLIDATED STATEMENTS OF STOCKHOLDERS’ EQUITY (DEFICIT)
(in millions; continued on next page)
| | | | | | | | | | | | | | | | | | | | | | | | | | | | | | | | | | | | | | | | | | | | | | | | | | | | | |
| Common Stock and Capital in Excess of Par Value | | Treasury Stock | | | | | | | | | | |
| | | | | | | | | | | | | | | | | |
| Issued Shares | | Amount | | Shares | | Amount | | Accumulated Deficit | | Accumulated Other Comprehensive Income/(Loss) | | Dell Technologies
Stockholders’ Equity (Deficit) | | Non-Controlling Interests | | Total Stockholders’ Equity (Deficit) |
| Balances as of January 29, 2021 | 761 | | | $ | 16,849 | | | 8 | | | $ | (305) | | | $ | (13,751) | | | $ | (314) | | | $ | 2,479 | | | $ | 5,074 | | | $ | 7,553 | |
| | | | | | | | | | | | | | | | | |
| Net income | — | | | — | | | — | | | — | | | 5,563 | | | — | | | 5,563 | | | 144 | | | 5,707 | |
| Foreign currency translation adjustments | — | | | — | | | — | | | — | | | — | | | (385) | | | (385) | | | — | | | (385) | |
| Cash flow hedges, net change | — | | | — | | | — | | | — | | | — | | | 216 | | | 216 | | | — | | | 216 | |
| Pension and other post-retirement | — | | | — | | | — | | | — | | | — | | | 44 | | | 44 | | | — | | | 44 | |
| Issuance of common stock, net of shares repurchased for employee tax withholding | 16 | | | 22 | | | — | | | — | | | — | | | — | | | 22 | | | — | | | 22 | |
| Stock-based compensation expense | — | | | 777 | | | — | | | — | | | — | | | — | | | 777 | | | 845 | | | 1,622 | |
| Treasury stock repurchases | — | | | — | | | 12 | | | (659) | | | — | | | — | | | (659) | | | — | | | (659) | |
| Revaluation of redeemable shares | — | | | 472 | | | — | | | — | | | — | | | — | | | 472 | | | — | | | 472 | |
| Impact from equity transactions of non-controlling interests | — | | | (60) | | | — | | | — | | | — | | | — | | | (60) | | | (823) | | | (883) | |
| Dividends paid by VMware, Inc. to non-controlling interests | — | | | — | | | — | | | — | | | — | | | — | | | — | | | (2,240) | | | (2,240) | |
| Spin-off of VMware, Inc. | — | | | (10,162) | | | — | | | — | | | — | | | 8 | | | (10,154) | | | (2,895) | | | (13,049) | |
| | | | | | | | | | | | | | | | | |
| Balances as of January 28, 2022 | 777 | | | $ | 7,898 | | | 20 | | | $ | (964) | | | $ | (8,188) | | | $ | (431) | | | $ | (1,685) | | | $ | 105 | | | $ | (1,580) | |
The accompanying notes are an integral part of these Consolidated Financial Statements.
DELL TECHNOLOGIES INC.
CONSOLIDATED STATEMENTS OF STOCKHOLDERS’ EQUITY (DEFICIT)
(continued; in millions)
| | | | | | | | | | | | | | | | | | | | | | | | | | | | | | | | | | | | | | | | | | | | | | | | | | | | | |
| Common Stock and Capital in Excess of Par Value | | Treasury Stock | | | | | | | | | | |
| | | | | | | | | | | | | | | | | |
| Issued Shares | | Amount | | Shares | | Amount | | Accumulated Deficit | | Accumulated Other Comprehensive Income/(Loss) | | Dell Technologies
Stockholders’ Equity (Deficit) | | Non-Controlling Interests | | Total Stockholders’ Equity (Deficit) |
| Balances as of January 28, 2022 | 777 | | | $ | 7,898 | | | 20 | | | $ | (964) | | | $ | (8,188) | | | $ | (431) | | | $ | (1,685) | | | $ | 105 | | | $ | (1,580) | |
| | | | | | | | | | | | | | | | | |
| Net income (loss) | — | | | — | | | — | | | — | | | 2,442 | | | — | | | 2,442 | | | (20) | | | 2,422 | |
| Dividends and dividend equivalents declared ($1.32 per common share) | — | | | — | | | — | | | — | | | (986) | | | — | | | (986) | | | — | | | (986) | |
| Foreign currency translation adjustments | — | | | — | | | — | | | — | | | — | | | (221) | | | (221) | | | (1) | | | (222) | |
| Cash flow hedges, net change | — | | | — | | | — | | | — | | | — | | | (351) | | | (351) | | | — | | | (351) | |
| Pension and other post-retirement | — | | | — | | | — | | | — | | | — | | | 2 | | | 2 | | | — | | | 2 | |
| Issuance of common stock, net of shares repurchased for employee tax withholding | 21 | | | (383) | | | — | | | — | | | — | | | — | | | (383) | | | — | | | (383) | |
| Stock-based compensation expense | — | | | 895 | | | — | | | — | | | — | | | — | | | 895 | | | 36 | | | 931 | |
| Treasury stock repurchases | — | | | — | | | 62 | | | (2,849) | | | — | | | — | | | (2,849) | | | — | | | (2,849) | |
| Impact from equity transactions of non-controlling interests | — | | | 14 | | | — | | | — | | | — | | | — | | | 14 | | | (23) | | | (9) | |
| | | | | | | | | | | | | | | | | |
| Balances as of February 3, 2023 | 798 | | | $ | 8,424 | | | 82 | | | $ | (3,813) | | | $ | (6,732) | | | $ | (1,001) | | | $ | (3,122) | | | $ | 97 | | | $ | (3,025) | |
The accompanying notes are an integral part of these Consolidated Financial Statements.
DELL TECHNOLOGIES INC.
NOTES TO THE CONSOLIDATED FINANCIAL STATEMENTS
NOTE 1 — BASIS OF PRESENTATION
References in these Notes to the Consolidated Financial Statements to the “Company” or “Dell Technologies” mean Dell Technologies Inc. individually and together with its consolidated subsidiaries.
Basis of Presentation — These Consolidated Financial Statements have been prepared in accordance with accounting principles generally accepted in the United States of America (“GAAP”).
The Company’s fiscal year is the 52- or 53-week period ending on the Friday nearest January 31. The fiscal year ended February 3, 2023 was a 53-week period. The fiscal years ended January 28, 2022 and January 29, 2021 were 52-week periods.
Spin-Off of VMware, Inc. — On November 1, 2021, the Company completed its spin-off of VMware, Inc. (NYSE: VMW) (individually and together with its consolidated subsidiaries, “VMware”) by means of a special stock dividend (the “VMware Spin-off”). The VMware Spin-off was effectuated pursuant to a Separation and Distribution Agreement, dated as of April 14, 2021, between Dell Technologies and VMware (the “Separation and Distribution Agreement”).
Pursuant to the Commercial Framework Agreement (the “CFA”) between Dell Technologies and VMware, Dell Technologies continues to act as a distributor of VMware’s standalone products and services and purchase such products and services for resale to customers. Dell Technologies also continues to integrate VMware’s products and services with Dell Technologies’ offerings and sell them to customers. The results of such operations are presented as continuing operations within the Company’s Consolidated Statements of Income for all periods presented.
In accordance with applicable accounting guidance, the results of VMware, excluding Dell Technologies' resale of VMware offerings, are presented as discontinued operations in the Consolidated Statements of Income and, as such, have been excluded from both continuing operations and segment results for all periods presented prior to the completion of the VMware Spin-off. The Consolidated Statements of Cash Flows are presented on a consolidated basis for both continuing operations and discontinued operations. See Note 3 of the Notes to the Consolidated Financial Statements for additional information on the VMware Spin-off.
Boomi Divestiture — On October 1, 2021, Dell Technologies completed the sale of Boomi, Inc. (“Boomi”) and certain related assets. At the completion of the sale, the Company received total cash consideration of approximately $4.0 billion, resulting in a pre-tax gain on sale of $4.0 billion recognized in interest and other, net on the Consolidated Statements of Income. The Company ultimately recorded a $3.0 billion gain, net of $1.0 billion in tax expense. Prior to the divestiture, Boomi’s operating results were included within other businesses and the divestiture did not qualify for presentation as a discontinued operation.
RSA Security Divestiture — On September 1, 2020, Dell Technologies completed the sale of RSA Security LLC (“RSA Security”) for total cash consideration of approximately $2.1 billion, resulting in a pre-tax gain on sale of $338 million. The Company ultimately recorded a $21 million loss, net of $359 million in tax expense due to the relatively low tax basis for the assets sold, particularly goodwill. Prior to the divestiture, RSA Security’s operating results were included within other businesses and the divestiture did not qualify for presentation as a discontinued operation.
Secureworks — As of February 3, 2023 and January 28, 2022, the Company held approximately 82.6% and 83.9%, respectively, of the outstanding equity interest in Secureworks, excluding restricted stock awards (“RSAs”), and approximately 82.6% and 83.1%, respectively, of the equity interest, including RSAs. The portion of the results of operations of Secureworks allocable to its other owners is shown as net income (loss) attributable to the non-controlling interests in the Consolidated Statements of Income, as an adjustment to net income attributable to Dell Technologies stockholders. The non-controlling interests’ share of equity in Secureworks is reflected as a component of the non-controlling interests in the Consolidated Statements of Financial Position and was $97 million and $105 million as of February 3, 2023 and January 28, 2022, respectively.
Other Events — During the fiscal year ended February 3, 2023, Dell Technologies recognized $171 million in costs associated with exiting the Company’s business in Russia, primarily related to asset impairments and other exit related costs.
DELL TECHNOLOGIES INC.
NOTES TO THE CONSOLIDATED FINANCIAL STATEMENTS (Continued)
NOTE 2 — DESCRIPTION OF BUSINESS AND SUMMARY OF SIGNIFICANT ACCOUNTING POLICIES
Description of Business — Dell Technologies is a leading global end-to-end technology provider that designs, develops, manufactures, markets, sells, and supports a wide range of comprehensive and integrated solutions, products, and services. Dell Technologies offerings include servers and networking, storage, cloud solutions, desktops, notebooks, services, software, and third-party software and peripherals.
Principles of Consolidation — These Consolidated Financial Statements include the accounts of Dell Technologies and its wholly-owned subsidiaries, as well as the accounts of Secureworks, which, as indicated above, is majority-owned by Dell Technologies, and VMware through the date of the VMware Spin-off. All intercompany transactions have been eliminated.
The Company also consolidates Variable Interest Entities ("VIEs") where it has been determined that the Company is the primary beneficiary of the applicable entities’ operations. For each VIE, the primary beneficiary is the party that has both the power to direct the activities that most significantly impact the VIE's economic performance and the obligation to absorb losses or the right to receive benefits of the VIE that could potentially be significant to such VIE. In evaluating whether the Company is the primary beneficiary of each entity, the Company evaluates its power to direct the most significant activities of the VIE by considering the purpose and design of each entity and the risks each entity was designed to create and pass through to its respective variable interest holders. The Company also evaluates its economic interests in each of the VIEs. See Note 6 of the Notes to the Consolidated Financial Statements for more information regarding consolidated VIEs.
Use of Estimates — The preparation of financial statements in accordance with GAAP requires management to make estimates and assumptions that affect the amounts reported in the Consolidated Financial Statements and the accompanying Notes. Actual results could differ materially from those estimates.
Cash and Cash Equivalents — All highly liquid investments, including credit card receivables due from banks, with original maturities of 90 days or less at date of purchase, are reported at fair value and are considered to be cash equivalents. All other investments not considered to be cash equivalents are separately categorized as investments.
Investments — The Company has strategic investments in equity securities as well as investments in fixed-income debt securities. All equity and other securities and long-term fixed income debt securities are recorded as long-term investments in the Consolidated Statements of Financial Position. Short-term fixed income debt securities are recorded as other current assets in the Consolidated Statements of Financial Position.
Strategic investments in marketable equity and other securities are recorded at fair value based on quoted prices in active markets. Strategic investments in non-marketable equity and other securities without readily determinable fair values are recorded at cost, less impairment, and are adjusted for observable price changes. Fair value measurements and impairments for strategic investments are recognized in interest and other, net in the Consolidated Statements of Income. In evaluating equity investments without readily determinable fair values for impairment or observable price changes, the Company uses inputs that include pre- and post-money valuations of recent financing events and the impact of those events on its fully diluted ownership percentages, as well as other available information regarding the issuer’s historical and forecasted performance.
Fixed-income debt securities are carried at amortized cost. The Company intends to hold the fixed-income debt securities to maturity.
Allowance for Expected Credit Losses — The Company recognizes an allowance for losses on accounts receivable in an amount equal to the current expected credit losses. The estimation of the allowance is based on an analysis of historical loss experience, current receivables aging, and management’s assessment of current conditions and reasonable and supportable expectation of future conditions, as well as an assessment of specific identifiable customer accounts considered at risk or uncollectible. The Company assesses collectibility by pooling receivables where similar characteristics exist and evaluates receivables individually when specific customer balances no longer share those risk characteristics and are considered at risk or uncollectible. The expense associated with the allowance for expected credit losses is recognized in selling, general, and administrative expenses.
DELL TECHNOLOGIES INC.
NOTES TO THE CONSOLIDATED FINANCIAL STATEMENTS (continued)
Accounting for Operating Leases as a Lessee — In its ordinary course of business, the Company enters into leases as a lessee for office buildings, warehouses, employee vehicles, and equipment. The Company determines if an arrangement is a lease or contains a lease at inception. The Company’s leases are generally classified as operating leases. Finance leases are immaterial. Operating leases result in the recognition of right of use (“ROU”) assets and lease liabilities on the Consolidated Statements of Financial Position. ROU assets represent the right to use an underlying asset for the lease term and lease liabilities represent the obligation to make lease payments arising from the lease, measured on a discounted basis. At lease commencement, the lease liability is measured at the present value of the lease payments over the lease term. The operating lease ROU asset equals the lease liability adjusted for any initial direct costs, prepaid or deferred rent, and lease incentives. The Company uses the implicit rate when readily determinable. As most of the leases do not provide an implicit rate, the Company uses its incremental borrowing rate based on the information available at the commencement date to determine the present value of lease payments.
The lease term may include options to extend or to terminate the lease that the Company is reasonably certain to exercise. The Company has elected not to record leases with an initial term of 12 months or less on the Consolidated Statements of Financial Position. Lease expense is recognized on a straight-line basis over the lease term in most instances. The Company does not generate material sublease income and has no material related party leases. The Company’s lease agreements do not contain any material residual value guarantees or material restrictive covenants.
The Company’s office building agreements contain costs such as common area maintenance and other executory costs that may be either fixed or variable in nature. Variable lease costs are expensed as incurred. The Company combines lease and non-lease components, including fixed common area and other maintenance costs, in calculating the ROU assets and lease liabilities for its office buildings and employee vehicles. Under certain service agreements with third-party logistics providers, the Company directs the use of the inventory within the warehouses and, therefore, controls the assets. The warehouses and some of the equipment used are considered embedded leases. The Company accounts for the lease and non-lease components separately. The lease components consist of the warehouses and some of the equipment, such as conveyor belts. The non-lease components consist of services and other shared equipment, such as material handling and transportation. The Company allocates the consideration to the lease and non-lease components using their relative standalone values. See Note 7 of the Notes to the Consolidated Financial Statements for additional information.
Accounting for Leases as a Lessor — The Company’s wholly-owned subsidiary Dell Financial Services and its affiliates (“DFS”) act as a lessor to provide equipment financing to customers through a variety of lease arrangements (“DFS leases”). The Company’s leases are classified as sales-type leases, direct financing leases, or operating leases. Direct financing leases are immaterial.
The Company also offers alternative payment structures and as-a-Service offerings that are assessed to determine whether an embedded lease arrangement exists. The Company accounts for those contracts as a lease arrangement if it is determined that the contract contains an identified asset and that control of that asset has transferred to the customer.
When a contract includes lease and non-lease components, the Company allocates consideration under the contract to each component based on relative standalone selling price and subsequently assesses lease classification for each lease component within a contract. DFS provides lessees with the option to extend the lease or purchase the underlying asset at the end of the lease term, which is considered when evaluating lease classification. In general, DFS’s lease arrangements do not have variable payment terms and are typically non-cancelable.
On commencement of sales-type leases, the Company recognizes profit up-front, and amounts due from the customer under the lease contract are recognized as financing receivables on the Consolidated Statements of Financial Position. Interest income is recognized as net product revenue over the term of the lease based on the effective interest method. The Company has elected not to include sales and other taxes collected from the lessee as part of lease revenue.
DELL TECHNOLOGIES INC.
NOTES TO THE CONSOLIDATED FINANCIAL STATEMENTS (continued)
All other leases that do not meet the definition of a sales-type lease or direct financing lease are classified as operating leases. The underlying asset in an operating lease arrangement is carried at depreciated cost as “Equipment under operating leases” within Property, plant, and equipment, net on the Consolidated Statements of Financial Position. Depreciation is calculated using the straight-line method over the term of the underlying lease contract and is recognized as cost of net revenue. The depreciable basis is the original cost of the equipment less the estimated residual value of the equipment at the end of the lease term. The residual value is based upon estimates of the value of the equipment at the end of the lease term using historical studies, industry data, and future value-at-risk demand valuation methods. The Company recognizes operating lease income to product revenue generally on a straight-line basis over the lease term and expenses deferred initial direct costs on the same basis. The Company recognizes variable lease income to product revenue generally as earned. Impairment of equipment under operating leases is assessed on the same basis as other long-lived assets.
Accounting for Fixed-Term Loans —On commencement of fixed-term loans, the Company may recognize profit up-front or over time depending on the product or service offering, and amounts due from the customer under the loan agreement are recognized as financing receivables on the Consolidated Statements of Financial Position. The Company generally recognizes interest income to product revenue based on the effective interest method and expenses deferred initial direct costs on a straight-line basis over the loan term.
Financing Receivables — Financing receivables are presented net of allowance for losses and consist of customer receivables and residual interest. Gross customer receivables include amounts due from customers under revolving loans, fixed-term loans, fixed-term sales-type or direct financing leases, and accrued interest. The Company has two portfolios, consisting of (i) fixed-term leases and loans and (ii) revolving loans, and assesses risk at the portfolio level to determine the appropriate allowance levels. The portfolio segments are further segregated into classes based on products, customer type, and credit risk evaluation: (i) Revolving — Dell Preferred Account (“DPA”); (ii) Revolving — Dell Business Credit (“DBC”); and (iii) Fixed-term — Consumer and Commercial. Fixed-term leases and loans are offered to qualified small and medium-sized businesses, large commercial accounts, governmental organizations, and educational entities. Fixed-term loans are also offered to qualified individual consumers. Revolving loans are offered under private label credit financing programs. The DPA revolving loan programs are primarily offered to individual consumers and the DBC revolving loan programs are primarily offered to small and medium-sized business customers.
The Company retains a residual interest in equipment leased under its fixed-term lease programs. The amount of the residual interest is established at the inception of the lease based upon estimates of the value of the equipment at the end of the lease term using historical studies, industry data, and future value-at-risk demand valuation methods.
Allowance for Financing Receivables Losses — The Company recognizes an allowance for financing receivable losses, including both the lease receivable and unguaranteed residual, in an amount equal to the expected losses net of recoveries. The allowance for financing receivable losses on the lease receivable is determined based on various factors, including lifetime expected losses determined using macroeconomic forecast assumptions and management judgments applicable to and through the expected life of the portfolios as well as past due receivables, receivable type, and customer risk profile. Both fixed and revolving financing receivable loss rates are affected by macroeconomic conditions, including the level of gross domestic product (“GDP”) growth, the level of commercial capital equipment investment, unemployment rates, and the credit quality of the borrower.
Generally, expected credit losses as a result of residual value risk on equipment under lease are not considered to be significant primarily because of the existence of a secondary market with respect to the equipment. The Company’s lease agreements also generally define applicable return conditions and remedies for non-compliance to ensure that the leased equipment will be in good operating condition upon return. Model changes and updates, as well as market strength and product acceptance, are monitored and adjustments are made to residual values in accordance with the significance of any such changes.
When an account is deemed to be uncollectible, customer account principal and interest are charged off to the allowance for losses. While the Company does not generally place financing receivables on non-accrual status during the delinquency period, accrued interest is included in the allowance for loss calculation and, therefore, the Company is adequately reserved in the event of charge off. Recoveries on receivables previously charged off as uncollectible are recorded to the allowance for financing receivables losses. The expense associated with the allowance for financing receivables losses is recognized as cost of net revenue.
DELL TECHNOLOGIES INC.
NOTES TO THE CONSOLIDATED FINANCIAL STATEMENTS (continued)
Asset Securitization — The Company transfers certain U.S. and European customer loan and lease payments and associated equipment to Special Purpose Entities (“SPEs”) that meet the definition of a Variable Interest Entity (“VIE”) and are consolidated into the Consolidated Financial Statements. These SPEs are bankruptcy-remote legal entities with separate assets and liabilities. The purpose of the SPEs is to facilitate the funding of customer loan and lease payments and associated equipment in the capital markets. Some of these SPEs have entered into financing arrangements with multi-seller conduits that, in turn, issue asset-backed debt securities in the capital markets. The asset securitizations in the SPEs are accounted for as secured borrowings.
Inventories — The Company generally records inventory on the Consolidated Statements of Financial Position when legal title and risk of loss has passed to the Company for items that are held for sale in the ordinary course of business, that are in process of production for sale, or that will be consumed in the production of goods or services that will be held for sale. Inventories are stated at the lower of cost or net realizable value, with cost being determined on a first-in, first-out basis. Adjustments to reduce the cost of inventory to its net realizable value are made, if required, for estimated excess, obsolescence, or impaired balances. At the point of the loss recognition, a new, lower cost basis for that inventory is established, and subsequent changes in facts and circumstances do not result in the restoration or increase in the newly established cost basis.
Property, Plant, and Equipment — Property, plant, and equipment are carried at depreciated cost. Depreciation is determined using the straight-line method over the shorter of the estimated useful lives of the assets or the lease term, as applicable. The estimated useful lives of the Company’s property, plant, and equipment are generally as follows:
| | | | | |
| Estimated Useful Life |
| Computer equipment | 3-5 years |
| Equipment under operating leases | Term of underlying lease contract |
| Buildings and building improvements | 10-30 years or term of underlying land lease |
| Leasehold improvements | 5 years or contract term |
| Machinery and equipment | 3-5 years |
Gains or losses related to retirements or dispositions of fixed assets are recognized in the period during which the retirement or disposition occurs.
Capitalized Software Development Costs — Software development costs related to the development of new product offerings are capitalized subsequent to the establishment of technological feasibility, which is demonstrated by the completion of a detailed program design or working model, if no program design is completed. The Company amortizes capitalized costs on a straight-line basis over the estimated useful lives of the products, which generally range from two to four years.
As of February 3, 2023 and January 28, 2022, capitalized software development costs were $673 million and $672 million, respectively, and are included in other non-current assets, net in the accompanying Consolidated Statements of Financial Position. Amortization expense for the fiscal years ended February 3, 2023, January 28, 2022, and January 29, 2021 was $317 million, $263 million, and $315 million, respectively.
The Company capitalizes certain internal and external costs to acquire or create internal use software which are incurred subsequent to the completion of the preliminary project stage. Development costs are generally amortized on a straight-line basis over five years. Costs associated with maintenance and minor enhancements to the features and functionality of the Company’s internal use software are expensed as incurred.
Impairment of Long-Lived Assets — The Company reviews long-lived assets for impairment when events or changes in circumstances indicate the carrying amount of an asset may not be recoverable. The Company assesses the recoverability of the assets based on the undiscounted future cash flows expected from the use and eventual disposition of the asset. If the carrying amount of the asset is determined not to be recoverable, a write-down to fair value is recorded. Fair values are determined based on quoted market values, discounted cash flows, or external appraisals, as applicable. Long-lived assets to be disposed of are reported at the lower of carrying amount or fair value less costs to sell.
Intangible Assets Including Goodwill — Identifiable intangible assets with finite lives are amortized over their estimated useful lives. Indefinite-lived intangible assets are not amortized. Definite-lived intangible assets are reviewed for impairment when
DELL TECHNOLOGIES INC.
NOTES TO THE CONSOLIDATED FINANCIAL STATEMENTS (continued)
events and circumstances indicate the asset may be impaired. Goodwill and indefinite-lived intangible assets are tested for impairment annually during the third fiscal quarter and whenever events or circumstances indicate that an impairment may have occurred.
Foreign Currency Translation — The majority of the Company’s international sales are made by international subsidiaries, some of which have the U.S. Dollar as their functional currency. The Company’s subsidiaries that do not use the U.S. Dollar as their functional currency translate assets and liabilities at current exchange rates in effect at the balance sheet date. Revenue and expenses from these international subsidiaries are translated using either the monthly average exchange rates in effect for the period in which the activity was recognized or the specific daily exchange rate associated with the date the transactions actually occur. Foreign currency translation adjustments are included as a component of accumulated other comprehensive income (loss) (“AOCI”) in stockholders’ equity (deficit).
Local currency transactions of international subsidiaries that have the U.S. Dollar as their functional currency are remeasured into U.S. Dollars using the current rates of exchange for monetary assets and liabilities and historical rates of exchange for nonmonetary assets and liabilities. Gains and losses from remeasurement of monetary assets and liabilities are included in interest and other, net on the Consolidated Statements of Income. See Note 20 of the Notes to the Consolidated Financial Statements for amounts recognized from remeasurement during the periods presented.
Hedging Instruments — The Company uses derivative financial instruments, primarily forward contracts, options, and swaps, to hedge certain foreign currency and interest rate exposures. The relationships between hedging instruments and hedged items, as well as the risk management objectives and strategies for undertaking hedge transactions, are formally documented. The Company does not use derivatives for speculative purposes. All derivative instruments are recognized as either assets or liabilities in the Consolidated Statements of Financial Position and are measured at fair value. The Company’s hedge portfolio includes non-designated derivatives and derivatives designated as cash flow hedges and, from time to time, fair value hedges.
For derivative instruments designated as a cash flow hedge, the Company assesses hedge effectiveness at the onset of the hedge, then performs qualitative assessments at regular intervals throughout the life of the derivative. The gain or loss on the hedge is recorded in AOCI, as a separate component of stockholders’ equity (deficit), and reclassified into earnings in the period during which the hedged transaction is recognized in earnings. For derivatives that are designated as a fair value hedge, the Company evaluates the effectiveness of the qualifying fair value hedge using the shortcut method of accounting under which hedges are assumed to be perfectly effective. The change in fair value of the hedge exactly offsets the fair value of the hedged item and there is no net impact recognized in earnings from the fair value of the derivative. For derivatives that are not designated as hedges or do not qualify for hedge accounting treatment, the Company recognizes the change in the instrument’s fair value in earnings as a component of interest and other, net.
Cash flows from derivative instruments are presented in the same category on the Consolidated Statements of Cash Flows as the cash flows from the underlying hedged items. See Note 9 of the Notes to the Consolidated Financial Statements for a description of the Company’s derivative financial instrument activities.
Revenue Recognition — The Company sells a wide portfolio of products and services to its customers. The Company’s agreements have varying requirements depending on the goods and services being sold, the rights and obligations conveyed, and the legal jurisdiction of the arrangement.
Revenue is recognized for these arrangements based on the following five steps:
(1) Identify the contract with a customer. The Company evaluates facts and circumstances regarding sales transactions in order to identify contracts with its customers. An agreement must meet all of the following criteria to qualify as a contract eligible for revenue recognition under the model: (i) the contract must be approved by all parties who are committed to perform their respective obligations; (ii) each party’s rights regarding the goods and services to be transferred to the customer can be identified; (iii) the payment terms for the goods and services can be identified; (iv) the customer has the ability and intent to pay and it is probable that the Company will collect substantially all of the consideration to which it will be entitled; and (v) the contract must have commercial substance. Judgment is used in determining the customer’s ability and intent to pay, which is based upon various factors, including the customer’s historical payment experience or customer credit and financial information.
DELL TECHNOLOGIES INC.
NOTES TO THE CONSOLIDATED FINANCIAL STATEMENTS (continued)
(2) Identify the performance obligations in the contract. The Company’s contracts with customers often include the promise to transfer multiple goods and services to the customer. Distinct promises within a contract are referred to as “performance obligations” and are accounted for as separate units of account. The Company assesses whether each promised good or service is distinct for the purpose of identifying the performance obligations in the contract. This assessment involves subjective determinations and requires management to make judgments about the individual promised goods or services and whether such goods or services are separable from the other aspects of the contractual relationship. Promised goods and services are considered distinct provided that: (i) the customer can benefit from the good or service either on its own or together with other resources that are readily available to the customer (that is, the good or service is capable of being distinct); and (ii) the Company’s promise to transfer the good or service to the customer is separately identifiable from other promises in the contract (that is, the promise to transfer the good or service is distinct within the context of the contract). The Company’s performance obligations include various distinct goods and services such as hardware, software licenses, support and maintenance agreements, and other service offerings and solutions. Promised goods and services are explicitly identified in the Company’s contracts and may be sold on a standalone basis or bundled as part of a combined solution. In certain hardware solutions, the hardware is highly interdependent on, and interrelated with, the embedded software. In these offerings, the hardware and software licenses are accounted for as a single performance obligation.
(3) Determine the transaction price. The transaction price reflects the amount of consideration to which the Company expects to be entitled in exchange for transferring goods or services to the customer. If the consideration promised in a contract includes a variable amount, the Company estimates the amount to which it expects to be entitled using either the expected value or most likely amount method. Generally, volume discounts, rebates, and sales returns reduce the transaction price. In determining the transaction price, the Company only includes amounts that are not subject to significant future reversal.
(4) Allocate the transaction price to performance obligations in the contract. When a contract includes multiple performance obligations, the transaction price is allocated to each performance obligation in an amount that depicts the consideration to which the Company expects to be entitled in exchange for transferring the promised goods or services. For contracts with multiple performance obligations, the transaction price is allocated in proportion to the standalone selling price (“SSP”) of each performance obligation.
The best evidence of SSP is the observable price of a good or service when the Company sells that good or service separately in similar circumstances to similar customers. If a directly observable price is available, the Company will utilize that price for the SSP. If a directly observable price is not available, the SSP must be estimated. The Company estimates SSP by considering multiple factors, including, but not limited to, pricing practices, internal costs, and profit objectives as well as overall market conditions, which include geographic or regional specific factors, competitive positioning, and competitor actions.
(5) Recognize revenue when (or as) the performance obligation is satisfied. Revenue is recognized when obligations under the terms of the contract with the Company’s customer are satisfied. Revenue is recognized either over time or at a point in time, depending on when the underlying products or services are transferred to the customer. Revenue is recognized at a point in time for products upon transfer of control. Revenue is recognized over time for support and deployment services, software support, Software-as-a-Service (“SaaS”), and Infrastructure-as-a-Service (“IaaS”). Revenue is recognized either over time or at a point in time for professional services and training depending on the nature of the offering to the customer.
The Company reports revenue net of any revenue-based taxes assessed by governmental authorities that are imposed on and concurrently with specific revenue-producing transactions.
The Company has elected the following practical expedients:
•The Company does not account for significant financing components if the period between revenue recognition and when the customer pays for the product or service will be one year or less.
•The Company recognizes revenue equal to the amount it has a right to invoice when the amount corresponds directly with the value to the customer of the Company’s performance to date.
DELL TECHNOLOGIES INC.
NOTES TO THE CONSOLIDATED FINANCIAL STATEMENTS (continued)
•The Company does not account for shipping and handling activities as a separate performance obligation, but rather as an activity performed to transfer the promised good.
The following summarizes the nature of revenue recognized and the manner in which the Company accounts for sales transactions.
Products
Product revenue consists of revenue from sales of hardware products, including notebooks and desktop PCs, servers, storage hardware, and other hardware-related devices, as well as revenue from software license sales, including non-essential software applications and third-party software licenses.
Revenue from sales of hardware products is recognized when control has transferred to the customer, which typically occurs when the hardware has been shipped to the customer, risk of loss has transferred to the customer, the Company has a present right to payment, and customer acceptance has been satisfied. Customer acceptance is satisfied if acceptance is obtained from the customer, if all acceptance provisions lapse, or if the Company has evidence that all acceptance provisions will be, or have been, satisfied. Revenue from software license sales is generally recognized when control has transferred to the customer, which is typically upon shipment, electronic delivery, or when the software is available for download by the customer. For certain software arrangements in which the customer is granted a right to additional unspecified future software licenses, the Company’s promise to the customer is considered a stand-ready obligation in which the transfer of control and revenue recognition will occur over time.
Services
Services revenue consists of revenue from sales of support services, including hardware support that extends beyond the Company’s standard warranties, software maintenance, and installation; professional services; training; SaaS; and IaaS. Revenue associated with undelivered performance obligations is deferred and recognized when or as control is transferred to the customer. Revenue from fixed-price support or maintenance contracts sold for both hardware and software is recognized on a straight-line basis over the period of performance because the Company is required to provide services at any given time. Other services revenue is recognized when the Company performs the services and the customer receives and consumes the benefits.
Other
Revenue from leasing arrangements is not subject to the revenue standard for contracts with customers and remains separately accounted for under lease accounting guidance. The Company records operating lease rental revenue as product revenue on a straight-line basis over the lease term. The Company records revenue under sales-type leases as product revenue in an amount equal to the present value of minimum lease payments at the inception of the lease. Sales-type leases also produce financing income, which is included in product net revenue in the Consolidated Statements of Income and is recognized at effective rates of return over the lease term. The Company also offers qualified customers fixed-term loans and revolving credit lines for the purchase of products and services offered by the Company. Financing income attributable to these loans is recognized in product net revenue on an accrual basis.
Principal versus Agent — For transactions that involve a third party, the Company evaluates whether it is acting as the principal or the agent in the transaction. This determination requires significant judgement and impacts the amount and timing of revenue recognized. If the Company determines that it controls a good or service before it is transferred to the customer, the Company is acting as the principal and recognizes revenue at the gross amount of consideration it is entitled to from the customer. Indicators that the Company controls a good or service before transferring to a customer include, but are not limited to, the Company being the primary obligor to the customer, establishing its own pricing, and having inventory and credit risks. Conversely, if the Company determines that it does not control the good or service before it is transferred to the customer, the Company is acting as an agent in the transaction. As an agent, the Company is arranging for the good or service to be provided by another party and recognizes revenue at the net amount of consideration retained.
DELL TECHNOLOGIES INC.
NOTES TO THE CONSOLIDATED FINANCIAL STATEMENTS (continued)
Disaggregation of Revenue — The Company’s revenue is presented on a disaggregated basis on the Consolidated Statements of Income and in Note 19 of the Notes to the Consolidated Financial Statements based on an evaluation of disclosures outside of the financial statements, information regularly reviewed by the chief operating decision maker for evaluating the financial performance of operating segments, and other information that is used to evaluate the Company’s financial performance or make resource allocations. This information includes revenue from products and services, revenue from reportable segments, and revenue by major product categories within the segments.
Contract Assets — Contract assets are rights to consideration in exchange for goods or services that the Company has transferred to a customer when such a right is conditional on something other than the passage of time. Such amounts have been insignificant to date.
Contract Liabilities — Contract liabilities primarily consist of deferred revenue. Deferred revenue is recorded when the Company has invoiced or payments have been received for undelivered products or services, or in situations where revenue recognition criteria have not been met. Deferred revenue primarily includes amounts received in advance for extended warranty services and software maintenance. Revenue is recognized on these items when the revenue recognition criteria are met, generally resulting in ratable recognition over the contract term. The Company also has deferred revenue related to undelivered hardware and professional services, consisting of installations and consulting engagements, which are recognized when the Company’s performance obligations under the contract are completed. See Note 11 of the Notes to the Consolidated Financial Statements for additional information about deferred revenue.
Deferred Costs — Deferred costs primarily consist ofcosts incurred to fulfill revenue-generating contracts mainly associated with VMware Resale discussed in Note 21 of the Notes to the Consolidated Financial Statements and third-party software support and maintenance. The Company defers these chargesin line with the deferred revenue associated with the contract to obtain the appropriate expense recognition timing. These costs are typically amortized on a straight-line basis over the life of the contract or the average contractduration.
Costs to Obtain a Contract —The Company capitalizes incremental direct costs to obtain a contract, primarily sales commissions and employer taxes related to commission payments, if the costs are deemed to be recoverable. The Company has elected, as a practical expedient, to expense as incurred costs to obtain a contract equal to or less than one year in duration. Capitalized costs are deferred and amortized over the period of contract performance or the estimated life of the customer relationship, if renewals are expected, and are typically amortized over an average period of three to five years. Amortization expense is recognized on a straight-line basis and included in selling, general, and administrative expenses in the Consolidated Statements of Income.
The Company periodically reviews these deferred costs to determine whether events or changes in circumstances have occurred that could impact the carrying value or period of benefit of the deferred sales commissions. There were no material impairment losses for deferred costs to obtain a contract during the fiscal years ended February 3, 2023, January 28, 2022, and January 29, 2021.
Deferred costs to obtain a contract as of February 3, 2023 and January 28, 2022 were $726 million and $734 million, respectively. Deferred costs to obtain a contract are classified as current assets and other non-current assets on the Consolidated Statements of Financial Position, based on when the expense is expected to be recognized. Amortization of costs to obtain a contract during the fiscal years ended February 3, 2023, January 28, 2022, and January 29, 2021 was $390 million, $380 million, and $385 million, respectively.
Standard Warranty Liabilities — The Company records warranty liabilities for estimated costs of fulfilling its obligations under standard limited hardware and software warranties at the time of sale. The liabilities for standard warranties are included in accrued and other current and other non-current liabilities in the Consolidated Statements of Financial Position. The specific warranty terms and conditions vary depending upon the product sold and the country in which the Company does business, but generally includes technical support, parts, and labor over a period ranging from one to three years. Factors that affect the Company’s warranty liabilities include the number of installed units currently under warranty, historical and anticipated rates of warranty claims on those units, and cost per claim to satisfy the Company’s warranty obligation. The anticipated rate of warranty claims is the primary factor impacting the estimated warranty obligation. The other factors are less significant due to the fact that the average remaining aggregate warranty period of the covered installed base is approximately 18 months, repair parts are generally already in stock or available at pre-determined prices, and labor rates are generally arranged at
DELL TECHNOLOGIES INC.
NOTES TO THE CONSOLIDATED FINANCIAL STATEMENTS (continued)
preestablished amounts with service providers. Warranty claims are relatively predictable based on historical experience of failure rates. If actual results differ from the estimates, the Company revises its estimated warranty liability. Each quarter, the Company reevaluates its estimates to assess the adequacy of its recorded warranty liabilities and adjusts the amounts as necessary.
Vendor Rebates — The Company may receive consideration from vendors in the normal course of business. Certain of these funds are rebates of purchase price paid and others are related to reimbursement of costs incurred by the Company to sell the vendor’s products. The Company recognizes a reduction of cost of goods sold if the funds are determined to be a reduction of the price of the vendor’s products. If the consideration is a reimbursement of costs incurred by the Company to sell or develop the vendor’s products, then the consideration is classified as a reduction of such costs, most often operating expenses, in the Consolidated Statements of Income. In order to be recognized as a reduction of operating expenses, the reimbursement must be for a specific, incremental, and identifiable cost incurred by the Company in selling the vendor’s products or services.
Loss Contingencies — The Company is subject to the possibility of various losses arising in the ordinary course of business. The Company considers the likelihood of loss or impairment of an asset or the incurrence of a liability, as well as the Company’s ability to reasonably estimate the amount of loss, in determining loss contingencies. An estimated loss contingency is accrued when it is probable that an asset has been impaired or a liability has been incurred and the amount of loss can be reasonably estimated. The Company regularly evaluates current information available to determine whether such accruals should be adjusted and whether new accruals are required.
Shipping Costs — The Company’s shipping and handling costs are included in cost of net revenue in the Consolidated Statements of Income.
Selling, General, and Administrative — Selling expenses include items such as sales salaries and commissions, marketing and advertising costs, and contractor services. Advertising costs are expensed as incurred in selling, general, and administrative expenses in the Consolidated Statements of Income. For the fiscal years ended February 3, 2023, January 28, 2022, and January 29, 2021, advertising expenses were $1.1 billion, $1.3 billion, and $1.0 billion, respectively. General and administrative expenses include items for the Company’s administrative functions, such as finance, legal, human resources, and information technology support. These functions include costs for items such as salaries and benefits and other personnel-related costs, maintenance and supplies, outside services, intangible asset amortization, and depreciation expense.
Research and Development — Research and development (“R&D”) costs are expensed as incurred. As noted in Capitalized Software Development Costs in this Note, qualifying software development costs are capitalized and amortized over time. R&D costs include salaries and benefits and other personnel-related costs associated with product development. Also included in R&D expenses are infrastructure costs, which consist of equipment and material costs, facilities-related costs, and depreciation expense.
Income Taxes — Deferred tax assets and liabilities are recorded based on the difference between the financial statement and tax basis of assets and liabilities using enacted tax rates in effect for the year in which the differences are expected to reverse. The Company calculates a provision for income taxes using the asset and liability method, under which deferred tax assets and liabilities are recognized by identifying the temporary differences arising from the different treatment of items for tax and accounting purposes. The Company accounts for the tax impact of including Global Intangible Low-Taxed Income (GILTI) in U.S. taxable income as a period cost. The Company provides valuation allowances for deferred tax assets, where appropriate. In assessing the need for a valuation allowance, the Company considers all available evidence for each jurisdiction, including past operating results, estimates of future taxable income, and the feasibility of ongoing tax planning strategies. In the event the Company determines that all or part of the net deferred tax assets are not realizable in the future, the Company will make an adjustment to the valuation allowance that will be charged to earnings in the period in which such a determination is made.
The accounting guidance for uncertainties in income tax prescribes a comprehensive model for the financial statement recognition, measurement, presentation, and disclosure of uncertain tax positions taken or expected to be taken in income tax returns. The Company recognizes a tax benefit from an uncertain tax position in the financial statements only when it is more likely than not that the position will be sustained upon examination, including resolution of any related appeals or litigation processes, based on the technical merits and a consideration of the relevant taxing authority’s administrative practices and precedents.
DELL TECHNOLOGIES INC.
NOTES TO THE CONSOLIDATED FINANCIAL STATEMENTS (continued)
Stock-Based Compensation — The Company measures stock-based compensation expense for all share-based awards granted based on the estimated fair value of those awards at grant date. To estimate the fair value of performance-based awards containing a market condition, the Company uses the Monte Carlo valuation model. The fair value of other share-based awards is generally based on the closing price of the Class C Common Stock as reported on the New York Stock Exchange (“NYSE”) on the date of grant.
The compensation cost of service-based stock options, restricted stock, and restricted stock units is recognized net of any estimated forfeitures on a straight-line basis over the employee requisite service period. Compensation cost for performance-based awards is recognized on a graded accelerated basis net of estimated forfeitures over the requisite service period. Forfeiture rates are estimated at grant date based on historical experience and adjusted in subsequent periods for differences in actual forfeitures from those estimates.
Recently Issued Accounting Pronouncements
Accounting for Contract Assets and Contract Liabilities from Contracts with Customers — In October 2021, the Financial Accounting Standards Board (“FASB”) issued guidance which requires companies to apply Topic 606, Revenue from Contracts with Customers, to recognize and measure contract assets and contract liabilities from contracts with customers acquired in a business combination. Public entities must adopt the new guidance for fiscal years beginning after December 15, 2022 and interim periods within those fiscal years, with early adoption permitted. Adoption of the guidance is not expected to have a material impact on the Company’s financial results.
Reference Rate Reform — In March 2020, the Financial Accounting Standards Board (“FASB”)FASB issued guidance which provides temporary optional expedients and exceptions to GAAP guidance on contract modifications and certain hedging relationships to ease the financial reporting burdens related to the expected market transition from the London Interbank Offered Rate to alternative reference rates. The Company may elect to apply the amendments prospectively through December 31, 2022. Adoption of the new guidance is not expected to have a material impact on the Company’s financial results.
Accounting for Convertible Instruments and Contracts in an Entity’s Own Equity —In August 2020, the FASB issued guidance to simplify the accounting for convertible debt instruments and convertible preferred stock, and the derivatives scope exception for contracts in an entity's own equity. In addition, the guidance on calculating diluted earnings per share has been simplified and made more internally consistent. Public entities must adopt the new guidance for fiscal years beginning after December 15, 2021, and interim periods within those fiscal years, with early adoption permitted for fiscal periods beginning after December 15, 2020. The Company will early adopt this guidance for the fiscal year beginning January 30, 2021 on a modified retrospective basis. Adoption of the new guidance is not expected to have a material impact on the Company’s financial results.
Simplifying Accounting for Income Taxes —In December 2019, the FASB issued guidance to simplify the accounting for income taxes by removing certain exceptions to the general principles in Topic 740, Income Taxes, and by clarifying and amending existing guidance in order to improve consistent application of GAAP for other areas of Topic 740. Public entities must adopt the new guidance for fiscal years beginning after December 15, 2020, and interim periods within those fiscal years, with early adoption permitted for fiscal periods beginning after December 15, 2019. The Company will adopt this guidance for the fiscal year beginning January 30, 2021.2024. Adoption of the new guidance is not expected to have a material impact on the Company’s financial results.
Recently Adopted Accounting Pronouncements
Measurement of Credit Losses on Financial Instruments— In June 2016, the FASB issued amended guidance which replaced the current incurred loss impairment methodology for measurement of credit losses on financial instruments with a methodology (the “current expected credit losses model” or “CECL model”) that reflects expected credit losses and requires consideration of a broader range of reasonable and supportable information to inform credit loss estimates. Under the CECL model, the allowance for losses on financial assets, measured at amortized cost, reflects management’s estimate of credit losses over the remaining expected life of such assets.
The Company adopted the standard (the “new CECL standard”) as of February 1, 2020 using the modified retrospective method, with the cumulative-effect adjustment to the opening balance of stockholders’ equity (deficit) as of the adoption date. The cumulative effect of adopting the new CECL standard resulted in an increase of $111 million and $27 million to the allowance for expected credit losses within financing receivables, net and accounts receivable, net, respectively, on the Consolidated Statements of Financial Position, and a corresponding decrease of $28 million to other non-current liabilities related to deferred taxes and $110 million to stockholders’ equity (deficit) as of February 1, 2020. See Note 2, Note 4, and Note 20 of the Notes to the Consolidated Financial Statements for additional information about the Company’s allowance for financing receivables losses and allowance for expected credit losses of accounts receivable.
Intangibles - Goodwill and Other - Internal-Use Software —In August 2018, the FASB issued guidance on a customer’s accounting for implementation costs incurred in a cloud-computing arrangement when hosted by a vendor. The guidance provides that, in a hosting arrangement that is a service contract, certain implementation costs should be capitalized and amortized over the term of the arrangement. The Company adopted the standard during the three months ended May 1, 2020 using the prospective method. The impact of the adoption of this standard was immaterial to the Consolidated Financial Statements.
Leases — In February 2016, the FASB issued amended guidance on the accounting for leasing transactions. The primary objective of this update is to increase transparency and comparability among organizations by requiring lessees to recognize a lease liability for the obligation to make lease payments and an ROU asset for the right to use the underlying asset for the lease term. The guidance also results in some changes to lessor accounting and requires additional disclosures about all leasing arrangements.
The Company adopted the new lease standard as of February 2, 2019 using the modified retrospective approach, with the cumulative-effect adjustment to the opening balance of stockholders’ equity (deficit) as of the adoption date. The Company elected to apply the practical expedient using the transition option whereby prior comparative periods were not retrospectively adjusted in the Consolidated Financial Statements. Accordingly, prior comparative periods have not been adjusted in the Consolidated Financial Statements. The Company also elected the package of practical expedients that does not require reassessment of initial direct costs, classification of a lease, and definition of a lease.
The adoption of the new lease standard resulted in the recognition of $1.6 billion in operating lease liabilities and related right of use (“ROU”) assets on the Consolidated Statements of Financial Position. The Company recorded an immaterial adjustment to stockholders’ equity (deficit) as of February 2, 2019 to reflect the cumulative effect of adoption of the new lease standard. As of February 2, 2019, there were no material finance leases for which the Company was a lessee.
In the area of lessor accounting, as of February 2, 2019, the Company began to originate operating leases due to the elimination of third-party residual value guarantee insurance from the sales-type lease classification test. Leases that commenced prior to the adoption of the new lease standard were not reassessed or restated pursuant to the practical expedients elected. Accordingly, there was no cumulative adjustment to stockholders’ equity (deficit) related to lessor accounting.
See Note 4 and Note 5 of the Notes to the Consolidated Financial Statements for additional information about the Company’s leases from a lessor and lessee perspective, respectively.
Revenue from Contracts with Customers— In May 2014, the FASB issued amended guidance on the recognition of revenue from contracts with customers. The new standard established a single comprehensive model for entities to use in accounting for revenue arising from contracts with customers and supersedes substantially all of the previous revenue recognition guidance, including industry-specific guidance. The new standard requires entities to recognize revenue when it transfers promised goods or services to customers in an amount that reflects the consideration to which the entity expects to be entitled in exchange for those goods or services. Further, the new standard requires additional disclosures to help enable users of the financial statements to better understand the nature, amount, timing, risks, and judgments related to revenue recognition and related cash flows from contracts with customers. Concurrently, the FASB issued guidance on the accounting for costs to fulfill or obtain a customer contract. The Company adopted these standards during the three months ended May 4, 2018 using the full retrospective method, which requires the Company to recast each prior period presented consistent with the new guidance. The Company recorded a credit of approximately $1 billion to retained earnings as of January 29, 2016 to reflect the cumulative effect of the adoption.
Recognition and Measurement of Financial Assets and Financial Liabilities — In January 2016, the FASB issued amended guidance that generally requires changes in the fair value of equity investments, other than those accounted for under the equity method, to be recognized through net income, rather than other comprehensive income. For equity investments without readily determinable fair values, the Company is no longer permitted to use the cost method of accounting. The Company has elected to apply the measurement alternative for those investments. Under the alternative, the Company measures investments without readily determinable fair values at cost, less impairment, adjusted by observable price changes on a prospective basis. The Company must make a separate election to use the alternative for each eligible investment and is required to reassess at each reporting period whether an investment qualifies for the alternative. The Company adopted this standard during the three months ended May 4, 2018. Adoption of the standard was applied through a cumulative one-time adjustment to accumulated deficit of $56 million for the accumulated unrealized gain previously recorded in other comprehensive income.
DELL TECHNOLOGIES INC.
NOTES TO THE CONSOLIDATED FINANCIAL STATEMENTS (continued)
NOTE 3 — DISCONTINUED OPERATIONS
VMware Spin-Off — As disclosed in Note 1 of the Notes to the Consolidated Financial Statements, on November 1, 2021, the Company completed its spin-off of VMware by means of a special stock dividend of 30,678,605 shares of Class A common stock and 307,221,836 shares of Class B common stock of VMware to Dell Technologies stockholders of record as of October 29, 2021.
Prior to receipt of the VMware common stock by the Company’s stockholders, each share of VMware Class B common stock automatically converted into one share of VMware Class A common stock. As a result of these transactions, each holder of record of shares of Dell Technologies common stock as of the distribution record date received approximately 0.440626 of a share of VMware Class A common stock for each share of Dell Technologies common stock held as of such date, based on shares outstanding as of the completion of the VMware Spin-off. Following completion of the transaction, the pre-transaction stockholders of Dell Technologies owned shares in two separate public companies, consisting of (1) VMware, which continues to own the businesses of VMware, Inc. and its subsidiaries, and (2) Dell Technologies, which continues to own Dell Technologies’ other businesses and subsidiaries. After the separation, Dell Technologies does not beneficially own any shares of VMware common stock.
VMware paid a cash dividend, pro rata, to each of the holders of VMware common stock in an aggregate amount equal to $11.5 billion, of which Dell Technologies received $9.3 billion. Following the payment by VMware to its stockholders, the separation of VMware from Dell Technologies occurred, including the termination or settlement of certain intercompany accounts and intercompany contracts. Dell Technologies used the net proceeds from its pro rata share of the cash dividend to repay a portion of its outstanding debt.
Dell Technologies determined that the VMware Spin-off, and related distributions, qualified as tax-free for U.S. federal income tax purposes, which required significant judgment by management. In making these determinations, Dell Technologies applied U.S. federal tax law to relevant facts and circumstances and obtained a favorable private letter ruling from the Internal Revenue Service, a tax opinion, and other external tax advice related to the concluded tax treatment. If the completed transactions were to fail to qualify for tax-free treatment for U.S. federal income tax purposes, the Company could be subject to significant liabilities, which could have material adverse impacts on the Company’s business, financial condition, results of operations and cash flows in future reporting periods.
In connection with and upon completion of the VMware Spin-off, Dell Technologies and VMware entered into various agreements that provide a framework for the relationship between the companies after the transaction, including, among others, a commercial framework agreement, a tax matters agreement, and a transition services agreement.
The CFA referred to in Note 1 to the Notes to the Consolidated Financial Statements provides a framework under which the Company and VMware will continue their commercial relationship after the transaction, particularly with respect to projects mutually agreed by the parties as having the potential to accelerate the growth of an industry, product, service, or platform that may provide one or both companies with a strategic market opportunity. The CFA has an initial term of five years, with automatic one-year renewals occurring annually thereafter, subject to certain terms and conditions.
Pursuant to the CFA, Dell Technologies continues to act as a distributor of VMware’s standalone products and services and purchases such products and services for resale to end-user customers. Dell Technologies also continues to integrate VMware’s products and services with Dell Technologies’ offerings and sell them to end users. Cash flows between Dell Technologies and VMware primarily relate to such transactions. The Company has determined that it is generally acting as principal in these arrangements. The results of such operations are classified as continuing operations within the Company’s Consolidated Statements of Income. See Note 21 of the Notes to the Consolidated Financial Statements for additional information regarding transactions between Dell Technologies and VMware.
In accordance with applicable accounting guidance, the results of VMware, excluding Dell Technologies’ resale of VMware offerings, are presented as discontinued operations in the Consolidated Statements of Income and, as such, have been excluded from both continuing operations and segment results for the fiscal years ended January 28, 2022 and January 29, 2021. The Consolidated Statements of Cash Flows are presented on a consolidated basis for both continuing operations and discontinued operations.
DELL TECHNOLOGIES INC.
NOTES TO THE CONSOLIDATED FINANCIAL STATEMENTS (continued)
The tax matters agreement between the Company and VMware governs the respective rights, responsibilities, and obligations of Dell Technologies and VMware with respect to tax liabilities (including taxes, if any, incurred as a result of any failure of the VMware Spin-off to qualify for tax-free treatment for U.S. federal income tax purposes) and benefits, tax attributes, the preparation and filing of tax returns, the control of audits and other tax proceedings, cooperation, and other matters regarding tax.
The transition services agreement between the Company and VMware governed the various administrative services which the Company provided to VMware on an interim transitional basis. Transition services were fulfilled and concluded during the fiscal year ended February 3, 2023.
The following table presents key components of “Income from discontinued operations, net of income taxes” for the fiscal years ended January 28, 2022 and January 29, 2021:
| | | | | | | | | | | | | | | | |
| | | | Fiscal Year Ended |
| | | | January 28, 2022 | | January 29, 2021 |
| | | | | | |
| | | | (in millions) |
| Net revenue | | | | $ | 5,798 | | | $ | 7,554 | |
| Cost of net revenue | | | | (1,632) | | | (1,723) | |
| Operating expenses | | | | 6,384 | | | 7,818 | |
| Interest and other, net | | | | 232 | | | 135 | |
| Income from discontinued operations before income taxes | | | | 814 | | | 1,324 | |
| Income tax expense | | | | 49 | | | 64 | |
| Income from discontinued operations, net of income taxes | | | | $ | 765 | | | $ | 1,260 | |
____________________
The table above reflects the offsetting effects of historical intercompany transactions which are presented on a gross basis within continuing operations on the Consolidated Statements of Income.
The following table presents significant cash flow items from discontinued operations for the fiscal years ended January 28, 2022 and January 29, 2021 included within the Consolidated Statements of Cash Flows:
| | | | | | | | | | | | | | | | |
| | | | Fiscal Year Ended |
| | | | January 28, 2022 | | January 29, 2021 |
| | | | (in millions) |
| Depreciation and amortization | | | | $ | 1,004 | | | $ | 1,523 | |
| Capital expenditures | | | | $ | 263 | | | $ | 329 | |
| Stock-based compensation expense | | | | $ | 814 | | | $ | 1,122 | |
DELL TECHNOLOGIES INC.
NOTES TO THE CONSOLIDATED FINANCIAL STATEMENTS (continued)
NOTE 4 — FAIR VALUE MEASUREMENTS AND INVESTMENTS
The following table presents the Company’s hierarchy for its assets and liabilities measured at fair value on a recurring basis as of the dates indicated:
| | | | | | | | | | | | | | | | | | | | | | | | | | | | | | | | | | | | | | | | | | | February 3, 2023 | | January 28, 2022 |
| | | January 29, 2021 | | January 31, 2020 | | Level 1 | | Level 2 | | Level 3 | | Total | | Level 1 | | Level 2 | | Level 3 | | Total |
| | | Level 1 | | Level 2 | | Level 3 | | Total | | Level 1 | | Level 2 | | Level 3 | | Total | | Quoted Prices in Active Markets for Identical Assets | | Significant Other Observable Inputs | | Significant Unobservable Inputs | | | | Quoted Prices in Active Markets for Identical Assets | | Significant Other Observable Inputs | | Significant Unobservable Inputs | | |
| | | Quoted Prices in Active Markets for Identical Assets | | Significant Other Observable Inputs | | Significant Unobservable Inputs | | | | Quoted Prices in Active Markets for Identical Assets | | Significant Other Observable Inputs | | Significant Unobservable Inputs | | | | | | | | | | | | | | | |
| | | (in millions) | | (in millions) |
| Assets: | Assets: | | | | | | | | | | | | | | | | Assets: | | | | | | | | | | | | | | | |
| Cash and cash equivalents: | | |
| | Money market funds | Money market funds | $ | 8,846 | | | $ | 0 | | | $ | 0 | | | $ | 8,846 | | | $ | 4,621 | | | $ | 0 | | | $ | 0 | | | $ | 4,621 | | Money market funds | $ | 4,301 | | | $ | — | | | $ | — | | | $ | 4,301 | | | $ | 3,737 | | | $ | — | | | $ | — | | | $ | 3,737 | |
| | Equity and other securities | 449 | | | 0 | | | 0 | | | 449 | | | 12 | | | 0 | | | 0 | | | 12 | | |
| Marketable equity and other securities | | Marketable equity and other securities | 33 | | | — | | | — | | | 33 | | | 86 | | | — | | | — | | | 86 | |
| Derivative instruments | Derivative instruments | 0 | | | 104 | | | 0 | | | 104 | | | 0 | | | 81 | | | 0 | | | 81 | | Derivative instruments | — | | | 295 | | | — | | | 295 | | | — | | | 253 | | | — | | | 253 | |
| Total assets | Total assets | $ | 9,295 | | | $ | 104 | | | $ | 0 | | | $ | 9,399 | | | $ | 4,633 | | | $ | 81 | | | $ | 0 | | | $ | 4,714 | | Total assets | $ | 4,334 | | | $ | 295 | | | $ | — | | | $ | 4,629 | | | $ | 3,823 | | | $ | 253 | | | $ | — | | | $ | 4,076 | |
| Liabilities: | Liabilities: | | | | | | | | | | | | | | | | Liabilities: | | | | | | | | | | | | | | | |
| Derivative instruments | Derivative instruments | $ | 0 | | | $ | 133 | | | $ | 0 | | | $ | 133 | | | $ | 0 | | | $ | 68 | | | $ | 0 | | | $ | 68 | | Derivative instruments | $ | — | | | $ | 460 | | | $ | — | | | $ | 460 | | | $ | — | | | $ | 138 | | | $ | — | | | $ | 138 | |
| Total liabilities | Total liabilities | $ | 0 | | | $ | 133 | | | $ | 0 | | | $ | 133 | | | $ | 0 | | | $ | 68 | | | $ | 0 | | | $ | 68 | | Total liabilities | $ | — | | | $ | 460 | | | $ | — | | | $ | 460 | | | $ | — | | | $ | 138 | | | $ | — | | | $ | 138 | |
The following section describes the valuation methodologies the Company uses to measure financial instruments at fair value:
Money Market Funds — The Company’s investment in money market funds that are classified as cash equivalents hold underlying investments with a weighted average maturity of 90 days or less and are recognized at fair value. The valuations of these securities are based on quoted prices in active markets for identical assets, when available, or pricing models whereby all significant inputs are observable or can be derived from or corroborated by observable market data. The Company reviews security pricing and assesses liquidity on a quarterly basis. As of January 29, 2021,February 3, 2023, the Company’s U.S. portfolio had no material exposure to money market funds with a fluctuating net asset value.
Marketable Equity and Other Securities — The majority of the Company’s investments in equity and other securities that are measured at fair value on a recurring basis consist of strategic investments in publicly-traded companies. The valuation of these securities is based on quoted prices in active markets.
Derivative Instruments — The Company’s derivative financial instruments consist primarily of foreign currency forward and purchased option contracts and interest rate swaps. The fair value of the portfolio is determined using valuation models based on market observable inputs, including interest rate curves, forward and spot prices for currencies, and implied volatilities. Credit risk is also factored into the fair value calculation of the Company’s derivative financial instrument portfolio. See Note 79 of the Notes to the Consolidated Financial Statements for a description of the Company’s derivative financial instrument activities.
Deferred Compensation Plans —The Company offers deferred compensation plans for eligible employees, which allow participants to defer payment for a portion of their compensation. Assets were the same as liabilities associated with the plans at approximately $308$179 million and $241$192 million as of January 29, 2021February 3, 2023 and January 31, 2020,28, 2022, respectively, and are included in other assets and other liabilities on the Consolidated Statements of Financial Position. The net impact to the Consolidated Statements of Income (Loss) is not material since changes in the fair value of the assets substantially offset changes in the fair value of the liabilities. As such, assets and liabilities associated with these plans have not been included in the recurring fair value table above.
DELL TECHNOLOGIES INC.
NOTES TO THE CONSOLIDATED FINANCIAL STATEMENTS (continued)
Assets and Liabilities Measured at Fair Value on a Nonrecurring Basis — Certain assets are measured at fair value on a nonrecurring basis and therefore are not included in the recurring fair value table above. These assets consist primarily of non-financial assets such as goodwill and intangible assets. See Note 810 of the Notes to the Consolidated Financial Statements for additional information about goodwill and intangible assets.
As of January 29, 2021February 3, 2023 and January 31, 2020,28, 2022, the Company held private strategic investments in non-marketable equity and other securities of $990 million$1.3 billion and $852 million,$1.4 billion, respectively. As these investments represent early-stage companies without readily determinable fair values, they are not included in the recurring fair value table above. See Note 5 of the Notes to the Consolidated Financial Statements for additional information about our strategic investments.
Carrying Value and Estimated Fair Value of Outstanding Debt — The following table presents the carrying value and estimated fair value of the Company’s outstanding debt as described in Note 8 of the Notes to the Consolidated Financial Statements, including the current portion, as of the dates indicated:
| | | | | | | | | | | | | | | | | | | | | | | |
| February 3, 2023 | | January 28, 2022 |
| Carrying Value | | Fair Value | | Carrying Value | | Fair Value |
| | | | | | | |
| (in billions) |
| | | | | | | |
| Senior Notes | $ | 18.1 | | | $ | 18.2 | | | $ | 16.1 | | | $ | 18.5 | |
| Legacy Notes and Debentures | $ | 0.9 | | | $ | 1.0 | | | $ | 0.8 | | | $ | 1.1 | |
| DFS Debt | $ | 10.3 | | | $ | 9.9 | | | $ | 9.6 | | | $ | 9.6 | |
| | | | | | | |
The fair values of the outstanding debt shown in the table above were determined based on observable market prices in a less active market or based on valuation methodologies using observable inputs and were categorized as Level 2 in the fair value hierarchy.
DELL TECHNOLOGIES INC.
NOTES TO THE CONSOLIDATED FINANCIAL STATEMENTS (continued)
NOTE 5 — INVESTMENTS
The Company has strategic investments in equity and other securities as well as investments in fixed income debt securities. All equity and other securities as well as long-term fixed income debt securities are recorded as long-term investments in the Consolidated Statements of Financial Position. Short-term fixed income debt securities are recorded as other current assets in the Consolidated Statements of Financial Position.
As of February 3, 2023 and January 28, 2022, total investments were $1.6 billion and $1.8 billion, respectively.
Equity and Other Securities
Equity and other securities include strategic investments in marketable and non-marketable securities. Investments in marketable securities are measured at fair value on a recurring basis. The Company has elected to apply the measurement alternative for these investments.non-marketable securities. Under the alternative, the Company measures investments without readily determinable fair values at cost, less impairment, adjusted by observable price changes. The Company must makemakes a separate election to use the alternative for each eligible investment and is required to reassess at each reporting period whether an investment qualifies for the alternative. In evaluating these investments for impairment or observable price changes, the Company uses inputs including pre- and post-money valuations of recent financing events and the impact of those events on its fully diluted ownership percentages, as well as other available information regarding the issuer’s historical and forecasted performance.
Carrying Value of Equity and Estimated Fair Value of Outstanding Debt Other Securities
—
The following table presents the carrying valuecost, cumulative unrealized gains, cumulative unrealized losses, and estimated faircarrying value of the Company’s outstanding debt as describedCompany's strategic investments in Note 6 of the Notes to the Consolidated Financial Statements, including the current portion,marketable and non-marketable equity securities as of the dates indicated:
| | | | | | | | | | | | | | | | | | | | | | | |
| January 29, 2021 | | January 31, 2020 |
| Carrying Value | | Fair Value | | Carrying Value | | Fair Value |
| (in billions) |
| Senior Secured Credit Facilities | $ | 6.2 | | | $ | 6.3 | | | $ | 8.8 | | | $ | 9.0 | |
| First Lien Notes | $ | 18.3 | | | $ | 22.8 | | | $ | 20.5 | | | $ | 23.9 | |
| Unsecured Notes and Debentures | $ | 1.2 | | | $ | 1.6 | | | $ | 1.2 | | | $ | 1.5 | |
| Senior Notes | $ | 2.7 | | | $ | 2.8 | | | $ | 2.6 | | | $ | 2.8 | |
| EMC Notes | $ | 1.0 | | | $ | 1.0 | | | $ | 1.6 | | | $ | 1.6 | |
| VMware Notes and VMware Term Loan Facility | $ | 4.7 | | | $ | 5.3 | | | $ | 5.5 | | | $ | 5.6 | |
| Margin Loan Facility | $ | 4.0 | | | $ | 3.9 | | | $ | 4.0 | | | $ | 3.9 | |
The fair values of the outstanding debt shown in the table above, as well as the DFS debt described in Note 4 of the Notes to the Consolidated Financial Statements, were determined based on observable market prices in a less active market or based on valuation methodologies using observable inputs and were categorized as Level 2 in the fair value hierarchy. The carrying value of DFS debt approximates fair value.
| | | | | | | | | | | | | | | | | | | | | | | | | | | | | | | | | | | | | | | | | | | | | | | |
| February 3, 2023 | | January 28, 2022 |
| Cost | | Unrealized Gain | | Unrealized Loss | | Carrying Value | | Cost | | Unrealized Gain | | Unrealized Loss | | Carrying Value |
| | | | | | | | | | | | | | | |
| (in millions) |
| Marketable | $ | 56 | | | $ | 17 | | | $ | (40) | | | $ | 33 | | | $ | 126 | | | $ | 79 | | | $ | (119) | | | $ | 86 | |
| Non-marketable | 714 | | | 651 | | | (100) | | | 1,265 | | | 593 | | | 900 | | | (52) | | | 1,441 | |
| Total equity and other securities | $ | 770 | | | $ | 668 | | | $ | (140) | | | $ | 1,298 | | | $ | 719 | | | $ | 979 | | | $ | (171) | | | $ | 1,527 | |
DELL TECHNOLOGIES INC.
InvestmentsNOTES TO THE CONSOLIDATED FINANCIAL STATEMENTS (continued)
Gains and Losses on Equity and Other Securities
The following table presents the carrying value of the Company’s investments as of the dates indicated:
| | | | | | | | | | | | | | | | | | | | | | | | | | | | | | | | | | | | | | | | | | | | | | | |
| January 29, 2021 | | January 31, 2020 |
| Cost | | Unrealized Gain | | Unrealized (Loss) | | Carrying Value | | Cost | | Unrealized Gain | | Unrealized (Loss) | | Carrying Value |
| (in millions) |
| Equity and other securities | $ | 907 | | | $ | 677 | | | $ | (145) | | | $ | 1,439 | | | $ | 783 | | | $ | 116 | | | $ | (35) | | | $ | 864 | |
| Fixed income debt securities | 176 | | | 9 | | | 0 | | | 185 | | | 0 | | | 0 | | | 0 | | | 0 | |
| Total securities | | | | | | | $ | 1,624 | | | | | | | | | $ | 864 | |
Equityunrealized gains and losses on marketable and non-marketable equity and other securities for the periods indicated:
| | | | | | | | | | | | | | | | | | | | | | | | |
| | | | Fiscal Year Ended |
| | | | | | | | February 3, 2023 | | January 28, 2022 | | January 29, 2021 |
| | | | | | | | | | | | |
| | (in millions) |
| Marketable securities: | | | | | | | | | | | | |
| Unrealized gain | | | | | | | | $ | 57 | | | $ | 45 | | | $ | 288 | |
| Unrealized loss | | | | | | | | (47) | | | (151) | | | (45) | |
| Net unrealized gain (loss) | | | | | | | | 10 | | | (106) | | | 243 | |
| Non-marketable securities: | | | | | | | | | | | | |
| Unrealized gain | | | | | | | | 90 | | | 604 | | | 190 | |
| Unrealized loss | | | | | | | | (349) | | | (43) | | | (59) | |
| Net unrealized gain (loss) (a) (b) | | | | | | | | (259) | | | 561 | | | 131 | |
| Net unrealized gain (loss) on equity and other securities | | | | | | | | $ | (249) | | | $ | 455 | | | $ | 374 | |
____________________— The Company has strategic investments in publicly-traded and privately-held companies.(a) For the fiscal year ended January 29, 2021,February 3, 2023, net unrealized losses on non-marketable securities were primarily attributable to the recognition of impairments on equity and other securities, without readily determinable fair valueswhich were generally in line with extended public equity market declines. In evaluating these investments for impairment, the Company used inputs including pre- and post-money valuations of $990 million increased by $200 million,recent financing events and the impact of those events on its fully diluted ownership percentages, as well as other available information regarding the issuer’s historical and forecasted performance.
(b) For the fiscal years ended January 28, 2022 and January 29, 2021, net unrealized gains on non-marketable securities were due to upward adjustments for observable price changes offset by $74 million of downward adjustmentslosses primarily attributable to impairments. For the fiscal year ended January 31, 2020, the equity and other securities without readily determinable fair values increased by $110 million due to upwarddownward adjustments for observable price changes offset by $15 million of downward adjustments that were primarily attributable toand impairments.
The remainder of equity and other securities consisted of publicly-traded investments that are measured at fair value on a recurring basis for both the fiscal years ended January 29, 2021 and January 31, 2020.
In September 2020, 1 of the Company’s strategic investments, which previously did not have a readily determinable fair value, completed its initial public offering which resulted in the investment having a readily determinable fair value and in the recognition of an unrealized net gain of $396 million during the fiscal year ended January 29, 2021, which is reflected in the table above. The unrealized net gain was reflected in Interest and other, net on the Consolidated Statements ofFixed Income (Loss) and in Other, net as a non-cash adjustment within cash flows from operating activities on the Consolidated Statements of Cash Flows. As of January 29, 2021, the carrying value of this investment was $428 million.Debt Securities
Fixed income debt securities — The Company has fixed income debt securities carried at amortized cost. The debt securitiescost which are held as collateral for borrowings. The Company intends to hold the investments to maturity. Unrealized gains represent foreign currency impacts.As of the balance sheet dates presented, the Company holds $98 million in fixed income debt securities which will mature within one year and $220 million in fixed income debt securities which will mature within two to five years.
The following table summarizes the Company’s debt securities as of the dates indicated:
| | | | | | | | | | | | | | | | | | | | | | | | | | | | | | | | | | | | | | | | | | | | | | | |
| February 3, 2023 | | January 28, 2022 |
| Cost | | Unrealized Gains | | Unrealized Loss | | Carrying Value | | Cost | | Unrealized Gains | | Unrealized Loss | | Carrying Value |
| | | | | | | | | | | | | | | |
| (in millions) |
| Fixed income debt securities | $ | 348 | | | $ | 65 | | | $ | (95) | | | $ | 318 | | | $ | 333 | | | $ | 26 | | | $ | (47) | | | $ | 312 | |
DELL TECHNOLOGIES INC.
NOTES TO THE CONSOLIDATED FINANCIAL STATEMENTS (continued)
NOTE 46 — FINANCIAL SERVICES
The Company offers or arranges various financing options and services, and alternative payment structures for its customers in North America, Europe, Australia,globally. Alternative payment structures consist of various flexible consumption models, including utility, subscription, and New Zealandas-a-Service models.
Financing options are offered primarily through DFS.Dell Financial Services and its affiliates (“DFS”). The Company also arranges financing for some of its customers in various countries where DFS does not currently operate as a captive enterprise. The key activities of DFS include originating, collecting, and servicing customer financing arrangements primarily related to the purchase or use of Dell Technologies products and services. In some cases, DFS also offers financing for the purchase of third-party technology products that complement the Dell Technologies portfolio of products and services. New financing originations were $8.9$9.7 billion, $8.5 billion, and $7.3$8.9 billion for the fiscal years ended February 3, 2023, January 28, 2022, and January 29, 2021, January 31, 2020, and February 1, 2019, respectively.
The Company’s lease and loan arrangements with customers are aggregated primarily into the following categories:
Revolving loans — Revolving loans offered under private label credit financing programs provide qualified customers with a revolving credit line for the purchase of products and services offered by Dell Technologies. These private label credit financing programs are referred to as Dell Preferred Account (“DPA”) and Dell Business Credit (“DBC”). The DPA product is primarily offered to individual consumer customers, and the DBC product is primarily offered to small and medium-sized commercial customers. Revolving loans in the United States bear interest at a variable annual percentage rate that is tied to the prime rate. Based on historical payment patterns, revolving loan transactions are typically repaid within twelve months on average. Due to the short-term nature of the revolving loan portfolio, the carrying value of the portfolio approximates fair value.
Fixed-term leases and loans — The Company enters into financing arrangements with customers who seek lease financing for equipment. Pursuant to the current lease accounting standard effective February 2, 2019, new DFS leases are generally classified as sales-type leases direct financing leases, or operating leases. When the terms of the DFS lease transfer control of the underlying asset to the lessee, the contract is typically classified as a sales-type lease. Direct financing leases are immaterial. All other new DFS leases are classified as operating leases. Leases that commenced prior to the effective date of the current lease accounting standard continue to be accounted for under previous lease accounting guidance. Leases with business customers have fixed terms of generally two to four years.
The Company also offers fixed-term loans to qualified small businesses, large commercial accounts, governmental organizations, educational entities, and certain individual consumer customers. These loans are repaid in equal payments including interest and have defined terms of generally three to five years. The fair value of the fixed-term loan portfolio is determined using market observable inputs. The carrying value of these loans approximates fair value.
Flexible consumption models, as defined above, enable the Company to offer its customers the option to pay over time to provide them with financial flexibility to meet their changing technological requirements. Such models may result in identification of embedded lease arrangements that lead to the recognition of operating or sales-type leases.
DELL TECHNOLOGIES INC.
NOTES TO THE CONSOLIDATED FINANCIAL STATEMENTS (continued)
Financing Receivables
The following table presents the components of the Company’s financing receivables segregated by portfolio segment as of the dates indicated:
| | | | | | | | | | | | | | | | | | | | | | | | | | | | | | | | | February 3, 2023 | | January 28, 2022 |
| | | January 29, 2021 | | January 31, 2020 | | Revolving | | Fixed-term | | Total | | Revolving | | Fixed-term | | Total |
| | Revolving | | Fixed-term | | Total | | Revolving | | Fixed-term | | Total | | | | | | | | | | | | |
| | | (in millions) | | (in millions) |
| Financing receivables, net: | Financing receivables, net: | | | | | Financing receivables, net: | | | | |
| Customer receivables, gross (a) | Customer receivables, gross (a) | $ | 796 | | | $ | 9,595 | | | $ | 10,391 | | | $ | 824 | | | $ | 8,486 | | | $ | 9,310 | | Customer receivables, gross (a) | $ | 685 | | | $ | 10,293 | | | $ | 10,978 | | | $ | 750 | | | $ | 9,833 | | | $ | 10,583 | |
| Allowances for losses | Allowances for losses | (148) | | | (173) | | | (321) | | | (70) | | | (79) | | | (149) | | Allowances for losses | (88) | | | (113) | | | (201) | | | (102) | | | (87) | | | (189) | |
| Customer receivables, net | Customer receivables, net | 648 | | | 9,422 | | | 10,070 | | | 754 | | | 8,407 | | | 9,161 | | Customer receivables, net | 597 | | | 10,180 | | | 10,777 | | | 648 | | | 9,746 | | | 10,394 | |
| Residual interest | Residual interest | 0 | | | 424 | | | 424 | | | 0 | | | 582 | | | 582 | | Residual interest | — | | | 142 | | | 142 | | | — | | | 217 | | | 217 | |
| Financing receivables, net | Financing receivables, net | $ | 648 | | | $ | 9,846 | | | $ | 10,494 | | | $ | 754 | | | $ | 8,989 | | | $ | 9,743 | | Financing receivables, net | $ | 597 | | | $ | 10,322 | | | $ | 10,919 | | | $ | 648 | | | $ | 9,963 | | | $ | 10,611 | |
| Short-term | Short-term | $ | 648 | | | $ | 4,507 | | | $ | 5,155 | | | $ | 754 | | | $ | 4,141 | | | $ | 4,895 | | Short-term | $ | 597 | | | $ | 4,684 | | | $ | 5,281 | | | $ | 648 | | | $ | 4,441 | | | $ | 5,089 | |
| Long-term | Long-term | $ | 0 | | | $ | 5,339 | | | $ | 5,339 | | | $ | 0 | | | $ | 4,848 | | | $ | 4,848 | | Long-term | $ | — | | | $ | 5,638 | | | $ | 5,638 | | | $ | — | | | $ | 5,522 | | | $ | 5,522 | |
____________________
(a) Customer receivables, gross includesinclude amounts due from customers under revolving loans, fixed-term loans, fixed-term sales-type or direct financing leases, and accrued interest.
The allowance for losses as of January 29, 2021 includes the adoption of the new CECL standard, which was adopted as of February 1, 2020 using the modified retrospective method. Prior period amounts have not been recast. The provision recognized on the Consolidated Statements of Income (Loss) for the fiscal year ended January 29, 2021 is based on an assessment of the impact of current and expected future economic conditions, inclusive of the effect of the COVID-19 pandemic on credit losses. The duration and severity of COVID-19 and continued market volatility is highly uncertain and, as such, the impact on expected losses is subject to significant judgment and may cause variability in the Company’s allowance for credit losses in future periods. See Note 2 of the Notes to the Consolidated Financial Statements for additional information about the new CECL standard.
The following table presents the changes in allowance for financing receivable losses for the periods indicated:
| | | | | | | | | | | | | | | | | |
| Revolving | | Fixed-term | | Total |
| (in millions) |
| Allowance for financing receivable losses: | | | | | |
| Balances as of February 2, 2018 | $ | 81 | | | $ | 64 | | | $ | 145 | |
| Charge-offs, net of recoveries | (78) | | | (26) | | | (104) | |
| Provision charged to income statement | 72 | | | 23 | | | 95 | |
| Balances as of February 1, 2019 | 75 | | | 61 | | | 136 | |
| Charge-offs, net of recoveries | (71) | | | (23) | | | (94) | |
| Provision charged to income statement | 66 | | | 41 | | | 107 | |
| Balances as of January 31, 2020 | 70 | | | 79 | | | 149 | |
| Adjustment for adoption of accounting standard (Note 2) | 40 | | | 71 | | | 111 | |
| Charge-offs, net of recoveries | (62) | | | (29) | | | (91) | |
| Provision charged to income statement | 100 | | | 52 | | | 152 | |
| Balances as of January 29, 2021 | $ | 148 | | | $ | 173 | | | $ | 321 | |
| | | | | | | | | | | | | | | | | |
| Revolving | | Fixed-term | | Total |
| (in millions) |
| Allowance for financing receivable losses: | | | | | |
| Balances as of January 31, 2020 | $ | 70 | | | $ | 79 | | | $ | 149 | |
| Adjustment for adoption of accounting standard (Note 2) | 40 | | | 71 | | | 111 | |
| Charge-offs, net of recoveries | (62) | | | (29) | | | (91) | |
| Provision charged to income statement | 100 | | | 52 | | | 152 | |
| Balances as of January 29, 2021 | 148 | | | 173 | | | 321 | |
| Charge-offs, net of recoveries | (43) | | | (29) | | | (72) | |
| Provision charged to income statement | (3) | | | (57) | | | (60) | |
| Balances as of January 28, 2022 | 102 | | | 87 | | | 189 | |
| Charge-offs, net of recoveries | (52) | | | (8) | | | (60) | |
| Provision charged to income statement | 38 | | | 34 | | | 72 | |
| Balances as of February 2, 2023 | $ | 88 | | | $ | 113 | | | $ | 201 | |
DELL TECHNOLOGIES INC.
NOTES TO THE CONSOLIDATED FINANCIAL STATEMENTS (continued)
Aging
The following table presents the aging of the Company’s customer financing receivables, gross, including accrued interest, segregated by class, as of the dates indicated:
| | | | | | | | | | | | | | | | | | | | | | | | | | | | | | | | | | | | | | | | | | | February 3, 2023 | | January 28, 2022 |
| | January 29, 2021 | | January 31, 2020 | | Current | | Past Due
1 — 90 Days | | Past Due
>90 Days | | Total | | Current | | Past Due
1 — 90 Days | | Past Due
>90 Days | | Total |
| | Current | | Past Due 1 — 90 Days | | Past Due
>90 Days | | Total | | Current | | Past Due 1 — 90 Days | | Past Due
>90 Days | | Total | | | | | | | | | | | | | | | | |
| | (in millions) | | (in millions) |
| Revolving — DPA | Revolving — DPA | $ | 578 | | | $ | 30 | | | $ | 13 | | | $ | 621 | | | $ | 550 | | | $ | 51 | | | $ | 20 | | | $ | 621 | | Revolving — DPA | $ | 457 | | | $ | 34 | | | $ | 17 | | | $ | 508 | | | $ | 520 | | | $ | 40 | | | $ | 11 | | | $ | 571 | |
| Revolving — DBC | Revolving — DBC | 157 | | | 14 | | | 4 | | | 175 | | | 184 | | | 15 | | | 4 | | | 203 | | Revolving — DBC | 154 | | | 19 | | | 4 | | | 177 | | | 158 | | | 18 | | | 3 | | | 179 | |
| Fixed-term — Consumer and Commercial | Fixed-term — Consumer and Commercial | 9,192 | | | 316 | | | 87 | | | 9,595 | | | 8,005 | | | 373 | | | 108 | | | 8,486 | | Fixed-term — Consumer and Commercial | 9,309 | | | 927 | | | 57 | | | 10,293 | | | 9,444 | | | 345 | | | 44 | | | 9,833 | |
| Total customer receivables, gross | Total customer receivables, gross | $ | 9,927 | | | $ | 360 | | | $ | 104 | | | $ | 10,391 | | | $ | 8,739 | | | $ | 439 | | | $ | 132 | | | $ | 9,310 | | Total customer receivables, gross | $ | 9,920 | | | $ | 980 | | | $ | 78 | | | $ | 10,978 | | | $ | 10,122 | | | $ | 403 | | | $ | 58 | | | $ | 10,583 | |
Aging is likely to fluctuate as a result of the variability in volume of large transactions entered into over the period, and the administrative processes that accompany those transactions. Aging is also impacted by the timing of the Dell TechnologiesCompany’s fiscal period end date relative to calendar month-end customer payment due dates. As a result of these factors, fluctuations in aging from period to period do not necessarily indicate a material change in the collectibility of the portfolio. The increase in past-due amounts as of February 3, 2023 is primarily attributable to the timing of the Company’s fiscal period end date relative to calendar month-end customer payment due dates.
Fixed-term consumer and commercial customer receivables are placed on non-accrual status if principal or interest is past due and considered delinquent, or if there is concern about the collectibility of a specific customer receivable. TheseThe receivables identified as doubtful for collectibility may be classified as current for aging purposes. Aged revolving portfolio customer receivables identified as delinquent are charged off.
DELL TECHNOLOGIES INC.
NOTES TO THE CONSOLIDATED FINANCIAL STATEMENTS (continued)
Credit Quality
The following tables present customer receivables, gross, including accrued interest, by credit quality indicator, segregated by class, as of the dates indicated. indicated:
| | | | | | | | | | | | | | | | | | | | | | | | | | | | | | | | | | | | | | | | | | | | | | | | | | | | | |
| February 3, 2023 |
| Fixed-term — Consumer and Commercial | | | | | | |
| Fiscal Year of Origination | | | | | | |
| 2023 | | 2022 | | 2021 | | 2020 | | 2019 | | Years Prior | | Revolving — DPA | | Revolving — DBC | | Total |
| | | | | | | | | | | | | | | | | |
| (in millions) |
| Higher | $ | 3,210 | | | $ | 1,805 | | | $ | 914 | | | $ | 343 | | | $ | 37 | | | $ | 1 | | | $ | 123 | | | $ | 44 | | | $ | 6,477 | |
| Mid | 1,242 | | | 631 | | | 362 | | | 119 | | | 17 | | | 1 | | | 136 | | | 54 | | | 2,562 | |
| Lower | 1,017 | | | 364 | | | 157 | | | 65 | | | 7 | | | 1 | | | 249 | | | 79 | | | 1,939 | |
| Total | $ | 5,469 | | | $ | 2,800 | | | $ | 1,433 | | | $ | 527 | | | $ | 61 | | | $ | 3 | | | $ | 508 | | | $ | 177 | | | $ | 10,978 | |
| | | | | | | | | | | | | | | | | | | | | | | | | | | | | | | | | | | | | | | | | | | | | | | | | | | | | |
| January 28, 2022 |
| Fixed-term — Consumer and Commercial | | | | | | |
| Fiscal Year of Origination | | | | | | |
| 2022 | | 2021 | | 2020 | | 2019 | | 2018 | | Years Prior | | Revolving — DPA | | Revolving — DBC | | Total |
| | | | | | | | | | | | | | | | | |
| (in millions) |
| Higher | $ | 3,279 | | | $ | 1,824 | | | $ | 914 | | | $ | 221 | | | $ | 25 | | | $ | 3 | | | $ | 150 | | | $ | 46 | | | $ | 6,462 | |
| Mid | 1,071 | | | 751 | | | 329 | | | 94 | | | 17 | | | — | | | 166 | | | 57 | | | 2,485 | |
| Lower | 599 | | | 450 | | | 208 | | | 42 | | | 6 | | | — | | | 255 | | | 76 | | | 1,636 | |
| Total | $ | 4,949 | | | $ | 3,025 | | | $ | 1,451 | | | $ | 357 | | | $ | 48 | | | $ | 3 | | | $ | 571 | | | $ | 179 | | | $ | 10,583 | |
The categories shown in the tables belowabove segregate customer receivables based on the relative degrees of credit risk. The credit quality indicators for DPA revolving accounts are measured primarily as of each quarter-end date, while all other indicators are generally updated on a periodic basis. The table presented as of January 31, 2020 was not recast to reflect the impact of the new CECL standard.
| | | | | | | | | | | | | | | | | | | | | | | | | | | | | | | | | | | | | | | | | | | | | | | | | | | | | |
| January 29, 2021 |
| Fixed-term — Consumer and Commercial | | | | | | |
| Fiscal Year of Origination | | | | | | |
| 2021 | | 2020 | | 2019 | | 2018 | | 2017 | | Years Prior | | Revolving — DPA (a) | | Revolving — DBC (a) | | Total |
| (in millions) |
| Higher | $ | 3,125 | | | $ | 1,802 | | | $ | 661 | | | $ | 166 | | | $ | 26 | | | $ | 0 | | | $ | 172 | | | $ | 47 | | | $ | 5,999 | |
| Mid | 1,121 | | | 671 | | | 287 | | | 73 | | | 9 | | | 0 | | | 188 | | | 52 | | | 2,401 | |
| Lower | 865 | | | 499 | | | 243 | | | 38 | | | 9 | | | 0 | | | 261 | | | 76 | | | 1,991 | |
| Total | $ | 5,111 | | | $ | 2,972 | | | $ | 1,191 | | | $ | 277 | | | $ | 44 | | | $ | 0 | | | $ | 621 | | | $ | 175 | | | $ | 10,391 | |
____________________
(a) The revolving portfolio is exempt from the requirement to disclose the amortized cost basis by year of origination since determining the appropriate origination year can be complex due to the nature of the revolving portfolio.
| | | | | | | | | | | | | | | | | | | | | | | |
| January 31, 2020 |
| Fixed-term — Consumer and Commercial | | Revolving — DPA | | Revolving — DBC | | Total |
| (in millions) |
| Higher | $ | 5,042 | | | $ | 137 | | | $ | 55 | | | $ | 5,234 | |
| Mid | 2,036 | | | 175 | | | 63 | | | 2,274 | |
| Lower | 1,408 | | | 309 | | | 85 | | | 1,802 | |
| Total | $ | 8,486 | | | $ | 621 | | | $ | 203 | | | $ | 9,310 | |
For DPA revolving receivables shown in the table above, the Company makes credit decisions based on proprietary scorecards, which include the customer’s credit history, payment history, credit usage, and other credit agency-related elements. The higher quality category includes prime accounts generally of a higher credit quality that are comparable to U.S. customer FICO scores of 720 or above. The mid-categorymid category represents the mid-tier accounts that are comparable to U.S. customer FICO scores from 660 to 719. The lower category is generally sub-prime and represents lower credit quality accounts that are comparable to U.S. customer FICO scores below 660. For the DBC revolving receivables and fixed-term commercial receivables shown in the table above, an internal grading system is utilized that assigns a credit level score based on a number of considerations, including liquidity, operating performance, and industry outlook. The grading criteria and classifications for the fixed-term products differ from those for the revolving products as loss experience varies between these product and customer groups. The credit quality categories cannot be compared between the different classes as loss experience varies substantially between the classes.
DELL TECHNOLOGIES INC.
NOTES TO THE CONSOLIDATED FINANCIAL STATEMENTS (continued)
Leases
Interest income on sales-type lease receivables was $270$161 million, $246 million, and $259$270 million for the fiscal years ended February 3, 2023, January 28, 2022, and January 29, 2021, and January 31, 2020, respectively.
The following table presents the net revenue, cost of net revenue, and gross margin recognized at the commencement date of sales-type leases for the periods indicated:
| | | | | | | | | | | | | | Fiscal Year Ended |
| | Fiscal Year Ended | | | February 3, 2023 | | January 28, 2022 | | January 29, 2021 |
| | January 29, 2021 | | January 31, 2020 | | | | | | | |
| | (in millions) | | | (in millions) |
Net revenue — products | Net revenue — products | $ | 824 | | | $ | 770 | | Net revenue — products | | $ | 851 | | | $ | 756 | | | $ | 824 | |
Cost of net revenue — products | Cost of net revenue — products | 578 | | | 582 | | Cost of net revenue — products | | 727 | | | 583 | | | 578 | |
Gross margin — products | Gross margin — products | $ | 246 | | | $ | 188 | | Gross margin — products | | $ | 124 | | | $ | 173 | | | $ | 246 | |
The following table presents the future maturity of the Company’s fixed-term customer leases and associated financing payments, and reconciles the undiscounted cash flows to the customer receivables, gross recognized on the Consolidated Statements of Financial Position as of the date indicated:
| | | | | |
| January 29, 2021February 3, 2023 |
| (in millions) |
Fiscal 20222024 | $ | 2,797 | |
Fiscal 2023 | 1,660 | |
Fiscal 2024 | 9312,514 | |
| Fiscal 2025 | 3541,690 | |
| Fiscal 2026 | 1,144 | |
| Fiscal 2027 | 482 | |
| Fiscal 2028 and beyond | 98112 | |
| Total undiscounted cash flows | 5,8405,942 | |
| Fixed-term loans | 4,4405,109 | |
| Revolving loans | 796685 | |
Less: unearnedUnearned income | (685)(758) | |
| Total customer receivables, gross | $ | 10,39110,978 | |
Operating Leases
The Company’s operating leases primarily consist of DFS captive fixed-term leases and contractually committed embedded leases identified within flexible consumption arrangements.
The following table presents the components of the Company’s operating lease portfolio included in Property,property, plant, and equipment, net as of the dates indicated:
| | | | | | | | | | | |
| January 29, 2021 | | January 31, 2020 |
| (in millions) |
| Equipment under operating lease, gross | $ | 1,746 | | | $ | 956 | |
| Less: accumulated depreciation | (432) | | | (116) | |
| Equipment under operating lease, net | $ | 1,314 | | | $ | 840 | |
Operating lease income relating to lease payments was $452 million and $169 million for the fiscal years ended January 29, 2021 and January 31, 2020, respectively. Depreciation expense was $334 million and $115 million for the fiscal years ended January 29, 2021 and January 31, 2020, respectively.
| | | | | | | | | | | |
| February 3, 2023 | | January 28, 2022 |
| | | |
| (in millions) |
| Equipment under operating lease, gross | $ | 3,725 | | | $ | 2,643 | |
| Less: Accumulated depreciation | (1,517) | | | (935) | |
| Equipment under operating lease, net | $ | 2,208 | | | $ | 1,708 | |
DELL TECHNOLOGIES INC.
NOTES TO THE CONSOLIDATED FINANCIAL STATEMENTS (continued)
The following table presents operating lease income related to lease payments and depreciation expense for the Company’s operating lease portfolio for the periods indicated:
| | | | | | | | | | | | | | | | | | | | | |
| | | Fiscal Year Ended |
| | | | | February 3, 2023 | | January 28, 2022 | | January 29, 2021 |
| | | | | | | | | |
| | | | | (in millions) |
| Income related to lease payments | | | | | $ | 1,091 | | | $ | 717 | | | $ | 452 | |
| Depreciation expense | | | | | $ | 803 | | | $ | 536 | | | $ | 334 | |
The following table presents the future payments to be received by the Company as lessor in operating lease contracts as of the date indicated:
| | | | | |
| January 29, 2021February 3, 2023 |
| (in millions) |
Fiscal 20222024 | $ | 622 | |
Fiscal 2023 | 454 | |
Fiscal 2024 | 2021,088 | |
| Fiscal 2025 | 36721 | |
| Fiscal 2026 | 375 | |
| Fiscal 2027 | 90 | |
| Fiscal 2028 and beyond | 032 | |
| Total | $ | 1,3142,306 | |
DFS Debt
The Company maintains programs that facilitate the funding of leases, loans, and other alternative payment structures in the capital markets. The majority of DFS debt is non-recourse to Dell Technologies and represents borrowings under securitization programs and structured financing programs, for which the Company’s risk of loss is limited to transferred loan and lease payments and associated equipment.
The following table presents DFS debt as of the dates indicated. The tableindicated and excludes the allocated portion of the Company’s other borrowings, which represents the additional amount considered to fund the DFS business.business:
| | | | | | | | | | | | | February 3, 2023 | | January 28, 2022 |
| | January 29, 2021 | | January 31, 2020 | | | | |
| DFS debt | DFS debt | (in millions) | DFS debt | (in millions) |
| DFS U.S. debt: | DFS U.S. debt: | | DFS U.S. debt: | |
| Asset-based financing and securitization facilities | Asset-based financing and securitization facilities | $ | 3,311 | | | $ | 2,606 | | Asset-based financing and securitization facilities | $ | 3,987 | | | $ | 3,054 | |
| Fixed-term securitization offerings | Fixed-term securitization offerings | 2,961 | | | 2,593 | | Fixed-term securitization offerings | 2,679 | | | 3,011 | |
| Other | Other | 140 | | | 141 | | Other | 76 | | | 135 | |
| Total DFS U.S. debt | Total DFS U.S. debt | 6,412 | | | 5,340 | | Total DFS U.S. debt | 6,742 | | | 6,200 | |
| DFS international debt: | DFS international debt: | | DFS international debt: | | | |
| Securitization facility | Securitization facility | 786 | | | 743 | | Securitization facility | 790 | | | 739 | |
| Other borrowings | Other borrowings | 1,006 | | | 931 | | Other borrowings | 871 | | | 785 | |
| Note payable | Note payable | 250 | | | 200 | | Note payable | 250 | | | 250 | |
| Dell Bank Senior Unsecured Eurobonds | 1,212 | | | 551 | | |
| Dell Bank senior unsecured eurobonds | | Dell Bank senior unsecured eurobonds | 1,637 | | | 1,672 | |
| Total DFS international debt | Total DFS international debt | 3,254 | | | 2,425 | | Total DFS international debt | 3,548 | | | 3,446 | |
| Total DFS debt | Total DFS debt | $ | 9,666 | | | $ | 7,765 | | Total DFS debt | $ | 10,290 | | | $ | 9,646 | |
| Total short-term DFS debt | Total short-term DFS debt | $ | 4,888 | | | $ | 4,152 | | Total short-term DFS debt | $ | 5,400 | | | $ | 5,803 | |
| Total long-term DFS debt | Total long-term DFS debt | $ | 4,778 | | | $ | 3,613 | | Total long-term DFS debt | $ | 4,890 | | | $ | 3,843 | |
DELL TECHNOLOGIES INC.
NOTES TO THE CONSOLIDATED FINANCIAL STATEMENTS (continued)
DFS U.S. Debt
Asset-Based Financing and Securitization Facilities — The Company maintains separate asset-based financing facilities and a securitization facility in the United States, which are revolving facilities for fixed-term leases and loans and for revolving loans, respectively. This debt is collateralized solely by the U.S. loan and lease payments and associated equipment in the facilities. The debt has a variable interest rate, and the duration of the debt is based on the terms of the underlying loan and lease payment streams. As of January 29, 2021,February 3, 2023, the total debt capacity related to the U.S. asset-based financing and securitization facilities was $4.1$5.6 billion. The Company enters into interest swap agreements to effectively convert a portion of this debt from a floating rate to a fixed rate. See Note 79 of the Notes to the Consolidated Financial Statements for additional information about interest rate swaps.
The Company’s U.S. securitization facility for revolving loans is effective through June 25, 2022.2025. The Company’s two U.S. asset-based financing facilities for fixed-term leases and loans are effective through August 22, 2021July 10, 2023 and June 21, 2024, respectively. The Company intends to extend the facility currently effective through July 26, 2022, respectively.10, 2023.
The asset-based financing and securitization facilities contain standard structural features related to the performance of the funded receivables, which include defined credit losses, delinquencies, average credit scores, and minimum collection requirements. In the event one or more of these criteria are not met and the Company is unable to restructure the facility, no further funding of receivables will be permitted and the timing of the Company’s expected cash flows from over-collateralization will be delayed. As of January 29, 2021,February 3, 2023, these criteria were met.
Fixed-Term Securitization Offerings — The Company periodically issues asset-backed debt securities under fixed-term securitization programs to private investors. The asset-backed debt securities are collateralized solely by the U.S. fixed-term leases and loans in the offerings, which are held by Special Purpose Entities (“SPEs”), as discussed below. The interest rate on these securities is fixed and ranges from 0.31%0.33% to 5.92%5.72% per annum, and the duration of these securities is based on the terms of the underlying lease and loan payment streams.
DFS International Debt
Securitization Facility — The Company maintains a securitization facility in Europe for fixed-term leases and loans. The debt under this facility has a variable interest rate, and the duration of the debt is based on the terms of the underlying loan and lease payment streams. This facility is effective through December 21, 202223, 2024 and had a total debt capacity of $970$873 million as of January 29, 2021.February 3, 2023.
The securitization facility contains standard structural features related to the performance of the securitized receivables, which include defined credit losses, delinquencies, average credit scores, and minimum collection requirements. In the event one or more of these criteria are not met and the Company is unable to restructure the program, no further funding of receivables will be permitted and the timing of the Company’s expected cash flows from over-collateralization will be delayed. As of January 29, 2021,February 3, 2023, these criteria were met.
Other Borrowings — In connection with the Company’s international financing operations, the Company has entered into revolving structured financing debt programs related to its fixed-term lease and loan products sold in Canada, Europe, Australia, and New Zealand. The debt under these programs has a variable interest rate, and the duration of the debt is based on the terms of the underlying loan and lease payment streams. The Canadian facility, which is collateralized solely by Canadian loan and lease payments and associated equipment, had a total debt capacity of $292$338 million as of January 29, 2021,February 3, 2023 and is effective through January 16, 2023.2025. The European facility, which is collateralized solely by European loan and lease payments and associated equipment, had a total debt capacity of $727655 million as of January 29, 2021,February 3, 2023 and is effective through June 14, 2022.2025. The Australia and New Zealand facility, which is collateralized solely by Australia and New Zealand loan and lease payments and associated equipment, had a total debt capacity of $269$318 million as of January 29, 2021,February 3, 2023 and is effective through DecemberApril 20, 2021.2023.
Note Payable —On November 27, 2017,May 25, 2022, the Company entered into an unsecured credit agreement to fund receivables in Mexico. As of July 31, 2020,February 3, 2023, the aggregate principal amount of the note payable was $187$250 million. ThisThe note was repaid in full during the three months ended October 30, 2020.bears interest at an annual rate of 4.24% and will mature on May 31, 2024.
On August 7, 2020, the Company entered into 2 new unsecured credit agreements to fund receivables in Mexico. As of January 29, 2021, the aggregate principal amount of the notes payable was $250 million. The notes bear interest at 3.37% and will mature on June 1, 2022.
DELL TECHNOLOGIES INC.
NOTES TO THE CONSOLIDATED FINANCIAL STATEMENTS (continued)
Dell Bank Senior Unsecured Eurobonds — On October 17, 2019, Dell Bank International D.A.C. issued 500 million Euro of 0.625% senior unsecured three year eurobonds due October 2022. On June 24, 2020, Dell Bank International D.A.C. issued an additional 500 million Euro of 1.625% senior unsecured four year eurobonds due June 2024. On October 27, 2021, Dell Bank issued 500 million Euro of 0.5% senior unsecured five year eurobonds due October 2026. On October 18, 2022, Dell Bank issued 500 million Euro of 4.5% senior unsecured five year eurobonds due October 2027.The issuanceissuances of the senior unsecured eurobonds supportssupport the expansion of the financing operations in Europe.
Variable Interest Entities
In connection with the asset-based financing facilities, securitization facilities, and fixed-term securitization offerings discussed above, the Company transfers certain U.S. and European loanlease and leaseloan payments and associated equipment to SPEs that meet the definition of a Variable Interest Entity (“VIE”)VIE and are consolidated, along with the associated debt detaileddescribed above, into the Consolidated Financial Statements, as the Company is the primary beneficiary of the VIEs. The SPEs are bankruptcy-remote legal entities with separate assets and liabilities. The purpose of the SPEs is to facilitate the funding of customer loan and lease payments and associated equipment in the capital markets.
Some of the SPEs have entered into financing arrangements with multi-seller conduits that, in turn, issue asset-backed debt securities in the capital markets. DFS debt outstanding held by the consolidated VIEs is collateralized by the loanlease and leaseloan payments and associated equipment. The Company’s risk of loss related to securitized receivables is limited to the amount by which the Company’s right to receive collections for assets securitized exceeds the amount required to pay interest, principal, and fees and expenses related to the asset-backed securities. The Company provides credit enhancement to the securitization in the form of over-collateralization.
The following table presents the assets and liabilities held by the consolidated VIEs as of the dates indicated, which are included in the Consolidated Statements of Financial Position:
| | | | | | | | | | | | | February 3, 2023 | | January 28, 2022 |
| | | January 29, 2021 | | January 31, 2020 | | | | |
| | | (in millions) | | (in millions) |
| Assets held by consolidated VIEs | Assets held by consolidated VIEs | | Assets held by consolidated VIEs | |
| Other current assets | Other current assets | $ | 838 | | | $ | 643 | | Other current assets | $ | 274 | | | $ | 535 | |
| Financing receivables, net of allowance | Financing receivables, net of allowance | | Financing receivables, net of allowance | |
| Short-term | Short-term | $ | 3,534 | | | $ | 3,316 | | Short-term | $ | 3,702 | | | $ | 3,368 | |
| Long-term | Long-term | $ | 3,314 | | | $ | 2,913 | | Long-term | $ | 3,295 | | | $ | 3,141 | |
| Property, plant, and equipment, net | Property, plant, and equipment, net | $ | 792 | | | $ | 435 | | Property, plant, and equipment, net | $ | 1,164 | | | $ | 945 | |
| Liabilities held by consolidated VIEs | Liabilities held by consolidated VIEs | | Liabilities held by consolidated VIEs | |
| Debt, net of unamortized debt issuance costs | Debt, net of unamortized debt issuance costs | | Debt, net of unamortized debt issuance costs | |
| Short-term | Short-term | $ | 4,208 | | | $ | 3,423 | | Short-term | $ | 4,761 | | | $ | 4,560 | |
| Long-term | Long-term | $ | 2,841 | | | $ | 2,509 | | Long-term | $ | 2,685 | | | $ | 2,235 | |
LoanLease and leaseloan payments and associated equipment transferred via securitization through SPEs were $6.1$6.2 billion and $5.4$5.3 billion for the fiscal years ended January 29, 2021February 3, 2023 and January 31, 2020,28, 2022, respectively.
Customer Receivable Sales
To manage certain concentrations of customer credit exposure, the Company may sell selected fixed-term customer receivables to unrelated third parties on a periodic basis, without recourse. The amount of customer receivables sold for this purpose was $648$680 million, $538$201 million, and $949$648 million for the fiscal years ended February 3, 2023, January 28, 2022, and January 29, 2021, January 31, 2020, and February 1, 2019, respectively. The Company’s continuing involvement in the above mentionedthese customer receivables is primarily limited to servicing arrangements.
DELL TECHNOLOGIES INC.
NOTES TO THE CONSOLIDATED FINANCIAL STATEMENTS (continued)
NOTE 57 — LEASES
The Company enters into leasing transactions in which the Company is the lessee. These lease contracts are typically classified as operating leases. The Company’s lease contracts are generally for office buildings used to conduct its business, and the determination of whether such contracts contain leases generally does not require significant estimates or judgments. The Company also leases certain global logistics warehouses, employee vehicles, and equipment. As of January 29, 2021,February 3, 2023, the remaining terms of the Company’s leases range from less than one month to 26approximately ten years. As of February 3, 2023 and January 28, 2022, there were no material finance leases for which the Company was a lessee.
The Company also enters into leasing transactions in which the Company is the lessor, primarily through customer financing arrangements offered through DFS. DFS originates leases that are primarily classified as either sales-type leases or operating leases. See Note 46 of the Notes to the Consolidated Financial Statements for more information on the DFS lease portfolio and related lease disclosures.
In adopting the current lease accounting standard effective February 2, 2019, the Company elected to apply a transition method that does not require the retrospective application to periods prior to the effective date. Financial information associated with the Company’s leases in which the Company is the lessee is contained in this Note 5. As of January 29, 2021 and January 31, 2020, there were no material finance leases for which the Company was a lessee.lessor arrangements.
The following table presents components of lease costs included in the Consolidated Statements of Income (Loss) for the periods indicated:
| | | | | | | | | | | | | | Fiscal Year Ended |
| | Fiscal Year Ended | | | February 3, 2023 | | January 28, 2022 |
| | January 29, 2021 | | January 31, 2020 | | | | | |
| | (in millions) | | | (in millions) |
| Operating lease costs | Operating lease costs | $ | 535 | | | $ | 510 | | Operating lease costs | | $ | 283 | | | $ | 335 | |
| Variable costs | Variable costs | 161 | | | 161 | | Variable costs | | 113 | | | 96 | |
| Total lease costs | Total lease costs | $ | 696 | | | $ | 671 | | Total lease costs | | $ | 396 | | | $ | 431 | |
During both the fiscal years ended January 29, 2021February 3, 2023 and January 31, 2020,28, 2022, sublease income, finance lease costs, and short-term lease costs were immaterial.
The following table presents supplemental information related to operating leases included in the Consolidated Statements of Financial Position as of the dates indicated:
| | | Classification | January 29, 2021 | | January 31, 2020 | | | Classification | February 3, 2023 | | January 28, 2022 | |
| | | (in millions, except for term and discount rate) | | | | | |
| Operating lease ROU assets | Other non-current assets | $ | 2,117 | | $ | 1,780 | | |
| | | (in millions, except for term and discount rate) |
| Operating lease right-of-use assets | | Operating lease right-of-use assets | Other non-current assets | $ | 725 | | $ | 871 | |
| | Current operating lease liabilities | Current operating lease liabilities | Accrued and other current liabilities | $ | 436 | | $ | 432 | | Current operating lease liabilities | Accrued and other current liabilities | $ | 260 | | $ | 287 | |
| Non-current operating lease liabilities | Non-current operating lease liabilities | Other non-current liabilities | 1,787 | | 1,360 | | Non-current operating lease liabilities | Other non-current liabilities | 630 | | 720 | |
| Total operating lease liabilities | Total operating lease liabilities | | $ | 2,223 | | $ | 1,792 | | Total operating lease liabilities | | $ | 890 | | $ | 1,007 | |
| | Weighted-average remaining lease term (in years) | Weighted-average remaining lease term (in years) | | 8.85 | | 8.57 | | Weighted-average remaining lease term (in years) | | 4.95 | | 5.51 | |
| Weighted-average discount rate | Weighted-average discount rate | | 3.47 | % | | 3.81 | % | | Weighted-average discount rate | | 3.48 | % | | 3.01 | % | |
DELL TECHNOLOGIES INC.
NOTES TO THE CONSOLIDATED FINANCIAL STATEMENTS (continued)
The following table presents supplemental cash flow information related to leases for the periods indicated:
| | | | | | | | | | | |
| Fiscal Year Ended |
| January 29, 2021 | | January 31, 2020 |
| (in millions) |
Cash paid for amounts included in the measurement of lease liabilities —
operating cash outflows from operating leases | $ | 523 | | | $ | 501 | |
| | | |
| ROU assets obtained in exchange for new operating lease liabilities | $ | 824 | | | $ | 630 | |
| | | | | | | | | | | |
| Fiscal Year Ended |
| February 3, 2023 | | January 28, 2022 |
| | | |
| (in millions) |
Cash paid for amounts included in the measurement of lease liabilities —
operating cash outflows from operating leases (a) | $ | 306 | | | $ | 459 | |
| | | |
| Right-of-use assets obtained in exchange for new operating lease liabilities | $ | 226 | | | $ | 144 | |
____________________
(a) Cash paid for amounts included in the measurement of lease liabilities - operating cash outflows from operating leases from discontinued operations was $135 million for the fiscal year ended January 28, 2022.
The following table presents the future maturity of the Company’s operating lease liabilities under non-cancelable leases and reconciles the undiscounted cash flows for these leases to the lease liability recognized on the Consolidated Statements of Financial Position as of the date indicated:
| | | | | | | |
| January 29, 2021February 3, 2023 | | |
| (in millions) |
Fiscal 20222024 | $ | 472260 | | | |
Fiscal 2023 | 445 | | | |
Fiscal 2024 | 324 | | | |
| Fiscal 2025 | 242200 | | | |
| Fiscal 2026 | 194162 | |
| Fiscal 2027 | 121 | |
| Fiscal 2028 | 85 | |
| Thereafter | 975138 | | | |
| Total lease payments | 2,652966 | | | |
| Less: Imputed interest | (429)(76) | | | |
| Total | $ | 2,223890 | | | |
| Current operating lease liabilities | $ | 436260 | | | |
| Non-current operating lease liabilities | $ | 1,787630 | | | |
Future lease commitments after Fiscal 2026 include the ground lease on VMware, Inc.’s Palo Alto, California headquarter facilities, which expires in Fiscal 2047.
As of January 29, 2021,February 3, 2023, the Company has additionalCompany’s undiscounted operating leases that havehad not yet commenced of $72 million. These operating leases will commence during Fiscal 2022 with lease terms of one year to 10 years.were immaterial.
DELL TECHNOLOGIES INC.
NOTES TO THE CONSOLIDATED FINANCIAL STATEMENTS (continued)
NOTE 68 — DEBT
The following table summarizes the Company’s outstanding debt as of the dates indicated:
| | | | | | | | | | | |
| | January 29, 2021 | | January 31, 2020 |
| (in millions) |
| Secured Debt | | | |
| Senior Secured Credit Facilities: | | | |
| | | |
| 2.75% Term Loan B-1 Facility due September 2025 | $ | 3,143 | | | $ | 4,738 | |
| | | |
| 1.90% Term Loan A-4 Facility due December 2023 | 0 | | | 679 | |
| | | |
| 1.90% Term Loan A-6 Facility due March 2024 | 3,134 | | | 3,497 | |
| First Lien Notes: | | | |
| | | |
| 4.42% due June 2021 | 0 | | | 4,500 | |
| 5.45% due June 2023 | 3,750 | | | 3,750 | |
| 4.00% due July 2024 | 1,000 | | | 1,000 | |
| 5.85% due July 2025 | 1,000 | | | 0 | |
| 6.02% due June 2026 | 4,500 | | | 4,500 | |
| 4.90% due October 2026 | 1,750 | | | 1,750 | |
| 6.10% due July 2027 | 500 | | | 0 | |
| 5.30% due October 2029 | 1,750 | | | 1,750 | |
| 6.20% due July 2030 | 750 | | | 0 | |
| 8.10% due July 2036 | 1,500 | | | 1,500 | |
| 8.35% due July 2046 | 2,000 | | | 2,000 | |
| Unsecured Debt | | | |
| Unsecured Notes and Debentures: | | | |
| | | |
| 4.625% due April 2021 | 400 | | | 400 | |
| 7.10% due April 2028 | 300 | | | 300 | |
| 6.50% due April 2038 | 388 | | | 388 | |
| 5.40% due September 2040 | 264 | | | 264 | |
| Senior Notes: | | | |
| 5.875% due June 2021 | 1,075 | | | 1,075 | |
| 7.125% due June 2024 | 1,625 | | | 1,625 | |
| EMC Notes: | | | |
| 2.650% due June 2020 | 0 | | | 600 | |
| 3.375% due June 2023 | 1,000 | | | 1,000 | |
| Debt of Public Subsidiary | | | |
| VMware Notes: | | | |
| 2.30% due August 2020 | 0 | | | 1,250 | |
| 2.95% due August 2022 | 1,500 | | | 1,500 | |
| 4.50% due May 2025 | 750 | | | 0 | |
| 4.65% due May 2027 | 500 | | | 0 | |
| 3.90% due August 2027 | 1,250 | | | 1,250 | |
| 4.70% due May 2030 | 750 | | | 0 | |
| VMware Term Loan Facility | 0 | | | 1,500 | |
| DFS Debt (Note 4) | 9,666 | | | 7,765 | |
| Other | | | |
| 2.46% Margin Loan Facility due April 2022 | 4,000 | | | 4,000 | |
| Other | 235 | | | 84 | |
| Total debt, principal amount | $ | 48,480 | | | $ | 52,665 | |
| | | January 29, 2021 | | January 31, 2020 | | February 3, 2023 | | January 28, 2022 |
| | (in millions) | | | | |
| | | (in millions) |
| Senior Notes: | | Senior Notes: | |
| 5.45% due June 2023 | | 5.45% due June 2023 | $ | 1,000 | | | $ | 1,000 | |
| 4.00% due July 2024 | | 4.00% due July 2024 | 1,000 | | | 1,000 | |
| 5.85% due July 2025 | | 5.85% due July 2025 | 1,000 | | | 1,000 | |
| 6.02% due June 2026 | | 6.02% due June 2026 | 4,500 | | | 4,500 | |
| 4.90% due October 2026 | | 4.90% due October 2026 | 1,750 | | | 1,750 | |
| 6.10% due July 2027 | | 6.10% due July 2027 | 500 | | | 500 | |
| 5.25% due February 2028 | | 5.25% due February 2028 | 1,000 | | | — | |
| 5.30% due October 2029 | | 5.30% due October 2029 | 1,750 | | | 1,750 | |
| 6.20% due July 2030 | | 6.20% due July 2030 | 750 | | | 750 | |
| 5.75% due February 2033 | | 5.75% due February 2033 | 1,000 | | | — | |
| 8.10% due July 2036 | | 8.10% due July 2036 | 1,000 | | | 1,000 | |
| 3.38% due December 2041 | | 3.38% due December 2041 | 1,000 | | | 1,000 | |
| 8.35% due July 2046 | | 8.35% due July 2046 | 800 | | | 800 | |
| 3.45% due December 2051 | | 3.45% due December 2051 | 1,250 | | | 1,250 | |
| Legacy Notes and Debentures: | | Legacy Notes and Debentures: | |
| 7.10% due April 2028 | | 7.10% due April 2028 | 300 | | | 300 | |
| 6.50% due April 2038 | | 6.50% due April 2038 | 388 | | | 388 | |
| 5.40% due September 2040 | | 5.40% due September 2040 | 264 | | | 264 | |
| DFS Debt (Note 6) | | DFS Debt (Note 6) | 10,290 | | | 9,646 | |
| Other | | Other | 325 | | | 337 | |
| Total debt, principal amount | Total debt, principal amount | $ | 48,480 | | | $ | 52,665 | | Total debt, principal amount | $ | 29,867 | | | $ | 27,235 | |
| Unamortized discount, net of unamortized premium | Unamortized discount, net of unamortized premium | (194) | | | (241) | | Unamortized discount, net of unamortized premium | (133) | | | (134) | |
| Debt issuance costs | Debt issuance costs | (302) | | | (368) | | Debt issuance costs | (146) | | | (147) | |
| Total debt, carrying value | Total debt, carrying value | $ | 47,984 | | | $ | 52,056 | | Total debt, carrying value | $ | 29,588 | | | $ | 26,954 | |
| Total short-term debt, carrying value | Total short-term debt, carrying value | $ | 6,362 | | | $ | 7,737 | | Total short-term debt, carrying value | $ | 6,573 | | | $ | 5,823 | |
| Total long-term debt, carrying value | Total long-term debt, carrying value | $ | 41,622 | | | $ | 44,319 | | Total long-term debt, carrying value | $ | 23,015 | | | $ | 21,131 | |
DuringFiscal 2023 Senior Note Issuance
On January 24, 2023, the fiscal year ended January 29, 2021, the net decreaseCompany completed a public offering of senior notes in the Company’s debt balance was primarily due to:
•retirement of $4.5 billionaggregate principal amount of 4.42% First Lien Notes due June 2021 via repayment of $4,265 million and open market repurchases of $235 million;
•repayment of$2.0 billion. In the remaining $679 million principal amount ofpublic offering, the Term Loan A-4 Facility;
•repayment of $1,595 million principal amount of the Term Loan B-1 Facility;
•repayment of $363 million principal amount of the Term Loan A-6 Facility;
•repayment of $1.5 billion principal amount of the VMware Term Loan Facility upon maturity;
•repayment of $1.25 billion principal amount of 2.30% VMware Notes due August 2020; and
•repayment of $600 million principal amount of 2.650% EMC Notes due June 2020 upon maturity.
These decreases in the Company’s debt balance during the fiscal year ended January 29, 2021 were partially offset by:
•issuance of $2.25Company issued $1.0 billion aggregate principal amount of First Lien Notes on April 9, 2020, described below;
•issuance of $2.05.25% senior notes due 2028 and $1.0 billion aggregate principal amount of VMware Notes on April 7, 2020, described below; and
•incurrence of an additional $1.9 billion, net, in DFS debt to support the expansion of its financing receivables portfolio.
During the fiscal year ended January 31, 2020, the net decrease in the Company’s debt balance was primarily due to:
•repayment of $1.4 billion principal amount of 2.650% EMC Notes due June 2020;
•repayment of $550 million principal amount of 5.875%5.75% senior unsecured notes due June 2021;
•repayment of $600 million principal amount of 5.875% senior unsecured notes due June 2019;
•repayment of $950 million principal amount of the Term Loan A-4 Facility;
•amortization of approximately $193 million of principal under the Company’s term loan facilities;
•repayment of $162.5 million principal amount as part of the Term Loan B Facility refinancing as described below under “Refinancing Transactions during Fiscal 2020”; and
•repayment of the remaining principal amount of approximately $1,277 million of the Term Loan A-2 Facility in connection with the First Lien Notes issued2033. Interest on March 20, 2019, as described below under “Refinancing Transactions during Fiscal 2020.”
These decreases in the Company’s debt balance during the fiscal year ended January 31, 2020 were partially offset by:
•debt issuances in connection with refinancing activities described below under “Refinancing Transactions during Fiscal 2020”; and
•incurrence of an additional $1.8 billion, net, in DFS debtthese borrowings is payable semiannually. The Company intends to support the expansion of its financing receivables portfolio. See Note 4 of the Notes to the Consolidated Financial Statements for more information about DFS debt.
Refinancing Transactions during Fiscal 2020
In connection with the Class V transaction described in Note 1 of the Notes to the Consolidated Financial Statements, on December 20, 2018, the Company entered into an amendment to the credit agreement for the Senior Secured Credit Facilities, described below, which included (a) a new senior secured Term Loan A-4 Facility under its Senior Secured Credit Facilities consisting of an aggregate principal amount of $1.7 billion term A-4 loans, (b) a new senior secured Term Loan A-5 Facility under the Senior Secured Credit Facilities consisting of an aggregate principal amount of $2.0 billion term A-5 loans, (c) $1.4 billion in incremental loans under the Margin Loan Facility, and (d) an increase in the aggregate revolving commitments available under the Revolving Credit Facility to $4.5 billion. See below for additional information regarding the Senior Secured Credit Facilities, the Margin Loan Facility, and the Revolving Credit Facility.
On March 7, 2019, the Company amended the Margin Loan Facility agreement to increase the aggregate principal amount of borrowings under the Margin Loan Facility by $650 million.
On March 13, 2019, the Company entered into an amendment to the credit agreement for the Senior Secured Credit Facilities to obtain a new senior secured Term Loan A-6 Facility in order to refinance the $5 billion aggregate principal amount of debt incurred in connection with the Class V transaction described in Note 1 of the Notes to the Consolidated Financial Statements. The Term Loan A-6 Facility aggregate principal amount of $3,634 million matures on March 13, 2024, of which $2,839 million aggregate principal amount represents the amounts outstanding under the Term Loan A-2 Facility that rolled over into the new facility. The remaining principal amount outstanding under the Term Loan A-2 Facility was subsequently repaid in full during the fiscal year ended January 31, 2020, partially with proceeds from a private offering of First Lien Notes described below.
On March 20, 2019, Dell International L.L.C. and EMC Corporation, both of which are wholly-owned subsidiaries of Dell Technologies Inc., completed a private offering of multiple series of First Lien Notes in an aggregate principal amount of $4.5 billion. A majority of the proceeds from the First Lien Notes issued on March 20, 2019 was used to repay all of the outstanding $3,750 million principal amount of 3.48% First Lien Notes due June 2019. In addition, proceeds of approximately $800 million of borrowings under the new Term Loan A-6 Facility,utilize the proceeds of the $650 million increase in the Margin Loan Facility, and a portion of the proceeds from the 2019 First Lien Notes were usedissued senior notes to repay all $2,016 million of outstanding amounts under the Term Loan A-5 Facility5.45% senior notes due December 2019. The remaining proceeds available from the 2019 First Lien Notes were used to repay a portion of outstanding amounts under the Term Loan A-2 Facility as described above, and to pay related premiums, accrued interest, fees, and expenses.
On September 19, 2019, the Company entered into a sixth refinancing amendment to the Senior Secured Credit Agreement (the “Sixth Refinancing Amendment”) to refinance the Term Loan B Facility due September 2023 with a new term loan B facility consisting of an aggregate principal amount of $4,750 million refinancing term B-1 loans maturing on September 19, 2025 (the “Term Loan B-1 Facility”). The Company used the proceeds from the Term Loan B-1 Facility, together with other available funds, to repay $4,913 million of outstanding amounts under the Term Loan B Facility due SeptemberJune 2023 and to pay related accrued interest, fees, and expenses.
The refinancing and amendments were evaluated in accordance with FASB ASC 470, “Debt-Modifications and Extinguishments.” The amendment toutilize the Margin Loan Facility agreement on March 7, 2019, the term debt refinancing on March 13, 2019, and the Term Loan B Facility refinancing on September 19, 2019 were accounted for as modifications for all existing lenders and as new issuances for new lenders. The First Lien Notes issued on March 20, 2019 were accounted for as new issuances for all lenders, and repayment of the Company’s outstanding amounts under the Term Loan A-5 Facility was accounted for as an extinguishment.
Secured Debt
Senior Secured Credit Facilities—The Company has entered into a credit agreement that provides for senior secured credit facilities (the “Senior Secured Credit Facilities”) comprising (a) term loan facilities and (b) a senior secured Revolving Credit Facility, which provides for a borrowing capacity of up to $4.5 billionremaining proceeds for general corporate purposes, including capacity for up to $0.5 billionrepayment of letters of credit and for borrowings of up to $0.4 billion under swing-line loans.other debt.
Commercial Paper Program
On July 18, 2022, the Company established a commercial paper program under which the Company may issue unsecured notes in a maximum aggregate face amount of $5.0 billion outstanding at any time, with maturities up to 397 days from the date of issuance. The notes will be sold on customary terms in the U.S. commercial paper market on a private placement basis. The proceeds of the notes will be used for general corporate purposes. As of January 29, 2021, availableFebruary 3, 2023, the Company had no outstanding borrowings under the Revolving Credit Facility totaled $4.5 billion. The Senior Secured Credit Facilities provide that the borrowers have the right at any time, subject to customary conditions, to request incremental term loanscommercial paper program. Commercial paper issuances and repayments with maturities of 90 days or incremental revolving commitments.
Borrowings under the Senior Secured Credit Facilities bear interest atless are presented on a rate per annum equal to an applicable margin, plus, at the borrowers’ option, either (a) a base rate, or (b) a London Interbank Offered Rate (“LIBOR”). The Term Loan B-1 Facility bears interest at LIBOR plus an applicable margin of 2.00% or a base rate plus an applicable margin of 1.00%. The Term Loan A-6 Facility bears interest at LIBOR plus an applicable margin rangingnet basis within cash flows from 1.25% to 2.00% or a base rate plus an applicable margin ranging from 0.25% to 1.00%. Interest is payable, in the case of loans bearing interest based on LIBOR, at the end of each interest period (but at least every three months), in arrears and, in the case of loans bearing interest basedfinancing activities on the base rate, quarterly in arrears.Consolidated Statements of Cash Flows.
DELL TECHNOLOGIES INC.
The Term Loan B-1 Facility amortizes in equal quarterly installments in aggregate annual amounts equal to 1% of the original principal amount. The Term Loan A-6 Facility amortizes in equal quarterly installments in aggregate annual amounts equal to 5% of the original principal amount in each of the first four years after the facility closing date of March 13, 2019, and 80% of the original principal amount in the fifth year after March 13, 2019. The Revolving Credit Facility has no amortization.NOTES TO THE CONSOLIDATED FINANCIAL STATEMENTS (continued)
The borrowers may voluntarily repay outstanding loans under the term loan facilities and the Revolving Credit Facility at any time without premium or penalty, other than customary “breakage” costs.
All obligations of the borrowers under the Senior Secured Credit Facilities and certain swap agreements, cash management arrangements, and certain letters of credit provided by any lender or agent party to the Senior Secured Credit Facilities or any of its affiliates and certain other persons are secured by (a) a first-priority security interest in certain tangible and intangible assets of the borrowers and the guarantors and (b) a first-priority pledge of 100% of the capital stock of the borrowers, Dell Inc., a wholly‑owned subsidiary of the Company (“Dell”), and each wholly-owned material restricted subsidiary of the borrowers and the guarantors, in each case subject to certain thresholds, exceptions, and permitted liens.Outstanding Debt
First LienSenior Notes — Dell International L.L.C. and EMC Corporation, both of which are wholly-owned subsidiaries of Dell Technologies Inc.,The Company completed private offerings of multiple series of senior secured notes (collectively, the “First Lien Notes”) which were issued on June 1, 2016, June 22, 2016, March 20, 2019, April 9, 2020, and December 13, 2021 in aggregate principal amounts of $20.0 billion, $3.3 billion, $4.5 billion, $2.3 billion, and $2.3 billion, respectively (together with the registered senior notes subsequently issued in exchange and the senior notes issued on January 24, 2023, the “Senior Notes”). Interest on these borrowings is payable semiannually.
In June 2021, Dell International L.L.C. and EMC Corporation, wholly-owned subsidiaries of Dell Technologies Inc. and issuers of the Senior Notes (the “Issuers”), completed an offer to exchange any and all outstanding Senior Notes issued on June 1, 2016, March 20, 2019, and April 9, 2020 in aggregate principal amounts of $20.0 billion, $4.5 billion, and $2.25 billion, respectively. Interest on these borrowings is payable semiannually. The First Lien Notes are secured on a pari passu basis with the Senior Secured Credit Facilities, on a first-priority basis by substantially all of the tangible and intangible assets of the issuers and guarantors that secure obligationsfor senior notes registered under the Senior Secured Credit Facilities, including pledgesSecurities Act of all capital stock of the issuers, Dell, and certain wholly-owned material subsidiaries of the issuers and the guarantors, subject to certain exceptions.
The Company has agreed to use commercially reasonable efforts to register with the SEC notes1933 having terms substantially identical to the terms of the First Lienoutstanding Senior Notes. The Issuers issued $18.4 billion aggregate principal amount of registered Senior Notes as part of an offer toin exchange such registered notes for the First Liensame aggregate principal amount of unregistered Senior Notes. The Company will be obligated to pay additional interest onaggregate principal amount of unregistered Senior Notes remaining outstanding following the First Lien Notes if it fails to consummate such ansettlement of the exchange offer within five years after the closing date of the EMC merger transaction, in the case of the First Lien Notes issued on June 1, 2016, and within five years after their respective issue dates, in the case of the First Lien Notes issued on March 20, 2019 and April 9, 2020. The Company intends to register with the SEC notes having terms substantially identical to the terms of the First Lien Notes as part of an offer to exchange such registered notes for such First Lien Notes during the first half of Fiscal 2022.was approximately $0.1 billion.
China Revolving Credit Facility — The Company entered into a new revolving credit facility for China (the “China Revolving Credit Facility”) effective May 25, 2020. The new terms provide for collateralized and non-collateralized principal amounts not to exceed $1.0 billion Chinese renminbi and $1.8 billion Chinese renminbi, respectively, or equivalent amounts in U.S. dollars. Outstanding borrowings under the collateralized portion of the China Revolving Credit Facility bore interest at the loan prime rate (“LPR”) less 0.2%, for borrowings denominated in Chinese renminbi, or LIBOR plus 1.0%, for borrowings denominated in U.S. dollars, and outstanding borrowings under the non-collateralized portion bore interest at LPR less 0.2%, for borrowings denominated in Chinese renminbi, or LIBOR plus 1.4%, for borrowings denominated in U.S. dollars. The new facility expired on August 30, 2020.
During the fiscal year ended January 31, 2020, the Company renewed the credit agreement for its legacy China revolving credit facility with a bank lender, which provided an uncommitted line with an aggregate principal amount not to exceed $500 million at an interest rate of LIBOR plus 0.6% per annum. The facility was terminated upon expiration on February 26, 2020.
Unsecured Debt
UnsecuredLegacy Notes and Debentures — The Company has outstanding unsecured notes and debentures (collectively, the “Unsecured“Legacy Notes and Debentures”) that were issued by Dell Inc. (“Dell”), a wholly-owned subsidiary of Dell Technologies Inc., prior to the acquisition of Dell by Dell Technologies Inc. in the going-private transaction that closed in October 2013. Interest on these borrowings is payable semiannually.
Senior Notes — The senior unsecured notes (collectively, the “Senior Notes”) were issued on June 22, 2016 in an aggregate principal amount of $3.25 billion. Interest on these borrowings is payable semiannually.
EMC NotesDFS Debt — On September 7, 2016, EMC had outstanding $2.5 billion aggregate principal amount of its 1.875% Notes due June 2018 and $2.0 billion aggregate principal amount of its 2.650% Notes due June 2020, each of which was fully repaid as of the respective maturity dates, and $1.0 billion aggregate principal amount of its 3.375% Notes due June 2023 (collectively, the “EMC Notes”). Interest on the outstanding borrowings is payable semiannually.
VMware Notes — VMware, Inc. completed public offerings of unsecured senior notes in the aggregate amounts of $4.0 billion and $2.0 billion on August 21, 2017 and April 7, 2020, respectively (collectively, the “VMware Notes”). None of the net proceeds of such borrowings will be made available to support the operations or satisfy any corporate purposes of Dell Technologies, other than the operations and corporate purposes of VMware, Inc. and VMware, Inc.’s subsidiaries.
VMware Revolving Credit Facility — On September 12, 2017, VMware, Inc. entered into an unsecured credit agreement, establishing a revolving credit facility (the “VMware Revolving Credit Facility”), with a syndicate of lenders that provides the company with a borrowing capacity of up to $1.0 billion for VMware, Inc. general corporate purposes. Commitments under the VMware Revolving Credit Facility are available for a period of five years, which may be extended, subject to the satisfaction of certain conditions, by up to 2 one year periods. The credit agreement contains certain representations, warranties, and covenants. Commitment fees, interest rates, and other terms of borrowings under the VMware Revolving Credit Facility may vary based on VMware, Inc.’s external credit ratings. None of the net proceeds of such borrowings will be made available to support the operations or satisfy any corporate purposes of Dell Technologies, other than the operations and corporate purposes of VMware, Inc. and VMware, Inc.’s subsidiaries. As of January 29, 2021, there were 0 outstanding borrowings under the VMware Revolving Credit Facility.
VMware Term Loan Facility — On September 26, 2019, VMware, Inc. entered into a senior unsecured term loan facility (the “VMware Term Loan Facility”) with a syndicate of lenders that provided VMware, Inc. with a borrowing capacity of up to $2.0 billion through February 7, 2020 for VMware, Inc. general corporate purposes. During the three months ended October 30, 2020, VMware, Inc. repaid the outstanding borrowings of $1.5 billion under the VMware Term Loan Facility.
DFS Debt
See Note 46 and Note 79 of the Notes to the Consolidated Financial Statements, respectively, for discussion of DFS debt and the interest rate swap agreements that hedge a portion of that debt.
Other
Margin Loan2021 Revolving Credit Facility — On April 12, 2017,As of February 3, 2023, the Company’s revolving credit facility, which was entered into on November 1, 2021 (the “2021 Revolving Credit Facility”), matures on November 1, 2027. This facility provides the Company entered into the Margin Loan Facilitywith revolving commitments in an aggregate principal amount of $2.0$6.0 billion under which VMW Holdco LLC,as of February 3, 2023 for general corporate purposes, including liquidity support for the Company’s commercial paper program, and includes a wholly-owned subsidiaryletter of EMC, is the borrower. In connection with the Class V transaction described in Note 1credit sub-facility of the Notesup to the Consolidated Financial Statements, on December 20, 2018,$0.5 billion and a swing-line loan sub-facility of up to $0.5 billion. The 2021 Revolving Credit Facility also allows the Company amended the Margin Loan Facility to increase the aggregate principal amountobtain incremental additional commitments on one or more occasions in minimum amounts of the facility to $3.35 billion. In connection with obtaining the Term Loan A-6 Facility during the fiscal year ended January 31, 2020, the Company increased the aggregate principal amount of the Margin Loan Facility to $4.0 billion.$10 million.
During the three months ended May 1, 2020, due to volatility in the U.S. stock market resulting from the outbreak of COVID-19, VMware Holdco LLC proactively pledged additional shares of VMware, Inc. common stock to secure its obligationsBorrowings under the Margin Loan Facility agreement. This resulted in an aggregate number of shares pledged of approximately 76 million shares of Class B common stock of VMware, Inc. and approximately 24 million shares of Class A common stock of VMware, Inc.
Loans under the Margin Loan2021 Revolving Credit Facility bear interest at a rate per annum payable,equal to an applicable margin plus, at the borrower’sborrowers’ option, either at (a) a base rate plus 1.25%the specified adjusted term Secured Overnight Financing Rate (“SOFR”) or (b) a LIBOR-basedbase rate. The margin applicable to SOFR and base rate borrowings varies based upon the Company’s existing date ratings. The base rate is calculated based upon the greatest of the specified prime rate, the specified federal reserve bank rate, or SOFR plus 2.25%1%. Interest under the Margin Loan Facility is payable quarterly. The Margin Loan Facility will mature in April 2022. The borrowerborrowers may voluntarily repay outstanding loans under the Margin Loan2021 Revolving Credit Facility at any time without premium or penalty, other than customary “breakage” costs,breakage costs.
As of February 3, 2023, available borrowings under the 2021 Revolving Credit Facility totaled $6.0 billion.
The Company may purchase, redeem, prepay, refinance, or otherwise retire any amount of outstanding indebtedness under the terms of such indebtedness at any time and from time to time, in open market or negotiated transactions with the holders of such indebtedness or otherwise, as considered appropriate in light of market conditions and other relevant factors.
Covenants — The credit agreement governing the 2021 Revolving Credit Facility and the indentures governing the Senior Notes and the Legacy Notes and Debentures impose various limitations, subject to exceptions, on creating certain minimum threshold amounts for prepayment.liens and entering into sale and lease-back transactions. The foregoing credit agreement and indentures contain customary events of default, including failure to make required payments, failure to comply with covenants, and the occurrence of certain events of bankruptcy and insolvency. The 2021 Revolving Credit Facility is also subject to an interest coverage ratio covenant that is tested at the end of each fiscal quarter with respect to the Company’s preceding four fiscal quarters. The Company was in compliance with this financial covenant as of February 3, 2023.
DELL TECHNOLOGIES INC.
NOTES TO THE CONSOLIDATED FINANCIAL STATEMENTS (continued)
Aggregate Future Maturities
The following tablestable presents the aggregate future maturities of the Company’s debt as of January 29, 2021February 3, 2023 for the periods indicated:
| | | | Maturities by Fiscal Year | | Maturities by Fiscal Year |
| | | 2022 | | 2023 | | 2024 | | 2025 | | 2026 | | Thereafter | | Total | | 2024 | | 2025 | | 2026 | | 2027 | | 2028 | | Thereafter | | Total |
| | | (in millions) | | | | | | | | | | | | | | |
| Senior Secured Credit Facilities and First Lien Notes | $ | 0 | | | $ | 241 | | | $ | 6,023 | | | $ | 1,774 | | | $ | 3,989 | | | $ | 12,750 | | | $ | 24,777 | | |
| Unsecured Notes and Debentures | 400 | | | 0 | | | 0 | | | 0 | | | 0 | | | 952 | | | 1,352 | | |
| Senior Notes and EMC Notes | 1,075 | | | 0 | | | 1,000 | | | 1,625 | | | 0 | | | 0 | | | 3,700 | | |
| VMware Notes | 0 | | | 1,500 | | | 0 | | | 0 | | | 750 | | | 2,500 | | | 4,750 | | |
| | | | (in millions) |
| Senior Notes | | Senior Notes | $ | 1,000 | | | $ | 1,000 | | | $ | 1,000 | | | $ | 6,250 | | | $ | 500 | | | $ | 8,550 | | | $ | 18,300 | |
| Legacy Notes and Debentures | | Legacy Notes and Debentures | — | | | — | | | — | | | — | | | — | | | 952 | | | 952 | |
| DFS Debt | DFS Debt | 4,888 | | | 3,722 | | | 339 | | | 709 | | | 8 | | | 0 | | | 9,666 | | DFS Debt | 5,400 | | | 3,442 | | | 305 | | | 595 | | | 548 | | | — | | | 10,290 | |
| Margin Loan Facility | 0 | | | 4,000 | | | 0 | | | 0 | | | 0 | | | 0 | | | 4,000 | | |
| Other | Other | 11 | | | 12 | | | 172 | | | 7 | | | 9 | | | 24 | | | 235 | | Other | 177 | | | 116 | | | 24 | | | 5 | | | 3 | | | — | | | 325 | |
| Total maturities, principal amount | Total maturities, principal amount | 6,374 | | | 9,475 | | | 7,534 | | | 4,115 | | | 4,756 | | | 16,226 | | | 48,480 | | Total maturities, principal amount | 6,577 | | | 4,558 | | | 1,329 | | | 6,850 | | | 1,051 | | | 9,502 | | | 29,867 | |
| Associated carrying value adjustments | Associated carrying value adjustments | (12) | | | (17) | | | (33) | | | (74) | | | (44) | | | (316) | | | (496) | | Associated carrying value adjustments | (4) | | | (8) | | | (2) | | | (54) | | | (5) | | | (206) | | | (279) | |
| Total maturities, carrying value amount | Total maturities, carrying value amount | $ | 6,362 | | | $ | 9,458 | | | $ | 7,501 | | | $ | 4,041 | | | $ | 4,712 | | | $ | 15,910 | | | $ | 47,984 | | Total maturities, carrying value amount | $ | 6,573 | | | $ | 4,550 | | | $ | 1,327 | | | $ | 6,796 | | | $ | 1,046 | | | $ | 9,296 | | | $ | 29,588 | |
Covenants and Unrestricted Net Assets— The credit agreement for the Senior Secured Credit Facilities contains customary negative covenants that generally limit the ability of Denali Intermediate Inc., a wholly-owned subsidiary of Dell Technologies, Dell, and Dell’s and Denali Intermediate’s other restricted subsidiaries to incur debt, create liens, make fundamental changes, enter into asset sales, make certain investments, pay dividends or distribute or redeem certain equity interests, prepay or redeem certain debt, and enter into certain transactions with affiliates. The indenture governing the Senior Notes contains customary negative covenants that generally limit the ability of Denali Intermediate, Dell, and Dell’s and Denali Intermediate’s other restricted subsidiaries to incur additional debt or issue certain preferred shares, pay dividends on or make other distributions in respect of capital stock or make other restricted payments, make certain investments, sell or transfer certain assets, create liens on certain assets to secure debt, consolidate, merge, sell, or otherwise dispose of all or substantially all assets, enter into certain transactions with affiliates, and designate subsidiaries as unrestricted subsidiaries. The negative covenants under such credit agreements and indenture are subject to certain exceptions, qualifications, and “baskets.” The indentures governing the First Lien Notes, the Unsecured Notes and Debentures, and the EMC Notes variously impose limitations, subject to specified exceptions, on creating certain liens, entering into sale and lease-back transactions, and entering into certain asset sales. The foregoing credit agreements and indentures contain customary events of default, including failure to make required payments, failure to comply with covenants, and the occurrence of certain events of bankruptcy and insolvency.
As of January 29, 2021, the Company had certain consolidated subsidiaries that were designated as unrestricted subsidiaries for all purposes of the applicable credit agreements and the indentures governing the First Lien Notes and the Senior Notes. Substantially all of the net assets of the Company’s consolidated subsidiaries were restricted, with the exception of the Company’s unrestricted subsidiaries, primarily VMware Inc., Secureworks, and their respective subsidiaries, as of January 29, 2021.
The Term Loan A-6 Facility and the Revolving Credit Facility are subject to a first lien leverage ratio covenant that is tested at the end of each fiscal quarter of Dell with respect to Dell’s preceding four fiscal quarters. The Company was in compliance with all financial covenants as of January 29, 2021.
DELL TECHNOLOGIES INC.
NOTES TO THE CONSOLIDATED FINANCIAL STATEMENTS (continued)
NOTE 79 — DERIVATIVE INSTRUMENTS AND HEDGING ACTIVITIES
As part of its risk management strategy, the Company uses derivative instruments, primarily foreign currency forward and option contracts and interest rate swaps, to hedge certain foreign currency and interest rate exposures, respectively.
The Company’s objective is to offset gains and losses resulting from these exposures with gains and losses on the derivative contracts used to hedge the exposures, thereby reducing volatility of earnings and protecting the fair values of assets and liabilities. The earnings effects of the derivative instruments are presented in the same income statement line items as the earnings effects of the hedged items. For derivatives designated as cash flow hedges, the Company assesses hedge effectiveness both at the onset of the hedge and at regular intervals throughout the life of the derivative. The Company does not have anyinstruments. For derivatives designated as fair value hedges.hedges, the Company assesses hedge effectiveness on qualifying instruments using the shortcut method whereby the hedges are considered perfectly effective at the onset of the hedge and over the life of the hedging relationship.
Foreign Exchange Risk
The Company uses foreign currency forward and option contracts designated as cash flow hedges to protect against the foreign currency exchange rate risks inherent in its forecasted transactions denominated in currencies other than the U.S. Dollar. Hedge accounting is applied based upon the criteria established by accounting guidance for derivative instruments and hedging activities. The risk of loss associated with purchased options is limited to premium amounts paid for the option contracts. The risk of loss associated with forward contracts is equal to the exchange rate differential from the time the contract is entered into until the time it is settled. The majority of these contracts typically expire in twelve months or less.
During the fiscal years ended February 3, 2023, January 28, 2022, and January 29, 2021, January 31, 2020, and February 1, 2019, the Company did not discontinue any cash flow hedges related to foreign exchange contracts that had a material impact on the Company’s results of operations due to the probability that the forecasted cash flows would not occur.
The Company uses forward contracts to hedge monetary assets and liabilities denominated in a foreign currency. These contracts generally expire in three months or less, are considered economic hedges, and are not designated for hedge accounting. The change in the fair value of these instruments represents a natural hedge as their gains and losses offset the changes in the underlying fair value of the monetary assets and liabilities due to movements in currency exchange rates.
In connection with expanded offerings of DFS operations in Europe, forward contracts are used to hedge financing receivables denominated in foreign currencies other than Euro. These contracts are not designated for hedge accounting and most expire within three years or less.
Interest Rate Risk
The Company uses interest rate swaps to hedge the variability in cash flows related to the interest rate payments on structured financing debt. The interest rate swaps economically convert the variable rate on the structured financing debt to a fixed interest rate to match the underlying fixed rate being received on fixed-term customer leases and loans. These contracts are not designated for hedge accounting and most expire within threefour years or less.
Interest rate swaps are utilized to manage the interest rate risk, at a portfolio level, associated with DFS operations in Europe. The interest rate swaps economically convert the fixed rate on financing receivables to a three-month Euribor floating rate basis in order to match the floating rate nature of the banks’ funding pool. TheseThe Company also uses interest rate swaps to manage the cash flows related to interest payments on Eurobonds. The interest rate swaps economically convert the fixed rate on its bonds to a floating rate to match the underlying lease repayments profile. None of these contracts are not designated for hedge accounting and most expire within five years or less.
The Company utilizes cross currencycross-currency amortizing swaps to hedge the currency and interest rate risk exposure associated with the European securitization program that was established in Europe in January 2017.program. The cross currencycross-currency swaps combine a Euro-based interest rate swap with a British Pound or U.S. Dollar foreign exchange forward contract in which the Company pays a fixed or floating British Pound or U.S. Dollar amount and receives a fixed or floating amount in Euros linked to the one-month Euribor. The notional value of the swaps amortizes in line with the expected cash flows and run-off of the securitized assets. The swaps are not designated for hedge accounting and expire within five years or less.
DELL TECHNOLOGIES INC.
NOTES TO THE CONSOLIDATED FINANCIAL STATEMENTS (continued)
Periodically, the Company also uses interest rate swaps to modify the market risk exposures in connection with long-term debt. During the fiscal year ended February 3, 2023, the Company entered into interest rate swaps designated as fair value hedges intended to hedge a portion of its interest rate exposure by converting the fixed interest rate of a certain tranche of debt to a floating interest rate based on the benchmark SOFR Overnight Index Swap rate. As of February 3, 2023, the carrying amount of the hedged debt was $1 billion. The gains and losses related to changes in the fair value of the interest rate swaps perfectly offset changes in the fair value of the hedged portion of the underlying debt that are attributable to the changes in the underlying benchmark interest rate. During the fiscal year ended February 3, 2023, the cumulative amount of fair value hedge accounting adjustments was immaterial. These contracts expire within four years.
Derivative Instruments
The following table presents the notional amounts of outstanding derivative instruments as of the dates indicated:
| | | | | | | | | | | |
| | February 3, 2023 | | January 28, 2022 |
| | | |
| | (in millions) |
| Foreign exchange contracts: | | | |
| Designated as cash flow hedging instruments | $ | 7,746 | | | $ | 7,879 | |
| Non-designated as hedging instruments | 6,833 | | | 8,713 | |
| Total | $ | 14,579 | | | $ | 16,592 | |
| Interest rate contracts: | | | |
| Designated as fair value hedging instruments | $ | 1,000 | | | $ | — | |
| Non-designated as hedging instruments | 7,214 | | | 6,715 | |
| Total | $ | 8,214 | | | $ | 6,715 | |
DELL TECHNOLOGIES INC.
Derivative InstrumentsNOTES TO THE CONSOLIDATED FINANCIAL STATEMENTS (continued)
Notional AmountsThe following table presents the effect of Outstanding Derivative Instruments
| | | | | | | | | | | |
| | January 29, 2021 | | January 31, 2020 |
| | (in millions) |
| Foreign exchange contracts: | | | |
| Designated as cash flow hedging instruments | $ | 6,840 | | | $ | 8,703 | |
| Non-designated as hedging instruments | 9,890 | | | 7,711 | |
| Total | $ | 16,730 | | | $ | 16,414 | |
| Interest rate contracts: | | | |
| Non-designated as hedging instruments | $ | 5,859 | | | $ | 4,043 | |
Effect of Derivative Instruments Designatedderivative instruments designated as Hedging Instrumentscash flow hedging instruments on the Consolidated Statements of Financial Position and the Consolidated Statements of Income (Loss)for the periods indicated:
| | Derivatives in Cash Flow Hedging Relationships | Derivatives in Cash Flow Hedging Relationships | | Gain (Loss) Recognized in Accumulated OCI, Net of Tax, on Derivatives | | Location of Gain (Loss) Reclassified from Accumulated OCI into Income | | Gain (Loss) Reclassified from Accumulated OCI into Income | Derivatives in Cash Flow Hedging Relationships | | Gain (Loss) Recognized in Accumulated OCI, Net of Tax, on Derivatives | | Location of Gain (Loss) Reclassified from Accumulated OCI into Income | | Gain (Loss) Reclassified from Accumulated OCI into Income |
| | | (in millions) | | | | (in millions) | | | (in millions) | | | | (in millions) |
| For the fiscal year ended February 3, 2023: | | For the fiscal year ended February 3, 2023: |
| | | Total net revenue | | $ | 736 | |
| Foreign exchange contracts | | Foreign exchange contracts | | $ | 354 | | | Total cost of net revenue | | (31) | |
| Total | | Total | | $ | 354 | | | Total | | $ | 705 | |
| | For the fiscal year ended January 28, 2022: | | For the fiscal year ended January 28, 2022: |
| | | Total net revenue | | $ | 158 | |
| | | Total cost of net revenue | | (3) | |
| Foreign exchange contracts | | Foreign exchange contracts | | $ | 374 | | | Income from discontinued operations | | 3 | |
| Total | | Total | | $ | 374 | | | Total | | $ | 158 | |
| | For the fiscal year ended January 29, 2021 | For the fiscal year ended January 29, 2021 | For the fiscal year ended January 29, 2021 |
| | | | Total net revenue | | $ | (105) | | | Total net revenue | | $ | (98) | |
| Foreign exchange contracts | | $ | (200) | | | Total cost of net revenue | | 5 | | |
| Interest rate contracts | | 0 | | | Interest and other, net | | 0 | | |
| Total | | $ | (200) | | | | | $ | (100) | | |
| | For the fiscal year ended January 31, 2020 | |
| | | | Total net revenue | | $ | 226 | | | Total cost of net revenue | | 5 | |
| Foreign exchange contracts | Foreign exchange contracts | | $ | 269 | | | Total cost of net revenue | | 0 | | Foreign exchange contracts | | $ | (200) | | | Income from discontinued operations | | (7) | |
| Interest rate contracts | | 0 | | | Interest and other, net | | 0 | | |
| Total | Total | | $ | 269 | | | | | $ | 226 | | Total | | $ | (200) | | | Total | | $ | (100) | |
| | For the fiscal year ended February 1, 2019 | |
| | | Total net revenue | | $ | 225 | | |
| Foreign exchange contracts | | $ | 299 | | | Total cost of net revenue | | 0 | | |
| Interest rate contracts | | 0 | | | Interest and other, net | | 0 | | |
| Total | | $ | 299 | | | | | $ | 225 | | |
EffectThe following table presents the effect of Derivative Instruments Not Designatedderivative instruments not designated as Hedging Instrumentshedging instruments on the Consolidated Statements of Income (Loss)as of the dates indicated:
| | | | | | | | | | | | | | | | | | | | | | | | Fiscal Year Ended | |
| | Fiscal Year Ended | | | | February 3, 2023 | | January 28, 2022 | | January 29, 2021 | | Location of Gain (Loss) Recognized |
| | January 29, 2021 | | January 31, 2020 | | February 1, 2019 | | Location of Gain (Loss) Recognized | | | | | | | | | |
| | (in millions) | | | | | (in millions) | |
| Foreign exchange contracts | Foreign exchange contracts | $ | 107 | | | $ | (152) | | | $ | (67) | | | Interest and other, net | Foreign exchange contracts | | $ | (174) | | | $ | (469) | | | $ | 169 | | | Interest and other, net |
| Interest rate contracts | Interest rate contracts | (45) | | | (28) | | | (8) | | | Interest and other, net | Interest rate contracts | | 50 | | | 10 | | | (45) | | | Interest and other, net |
| Foreign exchange contracts | | Foreign exchange contracts | | — | | | 26 | | | (62) | | | Income from discontinued operations |
| Total | Total | $ | 62 | | | $ | (180) | | | $ | (75) | | | Total | | $ | (124) | | | $ | (433) | | | $ | 62 | | |
DELL TECHNOLOGIES INC.
Fair Value of Derivative Instruments in the Consolidated Statements of Financial PositionNOTES TO THE CONSOLIDATED FINANCIAL STATEMENTS (continued)
The Company presents its foreign exchange derivative instruments on a net basis in the Consolidated Statements of Financial Position due to the right of offset by its counterparties under master netting arrangements. The following tables present the fair value of those derivative instruments presented on a gross basis as of the dates indicated:
| | | | | | | | | | | | | | | | | | | | | | | | | | | | February 3, 2023 |
| | | January 29, 2021 | | Other Current
Assets | | Other Non-
Current Assets | | Other Current
Liabilities | | Other Non-Current
Liabilities | | Total
Fair Value |
| | | Other Current
Assets | | Other Non-
Current Assets | | Other Current
Liabilities | | Other Non-Current
Liabilities | | Total
Fair Value | | | | | | | | | | |
| | | (in millions) | | (in millions) |
| Derivatives designated as hedging instruments: | Derivatives designated as hedging instruments: | Derivatives designated as hedging instruments: |
| Foreign exchange contracts in an asset position | Foreign exchange contracts in an asset position | $ | 28 | | | $ | 0 | | | $ | 18 | | | $ | 0 | | | $ | 46 | | Foreign exchange contracts in an asset position | $ | 7 | | | $ | — | | | $ | 30 | | | $ | — | | | $ | 37 | |
| Foreign exchange contracts in a liability position | Foreign exchange contracts in a liability position | (10) | | | 0 | | | (15) | | | 0 | | | (25) | | Foreign exchange contracts in a liability position | (21) | | | — | | | (142) | | | — | | | (163) | |
| Interest rate contracts in an asset position | | Interest rate contracts in an asset position | — | | | — | | | — | | | — | | | — | |
| Interest rate contracts in a liability position | | Interest rate contracts in a liability position | — | | | — | | | — | | | (6) | | | (6) | |
| Net asset (liability) | Net asset (liability) | 18 | | | 0 | | | 3 | | | 0 | | | 21 | | Net asset (liability) | (14) | | | — | | | (112) | | | (6) | | | (132) | |
| Derivatives not designated as hedging instruments: | Derivatives not designated as hedging instruments: | | | | | | | | | | Derivatives not designated as hedging instruments: | | | | | | | | | |
| Foreign exchange contracts in an asset position | Foreign exchange contracts in an asset position | 184 | | | 0 | | | 58 | | | 0 | | | 242 | | Foreign exchange contracts in an asset position | 282 | | | 1 | | | 368 | | | — | | | 651 | |
| Foreign exchange contracts in a liability position | Foreign exchange contracts in a liability position | (108) | | | 0 | | | (159) | | | (4) | | | (271) | | Foreign exchange contracts in a liability position | (121) | | | — | | | (614) | | | (1) | | | (736) | |
| Interest rate contracts in an asset position | Interest rate contracts in an asset position | 0 | | | 10 | | | 0 | | | 0 | | | 10 | | Interest rate contracts in an asset position | 14 | | | 133 | | | — | | | — | | | 147 | |
| Interest rate contracts in a liability position | Interest rate contracts in a liability position | 0 | | | 0 | | | 0 | | | (31) | | | (31) | | Interest rate contracts in a liability position | — | | | — | | | — | | | (95) | | | (95) | |
| Net asset (liability) | Net asset (liability) | 76 | | | 10 | | | (101) | | | (35) | | | (50) | | Net asset (liability) | 175 | | | 134 | | | (246) | | | (96) | | | (33) | |
| Total derivatives at fair value | Total derivatives at fair value | $ | 94 | | | $ | 10 | | | $ | (98) | | | $ | (35) | | | $ | (29) | | Total derivatives at fair value | $ | 161 | | | $ | 134 | | | $ | (358) | | | $ | (102) | | | $ | (165) | |
| | | | January 31, 2020 | | January 28, 2022 |
| | | Other Current
Assets | | Other Non-
Current Assets | | Other Current
Liabilities | | Other Non-Current
Liabilities | | Total
Fair Value | | Other Current
Assets | | Other Non-
Current Assets | | Other Current
Liabilities | | Other Non-Current
Liabilities | | Total
Fair Value |
| | | (in millions) | | | | | | | | | | |
| | | | (in millions) |
| Derivatives designated as hedging instruments: | Derivatives designated as hedging instruments: | Derivatives designated as hedging instruments: |
| Foreign exchange contracts in an asset position | Foreign exchange contracts in an asset position | $ | 108 | | | $ | 0 | | | $ | 15 | | | $ | 0 | | | $ | 123 | | Foreign exchange contracts in an asset position | $ | 135 | | | $ | — | | | $ | 50 | | | $ | — | | | $ | 185 | |
| Foreign exchange contracts in a liability position | Foreign exchange contracts in a liability position | (2) | | | 0 | | | (3) | | | 0 | | | (5) | | Foreign exchange contracts in a liability position | (5) | | | — | | | (8) | | | — | | | (13) | |
| Net asset (liability) | 106 | | | 0 | | | 12 | | | 0 | | | 118 | | |
| Net asset | | Net asset | 130 | | | — | | | 42 | | | — | | | 172 | |
| Derivatives not designated as hedging instruments: | Derivatives not designated as hedging instruments: | Derivatives not designated as hedging instruments: |
| Foreign exchange contracts in an asset position | Foreign exchange contracts in an asset position | 136 | | | 0 | | | 39 | | | 0 | | | 175 | | Foreign exchange contracts in an asset position | 280 | | | 2 | | | 106 | | | — | | | 388 | |
| Foreign exchange contracts in a liability position | Foreign exchange contracts in a liability position | (162) | | | 0 | | | (81) | | | (6) | | | (249) | | Foreign exchange contracts in a liability position | (189) | | | — | | | (244) | | | (5) | | | (438) | |
| Interest rate contracts in an asset position | Interest rate contracts in an asset position | 0 | | | 1 | | | 0 | | | 0 | | | 1 | | Interest rate contracts in an asset position | — | | | 30 | | | — | | | — | | | 30 | |
| Interest rate contracts in a liability position | Interest rate contracts in a liability position | 0 | | | 0 | | | 0 | | | (32) | | | (32) | | Interest rate contracts in a liability position | — | | | — | | | — | | | (37) | | | (37) | |
| Net asset (liability) | Net asset (liability) | (26) | | | 1 | | | (42) | | | (38) | | | (105) | | Net asset (liability) | 91 | | | 32 | | | (138) | | | (42) | | | (57) | |
| Total derivatives at fair value | Total derivatives at fair value | $ | 80 | | | $ | 1 | | | $ | (30) | | | $ | (38) | | | $ | 13 | | Total derivatives at fair value | $ | 221 | | | $ | 32 | | | $ | (96) | | | $ | (42) | | | $ | 115 | |
DELL TECHNOLOGIES INC.
NOTES TO THE CONSOLIDATED FINANCIAL STATEMENTS (continued)
The following tables present the gross amounts of the Company’s derivative instruments, amounts offset due to master netting agreements with the Company’s counterparties, and the net amounts recognized in the Consolidated Statements of Financial Position as of the dates indicated:
| | | | | | | | | | | | | | | | | | | | | | | | | | | | | | | | | February 3, 2023 |
| | January 29, 2021 | | Gross Amounts of Recognized Assets/ (Liabilities) | | Gross Amounts Offset in the Statement of Financial Position | | Net Amounts of Assets/ (Liabilities) Presented in the Statement of Financial Position | | Gross Amounts not Offset in the Statement of Financial Position | | Net Amount of Assets/ (Liabilities) Recognized in the Statement of Financial Position |
| | Gross Amounts of Recognized Assets/ (Liabilities) | | Gross Amounts Offset in the Statement of Financial Position | | Net Amounts of Assets/ (Liabilities) Presented in the Statement of Financial Position | | Gross Amounts not Offset in the Statement of Financial Position | | Net Amount of Assets/ (Liabilities) Recognized in the Consolidated Statement of Financial Position | | Financial Instruments | | Cash Collateral Received or Pledged | |
| Financial Instruments | | Cash Collateral Received or Pledged | | | | | | | | | | | | | |
| | (in millions) | | (in millions) |
| Derivative instruments: | Derivative instruments: | | Derivative instruments: | |
| Financial assets | Financial assets | $ | 298 | | | $ | (194) | | | $ | 104 | | | $ | 0 | | | $ | 0 | | | $ | 104 | | Financial assets | $ | 835 | | | $ | (540) | | | $ | 295 | | | $ | — | | | $ | — | | | $ | 295 | |
| Financial liabilities | Financial liabilities | (327) | | | 194 | | | (133) | | | 0 | | | 2 | | | (131) | | Financial liabilities | (1,000) | | | 540 | | | (460) | | | — | | | 25 | | | (435) | |
| Total derivative instruments | Total derivative instruments | $ | (29) | | | $ | 0 | | | $ | (29) | | | $ | 0 | | | $ | 2 | | | $ | (27) | | Total derivative instruments | $ | (165) | | | $ | — | | | $ | (165) | | | $ | — | | | $ | 25 | | | $ | (140) | |
| | | January 31, 2020 | | January 28, 2022 |
| | Gross Amounts of Recognized Assets/ (Liabilities) | | Gross Amounts Offset in the Statement of Financial Position | | Net Amounts of Assets/ (Liabilities) Presented in the Statement of Financial Position | | Gross Amounts not Offset in the Statement of Financial Position | | Net Amount of Assets/ (Liabilities) Recognized in the Consolidated Statement of Financial Position | | Gross Amounts of Recognized Assets/ (Liabilities) | | Gross Amounts Offset in the Statement of Financial Position | | Net Amounts of Assets/ (Liabilities) Presented in the Statement of Financial Position | | Gross Amounts not Offset in the Statement of Financial Position | | Net Amount of Assets/ (Liabilities) Recognized in the Statement of Financial Position |
| Financial Instruments | | Cash Collateral Received or Pledged | | | Financial Instruments | | Cash Collateral Received or Pledged | |
| | (in millions) | | | | | | | | | | | | |
| | | (in millions) |
| Derivative instruments: | Derivative instruments: | | Derivative instruments: | |
| Financial assets | Financial assets | $ | 299 | | | $ | (218) | | | $ | 81 | | | $ | 0 | | | $ | 0 | | | $ | 81 | | Financial assets | $ | 603 | | | $ | (350) | | | $ | 253 | | | $ | — | | | $ | — | | | $ | 253 | |
| Financial liabilities | Financial liabilities | (286) | | | 218 | | | (68) | | | 0 | | | 15 | | | (53) | | Financial liabilities | (488) | | | 350 | | | (138) | | | — | | | 24 | | | (114) | |
| Total derivative instruments | Total derivative instruments | $ | 13 | | | $ | 0 | | | $ | 13 | | | $ | 0 | | | $ | 15 | | | $ | 28 | | Total derivative instruments | $ | 115 | | | $ | — | | | $ | 115 | | | $ | — | | | $ | 24 | | | $ | 139 | |
DELL TECHNOLOGIES INC.
NOTES TO THE CONSOLIDATED FINANCIAL STATEMENTS (continued)
NOTE 810 — BUSINESS COMBINATIONS, GOODWILL AND INTANGIBLE ASSETS
Business Combinations
Fiscal year ended January 29, 2021
VMware, Inc. Acquisitions
SaltStack, Inc. — During the three months ended October 30, 2020, VMware, Inc. completed the acquisition of SaltStack, Inc., a developer of intelligent, event-driven automation software, to broaden VMware, Inc.’s Cloud Management capabilities from infrastructure to applications. The total purchase price, net of cash acquired, was $51 million. The purchase price primarily included $29 million of intangible assets and $24 million of goodwill that is 0t expected to be deductible for tax purposes. The identifiable intangible assets, which primarily consisted of completed technology, have estimated useful lives of three years.
Datrium, Inc. — During the three months ended July 31, 2020, VMware, Inc. completed the acquisition of Datrium, Inc., a provider of cloud-native disaster recovery solutions, to broaden the VMware Site Recovery Disaster Recovery as a Service offerings. The total purchase price, net of cash acquired, was $137 million. The purchase price primarily included $25 million of identifiable intangible assets and $91 million of goodwill. The identifiable intangible assets, which primarily consisted of completed technology, have estimated useful lives of three years to five years. During the three months ended January 29, 2021, VMware, Inc. evaluated facts and circumstances that existed as of the acquisition date and adjusted the provisional amount recorded to deferred tax asset, resulting in an increase of $40 million to goodwill, and determined that intangible assets and goodwill are expected to be deductible for tax purposes.
Lastline, Inc. — During the three months ended July 31, 2020, VMware, Inc. completed the acquisition of Lastline, Inc., a provider of network-based security breach detection products and services, to enhance capabilities for network detection and threat analysis on VMware NSX and SD-WAN offerings. The total purchase price, net of cash acquired, was $114 million. The purchase price primarily included $29 million of identifiable intangible assets and $86 million of goodwill that is 0t expected to be deductible for tax purposes. The identifiable intangible assets, which primarily consisted of completed technology, have estimated useful lives of one year to four years.
Nyansa, Inc. — During the three months ended May 1, 2020, VMware, Inc. completed the acquisition of Nyansa, Inc., a developer of artificial intelligence-based network analytics, to accelerate the delivery of end-to-end monitoring and troubleshooting capabilities within VMware SD-WAN by VeloCloud. The total purchase price, net of cash acquired, was $38 million. The purchase price primarily included $14 million of identifiable intangible assets and $24 million of goodwill that is 0t expected to be deductible for tax purposes. The identifiable intangible assets, which primarily consisted of completed technology, have estimated useful lives of one year to four years.
Other Fiscal 2021 Acquisitions — During the fiscal year ended January 29, 2021, VMware, Inc. completed 5 other acquisitions, which were not material, individually or in aggregate, to the Consolidated Financial Statements. VMware, Inc. expects these acquisitions to enhance its product features and capabilities for its VMware Carbon Black Cloud and vRealize Operations offerings. The aggregate purchase price for these 5 acquisitions, net of cash acquired, was $62 million and primarily included $52 million of identifiable intangible assets and $16 million of goodwill, of which $24 million is expected to be deductible for tax purposes. The identifiable intangible assets, which primarily consisted of completed technology, have estimated useful lives of one year to five years.
For each of the acquisitions completed during the fiscal year ended January 29, 2021, the excess of the purchase consideration over the fair value of net tangible and identifiable intangible assets acquired was recorded as goodwill, which management believes represents synergies expected from combining the technologies of VMware, Inc. with those of the acquired businesses. The estimated fair value assigned to the tangible assets, identifiable intangible assets, and assumed liabilities were based on management's estimates and assumptions. The initial allocation of the purchase price was based on preliminary valuations and assumptions and is subject to change within the measurement period. VMware, Inc. expects to finalize the allocation of the purchase price within the measurement period.
The pro forma financial information assuming these Fiscal 2021 acquisitions had occurred as of the beginning of the fiscal year prior to the fiscal year of acquisition, as well as the revenue and earnings generated during the current fiscal year, were not material for disclosure purposes.
Fiscal year ended January 31, 2020
VMware, Inc. Acquisition of Carbon Black, Inc.
On October 8, 2019, VMware, Inc. completed the acquisition of Carbon Black, Inc. (“Carbon Black”), a developer of cloud-native endpoint protection, in a cash tender offer for all of the outstanding shares of Carbon Black’s common stock, at a price of $26.00 per share. VMware, Inc. acquired Carbon Black to create a comprehensive intrinsic security portfolio to protect workloads, clients, and infrastructure from cloud to edge. VMware, Inc. believes that the acquisition will result in synergies with the Carbon Black platform and VMware NSX and VMware Workspace ONE offerings, among others, and enable VMware, Inc. to offer a highly-differentiated intrinsic security platform addressing multiple concerns of the security industry. The total purchase price was $2.0 billion, net of cash acquired of $111 million.
Merger consideration totaling $18 million is held with a third-party paying agent and is payable to a certain employee of Carbon Black subject to specified future employment conditions, and is being recognized as an expense over the requisite service period of approximately two years on a straight-line basis.
VMware, Inc. assumed all of Carbon Black’s unvested stock options and restricted stock awards outstanding at the completion of the acquisition with an estimated fair value of $181 million. Of the total consideration, $10 million was allocated to the purchase price and $171 million was allocated to future services and will be expensed over the remaining requisite service periods of approximately three years on a straight-line basis. The estimated fair value of the stock options assumed by VMware, Inc. was determined using the Black-Scholes option pricing model. A share conversion ratio of 0.2 was applied to convert Carbon Black’s outstanding stock awards into awards for shares of VMware, Inc.'s common stock.
The following table summarizes the allocation of the consideration to the fair value of the assets acquired and liabilities assumed on the date of acquisition (in millions):
| | | | | |
Cash | $ | 111 | |
Accounts receivable | 58 | |
Intangible assets | 492 | |
Goodwill | 1,588 | |
Other acquired assets | 52 | |
Total assets acquired | 2,301 | |
Deferred revenue | 151 | |
Other assumed liabilities | 45 | |
Total liabilities assumed | 196 | |
Fair value of assets acquired and liabilities assumed | $ | 2,105 | |
The following table summarizes the components of the intangible assets acquired and their estimated useful lives by VMware, Inc. in conjunction with the acquisition:
| | | | | | | | | | | |
| Weighted-Average Useful Lives | | Fair Value Amount |
| (in years) | | (in millions) |
| Purchased technology | 4.2 | | $ | 232 | |
| Customer relationships and customer lists | 7.0 | | 215 | |
| Trademarks and tradenames | 5.0 | | 25 | |
| Other | 2.0 | | 20 | |
| Total definite-lived intangible assets | | | $ | 492 | |
The excess of the purchase consideration over the fair value of net tangible and identifiable intangible assets acquired was recorded as goodwill. The estimated fair value assigned to the tangible assets, identifiable intangible assets, and assumed liabilities were based on VMware, Inc. management's estimates and assumptions. Goodwill and identifiable intangible assets were 0t deductible for tax purposes.
Other VMware, Inc. Acquisitions
During the fiscal year ended January 31, 2020, VMware, Inc. completed the acquisition of Avi Networks, Inc., a provider of multi-cloud application delivery services. Together, VMware, Inc. and Avi Networks, Inc. expect to deliver a software defined networking stack built for the multi-cloud environment. The total purchase price was $326 million, net of cash acquired of $9 million. The purchase price primarily included $94 million of identifiable intangible assets and $228 million of goodwill that was 0t deductible for tax purposes.
VMware, Inc. completed other acquisitions during the fiscal year ended January 31, 2020 which were not material, individually or in aggregate, to the Consolidated Financial Statements. VMware, Inc. expects that these acquisitions will enhance its product features and capabilities for its software-defined data center solutions and software-as-a-service offerings.
Fiscal year ended February 1, 2019
VMware, Inc. Acquisitions
CloudHealth Technologies, Inc. — During the third quarter of the fiscal year ended February 1, 2019, VMware, Inc. completed the acquisition of CloudHealth Technologies, Inc. (“CloudHealth Technologies”). CloudHealth Technologies delivers a cloud operations platform that enables customers to analyze and manage cloud cost, usage, security, and performance centrally for native public clouds, which expanded VMware, Inc’s portfolio of multi-cloud management solutions. The total purchase price was $495 million, net of cash acquired of $26 million. The fair value of assumed unvested equity awards attributed to post-combination services was $39 million and will be expensed over the remaining requisite service periods on a straight-line basis.
Heptio Inc. — During the fourth quarter of the fiscal year ended February 1, 2019, VMware, Inc. completed the acquisition of Heptio Inc. (“Heptio”), a provider of products and services that help enterprises deploy and operationalize Kubernetes. VMware, Inc. acquired Heptio to enhance VMware, Inc’s Kubernetes portfolio and cloud native strategy. The total purchase price was $420 million, net of cash acquired of $15 million. Merger consideration totaling $117 million, including $24 million being held in escrow, is payable to certain employees of Heptio subject to specified future employment conditions and is being recognized as expense over the requisite service period of approximately four years on a straight-line basis. The fair value of assumed unvested equity awards attributed to post-combination services was $47 million and will be expensed over the remaining requisite service periods on a straight-line basis.
Goodwill
The Infrastructure Solutions Group and Client Solutions Group and VMware reporting units are consistent with the reportable segments identified in Note 19 of the Notes to the Consolidated Financial Statements. Offerings within Other businesses as defined belowconsists of VMware Resale, Secureworks, and Virtustream, which each represent separate reporting units.
During the fiscal year ended January 31, 2020, VMware, Inc. completed its acquisition of Pivotal which was accounted for as a transaction by entities under common control, and Dell Technologies now reports Pivotal results within the VMware reportable segment. Pivotal results and goodwill were previously included within Other businesses. The historical segment results and the historical carrying amounts of goodwill attributable to Pivotal ($2.2 billion as of February 1, 2019) were recast to reflect this change. See Note 19 of the Notes to the Consolidated Financial Statements for the recast of segment results.
The following table presents goodwill allocated to the Company’s reportable segments and changes in the carrying amount of goodwill as of the dates indicated:
| | | | | | | | | | | | | | | | | | | | | | | | | | | | | |
| | Infrastructure Solutions Group | | Client Solutions Group | | VMware | | Other Businesses (a) | | Total |
| (in millions) |
| Balances as of February 1, 2019 | $ | 15,199 | | | $ | 4,237 | | | $ | 18,621 | | | $ | 2,032 | | | $ | 40,089 | |
| Goodwill acquired (b) | 0 | | | 0 | | | 1,911 | | | 16 | | | 1,927 | |
| Impact of foreign currency translation | (110) | | | — | | | 0 | | | (8) | | | (118) | |
| | | | | | | | | |
| Goodwill impaired (c) | 0 | | | 0 | | | 0 | | | (207) | | | (207) | |
| Balances as of January 31, 2020 | 15,089 | | | 4,237 | | | 20,532 | | | 1,833 | | | 41,691 | |
| Goodwill acquired (b) | 0 | | | 0 | | | 270 | | | 9 | | | 279 | |
| Impact of foreign currency translation | 235 | | | 0 | | | 0 | | | 9 | | | 244 | |
| Goodwill divested (d) | 0 | | | 0 | | | 0 | | | (1,385) | | | (1,385) | |
| | | | | | | | | |
| Balances as of January 29, 2021 | $ | 15,324 | | | $ | 4,237 | | | $ | 20,802 | | | $ | 466 | | | $ | 40,829 | |
____________________
(a) As of January 29, 2021, goodwill allocated to Other businesses consists of Secureworks, Virtustream, and Boomi.
(b) Related primarily to VMware, Inc. business combinations completed during the fiscal years ended January 29, 2021 and January 31, 2020, as discussed above.
(c) The Company recognized goodwill impairment charges related to Virtustream during the fiscal year ended January 31, 2020, as discussed below.
(d) During the three months ended October 30, 2020, Dell Technologies closed the transaction to sell RSA Security. Prior to the divestiture, RSA Security was included within Other businesses. See Note 1 of the Notes to the Consolidated Financial Statements for additional information about the divestiture of RSA Security. | | | | | | | | | | | | | | | | | | | | | | | |
| | Infrastructure Solutions Group | | Client Solutions Group | | Other Businesses | | Total |
| | | | | | | |
| (in millions) |
| Balances as of January 29, 2021 | $ | 15,325 | | | $ | 4,237 | | | $ | 466 | | | $ | 20,028 | |
| | | | | | | |
| Impact of foreign currency translation | (219) | | | — | | | — | | | (219) | |
| Goodwill divested | — | | | — | | | (39) | | | (39) | |
| | | | | | | |
| Balances as of January 28, 2022 | $ | 15,106 | | | $ | 4,237 | | | $ | 427 | | | $ | 19,770 | |
| Goodwill acquired | 48 | | | — | | | — | | | 48 | |
| Impact of foreign currency translation and other | (137) | | | (5) | | | — | | | (142) | |
| | | | | | | |
| | | | | | | |
| | | | | | | |
| Balances as of February 3, 2023 | $ | 15,017 | | | $ | 4,232 | | | $ | 427 | | | $ | 19,676 | |
Goodwill Impairment Tests— Goodwill and indefinite-lived intangible assets are tested for impairment annually during the third fiscal quarter and whenever events or circumstances may indicate that an impairment has occurred. As a result of the changes in the current economic environment related to the COVID-19 pandemic, the Company considered whether there was a potential triggering event requiring the evaluation of whether goodwill of any of the reporting units should be tested for impairment. The Company determined there was no triggering event in previous quarters during Fiscal 2021, and no impairment test was performed other than the Company’s annual impairment review in the third quarter of Fiscal 2021.
For the annual impairment review in the third quarter of Fiscal 2021, the Company elected to bypass the assessment of qualitative factors to determine whether it was more likely than not that the fair value of a reporting unit was less than its carrying amount, including goodwill. In electing to bypass the qualitative assessment, the Company proceeded directly to performing a quantitative goodwill impairment test to measure the fair value of each goodwill reporting unit relative to its carrying amount, and to determine the amount of goodwill impairment loss to be recognized, if any.
Management exercised significant judgment related to the above assessment, including the identification of goodwill reporting units, assignment of assets and liabilities to goodwill reporting units, assignment of goodwill to reporting units, and determination of the fair value of each goodwill reporting unit. The fair value of each goodwill reporting unit is generally estimated using a combination of public company multiples and discounted cash flow methodologies, unless the reporting unit relates to a publicly-traded entity (VMware, Inc. or Secureworks), in which case the fair value is determined based primarily on the public company market valuation. The discounted cash flow and public company multiples methodologies require significant judgment, including estimation of future revenues, gross margins, and operating expenses, which are dependent on internal forecasts, current and anticipated economic conditions and trends, selection of market multiples through assessment of the reporting unit’s performance relative to peer competitors, the estimation of the long-term revenue growth rate and discount rate of the Company’s business, and the determination of the Company’s weighted average cost of capital. Changes in these estimates and assumptions could materially affect the fair value of the goodwill reporting unit, potentially resulting in a non-cash impairment charge.
The fair value of the indefinite-lived trade names is generally estimated using discounted cash flow methodologies. The discounted cash flow methodology requires significant judgment, including estimation of future revenue, the estimation of the long-term revenue growth rate of the Company’s business and the determination of the Company’s weighted average cost of capital and royalty rates. Changes in these estimates and assumptions could materially affect the fair value of the indefinite-lived intangible assets, potentially resulting in a non-cash impairment charge.
Based on the results of the annual impairment test performed during the fiscal year ended January 29, 2021, the fair values of each of the reporting units exceeded their carrying values.
During the fiscal year ended January 31, 2020, an interim impairment assessment of Virtustream was required. There were no remaining balances of Virtustream goodwill, intangible assets, or property, plant, and equipment as of January 31, 2020 following the pre-tax asset impairment charge of $619 million ($524 million net of tax benefits) recognized during the fiscal year ended January 31, 2020, and a gross goodwill impairment charge of $190 million recognized during the fiscal year ended February 1, 2019. The asset impairment charge during the fiscal year ended January 31, 2020 was comprised of $207 million of goodwill, $266 million of intangible assets, net, $146 million of property plant and equipment, net, and $95 million of other non-current liabilities related to deferred income taxes. The impairments were reflected in Other, net within cash flows from operating activities on the Consolidated Statements of Cash Flows.
Intangible Assets
The following table presents the Company’s intangible assets as of the dates indicated:
| | | | | | | | | | | | | | | | | | | | | | | | | | | | | | | | | February 3, 2023 | | January 28, 2022 |
| | | January 29, 2021 | | January 31, 2020 | | Gross | | Accumulated
Amortization | | Net | | Gross | | Accumulated
Amortization | | Net |
| | | Gross | | Accumulated
Amortization | | Net | | Gross | | Accumulated
Amortization | | Net | | | | | | | | | | | | |
| | | (in millions) | | (in millions) |
| Customer relationships | Customer relationships | $ | 22,394 | | | $ | (15,448) | | | $ | 6,946 | | | $ | 22,950 | | | $ | (13,821) | | | $ | 9,129 | | Customer relationships | $ | 16,956 | | | $ | (14,474) | | | $ | 2,482 | | | $ | 16,956 | | | $ | (13,938) | | | $ | 3,018 | |
| Developed technology | Developed technology | 15,488 | | | (12,136) | | | 3,352 | | | 15,707 | | | (10,974) | | | 4,733 | | Developed technology | 9,466 | | | (8,660) | | | 806 | | | 9,635 | | | (8,405) | | | 1,230 | |
| Trade names | Trade names | 1,285 | | | (909) | | | 376 | | | 1,306 | | | (816) | | | 490 | | Trade names | 875 | | | (780) | | | 95 | | | 885 | | | (757) | | | 128 | |
| | Definite-lived intangible assets | Definite-lived intangible assets | 39,167 | | | (28,493) | | | 10,674 | | | 39,963 | | | (25,611) | | | 14,352 | | Definite-lived intangible assets | 27,297 | | | (23,914) | | | 3,383 | | | 27,476 | | | (23,100) | | | 4,376 | |
| Indefinite-lived trade names | Indefinite-lived trade names | 3,755 | | | — | | | 3,755 | | | 3,755 | | | — | | | 3,755 | | Indefinite-lived trade names | 3,085 | | | — | | | 3,085 | | | 3,085 | | | — | | | 3,085 | |
| Total intangible assets | Total intangible assets | $ | 42,922 | | | $ | (28,493) | | | $ | 14,429 | | | $ | 43,718 | | | $ | (25,611) | | | $ | 18,107 | | Total intangible assets | $ | 30,382 | | | $ | (23,914) | | | $ | 6,468 | | | $ | 30,561 | | | $ | (23,100) | | | $ | 7,461 | |
Amortization expense related to definite-lived intangible assets was approximately $3.4$1.0 billion, $4.4$1.6 billion, and $6.1$2.1 billion for the fiscal years ended February 3, 2023, January 28, 2022, and January 29, 2021, January 31, 2020, and February 1, 2019, respectively. There were no material impairment charges related to intangible assets during the fiscal yearyears ended February 3, 2023, January 28, 2022, and January 29, 2021. During the fiscal year ended January 31, 2020, an impairment charge related to Virtustream intangible assets, net was approximately $266 million, as discussed above. During the fiscal year ended February 1, 2019, due to Virtustream business changes, the Virtustream definite-lived intangible assets were tested for impairment using a quantitative analysis, and 0 impairment was identified.
During the three months ended May 1, 2020, the Company recognized proceeds and a gain of $120 million from the sale of certain internally developed intellectual property assets.
DELL TECHNOLOGIES INC.
NOTES TO THE CONSOLIDATED FINANCIAL STATEMENTS (continued)
The following table presents the estimated future annual pre-tax amortization expense of definite-lived intangible assets as of the date indicated:
| | | | | |
| January 29, 2021February 3, 2023 |
| (in millions) |
Fiscal 20222024 | $ | 2,702 | |
Fiscal 2023 | 1,824 | |
Fiscal 2024 | 1,455764 | |
| Fiscal 2025 | 1,105599 | |
| Fiscal 2026 | 859472 | |
| Fiscal 2027 | 364 | |
| Fiscal 2028 | 268 | |
| Thereafter | 2,729916 | |
| Total | $ | 10,6743,383 | |
Goodwill and Indefinite-Lived Intangible Assets Impairment Testing
Goodwill and indefinite-lived intangible assets are tested for impairment annually during the third fiscal quarter and whenever events or circumstances may indicate that an impairment has occurred.
For the annual impairment review during the third quarter of Fiscal 2023, the Company elected to bypass the assessment of qualitative factors to determine whether it was more likely than not that the fair value of a reporting unit was less than its carrying amount, including goodwill. In electing to bypass the qualitative assessment, the Company proceeded directly to perform a quantitative goodwill impairment test to measure the fair value of each goodwill reporting unit relative to its carrying amount, and to determine the amount of goodwill impairment loss to be recognized, if any.
Management exercised significant judgment related to the above assessment, including the identification of goodwill reporting units, assignment of assets and liabilities to goodwill reporting units, assignment of goodwill to reporting units, and determination of the fair value of each goodwill reporting unit. The fair value of each goodwill reporting unit is generally estimated using a combination of public company multiples and discounted cash flow methodologies. The discounted cash flow and public company multiples methodologies require significant judgment, including estimation of future revenues, gross margins, and operating expenses, which are dependent on internal forecasts, current and anticipated economic conditions and trends, selection of market multiples through assessment of the reporting unit’s performance relative to peer competitors, the estimation of the long-term revenue growth rate and discount rate of the Company’s business, and the determination of the Company’s weighted average cost of capital. Changes in these estimates and assumptions could materially affect the fair value of the goodwill reporting unit, potentially resulting in a non-cash impairment charge.
The fair value of the indefinite-lived trade names is generally estimated using discounted cash flow methodologies. These methodologies require significant judgment, including estimation of future revenue, the estimation of the long-term revenue growth rate of the Company’s business and the determination of the Company’s weighted average cost of capital and royalty rates. Changes in these estimates and assumptions could materially affect the fair value of the indefinite-lived intangible assets, potentially resulting in a non-cash impairment charge.
Based on the results of the annual impairment test performed during the fiscal year ended February 3, 2023, the fair values of each of the reporting units exceeded their carrying values. No goodwill impairment test was performed during the fiscal year ended February 3, 2023 other than the Company’s annual impairment review.
DELL TECHNOLOGIES INC.
NOTES TO THE CONSOLIDATED FINANCIAL STATEMENTS (continued)
NOTE 911 — DEFERRED REVENUE
Deferred Revenue — Deferred revenue is recorded forconsists of support and deployment services, software maintenance, training, Software-as-a-Service, and undelivered hardware and professional services, training,consisting of installations and software-as-a-serviceconsulting engagements. Deferred revenue is recorded when the Company has a right to invoiceinvoiced or payments have been received for undelivered products or services where transfer of control has not occurred. Revenue is recognized on these items when the revenue recognition criteria are met, generally resulting in ratable recognition over the contract term. The Company also has deferred revenue related to undelivered hardware and professional services, consisting of installations and consulting engagements, which are recognized as the Company’s performance obligations under the contract are completed.
The following table presents the changes in the Company’s deferred revenue for the periods indicated:
| | | | | | | | | | | | | | Fiscal Year Ended |
| | Fiscal Year Ended | | | February 3, 2023 | | January 28, 2022 |
| | January 29, 2021 | | January 31, 2020 | | | | | |
| | (in millions) | | | (in millions) |
| Deferred revenue: | Deferred revenue: | | Deferred revenue: | | |
| Deferred revenue at beginning of period | Deferred revenue at beginning of period | $ | 27,800 | | | $ | 24,010 | | Deferred revenue at beginning of period | | $ | 27,573 | | | $ | 25,592 | |
| Revenue deferrals | Revenue deferrals | 25,475 | | | 23,315 | | Revenue deferrals | | 23,166 | | | 20,968 | |
| Revenue recognized | Revenue recognized | (22,213) | | | (19,676) | | Revenue recognized | | (20,288) | | | (18,843) | |
| Other (a) (b) | (261) | | | 151 | | |
| Other (a) | | Other (a) | | (165) | | | (144) | |
| Deferred revenue at end of period | Deferred revenue at end of period | $ | 30,801 | | | $ | 27,800 | | Deferred revenue at end of period | | $ | 30,286 | | | $ | 27,573 | |
| Short-term deferred revenue | Short-term deferred revenue | $ | 16,525 | | | $ | 14,881 | | Short-term deferred revenue | | $ | 15,542 | | | $ | 14,261 | |
| Long-term deferred revenue | Long-term deferred revenue | $ | 14,276 | | | $ | 12,919 | | Long-term deferred revenue | | $ | 14,744 | | | $ | 13,312 | |
____________________
(a) For the fiscal year ended February 3, 2023, Other represents the reclassification of deferred revenue to accrued and other liabilities. For the fiscal year ended January 29, 2021,28, 2022, Other consists of divested deferred revenue from the sale of RSA Security.Boomi. See Note 1 of the Notes to the Consolidated Financial Statements for more information about the divestiture of RSA Security.
(b) For the fiscal year ended January 31, 2020, Other consists of acquired deferred revenue from Carbon Black, Inc. by VMware, Inc.Boomi.
Remaining Performance Obligations — Remaining performance obligations represent the aggregate amount of the transaction price allocated to performance obligations not delivered, or partially undelivered, as of the end of the reporting period. Remaining performance obligations include deferred revenue plus unbilled amounts not yet recorded in deferred revenue. The value of the transaction price allocated to remaining performance obligations as of January 29, 2021February 3, 2023 was approximately $41$40 billion. The Company expects to recognize approximately 60%57% of remaining performance obligations as revenue in the next twelve months, and the remainder thereafter.
The aggregate amount of the transaction price allocated to remaining performance obligations does not include amounts owed under cancelable contracts where there is no substantive termination penalty. The Company applied the practical expedient to exclude the value of remaining performance obligations for contracts for which revenue is recognized at the amount to which the Company has the right to invoice for services performed.
Remaining performance obligation estimates are subject to change and are affected by several factors, including terminations, changes in the scope of contracts, periodic revalidation, adjustments for revenue that have not materialized, and adjustments for currency.
DELL TECHNOLOGIES INC.
NOTES TO THE CONSOLIDATED FINANCIAL STATEMENTS (continued)
NOTE 1012 — COMMITMENTS AND CONTINGENCIES
Purchase Obligations
The Company has contractual obligations to purchase goods or services, which specify significant terms including(including fixed or minimum quantities to be purchased;purchased), fixed, minimum, or variable price provisions; and the approximate timing of the transaction. As of January 29, 2021,February 3, 2023, such purchase obligations were $4,885 million, $462 million, and $531 million$3.5 billion for Fiscal 2022, Fiscal 2023, and Fiscal 2024 and thereafter, respectively.
Lease Commitments
The Company leases property and equipment, manufacturing facilities, and office space under non-cancelable leases. As of January 29, 2021, the future maturity of the Company’s operating lease liabilities under non-cancelable leases was as follows: $472 million in Fiscal 2022; $445 million in Fiscal 2023; $324 million in Fiscal 2024; $242 million in$0.4 billion for Fiscal 2025; $194 million in$0.2 billion for Fiscal 2026; $0.2 billion for Fiscal 2027; $0.1 billion for Fiscal 2028; and $975 millionimmaterial thereafter.
The amount of future lease commitments after Fiscal 2026 includes the ground lease on VMware, Inc.’s Palo Alto, California headquarter facilities, which expires in Fiscal 2047.
As of January 29, 2021, the Company has additional operating leases that have not yet commenced of $72 million. These operating leases will commence during Fiscal 2022 with lease terms of one year to 10 years.
Legal Matters
The Company is involved in various claims, suits, assessments, investigations, and legal proceedings that arise from time to time in the ordinary course of its business, including those identified below, consisting of matters involving consumer, antitrust, tax, intellectual property, and other issues on a global basis. Pursuant to the Separation and Distribution Agreement referred to below, Dell Technologies shares responsibility with VMware for certain matters, as indicated below, and VMware has agreed to indemnify Dell Technologies in whole or in part with respect to certain matters.
The Company accrues a liability when it believes that it is both probable that a liability has been incurred and that it can reasonably estimate the amount of the loss. The Company reviews these accruals at least quarterly and adjusts them to reflect ongoing negotiations, settlements, rulings, advice of legal counsel, and other relevant information. To the extent new information is obtained and the Company’s views on the probable outcomes of claims, suits, assessments, investigations, or legal proceedings change, changes in the Company’s accrued liabilities would beare recorded in the period in which such a determination is made. For some matters, the amountincurrence of a liability is not probable or the amount cannot be reasonably estimated and therefore accruals have not been made.
The following is a discussion of the Company’s significant legal matters and other proceedings:
Class Actions Related to the Class V Transaction — NaNOn December 28, 2018, the Company completed a transaction (the “Class V transaction”) in which it paid $14.0 billion in cash and issued 149,387,617 shares of its Class C Common Stock to holders of its Class V Common Stock in exchange for all outstanding shares of Class V Common Stock. As a result of the Class V transaction, the tracking stock feature of the Company’s capital structure associated with the Class V Common Stock was terminated. In November 2018, four purported stockholders brought putative class action complaints arising out of the Class V transaction described in Note 1 of the Notes to the Consolidated Financial Statements.transaction. The actions were captioned Hallandale Beach Police and Fire Retirement Plan v. Michael Dell et al. (Civil Action No. 2018-0816-JTL), Howard Karp v. Michael Dell et al. (Civil Action No. 2019-0032-JTL), Miramar Police Officers’ Retirement Plan v. Michael Dell et al. (Civil Action No. 2019-0049-JTL), and Steamfitters Local 449 Pension Plan v. Michael Dell et al. (Civil Action No. 2019-0115-JTL). The four actions were consolidated in the Delaware Chancery Court into In Re Dell Class V Litigation (Consol. C.A. No. 2018-0816-JTL), which. The suit currently names as defendants Michael S. Dell and certain of the Company’s boardother directors serving on the Board of directors andDirectors at the time of the Class V transaction, certain stockholders of the Company, includingconsisting of Michael S. Dell. TheDell and Silver Lake Group LLC and certain of its affiliated funds, and Goldman Sachs & Co. LLC (“Goldman Sachs”), which served as financial advisor to the Company in connection with the Class V transaction. In an amended complaint filed in August 2019, the plaintiffs generally allege that the director and stockholder defendants breached their fiduciary duties under Delaware law to the former holders of Class V Common Stock in connection with the Class V transaction by offering a transaction value that was allegedly causingbillions of dollars below the fair value. The plaintiffs contend that the offer understated the value of shares surrendered by the former stockholders, which the plaintiffs allege should have reflected higher alternative valuations, including a valuation related to the value of the shares of VMware, Inc. common stock, and that the difference in values was wrongfully appropriated by the stockholder defendants. On August 20, 2021, the plaintiffs added Goldman Sachs as a defendant and allege that it aided and abetted the alleged primary violations. The Company is not a defendant in this action but is subject to director indemnification provisions under its certificate of incorporation and bylaws, and is a party to agreements with the defendants that contain indemnification obligations of the Company, to enter into a transaction that favoredconditioned on the interestssatisfaction of the controlling stockholders atrequirements set forth in such agreements, relating to service as a director, ownership of the expenseCompany’s securities, and provision of such former stockholders. Theservices, as applicable. In the complaint, the plaintiffs seek, among other remedies, a judicial declaration that the director and stockholder defendants breached their fiduciary dutiesduties. The plaintiffs also seek in the complaint disgorgement of all profits, benefits, and other compensation obtained by the defendants as a result of such alleged conduct and an award of unspecified damages, fees, and costs. The plaintiffs filed an amended complaint in August 2019 making substantially similar allegations to those described above. The defendants filed a motion to dismiss the action in September 2019. The court denied the motion in June 20202020. The plaintiffs and the case is currently in the discovery phase.
DELL TECHNOLOGIES INC.
Patent Litigation — On April 25, 2019, Cirba Inc.NOTES TO THE CONSOLIDATED FINANCIAL STATEMENTS (continued)
action, subject to court approval, in November 2022. Under the terms of the settlement, the plaintiffs have agreed to dismissal of all claims upon payment of a total of $1.0 billion (the “settlement amount”), which amount will include all costs, expenses and Cirba IP, Inc. (collectively, “Cirba”) filedfees of the plaintiff class relating to the action and its resolution. The settlement terms provide that it is a lawsuit against VMware, Inc.condition of the settlement that the settlement amount will be paid by the Company and/or the Company’s insurers on behalf of the defendants pursuant to indemnification obligations of the Company to the defendants. A special committee of the Company’s board of directors composed of directors who are not defendants, advised by independent counsel, has informed the board of directors that the committee has determined that the director defendants and the stockholder defendants are entitled to such indemnification. The Company is subject to indemnification obligations pursuant to the provisions of the Delaware General Corporation Law, the terms of the Company’s certificate of incorporation and bylaws, and agreements with the defendants. The settlement is conditioned on final approval of the settlement by the court. If the court does not grant final approval of the settlement and all of its material terms, or the settlement does not otherwise become final or effective, proceedings in the United States District Courtaction will continue. The hearing for the District of Delaware (the “Delaware Court”), alleging 2 patent infringement claims and 3 trademark infringement-related claims (the “First Action”). On May 6, 2019, Cirba filed a motion seeking a preliminary injunction tied to 1final approval of the 2 patents it alleges VMware, Inc. infringes. Followingsettlement is scheduled for April 19, 2023. During the fiscal year ended February 3, 2023, the Company established a hearing$1.0 billion liability on August 6, 2019, the Delaware Court denied Cirba’s preliminary injunction motion. On August 20, 2019, VMware, Inc. filed counterclaims against Cirba, asserting among other claims that Cirba is infringing 4 VMware, Inc. patents. The Delaware Court severed those claims from the January 2020 trial on Cirba’s claims. The trial on Cirba’s claims in Delaware was completed on January 23, 2020, and on January 24, 2020, the jury returned a verdict finding that VMware, Inc. willfully infringed the 2 asserted patents and awarding approximately $237 million in damages. The jury further found that VMware, Inc. was not liable on Cirba’s trademark infringement-related claims. A total of $237 million was accrued for the First Action, which reflected the estimated losses that were considered both probable and reasonably estimable at that time. The amount accrued for this matter was included in Accrued and other in the Consolidated Statements of Financial Position as of January 31, 2020, and the charge was classified in Selling, generalrecognized $1.0 billion expense within interest and administrative inother, net within the Consolidated Statements of Income (Loss) duringrelated to the fiscal year ended January 31, 2020. On March 9, 2020,settlement agreement. The Company expects to recover $106 million in insurance proceeds related to the parties filed post-trial motions insettlement agreement, with cash proceeds to be received upon payment of the First Action. On December 21, 2020, the Delaware Court granted VMware, Inc.’s request for a new trial based, in part, on Cirba Inc.’s lack of standing, set aside the verdict and damages award, and denied Cirba’s post-trial motions (the “Post-Trial Order”).
On October 22, 2019, VMware, Inc. filed a separate patent infringement lawsuit against Cirba Inc. in the United States District Courtsettlement. The Company accounted for the Eastern District of Virginia, asserting that Cirba infringes four additional VMware, Inc. patents (the “Second Action”). The Virginia court transferred the Second Action to the Delaware Court on February 25, 2020. On March 23, 2020, Cirba filed a counterclaim asserting one additional patent infringement claim against VMware, Inc. The Delaware Court consolidated the First and Second Actions and ordered a consolidated trial on all of the parties’ patent infringement claims and counterclaims. The parties have proposed April 24, 2023expected insurance proceeds as the date for a consolidated trial. On January 20, 2021, Cirba moved to certify the Post-Trial Order to enable an interlocutory appeal to the United States Court of Appeals for the Federal Circuit. This motion has been fully briefed and is now pending before the Delaware Court. As of January 29, 2021, VMware, Inc. reassessed its estimated loss accrual for the First Action based on the Post-Trial Order and determined that a loss is no longer probablerecovery and reasonably estimable with respect to the consolidated Firstrecognized a benefit within interest and Second Actions. Accordingly, the estimated loss accrual recognized during the fiscal year ended January 31, 2020 totaling $237 million was adjusted to $0 with the credit included in Selling, general, and administrative inother, net within the Consolidated Statements of Income (Loss) duringand corresponding receivable on the fiscal year ended January 29, 2021. VMware, Inc. is unable at this time to assess whether, or to what extent, it may be found liable and, if found liable, what the damages may be. VMware, Inc. intends to vigorously defend itself in this matter.
Class Actions Related to VMware, Inc.’s AcquisitionConsolidated Statements of Pivotal — NaN purported stockholders brought putative class action complaints arising out of VMware, Inc.’s acquisition of Pivotal Software, Inc. on December 30, 2019 as described in Note 1Financial Position. Pending final approval of the Notes tosettlement by the Consolidated Financial Statements. The 2 actions were consolidatedcourt, payment would be made in the Delaware Chancery Court into In re: Pivotal Software, Inc. Stockholders Litigation (Civil Action No. 2020-0440-KSJM). The complaint names as defendants the Company, VMware, Inc., Michael S. Dell, and certain officersCompany’s second quarter of Pivotal. The plaintiffs generally allege that the defendants breached their fiduciary duties to the former holders of Pivotal Class A Common Stock in connection with VMware, Inc.’s acquisition of Pivotal by allegedly causing Pivotal to enter into a transaction that favored the interests of Pivotal’s controlling stockholders at the expense of such former stockholders. The plaintiffs seek, among other remedies, a judicial declaration that the defendants breached their fiduciary duties and an award of damages, fees, and costs.Fiscal 2024.
Other Litigation — Dell does not currently anticipate that any of the other various legal proceedings it is involved in will have a material adverse effect on its business, financial condition, results of operations, or cash flows.
matters where it is at least reasonably possible that the Company could experience a material loss exceeding the amounts already accrued for these or other proceedings or matters. In addition, the Company also discloses matters based on its consideration of other matters and qualitative factors, including the experience of other companies in the industry, and investor, customer, and employee relations considerations. As of January 29, 2021,February 3, 2023, the Company does not believe there is a reasonable possibility that a material loss exceeding the amounts already accrued for these or other proceedings or matters has been incurred. However, since the ultimate resolution of any such proceedings and matters is inherently unpredictable, the Company’s business, financial condition, results of operations, or cash flows could be materially affected in any particular period by unfavorable outcomes in one or more of these proceedings or matters. Whether the outcome of any claim, suit, assessment, investigation, or legal proceeding, individually or collectively, could have a material adverse effect on the Company’s business, financial condition, results of operations, or cash flows will depend on a number of variables,factors, including the nature, timing, and amount of any associated expenses, amounts paid in settlement, damages, or other remedies or consequences.
Indemnifications Obligations
In the ordinary course of business, the Company enters into various contracts under which it may agree to indemnify other parties for losses incurred from certain events as defined in the relevant contract, such as litigation, regulatory penalties, or claims relating to past performance. Such indemnification obligations may not be subject to maximum loss clauses. Historically, payments related to these indemnificationsindemnification obligations have not been material to the Company.
Under the Separation and Distribution Agreement described in Note 3 of the Notes to the Consolidated Financial Statements, Dell Technologies has agreed to indemnify VMware, Inc., each of its subsidiaries and each of their respective directors, officers, and employees from and against all liabilities relating to, arising out of or resulting from, among other matters, the liabilities allocated to Dell Technologies as part of the separation of Dell Technologies and VMware and their respective businesses as a result of the VMware Spin-off (the “Separation”). VMware similarly has agreed to indemnify Dell Technologies Inc., each of its subsidiaries and each of their respective directors, officers, and employees from and against all liabilities relating to, arising out of or resulting from, among other matters, the liabilities allocated to VMware as part of the Separation. Dell Technologies expects VMware to fully perform under the terms of the Separation and Distribution Agreement.
DELL TECHNOLOGIES INC.
NOTES TO THE CONSOLIDATED FINANCIAL STATEMENTS (continued)
For information on the cross-indemnifications related to the tax matters agreement between the Company and VMware described in Note 3 of the Notes to the Consolidated Financial Statements effective upon the Separation on November 1, 2021, see Note 3 and Note 21 of the Notes to the Consolidated Financial Statements.
Certain Concentrations
The Company maintains cash and cash equivalents, derivatives, and certain other financial instruments with various financial institutions that potentially subject it to concentration of credit risk. As part of its risk management processes, the Company performs periodic evaluations of the relative credit standing of these financial institutions. The Company has not sustained material credit losses from instruments held at these financial institutions. Further, the Company does not anticipate nonperformance by any of the counterparties.
The Company markets and sells its products and services to large corporate clients, governments, and health care and education accounts, as well as to small and medium-sized businesses and individuals. No single customer accounted for more than 10% of the Company’s consolidated net revenue during the fiscal year ended February 3, 2023, January 28, 2022, and January 29, 2021, January 31, 2020, or February 1, 2019.2021.
The Company utilizes a limited number of contract manufacturers that assemble a portion of its products. The Company may purchasepurchases components from suppliers and sellsells those components to such contract manufacturers, thereby creatingmanufacturers. The Company reflects the sale of such components by recognizing non-trade receivables balances from the contract manufacturers. The agreements withmanufacturers and a reduction in inventory when title and risk of loss passes to the majority of the contract manufacturers permit the Companymanufacturer. Cash flows related to offset its payables against these receivables, thus mitigating the credit risk wholly or in part. Receivablessuch transactions are recorded within cash flows from the Company’s four largest contract manufacturers represented the majority of the Company’s gross non-trade receivables of $4.1 billion and $3.2 billion as of January 29, 2021 and January 31, 2020, respectively, of which $3.1 billion and $2.6 billion as of January 29, 2021 and January 31, 2020, respectively, have been offset against the corresponding payables. The portion of receivables not offset against payables is included in other current assets in the Consolidated Statements of Financial Position.operating activities. The Company does not reflect the sale of the components in revenue and does not recognize any profit on the component sales until the related products are sold.
The agreements with the majority of the contract manufacturers permit the Company to offset its payables against the receivables, thus mitigating the credit risk wholly or in part. Receivables from the Company’s four largest contract manufacturers represented the majority of the Company’s gross non-trade receivables of $3.3 billion and $5.7 billion as of February 3, 2023 and January 28, 2022, respectively. The Company offset its corresponding payables against $2.5 billion and $4.2 billion of such receivables as of February 3, 2023 and January 28, 2022, respectively. The portion of receivables not offset is included in other current assets in the Consolidated Statements of Financial Position.
DELL TECHNOLOGIES INC.
NOTES TO THE CONSOLIDATED FINANCIAL STATEMENTS (continued)
NOTE 1113 — INCOME AND OTHER TAXES
The following table presents components of the income tax expense (benefit) for continuing operations recognized for the periods indicated:
| | | | | | | | | | | | | | | | | |
| Fiscal Year Ended |
| January 29, 2021 | | January 31, 2020 | | February 1, 2019 |
| (in millions) |
| Current: | | | | | |
| Federal | $ | (526) | | | $ | (150) | | | $ | 461 | |
| State/local | 29 | | | 69 | | | 74 | |
| Foreign | 1,061 | | | 887 | | | 616 | |
| Current | 564 | | | 806 | | | 1,151 | |
| Deferred: | | | | | |
| Federal | 23 | | | (862) | | | (1,150) | |
| State/local | (145) | | | (150) | | | (85) | |
| Foreign | (277) | | | (5,327) | | | (96) | |
| Deferred | (399) | | | (6,339) | | | (1,331) | |
| Income tax expense (benefit) | $ | 165 | | | $ | (5,533) | | | $ | (180) | |
The Company’s provision for income taxes for the fiscal periods reflected in the Consolidated Financial Statements are not directly comparable primarily due to the intra-entity asset transfers of certain of its intellectual property (“IP”) completed in the fiscal year ended January 31, 2020. During the fiscal years ended January 29, 2021 and January 31, 2020, the Company completed intra-entity asset transfers of certain of its IP to Irish subsidiaries, resulting in discrete tax benefits of $59 million and $4.9 billion, respectively. The tax benefit for each intra-entity asset transfer was recorded as a deferred tax asset in the period of transaction and represents the book and tax basis difference on the transferred assets measured based on the IP’s current fair value and applicable Irish statutory tax rate. The Company expects to be able to realize the deferred tax assets resulting from these intra-entity asset transfers. | | | | | | | | | | | | | | | | | |
| Fiscal Year Ended |
| February 3, 2023 | | January 28, 2022 | | January 29, 2021 |
| | | | | |
| (in millions) |
| Current: | | | | | |
| Federal | $ | 605 | | | $ | 166 | | | $ | (514) | |
| State/local | 176 | | | 76 | | | (22) | |
| Foreign | 739 | | | 960 | | | 825 | |
| Current | 1,520 | | | 1,202 | | | 289 | |
| Deferred: | | | | | |
| Federal | (483) | | | (54) | | | (16) | |
| State/local | (103) | | | — | | | (115) | |
| Foreign | (131) | | | (167) | | | (57) | |
| Deferred | (717) | | | (221) | | | (188) | |
| Income tax expense | $ | 803 | | | $ | 981 | | | $ | 101 | |
The following table presents components of income (loss) before income taxes for continuing operations for the periods indicated:
| | | | | | | | | | | | | | | | | | Fiscal Year Ended |
| | Fiscal Year Ended | | February 3, 2023 | | January 28, 2022 | | January 29, 2021 |
| | January 29, 2021 | | January 31, 2020 | | February 1, 2019 | | | | | | |
| | (in millions) | | (in millions) |
| Domestic | Domestic | $ | (1,066) | | | $ | (3,067) | | | $ | (4,645) | | Domestic | $ | (1,316) | | | $ | 1,414 | | | $ | (1,361) | |
| Foreign | Foreign | 4,736 | | | 3,063 | | | 2,284 | | Foreign | 4,541 | | | 4,509 | | | 3,707 | |
| Income (loss) before income taxes | $ | 3,670 | | | $ | (4) | | | $ | (2,361) | | |
| Income before income taxes | | Income before income taxes | $ | 3,225 | | | $ | 5,923 | | | $ | 2,346 | |
DELL TECHNOLOGIES INC.
NOTES TO THE CONSOLIDATED FINANCIAL STATEMENTS (continued)
The following table presents a reconciliation of the Company’s effective tax rate to the statutory U.S. federal tax rate for continuing operations for the periods indicated:
| | | | | | | | | | | | | | | | | |
| Fiscal Year Ended |
| January 29, 2021 | | January 31, 2020 | | February 1, 2019 |
| U.S. federal statutory rate | 21.0 | % | | 21.0 | % | | 21.0 | % |
| State income taxes, net of federal tax benefit | (1.5) | | | 1194.6 | | | 0.5 | |
| Tax impact of foreign operations | 2.2 | | | (2741.3) | | | (19.5) | |
| Impact of intangible property transfers | (1.6) | | | 123367.9 | | | 0 | |
| Change in valuation allowance | 0.5 | | | 1030.6 | | | (6.6) | |
| Indirect tax effects of adoption of new revenue standard | 0 | | | 0 | | | 6.5 | |
| U.S. Tax Reform (a) | 0 | | | 0 | | | 1.5 | |
| U.S. tax audit settlement | (20.3) | | | 7615.7 | | | 0 | |
| Non-deductible transaction-related costs | 0.7 | | | (700.0) | | | (1.9) | |
| Stock-based compensation | (1.6) | | | 5873.2 | | | 4.1 | |
| U.S. R&D tax credits | (3.8) | | | 4424.9 | | | 6.9 | |
| RSA Security divestiture | 7.8 | | | 0 | | | 0 | |
| Other | 1.1 | | | (1761.6) | | | (4.9) | |
| Total | 4.5 | % | | 138325.0 | % | | 7.6 | % |
____________________
(a) Impact of the Tax Cuts and Jobs Act (“U.S. Tax Reform”), which was enacted by the U.S. federal government in December 2017. The Company completed its accounting for the income tax effects of U.S. Tax Reform during the fourth quarter of the fiscal year ended February 1, 2019. | | | | | | | | | | | | | | | | | |
| Fiscal Year Ended |
| February 3, 2023 | | January 28, 2022 | | January 29, 2021 |
| U.S. federal statutory rate | 21.0 | % | | 21.0 | % | | 21.0 | % |
| State income taxes, net of federal tax benefit | 2.0 | | | 1.7 | | | (3.5) | |
| Tax impact of foreign operations | (0.8) | | | (0.3) | | | 8.9 | |
| | | | | |
| Change in valuation allowance | 0.4 | | | 0.4 | | | — | |
| | | | | |
| | | | | |
| U.S. tax audit settlement | — | | | — | | | (31.8) | |
| Non-deductible transaction-related costs | 0.8 | | | 1.2 | | | 1.0 | |
| Stock-based compensation expense | (2.4) | | | (2.4) | | | (3.2) | |
| U.S. R&D tax credits | (2.6) | | | (1.3) | | | (2.5) | |
| Legal entity restructuring | — | | | (4.1) | | | — | |
| RSA Security divestiture | — | | | — | | | 12.3 | |
| Class V transaction litigation settlement | 5.8 | | | — | | | — | |
| Other | 0.7 | | | 0.4 | | | 2.1 | |
| Total | 24.9 | % | | 16.6 | % | | 4.3 | % |
The changes inChanges to the Company’s effective tax rates for the fiscal yearyears ended February 3, 2023, January 28, 2022, and January 29, 2021 as comparedwere primarily driven by items discrete to the fiscal year ended January 31, 2020 andthose years. The Company’s effective tax rate for the fiscal year ended January 31, 2020 as comparedFebruary 3, 2023 includes the impact of a $0.9 billion expense recognized in connection with an agreement to settle the fiscal year ended February 1, 2019 were primarily driven by discrete tax items and a change in the Company’s jurisdictional mix of income.
Class V transaction litigation. The Company’s effective tax rate for the fiscal year ended January 29, 202128, 2022 includes discretetax expense of $1.0 billion on a pre-tax gain of $4.0 billion related to the divestiture of Boomi during the period, as well as tax benefits of $746$367 million on $1.6 billion of debt extinguishment fees and $244 million related to an audit settlement, $159 million relatedthe restructuring of certain legal entities.
Other changes to stock-based compensation, and $59 million from an intra-entity asset transfer as described above. For the fiscal year ended January 29, 2021, the Company’s effective income tax rate also includes a discrete tax expense of $359 million relating to the divestiture of RSA Security during the period due to the relatively low tax basis for the assets sold, particularly goodwill, as discussed in Note 1 of the Notes to the Consolidated Financial Statements. The Company’s effective tax raterates for the fiscal yearyears ended February 3, 2023 as compared to January 31, 2020 includes discrete28, 2022 were attributable to the tax impact of foreign operations, which included the impacts of higher jurisdictional mix of income in lower tax jurisdictions and higher tax benefits of $4.9 billion related to similar intra-entity asset transfers as described above, $351 million related to stock-based compensation, $305 million related to an audit settlement, and $95 million related to Virtustream impairment charges discussed in Note 8 of the Notes to the Consolidated Financial Statements and included in Other in the table above. For the fiscal year ended February 1, 2019, the Company’s effective tax rate included $154 million of discrete tax benefits resulting from foreign-derived intangible income offset by the impact of its adoptionthe capitalization of research and development costs under the new revenue recognition standard.
Tax Cuts and Jobs Act.
The differences between the Company’s effective income tax rates and the U.S. federal statutory rate of 21% principally result from the geographical distribution of income, differences between the book and tax treatment of certain items, and the discrete tax items discussed above. In certain jurisdictions, the Company’s tax rate is significantly less than the applicable statutory rate as a result of tax holidays. The majority of the Company’s foreign income that is subject to these tax holidays and lower tax rates is attributable to Singapore China, and Malaysia.China. A significant portion of these income tax benefits relaterelates to a tax holiday that will be effective until January 31, 2029. The Company’s other tax holidays will expire in whole or in part during fiscal years 20222030 through 2030.2031. Many of these tax holidays and reduced tax rates may be extended when certain conditions are met or may be terminated early if certain conditions are not met.met or as a result of changes in tax legislation. As of January 29, 2021,February 3, 2023, the Company was not aware of any matters of noncompliance related to these tax holidays or enacted tax legislative changes affecting these tax holidays. For the fiscal years ended February 3, 2023, January 28, 2022, and January 29, 2021, January 31, 2020, and February 1, 2019, the income tax benefits attributable to the tax status of the affected subsidiaries were estimated to be approximately $123 million ($0.16 per share), $466 million ($0.59 per share), and $359 million ($0.47 per share of Dell Technologies Common Stock), $444 million ($0.59 per share of Dell Technologies Common Stock), and $313 million ($0.54 per share of DHI Group Common Stock)share), respectively. These income tax benefits are included in tax impact of foreign operations in the table above.
DELL TECHNOLOGIES INC.
NOTES TO THE CONSOLIDATED FINANCIAL STATEMENTS (continued)
The Company believes that a significant portion of the Company’s undistributed earnings as of January 29, 2021February 3, 2023 will not be subject to further U.S. federal taxation. As of January 29, 2021,February 3, 2023, the Company has undistributed earnings of certain foreign subsidiaries of approximately $36.5 billion that remain indefinitely reinvested, and as such has not recognized a deferred tax liability. Determination of the amount of unrecognized deferred income tax liability related to these undistributed earnings is not practicable.
The following table presents the components of the Company’s net deferred tax assets (liabilities) as of the dates indicated:
| | | | | | | | | | | | | February 3, 2023 | | January 28, 2022 |
| | January 29, 2021 | | January 31, 2020 | | | | |
| | (in millions) | | (in millions) |
| Deferred tax assets: | Deferred tax assets: | | Deferred tax assets: | |
| Deferred revenue and warranty provisions | Deferred revenue and warranty provisions | $ | 1,851 | | | $ | 1,672 | | Deferred revenue and warranty provisions | $ | 1,959 | | | $ | 1,555 | |
| Provisions for product returns and doubtful accounts | Provisions for product returns and doubtful accounts | 133 | | | 107 | | Provisions for product returns and doubtful accounts | 85 | | | 95 | |
| Credit carryforwards | Credit carryforwards | 1,531 | | | 1,951 | | Credit carryforwards | 938 | | | 1,094 | |
| Loss carryforwards | Loss carryforwards | 614 | | | 580 | | Loss carryforwards | 467 | | | 379 | |
| Operating and compensation related accruals | Operating and compensation related accruals | 774 | | | 744 | | Operating and compensation related accruals | 506 | | | 512 | |
| Operating leases | 238 | | | 239 | | |
| Intangible assets | 3,060 | | | 2,420 | | |
| | Capitalized research and development | | Capitalized research and development | 263 | | | — | |
| Other | Other | 361 | | | 205 | | Other | 332 | | | 301 | |
| Deferred tax assets | 8,562 | | | 7,918 | | |
| Deferred tax assets (a) | | Deferred tax assets (a) | 4,550 | | | 3,936 | |
| Valuation allowance | Valuation allowance | (1,709) | | | (1,687) | | Valuation allowance | (1,535) | | | (1,423) | |
| Deferred tax assets, net of valuation allowance | Deferred tax assets, net of valuation allowance | 6,853 | | | 6,231 | | Deferred tax assets, net of valuation allowance | 3,015 | | | 2,513 | |
| Deferred tax liabilities: | Deferred tax liabilities: | | | | Deferred tax liabilities: | | | |
| Leasing and financing | Leasing and financing | (375) | | | (369) | | Leasing and financing | (363) | | | (382) | |
| Operating leases | (208) | | | (210) | | |
| | Property and equipment | Property and equipment | (539) | | | (509) | | Property and equipment | (470) | | | (452) | |
| | Intangibles | | Intangibles | (483) | | | (673) | |
| Other | Other | (303) | | | (205) | | Other | (339) | | | (363) | |
| Deferred tax liabilities | (1,425) | | | (1,293) | | |
| Net deferred tax assets (liabilities) | $ | 5,428 | | | $ | 4,938 | | |
| Deferred tax liabilities (a) | | Deferred tax liabilities (a) | (1,655) | | | (1,870) | |
| Net deferred tax assets | | Net deferred tax assets | $ | 1,360 | | | $ | 643 | |
(a) Deferred tax assets and deferred tax liabilities are included in other non-current assets and other non-current liabilities, respectively, in the Consolidated Statements of Financial Position.
DELL TECHNOLOGIES INC.
NOTES TO THE CONSOLIDATED FINANCIAL STATEMENTS (continued)
The following tables present the net operating loss carryforwards, tax credit carryforwards, and other deferred tax assets with related valuation allowances recognized as of the dates indicated:
| | | | | | | | | | | | | | | | | | | | | | | February 3, 2023 | |
| | January 29, 2021 | | | Deferred Tax Assets | | Valuation Allowance | | Net Deferred Tax Assets | | First Year Expiring |
| | Deferred Tax Assets | | Valuation Allowance | | Net Deferred Tax Assets | | First Year Expiring | | | | | | | | |
| | (in millions) | | | | (in millions) | |
| Credit carryforwards | Credit carryforwards | $ | 1,531 | | | $ | (1,219) | | | $ | 312 | | | Fiscal 2022 | Credit carryforwards | $ | 938 | | | $ | (935) | | | $ | 3 | | | Fiscal 2024 |
| Loss carryforwards | Loss carryforwards | 614 | | | (265) | | | 349 | | | Fiscal 2022 | Loss carryforwards | 467 | | | (317) | | | 150 | | | Fiscal 2024 |
| Other deferred tax assets | Other deferred tax assets | 6,417 | | | (225) | | | 6,192 | | | NA | Other deferred tax assets | 3,145 | | | (283) | | | 2,862 | | | NA |
| Total | Total | $ | 8,562 | | | $ | (1,709) | | | $ | 6,853 | | | Total | $ | 4,550 | | | $ | (1,535) | | | $ | 3,015 | | |
| | | January 31, 2020 | | | January 28, 2022 | |
| | Deferred Tax Assets | | Valuation Allowance | | Net Deferred Tax Assets | | First Year Expiring | | Deferred Tax Assets | | Valuation Allowance | | Net Deferred Tax Assets | | First Year Expiring |
| | (in millions) | | | | | | | | | | |
| | | (in millions) | |
| Credit carryforwards | Credit carryforwards | $ | 1,951 | | | $ | (1,257) | | | $ | 694 | | | Fiscal 2021 | Credit carryforwards | $ | 1,094 | | | $ | (917) | | | $ | 177 | | | Fiscal 2023 |
| Loss carryforwards | Loss carryforwards | 580 | | | (348) | | | 232 | | | Fiscal 2021 | Loss carryforwards | 379 | | | (276) | | | 103 | | | Fiscal 2023 |
| Other deferred tax assets | Other deferred tax assets | 5,387 | | | (82) | | | 5,305 | | | NA | Other deferred tax assets | 2,463 | | | (230) | | | 2,233 | | | NA |
| Total | Total | $ | 7,918 | | | $ | (1,687) | | | $ | 6,231 | | | Total | $ | 3,936 | | | $ | (1,423) | | | $ | 2,513 | | |
The Company’s credit carryforwards as of January 29, 2021February 3, 2023 and January 31, 202028, 2022 relate primarily to U.S. tax credits and include state and federal tax credits associated with research and development, as well as foreign tax credits associated with the U.S. Tax Reform.Cuts and Jobs Act. The more significant amounts of the Company’s credit carryforwards will begin expiring in Fiscalfiscal year 2028. The Company assessed the realizability of these U.S. tax credits and has recorded a valuation allowance against the credits it does not expect to utilize. The change in the valuation allowance against these credits is included in Change in valuation allowance in the Company’s effective tax reconciliations for the fiscal years ended January 29, 2021 and January 31, 2020. The Company’s loss carryforwards as of January 29, 2021February 3, 2023 and January 31, 202028, 2022 include net operating loss carryforwards from federal, state, and foreign jurisdictions. The valuation allowances for other deferred tax assets as of January 29, 2021February 3, 2023 and January 31, 202028, 2022 primarily relate to foreign jurisdictions, the changes in which are included in Taxtax impact of foreign operations in the Company’s effective tax reconciliation. The Company has determined that it will be able to realize the remainder of its deferred tax assets, based on the future reversal of deferred tax liabilities.
The following table presents a reconciliation of the Company’s beginning and ending balances of unrecognized tax benefits for the periods indicated:
| | | | | | | | | | | | | | | | | | Fiscal Year Ended |
| | Fiscal Year Ended | | February 3, 2023 | | January 28, 2022 | | January 29, 2021 |
| | January 29, 2021 | | January 31, 2020 | | February 1, 2019 | | | | | | |
| | (in millions) | | (in millions) |
| Beginning Balance | Beginning Balance | $ | 2,447 | | | $ | 2,989 | | | $ | 2,867 | | Beginning Balance | $ | 1,595 | | | $ | 1,620 | | | $ | 2,235 | |
| Increases related to tax positions of the current year | Increases related to tax positions of the current year | 136 | | | 145 | | | 116 | | Increases related to tax positions of the current year | 132 | | | 113 | | | 102 | |
| Increases related to tax position of prior years | Increases related to tax position of prior years | 393 | | | 332 | | | 288 | | Increases related to tax position of prior years | 181 | | | 143 | | | 385 | |
| Reductions for tax positions of prior years | Reductions for tax positions of prior years | (698) | | | (490) | | | (170) | | Reductions for tax positions of prior years | (46) | | | (153) | | | (673) | |
| Lapse of statute of limitations | Lapse of statute of limitations | (40) | | | (127) | | | (90) | | Lapse of statute of limitations | (41) | | | (78) | | | (27) | |
| Audit settlements | Audit settlements | (405) | | | (402) | | | (22) | | Audit settlements | (9) | | | (50) | | | (402) | |
| Ending Balance | Ending Balance | $ | 1,833 | | | $ | 2,447 | | | $ | 2,989 | | Ending Balance | $ | 1,812 | | | $ | 1,595 | | | $ | 1,620 | |
The Company’s net unrecognized tax benefits were $1.4 billion, $2.5 billion, and $3.4 billion as of January 29, 2021, January 31, 2020, and February 1, 2019, respectively, and are included in accrued and other and other non-current liabilities in the Consolidated Statements of Financial Position.
The unrecognized tax benefits in the table above include $1.1 billion, $2.0 billion, and $2.4 billion as of January 29, 2021, January 31, 2020, and February 1, 2019, respectively, that, if recognized, would have impacted income tax expense. The table does not include accrued interest and penalties of $0.4 billion, $0.8 billion,$394 million, $383 million, and $1.0 billion$404 million as of February 3, 2023, January 28, 2022, and January 29, 2021, January 31, 2020, and February 1, 2019, respectively. TaxAdditionally, the table does not include certain tax benefits associated with interest and state tax deductions and other indirect jurisdictional effects of uncertain tax positions, which were $862$910 million, $629$817 million, and $611$835 million as of February 3, 2023, January 28, 2022, and January 29, 2021, respectively.
DELL TECHNOLOGIES INC.
NOTES TO THE CONSOLIDATED FINANCIAL STATEMENTS (continued)
After taking these items into account, the Company’s net unrecognized tax benefits were $1.3 billion, $1.2 billion, and $1.2 billion as of February 3, 2023, January 31, 2020,28, 2022, and January 29, 2021, respectively, and are included in other non-current liabilities in the Consolidated Statements of Financial Position.
The unrecognized tax benefits in the table above include $1.1 billion, $0.9 billion, and $0.9 billion as of February 1, 2019, respectively.3, 2023, January 28, 2022, and January 29, 2021, respectively, that, if recognized, would have impacted income tax expense. Interest and penalties related to income tax liabilities are included in income tax expense. The Company recorded tax benefitsexpense for interest and penalties of $251$16 million for the fiscal year ended February 3, 2023, and tax benefit of $14 million and $174$247 million for the fiscal years ended January 28, 2022 and January 29, 2021, and January 31, 2020, respectively, and tax expense of $127 million for the fiscal year ended February 1, 2019.respectively.
During the fiscal year ended January 29, 2021, the Company settled theThe Internal Revenue Service (“IRS”) audit for fiscal years 2010 through 2014, for whichis currently conducting tax examinations of the Company made a cash payment of $435 million to the IRS on August 3, 2020. During the fiscal year ended January 31, 2020, the Company made a cash payment of $438 million in settlement of the IRS audit for fiscal years 2007 through 2009. The IRS is currently examining fiscal years 2015 through 2019. The Company believes it has valid positions supporting its tax returns and that it is adequately reserved.
The Company is also currently under income tax audits in various U.S. state and foreign taxing jurisdictions. The Company is undergoing negotiations, and in some cases contested proceedings, relating to tax matters with the taxing authorities in these jurisdictions. The Company believes that it has provided adequate reserves related to all matters contained in tax periods open to examination. Although the Company believes it has made adequate provisions for the uncertainties surrounding these audits, should the Company experience unfavorable outcomes, such outcomes could have a material impact on its results of operations, financial position, and cash flows. With respect to major U.S. state and foreign taxing jurisdictions, the Company is generally not subject to tax examinations for years prior to the fiscal year ended January 29, 2010.
Judgment is required in evaluating the Company’s uncertain tax positions and determining the Company’s provision for income taxes. The Company does not anticipateexpect a significant change to the total amount of unrecognized tax benefits within the next twelve months.
The Company takes certain non-income tax positions in the jurisdictions in which it operates and has received certain non-income tax assessments from various jurisdictions. The Company believes that a material loss in these matters is not probable and that it is not reasonably possible that a material loss exceeding amounts already accrued has been incurred. The Company believes its positions in these non-income tax litigation matters are supportable and that it ultimately will prevail in the matters. In the normal course of business, the Company’s positions and conclusions related to its non-income taxes could be challenged and assessments may be made. To the extent new information is obtained and the Company’s views on its positions, probable outcomes of assessments, or litigation change, changes in estimates to the Company’s accrued liabilities would be recorded in the period in which such a determination is made. In the resolution process for income tax and non-income tax audits, the Company is required in certain situations to provide collateral guarantees or indemnification to regulators and tax authorities until the matter is resolved.
DELL TECHNOLOGIES INC.
NOTES TO THE CONSOLIDATED FINANCIAL STATEMENTS (continued)
NOTE 1214 — ACCUMULATED OTHER COMPREHENSIVE INCOME (LOSS)
Accumulated other comprehensive income (loss) is presented in stockholders’ equity (deficit) in the Consolidated Statements of Financial Position and consists of amounts related to foreign currency translation adjustments, unrealized net gains (losses) on investments, unrealized net gains (losses) on cash flow hedges, and actuarial net gains (losses) from pension and other postretirement plans.
The following table presents changes in accumulated other comprehensive income (loss), net of tax, by the following components as of the dates indicated:
| | | Foreign Currency Translation Adjustments | | Investments | | Cash Flow Hedges | | Pension and Other Postretirement Plans | | Accumulated Other Comprehensive Income (Loss) | | Foreign Currency Translation Adjustments | | | Cash Flow Hedges | | Pension and Other Postretirement Plans | | Accumulated Other Comprehensive Income (Loss) |
| | (in millions) | | | | | | | | | |
| Balances as of February 2, 2018 | $ | 179 | | | $ | 22 | | | $ | (103) | | | $ | 32 | | | $ | 130 | | |
| Adjustment for adoption of accounting standards (Note 2) | 0 | | | (61) | | | 0 | | | 3 | | | (58) | | |
| Other comprehensive income (loss) before reclassifications | (631) | | | 2 | | | 299 | | | (21) | | | (351) | | |
| Amounts reclassified from accumulated other comprehensive income (loss) | 0 | | | 43 | | | (225) | | | 0 | | | (182) | | |
| Total change for the period | (631) | | | (16) | | | 74 | | | (18) | | | (591) | | |
| Less: Change in comprehensive income attributable to non-controlling interests | 0 | | | 6 | | | 0 | | | 0 | | | 6 | | |
| Balances as of February 1, 2019 | (452) | | | 0 | | | (29) | | | 14 | | | (467) | | |
| Other comprehensive income (loss) before reclassifications | (226) | | | 0 | | | 269 | | | (60) | | | (17) | | |
| Amounts reclassified from accumulated other comprehensive income (loss) | 0 | | | 0 | | | (226) | | | 1 | | | (225) | | |
| Total change for the period | (226) | | | 0 | | | 43 | | | (59) | | | (242) | | |
| Less: Change in comprehensive income (loss) attributable to non-controlling interests | 0 | | | 0 | | | 0 | | | 0 | | | 0 | | |
| | | (in millions) |
| Balances as of January 31, 2020 | Balances as of January 31, 2020 | (678) | | | 0 | | | 14 | | | (45) | | | (709) | | Balances as of January 31, 2020 | $ | (678) | | | | $ | 14 | | | $ | (45) | | | $ | (709) | |
| Other comprehensive income (loss) before reclassifications | Other comprehensive income (loss) before reclassifications | 528 | | | 0 | | | (200) | | | (38) | | | 290 | | Other comprehensive income (loss) before reclassifications | 528 | | | | (200) | | | (38) | | | 290 | |
| Amounts reclassified from accumulated other comprehensive income (loss) | Amounts reclassified from accumulated other comprehensive income (loss) | 0 | | | 0 | | | 100 | | | 5 | | | 105 | | Amounts reclassified from accumulated other comprehensive income (loss) | — | | | | 100 | | | 5 | | | 105 | |
| Total change for the period | Total change for the period | 528 | | | 0 | | | (100) | | | (33) | | | 395 | | Total change for the period | 528 | | | | (100) | | | (33) | | | 395 | |
| Less: Change in comprehensive income (loss) attributable to non-controlling interests | 0 | | | 0 | | | 0 | | | 0 | | | 0 | | |
| | Balances as of January 29, 2021 | Balances as of January 29, 2021 | $ | (150) | | | $ | 0 | | | $ | (86) | | | $ | (78) | | | $ | (314) | | Balances as of January 29, 2021 | $ | (150) | | | | $ | (86) | | | $ | (78) | | | $ | (314) | |
| Other comprehensive income (loss) before reclassifications | | Other comprehensive income (loss) before reclassifications | (385) | | | | 374 | | | 37 | | | 26 | |
| Amounts reclassified from accumulated other comprehensive income (loss) | | Amounts reclassified from accumulated other comprehensive income (loss) | — | | | | (158) | | | 7 | | | (151) | |
| Spin-off of VMware | | Spin-off of VMware | 9 | | | | (1) | | | — | | | 8 | |
| Total change for the period | | Total change for the period | (376) | | | | 215 | | | 44 | | | (117) | |
| | Balances as of January 28, 2022 | | Balances as of January 28, 2022 | $ | (526) | | | | $ | 129 | | | $ | (34) | | | $ | (431) | |
| Other comprehensive income (loss) before reclassifications | | Other comprehensive income (loss) before reclassifications | (222) | | | | 354 | | | 1 | | | 133 | |
| Amounts reclassified from accumulated other comprehensive income (loss) | | Amounts reclassified from accumulated other comprehensive income (loss) | — | | | | (705) | | | 1 | | | (704) | |
| Total change for the period | | Total change for the period | (222) | | | | (351) | | | 2 | | | (571) | |
| Less: Change in comprehensive (loss) attributable to non-controlling interests | | Less: Change in comprehensive (loss) attributable to non-controlling interests | (1) | | | | — | | | — | | | (1) | |
| Balances as of February 3, 2023 | | Balances as of February 3, 2023 | $ | (747) | | | | $ | (222) | | | $ | (32) | | | $ | (1,001) | |
Amounts related to investments are reclassified to net income (loss) when gains and losses are realized. See Note 3 of the Notes to the Consolidated Financial Statements for more information on the Company’s investments. Amounts related to the Company’s cash flow hedges are reclassified to net income during the same period in which the items being hedged are recognized in earnings. See Note 79 of the Notes to the Consolidated Financial Statements for more information on the Company’s derivative instruments.
DELL TECHNOLOGIES INC.
NOTES TO THE CONSOLIDATED FINANCIAL STATEMENTS (continued)
The following table presents reclassifications out of accumulated other comprehensive income (loss), net of tax, to net income for the periods indicated:
| | | | | | | | | | | | | | | | | | | | | | | | | | | | | | | | | | | | Fiscal Year Ended |
| | | Fiscal Year Ended | | | February 3, 2023 | | | January 28, 2022 |
| | | January 29, 2021 | | | January 31, 2020 | | | Cash Flow Hedges | | Pensions | | Total | | | Cash Flow Hedges | | Pensions | | Total |
| | | Cash Flow Hedges | | Pensions | | Total | | | Cash Flow Hedges | | Pensions | | Total | | | | | | | | | | | | | | |
| | | (in millions) | | | (in millions) |
| Total reclassifications, net of tax: | Total reclassifications, net of tax: | | | | | Total reclassifications, net of tax: | | | | |
| Net revenue | Net revenue | | $ | (105) | | | $ | 0 | | | $ | (105) | | | | $ | 226 | | | $ | 0 | | | $ | 226 | | Net revenue | | $ | 736 | | | $ | — | | | $ | 736 | | | | $ | 158 | | | $ | — | | | $ | 158 | |
| Cost of net revenue | Cost of net revenue | | 5 | | | 0 | | | 5 | | | | 0 | | | 0 | | | 0 | | Cost of net revenue | | (31) | | | — | | | (31) | | | | (3) | | | — | | | (3) | |
| Operating expenses | Operating expenses | | 0 | | | (5) | | | (5) | | | | 0 | | | (1) | | | (1) | | Operating expenses | | — | | | (1) | | | (1) | | | | — | | | (7) | | | (7) | |
| | Income from discontinued operations | | Income from discontinued operations | | — | | | — | | | — | | | | 3 | | | — | | | 3 | |
| Total reclassifications, net of tax | Total reclassifications, net of tax | | $ | (100) | | | $ | (5) | | | $ | (105) | | | | $ | 226 | | | $ | (1) | | | $ | 225 | | Total reclassifications, net of tax | | $ | 705 | | | $ | (1) | | | $ | 704 | | | | $ | 158 | | | $ | (7) | | | $ | 151 | |
DELL TECHNOLOGIES INC.
NOTE 13— NON-CONTROLLING INTERESTS
VMware, Inc. — The non-controlling interests’ share of equity in VMware, Inc. is reflected as a component of the non-controlling interests in the Consolidated Statements of Financial Position and was $5.0 billion and $4.6 billion as of January 29, 2021 and January 31, 2020, respectively. As of January 29, 2021 and January 31, 2020, the Company held approximately 80.6% and 80.9%, respectively, of the outstanding equity interest in VMware, Inc.
As a result of VMware, Inc.’s acquisition of the non-controlling interest in Pivotal from Pivotal’s public stockholders on December 30, 2019, as described in Note 1 of the Notes to the Consolidated Financial Statements, the non-controlling interests’ share of equity in Pivotal is only reflected as a component of the non-controlling interest through December 30, 2019. Pivotal’s Class A common stock ceased to be listed and traded on the NYSE as of the acquisition date, and there was no non-controlling interest in Pivotal as of January 29, 2021 and January 31, 2020.
Secureworks — The non-controlling interests’ share of equity in Secureworks is reflected as a component of the non-controlling interests in the Consolidated Statements of Financial Position and was $96 million and $88 million as of January 29, 2021 and January 31, 2020, respectively. As of January 29, 2021 and January 31, 2020, the Company held approximately 85.7% and 86.8%, respectively, of the outstanding equity interest in Secureworks, excluding restricted stock awards (“RSAs”). As of January 29, 2021 and January 31, 2020, the Company held approximately 84.9% and 86.2%, respectively, of the outstanding equity interest in Secureworks, including RSAs.
The following table presents the effect of changes in the Company’s ownership interest in VMware, Inc. and Secureworks on the Company’s equity for the period indicated:
| | | | | | | | | | | | | | | | | |
| Fiscal Year Ended |
| January 29, 2021 | | January 31, 2020 | | February 1, 2019 |
| (in millions) |
| Net income attributable to Dell Technologies Inc. | $ | 3,250 | | | $ | 4,616 | | | $ | (2,310) | |
| Transfers (to)/from the non-controlling interests: | | | | | |
| Increase in Dell Technologies Inc. additional paid-in-capital for equity issuances and other equity activity | 980 | | | 1,997 | | | 954 | |
| Decrease in Dell Technologies Inc. additional paid-in-capital for equity issuances and other equity activity | (1,019) | | | (3,318) | | | (820) | |
| Net transfers to non-controlling interests | (39) | | | (1,321) | | | 134 | |
| Change from net income attributable to Dell Technologies Inc. and transfers to the non-controlling interests | $ | 3,211 | | | $ | 3,295 | | | $ | (2,176) | |
NOTE 1415 — CAPITALIZATION
The following table presents the Company’s authorized, issued, and outstanding common stock as of the dates indicated:
| | | Authorized | | Issued | | Outstanding | | Authorized | | Issued | | Outstanding |
| | (in millions) | | | | | | |
| Common stock as of January 29, 2021 | |
| | | (in millions) |
| Common stock as of February 3, 2023 | | Common stock as of February 3, 2023 |
| Class A | | Class A | 600 | | | 379 | | | 379 | |
| Class B | | Class B | 200 | | | 95 | | | 95 | |
| Class C | | Class C | 7,900 | | | 324 | | | 242 | |
| Class D | | Class D | 100 | | | — | | | — | |
| | | | 8,800 | | | 798 | | | 716 | |
| | Common stock as of January 28, 2022 | | Common stock as of January 28, 2022 |
| Class A | Class A | 600 | | | 385 | | | 385 | | Class A | 600 | | | 379 | | | 379 | |
| Class B | Class B | 200 | | | 102 | | | 102 | | Class B | 200 | | | 95 | | | 95 | |
| Class C | Class C | 7,900 | | | 274 | | | 266 | | Class C | 7,900 | | | 303 | | | 283 | |
| Class D | Class D | 100 | | | 0 | | | 0 | | Class D | 100 | | | — | | | — | |
| Class V | Class V | 343 | | | 0 | | | 0 | | Class V | 343 | | | — | | | — | |
| | 9,143 | | | 761 | | | 753 | | | 9,143 | | | 777 | | | 757 | |
| | Common stock as of January 31, 2020 | |
| Class A | 600 | | | 385 | | | 385 | | |
| Class B | 200 | | | 102 | | | 102 | | |
| Class C | 7,900 | | | 258 | | | 256 | | |
| Class D | 100 | | | 0 | | | 0 | | |
| Class V | 343 | | | 0 | | | 0 | | |
| 9,143 | | | 745 | | | 743 | | |
UnderOn June 29, 2022, the authorized capital stock provisions of the Company’s certificate of incorporation aswere amended and restated upon the completion ofto eliminate the Class V transaction described in Note 1Common Stock as the fifth authorized series of Dell Technologies common stock. In connection with the Notes to the Consolidated Financial Statements, the Company is prohibited from issuing anyelimination of the authorized shares of Class V Common Stock.Stock, the Company’s certificate of incorporation also was amended to decrease by 343 million shares the total number of shares of common stock which Dell Technologies is authorized to issue.
Preferred Stock
The Company is authorized to issue 1000000one million shares of preferred stock, par value $0.01 per share. As of January 29, 2021February 3, 2023 and January 31, 2020, 028, 2022, no shares of preferred stock were issued or outstanding.
Common Stock
Common Stock for Fiscal 2020 and Thereafter
Dell Technologies Common Stock — For Fiscal 2020 and thereafter, theThe Class A Common Stock, the Class B Common Stock, the Class C Common Stock, and the Class D Common Stock formerly collectively referred to as the DHI Group Common Stock, are collectively referred to as Dell Technologies Common Stock. The redesignation of such classes of common stock from DHI Group Common Stock to Dell Technologies Common Stock is intended to align the Company’s reporting with how such classes are referred to by securities analysts, investors, and other users of the financial statements since the completion on December 28, 2018 of the Class V transaction described in Note 1 of the Notes to the Consolidated Financial Statements. As a result of the cancellation of all outstanding Class V Common Stock upon the closing of that transaction, there is no requirement after the fourth quarter of Fiscal 2019 to allocate net income (loss) between two separate groups of common stock, denoted as DHI Group Common Stock and Class V Common Stock, or to report earnings (loss) per share for each such group. Accordingly, net income (loss), earnings (loss) per share and other relevant information are reported for Dell Technologies Common Stock for all fiscal periods beginning with the first quarter of Fiscal 2020 and, because of lack of comparability with the new reporting, are reported separately for the DHI Group and the Class V Common Stock, as applicable, for prior fiscal periods. The par value for all classesseries of Dell Technologies Common Stock is $0.01 per share. For purposes of calculating earnings (loss) per share, the Company continues to use the two-class method. The Class A Common Stock, the Class B Common Stock, the Class C Common Stock, and the Class D Common Stock share equally in dividends declared or accumulated and have equal participation rights in undistributed
earnings. As a result, earnings (loss) per share are the same for all classes of Dell Technologies Common Stock and are presented together.
Common Stock prior to Fiscal 2020
DHI Group Common Stockand DHI Group — For the fiscal periods prior to Fiscal 2020, the Class A Common Stock, the Class B Common Stock, the Class C Common Stock, and the Class D Common Stock were collectively referred to as the DHI Group Common Stock. All classes of DHI Group Common Stock have a par value of $0.01 per share, and the Class A Common Stock, the Class B Common Stock, the Class C Common Stock, and the Class D Common Stock share equally in dividends declared or accumulated and have equal participation rights in undistributed earnings. Prior to the completion on December 28, 2018 of the Class V transaction, the DHI Group referred to the direct and indirect interest of Dell Technologies in all of Dell Technologies’ business, assets, properties, liabilities, and preferred stock other than those attributable to the Class V Group, as well as the DHI Group’s retained interest in the Class V Group. Subsequent to the completion of the Class V transaction, the DHI Group refers to all classes of issued and outstanding DHI Group Common Stock.
Class V Common Stock and Class V Group — The Class V Common Stock was a class of common stock intended to track the performance of a portion of Dell Technologies’ economic interest in the Class V Group. The Class V Group consisted solely of VMware, Inc. common stock held by the Company. As of January 29, 2021 and January 31, 2020, 0 shares of Class V Common Stock remained outstanding.
Voting Rights — Each holder of record of (a) Class A Common Stock is entitled to 10ten votes per share of Class A Common Stock; (b) Class B Common Stock is entitled to 10ten votes per share of Class B Common Stock; (c) Class C Common Stock is entitled to 1one vote per share of Class C Common Stock; and (d) Class D Common Stock is not entitled to any vote on any matter except to the extent required by provisions of Delaware law (in which case such holder is entitled to 1one vote per share of Class D Common Stock).
Conversion Rights — Under the Company’s certificate of incorporation, at any time and from time to time, any holder of Class A Common Stock or Class B Common Stock has the right to convert all or any of the shares of Class A Common Stock or Class B Common Stock, as applicable, held by such holder into shares of Class C Common Stock on a one-to-one basis.
During the fiscal year ended February 3, 2023, there were no conversions of shares of Class A Common Stock or Class B Common Stock into shares of Class C Common Stock.
DELL TECHNOLOGIES INC.
NOTES TO THE CONSOLIDATED FINANCIAL STATEMENTS (continued)
During the fiscal year ended January 29, 2021,28, 2022, the Company issued an aggregate of 72,7275,985,573 shares of Class C Common Stock to stockholders upon their conversion of the same number of shares of Class A Common Stock into Class C Common Stock in accordance with the Company’s certificate of incorporation.
During the fiscal year ended January 31, 2020,29, 2021, the Company issued 35,822,123 shares of Class C Common Stock to stockholders upon their conversion of the same number of shares of Class A Common Stock into Class C Common Stock in accordance with the Company’s certificate of incorporation. During the fiscal year ended January 31, 2020, the Company issued 35,301,6416,334,990 shares of Class C Common Stock to stockholders upon their conversion of the same number of shares of Class B Common Stock into Class C Common Stock in accordance with the Company’s certificate of incorporation.
Class V Transaction
On December 28, 2018, the Company completed the Class V transaction in which Dell Technologies paid $14.0 billion in cash and issued 149,387,617 shares of its Class C Common Stock to holders of its Class V Common Stock in exchange for all outstanding shares of Class V Common Stock. The non-cash consideration portion of the Class V transaction totaled $6.9 billion. As a result of the Class V transaction, the tracking stock feature of Dell Technologies’ capital structure was terminated. The Class C Common Stock is traded on the New York Stock Exchange. See Note 1 of the Notes to the Consolidated Financial Statements for more information about the Class V transaction.
Repurchases of Common Stock and Treasury Stock
Dell Technologies Common Stock Repurchases by Dell TechnologiesDividends
On February 24, 2020,2022, the Company announced that its Board of Directors adopted a dividend policy providing for payment by the Company of quarterly cash dividends on the outstanding Dell Technologies Common Stock at a rate of $0.33 per share per fiscal quarter beginning in the first quarter of Fiscal 2023. On March 2, 2023, the Company announced that the Board of Directors approved a 12% increase in the quarterly dividend rate to a rate of $0.37 per share per fiscal quarter beginning in the first quarter of Fiscal 2024.
The Company paid the following dividends during the fiscal year ended February 3, 2023:
| | | | | | | | | | | | | | | | | | | | | | | | | | |
| Declaration Date | | Record Date | | Payment Date | | Dividend per Share | | Amount (in millions) |
| February 24, 2022 | | April 20, 2022 | | April 29, 2022 | | $ | 0.33 | | | $ | 248 | |
| June 7, 2022 | | July 20, 2022 | | July 29, 2022 | | $ | 0.33 | | | $ | 242 | |
| September 6, 2022 | | October 19, 2022 | | October 28, 2022 | | $ | 0.33 | | | $ | 238 | |
| December 6, 2022 | | January 25, 2023 | | February 3, 2023 | | $ | 0.33 | | | $ | 236 | |
Repurchases of Common Stock
Effective as of September 23, 2021, the Company’s boardBoard of directorsDirectors approved a stock repurchase program under which the Company is authorized to repurchase up to $1.0$5 billion of shares of the Company’s Class C Common Stock over a 24-month period expiring on February 28, 2022, of which approximately $760 million remained available as of January 29, 2021.with no fixed expiration date. During the fiscal year ended January 29, 2021,February 3, 2023, the Company repurchased approximately 662 million shares of Class C Common Stock for a total purchase price of approximately $240 million. During the three months ended May 1, 2020, the Company suspended activity under its stock repurchase program.$2.8 billion. During the fiscal year ended January 31, 2020, Dell Technologies Common Stock repurchases were immaterial.
To the extent not retired, shares repurchased under the repurchase program are placed in the Company’s treasury.
Class V Common Stock Repurchases by Dell Technologies
Prior to the Class V transaction and since the date of the EMC merger transaction, the Company authorized several programs to repurchase shares of its Class V Common Stock. The Company did not repurchase any shares of Class V Common Stock during the fiscal year ended February 1, 2019 under the repurchase programs.
As a result of the Class V transaction, pursuant to which all of the approximately 199 million outstanding shares of Class V Common Stock ceased to be outstanding, the tracking stock feature of the Company’s capital structure was terminated. Additionally, as a result of the Class V transaction, all of the approximately 127 million shares of DHI Group retained interest shares ceased to be outstanding.
DHI Group Common Stock Repurchases by Dell Technologies
Prior to the Class V transaction during the fiscal year ended February 1, 2019,28, 2022, the Company repurchased approximately 100000012 million shares of DHI GroupClass C Common Stock for a total purchase price of approximately $47$659 million. All shares of DHI Group Common Stock repurchased by the Company were held as treasury stock at cost.
VMware, Inc. Class A Common Stock Repurchases by VMware, Inc.
In August 2017, VMware, Inc.’s board of directors authorized the repurchase of up to $1.0 billion shares of VMware, Inc. Class A common stock through August 31, 2018 and subsequently, in July 2018, extended that authorization through August 31, 2019. On May 29, 2019, VMware, Inc.’s board of directors authorized the repurchase of an additional $1.5 billion of VMware, Inc.’s Class A common stock through January 29, 2021. On July 15, 2020, VMware, Inc.’s board of directors extended authorization of VMware, Inc.’s existing repurchase program and authorized the repurchase of up to an additional $1.0 billion of VMware, Inc.’s Class A common stock through January 28, 2022. As of January 29, 2021, the cumulative authorized amount remaining for stock repurchases was $1.1 billion.
During the fiscal year ended January 29, 2021, VMware, Inc. repurchased 6.9 million shares of its Class A common stock in the open market for approximately $945 million. During the fiscal year ended January 31, 2020, VMware, Inc. repurchased 7.7 million shares of its Class A common stock in the open market for approximately $1.3 billion, of which approximately $0.2 billion impacted Dell Technologies’ accumulated deficit balance as of January 31, 2020 as a result of the full depletion of VMware, Inc’s additional paid-in capital in the same period. During the fiscal year ended February 1, 2019, VMware, Inc. repurchased 0.3 million shares of its Class A common stock in the open market for approximately $42 million.
All shares repurchased under VMware, Inc.’s stock repurchase programs are retired.
The above VMware, Inc.repurchases of Class A common stock repurchases for the fiscal years ended January 29, 2021, January 31, 2020, and February 1, 2019C Common Stock exclude shares repurchasedwithheld from stock awards to settle employee tax withholding obligations related to the vesting of VMware, Inc. stock awards of $413 million, $521 million, and $373 million, respectively.such awards.
DELL TECHNOLOGIES INC.
NOTES TO THE CONSOLIDATED FINANCIAL STATEMENTS (continued)
NOTE 1516 — EARNINGS PER SHARE
Basic earnings (loss) per share is based on the weighted-average effect of all common shares issued and outstanding and is calculated by dividing net income (loss) by the weighted-average shares outstanding during the period. Diluted earnings (loss) per share is calculated by dividing net income (loss) by the weighted-average number of common shares used in the basic earnings (loss) per share calculation plus the number of common shares that would be issued assuming exercise or conversion of all potentially dilutive instruments. The Company excludes equity instruments from the calculation of diluted earnings (loss) per share if the effect of including such instruments is antidilutive.
Until the completion on December 28, 2018 of the Class V transaction described in Note 1 of the Notes to the Consolidated Financial Statements, the Company had 2 groups of common stock, denoted as the DHI Group Common Stock and the Class V Common Stock.
The Class V Common Stock was a class of common stock intended to track the economic performance of 61% of the Company’s interest in the Class V Group, which consisted solely of VMware, Inc. common stock held by the Company as of immediately before the completion of the Class V transaction. Upon the completion of the Class V transaction, all outstanding shares of Class V Common Stock ceased to be outstanding, and the tracking stock structure was terminated. The Class C Common Stock issued to former holders of the Class V Common Stock in the Class V transaction represents an interest in the Company’s entire business and, unlike the Class V Common Stock, is not intended to track the performance of any distinct assets or business.
Prior to the fiscal year ended January 31, 2020, the DHI Group Common Stock consisted of 4 classes of common stock, including the Class A Common Stock, the Class B Common Stock, the Class C Common Stock, and the Class D Common Stock. Prior to the completion of the Class V transaction, the DHI Group referred to the direct and indirect interest of Dell Technologies in all of Dell Technologies’ business, assets, properties, liabilities, and preferred stock other than those attributable to the Class V Group, as well as the DHI Group’s retained interest in the Class V Group. Subsequent to the completion of the Class V transaction, the DHI Group refers to all classes of issued and outstanding DHI Group Common Stock.
For purposes of calculating earnings (loss) per share, the Company continues to use the two-class method. The Class A Common Stock, the Class B Common Stock, the Class C Common Stock, and the Class D Common Stock share equally in dividends declared or accumulated and have equal participation rights in undistributed earnings. As a result, earnings (loss) per share are the same for all classes of Dell Technologies Common Stock and are presented together.
The Company accounted for the VMware, Inc. acquisition of the controlling interest in Pivotal from Dell Technologies described in Note 1 of the Notes to the Consolidated Financial Statements as a transaction by entities under common control. Consequently, the Pivotal acquisition had no net effect on the Company’s consolidated financial statements or earnings (loss) per share as previously reported, which includes the period in which the Class V Common Stock was outstanding.
The following table presents basic and diluted earnings (loss) per share for the periods indicated:
| | | | | | | | | | | | | | | | | | | | | |
| | | | Fiscal Year Ended |
| | | | | | January 29, 2021 | | January 31, 2020 | | February 1, 2019 |
| Earnings (loss) per share attributable to Dell Technologies Inc. — basic: |
| Dell Technologies Common Stock | | | | | $ | 4.37 | | | $ | 6.38 | | | |
| Class V Common Stock | | | | | | | | | $ | 6.01 | |
| DHI Group | | | | | | | | | $ | (6.02) | |
| | | | | | | | | |
| Earnings (loss) per share attributable to Dell Technologies Inc. — diluted: |
| Dell Technologies Common Stock | | | | | $ | 4.22 | | | $ | 6.03 | | | |
| Class V Common Stock | | | | | | | | | $ | 5.91 | |
| DHI Group | | | | | | | | | $ | (6.04) | |
| | | | | | | | | | | | | | | | | | | | | |
| | | | Fiscal Year Ended |
| | | | | | February 3, 2023 | | January 28, 2022 | | January 29, 2021 |
| Earnings per share attributable to Dell Technologies Inc. — basic |
| Continuing operations | | | | | $ | 3.33 | | | $ | 6.49 | | | $ | 3.02 | |
| Discontinued operations | | | | | $ | — | | | $ | 0.81 | | | $ | 1.35 | |
| | | | | | | | | |
| Earnings per share attributable to Dell Technologies Inc. — diluted |
| Continuing operations | | | | | $ | 3.24 | | | $ | 6.26 | | | $ | 2.93 | |
| Discontinued operations | | | | | $ | — | | | $ | 0.76 | | | $ | 1.29 | |
The following table presents the computation of basic and diluted earnings per share for the periods indicated:
| | | Fiscal Year Ended | | | | Fiscal Year Ended |
| | January 29, 2021 | | January 31, 2020 | | | | February 3, 2023 | | January 28, 2022 | | January 29, 2021 |
| | (in millions) | | | | | | | | |
| Numerator: Dell Technologies Common Stock | | | |
Net income attributable to Dell Technologies — basic | $ | 3,250 | | | $ | 4,616 | | | |
| Incremental dilution from VMware, Inc. attributable to Dell Technologies (a) | (13) | | | (84) | | | |
Net income attributable to Dell Technologies — diluted | $ | 3,237 | | | $ | 4,532 | | | |
| | | | (in millions) |
| Numerator: Continuing operations | | Numerator: Continuing operations | | |
| Net income attributable to Dell Technologies Inc. from continuing operations - basic and diluted | | Net income attributable to Dell Technologies Inc. from continuing operations - basic and diluted | | $ | 2,442 | | | $ | 4,948 | | | $ | 2,249 | |
| | Numerator: Discontinued operations | | Numerator: Discontinued operations | | |
| Income from discontinued operations, net of income taxes - basic | | Income from discontinued operations, net of income taxes - basic | | $ | — | | | $ | 615 | | | $ | 1,001 | |
| Incremental dilution from VMware, Inc. (a) | | Incremental dilution from VMware, Inc. (a) | | — | | | (7) | | | (13) | |
| Income from discontinued operations, net of income taxes, attributable to Dell Technologies Inc. - diluted | | Income from discontinued operations, net of income taxes, attributable to Dell Technologies Inc. - diluted | | $ | — | | | $ | 608 | | | $ | 988 | |
| | Denominator: Dell Technologies Common Stock weighted-average shares outstanding | Denominator: Dell Technologies Common Stock weighted-average shares outstanding | | | Denominator: Dell Technologies Common Stock weighted-average shares outstanding | | |
Weighted-average shares outstanding — basic | Weighted-average shares outstanding — basic | 744 | | | 724 | | | Weighted-average shares outstanding — basic | | 734 | | | 762 | | | 744 | |
| Dilutive effect of options, restricted stock units, restricted stock, and other | Dilutive effect of options, restricted stock units, restricted stock, and other | 23 | | | 27 | | | Dilutive effect of options, restricted stock units, restricted stock, and other | | 19 | | | 29 | | | 23 | |
Weighted-average shares outstanding — diluted | Weighted-average shares outstanding — diluted | 767 | | | 751 | | | Weighted-average shares outstanding — diluted | | 753 | | | 791 | | | 767 | |
Weighted-average shares outstanding — antidilutive | Weighted-average shares outstanding — antidilutive | 0 | | | 0 | | | Weighted-average shares outstanding — antidilutive | | 9 | | | — | | | — | |
____________________
(a)The incremental dilution from VMware, Inc. represents the impact of VMware, Inc.’s dilutive securities on diluted earnings (loss) per share of Dell Technologies Common Stock, and is calculated by multiplying the difference between VMware, Inc.’s basic and diluted earnings (loss) per share by the number of shares of VMware, Inc. common stock held by the Company. ForCompany before the fiscal year ended January 31, 2020, incremental dilution from VMware Inc. was calculated by the Company without regard to VMware Inc.’s required retrospective adjustments for the Pivotal acquisition in its stand-alone financial statements. There is no incremental dilution from Secureworks due to its net loss position for the periods presented.Spin-off.
The following table presents the computation of basic and diluted earnings (loss) per share prior to the fiscal year ended January 31, 2020 for the period indicated:
| | | | | |
| Fiscal Year Ended |
| February 1, 2019 |
| |
Numerator: Class V Common Stock | |
Net income attributable to Class V Common Stock — basic (a) | $ | 1,195 | |
Incremental dilution from VMware, Inc. attributable to Class V Common Stock (b) | (18) | |
Net income attributable to Class V Common Stock — diluted | $ | 1,177 | |
| |
Numerator: DHI Group | |
Net loss attributable to DHI Group — basic | $ | (3,505) | |
Incremental dilution from VMware, Inc. attributable to DHI Group (b) | (13) | |
Net loss attributable to DHI Group — diluted | $ | (3,518) | |
| |
Denominator: Class V Common Stock weighted-average shares outstanding | |
Weighted-average shares outstanding — basic (c)
| 199 | |
Dilutive effect of options, restricted stock units, restricted stock, and other (d) | 0 | |
Weighted-average shares outstanding — diluted
| 199 | |
Weighted-average shares outstanding — antidilutive (d)
| 0 | |
| |
Denominator: DHI Group weighted-average shares outstanding | |
Weighted-average shares outstanding — basic (e)
| 582 | |
Dilutive effect of options, restricted stock units, restricted stock, and other | 0 | |
Weighted-average shares outstanding — diluted
| 582 | |
Weighted-average shares outstanding — antidilutive (f)
| 44 | |
____________________
(a)For the fiscal year ended February 1, 2019, net income attributable to the Class V Common Stock - basic represents net income attributable to the Class V Group for the period ended December 27, 2018, the last date on which the Class V Common Stock was traded on the NYSE.
(b)The incremental dilution from VMware, Inc. represents the impact of VMware, Inc.’s dilutive securities on the diluted earnings (loss) per share of the DHI Group and the Class V Common Stock, respectively, and is calculated by multiplying the difference between VMware, Inc.’s basic and diluted earnings (loss) per share by the number of shares of VMware, Inc. common stock held by the Company.
(c)For the fiscal year ended February 1, 2019, the Class V Common Stock weighted-average shares outstanding - basic represents the weighted-average for the period ended December 27, 2018, the last date on which the Class V Common Stock was traded on the NYSE.
(d)The dilutive effect of Class V Common Stock-based incentive awards was not material to the calculation of the weighted-average Class V Common Stock shares outstanding. The antidilutive effect of these awards was also not material.
(e)For the fiscal year ended February 1, 2019, the DHI Group weighted-average shares outstanding - basic represents the weighted-average shares over the twelve month period, with the Class C shares weighted for the number of days outstanding before and after the completion of the Class V transaction.
(f)Stock-based incentive awards have been excluded from the calculation of the DHI Group’s diluted loss per share because their effect would have been antidilutive, as the Company had a net loss attributable to the DHI Group for the period presented.
The income allocation and earnings per share for the fiscal year ended February 1, 2019 were not impacted by the acquisition of Pivotal by VMware, Inc., because shares of Class V Common Stock were no longer outstanding. The following table presents a summary of the net loss attributable to Dell Technologies Inc. for the period indicated:
| | | | | |
| Fiscal Year Ended |
| February 1, 2019 |
| (in millions) |
Net income attributable to Class V Common Stock | $ | 1,195 | |
Net loss attributable to DHI Group | (3,505) | |
Net loss attributable to Dell Technologies Inc. | $ | (2,310) | |
The following table presents the basis of allocation of net income attributable to the Class V Group for the period indicated:
| | | | | |
| Fiscal Year Ended |
| February 1, 2019 |
| (in millions) |
Net income attributable to VMware | $ | 2,422 | |
Less: Net income attributable to VMware for the period from December 28, 2018 to February 1, 2019 | (15) | |
Less: Net income attributable to non-controlling interests | (452) | |
Net income attributable to Class V Group | 1,955 | |
Less: DHI Group's 38.90% weighted average retained interest in Class V Group | (760) | |
Class V Common Stock economic interest in Class V Group (a) | $ | 1,195 | |
____________________
(a) For the fiscal year ended February 1, 2019, Class V Common Stock economic interest in the Class V Group represents net income attributable to the Class V Group for the period ended December 27, 2018, the last date on which the Class V Common Stock was traded on the NYSE.
The following table presents a reconciliation of the VMware reportable segment results to the VMware, Inc. results attributable to the Class V Group pursuant to the tracking stock policy for the period indicated. The VMware reportable segment results presented below were recast as discussed in Note 19 of the Notes to the Consolidated Financial Statements. The VMware, Inc. results were not impacted by the Pivotal acquisition.
| | | | | | | | | | | | | | | | | |
| Fiscal Year Ended |
| February 1, 2019 |
| VMware Reportable Segment | | Adjustments and Eliminations (a) | | VMware |
| (in millions) |
| Net revenue | $ | 9,741 | | | $ | (767) | | | $ | 8,974 | |
| Cost of net revenue | 1,312 | | | (54) | | | 1,258 | |
| Gross margin | 8,429 | | | (713) | | | 7,716 | |
| Operating expenses: | | | | | |
| Selling, general, and administrative | 3,720 | | | (29) | | | 3,691 | |
| Research and development | 1,783 | | | 192 | | | 1,975 | |
| Total operating expenses | 5,503 | | | 163 | | | 5,666 | |
| Operating income (loss) | $ | 2,926 | | | $ | (876) | | | $ | 2,050 | |
| Interest and other income (expense), net attributable to VMware | | | | | 833 | |
| Income before income taxes attributable to VMware | | | | | 2,883 | |
| Income tax provision attributable to VMware | | | | | 461 | |
| Net income attributable to VMware | | | | | $ | 2,422 | |
____________________
(a) Adjustments and eliminations primarily consist of intercompany sales and allocated expenses, as well as expenses that are excluded from the VMware reportable segment, such as amortization of intangible assets, stock-based compensation expense, severance, and integration and acquisition-related costs. Adjustments also include adjustments and eliminations pertaining to Pivotal results.
DELL TECHNOLOGIES INC.
NOTES TO THE CONSOLIDATED FINANCIAL STATEMENTS (continued)
NOTE 1617 — STOCK-BASED COMPENSATION
Stock-Based Compensation Expense
The following table presents stock-based compensation expense recognized in the Consolidated Statements of Income (Loss) for the periods indicated:
| | | Fiscal Year Ended | | Fiscal Year Ended |
| | | January 29, 2021 | | January 31, 2020 | | February 1, 2019 | | February 3, 2023 | | January 28, 2022 | | January 29, 2021 |
| | | (in millions) | | | | | | |
| Stock-based compensation expense (a): | | | |
| | | | (in millions) |
| Stock-based compensation expense: | | Stock-based compensation expense: | | |
| Cost of net revenue | Cost of net revenue | $ | 194 | | | $ | 129 | | | $ | 76 | | Cost of net revenue | $ | 152 | | | $ | 133 | | | $ | 75 | |
| Operating expenses | Operating expenses | 1,415 | | | 1,133 | | | 842 | | Operating expenses | 779 | | | 675 | | | 412 | |
| Stock-based compensation expense before taxes | 1,609 | | | 1,262 | | | 918 | | |
| Stock-based compensation expense from continuing operations before taxes | | Stock-based compensation expense from continuing operations before taxes | 931 | | | 808 | | | 487 | |
| Stock-based compensation expense from discontinued operations before taxes (a) | | Stock-based compensation expense from discontinued operations before taxes (a) | — | | | 814 | | | 1,122 | |
| Total stock-based compensation expense before taxes | | Total stock-based compensation expense before taxes | 931 | | | 1,622 | | | 1,609 | |
| Income tax benefit | Income tax benefit | (313) | | | (392) | | | (260) | | Income tax benefit | (163) | | | (296) | | | (313) | |
| Stock-based compensation expense, net of income taxes | $ | 1,296 | | | $ | 870 | | | $ | 658 | | |
| Total stock-based compensation expense, net of income taxes | | Total stock-based compensation expense, net of income taxes | $ | 768 | | | $ | 1,326 | | | $ | 1,296 | |
____________________
(a) Stock-based compensation expense from discontinued operations before taxes represents VMware stock-based compensation expense and is included in income from discontinued operations, net of taxes, on the Consolidated Statements of Income for the fiscal years ended January 29, 2021, January 31, 2020, and February 1, 2019 includes $1,122 million, $892 million and $731 million, respectively, relatedperiods prior to the VMware Inc. plans discussed below.Spin-off.
Dell Technologies Inc. Stock-Based Compensation PlansPlan
Dell Technologies Inc. 2013 Stock Incentive Plan (As Amended and Restated as of July, 9, 2019)— On September 7, 2016, at the effective time of the EMC merger transaction, the Denali Holding Inc. 2013 Stock Incentive Plan (the “2013 Plan”) was amended and restated as the Dell Technologies Inc. 2013 Stock Incentive Plan (the “Restated Plan”). Employees, consultants, non-employee directors, and other service providers of the Company or its affiliates are eligible to participate in the Restated Plan.Dell Technologies Inc. 2013 Stock Incentive Plan, as amended and restated as of July 9, 2019 (the “2013 Plan”). The Restated Plan authorized the issuance of an aggregate of 75 million shares of the Company’s Class C Common Stock and 500,000 shares of the Company’s Class V Common Stock, of which 61 million shares of Class C Common Stock were previously reserved for issuance under the 2013 Plan. The Restated Plan authorizes the Company to grant stock options, restricted stock units (“RSUs”), stock appreciation rights (“SARs”), RSAs,restricted stock awards, and dividend equivalents.
Upon the completion of the Class V transaction on December 28, 2018, the Restated Plan was amended to remove allowance for employee awards to be settled in Class V Common Stock and reflected an increase in the total authorized shares of Class C Common Stock issued under the plan to 75.5 million shares from 75 million shares upon the conversion of 500,000 shares of Class V Common Stock previously authorized under the plan into the same number of shares of Class C Common Stock. In connection with the Class V transaction, an immaterial number of Class V Common Stock awards issued to the Company’s independent directors were converted into an immaterial number of Class C Common Stock awards, which are reflected in the underlying stock option and restricted stock data as outstanding. See Note 1 of the Notes to the Consolidated Financial Statements for additional information on the Class V transaction.
During the second quarter of the fiscal year ended January 31, 2020, the Company’s stockholders approved an amendment to the Restated Plan to authorize an additional 35 million shares of Class C Common Stock for issuance pursuant to the Plan. Upon effectiveness of the amendment, a total of 110.5 million shares of Class C Common Stock are authorized for issuance. As of January 29, 2021, there were approximately 32 million shares of Class C Common Stock available for future grants under the Restated Plan.
Stock Option Agreements — Stock options granted under the Restated Plan include service-based awards and performance-based awards. A majority of the service-based stock options vest pro-rata at each option anniversary date over a five-year period. Outstanding performance-based stock options became fully vested upon the achievement of a prescribed return on equity (“ROE”) measurement that was approved by the Company’s board of directors in connection with the Class V transaction. Both service-based and performance-based stock options arehave been granted with option exercise prices equal to the fair market value of the Company’s common stock. Prior toClass C Common Stock and expire ten years after the Class V transaction,grant date.
The 2013 Plan authorizes the fair market value was determined by the Company’s boardissuance of directors or authorized committee. After the Class V transaction, the fair market value is based on the closing pricean aggregate of 165.5 million shares of the Class C Common Stock, as reported onincluding 55.0 million shares automatically added to the NYSE onshare pool pursuant to the grant date. A majorityequitable adjustment provisions relating to the VMware Spin-off. As of February 3, 2023, there were approximately 28 million shares of Class C Common Stock available for future grants under the stock options expire ten years after the date of grant.2013 Plan.
DELL TECHNOLOGIES INC.
NOTES TO THE CONSOLIDATED FINANCIAL STATEMENTS (continued)
Stock Option Activity — The following table presents stock option activity settled in Dell Technologies Common Stock or DHI Group Common Stock for the periods indicated:
| | | Number of Options | | Weighted-Average Exercise Price | | Weighted-Average Remaining Contractual Term | | Aggregate Intrinsic Value (a) | | Number of Options | | Weighted-Average Exercise Price | | Weighted-Average Remaining Contractual Term | | Aggregate Intrinsic Value (a) |
| | (in millions) | | (per share) | | (in years) | | (in millions) | | (in millions) | | (per share) | | (in years) | | (in millions) |
| Options outstanding as of February 2, 2018 | 42 | | | $ | 14.80 | | | |
| Options outstanding as of January 31, 2020 | | Options outstanding as of January 31, 2020 | 18 | | | $ | 14.82 | | |
| Granted | Granted | 0 | | | 0 | | | Granted | — | | | — | | |
| Exercised | Exercised | 0 | | | 0 | | | Exercised | (12) | | | 14.32 | | |
| Forfeited | Forfeited | 0 | | | 0 | | | Forfeited | — | | | — | | |
| Canceled/expired | Canceled/expired | 0 | | | 0 | | | Canceled/expired | — | | | — | | |
| Options outstanding as of February 1, 2019 (b) | 42 | | | 14.76 | | | |
| Options outstanding as of January 29, 2021 | | Options outstanding as of January 29, 2021 | 6 | | | 15.87 | | |
| Granted | | Granted | — | | | — | | |
| VMware Spin-off adjustment (b) | | VMware Spin-off adjustment (b) | 2 | | | NA | |
| Exercised | | Exercised | (5) | | | 13.36 | | |
| Forfeited | | Forfeited | — | | | — | | |
| Canceled/expired | | Canceled/expired | — | | | — | | |
| Options outstanding as of January 28, 2022 | | Options outstanding as of January 28, 2022 | 3 | | | 9.62 | | |
| Granted | Granted | 0 | | | 0 | | | Granted | — | | | — | | |
| Exercised | Exercised | (24) | | | 14.86 | | | Exercised | (1) | | | 6.99 | | |
| Forfeited | Forfeited | 0 | | | 0 | | | Forfeited | — | | | — | | |
| Canceled/expired | Canceled/expired | 0 | | | 0 | | | Canceled/expired | — | | | — | | |
| Options outstanding as of January 31, 2020 (c) | 18 | | | 14.82 | | | |
| Granted | 0 | | | 0 | | | |
| Exercised | (12) | | | 14.32 | | | |
| Forfeited | 0 | | | 0 | | | |
| Canceled/expired | 0 | | | 0 | | | |
| Options outstanding as of January 29, 2021(c) | 6 | | | $ | 15.87 | | | 3.2 | | $ | 322 | | |
| Exercisable as of January 29, 2021 | 6 | | | $ | 15.65 | | | 3.2 | | $ | 321 | | |
| Vested and expected to vest (net of estimated forfeitures) as of January 29, 2021 | 6 | | | $ | 15.87 | | | 3.2 | | $ | 322 | | |
| Options outstanding as of February 3, 2023 (c) | | Options outstanding as of February 3, 2023 (c) | 2 | | | $ | 10.29 | | | 2.5 | | $ | 69 | |
| Exercisable as of February 3, 2023 | | Exercisable as of February 3, 2023 | 2 | | | $ | 10.43 | | | 2.0 | | $ | 65 | |
| Vested and expected to vest (net of estimated forfeitures) as of February 3, 2023 | | Vested and expected to vest (net of estimated forfeitures) as of February 3, 2023 | 2 | | | $ | 10.32 | | | 2.4 | | $ | 69 | |
____________________
(a) The aggregate intrinsic values represent the total pre-tax intrinsic values based on the closing price of $72.89$42.24 of the Company’s Class C Common Stock on January 29, 2021February 3, 2023 as reported on the NYSE that would have been received by the option holders had all in-the-money options been exercised as of that date.
(b) Stock option activity duringIn connection with the period was immaterial.VMware Spin-off, and as authorized by the 2013 Plan, Dell Technologies made certain adjustments to the number of stock options and the exercise price of unexercised stock options using a conversion ratio of approximately 1.97 to 1 to preserve the intrinsic value of the awards prior to the VMware Spin-off.
(c) The ending weighted-average exercise price was calculated based on underlying options outstanding as of February 1, 2019.
(c) Other than stock option exercises, stock option activity during the period was immaterial. The ending weighted-average exercise price was calculated based on underlying options outstanding as of January 31, 2020 and January 29, 2021, respectively. Of the 6 million stock options outstanding on January 29, 2021, 4 million related to performance-based awards and 2 million related to service-based awards.3, 2023.
The total fair value of options vested was $3 million, $4 million, and $150 millionnot material for the fiscal years ended February 3, 2023, January 28, 2022, and January 29, 2021, January 31, 2020, and February 1, 2019, respectively.2021. The pre-tax intrinsic value of the options exercised was $591$35 million, $835$340 million, and $18$591 million for the fiscal years ended February 3, 2023, January 28, 2022, and January 29, 2021, January 31, 2020, and February 1, 2019, respectively. Cash proceeds from the exercise of stock options was $179$5 million, $350$62 million, and immaterial$179 million for the fiscal years ended February 3, 2023, January 28, 2022, and January 29, 2021, January 31, 2020, and February 1, 2019, respectively.
The tax benefit realized from the exercise of stock options was $139$8 million, $197$76 million, and $5$139 million for the fiscal years ended February 3, 2023, January 28, 2022, and January 29, 2021, January 31, 2020, and February 1, 2019, respectively. As of January 29, 2021, there was $1 million of total unrecognized stock-based compensation expense, net of estimated forfeitures, related to unvested stock options expected to be recognized over a weighted-average period of 2.2 years.
Restricted Stock — The Company’s restricted stock primarily consists of RSUs granted to employees. During the fiscal yearyears ended February 3, 2023, January 28, 2022, and January 29, 2021, and January 31, 2020, the Company granted long-term incentive awards in the form of service-based RSUs and performance-based RSUs (“PSUs”) in order to align critical talent retention programs with the interests of holders of the Class C Common Stock.
DELL TECHNOLOGIES INC.
NOTES TO THE CONSOLIDATED FINANCIAL STATEMENTS (continued)
Service-based RSUs have a fair value based on the closing price of the Class C Common Stock price as reported on the NYSE on the grant date or the trade day immediately preceding the grant date, if the grant date falls on a non-trading day. MostThe majority of such RSUs vest ratably over a three-yearthree-year period. Each service-based RSU represents the right to acquire one share of Class C Common Stock upon vesting. Prior to the Class V transaction, each RSU converted into 1 share of DHI Group Common Stock upon vesting.
The PSUs granted afterduring the Class V transactionperiods presented are reflected as target units while thefor performance periods not yet complete. The actual number of units that ultimately vest will range from 0% to 200% of target, based on the level of achievement of the performance goals and continued employment with the Company over a three-yearthree-year performance period. Approximately half of the PSUs granted are subject to achievement of market-based performance goals based on relative total shareholder return and were valued utilizing a Monte Carlo valuation model to simulate the probabilities of achievement. The remaining PSUs are subject to internal financial metricsmeasures and have fair values based on the closing price of the Class C Common Stock as reported on the NYSE on the accounting grant date.
PriorBeginning with grants made during the fiscal year ended February 3, 2023, dividend equivalents will accrue on outstanding RSUs and PSUs when a dividend is paid to the Class V transaction,Company’s common stockholders. Accrued dividend equivalents will be paid when the Company granted market-basedunderlying RSUs and PSUs to certain members of the Company’s senior leadership team, which were also valued using the Monte Carlo model. The vesting and payout of the PSU awards depends upon the return on equity achieved on various measurement dates through the five year anniversary of the EMC merger transaction or specified liquidity events.vest.
The following table presents the assumptions utilized in the Monte Carlo valuation model for the periods indicated:
| | | Fiscal Year Ended | | Fiscal Year Ended |
| | January 29, 2021 | | January 31, 2020 | | February 3, 2023 | | January 28, 2022 | | January 29, 2021 |
Weighted-average grant date fair value | Weighted-average grant date fair value | $ | 40.01 | | | $ | 87.17 | | Weighted-average grant date fair value | $ | 73.26 | | | $ | 134.01 | | | $ | 40.01 | |
| Term (in years) | Term (in years) | 3.0 | | 3.0 | Term (in years) | 3 | | 3 | | 3 |
| Risk-free rate (U.S. Government Treasury Note) | Risk-free rate (U.S. Government Treasury Note) | 0.6 | % | | 2.4 | % | Risk-free rate (U.S. Government Treasury Note) | 2.0 | % | | 0.3 | % | | 0.6 | % |
| Expected volatility | Expected volatility | 47 | % | | 45 | % | Expected volatility | 39 | % | | 43 | % | | 47 | % |
| Expected dividend yield | Expected dividend yield | 0 | % | | 0 | % | Expected dividend yield | — | % | | — | % | | — | % |
(a) Weighted-average grant date fair value for periods prior to the completion of the VMware Spin-off is calculated using pre-spin off stock prices and has not been adjusted to reflect the impact of the conversion ratio on the Class C Common Stock.
DELL TECHNOLOGIES INC.
NOTES TO THE CONSOLIDATED FINANCIAL STATEMENTS (continued)
The following table presents restricted stock and restricted stock units activity settled in Dell Technologies Common Stock or DHI Group Common Stock for the periods indicated:
| | | | Number of Units | | Weighted-Average Grant Date Fair Value | | Number of Units | | Weighted-Average Grant Date Fair Value | | Aggregate Intrinsic Value (a) |
| | (in millions) | | (per unit) | | (in millions) | | (per unit) | | |
| Outstanding, February 2, 2018 | 7 | | | $ | 18.73 | | |
| Granted (a) | 0 | | | 0 | | |
| Vested | (1) | | | 28.03 | | |
| Forfeited | (1) | | | 17.88 | | |
| Outstanding, February 1, 2019 | 5 | | | $ | 18.90 | | |
| Outstanding as of January 31, 2020 | | Outstanding as of January 31, 2020 | 16 | | | $ | 50.78 | | |
| Granted | Granted | 13 | | | 60.55 | | Granted | 25 | | | 39.14 | | |
| Vested | Vested | (1) | | | 30.24 | | Vested | (5) | | | 48.15 | | |
| Forfeited | Forfeited | (1) | | | 46.50 | | Forfeited | (3) | | | 41.56 | | |
| Outstanding, January 31, 2020 | 16 | | | $ | 50.78 | | |
| Outstanding as of January 29, 2021 | | Outstanding as of January 29, 2021 | 33 | | | 43.09 | | |
| Granted | | Granted | 13 | | | 88.13 | | |
| VMware Spin-off adjustment (b) | | VMware Spin-off adjustment (b) | 30 | | | NA | |
| Vested | | Vested | (13) | | | 39.33 | | |
| Forfeited | | Forfeited | (4) | | | 46.27 | | |
| Outstanding as of January 28, 2022 | | Outstanding as of January 28, 2022 | 59 | | | 31.67 | | |
| Granted | Granted | 25 | | | 39.14 | | Granted | 23 | | | 48.11 | | |
| Vested | Vested | (5) | | | 48.15 | | Vested | (27) | | | 29.96 | | |
| Forfeited | Forfeited | (3) | | | 41.56 | | Forfeited | (5) | | | 39.26 | | |
| Outstanding, January 29, 2021 (b) | 33 | | | $ | 43.09 | | |
| Outstanding as of February 3, 2023 (c) | | Outstanding as of February 3, 2023 (c) | 50 | | | $ | 39.44 | | | $ | 2,110 | |
| Vested and expected to vest, February 3, 2023 | | Vested and expected to vest, February 3, 2023 | 48 | | | $ | 38.97 | | | $ | 2,008 | |
____________________
(a) The Company granted an immaterial number of restricted stock awards during the fiscal year ended February 1, 2019.
(b) As of January 29, 2021, the 33 million units outstanding included 28 million RSUs and 5 million PSUs.
The following table presents restricted stock that is expected to vest as of the date indicated:
| | | | | | | | | | | | | | | | | |
| Number of Units | | Weighted-Average Remaining Contractual Term | | Aggregate Intrinsic Value (a) |
| (in millions) | | (in years) | | (in millions) |
| Expected to vest, January 29, 2021 | 30 | | | 1.3 | | $ | 2,166 | |
____________________
(a)The aggregate intrinsic value represents the total pre-tax intrinsic values based on the closing price of $72.89$42.24 of the Company’s Class C Common Stock on January 29, 2021February 3, 2023 as reported on the NYSE that would have been received by the RSU holders had the RSUs been issued as of January 29, 2021.February 3, 2023.
(b) In connection with the VMware Spin-off, and as authorized by the 2013 Plan, Dell Technologies made certain adjustments to the number of RSUs using a conversion ratio of approximately 1.97 to 1 to preserve the intrinsic value of the awards prior to the VMware Spin-off.
(c) As of February 3, 2023, the 50 million units outstanding included 38 million RSUs and 12 million PSUs.
The total fair value of restricted stock that vested during the fiscal years ended February 3, 2023, January 28, 2022, and January 29, 2021, January 31, 2020, was $827 million, $493 million, andFebruary 1, 2019 was $235 million, $27 million, and $24 million, respectively, and thewith a pre-tax intrinsic value was $226of $1,371 million, $47$1,097 million, and $63$226 million, respectively. As of January 29, 2021, 33 million shares of restricted stock were outstanding, with an aggregate intrinsic value of $2,421 million.respectively.
As of January 29, 2021,February 3, 2023, there was $809$953 million of unrecognized stock-based compensation expense, net of estimated forfeitures, related to these awards expected to be recognized over a weighted-average period of approximately 1.91.8 years.
Dell Technologies Shares Withheld for Taxes — Under certain situations,Beginning in the fiscal year ended February 3, 2023, shares of Class C Common Stock are generally withheld from issuance to cover employee taxes for the vesting of restricted stock units. During the fiscal years ended January 28, 2022 and January 29, 2021, shares of Class C Common Stock were withheld from issuance to cover employee taxes for both the vesting of restricted stock units and the exercise of stock options.options only under certain situations. For the fiscal years ended February 3, 2023, January 28, 2022, and January 29, 2021, February 1, 2019, and February 2, 2018, 0.18 million, 0.10.4 million, and 0.40.1 million shares, respectively, were withheld to cover $1$388 million, $4$40 million, and $28$1 million, respectively, of employees’ tax obligations.
VMware, Inc. Stock-Based Compensation Plans
VMware, Inc. 2007 Equity and Incentive Plan —In June 2007, VMware, Inc. adopted its 2007 Equity and Incentive Plan (the “2007 Plan”). In June 2019, VMware, Inc. amended its 2007 Plan to increase the number of shares of Class A common stock available for issuance by 13 million. As of January 29, 2021, the number of authorized shares of VMware, Inc. Class A common stock under the 2007 Plan was approximately 145 million. The number of shares underlying outstanding equity awards that VMware, Inc. assumes in the course of business acquisitions are also added to the 2007 Plan reserve on an as-converted basis. VMware, Inc. has assumed approximately 12 million shares, which accordingly have been added to the authorized shares under the 2007 Plan reserve.
Awards under the 2007 Plan may be in the form of stock-based awards such as RSUs or stock options. VMware, Inc.’s Compensation and Corporate Governance Committee determines the vesting schedule for all equity awards. Generally, restricted stock grants made under the 2007 Plan have a three-year to four-year period over which they vest and vest 25% the first year and semiannually thereafter. The value of RSU grants is based on VMware, Inc.’s stock price on the date of grant. Thewithheld shares underlying the RSU awards are not issued until the RSUs vest. Upon vesting, each RSU converts into 1 share of VMware, Inc. Class A common stock. VMware, Inc.’s restricted stock also includes PSU awards which have been grantedwas classified as a reduction to certain VMware, Inc. executives and employees. The PSU awards include performance conditions and, in certain cases, a time-based or market-based vesting component. Upon vesting, each PSU award will convert into VMware, Inc.’s Class A common stock at various ratios ranging from 0.1 to 2.0 shares per PSU, depending upon the degreeand capital in excess of achievement of the performance or market based target designated by each award. If minimum performance thresholds are not achieved, then no shares will be issued.
The per share exercise price for a stock option awarded under the 2007 Plan will not be less than 100% of the per share fair market value of VMware, Inc. Class A common stock on the date of grant. Most options granted under the 2007 Plan vest 25% after the first year and monthly thereafter over the following three years and expire between six and seven years from the date of grant. VMware, Inc. utilizes authorized and unissued shares to satisfy all shares issued under the 2007 Plan. As of January 29, 2021, there was an aggregate of approximately 18 million shares of common stock available for issuance pursuant to future grants under the 2007 Plan.
Pivotal Equity Plan — Upon the completion of the acquisition of Pivotal by VMware, Inc. as described in Note 1 of the Notes to the Consolidated Financial Statements, Pivotal’s equity plan was terminated and no further awards may be granted under the plan. Pivotal’s outstanding unvested RSUs and options on the date of the acquisition were converted to VMware, Inc. RSUs and options and valued at their historical carrying amounts. The activity under Pivotal’s equity plan was not material during the fiscal years ended January 31, 2020 and February 1, 2019.
VMware, Inc. Employee Stock Purchase Plan — In June 2007, VMware, Inc. adopted its 2007 Employee Stock Purchase Plan (the “ESPP”), which is intended to be qualified under Section 423 of the Internal Revenue Code. In June 2019, VMware, Inc. amended its ESPP to increase the number of shares of Class A common stock available for issuance by 9 million. As of January 29, 2021, the number of authorized shares under the ESPP was approximately 32 million. Under the ESPP, eligible VMware, Inc. employees are granted options to purchase shares at the lower of 85% of the fair market value of the stock at the time of grant or 85% of the fair market value at the time of exercise.
The option period is generally twelve months and includes 2 embedded six-month option periods. Options are exercised at the end of each embedded option period. If the fair market value of the stock is lower on the first day of the second embedded option period than it was at the time of grant, then the twelve-month option period expires and each enrolled participant is granted a new twelve-month option. As of January 29, 2021, approximately 12 million shares of VMware, Inc. Class A common stock were available for issuance under the ESPP.
The following table presents ESPP activity for the periods indicated:
| | | | | | | | | | | | | | | | | |
| Fiscal Year Ended |
| January 29, 2021 (a) | | January 31, 2020 | | February 1, 2019 |
| (in millions, except per share amounts) |
| Cash proceeds | $ | 207 | | | $ | 172 | | | $ | 161 | |
| Class A common shares purchased | 2.0 | | | 1.5 | | | 1.9 | |
| Weighted-average price per share | $ | 102.44 | | | $ | 115.51 | | | $ | 84.95 | |
____________________
(a) During the fiscal year ended January 29, 2021, $107 million of ESPP withholdings was recorded as a liability in accrued and other on the Consolidated Statements of Financial Position related to a purchase under the ESPP that occurred on February 28, 2021, subsequent to the fiscal year ended January 29, 2021.
Total unrecognized stock-based compensation expense as of January 29, 2021 for the ESPP was $11 million.
VMware, Inc. 2007 Equity and Incentive Plan Stock Options— The following table presents stock option activity for VMware, Inc. employees in VMware, Inc. stock options for the periods indicated:
| | | | | | | | | | | | | | | | | | | | | | | |
| Number of Options | | Weighted-Average Exercise Price | | Weighted-Average Remaining Contractual Term | | Aggregate Intrinsic Value (a) |
| (in millions) | | (per share) | | (in years) | | (in millions) |
| Options outstanding as of February 2, 2018 | 2 | | | $ | 54.63 | | | | | |
| Granted | 1 | | | 16.07 | | | | | |
| Adjustment for special cash dividend | 0 | | | 0 | | | | | |
| Exercised | (1) | | | 46.73 | | | | | |
| Forfeited | 0 | | | 0 | | | | | |
| Canceled/expired | 0 | | | 0 | | | | | |
| Options outstanding as of February 1, 2019 (b) | 2 | | | 36.50 | | | | | |
| Granted | 2 | | | 73.19 | | | | | |
| Exercised | (1) | | | 39.94 | | | | | |
| Forfeited | 0 | | | 0 | | | | | |
| Canceled/expired | 0 | | | 0 | | | | | |
| Options outstanding as of January 31, 2020 | 3 | | | 56.58 | | | | | |
| Granted | 0 | | | 0 | | | | | |
| Exercised | (2) | | | 52.34 | | | | | |
| Forfeited | 0 | | | 0 | | | | | |
| Canceled/expired | 0 | | | 0 | | | | | |
| Options outstanding as of January 29, 2021 | 1 | | | $ | 58.68 | | | 5.9 | | $ | 98 | |
| Exercisable as of January 29, 2021 | 1 | | | $ | 54.72 | | | 5.1 | | $ | 64 | |
| Vested and expected to vest (net of estimated forfeitures) as of January 29, 2021 | 1 | | | $ | 58.26 | | | 5.9 | | $ | 98 | |
____________________
(a) The aggregate intrinsic value represents the total pre-tax intrinsic values based on VMware, Inc.’s closing stock price of $137.85 on January 29, 2021 as reported on the NYSE that would have been received by the option holders had all in-the-money options been exercised as of that date.
(b) The number of options and weighted-average exercise price of options outstanding as of February 1, 2019 reflect the non-cash adjustments to the options as a result of the special cash dividend paid by VMware, Inc. in connection with the Class V transaction described in Note 1 of the Notes to the Consolidated Financial Statements and below.
The above table includes stock options granted in conjunction with unvested stock options assumed in business combinations, including 0.6 million options issued for unvested options assumed as part of the Pivotal acquisition. As a result, the weighted-average exercise price per share may vary from the VMware, Inc. stock price at time of grant. The total fair value of VMware, Inc. stock options that vested during the fiscal years ended January 29, 2021, January 31, 2020, and February 1, 2019 was $92 million, $64 million, and $35 million, respectively. The pre-tax intrinsic value of the options exercised during the fiscal years ended January 29, 2021, January 31, 2020, and February 1, 2019 was $111 million, $103 million, and $56 million, respectively.
The tax benefit realized from the exercise of stock options was $24 million, $25 million, and $13 million for the fiscal years ended January 29, 2021, January 31, 2020, and February 1, 2019, respectively. As of January 29, 2021, there was $35 million of total unrecognized stock-based compensation expense, net of estimated forfeitures, related to unvested stock options expected to be recognized over a weighted-average period of less than one year.
Fair Value of VMware, Inc. Options— The fair value of each option to acquire VMware, Inc. Class A common stock granted is estimated on the date of grant using the Black-Scholes option-pricing model. The following tables present the assumptions utilized in this model, as well as the weighted-average assumptions for the periods indicated:
| | | | | | | | | | | | | | | | | |
| Fiscal Year Ended |
| January 29, 2021 | | January 31, 2020 | | February 1, 2019 |
| VMware, Inc. 2007 Equity and Incentive Plan | | | | | |
| Weighted-average grant date fair value of stock options granted per option | $ | 102.55 | | $ | 98.00 | | $ | 143.01 |
| Expected term (in years) | 2.6 | | 2.7 | | 3.2 |
| Risk-free rate (U.S. Government Treasury Note) | 0.4 | % | | 1.5 | % | | 2.9 | % |
| Expected volatility | 39 | % | | 34 | % | | 32 | % |
| Expected dividend yield | 0 | % | | 0 | % | | 0 | % |
| | | | | | | | | | | | | | | | | |
| Fiscal Year Ended |
| January 29, 2021 | | January 31, 2020 | | February 1, 2019 |
| VMware, Inc. Employee Stock Purchase Plan | | | | | |
| Weighted-average grant date fair value of stock options granted per option | $ | 33.60 | | $ | 35.66 | | $ | 34.72 |
| Expected term (in years) | 0.7 | | 0.6 | | 0.8 |
| Risk-free rate (U.S. Government Treasury Note) | 1.0 | % | | 1.7 | % | | 2.0 | % |
| Expected volatility | 36 | % | | 27 | % | | 33 | % |
| Expected dividend yield | 0 | % | | 0 | % | | 0 | % |
The weighted-average grant date fair value of VMware, Inc. stock options can fluctuate from period to period primarily due to higher valued options assumed through business combinations with exercise prices lower than the fair market value of VMware, Inc.’s stock on the date of grant.
For equity awards granted, volatility was based on an analysis of historical stock prices and implied volatilities of VMware, Inc.’s Class A common stock. The expected term was based on historical exercise patterns and post-vesting termination behavior, the term of the option period for grants made under the ESPP, or the weighted-average remaining term for options assumed in acquisitions. VMware, Inc.’s expected dividend yield input was 0 as it has not historically paid cash dividends on its common stock, other than the special cash dividend paid in connection with the Class V transaction described in Note 1 of the Notes to the Consolidated Financial Statements and below, and does not expect to pay cash dividends in the future. The risk-free interest rate was based on a U.S. Treasury instrument whose term is consistent with the expected term of the stock options.
On July 1, 2018, in connection with the Class V transaction, VMware, Inc.’s board of directors declared a $11 billion special cash dividend, paid pro-rata to VMware, Inc. stockholders on December 28, 2018 in the amount of $26.81 per outstanding share of VMware, Inc. common stock.
VMware, Inc. stock awards that were outstanding at the time of the special cash dividend were adjusted pursuant to anti-dilution provisions in VMware, Inc. equity incentive plan documents that provide for equitable adjustments to be determined by VMware’s Compensation and Corporate Governance Committee in the event of an extraordinary cash dividend. The adjustments to awards included increasing the number of outstanding restricted stock units and stock options, as well as reducing the exercise prices of outstanding stock options. The adjustments did not result in incremental stock-based compensation expense as the anti-dilutive adjustments were required by VMware, Inc.’s equity incentive plan.
VMware, Inc. Restricted Stock— The following table presents VMware, Inc.’s restricted stock activity for the periods indicated:
| | | | | | | | | | | |
| | Number of Units | | Weighted-Average Grant Date Fair Value |
| (in millions) | | (per unit) |
| Outstanding, February 2, 2018 | 17 | | | $ | 78.62 | |
| Granted | 7 | | | 146.61 | |
| Adjustment for special cash dividend (a) | 3 | | | NA |
| Vested | (7) | | | 75.45 | |
| Forfeited | (2) | | | 86.90 | |
| Outstanding, February 1, 2019 (a) | 18 | | | $ | 90.06 | |
| Granted | 9 | | | 157.07 | |
| Vested | (8) | | | 80.28 | |
| Forfeited | (2) | | | 101.29 | |
| Outstanding, January 31, 2020 | 17 | | | $ | 128.38 | |
| Granted | 11 | | | 149.63 | |
| Vested | (8) | | | 114.59 | |
| Forfeited | (2) | | | 137.55 | |
| Outstanding, January 29, 2021(b) | 18 | | | $ | 147.46 | |
____________________
(a) The weighted-average grant date fair value of outstanding RSU awards as of February 1, 2019 reflects the non-cash adjustments to the awards as a result of the special cash dividend.
(b) During the fiscal year ended January 29, 2021, 18 million units outstanding included 17 million RSUs and 1 million PSUs. The above table includes RSUs issued for outstanding unvested RSUs in connection with business combinations, including 2.2 millionRSUs issued for unvested RSUs assumed as part of the Pivotal acquisition during the fiscal year ended January 31, 2020.
The following table presents restricted stock that is expected to vest as of the date indicated:
| | | | | | | | | | | | | | | | | |
| Number of Units | | Weighted-Average Remaining Contractual Term | | Aggregate Intrinsic Value (a) |
| (in millions) | | (in years) | | (in millions) |
| Expected to vest, January 29, 2021 | 15 | | | 2.6 | | $ | 2,097 | |
____________________
(a)The aggregate intrinsic value represents the total pre-tax intrinsic values based on VMware, Inc.’s closing stock price of $137.85 on January 29, 2021 as reported on the NYSE that would have been received by the RSU holders had the RSUs been issued as of January 29, 2021.par value.
The total fair value of VMware, Inc. restricted stock awards that vested during the fiscal years ended January 29, 2021, January 31, 2020, and February 1, 2019 was $951 million, $657 million, and $556 million, respectively, and the pre-tax intrinsic value was $1,143 million, $1,414 million, and $1,061 million, respectively. As of January 29, 2021, 18 million restricted shares of VMware, Inc.’s Class A common stock were outstanding, with an aggregate intrinsic value of $2,452 million based on VMware, Inc.’s closing stock price on January 29, 2021as reported on the NYSE.
As of January 29, 2021, there was $1,830 million of unrecognized stock-based compensation expense, net of estimated forfeitures, related to these awards expected to be recognized over a weighted-average period of approximately 1.6 years.
VMware, Inc. Shares Withheld for Taxes — For the fiscal years ended January 29, 2021, January 31, 2020, and February 1, 2019, VMware, Inc. repurchased and retired or withheld 3 million shares of VMware, Inc. Class A common stock, each year; for $413 million, $521 million, and $373 million, respectively, to cover tax withholding obligations. These amounts may differ from the amounts of cash remitted for tax withholding obligations on the Consolidated Statements of Cash Flows due to the timing of payments. Pursuant to the respective award agreements, these shares were withheld in conjunction with the net share settlement upon the vesting of restricted stock and restricted stock units (including PSUs) during the period. The value of the withheld shares, including restricted stock units, was classified as a reduction to additional paid-in capital.
Other Plans
In addition to the plans disclosed2013 Plan described above, the Company has aCompany’s consolidated subsidiary, Secureworks, that maintains its own equity plan and issues equity grants settling in its own Class A common stock. The stock option and restricted stock unit activity under this plan was not material during the fiscal years ended February 3, 2023, January 28, 2022, and January 29, 2021, January 31, 2020, and February 1, 2019.2021.
DELL TECHNOLOGIES INC.
NOTE 17 — REDEEMABLE SHARES
Awards under the Company’s stock incentive plans include certain rights that allow the holder to exercise a put feature for the underlying Class A or Class C Common Stock after a six-month holding period following the issuance of such common stock. The put feature requires the Company to purchase the stock at its fair market value. Accordingly, these awards and such common stock are subject to reclassification from equity to temporary equity, and the Company determines the award amounts to be classified as temporary equity as follows:
•For stock options to purchase Class C Common Stock subject to service requirements, the intrinsic value of the option is multiplied by the portion of the option for which services have been rendered. Upon exercise of the option, the amount in temporary equity represents the fair value of the Class C Common Stock.
•For stock appreciation rights, RSUs, or RSAs, any of which stock award types are subject to service requirements, the fair value of the share is multiplied by the portion of the share for which services have been rendered.
•For share-based arrangements that are subject to the occurrence of a contingent event, those amounts are reclassified to temporary equity based on a probability assessment performed by the Company on a periodic basis. Contingent events include the achievement of performance-based metrics.
In connection with the Class V transaction described in Note 1 of the Notes to the Consolidated Financial Statements, the put feature provisions were amended to provide that the put feature will terminate upon the earlier of June 27, 2021 or the consummation of any underwritten public offering of shares of Class C Common Stock.
The following table presents the amount of redeemable shares classified as temporary equity and summarizes the award type as of the dates indicated:
| | | | | | | | | | | |
| January 29, 2021 | | January 31, 2020 |
| (in millions) |
| Redeemable shares classified as temporary equity | $ | 472 | | | $ | 629 | |
| | | |
| Issued and outstanding unrestricted common shares | 2 | | | 2 | |
| Restricted stock units | 0 | | | 1 | |
| Outstanding stock options | 6 | | | 15 | |
The decrease in the value of redeemable shares during the fiscal year ended January 29, 2021 was primarily attributable to the reduction in the number of shares eligible for put rights, offset by an increase in Class C Common Stock fair value.
NOTE 18 — RETIREMENT PLAN BENEFITS
Defined Benefit Retirement Plans
The Company sponsors retirement plans for certain employees in the United States and internationally, and some of these planswhich meet the criteria of a defined benefit retirement plan. Benefits under defined benefit retirement plans guarantee a particular payment to the employee in retirement. The amount of retirement benefit is defined by the plan and is typically a function of the number of years of service rendered by the employee and the employee’s average salary or salary at retirement. The annual costs of the plans are determined using the projected unit credit actuarial cost method that includes actuarial assumptions and estimates which are subject to change.
Net periodic benefit costs related to defined benefit retirement plans were immaterial for the fiscal years ended January 29, 2021, January 31, 2020, and February 1, 2019. The Company did not make any significant contributions to defined benefit retirement plans for the fiscal years ended January 29, 2021, January 31, 2020, and February 1, 2019, and does not expect to make any significant contributions in Fiscal 2022.
U.S. Pension Plan — The Company sponsors a noncontributory defined benefit retirement plan in the United States (the “U.S. pension plan”) which was assumed in connection with the EMC merger transaction. As of December 1999, the U.S. pension plan was frozen, so employees no longer accrue retirement benefits for future services. The measurement date for the U.S. pension plan is the end of the Company’s fiscal year. The Company did not make any significant contributions to the U.S. pension plan for the fiscal years ended February 3, 2023, January 28, 2022, and January 29, 2021, and does not expect to make any significant contributions in Fiscal 2024.
Net periodic benefit costs related to the U.S. pension plan were immaterial for the fiscal years ended February 3, 2023, January 28, 2022, and January 29, 2021.
The following table presents attributes of the U.S. pension plan as of the dates indicated:
| | | | | | | | | | | | | February 3, 2023 | | January 28, 2022 |
| | January 29, 2021 | | January 31, 2020 | | | | |
| | (in millions) | | (in millions) |
| Plan assets at fair value (a) | Plan assets at fair value (a) | $ | 572 | | | $ | 547 | | Plan assets at fair value (a) | $ | 439 | | | $ | 550 | |
| Benefit obligations | Benefit obligations | (635) | | | (588) | | Benefit obligations | (484) | | | (582) | |
| Underfunded position (b) | Underfunded position (b) | $ | (63) | | | $ | (41) | | Underfunded position (b) | $ | (45) | | | $ | (32) | |
____________________
(a) Plan assets are managed by outside investment managers. The Company’s investment strategy with respect to plan assets is to achieve a long-term growth of capital, consistent with an appropriate level of risk. Assets are recognized at fair value and are primarily classified within Level 2 of the fair value hierarchy.
(b) The underfunded position of the U.S. pension plan is recognized in other non-current liabilities in the Consolidated Statements of Financial Position.
As of January 29, 2021,February 3, 2023, future benefit payments for the U.S. pension plan are expected to be paid as follows: $33 million in Fiscal 2022; $35 million in Fiscal 2023; $36 million in Fiscal 2024; $37 million in Fiscal 2025; $37$38 million in Fiscal 2026; $38 million in Fiscal 2027; $38 million in Fiscal 2028; and $185$182 million thereafter.
DELL TECHNOLOGIES INC.
NOTES TO THE CONSOLIDATED FINANCIAL STATEMENTS (continued)
International Pension Plans — The Company also sponsors retirement plans outside of the United States which qualify as defined benefit plans. As of January 29, 2021, the aggregate fair value of plan assets for the international pension plans was $0.2 billion, the aggregate benefit obligations were $0.5 billion, and the aggregate net underfunded position was $0.3 billion. As of January 31, 2020, the aggregate fair value of plan assets for the international pension plans was $0.2 billion, the aggregate benefit obligations were $0.4 billion, and the aggregate net underfunded position was $0.2 billion. The underfunded positionfollowing table presents attributes of the international pension plans as of the dates indicated:
| | | | | | | | | | | |
| February 3, 2023 | | January 28, 2022 |
| | | |
| (in millions) |
| Plan assets at fair value (a) | $ | 221 | | | $ | 245 | |
| Benefit obligations | (423) | | | (479) | |
| Underfunded position (b) | $ | (202) | | | $ | (234) | |
____________________
(a) Plan assets are managed by outside investment managers. The Company’s investment strategy with respect to plan assets is presentedto achieve a long-term growth of capital, consistent with an appropriate level of risk. Assets are recognized at fair value and are primarily classified within Level 1 of the fair value hierarchy.
(b) The underfunded position is recognized in other non-current liabilities onin the Consolidated Statements of Financial Position as of the respective dates.Position.
Defined Contribution Retirement Plans
Dell 401(k) Plan — The Company has a defined contribution retirement plan (the “Dell 401(k) Plan”) that complies with Section 401(k) of the Internal Revenue Code. Only U.S. employees and employees of certain subsidiaries, except those who are covered by a collective bargaining agreement, classified as a leased employee or a nonresident alien, or are covered under a separate plan, are eligible to participate in the Dell 401(k) plan. Historically through May 31, 2020,Plan. Participation in the Dell 401(k) Plan is at the election of the employee. As of February 3, 2023, the Company matched 100% of each participant’s voluntary contributions (the “Dell 401(k) employer match”), subject to a maximum contribution of 6% of the participant’s eligible compensation, up to an annual limit of $7,500, and participants vest immediately in all contributions to the Dell 401(k) Plan. EffectiveOn June 1, 2020, the Company suspended the Dell 401(k) employer match for U.S. employees as a precautionary measure to preserve financial flexibility in light of COVID-19. Effective January 1, 2021, Thethe Dell 401(k) employer match was reinstated, with no change to the employer match policy or participant eligibility requirements.
The Company’s matching contributions as well as participants’ voluntary contributions are invested according to each participant’s elections in the investment options provided under the Dell 401(k) Plan. The Company’s contributions during the fiscal years ended February 3, 2023, January 28, 2022, and January 29, 2021 January 31, 2020,were $263 million, $249 million, and February 1, 2019 were $154 million, $267 million, and $254 million, respectively. The Company’s contributions decreased during the fiscal year ended January 29, 2021 due to the suspension of the Dell 401(k) employer match between June 1, 2020 and December 31, 2020, as discussed above.
VMware, Inc. and Pivotal have defined contribution programs for certain employees that comply with Section 401(k) of the Internal Revenue Code. Pivotal’s defined contribution program was acquired by VMware, Inc. in connection with VMware Inc.’s acquisition of Pivotal on December 30, 2019.
DELL TECHNOLOGIES INC.
NOTES TO THE CONSOLIDATED FINANCIAL STATEMENTS (continued)
NOTE 19 — SEGMENT INFORMATION
The Company has 3two reportable segments that are based on the following business units: Infrastructure Solutions Group (“ISG”); and Client Solutions Group (“CSG”); and VMware.
On December 30, 2019, VMware, Inc. completed its acquisition of Pivotal. Due to the Company’s ownership of a controlling interest in Pivotal, the Company and VMware, Inc. accounted for the Pivotal acquisition as a transaction by entities under common control, and consequently the transaction had no net effect to the Company’s consolidated financial statements. Pivotal now operates as a wholly-owned subsidiary of VMware, Inc. and Dell Technologies reports Pivotal results within the VMware reportable segment. Previously, Pivotal results were reported within Other businesses. Prior period results have been recast to conform with the current period presentation..
ISG enables the Company’s customers’ digital transformation ofwith solutions that address the fundamental shift to multicloud environments, machine learning, artificial intelligence, and data analytics. The Company’s customers through its trusted multi-cloud and big data solutions, which are built upon a modern data center infrastructure. The ISG comprehensive portfolio of advanced storage solutionsportfolio includes traditional storage solutions as well as next-generation storage solutions, (such asincluding all-flash arrays, scale-out file, object platforms, hyperconverged infrastructure, and software-defined solutions), while thestorage. The Company’s server portfolio includes high-performance rack, blade, tower, and hyperscaletower servers. The ISG networking portfolio helps the Company’s business customers transform and modernize their infrastructure, mobilize and enrich end-user experiences, and accelerate business applications and processes. ISG also offers attached software, peripherals, and services, including support and deployment, configuration, and extended warranty services.
CSG includes sales to commercial and consumer customers of branded hardware (such as desktops, workstations, and notebooks) and branded peripherals (such as displays, docking stations, and projectors)other electronics), as well as services and third-party software and peripherals. CSG also offers attached software, peripherals, andincludes services offerings, including support and deployment, configuration, and extended warranty services.
VMware works with customers in the areas of hybrid and multi-cloud, modern applications, networking, security, and digital workspaces, helping customers manage their IT resources across private clouds and complex multi-cloud, multi-device environments. VMware enables its customers to digitally transform their operations as they ready their applications, infrastructure, and employees for constantly evolving business needs.
The reportable segments disclosed herein are based on information reviewed by the Company’s management to evaluate the business segment results. The Company’s measure of segment revenue and segment operating income for management reporting purposes excludes operating results of Otherother businesses, unallocated corporate transactions, the impact of purchase accounting, amortization of intangible assets, transaction-related expenses, stock-based compensation expense, and other corporate expenses, as applicable. The Company does not allocate assets to the above reportable segments for internal reporting purposes.
As described in Note 1 and Note 3 of the Notes to the Consolidated Financial Statements, the Company completed the VMware Spin-off on November 1, 2021.
Pursuant to the CFA described in such Notes, Dell Technologies continues to act as a distributor of VMware’s standalone products and services and purchase such products and services for resale to end-user customers (“VMware Resale”). Dell Technologies also continues to integrate VMware’s products and services with Dell Technologies’ offerings and sell them to end users. The results of such operations are classified as continuing operations within the Company’s Consolidated Statements of Income. The results of standalone VMware Resale transactions are reflected in other businesses. The results of integrated offering transactions are reflected within CSG or ISG, depending upon the nature of the underlying offering sold. The Company's prior period segment results have been recast to reflect this change.
In accordance with applicable accounting guidance, the results of VMware, excluding Dell's resale of VMware offerings, are presented as discontinued operations in the Consolidated Statements of Income and, as such, have been excluded from both continuing operations and segment results for periods presented prior to the completion of the VMware Spin-off.
DELL TECHNOLOGIES INC.
NOTES TO THE CONSOLIDATED FINANCIAL STATEMENTS (continued)
The following table presents a reconciliation of net revenue by the Company’s reportable segments to the Company’s consolidated net revenue as well as a reconciliation of consolidated segment operating income to the Company’s consolidated operating income (loss) for the periods indicated:
| | | | | | | | | | | | | | | | | | | | | |
| | | | Fiscal Year Ended |
| | | | | | January 29, 2021 | | January 31, 2020 | | February 1, 2019 |
| | | | | | (in millions) |
| Consolidated net revenue: | | | | | | | | | |
| Infrastructure Solutions Group | | | | | $ | 32,588 | | | $ | 33,969 | | | $ | 36,720 | |
| Client Solutions Group | | | | | 48,355 | | | 45,838 | | | 43,196 | |
| VMware | | | | | 11,873 | | | 10,905 | | | 9,741 | |
| Reportable segment net revenue | | | | | 92,816 | | | 90,712 | | | 89,657 | |
| Other businesses (a) | | | | | 1,567 | | | 1,788 | | | 1,676 | |
| Unallocated transactions (b) | | | | | 6 | | | 1 | | | (9) | |
| Impact of purchase accounting (c) | | | | | (165) | | | (347) | | | (703) | |
| Total consolidated net revenue | | | | | $ | 94,224 | | | $ | 92,154 | | | $ | 90,621 | |
| | | | | | | | | |
| Consolidated operating income: | | | | | | | | | |
| Infrastructure Solutions Group | | | | | $ | 3,776 | | | $ | 4,001 | | | $ | 4,151 | |
| Client Solutions Group | | | | | 3,352 | | | 3,138 | | | 1,960 | |
| VMware | | | | | 3,571 | | | 3,081 | | | 2,926 | |
| Reportable segment operating income | | | | | 10,699 | | | 10,220 | | | 9,037 | |
| Other businesses (a) | | | | | 99 | | | (43) | | | (111) | |
| Unallocated transactions (b) | | | | | 0 | | | (29) | | | (72) | |
| Impact of purchase accounting (c) | | | | | (213) | | | (411) | | | (820) | |
| Amortization of intangibles | | | | | (3,393) | | | (4,408) | | | (6,138) | |
| Transaction-related expenses (d) | | | | | (257) | | | (285) | | | (750) | |
| Stock-based compensation expense (e) | | | | | (1,609) | | | (1,262) | | | (918) | |
| Other corporate expenses (f) | | | | | (182) | | | (1,160) | | | (419) | |
| Total consolidated operating income (loss) | | | | | $ | 5,144 | | | $ | 2,622 | | | $ | (191) | |
| | | | | | | | | | | | | | | | | | | | | |
| | | | Fiscal Year Ended |
| | | | | | February 3, 2023 | | January 28, 2022 | | January 29, 2021 |
| | | | | | | | | |
| | | | | | (in millions) |
| Consolidated net revenue: | | | | | | | | | |
| Infrastructure Solutions Group | | | | | $ | 38,356 | | | $ | 34,366 | | | $ | 33,002 | |
| Client Solutions Group | | | | | 58,213 | | | 61,464 | | | 48,387 | |
| Reportable segment net revenue | | | | | 96,569 | | | 95,830 | | | 81,389 | |
| Other businesses (a) (b) | | | | | 5,721 | | | 5,388 | | | 5,382 | |
| Unallocated transactions (c) | | | | | 11 | | | 11 | | | 5 | |
| Impact of purchase accounting (d) | | | | | — | | | (32) | | | (106) | |
| Total consolidated net revenue | | | | | $ | 102,301 | | | $ | 101,197 | | | $ | 86,670 | |
| | | | | | | | | |
| Consolidated operating income: | | | | | | | | | |
| Infrastructure Solutions Group | | | | | $ | 5,045 | | | $ | 3,736 | | | $ | 3,753 | |
| Client Solutions Group | | | | | 3,824 | | | 4,365 | | | 3,333 | |
| Reportable segment operating income | | | | | 8,869 | | | 8,101 | | | 7,086 | |
| Other businesses (a) (b) | | | | | (240) | | | (319) | | | (139) | |
| Unallocated transactions (c) | | | | | 8 | | | 3 | | | 2 | |
| Impact of purchase accounting (d) | | | | | (44) | | | (67) | | | (144) | |
| Amortization of intangibles | | | | | (970) | | | (1,641) | | | (2,133) | |
| Transaction-related expenses (e) | | | | | (22) | | | (273) | | | (124) | |
| Stock-based compensation expense (f) | | | | | (931) | | | (808) | | | (487) | |
| Other corporate expenses (g) | | | | | (899) | | | (337) | | | (376) | |
| Total consolidated operating income | | | | | $ | 5,771 | | | $ | 4,659 | | | $ | 3,685 | |
____________________
(a)Secureworks, Virtustream, and Boomi constitute Other businesses consists of (i) VMware Resale, (ii) Secureworks, and (iii) Virtustream, and do not meet the requirements for a reportable segment, either individually or collectively.
(b)The results of Other businesses are not material to the Company’s overall results. On September 1, 2020, the Company completed the sale of RSA Security.Security on September 1, 2020, and the sale of Boomi on October 1, 2021. Prior to the divestiture,divestitures, RSA Security’sSecurity and Boomi’s results were included within Otherother businesses. See Note 1 of the Notes to the Consolidated Financial Statements for more information aboutfurther details related to the divestituredivestitures of RSA Security.Security and Boomi.
(b)(c)Unallocated transactions includes other corporate items that are not allocated to Dell Technologies’ reportable segments.
(c)(d)Impact of purchase accounting includes non-cash purchase accounting adjustments that are primarily related to the EMC merger transaction.transaction that was completed in September 2016.
(d)(e)Transaction-related expenses includes acquisition, integration, and divestiture related costs, as well as the costs incurred in the Class V transactionVMware Spin-off described in Note 1 and Note 3 of the Notes to the Consolidated Financial Statements.
(e)(f)Stock-based compensation expense consists of equity awards granted based on the estimated fair value of those awards at grant date.
(f)(g)Other corporate expenses includes impairment charges, incentive charges related to equity investments, severance, facility action, payroll taxes associated with stock-based compensation, and other costs. This category also includes the derecognition of a VMware, Inc. patent litigation accrual of $237 million, which was initially recognized during the fiscal year ended January 31, 2020 and was subsequently fully reversed during the fiscal year ended January 29, 2021. See Note 10 of the Notes to the Consolidated Financial Statements for additional information about this litigation matter. For the fiscal years ended January 31, 2020 and February 1, 2019, this category includes Virtustream pre-tax impairment charges of $619 million and $190 million, respectively.
DELL TECHNOLOGIES INC.
NOTES TO THE CONSOLIDATED FINANCIAL STATEMENTS (continued)
The following table presents the disaggregation of net revenue by reportable segment, and by major product categories within the segments for the periods indicated:
| | | | | | | | | | | | | | | | | | | | Fiscal Year Ended |
| | | | Fiscal Year Ended | | | February 3, 2023 | | January 28, 2022 | | January 29, 2021 |
| | | | January 29, 2021 | | January 31, 2020 | | February 1, 2019 | | | | | | | |
| | | | (in millions) | | | (in millions) |
| Net revenue: | Net revenue: | | | | Net revenue: | | | |
| Infrastructure Solutions Group: | Infrastructure Solutions Group: | | | Infrastructure Solutions Group: | | |
| Servers and networking | Servers and networking | | $ | 16,497 | | | $ | 17,127 | | | $ | 19,953 | | Servers and networking | | $ | 20,398 | | | $ | 17,901 | | | $ | 16,592 | |
| Storage | Storage | | 16,091 | | | 16,842 | | | 16,767 | | Storage | | 17,958 | | | 16,465 | | | 16,410 | |
| Total ISG net revenue | Total ISG net revenue | | 32,588 | | | 33,969 | | | 36,720 | | Total ISG net revenue | | $ | 38,356 | | | $ | 34,366 | | | $ | 33,002 | |
| Client Solutions Group: | Client Solutions Group: | | | | | | | Client Solutions Group: | | | | | | |
| Commercial | Commercial | | 35,396 | | | 34,277 | | | 30,893 | | Commercial | | $ | 45,556 | | | $ | 45,576 | | | $ | 35,423 | |
| Consumer | Consumer | | 12,959 | | | 11,561 | | | 12,303 | | Consumer | | 12,657 | | | 15,888 | | | 12,964 | |
| Total CSG net revenue | Total CSG net revenue | | 48,355 | | | 45,838 | | | 43,196 | | Total CSG net revenue | | $ | 58,213 | | | $ | 61,464 | | | $ | 48,387 | |
| VMware: | | | |
| Total VMware net revenue | | 11,873 | | | 10,905 | | | 9,741 | | |
| Total segment net revenue | | $ | 92,816 | | | $ | 90,712 | | | $ | 89,657 | | |
The following table presents net revenue allocated between the United States and foreign countries for the periods indicated:
| | | | | | | | | | | | | | | | | | Fiscal Year Ended |
| | | Fiscal Year Ended | | February 3, 2023 | | January 28, 2022 | | January 29, 2021 |
| | | January 29, 2021 | | January 31, 2020 | | February 1, 2019 | | | | | | |
| | | (in millions) | | (in millions) |
| Net revenue: | Net revenue: | | | | | | Net revenue: | |
| United States | United States | $ | 45,671 | | | $ | 43,829 | | | $ | 42,803 | | United States | $ | 49,201 | | | $ | 46,752 | | | $ | 42,009 | |
| Foreign countries | Foreign countries | 48,553 | | | 48,325 | | | 47,818 | | Foreign countries | 53,100 | | | 54,445 | | | 44,661 | |
| Total net revenue | Total net revenue | $ | 94,224 | | | $ | 92,154 | | | $ | 90,621 | | Total net revenue | $ | 102,301 | | | $ | 101,197 | | | $ | 86,670 | |
The following table presents property, plant, and equipment, net allocated between the United States and foreign countries as of the dates indicated:
| | | | | | | | | | | | | February 3, 2023 | | January 28, 2022 |
| | January 29, 2021 | | January 31, 2020 | | | | |
| | (in millions) | | (in millions) |
| Property, plant, and equipment, net: | Property, plant, and equipment, net: | | Property, plant, and equipment, net: | |
| United States | United States | $ | 4,524 | | | $ | 4,322 | | United States | $ | 4,163 | | | $ | 3,667 | |
| Foreign countries | Foreign countries | 1,907 | | | 1,733 | | Foreign countries | 2,046 | | | 1,748 | |
| Total property, plant, and equipment, net | Total property, plant, and equipment, net | $ | 6,431 | | | $ | 6,055 | | Total property, plant, and equipment, net | $ | 6,209 | | | $ | 5,415 | |
The allocation between domestic and foreign net revenuerevenue is based on the location of the customers. Net revenue from any single foreign country did not constitute more than 10% of the Company’s consolidated net revenue for any of the fiscal years ended February 3, 2023, January 28, 2022, and January 29, 2021,2021. As of February 3, 2023 and January 31, 2020, and February 1, 2019. Property, plant, and equipment, net from any single foreign country did not constitute more than 10% of the Company’s consolidated28, 2022, property, plant, and equipment, net asprimarily related to domestic ownership. Within foreign countries, property, plant, and equipment, net of January 29, 2021 or January 31, 2020.$0.7 billion was located in Ireland.
DELL TECHNOLOGIES INC.
NOTES TO THE CONSOLIDATED FINANCIAL STATEMENTS (continued)
NOTE 20 — SUPPLEMENTAL CONSOLIDATED FINANCIAL INFORMATION
The following table presents additional information on selected asset accountsassets included in the Consolidated Statements of Financial Position as of the dates indicated:
| | | | | | | | | | | | | February 3, 2023 | | January 28, 2022 |
| | | January 29, 2021 | | January 31, 2020 | | | | |
| | | (in millions) | | (in millions) |
| Cash, cash equivalents, and restricted cash: | Cash, cash equivalents, and restricted cash: | | Cash, cash equivalents, and restricted cash: | |
| Cash and cash equivalents | Cash and cash equivalents | $ | 14,201 | | | $ | 9,302 | | Cash and cash equivalents | $ | 8,607 | | | $ | 9,477 | |
| Restricted cash - other current assets (a) | Restricted cash - other current assets (a) | 891 | | | 730 | | Restricted cash - other current assets (a) | 272 | | | 534 | |
| Restricted cash - other non-current assets (a) | Restricted cash - other non-current assets (a) | 92 | | | 119 | | Restricted cash - other non-current assets (a) | 15 | | | 71 | |
| Total cash, cash equivalents, and restricted cash | Total cash, cash equivalents, and restricted cash | $ | 15,184 | | | $ | 10,151 | | Total cash, cash equivalents, and restricted cash | $ | 8,894 | | | $ | 10,082 | |
| Inventories, net: | Inventories, net: | | | | Inventories, net: | | | |
| Production materials | Production materials | $ | 1,717 | | | $ | 1,590 | | Production materials | $ | 3,225 | | | $ | 3,653 | |
| Work-in-process | Work-in-process | 677 | | | 563 | | Work-in-process | 708 | | | 855 | |
| Finished goods | Finished goods | 1,008 | | | 1,128 | | Finished goods | 843 | | | 1,390 | |
| Total inventories, net | Total inventories, net | $ | 3,402 | | | $ | 3,281 | | Total inventories, net | $ | 4,776 | | | $ | 5,898 | |
| Prepaid expenses: | Prepaid expenses: | | | | Prepaid expenses: | | | |
| Total prepaid expenses (b) | Total prepaid expenses (b) | $ | 887 | | | $ | 885 | | Total prepaid expenses (b) | $ | 641 | | | $ | 886 | |
| Deferred Costs: | | Deferred Costs: | |
| Total deferred costs, current (b) | | Total deferred costs, current (b) | $ | 5,459 | | | $ | 4,996 | |
| Property, plant, and equipment, net: | Property, plant, and equipment, net: | | | | Property, plant, and equipment, net: | |
| Computer equipment | Computer equipment | $ | 6,506 | | | $ | 6,330 | | Computer equipment | $ | 6,899 | | | $ | 6,497 | |
| Land and buildings | Land and buildings | 4,745 | | | 4,700 | | Land and buildings | 3,059 | | | 3,095 | |
| Machinery and other equipment | Machinery and other equipment | 3,933 | | | 3,597 | | Machinery and other equipment | 3,134 | | | 2,714 | |
| Total property, plant, and equipment | Total property, plant, and equipment | 15,184 | | | 14,627 | | Total property, plant, and equipment | 13,092 | | | 12,306 | |
| Accumulated depreciation and amortization (c) | Accumulated depreciation and amortization (c) | (8,753) | | | (8,572) | | Accumulated depreciation and amortization (c) | (6,883) | | | (6,891) | |
| Total property, plant, and equipment, net | Total property, plant, and equipment, net | $ | 6,431 | | | $ | 6,055 | | Total property, plant, and equipment, net | $ | 6,209 | | | $ | 5,415 | |
| Other non-current assets: | | | | |
| Deferred and other tax assets | $ | 6,230 | | | $ | 5,960 | | |
| Operating lease ROU assets | 2,117 | | | 1,780 | | |
| Deferred Commissions | 1,094 | | | 998 | | |
| Other | 1,755 | | | 1,690 | | |
| Total other non-current assets | $ | 11,196 | | | $ | 10,428 | | |
|
____________________
(a) Restricted cash includes cash required to be held in escrow pursuant to DFS securitization arrangements and VMware, Inc. restricted cash.arrangements.
(b) PrepaidDeferred costs and prepaid expenses are included in other current assets in the Consolidated Statements of Financial Position. Amounts classified as long-term deferred costs are included in other non current assets and are not disclosed above.
(c) During the fiscal years ended February 3, 2023, January 28, 2022, and January 29, 2021, January 31, 2020, and February 1, 2019, the Company recognized $1.6$1.8 billion, $1.3$1.6 billion, and $1.3 billion, respectively, in depreciation expense. Additionally, during the fiscal years ended January 29, 2021, January 31, 2020, and February 1, 2019, the Company retired $1.4 billion, $0.8 billion, and $0.8 billion, respectively, of depreciated property, plant, and equipment.
DELL TECHNOLOGIES INC.
The following table presents additional information on selected liability accounts included in the Consolidated Statements of Financial Position as of the dates indicated:
| | | | | | | | | | | |
| | January 29, 2021 | | January 31, 2020 |
| | (in millions) |
| Accrued and other current liabilities: | | | |
| Compensation | $ | 3,818 | | | $ | 3,717 | |
| Income and other taxes | 1,621 | | | 1,767 | |
| Sales and marketing programs | 1,526 | | | 1,387 | |
| Operating lease liabilities | 436 | | | 432 | |
| Warranty liability | 356 | | | 341 | |
| Other | 1,792 | | | 2,129 | |
| Total accrued and other current liabilities | $ | 9,549 | | | $ | 9,773 | |
| Other non-current liabilities: | | | |
| Deferred and other tax liabilities | $ | 2,173 | | | $ | 3,110 | |
| Operating lease liabilities | 1,787 | | | 1,360 | |
| Warranty liability | 117 | | | 155 | |
| Other | 1,283 | | | 758 | |
| Total other non-current liabilities | $ | 5,360 | | | $ | 5,383 | |
Valuation and Qualifying Accounts
The allowance for expected credit losses of trade receivables and the allowance for financing receivables losses as of January 29, 2021 include the impacts of adoption of the new CECL standard, which was adopted as of February 1, 2020 using the modified retrospective method. The provisions recognized on the Consolidated Statements of Income (Loss) during the fiscal year ended January 29, 2021years presented are based on assessments of the impact of current and expected future economic conditions, inclusive of the effect of the COVID-19 pandemic on credit losses related to trade receivables and financing receivables.conditions. The duration and severity of COVID-19 and continued market volatility is highly uncertain and, as such, the impacts on expected credit losses for trade receivables and financing receivables are subject to significant judgment and may cause variability in the Company’s allowance for credit losses in future periods for trade receivables and financing receivables. See Note 2 of the Notes to the Consolidated Financial Statements for additional information about the new CECL standard.
The following table presents the Company’s valuation and qualifying accounts for the periods indicated:
| | | | | | | | | | | | | | | | | |
| Fiscal Year Ended |
| January 29, 2021 | | January 31, 2020 | | February 1, 2019 |
| (in millions) |
Trade Receivables — Allowance for expected credit losses: | | | | | |
| Balance at beginning of period | $ | 94 | | | $ | 85 | | | $ | 103 | |
| Adjustment for adoption of the new CECL standard (Note 2) | 27 | | | 0 | | | 0 | |
| | | | | |
| Provision charged to income statement | 45 | | | 71 | | | 77 | |
| Bad debt write-offs | (62) | | | (62) | | | (95) | |
| Balance at end of period | $ | 104 | | | $ | 94 | | | $ | 85 | |
| | | | | |
| Customer Financing Receivables — Allowance for financing receivable losses: | | | | | |
| Balance at beginning of period | $ | 149 | | | $ | 136 | | | $ | 145 | |
| Adjustment for adoption of the new CECL standard (Note 2) | 111 | | | 0 | | | 0 | |
| Charge-offs, net of recoveries (a) | (91) | | | (94) | | | (104) | |
| Provision charged to income statement | 152 | | | 107 | | | 95 | |
| Balance at end of period | $ | 321 | | | $ | 149 | | | $ | 136 | |
| | | | | |
| Tax Valuation Allowance: | | | | | |
| Balance at beginning of period | $ | 1,687 | | | $ | 1,704 | | | $ | 777 | |
| Charged to income tax provision | 80 | | | 32 | | | 927 | |
| Charged to other accounts | (58) | | | (49) | | | 0 | |
| Balance at end of period | $ | 1,709 | | | $ | 1,687 | | | $ | 1,704 | |
____________________
(a) Charge-offs for customer financing receivables includes principal and interest.
162 | | | | | | | | | | | | | | | | | |
| Fiscal Year Ended |
| February 3, 2023 | | January 28, 2022 | | January 29, 2021 |
| | | | | |
| (in millions) |
| | | | | |
| | | | | |
| | | | | |
| | | | | |
| | | | | |
| | | | | |
| | | | | |
| Customer Financing Receivables - Allowance for financing receivable losses: | | | | | |
| Balance at beginning of period | $ | 189 | | | $ | 321 | | | $ | 149 | |
| Adjustment for adoption of accounting standard | — | | | — | | | 111 | |
| Charge-offs, net of recoveries | (60) | | | (72) | | | (91) | |
| Provision charged to income statement | 72 | | | (60) | | | 152 | |
| Balance at end of period | $ | 201 | | | $ | 189 | | | $ | 321 | |
| | | | | |
| Tax Valuation Allowance: | | | | | |
| Balance at beginning of period | $ | 1,423 | | | $ | 1,297 | | | $ | 1,313 | |
| Charged to income tax provision | 84 | | | 155 | | | 41 | |
| Charged to other accounts | 28 | | | (29) | | | (57) | |
| Balance at end of period | $ | 1,535 | | | $ | 1,423 | | | $ | 1,297 | |
Warranty Liability
The following table presents changes in the Company’s liability for standard limited warranties for the periods indicated:
| | | | | | | | | | | | | | | | | | | | Fiscal Year Ended |
| | | Fiscal Year Ended | | | February 3, 2023 | | January 28, 2022 | | January 29, 2021 |
| | | | January 29, 2021 | | January 31, 2020 | | February 1, 2019 | | | | | | | |
| | | (in millions) | | | (in millions) |
| Warranty liability: | Warranty liability: | | | Warranty liability: | | |
| Warranty liability at beginning of period | Warranty liability at beginning of period | | $ | 496 | | | $ | 524 | | | $ | 539 | | Warranty liability at beginning of period | | $ | 480 | | | $ | 473 | | | $ | 496 | |
| Costs accrued for new warranty contracts and changes in estimates for pre-existing warranties (a) (b) | | 782 | | | 853 | | | 856 | | |
| Costs accrued for new warranty contracts and changes in estimates for pre-existing warranties (a) | | Costs accrued for new warranty contracts and changes in estimates for pre-existing warranties (a) | | 956 | | | 957 | | | 782 | |
| Service obligations honored | Service obligations honored | | (805) | | | (882) | | | (871) | | Service obligations honored | | (969) | | | (950) | | | (805) | |
| Warranty liability at end of period | Warranty liability at end of period | | $ | 473 | | | $ | 496 | | | $ | 524 | | Warranty liability at end of period | | $ | 467 | | | $ | 480 | | | $ | 473 | |
| Current portion | Current portion | | $ | 356 | | | $ | 341 | | | $ | 355 | | Current portion | | $ | 324 | | | $ | 353 | | | $ | 356 | |
| Non-current portion | Non-current portion | | $ | 117 | | | $ | 155 | | | $ | 169 | | Non-current portion | | $ | 143 | | | $ | 127 | | | $ | 117 | |
____________________
(a)Changes in cost estimates related to pre-existing warranties are aggregated with accruals for new standard warranty contracts. The Company’s warranty liability process does not differentiate between estimates made for pre-existing warranties and those made for new warranty obligations.
(b)
Includes the impact of foreign currency exchange rate fluctuations.
145
DELL TECHNOLOGIES INC.
NOTES TO THE CONSOLIDATED FINANCIAL STATEMENTS (continued)
Severance Charges
The Company incurs costs related to employee severance and records a liability for these costs when it is probable that employees will be entitled to termination benefits and the amounts can be reasonably estimated. The liability related to these actions is included in accrued and other current liabilities in the Consolidated Statements of Financial Position.
On February 6, 2023, subsequent to close of the fiscal year ended February 3, 2023, the Company announced to its employees reorganizations and actions to align its investments more closely with its previously discussed strategic and customer priorities. These actions will reduce the Company’s workforce by approximately 5% as the Company continues to take prudent steps in light of a challenging global economic environment. The Company recognized $367 million of expense associated with these actions in the fourth quarter of the fiscal year ended February 3, 2023.
The following table presents the activity related to the Company’s severance liability for the periods indicated:
| | | | | | | | | | | | | | | | | | | | | |
| | | Fiscal Year Ended |
| | | | | | January 29, 2021 | | January 31, 2020 | | February 1, 2019 |
| | | | | (in millions) |
| Severance liability: | | | | | | | | | |
| Severance liability at beginning of period | | | | | $ | 196 | | | $ | 146 | | | $ | 175 | |
| Severance charges to provision | | | | | 452 | | | 266 | | | 215 | |
| Cash paid and other (a) | | | | | (510) | | | (216) | | | (244) | |
| Severance liability at end of period | | | | | $ | 138 | | | $ | 196 | | | $ | 146 | |
____________________
(a) Other adjustments include the impact of foreign currency exchange rate fluctuations. | | | | | | | | | | | | | | | | | | | | | |
| | | Fiscal Year Ended |
| | | | | | February 3, 2023 | | January 28, 2022 | | January 29, 2021 |
| | | | | | | | | |
| | | | | (in millions) |
| Severance liability: | | | | | | | | | |
| Severance liability at beginning of period | | | | | $ | 74 | | | $ | 109 | | | $ | 117 | |
| Severance charges | | | | | 527 | | | 134 | | | 368 | |
| Cash paid and other | | | | | (193) | | | (169) | | | (376) | |
| Severance liability at end of period | | | | | $ | 408 | | | $ | 74 | | | $ | 109 | |
The following table presents severance charges as included in the Consolidated Statements of Income (Loss) for the periods indicated:
| | | | | | | | | | | | | | | | | | Fiscal Year Ended |
| | Fiscal Year Ended | | February 3, 2023 | | January 28, 2022 | | January 29, 2021 |
| | January 29, 2021 | | January 31, 2020 | | February 1, 2019 | | | | | | |
| | (in millions) | | (in millions) |
| Severance charges: | Severance charges: | | Severance charges: | |
| Cost of net revenue | Cost of net revenue | $ | 68 | | | $ | 37 | | | $ | 17 | | Cost of net revenue | $ | 108 | | | $ | 29 | | | $ | 58 | |
| Selling, general, and administrative | Selling, general, and administrative | 313 | | | 177 | | | 146 | | Selling, general, and administrative | 363 | | | 98 | | | 262 | |
| Research and development | Research and development | 71 | | | 52 | | | 52 | | Research and development | 56 | | | 7 | | | 48 | |
| Total severance charges | Total severance charges | $ | 452 | | | $ | 266 | | | $ | 215 | | Total severance charges | $ | 527 | | | $ | 134 | | | $ | 368 | |
DELL TECHNOLOGIES INC.
NOTES TO THE CONSOLIDATED FINANCIAL STATEMENTS (continued)
Interest and other, net
The following table presents information regarding interest and other, net for the periods indicated:
| | | | | | | | | | | | | | | | | |
| Fiscal Year Ended |
| January 29, 2021 | | January 31, 2020 | | February 1, 2019 |
| (in millions) |
| Interest and other, net: | | | | | |
| Investment income, primarily interest | $ | 54 | | | $ | 160 | | | $ | 313 | |
| Gain on strategic investments, net (a) | 582 | | | 194 | | | 342 | |
| Interest expense | (2,389) | | | (2,675) | | | (2,488) | |
| Foreign exchange | (127) | | | (162) | | | (206) | |
| Other (b) | 406 | | | (143) | | | (131) | |
| Total interest and other, net | $ | (1,474) | | | $ | (2,626) | | | $ | (2,170) | |
____________________
(a) Gain on strategic investments, net includes a $396 million net gain on the fair value adjustment of one of the Company’s strategic investments during the fiscal year ended January 29, 2021.
(b) Other includes a pre-tax gain of $338 million on the sale of RSA Security and a gain of $120 million recognized from the sale of certain intellectual property assets during the fiscal year ended January 29, 2021. | | | | | | | | | | | | | | | | | | | | | |
| | | Fiscal Year Ended |
| | | | | February 3, 2023 | | January 28, 2022 | | January 29, 2021 |
| | | | | | | | | |
| | | | | (in millions) |
| Interest and other, net: | | | | | | | | | |
| Investment income, primarily interest | | | | | $ | 100 | | | $ | 42 | | | $ | 47 | |
| Gain (loss) on investments, net | | | | | (206) | | | 569 | | | 425 | |
| Interest expense | | | | | (1,222) | | | (1,542) | | | (2,052) | |
| Foreign exchange | | | | | (265) | | | (221) | | | (160) | |
| Gain on disposition of businesses and assets | | | | | — | | | 3,968 | | | 458 | |
| Debt extinguishment fees | | | | | — | | | (1,572) | | | (158) | |
| Legal settlement, net | | | | | (894) | | | — | | | — | |
| Other | | | | | (59) | | | 20 | | | 101 | |
| Total interest and other, net | | | | | $ | (2,546) | | | $ | 1,264 | | | $ | (1,339) | |
DELL TECHNOLOGIES INC.
NOTE 21 —CONDENSEDNOTES TO THE CONSOLIDATED FINANCIAL INFORMATION OF PARENT COMPANY
Dell Technologies Inc. has no material assets or standalone operations other than its ownership in its consolidated subsidiaries. There are restrictions under credit agreements and indentures governing the First Lien Notes and the Senior Notes, described in Note 6 of the Notes to the Consolidated Financial Statements, on the Company’s ability to obtain funds from any of its subsidiaries through dividends, loans, or advances. As of January 29, 2021, the Company had certain consolidated subsidiaries that were designated as unrestricted subsidiaries for all purposes of the applicable credit agreements and such indentures. As of January 29, 2021, substantially all of the net assets of the Company’s consolidated subsidiaries were restricted, with the exception of the Company’s unrestricted subsidiaries, primarily VMware, Inc., Secureworks, and their respective subsidiaries. Accordingly, this condensed financial information is presented on a “Parent-only” basis. Under a Parent-only presentation, Dell Technologies Inc.’s investments in its consolidated subsidiaries are presented under the equity method of accounting.
The following table presents the financial position of Dell Technologies Inc. (Parent) as of the dates indicated:
| | | | | | | | | | | |
| January 29, 2021 | | January 31, 2020 |
| (in millions) |
| Assets: | | | |
| Cash and cash equivalents | $ | 1 | | | $ | 0 | |
| | | |
| Investments in subsidiaries | 2,950 | | | 0 | |
| | | |
| Total assets | $ | 2,951 | | | $ | 0 | |
| Liabilities: | | | |
| Short-term debt | $ | 0 | | | $ | 0 | |
| | | |
| | | |
| Guarantees of subsidiary obligations (a) | 0 | | | 945 | |
| Total liabilities | 0 | | | 945 | |
| Redeemable shares | 472 | | | 629 | |
| Stockholders’ equity (deficit): | | | |
| Common stock and capital in excess of $0.01 par value | 16,849 | | | 16,091 | |
| Treasury stock at cost | (305) | | | (65) | |
| Accumulated deficit | (13,751) | | | (16,891) | |
| Accumulated other comprehensive income (loss) | (314) | | | (709) | |
| Total stockholders’ equity (deficit) | 2,479 | | | (1,574) | |
| Total liabilities, redeemable shares, and stockholders’ equity (deficit) | $ | 2,951 | | | $ | 0 | |
____________________
(a) Guarantees of subsidiary obligations represents the capital Dell Technologies Inc. received in excess of the carrying amount of its investments in subsidiaries.
The following table presents a reconciliation of the equity in net income (loss) of subsidiaries to the net income (loss) attributable to Dell Technologies Inc., and a reconciliation of consolidated net income (loss) to comprehensive net income (loss) attributable to Dell Technologies Inc. for the periods indicated:
| | | | | | | | | | | | | | | | | |
| Fiscal Year Ended |
| January 29, 2021 | | January 31, 2020 | | February 1, 2019 |
| (in millions) |
| Equity in net income (loss) of subsidiaries attributable to Dell Technologies Inc. | $ | 3,267 | | | $ | 4,643 | | | $ | (2,042) | |
| | | | | |
| Parent - Total operating expense (a) | (16) | | | (21) | | | (273) | |
| Parent - Interest and other, net | 0 | | | 0 | | | (20) | |
| Parent - Income tax (expense) benefit (a) | (1) | | | (6) | | | 25 | |
| Parent - Loss before equity in net income of subsidiaries | $ | (17) | | | $ | (27) | | | $ | (268) | |
| | | | | |
| Consolidated net income (loss) attributable to Dell Technologies Inc. | 3,250 | | | 4,616 | | | (2,310) | |
| Other comprehensive income (loss) of subsidiaries attributable to Dell Technologies Inc. | 395 | | | (242) | | | (539) | |
| Comprehensive income (loss) attributable to Dell Technologies Inc. | $ | 3,645 | | | $ | 4,374 | | | $ | (2,849) | |
____________________
(a) During the fiscal years ended January 29, 2021, January 31, 2020, and February 1, 2019, the total operating expense and the associated income tax (expense) benefit were primarily related to the costs incurred in the Class V transaction described in Note 1 of the Notes to the Consolidated Financial Statements.
The following table presents the cash flows of Dell Technologies Inc. (Parent) for the periods indicated:
| | | | | | | | | | | | | | | | | |
| Fiscal Year Ended |
| January 29, 2021 | | January 31, 2020 | | February 1, 2019 |
| (in millions) |
| Change in cash from operating activities | $ | (16) | | | $ | (21) | | | $ | (274) | |
| | | | | |
| Cash flows from investing activities: | | | | | |
| Transfer (to)/from subsidiary | 79 | | | (308) | | | 14,360 | |
| Change in cash from investing activities | 79 | | | (308) | | | 14,360 | |
| | | | | |
| Cash flows from financing activities: | | | | | |
| | | | | |
| Proceeds from the issuance of common stock | 179 | | | 350 | | | 2 | |
| | | | | |
| Repurchases of parent common stock | (241) | | | (8) | | | (14,075) | |
| Repayments of debt | 0 | | | (13) | | | (13) | |
| | | | | |
| Change in cash from financing activities | (62) | | | 329 | | | (14,086) | |
| Change in cash, cash equivalents, and restricted cash | 1 | | | 0 | | | 0 | |
| Cash, cash equivalents, and restricted cash at beginning of the period | 0 | | | 0 | | | 0 | |
| Cash, cash equivalents, and restricted cash at end of the period | $ | 1 | | | $ | 0 | | | $ | 0 | |
NOTE 2221 — RELATED PARTY TRANSACTIONS
VMware is considered to be a related party of the Company as a result of Michael Dell’s ownership interests in both Dell Technologies is a large global organization that engages in millions of purchase, sales, and other transactions during the fiscal year. The Company enters into purchase and sales transactions with other publicly-traded and privately-held companies,VMware as well as not-for-profit organizations, that could be influenced by membersMr. Dell’s continued service as Chairman and Chief Executive Officer of Dell Technologies and as Chairman of the Company’s boardBoard of directors or the Company’s executive officers. The Company enters into these arrangements in the ordinary course of its business. Transactions with related parties were immaterial for the fiscal years ended January 29, 2021, January 31, 2020, and February 1, 2019.
NOTE 23 — SUBSEQUENT EVENTS
Debt Repayments — Subsequent to January 29, 2021, the Company repaid $400 million principal amount of the 4.625% Unsecured Notes due April 2021 and $600 million principal amount of the 5.875% Senior Notes due June 2021.
Senior Secured Credit Facilities — On February 18, 2021, the Company entered into an eighth refinancing amendment to the credit agreement for the Senior Secured Credit Facilities to refinance the existing term B loans (the “Original Term B Loans”) with a new term loan B facility consisting of an aggregate principal amount of $3,143 million refinancing term B-2 loans (the “Refinancing Term B-2 Loans”) maturing on September 19, 2025. Proceeds from the Refinancing Term B-2 Loans, together with other funds available to the borrowers, were used to repay in full the Original Term B Loans and all accrued and unpaid fees in respect thereof.
Except for a change in the interest rate, the Refinancing Term B-2 Loans have substantially the same terms as the Original Term B Loans under the sixth refinancing amendment to the Senior Secured Credit Agreement. Amortization payments on the Refinancing Term B-2 Loans are equal to 0.25% of the aggregate principal amount of Refinancing Term B-2 Loans outstanding on the effective date of the eighth refinancing amendment, payable at the end of each fiscal quarter, commencing with the fiscal quarter ending April 30, 2021. The Refinancing Term B-2 Loans will bear interest at LIBOR plus an applicable margin of 1.75% or a base rate plus an applicable margin of 0.75%.
VMware, Inc. See Note 61 and Note 3 of the Notes to the Consolidated Financial Statements for more information about the Company’s Senior Secured Credit Facilities.VMware Spin-off.
The information provided below includes a summary of transactions with VMware. Transactions with related parties other than VMware during the periods presented were immaterial, individually and in aggregate.
Transactions with VMware
Dell Technologies and VMware engage in the following ongoing related party transactions:
•Pursuant to original equipment manufacturer and reseller arrangements, Dell Technologies integrates or bundles VMware’s products and services with Dell Technologies’ products and sells them to end-users. Dell Technologies also acts as a distributor, purchasing VMware’s standalone products and services for resale to end-user customers. Where applicable, costs under these arrangements are presented net of rebates received by Dell Technologies.
•Dell Technologies procures products and services from VMware for its internal use. For the fiscal years ended February 3, 2023, January 28, 2022, and January 29, 2021, costs incurred associated with products and services purchased from VMware for internal use were immaterial.
•Dell Technologies sells and leases products and sells services to VMware. For the fiscal years ended February 3, 2023, January 28, 2022, and January 29, 2021, revenue recognized from sales of services to VMware was immaterial.
•DFS provides financing to certain VMware end-users. Upon acceptance of the financing arrangement by both VMware’s end-users and DFS, DFS recognizes amounts due to related parties on the Consolidated Statements of Financial Position. Associated financing fees are recorded to product net revenue on the Consolidated Statements of Income and are reflected within sales and leases of products to VMware in the table below.
•Dell Technologies and VMware also enter into joint marketing, sales, and branding arrangements, for which both parties may incur costs. For the fiscal years ended February 3, 2023, January 28, 2022, and January 29, 2021, consideration received from VMware for joint marketing, sales, and branding arrangements was immaterial.
•Dell Technologies and VMware entered into a transition services agreement in connection with the VMware Spin-off to provide various support services, including investment advisory services, certain support services from Dell Technologies personnel, and other transitional services. Costs associated with this agreement were immaterial for the fiscal years ended February 3, 2023 and January 28, 2022. Activities under the agreement concluded during the fiscal year ended February 3, 2023.
•Prior to the completion of the VMware Spin-off, Dell Technologies provided support services and support from Dell Technologies personnel to VMware in certain geographic regions where VMware did not have an established legal entity. These employees were managed by VMware, but Dell Technologies incurred the costs for these such services. The costs incurred by Dell Technologies on VMware’s behalf to these employees were charged to VMware. For the fiscal years ended January 28, 2022 and January 29, 2021, costs associated with such seconded employees were immaterial. Remaining activity related to seconded employees occurring after the completion of the VMware Spin-off was governed by the transition services agreement discussed above.
DELL TECHNOLOGIES INC.
NOTES TO THE CONSOLIDATED FINANCIAL STATEMENTS (continued)
The following table presents information about the impact of Dell Technologies’ related party transactions with VMware on the Consolidated Statements of Income for the periods indicated:
| | | | | | | | | | | | | | | | | | | | | | | | | | | |
| | | | | Fiscal Year Ended |
| Classification | | | | | | February 3, 2023 | | January 28, 2022 | | January 29, 2021 |
| | | | | | | | | | | |
| | | | | | | (in millions) |
| Sales and leases of products to VMware | Net revenue - products | | | | | | $ | 154 | | | $ | 188 | | | $ | 166 | |
| Purchase of VMware products for resale | Cost of net revenue - products | | | | | | $ | 1,634 | | | $ | 1,577 | | | $ | 1,493 | |
| Purchase of VMware services for resale | Cost of net revenue - services | | | | | | $ | 3,065 | | | $ | 2,487 | | | $ | 1,848 | |
The following table presents information about the impact of Dell Technologies’ related party transactions with VMware on the Consolidated Statements of Financial Position as of the dates indicated:
| | | | | | | | | | | | | | | | | |
| Classification | | February 3, 2023 | | January 28, 2022 |
| | | | | |
| | | (in millions) |
| Deferred costs related to VMware products and services for resale | Other current assets | | $ | 3,000 | | | $ | 2,571 | |
| Deferred costs related to VMware products and services for resale | Other non-current assets | | $ | 2,537 | | | $ | 2,311 | |
Due To/From Related Party
The following table presents amounts due to and from VMware as of the dates indicated:
| | | | | | | | | | | |
| February 3, 2023 | | January 28, 2022 |
| | | |
| (in millions) |
| Due from related party, net, current (a) | $ | 378 | | | $ | 131 | |
| Due from related party, net, non-current (b) | $ | 440 | | | $ | 710 | |
| Due to related party, current (c) | $ | 2,067 | | | $ | 1,414 | |
____________________
(a) Amounts due from related party, net, current consists of amounts due from VMware, inclusive of current net tax receivables from VMware under the Tax Agreements described below. Amounts, excluding tax, are generally settled in cash within 60 days of each quarter-end.
(b) Amounts due from related party, net, non-current consists of non-current portion of net receivables from VMware under the Tax Agreements.
(c) Amounts due to related party, current includes amounts due to VMware, which are generally settled in cash within 60 days of each quarter-end.
Related Party Tax Matters
Tax Agreements — In connection with the VMware Spin-off and concurrently with the execution of the Separation and Distribution Agreement, effective as of April 14, 2021, Dell Technologies and VMware entered into a Tax Matters Agreement (the “Tax Matters Agreement”) and agreed to terminate the tax sharing agreement as amended on December 30, 2019 (together with the Tax Matters Agreement, the “Tax Agreements”). The Tax Matters Agreement governs Dell Technologies’ and VMware’s respective rights and obligations, both for pre-spin-off periods and post-spin-off periods, regarding income and other taxes, and related matters, including tax liabilities and benefits, attributes, and returns.
The timing of the tax payments due to and from related parties is governed by the Tax Agreements. VMware’s portion of the mandatory one-time transition tax on accumulated earnings of foreign subsidiaries (the “Transition Tax”) is governed by a letter agreement between VMware and Dell Technologies entered into on April 1, 2019.
DELL TECHNOLOGIES INC.
NOTES TO THE CONSOLIDATED FINANCIAL STATEMENTS (continued)
Net receipts from VMware pursuant to the Tax Agreements were immaterial during the fiscal years ended February 3, 2023 and January 28, 2022, and $307 million during the fiscal year ended January 29, 2021, and primarily related to VMware’s portion of the Transition Tax, federal income taxes on Dell Technologies’ consolidated tax return, and state tax payments for combined states.
As a result of the activity under the Tax Agreements with VMware, amounts due from VMware were $599 million and $621 million as of February 3, 2023 and January 28, 2022, respectively, primarily related to VMware’s estimated tax obligation resulting from the Transition Tax. The 2017 Tax Cuts and Jobs Act included a deferral election for an eight-year installment payment method on the Transition Tax. Dell Technologies expects VMware to pay the remainder of its Transition Tax over a period of three years.
Indemnification — Upon consummation of the VMware Spin-off, Dell Technologies recorded net income tax indemnification receivables from VMware related to certain income tax liabilities for which Dell Technologies is jointly and severally liable, but for which it is indemnified by VMware under the Tax Matters Agreement. The amounts that VMware may be obligated to pay Dell Technologies could vary depending on the outcome of certain unresolved tax matters, which may not be resolved for several years. The net receivable as of February 3, 2023 and January 28, 2022 was $146 million and $144 million, respectively.
DELL TECHNOLOGIES INC.
NOTES TO THE CONSOLIDATED FINANCIAL STATEMENTS (continued)
NOTE 22 — GOVERNMENT ASSISTANCE
The Company receives government assistance in the form of grants and incentives which vary in size, duration, and conditions from various domestic and international governing bodies and related entities. For government assistance in which no specific US GAAP applies, the Company accounts for such transactions as a gain contingency and by analogy to a grant model. Under such model, the Company recognizes the impact of the government assistance on the Consolidated Statements of Income upon reaching reasonable assurance that the Company will comply with the conditions of the assistance and that the grant will be received. The Company classifies the impact of government assistance on the Consolidated Statements of Income based on the underlying nature and purpose of the assistance.
During the fiscal year ended February 3, 2023, government assistance received primarily consisted of the following:
The Company received assistance from foreign governmental entities designed, in part, to promote competitive pricing by providing companies with an offset to local sales taxes incurred on the sales of products to customers. The assistance received is broadly available to companies. To qualify for this assistance, companies are required to invest a portion of local revenue, derived from goods manufactured locally, into research and development activities. The incentives in place are currently set to expire at various dates through 2029. Such expirations could be impacted by future legislation. During the fiscal year ended February 3, 2023, the Company recognized $297 million within net revenue on the Consolidated Statements of Income related to such assistance.
The Company received incentives from foreign governmental entities to provide reimbursement for various costs incurred that are directly tied to the production or delivery of offerings sold to customers. The agreements governing such assistance require that the Company comply with certain conditions including, but not limited to, the achievement of future operational targets. These agreements currently expire at various dates through 2029. During the fiscal year ended February 3, 2023, the Company recognized a benefit of $318 million to cost of net revenue on the Consolidated Statements of Income related to such assistance.
DELL TECHNOLOGIES INC.
NOTES TO THE CONSOLIDATED FINANCIAL STATEMENTS (continued)
NOTE 23 — SUBSEQUENT EVENTS
There were no known events occurring after February 3, 2023 and up until the date of issuance of this report that would materially affect the information presented herein.
ITEM 9 — CHANGES IN AND DISAGREEMENTS WITH ACCOUNTANTS ON ACCOUNTING AND FINANCIAL DISCLOSURE
None.
ITEM 9A — CONTROLS AND PROCEDURES
This report includes the certifications of our Chief Executive Officer and Chief Financial Officer required by Rule 13a-14 under the Securities Exchange Act of 1934 (the “Exchange Act”). See Exhibits 31.1 and 31.2 filed with this report. This Item 9A includes information concerning the controls and control evaluations referred to in those certifications.
Evaluation of Disclosure Controls and Procedures
Disclosure controls and procedures (as defined in Rules 13a-15(e) and 15d-15(e) under the Exchange Act) are designed to provide reasonable assurance that information required to be disclosed in reports filed or submitted under the Exchange Act is recorded, processed, summarized, and reported within the time periods specified in SEC rules and forms and that such information is accumulated and communicated to management, including the Chief Executive Officer and the Chief Financial Officer, as appropriate to allow timely decisions regarding required disclosures.
In connection with the preparation of this report, our management, under the supervision and with the participation of our Chief Executive Officer and Chief Financial Officer, conducted an evaluation of the effectiveness of the design and operation of our disclosure controls and procedures as of January 29, 2021.February 3, 2023. Based on that evaluation, our Chief Executive Officer and Chief Financial Officer have concluded that our disclosure controls and procedures were effective at the reasonable assurance level as of January 29, 2021.February 3, 2023.
Management’s Annual Report on Internal Control Over Financial Reporting
Management, under the supervision of the Chief Executive Officer and the Chief Financial Officer, is responsible for establishing and maintaining adequate internal control over financial reporting. Internal control over financial reporting (as defined in Rules 13a-15(f) and 15d(f) under the Exchange Act) is a process designed to provide reasonable assurance regarding the reliability of financial reporting and the preparation of financial statements for external purposes in accordance with generally accepted accounting principles. Internal control over financial reporting includes those policies and procedures which (a) pertain to the maintenance of records that, in reasonable detail, accurately and fairly reflect the transactions and dispositions of assets, (b) provide reasonable assurance that transactions are recorded as necessary to permit preparation of financial statements in accordance with generally accepted accounting principles, (c) provide reasonable assurance that receipts and expenditures are being made only in accordance with appropriate authorization of management and the board of directors, and (d) provide reasonable assurance regarding prevention or timely detection of unauthorized acquisition, use, or disposition of assets that could have a material effect on the financial statements.
In connection with the preparation of this report, our management, under the supervision and with the participation of our Chief Executive Officer and Chief Financial Officer, conducted an evaluation of the effectiveness of our internal control over financial reporting as of January 29, 2021,February 3, 2023, based on the criteria established in Internal Control — Integrated Framework (2013) issued by the Committee of Sponsoring Organizations of the Treadway Commission. As a result of that evaluation, management has concluded that our internal control over financial reporting was effective as of January 29, 2021.February 3, 2023.
The effectiveness of our internal control over financial reporting as of January 29, 2021February 3, 2023 has been audited by PricewaterhouseCoopers LLP, our independent registered public accounting firm, as stated in their report, which is included in “Item 8 — Financial Statements and Supplementary Data.”
Changes in Internal Control Over Financial Reporting
There were no changes in our internal control over financial reporting during the fiscal quarter ended January 29, 2021February 3, 2023 that have materially affected, or are reasonably likely to materially affect, our internal control over financial reporting.
We have not experienced any material impact to our internal control over financial reporting. Most of our employees are working remotely for their health and safety during the COVID-19 pandemic. We are continually monitoring and assessing the potential impact of COVID-19 on our internal controls to minimize the impact on their design and operating effectiveness.
Limitations on the Effectiveness of Controls
Our system of controls is designed to provide reasonable, not absolute, assurance regarding the reliability and integrity of accounting and financial reporting. Management does not expect that our disclosure controls and procedures or our internal control over financial reporting will prevent or detect all errors and all fraud. A control system, no matter how well designed and operated, can provide only reasonable, not absolute, assurance that the objectives of the control system will be met. These inherent limitations include the following:
•Judgments in decision-making can be faulty, and control and process breakdowns can occur because of simple errors or mistakes.
•Controls can be circumvented by individuals, acting alone or in collusion with each other, or by management override.
•The design of any system of controls is based in part on certain assumptions about the likelihood of future events, and there can be no assurance that any design will succeed in achieving its stated goals under all potential future conditions.
•Over time, controls may become inadequate because of changes in conditions or deterioration in the degree of compliance with associated policies or procedures.
•The design of a control system must reflect the fact that resources are constrained, and the benefits of controls must be considered relative to their costs.
ITEM 9B — OTHER INFORMATION
None.
ITEM 9C — DISCLOSURE REGARDING FOREIGN JURISDICTIONS THAT PREVENT INSPECTIONS
Not applicable.
PART III
ITEM 10 — DIRECTORS, EXECUTIVE OFFICERS, AND CORPORATE GOVERNANCE
We have adopted a code of ethics applicable to our principal executive officer and our other senior financial officers. The code of ethics, which we refer to as our Code of Ethics for Senior Financial Officers, is available on the Investor Relations page of our website at www.delltechnologies.com. To the extent required by SEC rules, we intend to disclose any amendments to this code and any waiver of a provision of the code for the benefit of any senior financial officers on our website within any period that may be required under SEC rules from time to time.
See “Part I — Item 1 — Business — Information about our Executive Officers” for more information about our executive officers, which is incorporated by reference in this Item 10. Other information required by this Item 10 is incorporated herein by reference to our definitive proxy statement for our 20212023 annual meeting of stockholders, referred to as the “2021“2023 proxy statement,” which we will file with the SEC on or before 120 days after our 20212023 fiscal year-end, and which will appear in the 20212023 proxy statement under the captions “Proposal 1 — Election of Directors” and “Additional Information — Delinquent Section 16(a) Reports.Reports,” if applicable.
The following information about the members of our boardBoard of directorsDirectors and the principal occupation or employment of each director is provided as of the date of this report.
| | | | | |
Michael S. Dell Chairman and Chief Executive Officer Dell Technologies Inc. | Lynn Vojvodich Radakovich Public Company Director |
| |
David W. Dorman Founding Partner Centerview Capital Technology (investments) | Ellen J. Kullman Public Company Director |
| |
Egon Durban Co-CEO Silver Lake Partners (private equity) | Simon Patterson Managing Director Silver Lake Partners (private equity) |
| |
William D. Green Public Company Director
| David Grain
Founder and CEO
Grain Management
(private equity) |
ITEM 11 — EXECUTIVE COMPENSATION
Information required by this Item 11 is incorporated herein by reference to the 20212023 proxy statement, including the information in the 20212023 proxy statement appearing under the captions “Proposal 1 — Election of Directors — Director Compensation” and “Compensation of Executive Officers.”
ITEM 12 — SECURITY OWNERSHIP OF CERTAIN BENEFICIAL OWNERS AND MANAGEMENT AND RELATED STOCKHOLDER MATTERS
Information required by this Item 12 is incorporated herein by reference to the 20212023 proxy statement, including the information in the 20212023 proxy statement appearing under the captions “Equity Compensation Plan Information” and “Security Ownership of Certain Beneficial Owners and Management.”
ITEM 13 — CERTAIN RELATIONSHIPS AND RELATED TRANSACTIONS, AND DIRECTOR INDEPENDENCE
Information required by this Item 13 is incorporated herein by reference to the 20212023 proxy statement, including the information in the 20212023 proxy statement appearing under the captions “Proposal 1 — Elections of Directors” and “Additional Information — Certain Relationships and“Transactions with Related Transactions.Persons.”
ITEM 14 — PRINCIPAL ACCOUNTINGACCOUNTANT FEES AND SERVICES
Information required by this Item 14 is incorporated herein by reference to the 20212023 proxy statement, including the information in the 20212023 proxy statement appearing under the caption “Proposal 2 — Ratification of Appointment of Independent Registered Public Accounting Firm.”
PART IV
ITEM 15 — EXHIBIT AND FINANCIAL STATEMENT SCHEDULES
The following documents are filed as a part of this Annual Report on Form 10-K:
(1)Financial StatementsStatements:: The following financial statements are filed as part of this report under “Part II — Item 8 — Financial Statements and Supplementary Data”:
Consolidated Financial Statements:
Report of Independent Registered Public Accounting Firm
Consolidated Statements of Financial Position at January 29, 2021February 3, 2023 and January 31, 202028, 2022
Consolidated Statements of Income (Loss) for the fiscal years ended February 3, 2023, January 28, 2022, and January 29, 2021 January 31, 2020, and February 1, 2019
Consolidated Statements of Comprehensive Income (Loss) for the fiscal years ended February 3, 2023, January 28, 2022, and January 29, 2021 January 31, 2020, and February 1, 2019
Consolidated Statements of Cash Flows for the fiscal years ended February 3, 2023, January 28, 2022, and January 29, 2021 January 31, 2020, and February 1, 2019
Consolidated Statements of Stockholders’ Equity (Deficit) for the fiscal years ended February 3, 2023, January 28, 2022, and January 29, 2021 January 31, 2020, and February 1, 2019
Notes to Consolidated Financial Statements
(2)Financial Statement SchedulesSchedules: : The information required in the following financial statement schedules is included in Note 20 and Note 21 of the Notes to the Consolidated Financial Statements under “Part II — Item 8 — Financial Statements and Supplementary Data”:
Schedule I — Condensed Financial Information of Parent Company
Schedule II — Valuation and Qualifying Accounts
All other schedules have been omitted because they are not applicable or the required information is otherwise included in the Consolidated Financial Statements or Notes thereto.
Exhibits:Exhibits:
| | | | | | | | |
| | |
| | |
| | |
| | |
| | |
| | |
| | |
| | |
| | |
| | |
| | |
| | |
| | 2019 Notes Supplemental Indenture No. 2, 2021 Notes Supplemental Indenture No. 2, 2023 Notes Supplemental Indenture No. 2, 2026 Notes Supplemental Indenture No. 2, 2036 Notes Supplemental Indenture No. 2 and 2046 Notes Supplemental Indenture No. 2, dated as of September 7, 2016, by and among Dell International L.L.C., EMC Corporation, New Dell International LLC and The Bank of New York Mellon Trust Company, N.A., as trustee and collateral agent (incorporated by reference to Exhibit 4.2 to the Company’s Current Report on Form 8-K filed with the Commission on September 9, 2016) (Commission File No. 001-37867). |
| | | | | | | | |
| | 2019 Notes Supplemental Indenture No. 3, 2021 Notes Supplemental Indenture No. 3, 2023 Notes Supplemental Indenture No. 3, 2026 Notes Supplemental Indenture No. 3, 2036 Notes Supplemental Indenture No. 3 and 2046 Notes Supplemental Indenture No. 3, dated as of September 7, 2016, by and among Dell International L.L.C., EMC Corporation, Dell Technologies Inc., Denali Intermediate Inc., Dell Inc., the other guarantors named therein and The Bank of New York Mellon Trust Company, N.A., as trustee and collateral agent (incorporated by reference to Exhibit 4.3 to the Company’s Current Report on Form 8-K filed with the Commission on September 9, 2016) (Commission File No. 001-37867). |
| | Registration Rights Agreement, dated as of June 1, 2016, among Diamond 1 Finance Corporation, Diamond 2 Finance Corporation and J.P. Morgan Securities LLC, Credit Suisse Securities (USA) LLC, Merrill Lynch, Pierce, Fenner & Smith Incorporated, Barclays Capital Inc., Citigroup Global Markets Inc., Goldman, Sachs & Co., Deutsche Bank Securities Inc. and RBC Capital Markets, LLC, as the representatives of the several initial purchasers (incorporated by reference to Exhibit 4.4 to the Company’s Current Report on Form 8-K filed with the Commission on September 9, 2016) (Commission File No. 001-37867). |
| | Joinder Agreement to Registration Rights Agreement, dated as of September 7, 2016, among Dell International L.L.C., EMC Corporation, Dell Technologies Inc., Denali Intermediate Inc., Dell Inc., the other guarantors named therein and J.P. Morgan Securities LLC, Credit Suisse Securities (USA) LLC, Merrill Lynch, Pierce, Fenner & Smith Incorporated, Barclays Capital Inc., Citigroup Global Markets Inc., Goldman, Sachs & Co., Deutsche Bank Securities Inc. and RBC Capital Markets, LLC, as the representatives of the several initial purchasers (incorporated by reference to Exhibit 4.5 to the Company’s Current Report on Form 8-K filed with the Commission on September 9, 2016) (Commission File No. 001-37867). |
| | |
| | |
| | 2021 Notes Supplemental Indenture No. 3, dated as of September 7, 2016, by and among Dell International L.L.C., EMC Corporation, Dell Technologies Inc., Denali Intermediate Inc., Dell Inc., the other guarantors named therein and The Bank of New York Mellon Trust Company, N.A., as trustee (incorporated by reference to Exhibit 4.8 to the Company’s Current Report on Form 8-K filed with the Commission on September 9, 2016) (Commission File No. 001-37867). |
| | |
| | 2024 Notes Supplemental Indenture No 3. dated as of September 7, 2016, by and among Dell International L.L.C., EMC Corporation, Dell Technologies Inc., Denali Intermediate Inc., Dell Inc., the other guarantors named therein and The Bank of New York Mellon Trust Company, N.A., as trustee (incorporated by reference to Exhibit 4.10 to the Company’s Current Report on Form 8-K filed with the Commission on September 9, 2016) (Commission File No. 001-37867). |
| | Security Agreement, dated as of September 7, 2016, among Dell International L.L.C., EMC Corporation, Denali Intermediate Inc., Dell Inc., the other grantors party thereto and The Bank of New York Mellon Trust Company, N.A., as notes collateral agent (incorporated by reference to Exhibit 4.11 to the Company’s Quarterly Report on Form 10-Q for the quarterly period ended October 28, 2016) (Commission File No. 001-37867). |
| | |
| | |
| | | | | | | | |
| | 2019 Notes Supplemental Indenture No. 4, 2021 Notes Supplemental Indenture No. 4, 2023 Notes Supplemental Indenture No. 4, 2026 Notes Supplemental Indenture No. 4, 2036 Notes Supplemental Indenture No. 4 and 2046 Notes Supplemental Indenture No. 4, dated as of May 23, 2017, by and among Dell International L.L.C., EMC Corporation, Dell Global Holdings XIII L.L.C., QTZ L.L.C. and The Bank of New York Mellon Trust Company, N.A., as Trustee and Collateral Agent (incorporated by reference to Exhibit 4.32 to the Company’s Annual Report on Form 10-K for the fiscal year ended February 1, 2019) (Commission File No. 001-37867). |
| | Joinder Agreement to Registration Rights Agreement,Supplemental Indenture No. 5, dated as of May 23, 2017, byMarch 20, 2019, among Dell Global Holdings XIII L.L.C.International L.L.C., EMC Corporation, the guarantors party thereto and QTZ L.L.C.The Bank of New York Mellon Trust Company, N.A., as Trustee and Notes Collateral Agent (incorporated by reference to Exhibit 4.334.11 to the Company’s AnnualCurrent Report on Form 10-K for8-K filed with the fiscal year ended February 1,Commission on March 21, 2019) (Commission File No. 001-37867). |
| | |
| | | | | | | | |
| |
|
| |
|
| |
|
| | Registration Rights Agreement,Base Indenture, dated as of March 20, 2019,April 9, 2020, among Dell International L.L.C, EMC Corporation, the guarantors party thereto and Merrill Lynch, Pierce, Fenner & Smith Incorporated, Barclays Capital Inc.L.L.C., Citigroup Global Markets, Credit Suisse Securities (USA) LLC, Goldman, Sachs & Co. and J.P. Morgan Securities LLC, as the representatives for the initial purchasers (incorporated by reference to Exhibit 4.5 to the Company’s Current Report on Form 8-K filed with the Commission on March 21, 2019) (Commission File No. 001-37867). |
| |
|
| |
|
| | Joinder Agreement to2025 Notes Supplemental Indenture No. 1, dated as of April 9, 2020, among Dell International L.L.C., EMC Corporation, the Registration Rights Agreement, dated March 20, 2019guarantors party thereto and The Bank of New York Mellon Trust Company, N.A., as Trustee and Notes Collateral Agent (incorporated by reference to Exhibit 4.124.2 to the Company’s Current Report on Form 8-K filed with the Commission on April 9, 2020) (Commission File No. 001-37867). |
| | |
| | |
| | |
| | |
| | |
| | Registration Rights Agreement, dated as of December 13, 2021, among Dell International L.L.C., EMC Corporation, the guarantors party thereto and BofA Securities, Inc., Barclays Capital Inc., Citigroup Global Markets Inc., Credit Suisse Securities (USA) LLC, J.P. Morgan Securities LLC and Wells Fargo Securities LLC, as the representatives for the initial purchasers. (incorporated by reference to Exhibit 4.4 to the Company’s Current Report on Form 8-K filed with the Commission on December 15, 2021) (Commission File No. 001-37867). |
| | |
| | |
| | Second Amended and Restated Registration Rights Agreement, dated as of December 25, 2018, by and among the Company, Michael S. Dell, Susan Lieberman Dell Separate Property Trust, MSDC Denali Investors, L.P., MSDC Denali EIV, LLC, Silver Lake Partners III, L.P., Silver Lake Technology Investors III, L.P., Silver Lake Partners IV, L.P., Silver Lake Technology Investors IV, L.P., SLP Denali Co-Invest, L.P., Venezio Investments Pte. Ltd. and the Management Stockholders party thereto (incorporated by reference to Exhibit 10.4 to the Company’s Current Report on Form 8-K filed with the Commission on December 28, 2018) (Commission File No. 001-37867). |
| | | | | | | | |
| | Amendment No. 1 to Second Amended and Restated Registration Rights Agreement, dated as of May 27, 2019, among Dell Technologies Inc., Michael S. Dell, Susan Lieberman Dell Separate Property Trust, MSDC Denali Investors, L.P., MSDC Denali EIV, LLC, SL SPV-2, L.P., Silver Lake Partners IV, L.P., Silver Lake Technology Investors IV, L.P., Silver Lake Partners V DE (AIV), L.P., Silver Lake Technology Investors V, L.P., SLP Denali Co-Invest, L.P. and Venezio Investments Pte. Ltd. (incorporated by reference to Exhibit 4.40 to the Company’s Annual Report on Form 10-K for the fiscal year ended January 31, 2020) (Commission File No. 001-37867). |
| | |
| | | | | | | | |
| | |
| | |
| | |
| | |
| | Registration Rights Agreement, dated as of April 9, 2020, among Dell International L.L.C., EMC Corporation, the guarantors party thereto and BofA Securities, Inc., Barclays Capital Inc., Citigroup Global Markets Inc., Credit Suisse Securities (USA) LLC, Goldman, Sachs & Co. and J.P. Morgan Securities LLC, as the representatives for the initial purchasers. (incorporated by reference to Exhibit 4.5 to the Company’s Quarterly Report on Form 10-Q for the quarterly period ended May 1, 2020) (Commission File No. 001-37867). |
| | |
| | |
| | |
| | Amendment No. 2 to the Second Amended and Restated Registration Rights Agreement, dated as of April 15, 2020, among Dell Technologies Inc., Michael S. Dell and Susan Lieberman Dell Separate Property Trust, SL SPV-2 L.P., Silver Lake Partners IV, L.P., Silver Lake Technology Investors IV, L.P., Silver Lake Partners V DE (AIV), L.P., Silver Lake Technology Investors V, L.P. and Venezio Investments Pte. Ltd. (incorporated(incorporated by reference to Exhibit 4.9 to the Company’s Quarterly Report on Form 10-Q for the quarterly period ended May 1, 2020) (Commission File No. 001-37867). |
| | Amendment No. 3 to the Second Amended and Restated Registration Rights Agreement, dated as of September 15, 2020, among Dell Technologies Inc., Michael S. Dell and Susan Lieberman Dell Separate Property Trust, SL SPV-2 L.P., Silver Lake Partners IV, L.P., Silver Lake Technology Investors IV, L.P., Silver Lake Partners V DE (AIV), L.P., Silver Lake Technology Investors V, L.P. and Venezio Investments Pte. Ltd. (incorporated(incorporated by reference to Exhibit 4.1 to the Company’s Quarterly Report on Form 10-Q for the quarterly period ended October 30, 2020) (Commission File No. 001-37867). |
| | Consent to the Extension of Registration Rights Under the Second Amended and Restated Registration Rights Agreement, dated December 17, 2020,January 3, 2022, among Dell Technologies Inc. and SL SPV-2 L.P., Silver Lake Partners IV, L.P., Silver Lake Technology Investors IV, L.P., Silver Lake Partners V DE (AIV), L.P., Silver Lake Technology Investors V, L.P. (incorporated by reference to Exhibit 4.33 to the Company’s Annual Report on Form 10-K for the fiscal year ended January 28, 2022) (Commission File No. 001-37867). |
| | Consent to the Extension of Registration Rights Under the Second Amended and Restated Registration Rights Agreement, dated March 31, 2022, among Dell Technologies Inc. and SL SPV-2 L.P., Silver Lake Partners IV, L.P., Silver Lake Technology Investors IV, L.P., Silver Lake Partners V DE (AIV), L.P., Silver Lake Technology Investors V, L.P. (incorporated by reference to Exhibit 4.1 to the Company’s Quarterly Report on Form 10-Q for the quarterly period ended April 29, 2022) (Commission File No. 001-37867). |
| | Consent to the Extension of Registration Rights Under the Second Amended and Restated Registration Rights Agreement, dated June 28, 2022, among Dell Technologies Inc. and SL SPV-2 L.P., Silver Lake Partners IV, L.P., Silver Lake Technology Investors IV, L.P., Silver Lake Partners V DE (AIV), L.P., Silver Lake Technology Investors V, L.P. (incorporated by reference to Exhibit 4.1 to the Company’s Quarterly Report on Form 10-Q for the quarterly period ended July 29, 2022) (Commission File No. 001-37867). |
| | Consent to the Extension of Registration Rights Under the Second Amended and Restated Registration Rights Agreement, dated September 22, 2022, among Dell Technologies Inc. and SL SPV-2 L.P., Silver Lake Partners IV, L.P., Silver Lake Technology Investors IV, L.P., Silver Lake Partners V DE (AIV), L.P., Silver Lake Technology Investors V, L.P. (incorporated by reference to Exhibit 4.1 to the Company’s Quarterly Report on Form 10-Q for the quarterly period ended October 28, 2022) (Commission File No. 001-37867). |
| | Consent to the Extension of Registration Rights Under the Second Amended and Restated Registration Rights Agreement, dated January 18, 2023, among Dell Technologies Inc. and SL SPV-2 L.P., Silver Lake Partners IV, L.P., Silver Lake Technology Investors IV, L.P., Silver Lake Partners V DE (AIV), L.P., Silver Lake Technology Investors V, L.P. |
| | |
| | |
| | | | | | | | |
| | |
| | |
| | |
| | |
| | |
| | |
| | |
| | Credit Agreement, dated as of September 7, 2016, among Denali Intermediate Inc., Dell Inc., Dell International L.L.C., New Dell International LLC, Universal Acquisition Co., EMC Corporation, the issuing banks and lenders party thereto, Credit Suisse AG, Cayman Islands Branch, as Term Loan B Administrative Agent and Collateral Agent, JPMorgan Chase Bank, N A., as Term Loan A/Revolver Administrative Agent and Swingline Lender (incorporated by reference to Exhibit 10.1 to the Company’s Current Report on Form 8-K filed with the Commission on September 9, 2016) (Commission File No. 001-37867).2 |
| | Credit Agreement, dated as of September 7, 2016, among Denali Intermediate Inc., Dell Inc., Dell International L.L.C., New Dell International LLC, Universal Acquisition Co., EMC Corporation, the lenders party thereto and JPMorgan Chase Bank, N.A., as Administrative Agent (incorporated by reference to Exhibit 10.2 to the Company’s Current Report on Form 8-K filed with the Commission on September 9, 2016) (Commission File No. 001-37867). |
| | |
| | |
| | Collateral Agreement, dated as of September 7, 2016, among Dell International L.L.C., EMC Corporation, Denali Intermediate Inc., Dell Inc., the other grantors party thereto and Credit Suisse AG, Cayman Islands Branch, as Collateral Agent (incorporated by reference to Exhibit 10.5 to the Company’s Quarterly Report on Form 10-Q for the quarterly period ended October 28, 2016) (Commission File No. 001-37867). |
| | |
| | |
| | |
| | |
| | First Refinancing and Incremental Facility Amendment, dated as of March 8, 2017, among Denali Intermediate Inc., Dell Inc., Dell International L.L.C., EMC Corporation, Credit Suisse AG, Cayman Islands Branch, as Term Loan B Administrative Agent and Collateral Agent, JPMorgan Chase Bank, N.A., as Term Loan A/Revolver Administrative Agent, and the lenders party thereto (incorporated by reference to Exhibit 10.1 to the Company’s Current Report on Form 8-K filed with the Commission on March 9, 2017) (Commission File No. 001-37867). | | | | | | |
| | Second Refinancing Amendment, dated as of October 20, 2017, among Denali Intermediate Inc., Dell Inc., Dell International L.L.C., EMC Corporation, Credit Suisse AG, Cayman Islands Branch, as Term Loan B Administrative Agent and Collateral Agent, JPMorgan Chase Bank, N.A., as Term A/Revolver Administrative Agent, and the lenders party thereto (incorporated by reference to Exhibit 10.1 to the Company’s Report on Form 8-K filed with the Commission on October 24, 2017) (Commission File No. 001-37867).7 |
| | Third Refinancing Amendment, dated as of October 20, 2017, among Denali Intermediate Inc., Dell Inc., Dell International L.L.C., EMC Corporation, Credit Suisse AG, Cayman Islands Branch, as Term Loan B Administrative Agent and Collateral Agent, JPMorgan Chase Bank, N.A., as Term A/Revolver Administrative Agent, and the lenders party thereto (incorporated by reference to Exhibit 10.2 to the Company’s Report on Form 8-K filed with the Commission on October 24, 2017) (Commission File No. 001-37867). |
| | |
| | |
| | |
| | |
| | |
| | |
| | |
| | |
| | |
| | |
| | | | | | | | |
| | |
| | |
| | |
| | Commitment Letter, dated November 14, 2018, among Dell, Inc., Bank of America, N.A., Merrill Lynch, Pierce, Fenner & Smith Incorporated, Barclays Bank PLC, Citigroup Global Markets Inc., Credit Suisse AG, Cayman Islands Branch, Credit Suisse Loan Funding LLC, Goldman Sachs Bank, USA, JPMorgan Chase Bank, N.A., Morgan Stanley Senior Funding, Inc., Deutsche Bank AG New York Branch, Deutsche Bank Securities Inc., Royal Bank of Canada, UBS Securities LLC and UBS AG, Stamford Branch (incorporated by reference to Exhibit 10.1 to the Company’s Current Report on Form 8-K/A filed with the Commission on November 15, 2018) (Commission File No. 001-37867). |
| | |
| | Fourth Amendment, dated as of December 20, 2018, to the Credit Agreement among Denali Intermediate Inc., Dell Inc., Dell International L.L.C., EMC Corporation, Credit Suisse AG, Cayman Islands Branch, as Term Loan B Administrative Agent and Collateral Agent, JPMorgan Chase Bank, N.A., as Term Loan A/Revolver Administrative Agent, and the lenders party thereto (incorporated by reference to Exhibit 10.1 to the Company’s Current Report on Form 8-K filed with the Commission on December 21, 2018) (Commission File No. 001-37867). |
| | MD Stockholders Agreement, dated as of December 25, 2018, by and among the Company, Denali Intermediate Inc., Dell Inc., EMC Corporation, Denali Finance Corp., Dell International L.L.C., Michael S. Dell and the Susan Lieberman Dell Separate Property Trust (incorporated by reference to Exhibit 10.1 to the Company’s Current Report on Form 8-K filed with the Commission on December 28, 2018) (Commission File No. 001-37867). |
| | SLP Stockholders Agreement, dated as of December 25, 2018, by and among the Company, Denali Intermediate Inc., Dell Inc., EMC Corporation, Denali Finance Corp., Dell International L.L.C., Silver Lake Partners III, L.P., Silver Lake Technology Investors III, L.P., Silver Lake Partners IV, L.P., Silver Lake Technology Investors IV, L.P. and SLP Denali Co-Invest, L.P. and the other stockholders named therein (incorporated by reference to Exhibit 10.2 to the Company’s Current Report on Form 8-K filed with the Commission on December 28, 2018) (Commission File No. 001-37867). |
| | | | | | | | |
| | MSD Partners Stockholders Agreement, dated as of December 25, 2018, by and among the Company, Denali Intermediate Inc., Dell Inc., EMC Corporation, Denali Finance Corp., Dell International L.L.C., MSDC Denali Investors, L.P., MSDC Denali EIV, LLC and the other stockholders named therein (incorporated by reference to Exhibit 10.3 to the Company’s Current Report on Form 8-K filed with the Commission on December 28, 2018) (Commission File No. 001-37867).3 |
| | Second Amended and Restated Management Stockholders Agreement, dated as of December 25, 2018, by and among the Company, Michael S. Dell, Susan Lieberman Dell Separate Property Trust, Silver Lake Partners III, L.P., Silver Lake Technology Investors III, L.P., Silver Lake Partners IV, L.P., Silver Lake Technology Investors IV, L.P., SLP Denali Co-Invest, L.P. and the Management Stockholders (as defined therein) (incorporated by reference to Exhibit 10.5 to the Company’s Current Report on Form 8-K filed with the Commission on December 28, 2018) (Commission File No. 001-37867). |
| | Amended and Restated Class C Stockholders Agreement, dated as of December 25, 2018, by and among the Company, Michael S. Dell, Susan Lieberman Dell Separate Property Trust, Silver Lake Partners III, L.P., Silver Lake Partners IV, L.P., Silver Lake Technology Investors III, L.P., Silver Lake Technology Investors IV, L.P., SLP Denali Co-Invest, L.P. and Venezio Investments Pte. Ltd. (incorporated by reference to Exhibit 10.6 to the Company’s Current Report on Form 8-K filed with the Commission on December 28, 2018) (Commission File No. 001-37867). |
| | Second Amended and Restated Class A Stockholders Agreement, dated as of December 25, 2018, by and among the Company, Michael S. Dell, Susan Lieberman Dell Separate Property Trust, Silver Lake Partners III, L.P., Silver Lake Partners IV, L.P., Silver Lake Technology Investors III, L.P., Silver Lake Technology Investors IV, L.P., SLP Denali Co-Invest, L.P. and the New Class A Stockholders party thereto (incorporated by reference to Exhibit 10.7 to the Company’s Current Report on Form 8-K filed with the Commission on December 28, 2018) (Commission File No. 001-37867). |
| | Fifth Amendment, dated as of March 13, 2019, among Denali Intermediate Inc., Dell Inc., Dell International L.L.C., EMC Corporation, Credit Suisse AG, Cayman Islands Branch, as Term Loan B Administrative Agent and Collateral Agent, JPMorgan Chase Bank, N.A., as Term Loan A/Revolver Administrative Agent, and the lenders party thereto (incorporated by reference to Exhibit 10.1 to the Company’s Current Report on Form 8-K filed with the Commission on March 14, 2019) (Commission File No. 001-37867).1 |
| | |
| | |
| | |
| | Commercial Framework Agreement, dated as of November 1, 2021, by and between Dell International L.L.C., EMC Corporation, Credit Suisse AG, Cayman Islands Branch, as Term Loan B Administrative AgentTechnologies Inc. and Collateral Agent, JPMorgan Chase Bank, N.A., as Term Loan A/Revolver Administrative Agent, and the lenders party theretoVMware, Inc. (incorporated by reference to Exhibit 10.1 to the Company’s Current Report on Form 8-K filed with the Commission on September 23, 2019)November 1, 2021) (Commission File No. 001-37867). |
| | |
| | | | | | | | |
| | Credit Agreement, dated as of April 7, 2020, betweenNovember 1, 2021, among Dell Technologies Inc., Denali Intermediate Inc., Dell Inc., Dell International L.L.C., as a borrower, EMC Corporation, as a borrower, JPMorgan Chase Bank, N.A., as administrative agent, and Michael S. Dell.each of the lenders and other parties from time to time party thereto (incorporated by reference to Exhibit 10.2 to the Company’s Current Report on Form 8-K filed with the Commission on November 1, 2021) (Commission File No. 001-37867). |
| | First Amendment to the Credit Agreement, dated as of February 8, 2022, among Dell Technologies Inc., Denali Intermediate Inc., Dell Inc., Dell International L.L.C., as a borrower, EMC Corporation, as a borrower, JPMorgan Chase Bank, N.A., as administrative agent, and each of the lenders and other parties from time to time party thereto. |
| | Second Amendment to the Credit Agreement, dated as of November 10, 2022, among Dell Technologies Inc., Denali Intermediate Inc., Dell Inc., Dell International L.L.C., as a borrower, EMC Corporation, as a borrower, JPMorgan Chase Bank, N.A., as administrative agent, and each of the lenders and other parties from time to time party thereto. |
| | |
| | |
| | |
| | |
| | |
| | |
| 101 .INS† | | XBRL Instance Document - the instance document does not appear in the Interactive Data File because its XBRL tags are embedded within the Inline XBRL document. |
| 101 .SCH† | | Inline XBRL Taxonomy Extension Schema Document. |
| | | | | | | | |
| 101 .CAL†† | | Inline XBRL Taxonomy Extension Calculation Linkbase Document. |
| 101 .DEF† | | Inline XBRL Taxonomy Extension Definition Linkbase Document. |
| 101 .LAB† | | Inline XBRL Taxonomy Extension Label Linkbase Document. |
| 101 .PRE† | | Inline XBRL Taxonomy Extension Presentation Linkbase Document. |
| 104 | | Cover Page Interactive Data File - the cover page XBRL tags are embedded within the Inline XBRL document (included in Exhibit 101). |
| | | | | | | | |
| * | | Management contracts or compensation plans or arrangements in which directors or executive officers participate. |
| † | | Filed with this report. |
| †† | | Furnished with this report. |
* | | Management contracts or compensation plans or arrangements in which directors or executive officers participate. |
| | Pursuant to Item 601(b)(4)(iii) of Regulation S-K, copies of certain instruments defining the rights of holders of certain long-term debt of the Company and its subsidiaries are not filed. The Company agrees to furnish to the Securities and Exchange Commission, upon request, a copy of each instrument with respect to issuances of such long-term debt. |
ITEM 16 — FORM 10-K SUMMARY
None.
SIGNATURES
Pursuant to the requirementsrequirements of Section 13 or 15(d) of the Securities Exchange Act of 1934, the registrant has duly caused this report to be signed on its behalf by the undersigned, thereunto duly authorized.
| | | | | | | | |
| DELL TECHNOLOGIES INC. |
| | |
| | By: | /s/ MICHAEL S. DELL |
| | Michael S. Dell |
| | Chairman and Chief Executive Officer |
| | (Duly Authorized Officer) |
| | |
Date: March 26, 202130, 2023
Pursuant to the requirements of the Securities Exchange Act of 1934, this report has been signed below by the following persons on behalf of the registrant and in the capacities indicated as of March 26, 2021:30, 2023:
| | | | | | | | |
| Signature | | Title |
| | |
| /s/ MICHAEL S. DELL | | Chairman and Chief Executive Officer |
| Michael S. Dell | | (principal executive officer) |
| | |
| /s/ DAVID W. DORMAN | | Director |
| David W. Dorman | | |
| | |
| /s/ EGON DURBAN | | Director |
| Egon Durban | | |
| | |
| /s/ DAVID GRAIN | | Director |
| David Grain | | |
| | |
| /s/ WILLIAM D. GREEN | | Director |
| William D. Green | | |
| | |
| /s/ ELLEN J. KULLMAN | | Director |
| Ellen J. Kullman | | |
| | |
| /s/ SIMON PATTERSON | | Director |
| Simon Patterson | | |
| | |
| /s/ LYNN VOJVODICH RADAKOVICH | | Director |
| Lynn Vojvodich Radakovich | | |
| | |
| /s/ THOMAS W. SWEET | | Executive Vice President and Chief Financial Officer |
| Thomas W. Sweet | | (principal financial officer) |
| | |
| /s/ BRUNILDA RIOS | | Senior Vice President, Corporate Finance and |
| Brunilda Rios | | Chief Accounting Officer |
| | (principal accounting officer) |