UNITED STATES
SECURITIES AND EXCHANGE COMMISSION
Washington, D.C. 20549
__________________
FORM 10‑K10-K
_______________________________
☒xANNUAL REPORT PURSUANT TO SECTION 13 OR 15(d) OF THE SECURITIES EXCHANGE ACT OF 1934
For the fiscal year ended DECemberDecember 31, 20172021
OR
☐oTRANSITION REPORT PURSUANT TO SECTION 13 OR 15(d) OF THE SECURITIES EXCHANGE ACT OF 1934
For the transition period from ____________to____________
Commission File No.NUMBER 001-36491
__________________________
Century Communities, Inc.
(Exact Name of Registrant as Specified in Its Charter)
____________________________________________
|
|
|
|
|
|
Delaware |
| 68-0521411 |
(State or Other Jurisdiction of
Incorporation or Organization) |
| (I.R.S. Employer
Identification No.) |
8390 East Crescent Parkway, Suite 650
Greenwood Village, Colorado |
| 80111 |
(Address of Principal Executive Offices) |
| (Zip Code) |
(Registrant’s Telephone Number, Including Area Code):Code:(303) 770-8300
Securities registered pursuant to Section 12(b) of the Act:
|
|
|
Title of each Classclass | Trading Symbol(s) | Name of each Exchangeexchange on which registered |
Common Stock, par value $0.01 per share | CCS | New York Stock Exchange |
Securities registered pursuant to Section 12(g) of the Act: None
__________________________
Indicate by check mark if the registrant is a well-known seasoned issuer, as defined in Rule 405 of the Securities Act. Yes ☐x No ☒o
Indicate by check mark if the registrant is not required to file reports pursuant to Section 13 or Section 15(d) of the Act. Yes ☐o No ☒x
Indicate by check mark whether the registrant:registrant (1) has filed all reports required to be filed by Section 13 or 15(d) of the Securities Exchange Act of 1934 during the preceding 12 months (or for such shorter period that the registrant was required to file such reports), and (2) has been subject to such filing requirements for the past 90 days. Yes ☒x No ☐o
Indicate by check mark whether the registrant has submitted electronically and posted on its corporate Web site, if any, every Interactive Data File required to be submitted and posted pursuant to Rule 405 of Regulation S-T (§232.405 of this chapter) during the preceding 12 months (or for such shorter period that the registrant was required to submit and post such files). Yes ☒x No ☐o
Indicate by check mark if disclosure of delinquent filers pursuant to Item 405 of Regulation S-K (§229.405 of this chapter) is not contained herein, and will not be contained, to the best of registrant’s knowledge, in definitive proxy or information statements incorporated by reference in Part III of this Form 10-K or any amendment to this Form 10-K. ☒
Indicate by check mark whether the registrant is a large accelerated filer, an accelerated filer, a non-accelerated filer, a smaller reporting company, or an emerging growth company. See the definitions of “large accelerated filer,” “accelerated filer,” “smaller reporting company,” and “emerging growth company” in Rule 12b-2 of the Exchange Act. (Check one):
|
|
|
|
|
|
|
|
|
|
Large accelerated filer | ☐x
|
| Accelerated filer | ☒o
|
Non-accelerated filer | ☐o
| (Do not check if smaller reporting company)
| Smaller reporting company | ☐o
|
|
|
| Emerging growth company | ☐o
|
If an emerging growth company, indicate by check mark if the registrant has elected not to use the extended transition period for complying with any new or revised financial accounting standards provided pursuant to Section 13(a) of the Exchange Act. ☐o
Indicate by check mark whether the registrant has filed a report on and attestation to its management’s assessment of the effectiveness of its internal control over financial reporting under Section 404(b) of the Sarbanes-Oxley Act (15 U.S.C. 7262(b)) by the registered public accounting firm that prepared or issued its audit report. x
Indicate by check mark whether the registrant is a shell company (as defined in Rule 12b‑12b-2 of the Exchange Act.) Yes ☐o No ☒x
The aggregate market value of the registrant’s common stock held by non-affiliates of the registrant on June 30, 20172021 was approximately $457.7 million$2.0 billion based on the closing price of $24.80$66.54 per share as reported on the New York Stock Exchange on June 30, 2017. 2021.
As of February 27, 2018,January 25, 2022, the registrant had 29,616,59733,764,801 shares of common stock issued and outstanding.
DOCUMENTS INCORPORATED BY REFERENCE:
Part III of this Annual Report on Form 10-K incorporates by reference certain portions of the registrant’s definitive proxy statement for its 20182022 Annual Meeting of Stockholders to be filed with the Securities and Exchange Commission not later than 120 days after the end of the fiscal year covered by this report.
CENTURY COMMUNITIES, INC.
ANNUAL REPORT ON FORM 10-K
For the Fiscal Year Ended December 31, 20172021
Table of Contents
CAUTIONARY NOTE ABOUT FORWARD-LOOKING STATEMENTS
Some of the statements included in or incorporated by reference into this Annual Report on Form 10-K (which we refer to as this “Form 10-K”) constitute forward-looking statements within the meaning of the federal securities laws. Forward-looking statements relate to expectations, beliefs, projections, forecasts, future plans and strategies, anticipated events or trends and similar expressions concerning matters that are not historical facts. These statements are only predictions. We caution that forward-looking statements are not guarantees. Actual events and results of operations could differ materially from those expressed or implied in the forward-looking statements. Forward-looking statements are typically identified by the use of terms such as “may,” “will,” “should,” “expect,” “could,” “intend,” “plan,” “anticipate,” “estimate,” “believe,” “continue,” “predict,” “potential” or the negative of such terms and other comparable terminology.terminology, and the use of future dates. You can also identify forward-looking statements by discussions of strategy, plans or intentions. Actual results and the timing of events may differ materially from those contained in these forward-looking statements due to a number of factors.
The forward-looking statements included in this Form 10-K reflect our current views about future events and are subject to numerous known and unknown risks, uncertainties, assumptions and changes in circumstances that may cause our actual results to differ significantly from those expressed in any forward-looking statement. Statements regarding the following subjects, among others, may be forward-looking:forward-looking and subject to risks and uncertainties, including, among others:
| ·
| | economic changes either nationally or in the markets in which we operate, including declines in employment, volatility of mortgage interest rates and inflation;
|
| ·
| | economic changes either nationally or in the markets in which we operate, including declines in employment, volatility of mortgage interest rates and inflation;
|
| ·
| | a downturn in the homebuilding industry, including a decline in real estate values or market conditions resulting in impairment of our assets;
|
| ·
| | changes in assumptions used to make industry forecasts;
|
| ·
| | continued volatility and uncertainty in the credit markets and broader financial markets;
|
| ·
| | our future operating results and financial condition;
|
| ·
| | our business operations;
|
| ·
| | changes in our business and investment strategy;
|
| ·
| | availability of land to acquire, and our ability to acquire such land on favorable terms or at all;
|
| ·
| | availability, terms and deployment of capital;
|
| ·
| | availability of mortgage financing or an increase in the number of foreclosures in the market;
|
| ·
| | shortages of or increased prices for labor, land or raw materials used in housing construction;
|
| ·
| | delays in land development or home construction resulting from adverse weather conditions or other events outside our control;
|
| ·
| | impact of construction defect, product liability, and/or home warranty claims, including the adequacy of accruals and the applicability and sufficiency of our insurance coverage;
|
| ·
| | changes in, or the failure or inability to comply with, governmental laws and regulations;
|
| ·
| | the timing of receipt of regulatory approvals and the opening of projects;
|
| ·
| | the degree and nature of our competition;
|
| ·
| | our leverage and debt service obligations;
|
| ·
| | availability of qualified personnel and our ability to retain our key personnel; and
|
| ·
| | changes in United States generally accepted accounting principles (which we refer to as “GAAP”).
|
The forward-lookingthe impact of the COVID-19 pandemic and measures taken in response to the COVID-19 pandemic on our business operations, operating results and financial condition, as well as the general economy and housing market in particular;
economic changes either nationally or in the markets in which we operate, including declines in employment, volatility of mortgage interest rates and inflation;
shortages of or increased prices for labor, land or raw materials, including lumber, used in housing construction and resource shortages;
a downturn in the homebuilding industry, including a reduction in demand or a decline in real estate values or market conditions resulting in an adverse impact on our business, operating results and financial conditions, including an impairment of our assets;
changes in assumptions used to make industry forecasts, population growth rates or trends affecting housing demand or prices;
continued volatility and uncertainty in the credit markets and broader financial markets;
our future operating results and financial condition;
our business operations;
changes in our business and investment strategy;
availability and price of land to acquire, and our ability to acquire such land on favorable terms or at all;
availability, terms and deployment of capital;
availability or cost of mortgage financing or an increase in the number of foreclosures in the market;
delays in land development or home construction resulting from adverse weather conditions or other events outside our control;
impact of construction defect, product liability, and/or home warranty claims, including the adequacy of accruals and the applicability and sufficiency of our insurance coverage;
changes in, or the failure or inability to comply with, governmental laws and regulations;
the timing of receipt of regulatory approvals and the opening of projects;
the impact and cost of compliance with evolving environmental, health and safety and other laws and regulations and third-party challenges to required permits and other approvals and potential legal liability in connection therewith;
the degree and nature of our competition;
our leverage, debt service obligations and exposure to changes in interest rates and our ability to refinance our debt when needed or on favorable terms;
our ability to continue to fund and succeed in our mortgage lending business and the additional risks involved in that business;
availability of qualified personnel and contractors and our ability to retain key personnel and contractor relationships;
our ability to pay dividends in the future;
taxation and tax policy changes, tax rate changes, new tax laws, new or revised tax law interpretations or guidance; and
changes in United States generally accepted accounting principles (which we refer to as “GAAP”).
Forward-looking statements are based on our beliefs, assumptions and expectations of future events, taking into account all information currently available to us. Forward-looking statements are not guarantees of future events or of our performance. These beliefs, assumptions and expectations can change as a result of many possible events or factors, not all of which are known to us. Some of these events and factors are described in “Item“Part I, Item 1A. Risk Factors” and “Part II, Item 7. Management’s Discussion and Analysis of Financial Condition and Results of Operations” and in “Part I, Item 1A. Risk Factors” in this Form 10-K, and other risks and uncertainties detailed in this report and our
other reports and filings with the SEC. If a change occurs, our business, financial condition, liquidity, cash flows and results of operations may vary materially from those expressed in or implied by our forward-looking statements. New risks and uncertainties arise over time, and it is not possible for us to predict the occurrence of those matters or the manner in which they may affect us. Except as required by law, we are not obligated to, and do not intend to, update or revise any forward-looking statements, whether as a result of new information, future events or otherwise. Therefore, you should not rely on these forward-looking statements as of any date subsequent to the date of this Form 10-K.
As used in this Form 10-K, references to “Company,” “we,” “us” or “our” refer to Century Communities, Inc., a Delaware corporation, and, unless the context otherwise requires, its subsidiaries and affiliates.
PART I
ITEM 1.BUSINESS.
GeneralOverview
Century Communities, Inc., a Delaware corporation (which we refer to as “we,” “us,” “our,” “CCS,” or the “Company”), is engaged in the development, design, construction, marketing and sale of single-family attached and detached homes in metropolitan areas in the States of California, Colorado, Georgia, Nevada, North Carolina, South Carolina, Tennessee, Texas, Utah, and Washington.17 states. In many of our projects, in addition to building homes, we are responsible for the entitlement and development of the underlying land. We build and sell homes under our Century Communities and Century Complete brands.
Our Century Communities brand offers a wide range of buyer profiles including: entry-level, first and second time move-up, and lifestyle homebuyers, and provides our homebuyers with the ability to personalize their homes through certain option and upgrade opportunities. Our Century Complete brand targets entry-level homebuyers, primarily sells homes through retail studios and the internet, and generally provides no option or upgrade opportunities. We now have six states where both Century brands have a presence and we believe there are more opportunities for increased penetration within our over 40 high-growth markets to enable both brands to benefit from increased scale and enhanced operational efficiencies.
Our homebuilding operations are organized into the following fourfive reportable segments based on the geographic regions in which we operate:segments: West, Mountain, Texas, Southeast, and Southeast.Century Complete. Additionally, our indirect wholly-owned subsidiaries, Inspire Home Loans Inc., Parkway Title, LLC, and Parkway Title,IHL Home Insurance Agency, LLC, which provide mortgage, servicestitle, and titleinsurance services, respectively, primarily to our home buyers have been identified as our Financial Services segment.
Since the private placementWhile we offer homes that appeal to a broad range of 12.1 million sharesentry-level, move-up, and lifestyle homebuyers, our offerings are heavily weighted towards providing affordable housing options in each of our common stock, par value $0.01 per share,homebuyer segments. Additionally, we prefer building move-in-ready homes over built-to-order homes, which we believe allows for a faster construction process, advantageous pricing with subcontractors, and shortened time period from home sale to home delivery, thus allowing us to more appropriately price the homes and deploy our capital.Of the 10,805 homes delivered during 2021, approximately 75% of our deliveries were made to entry-level homebuyers and approximately 87% of homes delivered were built as move-in ready homes.
Since our initial public offering in May of 2013,2014, we have grown rapidlyexpanded geographically through the acquisitions of other homebuilders and organic entrance into new markets. We are one of the largest homebuilders in the United States and our common shares trade on the New York Stock Exchange under the symbol “CCS.” As of December 31, 2021, we operated in the 17 states and over 40 markets depicted below:
We operate our homebuilding operations within the following five reportable segments:
West (California and Washington)
Mountain (Arizona, Colorado, Nevada and Utah)
Texas
Southeast (Florida, Georgia, North Carolina, South Carolina and Tennessee)
Century Complete (Alabama, Arizona, Florida, Georgia, Indiana, Kentucky, Michigan, North Carolina, Ohio, South Carolina and Texas)
We have also identified our Financial Services operations, which provide mortgage, title, and insurance services to our and other homebuyers, as a sixth reportable segment. Our Corporate operations are a non-operating segment, as it serves to support our homebuilding, and to a lesser extent our Financial Services operations, through functions, such as our executive, finance, treasury, human resources, accounting and legal departments. See Note 2 – Reporting Segments in the Notes to the Consolidated Financial Statements for further detail on our reportable segments.
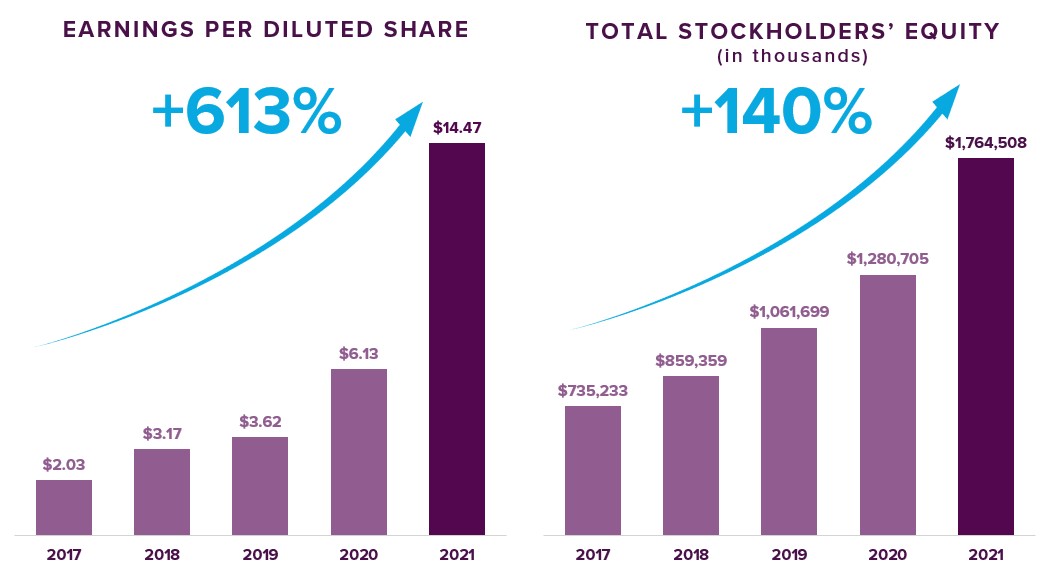
Positive macro-economic conditions, along with our operating efficiencies, business strategy and geographic expansion through the acquisition of other homebuilders and organic entrance into new markets has resulted in significant increases in total revenues, net income, earnings per diluted share, and stockholders’ equity over the last five years of 196%, 891%, 613%, and 140% respectively, as outlined below:


The outbreak of COVID-19, which was declared a pandemic by the World Health Organization on March 11, 2020, created significant volatility, disruption, and uncertainty across the nation and abroad. After an initial slowing of home sales trends in early spring of 2020, due in part to consumer uncertainty, home sales sharply rebounded, aided by historically low interest rates, lack of supply, and renewed desire from customers to move out of urban areas and/or apartments and into new homes in suburban areas, which desire was likely accelerated by the COVID-19 pandemic. These positive trends and market dynamics continued through the year ended December 31, 2021.
Although the trajectory and strength of our markets have continued to remain strong and consumer demand allowed us to pass on increased costs through increases in our selling prices and increase our margins during 2021, we continued to experience shortages of labor, land and raw materials, delays and material and labor supply cost pressures, and elongated construction cycle times to build homes in many of our markets, caused in part by increased demand, global supply chain disruptions and inflation, during 2021 that could negatively impact our margins in future periods. While the impact of the COVID-19 pandemic will continue to evolve and at any given time recovery could be slowed or reversed by a number of factors, including the emergence of new variants of COVID-19, such as Delta and Omicron, we believe we are well positioned from a cash and liquidity standpoint not only to operate in an uncertain environment,
| | | | |
•Raised $224 million through 144A equity offering.
•Acquired Jimmy Jacobs Homes in Austin and San Antonio Texas for $16 million
| •Acquired LVLH in Las Vegas for $165 million.
•Raised $200 million through offering of senior unsecured notes.
•Successfully completed IPO
•Acquired Grand View Builders in Houston for $13 million.
•Acquired Peachtree Communities in Atlanta for $57 million.
| •Raised $60 million through offering of senior unsecured notes.
•Expanded unsecured line of credit to $300 million with $100 million accordion feature.
| •Entered the Salt Lake City market.
•Acquired 50% of Wade Jurney Homes for $15 million.
•Formed financial services companies to provide title and mortgage services.
•Entered the Charlotte, NC market.
| •Expanded unsecured line of credit to $400 million.
•Raised $525 million through offering of senior unsecured notes.
•Entered West Coast and strengthened Southeast presence through the acquisition of UCP, Inc. for $362 million, including acquired debt
•Expanded Seattle through the acquisition of Sundquist Homes for $50 million.
|
but also to continue to grow with the market and pursue other ways to properly deploy capital to enhance returns, which may include taking advantage of debt refinancing and/or strategic opportunities as they arise.
Our Annual Reportsfinancial results for the year ended December 31, 2021 were driven by continued favorable market dynamics across our markets. These conditions included an increase in demand for new housing, particularly entry-level housing, impacted by the COVID-19 pandemic, which accelerated the trend of migration out of high-density urban areas and into suburban areas, historically low interest rates on Form 10-K, Quarterly Reportsmortgage products, including rates on Form 10-Q,30-year fixed mortgages, a low supply of available inventories and Current Reportspositive demographic trends. These conditions, coupled with our strategy to focus on Form 8-K are availableentry-level housing (approximately 75% of our deliveries in 2021 qualified for Federal Housing Administration-insured (“FHA”) mortgages) resulted in a positive sales environment, which we leveraged in 2021 to increase net new home contracts to 12,017, an 11.0% increase over the prior year period.
Homebuilding Operations
Strategy
Our strategy is focused on increasing the returns on our stockholders’ equity and inventory, and continuing to generate growth and strong profitability. In general, we are focused on the following initiatives:
Maintaining a strong balance sheet and prudent use of leverage;
While we offer homes that appeal to a broad range of entry-level, move-up, and lifestyle homebuyers, offerings are heavily weighted towards providing affordable housing options in each of our homebuyer segments;
Preferring building move-in-ready homes over built-to-order homes, which we believe allows for a faster construction process, advantageous pricing with subcontractors, and a shortened time period from home sale to home delivery, thus allowing us to more appropriately price the home;
Maintaining a strong pipeline of future land holdings, including favoring lot option contracts to manage our risk to land holdings;
Increasing our market share within our existing markets through organic growth and/or acquisitions of other homebuilders already operating in the market;
Expanding into new markets that meet our underwriting criteria either through organic start-up operations or through acquisitions of existing homebuilders;
Evaluation of opportunistic strategies for construction of single-family and multi-family rental units; and
Controlling costs, including costs of home sales revenue and selling, general and administrative expenses, and generating further efficiencies, including through the increased reliance on digital marketing and direct outreach to potential customers through our website at www.centurycommunities.com as soon as reasonably practicable afterand digital tools, such materials are electronically filed with, or furnished to, the U.S. Securities and Exchange Commission (which we refer to as the “SEC”).introduction of the ability to buy a home via our website, to achieve increased profitability.
DescriptionOur operating strategy has resulted in significant growth in revenue and income before income taxes over the last five years, and we believe it will continue to produce positive results. We expect our operating strategy will continue to adapt to market changes, and we cannot provide any assurance that our strategies will continue to be successful.
The core of Businessour business plan is to acquire land strategically, based on our understanding of population growth patterns, local markets, entitlement restrictions and infrastructure development. We focus on locations within our markets that are generally characterized by diverse economic and employment bases and demographics and increasing populations. We believe these conditions create strong demand for new housing, and these locations represent what we believe to be attractive opportunities for long-term growth. We also seek assets that have desirable characteristics, such as good access to major job centers, schools, shopping, recreation and transportation facilities. Location, product, price point and customer service are key components of the connection we seek to establish with each individual homebuyer. Our construction expertise across an extensive product offering allows us flexibility to pursue a wide array of land acquisition opportunities and appeal to a broad range of potential homebuyers, from entry-level to first- and second-time move-up buyers and lifestyle homebuyers. Additionally, we believe our diversified product strategy enables us to adapt quickly to changing market conditions and to optimize returns while strategically reducing portfolio risk.
Land acquisition process
We acquire land for our homebuilding operations with the primary intent to develop and construct single familysingle-family detached or attached homes for sale on the acquired land. From time to time we may sell land to other developers and homebuilders where we have excess land positions. We generally acquire land for cash, either through bulk acquisitions of land or through option contracts. Option contracts are generally structured where we have the right, but not the obligation, to buy land at predetermined prices on a defined schedule. Potential land acquisitions are identified by our local management within the markets in which we operate. We typically purchase lots for our Century Communities brand which range in status at acquisition from fully entitled for residential construction but requiring installation of streets, common areas, and wet and dry utilities to lots which are fully entitled and developed and immediately available for permitting and construction of the residence. For lots requiring development work, we negotiate, contract for, and oversee the work performed by subcontractors internally, and in some limited cases, we may hire a third-party general contractor for these services. For our Century Complete brand, we typically purchase lots which are immediately available for permitting and construction of the residence. Our land acquisition process typically includes soil tests, independent environmental studies, other engineering work and financial analysis which include an evaluation of expected returns, projected gross margins, estimated sales paces and pricing. All potentialPotential land acquisitions are approved by our Corporate office above established limits to ensure appropriate capital allocations taking into consideration current and projected inventory levels and risk adjusted returns.
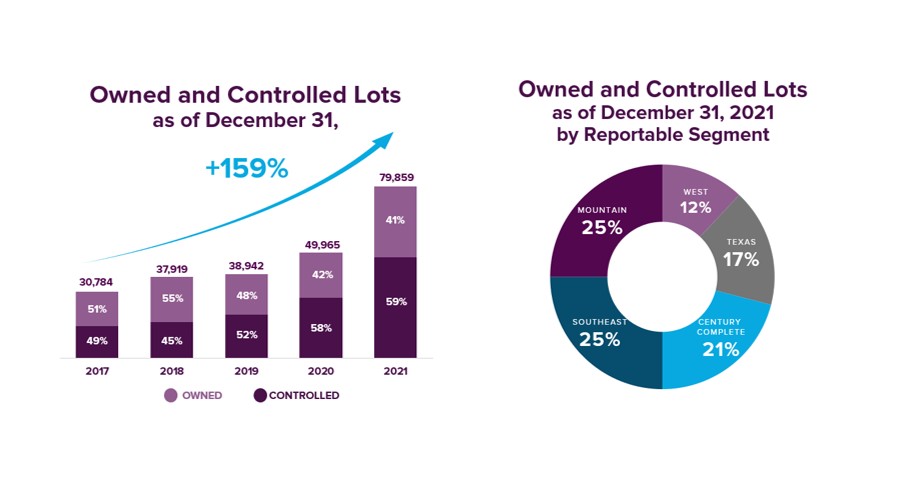
We strive to increase the number of lots we own and control across our markets in order to support future increases in the number of our home deliveries, while also maintaining a balance between the number of owned lots as compared to lots we control through option and other contracts. This balance allows us flexibility to adjust to local market conditions as they develop. This strategy has resulted in an owned and under control lot position of 79,859 as of December 31, 2021, of which 41% were owned and 59% were controlled through option contracts. Our owned and controlled lot position since 2017 and our owned and controlled lot position by segment as of December 31, 2021 are outlined below.
Design and construction
We engage architects, engineers and other professionals in connection with the home design process who are familiar with local market preferences, constraints, conditions and requirements, and we generally own the architectural design rights to our home plans. We serve as the general contractor, with all construction work typically performed by subcontractors. While we maintain long-standing relationships with many of our subcontractors and design professionals, we typically do not enter into long-term contractual
commitments with them and as a result may be subject to shortages of qualified and skilled labor. Our personnel, along with subcontracted marketing and design consultants, carefully design the exterior and interior of each home to coincide with the needs of targeted homebuyers.
When constructing homes, we use various construction materials and components including lumber, steel and concrete. It has typically taken us four to eight months or more in some instances to construct a home, though due to supply chain shortages during 2021, the average time to construct a home increased sequentially each quarter as compared to the previous quarter. While we attempt to contract for all input costs of the home at the start of construction, it is not always possible to do so. In those instances, labor and materials are subject to price fluctuations during the construction period. Such price fluctuations are caused by several factors, including recent global supply chain disruptions as well as seasonal variation in availability and demand for labor and materials. We may experience shortages in the availability of materials and/or labor in each of our markets and these shortages and delays may result in delays in the delivery of homes under construction, and/or reduced gross margins from home sales.
We are dependent upon building material suppliers for a continuous flow of certain materials. Whenever possible, we utilize standard products available from multiple national and international sources and utilize our buying power and relationships throughout the supply chain to ensure availability of products. We may also contract on a national level, directly with suppliers in many instances, to ensure availability and competitive prices of key materials.
We design and engineer our homes for energy efficiency to reduce the impact on the environment and lower energy costs to our homeowners. We have historically qualified approximately 70% of our homes for Energy Efficient Home Credits under Internal Revenue Code Section 45L.
Homebuilding marketing and sales process – Century Communities brand
We build and sellOur Century Communities brand has a focus on affordable housing options in each market but builds an extensive range of home types across a variety of price points. Our emphasis is on acquiring well-located land positions and offering quality homes. The core of our business plan is to acquire and develop land strategically, based on our understanding of population growth patterns, entitlement restrictions and infrastructure development. We focus on locations within our
markets with convenient access to metropolitan areas that are generally characterized by diverse economic and employment bases and demographics and increasing populations. We believe these conditions create strong demand for new housing, and these locations represent what we believe to be attractive opportunities for long-term growth. We also seek assets that have desirable characteristics, such as good access to major job centers, schools, shopping, recreation and transportation facilities, and we strive to offer a broad spectrum of product types in these locations. Location, product and customer service are key components of the connection we seek to establish with each individual homebuyer. Our construction expertise across an extensive product offering allows us flexibility to pursue a wide array of land acquisition opportunities and appeal to a broad range of potential homebuyers, from entry-level to first- and second-time move-up buyers and lifestyle homebuyers. Additionally, we believe our diversified product strategy enables us to adapt quickly to changing market conditions and to optimize returns while strategically reducing portfolio risk.
Our philosophy isCentury Communities brand strives to provide our customers with a positive experience to our homeowners by actively engaging them in the building process and by enhancing communication, knowledge and satisfaction. “Home for Every Dream.”
In many of our communities, we provide our customers with customization options to suit their lifestyle needs and have developed a number of home designs with features such as outdoor living spaces, one-story living and first floor master bedroom suites to appeal to universalbroad design needs. We also engineer our homes for energy efficiency, which is aimed at reducing the impact on the environment and lowering energy costs to our homebuyers. As part of these efforts, we offerneeds, while often offering homebuyers environmentally friendly alternatives, such as solar power to supplement a home’s energy needs.
We engage architects, engineers and other professionals in connection with the home design process who are familiar with local market preferences, constraints, conditions and requirements. We serve as the general contractor, with all construction work typically performed by subcontractors. While we maintain long-standing relationships with many of our subcontractors and design professionals, we typically do not enter into long-term contractual commitments with them.
We sell our homes through our own sales representatives and throughoften with the assistance of independent real estate brokers. Our in-house sales force typically works from sales offices located in model homes close to or in each community. In addition, in response to the COVID-19 pandemic and government restrictions, during 2020, we shifted our sales process to offer additional virtual online tours and appointments and where permitted, appointment only in-person meetings that complied with social distancing and other health and safety requirements and protocols. During 2021, we provided the ability for our customers to purchase homes directly on our website. Sales representatives assist potential buyers by providing them with basic floor plans, price information, development and construction timetables, tours of model homes where available and the selection of available options. Sales personnel are trained by us and generally have had prior experience selling new or resale homes in the local market. Our personnel, along with subcontracted marketing and design consultants, carefully design the exterior and interior of each home to coincide with the lifestyles of targeted homebuyers.
We advertise directly to potential homebuyers through the internet and in newspapers and trade publications, as well as throughdigital marketing, marketing brochures and newsletters.to a lesser extent newspapers. We may also use billboards, radio and television advertising, andalong with our website, to market the location, price range and availability of our homes. We also attempt to operate in conspicuously located communitiesareas that permit us to take advantage of local traffic patterns. Model homes play a significant role in our marketing efforts by not only by creating an attractive atmosphere, but also by displaying options and upgrades.
Homebuilding marketing and sales process – Century Complete brand
Our Century Complete brand primarily sells affordable homes to entry-level buyers through our own sales representatives located in retail locations which we refer to as studios, as opposed to model homes; however, model and vignetted homes are used in certain instances. We lease our studios within strip malls or other high traffic retail centers, located centrally to our homes under construction. Our studios are generally leased for a period of three years and average approximately 1,550 square feet. We also sell homes directly through our Century Complete website and utilize the services of independent real estate brokers in many cases. Our Century Complete brand aims to provide our customers with “More Home, Less Money.”
Our Century Complete brand often competes with resales as well as other new home builders within the submarkets in which we operate. We are often able to offer a new home offering to our customers at prices that are lower than other new home offerings. Our philosophy is to be the price leader through providing a limited number of floor plans, with no options or upgrades offered. Our advertising and marketing efforts are focused on cost effective means of reaching potential customers including centralized digital marketing, and direct
outreach to independent real estate brokers. Our goal is to leverage our studios and advertising and marketing efforts to generate homebuyer leads, which are then actively pursued by our sales associates.
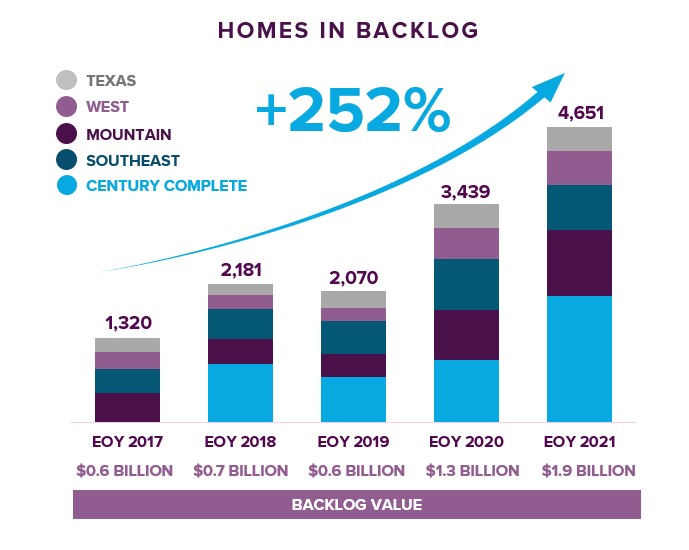
Our marketing and sales process for both of our brands combined with our overall growth has resulted in a 252% increase in units in backlog as of December 31, 2021 over the last five years as outlined below:
Customer relations, quality controlexperience
Our goal is to provide a positive experience to our homeowners by engaging them in the homebuying and warranty programs
homeowning processes. We pay particular attention to the product design process and carefully consider quality and choice of materials in order to attempt to eliminate building deficiencies. The quality and workmanship of the subcontractors we employ are monitored and we make regular inspections and evaluations of our subcontractors.
We maintain quality control and customer service staff whose role includes providing a positive experience for each customer throughout the pre-sale, sale, building, closinghomebuying process and post-closing periods. These employees arebeyond. This group is also responsible for providing after sales customer service. Our quality andcustomer service initiatives include taking customers on a comprehensive tour of their home prior to closing and using customer survey results to improve our standards of quality and customer satisfaction.
Generally, we provide each homeowner with product warranties covering workmanship and materials for one year from the time of closing, and warranties covering structural systems for eight to 10 years from the time of closing through the statute of repose with the states we operate in, connection with our general liability insurance policy.or ten years, whichever is shorter. The subcontractors who perform most of the actual construction also provide to us customary warranties on workmanship.
Customer FinancingSeasonality
DuringHistorically, the fourth quarterhomebuilding industry experiences seasonal fluctuations in quarterly operating results and capital requirements. We typically experience the highest new home order activity during the spring, although this activity is also highly dependent on the number of 2016,active selling communities, timing of new community openings and other market factors. Since it has historically taken four to eight months to construct a new home, we deliver more homes in the second half of the year as spring and summer home orders convert to home deliveries. Because of this seasonality, home starts, construction costs and related cash outflows have historically been highest in the second and third quarters, and the majority of cash receipts from home deliveries occurs during the second half of the year. We expect this seasonal pattern to continue over the long term, although it may be affected by volatility in the homebuilding industry and the COVID-19 pandemic and supply chain challenges which have extended our construction cycle times in many cases.
Financial Services Operations
We offer home financing for our customers and other homebuyers through our wholly owned subsidiary, Parkway Financial Group, LLC, formed Inspire Home Loans Inc. (which we refer to as “Inspire”). Inspire offers mortgageis authorized to originate Federal National Mortgage Association (“Fannie Mae”), Federal Home Loan Mortgage Corporation (“Freddie Mac”), FHA, and Department of Veterans Affairs-guaranteed (“VA”) mortgages (which
we refer to collectively as the “government sponsored entities”). We also offer title and home owners insurance services tothrough our homebuyers. In addition to Inspire,wholly owned subsidiaries, Parkway Title, LLC (which we refer to as “Parkway Title”“Parkway”) provides title servicesand IHL Home Insurance Agency, LLC (which we refer to select markets in which we operate.as “IHL”), respectively. These operations along with Inspire and Parkway Titlecollectively comprise our
Financial Services operating segment. We seekbelieve that our customers’ use of Inspire, Parkway, and IHL provides us with a competitive advantage by enabling more control over the quality of the overall home buying process for our customers, while also helping us align the timing of the house construction process with our customers’ financing, title and insurance needs.
The results of operations of our Financial Services operating segment are primarily driven by the results of Inspire. Because Inspire originates mortgage loans primarily for our homebuilding customers, Inspire is dependent on our homebuilding operations and its results of operations are highly correlated with our homebuilding operations, and to assista lesser degree the overall market demand for mortgages.
Our Financial Services segment generated income before income tax of $51.2 million for the year ended December 31, 2021, a 5.5% increase over the prior year. This increase was primarily the result of a $20.4 million increase in financial services revenue during the year ended December 31, 2021 compared to the prior year period. This increase was due to (1) a 21.1% increase to 8,375 in the number of mortgages originated during the year ended December 31, 2021, due to our homebuyersincreased capture rate of 76% as compared to 64% for the prior year period and the increase in obtaining financingthe number of homes delivered by arrangingour Century Communities and Century Complete brands year over year, and (2) a 25.2% increase in the number of loans sold to third parties during the year ended December 31, 2021 as compared to the prior year period. These increases were partially offset by (1) lower fair value of our mortgage loans held for sale and our mortgage loans in process for which interest rates were locked by borrowers, (2) reduced gain on sale margin from loans sold and (3) increased headcount to support continued growth, in each case as compared to the prior year period.
Inspire sells substantially all of the loans it originates, either as whole loans, or with servicing retained, in the secondary mortgage market within a short period of time after origination, generally within 30 days. This strategy results in owning the loans for only a short period of time. After the loans are sold, Inspire may be responsible for potential losses associated with mortgage lenders to offer qualified buyers a variety of financing options.
Materials
When constructing homes, we use various materialsloans originated and components. It has typically taken us five to eight months or more to construct a home, during which time materials are subject to price fluctuations. Such price fluctuations are caused by several factors, among them seasonal variation in availability and increased demand for materials as a result of the improved housing market.
Seasonality
We experience seasonal variations in our quarterly operating results and capital requirements. Historically, new order activity is highest during the spring and summer months. As a result, we typically have more homes under construction, close more homes, and have greater revenues and operating incomesold in the second halfevent of our fiscal year. Historical results are not necessarily indicativeerrors or omissions relating to customary industry-standard representations and warranties made by Inspire that the loans met certain requirements. Representations include underwriting standards, the existence of current or future homebuilding activities.primary mortgage insurance, and the validity of certain borrower representations in connection with the loans.
Governmental regulationRegulation and environmental mattersEnvironmental Matters
We are subject to numerous local, state, federal and other statutes, ordinances, rules and regulations concerning zoning, development, building design, construction and similar matters which impose restrictive zoning and density requirements in order to limit the number of homes that can eventually be built within the boundaries of a particular area. In the normal course of business, we incur the costs associated with these laws and regulations, which are included in our homebuilding cost of revenues. Projects that are not entitled may be subjected to periodic delays, changes in use, less intensive development or elimination of development in certain specific areas due to government regulations. We may also be subject to periodic delays or may be precluded entirely from developing in certain communities due to building moratoriums or “slow-growth” or “no-growth” initiatives that could be implemented in the future. Local and state governments also have broad discretion regarding the imposition of development fees for projects in their jurisdiction. Projects for which we have received land use and development entitlements or approvals may still require a variety of other governmental approvals and permits during the development process and can also be impacted adversely by unforeseen municipal, regulatory, health, safety and welfare issues, which can further delay these projects or prevent their development.
We are also subject to a variety of local, state, federal and other statutes, ordinances, rules and regulations concerning the environment. The particular environmental laws which apply to any given homebuilding site vary according to the site’s location, its environmental conditions, and the present and former uses of the site, as well as adjoining properties. Environmental laws and conditions may result in delays, may cause us to incur substantial compliance and other costs, which are difficult or impossible to estimate, and can prohibit or severely restrict homebuilding activity in environmentally sensitive regions or areas. From time to time, the Environmental Protection Agency and similar federal or state agencies review homebuilders’ compliance with environmental laws and may levy fines and penalties for failure to strictly comply with applicable environmental laws or impose additional requirements for future compliance as a result of past failures. Any such actions taken with respect to us may increase our costs. Further, we expect that increasingly stringent requirements will be imposed on homebuilders in the future. Environmental regulations can also have an adverse impact on the availability and price of certain raw materials such as lumber. Any delays and costs associated with our compliance with environmental laws and conditions have not materially impacted our results of operations.
Under various environmental laws, current or former owners of real estate, as well as certain other categories of parties, may be required to investigate and clean up hazardous or toxic substances or petroleum product releases, and may be held liable to a governmental entity or to third parties for property damage and for investigation and cleanup costs incurred by such parties in connection with the
contamination. In addition, in those cases where an endangered species is involved, environmental rules and regulations can result in the elimination of development in identified environmentally sensitive areas. To date, we have never had a significant environmental issue.
SegmentOur mortgage, title, and geographic area disclosures
We have broken our homebuilding operations intoinsurance subsidiaries must comply with applicable real estate, lending and insurance laws and regulations. The subsidiaries are licensed in the following reportable segments based on the geographic marketsstates in which they do business and must comply with laws and regulations in those states. These laws and regulations include provisions regarding capitalization, operating procedures, investments, lending and privacy disclosures, forms of policies and premiums. The Dodd-Frank Wall Street Reform and Consumer Protection Act contains a number of requirements relating to mortgage lending and securitizations. These include, among others, minimum standards for lender practices, limitations on certain fees and a requirement that the originator of loans that are securitized retain a portion of the risk, either directly or by holding interests in the securitizations. The impact of those statutes, rules, and regulations can be to increase our home buyers’ cost of financing, increase our cost of doing business, and restrict our home buyers’ access to some types of loans.
Several federal, state and local laws, rules, regulations and ordinances, including, but not limited to, the Federal Fair Debt Collection Practices Act (“FDCPA”) and the Federal Trade Commission Act and comparable state statutes, regulate consumer debt collection activity. Although, for a variety of reasons, we operate:
| ·
| | West (Southern California, Central Valley, Bay Area and Washington)
|
| ·
| | Mountain (Colorado, Nevada and Utah)
|
| ·
| | Texas (Houston, San Antonio and Austin)
|
| ·
| | Southeast (Georgia, North Carolina, South Carolina and Tennessee)
|
We have also identifiedmay not be specifically subject to the FDCPA or to some state statutes that govern debt collectors, it is our Financial Services operations, which provide mortgage and title servicespolicy to comply with applicable laws in our collection activities. To the extent that some or all of these laws apply to our homebuyers, ascollection activities, our failure to comply with such laws could have a fifth reportable segment. Our Corporate operationsmaterial adverse effect on us. We are a nonoperating segment, as it servesalso subject to support our homebuilding operations throughregulations promulgated by the Federal Consumer Financial Protection Bureau regarding residential mortgage loans.
functions, such as our executive, finance, treasury, human resources, and accounting departments. We have adjusted prior period segment information to conform to the current period presentation.
Footnote 2 (Reporting Segments) of our Consolidated Financial Statements contains information regarding the operations of our reportable segments.
The below table presents the approximate number of employees for each reportable segment as of December 31, 2017 and 2016.
| | | | | | |
| | Year Ended December 31, |
| | 2017 | | 2016 |
West | | | 160 | | | - |
Mountain | | | 262 | | | 265 |
Texas | | | 106 | | | 95 |
Southeast | | | 308 | | | 165 |
Financial Services | | | 70 | | | - |
Corporate | | | 105 | | | 40 |
Total | | | 1,011 | | | 565 |
Competition
We face competition in the homebuilding industry, which is characterized by relatively low barriers to entry. Homebuilders compete for, among other things, home buying customers, desirable land parcels, employees, financing, raw materials and skilled labor. Increased competition may prevent us from acquiring attractive land parcels on which to build homes or make such acquisitions more expensive, hinder our market share expansion or lead to pricing pressures on our homes that may adversely impact our margins and revenues. Our competitors may independently develop land and construct housing units that are superior or substantially similar to our products, or may be significantly larger, have a longer operating history and have greater resources or lower cost of capital than us; accordingly, they may be able to compete more effectively in one or more of the markets in which we operate or plan to operate. We also compete with other homebuilders that have long-standing relationships with subcontractors and suppliers in the markets in which we operate or plan to operate and we compete for sales with individual resales of existing homes and with available rental housing.
Our Financial Services operations compete with other mortgage lenders, including national, regional and local mortgage bankers and brokers, banks, savings and loan associations and other financial institutions, in the origination and sale of residential mortgage loans. Principal competitive factors include interest rates and other features of mortgage loan products available to the consumer. We compete with other title insurance agencies and underwriters for closing services and title insurance. We also compete with other insurance agencies. Principal competitive factors include service and price.
Human Capital Resources
We believe our employees have and will continue to be a primary reason for our growth and success. We place a focus on attracting and retaining talented and experienced individuals to manage and support our operations. Recognizing the importance of our human capital, our Board of Directors, through the Compensation Committee, retains direct oversight of our human capital and oversees and reviews our culture and policies and strategies related to human capital management, including with respect to diversity and inclusion initiatives, pay equity, talent, recruitment and development, performance management and employee engagement.
Employees
The total number of full-time employees as of December 31, 2021 was 1,600, which includes 246 employees related to our Financial Services segment and 1,354 employees related to our corporate and homebuilding operations. Within our homebuilding operations, the majority of our employees are related to our construction and sales functions, which totaled 405 and 342 employees, respectively, as of December 31, 2021. We do not have collective bargaining agreements relating to any of our employees. However, we subcontract many phases of our homebuilding operations and some of the subcontractors we use may have employees who are represented by labor unions.
Employee compensation and benefits
We offer our employees pay and benefits packages, which we believe are competitive with others throughout our industry, as well as within the local markets in which we operate. Compensation packages for our employees generally include competitive base pay and the opportunity to receive periodic bonus payments which are tied to individual employee performance and often times the achievement of operational performance targets. These operational performance targets vary by year and may vary based on local market
conditions. Additionally, for certain employees critical to the management of our operations, we provide long-term incentive compensation, in the form of restricted stock units, which typically vest over a three year period. We believe this compensation structure provides our employees with competitive pay and aligns individual performance with Company success.
Employee training
In accordance with our Commitment to Training and Professional Development, Century trains its employees in a variety of areas, including company policies, anti-harassment, anti-discrimination, sales, information technology including cyber security risks, retirement and financial wellness planning, and safety. On an individual level, we are committed to providing employees with the feedback necessary to improve their performance, reviewing expectations of their position, and fostering growth in their current role.
Diversity, inclusion, and ethics
As set forth in our Commitment to Diversity and Inclusion, we are committed to hiring and supporting a diverse and inclusive workforce. We define diversity as the range of human differences, including but not limited to race, ethnicity, gender, gender identity, sexual orientation, age, social class, physical ability or attributes, religious or ethical values system, national origin, and political beliefs. We aim to create an inclusive organization where all employees are treated with dignity and respect and are empowered to reach their full potential. Among other programs, all new employees are required to take trainings related to anti-harassment and anti-discrimination. Further, all employees are trained on anti-harassment and anti-discrimination every two years or more often if required by state law. We are committed to equal opportunity from the time a position becomes open, and are committed to pay equity, a core element of our pay-for-performance strategy.
Additionally, all our employees are expected to display and encourage honest, ethical, and respectful conduct in the workplace. Our employees must adhere to our Code of Business Conduct and Ethics that sets standards for appropriate behavior and includes periodic training on preventing, identifying, reporting, and stopping discrimination of any kind.
Health and safety
We are committed to workplace health and safety, as outlined in our Labor Rights Policy. Safety is promoted through designated lead Safety Officers, who promote and maintain Occupational Safety and Health Administration compliance. Additionally, Century conducts monthly safety audits, as well as third-party safety inspections, to ensure our construction operations are safe. Century also provides safety training through webinars, classroom settings, field onsite forums, trade toolbox talks, and one-on-one mentoring with third-party safety auditors.
The health of our employees and others is also critical to our workplace. During 2020 and 2021, in response to the COVID-19 pandemic, we implemented safety protocols and procedures to protect our employees, customers, homeowners and trade partners. These procedures include complying with social distancing and other health and safety standards as required by federal, state, and local government agencies. Additionally, we modified the way in which we conduct many aspects of our business to reduce the amount of in-person contact and interactions. We significantly expanded the use of virtual interactions in all aspects of our business, including customer facing activities. Our teams across all facets of the Company were able and continue to adapt to these changes in our work environment and have successfully managed our business during the pandemic.
Available Information
We are a U.S. public reporting company under the Securities Exchange Act of 1934, as amended (which we refer to as the “Exchange Act”), and file reports, proxy statements, and other information with the U.S. Securities and Exchange Commission (which we refer to as the “SEC”). Copies of these reports, proxy statements, and other information can be accessed from the SEC's home page on the Internet at http://www.sec.gov. Our Annual Reports on Form 10-K, Quarterly Reports on Form 10-Q, and Current Reports on Form 8-K are available free of charge on our website at www.centurycommunities.com as soon as reasonably practicable after such materials are electronically filed with, or furnished to, the SEC. The information contained on our website or connected to our website is not incorporated by reference into this Form 10-K and should not be considered part of this report.
ITEM 1A.RISK FACTORS.
Our business routinely encounters and attempts to address risks, some of which will cause our future results to differ, sometimes materially, from those originally anticipated. Below, we have described our present view of the most significantmaterial risks facing the Company. The risk factors set forth below are not the only risks that we may face or that could adversely affect us. If any of the circumstances described in the risk factors discussed in this Form 10-K actually occur, our business, prospects, liquidity, financial condition and results of
operations could be materially and adversely affected. If this were to occur, the trading price of our securities could decline significantly and stockholders may lose all or part of their investment.
The following discussion of risk factors contains “forward-looking“forward-looking statements,” which may be important to understanding any statement in this Form 10-K or in our other filings and public disclosures. In particular, the following information should be read in conjunction with the sections in this Form 10-K entitled, “Cautionary“Cautionary Note about Forward-Looking Statements,” “Item“Item 7. Management’sManagement’s Discussion and Analysis of Financial Condition and Results of Operations,” and “Item“Item 8. Financial Statements and Supplementary Data.”
Risk Factors Summary
This summary is not complete and should be read in conjunction with the risk factors that follow.
Risks Related to the Housing Market and General Economic Conditions
We are subject to demand fluctuations in the housing industry.
Adverse changes in general economic conditions, including inflation, unemployment rates, interest rates, and availability of financing, and changing home buying patterns and trends could reduce demand for our homes.
Our long-term growth depends upon our ability to successfully identify and acquire desirable land parcels at reasonable prices and to successfully manage our land and lot inventory.
Our geographic concentration and changes to the population growth rates in our markets could adversely affect our business.
Risks Related to the Homebuilding and Real Estate Industries
Our operating results are dependent on our ability to develop our communities successfully and within expected timeframes and to maintain good relations with the residents of our communities.
We face risks regarding utility, resource, raw material, building supply and labor shortages and prices, which have been exacerbated by recent inflation and supply chain disruptions.
We are subject to potential liability for health and safety incidents and product liability and warranty claims, which may exceed our insured limits.
The homebuilding industry is cyclical, seasonal and competitive.
Real estate investments are risky and dependent upon our ability to successfully manage our land acquisitions and development and construction processes.
Risk Related to Our Financial Services Business
Our mortgage lending business requires substantial capital, which may not continue to be available to us in the amounts we require and at acceptable pricing.
Our Financial Services segment can be adversely affected by reduced demand for our homes, a slowdown in mortgage refinancings, our inability to sell mortgages into the secondary market or potential liability in connection with such sales.
The financial services market is competitive.
Governmental regulation may adversely affect our Financial Services operations.
A cyber attack or other security breach of our Financial Services business could subject us to significant liability and harm our reputation.
Risks Related to Human Capital Management
The success of our business is dependent upon highly skilled, competent and key personnel, as well as suitable contractors.
We depend on key personnel, the loss of which could have a material adverse effect on our business
Risks Related to the COVID-19 Pandemic
There is significant uncertainty regarding the extent to which and how long the COVID-19 pandemic and its related effects will impact the U.S. economy.
Risks Related to Governmental, Regulatory, Legal and Compliance Matters
Government regulations and legal challenges may delay the start or completion of our communities, increase our costs and expenses or limit our homebuilding or other activities.
We may face substantial damages or be enjoined from pursuing important activities as a result of existing or future litigation, arbitration or other claims.
We are subject to liability under various data protection laws, the non-compliance of which could subject us to significant monetary damages, regulatory enforcement actions, fines and/or criminal prosecution.
Risks Related to Environmental Matters
We are subject to environmental laws and regulations, which may increase our costs, limit the areas in which we can build homes, delay completion of our projects or result in potential liability.
Risks Related to Weather and Climate Change
Adverse weather and geological conditions may increase our costs, cause project delays and reduce consumer demand for housing.
Changes in global or regional climate conditions and governmental actions in response to such changes may adversely affect us by increasing the costs of, or restricting, our planned or future growth activities.
Risk Related to Acquisitions and Joint Venture Investments
Acquisitions, investments and/or disposals involve risks and may result in unexpected costs and unrealized benefits.
A significant portion of our historical growth has been due to our prior acquisitions and we may not be able to continue to grow through acquisitions.
Risks Related to Our BusinessIndebtedness and Liquidity
Difficulty in obtaining sufficient additional capital at reasonable prices when needed could result in an inability to acquire land for our developments or increased costs and delays in the completion of our development projects.
We have substantial indebtedness and expect to continue to use leverage in executing our business strategy.
Interest expense on our debt limits our cash available to fund our growth strategies and we may be unable to generate sufficient cash flows to meet our debt service obligations or comply with our covenants.
Risks Related to Tax Policies and Regulation
Tax policies and regulation, including in particular any limitation on, or reduction or elimination of, tax benefits associated with owning a home or increases in property and sales taxes, may affect our business.
Risk Related to Possible Conflicts of Interest
Conflicts of interest may arise as a result of relationships between our Co-Chief Executive Officers and the Company.
Risks Related to Ownership of our Common Stock
The ownership of our common stock is risky as it is subordinated to our existing and future indebtedness.
Our actual operating results may differ significantly from our guidance, which could cause the market price of our common stock to decline.
General Risk Factors
We are subject to several other risks of which other public companies are subject, including without limitation, the effect of negative publicity; increased scrutiny related to our environmental, social and governance practices; information technology failures or data security breaches; our ability to change our operational policies, investment guidelines and business and growth strategies without stockholder consent; and our ability to maintain an effective system of internal controls.
Risks Related to the Housing Market and General Economic Conditions
We are subject to demand fluctuations in the housing industry. Any reduction in demand for our homes would adversely affect our business, results of operations, and financial condition.
Demand for our homes is subject to fluctuations, often due to factors outside of our control. In a housing market downturn when demand for our homes decreases, our revenues and results of operations are typically adversely affected; we may have significant inventory impairments and other write-offs; our gross margins may decline significantly from historical levels; and we may incur substantial losses from operations. At any particular time, we cannot accurately predict whether housing market conditions existing at that time will continue. For example, in the beginning of the COVID-19 pandemic, we experienced a decrease in demand for our homes which began to reverse course in May and June of 2020 and remained strong throughout the rest of 2020 and all of 2021. Despite overall strong demand and sales during 2021, continued demand for our homes during 2022 and beyond is uncertain in light of rising inflation, decreased consumer confidence, decreased availability of credit, and other factors, including those described elsewhere in this report.
Adverse changes in general economic conditions could reduce the demand for our homes and, as a result, could have a material adverse effect on us.our business, results of operations and financial condition.
The residential homebuilding industry is cyclical and is highly sensitive to changes in local and general economic conditions that are outside our control, including:
| ·
| | consumer confidence, levels of employment, personal income growth and household debt-to-income levels of potential homebuyers;
|
| ·
| | the availability of financing for homebuyers, including private and federal mortgage financing programs and federal, state, and provincial regulation of lending practices;
|
| ·
| | real estate taxes and federal and state income tax provisions, including provisions for the deduction of mortgage interest payments;
|
| ·
| | U.S. and global financial system and credit markets, including short- and long-term interest rates and inflation;
|
| ·
| | housing demand from population growth and demographic changes (including immigration levels and trends in urban and suburban migration);
|
| ·
| | competition from other real estate investors with significant capital, including other real estate operating companies and developers and institutional investment funds; and
|
| ·
| | the supply of new or existing homes and other housing alternatives, such as apartments and other residential rental property.
|
The U.S. housing market can also be negatively impacted by declining consumer confidence, employment levels, job growth, spending levels, wage and personal income growth, personal indebtedness levels, and household debt-to-income levels of potential homebuyers;
the availability and cost of financing for homebuyers or restrictive mortgage standards, including private and relatively large suppliesfederal mortgage financing programs and federal, state, and provincial regulation of lending practices;
real estate taxes and federal and state income tax provisions, including provisions for the deduction of mortgage interest payments;
U.S. and global financial system and credit markets, including short- and long-term interest rates and inflation;
housing demand from population growth, household formations, new home buying catalysts (such as marriage and children), second home buying catalysts (such as retirement), home sale catalysts (such as an aging population), demographic changes (including immigration levels and trends in urban and suburban migration), generational shifts, or otherwise, or perceptions regarding the strength of the housing market, and home price appreciation and depreciation resulting therefrom;
competition from other real estate investors with significant capital, including other real estate operating companies and developers, institutional investment funds and companies solely focused on single-family rentals; and
the supply of new or existing homes, including foreclosures, resales and new homes, among other factors. housing alternatives, such as apartments and other residential rental property, and the aging of existing housing inventory.
In the event these economic and business factors occur, we could experience declinesa decline in the demand and pricing for our homes, an increase in customer cancellations, an increase in selling concessions and downward pressure on the market value of our inventory, and demand for our homes, which could have a material adverse effect on our business, prospects, liquidity, financial condition and results of operations.
The health ofoperations and increase the residential homebuilding industry may also be significantly affected by “shadow inventory” levels. “Shadow inventory” refers to the number of homes with a mortgage that are in some form of distress but that have not yet been listedrisk for sale. Shadow inventory can occur when lenders put properties that have been foreclosed or forfeited to lenders on the market gradually, rather than all at once, or delay the foreclosure process. They may choose to do so because of regulations and foreclosure moratoriums, because of the additional costs and resources required to process and sell foreclosed properties, or because they want to avoid depressing housing prices further by putting many distressed properties up for sale at the same time.asset impairments. A significant shadow inventoryor sustained downturn in our markets could, were it to be released into our markets, adversely impact home prices and demand for our homes, which couldthe homebuilding market would likely have a materialan adverse effect on our business prospects, liquidity, financial condition and results of operations.operations for multiple years.
In addition, an important segmentthe portion of our customer base that consists of first- and second-time move-up buyers, who often purchase homes subject to contingencies related to the sale and/or closing of their existing homes. The difficulties thatIf these potential buyers face difficulties in selling or closing their homes, duringwhether due to periods of weak economic conditions, oversupply, high interest rates, restrictive mortgage standards or otherwise, our sales may be adversely affect our sales.affected. Moreover, during such periods, we may need to reduce our sales prices and offer greater incentives to buyers to compete for sales that may result in reduced margins.
Furthermore, deployments of U.S. military personnel to foreign regions, terrorist attacks, other acts of violence or threats to national security and any corresponding response by the United States or others, related domestic or international instability or civil unrest may cause an economic slowdown in the markets where we operate, which could adversely affect our business.
Our future success depends upon our ability to successfully adapt our business strategy to changing home buying patterns and trends.
Future changing home buying patterns and trends could reduce the demand for our homes and, as a result, could have a material adverse effect on our business and results of operations. Our business strategy has historically been to offer homes that appeal to a broad range of entry-level, move-up and, lifestyle homebuyers based on each local market in which we operate. However, given the significant increases in average home sales prices across our markets and the increased demand for more affordable homes due to generational shifts, affordability concerns, changing demographics and other factors, we have increased our focus on offering more affordable housing options in our markets. We believe that due to anticipated generational shifts, changing demographics and other factors, the demand for more entry-level and affordable homes will increase. This is particularly true in light of future home buyers being motivated to move out of their apartments or confined living areas, often in urban areas, and into more spacious homes, often in nearby suburbs, as they spend more time at home as a result of part- and full-time remote-working arrangements, which has become significantly more prevalent due primarily to the COVID-19 pandemic and which is expected to continue beyond the pandemic. Indeed, part of our strategy with our Century Complete brand is to target first time home buyers with an asset light business model. Our Century Complete brand targets entry-level homebuyers, primarily sells homes through retail studios and the internet, and generally provides no option or upgrade opportunities. We have also pivoted our Century Communities brand to target more affordable price points as well. No assurance can be provided that our current business strategy to focus on more affordable homes will be effective or that we will successfully anticipate and react to future changing home buying patterns and trends, which may include higher levels of single-family rental demand. In addition, if the level of new home demand continues to increase in future periods as a result of changing home buying patterns or trends
or otherwise, the risk of shortages and cost increases in residential lots, labor and materials available to the homebuilding industry will likely increase.
Our long-term growth depends upon our ability to successfully identify and acquire desirable land parcels at reasonable prices for residential build-out.
Our future growth depends upon our ability to successfully identify and acquire attractive land parcels for development of our homes at reasonable prices and with terms that meet our underwriting criteria. Our ability to acquire land parcels for new homes may be adversely affected by changes in the general availability of land parcels, the willingness of land sellers to sell land parcels at reasonable prices, competition for available land parcels, availability of financing to acquire land parcels, zoning, governmental and municipal restrictions, including environment restrictions, and other market conditions. There can be no assurance that an adequate supply of homebuilding lots will continue to be available to us on terms similar to those available in the past. If the supply of land parcels appropriate for development of homes is limited because of these factors, or for any other reason, our ability to grow could be significantly limited, and the number of homes that we build and sell could decline. Additionally, our ability to begin new projects could be impacted if we elect not to purchase land parcels under option contracts. To the extent that we are unable to purchase land parcels on a timely basis or enter into new contracts for the purchase of land parcels at reasonable prices, our home sales revenue and results of operations could be negatively impacted.
Our geographic concentration could materially and adversely affect us if the homebuilding industry in our current markets should decline.
Our business strategy is focused on the design, construction and sale of single-family detached and attached homes in metropolitan areas in17 states throughout the States of California, Colorado, Georgia, Nevada, North Carolina, South Carolina, Tennessee, Texas, Utah, and Washington. BecauseU.S. While our operations are concentrated in these areas,geographically diverse, a prolonged economic downturn in one or more of thesethe areas in which we operate could have a material adverse effect on our business, prospects, liquidity, financial condition and results of operations, and a disproportionately greater impact on us than other homebuilders with larger scale and more diversified operations.operations and geographic footprint.
Any increase in unemployment or underemployment may lead to reduced demand for our homes and an increase in the number of loan delinquencies and property repossessions and have an adverse impact on our business and results of operations.
In the United States, the unemployment rate was 3.9% as of the end of December 2021, according to the U.S. Bureau of Labor Statistics. People who are not employed, are underemployed, such as those who have exited the workforce as a result of concerns related to the COVID-19 pandemic, or are concerned about the loss of their jobs are less likely to purchase new homes, may be forced to try to sell the homes they own and may face difficulties in making required mortgage payments. Therefore, an increase in unemployment or underemployment may lead to an increase in the number of loan delinquencies and property repossessions and have an adverse impact on us.
In the United States, the unemployment rate was 4.1% as of the end of December 2017, according to the U.S. Bureau of Labor Statistics. People who are not employed, are underemployed or are concerned about the loss of their jobs are less likely to purchase new homes,
may be forced to try to sell the homes they own and may face difficulties in making required mortgage payments. Therefore, any increase in unemployment or underemployment may lead to an increase in the number of loan delinquencies and property repossessions and have an adverse impact on usour business by both by reducing the demand for the homes we build and by increasing the supply of homes for sale.sale, which would also likely adversely affect our Financial Services business, which is dependent upon the sale of our homes. In addition, an increase in unemployment or underemployment may result in increased default rates on mortgage loans we originated, which could expose us to repurchase obligations or other liabilities, reduce our ability to sell or finance the loans we originate or require us to sell or finance the loans we originate on less favorable terms, lead us to impose stricter loan qualification standards, or result in us no longer being able to offer financing terms that are attractive to potential buyers, all of which would adversely affect our Financial Services business.
If homebuyers are not able to obtain suitable financing, our results of operations may decline.
The success of homebuilders depends on the ability of potential homebuyers to obtain mortgages for the purchase of homes. If the home financing market is unstable or contracts, our revenues and results of operations could be adversely affected. A substantial majority of our homebuyers finance their home purchases through lenders that provide mortgage financing.financing or through our Financial Services business. First-time homebuyers are generally more affected by the availability of financing than other potential homebuyers. These buyers are an important source of our demand.demand, especially in light of our Century Complete segment, which targets first time home buyers. A limited availability of home mortgage financing may adversely affect the volume of our home sales and the sales prices we achieve inobtain. This environment would also likely adversely affect our Financial Services business.
In the United States.
During the recent past, the mortgage lending industry in the United States has experienced significant instability, beginning with increased defaults on subprime loans and other nonconforming loans and compounded by expectations of increasing interest payment requirements and further defaults. This in turn resulted in a decline in the market value of many mortgage loans and related securities. In response, lenders, regulators and others questioned the adequacy of lending standards and other credit requirements for several loan products and programs offered in recent years. Credit requirements have tightened, and investor demand for mortgage loans and mortgage-backed securities has declined. The deterioration in credit quality during the economic downturn had caused almost all lenders to stop offering subprime mortgages and most other loan products that were not eligible for sale to Fannie Mae or Freddie Mac, or loans that did not conform to
Fannie Mae, Freddie Mac, FHAFederal Housing Administration (which we refer to as the “FHA”) or Veterans Administration (which we refer to as the “VA”“VA”) requirements. Fewer loan products and tighter loan qualifications may continue to make it more difficult for certain buyers to finance the purchase of our homes. Additionally, if the federal government were to reduce or eliminate mortgage loan programs (including due to any failure of lawmakers to agree on a budget or appropriation legislation to fund relevant programs or operations), it may make it more difficult for our customers to finance the purchase of our homes. These factors may reduce the pool of qualified homebuyers and make it more difficult to sell to first-time and move-up buyers, who have historically made up a substantial part of our customers.customers and will likely continue to make up a substantial part of our customers especially in light of our Century Complete segment. Reductions in demand adversely affected our business and financial results during thethat downturn. The liquidity provided by Fannie Mae and Freddie Mac to the mortgage industry has been very important to the housing market. These entities in the past have required substantial injections of capital from the federal government and may require additional government support in the future. Several federal government officials have proposed changing the nature of the relationship between Fannie Mae and Freddie Mac and the federal government and even nationalizing or eliminating these entities entirely. If Fannie Mae and Freddie Mac were dissolved or if the federal government determined to stop providing liquidity support to the mortgage market, there would be a reduction in the availability of the financing provided by these institutions. Any such reduction would likely have an adverse effect on interest rates, mortgage availability and our sales of new homes.
The FHA insures mortgage loans that generally have lower loan payment requirements and qualification standards compared to conventional guidelines, and as a result, continue to be a particularly important source for buyers financing the salepurchase of our homes. The FHA has in recent years tightened its underwriting standards, which affects potential home buyers, including in particular first-time buyers. In addition, in recent years, lenders have taken a more conservative view of FHA guidelines causing significant tightening of borrower eligibility for approval. Availability of condominium financing and minimum credit score benchmarks hashave reduced opportunity for those purchasers. In the future, there may be further restrictions on FHA-insured loans, including limitations on seller-paid closing costs and concessions.concessions, stricter loan qualification standards, and an increase in minimum down payment requirements. This or any other restriction may negatively affect the availability or affordability of FHA financing, which could adversely affect our potential homebuyers’homebuyers’ ability to secure adequate financing and, accordingly, our ability to sell homes in the United States. In addition, changes in federal and provincialstate regulatory and fiscal policies aimed at aiding the home buying market (including a repeal or another limitation of the home mortgage interest tax deduction) may also negatively affect potential homebuyers’homebuyers’ ability or desire to purchase homes.
Decreases in the availability of credit and increases in the cost of credit adversely affect the ability of homebuyers to obtain or service mortgage debt. Even if potential homebuyersbuyers of our homes do not themselves need mortgage financing, where our potential homebuyersbuyers must sell their existing homes in order to buy a new home,one of our homes, increases in mortgage costs, lack of availability of mortgages and/or regulatory changes could prevent the buyers of potential homebuyers’ existing homes from obtainingdelay or adversely affect such a mortgage,sale, which would result in our potential customers’customers’ inability to buy a new home. Similar risks apply to those buyers who are awaiting delivery of their homes and are currently in backlog. The success of homebuilders depends on the ability of potential homebuyers to obtain mortgages for the purchase of homes. If our customers (or potential buyers of our customers’customers’ existing homes) cannot obtain suitable financing, our sales and results of operations could be adversely affected, and the price of our common stock may decline.affected.
Interest rate increases or changes in federal lending programs or other regulations could lower demand for our homes, which could materially and adversely affect us.our business and results of operations.
Most of the purchasers of our homes finance their acquisitions with mortgage financing. Risingfinancing and in many cases obtain their mortgage financing through our Financial Services business. Mortgage interest rates have been near historic lows for the past several years. While interest rates rose during the beginning of 2019, they decreased availabilitysubstantially during the remainder of mortgage financing or2019 and remained relatively low throughout 2020 and most of certain mortgage programs, higher down payment requirements or2021. However, interest rates have increased monthly mortgagerecently, and the Federal Reserve has indicated that it may raise interest rates in March 2022. Increases in interest rates increase the costs may lead to reducedof owning a home and could adversely affect the purchasing power of consumers and lower demand for the homes we sell, which could result in a decrease in sales, adversely affecting our homes and mortgage loans.results of operations. Increased interest rates can also decrease homebuyer confidence and hinder our ability to realize our backlog because our home purchase contracts typically provide customers with a financing contingency. Financing contingencies allow customers to cancel their home purchase contracts in the event that they cannot arrange for adequate financing. As a result, rising interest rates can decrease our
home sales and mortgage originations. Any of these factorsIn addition, monetary policy actions affecting interest rates or fiscal policy actions and new legislation related to taxation, spending levels or borrowing limits, along with the related political debates, conflicts and compromises associated with such actions, may negatively impact the financial markets and consumer confidence. Such events could have a material adverse effect onhurt the U.S. economy and the housing market and in turn, could adversely affect our business, prospects, liquidity, financial condition and results of operations.operating results.
In addition, the federal government plays a significant role in supporting mortgage lending through its conservatorship of Fannie Mae and Freddie Mac, both of which purchase home mortgages and mortgage-backed securities originated by mortgage lenders, and its insurance of mortgages originated by lenders through the FHA and the VA. The availability and affordability ofChanges in these programs could materially adversely affect the mortgage loans, including consumer interest rates for such loans, could be adversely affected bymarket, which would have a curtailment or cessation of the federal government’s mortgage-related programs or policies.negative impact on our business. The FHA may continue to impose stricter loan qualification standards, raise minimum down payment requirements, impose higher mortgage insurance premiums and other costs, and/or limit the number of mortgages it insures. Due to growing federal budget deficits,Several bills have been introduced in Congress over the U.S. Treasury may not be able to continue supportingpast several years concerning the mortgage-related activitiesfuture status of Fannie Mae and Freddie Mac the FHA and the VA at present levels, or it may revise significantlymortgage finance system, including bills which provided for the federal government’s participation in and supportwind-down
of Fannie Mae and Freddie Mac FHA-or proposed modifications to the financial relationship between Fannie Mae and VA-backedFreddie Mac and the federal government. The liquidity provided by Fannie Mae and Freddie Mac to the mortgage financing isindustry has been very important to the housing market. Eliminating Fannie Mae and Freddie Mac would mean that conventional loans, like the 30-year mortgage, would no longer be guaranteed, which would be likely to result in the elimination of these traditional, long-term, fixed-rate loans, and result in an important factorincrease in marketinginterest rates for longer term products. If Fannie Mae and selling many of our homes, any limitations, restrictionsFreddie Mac were dissolved or changesif the federal government determined to stop providing liquidity support to the mortgage market, there would be a reduction in the availability of the financing provided by these institutions. Any such government-backedreduction would likely have an adverse effect on interest rates and mortgage availability, and we would expect our sales of new homes to decline.
Our home purchase contracts typically provide our customers with a financing could reducecontingency, which allows our customers to cancel their home purchase contracts in the event that they cannot arrange for adequate financing. Increased interest rates, restrictions or reductions in government backed mortgage financing or the tightening of lenders’ borrowing standards may make it more difficult for our customers to obtain financing, which would decrease our home sales which couldand mortgage originations and have a material adverse effect on our business, prospects, liquidity, financial condition and results of operations.
Any limitation on, or reduction or elimination of, tax benefits associated with owning a home would have an adverse effect on the demand for our home products, which could be material to our business.
Significant expenses of owning a home, including mortgage interest and real estate taxes, generally are deductible expenses for an individual’s U.S. federal, and in some cases, state income taxes, subject to various limitations under current tax law and policy. If the U.S. federal government or a state government changes its income tax laws, as has been discussed from time to time, to eliminate, limit or substantially modify these income tax deductions, the after-tax cost of owning a new home would increase for many of our potential customers.
On December 22, 2017, the Tax Cuts and Jobs Act (which we refer to as the “TCJA”) was signed into law. The TCJA imposes certain caps and limitations for certain homeowners, such as lowering the mortgage interest deduction cap on a newly purchased home to $750,000 a year from the current $1,000,000 threshold. The resulting loss or reduction of homeowner tax deductions may adversely impact demand for and sales prices of new homes.
Increases in taxes could prevent potential customers from buying our homes and adversely affect our business or financial results.
Increases in property tax rates by local governmental authorities, as experienced in response to reduced federal and state funding, can adversely affect the ability of potential customers to obtain financing or their desire to purchase new homes. Fees imposed on developers to fund schools, open spaces or road improvements, and/or to provide low and moderate income housing, could increase our costs and have an adverse effect on our operations. In addition, increases in sales taxes could adversely affect our potential customers who may consider those costs in determining whether to make a new home purchase and decide, as a result, not to purchase one of our homes.
The recently passed comprehensive tax reform bill could adversely affect our business and financial condition.
On December 22, 2017, TCJA was signed into law. The TCJA significantly reforms the Internal Revenue Code of 1986, as amended. The TCJA, among other things, contains significant changes to corporate taxation, including reduction of the corporate tax rate from a top marginal rate of 35% to a flat rate of 21%, limitation of the tax deduction for interest expense to 30% of adjusted earnings (except for certain small businesses), limitation of the deduction for net operating losses to 80% of current year taxable income, elimination of net operating loss carrybacks, one time taxation of offshore earnings at reduced rates regardless of whether they are repatriated, immediate deductions for certain new investments instead of deductions for depreciation expense over time, and modifying or repealing many business deductions and credits. We continue to examine the impact this tax reform legislation may have on our business. Notwithstanding the reduction in the corporate income tax rate, the overall impact of the TCJA is uncertain and our business and financial condition could be adversely affected. Furthermore, as a result of the reduction in the corporate tax rates, we expect to have a significant reduction in the value of our deferred tax assets, but we have not yet fully determined the amount of such reduction.The impact of this tax reform on holders of our common stock is also uncertain and could be adverse.
Changes to the population growth rates in certain of the markets in which we operate or plan to operate could affect the demand for our homes in these regions.
Slower rates of population growth or population declines in the States of California, Colorado, Georgia, Nevada, North Carolina, South Carolina, Tennessee, Texas, Utah, and Washington,markets where we do business, or other key markets in the United States we plan to enter, especially as compared
to the high population growth rates in prior years, could adversely affect the demand for housing, causing home prices in these markets to fall, and adversely affect demand for our homes and our plans for growth, business, financial condition and operating results.
DifficultyInflation could adversely affect our business and financial results.
Inflation, which increased significantly during 2021, has adversely affected us by increasing the costs of land, materials and labor needed to operate our business and could continue to adversely affect us in obtaining sufficient capital could result in an inabilityfuture periods. In the event inflation continues to acquire land for our developments or increased costs and delays in the completion of development projects.
The homebuilding industry is capital-intensive and requires significant up-front expenditures to acquire land parcels and begin development. If internally generated funds are not sufficient,increase, we may seek additionalto increase the sales prices of homes in order to maintain satisfactory margins which to date has proven successful. However, an oversupply of homes relative to demand, home prices being set several months before homes are delivered and affordability concerns may make any such increase difficult or impossible in future periods. In addition, inflation is often accompanied by higher interest rates, which historically have had a negative impact on housing demand. In such an environment, we may not be able to raise home prices sufficiently to keep up with the rate of inflation and our margins could decrease. Moreover, the cost of capital in the formincreases as a result of equity or debt financing from a variety of potential sources, including additional bank financings and/or securities offerings. The availability of borrowed funds, especially for land acquisition and construction financing, may be greatly reduced nationally,inflation and the lending communitypurchasing power of our cash resources declines. Actions by the government to stimulate the economy may require increased amountsincrease the risk of equity to be invested in a project by borrowers in connection with both new loans and the extension of existing loans. The credit and capital marketssignificant inflation, which may have recently experienced significant volatility. If we are required to seek additional financing to fund our operations, continued volatility in these markets may restrict our flexibility to access such financing. If we are not successful in obtaining sufficient capital to fund our planned capital and other expenditures, we may be unable to acquire land for our housing developments and/or to develop the housing. Additionally, if we cannot obtain additional financing to fund the purchase of land under our option contracts or purchase contracts, we may incur contractual penalties and fees. Any difficulty in obtaining sufficient capital for planned development expenditures could also cause project delays and any such delay could result in cost increases. Any one or more of the foregoing events could have a materialan adverse effectimpact on our business prospects, liquidity,or financial condition and results of operations.results.
We face potentially substantial risk with respect to our land and lot inventory arising from significant changes in economic or market conditions.
We intend to acquire land parcels for replacementconditions, which could adversely affect our results of operations and expansionresult in write-downs of the carrying values of land inventory within our currentwe own.
We face substantial risk in owning developed and any new markets. The risks inherentundeveloped land. We acquire undeveloped land, buildable lots and housing inventories in purchasing and developing land parcels increase as consumer demand for housing decreases. As a result,the markets where we may buy and develop land parcels on which homes cannot be profitably built and sold.build homes. The market value of land, parcels, building lots, and housing inventories can fluctuate significantly as a result of changing market conditions, and the measures we employ to manage inventory risk may not be adequate to insulate our operations from a severe drop in inventory values. The risks inherent in purchasing and developing land parcels increase as consumer demand for housing decreases. If housing demand decreases below what we anticipated when we acquired our inventory, our results of operations may be adversely affected and we may not be able to recover our costs when we sell and build houses.
When market conditions are such that land values are not appreciating, previously entered into option agreements may become less desirable, at which time we may elect to forego deposits and pre-acquisition costs and terminate the agreements.agreements, which could result in abandonment charges and adversely affect our operating results and financial condition. In addition, inventory carrying costs can be significant, particularly if inventory must be held for longer than planned, and can result in losses in aon poorly performing projectprojects or market.markets. Factors, such as changes in regulatory requirements and applicable laws (including in relation to building regulations, taxation and planning), political conditions, the condition of financial markets, both local and national economic conditions, the financial condition of customers, potentially adverse tax consequences, and interest and inflation rate fluctuations, subject land valuations to uncertainty.
We regularly review the value of our land holdings and continue to review our holdings on a periodic basis. In the eventface of significant changes in economic oradverse market conditions, we may have substantial inventory carrying costs, and may have to write down our inventory to its fair value, and/or sell land or homes at a loss. In the past, we have been required to record significant write-downs of the carrying value of our land inventory, and have elected not to exercise options to purchase land, even though that required us to forfeit deposits and write-off pre-acquisition costs. Although we have taken efforts to reduce our exposure to costs of that type, a certain amount of exposure is inherent
in our homebuilding business. If market conditions were to deteriorate in the future, we could again be required to record significant write downs to our land inventory, which would decrease the asset values reflected on our consolidated balance sheet and could adversely affect our results of operations and financial condition and result in write-downs of the carrying values of land we own.
Increases in our home cancellation rate could have a negative impact on our home sales revenue and homebuilding margins.
Our backlog reflects sales contracts with homebuyers for homes that have not yet been delivered. We have received a deposit from a homebuyer for most homes reflected in our backlog, and generally we have the right to retain the deposit if the homebuyer fails to comply with his or her obligations under the sales contract, subject to certain exceptions, including as a result of state and local law and in certain circumstances, the homebuyer’s inability to sell his or her current home or, the homebuyer’s inability to obtain suitable financing. Home order cancellations negatively impact the number of closed homes, at significantly lower marginsnet new home orders, home sales revenue and results of operations, as well as the number of homes in backlog. Home order cancellations can result from a number of factors, including declines or at a loss, if we are ableslow appreciation in the market value of homes, increases in the supply of homes available to be purchased, increased competition, higher mortgage interest rates, homebuyers’ inability to sell them at all. their existing homes, homebuyers’ inability to obtain suitable financing, including providing sufficient down payments, and adverse changes in economic conditions. An increase in the level of our home order cancellations could have a negative impact on our business, prospects, liquidity, financial condition and results of operations.
Risks Related to the Homebuilding and Real Estate Industries
If we are unable to develop our communities successfully or within expected timeframes, our results of operations could be adversely affected.
Before a community generates any revenues, significant time and material expenditures are required to acquire land, obtain development approvals and construct significant portions of project infrastructure, amenities, model homes and sales facilities. A decline in our ability to develop and market our communities successfully, especially in our more recent or new markets where it may be more difficult to do so, and to generate positive cash flow from these operations in a timely manner could have a material adverse effect on our business and results of operations and on our ability to service our debt and to meet our working capital requirements.
Adverse weatherUtility and geological conditionsresource shortages or rate fluctuations could have an adverse effect on our operations.
Several of the markets in which we operate or may increaseoperate in the future have historically been subject to utility and resource shortages, including significant changes to the availability of electricity and water and seasonal fluctuation in the ability of certain commodities, particularly lumber. Shortages of natural resources in our markets may make it more difficult for us to obtain regulatory approval of new developments. We have also experienced material fluctuations in utility and resource costs cause project delaysacross our markets due, in part, to rising inflation and supply chain disruptions, and we may incur additional costs and may not be able to complete construction on a timely basis if such fluctuations arise. In particular, as the housing market has improved and the number of new homes being constructed has increased, we have experienced increased construction costs due to additional competition for labor and materials, the supply of which have recently been constrained by labor shortages and supply chain issues, respectively. Furthermore, these shortages and rate fluctuations may adversely affect the regional economies in which we operate, which may reduce consumer demand for our homes and negatively affect our business and results of operations.
A major health and safety incident relating to our business could be costly in terms of potential liabilities and reputational damage.
Building sites are inherently dangerous, and operating in the homebuilding industry poses certain inherent health and safety risks. Given the number of projects we work on, health and safety performance is critical to the success of all areas of our business. Any failure in health and safety performance may result in penalties for non-compliance with relevant regulatory requirements, and a failure that results in a major or significant health and safety incident is likely to be costly in terms of potential liabilities incurred as a result. Such a failure could also generate significant negative publicity, which could adversely impact our reputation, sales of our homes, relationships with relevant regulatory agencies and governmental authorities, and our ability to win new business, which in turn could have a material adverse effect on our business, financial condition and operating results.
We may not be able to compete effectively against competitors in the homebuilding industry, especially in our recent markets and new markets we plan to enter.
Competition in the homebuilding industry is intense, and there are relatively low barriers to entry into our business. We compete with large national and regional homebuilding companies and with smaller local homebuilders for home buying customers, land, financing, raw materials, and skilled management and labor resources. A number of our primary competitors are significantly larger, have a longer operating history, a more diversified geographic footprint and may have greater resources, less leverage or lower cost of capital than ours. Accordingly, these competitors may be able to compete more effectively in one or more of the markets in which we operate. In
addition, their increased scale may allow them to endure higher land and labor costs and buy raw materials more cheaply, as well as be less vulnerable to general economic conditions and fluctuations in housing demand. Many of these competitors have long-standing relationships with subcontractors and suppliers in the markets in which we operate and therefore better access to qualified labor and lower raw material costs. As we have expanded our operations into new markets, we have faced and will likely continue to face new competition from many established homebuilders in those markets, and we will not have the benefit of the extensive relationships and strong reputations with subcontractors, suppliers and homebuyers that we have historically enjoyed in our Colorado and other legacy markets. Increased competition could hurt our business, as it could prevent us from acquiring attractive land parcels on which to build homes or make such acquisitions more expensive, increase our labor and raw material costs, hinder our growth plans, lead to pricing pressures on our homes; cause us to increase selling concessions; and cause impairments in the value of our inventory or other assets, all of which may adversely impact our revenues, margins and other operating results.
We also compete with sellers of existing homes, including foreclosed homes, and more recently with rental housing, including in particular single-family rentals. Until 2012, the single-family rental business consisted primarily of private and individual investors in local markets and was managed individually or by small, local property managers. Since then, numerous large, well-capitalized real estate investment trusts and other vehicles have entered this business, resulting in a significant increase in the number of single-family rental homes. Increases in and an oversupply of competitively priced resale, foreclosure or rental homes in our markets could materially and adversely affect us.
As a homebuilder, we are subject to numerous risks, many of which are beyond our management’s control, such as droughts, floods, wildfires, landslides, soil subsidence, earthquakes and other weather-related and geological events which could damage projects, cause delays in completion of projects, or reduce consumer demand for housing, and shortages in labor or materials, which could delay project completion and cause increases in the prices for labor or materials, thereby affecting our sales and profitability. Many of our core markets are in Colorado, an area which has historically experienced seasonal wildfires and soil subsidence. Texas, a market into which we continue to expand, has historically experienced tornadoes, coastal flooding and hurricanes. California and Nevada, markets into which we recently expanded, have historically experienced extreme temperatures, droughts and water shortages. In addition to directly damaging our projects, earthquakes, wildfires, mudslides or other geological events could damage roads and highways providing access to those projects, thereby adversely affecting our ability to marketsell homes profitably.
One of our strategic initiatives is to evaluate opportunistic strategies for construction of single-family and multi-family rental units. This strategy, however, involves risks, especially in those areaslight of the numerous large, well-capitalized real estate investment trusts and possibly increasingother vehicles and companies that have entered this business. If we decide to pursue this new business, it would require additional capital and we would compete in securing debt financing or potential equity partners. We would also compete for tenants with the costsalready existing or newly built rental apartments, as well as with sellers of completion. homes. These competitive conditions could negatively impact our ability to enter into or succeed in this business if we decide to pursue it.
ThereIf we are some risks of loss for which we may be unable to purchase insurance coverage. For example, losses associated with landslides, earthquakessuccessfully compete in the homebuilding industry, especially in our recent markets and other geological events may not be insurable and other losses, such as those arising from terrorism, may not be
economically insurable. A sizeable uninsured loss could materially and adversely affectnew markets we plan to enter, our business, prospects, liquidity, financial condition and results of operations.operations could be materially and adversely affected.
ChangesRaw materials and building supply shortages and price fluctuations could delay or increase the cost of home construction and adversely affect our operating results.
The homebuilding industry has, from time to time, experienced raw material shortages and been adversely affected by volatility in global commodity prices and government imposed tariffs and trade regulations. In particular, shortages and fluctuations in the price of concrete, drywall, steel, lumber or regional climate conditionsother important raw materials could result in delays in the start or completion of, or increase the cost of, developing one or more of our residential communities. These shortages can be more severe during periods of strong demand for housing or during periods following natural disasters that have a significant impact on existing residential and governmental actionscommercial structures. The cost of raw materials also may be materially and adversely affected during periods of shortages or high inflation. In 2021, we experienced lumber and other building material shortages caused in responsepart by supply chain disruptions and price increases resulting from such supply chain disruptions, increased demand and the rising rate of inflation. We currently anticipate that these trends will likely continue into 2022.
Shortages or increases in the price of raw materials could cause delays in and increase our costs of home construction. We generally are unable to such changespass on increases in construction costs to customers who have already entered into home purchase contracts and may not be able to sufficiently increase the price of homes remaining to be sold due to affordability concerns or otherwise. Sustained increases in construction costs may adversely affect us by increasing the costs of, or restricting, our planned or future growth activities.
Projected climate change, if it occurs, may exacerbate the scarcity or presence of water and other natural resources in affected regions, which could limit, prevent or increase the costs of residential development in certain areas. In addition, there is a variety of new legislation being enacted, or considered for enactment, at the federal, state and local level relating to energy and climate change, and as climate change concerns continue to grow, legislation and regulations of this nature are expected to continue. This legislation relates to items such as carbon dioxide emissions control and building codes that impose energy efficiency standards. Government mandates, standards or regulations intended to mitigate or reduce greenhouse gas emissions or projected climate change impacts could result in prohibitions or severe restrictions on land development in certain areas, increased energy and transportation costs, and increased compliance expenses and other financial obligations to meet permitting, land development, or home construction-related requirements that we may be unable to fully recover (due to market conditions or other factors), any of which could cause a reduction in our homebuilding gross margins, andwhich in turn could materially and adversely affect our consolidatedbusiness, liquidity, financial statements. Energy-related initiativescondition and results of operations.
The cost of petroleum products, which are used both to deliver our materials and to transport workers to our job sites, fluctuates and may be subject to increased volatility as a result of geopolitical events or accidents. Increases in such costs could similarlyalso result in higher prices for any product utilizing petrochemicals. We experienced such increases during the second half of 2021, though these cost increases did not have a material adverse effect on our operations. However, if such cost increases persist or worsen, they may have an adverse effect on our operating margins and results of operations. Furthermore, any such cost increase may adversely affect the regional economies in which we operate and reduce demand for our homes.
Homebuilding is subject to product liability and warranty claims arising in the ordinary course of business that can be significant.
As a wide varietyhomebuilder, we are subject to home warranty and construction defect claims arising in the ordinary course of companies throughoutbusiness. There can be no assurance that any developments we undertake on homes we construct will be free from defects once completed. Construction defects may arise in projects, developments and homes and may arise during a significant period of time after completion. Defects
arising on a development or a home attributable to us may lead to significant contractual or other liabilities. As a consequence, we maintain products and completed operations excess liability insurance, obtain indemnities and certificates of insurance from subcontractors generally covering claims related to damages resulting from their faulty workmanship and materials, and create warranty and other reserves for the homes we sell based on historical experience in our markets and our judgment of the risks associated with the types of homes built. We cannot provide assurance that our insurance coverage, our subcontractor arrangements and our reserves will be adequate to address all of our warranty and construction defect claims in the future. In addition, contractual indemnities can be difficult to enforce. We may also be responsible for applicable self-insured retentions, and some types of claims may not be covered by insurance or may exceed applicable coverage limits. Additionally, the coverage offered by and the availability of products and completed operations excess liability insurance for construction defects is becoming increasingly expensive and the scope of coverage is restricted. There is no assurance that adequate insurance coverage will continue to be available with acceptable price and terms. If we cannot recover from our subcontractors or their insurance carriers, we may suffer even greater losses.
Unexpected expenditures attributable to defects or previously unknown sub-surface conditions arising on a development project may also have a material adverse effect on our business, financial condition and operating results. In addition, severe or widespread incidents of defects giving rise to unexpected levels of expenditures, to the extent not covered by insurance or redress against subcontractors, may adversely affect our business, reputation, financial condition and operating results.
We may suffer uninsured losses or suffer material losses in excess of insurance limits.
We could suffer physical damage to property and liabilities resulting in losses that may not be fully compensated by insurance. In addition, certain types of risks, such as personal injury claims, may be, or may become in the future, either uninsurable or not economically insurable, or may not be currently or in the future covered by our insurance policies. Should an uninsured loss or a loss in excess of insured limits occur, we could sustain financial loss or lose capital invested in the affected property as well as anticipated future income from that property. In addition, we could be responsible for repairing damages or covering liabilities caused by uninsured risks. We may be liable for any debt or other financial obligations related to affected property.
In the United States, the coverage offered and the world,availability of general liability insurance for construction defects is currently limited and is costly. As a result, an increasing number of our subcontractors in the United States may be unable to obtain insurance. If we cannot effectively recover construction defect liabilities and costs of defense from our subcontractors or their insurers, or if we have self-insured subcontractors who cannot cover the losses they cause, we may suffer losses. Insurance coverage may be further restricted and become even more costly in our industry. Premium amounts on many of our insurance policies are subject to audit during or following the expiration of the policy, which may result in an obligation to pay additional premiums. Such circumstances could adversely affect our business, financial condition and operating results.
Our operating performance is subject to risks associated with the real estate industry.
Real estate investments are subject to various risks and fluctuations and cycles in value and demand, many of which are beyond our control. Certain events may decrease cash available for operations, as well as the value of our real estate assets. These events include, but are not limited to:
adverse changes in financial conditions of buyers and sellers of properties, particularly residential homes and land suitable for development of residential homes;
adverse changes in international, national or local economic and demographic conditions;
competition from other real estate investors with significant capital, including other real estate operating companies and developers and institutional investment funds;
reductions in the level of demand for and increases in the supply of land suitable for development;
fluctuations in interest rates, which could adversely affect our ability, or the ability of homebuyers, to obtain financing on favorable terms, or at all;
unanticipated increases in expenses, including, without limitation, insurance costs, development costs, real estate assessments and other taxes and costs of compliance with laws, regulations and governmental policies; and
changes in enforcement of laws, regulations and governmental policies, including, without limitation, health, safety, environmental, zoning, tax and disability rights laws.
In addition, periods of economic slowdown or recession, rising interest rates, inflation, or declining demand for real estate, or the public perception that any of these events may occur, could result in a general decline in the purchase of homes or an increased incidence of home order cancellations. If we cannot successfully implement our business strategy, our business, prospects, liquidity, financial condition and results of operations will be adversely affected.
Because real estate investments are relatively illiquid, our ability to promptly sell one or more properties for reasonable prices in response to changing economic, financial and investment conditions may be limited and we may be forced to hold non-income producing properties for extended periods of time.
Real estate investments are relatively difficult to sell quickly. As a result, our ability to promptly sell one or more properties in response to changing economic, financial and investment conditions is limited. We may be forced to sell assets at significantly lower margins or at a loss, if we are able to sell them at all, or hold non-income producing assets for an extended period of time, which could have a negative impact on our liquidity or results of operations.
Our quarterly operating results may fluctuate because of the seasonal nature of our business and other factors.
Our quarterly operating results generally fluctuate by season. Historically, we have entered into a larger percentage of contracts for the sale of our homes during the spring and summer months. Weather-related problems, typically in the fall, late winter and early spring, may delay starts or closings and increase costs and thus reduce profitability. Seasonal natural disasters such as floods and fires could cause delays in the completion of, or increase the cost of, developing one or more of our communities, causing an adverse effect on our sales and revenues. In many cases, we may not be able to recapture increased costs by raising prices. In addition, deliveries may be staggered over different periods of the year and may be concentrated in particular quarters. Our quarterly operating results may fluctuate because of these and other factors, including without limitation:
the timing of home closings and land sales;
our ability to continue to acquire additional land or secure option contracts to acquire land on acceptable terms;
conditions of the real estate market in areas where we operate and of the general economy;
inventory impairments or other material write-downs;
raw material and labor shortages; and
other changes in operating expenses, including the cost of labor and raw materials, personnel and general economic conditions.
Poor relations with the residents of our communities could negatively impact sales, which could adversely affect our revenues or results of operations.
Residents of communities we develop rely on us to resolve issues or disputes that may arise in connection with the operation or development of their communities. Efforts made by us to resolve these issues or disputes could be deemed unsatisfactory by the affected residents and subsequent actions by these residents could adversely affect our sales or reputation. In addition, we could be required to make material expenditures related to the settlement of such issues or disputes or to modify our community development plans, which could adversely affect our results of operationsoperations.
Failure to manage land acquisitions and development and construction processes could result in significant cost overruns or errors in valuing sites.
We own and purchase a large number of sites each year and are heavilytherefore dependent on significant amountsour ability to process a very large number of rawtransactions (which include, among other things, evaluating the site purchase, designing the layout of the development, sourcing materials and subcontractors and managing contractual commitments) efficiently and accurately. Errors by employees, failure to comply with regulatory requirements and conduct of business rules, failings or inadequacies in internal control processes, inabilities to obtain desired approvals and entitlements, cost overruns, equipment failures, natural disasters or the failure of external systems, including those of our suppliers or counterparties, could result in operational losses that could adversely affect our business, operating results and financial condition and our relationships with our customers.
Risk Related to Our Financial Services Business
We are subject to various risks relating to our Financial Services business.
There are numerous risks involved with engaging in our mortgage lending business, and these initiativesrisks may be exacerbated for us in light of the fact that we do not have a long history in this business. Because we have limited experience in originating and underwriting home loans, our underwriting standards may not be as stringent as a more traditional lender, and accordingly, we may experience a higher rate of default than lenders who have engaged in the mortgage lending industry for a longer period of time. Moreover, the loans we originate are often to buyers of our homes, so our pool of borrowers is generally less diverse than as is the case with a traditional lender, and thus there could be a higher correlation in the default rate with our borrowers. In addition, because we originate loans to buyers of our homes, there is the risk that we may be more incentivized, compared to more traditional lenders, to lower our underwriting standards in order to close home sales. Should we not be able to establish sufficiently stringent underwriting standards, or if our underwriting standards do not adequately screen quality applicants, the default rate on the loans we originate may be higher, which could have an indirect adverse
impact on our results of operations and profitabilityfinancial condition, either because the borrowers under loans we own are no longer performing, or because we are required to repurchase or otherwise indemnify purchasers, guarantors or insurers of the loans we sold or securitized. Further, if we face a high default rate on the mortgages we originate, we may be unable to sell mortgages or the pricing we receive upon the sale of mortgages may not meet our expectations. Although we have established reserves for potential losses on mortgage loans we originate and sell or securitize, which we believe are adequate, if either actual repurchases or the losses incurred resolving those repurchases exceed our expectations, additional expense may be incurred. There can be no assurance that we will not have significant liabilities in respect of such claims in the future, which could exceed our reserves, or that the impact of such claims on our results of operations will not be material.
Our mortgage lending business requires substantial capital, which may not continue to be available to us in the amounts we require.
Inspire has mortgage warehouse facilities with Comerica Bank, J.P. Morgan and Wells Fargo. These mortgage warehouse lines of credit (which we refer to as the “Repurchase Facilities”) provide Inspire with repurchase facilities of up to an aggregate of $400 million as of December 31, 2021, secured by the mortgage loans financed thereunder. Amounts outstanding under the Repurchase Facilities are not guaranteed by us or any of our subsidiaries and the agreements contain various affirmative and negative covenants applicable to Inspire that are customary for arrangements of this type. The mortgage repurchase facilities must be renewed annually. We expect to renew and extend the term of the Repurchase Facilities with similar terms prior to their maturity. Adverse changes in market conditions could make the renewal of these facilities more difficult or could result in an increase in the cost of these facilities or a decrease in the committed amounts. Such changes affecting our Repurchase Facilities may also make it more difficult or costly to sell the mortgages that we originate. As of December 31, 2021, we had $331.9 million outstanding under these Repurchase Facilities and were in compliance with all covenants thereunder. No assurance can be provided, however, that we will remain in compliance with the covenants or have continued access to these facilities or substitute or replacement facilities in an amount sufficient to fund our mortgage lending business.
Our Financial Services segment can be adversely affected by reduced demand for our homes or by a slowdown in mortgage refinancings.
Approximately 84% of the mortgage loans closed by our Financial Services segment in 2021 were made to buyers of homes we built. Therefore, a decrease in the demand for our homes would adversely affect the revenues of this segment of our business. Despite overall strong demand and sales during 2021, continued demand for our homes is uncertain in light of rising inflation, decreased consumer confidence, decreased availability of credit, and other factors, including those described elsewhere in this report.
If our ability to sell mortgages into the secondary market is impaired, that could significantly reduce our ability to sell homes unless we are willing to become a long-term investor in the loans we originate.
We sell substantially all of the loans we originate either as loans with servicing rights released, or with servicing rights retained, in the secondary mortgage market within a short period of time after origination, generally within 30 days. If we are unable or choose not to sell loans into the secondary mortgage market or directly to Fannie Mae and Freddie Mac, we may have to either curtail our origination of residential mortgage loans, which among other things, could significantly reduce our ability to sell homes, or commit our own funds to long term investments in mortgage loans, which, in addition to requiring us to deploy substantial amounts of our own funds, could delay the time when we recognize revenues from home sales in our consolidated statements of operations.
Beginning in mid-2020 and continuing through 2021, due to reduced liquidity in the secondary market related to remedies provided in the Coronavirus Aid, Relief, and Economic Security Act (which we refer to as the CARES Act) to borrowers of residential loans, we began retaining mortgage servicing rights on some of our loan sales. As servicer for these loans, we may have to advance payments to the mortgage-backed securities bondholders to the extent there are insufficient collections to satisfy the manufacturersrequired principal and suppliersinterest remittances of the underlying mortgage-backed securities.
We may be liable for certain limited representations and warranties we make in connection with the sale of our materials are burdened with expensive caploans.
When we sell the loans we originate, we make customary representations and trade or other climate related regulations.
As a result, climate change impacts,warranties to purchasers, guarantors and lawsinsurers about the mortgage loans and land development and home construction standards, and/or the manner in which they were originated, and offer certain indemnities and guaranties to the purchasers, guarantors and insurers of which we are interpretedresponsible. In the event of defaults on the loans we originate, we may be required to repurchase or implemented,substitute mortgage loans, or indemnify buyers, guarantors or insurers of our loans. If we have significant liabilities with respect to address potential climate change concernssuch claims, it could increasehave an adverse effect on our costsresults of operations, and possibly our financial condition.
The financial services market is competitive and we may not be able to compete effectively in this area.
The competitors to our Financial Services business include other insurance agencies, title companies and mortgage lenders, including national, regional and local mortgage banks and other financial institutions. Some of these competitors are subject to fewer governmental regulations and have greater access to capital than we do, and some of them may operate with different criteria than we do. These competitors may offer a long-term adversebroader or more attractive array of financing and other products and services to potential customers than we do. For these reasons, we may not be able to compete effectively in the financial services market.
Governmental regulation of our Financial Services operations could adversely affect our business or financial results.
Our Financial Services operations are subject to extensive state and federal laws and regulations, which are administered by numerous agencies, including but not limited to the Consumer Financial Protection Bureau, Federal Housing Finance Agency, U.S. Department of Housing and Urban Development, FHA, VA, USDA, Fannie Mae, and Freddie Mac. These laws and regulations include many compliance requirements, including but not limited to licensing, consumer disclosures, fair lending and real estate settlement procedures. As a result, our Financial Services operations are subject to regular, extensive examinations by the applicable agencies. In addition, the possibility of additional future regulations, changing rule interpretations and examinations by regulatory agencies may result in more stringent compliance standards and could adversely affect the results of our operations.
Our ability to collect upon mortgage loans may be limited by the application of state laws.
Our mortgage loans typically permit us to accelerate the debt upon default by the borrower. The courts of all states will enforce acceleration clauses in the event of a material payment default, subject in some cases to a right of the court to revoke the acceleration and reinstate the mortgage loan if a payment default is cured. The equity courts of a state, however, may refuse to allow the foreclosure of a mortgage or to permit the acceleration of the indebtedness in instances in which they decide that the exercise of those remedies would be inequitable or unjust or the circumstances would render an acceleration unconscionable.
Further, the ability to collect upon mortgage loans may be limited by the application of state and federal laws. For example, Nevada has enacted a law providing that if the amount an assignee of a mortgage note paid to acquire the note is less than the face amount of the note, the assignee cannot recover more through a deficiency action than the amount it paid for the note. If the Nevada law is upheld, or similar laws are enacted in other jurisdictions, it could materially and adversely affect our ability and the ability of funds we manage to profit from purchases of distressed debt.
Any cyber attack or other security breach of or vulnerability in our technology systems, or those of our customers or other third-party vendors we rely on, especially with respect to our Financial Services business, could have operational impacts, subject us to significant liability and harm our reputation.
Our Financial Services operations rely heavily on the secure processing, storage and transmission of sensitive and confidential financial, personal and other information in our computer systems and networks. There have been several highly publicized cases involving financial services companies reporting the unauthorized disclosure of customer or other confidential information in recent years, as well as cyber attacks involving theft, dissemination and destruction of corporate information or other assets, in some cases as a result of failure to follow procedures by employees or contractors or as a result of actions by third parties. Cyber attacks can originate from a variety of sources, including third parties affiliated with foreign governments, organized crime or terrorist organizations. Third parties may also attempt to place individuals within our company or induce employees, customers or other users of our systems to disclose sensitive information or provide access to our data, and these types of risks may be difficult to detect or prevent. Although cybersecurity incidents among companies in the financial services industry are on the rise, we are not aware of any material losses relating to cyber attacks or other information security breaches. However, the techniques used in these attacks are increasingly sophisticated, change frequently and are often not recognized until launched. Although we seek to maintain a robust suite of authentication and layered information security controls, these controls could fail to detect, mitigate or remediate these risks in a timely manner. Despite our implementation of protective measures and endeavoring to modify them as circumstances warrant, our computer systems, software and networks may be vulnerable to human error, natural disasters, power loss, spam attacks, unauthorized access, distributed denial of service attacks, computer viruses and other malicious code, and other events that could result in significant liability and damage to our reputation, and have an ongoing impact on the security and stability of our operations.
We also rely on numerous third-party service providers to conduct other aspects of our Financial Services operations, and we face similar risks relating to them. While we regularly conduct security assessments on these third-party vendors, we cannot be certain that their information security protocols are sufficient to withstand a cyber attack or other security breach. In addition, in order to access our services, our customers may use computers and other devices that are beyond our security control systems and processes.
Notwithstanding the precautions we take, if a cyber attack or other information security breach were to occur, especially with respect to our Financial Services business, this could jeopardize the information we confidentially maintain, or otherwise cause interruptions in our operations or those of our customers, exposing us to liability. As attempted attacks continue to evolve in scope and consolidatedsophistication, we may be required to expend substantial additional resources to modify or enhance our protective measures, to investigate and remediate vulnerabilities or other exposures or to communicate about cyber attacks to our customers. Though we have insurance against some cyber risks and attacks, we may be subject to litigation and financial statements. Thislosses that exceed our policy limits or are not covered under any of our current insurance policies.
Interest rate changes may adversely affect us. Although we attempt to mitigate interest rate risk with hedging activities, such activities may not be effective and also involve risk.
In our Financial Services business, we utilize forward commitments on mortgage-backed securities, forward commitments, and investor commitments to protect the value of interest rate lock commitments and loans held for sale from fluctuations in mortgage-related interest rates. To mitigate interest risk associated with loans held for sale, we use derivative financial instruments to hedge our exposure to risk from the time a borrower locks a loan until the time the loan is a particular concern securitized. We may obtain additional forms of interest rate protection—in the western United States,form of swap agreements, interest rate cap contracts or similar agreements—to hedge against the possible negative effects of interest rate fluctuations. However, we cannot assure that any hedging will adequately relieve the adverse effects of interest rate increases or that counterparties under these agreements will honor their obligations thereunder. In addition, we may be subject to risks of default by hedging counterparties. Adverse economic conditions could also cause the terms on which have instituted somewe borrow to be unfavorable. We could be required to liquidate one or more of the most extensive and stringent environmental laws and residential building construction standardsour assets at times which may not permit us to receive an attractive return on our assets in the country.order to meet our debt service obligations.
Risks Related to Human Capital Management
Failure to recruit, retain and develop highly skilled, and competent personnel may have a material adverse effect on our standards of service.service and adversely affect our business.
Key employees, including members of our management team, members, are fundamental to our ability to obtain, generate and manage business opportunities. Key employees working in the homebuilding and construction industries are highly sought after.after, especially in light of the unprecedented demand for new homes and current labor shortage. Failure to attract and retain such personnel or to ensure that their experience and knowledge is not lost when they leave the business through retirement, redundancy or otherwise may adversely affect the standards of our service and may have an adverse impact on our business, financial conditionscondition and operating results. In addition, we do not maintain key person insurance in respect of any member of our senior management team. The loss of any members of our management members or key personnel could adversely impact our business, financial condition and operating results.
Failure to find suitable contractors may have a material adverse effect on our standards of service.
Substantially all of our construction work is done by third-party subcontractors with us acting as the general contractor. Accordingly, the timing and quality of our construction depend on the availability and skill of our subcontractors. The recentAn increase in levels of homebuilding in the markets in which we operate has occasionally led to some difficulty in securing the services of skilled tradesmentrades people who are currently in high demand. Additionally, labor shortages, such as the labor shortage that began in 2021, may further increase the difficulty in securing the services of skilled trades people. While we anticipate being able to obtain sufficient materials and reliable subcontractors and believe that our existing relationships with subcontractors are good, we do not have long-term contractual commitments with any subcontractors, and there can be no assurance that skilled subcontractors will continue to be available at reasonable rates and in the areas in which we conduct our operations. In addition, as we expand into new markets, we typically must develop new relationships with subcontractors in such markets, and there can be no assurance that we will be able to do so in a cost-effective and timely manner, or at all.
In the future, certain of the subcontractors engaged by us may be represented by labor unions or subject to collective bargaining arrangements. A strike or other work stoppage involving any of our subcontractors could also make it difficult for us to retain subcontractors for our construction work. In addition, union activity could result in higher costs to retain our subcontractors. The inability to contract with skilled subcontractors at reasonable costs on a timely basis could have a material adverse effect on our business, prospects, liquidity, financial condition and results of operations.
Our reliance on contractors can expose us to various liability risks.
We rely on third-party contractors in order to perform the construction of our homes, and in many cases, to select and obtain raw materials. We are exposed to various risks as a result of our reliance on these contractors and their respective subcontractors and suppliers, including the possibility of defects in our homes due to improper practices or materials used by contractors or jobsite safety issues, which may require us to comply with our warranty obligations and/or bring a claim under an insurance policy. For example,
despite our quality control and jobsite safety efforts, we may
discover that our subcontractors were engaging in improper construction or safety practices or installing defective materials in our homes. When we discover these issues, we repair the homes in accordance with our new home warranty and as required by law. We establish warranty and other reserves for the homes we sell based on market practices, our historical experiences, and our judgment of the qualitative risks associated with the types of homes built. However, the cost of satisfying our warranty and other legal obligations in these instances may be significantly higher than our warranty reserves, and we may be unable to recover the cost of repair from such subcontractors. Regardless of the steps we take, we can in some instances be subject to fines or other penalties, and our reputation may be injured.
In addition, several other homebuilders have received inquiries from regulatory agencies concerning whether homebuilders using contractors are deemed to be employers of the employees of such contractors under certain circumstances. Although contractors are independent of the homebuilders that contract with them under normal management practices and the terms of trade contracts and subcontracts within the homebuilding industry, if regulatory agencies reclassify the employees of contractors as employees of homebuilders, homebuilders using contractors could be responsible for wage, hour and other employment-related liabilities of their contractors, which could adversely affect our results of operations.Century has not received similar inquiries.
If we experience shortages in labor supply, increased labor costs or labor disruptions, there could be delays or increased costs in developing our communities or building homes, which could adversely affect our margins and other operating results.
We require a qualified labor force to develop our communities. Access to qualified labor and the costs for such labor may be affected by circumstances beyond our control, including:
| ·
| | work stoppages resulting from labor disputes;
|
| ·
| | shortages of qualified trades people, such as carpenters, roofers, electricians and plumbers, especially in our key markets in the United States;
|
| ·
| | changes in laws relating to union organizing activity;
|
| ·
| | changes in immigration laws and trends in labor force migration; and
|
| ·
| | increases in subcontractor and professional services costs.
|
shortages of qualified trades people, such as carpenters, roofers, electricians and plumbers, especially in our key markets;
work stoppages resulting from labor disputes;
changes in laws relating to union organizing activity;
changes in immigration laws and trends in labor force migration; and
increases in wages and subcontractor and professional services costs.
Any of these circumstances could give rise to delays in the start or completion of, or could increase the costcosts of, developing one or more of our communities and building homes. Labor shortages, such as the labor shortage that began in 2021, can be more severe during periods of strong demand for housing and pricing for labor can be affected by the factors discussed above and various other national, regional and local economic and political factors. We may not be able to recover these increased costs by raising our home prices because the price for each home is typically set months prior to its delivery pursuant to sales contracts with our homebuyers.homebuyers and due to affordability concerns. In such circumstances, our operating results, including in particular, our margins, could be adversely affected. Additionally, market and competitive forces may also limit our ability to raise the sales prices of our homes.
Utility and resource shortages or rate fluctuationsWe depend on key personnel, the loss of which could have ana material adverse effect on our operations.business.
SeveralOur success depends to a significant degree upon the contributions of certain key personnel including, but not limited to, Dale Francescon and Robert Francescon, our Co-Chief Executive Officers, each of whom would be difficult to replace. Although we have entered into employment agreements with Dale Francescon and Robert Francescon, there is no guarantee that these executives will remain employed with us. In addition, we are dependent upon other key personnel, including in particular managerial, technical, sales and marketing, operations, and customer service personnel. Our future success will depend in large part on our ability to identify, attract, engage, train and retain highly qualified personnel. Competition for these individuals is intense, and we may not succeed in identifying, attracting, or retaining qualified personnel. The loss or interruption of the markets in which we operate and in which we may operateservices of any of our executive officers or other key employees, the inability to identify, attract, or retain qualified personnel in the future, have historically been subjectthe inability to utility and resource shortages, including significant changes to the availability of electricity and water and seasonal fluctuationsuccessfully implement executive officer, key employee or other personnel transitions, delays in the ability of certain commodities, particularly lumber. Shortages of natural resources in our markets, particularly of water, mayhiring qualified personnel, or any employee work slowdowns, strikes, or similar actions could make it more difficult for us to obtain regulatory approvalconduct and manage our business and meet key objectives, which could harm our business, financial condition, and operating results. The loss of new developments. We have also experienced material fluctuationsservices from key personnel or a limitation in utilitytheir availability could materially and resource costs acrossadversely impact our markets, and we may incur additional costs and may not be able to complete construction on a timely basis if such fluctuations arise. In particular, as the housing market has improved and the number of new homes being constructed has increased, we have experienced increased construction costs due to additional competition for labor and materials. Furthermore, these shortages and rate fluctuations may adversely affect the regional economies in which we operate, which may reduce demand for our homes and negatively affect our business, prospects, liquidity, financial condition and results of operations. Further, such a loss could be negatively perceived in the capital markets. We have not obtained and do not expect to obtain key person life insurance that would provide us with proceeds in the event of death or disability of any of our key personnel.
Termination of the employment agreements with the members of our executive management team could be costly and prevent a change in control of the Company.
The employment agreements we have entered into with Dale Francescon and Robert Francescon, our Co-Chief Executive Officers, and Dave Messenger, our Chief Financial Officer, each provide that if their employment with us terminates under certain circumstances, we may be required to pay them significant amounts of severance compensation, thereby making it costly to terminate their employment. In addition, under certain circumstances, the termination of employment of one of our Co-Chief Executive Officers could result in the
termination of employment of our other Co-Chief Executive Officer which would result in a requirement for us to pay severance compensation to both former executives. Furthermore, these provisions could delay or prevent a transaction or a change in control of the Company that might involve a premium paid for shares of our common stock or otherwise be in the best interests of our stockholders, which could adversely affect the market price of our common stock.
Risks Related to the COVID-19 Pandemic
There is significant uncertainty regarding the extent to which and how long the COVID-19 pandemic and its related effects will impact the U.S. economy, capital markets, secondary mortgage markets, consumer confidence, and availability of mortgage loans to homebuyers, and as a result, our business and future operating results and financial condition.
The global COVID-19 pandemic has created significant volatility, disruption and uncertainty. It has resulted in government restrictions, such as quarantines, travel advisories and the implementation of social distancing measures, leading to the closure of businesses and causing weakened economic conditions. While these circumstances did not materially adversely affect our 2021 financial results, we recognize that the long term macro-economic effects could ultimately impact the homebuilding industry and our business and future operating results.
There is significant uncertainty regarding the extent to which and how long COVID-19 and its related effects will impact the U.S. economy, capital markets, secondary mortgage markets, consumer confidence, and availability of mortgage loans to homebuyers. The extent to which COVID-19 will impact our business and operating results during 2022 will depend on future developments, including the duration and continued spread of COVID-19, including existing and new variants, such as Delta and Omicron, the acceptance and effectiveness of vaccines against COVID-19 and new variants that may arise, and the impact on our customers, trade partners and employees, as well as the U.S. economy, all of which are highly uncertain and cannot be predicted. The adverse effect of COVID-19 on the economy could negatively impact demand for new homes, as well as the origination volume of and revenues from our Financial Services segment. Despite strong demand for and sales of our homes during 2021, continued demand is uncertain in light of inflation, decreased consumer confidence, decreased availability of credit, and other factors, including those described in this report.
The COVID-19 pandemic may have other adverse effects on our business, operating results and financial condition, including:
availability of employees, their ability to work remotely and/or under revised work environment protocols, as well as the general willingness of employees to come to and perform work;
an increase in our use of sales incentives and concessions, which could adversely affect our margins;
an increase in customer cancellations of home purchase contracts;
deteriorating individual credit quality and an increase in default rates on mortgage loans we originated which may expose us to repurchase obligations or other liabilities, reduce our ability to sell or finance the loans we originate or on less favorable terms, lead us to impose stricter loan qualification standards, or result in us no longer being able to offer financing terms that are attractive to potential buyers;
an increase in the costs or decrease in the supply of building materials or the availability of subcontractors and other talent, including as a result of infections or medically necessary or recommended self-quarantining, or governmental mandates to direct production activities to support public health efforts;
one or more of our suppliers or subcontractors may experience financial distress, cancel, postpone or delay orders, be unable to perform under a contract, file for bankruptcy protection, go out of business, or suffer disruptions in their business or we may need to offer special payment terms or relief to our suppliers and subcontractors, subjecting us heightened credit risk;
increased costs and delays in the completion of our development projects;
decreased land acquisitions and the termination or modification of option contracts to conserve our cash resources;
potential future restructuring, impairment and other charges, which may be material, for inventory impairments or land option contract abandonments, or both;
potential disruption and volatility in the global capital and credit markets, which could adversely affect our ability to access lending, capital markets, and other sources of liquidity when needed and on reasonable terms and costs, or the ability of potential homebuyers to obtain suitable financing, especially if mortgage loan underwriting criteria tighten or default rates increase; and
our ability to comply with the financial covenants in our debt agreements if a material or extended economic downturn occurs.
We are uncertain of the potential full magnitude or duration of the business and economic impacts from the COVID-19 pandemic. This inherent uncertainty, due in part to governmental directives, which may be imposed or reinstated should there be a significant resurgence of COVID-19 cases and hospitalizations, public health challenges and progress, including the acceptance and effectiveness of vaccines, and market reactions thereto, makes it challenging for our management to estimate the future performance of our business and plan accordingly. Should the potential adverse impacts described above (or others that are currently unknown) occur, whether individually or collectively, we would expect to experience, among other things, decreases in our homes delivered, average selling prices, net new home contracts, revenues and profitability.
Finally, the impacts from the COVID-19 pandemic and efforts to contain it heighten the risks described in other risk factors in this report.
Risks Related to the Governmental, Regulatory, Legal and Compliance Matters
Government regulations and legal challenges may delay the start or completion of our communities, increase our expenses or limit our homebuilding or other activities, which could have a negative impact on our results of operations.
The approval of numerous governmental authorities must be obtained in connection with our development activities, and these governmental authorities often have broad discretion in exercising their approval authority. We incur substantial costs related to compliance with legal and regulatory requirements. Any increase in legal and regulatory requirements may cause us to incur substantial additional costs, or in some cases cause us to determine that the property is not feasible for development. Various local, provincial, state and federal statutes, ordinances, rules and regulations concerning building, health and safety, environment, zoning, sales and similar matters apply to and/or affect the housing industry.industry, and the approval of numerous governmental authorities must be obtained in connection with our development activities. These governmental authorities often have broad discretion in exercising their approval authority. We incur substantial costs related to compliance with legal and regulatory requirements in the markets in which we operate. Restrictive land use regulation and changes in legal and regulatory requirements may cause us to incur substantial additional costs, or in some cases, cause us to determine that a property we acquired is not feasible for development. This is particularly true in certain of the markets in which operate, including in particular California, Washington, and parts of Texas, among others.
Municipalities may restrict or place moratoriums on the availability of building permits and utilities, such as water and sewer taps. If municipalities in which we operate take such actions, it could have an adverse effect on our business by causing delays, increasing our costs or limiting our ability to operatebuild in those municipalities.
We In addition, we may become subject to various state and local “slow growth”“slow growth” or “no growth”“no growth” initiatives and other ballot measuresrestrictions that could negatively impact the availability of land and building opportunities within those localities.
Governmental regulation affects not only construction activities but also sales activities, mortgage lending activities and other dealings with consumers. In addition, it is possible that some form of expanded energy efficiency legislation may be passed by the U.S. Congress or federal agencies and certain state and provincial legislatures, which may, despite being phased in over time, significantly increase our costs of building homes and the sale price to our buyers, and adversely affect our sales volumes. We may be required to apply for additional approvals or modify our existing approvals because of changes in local circumstances or applicable law. Further, we may experience delays and increased expenses as a result of legal challenges to our proposed communities, whether brought by governmental authorities or private parties.
An inabilityFinally, because of our need to obtain additional performance, paymentgovernmental approvals in connection with our development activities, government shutdowns or slowdowns may have an adverse effect on our business.
Changes in accounting rules, assumptions and/or judgments could materially and completion surety bondsadversely affect us.
Accounting rules and lettersinterpretations for certain aspects of credit could limitour operations are highly complex and involve significant assumptions and judgment. Refer to Note 1 – Nature of Operations and Summary of Significant Accounting Policies in the Notes to the Consolidated Financial Statements for a description of certain changes in accounting rules and interpretations that may affect our future growth.
We are often requiredresults of operations. These complexities could lead to provide performance, paymenta delay in the preparation and completion surety bonds or letters of credit to secure the completiondissemination of our construction contracts, development agreementsfinancial statements. Furthermore, changes in accounting rules and other arrangements. We have obtained facilities to provide the required volume of performance, paymentinterpretations or in our accounting assumptions and/or judgments, such as asset impairments and completion surety bonds and letters of credit forcontingencies, could significantly impact our expected growth in the medium term; however, unexpected growth may require additional facilities. We may alsofinancial statements. In some cases, we could be required to renewapply a new or amend our existing facilities. Our ability to obtain additional performance, payment and completion surety bonds and lettersrevised standard retroactively, resulting in restating prior period financial statements. Any of credit primarily depends on our credit rating, capitalization, working capital, past performance, management expertise and certain external factors, including the capacity of the markets for such bonds. Performance, payment and completion surety bond and letter of credit providers consider these factors in addition to our performance and claims record and provider-specific underwriting standards, which may change from time to time.
If our performance record or our providers’ requirements or policies change, if we cannot obtain the necessary consent from our lenders, or if the market’s capacity to provide performance, payment and completion bonds or letters of credit is not sufficient for any unexpected growth and we are unable to renew or amend our existing facilities on favorable terms, or at all, we could be unable to obtain additional performance, payment and completion surety bonds or letters of credit from other sources when required, whichcircumstances could have a material adverse effect on our business, prospects, liquidity, financial condition and results of operations.
A major healthWe may face substantial damages or be enjoined from pursuing important activities as a result of existing or future litigation, arbitration or other claims.
In our homebuilding activities, we are exposed to potentially significant litigation, including, among others, breach of contract, contractual disputes and safety incidentdisputes relating to our business could be costly in termsdefective title, property misdescription or construction defects, including use of potential liabilitiesdefective materials. Although we have established warranty, claim and reputational damage.
Building siteslitigation reserves that we believe are inherently dangerous, and operating in the homebuilding industry poses certain inherent health and safety risks. Due to health and safety regulatory requirements and the number of projects we work on, health and safety performance is criticaladequate, due to the success of all areas of our business. Any failureuncertainty inherent in health and safety performancelitigation, legal proceedings may result in penalties for non-compliancethe award of substantial damages against us that exceed our reserves. Furthermore, plaintiffs may in certain of these legal proceedings seek class action status with relevant regulatory requirements, and a failurepotential class sizes that results in a major or significant health and safety incident is likelyvary from case to case. Class action lawsuits can be costly to defend and settle, and if we were to lose any certified class action suit, it could result in termssubstantial liability for us. In addition, we are subject to potential lawsuits, arbitration proceedings and other claims in connection with our business.
With respect to certain general liability exposures, including construction defect and product liability claims, interpretation of potential liabilities incurred asunderlying current and future trends, assessment of claims and the related liability and reserve estimation process require us to exercise significant judgment due to the complex nature of these exposures, with each exposure often exhibiting unique circumstances. Furthermore, once claims are asserted for construction defects, it is difficult to determine the extent to which the assertion of these claims will expand
geographically. As a result. Suchresult, our insurance policies may not be available or adequate to cover any liability for damages, the cost of repairs, and/or the expense of litigation surrounding current claims, and future claims may arise out of events or circumstances not covered by insurance and not subject to effective indemnification agreements with our subcontractors. Should such a failure could generate significant negative publicity and have a corresponding impact on our reputation, our relationships with relevant regulatory agencies or governmental authorities, and our ability to win new business, which in turn couldsituation arise, it may have a material adverse effect on our business, financial condition and operating results.
We are subject to liability under various data protection laws, the non-compliance of which could subject us to significant monetary damages, regulatory enforcement actions, fines and/or criminal prosecution.
Data protection and privacy laws have been enacted by the U.S. federal and state governments, including the California Consumer Privacy Act, which became effective on January 1, 2020, Virginia’s Consumer Data Protection Act, which will become effective on January 1, 2023, and the Colorado Privacy Act, which will become effective on July 1, 2023, and the regulatory regime continues to evolve and is increasingly complex and demanding. Many states are considering privacy and security legislation and there are ongoing discussions regarding a national privacy law. Variations in requirements across other states could present compliance challenges, as well as significant costs related to compliance. In providing Financial Services to customers, we manage, utilize and store sensitive or confidential client or employee data, including personal data. As a result, we are subject to numerous laws and regulations designed to protect this information, such as U.S. federal, state and international laws governing the protection of personally identifiable information.
If any person, including any of our employees, negligently disregards or intentionally breaches our established controls with respect to customer or employee data, or otherwise mismanages or misappropriates such data, we could be subject to significant monetary damages, regulatory enforcement actions, fines and/or criminal prosecution. In addition, unauthorized disclosure of sensitive or confidential customer or employee data, whether through system failure, employee negligence, fraud or misappropriation, could damage our reputation and cause us to lose customers and related revenue. Potential liability in the event of a security breach of customer data could be significant. Depending on the circumstances giving rise to the breach, this liability may not be subject to a contractual limit or an exclusion of consequential or indirect damages.
Failure by our directors, officers, employees or contractors to comply with applicable laws and regulations and codes of conduct could materially and adversely affect us.
We are required to comply with laws and regulations that govern all aspects of our business, including land acquisition, development, home construction, labor and employment, mortgage origination, title and escrow operations, sales of homes and warranties. It is possible that our employees or entities engaged by us, such as subcontractors, could intentionally or unintentionally violate some of these laws and regulations. Although we endeavor to take immediate action if we become aware of such violations, we may incur fines or penalties as a result of these actions and our reputation with governmental agencies and our customers could be damaged. In addition, we have adopted a code of business conduct and ethics for our directors, officers and employees. Our adoption of this code and other standards of conduct is not a representation or warranty that all persons subject to this code or standards are or will be in complete compliance. The failure of a director, officer or employee to comply with the applicable code or standards of conduct may result in termination of the relationship and/or adverse publicity, which could materially and adversely affect us.
Risks Related to Environmental Matters
We are subject to environmental laws and regulations, which may increase our costs, limit the areas in which we can build homes and delay completion of our projects.
We are subject to a variety of local, state and federal statutes, rules and regulations concerning land use and the protection of health and the environment, including those governing discharge of pollutants to water and air, including asbestos, the handling of hazardous materials, including asbestos, and the cleanup of contaminated sites. We may be liable for the costs of removal, investigation or remediation of hazardous or toxic substances located on, under, from or in a property currently or formerly owned, leased or occupied by us, whether or not we caused or knew of the pollution. The costs of any required removal, investigation or remediation of such substances or the costs of defending against environmental claims may be substantial. The presence of such substances, or the failure to remediate such substances properly, may also adversely affect our ability to sell the land or to borrow using the land as security. Environmental impacts from historical activities have been identified at some of the projects we have developed in the past and additional projects may be located on land that may have been contaminated by previous use. Although we are not aware of any projects requiring material remediation activities by us as a result of historical contamination, no assurances can be given that material claims or liabilities relating to such developments will not arise in the future.
The particular impact and requirements of environmental laws that apply to any given communitysite vary greatly according to the community, site, the site’s environmental conditions and the present and former use of the site. From time to time, the United States Environmental Protection Agency and other federal or state agencies review homebuilders’ compliance with environmental laws and may levy fines and penalties for failure to comply with applicable environmental laws or impose additional requirements for future compliance as a result of past
failures. Any such actions taken with respect to us may increase our costs. We expect that increasingly stringent requirements may be imposed on homebuilders in the future. EnvironmentalCompliance with environmental laws that affect our building sites or our business may result in delays, cause us to implement time consuming and expensive compliance programs and prohibit or severely restrict development in certain environmentally sensitive regions or areas, such as wetlands. We alsoIt may not identify all of these concernsbe obvious during anyour pre-development review of project sites.sites whether a site has environmental concerns, which could cause us to unnecessarily expend time and resources. Environmental regulations can also have an adverse impact on the availability and price of certain raw materials, such as lumber. Furthermore, we could incur substantial costs, including cleanup costs, fines, and penalties, and other sanctions andas well as damages from third-party claimsthird-parties for property damage or personal injury as a result of our failure to comply with or liabilities under, applicable environmental laws and regulations.
In addition, we are subject to third-party challenges such as by environmental groups, under environmental laws and regulations to the permits and other approvals required for our projects and operations. These mattersoperations, such as by environmental groups, under environmental laws and regulations. There is a growing concern from advocacy groups and the general public that greenhouse gas emissions and other human activities have caused, or will cause, significant changes in weather patterns and temperatures and the frequency and severity of natural disasters. Government mandates, standards and regulations enacted in response to these projected climate changes impacts could result in restrictions on land development in certain areas, such as areas prone to drought, or increased energy, transportation and raw material costs that may adversely affect our business, financial condition and operating results.results of operations.
We may be liable for claims for damages as a result of use of hazardous materials.
As a homebuilding business with a wide variety of historic homebuilding and construction activities, we could be liable for future claims for damages as a result of theour past or present use of hazardous materials, including building materials which in the future become known or are suspected to be hazardous. Any such claims may adversely affect our business, financial condition and operating results. Insurance coverage for such claims may be limited or non-existent.
Our properties may contain or develop harmful mold, which could lead to liability for adverse health effects and costs of remediating the problem.
Litigation and concern about indoor exposure to certain types of toxic molds have been increasing as the public becomes increasingly aware that exposure to mold can cause a variety of health effects and symptoms, including allergic reactions. Toxic molds can be found almost anywhere;anywhere as they can grow on virtually any organic substance as long as moisture and oxygen are present. There are molds that can grow on wood, paper, carpet, foods and insulation. When excessive moisture accumulates in buildings or on building materials, mold growth will often occur, particularly if the moisture problem remains undiscovered or unaddressed. It is impossible to eliminate all mold and mold spores in the indoor environment. If mold or other airborne contaminants exist or appear at our properties, we may have to undertake a costly remediation program to contain or remove the contaminants or increase indoor ventilation. If indoor air quality were impaired, we could be liable to our homebuyers or others for property damage or personal injury. injury and our reputation could be harmed.
WeRisks Related to Weather and Climate Change
Adverse weather and geological conditions may increase costs, cause project delays and reduce consumer demand for housing, all of which could materially and adversely affect our business and results of operations.
Significant weather conditions and natural disasters in the geographic areas where we operate, such as hurricanes, tornadoes, earthquakes, volcanic activity, wildfires, ice storms, snow storms, landslides and soil subsidence, droughts, floods, and heavy or prolonged precipitation could damage projects, cause delays in completion of projects, or reduce consumer demand for housing. Extreme weather conditions and natural disasters could also disrupt or cause shortages in labor or materials, which could delay project completion or result in increases in the prices for labor or materials, thereby affecting our sales and profitability. The climates of certain of the states in which we operate present increased risks of adverse weather or natural disasters. For example, Colorado has historically experienced seasonal wildfires, snow storms, and soil subsidence; Texas has historically experienced tornadoes, coastal flooding and hurricanes; California and Nevada have historically experienced earthquakes, extreme temperatures, wildfires, and droughts and water shortages; and Florida and the Carolinas have historically experienced a risk of hurricanes and coastal flooding. In addition to directly damaging or delaying our projects, natural disasters and extreme weather events could damage roads and highways providing access to those projects, thereby adversely affecting our ability to market homes in those areas and possibly increasing the costs of completion. Some conditions, such as severe drought or risk of flooding, may cause state and local governments to take restrictive actions, such as placing moratoriums on the issuance of new building permits or issuing new building codes and standards that increase building costs. Our insurance policies may not fully cover losses resulting from these events or any related business interruption. For example, losses associated with floods, landslides, earthquakes and other geological events may not be able to compete effectively against competitors in the homebuilding industry, especially in the new markets we plan to enter.
Competition in the homebuilding industry is intense,insurable and there are relatively low barriers to entry into our business. Homebuilders compete for, among other things, home buying customers, desirable land parcels, financing, raw materialslosses, such as those arising from terrorism, may not be economically insurable. A significant uninsured loss could materially and skilled labor. Increased competition could hurt our business, as it could prevent us from acquiring attractive land parcels on which to build homes or make such acquisitions more expensive, hinder our market share expansion and lead to pricing pressures on our homes that may adversely impact our margins and revenues. If we are unable to successfully compete,affect our business, prospects, liquidity, financial condition and results of operations could be materially and adversely affected. We compete with large national and regional homebuilding companies and with smaller local homebuilders for land, financing, raw materials and skilled management and labor resources. Furthermore, a numberoperations.
Raw materials and building supply shortages and price fluctuations could delay or increase the cost of home construction and adversely affect our operating results.
The homebuilding industry has, from time to time, experienced raw material shortages and been adversely affected by volatilityChanges in global commodity prices. In particular, shortagesor regional climate conditions and fluctuations in the price of concrete, drywall, lumber or other important raw materials could result in delays in the start or completion of, or increase the cost of, developing one or more of our residential communities. These
shortages can be more severe during periods of strong demand for housing or during periods following natural disasters that have a significant impact on existing residential and commercial structures. The cost of raw materials may also be materially and adversely affected during periods of shortages or high inflation. Shortages and price increases could cause delays in and increase our costs of home construction. We generally are unable to pass on increases in construction costs to customers who have already entered into home purchase contracts. Sustained increases in construction costs may adversely affect our gross margins, which in turn could materially and adversely affect our business, liquidity, financial condition and results of operations.
In addition, the cost of petroleum products, which are used both to deliver our materials and to transport workers to our job sites, fluctuates and may be subject to increased volatility as a result of geopolitical events or accidents. Changes in such costs could also result in higher prices for any product utilizing petrochemicals. These cost increases may have an adverse effect on our operating margin and results of operations and may result in a decline in the price of our common stock. Furthermore, any such cost increase may adversely affect the regional economies in which we operate and reduce demand for our homes.
Increases in our cancellation rate could have a negative impact on our home sales revenue and homebuilding margins.
Our backlog reflects sales contracts with our homebuyers for homes that have not yet been delivered. We have received a deposit from a homebuyer for each home reflected in our backlog, and generally we have the right to retain the deposit if the homebuyer fails to comply with his or her obligations under the sales contract, subject to certain exceptions, including as a result of state and local law, the homebuyer’s inability to sell his or her current home or, in certain circumstances, the homebuyer’s inability to obtain suitable financing. Home order cancellations negatively impact the number of closed homes, net new home orders, home sales revenue and results of operations, as well as the number of homes in backlog. Home order cancellations can result from a number of factors, including declines or slow appreciation in the market value of homes, increases in the supply of homes available to be purchased, increased competition, higher mortgage interest rates, homebuyers’ inability to sell their existing homes, homebuyers’ inability to obtain suitable financing, including providing sufficient down payments, and adverse changes in economic conditions. An increase in the level of our home order cancellations could have a negative impact on our business, prospects, liquidity, financial condition and results of operations.
Homebuilding is subject to product liability and warranty claims arising in the ordinary course of business that can be significant.
As a homebuilder, we are subject to home warranty and construction defect claims arising in the ordinary course of business. There can be no assurance that any developments we undertake will be free from defects once completed. Construction defects may occur on projects and developments and may arise during a significant period of time after completion. Defects arising on a development attributable to us may lead to significant contractual or other liabilities.
As a consequence, we maintain products and completed operations excess liability insurance, obtain indemnities and certificates of insurance from subcontractors generally covering claims related to damages resulting from faulty workmanship and materials, and create warranty and other reserves for the homes we sell based on historical experience in our markets and our judgment of the risks associated with the types of homes built. Although we actively monitor our insurance reserves and coverage, because of the uncertainties inherent to these matters, we cannot provide assurance that our insurance coverage, our subcontractor arrangements and our reserves will be adequate to address all of our warranty and construction defect claims in the future. In addition, contractual indemnities can be difficult to enforce. We may also be responsible for applicable self-insured retentions, and some types of claims may not be covered by insurance or may exceed applicable coverage limits. Additionally, the coverage offered by and the availability of products and completed operations excess liability insurance for construction defects is currently limited and costly. This coverage may be further restricted or become more costly in the future.
Unexpected expenditures attributable to defects or previously unknown sub-surface conditions arising on a development project may have a material adverse effect on our business, financial condition and operating results. In addition, severe or widespread incidents of defects giving rise to unexpected levels of expenditure, to the extent not covered by insurance or redress against subcontractors, may adversely affect our business, financial condition and operating results.
We may suffer uninsured losses or suffer material losses in excess of insurance limits.
We could suffer physical damage to property and liabilities resulting in losses that may not be fully compensated by insurance. In addition, certain types of risks, such as personal injury claims, may be, or may become in the future, either uninsurable or not economically insurable, or may not be currently or in the future covered by our insurance policies. Should an uninsured loss or a loss in excess of insured limits occur, we could sustain financial loss or lose capital invested in the affected property as well as anticipated future income from that property. In addition, we could be liable to repair damage or meet liabilities caused by uninsured risks. We
may be liable for any debt or other financial obligations related to affected property. Material losses or liabilities in excess of insurance proceeds may occur in the future.
In the United States, the coverage offered and the availability of general liability insurance for construction defects is currently limited and is costly. As a result, an increasing number of our subcontractors in the United States may be unable to obtain insurance. If we cannot effectively recover construction defect liabilities and costs of defense from our subcontractors or their insurers, or if we have self-insured, we may suffer losses. Coverage may be further restricted and become even more costly. Such circumstances could adversely affect our business, financial condition and operating results.
Our operating performance is subject to risks associated with the real estate industry.
Real estate investments are subject to various risks and fluctuations and cycles in value and demand, many of which are beyond our control. Certain events may decrease cash available for operations, as well as the value of our real estate assets. These events include, but are not limited to:
| ·
| | adverse changes in financial conditions of buyers and sellers of properties, particularly residential homes and land suitable for development of residential homes;
|
| ·
| | adverse changes in international, national or local economic and demographic conditions;
|
| ·
| | competition from other real estate investors with significant capital, including other real estate operating companies and developers and institutional investment funds;
|
| ·
| | reductions in the level of demand for and increases in the supply of land suitable for development;
|
| ·
| | fluctuations in interest rates, which could adversely affect our ability, or the ability of homebuyers, to obtain financing on favorable terms, or at all;
|
| ·
| | unanticipated increases in expenses, including, without limitation, insurance costs, development costs, real estate assessments and other taxes and costs of compliance with laws, regulations and governmental policies; and
|
| ·
| | changes in enforcement of laws, regulations and governmental policies, including, without limitation, health, safety, environmental, zoning and tax laws, governmental fiscal policies and the Americans with Disabilities Act of 1990.
|
In addition, periods of economic slowdown or recession, rising interest rates or declining demand for real estate, or the public perception that any of these events may occur, could result in a general decline in the purchase of homes or an increased incidence of home order cancellations. If we cannot successfully implement our business strategy, our business, prospects, liquidity, financial condition and results of operations will be adversely affected.
Because real estate investments are relatively illiquid, our ability to promptly sell one or more properties for reasonable pricesgovernmental actions in response to changing economic, financial and investment conditionssuch changes may be limited and we may be forced to hold non-income producing properties for extended periods of time.
Real estate investments are relatively difficult to sell quickly. As a result, our ability to promptly sell one or more properties in response to changing economic, financial and investment conditions is limited and we may be forced to hold non-income producing assets for an extended period of time. We cannot predict whether we will be able to sell any property for the price or on the terms that we set or whether any price or other terms offered by a prospective purchaser would be acceptable to us. We also cannot predict the length of time needed to find a willing purchaser and to close the sale of a property.
If the market value of our land inventory decreases, our results of operations could be adversely affected by impairments and write-downs.
The market value of our land and housing inventories depends on market conditions. We acquire land for expansion into new markets and for replacement of land inventory and expansion within our current markets. There is an inherent risk that the value of the land owned by us may decline after purchase. The valuation of property is inherently subjective and based on the individual characteristics of each property. We may have acquired options on or bought and developed land at a cost we will not be able to recover fully or on which we cannot build and sell homes profitably. In addition, our deposits for lots controlled under option or similar contracts may be put at risk.
Factors, such as changes in regulatory requirements and applicable laws (including in relation to building regulations, taxation and planning), political conditions, the condition of financial markets, both local and national economic conditions, the financial condition of customers, potentially adverse tax consequences, and interest and inflation rate fluctuations, subject land valuations to uncertainty. Moreover, all valuations are made on the basis of assumptions that may not prove to reflect economic or demographic reality. If housing demand decreases below what we anticipated when we acquired our inventory, our profitability may be adversely affected and we may not be able to recover our costs when we sell and build houses.
We regularly review the value of our land holdings and continue to review our holdings on a periodic basis. If material write-downs and impairments in the value of our inventory are required in the future, we may have to sell land or homes at a loss, which could adversely affect our results of operations and financial condition.
Inflation could adversely affect our business and financial results.
Inflation could adversely affect us by increasing the costs of, or restricting, our planned or future growth activities.
Climate change, if it continues as currently projected, may exacerbate the scarcity or presence of water and other natural resources in affected regions, which could limit, prevent or increase the costs of residential development in certain areas. In addition, there is a variety of new legislation being enacted, or considered for enactment, at the federal, state and local level relating to energy and climate change, and as climate change concerns continue to grow, legislation and regulations of this nature are expected to continue. This legislation relates to items such as carbon dioxide emissions and building codes that impose energy efficiency standards. Government mandates, restrictions, standards or regulations intended to mitigate or reduce greenhouse gas emissions or projected climate change impacts could result in prohibitions or severe restrictions on land development in certain areas, increased energy, transportation or raw material costs, and increased compliance expenses and other financial obligations to meet permitting, land development, or home construction-related requirements that we may be unable to fully recover (due to market conditions or other factors), any of which could cause a reduction in our homebuilding gross margins and materially and adversely affect our results of operations. Energy-related initiatives could similarly affect a wide variety of companies throughout the United States and the world, and because our results of operations are heavily dependent on purchasing significant amounts of raw materials, these initiatives could have an indirect adverse impact on our results of operations and labor neededprofitability to operatethe extent the manufacturers and suppliers of our business. Inmaterials are burdened with expensive cap and trade, tariffs, or other climate related regulations. As a result, climate change impacts, and the event oflaws and land development and home construction standards implemented to address potential climate change concerns, could result in an increase in inflation, we may seek to increase the sales prices of homes in order to maintain satisfactory margins. However, an oversupply of homes relative to demandour costs and home prices being set several months before homes are delivered may make any such increase difficult or impossible. In addition, inflation is often accompanied by higher interest rates, which historically have had a negative impact on housing demand. In such an environment, we may not be able to raise home prices sufficiently to keep up with the rate of inflation and our margins could decrease. Moreover, the cost of capital increases as a result of inflation and the purchasing power of our cash resources declines. Current or future efforts by the government to stimulate the economy may increase the risk of significant inflation and itslong-term adverse impact on our business or financial results.
Our quarterly operating results may fluctuate because of the seasonal nature of our business and other factors.
Our quarterly operating results generally fluctuate by season. Historically, we have entered into a larger percentage of contracts for the sale of our homes during the spring and summer months. Weather-related problems, typically in the fall, late winter and early spring, may delay starts or closings and increase costs and thus reduce profitability. Seasonal natural disasters such as floods and fires could cause delays in the completion of, or increase the cost of, developing one or more of our communities, causing an adverse effect on our sales and revenues.
In many cases, we may not be able to recapture increased costs by raising prices. In addition, deliveries may be staggered over different periods of the year and may be concentrated in particular quarters. Our quarterly operating results may fluctuate because of these and other factors.
We are subject to financial reporting and other requirements as a public company for which our accounting and other management systems and resources may not be adequately prepared.
As a public company with listed equity securities, we are required to comply with certain laws, regulations and requirements, including the requirements of the Securities Exchange Act of 1934, as amended (which we refer to as the “Exchange Act”), certain corporate governance provisions of the Sarbanes-Oxley Act of 2002 (which we refer to as the “Sarbanes-Oxley Act”), related regulations of the SEC, and requirements of the New York Stock Exchange. The Exchange Act requires that we file annual, quarterly and current reports with respect to our business and financial condition. The Sarbanes-Oxley Act requires, among other things, that we maintain effective internal controls and procedures for financial reporting. Section 404 of the Sarbanes-Oxley Act requires our management and independent auditors to report annually on the effectiveness of our internal control over financial reporting.
We have completed the process of compiling the systems necessary to perform the evaluations needed to comply with Section 404 of the Sarbanes-Oxley Act. These reporting and other obligations place significant demands on our management, administrative, operational, and accounting resources and will cause us to incur significant expenses. We may in the future need to upgrade our systems or create new systems, implement additional financial and management controls, reporting systems and procedures, create or outsource an internal audit function, and hire additional accounting and finance staff. If we are unable to accomplish these objectives in a timely and effective fashion, our ability to comply with the financial reporting requirements and other rules that apply to reporting companies could be impaired. Any failure to maintain effective internal control over financial reporting could have a material adverse effect on our business, prospects, liquidity, financial condition and results of operations.
AsThis is a public company, we are obligated to maintain proper and effective internal controls over financial reporting. These internal controls may not be determined to be effective, which may adversely affect investor confidenceparticular concern in the Company.
We are required, pursuant to Section 404western U.S., where some of the Sarbanes-Oxley Act, to furnish a report by management on, among other things, the effectiveness of our internal control over financial reporting as of the end of our fiscal year 2017. This assessment includes disclosure of any material weaknesses identified by our management in our internal control over financial reporting.
We are also required to disclose changes made in our internal controlmost extensive and procedures on a quarterly basis. However, our independent registered public accounting firm may issue a report that is adversestringent environmental laws and residential building construction standards in the event it is not satisfied with the level at which our controls are documented, designed or operating. In order to continue to maintain effective internal controls over financial reporting, we may need to undertake various actions, such as implementing new internal controlscountry have been instituted, and procedures and hiring accounting or internal audit staff.
Acts of war or terrorism may seriously harm our business.
Acts of war, any outbreak or escalation of hostilities between the United States and any foreign power or acts of terrorism may cause disruption to the U.S. economy, or the local economies of the markets in which we operate, cause shortages of building materials, increase costs associated with obtaining building materials, result in building code changes that could increase costs of construction, affect job growth and consumer confidence or cause economic changes that we cannot anticipate, all of which could reduce demand for our homes and adversely impact our business, prospects, liquidity, financial condition and results of operations.
Negative publicity may affect our business performance and could affect the value of our securities.
Unfavorable media related to the Company, our industry, or Company brands, marketing, personnel, operations, business performance or prospects may affect the value of our securities and the performancewhere some of our business regardlessoperations are located.
Public company stockholders are increasingly sensitive to the climate change impacts and mitigation efforts of its accuracycompanies, are increasingly seeking enhanced disclosure on the risks, challenges, governance implications, and financial impacts of climate change faced by companies and are demanding that companies take a proactive approach to addressing perceived environmental risks, including risks associated with climate change, relating to their operations. Adverse publicity related to our handling of climate change mitigation efforts or inaccuracy. Our success in maintaining, extending and expanding our brand image dependscompliance with governmental actions or climate-related litigation that impacts us could have a negative impact on our ability to adapt to a rapidly changing media environment. Adverse publicity or negative commentary on social media outlets, such as blogs, websites or newsletters, could hurt operating results, as consumers might avoid brands that receive bad press or negative reviews. Negative publicity may result in a decrease in operating results that could lead to a decline in the value of our securities.business.
Poor relations with the residents of our communities could negatively impact sales, which could cause our revenues or results of operations to decline.Risk Related Acquisitions and Joint Venture Investments
Residents of communities we develop rely on us to resolve issues or disputes that may arise in connection with the operation or development of their communities. Efforts made by us to resolve these issues or disputes could be deemed unsatisfactory by the affected residents and subsequent actions by these residents could adversely affect sales or our reputation. In addition, we could be required to make material expenditures related to the settlement of such issues or disputes or to modify our community development plans, which could adversely affect our results of operations.
Failure to manage land acquisitions and development and construction processes could result in significant cost overruns or errors in valuing sites.
We own and purchase a large number of sites each year and are therefore dependent on our ability to process a very large number of transactions (which include, among other things, evaluating the site purchase, designing the layout of the development, sourcing materials and subcontractors and managing contractual commitments) efficiently and accurately. Errors by employees, failure to comply with regulatory requirements and conduct of business rules, failings or inadequacies in internal control processes, inabilities to obtain desired approvals and entitlements, cost overruns, equipment failures, natural disasters or the failure of external systems, including those of our suppliers or counterparties, could result in operational losses that could adversely affect our business, financial condition and operating results and our relationships with our customers.
We may incur a variety of costs to engage in future growth or expansion of our operations or acquisitions Acquisitions, investments and/or disposals of businesses, and the anticipated benefits may never be realized.involve risks.
As a part of our business strategy, we may makehave made seven acquisitions since 2013 and we intend to continue to explore future acquisitions, or significant investments in, and/or disposals of businesses. Any future acquisitions,Acquisitions, investments and/or disposals would be accompanied byinvolve risks, such as:
difficulties in assimilating the operations and personnel of acquired companies or businesses; diversion of our management’s attention from ongoing business concerns; disruption to our existing operations and plans; inability to effectively manage our expanded operations; our potential inability to maximize our financial and strategic position through the successful incorporation or disposition of operations; difficulties or delays in integrating and assimilating operations, including information and financial systems, or in realizing projected efficiencies, growth prospects, cost savings, and synergies; maintenance of uniform standards, controls, procedures and policies; impairment of existing relationships with employees, contractors, suppliers and customers as a result of the integration of new management personnel and cost-saving initiatives; adverse impact on overall profitability if our expanded operations do not achieve the financial results projected in our valuation models and as a result of the effect of any required step-up to the historical basis of an acquired home; reallocation of amounts of capital from other operating initiatives and/or an increase in our leverage and debt service requirements to pay acquisition purchase prices or other business venture investment costs, which could in turn restrict our ability to access additional capital when needed or pursue other important elements of our business strategy; inaccurate assessment of additional post-acquisition or business venture investments, undisclosed, contingent or other liabilities or problems, unanticipated costs associated with an acquisition or other business venture, and an inability to recover or manage such liabilities and costs; incorrect estimates made in the accounting for acquisitions and incurrence of non-recurring charges; and write-off of significant amounts of goodwill or other assets as a result of deterioration in the performance of an acquired business, adverse market conditions, changes in the competitive landscape, changes in laws or regulations that restrict activities of an acquired business, or as a result of a variety of other circumstances. | ·
| | difficulties in assimilating the operations and personnel of acquired companies or businesses;
|
| ·
| | diversion of our management’s attention from ongoing business concerns;
|
| ·
| | our potential inability to maximize our financial and strategic position through the successful incorporation or disposition of operations;
|
| ·
| | maintenance of uniform standards, controls, procedures and policies; and
|
| ·
| | impairment of existing relationships with employees, contractors, suppliers and customers as a result of the integration of new management personnel and cost-saving initiatives.
|
We cannot guarantee that we will be able to successfully integrate any company or business that we might acquire in the future, and our failure to do so could harm our current business.
In addition, we may not realize the anticipated benefits of these transactionsan acquisition or other similar transaction at all or within a reasonable time period and there may be other unanticipated or unidentified effects. While we would seek protection, for example, through warranties and indemnities in the case of acquisitions, significant liabilities may not be identified in due diligence or come to light after the expiry of warranty or indemnity periods. Additionally, while we would seek to limit our ongoing exposure, for example, through liability caps and period limits on warranties and indemnities in the case of disposals, some warranties and indemnities may give rise to unexpected and significant liabilities. Any claims arising in the future may adversely affect our business, financial condition and operating results.
Our acquisitions of the assets of Jimmy Jacobs Homes L.P. in September 2013, Las Vegas Land Holdings, LLC in April 2014, Grand View Builders in August 2014, Peachtree Communities Group, Inc. in November 2014, UCP in August 2017, and Sundquist Homes in October 2017 were accounted for as business combinations in accordance with our accounting policies and GAAP with the acquired assets and assumed liabilities recorded at their estimated fair values as of the acquisition date. Based upon estimates of the fair value of the assets to be acquired and the liabilities to be assumed, we have recorded a step-up to the historical basis of an acquired home under construction inventory. As homes are delivered in future periods, this step-up will initially result in gross margins from home sales revenues that are commensurate with the stage of completion of the acquired inventory and the related risk assumed by us for its completion. The ultimate gross margins from home sales revenues that we will be able to achieve from our acquired businesses will be impacted by (1) our ability to construct homes at prices consistent with our forecasted budgets, and (2) future pricing increases or decreases based on market demand.
We may be unable to successfully integrate our and UCP’s businesses or realize the anticipated benefits of the UCP Merger.
The UCP Merger involved the combination of two companies that previously operated as independent public companies. We are currently devotingA significant management attention and resources to integrate our and UCP’s business practices and operations. Potential difficulties that we may encounter as part of the integration process include the following:
| •
| | the inability to successfully combine our and UCP’s businesses in a manner that permits us to achieve, on a timely basis, or at all, the enhanced revenue opportunities and cost savings and other benefits anticipated to result from the UCP Merger;
|
| •
| | complexities associated with managing the combined businesses, including difficulty addressing possible differences in corporate cultures and management philosophies and the challenge of integrating complex systems, technology, networks and other assets of each of the companies in a seamless manner that minimizes any adverse impact on homebuying customers, suppliers, employees and other constituencies; and
|
| •
| | potential unknown liabilities associated with the UCP Merger.
|
In addition, it is possible that the integration process could result in:
| •
| | diversion of the attention of each company’s management; and
|
| •
| | the disruption of, or the loss of momentum in, our ongoing business.
|
Any of these issues could adversely affect our business and financial results.
We may be unable to realize anticipated cost synergies and expects to incur substantial expenses related to the UCP Merger, which could have a material adverse effect on our business, financial condition and results of operations.
Following the consummation of the UCP Merger, we expect to realize annualized cost synergies of approximately $10.0 million beginning in 2018.
While we believe these cost synergies are achievable, our ability to achieve such estimated cost synergies in the timeframe described, or at all, is subject to various assumptions by our management, which may or may not be realized, as well as the incurrence of other costs in our operations that offset all or a portion of such cost synergies. As a consequence,our historical growth has been due to our prior acquisitions and we may not be able to realize all of these cost synergies within the timeframe expected or at all. In addition, we may incur additional and/or unexpected costs in order to realize these cost synergies. Failure to achieve the expected cost synergies could significantly reduce the expected benefits associated with the UCP Merger and adversely affect us.
We expect to continue to incur non-recurring costs associated with consummating the UCP Merger, combining the operations of the two companies, and achieving the desired cost synergies. These fees and costs have been, and will continue to be, substantial. The substantial majority of non-recurring expenses will consist of transaction costs related to the UCP Merger and include, among others, fees paid to legal, accounting and financial advisors, employee benefit costs, and filing and printing fees.
These costs described above, as well as other unanticipated costs and expenses, could have a material adverse effect on our financial condition and operating results.
We are expected to incur substantial expenses in connection with the integration process related to the UCP Merger.
We are expected to incur substantial expenses in connection with the integration process related to the UCP Merger. There are a large number of processes, policies, procedures, operations, technologies and systems that may need to be integrated, including purchasing, accounting and finance, sales, payroll, pricing and benefits. While we have assumed that a certain level of expenses will be incurred, there are many factors beyond our control that could affect the total amount or the timing of the integration expenses. Moreover, many of the expenses that will be incurred are, by their nature, difficult to estimate accurately. These expenses could, particularly in the near term, exceed the savings that we expect to achieve from the elimination of duplicative expenses and the realization of economies of scale and cost savings. These integration expenses likely will result in us taking significant charges against earnings, and the amount and timing of such charges are uncertain at present.
Our future results will suffer if we do not effectively manage our expanded operations.
As a result of the UCP Merger, the size of our business has increased significantly. Our future success will depend, in part, upon our ability to manage this expanded business, which will pose substantial challenges for management, including challenges related to the management and monitoring of new operations and associated increased costs and complexity. There can be no assurances that we will be successful or that we will realize the expected operating efficiencies, cost savings, revenue enhancements or other benefits from the UCP Merger.
We may not be able to continue to grow through acquisitions.
In the past,A significant portion of our historical growth has been due in part to our prior acquisitions and we have sought growth throughintend to continue to explore future acquisitions of, or significant investments in, businesses that offer complementary products and services or otherwise support our growth objectives. However, we cannot assure you that we will continue to identify attractive acquisition targets and consummate acquisitions. As a result of the UCP Mergerany future acquisitions and the incurrence of debt in connection therewith, the amount of our indebtedness ismay be significantly higher than prior to the consummation of the UCP Merger.such acquisitions. As a result, we cannot assure you that we will be able to arrange financing for future acquisitions on terms acceptable to us. In addition, the combinedas a result of our prior acquisitions, our company is substantially larger than we have been in the past, and we may face additional scrutiny in connection with federal and state governmental approvals in connection with any future acquisitions of attractive targets or may not be able to obtain such approvals on a time basis or at all. The realization of any of these risks could adversely affect our business.
We may be subject to various risks relating to our plan to vertically integrate mortgage lending into our business.
We are in the process of vertically integrating mortgage lending into our business, which will enable us to provide financing to our homebuyers. There are risks involved with engaging in the mortgage lending business,have intangible assets, including establishing sufficient stringent underwriting standards, sogoodwill, primarily as to limit the level of foreclosures experienced on mortgages originated by us. We may hold some of the loans we originate to maturity; however, in order to finance our planned mortgage business, we will most likely sell the loans we originate, either as whole loans or pursuant to a securitization. It is customary in connection with such transactions for the originator, such as we would be, to make representations and warranties to the purchasers, guarantors and insurers about the mortgage loans and the manner in which they were originated and to offer certain indemnities and guaranties to the purchasers, guarantors and insurers. In the event of defaults on the loans we originate, we may be required to repurchase or substitute mortgage loans, or indemnify buyers, guarantors or insurersresult of our loans. Because we have limited experience in originating and underwriting home loans, our underwriting standards may not be as stringent as a more traditional lender, and accordingly, we may experience a higher rate of default than lenders who have engaged in the mortgage lending industry for a longer period of time. Moreover, the loans we originate will be limited primarily to buyers of our homes, so our pool of borrowers will be less diverse than as would be the case with a traditional lender, and thus there could be a higher correlation in the default rate with our borrowers. In addition, because we would be originating loans to buyers of our homes, there is the risk that we may be more incentivized, compared to more traditional lenders, to lower our underwriting
standards in order to close home sales. Should our underwriting standards not adequately screen quality applicants, the default rate on the loans we originate may be higher, which could have an adverse impact onprior acquisitions. If these assets become impaired, then our results of operations and financial condition, either because the loans we own are no longer performing or because we are required to repurchase or otherwise indemnify purchasers, guarantors or insurers of the loans we sell or securitize.
Risk Related to Conflicts of Interest
As a result of Dale Francescon’s and Robert Francescon’s relationship with the Company, conflicts of interest may arise with respect to any transactions involving or with Dale Francescon, Robert Francescon, or their affiliates, and their interests may not be aligned with yours.
Dale Francescon and Robert Francescon are our Co-Chief Executive Officers, sit on our board of directors, and collectively beneficially own 3,894,572 shares of our common stock, which represents 13.2% of our common stock outstanding as of December 31, 2017. For so long as Dale Francescon and Robert Francescon continue to beneficially own a significant stake in us, they will have significant influence over the power to:
| ·
| | elect our directors and exercise overall control over the Company;
|
| ·
| | agree to sell or otherwise transfer a controlling stake in the Company; and
|
| ·
| | determine the outcome of substantially all actions requiring the majority approval of our stockholders, including transactions with related parties, corporate reorganizations, mergers, acquisitions and dispositions of assets.
|
The interests of Dale Francescon and Robert Francescon may not be fully aligned with yours, and this could lead to a strategy that is not in your best interests. In addition, their significant ownership in us and resulting ability to effectively control us will limit your ability to influence corporate matters and may discourage someone from making a significant equity investment in us, or could discourage transactions involving a change in control.
In addition, there may be transactions between us and Dale Francescon, Robert Francescon, or their affiliates that could present an actual or perceived conflict of interest. These conflicts of interest may lead Dale and/or Robert Francescon to recuse himself or themselves from actions of our board of directors with respect to any transactions involving or with Dale or Robert Francescon or their affiliates. For example, we have entered into employment agreements with Dale Francescon and Robert Francescon, our Co-Chief Executive Officers, in their capacities as officers, pursuant to which they are required to devote substantially full-time attention to our affairs. These employment agreements were not negotiated on an arm’s-length basis. We may choose not to enforce, or to enforce less vigorously, our rights under these agreements because of our desire to maintain our ongoing relationship with Dale Francescon and Robert Francescon.adversely affected.
Risks Related to Our Indebtedness
We use and expect to continue to use leverage in executing our business strategy, which may adversely affect the return on our assets.
We may incur a substantial amount of debt in the future. As of December 31, 2017,2021, we had approximately $824.6$30.4 million in outstanding indebtedness, consisting of $379.2 million outstanding ongoodwill, related primarily to our 6.875% Senior Notes due 2022 (which we refer to as our “Existing 6.875% Notes”), $394.7 million outstanding on our 5.875% Senior Notes due 2025 (which we refer to as our “Existing 5.875% Notes”), $48.3 million outstanding on our mortgage repurchase facilities,prior business combinations and $2.3 million outstanding on other financing obligations.
As of December 31, 2017, we had $400 million of available borrowing capacity, with no borrowings outstanding, under our revolving credit facility. Our board of directors will consider a number of factors when evaluating our level of indebtedness and when making decisions regardingacquisitions. If the incurrence of new indebtedness, including the purchase price of assets to be acquired with debt financing, the estimated marketcarrying value of our intangible assets andis deemed impaired, the ability of particular assets, and the Company as a whole,carrying value is written down to generate cash flow to cover the expected debt service. Our charter does not contain a limitation on the amount of debt we may incur and our board of directors may change our target debt levels at any time without the approval of our stockholders.
Incurring a substantial amount of debt could have important consequences for our business, including:
| ·
| | making it more difficult for us to satisfy our obligations with respect to our debt or to our trade or other creditors;
|
| ·
| | increasing our vulnerability to adverse economic or industry conditions;
|
| ·
| | limiting our ability to obtain additional financing to fund capital expenditures and acquisitions, particularly when the availability of financing in the capital markets is limited;
|
| ·
| | requiring a substantial portion of our cash flows from operations for the payment of interest on our debt and reducing our ability to use our cash flows to fund working capital, capital expenditures, acquisitions and general corporate requirements;
|
| ·
| | limiting our flexibility in planning for, or reacting to, changes in our business and the industry in which we operate; and
|
| ·
| | placing us at a competitive disadvantage to less leveraged competitors.
|
We cannot assure you that our business will generate sufficient cash flow from operations or that future borrowings will be available to us through capital markets financings or under our credit facilities or otherwise in an amount sufficient to enable us to pay our indebtedness, or to fund our other liquidity needs. We may need to refinance all or a portion of our indebtedness, on or before its maturity. We cannot assure you that we will be able to refinance any of our indebtedness on commercially reasonable terms, or at all. In addition, we may incur additional indebtedness in order to finance our operations or to repay existing indebtedness. If we cannot service our indebtedness, we may have to take actions such as selling assets, seeking additional debt or equity or reducing or delaying capital expenditures, strategic acquisitions, investments and alliances. We cannot assure you that any such actions, if necessary, could be effected on commercially reasonable terms, or at all, or on terms thatfair value. This would be advantageous to our stockholders or on terms that would not require us to breach the terms and conditions of our existing or future debt agreements.
Access to financing sources may not be available on favorable terms, or at all, especially in light of current market conditions, which could adversely affect our ability to maximize our returns.
We expect to employ prudent levels of leverage to finance the acquisition and development of our lots and construction of our homes. Our access to additional third-party sources of financing will depend, in part, on:
| ·
| | general market conditions;
|
| ·
| | the market’s perception of our growth potential;
|
| ·
| | with respect to acquisition and/or development financing, the market’s perception of the value of the land parcels to be acquired and/or developed;
|
| ·
| | our current debt levels;
|
| ·
| | our current and expected future earnings;
|
| ·
| | the market price per share of our common stock.
|
If the capital and credit markets experience increased volatility or weakness, potential lenders may be unwilling or unable to provide us with financing that is attractive to us or may charge us prohibitively high fees in order to obtain financing. In such a situation, investment returns on our assets and our ability to make acquisitions could be adversely affected by our inability to secure additional financing on reasonable terms, if at all.
In addition, while we have not encountered any such issues to date, if the credit rating agencies that rate our debt were to downgrade our credit ratings, it would likely increase our cost of capital and make it more difficult for us to obtain new financing and access the capital and credit markets, which could also have a material adverse effect on our business, financial condition, results of operations, or cash flows.
Depending on market conditions at the relevant time, we may have to rely more heavily on additional equity financings or on less efficient forms of debt financing that require a larger portion of our cash flow from operations, thereby reducing funds available for our
operations, future business opportunities and other purposes. We may not have access to such equity or debt capital on favorable terms at the desired times, or at all.
Interest expense on debt we will incur may limit our cash available to fund our growth strategies.
As of December 31, 2017, we had approximately $824.6 million in outstanding indebtedness, consisting of $379.2 million outstanding on our Existing 6.875% Notes, $394.7 million outstanding on our Existing 5.875% Notes, $48.3 million outstanding on our mortgage repurchase facilities, and $2.3 million outstanding on other financing obligations.
As of December 31, 2017, we had $400.0 million of available borrowing capacity, with no borrowings outstanding, under our revolving credit facility. As part of our growth strategy, we may incur a significant amount of additional debt. Certain of our current debt has, and any additional debt we subsequently incur may have, a floating rate of interest. Higher interest rates could increase debt service requirements on our current floating rate debt and on any floating rate debt we subsequently incur, and could reduce funds available for operations, future business opportunities or other purposes. If we need to repay existing debt during periods of rising interest rates, we could be required to refinance our then-existing debt on unfavorable terms or liquidate one or more of our assets to repay such debt at times which may not permit realization of the maximum return on such assets and could result in a loss. The occurrence of either such event or both could materially and adversely affect our cash flows and results of operations.
Interest rate changes may adversely affect us.
We currently do not hedge against interest rate fluctuations. We may obtain in the future one or more forms of interest rate protection—in the form of swap agreements, interest rate cap contracts or similar agreements—to hedge against the possible negative effects of interest rate fluctuations. However, we cannot assure you that any hedging will adequately relieve the adverse effects of interest rate increases or that counterparties under these agreements will honor their obligations thereunder. In addition, we may be subject to risks of default by hedging counterparties. Adverse economic conditions could also cause the terms on which we borrow to be unfavorable. We could be required to liquidate one or more of our assets at times which may not permit us to receive an attractive return on our assets in order to meet our debt service obligations.
Our current financing arrangements contain, and our future financing arrangements likely will contain, restrictive covenants relatingcharge to our operations.
Our current financing arrangements contain, and the financing arrangements we enter into in the future likely will contain, covenants (financial and otherwise) affecting our ability to incur additional debt, make certain investments, reduce liquidity below certain levels, make distributions to our stockholders and otherwise affect our operating policies. The restrictions contained in our financing arrangements could also limit our ability to plan for or react to market conditions, meet capital needs or make acquisitions or otherwise restrict our activities or business plans. If we fail to meet or satisfy any of these covenants in our debt agreements we would be in default under these agreements, and our lenders could elect to declare outstanding amounts due and payable, terminate their commitments, require the posting of additional collateral or enforce their respective interests against existing collateral. A default also could limit significantly our financing alternatives, which could cause us to curtail our investment activities and/or dispose of assets when we otherwise would not choose to do so. If we default on several of our debt agreements or any single significant debt agreement, it could have a material adverse effect on our business, prospects, liquidity, financial condition and results of operations.
We may not be able to generate sufficient cash flow to meet our debt service obligations.
Our ability to generate sufficient cash flow from operations to make scheduled payments on our debt obligations will depend on our current and future financial performance, which is subject to general economic, financial, competitive, legislative, regulatory and other factors that are beyond our control. In the future, we may fail to generate sufficient cash flow from the sales of our homes and land to meet our cash requirements. Further, our capital requirements may vary materially from those currently planned if, forearnings. For example, our revenues do not reach expected levels or we have to incur unforeseen capital expenditures and make investments to maintain our competitive position. If we do not generate sufficient cash flow from operations to satisfy our debt obligations, including interest payments and the payment of principal at maturity, we may have to undertake alternative financing plans, such as refinancing or restructuring our debt, selling assets, reducing or delaying capital investments or seeking to raise additional capital. We cannot provide assurance that any refinancing would be possible, that any assets could be sold, or, if sold, of the timeliness and amount of proceeds realized from those sales, that additional financing could be obtained on acceptable terms, if at all, or that additional financing would be permitted under the terms of our various debt instruments then in effect. Furthermore, our ability to refinance would depend upon the condition of the finance and credit markets. Our inability to generate sufficient cash flow to satisfy our debt obligations, or to refinance our obligations on commercially reasonable terms or on a timely basis, would materially affect our business, financial condition or results of operations and may delay or prevent the expansion of our business.
The agreements governing our debt include provisions that may restrict our financial and business operations, but may not necessarily restrict our ability to take actions that may impair our ability to repay our debt.
The agreements governing our indebtedness, including our revolving credit facility and the indentures that govern our senior notes, contain negative covenants customary for such financings, such as limiting our ability to sell or dispose of assets, incur additional indebtedness or liens, make certain restricted payments, make certain investments, consummate mergers, consolidations or other business combinations or engage in other lines of business. These restrictions may interfere with our ability to engage in other necessary or desirable business activities, which could materially affect our business, financial condition or results of operations.
Our revolving credit facility also requires us to comply with certain financial ratios and covenants, such as maximum consolidated leverage ratios, minimum consolidated interest coverage ratios and minimum tangible net worth. Our ability to comply with these covenants depends on our financial condition and performance and also is subject to events outside our control. Asset write-downs, other non-cash charges and other one-time events also impact our ability to comply with these covenants. In addition, these restrictions may interfere with our ability to obtain financing or to engage in other necessary or desirable business activities, which may have a material effect on our operations. These covenants are subject to important exceptions and qualifications. Moreover, if we fail to comply with these covenants and are unable to obtain a waiver or amendment, an event of default would result. Our revolving credit facility and other debt agreements, including the indentures governing our senior notes, also contain other events of default customary for such financings. We cannot provide assurance that we would have sufficient liquidity to repay or refinance our debt if such amounts were accelerated upon an event of default. If we are unable to service our debt, this could materially affect our business, financial condition or results of operations.
We may require additional capital in the future and may not be able to secure adequate funds on terms acceptable to us.
The expansion and development of our business may require significant capital, which we may be unable to obtain, to fund our capital expenditures and operating expenses, including working capital needs. In accordance with our growth strategy, we expect to opportunistically raise additional debt capital to help fund the growth of our business, subject to market and other conditions, but such debt capital may not be available to us on a timely basis at reasonable rates, or at all.
In the future, we may fail to generate sufficient cash flow from the sales of our homes and land to meet our cash requirements. Further, our capital requirements may vary materially from those currently planned if, for example, our revenues do not reach expected levels or we have to incur unforeseen capital expenditures and make investments to maintain our competitive position. If this is the case, we may require additional financing sooner than anticipated or we may have to delay or abandon some or all of our development and expansion plans or otherwise forego market opportunities.
To a large extent, our cash flow generating ability is subject to general economic, financial, competitive, legislative and regulatory factors and other factors that are beyond our control. We cannot assure you that our business will generate cash flow from operations in an amount sufficient to enable us to fund our liquidity needs. As a result, we may need to refinance all or a portion of our debt, on or before its maturity, or obtain additional equity or debt financing. We cannot assure you that we will be able to do so on favorable terms, if at all. Any inability to generate sufficient cash flow, refinance our debt or incur additional debt on favorable terms could adversely affect our financial condition and could cause us to be unable to service our debt and may delay or prevent the expansion of our business.
We are dependent upon payments from our subsidiaries to fund payments on our indebtedness and our ability to receive funds from our subsidiaries is dependent upon the profitability of our subsidiaries and restrictions imposed by law and contracts.
We are dependent on the cash flow of, and dividends and distributions to us from, our subsidiaries in order to service our existing indebtedness. Our subsidiaries are separate and distinct legal entities and have no obligation, contingent or otherwise, to pay any amounts due pursuant to any indebtedness of ours or to make any funds available therefor, except for those subsidiaries that have guaranteed our obligations under our outstanding indebtedness. The ability of our subsidiaries to pay any dividends and distributions will be subject to, among other things, the terms of any debt instruments of our subsidiaries then in effect as well as among other things, the availability of profits or funds and requirements of applicable laws, including surplus, solvency and other limits imposed on the
ability of companies to pay dividends. There can be no assurance that our subsidiaries will generate cash flow sufficient to pay dividends or distributions to us that enable us to pay interest or principal on our existing indebtedness.
Risks Related to Our Organization and Structure
We depend on key personnel.
Our success depends to a significant degree upon the contributions of certain key personnel including, but not limited to, Dale Francescon and Robert Francescon, our Co-Chief Executive Officers, each of whom would be difficult to replace. Although we have entered into employment agreements with Dale Francescon and Robert Francescon, in their capacities as officers, there is no guarantee that these executives will remain employed with us. If any of our key personnel were to cease employment with us, our operating results could suffer. Further, the process of attracting and retaining suitable replacements for key personnel whose services we may lose would result in transition costs and would divert the attention of other members of our senior management from our existing operations. The loss of services from key personnel or a limitation in their availability could materially and adversely impact our business, prospects, liquidity, financial condition and results of operations. Further, such a loss could be negatively perceived in the capital markets. We have not obtained and do not expect to obtain key man life insurance that would provide us with proceeds in the event of death or disability of any of our key personnel.
Termination of the employment agreements with the members of our management team could be costly and prevent a change in control of the Company.
The employment agreements we have entered into with Dale Francescon and Robert Francescon, our Co-Chief Executive Officers, in their capacities as officers, each provide that if their employment with us terminates under certain circumstances, we may be required to pay them significant amounts of severance compensation, thereby making it costly to terminate their employment. Furthermore, these provisions could delay or prevent a transaction or a change in control of the Company that might involve a premium paid for shares of our common stock or otherwise be in the best interests of our stockholders, which could adversely affect the market price of our common stock.
Certain anti-takeover defenses and applicable law may limit the ability of a third party to acquire control of the Company.
Our charter and bylaws and Delaware law contain provisions that may delay or prevent a transaction or a change in control of the Company that might involve a premium paid for shares of our common stock or otherwise be in the best interests of our stockholders, which could adversely affect the market price of our common stock. Certain of these provisions are described below.
Selected provisions of our charter and bylaws. Our charter and/or bylaws contain anti-takeover provisions that:
| ·
| | authorize our board of directors, without further action by the stockholders, to issue up to 50 million shares of preferred stock in one or more series, and with respect to each series, to fix the number of shares constituting that series, the powers, rights and preferences of the shares of that series, and the qualifications, limitations and restrictions of that series;
|
| ·
| | require that actions to be taken by our stockholders may be taken only at an annual or special meeting of our stockholders and not by written consent;
|
| ·
| | specify that special meetings of our stockholders can be called only by our board of directors, the chairman of our board of directors, our chief executive officer, or our president;
|
| ·
| | provide that our bylaws may be amended by our board of directors without stockholder approval;
|
| ·
| | provide that directors may be removed from office only by the affirmative vote of the holders of 66 2/3% of the voting power of our capital stock entitled to vote generally in the election of directors;
|
| ·
| | provide that vacancies on our board of directors or newly created directorships resulting from an increase in the number of our directors may be filled only by a vote of a majority of directors then in office, even though less than a quorum;
|
| ·
| | provide that, subject to the express rights, if any, of the holders of any series of preferred stock, any amendment, modification or repeal of, or the adoption of any new or additional provision, inconsistent with our charter provisions relating to the removal of directors, exculpation of directors, indemnification, the prohibition against stockholder action by written consent, and the
|
vote of our stockholders required to amend our bylaws requires the affirmative vote of the holders of at least 66 2/3% of the voting power of our capital stock entitled to vote generally in the election of directors;
|
| ·
| | provide that the stockholders may amend, modify or repeal our bylaws, or adopt new or additional provisions of our bylaws, only with the affirmative vote of 66 2/3% of the voting power of our capital stock entitled to vote generally; and
|
| ·
| | establish advance notice procedures for stockholders to submit nominations of candidates for election to our board of directors and other proposals to be brought before a stockholders meeting.
|
Selected provisions of Delaware law. We are a Delaware corporation, and we have elected to be subject to Section 203 of the DGCL by provision of our charter. In general, Section 203 of the DGCL prevents an “interested stockholder” (as defined in the DGCL) from engaging in a “business combination” (as defined in the DGCL) with us for three years following the date that person becomes an interested stockholder unless one or more of the following occurs:
| ·
| | Before that person became an interested stockholder, our board of directors approved the transaction in which the interested stockholder became an interested stockholder or approved the business combination;
|
| ·
| | Upon consummation of the transaction that resulted in the interested stockholder becoming an interested stockholder, the interested stockholder owned at least 85% of our voting stock outstanding at the time the transaction commenced, excluding for purposes of determining the voting stock outstanding (but not the outstanding voting stock owned by the interested stockholder) stock held by directors who are also officers of the Company and by employee stock plans that do not provide employees with the right to determine confidentially whether shares held under the plan will be tendered in a tender or exchange offer; or
|
| ·
| | Following the transaction in which that person became an interested stockholder, the business combination is approved by our board of directors and authorized at a meeting of stockholders by the affirmative vote of the holders of at least 66 2/3% of our outstanding voting stock not owned by the interested stockholder.
|
The DGCL generally defines “interested stockholder” as any person who, together with affiliates and associates, is the owner of 15% or more of our outstanding voting stock or is our affiliate or associate and was the owner of 15% or more of our outstanding voting stock at any time within the three-year period immediately before the date of determination.
We may change our operational policies, investment guidelines and business and growth strategies without stockholder consent, which may subject us to different and more significant risks in the future.
Our board of directors determines our operational policies, investment guidelines and business and growth strategies. Our board of directors may make changes to, or approve transactions that deviate from, those policies, guidelines and strategies without a vote of, or notice to, our stockholders. Under any of these circumstances, we may expose ourselves to different and more significant risks in the future, which could have a material adverse effect on our business, prospects, liquidity, financial condition and results of operations.
If we fail to maintain an effective system of internal controls, we may not be able to accurately determine our financial results or prevent fraud. As a result, our stockholders could lose confidence in our financial results, which could materially and adversely affect us.
Effective internal controls are necessary for us to provide reliable financial reports and effectively prevent fraud. There is no assurance that material weaknesses or significant deficiencies will not be identified in the future or that we will be successful in adequately remediating any such material weaknesses and significant deficiencies. We may in the future discover areas of our internal controls that need improvement. We cannot be certain that we will be successful in maintaining adequate internal control over our financial reporting and financial processes. Furthermore, as we grow our business, our internal controls will become more complex, and we will require significantly more resources to ensure our internal controls remain effective. Additionally, the existence of any material weakness or significant deficiency would require management to devote significant time and incur significant expense to remediate any such material weaknesses or significant deficiencies and management may not be able to remediate any such material weaknesses or significant deficiencies in a timely manner. The existence of any material weakness in our internal control over financial reporting could also result in errors in our financial statements that could require us to restate our financial statements again, cause us to fail to meet our reporting obligations and cause stockholders to lose confidence in our reported financial information, all of which could materially and adversely affect us.
Changes in accounting rules, assumptions and/or judgments could materially and adversely affect us.
Accounting rules and interpretations for certain aspects of our operations are highly complex and involve significant assumptions and judgment. These complexities could lead to a delay in the preparation and dissemination of our financial statements. Furthermore, changes in accounting rules and interpretations or in our accounting assumptions and/or judgments, such as asset impairments, could significantly impact our financial statements. In some cases, we could be required to apply a new or revised standard retroactively, resulting in restating prior period financial statements. Any of these circumstances could have a material adverse effect on our business, prospects, liquidity, financial condition and results of operations.
We may face substantial damages or be enjoined from pursuing important activities as a result of existing orthe rebranding of our Wade Jurney Homes brand to Century Complete we recorded an impairment charge of $2.8 million associated with the Wade Jurney Homes trade name during the year ended December 31, 2019. If management’s expectations of future litigation, arbitration or other claims.
In our homebuilding activities, we are exposed to potentially significant litigation, including breachresults and cash flows decrease significantly, impairments of contract, contractual disputes and disputes relating to defective title, property misdescription or construction defects, including use of defective materials. Although we have established warranty, claim and litigation reserves that we believe are adequate, due to the uncertainty inherent in litigation, legal proceedingsremaining intangible assets may result in the award of substantial damages against us beyond our reserves. Furthermore, plaintiffs may in certain of these legal proceedings seek class action status with potential class sizes that vary from case to case. Class action lawsuits can be costly to defend, and if we were to lose any certified class action suit, it could result in substantial liability for us. In addition, we are subject to potential lawsuits, arbitration proceedings and other claims in connection with our business.
With respect to certain general liability exposures, including construction defect and product liability claims, interpretation of underlying current and future trends, assessment of claims and the related liability and reserve estimation process require us to exercise significant judgment due to the complex nature of these exposures, with each exposure often exhibiting unique circumstances. Furthermore, once claims are asserted for construction defects, it is difficult to determine the extent tooccur, which the assertion of these claims will expand geographically. As a result, our insurance policies may not be available or adequate to cover any liability for damages, the cost of repairs, and/or the expense of litigation surrounding current claims, and future claims may arise out of events or circumstances not covered by insurance and not subject to effective indemnification agreements with our subcontractors. Should such a situation arise, it may have a material adverse effect on our business, financial condition and operating results.
Failure by our directors, officers or employees to comply with applicable codes of conduct could materially andwould adversely affect us.our results of operations.
We have adopted a code of business conduct and ethics for our directors, officers and any employees. Our adoption of this code and other standards of conduct is not a representation or warranty that all persons subject to this code or standards are or will be in complete compliance. The failure of a director, officer or employee to comply with the applicable code or standards of conduct may result in termination of the relationship and/or adverse publicity, which could materially and adversely affect us.
Any joint venture investments that we make could be adversely affected by our lack of sole decision makingdecision-making authority, our reliance on co-venturers’ financial conditions and disputes between us and our co-venturers.
On November 1, 2016,Prior to acquiring Wade Jurney Homes, we first acquired a 50% ownership of WJH LLC (which we refer tointerest and held this investment as “WJH”), which is a successor to Wade Jurney Homes, Inc. and Wade Jurney of Florida, Inc. WJH primarily targets first-time homebuyers in the Southeastern United States. The Company and Mr. Wade Jurney will share responsibility for all of WJH’s strategic decisions, with Mr. Wade Jurney continuing to manage the day-to-day operations under the existing operating model.
joint venture. Although it is currently not a focus in our business strategy, we may in the future continue to co-invest with third parties through partnerships, joint ventures or other entities, acquiring non-controlling interests in or sharing responsibility for managing the affairs of a land acquisition and/or a development. In this event, we would make a capital investment and may not be in a position to exercise sole decision-making authority regarding the acquisition and/or development, and our investment may be illiquid due to our lack of control. Investments in partnerships, joint ventures, or other entities may, under certain circumstances, involve risks not present were a third party not involved, including the possibility that partners or co-venturers might become bankrupt, fail to fund their share of required capital contributions, make poor business decisions or block or delay necessary decisions. Partners or co-venturers may have economic or other business interests or goals which are inconsistent with our business interests or goals, and may be in a position to take actions contrary to our policies or objectives. Such investments may also have the potential risk of impasses on decisions, such as a sale, because neither we nor the partner or co-venturer would have full control over the partnership or joint venture. Disputes between us and partners or co-venturers may result in litigation or arbitration that would increase our expenses and prevent our officers and/or directors from focusing their time and effort on our business. In addition, we may in certain circumstances be liable for the actions of our third-party partners or co-venturers.
Risks Related to Our Indebtedness and Liquidity
Difficulty in obtaining sufficient capital could result in an inability to acquire land for our developments or increased costs and delays in the completion of our development projects.
The homebuilding industry is capital-intensive and requires significant up-front expenditures to acquire land parcels and begin development. If our internally generated funds are not sufficient, we may seek additional capital in the form of equity or debt financing from a variety of potential sources, including additional bank financings and/or securities offerings. The availability of borrowed funds, especially for land acquisition and construction financing, may be greatly reduced nationally, and the lending community may require
An information systems interruption increased amounts of equity to be invested in a project by borrowers in connection with both new loans and the extension of existing loans. The credit and capital markets in the past have experienced significant volatility. Continued volatility in these markets may restrict our flexibility to access such financing when needed. If we are not successful in obtaining sufficient capital to fund our planned capital and other expenditures, when needed, we may be unable to acquire land for our housing developments and/or breachto develop the housing. Additionally, if we cannot obtain additional financing to fund the purchase of land under our option contracts or purchase contracts, we may incur contractual penalties and fees. Any difficulty in securityobtaining sufficient capital for planned development expenditures could also cause project delays and any such delay could result in cost increases. Any one or more of the foregoing events could have a material adverse effect on our business, prospects, liquidity, financial condition and results of operations.
We have substantial indebtedness and expect to continue to use leverage in executing our business strategy, which could have important consequences on our business and adversely affect us.the return on our assets.
As of December 31, 2021, we had approximately $1.3 billion in outstanding indebtedness, consisting of $500 million outstanding on our 3.875% senior notes due 2029, $500 million outstanding on our 6.750% senior notes due 2027, $331.9 million in borrowings outstanding under our mortgage repurchase facilities, and $9.2 million outstanding under other financing obligations. As of December 31, 2021, we had all $800.0 million in availability under our revolving line of credit. Our board of directors will consider a number of factors when evaluating our level of indebtedness and when making decisions regarding the incurrence of new indebtedness, including the purchase price of assets to be acquired with debt financing, the estimated market value of our assets and the ability of particular assets, and the Company as a whole, to generate cash flow to cover the expected debt service. Our charter does not contain a limitation on the amount of debt we may incur, and our board of directors may change our target debt levels at any time without the approval of our stockholders.
This substantial indebtedness, as well as any future indebtedness we may incur, could have important consequences for our business and holders of our securities, including:
making it more difficult for us to satisfy our obligations with respect to our debt or to our trade or other creditors;
causing us to pay higher interest rates upon refinancing indebtedness if interest rates rise;
increasing our vulnerability to adverse economic or industry conditions;
limiting our ability to obtain additional financing to fund capital expenditures and acquisitions, particularly when the availability of financing in the capital markets is limited;
requiring a substantial portion of our cash flows from operations for the payment of interest on our debt and reducing our ability to use our cash flows to fund working capital, land purchases, capital expenditures, acquisitions, stock repurchases, and general corporate requirements;
limiting our flexibility in planning for, or reacting to, changes in our business and the homebuilding industry; and
placing us at a competitive disadvantage to less leveraged competitors.
We relycannot assure you that our business will generate sufficient cash flow from operations or that future borrowings will be available to us through capital markets financings or under our credit facilities or otherwise in an amount sufficient to enable us to pay our indebtedness, or to fund our other liquidity needs. We may need to refinance all or a portion of our indebtedness, on accounting, financialor before its maturity. Our mortgage repurchase facilities have varying short term dates through August 23, 2022. Our revolving line of credit expires in 2026 and operational management information systemsa substantial portion of our senior notes mature in 2027. We cannot assure you that we will be able to conductrefinance any of our operations. Any disruptionindebtedness on commercially reasonable terms, or at all. In addition, we may incur additional indebtedness in these systemsorder to finance our operations, make acquisitions or to repay existing indebtedness. If we cannot service our indebtedness, we may have to take actions such as selling assets, seeking additional debt or equity or reducing or delaying capital expenditures, strategic acquisitions, investments and alliances. We cannot assure you that any such actions, if necessary, could be effected on commercially reasonable terms, or at all, or on terms that would be advantageous to our stockholders or on terms that would not require us to breach the terms and conditions of our existing or future debt agreements.
Access to future financing sources may not be available on favorable terms, or at all, especially in light of current market conditions, which could adversely affect our ability to conductmaximize our returns.
We expect to continue to employ prudent levels of leverage to finance the acquisition and development of our lots and construction of our homes and to operate our Financial Services business. Furthermore,Our access to additional third-party sources of financing will depend, in part, on:
general market conditions;
the market’s perception of our growth potential;
with respect to acquisition and/or development financing, the market’s perception of the value of the land parcels to be acquired and/or developed;
our current debt levels;
our current and expected future earnings;
our cash flows; and
the market price per share of our common stock.
If the capital and credit markets experience increased volatility or weakness, potential lenders may be unwilling or unable to provide us with financing that is attractive to us or may charge us prohibitively high fees in order to obtain financing. In such a situation, investment returns on our assets and our ability to make acquisitions could be adversely affected by our inability to secure additional financing on reasonable terms, if at all.
In addition, while we have not encountered any security breachsuch issues to date, if the credit rating agencies that rate our debt were to downgrade our credit ratings, it would likely increase our cost of information systemscapital and make it more difficult for us to obtain new financing and access the capital and credit markets, which could also have a material adverse effect on our business, financial condition, results of operations, or datacash flows.
Depending on market conditions at the relevant time, we may have to rely more heavily on additional equity financings, which would cause dilution to our existing stockholders, or on less efficient forms of debt financing that require a larger portion of our cash flow from operations, thereby reducing funds available for our operations, future business opportunities and other purposes. We may not have access to such equity or debt capital on favorable terms at the desired times, or at all.
Increased demand for homes could require us to further increase our indebtedness and credit facilities, and our inability to do that could limit our ability to take full advantage of market opportunities.
Our business requires that we be able to continue to finance the development of our residential communities and the extension of mortgage loans by our Financial Services business. One of the ways we do this is with bank borrowings. At December 31, 2021, we had a $800.0 million revolving line of credit, of which no amounts were outstanding. If market conditions strengthen to the point that we need additional funding but we are not able to increase this facility or obtain funds from other types of financings, that could prevent us from taking full advantage of the enhanced market opportunities.
Interest expense on our debt limits our cash available to fund our growth strategies.
We pay significant interest expense on our outstanding indebtedness. During the year ended December 31, 2021, we paid approximately $59.2 million in interest expense payments. Borrowings under our revolving line of credit bear interest at a floating rate equal to the adjusted Eurodollar Rate plus an applicable margin between 2.05% and 2.65% per annum, or, in the Administrative Agent’s discretion, a base rate plus an applicable margin between 1.05% and 1.65% per annum. Higher interest rates could increase debt service requirements on our current floating rate debt and on any floating rate debt we subsequently incur, and could reduce funds available for operations, future business opportunities or other purposes. If we need to repay existing debt during periods of rising interest rates, we could be required to refinance our then-existing debt on unfavorable terms or liquidate one or more of our assets to repay such debt at times which may not permit realization of the maximum return on such assets and could result in a violationloss. The occurrence of either such event or both could materially and adversely affect our cash flows and results of operations.
We may not be able to generate sufficient cash flows to meet our debt service obligations.
Our ability to generate sufficient cash flows from operations to make scheduled payments on our debt obligations will depend on our current and future financial performance, which is subject to general economic, financial, competitive, legislative, regulatory and other factors that are beyond our control. In the future, we may fail to generate sufficient cash flows from the sales of our homes and land to meet our cash requirements. Further, our capital requirements may vary materially from those currently planned if, for example, our revenues do not reach expected levels or we have to incur unforeseen capital expenditures and make investments to maintain our competitive position. If we do not generate sufficient cash flows from operations to satisfy our debt obligations, including interest payments and the payment of principal at maturity, we may have to undertake alternative financing plans, such as refinancing or restructuring our debt, selling assets, reducing or delaying capital investments or seeking to raise additional capital. We cannot provide assurance that any refinancing would be possible, that any assets could be sold, or, if sold, of the timeliness and amount of proceeds realized from those sales, that additional financing could be obtained on acceptable terms, if at all, or that additional financing would be permitted under the terms of our various debt instruments then in effect. Furthermore, our ability to refinance would depend upon the condition of the finance and credit markets. Our inability to generate sufficient cash flows to satisfy our debt obligations, or to refinance our obligations on commercially reasonable terms or on a timely basis, would materially affect our business, financial condition or results of operations and may delay or prevent the expansion of our business.
The agreements governing our debt include covenants and other provisions that may restrict our financial and business operations. Failure to comply with the covenants and conditions imposed by our debt agreements could restrict future borrowings or cause our debt to become immediately due and payable.
The agreements governing our indebtedness, including our revolving line of credit and the indentures that govern our senior notes, contain negative covenants customary for such financings, such as limiting our ability to sell or dispose of assets, incur additional indebtedness or liens, make certain restricted payments, make certain investments, consummate mergers, consolidations or other business combinations or engage in other lines of business. These restrictions may interfere with our ability to engage in other necessary or desirable business activities, which could materially affect our business, financial condition or results of operations. Our revolving line of credit also requires us to comply with certain financial ratios and covenants, such as maximum consolidated leverage ratios, minimum consolidated interest coverage ratios and minimum tangible net worth. Our ability to comply with these covenants depends on our financial condition and performance and also is subject to events outside our control. Asset write-downs, other non-cash charges and other one-time events also impact our ability to comply with these covenants. In addition, these restrictions may interfere with our ability to obtain financing or to engage in other necessary or desirable business activities, which may have a material effect on our operations. These covenants are subject to important exceptions and qualifications. Moreover, if we fail to comply with these covenants and are unable to obtain a waiver or amendment, an event of default would result. Our revolving line of credit and other debt agreements, including the indentures governing our senior notes, also contain other events of default customary for such financings. In addition, the indentures governing our senior notes and the agreement governing our revolving line of credit contain cross default provisions. Our inability to generate sufficient cash flow to satisfy our debt service obligations, or to refinance or restructure our obligations on commercially reasonable terms or at all, would likely have an adverse effect, which could be material, on our business, financial condition, and operating results. We cannot provide assurance that we would have sufficient liquidity to repay or refinance our debt if such amounts were accelerated upon an event of default. If we are unable to service our debt, this could materially affect our business, financial condition or results of operations.
We are dependent upon payments from our subsidiaries to fund payments on our indebtedness and our ability to receive funds from our subsidiaries is dependent upon the profitability of our subsidiaries and restrictions imposed by law and contracts.
We are dependent on the cash flow of, and dividends and distributions to us from, our subsidiaries in order to service our existing indebtedness. Our subsidiaries are separate and distinct legal entities and have no obligation, contingent or otherwise, to pay any amounts due pursuant to any indebtedness of ours or to make any funds available therefor, except for those subsidiaries that have guaranteed our obligations under our outstanding indebtedness. The ability of our subsidiaries to pay any dividends and distributions will be subject to, among other things, the terms of any debt instruments of our subsidiaries then in effect as well as among other things, the availability of profits or funds and requirements of applicable privacylaws, including surplus, solvency and other laws,limits imposed on the ability of companies to pay dividends. There can be no assurance that our subsidiaries will generate cash flow sufficient to pay dividends or distributions to us that enable us to pay interest or principal on our existing indebtedness.
We may require additional capital in the future and may not be able to secure adequate funds on terms acceptable to us.
Although it is difficult for us to predict our future liquidity requirements, we believe that we will be able to fund our current and foreseeable liquidity needs with our cash on hand, anticipated cash generated from operations, and cash expected to be available from our revolving line of credit or through accessing debt or equity capital, as needed. The expansion and development of our business may require significant legaladditional capital, which we may be unable to obtain, to fund our capital expenditures and operating expenses, including working capital needs. At December 31, 2021, we had a $800.0 million revolving line of credit, of which no amounts were outstanding. In addition, in accordance with our growth strategy, we expect to opportunistically raise additional capital to help fund the growth of our business, subject to market and other conditions, but such capital may not be available to us on a timely basis at reasonable rates, or at all. Under our shelf registration statement, which we filed with the SEC in July 2021 and was automatically effective upon filing, we have the ability to access the debt and equity capital markets as needed as part of our ongoing financing strategy and subject to market conditions, including through the use of our at-the-market facility with J.P. Morgan Securities LLC, BofA Securities, Inc., Fifth Third Securities, Inc., and Wells Fargo Securities, LLC, as sales agents (which we refer to as our “ATM Facility”). If we raise additional funds by issuing equity securities under our ATM Facility or otherwise, our stockholders may experience dilution. Additional debt financing, if available, may involve additional covenants restricting our operations or our ability to incur additional debt, in addition to those under our existing indentures and revolving line of credit. Any additional debt financing or additional equity that we raise may contain terms that are not favorable to us or our stockholders.
An inability to obtain additional performance, payment and completion surety bonds and letters of credit could limit our future growth.
We are often required to provide performance, payment and completion surety bonds or letters of credit to secure the completion of our construction contracts, development agreements and other arrangements. We have obtained facilities to provide the required volume of
these surety bonds and letters of credit for our expected growth in the medium term; however, unexpected growth may require additional facilities.
We may also be required to renew or amend our existing facilities. Our ability to obtain additional performance, payment and completion surety bonds and letters of credit primarily depends on our credit rating, capitalization, working capital, past performance, management expertise and certain external factors, including the capacity of the markets for such bonds. Surety bond and letter of credit providers consider these factors in addition to our performance and claims record and provider-specific underwriting standards, which may change from time to time.
If our performance record or our providers’ requirements or policies change and we are unable provide performance, payment and completion surety bonds to ensure the completion of our projects, our business operations and financial exposure, damagecondition could be adversely affected. If market conditions become unfavorable, we may not be able to obtain new surety bonds, or and some providers might request credit enhancements (such as cash deposits or letters of credit) in order to maintain existing bonds or to issue new bonds. If we are unable to obtain new bonds in the future, or are required to provide credit enhancements with respect to our reputation,current or future bonds, our liquidity could be negatively impacted, and our growth and results of operations will be adversely affected.
Risks Related to Tax Policies and Regulation
Any limitation on, or reduction or elimination of, tax benefits associated with owning a home would have an adverse effect on the demand for our homes, which could be material to our business.
Prior to the late 2017 enactment of the Tax Cuts and Jobs Act (which we refer to as the “TCJA”), significant expenses of owning a home, including mortgage loan interest and state and local property and income taxes, generally were deductible expenses for an individual’s U.S. federal income taxes subject to various limitations. The TCJA established new limits on the federal tax deductions individual taxpayers may take on mortgage loan interest payments and on state and local taxes, including property and income taxes. Under the TCJA, through the end of 2023, the mortgage interest deduction cap on a newly purchased home was decreased to $750,000 a year ($375,000 in the case of a separate return filed by a married individual) from the prior $1,000,000 threshold, and the annual deduction for real estate and other property taxes, state and local income taxes and sales taxes has been limited to a combined amount of $10,000 (or $5,000 in the case of a separate return filed by a married individual). The TCJA also increased the standard deduction for individuals. As a result, fewer individuals are expected to itemize their income tax deductions, which would reduce the income tax advantages associated with homeownership for those individuals. These changes have reduced and may continue to reduce the actual or perceived affordability of homeownership, which have adversely affected and could continue to adversely affect demand for and sales prices of new homes, especially in areas with relatively high housing prices or high state and local income taxes and real estate taxes. Any further change in income tax laws by the federal or state government to eliminate or substantially reduce income tax benefits associated with homeownership could adversely affect demand for and sales prices of new homes.
Our income tax expense is reduced based upon the availability of the Internal Revenue Code Section 45L credit for energy-efficient new homes (the “Federal Energy Credits”), which provided a tax credit of $2,000 per qualifying home to eligible builders, for homes delivered through December 31, 2021. Proposed legislation included in the pending “Build Back Better Act” would extend the Federal Energy Credits through December 31, 2031 but would modify the current qualification requirements and provide a $2,500 or $5,000 tiered credit for new single-family homes meeting designated “Energy Star” or “Zero Energy” program requirements, respectively. Neither the Build Back Better Act nor any similar legislation has been enacted as of the date of this Form 10-K, and it is uncertain whether an extension or similar tax credit will be adopted or available in the future or the scope of any modified program requirements. The Federal Energy Credits reduced our income tax expense by $16.5 million and $8.5 million for the years ended December 31, 2021 and 2020, respectively. If similar legislation is not enacted, our income tax expense may increase, which could have an adverse effect on our business.
Increases in property and sales taxes could prevent potential customers from buying our homes and adversely affect our business or financial results.
Increases in property tax rates by local governmental authorities, as experienced in response to reduced federal and state funding and shortfalls in revenue caused by the COVID-19 pandemic, can adversely affect the ability of potential customers to obtain financing or their desire to make a new home purchase and they may decide, as a result, not to purchase one of our homes. Fees imposed on developers to fund schools, open spaces or road improvements, and/or to provide low and moderate income housing, could increase our costs and have an adverse effect on our business and results of operations. In addition, increases in sales taxes could adversely affect our potential customers who may consider those costs in determining whether to make a new home purchase and decide, as a result, not to purchase one of our homes.
The Tax Cuts and Jobs Act, other enacted and pending legislation and the policies of the administration could adversely affect our business and financial condition.
The TCJA significantly reformed the Internal Revenue Code of 1986, as amended. The TCJA, among other things, contains significant changes to corporate taxation, including reduction of the corporate tax rate from a top marginal rate of 35% to a flat rate of 21%, limitation of the tax deduction for interest expense to 30% of adjusted earnings (except for certain small businesses), limitation of the deduction for net operating losses to 80% of current year taxable income, elimination of net operating loss carrybacks, one time taxation of offshore earnings at reduced rates regardless of whether they are repatriated, immediate deductions for certain new investments instead of deductions for depreciation expense over time, and modifying or repealing many business deductions and credits. Notwithstanding the reduction in the corporate income tax rate, the overall impact of the TCJA is uncertain and our business and financial condition have been and could continue to be adversely affected by the TCJA. The Biden Administration has indicated that it supports increases in corporate and certain individual income tax rates and may in the future propose additional measures to repeal certain taxpayer favorable provisions of the TCJA and other legislation, which may adversely affect our business and financial condition.
Non-U.S. holders may be subject to United States federal income tax on gain realized on the sale or disposition of shares of our common stock, which may cause non-US investors not to invest in our Company.
Because of our holdings in United States real property interests, we believe we are and will remain a “United States real property holding corporation” (which we refer to as “USRPHC”) for United States federal income tax purposes. However, assuming we are publicly traded as discussed below, non-U.S. holders who actually or constructively hold five percent or less of our common stock should qualify for an exemption from federal income tax that otherwise would be imposed on gain on our common stock. As a USRPHC, our stock may be treated as a United States real property interest (which we refer to as “USRPI”), gains from the sale of which by non-U.S. holders would be subject to U.S. income tax and reporting obligations pursuant to the Foreign Investment in Real Property Tax Act (which we refer to as “FIRPTA”). Our common stock will not be treated as a USRPI if it is regularly traded on an established securities market, except in the case of a non-U.S. holder that actually or constructively holds more than five percent of such class of stock at any time during the shorter of the five-year period preceding the date of disposition or the holder’s holding period for such stock. We anticipate that our common stock will continue to be regularly traded on the New York Stock Exchange. However, no assurance can be given that our common stock will remain regularly traded in the future. If our common stock is treated as a USRPI, a non-U.S. holder would be subject to regular United States federal income tax with respect to any gain on such stock in the same manner as a taxable U.S. holder (subject to any applicable alternative minimum tax and a lossspecial alternative minimum tax in the case of confidencenonresident alien individuals). In addition, the purchaser of the common stock would be required to withhold and remit to the I.R.S. 15% of the purchase price unless an exception applies. A non-U.S. holder that is not otherwise exempt from FIRPTA as discussed above also would be required to file a U.S. federal income tax return for any taxable year in which it realizes a gain from the disposition of our common stock that is subject to U.S. federal income tax. Because of these adverse tax consequences, non-U.S. investors may choose not to invest in our security measures,Company.
Non-U.S. holders should consult their tax advisors concerning the consequences of disposing of shares of our common stock.
Our income tax provision and tax reserves may be insufficient if a taxing authority is successful in asserting positions that are contrary to our interpretations and related reserves, if any, and we may not realize our deferred tax assets.
Significant judgment is required in determining our provision for income taxes and our reserves for federal, state, and local taxes. In the ordinary course of business, there may be matters for which the ultimate outcome is uncertain. Our evaluation of our tax matters is based on a number of factors, including relevant facts and circumstances, applicable tax law, correspondence with tax authorities during the course of audits, and effective settlement of audit issues. Although we believe our approach to determining the tax treatment for such items is appropriate, no assurance can be given that the final tax authority review will not be materially different than that which is reflected in our income tax provision and related tax reserves. Such differences could have a material adverse effect on our income tax provision in the period in which such determination is made and, consequently, on our financial position, cash flows, or net income.
We are periodically audited by various federal, state, and local authorities regarding tax matters. As each audit is concluded, adjustments, if any, are recorded in our financial statements in the period determined. To provide for potential tax exposures, we consider a variety of factors, including relevant facts and circumstances, applicable tax law, correspondence with taxing authorities, and effective settlement of audit issues. If these reserves are insufficient upon completion of an audit, there could be an adverse impact on our financial position, cash flows, and results of operations. As of December 31, 2021, we are not currently under audit by any federal, state, or local authorities. We may be subject to U.S. federal income tax and various state income tax examinations for calendar tax years ending 2016 through 2021.
We are required to recognize deferred tax assets and liabilities at enacted income tax rates for the temporary differences between the financial reporting bases and the tax bases of our assets and liabilities. Any effects of changes in income tax rates or tax laws are included in the provision for income taxes in the period of enactment. When it is more likely than not that a portion or all of a deferred
tax asset will not be realized in the future, we record a corresponding valuation allowance against the deferred tax asset. As of December 31, 2021 and 2020, we had deferred tax assets, net of deferred tax liabilities, of $21.2 million and $12.5 million, respectively, against which we provided no valuation allowance. The ultimate realization of our deferred tax assets is dependent upon generating future taxable income. While we have not recorded valuation allowances against our deferred tax assets, the valuation allowances are subject to change as facts and circumstances change.
The value of our deferred tax assets and liabilities are also dependent upon the tax rates expected to be in effect at the time they are realized. A change in enacted corporate tax rates in our major jurisdictions, especially the U.S. federal corporate tax rate, would change the value of our deferred taxes, which could harmbe material.
Risk Related to Possible Conflicts of Interest
As a result of Dale Francescon’s and Robert Francescon’s relationship with the Company, conflicts of interest may arise with respect to any transactions involving or with Dale Francescon, Robert Francescon, or their affiliates, and their interests may not be aligned with yours.
Dale Francescon and Robert Francescon are our business.Co-Chief Executive Officers, sit on our board of directors, are brothers, and collectively beneficially owned 3,715,231 shares of our common stock, including 261,520 shares issuable upon vesting of performance share unit awards within 60 days of December 31, 2021, which together represents 11.0% of our common stock outstanding as of December 31, 2021. For so long as Dale Francescon and Robert Francescon control such a significant percentage of our common stock, they will have significant influence over the power to:
elect our directors and exercise overall control over the Company;
agree to sell or otherwise transfer a controlling stake in the Company; and
determine the outcome of substantially all actions requiring the majority approval of our stockholders, including transactions with related parties, corporate reorganizations, mergers, acquisitions and dispositions of assets.
The interests of Dale Francescon and Robert Francescon may not be fully aligned with our other stockholders, and this could lead to a strategy that is not in the best interests of our other stockholders. In addition, their significant ownership in us and resulting ability to effectively control us will limit the ability of our other stockholders to influence corporate matters and may discourage someone from making a significant equity investment in our Company, or could discourage transactions involving a change in control.
In addition, there may be transactions between us and Dale Francescon, Robert Francescon, or their affiliates that could present an actual or perceived conflict of interest. These conflicts of interest may lead Dale Francescon and/or Robert Francescon to recuse himself or themselves from actions of our board of directors with respect to any transactions involving or with Dale Francescon or Robert Francescon or their affiliates. For example, we have entered into employment agreements with Dale Francescon and Robert Francescon, our Co-Chief Executive Officers, in their capacities as officers, pursuant to which they are required to devote substantially full-time attention to our affairs. We may choose not to enforce, or to enforce less vigorously, our rights under these agreements because of our desire to maintain our ongoing relationship with Dale Francescon and Robert Francescon.
Risks Related to Ownership of our Common Stock
A trading market for our common stock may not be sustained and our common stock prices could decline.
Although our common stock is listed on the New York Stock Exchange under the symbol, “CCS,“CCS,” an active trading market for the shares of our common stock may not be sustained. Accordingly, no assurance can be given as to the following:
| ·
| | the likelihood that an active trading market for shares of our common stock will be sustained;
|
| ·
| | the liquidity of any such market;
|
| ·
| | the ability of our stockholders to sell their shares of common stock; or
|
| ·
| | the price that our stockholders may obtain for their common stock.
|
the likelihood that an active trading market for shares of our common stock will be sustained;
the liquidity of any such market;
the ability of our stockholders to sell their shares of common stock; or
the price that our stockholders may obtain for their common stock.
In addition, our common stock has experienced price and volume volatility over the past year. During 2021, the sale price of our common stock ranged from $41.82 to $84.95 per share and the trading volume ranged from 138,200 shares to 2,504,600 shares. The market price and volume of our common stock may continue to experience fluctuations not only due to general stock market conditions but also due to government regulatory action, tax laws, interest rates, the condition of the U.S. economy and a change a change in sentiment in the market regarding our industry, operations or business prospects. In addition to the other risk factors, discussed in this section, the price and volume volatility of our common stock may be affected by:
| ·
| | factors influencing home purchases, such as availability of home mortgage loans and interest rates, credit criteria applicable to prospective borrowers, ability to sell existing residences, and homebuyer sentiment in general;
|
| ·
| | the operating and securities price performance of companies that investors consider comparable to us;
|
| ·
| | announcements of strategic developments, acquisitions and other material events by us or our competitors;
|
| ·
| | changes in global financial markets and global economies and general market conditions, such as interest rates, commodity and equity prices and the value of financial assets;
|
| ·
| | additions or departures of key personnel;
|
| ·
| | operating results that vary from the expectations of securities analysts and investors;
|
| ·
| | actions by stockholders; and
|
| ·
| | passage of legislation or other regulatory developments that adversely affect us or the homebuilding industry.
|
factors influencing home purchases, such as availability of home mortgage loans, interest rates, credit criteria applicable to prospective borrowers, ability to sell existing residences, and homebuyer sentiment in general;
the operating and securities price performance of companies that investors consider comparable to us;
announcements of strategic developments, acquisitions and other material events by us or our competitors;
changes in global financial markets and global economies and general market conditions, such as interest rates, commodity and equity prices and the value of financial assets;
additions or departures of key personnel;
operating results that vary from the expectations of securities analysts and investors;
sales of our equity securities by stockholders or management or sales of additional equity securities by us;
changes in our stock repurchase or dividend policies;
actions by stockholders; and
passage of legislation or other regulatory developments that adversely affect us or the homebuilding industry.
If an active market is not maintained, or if our common stock continues to experience price and volume volatility, the market price of our common stock may decline.
Stockholders of a public company sometimes bring securities class action suits against the company following periods of instability in the market price of that company’s securities. If we were involved in a class action suit, it could divert a significant amount of our management’s attention and other resources from our business and operations, which could harm our results of operations and require us to incur significant expenses to defend the suit. Any such class action suit, whether or not successful, could harm our reputation and restrict our ability to raise capital in the future. In addition, if a claim is successfully made against us, we may be required to pay significant damages, which could have a material adverse effect on our results of operations and financial condition.
Furthermore, our ability to raise funds through the issuance of equity or otherwise use our common stock as consideration is impacted by the price of our common stock. A low stock price may adversely impact our ability to reduce our financial leverage, as measured by the ratio of total debt to total capital. Continued high levels of leverage or significant increases may adversely affect our credit ratings and make it more difficult for us to access additional capital. These factors may limit our ability to implement our operating and growth plans.
If securities analysts do not publish, or cease publishing, research or reports about us, our business or our market, or if they change their recommendations regarding our stock adversely, the price of our common stock and trading volume could decline.
The trading market for our common stock could be influenced by any research and reports that securities or industry analysts publish about us, our business or our market. If one or more of the analysts who covers us downgrades our common stock or publishes inaccurate or unfavorable research about us, our business, industry or our market,markets, the price of our common stock would likely decline. If one or more of these analysts ceases coverage of us or fails to publish reports on us regularly, demand for our common stock could decrease, which could cause the price of our common stock and trading volume to decline.
Future offerings of debt securities, which would rank senior to our common stock upon oura bankruptcy liquidation, and future offerings of equity securities, including those that may be senior to our common stock for the purposes of dividend and liquidating distributions, may adversely affect the market price of our common stock.
In the future, we may attempt to increase ourTo raise capital resources, by making offeringswe have offered and sold debt and equity securities, including securities that rank senior to our common stock, and may continue to do so in the future. For example, in August 2021, we sold and issued $500.0 million aggregate principal amount of debt securities or additional offerings of equity securities.3.875% senior notes due 2029. Upon a bankruptcy or liquidation, holders of our debt securities and lenders with respect to other borrowings will receive a distribution of our available assets prior to the holders of our common stock. Additional equity offerings may dilute the holdings of our existing stockholders or reduce the market price of our common stock, or both. Our preferred stock, if issued, could have a preference on liquidating distributions or a preference on dividend payments or both that could limit our ability to pay dividends or make liquidating distributions to the holders of our common stock. Our decision to issue securities in any future offering will depend on market conditions at the time and other factors, some of which may be beyond our control. As a result, we cannot predict or estimate the amount, timing or nature of our future offerings, and purchasersholders of our common stock bear the risk of our future offerings reducing the market price of our common stock and diluting their ownership interest in the Company.
We cannot guarantee that our stock repurchase program will be fully consummated or that our stock repurchase program will enhance long-term stockholder value, and stock repurchases could increase the volatility of the price of our stock and diminish our cash reserves.
In November 2018, we authorized a stock repurchase program, under which we may repurchase up to 4,500,000 shares of our outstanding common stock. As of December 31, 2021, the number of shares that remained available for repurchase pursuant to our stock repurchase program is 3,812,939 shares. Under the terms of the program, the shares may be repurchased from time to time in open market transactions at prevailing market prices, in privately negotiated transactions or by other means in accordance with federal securities laws. The actual manner, timing, amount and value of repurchases under the stock repurchase program will be determined by management at its discretion and will depend on a number of factors, including the market price of our common stock, trading volume, other capital management objectives and opportunities, applicable legal requirements, and general market and economic conditions. We intend to finance any stock repurchases through available cash and our revolving line of credit. Repurchases also may be made under a trading plan under Rule 10b5-1, which would permit shares to be repurchased when we might otherwise may be precluded from doing so because of self-imposed trading blackout periods or other regulatory restrictions. There is no guarantee as to the number of shares that will be repurchased, and the stock repurchase program may be extended, suspended or discontinued at any time without notice at our discretion, which may result in a decrease in the trading price of our common stock. The stock repurchase program could increase volatility in and affect the price of our common stock. The existence of our stock repurchase program could also cause the price of our common stock to be higher than it would be in the absence of such a program and could potentially reduce the market liquidity for our common stock. Additionally, repurchases under our stock repurchase program will diminish our cash reserves and could increase our indebtedness. There can be no assurance that any stock repurchases will enhance stockholder value because the market price of our common stock may decline below the levels at which we repurchased such shares. Any failure to repurchase shares after we have announced our intention to do so may negatively impact our reputation and investor confidence in us and may negatively impact our stock price. Although our stock repurchase program is intended to enhance long-term stockholder value, short-term stock price fluctuations could reduce the program’s effectiveness.
Our actual operating results may differ significantly from our guidance, which could cause the market price of our common stock to decline.
From time to time, we release guidance regarding our future performance, such as our anticipated annual revenue and home deliveries, that represents our management’s estimates as of the date of release. This guidance, which consists of forward-looking statements, is prepared by our management and is qualified by, and subject to, United States federal income taxthe assumptions and the other information contained or referred to in the release. Our guidance is not prepared with a view toward compliance with published guidelines of the American Institute of Certified Public Accountants, and neither any independent registered public accounting firm nor any other independent expert or outside party compiles, examines or reviews the guidance and, accordingly, no such person expresses any opinion or any other form of assurance with respect thereto.
Guidance is based upon a number of assumptions and estimates that, while presented with numerical specificity, is inherently subject to significant business, economic and competitive uncertainties and contingencies, many of which are beyond our control and are based upon specific assumptions with respect to future business decisions, some of which will change. We generally state possible outcomes as high and low ranges which are intended to provide a sensitivity analysis as variables are changed but are not intended to represent that actual results could not fall outside of these ranges. The principal reason that we release this data is to provide a basis for our management to discuss our business outlook with analysts and investors. We do not accept any responsibility for any projections or reports published by any such persons.
Guidance is necessarily speculative in nature, and it can be expected that some or all of the assumptions of the guidance furnished by us will not materialize or will vary significantly from actual results, particularly any guidance relating to the results of operations of acquired businesses or companies as our management will, necessarily, be less familiar with their business, procedures and operations. Accordingly, our guidance is only an estimate of what management believes is realizable as of the date of release. Actual results will vary from the guidance and the variations may be material. Investors should also recognize that the reliability of any forecasted financial data will diminish the farther in the future that the data are forecast. In light of the foregoing, investors are urged to put the guidance in context and not to place undue reliance on gain realizedit.
Any failure to successfully implement our operating strategy or the occurrence of any of the events or circumstances set forth in this Form 10-K could result in the actual operating results being different than our guidance, and such differences may be adverse and material. The failure to achieve such guidance could disappoint investors and analysts and cause the market price of our common stock to decline.
We cannot assure you that we will continue to pay dividends on our common stock at the salecurrent rate or dispositionat all.
Since May 2021, we have paid a quarterly cash dividend on our common stock. The declaration and payment of future dividends are at the discretion of our Board of Directors andwill depend on many factors, including our results of operations and financial condition, our capital requirements, and contractual limitations. The agreements governing our indebtedness, including our revolving line of credit and the indentures that govern our senior notes, limit our ability to pay dividends and restrict the amount of dividends we may pay. If we do not continue to pay dividends on our common stock at the current rate or at all, the market price of our common stock could be adversely affected.
Certain anti-takeover defenses and applicable law may limit the ability of a third party to acquire control of the Company.
Our charter and bylaws and Delaware law contain provisions that may delay or prevent a transaction or a change in control of the Company that might involve a premium paid for shares of our common stock.
Becausestock or otherwise be in the best interests of our holdingsstockholders, which could adversely affect the market price of our common stock.
Our charter and/or bylaws contain anti-takeover provisions that:
authorize our board of directors, without further action by the stockholders, to issue up to 50 million shares of preferred stock in United States real property interests, we believe one or more series, and with respect to each series, to fix the number of shares constituting that series, the powers, rights and preferences of the shares of that series, and the qualifications, limitations and restrictions of that series;
require that actions to be taken by our stockholders may be taken only at an annual or special meeting of our stockholders and not by written consent;
specify that special meetings of our stockholders can be called only by our board of directors, the chairman of our board of directors, our chief executive officer, or our president;
provide that our bylaws may be amended by our board of directors without stockholder approval;
provide that directors may be removed from office only by the affirmative vote of the holders of 66 2/3% of the voting power of our capital stock entitled to vote generally in the election of directors;
provide that vacancies on our board of directors or newly created directorships resulting from an increase in the number of our directors may be filled only by a vote of a majority of directors then in office, even though less than a quorum;
provide that, subject to the express rights, if any, of the holders of any series of preferred stock, any amendment, modification or repeal of, or the adoption of any new or additional provision, inconsistent with our charter provisions relating to the removal of directors, exculpation of directors, indemnification, the prohibition against stockholder action by written consent, and the vote of our stockholders required to amend our bylaws requires the affirmative vote of the holders of at least 66 2/3% of the voting power of our capital stock entitled to vote generally in the election of directors;
provide that the stockholders may amend, modify or repeal our bylaws, or adopt new or additional provisions of our bylaws, only with the affirmative vote of 66 2/3% of the voting power of our capital stock entitled to vote generally; and
establish advance notice procedures for stockholders to submit nominations of candidates for election to our board of directors and other proposals to be brought before a stockholders meeting.
Additionally, we are a Delaware corporation, and will remain a “United States real property holding corporation” (which we referhave elected to as “USRPHC”) for United States federal income tax purposes. As a USRPHC, our stock may be treated as a United States real property interest (which we refer to as “USRPI”), gains from the sale of which by non-U.S. holders would be subject to U.S. income tax and reporting obligations pursuant toSection 203 of the Foreign Investment in Real Property Tax Act (which we refer to as “FIRPTA”). Our common stock will not be treated as a USRPI if it is regularly traded onDGCL by provision of our charter. In general, Section 203 of the DGCL prevents an established securities market, except“interested stockholder” (as defined in the caseDGCL) from engaging in a “business combination” (as defined in the DGCL) with us for three years following the date that person becomes an interested stockholder unless one or more of the following occurs:
Before that person became an interested stockholder, our board of directors approved the transaction in which the interested stockholder became an interested stockholder or approved the business combination;
Upon consummation of the transaction that resulted in the interested stockholder becoming an interested stockholder, the interested stockholder owned at least 85% of our voting stock outstanding at the time the transaction commenced, excluding for purposes of determining the voting stock outstanding (but not the outstanding voting stock owned by the interested stockholder) stock held by directors who are also officers of the Company and by employee stock plans that do not provide employees with the right to determine confidentially whether shares held under the plan will be tendered in a non-U.S. holdertender or exchange offer; or
Following the transaction in which that actuallyperson became an interested stockholder, the business combination is approved by our board of directors and authorized at a meeting of stockholders by the affirmative vote of the holders of at least 66 2/3% of our outstanding voting stock not owned by the interested stockholder.
The DGCL generally defines “interested stockholder” as any person who, together with affiliates and associates, is the owner of 15% or constructively holds more than five percent of such classour outstanding voting stock or is our affiliate or associate and was the owner of 15% or more of our outstanding voting stock at any time duringwithin the shorter of the five-yearthree year period precedingimmediately before the date of disposition ordetermination.
General Risk Factors
Negative publicity may affect our business performance and could affect the holder’s holding period for such stock. We anticipate thatvalue of our common stock will continue to be regularly traded on the New York Stock Exchange. However, no assurance can be given in this regardstock.
Unfavorable media or investor and no assurance can be given that our common stock will remain regularly traded in the future. If our stock is treated as a USRPI, a non-U.S. holder would be subject to regular United States federal income tax with respect to any gain on such stock in the same manner as a taxable U.S. holder (subject to any applicable alternative minimum tax and a special alternative minimum tax in the case of nonresident alien individuals). In addition, the purchaser of the stock would be required to withhold and remitanalyst reports related to the IRS 10% ofCompany, our industry, or Company brands, marketing, personnel, operations, business performance or prospects may adversely affect the purchase price unless an exception applies. A non-U.S. holder also would be required to file a U.S. federal income tax return for any taxable year in which it realizes a gain from the dispositionvalue of our common stock and the performance of our business, regardless of its accuracy or inaccuracy. Furthermore, the speed at which negative publicity is disseminated has increased dramatically through the use of electronic communication, including social media outlets, websites and other digital platforms. Our success in maintaining, extending and expanding our brand image depends on our ability to adapt to a rapidly changing media environment. Adverse publicity or negative commentary from any media outlets could hurt our reputation and reduce demand for our homes, as consumers might avoid brands that is subjectreceive bad press or negative reviews. Negative publicity may result in a decrease in our operating results that could lead to U.S. federal income tax.
Non-U.S. holders should consult their tax advisors concerninga decline in the consequences of disposing of sharesvalue of our common stock.
Increased scrutiny from the public, investors, and others regarding our ESG practices could impact our reputation, and compliance with ESG-related policies may impose additional capital and operational expenditures on our business.
Recently, more attention is being directed towards environmental, social, and governance (“ESG”) practices of publicly traded companies, like us. In 2020 and 2021, we enhanced our focus on sustainability by establishing policies addressing ESG, human rights, training and professional development, labor rights, workplace health and safety, diversity and inclusion and vendor conduct. Additionally, in 2021, we published our inaugural ESG sustainability report. Our ESG sustainability report includes information related to a variety of topics, including our environmental and social initiatives, occupational health and safety, and our carbon footprint.
The publication of ESG-related policies and an ESG sustainability report may result in increased investor, media, employee and other stakeholder attention to such initiatives. It is possible that stakeholders may not be satisfied with our ESG practices or initiatives or the speed with which we are implementing our initiatives. Government, media or activist pressure to decrease our carbon footprint, for example, could negatively impact perceptions of our homebuilding practices, which could have a material adverse effect on our business and ability to compete with homebuilders that may be viewed as more sustainable. Additionally, organizations that provide information to investors on corporate governance and other matters have developed rating systems for evaluating companies on their approach to ESG. Unfavorable ratings may lead to negative investor sentiment, which could have a negative impact on our stock price. Any failure, or perceived failure, to respond to expectations related to ESG concerns could cause harm to our business and reputation and could negatively impact employee retention and the willingness of homebuyers to do business with us.
In addition to the ESG practices described above, we are subject to laws and government regulations that relate to the environment and occupational health and safety, among other matters. These laws and regulations, as well as related initiatives, are under active development, subject to change, and may prove difficult and expensive for us to comply with. We may be required to make additional capital and operational expenditures, which may have a material adverse effect on earnings, liquidity, financial condition or competitive position.
Information technology failures or data security breaches could expose us to liability and materially adversely affect our results of operations and financial condition.
We rely on accounting, financial and operational management information systems to conduct our operations and maintain critical business records. Many of these resources are provided to us and/or maintained on our behalf by third-party service providers pursuant to agreements that specify to varying degrees certain security and service level standards. Our information technology systems are dependent upon these providers, as well as global communications providers, telephone systems and other aspects of the Internet infrastructure, which have experienced significant systems failures and electrical outages in the past, and are susceptible to damage or interruption from fire, floods, power outages, or telecommunications failures, or cybersecurity threats such as computer viruses, break-ins, security breaches, and similar events. The occurrence of any of these events to us directly or any of our third-party service providers could adversely affect our ability to operate our business, damage our reputation, result in the loss of customers, suppliers, or revenues, or result in the misappropriation or public disclosure of our confidential information. As a result, we may be required to incur significant costs to remediate the damage caused by these disruptions or to prevent security breaches in the future. While, to date, we have not had a significant cybersecurity breach or attack that had a material impact on our business or operating results, there can be no assurance that our efforts to maintain the security and integrity of these types of information technology networks and related systems will be effective or that attempted security breaches or disruptions would not be successful or damaging.
In the ordinary course of our business, we collect and store certain confidential information, including personal information of homebuyers/borrowers and information about our employees, contractors, vendors and suppliers. This information is entitled to protection under a number of regulatory regimes. We may share some of this information with vendors who assist us with certain
aspects of our business, particularly with respect to our mortgage lending business. If these vendors or we fail to maintain the security of the data which we are required to protect, including via the penetration of network security and the misappropriation of confidential and personal information, we could face business disruption, damage to our reputation, financial obligations to third parties, fines, penalties, regulatory proceedings and private litigation with potentially large costs, any of which could have a material adverse impact on our financial condition and results of operations. We maintain cyber liability insurance; however, this insurance may not be sufficient to cover the financial, legal, business or reputational losses that may result from an interruption or breach of our systems.
We may change our operational policies, investment guidelines and business and growth strategies without stockholder consent, which may subject us to different and more significant risks in the future.
Our board of directors determines our operational policies, investment guidelines and business and growth strategies. Our board of directors may make changes to, or approve transactions that deviate from, those policies, guidelines and strategies without a vote of, or notice to, our stockholders. Under any of these circumstances, we may expose ourselves to different and more significant risks in the future, which could have a material adverse effect on our business, prospects, liquidity, financial condition and results of operations.
If we fail to maintain an effective system of internal controls, we may not be able to accurately determine our financial results or prevent fraud. As a result, our stockholders could lose confidence in our financial results, which could materially and adversely affect us.
Effective internal controls are necessary for us to provide reliable financial reports and effectively prevent fraud. There is no assurance that material weaknesses or significant deficiencies will not be identified in the future or that we will be successful in adequately remediating any such material weaknesses and significant deficiencies. We may in the future discover areas of our internal controls that need improvement. We cannot be certain that we will be successful in maintaining adequate internal control over our financial reporting and financial processes. Furthermore, as we grow our business, including through acquisitions, our internal controls will become more complex, and we will require significantly more resources to ensure our internal controls remain effective. The existence of any material weakness or significant deficiency would require management to devote significant time and incur significant expense to remediate any such material weaknesses or significant deficiencies, and management may not be able to remediate any such material weaknesses or significant deficiencies in a timely manner. The existence of any material weakness in our internal control over financial reporting could also result in errors in our financial statements that could require us to restate our financial statements, cause us to fail to meet our reporting obligations, subject us to investigations from regulatory authorities or cause stockholders to lose confidence in our reported financial information, all of which could materially and adversely affect us.
ITEM 1B.UNRESOLVED STAFF COMMENTS.
None.
None.
ITEM 2.PROPERTIES.
ITEM 2.PROPERTIES.
We lease our corporate headquarters located at 8390 East Crescent Parkway, Suite 650, Greenwood Village, Colorado. We also lease offices in theother markets where we conduct business, butalthough none of these properties are material to the operation of our business. All facilities are in good condition, adequately utilized, and sufficient to meet our present operating needs.
Because of the nature of our homebuilding operations, significant amounts of property are held as inventory in the ordinary course of our homebuilding business. We discuss these properties in the discussion of our homebuilding operations elsewhere in this Form 10-K.
ITEM 3.LEGAL PROCEEDINGS.
Because of the nature of the homebuilding business, we and certain of our subsidiaries and affiliates have been named as defendants in various claims, complaints and other legal actions arising in the ordinary course of business. In the opinion of our management, the outcome of these ordinary course matters will not have a material adverse effect upon our financial condition, results of operations or cash flows.
ITEM 4.MINE SAFETY DISCLOSURES.
Not applicable.
PART II
ITEM 5.MARKET FOR REGISTRANT’S COMMON EQUITY, RELATED STOCKHOLDER MATTERS AND ISSUER PURCHASES OF EQUITY SECURITIES.
Market Information
The shares of our common stock are listed on the New York Stock Exchange under the symbol, “CCS.” The following table sets forth high and low closing price ranges of our common stock for the periods indicated in the years ended December 31, 2017 and 2016, as reported by the New York Stock Exchange.
| | | | | | |
Quarter Ended in 2017 | | High | | Low |
March 31, | | $ | 25.40 | | $ | 20.75 |
June 30, | | $ | 27.90 | | $ | 24.35 |
September 30, | | $ | 26.10 | | $ | 21.95 |
December 31, | | $ | 31.35 | | $ | 25.20 |
| | | | | | |
Quarter Ended in 2016 | | High | | Low |
March 31, | | $ | 17.07 | | $ | 13.47 |
June 30, | | $ | 18.85 | | $ | 16.20 |
September 30, | | $ | 21.51 | | $ | 17.15 |
December 31, | | $ | 21.60 | | $ | 19.20 |
Holders
As of February 27, 2018,January 25, 2022, there were approximately 7038 stockholders of record of our common stock. On February 27, 2018,
Dividends
In May 2021, our Board of Directors announced the last reported sale priceapproval of the initiation of a quarterly cash dividend, and during the year ended December 31, 2021, we paid a quarterly cash dividend of $0.15 per share beginning with the second quarter of 2021, and aggregate cash dividends of $0.45 per share to holders of record of our common stockstock. The declaration and payment of future dividends are at the discretion of our Board of Directors andwill depend on many factors, including our results of operations and financial condition, our capital requirements, and contractual limitations. The agreements governing our indebtedness, including our revolving line of credit and the New York Stock Exchange was $31.15 per share.
Dividends
indentures that govern our senior notes, limit our ability to pay dividends and restrict the amount of dividends we may pay. During the yearsyear ended December 31, 2017 and 2016,2020, we did not declare or pay any dividends.
Issuer Purchases of Equity Securities
On November 6, 2018, the Company's Board of Directors authorized a stock repurchase program, under which we may repurchase up to 4,500,000 shares of our outstanding common stock. Under the terms of the program, the shares may be repurchased from time to time in open market transactions at prevailing market prices, in privately negotiated transactions or by other means in accordance with federal securities laws. This program has no expiration date but may be terminated by the Board of Directors at any time. The Company repurchased 687,061 shares throughout the duration of this program and 3,812,939 shares remained available to repurchase under this program as of December 31, 2021. No shares were repurchased by the Company during the year ended December 31, 2021.
Stock Performance Graph
The following stock performance graph below compares the cumulative total shareholder return (assuming reinvestment of dividends) on $100 invested in each of our common stock, the S&P 500, Index, the Dow Jones US Home Construction Index, anda peer group of four homebuilding companies similar to Century that was presented in the stock performance graph last year, and a broader industry peer group for the periodsfive-year period from June 18, 2014, the date our common stock commenced trading on the New York Stock Exchange,December 31, 2016 to December 31, 2016.2021.
It is assumed inCentury believes the graph that $100 was invested in (1) our common stock; (2) the stocks of the companies in the Standard & Poor’s 500 Stock Index; (3) the stocks of the Dow Jones U.S. Home Construction Index; and (4) the stocks of thebroader industry peer group companies, just prioris more representative of a group similar to the commencement of the period and that all dividends received within a quarter were reinvested in that quarter.Century. The former peer group index is composed of four homebuilding companies includes: Beazer Homes USA, Inc. M.D.C. Holdings, M/I Homes, Inc. and Tri Pointe Homes, Inc. The broader industry peer group includes the following companies: AV Homes Inc., Beazer Homes USA, Inc., Hovanian Enterprises, Inc., KB Home, LGI Homes, Inc., M.D.C. Holdings, Inc., M/I Homes, Inc., M.D.C. Holdings,Meritage Home Corporation, Taylor Morrison Home Corporation, and Tri Pointe Homes, Inc., Tripointe Homes and William Lyon Homes.
The stock price performance shown on the following graph is not indicative of future price performance.
Comparison of Cumulative Total Return from June 18, 2014 (the Date our Common Stock Commenced Trading on the New York Stock Exchange)December 31, 2016 to December 31, 20172021
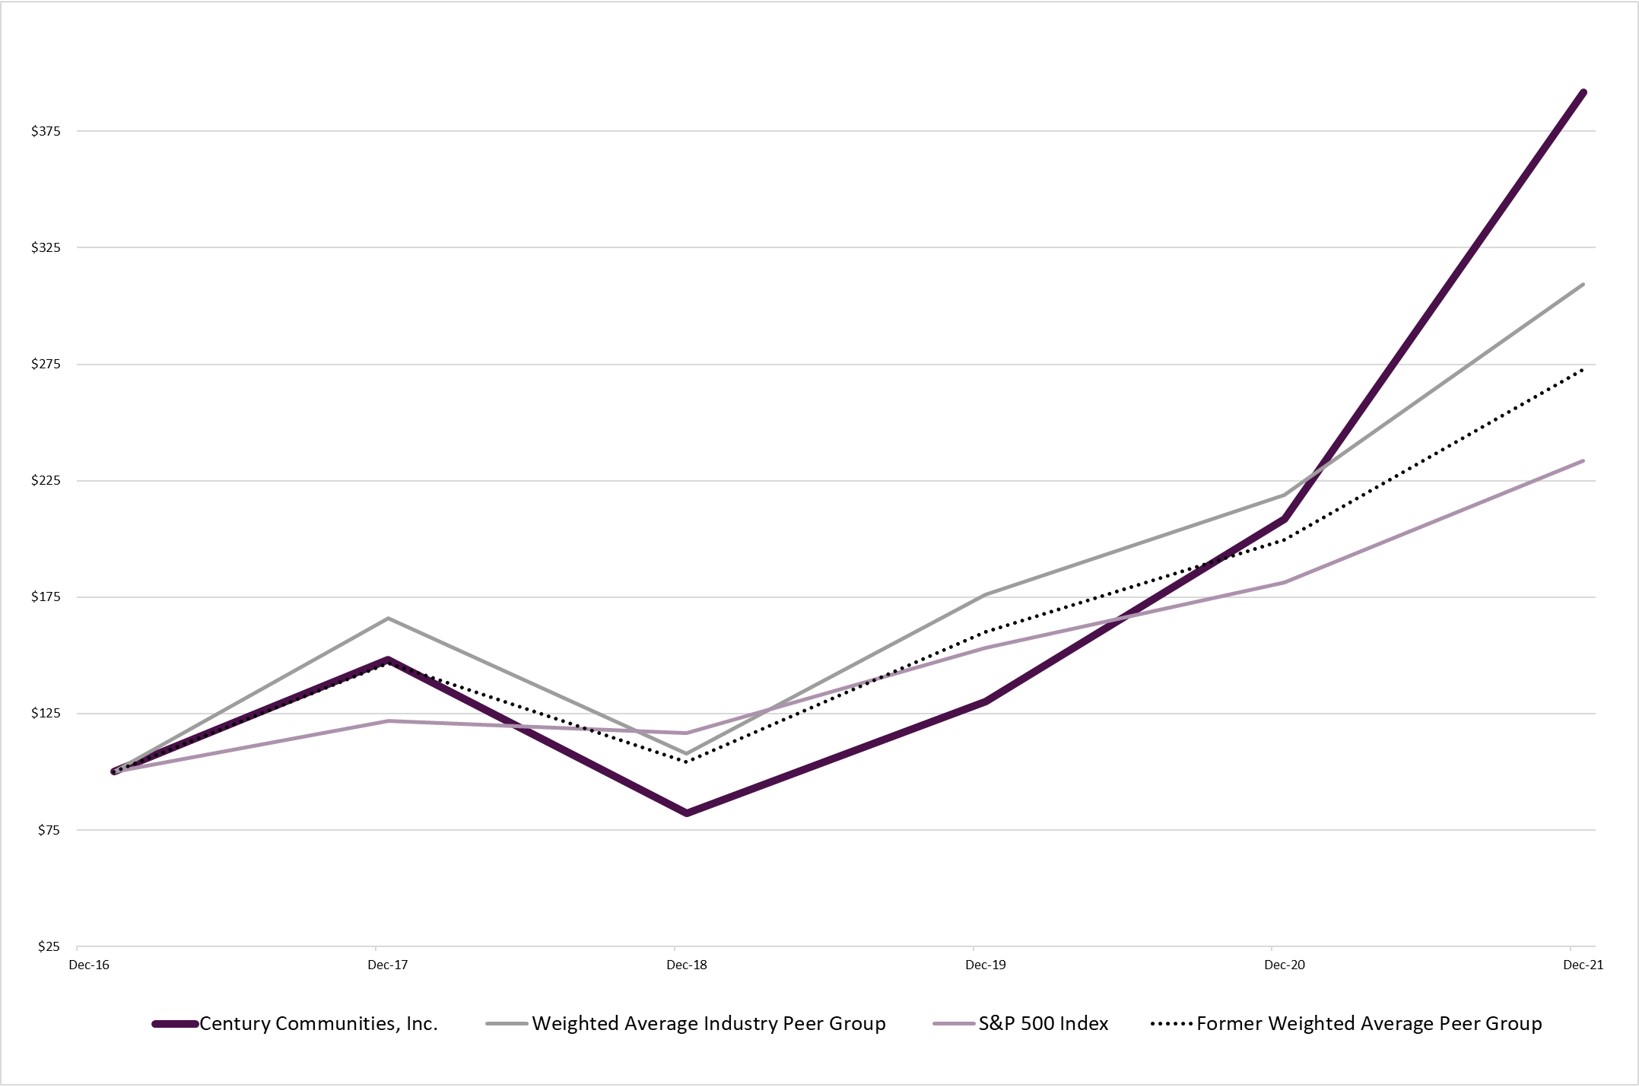

Issuer Purchases of Equity Securities
The following table summarizes the number of shares of our common stock that were repurchased from certain employees of the Company during the quarter ended December 31, 2017. Such shares were not repurchased pursuant to our stock repurchase program,
but were repurchased to satisfy statutory minimum federal and state tax obligations associated with the vesting of restricted shares of common stock issued under our 2017 Omnibus Incentive Plan (which we refer to as our “2017 Incentive Plan”).
| | | | | | | | | | |
| | Total number of shares purchased | | Average price paid per share | | Total number of shares purchased as part of publicly announced plans or programs | | Maximum number of shares that may yet be purchased under the plans or programs |
October | | | | | | | | | | |
Purchased 10/1 through 10/31 | | 14,459 | | $ | 25.25 | | N/A | | | N/A |
November | | | | | | | | | | |
Purchased 11/1 through 11/30 | | — | | | — | | N/A | | | N/A |
December | | | | | | | | | | |
Purchased 12/1 through 12/31 | | — | | | — | | N/A | | | N/A |
Total | | 14,459 | | $ | 25.25 | | | | | |
ITEM 6.[Reserved]
ss
ITEM 6.SELECTED FINANCIAL DATA.
The data in this table should be read in conjunction with “Item 7. Management’s Discussion and Analysis of Financial Condition and Results of Operations” and our consolidated financial statements and related notes thereto, which are included in “Item 8. Consolidated Financial Statements.”
��
| | | | | | | | | | | | | | | |
| | |
(in thousands, except per share amounts) | | Year Ended December 31, |
| | 2017 | | 2016 | | 2015 | | 2014 | | 2013 |
Consolidated Statements of Operations: | | | | | | | | | | | | | | | |
Total revenues | | $ | 1,423,799 | | $ | 994,440 | | $ | 734,489 | | $ | 362,392 | | $ | 171,133 |
Income before income tax expense | | $ | 84,164 | | $ | 73,149 | | $ | 60,305 | | $ | 30,959 | | $ | 18,073 |
Net income | | $ | 50,295 | | $ | 49,540 | | $ | 39,890 | | $ | 20,022 | | $ | 12,431 |
Basic earnings per share | | $ | 2.06 | | | 2.34 | | | 1.88 | | | 1.03 | | | 0.95 |
Diluted earnings per share | | $ | 2.03 | | | 2.33 | | | 1.88 | | | 1.03 | | | 0.95 |
Balance Sheet Data (end of period): | | | | | | | | | | | | | | | |
Cash and cash equivalents | | $ | 88,832 | | $ | 29,450 | | $ | 29,287 | | $ | 33,462 | | $ | 109,998 |
Inventories | | $ | 1,390,354 | | $ | 857,885 | | $ | 810,137 | | $ | 556,323 | | $ | 184,072 |
Total assets | | $ | 1,735,022 | | $ | 1,007,528 | | $ | 917,741 | | $ | 670,616 | | $ | 312,639 |
Total debt | | $ | 824,602 | | $ | 454,008 | | $ | 390,243 | | $ | 224,247 | | $ | 1,500 |
Total liabilities | | $ | 999,789 | | $ | 533,892 | | $ | 508,262 | | $ | 305,411 | | $ | 41,083 |
Equity | | $ | 735,233 | | $ | 473,636 | | $ | 409,479 | | $ | 365,205 | | $ | 271,556 |
Other Operating Information (dollars in thousands): | | | | | | | | | | | | | | | |
Number of homes delivered | | | 3,640 | | | 2,825 | | | 2,401 | | | 1,046 | | | 448 |
Average sales price of homes delivered | | $ | 386.1 | | $ | 346.5 | | $ | 302.1 | | $ | 336.4 | | $ | 382.0 |
Backlog at end of period, number of homes | | | 1,320 | | | 749 | | | 714 | | | 772 | | | 222 |
Backlog at end of period, aggregate sales value | | $ | 572,888 | | $ | 302,823 | | $ | 271,138 | | $ | 246,327 | | $ | 103,250 |
Average sales price of homes in backlog | | $ | 434.0 | | $ | 404.3 | | $ | 379.7 | | $ | 319.1 | | $ | 465.1 |
Net new home contracts | | | 3,814 | | | 2,860 | | | 2,356 | | | 1,042 | | | 406 |
Selling communities at period end | | | 119 | | | 89 | | | 88 | | | 75 | | | 23 |
ITEM 7. MANAGEMENT’S DISCUSSION AND ANALYSIS OF FINANCIAL CONDITION AND RESULTS OF OPERATIONS.
OverviewThe following discussion and analysis of our financial condition and results of operations is intended to help the reader understand our Company, business, operations and present business environment and is provided as a supplement to, and should be read in conjunction with, our consolidated financial statements and the related notes to those statements included elsewhere in this Form 10-K. In addition to historical financial information, the following discussion and analysis contains forward-looking statements that involve risks, uncertainties and assumptions. Our actual results may differ materially from those anticipated in these forward-looking statements as a result of many factors, including those discussed under “Risk Factors” and elsewhere in this Annual Report on Form 10-K. We use certain non-GAAP financial measures that we believe are important for purposes of comparison to prior periods. This information is also used by our management to measure the profitability of our ongoing operations and analyze our business performance and trends. Some of the numbers included herein have been rounded for the convenience of presentation.
In July 2019, the Financial Accounting Standards Board (which we refer to as “FASB”) issued Accounting Standards Update 2019-07, “Codification Updates to SEC Sections-Amendments to SEC Paragraphs Pursuant to SEC Final Rule Releases No. 33-10532, Disclosure Update and Simplification", which changes were meant to simplify certain disclosures in financial condition and results of operations, particularly by eliminating year-to-year comparisons between prior periods previously disclosed. This section of this Form 10-K generally discusses 2021 and 2020 items and year-to-year comparisons between 2021 and 2020. Discussions of 2019 items and year-to-year comparisons between 2020 and 2019 that are not included in this Form 10-K can be found in “Management’s Discussion and Analysis of Financial Condition and Results of Operations” in Part II, Item 7 of the Company’s Annual Report on Form 10-K for the fiscal year ended December 31, 2020.
Business Overview
We are engaged in the development, design, construction, marketing and sale of single-family attached and detached homes in metropolitan areas in the States of California, Colorado, Georgia, Nevada, North Carolina, South Carolina, Tennessee, Texas, Utah, and Washington.17 states. In many of our projects, in addition to building homes, we are responsible for the entitlement and development of the underlying land. We build and sell homes under our Century Communities and Century Complete brands. Our Century Communities brand offers a wide range of buyer profiles including: entry-level, first and second time move-up, and lifestyle homebuyers, and provides our homebuyers with the ability to personalize their homes through certain option and upgrade selections. Our Century Complete brand targets entry-level homebuyers, primarily sells homes through retail studios and the internet, and generally provides no option or upgrade opportunities. Our homebuilding operations are organized into the following fourfive reportable segments based on the geographic regions in which we operate:segments: West, Mountain, Texas, Southeast, and Southeast.Century Complete. Additionally, our indirect wholly-owned subsidiaries, Inspire Home Loans Inc., Parkway Title, LLC, and Parkway Title,IHL Home Insurance Agency, LLC, which provide mortgage, servicestitle, and titleinsurance services, respectively, primarily to our home buyers have been identified as our Financial Services operating segment.
We build and sell an extensiveWhile we offer homes that appeal to a broad range of entry-level, move-up, and lifestyle homebuyers, our offerings are heavily weighted towards providing affordable housing options in each of our homebuyer segments. Additionally, we prefer building move-in-ready homes over built-to-order homes, which we believe allows for a faster construction process, advantageous pricing with subcontractors, and shortened time period from home typessale to home delivery, thus allowing us to more appropriately price the homes and deploy our capital. Of the 10,805 homes delivered during 2021, approximately 75% of our deliveries were made to entry-level and approximately 87% of homes delivered were built as move-in ready homes.
Impact of COVID-19 Pandemic
The outbreak of COVID-19, which was declared a pandemic by the World Health Organization on March 11, 2020, created significant volatility, disruption, and uncertainty across a varietythe nation and abroad. After an initial slowing of price points. Our emphasis is on acquiring well-located land positionshome sales trends in early spring 2020, due in part to consumer uncertainty, home sales sharply rebounded, aided by historically low interest rates, lack of supply, and offering qualityrenewed desire from customers to move out of urban areas and/or apartments and into new homes with innovative design elements.
Results of Operations – Years Ended December 31, 2017in suburban areas, which desire was likely accelerated by the COVID-19 pandemic. These positive trends and 2016
Duringmarket dynamics continued through the year ended December 31, 2017, we experienced moderate improvement in the homebuilding2021.
While these positive trends and market throughout our operating segments. The current homebuilding market enjoys a stable macro-economic environment, which includes stable employment growth as well as growth in median household incomes. These factors along with low levels of existing housing inventory resulted in an environment in which we were able to achieve increases in net new home contracts, home deliveries, and average sales price fordynamics continued through the year ended December 31, 20172021, we recognize that long term macro-economic effects of 33.4%, 28.8%,the pandemic that could ultimately impact the homebuilding industry and 11.4%, respectively,our home sales have yet to be known. There is still uncertainty regarding the extent and duration of the COVID-19 pandemic and future increases in COVID-19
positive cases and hospitalizations could result in changing plans of numerous state and local municipalities, which may include government restrictions, quarantines, travel advisories and social distancing measures. Despite overall strong demand and sales of our homes during 2021, continued future demand is uncertain as comparedeconomic conditions are uncertain, in particular with respect to unemployment levels, inflation, interest rates, and the extent to which and how long COVID-19 and related government directives, actions, and economic relief efforts will impact the U.S. economy, unemployment levels, financial markets, credit and mortgage markets, consumer confidence, interest rates, availability of mortgage loans to homebuyers, wage growth, household formations, levels of new and existing homes for sale, cost of land, labor and construction materials, demographic trends, and housing demand, and other factors, including those described elsewhere in this Form 10-K. A decrease in demand for our homes would adversely affect our operating results in future periods, as well as have a direct effect on the origination volume of and revenues from our Financial Services segment. In addition, because the full magnitude and duration of the COVID-19 pandemic is uncertain and difficult to predict, changes in our cash flow projections may change our conclusions on the recoverability of inventories in the future.
Driven by the continued strong demand for our homes through the year ended December 31, 2016. The
increasescredit, $316.3 million of cash and cash equivalents, $52.3 million of cash held in escrow, and a net new home contracts, home deliverieshomebuilding debt to net capital ratio of 26.3%. Additionally, we increased our land acquisition and average sales price, along withdevelopment activities during 2021 to bolster our continued focus on cost controllot pipeline and investing in our infrastructure prudently as we expand,support future community growth, which resulted in total revenue79,859 lots owned and income before tax of $1.4 billion and $84.2 million, respectively for the year endedcontrolled at December 31, 2017, which represented2021, a 43.2% and 15.1%60.0% increase respectively, over the year endedas compared to December 31, 2016.
In August 2017, we acquired UCP, Inc. (which we refer to as “UCP”), which was a homebuilder2020. Although the trajectory and land developer with expertise in residential land acquisition, development and entitlement, as well as home design, construction and sales. Our acquisitionstrength of UCP included approximately 4,199 owned lots within 43 total communities located in the States of California, Washington, North Carolina, South Carolina and Tennessee. The 4,199 lots included 346 homes in backlog and 59 model homes. The results of UCP are included in our financial statements from August 4, 2017 through December 31, 2017 and consisted of $201.4 million in revenue related to 403 home deliveries.
Additionally in October 2017, we acquired substantially all the assets and operations and assumed certain liabilities of Sundquist Homes and affiliates, a homebuilder with operations in the greater Seattle, Washington area, for approximately $50 million. The acquired assets consisted of approximately 147 owned lots. The 147 lots included 45 homes in backlog. The results of Sundquist Homes are included in our financial statements from October 31, 2017 through December 31, 2017 and consisted of $18.7 million in revenue related to 24 deliveries.
We believe our operations are well positioned for future growth as a result of the strong markets in which we operate, our product offerings which span the home buying segment as well as current and future inventories of attractive land positions. As we have grown, we have continued to focusremain strong and allowed us to pass on maintaining prudent leverageincreased costs through increases in our selling prices and increase our margins during 2021, we continued to experience shortages of labor, land and raw materials, delays and material and labor supply cost pressures, and elongated construction cycle times to build homes in many of our markets, caused in part by increased demand, global supply chain disruptions and inflation, during 2021 that could negatively impact our margins in future periods. While the impact of the COVID-19 pandemic will continue to evolve and at any given time recovery could be slowed or reversed by a number of factors, including the emergence of new variants of COVID-19, such as a result,Delta and Omicron, we believe we are well positioned from a cash and liquidity standpoint not only to execute on our growth strategyoperate in orderan uncertain environment, but also to optimize our stockholder returns. continue to grow with the market and pursue other ways to properly deploy capital to enhance returns, which may include taking advantage of debt refinancing and/or strategic opportunities as they arise.
We anticipate the homebuilding markets in each of our operating segments towill continue to be tied to both the local economy and to a lesser degree, the macro-economic environment. Accordingly, our net sales, home deliveries, and average sales price in future years could be negatively affected by economic conditions, such as decreases in employment and median household incomes, as well as decreases in household formations and increasing supply of inventories. Additionally, our results could be impacted by a decrease in home affordability as a result of price appreciation or significant increases in mortgage interest rates or tightening of mortgage lending standards.
Results of Operations – Years Ended December 31, 2021 and 2020
StrategyDuring the year ended December 31, 2021, we generated record revenues of $4.2 billion, with home sales revenues of $4.0 billion, an increase of 33.2% over 2020, and financial services revenue of $123.7 million, an increase of 19.8% over 2020. The increase in home sales revenue was fueled by a 14.3% increase in the number of homes delivered to 10,805 and a 16.6% increase in the average sales price per home to $373,300. This increase in home sales revenue combined with a 580 basis point increase in homebuilding gross margin percent and a 160 basis point decrease in the percentage of selling, general and administrative expense as a percent of home sales revenues, resulted in a record $641.1 million in income before income tax expense for the year ended December 31, 2021.
Our financial results for the year ended December 31, 2021 were driven by continued favorable market dynamics across our markets. These conditions included an increase in demand for new housing, particularly entry-level housing, impacted by the COVID-19 pandemic, which accelerated the trend of migration out of high-density urban areas and into suburban areas, historically low interest rates on mortgage products, including rates on 30-year fixed mortgages, a low supply of available inventories and positive demographic trends. These conditions, coupled with our strategy to focus on entry-level housing (approximately 75% of our home deliveries in 2021 qualified for FHA mortgages) resulted in a positive sales environment, which we leveraged in 2021 to increase net new home contracts to 12,017, an 11.0% increase over prior period.
As of December 31, 2021, we had a backlog of 4,651 homes, a 35.2% increase as compared to December 31, 2020, representing approximately $1.9 billion in sales value, a 44.5% increase as compared to December 31, 2020.
The increase in demand has also resulted in increased prices for and shortages of labor, land and raw materials, as well as elongated construction cycle times to build homes in many of our markets. During 2021, we successfully offset most of the cost increases through increases in our selling prices.
Our results of operations resulted in net income of $498.5 million, or $14.47 per diluted share, compared to $206.2 million, or $6.13 per diluted share in the prior year, and driving our return on equity to 33% for 2021. In May 2021, our Board of Directors initiated a quarterly cash dividend, which paid our stockholders of record $0.15 per share during the last nine months of 2021.
Our net homebuilding debt to net capital was 26.3% as of December 31, 2021, down from 27.2% as of December 31, 2020. We believe our current net homebuilding debt to net capital position allows us the flexibility to increase our debt levels if necessary to continue to grow our operations and our approximately 80,000 lots owned and controlled in future periods.
While in early 2022 rates on 30-year fixed mortgages have risen modestly and the Federal reserve has indicated that it may raise interest rates in March 2022, we believe housing demographics and buyer demand will remain strong at least in the short term and we believe we are well-positioned to benefit from the ongoing shortage of both new and resale homes available for purchase. Subject to deteriorating market conditions, we believe our operations are well positioned for future growth as a result of the markets in which we operate, our product offerings which span the home buying segment, but focus on affordable price points, as well as current and future inventories of attractive land positions. As we have grown, we have continued to focus on maintaining prudent leverage, and, as a result, we believe we are well positioned to execute on our growth strategy in order to optimize stockholder returns.
In August 2021, we completed a private offering of $500.0 million aggregate principal amount of our 3.875% senior notes due 2029 (which we refer to as the “2029 Notes”), which were issued at 100% of their principal amount, and we received net proceeds of $493.8 million. The indenture covering these notes contains certain restrictive covenants on issuing future secured debt and other transactions. The aggregate principal balance of the 3.875% senior notes due 2029 is due August 2029, with interest only payments due semi-annually in February and August of each year, beginning on February 15, 2022. In addition, in August 2021, we redeemed $400.0 million in outstanding principal of our 5.875% senior notes due 2025 at a redemption price equal to 102.938% of the principal amount, plus accrued and unpaid interest, totaling $414.8 million. The redemption was conditioned upon our prior consummation of the offering and issuance of the 2029 Notes. The redemption transaction resulted in a loss of $14.5 million, which is presented in loss on debt extinguishment in the consolidated statement of operations.
Strategy
Our strategy is focused on increasing the returns on our inventory while generating strong profitability. In general, we are focused on the following initiatives:
| ·
| | Maintaining a strong balance sheet and prudent use of leverage as we grow;
|
| ·
| | Offering products that appeal to a broad range of entry-level, move-up, lifestyle and luxury homebuyers based on each local market in which we operate;
|
| ·
| | Maintaining a strong pipeline of future land holdings, including utilizing lot option contracts to manage our risk to land holdings;
|
| ·
| | Expanding into new markets that meet our underwriting criteria either through organic start-up operations or through acquisitions of existing homebuilders; and
|
| ·
| | Controlling costs, including costs of home sales revenue and selling and general administrative expenses, to achieve increased profitability.
|
Maintaining a strong balance sheet and prudent use of leverage;
While we offer homes that appeal to a broad range of entry-level, move-up, and lifestyle homebuyers, our offerings are heavily weighted towards providing affordable housing options in each of our homebuyer segments;
Preferring building move-in-ready homes over built-to-order homes, which we believe allows for a faster construction process, advantageous pricing with subcontractors, and shortened time period from home sale to home delivery, thus allowing us to more appropriately price the home;
Maintaining a strong pipeline of future land holdings, including favoring lot option contracts to manage our risk to land holdings;
Increasing our market share within our existing markets through organic growth and/or acquisitions of other homebuilders already operating in the market;
Expanding into new markets that meet our underwriting criteria either through organic start-up operations or through acquisitions of existing homebuilders;
Evaluation of opportunistic strategies for construction of single-family and multi-family rental units; and
Controlling costs, including costs of home sales revenue and selling, general and administrative expenses, and generating further efficiencies, including through the increased reliance on digital marketing and direct outreach to potential customers through our website and digital tools, such as the introduction of the ability to buy a home via our website, to achieve increased profitability.
Our operating strategy has resulted in significant growth in revenue and income before income taxes over the last five years, and we believe it will continue to produce positive results. OurWe expect our operating strategy will continue to evolveadapt to market changes, and we cannot provide any assurancesassurance that our strategies will continue to be successful.
The following table summarizes our results of operationoperations for the years ended December 31, 20172021 and 2016. 2020.
|
|
|
|
|
|
|
|
|
|
|
|
|
|
|
|
|
|
(in thousands, except per share amounts) |
| Year Ended December 31, |
|
|
| Increase (Decrease) |
|
| 2021 |
| 2020 |
|
|
| Amount |
|
| % |
Consolidated Statements of Operations: |
|
|
|
|
|
|
|
|
|
|
|
|
|
|
|
|
|
Revenue |
|
|
|
|
|
|
|
|
|
|
|
|
|
|
|
|
|
Home sales revenues |
| $ | 4,032,969 |
|
| $ | 3,027,167 |
|
|
|
| $ | 1,005,802 |
|
| 33.2 | % |
Land sales and other revenues |
|
| 59,607 |
|
|
| 30,717 |
|
|
|
|
| 28,890 |
|
| 94.1 | % |
Total homebuilding revenues |
|
| 4,092,576 |
|
|
| 3,057,884 |
|
|
|
|
| 1,034,692 |
|
| 33.8 | % |
Financial services revenues |
|
| 123,738 |
|
|
| 103,308 |
|
|
|
|
| 20,430 |
|
| 19.8 | % |
Total revenues |
|
| 4,216,314 |
|
|
| 3,161,192 |
|
|
|
|
| 1,055,122 |
|
| 33.4 | % |
Homebuilding cost of revenues |
|
|
|
|
|
|
|
|
|
|
|
|
|
|
|
|
|
Cost of home sales revenues |
|
| (3,056,048) |
|
|
| (2,468,133) |
|
|
|
|
| (587,915) |
|
| 23.8 | % |
Cost of land sales and other revenues |
|
| (39,315) |
|
|
| (21,929) |
|
|
|
|
| (17,386) |
|
| 79.3 | % |
|
|
| (3,095,363) |
|
|
| (2,490,062) |
|
|
|
|
| (605,301) |
|
| 24.3 | % |
Financial services costs |
|
| (72,578) |
|
|
| (54,797) |
|
|
|
|
| (17,781) |
|
| 32.4 | % |
Selling, general, and administrative |
|
| (389,610) |
|
|
| (341,710) |
|
|
|
|
| (47,900) |
|
| 14.0 | % |
Loss on debt extinguishment |
|
| (14,458) |
|
|
| — |
|
|
|
|
| (14,458) |
|
| (100.0) | % |
Inventory impairment and other |
|
| (41) |
|
|
| (2,172) |
|
|
|
|
| 2,131 |
|
| (98.1) | % |
Other income (expense) |
|
| (3,142) |
|
|
| (2,211) |
|
|
|
|
| (931) |
|
| 42.1 | % |
Income before income tax expense |
|
| 641,122 |
|
|
| 270,240 |
|
|
|
|
| 370,882 |
|
| 137.2 | % |
Income tax expense |
|
| (142,618) |
|
|
| (64,083) |
|
|
|
|
| (78,535) |
|
| 122.6 | % |
Net income |
| $ | 498,504 |
|
| $ | 206,157 |
|
|
|
| $ | 292,347 |
|
| 141.8 | % |
Earnings per share: |
|
|
|
|
|
|
|
|
|
|
|
|
|
|
|
|
|
Basic |
| $ | 14.79 |
|
| $ | 6.19 |
|
|
|
| $ | 8.60 |
|
| 138.9 | % |
Diluted |
| $ | 14.47 |
|
| $ | 6.13 |
|
|
|
| $ | 8.34 |
|
| 136.1 | % |
Adjusted diluted earnings per share(1) |
| $ | 14.80 |
|
| $ | 6.22 |
|
|
|
| $ | 8.58 |
|
| 137.9 | % |
Other Operating Information (dollars in thousands): |
|
|
|
|
|
|
|
|
|
|
|
|
|
|
|
|
|
Number of homes delivered |
|
| 10,805 |
|
|
| 9,453 |
|
|
|
|
| 1,352 |
|
| 14.3 | % |
Average sales price of homes delivered |
| $ | 373.3 |
|
| $ | 320.2 |
|
|
|
| $ | 53.1 |
|
| 16.6 | % |
Homebuilding gross margin percentage(2) |
|
| 24.2 | % |
|
| 18.4 | % |
|
|
|
| 5.8 | % |
| 31.5 | % |
Adjusted homebuilding gross margin excluding interest and inventory impairment and other (1) |
|
| 25.9 | % |
|
| 20.8 | % |
|
|
|
| 5.1 | % |
| 24.5 | % |
Backlog at end of period, number of homes |
|
| 4,651 |
|
|
| 3,439 |
|
|
|
|
| 1,212 |
|
| 35.2 | % |
Backlog at end of period, aggregate sales value |
| $ | 1,869,772 |
|
| $ | 1,294,202 |
|
|
|
| $ | 575,570 |
|
| 44.5 | % |
Average sales price of homes in backlog |
| $ | 402.0 |
|
| $ | 376.3 |
|
|
|
| $ | 25.7 |
|
| 6.8 | % |
Net new home contracts |
|
| 12,017 |
|
|
| 10,822 |
|
|
|
|
| 1,195 |
|
| 11.0 | % |
Selling communities at period end |
|
| 202 |
|
|
| 198 |
|
|
|
|
| (4) |
|
| (2.0) | % |
Average selling communities |
|
| 189 |
|
|
| 217 |
|
|
|
|
| (31) |
|
| (14.3) | % |
Total owned and controlled lot inventory |
|
| 79,859 |
|
|
| 49,965 |
|
|
|
|
| 29,894 |
|
| 59.8 | % |
Adjusted EBITDA(1) |
| $ | 732,718 |
|
| $ | 356,414 |
|
|
|
| $ | 376,304 |
|
| 105.6 | % |
Adjusted income before income tax expense(1) |
| $ | 655,621 |
|
| $ | 273,996 |
|
|
|
| $ | 381,625 |
|
| 139.3 | % |
Adjusted net income(1) |
| $ | 509,778 |
|
| $ | 209,022 |
|
|
|
| $ | 300,756 |
|
| 143.9 | % |
Net homebuilding debt to net capital (1) |
|
| 26.3 | % |
|
| 27.2 | % |
|
|
|
| (0.9) | % |
| (3.3) | % |
(1)This is a non-GAAP financial measure and should not be used as a substitute for the Company’s operating results prepared in accordance with GAAP. See the reconciliations to the most comparable GAAP measure and other information within our “Homebuilding Gross Margin” and “Non-GAAP Financial Measures” sections in this Management’s Discussion and Analysis of Financial Condition and Results of Operations. An analysis of any non-GAAP financial measure should be used in conjunction with results presented in accordance with GAAP.
(2)Homebuilding gross margin percentage is inclusive of nominal impairment charges and $2.2 million in impairment charges for the years ended December 31, 2021 and 2020, respectively, in inventory impairment included within inventory impairment and other on our consolidated statements of operations. See Note 12 – Fair Value Disclosures in the Notes to the Consolidated Financial Statements for further detail.
| | | | | | | | | | | | | | | |
(in thousands, except per share amounts) | | Year Ended December 31, | | | | | | | |
| | 2017 | | 2016 | | Amount | | % |
| | | | | | | | | | | | | | | |
Consolidated Statements of Operations: | | | | | | | | | | | | | | | |
Revenue | | | | | | | | | | | | | | | |
Home sales revenues | | $ | 1,405,443 | | | $ | 978,733 | | | $ | 426,710 | | | 43.6 | % |
Land sales revenues | | | 8,503 | | | | 15,707 | | | | (7,204) | | | (45.9) | % |
| | | 1,413,946 | | | | 994,440 | | | | 419,506 | | | 42.2 | % |
Financial services revenue | | | 9,853 | | | | — | | | | 9,853 | | | — | |
Total revenues | | | 1,423,799 | | | | 994,440 | | | | 429,359 | | | 43.2 | % |
Homebuilding cost of revenues | | | | | | | | | | | | | | | |
Cost of home sales revenues | | | (1,153,359) | | | | (786,127) | | | | (367,232) | | | 46.7 | % |
Cost of land sales and other revenues | | | (6,516) | | | | (14,217) | | | | 7,701 | | | (54.2) | % |
| | | (1,159,875) | | | | (800,344) | | | | (359,531) | | | 44.9 | % |
Financial services costs | | | (8,664) | | | | — | | | | (8,664) | | | | |
Selling, general, and administrative | | | (176,304) | | | | (122,224) | | | | (54,080) | | | 44.2 | % |
Acquisition expense | | | (9,905) | | | | (490) | | | | (9,415) | | | 1,921.4 | % |
Equity in income of unconsolidated subsidiaries | | | 12,176 | | | | 191 | | | | 11,985 | | | 6,274.9 | % |
Other income (expense) | | | 2,937 | | | | 1,576 | | | | 1,361 | | | 86.4 | % |
Income before income tax expense | | | 84,164 | | | | 73,149 | | | | 11,015 | | | 15.1 | % |
Income tax expense | | | (33,869) | | | | (23,609) | | | | (10,260) | | | 43.5 | % |
Net income | | $ | 50,295 | | | $ | 49,540 | | | $ | 755 | | | 1.5 | % |
Earnings per share: | | | | | | | | | | | | | | | |
Basic | | $ | 2.06 | | | $ | 2.34 | | | $ | (0.28) | | | (12.0) | % |
Diluted | | $ | 2.03 | | | $ | 2.33 | | | $ | (0.30) | | | (12.9) | % |
Adjusted diluted earnings per share(1) | | $ | 2.87 | | | $ | 2.36 | | | $ | 0.51 | | | 21.6 | % |
Other Operating Information (dollars in thousands): | | | | | | | | | | | | | | | |
Number of homes delivered | | | 3,640 | | | | 2,825 | | | | 815.0 | | | 28.8 | % |
Average sales price of homes delivered | | $ | 386.1 | | | $ | 346.5 | | | $ | 39.6 | | | 11.4 | % |
Homebuilding gross margin percentage | | | 17.9 | % | | | 19.7 | % | | | (1.8) | % | | (9.1) | % |
Adjusted homebuilding gross margin excluding interest and purchase price accounting for acquired work in process inventory (1) | | | 21.4 | % | | | 21.7 | % | | | (0.3) | % | | (1.4) | % |
Cancellation rate | | | 21 | % | | | 20 | % | | | 1 | % | | 5.0 | % |
Backlog at end of period, number of homes | | | 1,320 | | | | 749 | | | | 571 | | | 76.2 | % |
Backlog at end of period, aggregate sales value | | $ | 572,888 | | | $ | 302,823 | | | $ | 270,065 | | | 89.2 | % |
Average sales price of homes in backlog | | $ | 434.0 | | | $ | 404.3 | | | $ | 29.7 | | | 7.3 | % |
Net new home contracts | | | 3,814 | | | | 2,860 | | | | 954 | | | 33.4 | % |
Selling communities at period end | | | 119 | | | | 89 | | | | 30 | | | 33.7 | % |
Average selling communities | | | 101 | | | | 89 | | | | 12 | | | 13.5 | % |
Total owned and controlled lot inventory | | | 30,784 | | | | 18,296 | | | | 12,488 | | | 68.3 | % |
Adjusted EBITDA(1) | | $ | 150,477 | | | $ | 100,343 | | | $ | 50,134 | | | 50.0 | % |
Adjusted income before income tax expense(1) | | $ | 109,694 | | | $ | 74,028 | | | $ | 35,666 | | | 48.2 | % |
Adjusted net income(1) | | $ | 71,082 | | | $ | 50,135 | | | $ | 20,947 | | | 41.8 | % |
Net debt to net capital(1) | | | 48.7 | % | | | 46.1 | % | | | 2.6 | % | | 5.6 | % |
Results of Operations by Segment
(dollars in thousands)
| |
|
|
|
|
|
|
|
|
|
|
|
|
|
|
|
|
|
|
| | | | | | | | | | | | | | | | | | |
|
|
|
|
|
|
|
|
|
|
|
|
|
|
|
|
|
|
| | New Homes Delivered | | Average Sales Price of Homes Delivered | | Home Sales Revenues | | Income before Income Tax |
| New Homes Delivered |
| Average Sales Price of Homes Delivered |
| Home Sales Revenues |
| Income before Income Tax Expense |
| | Year Ended December 31, | | Year Ended December 31, | | Year Ended December 31, | | Year Ended December 31, |
| Year Ended December 31, |
| Year Ended December 31, |
| Year Ended December 31, |
| Year Ended December 31, |
| | 2017 | | 2016 | | 2017 | | 2016 | | 2017 | | 2016 | | 2017 | | 2016 |
| 2021 |
| 2020 |
| 2021 |
| 2020 |
| 2021 |
| 2020 |
| 2021 |
| 2020 |
West | | | 398 | | | — | | $ | 529.4 | | $ | — | | $ | 210,696 | | $ | — | | $ | 14,640 | | $ | — |
|
| 1,602 |
|
| 1,242 |
| $ | 629.4 |
| $ | 545.7 |
| $ | 1,008,274 |
| $ | 677,755 |
| $ | 213,301 |
| $ | 71,417 |
Mountain | | 1,465 | | 1,222 | | $ | 418.0 | | $ | 409.5 | | 612,392 | | 500,386 | | 75,704 | | | 66,613 |
| 2,315 |
| 1,973 |
|
| 481.2 |
| 424.8 |
|
| 1,114,078 |
| 838,055 |
| 212,335 |
| 114,722 |
Texas | | 413 | | 338 | | $ | 389.6 | | $ | 400.0 | | 160,891 | | 135,207 | | 10,952 | | | 2,686 |
| 1,615 |
| 1,338 |
|
| 295.1 |
| 251.8 |
|
| 476,664 |
| 336,882 |
| 68,565 |
| 34,694 |
Southeast | | 1,364 | | 1,265 | | $ | 309.0 | | $ | 271.3 | | 421,464 | | 343,140 | | 29,662 | | | 31,138 |
| 1,683 |
| 1,903 |
|
| 394.1 |
| 353.1 |
|
| 663,224 |
| 672,034 |
| 92,420 |
| 57,181 |
Century Complete | |
| 3,590 |
| 2,997 |
|
| 214.7 |
| 167.6 |
|
| 770,729 |
| 502,441 |
| 109,213 |
| 33,449 |
Financial Services | | — | | — | | $ | — | | $ | — | | — | | — | | 1,225 | | | — |
| — |
| — |
|
| — |
| — |
|
| — |
| — |
| 51,160 |
| 48,511 |
Corporate | | | — | | | — | | $ | — | | $ | — | | | — | | | — | | | (48,019) | | | (27,288) |
|
| — |
|
| — |
|
| — |
|
| — |
|
| — |
|
| — |
|
| (105,872) |
|
| (89,734) |
Total | | | 3,640 | | | 2,825 | | $ | 386.1 | | $ | 346.5 | | $ | 1,405,443 | | $ | 978,733 | | $ | 84,164 | | $ | 73,149 |
|
| 10,805 |
|
| 9,453 |
| $ | 373.3 |
| $ | 320.2 |
| $ | 4,032,969 |
| $ | 3,027,167 |
| $ | 641,122 |
| $ | 270,240 |
West
In our West segment, forDuring the year ended December 31, 2017,2021, our West segment generated income before income tax increasedexpense of $213.3 million, a 198.7% increase over the prior year period. This increase was driven by $14.6 million to $14.6 million. We acquired the entirety of our operations in our West segment in conjunction with our acquisitions of UCP and Sundquist Homes as discussed above. Since completing these acquisitions, we delivered 398 new homes with an average price of $529.4 thousand and generated $210.7 millionincrease in home sales revenue of $330.5 million and an increase of 1,062 basis points in the percentage of income before income tax expense to home sales revenues, in our West segment.
Mountain
In our Mountain segment, foras a result of (1) increased revenue on a partially fixed cost base and (2) increased gross margin on home sales. The revenue increase during the year ended December 31, 2017, our income before income tax increased2021 was primarily generated by $9.1 million to $75.7 million, as compared to $66.6 million for the same period in 2016. This increase is related to ana 29.0% increase in the number of homes delivered, and anas well as a 15.3% increase in the average sellingsales price of those homes in 2017.
Texas
In our Texas segment, forper home. During the year ended December 31, 2017, our income before income tax increased by $8.3 million to $11.0 million as compared $2.7 million for2021, the same period in 2016. This increase is primarily related to an increase in the number of homes delivered was driven by favorable market dynamics across our markets. The average sales price increase was driven by the mix of deliveries within individual communities, as well as increased pricing power as a result of strong market dynamics.
Mountain
During the year ended December 31, 2021, our Mountain segment generated income before income tax expense of $212.3 million, an 85.1% increase over the prior year period. This increase was driven by an increase in 2017. home sales revenue of $276.0 million and an increase of 537 basis points in the percentage of income before income tax expense to home sales revenues, as a result of (1) increased revenue on a partially fixed cost base and (2) increased gross margin on home sales. The revenue increase during the year ended December 31, 2021 was primarily generated by a 17.3% increase in the number of homes delivered, as well as a 13.3% increase in the average sales price per home. During the year ended December 31, 2021, the increase in the number of homes delivered was driven by favorable market dynamics across our markets. The average sales price increase was driven by the mix of deliveries within individual communities, as well as increased pricing power as a result of strong market dynamics.
Texas
SoutheastDuring the year ended December 31, 2021, our Texas segment generated income before income tax expense of $68.6 million a 97.6% increase over the prior year period. This increase was driven by an increase in home sales revenue of $139.8 million and an increase of 409 basis points in the percentage of income before income tax expense to home sales revenues, as a result of (1) increased revenue on a partially fixed cost base and (2) increased gross margin on home sales. The revenue increase during the year ended December 31, 2021 was primarily generated by a 20.7% increase in the number of homes delivered, as well as a 17.2% increase in the average sales price per home. During the year ended December 31, 2021, the increase in the number of homes delivered was driven by favorable market dynamics across our markets. The average sales price increase was driven by the mix of deliveries within individual communities, as well as increased pricing power as a result of strong market dynamics.
Southeast
InDuring the year ended December 31, 2021, our Southeast segment generated income before income tax expense of $92.4 million a 61.6% increase over the prior year period. This increase was primarily driven by an increase of 543 basis points in the percentage of income before income tax expense to home sales revenues, as a result of increased gross margin on home sales. Homes sales revenue decreased during the year ended December 31, 2021, primarily generated by a decrease in the number of homes delivered due to a
decrease in the number of communities opened, and partially offset by an 11.6% increase in the average sales price per home. The average sales price increase was driven by the mix of deliveries within individual communities, as well as increased pricing power as a result of strong market dynamics.
Century Complete
During the year ended December 31, 2021, our Century Complete segment generated income before income tax expense of $109.2 million, a 226.5% increase over the prior year period. This increase was driven by an increase in home sales revenue of $268.3 million and an increase of 751 basis points in the percentage of income before income tax expense to home sales revenues, as a result of (1) increased revenue on a partially fixed cost base and (2) increased gross margin on home sales. The revenue increase during the year ended December 31, 2021 was primarily generated by a 19.8% increase in the number of homes delivered, as well as a 28.1% increase in the average sales price per home. During the year ended December 31, 2021, the increase in the number of homes delivered was driven by favorable market dynamics across our markets. The average sales price increase was driven by the mix of deliveries within markets between years, as well as increased pricing power as a result of strong market dynamics.
Financial Services
Our Financial Services segment generated income before income tax of $51.2 million for the year ended December 31, 2017,2021, a 5.5% increase over the prior year. This increase was primarily the result of a $20.4 million increase in financial services revenue during the year ended December 31, 2021 compared to the prior year period. This increase was due to (1) a 21.1% increase to 8,375 in the number of mortgages originated during the year ended December 31, 2021, due to our income before income tax decreased by $1.5 million to $29.7 million,increased capture rate of 76% as of December 31, 2021 as compared to $31.1 million64% for the sameprior year period and the increase in 2016. Thethe number of homes delivered home sales revenueby our Century Communities and average selling price all increased in our Southeast segmentCentury Complete brands year over year. However, as we have recently started operations in North Carolina, our selling, generalyear, and administrative expenses have increased without(2) a corresponding25.2% increase in revenues.the number of loans sold to third parties during the year ended December 31, 2021 as compared to the prior year period. These increases were partially offset by (1) lower fair value of our mortgage loans held for sale and our mortgage loans in process for which interest rates were locked by borrowers, (2) reduced gain on sale margin from loans sold and (3) increased headcount to support continued growth.
Financial Services
Our indirect wholly-owned subsidiaries, Inspire Home Loans Inc. and Parkway Title, LLC, which provide mortgage services and title services, respectively, to our home buyers have been identified asThe following table presents selected operational data for our Financial Services segment. We began providing mortgage services to our customers during the second quarter of 2017. Substantially all of the loans we originate are soldsegment (dollars in the secondary market within a short period of time after origination, generally within 30 days. thousands):
|
|
|
|
|
|
|
|
|
|
| Year Ended December 31, |
|
| 2021 |
| 2020 |
Total originations: |
|
|
|
|
|
|
|
|
Number of loans |
|
| 8,375 |
|
|
| 6,918 |
|
Principal |
| $ | 2,714,764 |
|
| $ | 2,045,871 |
|
Capture rate of Century homebuyers |
|
| 76 | % |
|
| 64 | % |
Century Communities |
|
| 81 | % |
|
| 74 | % |
Century Complete |
|
| 63 | % |
|
| 40 | % |
Average FICO score |
|
| 737 |
|
|
| 735 |
|
Century Communities |
|
| 743 |
|
|
| 739 |
|
Century Complete |
|
| 712 |
|
|
| 713 |
|
|
|
|
|
|
|
|
|
|
Loans sold to third parties: |
|
|
|
|
|
|
|
|
Number of loans sold |
|
| 8,245 |
|
|
| 6,587 |
|
Principal |
| $ | 2,629,808 |
|
| $ | 1,945,113 |
|
Corporate
During the year ended December 31, 2017, we originated and closed 550 loans with a total principal amount of $172.2 million.
Corporate
During the year ended December 31, 2017,2021, our Corporate segment generated lossesa loss of $48.0$105.9 million, as compared to lossesa loss of $27.3$89.7 million for the same period in 2016. Theduring 2020. This increase in expensesloss is primarily attributed to a $14.5 million loss on debt extinguishment during the year ended December 31, 2017 was primarily attributed2021 related to the following: (1) an increaseredemption of $9.4our 5.75% senior notes due 2025, as described above, as well as increased compensation and bonus costs for our Corporate segment of approximately $6.4 million, in acquisition expenses, (2) an increase of $11.6 million in compensation related expenses, including non-cash expenses for share based payments and an increase in the number of employees after our acquisition of UCP and
Sundquist Homes, (3) an increase of $3.4 million in information technology related expenses, and (4) an increase of $1.0 million in advertising costs, partially offset by an increasea decrease in equity in income from unconsolidated subsidiaries.stock-based compensation expense of $4.7 million primarily due to accelerated expense recognized during 2020 for the updated estimates related to our performance-based share awards.
Homebuilding Gross Margin
Homebuilding gross margin represents home sales revenue less cost of home sales revenues.revenues and inventory impairment and other. Our homebuilding gross margin percentage, which represents homebuilding gross margin divided by home sales revenues, decreasedincreased to 24.2% for the year ended December 31, 2017 to 17.9%,2021, as compared to 19.7%18.4% for the year ended December 31, 2016. The decrease is2020. This increase was primarily driven by purchase accounting for acquired work(1) the positive homebuilding sales environment across our markets, which resulted in process inventory.increased demand, (2) our ability to increase sales price in excess of an increase in our labor and direct costs year over year, (3) benefits from our increased scale driving building efficiencies and streamlined production processes, and (4) the realization of less interest in cost of home sales revenue over the prior period.
In the following table, we calculate our homebuilding gross margins adjusting formargin adjusted to exclude inventory impairment and other and interest in cost of home sales and purchase price accounting for acquired work in process inventory. See “Critical Accounting Policies” below and Footnote 3 (Business Combinations) of our Consolidated Financial Statements for additional discussion regarding our methodology for estimating the fair value of acquired work in process inventory.revenues.
(dollars in thousands)
| |
|
|
|
|
|
|
|
|
|
|
| |
|
|
|
|
|
|
|
|
|
|
|
| | | | | | | | | | |
| Year Ended December 31, |
| | Year Ended December 31, |
|
|
|
|
|
|
|
|
|
|
|
| | 2017 | | % | | 2016 | | % |
| 2021 |
| % |
| 2020 |
| % |
| | | | | | | | | | | | |
|
|
|
|
|
|
|
|
|
|
|
|
Home sales revenues | | $ | 1,405,443 | | 100.0 | % | | $ | 978,733 | | 100.0 | % |
| $ | 4,032,969 |
| 100.0 | % |
| $ | 3,027,167 |
| 100.0 | % |
Cost of home sales revenues | | | (1,153,359) | | 82.1 | % | | | (786,127) | | 80.3 | % |
| (3,056,048) |
| (75.8) | % |
| (2,468,133) |
| (81.5) | % |
Inventory impairment and other | |
|
| (41) |
| (0.0) | % |
|
| (2,172) |
| (0.1) | % |
Gross margin from home sales | | | 252,084 | | 17.9 | % | | | 192,606 | | 19.7 | % |
|
| 976,880 |
| 24.2 | % |
|
| 556,862 |
| 18.4 | % |
Add: Inventory impairment and other | |
| 41 |
| 0.0 | % |
| 2,172 |
| 0.1 | % |
Add: Interest in cost of home sales revenues | | | 32,898 | | 2.3 | % | | | 19,502 | | 2.0 | % |
|
| 66,846 |
| 1.7 | % |
|
| 72,002 |
| 2.4 | % |
Adjusted homebuilding gross margin excluding interest (1) | | | 284,982 | | 20.3 | % | | | 212,108 | | 21.7 | % | |
Add: Purchase price accounting for acquired work in process inventory | | | 15,625 | | 1.1 | % | | | 389 | | 0.0 | % | |
Adjusted homebuilding gross margin excluding interest and purchase price accounting for acquired work in process inventory (1) | | $ | 300,607 | | 21.4 | % | | $ | 212,497 | | 21.7 | % | |
Adjusted homebuilding gross margin excluding interest and inventory impairment and other (1) | |
| $ | 1,043,767 |
| 25.9 | % |
| $ | 631,036 |
| 20.8 | % |
(1)This non-GAAP financial measure should not be used as a substitute for the Company’s operating results in accordance with GAAP.GAAP. See the reconciliations to the most comparable GAAP measure and other information under “—Non-GAAP Financial Measures.” An analysis of any non-GAAP financial measure should be used in conjunction with results presented in accordance with GAAP.
ExcludingFor the year ended December 31, 2021, excluding inventory impairment and other, and interest in cost of home sales and purchase price accounting,revenues, our adjusted homebuilding gross margin percentage was 21.4% for the year ended December 31, 2017,25.9% as compared to 21.7%20.8% for the year ended December 31, 2016.2020. We believe the above information is meaningful as it isolates the impact that inventory impairment, indebtedness and acquisitions (if applicable) have on our homebuilding gross margin and allows for comparability of our homebuilding gross margins to previous periods and our competitors.
Selling, General and Administrative Expense
(dollars in thousands)
| | | | | | | | | | | | | | | |
(dollars in thousands) | | | | | |
| | Year Ended December 31, | | Increase |
| | 2017 | | 2016 | | Amount | | % |
Selling, general and administrative | | $ | (176,304) | | | $ | (122,224) | | | $ | (54,080) | | | 44.2 | % |
As a percentage of homes sales revenue | | | (12.5) | % | | | (12.5) | % | | | | | | | |
|
|
|
|
|
|
|
|
|
|
|
|
|
|
|
|
|
| Year Ended December 31, |
| Increase |
|
| 2021 |
| 2020 |
| Amount |
| % |
Selling, general and administrative |
| $ | 389,610 |
|
| $ | 341,710 |
|
| $ | 47,900 |
|
| 14.0 | % |
As a percentage of home sales revenue |
|
| 9.7 | % |
|
| 11.3 | % |
|
|
|
|
|
|
|
Our selling, general and administrative costsexpense increased $54.1$47.9 million for the year ended December 31, 20172021 as compared to 2016. Thethe year ended December 31, 2020. This increase was primarily attributable to the following: (1) an increase of $12.1$34.4 million in salaries and wages expense as compared to 2020, as well as an increase of $13.8 million in internal and external commission expense, resulting from a 44% increasewhich is directly related to the increases in home sales revenues, (2) anrevenues. The increase of $26.2 million in compensation related expenses, including incentive compensation as a result of higher head count to support our growth, (3) an increase of $4.7 million in advertising expenses, (4) an increase of $2.0
million in information technology expenses, and (5) a net increase of $9.0 million related to individually insignificant changes in other expenses, including rent, insurance, depreciation and legal.
Other Income (Expense)
Forfor the year ended December 31, 2017, other income (expense) increased to $2.9 million from $1.6 million for the same period2021 was partially offset by a decrease in 2016. The increase was related to increasesexpenses in interest incomenumerous areas, including advertising and forfeited deposits.
Equity in Income from Unconsolidated Subsidiaries
As of December 31, 2017, our investment in WJH was $28.2 million and we recognized $12.2 million and $0.2 million of equity in income of unconsolidated subsidiaries during the years ended December 31, 2017 and 2016, respectively. Our investment in WJH was made in November 2016, and as such there were limited earnings during 2016. WJH had 1,742 home deliveries with an average sales price of $148.2 thousand duringlegal expenses. During the year ended December 31, 2017. 2021, our selling, general and administrative expense decreased 160 basis points as a percentage of home sales revenue as compared to the year ended December 31, 2020, as a result of increased revenues on a partially fixed cost base.
Income Tax Expense
Our income tax expense for the year ended December 31, 20172021 was $33.9$142.6 million, or 22.2% of income before income tax expense, as compared to $23.6$64.1 million, for the year ended December 31, 2016. Ouror 23.7% of income before income tax expense, for the year ended December 31, 2017 results in an2020. Our effective tax
rates for the years ended December 31, 2021 and 2020 were benefited by a $16.5 million and $8.5 million benefit, respectively, related to the Energy Efficient Home Credit.
Our effective tax rate of 40.2%, as compared to an effective tax rate of 32.3%22.2% for the year ended December 31, 2016. Our2021 is comprised of our statutory federal and blended state rate of 24.8%, partially offset by certain permanent differences between taxable income and GAAP income before tax expense. These differences include certain compensation paid to executive officers, which is not deductible for federal income tax purposes and increased our effective tax rate is driven by 0.6%, and the Energy Efficient Home Credit, which benefited our blended federal and state statutory rate of 37.8%. Our blended federal and state statutoryeffective tax rate is reflectiveby 2.6%.
The Energy Efficient Home Credit provides eligible contractors a federal income tax credit of $2,000 for each home delivered that meets the energy saving and certification requirements under the statute. On December 27, 2020, an extension of the statesFederal Energy Credit was enacted which extended the current provisions through December 31, 2021. Of the $16.5 million benefit recognized during the year ended December 31, 2021, approximately $2.6 million and $1.6 million were related to homes closed during the years ended 2019 and 2018 and prior, respectively. Proposed legislation included in which we operate, including Nevada, Texasthe pending “Build Back Better Act” would extend the Federal Energy Credits through December 31, 2031 but would modify the current qualification requirements and Washington which generally do not have corporate income tax. Asprovide a $2,500 or $5,000 tiered credit for new single-family homes meeting designated “Energy Star” or “Zero Energy” program requirements, respectively. Neither the Build Back Better Act nor any similar legislation has been enacted as of the date of this Form 10-K, and it is uncertain whether an extension or similar tax credit will be adopted or available in the future or the scope of any modified program requirements.
Segment Assets
(dollars in thousands)
|
|
|
|
|
|
|
|
|
|
|
|
|
|
| December 31, |
| December 31, |
|
| Increase (Decrease) |
|
| 2021 |
| 2020 |
|
| Amount |
| Change |
West |
| $ | 668,830 |
| $ | 536,907 |
| $ | 131,923 |
| 24.6 | % |
Mountain |
|
| 1,008,481 |
|
| 778,198 |
|
| 230,283 |
| 29.6 | % |
Texas |
|
| 322,302 |
|
| 207,746 |
|
| 114,556 |
| 55.1 | % |
Southeast |
|
| 360,644 |
|
| 329,930 |
|
| 30,714 |
| 9.3 | % |
Century Complete |
|
| 371,096 |
|
| 218,604 |
|
| 152,492 |
| 69.8 | % |
Financial Services |
|
| 533,159 |
|
| 421,153 |
|
| 112,006 |
| 26.6 | % |
Corporate |
|
| 232,364 |
|
| 352,555 |
|
| (120,191) |
| (34.1) | % |
Total assets |
| $ | 3,496,876 |
| $ | 2,845,093 |
| $ | 651,783 |
| 22.9 | % |
Total assets increased by $651.8 million, or 22.9%, to $3.5 billion at December 31, 2021, as compared to $2.8 billion at December 31, 2020, as a result of the Tax Cutsoverall growth of the Company, and Jobs Act signed into law on December 22, 2017, we recorded a provisional remeasurementthe increase in the number of our deferred tax assets totaling $2.8 million. Our blended federalowned lots year over year.
Lots owned and state statutory tax rate is partially offset by benefits from additional deductions for domestic production activities in 2017. controlled
Segment Assets
(dollars in thousands)
| |
|
|
|
|
|
|
|
|
|
|
|
|
|
|
|
|
|
|
|
|
|
| | | | | | | | | | | | |
| December 31, 2021 |
| December 31, 2020 |
| % Change |
|
| | December 31, | | December 31, | | Increase (Decrease) |
| Owned |
| Controlled |
| Total |
| Owned |
| Controlled |
| Total |
| Owned |
| Controlled |
| Total |
| | 2017 | | 2016 | | Amount | | Change |
|
|
|
|
|
|
|
|
|
|
|
|
|
|
|
|
|
|
|
|
|
West | | $ | 273,749 | | $ | — | | $ | 273,749 | | NM | |
| 4,440 |
| 4,877 |
| 9,317 |
| 3,266 |
| 3,392 |
| 6,658 |
| 35.9 | % |
| 43.8 | % |
| 39.9 | % |
Mountain | | | 571,880 | | | 541,657 | | | 30,223 | | 5.6 | % |
| 11,860 |
| 8,039 |
| 19,899 |
| 7,951 |
| 5,910 |
| 13,861 |
| 49.2 | % |
| 36.0 | % |
| 43.6 | % |
Texas | | | 192,078 | | | 138,392 | | | 53,686 | | 38.8 | % |
| 5,340 |
| 8,159 |
| 13,499 |
| 3,035 |
| 5,873 |
| 8,908 |
| 75.9 | % |
| 38.9 | % |
| 51.5 | % |
Southeast | | | 401,618 | | | 262,448 | | | 139,170 | | 53.0 | % |
| 5,928 |
| 14,195 |
| 20,123 |
| 3,076 |
| 6,389 |
| 9,465 |
| 92.7 | % |
| 122.2 | % |
| 112.6 | % |
Financial Services | | | 63,137 | | | — | | | 63,137 | | NM | | |
Corporate | | | 232,560 | | | 65,031 | | | 167,529 | | 257.6 | % | |
Total assets | | $ | 1,735,022 | | $ | 1,007,528 | | $ | 727,494 | | 72.2 | % | |
Century Complete | |
| 5,287 |
| 11,734 |
| 17,021 |
| 3,473 |
| 7,600 |
| 11,073 |
| 52.2 | % |
| 54.4 | % |
| 53.7 | % |
Total | |
| 32,855 |
| 47,004 |
| 79,859 |
| 20,801 |
| 29,164 |
| 49,965 |
| 57.9 | % |
| 61.2 | % |
| 59.8 | % |
| | | | | | | | | | | | | | | | | | | | | |
Lots owned and | | December 31, 2017 | | December 31, 2016 | | % Change | |
controlled | | Owned | | Controlled | | Total | | Owned | | Controlled | | Total | | Owned | | Controlled | | Total |
| | | | | | | | | | | | | | | | | | | | | |
West | | 3,742 | | 3,179 | | 6,921 | | — | | — | | — | | NM | | | NM | | | NM | |
Mountain | | 4,666 | | 4,856 | | 9,522 | | 4,354 | | 2,959 | | 7,313 | | 7.2 | % | | 64.1 | % | | 30.2 | % |
Texas | | 2,517 | | 3,489 | | 6,006 | | 1,356 | | 3,420 | | 4,776 | | 85.6 | % | | 2.0 | % | | 25.8 | % |
Southeast | | 4,827 | | 3,508 | | 8,335 | | 2,953 | | 3,254 | | 6,207 | | 63.5 | % | | 7.8 | % | | 34.3 | % |
Total | | 15,752 | | 15,032 | | 30,784 | | 8,663 | | 9,633 | | 18,296 | | 81.8 | % | | 56.0 | % | | 68.3 | % |
Of our total lots owned and controlled as of December 31, 2017, 51.2%2021, 41.1% were owned and 48.8%58.9% were controlled, as compared to 47.3%41.6% owned and 52.7%58.4% controlled as of December 31, 2016.2020.
Other Homebuilding Operating Data
| | | | | | | | | |
|
|
|
|
|
|
|
|
|
| | Year Ended | | | | | |
|
|
|
|
|
|
|
Net new home contracts | | December 31, | | Increase |
| Year Ended December 31, |
| Increase (Decrease) |
| | 2017 | | 2016 | | Amount | | % Change |
| 2021 |
| 2020 |
| Amount |
| % Change |
West | | 296 | | — | | 296 | | NM | |
| 1,640 |
| 1,526 |
| 114 |
| 7.5 | % |
Mountain | | 1,591 | | 1,260 | | 331 | | 26.3 | % |
| 2,571 |
| 2,389 |
| 182 |
| 7.6 | % |
Texas | | 477 | | 349 | | 128 | | 36.7 | % |
| 1,616 |
| 1,448 |
| 168 |
| 11.6 | % |
Southeast | | 1,450 | | 1,251 | | 199 | | 15.9 | % |
| 1,595 |
| 2,191 |
| (596) |
| (27.2) | % |
Century Complete | |
| 4,595 |
| 3,268 |
| 1,327 |
| 40.6 | % |
Total | | 3,814 | | 2,860 | | 954 | | 33.4 | % |
| 12,017 |
| 10,822 |
| 1,195 |
| 11.0 | % |
Net new home contracts (new home contracts net of cancellations) for the year ended December 31, 20172021 increased by 9541,195 homes, or 33.4%11.0%, to 3,814,12,017, as compared to 2,86010,822 for the year ended December 31, 2016.2020. The increase in our net new home contracts was primarily driven by an increasestronger sales across all of our segments as the homebuilding industry continued to experience positive trends during 2021, partially offset by a decrease in net new home contracts in the Southeast region. This decrease in our absorption ratesSoutheast segment is driven by a 42.7% decrease in average selling communities opened during the year as well as our acquisitions of UCP and Sundquist Homes.compared to the prior year period.
Monthly Absorption Rate
Our overall monthly “absorption rate” (the rate at which home orders are contracted, net of cancelations) for the years ended December 31, 20172021 and 20162020 by segment areis included in the table below:
| | | | | | | | | |
|
|
|
|
|
|
|
|
|
| | Year Ended December 31, | | Increase |
| Year Ended December 31, |
| Increase (Decrease) |
| | 2017 | | 2016 | | Amount | | % Change |
| 2021 |
| 2020 |
| Amount |
| % Change |
West | | 3.7 | | — | | 3.7 | | NM | |
| 7.2 |
| 7.5 |
| (0.3) |
| (4.0) | % |
Mountain | | 4.0 | | 3.0 | | 1.0 | | 33.3 | % |
| 6.0 |
| 5.2 |
| 0.8 |
| 15.4 | % |
Texas | | 1.7 | | 1.3 | | 0.4 | | 30.8 | % |
| 8.4 |
| 8.0 |
| 0.4 |
| 5.0 | % |
Southeast | | 3.4 | | 3.4 | | — | | — | % |
| 6.0 |
| 7.0 |
| (1.0) |
| (14.3) | % |
Century Complete | |
| 3.5 |
| 2.7 |
| 0.8 |
| 29.6 | % |
Total | | 3.2 | | 2.7 | | 0.5 | | 18.5 | % |
| 5.0 |
| 4.6 |
| 0.4 |
| 8.7 | % |
Our absorption rate increased by 18.5% to 3.2 per month during
During the year ended December 31, 2017,2021, our absorption rates increased by 8.7% to 5.0 per month as compared to 2.7 per month during the same period in 2016. The increase in absorption rate is attributable2020. Absorption rates continued to be strong across all of our markets driven by continued historically low interest rates and strong demand for new homes during the strong homebuilding environment as a result of positive economic trends across our markets.current year period.
|
|
|
|
|
|
|
|
|
|
|
|
|
|
|
|
|
|
|
|
|
|
Selling communities at period end |
| As of December 31, |
|
| Increase/(Decrease) |
|
| 2021 |
| 2020 |
|
| Amount |
| % Change |
|
|
|
|
|
|
|
|
|
|
|
West |
| 19 |
| 17 |
|
| 2 |
| 11.8 | % |
Mountain |
| 36 |
| 38 |
|
| (2) |
| (5.3) | % |
Texas |
| 16 |
| 15 |
|
| 1 |
| 6.7 | % |
Southeast |
| 22 |
| 26 |
|
| (4) |
| (15.4) | % |
Century Complete |
| 109 |
| 102 |
|
| 7 |
| 6.9 | % |
Total |
| 202 |
| 198 |
|
| 4 |
| 2.0 | % |
| | | | | | | | | | |
| | | | | | | | | | |
Selling communities at period end | | As of December 31, | | | Increase/(Decrease) |
| | 2017 | | 2016 | | | Amount | | % Change |
| | | | | | | | | | |
West | | 19 | | — | | | 19 | | NM | |
Mountain | | 33 | | 35 | | | (2) | | (5.7) | % |
Texas | | 27 | | 23 | | | 4 | | 17.4 | % |
Southeast | | 40 | | 31 | | | 9 | | 29.0 | % |
Total | | 119 | | 89 | | | 30 | | 33.7 | % |
Our selling communities increased by 304 communities to 119202 communities at December 31, 2017,2021, as compared to 89198 communities at December 31, 2016.2020. The increase is attributable to our acquisitionswas a result of UCP and Sundquist Homes, as well as organic growth in our existing markets.new community openings, which outpaced the strong sales environment.
| | | | | | | | | | | | | | | | | | | | | | | | | |
| | | | | | | | | | | | | | | | | | | | | | | | | |
| | As of December 31, | | | | | | | | | |
Backlog | | 2017 | | 2016 | | % Change | |
| | | | | | | | | | | | | | | | | | | | | | | | | |
| | Homes | | Dollar Value | | Average Sales Price | | Homes | | Dollar Value | | Average Sales Price | | Homes | | Dollar Value | | Average Sales Price |
| | | | | | |
West | | 270 | | $ | 164,071 | | $ | 607.7 | | — | | $ | — | | $ | — | | NM | | | NM | | | NM | |
Mountain | | 455 | | | 200,887 | | | 441.5 | | 329 | | | 148,298 | | | 450.8 | | 38.3 | % | | 35.5 | % | | (2.1) | % |
Texas | | 215 | | | 82,886 | | | 385.5 | | 151 | | | 72,423 | | | 479.6 | | 42.4 | % | | 14.4 | % | | (19.6) | % |
Southeast | | 380 | | | 125,044 | | | 329.1 | | 269 | | | 82,102 | | | 305.2 | | 41.3 | % | | 52.3 | % | | 7.8 | % |
Total / Weighted Average | | 1,320 | | $ | 572,888 | | $ | 434.0 | | 749 | | $ | 302,823 | | $ | 404.3 | | 76.2 | % | | 89.2 | % | | 7.3 | % |
Backlog
(dollars in thousands)
|
|
|
|
|
|
|
|
|
|
|
|
|
|
|
|
|
|
|
|
|
|
|
|
|
|
|
|
|
|
|
|
|
|
|
|
|
|
|
|
|
|
|
|
|
|
|
|
|
|
|
|
|
| As of December 31, |
|
|
|
|
|
|
|
|
|
|
| 2021 |
| 2020 |
| % Change |
|
|
|
|
|
|
|
|
|
|
|
|
|
|
|
|
|
|
|
|
|
|
|
|
|
|
|
|
| Homes |
| Dollar Value |
| Average Sales Price |
| Homes |
| Dollar Value |
| Average Sales Price |
| Homes |
| Dollar Value |
| Average Sales Price |
|
|
|
|
|
|
|
West |
| 524 |
| $ | 371,848 |
| $ | 709.6 |
| 486 |
| $ | 294,113 |
| $ | 605.2 |
| 7.8 | % |
| 26.4 | % |
| 17.3 | % |
Mountain |
| 1,045 |
|
| 574,085 |
|
| 549.4 |
| 789 |
|
| 365,328 |
|
| 463.0 |
| 32.4 | % |
| 57.1 | % |
| 18.7 | % |
Texas |
| 386 |
|
| 136,893 |
|
| 354.6 |
| 385 |
|
| 134,023 |
|
| 348.1 |
| 0.3 | % |
| 2.1 | % |
| 1.9 | % |
Southeast |
| 713 |
|
| 308,663 |
|
| 432.9 |
| 801 |
|
| 306,644 |
|
| 382.8 |
| (11.0) | % |
| 0.7 | % |
| 13.1 | % |
Century Complete |
| 1,983 |
|
| 478,283 |
|
| 241.2 |
| 978 |
|
| 194,094 |
|
| 198.5 |
| 102.8 | % |
| 146.4 | % |
| 21.5 | % |
Total / Weighted Average |
| 4,651 |
| $ | 1,869,772 |
| $ | 402.0 |
| 3,439 |
| $ | 1,294,202 |
| $ | 376.3 |
| 35.2 | % |
| 44.5 | % |
| 6.8 | % |
Backlog reflects the number of homes, net of cancellations, experienced during the period, for which we have entered into a sales contract with a customer but for which we have not yet delivered the home. At December 31, 2017,2021, we had 1,3204,651 homes in backlog with a total value of $572.9 million,$1.9 billion, which represents an increaseincreases of 76.2%35.2% and 89.2%44.5%, respectively, as compared to 7493,439 homes in backlog with a total value of $302.8 million$1.3 billion at December 31, 2016.2020. The increase in backlog and backlogdollar value is primarily attributable to our acquisitions of UCP and Sundquist Homes as well as the increase in our absorption rates. Thebacklog units and a 6.8% increase in the average sales price of homes in backlog, is drivenpartially offset by increasesa decrease in mostbacklog units for our Southeast segment which correlates directly with the decrease in selling communities.
Liquidity and Capital Resources
Overview
Our liquidity, consisting of our cash and cash equivalents and cash held in escrow and credit facility availability, was $1.2 billion as of December 31, 2021, compared to $1.1 billion as of December 31, 2020.
Our principal uses of capital for the year ended December 31, 2021 were our land purchases, land development, home construction, and the payment of routine liabilities. We increased our land acquisition and development activities during 2021, which resulted in 79,859 lots owned and controlled at December 31, 2021, a 59.8% increase as compared to December 31, 2020.
Cash flows for each of our communities depend on the stage in the development cycle and can differ substantially from reported earnings. Early stages of development or expansion require significant cash outlays for land acquisitions, entitlements and other approvals, and construction of model homes, roads, utilities, general landscaping and other amenities. Because these costs are a component of our inventory and not recognized in our consolidated statements of operations until a home closes, we incur significant cash outlays prior to our recognition of earnings. In the later stages of community development, cash inflows may significantly exceed earnings reported for financial statement purposes, as the cash outflow associated with home and land construction was previously incurred. From a liquidity standpoint, we are actively acquiring and developing lots in our markets to maintain and grow our lot supply and active selling communities. As we continue to expand our business, our cash outlays for land purchases and land development to grow our lot inventory may exceed our cash generated by operations.
Under our shelf registration statement, which we filed with the SEC on July 1, 2021 and was automatically effective upon filing, we have the ability to access the debt and equity capital markets in registered transactions from time to time and as needed as part of our ongoing financing strategy and subject to market conditions. In August 2021, we filed a prospectus supplement to offer up to $100.0 million under the shelf registration statement under our at-the-market facility described below.
Short-term Liquidity and Capital Resources
We use funds generated by operations, available borrowings under our revolving credit facility, and proceeds from issuances of debt or equity, including our current at-the-market facility, to fund our short term working capital obligations and fund our purchases of land, as well as land development, home construction activities, and other cash needs.
Our Financial Services operations use funds generated from operations, and availability under our mortgage repurchase facilities to finance its operations including originations of mortgage loans to our homebuyers.
We believe that we will be able to fund our current liquidity needs for at least the next twelve months with our cash on hand, cash generated from operations, and cash expected to be available from our revolving line of credit or through accessing debt or equity capital, as needed or appropriate, although no assurance can be provided that such additional debt or equity capital will be available or on acceptable terms, especially in light of the current COVID-19 pandemic, its impact on the macro-economy, and market conditions at the time. While the impact of the COVID-19 pandemic will continue to evolve, we believe we are well positioned from a cash and liquidity standpoint to not only operate in an uncertain environment, but also continue to grow with the market and pursue other ways to properly deploy capital to enhance returns, which may include taking advantage of strategic opportunities as they arise.
Long-term Liquidity and Capital Resources
Beyond the next twelve months, we believe that our principal uses of capital will be land and inventory purchases and other expenditures to invest in our future growth, as well as principal and interest payments on our long-term debt obligations. We believe that we will be able to fund our long-term liquidity needs with cash generated from operations and cash expected to be available from our revolving line of credit or through accessing debt or equity capital, as needed or appropriate, although no assurance can be provided that such additional debt or equity capital will be available. To the extent these sources of capital are insufficient to meet our needs, we may also conduct additional public or private offerings of our securities, refinance debt, or dispose of certain assets to fund our operating activities and capital needs.
Material Cash Requirements
In the normal course of business, we enter into contracts and commitments that obligate us to make payments in the future. These obligations impact our short-term and long-term liquidity and capital resource needs. Our contractual obligations as of December 31, 2021 were as follows (in thousands):
|
|
|
|
|
|
|
|
|
|
|
|
|
|
|
|
|
| Payments due by period |
|
| Total |
| Less than 1 year |
| 1 - 3 years |
| 3 - 5 years |
| More than 5 years |
Long-term debt maturities, including interest (1) |
| $ | 1,683,740 |
| $ | 399,886 |
| $ | 106,250 |
| $ | 606,250 |
| $ | 571,354 |
Operating leases (2) |
|
| 18,688 |
|
| 5,989 |
|
| 10,320 |
|
| 2,362 |
|
| 17 |
Total contractual obligations |
| $ | 1,702,428 |
| $ | 405,875 |
| $ | 116,570 |
| $ | 608,612 |
| $ | 571,371 |
(1)Principal payments in accordance with our revolving line of credit, mortgage repurchase facilities and long-term debt agreements, and interest payments for outstanding long-term debt obligations. Interest on variable rate debt was calculated using the interest rate as of December 31, 2021. See Note 9 – Debt in the Notes to the Consolidated Financial Statements for further detail.
(2)Operating lease obligations do not include payments to property owners covering real estate taxes and common area maintenance. See Note 13 – Leases in the Notes to the Consolidated Financial Statements for further detail.
In the ordinary course of business, we enter into land purchase contracts in order to procure lots for the construction of our homes. We are subject to customary obligations associated with entering into contracts for the purchase of land and improved lots. Purchase and option contracts for the purchase of land enable us to defer acquiring portions of properties owned by third parties until we have determined whether to exercise our option, which may serve to reduce our financial risks associated with long-term land holdings. These purchase contracts typically require a cash deposit, and the purchase of properties under these contracts is generally contingent upon satisfaction of certain requirements, including obtaining applicable property and development entitlements. We also utilize option contracts with land sellers and others as a resultmethod of pricing strength dueacquiring land in staged takedowns, to positivehelp us manage the financial and market trends.
Supplemental Pro Forma Information
To aid readersrisk associated with 2017 over 2016 comparabilityland holdings, and to reduce the use of funds from our corporate financing sources. Option contracts generally require payment by us of a non-refundable deposit for the entire consolidated businessright to acquire lots over a specified period of time at pre-determined prices. Our obligations with respect to purchase contracts and option contracts are generally limited to the forfeiture of the related non-refundable cash deposits.
As of December 31, 2021, we had outstanding purchase contracts and option contracts for 47,004 lots totaling approximately $2.0 billion and we had $61.6 million of deposits for land contracts, of which $38.1 million were non-refundable cash deposits pertaining to land contracts. While our performance, including UCP,the timing and amount of purchase, if any, under these outstanding purchase and option contracts is subject to change, we currently anticipate performing on the majority of the purchase and option contracts during the next twelve to eighteen months, with performance on the remaining purchase and option contacts occurring in future periods.
Our utilization of land option contracts is dependent on, among other things, the availability of land sellers willing to enter into option
takedown arrangements, the availability of capital to financial intermediaries to finance the development of optioned lots, general housing market conditions, and local market dynamics. Options may be more difficult to procure from land sellers in strong housing markets and are more prevalent in certain geographic regions.
Outstanding Debt Obligations and Debt Service Requirements
One of our principal liquidity needs is the payment of principal and interest on outstanding indebtedness. Our outstanding indebtedness is described in detail in Note 9 – Debt to our Notes to the Consolidated Financial Statements. We are required to meet certain covenants, and as of December 31, 2021, we were in compliance with all such covenants and requirements on our revolving line of credit and mortgage repurchase facilities. See Note 9 – Debt in the Notes to the Consolidated Financial Statements for further detail.
Our outstanding debt obligations included the following also presents limited supplemental pro forma information.
| | | | | | | | | | | | | | | | | | | | |
| | Year Ended December 31, |
(dollars in thousands) | | 2017 | | 2016 |
| | | Pro Forma Home sales revenues | | Pro Forma Net new home contracts | | Pro Forma Deliveries | | | Pro Forma Average sales price | | | Pro Forma Home sales revenues | | Pro Forma Net new home contracts | | Pro Forma Deliveries | | | Pro Forma Average sales price |
West | | $ | 416,327 | | 769 | | 818 | | $ | 509.0 | | $ | 289,037 | | 668 | | 596 | | $ | 485.0 |
Mountain | | | 612,392 | | 1,591 | | 1,465 | | $ | 418.0 | | | 500,386 | | 1,260 | | 1,222 | | $ | 409.5 |
Texas | | | 160,891 | | 477 | | 413 | | $ | 389.6 | | | 135,207 | | 349 | | 338 | | $ | 400.0 |
Southeast | | | 462,550 | | 1,563 | | 1,509 | | $ | 306.5 | | | 398,022 | | 1,516 | | 1,489 | | $ | 267.3 |
Total | | $ | 1,652,160 | | 4,400 | | 4,205 | | $ | 392.9 | | $ | 1,322,652 | | 3,793 | | 3,645 | | $ | 362.9 |
Results of Operations – Years Ended December 31, 20162021 and 20152020 (in thousands):
|
|
|
|
|
|
|
|
|
|
|
|
|
|
|
| December 31, |
| December 31, |
|
| 2021 |
| 2020 |
3.875% senior notes, due August 2029(1) |
| $ | 494,117 |
| $ | — |
6.750% senior notes, due May 2027(1) |
|
| 495,581 |
|
| 494,768 |
5.875% senior notes, due July 2025(1) |
|
| — |
|
| 396,821 |
Other financing obligations |
|
| 9,238 |
|
| 3,286 |
Notes payable |
|
| 998,936 |
|
| 894,875 |
Revolving line of credit |
|
| — |
|
| — |
Mortgage repurchase facilities |
|
| 331,876 |
|
| 259,050 |
Total debt |
| $ | 1,330,812 |
| $ | 1,153,925 |
(1)The carrying value of senior notes reflects the impact of premiums, discounts, and issuance costs that are amortized to interest cost over the respective terms of the senior notes.
During the year ended December 31, 2016,2021, we experienced moderate improvementcompleted a private offering of $500.0 million aggregate principal amount of our 3.875% senior notes due 2029, and used a portion of the net proceeds from the offering to redeem all $400.0 million aggregate principal amount of our 5.875% senior notes due 2025, with the remaining net proceeds from the offering to be used for general corporate purposes.
We may from time to time seek to refinance or increase our outstanding debt or retire or purchase our outstanding debt through cash purchases and/or exchanges for equity securities, in open market purchases, privately negotiated transactions or otherwise. Such repurchases or exchanges, if any, will depend on prevailing market conditions, our liquidity requirements, contractual restrictions and other factors. The amounts involved may or may not be material during any particular reporting period.
Letters of Credit and Performance Bonds
In the normal course of business, we post letters of credit and performance and other bonds primarily related to our land development performance obligations with local municipalities. As of December 31, 2021 and December 31, 2020, we had $492.5 million and $402.7 million, respectively, in letters of credit and performance and other bonds issued and outstanding. Although significant development and construction activities have been completed related to the improvements at these sites, the letters of credit and performance and other bonds are not generally released until all development and construction activities are completed. We anticipate that the obligations secured by these performance bonds and letters of credit generally will be performed in the homebuilding market throughout mostordinary course of business.
Revolving Line of Credit
On May 21, 2021, we entered into a Second Amended and Restated Credit Agreement (which we refer to as the “Second A&R Credit Agreement”) with Texas Capital Bank, National Association, as Administrative Agent and L/C Issuer, and the lenders party thereto. The Second A&R Credit Agreement, which amended and restated our prior Amended and Restated Credit Agreement, provides us with a senior unsecured revolving line of credit (which we refer to as the “Credit Facility”) of up to $800.0 million, and unless terminated earlier, will mature on April 30, 2026. The Credit Facility includes a $250.0 million sublimit for standby letters of credit. Under the terms of the Second A&R Credit Agreement, we are entitled to request an increase in the size of the Credit Facility by an amount not exceeding $200 million. Our obligations under the Second A&R Credit Agreement are guaranteed by certain of our segments. subsidiaries. The Second A&R Credit Agreement contains customary affirmative and negative covenants (including limitations on our ability to grant liens, incur additional debt, pay dividends, redeem our common stock, make certain investments and engage in certain merger, consolidation or asset sale transactions), as well as customary events of default. Borrowings under the Second A&R Credit Agreement bear interest at a floating rate equal to the adjusted Eurodollar Rate plus an applicable margin between 2.05% and 2.65% per annum,
and if made available in the Administrative Agent’s discretion, a base rate plus an applicable margin between 1.05% and 1.65% per annum.As of December 31, 2021, no amounts were outstanding under the Credit Facility and we were in compliance with all covenants.
At-the-Market Offerings
On November 27, 2019, we entered into a Distribution Agreement with J.P. Morgan Securities LLC, BofA Securities, Inc., Citigroup Global Markets Inc., and Fifth Third Securities, Inc. (which we refer to as the “Distribution Agreement”), as sales agents pursuant to which we may offer and sell shares of our common stock having an aggregate offering price of up to $100.0 million from time to time through any of the sales agents party thereto in “at-the-market” offerings, in accordance with the terms and conditions set forth in the Distribution Agreement. This Distribution Agreement, which superseded and replaced a prior similar distribution agreement, and was amended in July 2021 to acknowledge our filing of a new registration statement on Form S-3 registering the issuance and sale of shares of our common stock under the Distribution Agreement and replace Citigroup Global Markets Inc. with Wells Fargo Securities, LLC as a sales agent, had all $100 million available for sale as of December 31, 2021. The Distribution Agreement will remain in full force and effect until terminated by either party pursuant to the terms of the agreement or such date that the maximum offering amount has been sold in accordance with the terms of the agreement. We did not sell or issue any shares of our common stock during the years ended December 31, 2021 and 2020, respectively.
Stock Repurchase Program
On November 6, 2018, our Board of Directors authorized a stock repurchase program, under which we may repurchase up to 4,500,000 shares of our outstanding common stock. The shares may be repurchased from time to time in open market transactions at prevailing market prices, in privately negotiated transactions or by other means in accordance with federal securities laws. The actual manner, timing, amount and value of repurchases under the stock repurchase program will be determined by management at its discretion and will depend on a number of factors, including the market price of our common stock, trading volume, other capital management objectives and opportunities, applicable legal requirements, and general market and economic conditions.
We intend to finance any stock repurchases through available cash and our revolving credit facility. Repurchases also may be made under a trading plan under Rule 10b5-1 under the Securities Exchange Act of 1934, which would permit shares to be repurchased when we otherwise may be precluded from doing so because of self-imposed trading blackout periods or other regulatory restrictions. The stock repurchase program has no expiration date and may be extended, suspended or discontinued by our Board of Directors at any time without notice at our discretion. All shares of common stock repurchased under the program will be cancelled and returned to the status of authorized but unissued shares of common stock.
During the years ended December 31, 2021 and 2020, no shares were ablerepurchased under our stock share repurchase program. The maximum number of shares that may yet be purchased under the stock repurchase program as of December 31, 2021 is 3,812,939.
Dividends
On May 19, 2021, our Board of Directors approved the initiation of a quarterly cash dividend. The following table sets forth cash dividends declared by our Board of Directors to achieve increasesholders of record of our common stock during the year ended December 31, 2021 (in thousands, except per share information):
|
|
|
|
|
|
|
|
|
|
|
|
|
|
|
|
|
|
|
|
|
|
|
|
|
|
|
| Cash Dividends Declared |
Declaration Date |
| Record Date |
| Payable Date |
| Per Share |
| Amount |
May 19, 2021 |
| June 2, 2021 |
| June 16, 2021 |
| $ | 0.15 |
| $ | 5,064 |
August 18, 2021 |
| September 1, 2021 |
| September 15, 2021 |
| $ | 0.15 |
| $ | 5,064 |
November 10, 2021 |
| December 1, 2021 |
| December 15, 2021 |
| $ | 0.15 |
| $ | 5,064 |
The declaration and payment of future cash dividends on our common stock, whether at current levels or at all, are at the discretion of our Board of Directors and depend upon, among other things, our expected future earnings, cash flows, capital requirements, access to external financing, debt structure and any adjustments thereto, operational and financial investment strategy and general financial condition, as well as general business conditions.
Cash Flows—Year Ended December 31, 2021 Compared to the Year Ended December 31, 2020
For the years ended December 31, 2021 and 2020, the comparison of cash flows is as follows:
Our primary sources of cash flows from operations are from the sale of single-family attached and detached homes and mortgages. Our primary uses of cash flows from operations are the acquisition of land and expenditures associated with the construction of our single-family attached and detached homes and the origination of mortgages held for sale. Net cash used in operating activities was $201.2 million during the year ended December 31, 2021 as compared to net new home contracts, home deliveries, and average sales pricecash provided by operating activities of $340.6 million during 2020. The increase in cash used in operations is primarily a result of increased investment in our homebuilding inventories for the year ended December 31, 2016 of 21.4%, 17.7%, and 14.7%, respectively,2021 as compared to the year ended December 31, 2015. The increases2020, partially offset by a $292.3 million increase in net new home contracts, home deliveries and average sales price, along with our continued focus on cost control and investing in our infrastructure prudentlyincome during year ended December 31, 2021 as we expand, resulted in total revenue and net income of $994.4 million and $49.5 million, respectively, forcompared to the year ended December 31, 2016, which represented a 35.4% and 24.2% increase, respectively, over the year ended December 31, 2015. 2020.
During 2016, we also invested for future growth through (i) our entrance into the Utah and North Carolina markets, (ii) commencing our Financial Services operating segment through our indirect wholly-owned subsidiaries, Inspire and Parkway Title, and (iii) acquiring a 50% ownershipNet cash used in WJH. We also continued to expand our future pipeline of land positions as we increased our total lots owned and under control from 13,160 as of December 31, 2015 to 18,296 as of December 31, 2016.
The following table summarizes our results of operation for the years ended December 31, 2016 and 2015.
| | | | | | | | | | | | | | | | |
| | | | | | | | | | | | | | | | |
| | | | |
(in thousands, except per share amounts) | | Year Ended December 31, | | Increase (Decrease) | |
| | 2016 | | 2015 | | Amount | | % | |
| | | | | | | | | | |
Consolidated Statements of Operations: | | | | | | | | | | | | | | | | |
Revenue | | | | | | | | | | | | | | | | |
Homebuilding revenues | | | | | | | | | | | | | | | | |
Home sales revenues | | $ | 978,733 | | | $ | 725,437 | | | $ | 253,296 | | | 34.9 | % | |
Land sales and other revenue | | | 15,707 | | | | 9,052 | | | | 6,655 | | | 73.5 | % | |
| | | 994,440 | | | | 734,489 | | | | 259,951 | | | 35.4 | % | |
Financial services revenue | | | - | | | | - | | | | - | | | - | | |
Total revenue | | | 994,440 | | | | 734,489 | | | | 259,951 | | | 35.4 | % | |
Homebuilding Cost of Revenues | | | | | | | | | | | | | | | | |
Cost of home sales revenues | | | (786,127) | | | | (579,203) | | | | (206,924) | | | 35.7 | % | |
Cost of land sales and other revenues | | | (14,217) | | | | (8,432) | | | | (5,785) | | | 68.6 | % | |
| | | (800,344) | | | | (587,635) | | | | (212,709) | | | (36.2) | % | |
Financial services costs | | | - | | | | - | | | | - | | | - | | |
Selling, general, and administrative | | | (122,224) | | | | (87,840) | | | | (34,384) | | | 39.1 | % | |
Acquisition expense | | | (490) | | | | (491) | | | | 1 | | | (0.2) | % | |
Equity income of unconsolidated subsidiaries | | | 191 | | | | - | | | | 191 | | | NM | | |
Other income (expense) | | | 1,576 | | | | 1,782 | | | | (206) | | | (11.6) | % | |
Income before income tax expense | | | 73,149 | | | | 60,305 | | | | 12,844 | | | 21.3 | % | |
Income tax expense | | | (23,609) | | | | (20,415) | | | | (3,194) | | | 15.6 | % | |
Net income | | $ | 49,540 | | | $ | 39,890 | | | $ | 9,650 | | | 24.2 | % | |
Earnings per share: | | | | | | | | | | | | | | | | |
Basic | | $ | 2.34 | | | $ | 1.88 | | | $ | 0.46 | | | 24.5 | % | |
Diluted | | $ | 2.33 | | | $ | 1.88 | | | $ | 0.45 | | | 23.9 | % | |
Other Operating Information (dollars in thousands): | | | | | | | | | | | | | | | | |
Number of homes delivered | | | 2,825 | | | | 2,401 | | | | 424 | | | 17.7 | % | |
Average sales price of homes delivered | | $ | 346.5 | | | $ | 302.1 | | | $ | 44.4 | | | 14.7 | % | |
Homebuilding gross margin percentage | | | 19.7 | % | | | 20.2 | % | | | (0.5) | % | | (2.5) | % | |
Adjusted homebuilding gross margin excluding interest and purchase price accounting for acquired work in process inventory (1) | | | 21.7 | % | | | 21.9 | % | | | (0.2) | % | | (1.0) | % | |
Cancellation rate | | | 20 | % | | | 21 | % | | | (1) | % | | (4.8) | % | |
Backlog at end of period, number of homes | | | 749 | | | | 714 | | | | 35 | | | 4.9 | % | |
Backlog at end of period, aggregate sales value | | $ | 302,823 | | | $ | 271,138 | | | $ | 31,685 | | | 11.7 | % | |
Average sales price of homes in backlog | | $ | 404.3 | | | $ | 379.7 | | | $ | 24.6 | | | 6.5 | % | |
Net new home contracts | | | 2,860 | | | | 2,356 | | | | 504 | | | 21.4 | % | |
Selling communities at period end | | | 89 | | | | 88 | | | | 1 | | | 1.1 | % | |
Average selling communities | | | 89 | | | | 90 | | | | (1) | | | (1.1) | % | |
Total owned and controlled lot inventory | | | 18,296 | | | | 13,160 | | | | 5,136 | | | 39.0 | % | |
Adjusted EBITDA(1) | | $ | 100,343 | | $ | | 78,274 | | | $ | 22,069 | | | 28.2 | % | |
Adjusted income before income tax expense(1) | | $ | 74,028 | | $ | | 63,469 | | | $ | 10,559 | | | 16.6 | % | |
Adjusted net income(1) | | $ | 50,135 | | $ | | 41,255 | | | $ | 8,880 | | | 21.5 | % | |
Net debt to net capital(1) | | | 46.1 | % | | | 46.0 | % | | | 0.1 | % | | 0.2 | % | |
(1) Non-GAAP financial measure. | | | | | | | | | | | | | | | | |
Results of Operations by Segment
(dollars in thousands)
| | | | | | | | | | | | | | | | | | | | | | | | |
| | New Homes Delivered | | Average Sales Price of Homes Delivered | | Home Sales Revenues | | Income before Income Tax |
| | Year Ended December 31, | | Year Ended December 31, | | Year Ended December 31, | | Year Ended December 31, |
| | 2016 | | 2015 | | 2016 | | 2015 | | 2016 | | 2015 | | 2016 | | 2015 |
Mountain | | | 1,222 | | | 898 | | $ | 409.5 | | $ | 382.4 | | $ | 500,385 | | $ | 343,424 | | $ | 66,613 | | $ | 49,515 |
Texas | | | 338 | | | 329 | | $ | 400.0 | | $ | 342.9 | | | 135,207 | | | 112,825 | | | 2,686 | | | 4,260 |
Southeast | | | 1,265 | | | 1,174 | | $ | 271.3 | | $ | 229.3 | | | 343,141 | | | 269,188 | | | 31,138 | | | 23,574 |
Corporate | | | — | | | — | | $ | — | | $ | — | | | — | | | — | | | (27,288) | | | (17,044) |
Total | | | 2,825 | | | 2,401 | | $ | 346.5 | | $ | 302.1 | | $ | 978,733 | | $ | 725,437 | | $ | 73,149 | | $ | 60,305 |
Mountain
In our Mountain segment, for the year ended December 31, 2016, our income before income tax increased by $17.1investing activities was $6.5 million to $66.6 million, as compared to $49.5 million for the same period in 2015. This increase is related to an increase in the number of homes delivered and an increase in the average selling price of those homes in 2016.
Texas
In our Texas segment, for the year ended December 31, 2016, our income before income tax decreased by $1.6 million to $2.7 million, as compared $4.3 million for the same period in 2015. This decrease is related to an increase in the number of homes delivered and an increase in the gross margin of those homes sold year over year.
Southeast
In our Southeast segment, for the year ended December 31, 2016, our income before income tax increased by $7.6 million to $31.1 million, as compared to $23.6 million for the same period in 2015. This increase is related to an additional 91 home deliveries with an increase of $42.0 thousand in the average selling price during the year ended December 31, 2016, as2021, compared to $8.4 million used during 2020. The decrease was primarily related to the same period in 2015.
Corporate
Our corporate segment generated $27.3 million in lossproceeds from a secured note receivable during the year ended December 31, 2016 as compared to a loss of $17.02021.
Net cash provided by financing activities was $131.8 million for the same period in 2015. The increase in expenses was primarily attributed to the following: (1) an increase of $4.1 million in compensation related expenses, including non-cash expenses for share based payments, (2) an increase of $1.6 million in legal and insurance costs, and (3) and an increase of $1.0 million in information technology related expenses.
Homebuilding Gross Margin
Homebuilding gross margin represents home sales revenue less cost of home sales revenues. Our homebuilding gross margin percentage, which represents homebuilding gross margin divided by home sales revenues, decreased forduring the year ended December 31, 2016 to 19.7%, as2021, compared to 20.2% for$7.4 million during the year ended December 31, 2015. The decrease is primarily driven by higher interest expense in cost of sales as a result of higher debt balances outstanding in 2016 as compared to 2015.
In the following table, we calculate our gross margins adjusting for interest in cost of sales, and purchase price accounting for acquired work in process inventory. See “Critical Accounting Policies” below and Footnote 3 (Business Combinations) of our Consolidated Financial Statements for additional discussion regarding our methodology for estimating the fair value of acquired work in process inventory.
| | | | | | | | | | | | |
| | | | | | | | | | | | |
(dollars in thousands) | | Year Ended December 31, |
| | 2016 | | % | | 2015 | | % |
| | | | | | | | | | | | |
Home sales revenues | | $ | 978,733 | | 100.0 | % | | $ | 725,437 | | 100.0 | % |
Cost of home sales revenues | | | 786,127 | | 80.3 | % | | | 579,203 | | 79.8 | % |
Gross margin from home sales | | | 192,606 | | 19.7 | % | | | 146,234 | | 20.2 | % |
Add: Interest in cost of home sales revenues | | | 19,502 | | 2.0 | % | | | 10,082 | | 1.4 | % |
Adjusted homebuilding gross margin excluding interest (1) | | | 212,108 | | 21.7 | % | | | 156,316 | | 21.5 | % |
Add: Purchase price accounting for acquired work in process inventory | | | 389 | | 0.0 | % | | | 2,673 | | 0.4 | % |
Adjusted homebuilding gross margin excluding interest and purchase price accounting for acquired work in process inventory (1) | | $ | 212,497 | | 21.7 | % | | $ | 158,989 | | 21.9 | % |
(1) This non-GAAP financial measure should not be used as a substitute for the Company’s operating results in accordance with GAAP. An analysis of any non-GAAP financial measure should be used in conjunction with results presented in accordance with GAAP.
Excluding interest in cost of home sales and purchase price accounting, our adjusted homebuilding gross margin percentage was 21.7% for the year ended December 31, 2016, as compared to 21.9% for the year ended December 31, 2015. The nominal decrease in adjusted gross margin is attributed to a wider geographic mix of home deliveries in 2016 as compared to 2015. We believe the above information is meaningful as it isolates the impact that indebtedness and acquisitions have on homebuilding gross margin and allows for comparability of our gross margins to previous periods and our competitors.
Selling, General and Administrative Expense
| | | | | | | | | | | | | | | |
(dollars in thousands) | | | | | |
| | Year Ended December 31, | | Increase |
| | 2016 | | 2015 | | Amount | | % |
Selling, general and administrative | | $ | 122,224 | | | $ | 87,840 | | | $ | 34,384 | | | 39.1 | % |
As a percentage of homes sales revenue | | | 12.5 | % | | | 12.1 | % | | | | | | | |
Our selling, general and administrative costs increased $34.4 million for the year ended December 31, 2016 as compared to 2015. 2020. The increase was primarily attributable to 1) the following: (1) an increaseissuance of $10.6$500.0 million in compensation-related expenses, including incentive compensation,senior notes due 2029, offset by the extinguishment of our former senior notes due 2025 resulting largely from an increase in headcount, (2) an increasea payment of $10.5$411.8 million, net of interest and 2) a decrease of $68.7 million in commission expense to $39.4net payments under our revolving line of credit. The increase was partially offset by a $12.1 million for the year ended December 31, 2016, resulting from a 34.9% increasedecrease in home sales revenues, (3) an increase of $2.7 million related to advertising costs associated withnet proceeds on our increased number of homes delivered, (4) an increase of $1.2 million related to depreciationmortgage repurchase facilities and amortization as a result of an increased property plant and equipment balance year over year, (5) an increase of $3.4$15.2 million in legal costs, (6) an increase of $1.1 million in information technology expenses related to the growth of the Company, and (7) an increase of $4.9 million related to increases in rent, model expenses, other corporate expenses, and feasibility related costs.
Other Income (Expense)
Other income (expense) remained relatively consistent at $1.6 million and $1.8 million for the years ended December 31, 2016 and 2015, respectively.
Income Tax Expense
Our income tax expense for the year ended December 31, 2016 was $23.6 million, as compared to $20.4 million for the year ended December 31, 2015. Our income tax expense for the year ended December 31, 2016 results in an effective tax rate of 32.3%, as compared to an effective tax rate of 33.8% for the year ended December 31, 2015. Our effective tax rate is driven by our blended federal and state statutory rate of 37.4%. Our blended federal and state statutory tax rate is reflective of the states in which we operate, including Nevada and Texas, which generally do not have corporate income tax. Our blended federal and state statutory tax rate is partially offset by
benefits from additional deductions for domestic production activities and federal energy credits allowed for under the Internal Revenue Code.
Segment Assets
| | | | | | | | | | | | |
| | December 31, | | December 31, | | | Increase (Decrease) |
| | 2016 | | 2015 | | | Amount | | Change |
Mountain | | $ | 541,657 | | $ | 533,862 | | | 7,795 | | 1.5 | % |
Texas | | | 138,392 | | | 168,571 | | | (30,179) | | (17.9) | % |
Southeast | | | 262,448 | | | 185,331 | | | 77,117 | | 41.6 | % |
Corporate | | | 65,031 | | | 29,977 | | | 35,054 | | 116.9 | % |
Total assets | | $ | 1,007,528 | | $ | 917,741 | | $ | 89,787 | | 9.8 | % |
| | | | | | | | | | | | | | | | | | | | | |
Lots owned | | December 31, 2016 | | December 31, 2015 | | % Change | |
and controlled | | Owned | | Controlled | | Total | | Owned | | Controlled | | Total | | Owned | | Controlled | | Total |
Mountain | | 4,354 | | 2,959 | | 7,313 | | 4,835 | | 1,022 | | 5,857 | | (9.9) | % | | 189.5 | % | | 24.9 | % |
Texas | | 1,356 | | 3,420 | | 4,776 | | 1,493 | | 568 | | 2,061 | | (9.2) | % | | 502.1 | % | | 131.7 | % |
Southeast | | 2,953 | | 3,254 | | 6,207 | | 2,667 | | 2,575 | | 5,242 | | 10.7 | % | | 26.4 | % | | 18.4 | % |
Total | | 8,663 | | 9,633 | | 18,296 | | 8,995 | | 4,165 | | 13,160 | | (3.7) | % | | 131.3 | % | | 39.0 | % |
Of our total lots owned and controlled as of December 31, 2016, 47.3% were owned and 52.7% were controlled, as compared to 68.4% owned and 31.6% controlled as of December 31, 2015.
Total assets increased by $89.8 million, or 9.8%, to $1.0 billion at December 31, 2016. The increase is primarily driven by increased investments in our Southeast and Mountain segments as well as our entrance into the Utah market (Mountain segment) and our purchase of lots in the Charlotte, North Carolina market (Southeast segment).
Other Homebuilding Operating Data
| | | | | | | | | |
| | Year Ended | | | | | |
Net new home contracts | | December 31, | | Increase |
| | 2016 | | 2015 | | Amount | | % Change |
Mountain | | 1,260 | | 938 | | 322 | | 34.3 | % |
Texas | | 349 | | 284 | | 65 | | 22.9 | % |
Southeast | | 1,251 | | 1,134 | | 117 | | 10.3 | % |
Total | | 2,860 | | 2,356 | | 504 | | 21.4 | % |
Net new home contracts (new home contracts net of cancellations) for the year ended December 31, 2016 increased by 504 homes, or 21.4%, to 2,860, as compared to 2,356 for the year ended December 31, 2015. The increase in our net new home contracts was driven by overall positive market conditions in the markets in which we operate.
Our overall monthly “absorption rate” (the rate at which home orders are contracted, net of cancelations) for the years ended December 31, 2016 and 2015 by segment are included in the table below:
| | | | | | | | | |
| | December 31, | | Increase |
| | 2016 | | 2015 | | Amount | | % Change |
Mountain | | 3.0 | | 2.4 | | 0.6 | | 25.0 | % |
Texas | | 1.3 | | 1.0 | | 0.3 | | 30.0 | % |
Southeast | | 3.4 | | 3.2 | | 0.2 | | 6.3 | % |
Total | | 2.7 | | 2.4 | | 0.3 | | 12.5 | % |
Our absorption rate increased by 12.5% to 2.7 per monthdividend payments during the year ended December 31, 2016, as compared to 2.4 per month for the same period in 2015. The increase in absorption rate is attributable to the strong homebuilding environment as a result2021.
As of positive economic trends in most of our markets.
| | | | | | | | | | |
Selling communities at period end | | As of December 31, | | | Increase/(Decrease) |
| | 2016 | | 2015 | | | Amount | | % Change |
Mountain | | 35 | | 32 | | | 3 | | 9.4 | % |
Texas | | 23 | | 23 | | | — | | — | % |
Southeast | | 31 | | 33 | | | (2) | | (6.1) | % |
Total | | 89 | | 88 | | | 1 | | 1.1 | % |
Our selling communities increased by one community to 89 communities at December 31, 2016,2021, our cash and cash and equivalents and restricted cash was $322.2 million.
Supplemental Guarantor Information
Our 6.750% senior notes due 2027 (which we collectively refer to as comparedour “2027 Notes”) and our 3.875% senior notes due 2029 (which we collectively refer to 88 communities at December 31, 2015.
| | | | | | | | | | | | | | | | | | | | | | | | | |
| | As of December 31, | | | | | | | | | |
Backlog | | 2016 | | 2015 | | % Change | |
| | Homes | | Dollar Value | | Average Sales Price | | Homes | | Dollar Value | | Average Sales Price | | Homes | | Dollar Value | | Average Sales Price |
Mountain | | 329 | | | 148,298 | | | 450.8 | | 291 | | | 133,876 | | | 460.1 | | 13.1 | % | | 10.8 | % | | (2.0) | % |
Texas | | 151 | | | 72,423 | | | 479.6 | | 140 | | | 63,013 | | | 450.1 | | 7.9 | % | | 14.9 | % | | 6.6 | % |
Southeast | | 269 | | | 82,102 | | | 305.2 | | 283 | | | 74,249 | | | 262.4 | | (4.9) | % | | 10.6 | % | | 16.3 | % |
Total / Weighted Average | | 749 | | $ | 302,823 | | $ | 404.3 | | 714 | | $ | 271,138 | | $ | 379.7 | | 4.9 | % | | 11.7 | % | | 6.5 | % |
Backlog reflectsas our “2029 Notes” and together with the number of homes, net of actual cancellations experienced during2027 Notes, the period, for which we have entered into a sales contract with a customer but for which we have not yet delivered the home. At December 31, 2016, we had 749 homes in backlog with a total value of $302.8 million, which represents“Senior Notes”) are our unsecured senior obligations and are fully and unconditionally guaranteed on an increase of 4.9%unsecured basis, jointly and 11.7%, respectively, as compared to December 31, 2015. The increase in backlog and backlog value is primarily attributable to the increase in the demand for new homes in the markets in which we operate. The increase in average sales price of homes in backlog is drivenseverally, by increases acrosssubstantially all of our direct and indirect wholly-owned operating segments,subsidiaries (which we refer to collectively as “Guarantors”). In addition, our former 5.875% senior notes due 2025 (which we collectively refer to as our “2025 Notes”), which were extinguished during the year ended December 31, 2021, were our unsecured senior obligations and were fully and unconditionally guaranteed on an unsecured basis, jointly and severally, by the Guarantors. Our subsidiaries associated with our Financial Services operations (referred to as “Non-Guarantors”) do not guarantee the Senior Notes. The guarantees are senior unsecured obligations of the Guarantors that rank equal with all existing and future senior debt of the Guarantors and senior to all subordinated debt of the Guarantors. The guarantees are effectively subordinated to any secured debt of the Guarantors. As of December 31, 2021, Century Communities, Inc. had outstanding $1.0 billion in total principal amount of Senior Notes.
Each of the indentures governing our Senior Notes provides that the guarantees of a Guarantor will be automatically and unconditionally released and discharged: (1) upon any sale, transfer, exchange or other disposition (by merger, consolidation or otherwise) of all of the equity interests of such Guarantor after which the applicable Guarantor is no longer a “Restricted Subsidiary” (as defined in the respective indentures), which sale, transfer, exchange or other disposition does not constitute an “Asset Sale” (as defined in the respective indentures) or is made in compliance with applicable provisions of the applicable indenture; (2) upon any sale, transfer, exchange or other disposition (by merger, consolidation or otherwise) of all of the assets of such Guarantor, which sale, transfer, exchange or other disposition does not constitute an Asset Sale or is made in compliance with applicable provisions of the applicable indenture; provided, that after such sale, transfer, exchange or other disposition, such Guarantor is an “Immaterial Subsidiary” (as defined in the respective indentures); (3) unless a default has occurred and is continuing, upon the release or discharge of such Guarantor from its guarantee of any indebtedness for borrowed money of the Company and the Guarantors so long as such Guarantor would not then otherwise be required to provide a guarantee pursuant to the applicable indenture; provided that if such Guarantor has incurred any indebtedness in reliance on its status as a resultGuarantor in compliance with applicable provisions of pricing strength duethe applicable Indenture, such Guarantor’s obligations under such indebtedness, as the case may be, so incurred are satisfied in full and discharged or are otherwise permitted to positive market trendsbe incurred by a Restricted Subsidiary (other than a Guarantor) in compliance with applicable provisions of the applicable Indenture; (4) upon the designation of such Guarantor as an “Unrestricted Subsidiary” (as defined in the respective Indentures), in accordance with the applicable indenture; (5) if the Company exercises its legal defeasance option or covenant defeasance option under the applicable indenture or if the obligations of the Company and the Guarantors are discharged in compliance with applicable provisions of the applicable indenture, upon such exercise or discharge; or (6) in connection with the dissolution of such Guarantor under applicable law in accordance with the applicable indenture. The indenture governing our former 2025 Notes contained a similar provision.
If a guarantor were to become a debtor in a case under the US Bankruptcy Code, a court may decline to enforce its guarantee of the Senior Notes. This may occur when, among other factors, it is found that the guarantor originally received less than fair consideration for the guarantee and the guarantor would be rendered insolvent by enforcement of the guarantee. On the basis of historical financial information, operating history and other factors, we believe that each of the guarantors, after giving effect to the issuance of its guarantee of the Senior Notes when the guarantee was issued, was not insolvent and did not and has not incurred debts beyond its ability to pay such debts as they mature. The Company cannot predict, however, what standard a court would apply in making these determinations or that a court would agree with our conclusions in this regard.
Only the 2027 Notes and the related guarantees are, and the former 2025 Notes and the related guarantees were, registered securities under the Securities Act of 1933, as amended (the “Securities Act”). The offer and sale of the 2029 Notes and the related guarantees were not and will not be registered under the Securities Act or the securities laws of any other jurisdiction and instead were issued in reliance upon an exemption from such registration. Unless they are subsequently registered under the Securities Act, neither the 2029 Notes nor the related guarantees may be offered and sold only in transactions that are exempt from the registration requirements under the Securities Act and the applicable securities laws of any other jurisdiction.
As the guarantees for the 2027 Notes and the guarantees for the former 2025 Notes were made in connection with the issuance of the
2027 Notes and former 2025 Notes and exchange offers effected under the Securities Act in February 2015, October 2015 and April 2017, the Guarantors’ condensed supplemental financial information is presented in this report as if the guarantees existed during the periods presented pursuant to applicable SEC rules and guidance. If any Guarantors are released from the guarantees in future periods, the changes are reflected prospectively. We have determined that separate, full financial statements of the Guarantors would not be material to investors, and accordingly, supplemental financial information is presented below.
On March 2, 2020, the SEC adopted amendments to Rules 3-10 and 3-16 of Regulation S-X, under Rule Release No. 33-10762, Financial Disclosures about Guarantors and Issuers of Guaranteed Securities and Affiliates Whose Securities Collateralize a Registrant’s Securities (“Rule 33-10762”), that reduce and simplify the financial disclosure requirements applicable to registered debt offerings for guarantors and issuers of guaranteed securities (which we previously included within the notes to our consolidated financial statements in our Annual Reports on Form 10-K and Quarterly Reports on Form 10-Q). The amendments under Rule 33-10762 were effective January 4, 2021, but voluntary compliance was permitted in advance of the effective date. We adopted the new disclosure requirements permitted under Rule 33-10762, beginning with the three and six month period ended June 30, 2020.
The following summarized financial information is presented for Century Communities, Inc. and the Guarantor Subsidiaries on a combined basis after eliminating intercompany transactions and balances among Century Communities, Inc. and the Guarantor Subsidiaries, as well as product mix towards higher priced communities. their investment in, and equity in earnings from Non-Guarantor Subsidiaries.
|
|
|
|
Summarized Balance Sheet Data (in thousands) |
| December 31, 2021 |
|
|
|
|
Assets |
|
|
|
Cash and cash equivalents |
| $ | 180,843 |
Cash held in escrow |
|
| 52,297 |
Accounts receivable |
|
| 39,492 |
Inventories |
|
| 2,456,614 |
Prepaid expenses and other assets |
|
| 160,999 |
Property and equipment, net |
|
| 24,220 |
Deferred tax assets, net |
|
| 21,239 |
Goodwill |
|
| 30,395 |
Total assets |
| $ | 2,966,099 |
Liabilities and stockholders’ equity |
|
|
|
Liabilities: |
|
|
|
Accounts payable |
| $ | 82,734 |
Accrued expenses and other liabilities |
|
| 288,229 |
Notes payable |
|
| 998,936 |
Revolving line of credit |
|
| — |
Total liabilities |
|
| 1,369,899 |
Stockholders’ equity: |
|
| 1,596,200 |
Total liabilities and stockholders’ equity |
| $ | 2,966,099 |
|
|
|
|
Summarized Statement of Operations Data (in thousands) |
| Year Ended December 31, 2021 |
|
|
|
|
Total homebuilding revenues |
| $ | 4,092,576 |
Total homebuilding cost of revenues |
|
| (3,095,363) |
Selling, general and administrative |
|
| (389,610) |
Loss on debt extinguishment |
|
| (14,458) |
Inventory impairment and other |
|
| (41) |
Other income (expense) |
|
| (3,307) |
Income before income tax expense |
|
| 589,797 |
Income tax expense |
|
| (131,201) |
Net income |
| $ | 458,596 |
Critical Accounting Policies
Critical accounting estimates are those that we believe are both significant and that require us to make difficult, subjective or complex judgments, often because we need to estimate the effect of inherently uncertain matters. We base our estimates and judgments on historical experiences and various other factors that we believe to be appropriate under the circumstances. Actual results may differ from these estimates, and the estimates included in our financial statements might be impacted if we used different assumptions or conditions. Our management believes that the following accounting policies are among the most important to the portrayal of our financial condition and results of operations and require among the most difficult, subjective or complex judgments:
Revenue Recognition
RevenuesUnder Accounting Standards Codification (which we refer to as “ASC”) 606, revenues from home sales and the related profit are recorded and a profit is recognizedwhen our performance obligations are satisfied, which generally occurs when the respective unitshomes are closed and title has passed to our homebuyers. We generally satisfy our performance obligations in less than one year from the homeowner’s initial and continuing investmentcontract date. Proceeds from home closings that are held for our benefit in escrow, are presented as cash held in escrow on our consolidated balance sheets. Cash held for our benefit in escrow is adequate, and other attributes of ownership have been transferred totypically held by the homeowner. Sales incentives are recorded asescrow agent for less than a reduction of revenues when the respective unit is closed.few days. When it is determined that the earnings process is not complete and we have remaining performance obligations that are material in the sale andcontext of the contract, the related profitrevenue and costs are deferred for recognition in future periods.
We also serveperiods until those performance obligations have been satisfied. Prior to satisfying our performance obligations, we typically receive deposits from customers related to sold but undelivered homes. These deposits are classified as the general contractor for custom homesearnest money deposits and are included in our Texas segment, where the customeraccrued expenses and not the Company owns the underlying land (Build on Your Own Lot Contracts). Accordingly, we recognize revenue for the Build on Your Own Lot Contracts, which are primarily cost plus contracts, on the percentage-of-completion method where progress toward completion is measured by relating the actual cost of work performed to date to the current estimated total cost of the respective contracts. As the Company makes such estimates, judgments are required to evaluate potential variances in the cost of materials and labor and productivity.
In August 2015, the Financial Accounting Standards Board (which we refer to as “FASB”) issued ASU 2015-14, “Revenue from Contracts with Customers (ASC 606).” ASU 2015-14 defers the effective date of ASU No. 2014-09, “Revenue from Contracts with
Customers (Topic 606)” and will be effective for the Company beginning on January 1, 2018, including interim reporting periods within that period. Early adoption is permitted as of annual reporting periods beginning after December 15, 2016. We plan to adopt ASU 2015-14 on January 1, 2018 under the modified retrospective approach.
We are substantially complete with our evaluation of the impactother liabilities on our consolidated financial statements of adopting ASU 2015-14. We have evaluated contracts in each of our revenue streams in our reportable segmentsbalance sheets. Earnest money deposits totaled $56.8 million and have determined that there will not be a material impact on the amount or timing of recording home sales revenues$30.6 million at December 31, 2021 and related costs of home sales revenues as a result of adopting ASU 2015-14. While the adoption of ASU 2015-14 will not result in a material impact to our consolidated financial statements, it will impact the following:December 31, 2020, respectively.
| ·
| | Certain costs incurred related to our model homes, which were previously capitalized to inventory, will now be expensed as incurred.
|
| ·
| | Forfeited customer earnest money deposits which are currently presented in other income within the Consolidated Statement of Operations will be presented as other revenue.
|
| ·
| | Land sales to third parties which do not meet the definition of a customer in ASC 606, will be classified as other income in our Consolidated Statement of Operations.
|
| ·
| | Deferral of an allocated amount of revenue and costs associated with unsatisfied performance obligations, primarily the installation of landscaping, at the time of home delivery.
|
| ·
| | Reclassification of certain costs related to our model homes from inventory to property and equipment on our Consolidated Balance Sheet.
|
Under the modified retrospective approach, we anticipate recording an opening adjustment to decrease retained earnings related to model homes costs that were previously capitalized to inventory, but would have been expensed as incurred under ASU 2015-14.
Inventories and Cost of Sales
We capitalize pre-acquisition, land, development, and other allocated costs, including interest, during periods of entitlement, development and home construction.
Land, development, and other common costs are allocated to inventory using the relative-sales-value method; however, as lots within a project typically have comparable market values, we generally allocate land, development, and common costs equally to each lot within the project. Home construction costs are recorded using the specific-identification method. Cost of sales for homes closed includes the allocation of construction costs of each home and all applicable land acquisition, land development, and related common costs, both incurred and estimated to be incurred. Changes to estimated total development costs subsequent to initial home closings in a community are generally allocated to the remaining homes in the community.
When a home is closed, the Company generally has not paid all incurred costs necessary to complete the home, and a liability and a charge to cost of home sales revenues are recorded for the amount that is estimated will ultimately be paid related to completed homes.
Impairment of Real Estate Inventories
We review all of our communities for an indicator of impairment and record an impairment loss when conditions exist where the carrying amount of inventory is not recoverable and exceeds its fair value. Indicators of impairment include, but are not limited to, significant decreases in local housing market values and selling prices of comparable homes, significant decreases to gross margins and sales absorption rates, costs in excess of budget, and actual or projected cash flow losses. We prepare and analyze cash flows at the lowest level for which there is identifiable cash flows that are independent of the cash flows of other groups of assets, which we have determined as the community level.
If events or circumstances indicate that the carrying amount may be impaired, such impairment will be measured based upon the difference between the carrying amount and the fair value of such assets determined using the estimated future discounted cash flows,
excluding interest charges, generated from the use and ultimate disposition of the respective inventories. Such losses, if any, are reported within costs of sales. The discount rate used in determining each asset’s fair value reflects inherent risks associated with the related estimated cash flows, as well as current risk-free rates available in the market and estimated market risk premiums. We have utilized a discount rate of approximately 12% in our valuations.
When estimating undiscounted cash flows, we make various assumptions, including the following: the expected sales prices and sales incentives to be offered, including the number of homes available, pricing and incentives offered by us or other builders in other communities, and future sales pricesprice adjustments based on market and economic trends; the costs incurred to date and expected to be incurred including, but not limited to, land and land development costs, home construction costs, interest costs, indirect construction,
and selling and marketing costs; any alternative product offerings that may be offered that could have an impact on sales, sales prices and/or building costs; and alternative uses for the property.
For the years ended December 31, 2017, 2016,2021 and 2015,2020, the following table shows the number of communities for which we identified an indicator of impairment and therefore tested for whether an impairment existed, compared to the total number of communities that existed during such period.
| | | | |
| | | | |
| | Number of Communities Tested for Impairment | | Total Number of Existing Communities |
Year ended December 31, 2017 | | 12 | | 119 |
Year ended December 31, 2016 | | 4 | | 89 |
Year ended December 31, 2015 | | — | | 88 |
|
|
|
|
|
|
| Number of Communities Tested for Impairment |
| Total Number of Existing Communities |
Year ended December 31, 2021 |
| 7 |
| 202 |
Year ended December 31, 2020 |
| 13 |
| 198 |
For the year ended December 31, 2017,2021, we recorded nominal impairment charges on one community. During the year ended December 31, 2020, we recorded impairment charges on fivefour communities totaling $0.8$2.2 million. The impairment charges are included in “Cost of home sales revenues”inventory impairment and other in our Consolidated Statementconsolidated statement of Operations. For the years ended December 31, 2016 and 2015, no inventory impairments were recorded. operations.
Warranties
We evaluate our investment in unconsolidated subsidiaries for impairment whenever events or changes in circumstances indicate that there may be an other-than-temporary decline in value. To do so, we calculate the estimated fair value of the investment using a market, income or replacement cost approach, or combination thereof. The amount of impairment recognized, if any, would be the excess of the investment’s carrying amount over its estimated fair value. We consider various factors to determine if a decline in the value of the investment is other-than-temporary. These factors are Level 2 and 3 inputs and include but are not limited to, age of the venture, our intent and ability to retain our investment in the entity, the financial condition and long-term prospects of the entity, expected term of the investment, and the relationships with our partners. If we believe that the decline in the fair value is temporary, no impairment is recorded. The aforementioned factors are taken as a whole by management in determining the valuation of our investment. Should the actual results differ from management’s estimates, the valuation could be negatively affected and may result in a negative impact on the consolidated financial statements.
Warranties
Estimated future direct warranty costs are accrued and charged to cost of sales in the period when the related homebuilding revenues are recognized. Amounts accrued, which are included in accrued expenses and other liabilities on the Consolidated Balance Sheet,consolidated balance sheet, are based upon historical experience rates. We subsequently assess the adequacy of our warranty accrual on a quarterly basis through an internally developed analysis that incorporates historical payment trends and adjust the amounts recorded if necessary.
Mortgage Loans Held for Sale and Revenue Recognition
Mortgage loans held for sale, including the rights to service the mortgage loans, mortgage loans in process for which interest rates were committed to the borrowers (referred to as “interest rate lock commitments”), as well as the derivative instruments used to economically hedge our interest rate risk, which are typically forward commitments on mortgage-backed securities and interest rate lock commitments, are carried at fair value. Changes in fair value are reflected in financial services revenue on the consolidated statement of operations. Management believes carrying loans held for sale at fair value improves financial reporting by mitigating volatility in reported earnings caused by measuring the fair value of the loans and the derivative instruments used to economically hedge them.
Also included in financial services revenue are gains and losses from the sale of mortgage loans held for sale, that are recognized based upon the difference between the sales proceeds and carrying value of the related loans upon sale, and loan origination fees. Loan origination fees represent revenue earned from originating mortgage loans which generally represent a flat per loan fee based on a percentage of the original principal loan balance and are recognized at the time the mortgage loans are funded.
Stock-Based Compensation
We estimate the grant date fair value of stock-based compensation awards and recognize the fair value as compensation costs over the requisite service period, which is generally three years, for all awards that vest.We value the fair value of our restricted stock units and awards and restrictedin the form of unrestricted shares of common stock units equal to the closing price of our common stock on the New York Stock Exchange on the date of grant. Stock-based compensation expense associated with outstanding performance share units is measured using the grant date fair value and is based on the estimated achievement of the established performance criteria at the end of each reporting period until the performance period ends, recognized on a straight-line basis over the performance period. Stock-based compensation expense is only recognized for performance share units that we expect to vest, which we estimate based upon an assessment of the probability that the performance criteria will be achieved. The performance share units granted during the fiscal years ended December 31, 2021 and 2020 have three-year performance-based metrics measured over performance periods ending on December 31 for each three-year period. Stock-based compensation expense associated with outstanding performance share units is
updated for actual forfeitures.
Income Taxes
We account for income taxes in accordance with ASC 740, Income Taxes, which requires recognition of deferred tax assets and liabilities at enacted income tax rates for the temporary differences between the financial reporting bases and the tax bases of its assets and liabilities. Any effects of changes in income tax rates or tax laws are included in the provision for income taxes in the period of enactment. When it is more likely than not that a portion or all of a deferred tax asset will not be realized in the future, we provide a corresponding valuation allowance against the deferred tax asset. In addition, when it is more likely than not that a tax position will be sustained upon examination by a tax authority that has full knowledge of all relevant information, we measure the amount of tax benefit from the position and record the largest amount of tax benefit that is more likely than not of being realized after settlement with a tax authority. Our policy is to recognize interest to be paid on an underpayment of income taxes in interest expense and any related statutory penalties in the provision for income taxes on our Consolidated Statementconsolidated statements of Operations. operations.
Goodwill
On December 22, 2017, the Tax Cuts and Jobs Act (which we refer to as the “TCJA”) was signed into law. The TCJA significantly reforms the Internal Revenue Code of 1986, as amended. The TCJA, among other things, contains significant changes to corporate taxation, including reduction of the corporate tax rate, commencing in 2018, from a top marginal rate of 35% to a flat rate of 21%, limitation of the tax deduction for interest expense to 30% of adjusted earnings (except for certain small businesses), limitation of the deduction for net operating losses to 80% of current year taxable income, elimination of net operating loss carrybacks, one time taxation
of offshore earnings at reduced rates regardless of whether they are repatriated, immediate deductions for certain new investments instead of deductions for depreciation expense over time, and modifying or repealing many business deductions and credits.
Also on December 22, 2017, the SEC staff issued Staff Accounting Bulletin No. 118 (SAB 118) which addresses the application of ASC Topic 740 to the TCJA. SAB 118 outlines that if the accounting for the effects of the TCJA is incomplete, but a reasonable estimate can be made, then provisional amounts should be reflected in the financial statements.
Our accounting for the impacts of the TCJA related to current and deferred taxes, and in particular related to our acquisitions of UCP and Sundquist Homes, remain incomplete as of the date of these financial statements. Accordingly, we remeasured our deferred tax assets and liabilities based on the rates at which they are expected to reverse in the future, which is generally our estimated blended state and federal statutory rate in future periods of approximately 24%. This remeasurement resulted in a provisional reduction to our deferred tax assets of $2.8 million. This reduction is reflected in “Income tax expense” in our Consolidated Statement of Operations.
We anticipate that our accounting for the TCJA will be finalized upon the completion of our analysis of our tax basis in UCP, Inc., including refining certain calculations associated with UCP’s distributive share of its investment in UCP, LLC at the acquisition date of August 4, 2017 in accordance with I.R.C. §704(c). Additionally, we are still reviewing certain items related to the TCJA and refining our calculations. The resolution of these items could potentially affect the measurement of our provisional reduction to our deferred tax asset.
Goodwill
We evaluate goodwill for possible impairment in accordance with Accounting Standards Codification (which we refer to as “ASC”) TopicASC 350, Intangibles–Goodwill and Other,, on an annual basis, or more frequently if events or changes in circumstances indicate that the carrying amount of such assets may not be recoverable. We use a threetwo step process to assess whether or not goodwill can be realized. The first step is a qualitative assessment that analyzes current economic indicators associated with a particular reporting unit. For example, we analyze changes in economic, market and industry conditions, business strategy, cost factors, and financial performance, among others, to determine if there would be a significant decline to the fair value of a particular reporting unit. If the qualitative assessment indicates a stable or improved fair value, no further testing is required.
If a qualitative assessment indicates that a significant decline to fair value of a reporting unit is more likely than not, or if a reporting unit’s fair value has historically been closer to its carrying value, we will proceed to the second step where we calculate the fair value of a reporting unit based on discounted future cash flows. If this step indicates that the carrying value of a reporting unit is in excess of its fair value, we will proceedan impairment loss shall be recognized in an amount equal to that excess, limited to the third step where the fair value of the reporting unit will be allocated to assets and liabilities as they would in a business combination. Impairment occurs when the carryingtotal amount of goodwill exceeds its estimated fair value calculated in the third step.allocated to that reporting unit.
Business Combinations
We account for business combinations in accordance with ASC Topic 850, Business Combinations, if the acquired assets assumed and liabilities incurred constitute a business. We consider acquired companies to constitute a business if the acquired net assets and processes have the ability to create outputs in the form of revenue. For acquired companies constituting a business, we recognize the identifiable assets acquired and liabilities assumed at their acquisition-date fair values and recognize any excess of total consideration paid over the fair value of the identifiable assets as goodwill.
The estimated fair value of the acquired assets and assumed liabilities requires significant judgments by management which are outlined below:
Inventories
The fair value of acquired inventories largely depends on the stage of production of the acquired land and work in process inventory. For acquired land inventory, we typically utilize, with the assistance of a third party appraiser, a forecasted cash flow approach for the development, marketing, and sale of each community acquired. Significant assumptions included in our estimates include future per lot development costs, construction and overhead costs, mix of products sold in each community, as well as average sales price. For work in process inventories, we estimate the fair value based upon the stage of production of each unit and a gross margin that we believe a
market participant would require to complete the remaining development and requisite selling efforts. For the acquisitions that
Non-GAAP Financial Measures
In this Form 10-K, we completed in 2017, we estimated a market participant would require a gross margin ranging from 6%use certain non-GAAP financial measures, including EBITDA, Adjusted EBITDA, net homebuilding debt to 22%.
Liquiditynet capital, and Capital Resources
Overview
Our principal uses of capital for the year ended December 31, 2017 were the acquisition of UCPadjusted net income and Sundquist Homes, as well as for regular land purchases, land development, home construction, investment in unconsolidated subsidiaries and the payment of routine liabilities. We used funds generated by operations, common stock issuances, and available borrowings under our Revolving Credit Facility to meet our short-term working capital requirements.
Cash flows for each of our communities depend on the stage in the development cycle, and can differ substantially from reported earnings. Early stages of development or expansion require significant cash outlays for land acquisitions, entitlements and other approvals, and construction of model homes, roads, utilities, general landscaping and other amenities. Because these costsadjusted earnings per diluted share. These non-GAAP financial measures are a component of our inventory and not recognized in our statement of operations until a home closes, we incur significant cash outlays prior to our recognition of earnings. In the later stages of community development, cash inflows may significantly exceed earnings reported for financial statement purposes, as the cash outflow associated with home and land construction was previously incurred. From a liquidity standpoint, we are currently actively acquiring and developing lots in our markets to maintain and grow our lot supply and active selling communities that are strategically located in our core markets. As we continue to expand our business, our cash outlays for land purchases and land development to grow our lot inventory have begun to exceed our cash generated by operations.
Covenant Compliance
On October 21, 2014, we entered into a credit agreement with Texas Capital Bank, National Association, as Administrative Agent and L/C Issuer, and the lenders from time to time party thereto (which we refer to as the “Credit Agreement”). The Credit Agreement provides the Company with a revolving line of credit (which we refer to as the “Revolving Credit Facility”) of up to $120 million. Under the terms of the Credit Agreement, we are entitled to request an increase in the size of the Revolving Credit Facility by an amount not exceeding $80 million. If the existing lenders elect notpresented to provide the full amount of a requested increase, we may invite one or more other lender(s)investors additional information to become a party to the Credit Agreement, subject to the approval of the Administrative Agent and L/C Issuer. The Credit Agreement includes a letter of credit sublimit of $20 million. The obligations under the Revolving Credit Facility are guaranteed by certain of our subsidiaries.
On July 31, 2015, we entered into a First Modification Agreement with Texas Capital Bank, National Association, as Administrative Agent, the lenders party thereto, and our subsidiary guarantors party thereto, which modified the Credit Agreement. The First Modification Agreement, among other things, (i) increased the Revolving Credit Facility from $120 million to $200 million, (ii) extended the maturity date of the Revolving Credit Facility from October 21, 2017 to October 21, 2018, (iii) admitted Bank of America, N.A. as a new lender under the Revolving Credit Facility, and (iv) increased the amount of the Company’s option to request, from time to time, an increase in the size of the Revolving Credit Facility, from an amount not exceeding $80 million to an amount not exceeding $100 million, subject to the terms and conditions of the First Modification Agreement and the Credit Agreement.
On December 22, 2015, we entered into a Second Modification Agreement with Texas Capital Bank, National Association, as Administrative Agent, the lenders party thereto, and our subsidiary guarantors party thereto, which modified the Credit Agreement. The Second Modification Agreement, among other things, (i) increased the Revolving Credit Facility from $200 million to $300 million, and (ii) admitted Compass Bank, an Alabama Banking Corporation, and U.S. Bank National Association as new lenders under the Revolving Credit Facility.
On August 19, 2016, we entered into a Third Modification Agreement with Texas Capital Bank, National Association, as Administrative Agent, the lenders party thereto, and our subsidiary guarantors party thereto, which further modified the Credit Agreement. The Third Modification Agreement, among other things, (i) increased the Revolving Credit Facility from $300 million to $380 million through our exercise of $80 million of the accordion feature of the Credit Agreement, (ii) admitted Citibank, N.A. and Flagstar Bank, FSB as new lenders under the Revolving Credit Facility, (iii) increased certain lenders’ respective commitments to the Revolving Credit Facility, and (iv) extended the maturity date of the Revolving Credit Facility by one year to mature on October 21, 2019.
On February 24, 2017, we entered into a Commitment Increase Agreement with Texas Capital Bank, National Association, as Administrative Agent, Flagstar Bank, FSB (which we refer to as “Flagstar”), and our subsidiary guarantors party thereto. The Commitment Increase Agreement supplements the Credit Agreement, and (i) increased the Revolving Credit Facility from $380 million
to $400 million through our exercise of the remaining $20 million of the accordion feature of the Credit Agreement, and (ii) increased Flagstar’s commitment to the Credit Facility.
Unless terminated earlier, the principal amount under the Revolving Credit Facility, together with all accrued unpaid interest and other amounts owing thereunder, if any, will be payable in full on October 21, 2019, the maturity date of the Revolving Credit Facility. Borrowings under the Revolving Credit Facility bear interest at a floating rate equal to the London Interbank Offered Rate plus an applicable margin between 2.75% and 3.25% per annum, or, in the Administrative Agent’s discretion, a base rate plus an applicable margin between 1.75% and 2.25% per annum. The “applicable margins” described above are determined by a schedule based on our leverage ratio, as defined in the Credit Agreement. The Credit Agreement also provides for fronting fees and letter of credit fees payable to the L/C Issuer and commitment fees payable to the Administrative Agent equal to 0.20% of the unused portion of the Revolving Credit Facility.
The Credit Agreement contains customary affirmative and negative covenants (including limitations on the Company’s ability to grant liens, incur additional debt, pay dividends, redeem its common stock, make certain investments and engage in certain merger, consolidation or asset sale transactions), as well as customary events of default. The Credit Agreement also requires the Company to maintain (i) a leverage ratio of not more than 1.50 to 1.0 as of the last day of any fiscal quarter, based upon the ratio of debt to tangible net worth of the Company and its subsidiaries on a consolidated basis, (ii) an interest coverage ratio of not less than 1.50 to 1.0 for any four fiscal quarter period, based upon the ratio of EBITDA to cash interest expense of the Company and its subsidiaries on a consolidated basis, (iii) a consolidated tangible net worth of not less than the sum of $250 million, plus 50% of the net proceeds of any issuances of equity interests of the Company and the guarantors of the Revolving Credit Facility, plus 50% of the amount of consolidated net income of the Company and its subsidiaries, (iv) liquidity of not less than $25 million, and (v) a risk asset ratio of not more than 1.25 to 1.0, based upon the ratio of the book value of all risk assets owned by the Company and its subsidiaries to the Company’s tangible net worth.
As of December 31, 2017 and 2016, we were in compliance with all covenants under the Credit Agreement.
At-the-Market Offering Program
On November 7, 2016, we entered into a Distribution Agreement (which we refer to as the “First Distribution Agreement”) with J.P. Morgan Securities LLC, Merrill Lynch, Pierce, Fenner & Smith Incorporated, and Citigroup Global Markets Inc. (which we refer to collectively as the “Sales Agents,” and individually as a “Sales Agent”), relating to our common stock. Under the First Distribution Agreement we were authorized to offer and sell shares of our common stock having an aggregate offering price of up to $50.0 million from time to time through any of our Sales Agents in “at the market” offerings. During the years ended December 31, 2017 and 2016, we sold and issued 1.4 million and 0.6 million shares of our common stock, respectively, under the First Distribution Agreement, which provided net proceeds to us of $33.5 million and $11.4 million, respectively, and, in connection with such sales, paid total commissions and fees to the Sales Agents of $0.7 million and $0.2 million, respectively.
On August 9, 2017, we entered into a second Distribution Agreement (which we refer to as the “Second Distribution Agreement”) with the Sales Agents, pursuant to which we may offer and sell from time to time up to $100.0 million in “at the market” offerings. During the year ended December 31, 2017, we sold and issued 2.3 million shares of our common stock under the Second Distribution Agreement, which provided net proceeds to us of $64.6 million, and, in connection with such sales, paid total commissions and fees to the Sales Agents of $1.3 million. At December 31, 2017, there was approximately $34.2 million available for sale and issuance under the Second Distribution Agreement.
Cash Flows—Year Ended December 31, 2017 Compared to the Year Ended December 31, 2016
For the year ended December 31, 2017 and December 31, 2016,facilitate the comparison of cash flowsour past and present operations. We believe these non-GAAP financial measures provide useful information to investors because they are used to evaluate our performance on a comparable year-over-year basis. These non-GAAP financial measures are not in accordance with, or an alternative for, GAAP measures and may be different from non-GAAP financial measures used by other companies. In addition, these non-GAAP financial measures are not based on any comprehensive or standard set of accounting rules or principles. Accordingly, the calculation of our non-GAAP financial measures may differ from the definitions of other companies using the same or similar names limiting, to some extent, the usefulness of such measures for comparison purposes. Non-GAAP financial measures have limitations in that they do not reflect all of the amounts associated with our financial results as determined in accordance with GAAP. These measures should only be used to evaluate our financial results in conjunction with the corresponding GAAP measures. Accordingly, we qualify our use of non-GAAP financial information in a statement when non-GAAP financial information is as follows:presented.
| ·
| | Net cash used in investing activities was $134.4 million during the year ended December 31, 2017, compared to $23.2 million used during the same period in 2016. The increase relates to our acquisition of UCP and Sundquist Homes, which resulted in cash outflows, net of cash acquired, totaling $130.0 million an increase in purchases of property and equipment, partially offset the sale of our South Carolina operations which generated cash proceeds of $17.1 million, and a decrease in contributions to our unconsolidated joint venture during the year ended December 31, 2017, as compared to the same period in 2016.
|
| ·
| | Net cash provided by financing activities was $308.5 million during the year ended December 31, 2017, compared to $69.2 million during the same period in 2016. The increase in cash provided by financing activities is primarily attributed to cash proceeds from issuance of senior notes totaling $527.5 million, the net proceeds received from the sale of common stock totaling $98.1 million, and net proceeds from our mortgage repurchase facilities of $48.3 million, partially offset by an increase in net payments on our Revolving Credit Facility totaling $255.0 million, repayment of debt assumed in connection with our UCP acquisition of $151.9 million, a decrease in proceeds received from issuance of insurance premium notes and other indebtedness totaling $9.2 million, and an increase of debt issuance costs of $7.4 million.
|
As of December 31, 2017, our cash balance was $88.8 million.EBITDA and Adjusted EBITDA
Cash Flows—Year Ended December 31, 2016 Compared to the Year Ended December 31, 2015
For the year ended December 31, 2016 and December 31, 2015, the comparison of cash flows is as follows:
| ·
| | Net cash used in operating activities decreased to $45.8 million during the year ended December 31, 2016 from net cash used of $162.7 million during the same period in 2015. The decrease in cash used in operations was primarily a result of a net outflow associated with inventories of $91.9 million during the year ended December 31, 2016, compared to a net outflow of $208.5 million during the same period in 2015. The outflow in 2016 was driven by our investment in inventories through the purchase of 2,493 lots during the year ended December 31, 2016, as well as 1,367 homes under construction as of December 31, 2016. These outflows were partially offset by cash inflows associated with home deliveries of 2,825 homes in 2016. We had net cash used in working capital items including cash held in escrow, accounts receivable, prepaid expenses and other assets, accounts payable and accrued expenses and other liabilities of $16.6 million for the year ended December 31, 2016, as compared to cash used of $5.6 million for the same period in 2015.
|
| ·
| | Net cash used in investing activities was $23.2 million during the year ended December 31, 2016, compared to $4.2 million used during the same period in 2015. The increase relates to our investment in unconsolidated subsidiaries in 2016 as well increased purchases of property and equipment, partially offset by proceeds on a secured note receivable and the sale of assets.
|
| ·
| | Net cash provided by financing activities was $69.2 million during the year ended December 31, 2016, compared to $162.8 million during the same period in 2015. The decrease in cash provided by financing activities is primarily attributed to the issuance of senior notes in 2015 totaling $59.0 million, an increase in net payments on our Revolving Credit Facility totaling $55.0 million, and a decrease of a total of $2.5 million in cash used for repurchasing our common stock under our stock repurchase program and upon the vesting of restricted stock awards during the year ended December 31, 2016. These decreases in cash provided in 2016 were partially offset by the net proceeds received from the sale of common stock totaling $11.4
|
million, an increase in proceeds from insurance premium notes totaling $10.4 million, and a decrease in debt issuance costs paid of $1.7 million.
|
As of December 31, 2016, our cash balance was $29.5 million.
Contractual Obligations
Our contractual obligations as of December 31, 2017 were as follows (in thousands):
| | | | | | | | | | | | | | | |
| | Payments due by period |
| | Total | | Less than 1 year | | 1 - 3 years | | 3 - 5 years | | More than 5 years |
Long-term debt maturities, including interest | | $ | 1,127,568 | | $ | 100,609 | | $ | 99,938 | | $ | 467,292 | | $ | 459,729 |
Operating leases | | | 9,053 | | | 3,113 | | | 4,270 | | | 1,670 | | | - |
Total contractual obligations | | $ | 1,136,621 | | $ | 103,722 | | $ | 104,208 | | $ | 468,962 | | $ | 459,729 |
Off-Balance Sheet Arrangements
In the ordinary course of business, we enter into land purchase contracts in order to procure lots for the construction of our homes. We are subject to customary obligations associated with entering into contracts for the purchase of land and improved lots. These purchase contracts typically require a cash deposit, and the purchase of properties under these contracts is generally contingent upon satisfaction of certain requirements, including obtaining applicable property and development entitlements. We also utilize option contracts with land sellers as a method of acquiring land in staged takedowns, to help us manage the financial and market risk associated with land holdings, and to reduce the use of funds from our corporate financing sources. Option contracts generally require payment by us of a non-refundable deposit for the right to acquire lots over a specified period of time at pre-determined prices. Our obligations with respect to purchase contracts and option contracts are generally limited to the forfeiture of the related non-refundable cash deposits. As of December 31, 2017, we had outstanding purchase contracts and option contracts for 15,032 lots totaling $436.7 million, and had $18.9 million of non-refundable cash deposits pertaining to land option contracts. While our performance, including the timing and amount of purchase, if any, under these outstanding purchase and option contracts is subject to change, we currently anticipate performing on 60% to 70% of the purchase and option contracts during the year ending December 31, 2017, with performance on the remaining purchase and option contacts occurring in future periods.
Our utilization of land option contracts is dependent on, among other things, the availability of land sellers willing to enter into option takedown arrangements, the availability of capital to financial intermediaries to finance the development of optioned lots, general housing market conditions, and local market dynamics. Options may be more difficult to procure from land sellers in strong housing markets and are more prevalent in certain geographic regions.
We post letters of credit and performance bonds related to our land development performance obligations, with local municipalities. As of December 31, 2017 and 2016, we had $78.3million and $70.1 million, respectively, in letters of credit and performance bonds issued and outstanding. We anticipate that the obligations secured by these performance bonds and letters of credit generally will be performed in the ordinary course of business.
The following table presents EBITDA and Adjusted EBITDA for the years ended December 31, 2017, 2016,2021 and 2015.2020. Adjusted EBITDA is a non-GAAP financial measure we use as a supplemental measure in evaluating operating performance. We define Adjusted EBITDA as consolidated net income before (i) income tax expense, (ii) interest in cost of home sales revenues, (iii) other interest expense, (iv) depreciation and amortization expense, (v) loss on debt extinguishment, and (v) adjustments resulting from the application of purchase accounting for acquired work in process(vi) inventory related to business combinations. impairment and other. We believe Adjusted EBITDA provides an indicator of general economic performance that is not affected by fluctuations in interest rates or effective tax rates, levels of depreciation or amortization, and items considered to be non-recurring. Accordingly, our management believes that this measurement is useful for comparing general operating performance from period to period. Adjusted EBITDA should be considered in addition to, and not as a substitute for, consolidated net income in accordance with GAAP as a measure of performance. Our presentation of Adjusted EBITDA should not be
construed as an indication that our future results will be unaffected by unusual or non-recurring items. Our Adjusted EBITDA is limited as an analytical tool, and should not be considered in isolation or as a substitute for analysis of our results as reported under GAAP.
(dollars in thousands)
| | | | | | | | | |
|
|
|
|
|
|
|
|
|
|
| | Year Ended December 31, |
| Year Ended December 31, |
| | 2017 | | 2016 | | 2015 |
| 2021 |
| 2020 |
| % Change |
Net income | | $ | 50,295 | | $ | 49,540 | | $ | 39,890 |
| $ | 498,504 |
| $ | 206,157 |
|
| 141.8 | % |
Income tax expense | | | 33,869 | | | 23,609 | | | 20,415 |
|
| 142,618 |
|
| 64,083 |
|
| 122.6 | % |
Interest in cost of home sales revenues | | | 32,898 | | | 19,502 | | | 10,082 |
|
| 66,846 |
|
| 72,002 |
|
| (7.2) | % |
Interest expense (income) | | | (3) | | | 5 | | | 10 |
|
| (661) |
|
| (1,141) |
|
| (42.1) | % |
Depreciation and amortization expense | | | 6,973 | | | 5,580 | | | 4,713 |
|
| 10,912 |
|
| 13,141 |
|
| (17.0) | % |
EBITDA | | | 124,032 | | | 98,236 | | | 75,110 |
|
| 718,219 |
|
| 354,242 |
|
| 102.7 | % |
Purchase price accounting for acquired work in process inventory | | | 15,625 | | | 389 | | | 2,673 | |
Purchase price accounting for investment in unconsolidated subsidiaries outside basis | | | 915 | | | 1,228 | | | — | |
Acquisition expense | | | 9,905 | | | 490 | | | 491 | |
Loss on debt extinguishment | |
|
| 14,458 |
|
| — |
|
| NM |
|
Inventory impairment and other | |
|
| 41 |
|
| 2,172 |
|
| (98.1) | % |
Adjusted EBITDA | | $ | 150,477 | | $ | 100,343 | | $ | 78,274 |
| $ | 732,718 |
| $ | 356,414 |
|
| 105.6 | % |
Net Homebuilding Debt to Net Capital
The following table presents our ratio of net homebuilding debt to net capital, which is a non-GAAP financial measure. We calculate this by dividing net homebuilding debt (notes payable and borrowings under our revolving line of credit less cash and cash equivalents and cash held in escrow and cash and cash equivalents)escrow) by net capital (net homebuilding debt plus total stockholders’ equity). Homebuilding debt is our total debt minus outstanding borrowings under our mortgage repurchase facilities. The most directly comparable GAAP measure is the ratio of debt to total capital. We believe the ratio of net homebuilding debt to net capital is a relevant and useful financial measure to investors in understanding the leverage employed in our operations and as an indicator of the our ability to obtain external financing.
(dollars in thousands)
| | | | | | | | | |
|
|
|
|
|
|
| | Year Ended December 31, |
| December 31, |
| December 31, |
| | 2017 | | 2016 | | 2015 |
| 2021 |
| 2020 |
Notes payable and revolving line of credit | | $ | 824,602 | | $ | 454,088 | | $ | 390,243 | |
Total homebuilding debt | |
| $ | 998,936 |
| $ | 894,875 |
Total stockholders' equity | | | 735,233 | | | 473,636 | | | 409,479 |
|
| 1,764,508 |
|
| 1,280,705 |
Total capital | | $ | 1,559,835 | | $ | 927,724 | | $ | 799,723 |
| $ | 2,763,444 |
| $ | 2,175,580 |
Debt to capital | | | 52.9% | | | 48.9% | | | 48.8% | |
Homebuilding debt to capital | |
|
| 36.1% |
|
| 41.1% |
| | | | | | | | | |
|
|
|
|
|
|
Notes payable and revolving line of credit | | $ | 824,602 | | $ | 454,088 | | $ | 390,243 | |
Total homebuilding debt | |
| $ | 998,936 |
| $ | 894,875 |
Cash and cash equivalents | |
|
| (316,310) |
|
| (394,001) |
Cash held in escrow | | | (37,723) | | | (20,044) | | | (11,817) |
|
| (52,297) |
|
| (23,149) |
Cash and cash equivalents | | | (88,832) | | | (29,450) | | | (29,287) | |
Net debt | | | 698,047 | | | 404,594 | | | 349,139 | |
Net homebuilding debt | |
|
| 630,329 |
|
| 477,725 |
Total stockholders' equity | | | 735,233 | | | 473,636 | | | 409,479 |
|
| 1,764,508 |
|
| 1,280,705 |
Net capital | | $ | 1,433,280 | | $ | 878,230 | | $ | 758,618 |
| $ | 2,394,837 |
| $ | 1,758,430 |
| | | | | | | | | |
|
|
|
|
|
|
Net debt to net capital | | | 48.7% | | | 46.1% | | | 46.0% | |
Net homebuilding debt to net capital | |
|
| 26.3% |
|
| 27.2% |
Adjusted Net Income and Adjusted Diluted Earnings per Common Share
Adjusted Net Income and Adjusted Diluted Earnings per Common Share (which we refer to as “Adjusted Diluted EPS”) is aare non-GAAP financial measuremeasures that we believe isare useful to management, investors and other users of our financial information in evaluating our operating results and understanding our operating trends without the effect of certain non-recurring items. We believe excluding certain non-recurring items provides more comparable assessment of our financial results from period to period. We define Adjusted Net Income as consolidated net income before (i) income tax expense, (ii) inventory impairment and other (iii) restructuring costs, and (iv) loss on debt extinguishment, less adjusted income tax expense, calculated using the Company’s estimated annual effective tax rate after discrete items for the applicable period. Adjusted Diluted EPS is calculated by excluding the effect of acquisitionloss on inventory impairment and other, restructuring costs and purchase price accounting for acquired work in processloss on debt extinguishment from the calculation of reported EPS.EPS.
(dollars in thousands, except share and per share information)
| | | | | | | | | |
| | Year Ended |
| | December 31, |
| | 2017 | | 2016 | | 2015 |
Numerator | | | | | | | | | |
Net income | | $ | 50,295 | | $ | 49,540 | | $ | 39,890 |
Less: Undistributed earnings allocated to participating securities | | | (384) | | | (1,050) | | | (1,323) |
Net income allocable to common stockholders | | $ | 49,911 | | $ | 48,490 | | $ | 38,567 |
Denominator | | | | | | | | | |
Weighted average common shares outstanding - basic | | | 24,280,871 | | | 20,679,189 | | | 20,569,012 |
Dilutive effect of restricted stock units | | | 274,638 | | | 112,748 | | | — |
Weighted average common shares outstanding - diluted | | | 24,555,509 | | | 20,791,937 | | | 20,569,012 |
Earnings per share: | | | | | | | | | |
Basic | | $ | 2.06 | | $ | 2.34 | | $ | 1.88 |
Diluted | | $ | 2.03 | | $ | 2.33 | | $ | 1.88 |
| | | | | | | | | |
Adjusted Earnings per share | | | | | | | | | |
Numerator | | | | | | | | | |
Income before income tax expense | | $ | 84,164 | | $ | 73,149 | | $ | 60,305 |
Purchase price accounting for acquired work in process inventory | | | 15,625 | | | 389 | | | 2,673 |
Acquisition expense | | | 9,905 | | | 490 | | | 491 |
Adjusted income before income tax expense | | | 109,694 | | | 74,028 | | | 63,469 |
Income tax expense, adjusted(1) | | | (38,612) | | | (23,893) | | | (22,214) |
Adjusted net income | | | 71,082 | | | 50,135 | | | 41,255 |
Less: Undistributed earnings allocated to participating securities | | | (543) | | | (1,062) | | | (1,368) |
Adjusted net income allocable to common stockholders | | $ | 70,539 | | $ | 49,073 | | $ | 39,887 |
| | | | | | | | | |
Denominator - Diluted | | | 24,555,509 | | | 20,791,937 | | | 20,569,012 |
| | | | | | | | | |
Adjusted diluted earnings per share | | $ | 2.87 | | $ | 2.36 | | $ | 1.94 |
| | | | | | | | | |
| (1)
| | The tax rate used in calculating adjusted net income was 35.2% for the year ended December 31, 2017. The tax rate used is reflective of our GAAP tax rate for the applicable periods adjusted for certain acquisition costs which are not deductible for tax and the remeasurement of our deferred tax assets as a result of the Tax Cuts and Jobs Act which was signed into law on December 22, 2017. For the three months and year ended December 31, 2016, our GAAP tax rate was utilized.
|
|
|
|
|
|
|
|
|
| Year Ended December 31, |
|
| 2021 |
| 2020 |
Numerator |
|
|
|
|
|
|
Net income |
| $ | 498,504 |
| $ | 206,157 |
Denominator |
|
|
|
|
|
|
Weighted average common shares outstanding - basic |
|
| 33,706,782 |
|
| 33,312,554 |
Dilutive effect of restricted stock units |
|
| 738,136 |
|
| 297,544 |
Weighted average common shares outstanding - diluted |
|
| 34,444,918 |
|
| 33,610,098 |
Earnings per share: |
|
|
|
|
|
|
Basic |
| $ | 14.79 |
| $ | 6.19 |
Diluted |
| $ | 14.47 |
| $ | 6.13 |
|
|
|
|
|
|
|
Adjusted earnings per share |
|
|
|
|
|
|
Numerator |
|
|
|
|
|
|
Net income |
| $ | 498,504 |
| $ | 206,157 |
Income tax expense |
|
| 142,618 |
|
| 64,083 |
Income before income tax expense |
|
| 641,122 |
|
| 270,240 |
Inventory impairment and other |
|
| 41 |
|
| 2,172 |
Restructuring costs |
|
| — |
|
| 1,584 |
Loss on debt extinguishment |
|
| 14,458 |
|
| — |
Adjusted income before income tax expense |
|
| 655,621 |
|
| 273,996 |
Adjusted income tax expense(1) |
|
| (145,843) |
|
| (64,974) |
Adjusted net income |
| $ | 509,778 |
| $ | 209,022 |
|
|
|
|
|
|
|
Denominator - Diluted |
|
| 34,444,918 |
|
| 33,610,098 |
|
|
|
|
|
|
|
Adjusted diluted earnings per share |
| $ | 14.80 |
| $ | 6.22 |
(1)The tax rates used in calculating adjusted net income for the years ended December 31, 2021 and 2020 were 22.2% and 23.7%, respectively, which reflect of the Company’s GAAP tax rates for the applicable periods.
ITEM 7A.QUANTITATIVE AND QUALITATIVE DISCLOSURES ABOUT MARKET RISK.
Interest Rates
Market risk is the risk of loss arising from adverse changes in market rates and prices, such as interest rates, foreign currency exchange rates and commodity prices. Our primary exposure to market risk is interest rate risk associated with our Second Amended and Restated Credit Agreement. Borrowings under the Second A&R Credit Agreement which was entered into on October 21, 2014. Future borrowings under the Credit Agreement bear interest at a floating rate equal to the London Interbank Offeredadjusted Eurodollar Rate plus an applicable margin between 2.75%2.05% and 3.25%2.65% per annum, or,and if made available in the Administrative Agent’s discretion, a base rate plus an applicable margin between 1.75%1.05% and 2.25%1.65% per annum. The “applicable margins” described above are determined
by a schedule based on the leverage ratio of the Company, as defined in the Credit Agreement. TheSecond A&R Credit Agreement. The Second A&R Credit
Agreement also provides for fronting fees and letter of credit fees payable to the L/C Issuer and commitment fees payable to the Administrative Agent equal to 0.20% of the unused portion of the Revolving Credit Facility.senior unsecured revolving line of credit.
For fixed rate debt, such as our senior notes, changes in interest rates generally affect the fair value of the debt instrument, but not our earnings or cash flows. As interest rates increase, the fair value of the debt instrument will decrease.
InflationOur Financial Services business utilizes mortgage backed securities forward commitments, option contracts and investor commitments to protect the value of rate-locked commitments and loans held for sale from fluctuations in mortgage-related interest rates. To mitigate interest risk associated with loans held for sale, we typically use derivative financial instruments to hedge our exposure to risk from the time a borrower locks a loan until the time the loan is securitized. We also typically hedge our interest rate exposure through entering into interest rate swap futures.
Inflation
Our homebuilding operations can be adversely impacted by inflation, primarily from higher land, financing, labor, material, particularly lumber, and construction costs. In addition, inflation can lead to higher mortgage rates, which can significantly affect the affordability of mortgage financing to homebuyers. WhileDuring the year ended December 31, 2021, we attemptwere generally able to pass on cost increases from inflationary impacts to customers through increased prices, however, when weak housing market conditions exist, we are often unable to offset cost increases with higher selling prices.
Seasonality
Historically, the homebuilding industry experiences seasonal fluctuations in quarterly operating results and capital requirements. We typically experience the highest new home order activity during the spring, although this activity is also highly dependent on the number of active selling communities, timing of new community openings and other market factors. Since it typically takeshistorically has taken four to sixeight months to construct a new home, we typically deliver more homes in the second half of the year as spring and summer home orders convert to home deliveries. Because of this seasonality, home starts, construction costs and related cash outflows have historically been highest in the second and third quarters, and the majority of cash receipts from home deliveries occurs during the second half of the year. We expect this seasonal pattern to continue over the long term, although it may be affected by volatility in the homebuilding industry.industry, supply chain challenges, and the COVID-19 pandemic.
ITEM 8.CONSOLIDATED FINANCIAL STATEMENTS.STATEMENTS AND SUPPLEMENTARY DATA.
The information required by this Item is incorporated herein by reference to the financial statements set forth in Item 15 (Exhibits and Financial Statement Schedules) of Part IV of this Form 10-K.
ITEM 9.CHANGES IN AND DISAGREEMENTS WITH ACCOUNTANTS ON ACCOUNTING AND FINANCIAL DISCLOSURE.
None.
ITEM 9A.CONTROLS AND PROCEDURES.
Evaluation of Disclosure Controls and Procedures
Under the supervision and with the participation of our management, including our principalco-principal executive officerofficers and principal financial officer, we conducted an evaluation of the effectiveness of our disclosure controls and procedures (as such term is defined under Rule 13a-15(e) under the Exchange Act) as of December 31, 2017,2021, the end of the period covered by this Form 10-K. Based on this evaluation, our principalco-principal executive officerofficers and principal financial officer concluded that our disclosure controls and procedures were effective as of December 31, 20172021 in providing reasonable assurance that information required to be disclosed by us in the reports that we file or submit under the Exchange Act is recorded, processed, summarized and reported within the time periods specified in the SEC’s rules and forms.
Management’s Report on Internal Control over Financial Reporting
Our management is responsible for establishing and maintaining adequate internal control over financial reporting (as such term is defined in Exchange Act Rules 13a-15(f) and 15d-15(f)). In addition, our management is required to report their assessment, including their evaluation criteria, on the design and operating effectiveness of our internal control over financial reporting in this Form 10-K.
Our internal control over financial reporting is a process designed under the supervision of our principalco-principal executive officerofficers and principal financial officer. During 2017,2021, our management conducted an assessment of the internal control over financial reporting based upon criteria established in the “Internal Control – Integrated Framework” issued by the Committee of Sponsoring Organizations of the Treadway Commission (2013 framework). Based on our management’s assessment, which included a comprehensive review of the design and operating effectiveness of our internal control over financial reporting, our management has concluded that our internal control over financial reporting iswas effective as of December 31, 2017. In accordance with the SEC's published guidance, because we2021.
acquired UCP and Sundquist Homes during the current fiscal year, management has excluded these companies from its evaluation of the effectiveness of the Company'sOur internal control over financial reporting as of December 31, 2017. Home sales revenue and the aggregate total assets attributable to UCP and Sundquist Homes was $201.4 million and $18.7 million, respectively, for the year ended December 31, 2017, and $266.5 million and $59.7 million, respectively,2021 has been audited by Ernst & Young LLP, an independent registered public accounting firm, as of December 31, 2017. Based on this assessment, our management concluded that, as of December 31, 2017, the Company's internal control over financial reporting was effective based on those criteria.stated in their report, which is included herein.
Changes in Internal Control over Financial Reporting
There were no changes during the fourth quarter of 20172021 in our internal control over financial reporting (as defined in Rule 13a-15(f) under the Exchange Act) that have materially affected or are reasonably likely to materially affect our internal control over financial reporting.
Report of Independent Registered Public Accounting Firm
TheTo the Board of Directors and Stockholders of Century Communities, Inc.
Opinion on Internal Control overOver Financial Reporting
We have audited Century Communities, Inc.’s internal control over financial reporting as of December 31, 2017,2021, based on criteria established in Internal Control—Control — Integrated Framework issued by the Committee of Sponsoring Organizations of the Treadway Commission (2013 framework) (the COSO criteria). In our opinion, Century Communities, Inc. (the Company) maintained, in all material respects, effective internal control over financial reporting as of December 31, 2017,2021, based on the COSO criteria.
We also have audited, in accordance with the standards of the Public Company Accounting Oversight Board (United States) (PCAOB), the 20172021 consolidated financial statements of the Company and our report dated March 1, 2018February 2, 2022 expressed an unqualified opinion thereon.
As indicated in the accompanying Management’s Report on Internal Control over Financial Reporting, management’s assessment of and conclusion on the effectiveness of internal control over financial reporting did not include the internal controls of UCP, Inc. or Sundquist Homes and affiliates, which are included in the 2017 consolidated financial statements of the Company and constituted 19% and 39% of total and net assets, respectively, as of December 31, 2017 and 15% and 22% of revenues and net income, respectively, for the year then ended. Our audit of internal control over financial reporting of the Company also did not include an evaluation of the internal control over financial reporting of UCP, Inc. or Sundquist Homes and affiliates.
Basis for Opinion
The Company’s management is responsible for maintaining effective internal control over financial reporting and for its assessment of the effectiveness of internal control over financial reporting included in the accompanying Management’s Report on Internal Control overOver Financial Reporting. Our responsibility is to express an opinion on the Company’s internal control over financial reporting based on our audit. We are a public accounting firm registered with the PCAOB and are required to be independent with respect to the Company in accordance with the U.S. federal securities laws and the applicable rules and regulations of the Securities and Exchange Commission and the PCAOB.
We conducted our audit in accordance with the standards of the PCAOB. Those standards require that we plan and perform the audit to obtain reasonable assurance about whether effective internal control over financial reporting was maintained in all material respects.
Our audit included obtaining an understanding of internal control over financial reporting, assessing the risk that a material weakness exists, testing and evaluating the design and operating effectiveness of internal control based on the assessed risk, and performing such other procedures as we considered necessary in the circumstances. We believe that our audit provides a reasonable basis for our opinion.
Definition and Limitations of Internal Control Over Financial Reporting
A company’s internal control over financial reporting is a process designed to provide reasonable assurance regarding the reliability of financial reporting and the preparation of financial statements for external purposes in accordance with generally accepted accounting principles. A company’s internal control over financial reporting includes those policies and procedures that (1) pertain to the maintenance of records that, in reasonable detail, accurately and fairly reflect the transactions and dispositions of the assets of the company; (2) provide reasonable assurance that transactions are recorded as necessary to permit preparation of financial statements in accordance with generally accepted accounting principles, and that receipts and expenditures of the company are being made only in accordance with authorizations of management and directors of the company; and (3) provide reasonable assurance regarding prevention or timely detection of unauthorized acquisition, use, or disposition of the company’s assets that could have a material effect on the financial statements.
Because of its inherent limitations, internal control over financial reporting may not prevent or detect misstatements. Also, projections of any evaluation of effectiveness to future periods are subject to the risk that controls may become inadequate because of changes in conditions, or that the degree of compliance with the policies or procedures may deteriorate.
/s/ Ernst & Young LLP
Denver, Colorado
February 2, 2022
March 1, 2018
ITEM 9B.OTHER INFORMATION.
None.
None.
PART IIIITEM 9C. DISCLOSURE REGARDING FOREIGN JURISDICTIONS THAT PREVENT INSPECTIONS.
Not applicable.
PART III
Item 10.Directors, Executive Officers and Corporate Governance.
The information required in response to this Item is incorporated herein by reference to the information contained under the captions entitled “Election“Proposal No. 1 Election of Directors—Information about Director Nominees,” “Executive Officers,” and Compensation” and “Section 16(a) Beneficial Ownership Reporting Compliance” “Corporate Governance” in our definitive proxy statement for our 20182022 Annual Meeting of Stockholders, which willto be filed with the SEC pursuant to Regulation 14A under theSecurities and Exchange Act noCommission not later than April 30, 2018120 days after the end of the fiscal year covered by this report (which we refer to as our “2018“2022 Proxy Statement”).
We will provide to any stockholders or other person without charge, upon request, a copy of our Corporate Governance Policy,Our Code of Business Conduct and Ethics, which applies to all of our directors, executive officers and employees, is available in the charters“Investors—Corporate Governance—Governance Documents” section of our website located at www.centurycommunities.com. In addition, printed copies of our Code of Business Conduct and Ethics are available upon written request to Century Communities, Inc., 8390 East Crescent Parkway, Suite 650, Greenwood Village, Colorado 80111, Attention: Corporate Secretary. Any waiver of our Code of Business Conduct and Ethics for our Audit Committee, Compensation Committee andexecutive officers, directors, or any employees may be made only by the Nominating and Corporate Governance Committee. You may obtain these documents onCommittee of the Board of Directors and will be promptly disclosed as required by law and NYSE rules. We intend to satisfy the disclosure requirements of Item 5.05 of Form 8-K and applicable NYSE rules regarding amendments to or waivers from any provision of our Code of Business Conduct and Ethics by posting such information in the “Investors—Corporate Governance—Governance Documents” section of our website located at http://www.centurycommunities.com under the Investor Relations section or by contacting our Investor Relations department at 303-268-8398..
Item 11.Executive Compensation.
The information required in response to this Item is incorporated herein by reference to the information contained in under the captioncaptions entitled “Executive OfficersCompensation,” “Compensation Discussion and Analysis,” “Compensation Committee Report” and “Director Compensation” in our 2018definitive proxy statement for our 2022 Proxy Statement.
Item 12.Security Ownership of Certain Beneficial Owners and Management and Related Stockholder Matters.
The information required in response to this Item is incorporated herein by reference to the information contained in under the caption entitled “Security Ownership of Certain Beneficial Owners and Management and Related Stockholder Matters”“Stock Ownership” in our 20182022 Proxy Statement.
Item 13.Certain Relationships and Related Transactions, and Director Independence.
The information required in response to this Item is incorporated herein by reference to the information contained in under the captioncaptions entitled “Certain Relationships and Related Party Transactions” and “Corporate Governance—Director Independence” in our 20182022 Proxy Statement.
Item 14.Principal Accounting Fees and Services.
The information required in response to this Item is incorporated herein by reference to the information contained in under the captioncaptions entitled “Fees Incurred for Services by Principal Accountant”“Proposal No. 2: Ratification of Appointment of Independent Registered Public Accounting Firm—Audit, Audit-Related, Tax, and Other Fees” and “Proposal No. 2: Ratification of Appointment of Independent Registered Public Accounting Firm—Pre-Approval Policies and Procedures” in our 20182022 Proxy Statement.
PART IV
ITEM 15.EXHIBITS AND FINANCIAL STATEMENT SCHEDULES.
(a)(1)Financial Statements
The following financial statements of the Company are included in a separate section of this Form 10-K commencing on the page numbers specified below:
|
|
Page |
|
|
Consolidated Financial Statements |
|
Report of Independent Registered Public Accounting Firm (PCAOB 00042) | F-2 |
Consolidated Balance Sheets as of December 31, 20172021 and December 31, 20162020 | F-3F-4
|
Consolidated Statements of Operations for the Years Ended December 31, 2017, 20162021, 2020 and 20152019 | F-4F-5
|
Consolidated Statements of Stockholders’ Equity for the Years Ended December 31, 2017, 20162021, 2020 and 20152019 | F-5F-6
|
Consolidated Statements of Cash Flows for the Years Ended December 31, 2017, 20162021, 2020 and 20152019 | F-6F-7
|
Notes to Consolidated Financial Statements | F-7F-8
|
(a)(2)Financial Statements Schedules
Financial statement schedules have been omitted because they are not applicable, not material, not required or the required information is included in this Form 10-K.
(a)(3)Exhibits
The following exhibits are either filed herewith or incorporated herein by reference:
EXHIBIT INDEX
|
|
Exhibit Number
| Description
|
|
|
Exhibit
Number
| Description
|
| |
3.1 | Certificate of Incorporation of Century Communities, Inc., as amended (incorporated by reference to Exhibit 3.1 to the initial filing of the Registration Statement on Form S-1 of Century Communities, Inc. (File No. 333-195678) filed with the SEC on May 5, 2014). |
|
|
3.2 | Restated Bylaws of Century Communities, Inc. (incorporated by reference to Exhibit 3.2 to Century Communities, Inc.’s Quarterly Report on Form 10-Q for the quarter ended June 30, 2021 (File No. 001-36491)). |
|
|
4.1 | Specimen Common Stock Certificate of Century Communities, Inc. (incorporated by reference to Exhibit 4.1 to the initial filing of the Registration Statement on Form S-1 of Century Communities, Inc. (File No. 333-195678) filed with the SEC on May 5, 2014). |
|
|
3.34.2
| Amendment to the Bylaws of Century Communities, Inc., adopted and effective on April 10, 2017 Description of Securities Registered Pursuant to Section 12 of the Securities Exchange Act of 1934 (incorporated by reference to Exhibit 4.2 to Century Communities, Inc.’s CurrentAnnual Report on Form 8-K filed with10-K for the SEC on April 11, 2017)year ended December 31, 2020).
|
|
|
4.14.3
| Specimen Common Stock Certificate of Century Communities, Inc. (incorporated by reference to the initial filing of the Registration Statement on Form S-1 of Century Communities, Inc. (File No. 333-195678) filed with the SEC on May 5, 2014).
|
| |
4.2
| Indenture (including formsform of 6.875%6.750% Senior Notes Due 2022)due 2027), dated as of May 5, 2014,23, 2019, by and among Century Communities, Inc., the Guarantors party thereto, and U.S. Bank National Association, as trustee (incorporated by reference to Amendment No. 2 to the Registration Statement on Form S-1 of Century Communities, Inc. (File No. 333-195678) filed with the SEC on May 30, 2014). |
| |
4.3
| Supplemental Indenture, dated as of December 18, 2014, among Century Communities, Inc., the Guarantors party thereto, and U.S. Bank National Association, as trustee under the Indenture (incorporated by reference to Century Communities, Inc.’s Annual Report on Form 10-K for the fiscal year ended December 31, 2014 filed with the SEC on March 6, 2015).
|
| |
4.4
| Second Supplemental Indenture, dated as of March 13, 2015, by and among Century Communities, Inc., the Guarantors party thereto, and U.S. Bank National Association, as trustee under the Indenture (incorporated by referenceExhibit 4.1 to Century Communities, Inc.’s Current Report on Form 8-K filed with the SEC on April 10, 2015)May 23, 2019 (File No. 001-36491)).
|
|
|
4.54.4
| Third Supplemental Indenture, datedForm of 6.750% Senior Notes due 2027 (included as of April 9, 2015, by and among Century Communities, Inc.,Exhibit A to Rule 144A/Regulation S Appendix to the Guarantors party thereto, and U.S. Bank National Association, as trustee under the IndentureIndenture) (incorporated by reference to Exhibit 4.1 to Century Communities, Inc.’s Current Report on Form 8-K filed with the SEC on April 10, 2015)May 23, 2019 (File No. 001-36491)).
|
|
|
4.5 | Fourth Supplemental Indenture (including form of 3.875% Senior Notes due 2029), dated as of August 27, 2015,23, 2021, by and among Century Communities, Inc., the Guarantors party thereto, and U.S. Bank National Association, as trustee under the Indenture (incorporated by reference to Century Communities, Inc.’s Current Report on Form 8-K filed with the SEC on August 27, 2015).
|
| |
4.6
| Fifth Supplemental Indenture, dated as of November 8, 2016, by and among Century Communities, Inc., the Guarantors party thereto, and U.S. Bank National Association, as trustee under the Indenture (incorporated by reference to Century Communities, Inc.’s Current Report on Form 8-K filed with the SEC on November 9, 2016).
|
| |
4.7
| Sixth Supplemental Indenture, dated as of January 26, 2017, by and among Century Communities, Inc., the Guarantors party thereto, and U.S. Bank National Association, as trustee under the Indenture (incorporated by reference to Century Communities, Inc.’s Current Report on Form 8-K filed with the SEC on January 26, 2017).
|
| |
4.8
| Seventh Supplemental Indenture, dated as of October 17, 2017, by and among Century Communities, Inc., the Guarantors party thereto, and U.S. Bank National Association, as trustee under the 2014 Indenture (incorporated by reference to Century Communities, Inc.’s Current Report on Form 8-K filed with the SEC on October 20, 2017).
|
| |
4.9
| Indenture (including forms of 5.875% Senior Notes Due 2025), dated as of May 12, 2017, among Century Communities, Inc., the Guarantors party thereto, and U.S. Bank National Association, as trustee (incorporated by reference to Century Communities, Inc.’s Current Report on Form 8-K, filed with the SEC on May 12, 2017).
|
| |
4.10
| First Supplemental Indenture, dated as of October 17, 2017, by and among Century Communities, Inc., the Guarantors party thereto, and U.S. Bank National Association, as trustee under the 2017 Indenture (incorporated by referenceExhibit 4.1 to Century Communities, Inc.’s Current Report on Form 8-K filed with the SEC on October 20, 2017)August 23, 2021 (File No. 001-36491)).
|
|
|
10.1†4.6
| Form of 3.875% Senior Notes due 2029 (included as Exhibit A to the Indenture) (incorporated by reference to Exhibit 4.2 to Century Communities, Inc.’s Current Report on Form 8-K filed with the SEC on August 23, 2021 (File No. 001-36491)). |
|
|
10.1† | Century Communities, Inc. Amended and Restated 2017 Omnibus Incentive Plan (incorporated by reference to Exhibit 10.1 to Century Communities, Inc.’s Current Report on Form 8-K filed with the SEC on May 12, 2017)9, 2019 (File No. 001-36491)). |
|
|
10.2† | Form of Employee Restricted Stock Unit Award Agreement for use with the Century Communities, Inc. 2017 Omnibus Incentive Plan (incorporated by reference to Exhibit 10.2 to Century Communities, Inc.’s Current Report on Form 8-K filed with the SEC on May 12, 2017)2017 (File No. 001-36491)). |
|
|
10.3† | Form of Performance Share Unit Award Agreement for use with the Century Communities, Inc. 2017 Omnibus Incentive Plan (incorporated by reference to Exhibit 10.3 to Century Communities, Inc.’s Annual Report on Form 10-K for the year ended December 31, 2018 (File No. 001-36491)). |
|
|
10.4† | Form of Non-Employee Director Restricted Stock Unit Award Agreement for use with the Century Communities, Inc. 2017 Omnibus Incentive Plan (incorporated by reference to Exhibit 10.4 to Century Communities, Inc.’s CurrentAnnual Report on Form 8-K, filed with10-K for the SEC on May 12, 2017)year ended December 31, 2020). |
|
|
10.4†10.5†
| Amended and Restated Employment Agreement, dated as of May 11, 2016,July 28, 2020, between Century Communities, Inc. and Dale Francescon (incorporated by reference to Exhibit 10.1 to Century Communities, Inc.’s CurrentQuarterly Report on Form 8-K filed with10-Q for the SEC on May 17, 2016)quarter ended June 30, 2020 (File No. 001-36491)). |
|
|
10.5†10.6†
| Amended and Restated Employment Agreement, dated as of May 11, 2016,July 28, 2020, between Century Communities, Inc. and Robert J. Francescon (incorporated by reference to Exhibit 10.2 to Century Communities, Inc.’s CurrentQuarterly Report on Form 8-K filed with10-Q for the SEC on May 17, 2016)quarter ended June 30, 2020 (File No. 001-36491)). |
10.6†
|
|
10.7† | Amended and Restated Employment Agreement, dated as of November 17, 2017, by andJuly 28, 2020, between Century Communities, Inc. and David Messenger (incorporated by reference to Exhibit 10.3 to Century Communities, Inc.’s CurrentQuarterly Report on Form 8-K filed with10-Q for the SEC on November 21, 2017)quarter ended June 30, 2020 (File No. 001-36491)). |
|
|
10.710.8†
| Form of Director and Officer Indemnification Agreement between Century Communities, Inc. and each of its directors and officers (incorporated by reference to the initial filing of the Registration Statement on Form S-1 of Century Communities, Inc. (File No. 333-195678) filed with the SEC on May 5, 2014). |
| |
10.8
| Indemnification Agreement, dated as of May 7, 2013, among Century Communities, Inc. and Dale Francescon and Robert Francescon (incorporated by reference to the initial filing of the Registration Statement on Form S-1 of Century Communities, Inc. (File No. 333-195678) filed with the SEC on May 5, 2014).
|
| |
10.9
| Sublease, dated as of April 29, 2011, between Clifton Gunderson LLP and Century Communities, Inc. (incorporated by reference to the initial filing of the Registration Statement on Form S-1 of Century Communities, Inc. (File No. 333-195678) filed with the SEC on May 5, 2014).
|
| |
10.10
| Credit Agreement, dated October 21, 2014, among Century Communities, Inc., Texas Capital Bank, National Association, and the lenders party thereto (incorporated by referenceExhibit 10.1 to Century Communities, Inc.’s Current Report on Form 8-K filed with the SEC on October 23, 2014)December 9, 2020 (File No. 333-195678).
|
|
|
10.1110.9
| First ModificationSecond Amended and Restated Credit Agreement, dated as of July 31, 2015,May 21, 2021, by and among Century Communities, Inc., the lenders party thereto, Texas Capital Bank, National Association, as Administrative Agent and L/C Issuer, and Texas Capital Bank, National Association, BBVA USA, BofA Securities, Inc., Fifth Third Bank, National Association and U.S. Bank National Association, as Joint Lead Arrangers and Joint Book Runners, and Wells Fargo Bank, N.A., as Syndication Agent (incorporated by reference to Exhibit 10.1 to Century Communities, Inc.’s Current Report on Form 8-K filed with the lendersSEC on May 25, 2021 (File No. 001-36491)).
|
|
|
|
|
10.10 | Purchase Agreement, dated May 9, 2019, among Century Communities, Inc., the Guarantors party thereto, and J.P. Morgan Securities LLC, as representative of the subsidiary guarantors of Century Communities, Inc. partyinitial purchasers named on Schedule A thereto (incorporated by reference to Exhibit 10.1 to Century Communities, Inc.’s Current Report on Form 8-K filed with the SEC on May 14, 2019 (File No. 001-36491)). |
|
|
10.11 | Registration Rights Agreement, dated as of May 23, 2019, by and among Century Communities, Inc., the Guarantors party thereto, and J.P. Morgan Securities LLC, on behalf of the initial purchasers (incorporated by reference to Exhibit 10.1 to Century Communities, Inc.’s Current Report on Form 8-K filed with the SEC on May 23, 2019 (File No. 001-36491)). |
|
|
10.12 | Distribution Agreement, dated November 27, 2019, among Century Communities, Inc. and J.P. Morgan Securities LLC, BofA Securities, Inc., Citigroup Global Markets Inc., and Fifth Third Securities, Inc. (incorporated by reference to Exhibit 1.1 to Century Communities, Inc.’s Current Report on Form 8-K filed with the SEC on November 27, 2019 (File No. 001-36491)). |
|
|
10.13 | Amendment No. 1 to Distribution Agreement, dated August 3, 2021, among Century Communities, Inc. and J.P. Morgan Securities LLC, BofA Securities, Inc., Citigroup Global Markets Inc., Fifth Third Securities, Inc., and Wells Fargo Securities, LLC (incorporated by reference to Exhibit 1.1 to Century Communities, Inc.’s Current Report on Form 8-K filed with the SEC on August 4, 2015)3, 2021 (File No. 001-36491)). |
|
|
10.1210.14
| Second ModificationPurchase Agreement, dated as of December 22, 2015, by andAugust 3, 2021, among Century Communities, Inc., Texas Capital Bank, National Association, as Administrative Agent, the lendersGuarantors party thereto, and BofA Securities, Inc., as representative of the subsidiary guarantors of Century Communities, Inc. partyinitial purchasers named in Schedule A thereto (incorporated by reference to Century Communities, Inc.’s Current Report on Form 8-K filed with the SEC on December 23, 2015).
|
| |
10.13
| Third Modification Agreement, dated as of August 19, 2016, by and among Century Communities, Inc., Texas Capital Bank, National Association, as Administrative Agent, the lenders party thereto, and the subsidiary guarantors of Century Communities, Inc. party thereto (incorporated by referenceExhibit 10.1 to Century Communities, Inc.’s Current Report on Form 8-K filed with the SEC on August 24, 2016)5, 2021 (File No. 001-36491)).
|
|
|
10.1421.1
| Commitment Increase Agreement, dated as of February 24, 2017, by and among Century Communities, Inc., Texas Capital Bank, National Association, as Administrative Agent, Flagstar Bank, FSB, and the subsidiary guarantorsSubsidiaries of Century Communities, Inc. party thereto (incorporated by reference to Century Communities, Inc.’s Current Report on Form 8-K filed with the SEC on March 2, 2017)(filed herewith).
|
|
|
_____________________
†Management contract or compensatory plan or arrangement.
ITEM 16.FORM 10-K SUMMARY.
None.
SIGNATURES
SIGNATURES
Pursuant to the requirements of Section 13 or 15(d) of the Securities Exchange Act of 1934, as amended, the Registrant has duly caused this report to be signed on its behalf by the undersigned, thereunto duly authorized.
|
|
|
|
|
|
|
|
|
|
|
|
|
|
|
|
|
| Century Communities, Inc. |
|
|
|
|
Date: March 1, 2018February 2, 2022 |
|
|
| By: |
| /s/ Dale Francescon |
|
|
|
|
|
| Dale Francescon |
|
|
|
|
|
| Chairman of the Board and Co-Chief Executive Officer (Co-Principal Executive Officer) |
|
|
|
|
Date: March 1, 2018February 2, 2022 |
|
|
| By: |
| /s/ Robert J. Francescon |
|
|
|
|
|
| Robert J. Francescon |
|
|
|
|
|
| Co-Chief Executive Officer and President (Co-Principal Executive Officer) |
|
|
|
|
Pursuant to the requirements of the Securities Exchange Act of 1934, as amended, this report has been signed below by the following persons on behalf of the Registrant and in the capacities and on the dates indicated.
|
|
|
|
|
|
| |
| |
|
| Title
| | Date
|
| | |
/s/ Dale Francescon Dale Francescon |
| Chairman of the Board of Directors and Co-Chief Executive Officer (Co-Principal Executive Officer) |
| March 1, 2018February 2, 2022
|
|
|
|
Robert J. Francescon |
| Co-Chief Executive Officer, President and Director (Co-Principal Executive Officer) |
| March 1, 2018February 2, 2022
|
|
|
|
David L. Messenger |
| Chief Financial Officer (Principal Financial Officer) |
| March 1, 2018February 2, 2022
|
|
|
|
|
|
|
| | Chief Accounting Officer |
|
|
J. Scott Dixon |
| (Principal Accounting Officer) |
| March 1, 2018February 2, 2022
|
|
|
|
|
|
/s/ David L. Messenger, attorney in fact James M. LippmanPatricia L. Arvielo
|
| Director |
| March 1, 2018February 2, 2022
|
|
|
|
|
|
/s/ David L. Messenger, attorney in fact Keith R. GuerickeJohn P. Box
|
| Director |
| March 1, 2018February 2, 2022
|
|
|
|
|
|
/s/ David L. Messenger, attorney in fact John P. BoxKeith R. Guericke
|
| Director |
| March 1, 2018February 2, 2022
|
/s/ David L. Messenger, attorney in fact James M. Lippman |
|
Director |
|
February 2, 2022 |
CENTURY COMMUNITIES, INC.
INDEX TO CONSOLIDATED FINANCIAL STATEMENTS
| Page |
|
|
|
|
Consolidated Financial Statements |
|
Report of Independent Registered Public Accounting Firm (PCAOB 00042) | F-2F-2
|
Consolidated Balance Sheets as of December 31, 20172021 and 20162020 | F-3F-4
|
Consolidated Statements of Operations for the Years Ended December 31, 2017, 20162021, 2020 and 20152019 | F-4F-5
|
Consolidated Statements of Stockholders' Equity for the Years Ended December 31, 2017, 20162021, 2020 and 20152019 | F-5F-6
|
Consolidated Statements of Cash Flows for the Years Ended December 31, 2017, 20162021, 2020 and 20152019 | F-6F-7
|
Notes to the Consolidated Financial Statements | F-7F-8
|
Report of IndependentIndependent Registered Public Accounting Firm
TheTo the Board of Directors and Stockholders of Century Communities, Inc.
Opinion on the Financial Statements
We have audited the accompanying consolidated balance sheets of Century Communities, Inc. (the Company) as of December 31, 20172021 and 2016, and2020, the related consolidated statements of operations, stockholders’ equity and cash flows for each of the three years in the period ended December 31, 2017,2021, and the related notes (collectively referred to as the “financial“consolidated financial statements”). In our opinion, the consolidated financial statements present fairly, in all material respects, the consolidated financial position of the Company at December 31, 20172021 and 2016,2020, and the consolidated results of its operations and its cash flows for each of the three years in the period ended December 31, 2017,2021, in conformity with U.S. generally accepted accounting principles.
We also have audited, in accordance with the standards of the Public Company Accounting Oversight Board (United States) (PCAOB), the Company'sCompany’s internal control over financial reporting as of December 31, 2017,2021, based on criteria established in Internal Control-Integrated Framework issued by the Committee of Sponsoring Organizations of the Treadway Commission (2013 framework), and our report dated March 1, 2018February 2, 2022 expressed an unqualified opinion thereon.
Basis for Opinion
These financial statements are the responsibility of the Company'sCompany’s management. Our responsibility is to express an opinion on the Company’s financial statements based on our audits. We are a public accounting firm registered with the PCAOB and are required to be independent with respect to the Company in accordance with the U.S. federal securities laws and the applicable rules and regulations of the Securities and Exchange Commission and the PCAOB.
We conducted our audits in accordance with the standards of the PCAOB. Those standards require that we plan and perform the audit to obtain reasonable assurance about whether the financial statements are free of material misstatement, whether due to error or fraud. Our audits included performing procedures to assess the risks of material misstatement of the financial statements, whether due to error or fraud, and performing procedures that respond to those risks. Such procedures included examining, on a test basis, evidence regarding the amounts and disclosures in the financial statements. Our audits also included evaluating the accounting principles used and significant estimates made by management, as well as evaluating the overall presentation of the financial statements. We believe that our audits provide a reasonable basis for our opinion.
Critical Audit Matter
The critical audit matter communicated below is a matter arising from the current period audit of the financial statements that was communicated or required to be communicated to the audit committee and that: (1) relates to accounts or disclosures that are material to the financial statements and (2) involved our especially challenging, subjective or complex judgments. The communication of the critical audit matter does not alter in any way our opinion on the consolidated financial statements, taken as a whole, and we are not, by communicating the critical audit matter below, providing a separate opinion on the critical audit matter or on the accounts or disclosures to which it relates.
|
|
|
|
| Impairment of Inventories |
Description of the Matter |
| As more fully described in Note 1 to the consolidated financial statements, management evaluates inventories for impairment at the community level. If an indicator of impairment is identified, the Company estimates the recoverability of the community by comparing the estimated future cash flows on an undiscounted basis to its carrying value.
When indicators of impairment have been identified, auditing the Company’s assessment of inventories for impairment requires subjective auditor judgment in evaluating the expected homebuilding revenues included in the estimated future undiscounted cash flows. The estimated future homebuilding revenues is a forward-looking assumption that can be significantly affected by sub-market information including competition, customer demand for a specific type of home, recent pricing trends, and sales pace. This assumption can have a significant impact on the results of the estimated future undiscounted cash flows and the evaluation of recoverability. |
How We Addressed the Matter in Our Audit |
| We tested the Company’s internal controls over the inventory impairment process. This included testing controls over management’s review of the homebuilding revenues, which is a significant assumption, and their analysis of the forecasted revenue amounts compared to the historical average sales price and sales price trends. Our testing of the Company's impairment analysis included, among other procedures, evaluating the significant assumptions and operating data used to estimate the future undiscounted cash flows. To test the homebuilding revenues assumption included in the estimated future undiscounted cash flows, among other procedures, we compared the home sales revenue assumption and estimated sales pace at the community level to market industry information, including publicly available competitor data, recent pricing trends, changes in customer demands, and historical community operating trends.
|
/s/ Ernst & Young LLP
We have served as the Company’s auditor since 2013.
Denver, Colorado
February 2, 2022
March 1, 2018
Century Communities, Inc.
Consolidated Balance Sheets
As of December 31, 20172021 and 2016 2020
(in thousands)thousands, except share and per share amounts)
| | | | | | |
|
|
|
|
|
|
| | | | | | |
|
|
|
|
|
|
| | December 31, | | December 31, |
| December 31, |
| December 31, |
| | 2017 | | 2016 |
| 2021 |
| 2020 |
Assets | | | | | | |
|
|
|
|
Cash and cash equivalents | | $ | 88,832 | | $ | 29,450 |
| $ | 316,310 |
| $ | 394,001 |
Cash held in escrow | | | 37,723 | | | 20,044 |
|
| 52,297 |
|
| 23,149 |
Accounts receivable | | | 12,999 | | | 5,656 |
|
| 41,932 |
|
| 21,781 |
Inventories | | | 1,390,354 | | | 857,885 |
|
| 2,456,614 |
|
| 1,929,664 |
Mortgage loans held for sale | | | 52,327 | | | — |
|
| 353,063 |
|
| 282,639 |
Prepaid expenses and other assets | | | 60,812 | | | 34,714 |
|
| 200,087 |
|
| 122,630 |
Property and equipment, net | | | 27,911 | | | 15,935 |
|
| 24,939 |
|
| 28,384 |
Investment in unconsolidated subsidiaries | | | 28,208 | | | 18,275 | |
Deferred tax assets, net | | | 5,555 | | | — |
|
| 21,239 |
|
| 12,450 |
Amortizable intangible assets, net | | | 2,938 | | | 4,204 | |
Goodwill | | | 27,363 | | | 21,365 |
|
| 30,395 |
|
| 30,395 |
Total assets | | $ | 1,735,022 | | $ | 1,007,528 |
| $ | 3,496,876 |
| $ | 2,845,093 |
Liabilities and stockholders' equity | | | | | | |
|
|
|
|
|
|
Liabilities: | | | | | | |
|
|
|
|
|
|
Accounts payable | | $ | 24,831 | | $ | 15,726 |
| $ | 84,679 |
| $ | 107,712 |
Accrued expenses and other liabilities | | | 150,356 | | | 62,296 |
|
| 316,877 |
|
| 302,751 |
Deferred tax liability, net | | | — | | | 1,782 | |
Senior notes payable | | | 776,283 | | | 259,088 | |
Notes payable | |
|
| 998,936 |
|
| 894,875 |
Revolving line of credit | | | — | | | 195,000 |
|
| — |
|
| — |
Mortgage repurchase facilities | | | 48,319 | | | — |
|
| 331,876 |
|
| 259,050 |
Total liabilities | | | 999,789 | | | 533,892 |
|
| 1,732,368 |
|
| 1,564,388 |
Stockholders' equity: | | | | | | |
|
|
|
|
|
|
Preferred stock, $0.01 par value, 50,000,000 shares authorized, none outstanding | | | — | | | — |
|
| — |
|
| — |
Common stock, $0.01 par value, 100,000,000 shares authorized, 29,502,624 and 21,620,544 shares issued and outstanding at December 31, 2017 and December 31, 2016, respectively | | | 295 | | | 216 | |
Common stock, $0.01 par value, 100,000,000 shares authorized, 33,760,940 and 33,350,633 shares issued and outstanding at December 31, 2021 and December 31, 2020, respectively | |
|
| 338 |
|
| 334 |
Additional paid-in capital | | | 566,790 | | | 355,567 |
|
| 697,845 |
|
| 697,200 |
Retained earnings | | | 168,148 | | | 117,853 |
|
| 1,066,325 |
|
| 583,171 |
Total stockholders' equity | | | 735,233 | | | 473,636 |
|
| 1,764,508 |
|
| 1,280,705 |
Total liabilities and stockholders' equity | | $ | 1,735,022 | | $ | 1,007,528 |
| $ | 3,496,876 |
| $ | 2,845,093 |
See Notes to Consolidated Financial Statements.
Century Communities, Inc.
Consolidated Statements of Operations
For the Years Ended December 31, 2017, 20162021, 2020 and 20152019
(in thousands, except per share amounts)
| |
|
|
|
|
|
|
|
|
|
| | | | | | | | | |
|
|
|
|
|
|
|
|
|
| | Year Ended December 31, |
| Year Ended December 31, |
| | 2017 | | 2016 | | | 2015 |
| 2021 |
| 2020 |
| 2019 |
Revenues | | | | | | | | | |
|
|
|
|
|
|
|
|
|
Homebuilding revenues | | | | | | | | | |
|
|
|
|
|
|
|
|
|
Home sales revenues | | $ | 1,405,443 | | $ | 978,733 | | $ | 725,437 |
| $ | 4,032,969 |
| $ | 3,027,167 |
| $ | 2,481,465 |
Land sales and other revenues | | | 8,503 | | | 15,707 | | | 9,052 |
|
| 59,607 |
|
| 30,717 |
|
| 11,184 |
| | | 1,413,946 | | | 994,440 | | | 734,489 | |
Financial services revenue | | | 9,853 | | | — | | | — | |
Total homebuilding revenues | |
|
| 4,092,576 |
|
| 3,057,884 |
|
| 2,492,649 |
Financial services revenues | |
|
| 123,738 |
|
| 103,308 |
|
| 43,262 |
Total revenues | | | 1,423,799 | | | 994,440 | | | 734,489 |
|
| 4,216,314 |
|
| 3,161,192 |
|
| 2,535,911 |
Homebuilding Cost of Revenues | | | | | | | | | | |
Homebuilding cost of revenues | |
|
|
|
|
|
|
|
|
|
Cost of home sales revenues | | | (1,153,359) | | | (786,127) | | | (579,203) |
|
| (3,056,048) |
|
| (2,468,133) |
|
| (2,040,241) |
Cost of land sales and other revenues | | | (6,516) | | | (14,217) | | | (8,432) |
|
| (39,315) |
|
| (21,929) |
|
| (8,130) |
| | | (1,159,875) | | | (800,344) | | | (587,635) | |
Total homebuilding cost of revenues | |
|
| (3,095,363) |
|
| (2,490,062) |
|
| (2,048,371) |
Financial services costs | | | (8,664) | | | — | | | — |
|
| (72,578) |
|
| (54,797) |
|
| (32,575) |
Selling, general, and administrative | | | (176,304) | | | (122,224) | | | (87,840) | |
Acquisition expense | | | (9,905) | | | (490) | | | (491) | |
Equity in income of unconsolidated subsidiaries | | | 12,176 | | | 191 | | | — | |
Other income | | | 2,937 | | | 1,576 | | | 1,782 | |
Selling, general and administrative | |
|
| (389,610) |
|
| (341,710) |
|
| (301,525) |
Loss on debt extinguishment | |
|
| (14,458) |
|
| — |
|
| (10,832) |
Inventory impairment and other | |
|
| (41) |
|
| (2,172) |
|
| (4,783) |
Other income (expense) | |
|
| (3,142) |
|
| (2,211) |
|
| (5,190) |
Income before income tax expense | | | 84,164 | | | 73,149 | | | 60,305 |
|
| 641,122 |
|
| 270,240 |
|
| 132,635 |
Income tax expense | | | (33,869) | | | (23,609) | | | (20,415) |
|
| (142,618) |
|
| (64,083) |
|
| (19,641) |
Net income | | $ | 50,295 | | $ | 49,540 | | $ | 39,890 |
| $ | 498,504 |
| $ | 206,157 |
| $ | 112,994 |
| | | | | | | | | |
|
|
|
|
|
|
|
|
|
Earnings per share: | | | | | | | | | |
|
|
|
|
|
|
|
|
|
Basic | | $ | 2.06 | | $ | 2.34 | | $ | 1.88 |
| $ | 14.79 |
| $ | 6.19 |
| $ | 3.66 |
Diluted | | $ | 2.03 | | $ | 2.33 | | $ | 1.88 |
| $ | 14.47 |
| $ | 6.13 |
| $ | 3.62 |
Weighted average common shares outstanding: | | | | | | | | | |
|
|
|
|
|
|
|
|
|
Basic | | | 24,280,871 | | | 20,679,189 | | | 20,569,012 |
|
| 33,706,782 |
|
| 33,312,554 |
|
| 30,886,382 |
Diluted | | | 24,555,509 | | | 20,791,937 | | | 20,569,012 |
|
| 34,444,918 |
|
| 33,610,098 |
|
| 31,186,952 |
See Notes to Consolidated Financial Statements.
Century Communities, Inc.
Consolidated Statements of Stockholders’ Equity
For the Years Ended December 31, 2017, 20162021, 2020 and 20152019
(in thousands)
| | | | | | | | | | | | | | |
| | | | | | | Paid-In | | Retained | | Total |
| | Shares | | Amount | | Capital | | Earnings | | Equity |
Balance at December 31, 2014 | | 20,876 | | $ | 209 | | $ | 336,573 | | $ | 28,423 | | $ | 365,205 |
Repurchase of common stock upon vesting of restricted stock awards | | (44) | | | — | | | (861) | | | — | | | (861) |
Issuance of restricted stock awards | | 501 | | | — | | | — | | | — | | | — |
Stock-based compensation expense | | — | | | 4 | | | 5,241 | | | — | | | 5,245 |
Forfeitures of restricted stock awards | | (29) | | | — | | | — | | | — | | | — |
Net income | | — | | | — | | | — | | | 39,890 | | | 39,890 |
Balance at December 31, 2015 | | 21,304 | | $ | 213 | | $ | 340,953 | | $ | 68,313 | | $ | 409,479 |
Issuance of common stock | | 578 | | | 6 | | | 11,363 | | | — | | | 11,369 |
Repurchase of common stock | | (159) | | | (2) | | | (2,391) | | | — | | | (2,393) |
Repurchase of common stock upon vesting of restricted stock awards | | (60) | | | (1) | | | (1,015) | | | — | | | (1,016) |
Stock-based compensation expense | | — | | | — | | | 6,657 | | | — | | | 6,657 |
Forfeitures of restricted stock awards | | (42) | | | — | | | — | | | — | | | — |
Net income | | — | | | — | | | — | | | 49,540 | | | 49,540 |
Balance at December 31, 2016 | | 21,621 | | $ | 216 | | $ | 355,567 | | $ | 117,853 | | $ | 473,636 |
Issuance of common stock | | 3,897 | | | 39 | | | 97,301 | | | — | | | 97,340 |
Issuance of common stock in connection with business combination | | 4,176 | | | 42 | | | 107,737 | | | — | | | 107,779 |
Replacement award value in connection with business combination | | — | | | — | | | 1,149 | | | — | | | 1,149 |
Repurchase of common stock upon vesting of restricted stock awards | | (189) | | | (2) | | | (4,506) | | | — | | | (4,508) |
Stock-based compensation expense | | — | | | — | | | 9,542 | | | — | | | 9,542 |
Forfeitures of restricted stock awards | | (2) | | | — | | | — | | | — | | | — |
Net income | | — | | | — | | | — | | | 50,295 | | | 50,295 |
Balance at December 31, 2017 | | 29,503 | | $ | 295 | | $ | 566,790 | | $ | 168,148 | | $ | 735,233 |
|
|
|
|
|
|
|
|
|
|
|
|
|
|
|
|
|
|
|
|
|
| Additional |
|
|
|
| Total |
|
|
|
|
|
|
| Paid-In |
| Retained |
| Stockholders' |
|
| Shares |
| Amount |
| Capital |
| Earnings |
| Equity |
Balance at December 31, 2018 |
| 30,155 |
| $ | 302 |
| $ | 595,037 |
| $ | 264,020 |
| $ | 859,359 |
Issuance of common stock, net |
| 2,717 |
|
| 27 |
|
| 79,025 |
|
| — |
|
| 79,052 |
Repurchases of common stock |
| (83) |
|
| (1) |
|
| (1,438) |
|
| — |
|
| (1,439) |
Vesting of restricted stock units |
| 430 |
|
| 4 |
|
| (4) |
|
| — |
|
| — |
Withholding of common stock upon vesting of restricted stock units |
| (152) |
|
| (1) |
|
| (3,582) |
|
| — |
|
| (3,583) |
Stock-based compensation expense |
| — |
|
| — |
|
| 15,316 |
|
| — |
|
| 15,316 |
Net income |
| — |
|
| — |
|
| — |
|
| 112,994 |
|
| 112,994 |
Balance at December 31, 2019 |
| 33,067 |
| $ | 331 |
| $ | 684,354 |
| $ | 377,014 |
| $ | 1,061,699 |
Vesting of restricted stock units |
| 454 |
|
| 5 |
|
| (5) |
|
| — |
|
| — |
Withholding of common stock upon vesting of restricted stock units |
| (170) |
|
| (2) |
|
| (5,098) |
|
| — |
|
| (5,100) |
Stock-based compensation expense |
| — |
|
| — |
|
| 18,334 |
|
| — |
|
| 18,334 |
Other |
| — |
|
| — |
|
| (385) |
|
| — |
|
| (385) |
Net income |
| — |
|
| — |
|
| — |
|
| 206,157 |
|
| 206,157 |
Balance at December 31, 2020 |
| 33,351 |
| $ | 334 |
| $ | 697,200 |
| $ | 583,171 |
| $ | 1,280,705 |
Vesting of restricted stock units and issuance of unrestricted common stock awards |
| 675 |
|
| 7 |
|
| (7) |
|
| — |
|
| — |
Withholding of common stock upon vesting of restricted stock units |
| (265) |
|
| (3) |
|
| (13,723) |
|
| — |
|
| (13,726) |
Stock-based compensation expense |
| — |
|
| — |
|
| 14,377 |
|
| — |
|
| 14,377 |
Cash dividends declared |
| — |
|
| — |
|
| 158 |
|
| (15,350) |
|
| (15,192) |
Other |
| — |
|
| — |
|
| (160) |
|
| — |
|
| (160) |
Net income |
| — |
|
| — |
|
| — |
|
| 498,504 |
|
| 498,504 |
Balance at December 31, 2021 |
| 33,761 |
| $ | 338 |
| $ | 697,845 |
| $ | 1,066,325 |
| $ | 1,764,508 |
See Notes to Consolidated Financial Statements.
Century Communities, Inc.
Consolidated Statements of Cash Flows
For the Years Ended December 31, 2017, 20162021, 2020 and 2015 2019
(in thousands)
| | | | | | | | | |
|
|
|
|
|
|
|
|
|
| | Year Ended December 31, |
| Year Ended December 31, |
| | 2017 | | 2016 | | 2015 |
| 2021 |
| 2020 |
| 2019 |
Operating activities | | | | | | | | | |
|
|
|
|
|
|
|
|
|
Net income | | $ | 50,295 | | $ | 49,540 | | $ | 39,890 |
| $ | 498,504 |
| $ | 206,157 |
| $ | 112,994 |
Adjustments to reconcile net income to net cash used in operating activities: | | | | | | | | | | |
Adjustments to reconcile net income to net cash provided by (used in) operating activities: | |
|
|
|
|
|
|
|
|
|
Depreciation and amortization | | | 6,973 | | | 5,580 | | | 4,713 |
|
| 10,912 |
|
| 13,141 |
|
| 13,382 |
Stock-based compensation expense | | | 9,542 | | | 6,657 | | | 5,245 |
|
| 14,377 |
|
| 18,334 |
|
| 15,316 |
Fair value of mortgage loans held for sale and other | |
|
| 5 |
|
| (7,145) |
|
| (1,566) |
Loss on debt extinguishment | |
|
| 14,458 |
|
| — |
|
| 10,832 |
Inventory impairment and other | |
|
| 41 |
|
| 2,172 |
|
| 4,783 |
Deferred income taxes | | | 674 | | | 1,507 | | | 1,634 |
|
| (8,701) |
|
| (1,861) |
|
| 3,174 |
Distribution of income from unconsolidated subsidiaries | | | 5,243 | | | — | | | — | |
Equity in income of unconsolidated subsidiaries | | | (12,176) | | | (191) | | | — | |
(Gain) loss on disposition of assets | | | 577 | | | (446) | | | (128) | |
Loss on disposition of assets | |
|
| 1,483 |
|
| 1,425 |
|
| 361 |
Changes in assets and liabilities: | | | | | | | | | |
|
|
|
|
|
|
|
|
|
Cash held in escrow | | | (17,679) | | | (8,227) | | | (1,821) |
|
| (29,148) |
|
| 12,159 |
|
| (10,964) |
Accounts receivable | | | (166) | | | (488) | | | (1,438) |
|
| (5,763) |
|
| 5,657 |
|
| (13,974) |
Inventories | | | (83,380) | | | (91,859) | | | (208,524) |
|
| (580,365) |
|
| 94,498 |
|
| (129,024) |
Mortgage loans held for sale | |
|
| (72,378) |
|
| (90,248) |
|
| (72,853) |
Prepaid expenses and other assets | | | (19,959) | | | (13,420) | | | 4,811 |
|
| (76,478) |
|
| 3,142 |
|
| 43,108 |
Accounts payable | | | (3,670) | | | 4,657 | | | (6,102) |
|
| (23,033) |
|
| 22,918 |
|
| (5,113) |
Accrued expenses and other liabilities | | | 1,405 | | | 854 | | | (1,014) |
|
| 54,933 |
|
| 60,229 |
|
| (39,263) |
Mortgage loans held for sale | | | (52,327) | | | — | | | — | |
Net cash used in operating activities | | | (114,648) | | | (45,836) | | | (162,734) | |
Net cash provided by (used in) operating activities | |
|
| (201,153) |
|
| 340,578 |
|
| (68,807) |
Investing activities | | | | | | | | | |
|
|
|
|
|
|
|
|
|
Purchases of property and equipment | | | (17,627) | | | (7,762) | | | (5,750) |
|
| (11,576) |
|
| (9,004) |
|
| (16,797) |
Business combinations net of acquired cash | | | (130,047) | | | — | | | — | |
Proceeds from sale of South Carolina operations | | | 17,074 | | | — | | | — | |
Investment in unconsolidated subsidiaries | | | (4,000) | | | (17,000) | | | — | |
Other investing activities | | | 154 | | | 1,561 | | | 1,518 | |
Proceeds from sale of property and equipment and intangible asset | |
|
| 2,666 |
|
| 482 |
|
| 2,410 |
Proceeds from secured note receivable and other | |
|
| 2,434 |
|
| 117 |
|
| 104 |
Net cash used in investing activities | | | (134,446) | | | (23,201) | | | (4,232) |
|
| (6,476) |
|
| (8,405) |
|
| (14,283) |
Financing activities | | | | | | | | | |
|
|
|
|
|
|
|
|
|
Borrowings under revolving credit facilities | | | 175,000 | | | 220,000 | | | 180,000 |
|
| 30,000 |
|
| 678,000 |
|
| 1,548,500 |
Payments on revolving credit facilities | | | (370,000) | | | (160,000) | | | (65,000) |
|
| (30,000) |
|
| (746,700) |
|
| (1,682,300) |
Proceeds from issuance of senior notes | | | 527,500 | | | — | | | 58,956 | |
Proceeds from issuance of senior notes due 2029 | |
|
| 500,000 |
|
| — |
|
| — |
Extinguishment of senior notes due 2025 | |
|
| (411,752) |
|
| — |
|
| — |
Proceeds from issuance of senior notes due 2027 | |
|
| — |
|
| — |
|
| 500,000 |
Extinguishment of senior notes due 2022 | |
|
| — |
|
| — |
|
| (391,942) |
Proceeds from issuance of insurance premium notes and other | | | 2,320 | | | 11,612 | | | 1,169 |
|
| 21,484 |
|
| 5,778 |
|
| 13,719 |
Principal payments on notes payable | | | (6,998) | | | (9,217) | | | (8,656) | |
Repayment of debt assumed in business combination | | | (151,919) | | | — | | | — | |
Principal payments on insurance premium notes and other | |
|
| (15,532) |
|
| (8,769) |
|
| (20,237) |
Debt issuance costs | | | (8,579) | | | (1,156) | | | (2,817) |
|
| (6,159) |
|
| (392) |
|
| (6,140) |
Net proceeds from mortgage repurchase facilities | | | 48,320 | | | — | | | — |
|
| 72,826 |
|
| 84,955 |
|
| 69,540 |
Net proceeds from issuances of common stock | | | 98,063 | | | 11,369 | | | — |
|
| — |
|
| — |
|
| 79,052 |
Repurchases of common stock upon vesting of restricted stock awards | | | (5,231) | | | (1,015) | | | (861) | |
Repurchases of common stock under our stock repurchase program | | | — | | | (2,393) | | | — | |
Withholding of common stock upon vesting of restricted stock units | |
|
| (13,726) |
|
| (5,100) |
|
| (3,583) |
Repurchases of common stock under stock repurchase program | |
|
| — |
|
| — |
|
| (1,439) |
Dividend payments | |
|
| (15,192) |
|
| — |
|
| — |
Other | |
|
| (160) |
|
| (385) |
|
| — |
Net cash provided by financing activities | | | 308,476 | | | 69,200 | | | 162,791 |
|
| 131,789 |
|
| 7,387 |
|
| 105,170 |
Net decrease in cash and cash equivalents | | $ | 59,382 | | $ | 163 | | $ | (4,175) | |
Cash and cash equivalents | | | | | | | | | | |
Net increase (decrease) | |
| $ | (75,840) |
| $ | 339,560 |
| $ | 22,080 |
Cash and cash equivalents and Restricted cash | |
|
|
|
|
|
|
|
|
|
Beginning of period | | | 29,450 | | | 29,287 | | | 33,462 |
|
| 398,081 |
|
| 58,521 |
|
| 36,441 |
End of period | | $ | 88,832 | | $ | 29,450 | | $ | 29,287 |
| $ | 322,241 |
| $ | 398,081 |
| $ | 58,521 |
Supplemental cash flow disclosure | | | | | | | | | |
|
|
|
|
|
|
|
|
|
Cash paid for income taxes | | $ | 29,632 | | $ | 23,467 | | $ | 18,657 |
| $ | 155,590 |
| $ | 48,789 |
| $ | 26,936 |
Cash and cash equivalents and Restricted cash | |
|
|
|
|
|
|
|
|
|
Cash and cash equivalents | |
| $ | 316,310 |
| $ | 394,001 |
| $ | 55,436 |
Restricted cash (Note 6) | |
|
| 5,931 |
|
| 4,080 |
|
| 3,085 |
Cash and cash equivalents and Restricted cash | |
| $ | 322,241 |
| $ | 398,081 |
| $ | 58,521 |
See Notes to Consolidated Financial Statements.
Century Communities, Inc.
Notes to the Consolidated Financial Statements
December 31, 2017, 20162021, 2020 and 2015 2019
1. Nature of Operations and Summary of Significant Accounting Policies
Nature of Operations
Century Communities, Inc. (which we refer to as “we,” “CCS,” or the “Company”), together with its subsidiaries, is engaged in the development, design, construction, marketing and sale of single-family attached and detached homes in metropolitan areas in the States of California, Colorado, Georgia, Nevada, North Carolina, South Carolina, Tennessee, Texas, Utah, and Washington.17 states. In many of our projects, in addition to building homes, we are responsible for the entitlement and development of the underlying land. We build and sell homes under our Century Communities and Century Complete brands. Our Century Communities brand offers a wide range of buyer profiles including: entry-level, first and second time move-up, and lifestyle homebuyers, and provides our homebuyers with the ability to personalize their homes through certain option and upgrade selections. Our Century Complete brand targets entry-level homebuyers, primarily sells homes through retail studios and the internet, and generally provides no option or upgrade selections.Our homebuilding operations are organized into the following four5 reportable segments based on the geographic regions in which we operate:segments: West, Mountain, Texas, Southeast, and Southeast.Century Complete. Additionally, our indirect wholly-owned subsidiaries, Inspire Home Loans Inc., Parkway Title, LLC, and Parkway Title,IHL Home Insurance Agency, LLC, which provide mortgage, servicestitle, and titleinsurance services, respectively, primarily to our home buyers have been identified as our Financial Services segment.
On August 4, 2017, we acquired UCP, Inc. (which we refer to as “UCP”) which was a homebuilder and land developer with expertise in residential land acquisition, development and entitlement, as well as home design, construction and sales, and with operations in the States of California, Washington, North Carolina, South Carolina and Tennessee. The merger was unanimously approved by the board of directors of both the Company and UCP and was also approved by UCP stockholders on August 1, 2017. In connection with the merger, each share of UCP Class A common stock outstanding immediately prior to the closing was converted into $5.32 in cash and 0.2309 of a newly issued share of our common stock. Approximately 4.2 million shares of our common stock were issued and $100.2 million in cash was paid in connection with the merger. Additionally, on October 31, 2017, we acquired substantially all the assets and operations and assumed certain liabilities of Sundquist Homes and affiliates (which we refer to as “Sundquist Homes”), a homebuilder with operations in the greater Seattle, Washington area, for approximately $50.2 million in cash. Our operating results presented herein include the operations of UCP and Sundquist Homes from the dates of the respective acquisitions through December 31, 2017.
Principles of Consolidation
The consolidated financial statements include the accounts of the Company, as well as all subsidiaries in which we have a controlling interest, and each variable interest entity (which we refer to as “VIE”)entities for which the Company is deemed to be the primary beneficiary. We do not have any variable interest entities in which we are deemed the primary beneficiary. All intercompany accounts and transactions have been eliminated.
All numbers related to lots and communities disclosed in the notes to the consolidated financial statements are unaudited.
Use of Estimates
The preparation of financial statements in conformity with U.S. generally accepted accounting principles (GAAP)(which we refer to as “GAAP”) requires management to make estimates and assumptions that affect the reported amounts of assets and liabilities and disclosure of contingent assets and liabilities at the date of the consolidated financial statements and the reported amounts of revenues and expenses during the reporting period. Accordingly, actual results could differ from those estimates.
Cash and Cash Equivalents
The Company considers all liquid investments with original maturities of three months or less to be cash equivalents.
Cash Held in Escrow
Cash held in escrow consists of amounts related to the proceeds from home closings held for our benefit in escrow, which are typically held for less than a few days.
Accounts Receivable
Accounts receivable primarily consists of contractrebates receivables, related to certain contracts in our Texas segment accounted forreceivables under the percentage-of-completion method,insurance policies, and income tax receivables and rebates receivables.
We periodically review the collectability of our accounts receivables,receivable, and, if it is determined that a receivable might not be fully collectible, an allowance is recorded for the amount deemed uncollectible. As of December 31, 2017 and 2016, no allowance was recorded related to accounts receivable.
Inventories and Cost of Sales
We capitalize pre-acquisition, land, development, and other allocated costs, including interest, during development, periods of entitlement, and home construction.
Land, development, and other common costs are allocated to inventory using the relative-sales-value method; however, as lots within a project typically have comparable market values, we generally allocate land, development, and common costs equally to each lot within the project. Home construction costs are recorded using the specific-identification method. Cost of sales for homes closed includes the allocation of construction costs of each home and all applicable land acquisition, land development, and related common costs, both incurred and estimated to be incurred. Changes to estimated total development costs subsequent to initial home closings in a community are generally allocated to the remaining homes in the community.
When a home is closed, the Company generally has not paid all incurred costs necessary to complete the home, and a liability and a charge to cost of home sales revenues are recorded for the amount that is estimated will ultimately be paid related to completed homes.
Inventories are carried at cost unless events and circumstances indicate that the carrying value may not be recoverable. We review for indicators of impairment at the lowest level of identifiable cash flows, which we have determined asto be the community level.
Indicators of impairment include, but are not limited to, significant decreases in local housing market values and selling prices of comparable homes, decreases in actual or trending gross margins or sales absorption rates, significant unforeseen cost in excess of budget, and actual or projected cash flow losses.
If an indicator of impairment is identified, we estimate the recoverability of the community by comparing the estimated future cash flows on an undiscounted basis to its carrying value. If the undiscounted cash flows are more than the carrying value, the community is recoverable and no impairment is recorded. If the undiscounted cash flows are less than the community’s carrying value, we generally estimate the fair value using a discounted cash flow approach. A community with a fair value less than its carrying value is impaired and is written down to fair value.
When estimating cash flows of a community, we make various assumptions, including the following: (i) expected sales prices and sales incentives to be offered, including the number of homes available, pricing and incentives being offered by us or other builders in other communities, and future sales price adjustments based on market and economic trends; (ii) expected sales pace based on local housing market conditions, competition, and historical trends; (iii) costs expended to date and expected to be incurred, including, but not limited to, land and land development costs, home construction costs, interest costs, indirect construction and overhead costs, and selling and marketing costs; and (iv) alternative uses for the property. For the year ended December 31, 2017,2021, we recorded nominal impairment charges on 1 community and for the year ended December 31, 2020, we recorded impairment charges on five4 communities totaling $0.8 million, which is$2.2 million. Inventory impairments are included in “Cost of home sales revenues”inventory impairment and other in our Consolidated Statementsconsolidated statements of Operations. For the years ended December 31, 2016 and 2015, no inventory impairments were recorded.operations.
Home Sales Revenues and Profit Recognition
RevenuesAs defined in the Accounting Standards Codification (which we refer to as “ASC”) 606, Revenue from Contracts with Customers (“ASC 606”), revenues from home sales and the related profit are recorded and a profit is recognizedwhen our performance obligations are satisfied, which generally occurs when the respective unitshomes are closed and title has passed to our homebuyers. We generally satisfy our performance obligations in less than one year from the homeowner’s initial and continuing investmentcontract date. Proceeds from home closings that are held for our benefit in escrow, are presented as cash held in escrow on our consolidated balance sheets. Cash held for our benefit in escrow is adequate, and other attributes of ownership have been transferred totypically held by the homeowner. Sales incentives are recorded asescrow agent for a reduction of revenues when the respective unit is closed.few days. When it is determined that the earnings process is not complete and we have remaining performance obligations that are material in the sale andcontext of the contract, the related profitrevenue and costs are deferred for recognition in future periods.
We also serveperiods until those performance obligations have been satisfied. Prior to satisfying our performance obligations, we typically receive deposits from customers related to sold but undelivered homes and we collect these deposits at the time a home buyer’s contract is accepted. These deposits are classified as the general contractor for custom homesearnest money deposits and are included in accrued expenses and other liabilities on our Texas operating segment, where the customerconsolidated balance sheets. Earnest money deposits totaled $56.8 million and not the Company owns the underlying land (which we refer to as “Build on Your Own Lot Contracts”). Accordingly, we recognize revenue for the Build on Your Own Lot Contracts, which are primarily cost plus contracts, on the percentage-of-completion method where progress toward completion is measured by relating the actual cost of work performed to date to the current estimated total cost of the respective contracts. As the Company makes such estimates, judgments are required to evaluate potential variances in the cost of materials and labor and productivity. During the years ended$30.6 million at December 31, 2017, 20162021 and 2015, we recognized revenue of $10.4 million, $7.3 million andDecember 31, 2020, respectively.
$6.1 million, respectively, associated with Build on Your Own Lot Contracts, which is presented in home sales revenues on the Consolidated Statements of Operations.
Performance Deposits
We are occasionally required to make a land, bond, and utility deposit as each new development is started. These amounts typically are refundable as each home is sold.delivered. Performance deposits are included in prepaid expenses and other assets on the Consolidated Balance Sheet.consolidated balance sheet.
Lot Option and Escrow Deposits
We enter into lot option and purchase agreements with unrelated parties to acquire lots for the construction of homes. Under these agreements, we have paid deposits, which in many cases are non-refundable, in consideration for the right, but not the obligation, to purchase land or lots at a future point in time with predetermined terms. Lot option and escrow deposits are included in prepaid expenses and other assets on the Consolidated Balance Sheet.consolidated balance sheet.
Model Homes and Sales Facilities
Costs related to our model homes and sales facilities are treated in one of three ways depending on their nature. Costs directly attributable to the home including upgrades that are permanent and sold with the home are capitalized to inventory and included in cost of home sales revenues when the unit is closed to the home buyer. Marketing related costs, such as non-permanent signage, brochures and marketing materials as well as the cost to convert the model into a salable unit are expensed as incurred. Costs to furnish the model home sites, permanent signage, and construction of sales facilities are capitalized to property and equipment and depreciated over the estimated life of the community based on the number of lots in the community which typically range from 2 to 3 years.
Property and Equipment
Property and equipment are stated at cost less accumulated depreciation. Depreciation is charged to expense on the straight-line basis over the estimated useful life of each asset. During the year ended December 31, 2017, we determined that it was no longer probable that we would dispose of the golf course in our Rhodes Ranch Community, in our Mountain segment, within one year. Accordingly, we reclassified the assets associated with the golf course, previously classified as “Held for sale” within “Prepaid expenses and other assets” to the related assets on our Consolidated Balance Sheets as of December 31, 2017 and 2016, respectively. Additionally, we recorded a catch-up depreciation expense totaling $0.7 million during the year ended December 31, 2017, which is classified as “Cost of land sales and other revenues” in our Consolidated Statements of Operations.
The estimated useful lives for each major depreciable classification of property and equipment are as follows:
| | |
| | |
| | Years
|
Buildings and improvements
| | 3 – 40 years
|
Leasehold improvements
| | 3 – 10 years
|
Machinery and equipment
| | 3 – 25 years
|
Furniture and fixtures
| | 2 – 7 years
|
Model furnishings
| | 2 – 5 years
|
Computer hardware and software
| | 1 – 5 years
|
|
|
|
|
|
|
|
| Years |
Leasehold improvements, furniture and fixtures, and other |
| 2 | - | 40 | years |
Machinery and equipment |
| 3 | - | 25 | years |
Model furnishings |
| 2 | - | 3 | years |
Computer hardware and software |
| 1 | - | 5 | years |
Mortgage Loans Held for Sale and Revenue Recognition
We use best efforts commitments with various investors to mitigate the risk associated with mortgageMortgage loans held for sale. Best efforts commitmentssale, mortgage servicing rights, mortgage loans in process for which fixinterest rates were committed to the forward sales price that will be realized inborrowers (referred to as “interest rate lock commitments”), and the secondary market arederivative instruments used to eliminateeconomically hedge our interest rate risk, which are typically forward commitments on mortgage-backed securities, forward commitments, and price risks. These best effortinvestor commitments, are considered derivative instruments under ASC 815, “Derivatives and Hedging,” however, we do not have any derivative instruments designated as hedging instruments ascarried at fair value. Changes in fair value are reflected in financial services revenue on the consolidated statements of December 31, 2017. Substantially alloperations. Management believes carrying loans held for sale at fair value improves financial reporting by mitigating volatility in reported earnings caused by measuring the fair value of the loans, originated by usinterest rate lock commitments, and their related servicing rightsthe derivative instruments used to economically hedge them.
Also included in financial services revenue are sold in the secondary mortgage market within a short period of time after origination, generally within 30 days. In accordance with ASC 825, “Financial Instruments” we use the fair value option to record residential mortgage loans available-for-sale at the price they are committed to be sold under the best efforts commitments.
Expected gains and losses from the sale of ourmortgage loans held for sale, which are included inrecognized based upon the measurementdifference between the sales proceeds and carrying value of writtenthe related loans upon sale and loan commitments thatorigination fees. Loan origination fees represent revenue earned from originating mortgage loans, which generally represent a flat per loan fee based on a percentage of the original principal loan balance, as well as discount points to reduce interest rates, and are accounted for at fair value through Financial Services revenuesrecognized at the time of commitment. As of December 31, 2017,the mortgage loans available-for-sale had an aggregate fair value of $52.3 million and an aggregate outstanding principal balance of $50.4 million. The net gain resulting from changes in fair value of the best efforts commitments and mortgage loans held in inventory totaled $1.9 million for the year ended December 31, 2017 and are included in “Financial services revenues.” Realized net gains from the sale of mortgages during the year ended December 31, 2017 were $4.2 million and have been included in “Financial Services revenues.” funded.
Stock-Based Compensation
Investment in Unconsolidated Subsidiaries
We account for our investment in unconsolidated subsidiaries under the equity method because we exercise significant influence over, but do not control, these entities. Under the equity method, these investments are initially recorded at cost and are subsequently adjusted
to reflect our proportionate share of net earnings or losses, distributions received, contributions made and certain other adjustments, as appropriate. Such investments are included in “Investment in unconsolidated subsidiaries” in our Consolidated Balance Sheets. Distributions from these investments that are related to cash earnings from operations are included as operating activities and distributions that are related to capital transactions are included as investing activities in our Consolidated Statements of Cash Flows. We recognize our proportionate share of the ongoing earnings or losses of the unconsolidated subsidiary in “equity in income of unconsolidated subsidiaries” in our Consolidated Statements of Operations.
We evaluate our investment in unconsolidated subsidiaries for impairment whenever events or changes in circumstances indicate that there may be an other-than-temporary decline in value. To do so, we calculate the estimated fair value of the investment using a market, income or replacement cost approach, or combination thereof. The amount of impairment recognized, if any, would be the excess of the investment’s carrying amount over its estimated fair value. We consider various factors to determine if a decline in the value of the investment is other-than-temporary. These factors are Level 2 and 3 inputs and include but are not limited to, age of the venture, our intent and ability to retain our investment in the entity, the financial condition and long-term prospects of the entity, expected term of the investment, and the relationships with our partners. If we believe that the decline in the fair value is temporary, no impairment is recorded. The aforementioned factors are taken as a whole by management in determining the valuation of our investment. Should the actual results differ from management’s estimates, the valuation could be negatively affected and may result in a negative impact on our consolidated financial statements.
Amortizable Intangible Assets
Amortizable intangible assets consist of the estimated fair value of trade names, home construction contracts, non-compete agreements, and home plans that were acquired upon closing of the acquisition of Jimmy Jacobs, LVLH, Grand View, and Peachtree. The acquisitions were accounted for as business combinations as defined in Accounting Standards Codification (which we refer to as “ASC”) 805, Business Combinations. A high degree of judgment is made by management on variables, such as revenue growth rates, profitability, and discount rates, when calculating the value of the intangible assets. The identified intangible assets are amortized over their respective estimated useful life. Trade names, non-compete agreements, and other intangibles assets are amortized to selling, general and administrative expenses in the Consolidated Statements of Operations. Intangible assets for cell phone tower leases, and home construction contracts are amortized to other income and cost of home sales revenues, respectively, as income on the related contracts are earned.
The estimated lives for each major amortizable classification of intangible assets are as follows:
| | |
| | |
| | Years
|
Trade names
| | 2 – 4 years
|
Home construction contracts
| | 1 – 2 years
|
Non-compete agreements
| | 2 – 5 years
|
Cell phone tower leases
| | 5 – 20 years
|
Home plans
| | 7 years
|
Earnest Money Deposits
We collect earnest deposits at the time a home buyer’s contract is accepted. Earnest money deposits held on homes under contract as of December 31, 2017 and 2016, totaled $14.1 million and $7.3 million, respectively, and are included in accrued expenses and other liabilities on the Consolidated Balance Sheets.
Stock-Based Compensation
We account for share-basedstock-based awards in accordance with ASC 718, Compensation—Stock Compensation.ASC 718 requires us to estimate the grant date fair value of stock-based compensation awards and to recognize the fair value as compensation costs over the requisite service period, which is generally three years, for all awards that vest. We value our restricted stock units and awards and restrictedin the form of unrestricted shares of common stock units equal to the closing price of our common stock on the New York Stock Exchange on the date of grant. Stock-based compensation expense associated with outstanding performance share units is measured using the grant date fair value and is based on the estimated achievement of the established performance criteria at the end of each reporting period until the performance period ends, recognized on a straight-line basis over the performance period. Stock-based compensation expense is only recognized for performance share units that we expect to vest, which we estimate based upon an assessment of the probability that the performance criteria will be achieved. The performance share units granted during the fiscal years ended December 31, 2021, 2020, and 2019 have three-year performance-based metrics measured over performance periods ending on December 31 of each three-year period. Stock-based compensation expense associated with outstanding performance share units is updated for actual forfeitures.
Income Taxes
We account for income taxes in accordance with ASC 740, Income Taxes, which requires recognition of deferred tax assets and liabilities at enacted income tax rates for the temporary differences between the financial reporting bases and the tax bases of its assets and
liabilities. Any effects of changes in income tax rates or tax laws are included in the provision for income taxes in the period of enactment. When it is more likely than not that a portion or all of a deferred tax asset will not be realized in the future, the Company providesrecords a corresponding valuation allowance against the deferred tax asset. As of December 31, 20172021 and 2016,2020, we had no0 valuation allowance recorded against our deferred tax assets.
In addition, when it is more likely than not that a tax position will be sustained upon examination by a tax authority that has full knowledge of all relevant information, the Company measures the amount of tax benefit from the position and records the largest amount of tax benefit that is more likely than not of being realized after settlement with a tax authority. The Company’s policy is to recognize interest to be paid on an underpayment of income taxes in interest expense and any related statutory penalties in the provision for income taxes on the Consolidated Statementsconsolidated statements of Operations.operations. As of December 31, 20172021 and 2016,2020 we had no0 reserves for uncertain tax positions.
Goodwill
We evaluate goodwill for possible impairment in accordance with ASC 350, Intangibles–Goodwill and Other, on an annual basis, or more frequently if events or changes in circumstances indicate that the carrying amount of such assets may not be recoverable. We use a threetwo step process to assess whether or not goodwill can be realized. The first step is a qualitative assessment that analyzes current economic indicators associated with a particular reporting unit. If the qualitative assessment indicates a stable or improved fair value, no further testing is required.
If a qualitative assessment indicates that a significant decline to fair value of a reporting unit is more likely than not, we will proceed to the second step where we calculate the fair value of a reporting unit based on discounted future cash flows. If this step indicates that the carrying value of a reporting unit is in excess of its fair value, we will proceedan impairment loss shall be recognized in an amount equal to that excess, limited to the third step where the fair value of the reporting unit will be allocated to assets and liabilities as they would in a business combination. Impairment occurs when the carryingtotal amount of goodwill exceeds its estimated fair value calculated in the third step.allocated to that reporting unit.
As of December 31, 20172021 and 2016,2020, we determined our goodwill was not0t impaired.
Business Combinations
We account for business combinations in accordance with ASC 850, 805, Business Combinations, if the acquired assets assumed and liabilities incurred constitute a business. We consider acquired companies to constitute a business if the acquired net assets and processes have the ability to create outputs in the form of revenue. For acquired companies constituting a business, we recognize the identifiable assets acquired and liabilities assumed at their acquisition-date fair values and recognize any excess of total consideration paid over the fair value of the identifiable net assets as goodwill.
Variable Interest Entities (“VIEs”)
We review land option contracts where we have a non-refundable deposit to determine whether the corresponding land seller is a VIE and, if so, whether we are the primary beneficiary. Although we do not have legal title to the underlying land, we are required to consolidate a VIE if we are the primary beneficiary.
In determining whether we are the primary beneficiary, we consider, among other things, whether we have the power to direct the activities that most significantly impact the economic performance of the VIE. In making this determination, we consider whether we have the power to direct certain activities, including, but not limited to, determining or limiting the scope or purpose of the VIE, the ability to sell or transfer property owned or controlled by the VIE, or arranging financing for the VIE. We are not the primary beneficiary of any VIE as of December 31, 2017 and 2016.
We analyzed each of our land option contracts to determine whether the land seller is a VIE and, if so, whether we are the primary beneficiary. Although we do not have legal title to the underlying land, we are required to consolidate a VIE if we are the primary beneficiary. As a result of our analysis, we determined that as of December 31, 2017,2021 and 2020, we were not the primary beneficiary of any VIE from which we have acquired rights to land under the land option contract. As of December 31, 20172021 and 2016,2020, we havehad non-refundable cash deposits totaling $18.9$38.1 million and $10.5$31.3 million, respectively, classified in “Prepaidprepaid expenses and other assets”assets in our Consolidated Balance Sheetsconsolidated balance sheets for land option contracts. The non-refundable deposit is our maximum exposure to loss for the transactions as of December 31, 20172021 and 2016,2020, respectively.
Advertising and Marketing Costs
Advertising and marketing costs are expensed as incurred and totaled $7.7 million, $11.3 million and $17.0 million for the years ended December 31, 2021, 2020 and 2019, respectively. Advertising and marketing costs are included in selling, general and administrative on the consolidated statement of operations.
Self-Insurance
We maintain general liability insurance coverage, including coverage for certain construction defects. These insurance policies protect us against a portion of the risk of loss from claims, subject to certain self-insured per occurrence and aggregate retentions, deductibles, and available policy limits. In circumstances where we have elected to retain a higher portion of the overall risk for construction defect claims in return for a lower initial premium, we reserve for the costs that are above our coverage limits or that are not covered by our insurance policies. The reserve is recorded on an undiscounted basis at the time revenue is recognized for each home closing. Amounts accrued, which are included in other accrued liabilities within accrued expenses and other liabilities on the consolidated balance sheets, are based on third party actuarial analyses of our historical claims and industry data, which include estimates of claims incurred but not yet reported. Adjustments to estimated reserves are recorded in the period in which the change in estimate occurs. Our self-insurance liability is presented on a gross basis without consideration of insurance recoveries and amounts we have paid on behalf of and expect to recover from other parties, if any. Estimates of insurance recoveries and amounts we have paid on behalf of and expect to recover from other parties, if any, are recorded as receivables when such recoveries are considered probable. As of December 31, 2021, our accrual for incurred but not reported construction defect claims was $5.1 million. As of December 31, 2020, we had 0 accrual recorded for incurred but not reported construction defect claims.
Reclassifications
Certain prior period amounts have been reclassified to conform to current period presentation.
Recently IssuedAdopted Accounting Standards
Income Taxes
In August 2015,December 2019, the Financial Accounting Standards Board (which we refer to as “FASB”) issued ASU 2015-14, “Revenue from Contracts with Customers (ASC 606).” ASU 2015-14 defersAccounting Standards Update (which we refer to as “ASU”) No. 2019-12, “Income Taxes (Topic 740): Simplifying the effective dateAccounting for Income Taxes” (which we refer to as “ASU 2019-12”). The standard simplifies the accounting for income taxes, eliminates certain exceptions, and clarifies certain aspects of ASU No. 2014-09, “Revenue from Contracts with
Customers (Topic 606)” and will be effective for the Company beginningASC 740 to promote consistency among reporting entities. We adopted this standard on January 1, 2018, including interim reporting periods within that period. Early adoption is permitted as of annual reporting periods beginning after December 15, 2016. We plan to adopt ASU 2015-142021 with no material effect on January 1, 2018 under the modified retrospective approach.
We are substantially complete with our evaluation of the impact on our consolidated financial statements of adopting ASU 2015-14. We have evaluated contracts in each of our revenue streams in each of our reportable segments and have determined that there will not be a material impact on the amount or timing of recording home sales revenues and related costs of home sales revenues as a result of adopting ASU 2015-14. While the adoption of ASU 2015-14 will not result in a material impact to our consolidated financial statements, it will impact the following:disclosures.
| ·
| | Certain costs incurred related to our model homes, which were previously capitalized to inventory, will now be expensed as incurred.
|
| ·
| | Forfeited customer earnest money deposits, which are currently presented in other income within the Consolidated Statements of Operations, will be presented as other revenue.
|
| ·
| | Land sales to third parties which do not meet the definition of a customer in ASC 606 will be classified as other income in our Consolidated Statements of Operations.
|
| ·
| | Deferral of an allocated amount of revenue and costs associated with unsatisfied performance obligations, primarily the installation of landscaping, at the time of home delivery.
|
| ·
| | Reclassification of certain costs related to our model homes from inventory to property and equipment on our Consolidated Balance Sheet.
|
Under the modified retrospective approach, we anticipate recording an opening adjustment to decrease retained earnings related to model homes costs that were previously capitalized to inventory, but would have been expensed as incurred under ASU 2015-14.
In February 2016, the FASB issued ASU 2016-02, “Leases (Topic 842).” ASU 2016-02 requires the recognition of lease assets and lease liabilities by lessees for those leases classified as operating leases under previous GAAP. ASU 2016-02 is effective for the Company beginning January 1, 2019 and interim periods within the annual periods. We are currently evaluating the impact ASU 2016-02 will have on our consolidated financial statements.
In August 2016, the FASB issued ASU 2016-15, “Statement of Cash Flows - Classification of Certain Cash Receipts and Cash Payments.” ASU 2016-15 consists of eight provisions that provide guidance on the classification of certain cash receipts and cash payments in the statement of cash flows. ASU 2016-15 is effective for annual reporting periods, and interim periods therein, beginning after December 15, 2017. We do not believe that ASU 2016-15 will have a material effect on our consolidated financial statements.
Recently Adopted Accounting Standards
In March 2016, the FASB issued ASU 2016-09, “Compensation – Stock Compensation (Topic 718): Improvements to Employee Share-Based Payment Accounting.” ASU 2016-09 simplifies several aspects of the accounting for share-based payment transactions including income tax consequences, classification of awards as either equity or liabilities, and classification on the statement of cash flows. ASU 2016-09 is effective for the Company beginning January 1, 2017 and interim periods within the annual periods. We have adopted this standard and as a result have realized excess tax benefits of $1.1 million, which is included as a reduction to “Income tax expense” in our Condensed Consolidated Statements of Operations. Our calculation of earnings per share was also modified to reflect a change to exclude excess tax benefits from assumed proceeds in our computation of diluted shares outstanding under the treasury method. We have elected to continue to estimate forfeitures in recognizing the expense for our equity awards. Employee taxes paid by withholding shares on vesting of stock compensation are classified as a financing activity in our Condensed Consolidated Statements of Cash Flows.
In January 2017, the FASB issued ASU 2017-04, “Intangibles – Goodwill and Other (Topic 350): Simplifying the Test for Goodwill Impairment.” ASU 2017-04 requires only a one-step quantitative impairment test, whereby a goodwill impairment loss will be measured as the excess of a reporting unit’s carrying amount over its fair value. It eliminates Step 2 of the current two-step goodwill impairment test. ASU 2017-04 is effective for annual reporting periods in fiscal years beginning after December 15, 2019 and early adoption is permitted. We elected to early adopt ASU 2017-04 for the reporting period beginning January 1, 2017. Our adoption of ASU 2017-04 has not had a material effect on our condensed consolidated financial statements.
2. Reporting Segments
Our homebuilding operations are engaged in the development, design, construction, marketing and sale of single-family attached and detached homes in ten states, which are aggregated into four regions, each of which17 states. We build and sell homes under our Century Communities and Century Complete brands. Our Century Communities brand is managed by onegeographic location, and each of our regional presidents.four geographic regions offers a wide range of buyer profiles including: entry-level, first and second time move-up, and lifestyle homebuyers, and provides our homebuyers with the ability to personalize their homes through certain option and upgrade selections. Each of our homebuilding divisionsfour geographic regions is considered ana separate operating segment, butsegment. Our Century Complete brand targets entry-level homebuyers, primarily sells homes through retail studios and the internet, and generally provides no option or upgrade selections. Our Century Complete brand currently has been aggregated into reportable segments defined byoperations in 11 states and is managed separately from our regional structure as each region has similar economic characteristics and housing products. Each4 geographic regions. Accordingly, it is considered a separate operating segment.
The management of our regional managers reportfour Century Communities geographic regions and Century Complete reports to our chief operating decision makers (which we refer to as “CODMs”), the Co-Chief Executive Officers of our Company. The CODMs review the results of our operations, including total revenue and income before income tax expense to determine profitability at the regional level.and to allocate resources. Accordingly, we have brokenpresented our homebuilding operations intoas the following 5 reportable segments based on the geographic markets in which we operate:segments:
| ·
| | West (Southern California, Central Valley, Bay Area and Washington)
|
| ·
| | Mountain (Colorado, Nevada and Utah)
|
| ·
| | Texas (Houston, San Antonio and Austin)
|
| ·
| | Southeast (Georgia, North Carolina, South Carolina and Tennessee)
|
West (California and Washington)
Mountain (Arizona, Colorado, Nevada and Utah)
Texas
Southeast (Florida, Georgia, North Carolina, South Carolina and Tennessee)
Century Complete (Alabama, Arizona, Florida, Georgia, Indiana, Kentucky, Michigan, North Carolina, Ohio, South Carolina and Texas)
We have also identified our Financial Services operations, which provide mortgage, title, and titleinsurance services to our homebuyers, as a fifthsixth reportable segment. Our Corporate operations are a nonoperatingnon-operating segment, as it serves to support our homebuilding, and to a lesser extent our Financial Services operations, through functions, such as our executive, finance, treasury, human resources, accounting and accountinglegal departments. We have adjusted prior period segment information to conform to the current period presentation.
The following table summarizes total revenue and income before income tax expense by segment (in thousands):
| |
|
|
|
|
|
|
|
|
| |
|
|
|
|
|
|
|
|
| | | | | | | | |
|
|
|
|
| Year Ended December 31, | Year Ended December 31, |
| 2017 | | 2016 | | 2015 | 2021 |
| 2020 |
| 2019 |
Revenue: | | | | | | | | |
|
|
|
|
|
|
|
|
West | $ | 210,696 | | $ | — | | | — | $ | 1,022,523 |
| $ | 683,138 |
| $ | 534,613 |
Mountain | | 616,517 | | | 504,293 | | | 349,072 |
| 1,151,911 |
|
| 860,041 |
|
| 729,045 |
Texas | | 165,170 | | | 147,006 | | | 116,229 |
| 481,915 |
|
| 339,346 |
|
| 252,921 |
Southeast | | 421,563 | | | 343,141 | | | 269,188 |
| 663,728 |
|
| 672,790 |
|
| 548,661 |
Century Complete | |
| 772,499 |
|
| 502,569 |
|
| 427,409 |
Financial Services | | 9,853 | | | — | | | — |
| 123,738 |
|
| 103,308 |
|
| 43,262 |
Corporate | | — | | | — | | | — |
| — |
|
| — |
|
| — |
Total revenue | $ | 1,423,799 | | $ | 994,440 | | $ | 734,489 | $ | 4,216,314 |
| $ | 3,161,192 |
| $ | 2,535,911 |
| | | | | | | | |
|
|
|
|
|
|
|
|
Income (loss) before income tax expense: | | | | | | | | |
|
|
|
|
|
|
|
|
West | $ | 14,640 | | $ | — | | | — | $ | 213,301 |
| $ | 71,417 |
| $ | 43,027 |
Mountain | | 75,704 | | | 66,613 | | | 49,515 |
| 212,335 |
|
| 114,722 |
|
| 89,201 |
Texas | | 10,952 | | | 2,686 | | | 4,260 |
| 68,565 |
|
| 34,694 |
|
| 25,866 |
Southeast | | 29,662 | | | 31,138 | | | 23,574 |
| 92,420 |
|
| 57,181 |
|
| 31,435 |
Century Complete | |
| 109,213 |
|
| 33,449 |
|
| 22,044 |
Financial Services | | 1,225 | | | — | | | — |
| 51,160 |
|
| 48,511 |
|
| 10,687 |
Corporate | | (48,019) | | | (27,288) | | | (17,044) |
| (105,872) |
|
| (89,734) |
|
| (89,625) |
Total income before income tax expense | $ | 84,164 | | $ | 73,149 | | $ | 60,305 | $ | 641,122 |
| $ | 270,240 |
| $ | 132,635 |
The following table summarizes total assets by segment (in thousands):
| | | | | | |
|
|
|
|
|
|
| | | | | | |
|
|
|
|
|
|
| | December 31, | | December 31, |
| December 31, |
| December 31, |
| | 2017 | | 2016 |
| 2021 |
| 2020 |
West | | $ | 273,749 | | $ | — |
| $ | 668,830 |
| $ | 536,907 |
Mountain | | | 571,880 | | | 541,657 |
|
| 1,008,481 |
|
| 778,198 |
Texas | | | 192,078 | | | 138,392 |
|
| 322,302 |
|
| 207,746 |
Southeast | | | 401,618 | | | 262,448 |
|
| 360,644 |
|
| 329,930 |
Century Complete | |
|
| 371,096 |
|
| 218,604 |
Financial Services | | | 63,137 | | | — |
|
| 533,159 |
|
| 421,153 |
Corporate | | | 232,560 | | | 65,031 |
|
| 232,364 |
|
| 352,555 |
Total assets | | $ | 1,735,022 | | $ | 1,007,528 |
| $ | 3,496,876 |
| $ | 2,845,093 |
Corporate assets include certain cash and cash equivalents, our investment in unconsolidated subsidiaries,certain property and equipment, prepaid insurance, and deferred financing costs on our revolving line of credit.
3. Inventory
Inventory included the following (in thousands):
|
|
|
|
|
|
|
|
|
|
|
|
|
|
|
| December 31, |
| December 31, |
|
| 2021 |
| 2020 |
Homes under construction |
| $ | 1,188,270 |
| $ | 1,040,584 |
Land and land development |
|
| 1,214,965 |
|
| 828,242 |
Capitalized interest |
|
| 53,379 |
|
| 60,838 |
Total inventories |
| $ | 2,456,614 |
| $ | 1,929,664 |
3. Business Combinations
UCP, Inc.
On August 4, 2017, we acquired UCP, Inc. which was4. Financial Services
Our Financial Services are principally comprised of our mortgage lending operations, Inspire. Inspire is a homebuilderfull-service mortgage lender and land developerprimarily originates mortgage loans for our homebuyers. Inspire sells substantially all of the loans it originates either as loans with expertise in residential land acquisition, development and entitlement, as well as home design, construction and sales, andservicing rights released, or with operationsservicing rights retained, in the Statessecondary mortgage market within a short period of California, Washington, North Carolina, South Carolinatime after origination, generally within 30 days. Inspire primarily finances these loans using its mortgage repurchase facilities. Mortgage loans in process for which interest rates were locked by borrowers, or interest rate lock commitments, totaled approximately $164.3 million and Tennessee. The merger was unanimously approved by the board$172.3 million at December 31, 2021 and 2020, respectively, and carried a weighted average interest rate of directorsapproximately 3.3% and 2.8%, respectively. As of both the CompanyDecember 31, 2021 and UCP and was also approved by UCP stockholders on August 1, 2017. In connection2020, Inspire had mortgage loans held for sale with the merger, each share of UCP Class A common stock outstanding immediately prior to the closing was converted into $5.32 in cash and 0.2309 of a newly issued share of our common stock. No fractional shares were issued in connection with the merger, and UCP stockholders received cash in lieu of any fractional shares. Approximately 4.2 million shares of our common stock were issued and $100.2 million in cash was paid in connection with the merger. Outstanding UCP restricted stock units were also converted into an aggregate amount of 0.2 million Century Communities restricted stock units pursuant to the merger. We determined that the total fair value of these awards was $6.2$353.1 million and $282.6 million, respectively, and an aggregate outstanding principal balance of which $1.1$342.0 million was attributable to services performed by UCP employees prior to the merger and as such, was included as consideration. During the year ended December 31, 2017, we incurred $9.6$269.6 million, in acquisition related expenses, presented as “Acquisition expense”respectively. Our net gains on the Unaudited Condensed Consolidated Statements of Operations. Total consideration of $209.0 million inclusive of cash acquired of $20.3 million is summarized as follows (in thousands, except per share amount):
| | | |
UCP Shares (including noncontrolling interest)
| | | 18,085 |
Cash paid per share
| | $
| 5.32 |
Cash consideration
| | $
| 96,213 |
Cash consideration pertaining to stockholder exercising appraisal rights
| | $
| 3,937 |
Total cash consideration
| | $
| 100,150 |
| | | |
UCP Shares (including noncontrolling interest)
| | | 18,085 |
Exchange ratio
| | | 0.2309 |
Number of CCS shares issued
| | | 4,176 |
Closing price of Century Communities stock
| | $
| 25.80 |
Consideration attributable to common stock
| | $
| 107,737 |
Total replacement award value
| | $
| 1,149 |
Total equity consideration
| | $
| 108,886 |
| | | |
Total consideration in cash and equity
| | $
| 209,036 |
The acquired assets consisted of approximately 4,199 owned lots within 43 total communities in the States of California, Washington, North Carolina, South Carolina and Tennessee. The 4,199 lots included 346 homes in backlog and 59 model homes. As the acquired assets and processes have the ability to create outputs in the form of revenue from the sale of single family residences, we concluded that the acquisition represents a business combination.
The following table summarizes our estimate of the fair value of assets acquired and liabilities assumed as of the acquisition date of UCP (in thousands):
| | |
Cash and cash equivalents
| $
| 20,264 |
Accounts receivable
| | 7,248 |
Inventories
| | 394,098 |
Prepaid expenses and other assets
| | 6,988 |
Property and equipment, net
| | 717 |
Deferred tax asset, net
| | 7,931 |
Goodwill
| | 5,998 |
Total assets
| $
| 443,244 |
| | |
Accounts payable
| $
| 10,712 |
Accrued expenses and other liabilities
| | 70,577 |
Notes payable
| | 152,919 |
Total liabilities
| | 234,208 |
Purchase price/Net equity
| $
| 209,036 |
The purchase price accounting reflected above is preliminary and is based upon estimates and assumptions that are subject to change within the measurement period (up to one year from the acquisition date). The measurement period remains open pending the completion of valuation procedures related to the acquired assets and assumed liabilities including inventories and our deferred tax asset. We have not yet finalized the allocation of goodwill to our reporting units.
Acquired inventories consist of both acquired land and work in process inventories. We determined the estimate of fair value for acquired land inventory with the assistance of a third-party appraiser primarily using a forecasted cash flow approach for the development, marketing, and sale of each community acquired. Significant assumptions included in our estimate include future per lot development costs, construction and overhead costs, mix of products sold in each community, as well as average sales price, and absorption rates. We estimated the fair value of acquired work in process inventories based upon the stage of production of each unit and a gross margin that we believe a market participant would require to complete the remaining development and requisite selling efforts. The stage of production, as of the acquisition date, ranged from recently started lots to fully completed single family residences. We estimated a market participant would require a gross margin ranging from 6% to 20% based upon the stage of production of the individual lot. Goodwill represents the excess of the purchase price over the fair value of assets acquired and liabilities assumed. We expect that $6.5mortgage loans were $85.3 million, of Goodwill will be deductible for tax purposes. The purchase price accounting reflected in the accompanying financial statements is preliminary and is based upon estimates and assumptions that are subject to change within the measurement period (up to one year from the acquisition date).
On August 17, 2017, we sold BMCH South Carolina, LLC, a subsidiary of UCP that was recently acquired as part of our acquisition of UCP, to a third party for approximately $17.1 million. Accordingly, the estimated fair value of the acquired assets of BMCH South Carolina, LLC was determined to be equal to the disposal price given the proximity of the two transactions.
We determined that UCP’s carrying costs approximated fair value for all other acquired assets and assumed liabilities.
UCP’s results of operations, which include homebuilding revenues of $201.4$87.6 million and income before tax of $20.5$32.2 million are included in the accompanying Consolidated Statements of Operations for the period from August 4, 2017 through December 31, 2017.
Sundquist Homes
On October 31, 2017, we acquired substantially all the assets and operations and assumed certain liabilities of Sundquist Homes and affiliates, a homebuilder with operations in the greater Seattle, Washington area, for approximately $50.2 million in cash. The acquired assets include owned and controlled land, homes under construction and model homes. As the acquired assets and processes have the ability to create outputs in the form of revenue from the sale of single family residences, we concluded that the acquisition represents a business combination.
The following table summarizes our preliminary estimates of the fair value of the assets acquired and liabilities assumed as of the acquisition date of Sundquist Homes (in thousands):
| | |
Accounts receivable
| $
| 11 |
Inventories
| | 55,077 |
Prepaid expenses and other assets
| | 1,050 |
Property and equipment, net
| | 142 |
Total assets
| $
| 56,280 |
| | |
Accounts payable
| $
| 3,646 |
Accrued expenses and other liabilities
| | 2,431 |
Total liabilities
| | 6,077 |
Purchase price/Net equity
| $
| 50,203 |
The purchase price accounting reflected above is preliminary and is based upon estimates and assumptions that are subject to change within the measurement period (up to one year from the acquisition date). The measurement period remains open pending the completion of valuation procedures related to the acquired assets and assumed liabilities.
Acquired inventories consist of both acquired land and work in process inventories. We determined the estimate of fair value for acquired land inventory with the assistance of a third-party appraiser primarily using a forecasted cash flow approach for the development, marketing, and sale of each community acquired. Significant assumptions included in our estimate include future per lot development costs, construction and overhead costs, mix of products sold in each community, as well as average sales price, and absorption rates. We estimated the fair value of acquired work in process inventories based upon the stage of production of each unit and a gross margin that we believe a market participant would require to complete the remaining development and requisite selling efforts. The stage of production, as of the acquisition date, ranged from recently started lots to fully completed single family
residences. We estimated a market participant would require a gross margin ranging from 6% to 20% based upon the stage of production of the individual lot. The purchase price accounting reflected in the accompanying financial statements is preliminary and is based upon estimates and assumptions that are subject to change within the measurement period (up to one year from the acquisition date). We expect that $4.8 million of tax Goodwill will be deductible for tax purposes in connection with this acquisition. During the year ended December 31, 2017, we incurred $0.3 million in acquisition related expenses, presented as “Acquisition expense” on the Unaudited Condensed Consolidated Statements of Operations.
We determined that Sundquist Homes’s carrying costs approximated fair value for all other acquired assets and assumed liabilities.
Sundquist Homes’s results of operations, which include homebuilding revenues of $18.7 million and income before tax of $3.9 million, are included in the accompanying Consolidated Statements of Operations for the period from October 31, 2017 through December 31, 2017. Income before income tax includes adjustments for inventory and acquisition expenses.
Unaudited Pro Forma Financial Information
Unaudited pro forma revenue and income before tax expense for the years ended December 31, 20172021, 2020, and 2016 give effect to2019, respectively, and are included in financial services revenue on the resultsconsolidated statements of the acquisitions of UCP and Sundquist Homes as of January 1, 2017 and 2016, respectively. Unaudited pro forma income before tax expense adjusts the operating results of UCP and Sundquist Homes to reflect the additional costs that would have been recorded assuming the fair value adjustments had been applied as of the beginning of the period presented and excludes acquisition expense incurredoperations. Interest rate risks related to mortgage loans held for sale and interest rate lock commitments are typically mitigated by utilizing forward commitments on mortgage-backed securities, forward commitments, and investor commitments to protect the transactions. Pro forma basic and diluted EPS gives effect to the issuance of approximately 4.2 million shares of common stock as consideration for the acquisition of UCP as though the acquisition had occurred on January 1, 2017 and 2016, respectively (in thousands, except share and per share information):value from fluctuations in mortgage-related interest rates.
| | | | | |
| | Year Ended December 31, |
�� | 2017 | | 2016 |
Revenues | $ | 1,718,924 | | $ | 1,403,514 |
| | | | | |
Income before tax expense | $ | 110,764 | | $ | 85,896 |
Tax expense | | (40,822) | | | (17,848) |
Net income | $ | 69,942 | | $ | 68,048 |
Less: Undistributed earnings allocated to participating securities | | (456) | | | (1,204) |
Numerator for basic and diluted pro forma EPS | $ | 69,486 | | $ | 66,844 |
| | | | | |
Pro forma weighted average shares-basic | | 28,456,725 | | | 24,855,043 |
Pro forma weighted average shares-diluted | | 28,760,635 | | | 24,967,791 |
| | | | | |
Pro forma basic EPS | $ | 2.44 | | $ | 2.69 |
Pro forma diluted EPS | $ | 2.42 | | $ | 2.68 |
4. Inventory
Inventory included the following (in thousands):
| | | | | | |
| | | | | | |
| | December 31, | | December 31, |
| | 2017 | | 2016 |
Homes under construction | | $ | 869,554 | | $ | 455,454 |
Land and land development | | | 479,038 | | | 373,496 |
Capitalized interest | | | 41,762 | | | 28,935 |
Total inventories | | $ | 1,390,354 | | $ | 857,885 |
5. Amortizable Intangible Assets
Amortizable intangible assets included the following (in thousands):
| | | | | | |
| | As of December 31, |
| | 2017 | | 2016 |
Trade names | | $ | — | | $ | 1,185 |
Non-compete agreements | | | 5,065 | | | 5,065 |
In place lot option contracts | | | — | | | 628 |
Cell phone tower lease | | | 1,408 | | | 1,408 |
Home plans | | | 764 | | | 764 |
Gross intangible assets | | | 7,237 | | | 9,050 |
Accumulated amortization | | | (4,299) | | | (4,846) |
Intangible assets, net | | $ | 2,938 | | $ | 4,204 |
We recognized amortization expense on our intangible assets of $1.3 million, $1.9 million and $2.4 million during the years ended December 31, 2017, 2016 and 2015, respectively. During the years ended December 31, 2017 and 2016, we wrote off fully depreciated amortizable intangible assets totaling $1.8 million and $2.2 million, respectively, and the related accumulated amortization.
As of December 31, 2017, expected amortization expense for amortizable intangible assets for each of the next five years, and thereafter, is as follows (in thousands):
| | | |
2018 | | $ | 1,181 |
2019 | | | 765 |
2020 | | | 173 |
2021 | | | 113 |
2022 | | | 73 |
Thereafter | | | 633 |
Net intangible assets, net | | $ | 2,938 |
6. Property and Equipment
Property and equipment included the following (in thousands):
| | | | | | |
|
|
|
|
|
|
| | December 31, | | December 31, |
| December 31, |
| December 31, |
| | 2017 | | 2016 |
| 2021 |
| 2020 |
Land | | $ | 3,167 | | $ | 3,159 |
| $ | — |
| $ | 2,245 |
Buildings and improvements | | | 2,069 | | | 1,571 | |
Leasehold improvements | | | 991 | | | 587 | |
Leasehold improvements, furniture and fixtures, and other | |
|
| 10,038 |
|
| 10,478 |
Machinery and equipment | | | 10,334 | | | 958 |
|
| 11,470 |
|
| 11,752 |
Furniture and fixtures | | | 1,938 | | | 749 | |
Model furnishings | | | 16,113 | | | 12,315 |
|
| 24,427 |
|
| 27,109 |
Computer hardware and software | | | 7,605 | | | 3,656 |
|
| 17,227 |
|
| 13,572 |
| | | 42,217 | | | 22,995 |
|
| 63,162 |
|
| 65,156 |
Less accumulated depreciation | | | (14,306) | | | (7,060) |
|
| (38,223) |
|
| (36,772) |
Total property and equipment, net | | $ | 27,911 | | $ | 15,935 |
| $ | 24,939 |
| $ | 28,384 |
7.
6. Prepaid Expenses and Other Assets
Prepaid expenses and other assets included the following (in thousands):
| | | | | | |
|
|
|
|
|
|
| | | | | | |
|
|
|
|
|
|
| | December 31, | | December 31, |
| December 31, |
| December 31, |
| | 2017 | | 2016 |
| 2021 |
| 2020 |
Prepaid insurance | | $ | 6,549 | | $ | 12,259 |
| $ | 37,814 |
| $ | 18,699 |
Lot option and escrow deposits | | | 35,700 | | | 12,320 |
|
| 61,649 |
|
| 39,985 |
Performance deposits | | | 3,295 | | | 1,544 |
|
| 11,196 |
|
| 9,372 |
Deferred financing costs revolving line of credit, net | | | 1,795 | | | 2,637 | |
Deferred financing costs on revolving line of credit, net | |
|
| 5,135 |
|
| 3,206 |
Restricted cash | | | 4,881 | | | 1,505 |
|
| 5,931 |
|
| 4,080 |
Secured note receivable | | | 2,753 | | | 2,850 |
|
| — |
|
| 2,434 |
Other | | | 5,839 | | | 1,599 | |
Right of use assets | |
|
| 16,939 |
|
| 16,175 |
Other assets and prepaid expenses | |
|
| 28,322 |
|
| 8,082 |
Mortgage loans held for investment | |
|
| 13,456 |
|
| 8,727 |
Derivative assets and mortgage servicing rights | |
|
| 19,645 |
|
| 11,870 |
Total prepaid expenses and other assets | | $ | 60,812 | | $ | 34,714 |
| $ | 200,087 |
| $ | 122,630 |
8. Investment in Unconsolidated Subsidiaries
On November 1, 2016, we acquired a 50% ownership interest in WJH LLC (which we refer to as “WJH”), which is the successor to Wade Jurney Homes, Inc. and Wade Jurney(1)Restricted cash consists of Florida, Inc.,earnest money deposits for $15.0 million of which $1.0 million washome sale contracts held by the Company for potential indemnification claims for a period of twelve months following the closing. WJH primarily targets first-time homebuyers in the Southeastern United States. As a result of the transaction, we own 50% of WJHthird parties as required by various jurisdictions, and Wade Jurney Jr., an individual, owns the other 50% interest. Each party contributed an additional $3.0 million in capital to WJH upon its formation and we incurred $0.1 million in related acquisition costs. The Company and Wade Jurney Jr. share responsibility for all of WJH’s strategic decisions,certain pledge balances associated with Wade Jurney Jr. continuing to manage the day-to-day operations under the existing operating model. Our investment in WJH is treated as an unconsolidated investment under the equity method of accounting. our mortgage repurchase facilities.
Our aggregate investment in WJH at December 31, 2017 of $28.2 million was more than our share of the underlying net assets of WJH, resulting in outside basis of approximately $5.4 million. Of the $5.4 million in outside basis, $1.1 million and $4.4 million are attributed to the underlying trade names and goodwill of WJH, respectively. Amounts allocated to intangible assets will be amortized to equity in earnings over approximately 10 years.
As of December 31, 2017 and 2016, our investment in WJH was $28.2 million and $18.3 million, respectively, and we recognized $12.2 million and $0.2 million of equity in income of unconsolidated subsidiaries during the years ended December 31, 2017 and 2016, respectively. During the year ended December 31, 2017, we made capital contributions totaling $3.0 million and received operating distributions from WJH of $5.2 million.
The following table provides unaudited selected financial information for WJH as of and for the year ended December 31, 2017, and as of and for the period from November 1, 2016 (our investment date) through December 31, 2016 (in thousands):
| | | | | | |
| | December 31, |
| | 2017 (unaudited) | | 2016 (unaudited) |
Inventories | | $ | 101,649 | | $ | 42,069 |
Total assets | | $ | 136,531 | | $ | 63,572 |
Total liabilities | | $ | 91,002 | | $ | 39,733 |
Partners' capital | | $ | 45,529 | | $ | 23,839 |
Homebuilding revenues | | $ | 271,653 | | $ | 31,019 |
Income before income tax expense | | $ | 26,185 | | $ | 2,839 |
9.7. Accrued Expenses and Other Liabilities
Accrued expenses and other liabilities included the following (in thousands):
| | | | | | |
|
|
|
|
|
|
| | | | | | |
|
|
|
|
|
|
| | December 31, | | December 31, |
| December 31, |
| December 31, |
| | 2017 | | 2016 |
| 2021 |
| 2020 |
Earnest money deposits | | $ | 14,077 | | $ | 7,304 |
| $ | 56,811 |
| $ | 30,578 |
Warranty reserve | | | 8,531 | | | 2,479 |
|
| 13,343 |
|
| 13,824 |
Accrued compensation costs | | | 22,129 | | | 12,627 |
|
| 81,604 |
|
| 60,692 |
Land development and home construction accruals | | | 61,918 | | | 31,486 |
|
| 88,155 |
|
| 80,088 |
Liability for product financing arrangement | | | 19,751 | | | — | |
Liability for product financing arrangements | |
|
| — |
|
| 62,084 |
Accrued interest | | | 14,435 | | | 3,039 |
|
| 9,653 |
|
| 13,649 |
Lease liabilities - operating leases | |
|
| 17,359 |
|
| 16,801 |
Income taxes payable | | | 851 | | | 783 |
|
| 1,684 |
|
| 3,118 |
Other | | | 8,664 | | | 4,578 | |
Derivative liabilities | |
|
| 359 |
|
| 3,807 |
Other accrued liabilities | |
|
| 47,909 |
|
| 18,110 |
Total accrued expenses and other liabilities | | $ | 150,356 | | $ | 62,296 |
| $ | 316,877 |
| $ | 302,751 |
8. Warranties
10. Warranties
Estimated future direct warranty costs are accrued and charged to cost of home sales revenues in the period when the related home sales revenues are recognized.recognized. Amounts accrued, which are included in accrued expenses and other liabilities on the Consolidated Balance Sheets,consolidated balance sheets, are based upon historical experience rates. We subsequently assess the adequacy of our warranty accrual on a quarterly basis through an internala model that incorporates historical payment trends and adjust the amounts recorded if necessary. Based on favorable warranty payment trends relative to our estimates at the time of home closing, we reduced our warranty reserve by $1.5$5.4 million, $1.4$2.4 million and $0.6$1.9 million during the years ended December 31, 2017, 20162021, 2020 and 2015,2019, respectively, which is included as a reduction to cost of homes home
sales revenues on our Consolidated Statementsconsolidated statements of Operations.operations. Changes in our warranty accrual for the years ended December 31, 2017, 2016,2021, 2020 and 20152019 are detailed in the table below (in thousands):
| | | | | | | | | |
|
|
|
|
|
|
|
|
|
| | Year Ended December 31, |
| Year Ended December 31, |
| | 2017 | | 2016 | | 2015 |
| 2021 |
| 2020 |
| 2019 |
Beginning balance | | $ | 2,479 | | $ | 2,622 | | $ | 2,194 |
| $ | 13,824 |
| $ | 9,731 |
| $ | 7,970 |
Warranty reserve assumed in business combination | | | 5,327 | | | — | | | — | |
Warranty expense provisions | | | 4,709 | | | 2,873 | | | 2,676 |
|
| 10,512 |
|
| 9,592 |
|
| 7,727 |
Payments | | | (2,526) | | | (1,610) | | | (1,628) |
|
| (5,615) |
|
| (3,056) |
|
| (4,024) |
Warranty adjustment | | | (1,458) | | | (1,406) | | | (620) |
|
| (5,378) |
|
| (2,443) |
|
| (1,942) |
Ending balance | | $ | 8,531 | | $ | 2,479 | | $ | 2,622 |
| $ | 13,343 |
| $ | 13,824 |
| $ | 9,731 |
9. Debt
11. Debt
Our outstanding debt obligations included the following as of December 31, 20172021 and 20162020 (in thousands):
| | | | | | |
| | | | | | |
| | December 31, | | December 31, |
| | 2017 | | 2016 |
6.875% senior notes | | $ | 379,238 | | $ | 253,089 |
5.875% senior notes | | | 394,725 | | | — |
Financing obligations | | | 2,320 | | | 5,999 |
Senior notes payable | | | 776,283 | | | 259,088 |
Revolving line of credit | | | — | | | 195,000 |
Mortgage repurchase facilities | | | 48,319 | | | — |
Total debt | | $ | 824,602 | | $ | 454,088 |
|
|
|
|
|
|
|
|
|
|
|
|
|
|
|
| December 31, |
| December 31, |
|
| 2021 |
| 2020 |
3.875% senior notes, due August 2029(1) |
| $ | 494,117 |
| $ | — |
6.750% senior notes, due May 2027(1) |
|
| 495,581 |
|
| 494,768 |
5.875% senior notes, due July 2025(1) |
|
| — |
|
| 396,821 |
Other financing obligations |
|
| 9,238 |
|
| 3,286 |
Notes payable |
|
| 998,936 |
|
| 894,875 |
Revolving line of credit |
|
| — |
|
| — |
Mortgage repurchase facilities |
|
| 331,876 |
|
| 259,050 |
Total debt |
| $ | 1,330,812 |
| $ | 1,153,925 |
6.875%(1)The carrying value of senior notes reflects the impact of premiums, discounts, and issuance costs that are amortized to interest cost over the respective terms of the senior notes.
Issuance of 3.875% Senior Notes Due 2029
In May 2014,August 2021, we completed a private offering of $200.0$500.0 million in aggregate principal amount of senior unsecured notesour 3.875% Senior Notes due 20222029 (which we refer to as the “Initial Senior“2029 Notes”) in reliance on Rule 144A and Regulation S under the Securities Act of 1933, as amended (which we refer to as the “Securities Act”). The Initial2029 Notes were issued under an Indenture, dated as of August 23, 2021, among the Company, our subsidiary guarantors party thereto, and U.S. Bank National Association, as trustee (which we refer to as the “August 2021 Indenture,” as it may be supplemented or amended from time to time). The 2029 Notes were issued at 100% of their principal amount and we received proceeds of $493.8 million, net of $6.2 million in issuance costs. The August 2021 Indenture contains certain restrictive covenants on issuing future secured debt and other transactions. The aggregate principal balance of the 2029 Notes is due August 2029, with interest only payments due semi-annually in February and August of each year, beginning on February 15, 2022.
As of December 31, 2021, the aggregate obligation, inclusive of unamortized financing costs on the 2029 Notes was $494.1 million. The issuance of the 2029 Notes, along with the redemption and extinguishment of our 5.875% Senior Notes due 2025 discussed below, effectively extended the maturity of our senior notes by more than four years, increased the aggregate principal amount by $100.0 million and reduced our weighted average rate on our senior notes by approximately 105 basis points.
6.750% Senior Notes Due 2027
In May 2019, we completed a private offering of $500.0 million aggregate principal amount of the Company’s Initial 6.750% Senior Notes due 2027 (which we refer to as the “Initial Notes due 2027”) in reliance on Rule 144A and Regulation S under the Securities Act of 1933. The Initial Notes due 2027 were issued under the Indenture, dated as of May 5, 2014,23, 2019, among the Company, our subsidiary guarantors party thereto, and U.SU.S. Bank National Association, as trustee (which we refer to as the “May 20142019 Indenture,” as it may be supplemented or amended from time to time). The Initial Senior Notes due 2027 were issued at a price equal to 99.239%100% of their principal amount and we received net proceeds of approximately $193.3$493.9 million. In connection with this issuance, we deferred $6.1 million of issuance costs, which is presented in the notes payable line item of the consolidated balance sheet. In February 2015,2020, we completed an offer to exchange $200.0approximately $500.0 million in aggregate principal amount of our 6.875% senior notesInitial Notes due 2022,2027, which are registered under the Securities Act (which we refer to as the “Initial Exchange Notes”“Exchange Notes due 2027”), for allan equivalent amount of the Initial Senior Notes.Notes due 2027 that were tendered and accepted for exchange. The terms of the Initial Exchange Notes due 2027 are identical in all material respects to the Initial Senior Notes due 2027, except that the Initial Exchange Notes are registered under the Securities Act and the transfer restrictions, registration rights, and additional interest provisions applicable to the Initial Senior Notes do not apply to the Initial Exchange Notes.
In April 2015, we completed a private offering of an additional $60 million in aggregate principal amount of our 6.875% senior notes due 2022 (which we refer to as the “April 2015 Senior Notes”) in reliance on Rule 144A and Regulation S under the Securities Act. The April 2015 Senior Notes were issued at a price equal to 98.26% of their principal amount, and we received net proceeds of approximately $58.5 million. The April 2015 Senior Notes were additional notes issued under the May 2014 Indenture. In October 2015, we completed an offer to exchange $60.0 million in aggregate principal amount of our 6.875% senior notes due 2022, which are registered under the Securities Act (which we refer to as the “October 2015 Exchange Notes”), for all of the April 2015 Senior Notes. The terms of the October 2015 Exchange Notes are identical in all material respects to the April 2015 Senior Notes, except that the October 2015 Exchange Notes2027 are registered under the Securities Act and the transfer restrictions, registration rights, and additional interest provisions that wereare applicable to the April 2015 SeniorInitial Notes due 2027 do not apply to the October 2015 Exchange Notes.
In January 2017, we completed a private offering of an additional $125 million in aggregate principal amount of our 6.875% senior notes due 2022 (which we refer to as the “January 2017 Senior Notes”) in reliance on Rule 144A and Regulation S under the Securities Act. The January 2017 Senior Notes were issued at a price equal to 102.00% of their principal amount, and we received net proceeds of approximately $125.4 million. The January 2017 Senior Notes were additional notes issued under the May 2014 Indenture. In April 2017, we completed an offer to exchange $125.0 million in aggregate principal amount of our 6.875% senior notes due 2022, which are registered under the Securities Act (which we refer to as the “April 2017 Exchange Notes”), for all of the January 2017 Senior Notes. The terms of the April 2017 Exchange Notes are identical in all material respects to the January 2017 Seniordue 2027.
The Initial Notes except that the April 2017due 2027 and Exchange Notes are registered under the Securities Act and the transfer restrictions, registration rights, and additional interest provisions that were applicable to the January 2017 Senior Notes do not apply to the April 2017 Exchange Notes.
The Initial Exchange Notes, October 2015 Exchange Notes, and April 2017 Exchange Notesdue 2027 (which we refer to collectively, as the “Existing 6.875% Notes”Notes due 2027”) will be treated as a single series of notes under the May 20142019 Indenture, and will vote as a single class of notes for all matters submitted to a vote of holders under the May 20142019 Indenture.
The Existing 6.875% Notes due 2027 are unsecured senior obligations which are guaranteed on an unsecured senior basis by certain of our current and future subsidiaries. The May 2019 Indenture governing the Existing 6.875% Notes containdue 2027 contains certain restrictive covenants on issuing future secured debt and other transactions. The aggregate principal balance of the Existing 6.875% Notes due 2027 is due May 2022,July 2027, with interest only payments due semi-annually in MayJune and NovemberDecember of each year.year, which began on December 1, 2019.
As of December 31, 2017,2021, the aggregate amount outstandingobligation, inclusive of unamortized financing costs on the Existing 6.875% Notes due 2027, was $379.2$495.6 million.
Redemption and Extinguishment of 5.875% Senior Notes Due 2025
5.875% senior notes
In May 2017,During the year ended December 31, 2021, we completed a private offering of $400redeemed $400.0 million in aggregateoutstanding principal amount of our 5.875% Senior Notes due 2025 at a redemption price equal to 102.938% of the principal amount, plus accrued and unpaid interest, totaling $414.8 million. The redemption transaction resulted in a $14.5 million loss on debt extinguishment in our consolidated statement of operations.
Revolving Line of Credit
On May 21, 2021, we entered into a Second Amended and Restated Credit Agreement (which we refer to as the “May 2017 Senior Notes”“Second A&R Credit Agreement”) in reliance on Rule 144A and Regulation S under the Securities Act. The May 2017 Senior Notes were issued under the Indenture, dated as of May 12, 2017, among the Company, our subsidiary guarantors party thereto, and U.S Bank National Association, as trustee (which we refer to as the “May 2017 Indenture,” as it may be supplemented or amended from time to time). The May 2017 Senior Notes were issued at a price equal to 100.00% of their principal amount, and we received net proceeds of approximately $395.5 million. In December 2017, we completed an offer to exchange approximately $400.0 million in aggregate principal amount of our 5.875% senior notes due 2025, which are registered under the Securities Act (which we refer to as the “December 2017 Exchange Notes”), for an equivalent amount of the May 2017 Senior Notes that were tendered and accepted for exchange. The terms of the December 2017 Exchange Notes are identical in all material respects to the May 2017 Senior Notes, except that the December 2017 Exchange Notes are registered under the Securities Act and the transfer restrictions, registration rights, and additional interest provisions that are applicable to the May 2017 Senior Notes do not apply to the December 2017 Exchange Notes.
The May 2017 Senior Notes and December 2017 Exchange Notes (which we refer to collectively, as the “Existing 5.875% Notes”) will be treated as a single series of notes under the May 2017 Indenture, and will vote as a single class of notes for all matters submitted to a vote of holders under the May 2017 Indenture.
The Existing 5.875% Notes are unsecured senior obligations which are guaranteed on an unsecured senior basis by certain of our current and future subsidiaries. The Existing 5.875% Notes contain certain restrictive covenants on issuing future secured debt and other transactions. The aggregate principal balance of the Existing 5.875% Notes is due July 2025, with interest only payments due semi-annually in January and July of each year.
As of December 31, 2017, the aggregate amount outstanding on the May 2017 Senior Notes and December 2017 Exchange Notes was $394.7 million.
Revolving line of credit
On October 21, 2014, we entered into a credit agreement with Texas Capital Bank, National Association, as Administrative Agent and L/C Issuer, and the lenders from time to time party theretothereto. The Second A&R Credit Agreement, which amended and restated our prior Amended and Restated Credit Agreement, provides us with a senior unsecured revolving line of credit (which we refer to as the “Credit Agreement”Facility”). The Credit Agreement provides us with a revolving line of credit of up to $120$800.0 million, (which we refer to as the “Revolvingand unless terminated earlier, will mature on April 30, 2026. The Credit Facility”).
Facility includes a $250.0 million sublimit for standby letters of credit.Under the terms of the Second A&R Credit Agreement, we arethe Company is entitled to request an increase in the size of the Revolving Credit Facility by an amount not exceeding $80$200 million. If the existing lenders elect not to provide the full amount of a requested increase, we may invite one or more other lender(s) to become a party to the Credit Agreement, subject to the approval of the Administrative Agent and L/C Issuer. The Credit Agreement includes a letter of credit sublimit of $20 million. TheOur obligations under the RevolvingSecond A&R Credit FacilityAgreement are guaranteed by certain of our subsidiaries.
On July 31, 2015, we entered into a First Modification Agreement with Texas Capital Bank, National Association, as Administrative Agent, the lenders party thereto, and our subsidiary guarantors party thereto, which modified the Credit Agreement. The First Modification Agreement, among other things, (i) increased the Revolving Credit Facility from $120 million to $200 million, (ii) extended the maturity date of the Revolving Credit Facility from October 21, 2017 to October 21, 2018, (iii) admitted Bank of America, N.A. as a new lender under the Revolving Credit Facility, and (iv) increased the amount of the Company’s option to request, from time to time, an increase in the size of the Revolving Credit Facility, from an amount not exceeding $80 million to an amount not exceeding $100 million, subject to the terms and conditions of the First Modification Agreement and the Credit Agreement.
On December 22, 2015, we entered into a Second Modification Agreement with Texas Capital Bank, National Association, as Administrative Agent, the lenders party thereto, and our subsidiary guarantors party thereto, which modified the Credit Agreement. The Second Modification Agreement, among other things, (i) increased the Revolving Credit Facility from $200 million to $300 million, and (ii) admitted Compass Bank, an Alabama Banking Corporation, and U.S. Bank National Association as new lenders under the Revolving Credit Facility.
On August 19, 2016, we entered into a Third Modification Agreement with Texas Capital Bank, National Association, as Administrative Agent, the lenders party thereto, and our subsidiary guarantors party thereto, which further modified the Credit Agreement. The Third Modification Agreement, among other things, (i) increased the Revolving Credit Facility from $300 million to $380 million through our exercise of $80 million of the accordion feature of the Credit Agreement, (ii) admitted Citibank, N.A. and Flagstar Bank, FSB as new
lenders under the Revolving Credit Facility, (iii) increased certain lenders’ respective commitments to the Revolving Credit Facility, and (iv) extended the term of the Revolving Credit Facility by one year to mature on October 21, 2019.
On February 24, 2017, we entered into a Commitment Increase Agreement with Texas Capital Bank, National Association, as Administrative Agent, Flagstar Bank, FSB (which we refer to as “Flagstar”), and our subsidiary guarantors party thereto. The Commitment Increase Agreement supplements the Credit Agreement, and (i) increased the Revolving Credit Facility from $380 million to $400 million through our exercise of the remaining $20 million of the accordion feature of the Credit Agreement, and (ii) increased Flagstar’s commitment to the Credit Facility.
Unless terminated earlier, on October 21, 2019, the maturity date of the Revolving Credit Facility, the principal amount thereunder, together with all accrued unpaid interest and other amounts owing thereunder, if any, will be payable in full on such date. Borrowings under the Revolving Credit Facility bear interest at a floating rate equal to the LIBOR plus an applicable margin between 2.75% and 3.25% per annum, or, in the Administrative Agent’s discretion, a base rate plus an applicable margin between 1.75% and 2.25% per annum. The “applicable margins” described above are determined by a schedule based on our leverage ratio, as defined in the Credit Agreement. The Credit Agreement also provides for fronting fees and letter of credit fees payable to the L/C Issuer and commitment fees payable to the Administrative Agent equal to 0.20% of the unused portion of the Revolving Credit Facility.
TheA&R Credit Agreement contains customary affirmative and negative covenants (including limitations on our ability to grant liens, incur additional debt, pay dividends, redeem our common stock, make certain investments and engage in certain merger, consolidation or asset sale transactions), as well as customary events of default. TheBorrowings under the Second A&R Credit Agreement also requires us to maintain (i)bear interest at a leverage ratio of not more than 1.50 to 1.0 as of the last day of any fiscal quarter, based upon our and our subsidiaries’ (on a consolidated basis) ratio of debt to tangible net worth, (ii) an interest coverage ratio of not less than 1.50 to 1.0 for any four fiscal quarter period, based upon our and our subsidiaries’ (on a consolidated basis) ratio of EBITDA to cash interest expense, (iii) a consolidated tangible net worth of not less than the sum of $250 million, plus 50% of the net proceeds of any issuances of equity interests by us and the guarantors of the Revolving Credit Facility, plus 50% of the amount of our and our subsidiaries’ consolidated net income, (iv) liquidity of not less than $25 million, and (v) a risk asset ratio of not more than 1.25 to 1.0, based upon the ratio of the book value of all risk assets owned by us and our subsidiariesfloating rate equal to the our tangible net worth. adjusted Eurodollar Rate plus an applicable margin between 2.05% and 2.65% per annum, and if made available in the Administrative Agent’s discretion, a base rate plus an applicable margin between 1.05% and 1.65% per annum.
As of December 31, 2017, we2021, 0 amounts were outstanding under the credit facility and were in compliance with all covenants under the Credit Agreement.covenants.
As of December 31, 2017, we did not have any amounts outstanding under the Credit Agreement.
Mortgage Repurchase Facilities – Financial Services
On April 10, 2017,May 4, 2018, September 14, 2018 and August 1, 2019, Inspire Home Loans Inc. (which we refer to as “Inspire”), an indirect wholly-owned subsidiary of the Company, entered into a Master Repurchase Agreementmortgage warehouse facilities, with Comerica Bank, J.P. Morgan and Wells Fargo, respectively. The mortgage warehouse lines of credit (which we refer to as the “First Master Repurchase Agreement”“Repurchase Facilities”) with Branch Banking and Trust Company, as the buyer thereunder (which we refer to as the “Buyer”). The First Master Repurchase Agreement provides, which were increased during 2020, provide Inspire with a revolving mortgage loanuncommitted repurchase facilityfacilities of up to $25$400 million (which we refer to as the “First Repurchase Facility”). The primary purpose of the First Repurchase Facility is to provide financing and liquidity to Inspire by facilitating purchase transactions in which Inspire transfers eligible loans to the Buyer, and the Buyer transfers funds, subject to a simultaneous agreementDecember 31, 2021, secured by the Seller to repurchase from the Buyer such eligiblemortgage loans (i) upon written notice to the Buyer by Inspire, (ii) on a prescribed date in the future, (iii) upon the occurrence of prescribed events, or (iv) on the Termination Date (as defined below). The purchase transactions are based on and subject to the terms and conditions set forth in the First Master Repurchase Agreement. The maximum aggregate amount of the Buyer’s commitment to fund purchase transactions under the First Repurchase Facility is $25 million (which we refer to as the “Commitment”), subject to certain sublimits. The First Repurchase Facility and the Buyer’s Commitment thereunder expires on the earlier of (i) April 9, 2018, and (ii) the date when the Buyer’s Commitment is terminated pursuant to the First Master Repurchase Agreement or by operation of law (which we refer to as the “Termination Date”).
On September 15, 2017, Inspire entered into a second Master Repurchase Facility (which we refer to as the “Second Master Repurchase Agreement”) with J.P. Morgan Chase Bank, N.A. as the buyerfinanced thereunder. The Second Master Repurchase Agreement provides Inspire withrepurchase facilities have varying short term maturity dates through August 23, 2022 and bear a revolving mortgage loan repurchase facilityweighted average interest rate of up to $35 million (which we refer to as the “Second Repurchase Facility”)2.13%. The purpose of the Second Repurchase Facility is similar to the purpose outlined above for the First Repurchase Facility.
Amounts outstanding under the First Repurchase Facility and Second Repurchase FacilityFacilities are not guaranteed by us or any of our subsidiaries. Each ofsubsidiaries and the First Master Repurchase Agreement and Second Master Repurchase Agreement containsagreements contain various affirmative and negative covenants applicable to Inspire that are customary for arrangements of this type. As of December 31, 2017,
2021 and 2020, we had $331.9 million and $259.1 million outstanding under these Repurchase Facilities, respectively, and were in compliance with all covenants under eachthereunder.
During the years ended December 31, 2021 and 2020, we incurred interest expense on our Repurchase Facilities of the First Repurchase Facility$2.1 million and Second Repurchase Facility.$3.0 million, respectively, which are included in financial services costs on our consolidated statements of operations.
Other Financing Obligations
As of December 31, 2017, there was an aggregate $48.3 million outstanding under both the First Master Repurchase Agreement and Second Master Repurchase Agreement, and such outstanding amount was collateralized by the mortgage loans held for sale.
Other Financing Obligations
As of December 31, 2017,2021, we had $2.30 outstanding land development notes and $9.2 million of outstanding insurance premium notes, compared to $2.0 million of outstanding land development notes. During the year ended December 31, 2017, we repaid fournotes and $1.3 million outstanding insurance premium notes. Asnotes as of December 31, 2016, we had $6.0 million of outstanding insurance premium notes. 2020.
Aggregate annual maturities of debt as of December 31, 20172021 are as follows (in thousands):
| | | |
|
|
|
2018 | | $ | 50,639 | |
2019 | | | — | |
2020 | | | — | |
2021 | | | — | |
2022 | | | 385,000 |
| $ | 341,114 |
2023 | |
|
| — |
2024 | |
|
| — |
2025 | |
|
| — |
2026 | |
|
| — |
Thereafter | | | 400,000 |
|
| 1,000,000 |
Total | | | 835,639 |
|
| 1,341,114 |
Less: Discount and deferred financing costs, net on senior notes | | | (11,037) |
|
| (10,302) |
Carrying amount | | $ | 824,602 |
| $ | 1,330,812 |
During the years ended December 31, 2021 and 2020, we paid approximately $59.2 million and $66.8 million, respectively, in interest expense payments.
12.
10. Interest
Interest is capitalized to inventories while the related communities are being actively developed and until homes are completed. As our qualifying assets exceeded our outstanding debt during the years ended December 31, 2017, 2016,2021, 2020, and 2015,2019, we capitalized all interest costs incurred during these periods, except for interest incurred on capital leases of machinery related to our golf course operations.mortgage repurchase facilities.
Our interest costs are as follows (in thousands):
| | | | | | | | | | |
| | |
|
|
|
|
|
|
|
|
|
| | Year Ended December 31, |
| Year Ended December 31, |
| | 2017 | | 2016 | | 2015 |
| 2021 |
| 2020 |
| 2019 |
Interest capitalized beginning of period | | $ | 28,935 | | $ | 21,533 | | $ | 11,302 |
| $ | 60,838 |
| $ | 67,069 |
| $ | 53,842 |
Interest capitalized during period | | | 45,725 | | | 26,904 | | | 20,313 |
|
| 59,387 |
|
| 65,771 |
|
| 74,377 |
Less: capitalized interest in cost of sales | | | (32,898) | | | (19,502) | | | (10,082) |
|
| (66,846) |
|
| (72,002) |
|
| (61,150) |
Interest capitalized end of period | | $ | 41,762 | | $ | 28,935 | | $ | 21,533 |
| $ | 53,379 |
| $ | 60,838 |
| $ | 67,069 |
13.11. Income Taxes
On December 22, 2017, the Tax Cuts and Jobs Act (which we refer to as the “TCJA”) was signed into law. The TCJA significantly reforms the Internal Revenue Code of 1986, as amended. The TCJA, among other things, contains significant changes to corporate taxation, including reduction of the corporate tax rate, commencing in 2018, from a top marginal rate of 35% to a flat rate of 21%, limitation of the tax deduction for interest expense to 30% of adjusted earnings (except for certain small businesses), limitation of the deduction for net operating losses to 80% of current year taxable income, elimination of net operating loss carrybacks, immediate deductions for certain new investments instead of deductions for depreciation expense over time, and modifying or repealing many business deductions and credits.
Also on December 22, 2017 the SEC staff issued Staff Accounting Bulletin No. 118 (SAB 118) which addresses the application of ASC Topic 740 to the TCJA. SAB 118 outlines that if the accounting for the effects of the TCJA is incomplete, but a reasonable estimate can be made, then provisional amount should be reflected in the financial statements.
Our accounting for the impacts of the TCJA related to current and deferred taxes, and in particular our deferred taxes related to our acquisition of UCP and Sundquist Homes, remains incomplete as of the date of these financial statements. Accordingly, we remeasured our deferred tax assets and liabilities based on the rates at which they are expected to reverse in the future, which is generally our estimated blended state and federal statutory rate in future periods of approximately 24%. This remeasurement resulted in a provisional reduction to our deferred tax assets of $2.8 million. This reduction is reflected in “Income tax expense” in our Consolidated Statements of Operations.
We anticipate that our accounting for the TCJA will be finalized upon the completion of our analysis of our tax basis in UCP and Sundquist Homes, including refining certain calculations associated with UCP’s distributive share of its investment in UCP, LLC at the acquisition date of August 4, 2017 in accordance with I.R.C. §704(c). Additionally, we are still reviewing certain items related to the TCJA and refining our calculations. The resolution of these items could potentially affect the measurement of our provisional reduction to our deferred tax asset.
Our income tax expense for the years ended December 31, 2017, 20162021, 2020 and 20152019 comprises the following current and deferred amounts (in thousands):
| | | | | | | | | |
|
|
|
|
|
|
|
|
|
| | Year Ended December 31, |
| Year Ended December 31, |
| | 2017 | | 2016 | | 2015 |
| 2021 |
| 2020 |
| 2019 |
Current | | | | | | | | | |
|
|
|
|
|
|
|
|
|
Federal | | $ | 29,241 | | $ | 19,417 | | $ | 16,754 |
| $ | 120,448 |
| $ | 51,741 |
| $ | 9,113 |
State and local | | | 3,954 | | | 2,685 | | | 2,027 |
|
| 30,871 |
|
| 14,203 |
|
| 7,354 |
Total current | | | 33,195 | | | 22,102 | | | 18,781 |
|
| 151,319 |
|
| 65,944 |
|
| 16,467 |
Deferred | | | | | | | | | |
|
|
|
|
|
|
|
|
|
Federal | | | 920 | | | 1,357 | | | 1,513 |
|
| (7,151) |
|
| (1,375) |
|
| 2,528 |
State and local | | | (246) | | | 150 | | | 121 |
|
| (1,550) |
|
| (486) |
|
| 646 |
Total deferred | | | 674 | | | 1,507 | | | 1,634 |
|
| (8,701) |
|
| (1,861) |
|
| 3,174 |
Income tax expense | | $ | 33,869 | | $ | 23,609 | | $ | 20,415 |
| $ | 142,618 |
| $ | 64,083 |
| $ | 19,641 |
Total income tax expense differed from the amounts computed by applying the federal statutory income tax rate of 35%21% for the years ended December 31, 2021, 2020, and 2019, to income before income taxes as a result of the following items (in thousands):
| | | | | | | | | |
|
|
|
|
|
|
|
|
|
| | Year Ended December 31, |
| Year Ended December 31, |
| | 2017 | | 2016 | | 2015 |
| 2021 |
| 2020 |
| 2019 |
Statutory income tax expense | | $ | 29,469 | | $ | 25,602 | | $ | 21,107 |
| $ | 134,636 |
| $ | 56,730 |
| $ | 27,844 |
State income tax expense, net of federal income tax expense | | | 3,596 | | | 1,954 | | | 1,690 |
|
| 24,123 |
|
| 11,153 |
|
| 5,483 |
Domestic production activities deduction | | | (2,513) | | | (2,146) | | | (1,766) | |
Provisional re-measurement of deferred tax assets | | | 2,790 | | | - | | | - | |
Executive compensation | |
|
| 3,520 |
|
| 4,566 |
|
| 4,123 |
Excess tax benefits upon vesting of share based payment awards | |
|
| (764) |
|
| (108) |
|
| (252) |
Federal energy credits | | | - | | | (1,944) | | | - |
|
| (16,451) |
|
| (8,549) |
|
| (17,256) |
Other permanent items | | | 248 | | | 221 | | | 37 | |
Other adjustments | | | 279 | | | (78) | | | (653) | |
State tax credits | |
|
| (1,220) |
|
| (900) |
|
| — |
Other | |
|
| (1,226) |
|
| 1,191 |
|
| (301) |
Income tax expense | | $ | 33,869 | | $ | 23,609 | | $ | 20,415 |
| $ | 142,618 |
| $ | 64,083 |
| $ | 19,641 |
Income tax expense for the years ended December 31, 2021, 2020, and 2019 was impacted by benefits of $16.5 million, $8.5 million, and $17.3 million, respectively, associated with the Energy Efficient Home Credit under Internal Revenue Code Section 45L (which we refer to as “Federal Energy Credits”). The Federal Energy Credits provide eligible contractors a federal income tax credit of $2,000 for each home delivered that meets the energy saving and certification requirements under the statute. On December 27, 2020, an extension of the Federal Energy Credits was enacted into law, extending the current provisions through December 31, 2021, and no similar legislation has been enacted as of the date of this Form 10-K, and it is uncertain whether an extension or similar tax credit will be adopted or available in the future or the scope of any modified program requirements.
Deferred income tax assets and liabilities are recognized for the future tax consequences of temporary differences. Temporary differences arise when revenues and expenses for financial reporting are recognized for tax purposes in a different period. ASC 740 requires that a valuation allowance be recorded against deferred tax assets unless it is more likely than not that the deferred tax assetassets will be utilized. As a result of this analysis, the Company has not0t recorded a valuation allowance against its deferred tax assets. The Company will continue to evaluate the need to record valuation allowances against deferred tax assets and will make adjustments in accordance with the accounting standard.
The tax effects of temporary differences that give rise to significant portions of the deferred tax assets and liabilities at December 31, 20172021 and 20162020 (in thousands):
| | | | | | |
|
|
|
|
|
|
| | As of December 31, |
| As of December 31, |
| | 2017 | | 2016 |
| 2021 |
| 2020 |
Deferred tax assets | | | | | | |
|
|
|
|
|
|
Warranty reserves | | $ | 1,848 | | $ | 928 |
| $ | 3,265 |
| $ | 3,389 |
Amortizable intangible assets | | | - | | | 113 | |
Stock based compensation | | | 1,629 | | | 2,105 | |
Stock-based compensation | |
|
| 770 |
|
| 841 |
Accrued compensation and other | | | 574 | | | 845 |
|
| 16,151 |
|
| 9,949 |
Inventories, additional costs capitalized for tax | | | 7,844 | | | - |
|
| 6,959 |
|
| 2,028 |
Lease liabilities | |
|
| 4,433 |
|
| 4,245 |
Other | |
|
| 2,205 |
|
| 1,794 |
Deferred tax asset | | | 11,895 | | | 3,991 |
|
| 33,783 |
|
| 22,246 |
| | | | | | |
|
|
|
|
|
|
Deferred tax liabilities | | | | | | |
|
|
|
|
|
|
Prepaid expenses | | | 148 | | | 191 |
|
| (246) |
|
| (141) |
Property and equipment | | | 4,276 | | | 2,023 |
|
| (4,801) |
|
| (4,658) |
Amortizable intangible assets | | | 1,280 | | | - | |
Accrued expenses | | | 636 | | | 3,057 | |
Inventories, additional costs capitalized for tax | | | - | | | 502 | |
Mortgage servicing rights | |
|
| (3,352) |
|
| (1,009) |
Right of use assets | |
|
| (4,145) |
|
| (3,988) |
Deferred tax liability | | | 6,340 | | | 5,773 |
|
| (12,544) |
|
| (9,796) |
Net deferred tax asset/(liability) | | $ | 5,555 | | $ | (1,782) | |
Net deferred tax asset | |
| $ | 21,239 |
| $ | 12,450 |
The uncertainty provisions of ASC 740 also require the Company to recognize the impact of a tax position in its consolidated financial statements only if the technical merits of that position indicate that the position is more likely than not of being sustained upon audit. During the year,years ended December 31, 2021 and 2020, the Company did not0t record a reserve for uncertain tax positions. We file income
tax returns in the U.S. federal jurisdiction and various state jurisdictions. We are subject to U.S. federal income tax examination for calendar tax years ending 2014 through 2017. Additionally, we are subject toand various state income tax examinations for the 2013 through 2017calendar tax years. years ending 2016 through 2021.
14.12. Fair Value Disclosures
ASC 820, Fair Value Measurement, definesvalue measurements are used for the Company’s mortgage loans held for sale, mortgage loans held for investment, mortgage servicing rights, interest rate lock commitments and other derivative instruments on a recurring basis. We also utilize fair value asmeasurements on a non-recurring basis for inventories, and intangible assets when events and circumstances indicate that the price that would be received for selling an asset or paidcarrying value is not recoverable. The fair value hierarchy and its application to transfer a liability in an orderly transaction between market participants at measurement date and requiresthe Company’s assets and liabilities carried at fair value to be classified and disclosed in the following three categories:is as follows:
Level 1 – Quoted prices for identical instruments in active markets.
Level 2 – Quoted prices for similar instruments in active markets; quoted prices for identical or similar instruments in markets that are inactive; and model-derived valuations in which all significant inputs and significant value drivers are observable in active markets at measurement date.
Mortgage loans held for sale – Fair value is based on quoted market prices for committed and uncommitted mortgage loans.
Derivative assets and liabilities – Derivative assets are interest rate lock commitments and derivative liabilities are associated with forward commitments and investor commitments on loans. Fair value is based on market prices for similar instruments.
Level 3 – Valuations derived from techniques where one or more significant inputs or significant value drivers are unobservable in active markets at measurement date.
Mortgage servicing rights – The fair value of the mortgage servicing rights is calculated using third-party valuations. The key assumptions, which are generally unobservable inputs, used in the valuation of the mortgage servicing rights include mortgage prepayment rates, discount rates and cost to service.
Mortgage loans held for investment – The fair value of mortgage loans held for investment is calculated based on Level 3 analysis which incorporates information including the value of underlying collateral, from markets where there is little observable trading activity.
The following outlines the Company’s assets and liabilities measured at fair value on a recurring basis at December 31, 2021 and 2020, and the changes in the fair value of the Level 3 assets during the years ended December 31, 2021 and 2020:
|
|
|
|
|
|
|
|
|
|
|
|
|
|
|
|
| December 31, |
| December 31, |
|
| Balance Sheet Classification |
| Hierarchy |
| 2021 |
| 2020 |
|
|
|
|
|
|
|
|
|
|
|
Mortgage loans held for sale |
| Mortgage loans held for sale |
| Level 2 |
| $ | 353,063 |
| $ | 282,639 |
Mortgage loans held for investment (1) |
| Prepaid expenses and other assets |
| Level 3 |
| $ | 13,456 |
| $ | 8,727 |
Derivative assets |
| Prepaid expenses and other assets |
| Level 2 |
| $ | 5,944 |
| $ | 7,755 |
Mortgage servicing rights (2) |
| Prepaid expenses and other assets |
| Level 3 |
| $ | 13,701 |
| $ | 4,115 |
Derivative liabilities |
| Accrued expenses and other liabilities |
| Level 2 |
| $ | 359 |
| $ | 3,807 |
(1)The unobservable inputs used in the valuation of the mortgage loans held for investment include the value of underlying collateral, from markets where there is little observable trading activity.
(2)The unobservable inputs used in the valuation of the mortgage servicing rights include mortgage prepayment rates, discount rates and cost to service, which were 8.5%, 9.9%, and $0.085 per year per loan, respectively as of December 31, 2021 and 10.4%, 9.8%, and $0.084 per year per loan, respectively, as of December 31, 2020. The high and low end of the range of unobservable inputs used in the valuation did not result in a significant change to the fair value measurement.
The following table presentsrepresents the reconciliation of the beginning and ending balance for the Level 3 recurring fair value measurements:
|
|
|
|
|
|
| Year Ended December 31, |
|
|
|
|
|
|
Mortgage servicing rights |
| 2021 |
|
| 2020 |
Beginning of period | $ | 4,115 |
| $ | — |
Originations |
| 10,295 |
|
| 4,115 |
Settlements |
| (920) |
|
| — |
Changes in fair value |
| 211 |
|
| — |
End of period | $ | 13,701 |
| $ | 4,115 |
|
|
|
|
|
|
| Year Ended December 31, |
Mortgage loans held for investment |
| 2021 |
|
| 2020 |
Beginning of period | $ | 8,727 |
| $ | 3,385 |
Transfers from loans held for sale |
| 7,075 |
|
| 7,050 |
Settlements |
| (2,235) |
|
| (1,525) |
Reduction in unpaid principal balance |
| (213) |
|
| (111) |
Changes in fair value |
| 102 |
|
| (72) |
End of period | $ | 13,456 |
| $ | 8,727 |
For the financial assets and liabilities that the Company does not reflect at fair value, the following present both their respective carrying valuesvalue and estimated fair values of financial instruments (in thousands):value at December 31, 2021 and 2020:
| | | | | | | | | | | | | | |
| | | | | | | | | | | | | | |
| | | | December 31, 2017 | | December 31, 2016 |
| | Hierarchy | | Carrying | | Fair Value | | Carrying | | Fair Value |
Secured notes receivable(1) | | Level 2 | | $ | 2,753 | | $ | 2,727 | | $ | 2,850 | | $ | 2,828 |
Mortgage loans held for sale(2) | | Level 2 | | $ | 52,327 | | $ | 52,327 | | $ | — | | $ | — |
| | | | | | | | | | | | | | |
6.875% senior notes(3) | | Level 2 | | $ | 379,238 | | $ | 397,044 | | $ | 253,089 | | $ | 260,090 |
5.875 % senior notes (3) | | Level 2 | | $ | 394,725 | | $ | 400,225 | | $ | — | | $ | — |
Revolving line of credit(4) | | Level 2 | | $ | — | | $ | — | | $ | 195,000 | | $ | 195,000 |
Insurance premium notes and other(4) | | Level 2 | | $ | 2,320 | | $ | 2,320 | | $ | 5,999 | | $ | 5,999 |
Mortgage repurchase facilities(4) | | Level 2 | | $ | 48,319 | | $ | 48,319 | | $ | — | | $ | — |
|
|
|
|
|
|
|
|
|
|
|
|
|
|
|
|
|
|
|
|
|
|
|
|
|
|
|
|
|
|
|
|
|
| December 31, 2021 |
| December 31, 2020 |
|
|
|
|
|
|
|
|
|
|
|
|
|
|
|
|
| Hierarchy |
| Carrying |
| Fair Value |
| Carrying |
| Fair Value |
Cash and cash equivalents |
| Level 1 |
| $ | 316,310 |
| $ | 316,310 |
| $ | 394,001 |
| $ | 394,001 |
Secured notes receivable (1) |
| Level 2 |
| $ | — |
| $ | — |
| $ | 2,434 |
| $ | 2,448 |
3.875% senior notes (2)(3) |
| Level 2 |
| $ | 494,117 |
| $ | 504,375 |
| $ | — |
| $ | — |
5.875% senior notes (2)(3) |
| Level 2 |
| $ | — |
| $ | — |
| $ | 396,821 |
| $ | 417,500 |
6.750% senior notes (2)(3) |
| Level 2 |
| $ | 495,581 |
| $ | 526,875 |
| $ | 494,768 |
| $ | 533,750 |
Revolving line of credit(4) |
| Level 2 |
| $ | — |
| $ | — |
| $ | — |
| $ | — |
Other financing obligations(4)(5) |
| Level 3 |
| $ | 9,238 |
| $ | 9,238 |
| $ | 3,286 |
| $ | 3,286 |
Mortgage repurchase facilities(4) |
| Level 2 |
| $ | 331,876 |
| $ | 331,876 |
| $ | 259,050 |
| $ | 259,050 |
(1) |
| EstimatedDuring the year ended December 31, 2021, the secured note receivable was paid in full at $2.4 million. Prior year estimated fair value of the secured notes receivednote receivable was based on cash flow models discounted at market interest rates thatwhich considered the underlying risks of the note.
|
(2) |
| The mortgage loans held for sale are carried at fair value as of December 31, 2017, which was based on quoted market prices for those committed mortgage loans.
|
(3)
| | Estimated fair value of the senior notes incorporatedis based on recent trading activity in inactive markets. |
(4)(3)
|
| Carrying amounts include any associated unamortized deferred financing costs, premiums and discounts. As of December 31, 2021, these amounts totaled $5.9 million and $4.4 million for the 3.875% senior notes and 6.750% senior notes, respectively. As of December 31, 2020, these amounts totaled $5.2 million and $3.2 million for the 6.750% senior notes and 5.875% senior notes, respectively. |
(4) |
| Carrying amount approximates fair value due to short-term nature and interest rate terms. |
(5) |
| Insurance premium notes included in other financing obligations bore interest rates ranging from 2.99% to 3.24% during the year ended December 31, 2021 from 3.20% to 3.24% during the year ended December 31, 2020. |
TheDuring the year ended December 31, 2021, we recorded nominal impairment charges for one community. During the year ended December 31, 2020, we determined that inventory with a carrying amountvalue before impairment of cash$12.0 million within 4 communities across our Texas and cash equivalents approximates fair value. Nonfinancial assets and liabilities include items such as inventory and property and equipment that are measured atCentury Complete segments was not recoverable. Accordingly, we recognized impairment charges of an aggregate $2.2 million to reflect the estimated fair value when acquiredof the communities of $9.8 million. The estimated fair value of the communities was determined through a discounted cash flow approach utilizing Level 3 inputs. Changes in our cash flow projections in future periods related to these communities may change our conclusions on the recoverability of inventory in the future.
13. Leases
Under ASC 842, the Company determines if a contract is or contains a lease at inception or modification of a contract. A contract is or contains a lease if the contract conveys the right to control the use of an identified asset for a period in exchange for consideration. Control over the use of the identified asset means the lessee has both (a) the right to obtain substantially all of the economic benefits from the use of the asset and resulting from impairment, if deemed necessary.(b) the right to direct the use of the asset.
15. Operating Leases
The Company maintains noncancellableWe primarily enter into operating leases for the right to use office space.space and computer and office equipment, which have lease terms that generally range from 1 to 7 years and often include one or more options to renew. We include renewal terms in the lease term when it is reasonably certain that we will exercise the option. We establish a right of use asset and a lease liability at the commencement date of the lease based on the present value of future minimum lease payments. As the rate implicit in each lease is not readily determinable, we utilize our incremental borrowing rate in determining the present value of future minimum payments. Our incremental borrowing rate is determined based on information available at the commencement date. We account for the lease components and non-lease components as a single lease component. As of December 31, 2021, the Company had $16.9 million and $17.4 million recognized as a right of use asset and lease liability, respectively, which are presented on the consolidated balance sheet within prepaid expenses and other assets and accrued expenses and other liabilities, respectively. As of December 31, 2020, the Company had $16.2 million and $16.8 million recognized as a right of use asset and lease liability, respectively. The Company recognizeshas entered into various short-term operating leases, primarily for marketing billboards, with an initial term of twelve months or less. These leases are not recorded on our consolidated balance sheet.
Under ASC 842, operating lease expense is recognized on a straight-line basis over the life of each lease. Rentlease term. Operating lease expense was $7.3 million and $6.5 million for the years ended December 31, 2017, 20162021 and 2015 was $2.3 million, $1.4 million and $1.1 million,2020, respectively, included inwhich are presented on the consolidated statement of operations within selling, general, and administrative on our Consolidated Statementsexpense.
Information related to the Company’s right of Operations. use asset and lease liability were as follows (in thousands):
Future minimum
|
|
|
|
|
|
|
|
|
|
| Year Ended December 31, |
|
| 2021 |
|
| 2020 |
|
Cash paid for operating lease liabilities |
| $ | 6,768 |
|
| $ | 6,074 |
|
Right of use assets obtained in exchange for new operating lease obligations |
| $ | 6,712 |
|
| $ | 2,815 |
|
Weighted-average remaining lease term |
|
| 3.21 yrs |
|
|
| 3.52 yrs |
|
Weighted-average discount rate |
|
| 4.65 | % |
|
| 5.64 | % |
Maturities of lease paymentsliabilities as of December 31, 2017 are2021 were as follows (in thousands):
| | | |
2018 | | $ | 3,113 |
2019 | | | 2,314 |
2020 | | | 1,956 |
2021 | | | 1,418 |
2022 | | | 252 |
Thereafter | | | — |
Total | | $ | 9,053 |
|
|
|
|
2022 |
| $ | 5,989 |
2023 |
|
| 5,893 |
2024 |
|
| 4,427 |
2025 |
|
| 1,775 |
2026 |
|
| 587 |
Thereafter |
|
| 17 |
Total |
| $ | 18,688 |
Less: discount |
|
| (1,329) |
Total lease liabilities |
| $ | 17,359 |
16.14. Post-Retirement Plan
The Company has a 401(k) plan coveringplans available to substantially all employees. The Company generally makes matching contributions of 50% of employees’ salary deferral amounts on the first 6% of employees’ compensation. The Company also has a second 401(k) plan assumed from our acquisition of UCP, in which matching contributions are based on a percentage of employee compensation. Contributions to the plans during the years ended December 31, 2017, 20162021, 2020 and 20152019 were $1.0$3.2 million, $0.4$2.5 million and $0.2$1.9 million, respectively.
17.15. Stock-Based Compensation
During the years ended December 31, 2021, 2020 and 2019, we granted performance share units (which we refer to as “PSUs”) covering up to 0.2 million, 0.3 million, and 0.3 million shares of common stock, respectively in each year, assuming maximum level of performance, with grant date fair values of $58.28, $26.38, and $22.01, respectively, per share that are subject to both service and
performance vesting conditions. The quantity of shares that will ultimately vest for the PSUs ranges from 0% to 250% of a targeted number of shares for each participant and will be determined based on an achievement of a three year pre-tax income performance goal.During the year ended December 31, 2017,2021, 0.3 million PSUs of common stock vested that were granted in 2018. Approximately 0.8 million shares will vest in 2022 to 2024 if the defined maximum performance targets are met, and 0 shares will vest if the defined minimum performance targets are not met.During the years ended December 31, 2021, 2020 and 2019, we also granted shares of restricted stock units which(which we refer to as “RSUs”) covering 0.2 million, 0.4 million and 0.6 million shares of common stock, respectively, with grant date fair values of $53.21, $30.44 and $23.85 per share, respectively, that vest over a period1 to 3 year period. During the year ended December 31, 2021, we granted 7.0 thousand shares of three years from thecommon stock on an unrestricted basis (which we refer to as “stock awards”) with grant date. date fair values of $78.30 to our non-employee directors.
The following table summarizes the activity of our restrictedPSUs, RSUs, and stock units and restricted common stockawards for the years ended December 31, 2017, 20162021, 2020 and 20152019 (in thousands):
| | | | | | | | | | | | | | | |
|
|
|
|
|
|
|
|
|
|
|
|
|
|
| | Year Ended December 31, |
| Year Ended December 31, |
| | 2017 | | 2016 | | 2015 |
| 2021 |
| 2020 |
| 2019 |
| | Shares | | | Weighted average per share grant date fair value | | Shares | | | Weighted average per share grant date fair value | | Shares | | | Weighted average per share grant date fair value |
| Shares |
|
| Weighted average per share grant date fair value |
| Shares |
|
| Weighted average per share grant date fair value |
| Shares |
|
| Weighted average per share grant date fair value |
Outstanding, beginning of year | | 852 | | $ | 15.81 | | 696 | | $ | 18.18 | | 366 | | $ | 20.78 |
| 1,462 |
| $ | 26.76 |
| 1,219 |
| $ | 24.64 |
| 846 |
| $ | 25.14 |
Granted | | 460 | | | 21.64 | | 514 | | | 14.28 | | 500 | | | 16.92 |
| 347 |
|
| 55.60 |
| 701 |
|
| 28.90 |
| 882 |
|
| 23.49 |
Vested | | (452) | | | 17.19 | | (297) | | | 18.65 | | (141) | | | 20.62 |
| (675) |
|
| 29.31 |
| (454) |
|
| 24.42 |
| (430) |
|
| 23.53 |
Forfeited | | (26) | | | 19.63 | | (61) | | | 16.05 | | (29) | | | 17.42 |
| (30) |
|
| 37.68 |
| (4) |
|
| 28.56 |
| (79) |
|
| 24.99 |
Outstanding, end of year | | 834 | | $ | 18.16 | | 852 | | $ | 15.81 | | 696 | | $ | 18.18 |
| 1,104 |
| $ | 31.48 |
| 1,462 |
| $ | 26.76 |
| 1,219 |
| $ | 24.64 |
A summary of our outstanding awardsRSUs and PSUs, assuming current estimated level of restricted common stock and restricted stock unitsperformance achievement, are as follows (in thousands, except years):
| | | | | | | | | |
| | | As of December 31, 2017 |
| | Restricted Stock Awards | | Restricted Stock Units | | Total |
Unvested awards/units | | | 138 | | | 696 | | | 834 |
Unrecognized compensation cost | | $ | 319 | | $ | 7,034 | | $ | 7,353 |
Period to recognize compensation cost | | | 0.2 years | | | 1.8 years | | | 1.8 years (average) |
|
|
|
|
|
| As of December 31, 2021 |
Unvested units |
|
| 1,104 |
Unrecognized compensation cost |
| $ | 17,206 |
Weighted-average period to recognize compensation cost |
|
| 1.69 |
During the years ended December 31, 2017, 20162021, 2020 and 2015,2019, the Company recognized stock-based compensation expense of $9.5$14.4 million, $6.7$18.3 million and $5.2$15.3 million, respectively, which is generally included in selling, general and administrative on the Consolidated Statementsconsolidated statements of Operations.operations.
18.16. Stockholders’ Equity
The Company’s authorized capital stock consists of 100.0 million shares of common stock, par value $0.01 per share, and 50.0 million shares of preferred stock, par value $0.01 per share. As of December 31, 20172021, and 2016,2020, there were 29.433.8 million and 21.333.4 million shares of common stock issued and outstanding, exclusive of the restricted common stock issued, respectively.
We issued 0.3 millionrespectively, and 0 shares of commonpreferred stock related to the vesting of restricted stock awards during the years ended December 31, 2017 under our First Amended & Restated 2013 Long-Term Incentive Plan. At our 2017 annual meeting of stockholders held onoutstanding.
On May 10, 2017, our stockholders approved the adoption of the Century Communities, Inc. 2017 Omnibus Incentive Plan (which we refer to as our “2017 Incentive Plan”), which replaced our First Amended & Restated 2013 Long-Term Incentive Plan. We had reserved a total of 1.8 million shares of our common stock for issuance under our First Amended & Restated 2013 Long-Term Incentive Plan, of which approximately 0.6 million shares rolled over into the 2017 Incentive Plan when it became effective. AsOn May 8, 2019, our stockholders approved the Century Communities, Inc. Amended and Restated 2017 Omnibus Incentive Plan (which we refer to as our “Amended 2017 Incentive Plan”), which increased the number of December 31, 2017, approximately 1.2 million shares remain availableof our common stock authorized for issuance under the 2017 Incentive Plan.Plan by an additional 1.6 million shares. We also issued 4.20.7 million and 0.5 million shares of our common stock in connection with our acquisitionrelated to the vesting of UCP, as discussed in Note 3. RSUs and stock awards during the years ended December 31, 2021 and 2020, respectively. As of December 31, 2021, approximately 0.7 million shares of common stock remained available for issuance under the Amended 2017 Incentive Plan.
On November 7, 2016,27, 2019, we entered into a Distribution Agreement with J.P. Morgan Securities LLC, BofA Securities, Inc., Citigroup Global Markets Inc., and Fifth Third Securities, Inc. (which we refer to as the “First Distribution“Distribution Agreement”) with J.P. Morgan Securities LLC, Merrill Lynch, Pierce, Fenner & Smith Incorporated, and Citigroup Global Markets Inc. (which, as sales agents pursuant to which we refer to collectively as the “Sales Agents”), relating to our common stock. Under the First Distribution Agreement, we were authorized tomay offer and sell shares of our common stock having an aggregate offering price of up to $50.0$100.0 million from time to time through any of our Sales Agentsthe sales agents party thereto in “at“at-the-market” offerings, in accordance with the market” offerings. On August 9, 2017, we entered into a secondterms and conditions set forth in the Distribution Agreement. This Distribution Agreement, (which we referwhich superseded and replaced a prior similar distribution agreement, and was amended in July 2021 to acknowledge our filing of a new registration statement on Form S-3 registering the issuance and sale of shares
of our common stock under the Distribution Agreement and replace Citigroup Global Markets Inc. with Wells Fargo Securities, LLC as a sales agent, had all $100.0 million available for sale as of December 31, 2021. We did 0t sell or issue any shares of our common stock during the “Secondyears ended December 31, 2021 and 2020. The Distribution Agreement”)Agreement will remain in full force and effect until terminated by either party pursuant to the terms of the agreement or such date that the maximum offering amount has been sold in accordance with the Sales Agents, pursuant toterms of the agreement.
In November 2018, we authorized a stock repurchase program, under which we may offer and sell from time to timerepurchase up to $100.0 million in “at the market” offerings.4,500,000 shares of our outstanding common stock. During the years ended December 31, 20172021 and 2016,2020, we sold and issued an aggregatedid not repurchase any shares of 3.7 million and 0.6 millioncommon stock. The maximum number of shares available to be purchased under the stock repurchase program as of December 31, 2021 was 3,812,939 shares. During the year ended December 31, 2019, we repurchased 83,000 shares of common stock under this program for approximately $1.4 million.
On May 19, 2021, our Board of Directors approved the initiation of a quarterly cash dividend. The following table sets forth cash dividends declared by our Board of Directors to holders of record of our common stock respectively, underduring the First Distribution Agreement and Second Distribution Agreement, which provided net proceeds to us of $98.1 million and $11.4 million, respectively, and in connection with such sales, we paid total commissions and fees to the Sales Agents of $2.0 million and $0.2 million, respectively.year ended December 31, 2021 (in thousands, except per share information):
19.
|
|
|
|
|
|
|
|
|
|
|
|
|
|
|
|
|
|
|
|
|
|
|
|
|
|
|
| Cash Dividends Declared |
Declaration Date |
| Record Date |
| Payable Date |
| Per Share |
| Amount |
May 19, 2021 |
| June 2, 2021 |
| June 16, 2021 |
| $ | 0.15 |
| $ | 5,064 |
August 18, 2021 |
| September 1, 2021 |
| September 15, 2021 |
| $ | 0.15 |
| $ | 5,064 |
November 10, 2021 |
| December 1, 2021 |
| December 15, 2021 |
| $ | 0.15 |
| $ | 5,064 |
17. Earnings Per Share
We useDuring the two-classyears ended December 31, 2021, 2020 and 2019, we used the treasury stock method of calculating earnings per share (EPS)(which we refer to as “EPS”) as our unvested restricted stock awardscurrently non-vested RSUs and PSUs do not have non-forfeitable rights to dividends, and accordingly represent a participating security. The two-class method is an earnings allocation method under which EPS is calculated for each class of common stock and participating security considering both dividends declared (or accumulated) and participation rights in undistributed earnings as if all such earnings had been distributed during the period.rights.
The following table sets forth the computation of basic and diluted earnings per share for the years ended December 31, 2017, 20162021, 2020 and 20152019 (in thousands, except share and per share information):
|
|
|
|
|
|
|
|
|
|
|
|
|
|
|
|
|
|
|
|
|
| Year Ended December 31, |
|
| 2021 |
| 2020 |
| 2019 |
Numerator |
|
|
|
|
|
|
|
|
|
Net income |
| $ | 498,504 |
| $ | 206,157 |
| $ | 112,994 |
Denominator |
|
|
|
|
|
|
|
|
|
Weighted average common shares outstanding - basic |
|
| 33,706,782 |
|
| 33,312,554 |
|
| 30,886,382 |
Dilutive effect of restricted stock units |
|
| 738,136 |
|
| 297,544 |
|
| 300,570 |
Weighted average common shares outstanding - diluted |
|
| 34,444,918 |
|
| 33,610,098 |
|
| 31,186,952 |
Earnings per share: |
|
|
|
|
|
|
|
|
|
Basic |
| $ | 14.79 |
| $ | 6.19 |
| $ | 3.66 |
Diluted |
| $ | 14.47 |
| $ | 6.13 |
| $ | 3.62 |
| | | | | | | | |
| | | |
| Year Ended December 31, |
| 2017 | | 2016 | | 2015 |
Numerator | | | | | | | | |
Net income | $ | 50,295 | | $ | 49,540 | | $ | 39,890 |
Less: Undistributed earnings allocated to participating securities | | (384) | | | (1,050) | | | (1,323) |
Net income allocable to common stockholders | $ | 49,911 | | $ | 48,490 | | $ | 38,567 |
Denominator | | | | | | | | |
Weighted average common shares outstanding - basic | | 24,280,871 | | | 20,679,189 | | | 20,569,012 |
Dilutive effect of restricted stock units | | 274,638 | | | 112,748 | | | — |
Weighted average common shares outstanding - diluted | | 24,555,509 | | | 20,791,937 | | | 20,569,012 |
Earnings per share: | | | | | | | | |
Basic | $ | 2.06 | | $ | 2.34 | | $ | 1.88 |
Diluted | $ | 2.03 | | $ | 2.33 | | $ | 1.88 |
Stock-based awards are excluded from the calculation of diluted EPS in the event they are subject to unsatisfied performance conditions or are antidilutive. We do not have anyexcluded 0.2 million, 0.8 million, and 0.6 million common stock unit equivalents to exclude from diluted earnings per share during the years ended December 31, 2017, 20162021, 2020 and 2015.
20. Related-Party Transactions
Prior2019 respectively, related to our May 2013 private placement, the Company transacted with entities that were controlled by the same individuals who control the Company and are Co-CEOs of the Company. Transactions between entities under common control for land inventory are recorded at the carrying basis of the related party.
During the years ended December 31, 2017, 2016 and 2015, we delivered homesPSUs for which the land was originally purchased from entities under common control. Recording the lots at the carrying basisperformance conditions remained unsatisfied.
21.18. Commitments and Contingencies
Letters of Credit and Performance Bonds
In the normal course of business, the Company posts letters of credit and performance and other bonds primarily related to our land development performance obligations, with local municipalities. As of December 31, 20172021 and 2016,2020, we had $78.3$492.5 million and $70.1$402.7 million, respectively, in letters of credit and performance and other bonds issued and outstanding.
LitigationLegal Proceedings
The Company is subject to claims and lawsuits that arise primarily in the ordinary course of business, which consist primarily of construction defect claims. It is the opinion of management that if the claims have merit, parties other than the Company would be, at least in part, liable for the claims, and eventual outcome of these claims will not have a material adverse effect upon our consolidated financial condition, results of operations, or cash flows. When we believe that a loss is probable and estimable, we record a charge to selling, general and administrative expense on our Consolidated Statementsconsolidated statements of Operationsoperations for our estimated loss.
Under various insurance policies, we have the ability to recoup costs in excess of applicable self-insured retentions. Estimates of such amounts are recorded in other assets on our consolidated balance sheet when recovery is probable.
We do not believe that the ultimate resolution of any claims and lawsuits will have a material adverse effect upon our consolidated financial position, results of operations, or cash flow.
22.19. Results of Quarterly Operations (Unaudited)
| | | | | | | | | | | | |
|
|
|
|
|
|
|
|
|
|
|
|
| | Quarter |
| Quarter |
| | First | | Second | | Third | | Fourth |
| First |
| Second |
| Third |
| Fourth |
| | (in thousands, except per share amounts) |
| (in thousands, except per share amounts) |
2017 | | | | | | | | | | | | | |
2021 | |
|
|
|
|
|
|
|
|
|
|
|
|
Home sales revenues | | $ | 226,420 | | $ | 287,588 | | $ | 374,935 | | $ | 516,500 |
| $ | 959,279 |
| $ | 1,004,789 |
| $ | 917,337 |
| $ | 1,151,564 |
Gross margin from home sales revenues | | $ | 44,096 | | $ | 53,700 | | $ | 63,570 | | $ | 90,718 |
| $ | 202,772 |
| $ | 240,121 |
| $ | 235,325 |
| $ | 298,704 |
Income before tax expense | | $ | 12,051 | | $ | 23,109 | | $ | 15,156 | | $ | 33,848 | |
Income before income tax expense | |
| $ | 131,049 |
| $ | 152,134 |
| $ | 145,761 |
| $ | 212,177 |
Net income | | $ | 8,799 | | $ | 14,831 | | $ | 9,470 | | $ | 17,195 |
| $ | 101,652 |
| $ | 117,910 |
| $ | 113,977 |
| $ | 164,965 |
Basic earnings per share | | $ | 0.40 | | $ | 0.67 | | $ | 0.37 | | $ | 0.61 |
| $ | 3.03 |
| $ | 3.49 |
| $ | 3.38 |
| $ | 4.89 |
Diluted earnings per share | | $ | 0.40 | | $ | 0.66 | | $ | 0.37 | | $ | 0.60 |
| $ | 3.00 |
| $ | 3.47 |
| $ | 3.31 |
| $ | 4.78 |
| | | | | | | | | | | | |
|
|
|
|
|
|
|
|
|
|
|
|
2016 | | | | | | | | | | | | | |
2020 | |
|
|
|
|
|
|
|
|
|
|
|
|
Home sales revenues | | $ | 181,081 | | $ | 257,179 | | $ | 248,075 | | $ | 292,398 |
| $ | 572,710 |
| $ | 747,415 |
| $ | 760,239 |
| $ | 946,803 |
Gross margin from home sales revenues | | $ | 36,728 | | $ | 49,296 | | $ | 50,425 | | $ | 56,157 |
| $ | 102,183 |
| $ | 126,760 |
| $ | 132,875 |
| $ | 197,216 |
Income before tax expense | | $ | 12,429 | | $ | 19,097 | | $ | 19,731 | | $ | 21,892 | |
Income before income tax expense | |
| $ | 34,088 |
| $ | 50,103 |
| $ | 64,885 |
| $ | 121,164 |
Net income | | $ | 7,983 | | $ | 13,142 | | $ | 13,342 | | $ | 15,073 |
| $ | 26,126 |
| $ | 38,450 |
| $ | 49,764 |
| $ | 91,817 |
Basic and diluted earnings per share | | $ | 0.38 | | $ | 0.62 | | $ | 0.63 | | $ | 0.71 | |
Basic earnings per share | |
| $ | 0.79 |
| $ | 1.15 |
| $ | 1.49 |
| $ | 2.75 |
Diluted earnings per share | |
| $ | 0.78 |
| $ | 1.15 |
| $ | 1.48 |
| $ | 2.72 |
23. Supplemental Guarantor Information
The Existing 6.875% Notes and the Existing 5.875% Notes are our unsecured senior obligations, and are fully and unconditionally guaranteed on an unsecured basis, jointly and severally, by substantially all of our direct and indirect wholly-owned operating subsidiaries (which we refer to as “Guarantors”).
Each of the May 2014 Indenture governing the Existing 6.875% Notes, and the May 2017 Indenture governing the Existing 5.875% Notes, provides that the guarantees of a Guarantor will be automatically and unconditionally released and discharged: (1) upon any sale, transfer, exchange or other disposition (by merger, consolidation or otherwise) of all of the equity interests of such Guarantor after which the applicable Guarantor is no longer a “Restricted Subsidiary” (as defined in the applicable Indenture), which sale, transfer, exchange or other disposition does not constitute an “Asset Sale” (as defined in the applicable Indenture) or is made in compliance with applicable provisions of the applicable Indenture; (2) upon any sale, transfer, exchange or other disposition (by merger, consolidation or otherwise) of all of the assets of such Guarantor, which sale, transfer, exchange or other disposition does not constitute an Asset Sale or is made in compliance with applicable provisions of the applicable Indenture; provided, that after such sale, transfer, exchange or other disposition, such Guarantor is an “Immaterial Subsidiary” (as defined in the applicable Indenture); (3) unless a default has occurred and is continuing, upon the release or discharge of such Guarantor from its guarantee of any indebtedness for borrowed money of the Company and the Guarantors so long as such Guarantor would not then otherwise be required to provide a guarantee pursuant to the applicable Indenture; provided that if such Guarantor has incurred any indebtedness in reliance on its status as a Guarantor in compliance with applicable provisions of the applicable Indenture, such Guarantor’s obligations under such indebtedness, as the case may be, so incurred are satisfied in full and discharged or are otherwise permitted to be incurred by a Restricted Subsidiary (other than a Guarantor) in compliance with applicable provisions of the applicable Indenture; (4) upon the designation of such Guarantor as an “Unrestricted Subsidiary” (as defined in the applicable Indenture), in accordance with the applicable Indenture; (5) if the Company exercises its legal defeasance option or covenant defeasance option under the applicable Indenture or if the obligations of the Company and the Guarantors are discharged in compliance with applicable provisions of the applicable Indenture, upon such exercise or discharge; or (6) in connection with the dissolution of such Guarantor under applicable law in accordance with the applicable Indenture.
As the guarantees were made in connection with the February 2015 exchange offer for the Initial Exchange Notes, the October 2015 exchange offer for the October 2015 Exchange Notes, the April 2017 exchange offer for the April 2017 Exchange Notes, and the December exchange offer for the December 2017 Exchange Notes, the Guarantors’ condensed financial information is presented as if the guarantees existed during the periods presented. If any Guarantors are released from the guarantees in future periods, the changes are reflected prospectively.
We have determined that separate, full financial statements of the Guarantors would not be material to investors and, accordingly, supplemental financial information is presented below:
| | | | | | | | | | | | | | | |
| | Supplemental Condensed Consolidated Balance Sheet |
| | As of December 31, 2017 (in thousands) |
| | | | | Guarantor | | Non Guarantor | | Elimination | | Consolidated |
| | CCS | | Subsidiaries | | Subsidiaries | | Entries | | CCS |
Assets | | | | | | | | | | | | | | | |
Cash and cash equivalents | | $ | 56,234 | | $ | 23,399 | | $ | 9,199 | | $ | — | | $ | 88,832 |
Cash held in escrow | | | — | | | 37,088 | | | 635 | | | — | | | 37,723 |
Accounts receivable | | | 3,124 | | | 9,944 | | | (69) | | | — | | | 12,999 |
Investment in consolidated subsidiaries | | | 1,434,619 | | | — | | | — | | | (1,434,619) | | | — |
Inventories | | | — | | | 1,390,354 | | | — | | | — | | | 1,390,354 |
Mortgage loans held for sale | | | — | | | — | | | 52,327 | | | — | | | 52,327 |
Prepaid expenses and other assets | | | 3,028 | | | 57,273 | | | 511 | | | — | | | 60,812 |
Deferred tax assets, net | | | 5,555 | | | — | | | — | | | — | | | 5,555 |
Property and equipment, net | | | 11,694 | | | 15,683 | | | 534 | | | — | | | 27,911 |
Investment in unconsolidated subsidiaries | | | 28,208 | | | — | | | — | | | | | | 28,208 |
Amortizable intangible assets, net | | | — | | | 2,938 | | | — | | | — | | | 2,938 |
Goodwill | | | — | | | 27,363 | | | — | | | — | | | 27,363 |
Total assets | | $ | 1,542,462 | | $ | 1,564,042 | | $ | 63,137 | | $ | (1,434,619) | | $ | 1,735,022 |
Liabilities and stockholders’ equity | | | | | | | | | | | | | | | |
Liabilities: | | | | | | | | | | | | | | | |
Accounts payable | | $ | 1,452 | | $ | 23,057 | | $ | 322 | | $ | — | | $ | 24,831 |
Accrued expenses and other liabilities | | | 31,814 | | | 117,070 | | | 1,472 | | | — | | | 150,356 |
Notes payable | | | 773,963 | | | 2,320 | | | — | | | — | | | 776,283 |
Revolving line of credit | | | — | | | — | | | — | | | — | | | — |
Mortgage repurchase facilities | | | — | | | — | | | 48,319 | | | — | | | 48,319 |
Total liabilities | | | 807,229 | | | 142,447 | | | 50,113 | | | — | | | 999,789 |
Stockholders’ equity: | | | 735,233 | | | 1,421,595 | | | 13,024 | | | (1,434,619) | | | 735,233 |
Total liabilities and stockholders’ equity | | $ | 1,542,462 | | $ | 1,564,042 | | $ | 63,137 | | $ | (1,434,619) | | $ | 1,735,022 |
| | | | | | | | | | | | | | | |
| | Supplemental Condensed Consolidated Balance Sheet |
| | As of December 31, 2016 (in thousands) |
| | | | | | | | | | | | | | | |
| | | | | Guarantor | | Non Guarantor | | Elimination | | Consolidated |
| | CCS | | Subsidiaries | | Subsidiaries | | Entries | | CCS |
Assets | | | | | | | | | | | | | | | |
Cash and cash equivalents | | $ | 14,637 | | $ | 8,646 | | $ | 6,167 | | $ | — | | $ | 29,450 |
Cash held in escrow | | | — | | | 20,044 | | | — | | | — | | | 20,044 |
Accounts receivable | | | 2,980 | | | 2,676 | | | — | | | — | | | 5,656 |
Investment in subsidiaries | | | 895,990 | | | — | | | — | | | (895,990) | | | — |
Inventories | | | — | | | 857,885 | | | — | | | — | | | 857,885 |
Prepaid expenses and other assets | | | 3,303 | | | 31,244 | | | 167 | | | — | | | 34,714 |
Property and equipment, net | | | 1,166 | | | 14,747 | | | 22 | | | — | | | 15,935 |
Investment in unconsolidated subsidiaries | | | 18,275 | | | — | | | — | | | — | | | 18,275 |
Amortizable intangible assets, net | | | — | | | 4,204 | | | — | | | — | | | 4,204 |
Goodwill | | | — | | | 21,365 | | | — | | | — | | | 21,365 |
Total assets | | $ | 936,351 | | $ | 960,811 | | $ | 6,356 | | $ | (895,990) | | $ | 1,007,528 |
Liabilities and stockholders’ equity | | | | | | | | | | | | | | | |
Liabilities: | | | | | | | | | | | | | | | |
Accounts payable | | $ | 257 | | $ | 15,593 | | $ | (124) | | $ | — | | $ | 15,726 |
Accrued expenses and other liabilities | | | 12,587 | | | 49,679 | | | 30 | | | — | | | 62,296 |
Deferred tax liabilities, net | | | 1,782 | | | — | | | — | | | — | | | 1,782 |
Senior notes payable | | | 253,089 | | | 5,999 | | | — | | | — | | | 259,088 |
Revolving line of credit | | | 195,000 | | | — | | | — | | | — | | | 195,000 |
Total liabilities | | | 462,715 | | | 71,271 | | | (94) | | | — | | | 533,892 |
Stockholders’ equity: | | | 473,636 | | | 889,540 | | | 6,450 | | | (895,990) | | | 473,636 |
Total liabilities and stockholders’ equity | | $ | 936,351 | | $ | 960,811 | | $ | 6,356 | | $ | (895,990) | | $ | 1,007,528 |
| | | | | | | | | | | | | | | |
| | Supplemental Condensed Consolidated Statement of Operations |
| For the Year Ended December 31, 2017 (in thousands) |
| | | | | Guarantor | | Non Guarantor | | Elimination | | Consolidated |
| | CCS | | Subsidiaries | | Subsidiaries | | Entries | | CCS |
Revenues | | | | | | | | | | | | | | | |
Homebuilding revenues | | | | | | | | | | | | | | | |
Home sales revenues | | $ | — | | $ | 1,405,443 | | $ | — | | $ | — | | $ | 1,405,443 |
Land sales and other revenues | | | — | | | 8,503 | | | — | | | — | | | 8,503 |
| | | — | | | 1,413,946 | | | — | | | — | | | 1,413,946 |
Financial services revenue | | | — | | | — | | | 9,853 | | | — | | | 9,853 |
Total revenues | | | — | | | 1,413,946 | | | 9,853 | | | — | | | 1,423,799 |
Homebuilding cost of revenues | | | | | | | | | | | | | | | |
Cost of homes sales revenues | | | — | | | (1,153,359) | | | — | | | — | | | (1,153,359) |
Cost of land sales and other revenues | | | — | | | (6,516) | | | — | | | — | | | (6,516) |
| | | — | | | (1,159,875) | | | — | | | — | | | (1,159,875) |
Financial services costs | | | — | | | — | | | (8,664) | | | — | | | (8,664) |
Selling, general and administrative | | | (48,386) | | | (127,918) | | | — | | | — | | | (176,304) |
Acquisition expense | | | (9,905) | | | — | | | — | | | — | | | (9,905) |
Equity in earnings from consolidated subsidiaries | | | 83,979 | | | — | | | — | | | (83,979) | | | — |
Equity in income of unconsolidated subsidiaries | | | 12,176 | | | — | | | — | | | — | | | 12,176 |
Other income (expense) | | | 1,080 | | | 1,820 | | | 37 | | | — | | | 2,937 |
Income before income tax expense | | | 38,944 | | | 127,973 | | | 1,226 | | | (83,979) | | | 84,164 |
Income tax expense | | | 11,351 | | | (44,791) | | | (429) | | | — | | | (33,869) |
Net income | | $ | 50,295 | | $ | 83,182 | | $ | 797 | | $ | (83,979) | | $ | 50,295 |
| | | | | | | | | | | | | | | |
| | Supplemental Condensed Consolidated Statement of Operations |
| For the Year Ended December 31, 2016 (in thousands) |
| | | | | | | | | | | | | | | |
| | | | | Guarantor | | Non Guarantor | | Elimination | | Consolidated |
| | CCS | | Subsidiaries | | Subsidiaries | | Entries | | CCS |
Revenues | | | | | | | | | | | | | | | |
Homebuilding revenues | | | | | | | | | | | | | | | |
Home sales revenues | | $ | — | | $ | 978,733 | | $ | — | | $ | — | | $ | 978,733 |
Land sales and other revenues | | | — | | | 15,707 | | | — | | | — | | | 15,707 |
| | | — | | | 994,440 | | | — | | | — | | | 994,440 |
Financial services revenue | | | — | | | — | | | — | | | — | | | — |
Total revenues | | | — | | | 994,440 | | | — | | | — | | | 994,440 |
Homebuilding cost of revenues | | | | | | | | | | | | | | | |
Cost of homes sales revenues | | | — | | | (786,127) | | | — | | | — | | | (786,127) |
Cost of land sales and other revenues | | | — | | | (14,217) | | | — | | | — | | | (14,217) |
| | | — | | | (800,344) | | | — | | | — | | | (800,344) |
Financial services costs | | | — | | | — | | | — | | | — | | | — |
Selling, general and administrative | | | (25,674) | | | (96,235) | | | (315) | | | — | | | (122,224) |
Acquisition expense | | | (490) | | | — | | | — | | | — | | | (490) |
Equity in earnings from consolidated subsidiaries | | | 64,297 | | | — | | | — | | | (64,297) | | | — |
Equity in income of unconsolidated subsidiaries | | | 191 | | | — | | | — | | | — | | | 191 |
Other income (expense) | | | 34 | | | 1,542 | | | — | | | — | | | 1,576 |
Income before income tax expense | | | 38,358 | | | 99,403 | | | (315) | | | (64,297) | | | 73,149 |
Income tax expense | | | 11,182 | | | (34,791) | | | — | | | — | | | (23,609) |
Net income | | $ | 49,540 | | $ | 64,612 | | $ | (315) | | $ | (64,297) | | $ | 49,540 |
| | | | | | | | | | | | | | | |
| | | | | | | | | | | | | | | |
| | Supplemental Condensed Consolidated Statement of Cash Flows |
| | For the Year Ended December 31, 2017 (in thousands) |
| | | | | Guarantor | | Non Guarantor | | Elimination | | Consolidated |
| | CCS | | Subsidiaries | | Subsidiaries | | Entries | | CCS |
Net cash provided by/(used in) operating activities | | $ | (27,787) | | $ | (36,309) | | $ | (50,552) | | $ | — | | $ | (114,648) |
Net cash used in investing activities | | $ | (456,299) | | $ | (118,583) | | $ | (513) | | $ | 440,949 | | $ | (134,446) |
Financing activities | | | | | | | | | | | | | | | |
Borrowings under revolving credit facilities | | $ | 175,000 | | $ | — | | $ | — | | $ | — | | $ | 175,000 |
Payments on revolving credit facilities | | | (370,000) | | | — | | | — | | | — | | | (370,000) |
Proceeds from issuance of senior notes | | | 527,500 | | | — | | | — | | | — | | | 527,500 |
Proceeds from insurance premium notes and other | | | — | | | 2,320 | | | — | | | — | | | 2,320 |
Repayment of debt assumed in business combination | | | — | | | (151,919) | | | — | | | — | | | (151,919) |
Principal payments on notes payable | | | — | | | (6,998) | | | — | | | — | | | (6,998) |
Debt issuance costs | | | (8,579) | | | — | | | — | | | — | | | (8,579) |
Repurchases of common stock upon vesting of restricted stock awards | | | (5,231) | | | — | | | — | | | — | | | (5,231) |
Payments from (and advances to) parent/subsidiary | | | 108,930 | | | 326,242 | | | 5,777 | | | (440,949) | | | — |
Net proceeds from mortgage repurchase facilities | | | — | | | — | | | 48,320 | | | — | | | 48,320 |
Net proceeds from issuances of common stock | | | 98,063 | | | — | | | — | | | — | | | 98,063 |
Net cash provided by financing activities | | $ | 525,683 | | $ | 169,645 | | $ | 54,097 | | $ | (440,949) | | $ | 308,476 |
Net decrease in cash and cash equivalents | | $ | 41,597 | | $ | 14,753 | | $ | 3,032 | | $ | — | | $ | 59,382 |
Cash and cash equivalents | | | | | | | | | | | | | | | |
Beginning of period | | $ | 14,637 | | $ | 8,646 | | $ | 6,167 | | $ | — | | $ | 29,450 |
End of period | | $ | 56,234 | | $ | 23,399 | | $ | 9,199 | | $ | — | | $ | 88,832 |
| | | | | | | | | | | | | | | |
| | Supplemental Condensed Consolidated Statement of Cash Flows |
| | For the Year Ended December 31, 2016 (in thousands) |
| | | | | Guarantor | | Non Guarantor | | Elimination | | Consolidated |
| | CCS | | Subsidiaries | | Subsidiaries | | Entries | | CCS |
Net cash provided by/(used in) operating activities | | $ | (16,138) | | $ | (29,123) | | $ | (575) | | $ | — | | $ | (45,836) |
Net cash used in investing activities | | $ | (58,032) | | $ | (5,585) | | $ | (23) | | $ | 40,439 | | $ | (23,201) |
Financing activities | | | | | | | | | | | | | | | |
Borrowings under revolving credit facilities | | $ | 220,000 | | $ | — | | $ | — | | $ | — | | $ | 220,000 |
Payments on revolving credit facilities | | | (160,000) | | | — | | | — | | | — | | | (160,000) |
Proceeds from issuance of senior notes | | | — | | | — | | | — | | | — | | | — |
Proceeds from insurance premium notes and other | | | — | | | 11,612 | | | — | | | — | | | 11,612 |
Repurchases of common stock under our stock repurchase program | | | (2,393) | | | — | | | — | | | — | | | (2,393) |
Principal payments on notes payable | | | — | | | (9,217) | | | — | | | — | | | (9,217) |
Debt issuance costs | | | (1,156) | | | — | | | — | | | — | | | (1,156) |
Repurchases of common stock upon vesting of restricted stock awards | | | (1,015) | | | — | | | — | | | — | | | (1,015) |
Payments from (and advances to) parent/subsidiary | | | — | | | 33,674 | | | 6,765 | | | (40,439) | | | — |
Net proceeds from mortgage repurchase facilities | | | — | | | — | | | — | | | — | | | — |
Net proceeds from issuances of common stock | | | 11,369 | | | — | | | — | | | — | | | 11,369 |
Net cash provided by financing activities | | $ | 66,805 | | $ | 36,069 | | $ | 6,765 | | $ | (40,439) | | $ | 69,200 |
Net decrease in cash and cash equivalents | | $ | (7,365) | | $ | 1,361 | | $ | 6,167 | | $ | — | | $ | 163 |
Cash and cash equivalents | | | | | | | | | | | | | | | |
Beginning of period | | $ | 22,002 | | $ | 7,285 | | $ | — | | $ | — | | $ | 29,287 |
End of period | | $ | 14,637 | | $ | 8,646 | | $ | 6,167 | | $ | — | | $ | 29,450 |
| | | | | | | | | | | | | | | |
| | Supplemental Condensed Consolidated Statement of Cash Flows |
| | For the Year Ended December 31, 2015 (in thousands) |
| | | | | Guarantor | | Non Guarantor | | Elimination | | Consolidated |
| | CCS | | Subsidiaries | | Subsidiaries | | Entries | | CCS |
Net cash used in operating activities | | $ | (3,742) | | $ | (158,992) | | $ | — | | $ | — | | $ | (162,734) |
Net cash used in investing activities | | | (167,244) | | | (3,839) | | | — | | | 166,851 | | | (4,232) |
Financing activities | | | | | | | | | | | | | | | |
Borrowings under revolving credit facilities | | | 180,000 | | | — | | | — | | | — | | | 180,000 |
Payments on revolving credit facilities | | | (65,000) | | | — | | | — | | | — | | | (65,000) |
Proceeds from issuance of senior notes | | | 58,956 | | | — | | | — | | | — | | | 58,956 |
Proceeds from issuance of notes payable | | | — | | | 1,169 | | | — | | | — | | | 1,169 |
Principal payments on notes payable | | | — | | | (8,656) | | | — | | | — | | | (8,656) |
Debt issuance costs | | | (2,817) | | | — | | | — | | | — | | | (2,817) |
Repurchases of common stock upon vesting of restricted stock awards | | | (861) | | | — | | | — | | | — | | | (861) |
Payments from (and advances to) parent/subsidiary | | | — | | | 166,851 | | | — | | | (166,851) | | | — |
Net cash provided by financing activities | | | 170,278 | | | 159,364 | | | — | | | (166,851) | | | 162,791 |
Net decrease in cash and cash equivalents | | | (708) | | | (3,467) | | | — | | | — | | | (4,175) |
Cash and cash equivalents | | | | | | | | | | | | | | | |
Beginning of period | | | 22,710 | | | 10,752 | | | — | | | — | | | 33,462 |
End of period | | $ | 22,002 | | $ | 7,285 | | $ | — | | $ | — | | $ | 29,287 |